Table of Contents
As filed with the Securities and Exchange Commission on 3/4/10
UNITED STATES
SECURITIES AND EXCHANGE COMMISSION
SECURITIES AND EXCHANGE COMMISSION
Washington, D.C. 20549
FORM N-CSR
CERTIFIED SHAREHOLDER REPORT OF REGISTERED
MANAGEMENT INVESTMENT COMPANIES
MANAGEMENT INVESTMENT COMPANIES
Investment Company Act file number 811-09025
New Covenant Funds
(Exact name of registrant as specified in charter)
200 East Twelfth Street, Jeffersonville, IN 47130
(Address of principal executive offices) (Zip code)
U.S. Bancorp Fund Service, LLC
777 E Wisconsin Avenue
Milwaukee, WI 53202
777 E Wisconsin Avenue
Milwaukee, WI 53202
(Name and address of agent for service)
414-765-5138
Registrant’s telephone number, including area code
Date of fiscal year end: June 30
Date of reporting period: December 31, 2009
Table of Contents
Item 1. Reports to Stockholders.

table of contents
| 2 | ||||||||
| 6 | ||||||||
| 15 | ||||||||
| 16 | ||||||||
| 17 | ||||||||
| 19 | ||||||||
| 23 | ||||||||
| 31 | ||||||||
| EX-99.CERT | ||||||||
| EX-99.906CERT | ||||||||
Table of Contents
to our shareholders
NEW COVENANT FUNDS
December 31, 2009
December 31, 2009
Dear Shareholders,
In 2009, stock and bond markets recovered as the economy reached bottom and began to grow. The Standard & Poor’s 500 Index1 soared 26.5% and the Barclay’s Intermediate Aggregate Bond Index1 was up 6.5%. Credit markets stabilized and credit spreads narrowed dramatically from the historically wide levels reached in March.
In this environment, we were pleased with the investment results of New Covenant Funds on both an absolute and a relative basis.
| Aggregate | Average Annual Returns | |||||||||||||||||||
| Latest Quarter | 2009 | 3 years | 5 years | 10 years | ||||||||||||||||
New Covenant Growth Fund | 5.6 | % | 27.8 | % | -6.4 | % | 0.1 | % | -0.9 | % | ||||||||||
New Covenant Income Fund | 0.5 | % | 12.8 | % | 0.6 | % | 1.5 | % | 4.2 | % | ||||||||||
New Covenant Balanced Growth Fund | 3.7 | % | 21.7 | % | -3.4 | % | 0.9 | % | 1.4 | % | ||||||||||
New Covenant Balanced Income Fund | 2.5 | % | 17.7 | % | -1.7 | % | 1.2 | % | 2.6 | % | ||||||||||
Expense Ratios
| Gross Expense Ratio | Net Expense Ratio | |||||||
New Covenant Growth Fund | 1.37 | % | 1.20 | % | ||||
New Covenant Income Fund | 1.12 | % | 0.87 | % | ||||
New Covenant Balanced Growth Fund | 1.39 | % | 1.22 | % | ||||
New Covenant Balanced Income Fund | 1.34 | % | 1.17 | % | ||||
Past performance does not guarantee future results. The performance data quoted represents past performance and current returns may be lower or higher. Total return figures include changes in share price, and include reinvestment of dividends and capital gains. The investment return and principal value will fluctuate so that an investor’s shares, when redeemed, may be worth more or less than the original cost. To obtain more current performance information, call 877-835-4531 or visit www.NewCovenantFunds.com.
Bond funds will tend to experience smaller fluctuations in value than stock funds. Fluctuations in price, especially for longer-term bonds in environments of changing interest rates, should be anticipated. Asset-backed and mortgage-backed securities are generally subject to higher prepayment risks than other types of debt securities, which can limit the potential for gain in a declining interest rate environment and increase the potential for loss in a rising interest rate environment. Mortgage-backed securities may also be structured so that they are particularly sensitive to interest rates. A high rate of defaults on mortgages held by a mortgage pool may limit the pool’s ability to make payments to the fund if the fund holds securities that are subordinate to other interests in the same mortgage pool; the risk of such defaults is generally higher in mortgage pools that include subprime mortgages. Other principal risks associated with securities in the Income Fund are the following: Interest Rate Risk, Call Risk, Credit Risk, Put and Call Option Risk, Foreign Securities Risk, Options and Futures Risk, Government Securities Risk and Rebalancing Risk. For a more complete description of these risks, please consult the prospectus.
The Gross Expense Ratio is based on the most recent prospectus. The Fund’s Advisor has contractually agreed to limit the fees for the period from July 1, 2009 through October 31, 2010. The Net Expense Ratio is based upon the Gross Expenses less the fees waived by the Advisor. Had this waiver not been in effect, the performance would have been lower. For the New Covenant Income, Balanced Growth and Balanced Income Funds, the ratios also include those expenses incurred indirectly by the Fund as a result of investments in shares of one or more investment companies. Excluding these acquired fund fees and expenses, the Expense Ratios would be as follows: Income Fund: Gross 1.11% and Net 0.86%; Balanced Growth Fund: Gross 0.38% and Net 0.21%; and Balanced Income Fund: Gross 0.41% and Net 0.24%.
We note that the markets have rallied significantly over a short period of time and believe caution is warranted. We believe the economy will improve gradually with consumer deleveraging and unemployment providing a drag on more robust growth. While we see no immediate signs of inflation, we are watching commodity prices closely and are looking for signs that the massive stimulus programs of the past year will cause the economy to overheat. With such a mixed picture we are comforted by our more balanced approach, with Funds that share a number of managers having differing investment styles.
Looking back, we are also pleased by the successful stewardship of the Funds toward our stated social investing mandate. Working with the Presbyterian Church (USA)’s General Assembly Mission Counsel Committee (Mission Responsibility Through Investing), a list of prohibited securities is maintained. Today, this list includes 141 companies that derive more than 50% of their revenues from industries such as alcohol, tobacco, firearms, and gaming. The list also includes companies deemed to be human rights violators. An important part of our socially-responsible investment process involves filing shareholder resolutions and voting proxies. We are encouraged that the Funds were able to employ our social responsibility mandate while also delivering competitive investment results.
Performance Review
New Covenant Growth Fund
We serve as a “manager of managers” by crafting a portfolio through the careful selection and allocation of assets across one core and currently, four satellite sub-advisors. In 2009, we increased our exposure to our more actively managed satellite sub-advisors Capital Guardian Trust Company, Sound Shore Management, Inc., Santa Barbara Asset Management and to a new sub-advisor, TimesSquare Capital Management. We believe the current environment will favor “stock pickers,” investors who do extensive research and seek to find investments that will outperform the broader market. However, the Fund remains anchored by the core Wellington portfolio that seeks to deliver consistent relative performance by maintaining a sector allocation that is close to the benchmark.
2
Table of Contents
to our shareholders
NEW COVENANT FUNDS
December 31, 2009
December 31, 2009
The Fund produced a total return of 27.8% in 2009 versus the S&P 500 return of 26.5%. Out-performance relative to the benchmark came mostly from our exposure to international stocks, significant out-performance from our value-style sub-advisor, and the Fund’s core manager. Our target allocation to the Growth Fund sub-advisors at year-end was as follows:

Overview of sub-advisor results:
Wellington Management Company LLC — Our core advisor Wellington uses the Russell 1000 as its benchmark, which had a return of 28.4% in 2009. Wellington performed in line with this benchmark.
Capital Guardian Trust Company, Inc. — Internationally-focused satellite sub-advisor Capital Guardian underperformed its MSCI Index benchmark in 2009. This result lagged the MSCI index (+42.1%) due to a more defensive posture, emphasizing sectors like consumer staples and telecommunications while avoiding the cyclical and lower quality stock sectors that drove investment performance during the year.
Sound Shore Management Inc. — Our large-cap-value satellite sub-advisor Sound Shore delivered a strong return, outperforming the Russell 1000 Value benchmark (+19.7%). Sound Shore seeks to find good companies selling at a discount to their historic or “normal” valuations.
Santa Barbara Asset Management — Our growth-oriented satellite sub-advisor Santa Barbara posted a return that lagged the hard-to-beat Russell 1000 Growth benchmark (+37.2%). Santa Barbara focuses on high quality growth stocks and posted superior returns with a steady portfolio in 2008. However, Santa Barbara avoided certain lower quality growth stocks in 2009 and thus lagged the strong recovery.
TimesSquare Capital Management — We added TimesSquare as a satellite sub-advisor in April, 2009. As a mid-cap growth manager, TimesSquare adds greater depth in our exposure to the growth style of investing. TimesSquare’s process emphasizes stock selection through rigorous bottom-up fundamental research. TimesSquare’s analysts visit more than 1,500 small and midcap companies a year to find those with pricing power, competitive advantages and the potential to be industry leaders.
New Covenant Income Fund
When I joined the Advisor as Chief Investment Officer in the fall of 2008, one of my first objectives was to transition the Income Fund from its former sub-advisor to three new bond managers. That transition was completed January 2, 2009 and we successfully increased the overall quality and diversification of the bond portfolio. In addition, our patience during the transition allowed us to recapture some of the losses of 2008 by not simply unloading the distressed securities that contributed to the Fund’s underperformance. Instead, our new sub-advisors were able to successfully capture some of the rebound from the March lows as they carefully shed these securities. This strategy produced competitive results for shareholders in 2009. For the year, the New Covenant Income Fund produced a return of 12.8%. This was significantly better than the Barclays Capital Intermediate Aggregate benchmark which rose 6.5%.
The use of three bond managers emulates the “manager of managers” approach employed by our Growth Fund. We believe that by crafting a portfolio through the careful selection and allocation of assets across a number of managers, we can reduce risk while still maintaining the potential for benchmark-beating results.
3
Table of Contents
to our shareholders
NEW COVENANT FUNDS
December 31, 2009
December 31, 2009
Our allocation to the Income Fund sub-advisors at year-end was as follows:
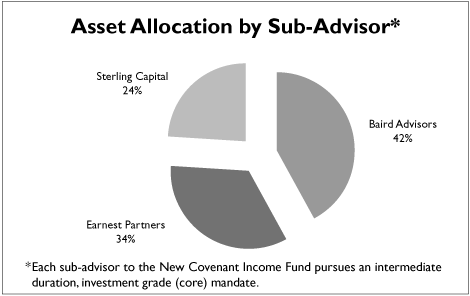
Overview of sub-advisor results:
Baird Advisors — Baird, a core bond manager focusing on high-quality investments, produced a strong return, outperforming the Barclays Capital Intermediate Aggregate return of 6.5%. Baird’s duration-neutral approach (relative to the benchmark) and high quality, intermediate-term portfolio provided competitive results for 2009.
Earnest Partners LLC — Earnest posted strong returns this year versus the Barclays Capital Intermediate Aggregate. Earnest’s investment strategy focuses on non-Treasury, AAA rated intermediate-term securities that have the full faith and credit of the US Treasury. That said, much of the year’s outperformance came from commercial mortgage-backed securities that they selected from the Income Fund transition portfolio. They gradually reduced this exposure as the year progressed.
Sterling Capital Management — Sterling also posted strong returns relative to the Barclays Capital Intermediate Aggregate. Sterling’s performance benefited from an overweight to corporate bonds which enjoyed a significant rally. With a high quality, intermediate-term portfolio, Sterling ventures out to pursue duration-, sector-, and credit-related opportunities in their effort to outperform the benchmark.
New Covenant Balanced Growth Fund and New Covenant Balanced Income Fund
Our balanced funds are each a mix of the New Covenant Growth Fund and the New Covenant Income Fund. The Balanced Growth Fund’s target allocation is currently 62.5% growth and 37.5% income. The Balanced Income Fund’s target allocation is the reverse, with 37.5% growth and 62.5% income. In early 2009, we increased the target allocation to equities in both balanced funds by 2.5 percentage points, allowing these funds to capture slightly more of the strong equity performance in 2009.
Conclusion
2009 marked some important changes to the New Covenant Funds. The Growth Fund increased its emphasis on the more actively managed satellite sub-advisors given our belief that experienced stock pickers should be able to add value over the indices. The Income Fund’s transition went extremely well and the Fund is well positioned with a high-quality, well-diversified portfolio. As a manager of managers, we seek the best mix of investment styles and experience from our sub-advisors as we attempt to produce benchmark beating results. We also endeavor to add value through incremental changes in the allocation of assets across the different investment styles.
While producing strong results is a primary goal, so too is exercising our social investing mandate. We continue to steward your investments away from securities on our prohibited list and will express our social principles by filing shareholder resolutions and taking opportunities to vote proxies.
Thank you for your continued interest in New Covenant Funds. As always, we appreciate your trust and thank you for your business.

Paul H. Stropkay, CFA
Senior Vice President and Chief Investment Officer
One Compass Advisors
Senior Vice President and Chief Investment Officer
One Compass Advisors
Disclosures:
| 1 | The Standard & Poor’s 500 Index (“S&P 500”) is an unmanaged, capitalization weighted index that measures the performance of 400 large-capitalization stocks representing all major industries. The Barclays Capital U.S Intermediate Aggregate Bond Index (formerly known as the Lehman Intermediate Aggregate Bond Index) is an unmanaged index of U.S. bonds which includes reinvestment of any earnings. It is widely used to measure the overall performance of the U.S. bond market. Russell 1000 Index measures the performance of the 1000 largest companies in the Russell 3000 Index. MSCI AC World ex US Index measures equity market performance in the global developed and emerging markets. It includes 48 developed and emerging market country indices. It is not possible to invest directly in an index. | |
| 2 | Portfolio composition is subject to change. Diversification does not guarantee a profit nor protect against a loss. |
The New Covenant Funds are advised by One Compass Advisors, a subsidiary of the Presbyterian Church (U.S.A.) Foundation.
4
Table of Contents
to our shareholders
NEW COVENANT FUNDS
December 31, 2009
December 31, 2009
Portfolio Allocation as of 12/31/09 (unaudited) (subject to change)
GROWTH FUND:
| Percentage of | ||||
| Security Allocation | Market Value | |||
| Information Technology | 18.2% | |||
| Financials | 14.3% | |||
| Health Care | 13.0% | |||
| Energy | 11.3% | |||
| Industrials | 10.1% | |||
| Consumer Discretionary | 9.6% | |||
| Consumer Staples | 8.7% | |||
| Materials | 5.0% | |||
| Utilities | 3.4% | |||
| Telecommunication Services | 3.0% | |||
| Cash Equivalents | 1.8% | |||
| Other | 1.6% | |||
| Total | 100.0% | |||
INCOME FUND:
| Percentage of | ||||
| Security Allocation | Market Value | |||
| Government Agency/Mortgage Backed Securities | 45.8% | |||
| Corporates | 21.3% | |||
| Non-Government Agency/Mortgage Backed | 10.9% | |||
| Treasuries | 7.5% | |||
| Asset Backed | 4.9% | |||
| Other | 4.4% | |||
| Cash Equivalents | 4.2% | |||
| Short Term Investments | 1.0% | |||
| Total | 100.0% | |||
BALANCED GROWTH FUND:
| Percentage of | ||||
| Security Allocation | Market Value | |||
| New Covenant Growth Fund | 65.0% | |||
| New Covenant Income Fund | 34.0% | |||
| Cash Equivalents | 1.0% | |||
| Total | 100.0% | |||
BALANCED INCOME FUND:
| Percentage of | ||||
| Security Allocation | Market Value | |||
| New Covenant Income Fund | 57.4% | |||
| New Covenant Growth Fund | 39.7% | |||
| Cash Equivalents | 2.9% | |||
| Total | 100.0% | |||
5
Table of Contents
portfolio of investments
NEW COVENANT GROWTH FUND
SCHEDULE OF INVESTMENTS at December 31, 2009 (Unaudited)
SCHEDULE OF INVESTMENTS at December 31, 2009 (Unaudited)
| Shares | Value | |||||||
COMMON STOCKS - 98.2% | ||||||||
| Advertising - 0.4% | ||||||||
| 67,000 | Omnicom Group, Inc. | $2,623,050 | ||||||
| Automotive - 1.1% | ||||||||
| 24,014 | Daimler AG | 1,281,651 | ||||||
| 244,500 | Ford Motor Co.(a) | 2,445,000 | ||||||
| 3,813 | Hyundai Mobis | 559,929 | ||||||
| 16,100 | Toyota Motor Corp. | 670,725 | ||||||
| 63,800 | TRW Automotive Holdings Corp.(a) | 1,523,544 | ||||||
| 51,500 | WABCO Holdings, Inc. | 1,328,185 | ||||||
| 7,809,034 | ||||||||
| Banks - 5.3% | ||||||||
| 106,130 | Banco Bilbao Vizcaya Argentaria SA(L) | 1,936,773 | ||||||
| 25,072 | Banco Santander SA | 415,129 | ||||||
| 468,029 | Bank Of America Corp. | 7,048,517 | ||||||
| 1,199,000 | Bank of China Ltd. | 649,496 | ||||||
| 180,500 | Barclays PLC(b) | 804,658 | ||||||
| 264,000 | China Construction Bank Corp. | 227,111 | ||||||
| 184,600 | Commerce Asset Holdings | 692,250 | ||||||
| 5,800 | Deutsche Bank AG | 410,906 | ||||||
| 348,185 | Grupo Financiero Inbursa SA | 1,014,852 | ||||||
| 214,164 | HSBC Holdings PLC | 2,451,862 | ||||||
| 1,870,000 | Industrial & Commercial Bank of China, Class H | 1,553,228 | ||||||
| 150,456 | JPMorgan Chase & Co. | 6,269,502 | ||||||
| 501,900 | Lloyds Banking Group PLC(a) | 410,927 | ||||||
| 45,800 | PNC Financial Services Group | 2,417,782 | ||||||
| 6,660 | Shinhan Financial Group Co., Ltd.(a) | 247,074 | ||||||
| 210,000 | Shinsei Bank, Ltd.(a) | 227,734 | ||||||
| 1 | Standard Chartered | 25 | ||||||
| 20,221 | Standard Chartered PLC | 514,409 | ||||||
| 50,000 | State Street Corp. | 2,177,000 | ||||||
| 288,276 | UniCredit SpA(a) | 968,056 | ||||||
| 271,100 | Wells Fargo & Co. | 7,316,989 | ||||||
| 37,754,280 | ||||||||
| Chemicals - 2.0% | ||||||||
| 4,400 | Airgas, Inc. | 209,440 | ||||||
| 48,100 | Cabot Corp. | 1,261,663 | ||||||
| 30,100 | Eastman Chemical Co. | 1,813,224 | ||||||
| 8,200 | Ecolab, Inc. | 365,556 | ||||||
| 26,400 | FMC Corp.(L) | 1,472,064 | ||||||
| 3,470 | Lg Chemical | 680,903 | ||||||
| 25,000 | Monsanto Co. | 2,043,750 | ||||||
| 32,600 | Mosaic Co., Inc. | 1,947,198 | ||||||
| 1,200 | OCI Co. Ltd. | 225,166 | ||||||
| 5,000 | Potash Corp. of Saskatchewan, Inc.(a) | 546,876 | ||||||
| 29,400 | Praxair, Inc. | 2,361,114 | ||||||
| 2,818 | Syngenta AG | 791,911 | ||||||
| 26,600 | Valspar Corp. | 721,924 | ||||||
| 14,440,789 | ||||||||
| Commercial Services - 1.9% | ||||||||
| 5,200 | Alliance Data Systems Corp.(a)(L) | 335,868 | ||||||
| 3,500 | Copart, Inc.(a) | 128,205 | ||||||
| 124,100 | Discover Financial Services | 1,825,511 | ||||||
| 2,800 | Dun & Bradstreet Corp. | 236,236 | ||||||
| 4,400 | Iron Mountain, Inc.(a) | 100,144 | ||||||
| 19,000 | Manpower, Inc. | 1,037,020 | ||||||
| 35,700 | Moody’s Corp. | 956,760 | ||||||
| 1,000 | Priceline.com, Inc.(a) | 218,500 | ||||||
| 65,100 | RR Donnelley & Sons Co. | 1,449,777 | ||||||
| 22,700 | Serco Group PLC | 194,324 | ||||||
| 3,700 | Stericycle, Inc.(a) | 204,129 | ||||||
| 1,700 | Strayer Education, Inc.(L) | 361,233 | ||||||
| 18,400 | Visa, Inc., Class A | 1,609,264 | ||||||
| 15,900 | Watson Wyatt Worldwide, Inc. | 755,568 | ||||||
| 226,000 | Western Union Co. | 4,260,100 | ||||||
| 13,672,639 | ||||||||
| Computer Services & Software - 8.3% | ||||||||
| 57,368 | Acer Inc New - ADR | 862,717 | ||||||
| 139,525 | Activision Blizzard, Inc.(a) | 1,550,123 | ||||||
| 8,000 | Adobe Systems, Inc.(a) | 294,240 | ||||||
| 20,900 | Amdocs Ltd.(a) | 596,277 | ||||||
| 34,700 | Apple Computer, Inc.(a) | 7,316,842 | ||||||
| 36,400 | BMC Software, Inc.(a) | 1,459,640 | ||||||
| 194,000 | Cisco Systems, Inc.(a) | 4,644,360 | ||||||
| 49,500 | Dell, Inc.(a) | 710,820 | ||||||
| 53,500 | EMC Corp.(a) | 934,645 | ||||||
| 73,700 | Hewlett Packard Co. | 3,796,287 | ||||||
| 66,900 | �� | International Business Machines Corp. | 8,757,210 | |||||
| 181,200 | Intuit, Inc.(a) | 5,564,652 | ||||||
| 401,700 | Microsoft Corp. | 12,247,833 | ||||||
| 6,800 | NetApp, Inc.(a) | 233,852 | ||||||
| 212,800 | Oracle Corp. | 5,222,112 | ||||||
| 8,500 | Oracle Corp. Japan(L) | 352,285 | ||||||
| 38,300 | Red Hats, Inc.(a) | 1,183,470 | ||||||
| 1,300 | Salesforce Com, Inc.(a) | 95,901 | ||||||
| 63,000 | SanDisk Corp.(a) | 1,826,370 | ||||||
| 10,200 | SAP AG | 482,532 | ||||||
| 24,000 | Trend Micro, Inc. | 909,647 | ||||||
| 6,864 | Wistron Corp. GDR(a) | 133,272 | ||||||
| 59,175,087 | ||||||||
| Construction & Building Materials - 1.5% | ||||||||
| 70,000 | Anhui Conch Cement Co. Ltd., Class H | 450,512 | ||||||
| 8,541 | Bouygues SA(L) | 445,985 | ||||||
| 189,000 | China Railway | 242,545 | ||||||
| 410,000 | China Shanshui Cement Group | 299,301 | ||||||
| 50,544 | CRH PLC | 1,380,102 | ||||||
| 31,200 | Emcor Group, Inc.(a) | 839,280 | ||||||
| 7,000 | HeidelbergCement AG | 483,980 | ||||||
| 16,190 | Holcim(a)(b) | 1,259,884 | ||||||
| 34,000 | Jacobs Engineering Group, Inc.(a) | 1,278,740 | ||||||
| 11,918 | Lafarge SA(b) | 987,692 | ||||||
| 1,400 | Martin Marietta Materials, Inc. | 125,174 | ||||||
| 3,900 | Orascom Construction Industries - ADR | 181,350 | ||||||
| 7,000 | Pool Corp. | 133,560 | ||||||
| 18,000 | PT Indocement Tunggal Prakarsa Tbk | 26,248 | ||||||
| 16,000 | PT Semen Gresik (Persero) Tbk | 12,858 | ||||||
| 47,200 | Stanley Works(L) | 2,431,272 | ||||||
| 7,300 | EQT(L) | 324,996 | ||||||
| 10,903,479 | ||||||||
| Consumer Products - 2.6% | ||||||||
| 28,700 | Herbalife Ltd. | 1,164,359 | ||||||
| 43,700 | Kimberly-Clark Corp. | 2,784,127 | ||||||
| 98,000 | Li & Fung | 407,627 | ||||||
| 31,500 | L’OREAL SA | 3,522,227 | ||||||
| 14,800 | NIKE, Inc. | 977,836 | ||||||
| 5,000 | Nintendo Co. Ltd. | 1,183,229 | ||||||
| 107,100 | Nu Skin Enterprises, Inc., Class A | 2,877,777 | ||||||
| 94,622 | Procter & Gamble Co. | 5,736,932 | ||||||
| 18,654,114 | ||||||||
| Diversified Operations - 1.6% | ||||||||
| 24,500 | 3M Co. | 2,025,415 | ||||||
| 48,868 | BAE Systems | 283,758 | ||||||
| 17,100 | Cooper Industries PLC | 729,144 | ||||||
| 0 | Delta Electronics, Inc. - ADR(a) | 2 | ||||||
| 10,900 | FPL Group, Inc. | 575,738 | ||||||
| 322,700 | General Electric Co. | 4,882,451 | ||||||
| 43,200 | Mitsubishi Corp. | 1,069,158 | ||||||
| 18,000 | Siemens AG | 1,656,866 | ||||||
| 21,800 | Sumitomo Corp. | 220,727 | ||||||
| 11,443,259 | ||||||||
The accompanying notes are an integral part of these financial statements.
6
Table of Contents
portfolio of investments (continued)
NEW COVENANT GROWTH FUND
SCHEDULE OF INVESTMENTS at December 31, 2009 (Unaudited)
SCHEDULE OF INVESTMENTS at December 31, 2009 (Unaudited)
| Shares | Value | |||||||
COMMON STOCKS (cont.) | ||||||||
| Electronics - 2.8% | ||||||||
| 37,300 | AMETEK, Inc. | $1,426,352 | ||||||
| 100 | Avnet, Inc.(a) | 3,016 | ||||||
| 33,500 | BYD Co. Ltd.(a)(L) | 295,751 | ||||||
| 4,000 | Dolby Laboratories, Inc.(a)(L) | 190,920 | ||||||
| 47,500 | Emerson Electric Co. | 2,023,500 | ||||||
| 7,000 | Epistar Corp.(a) | 127,050 | ||||||
| 285,300 | Flextronics International Ltd.(a) | 2,085,543 | ||||||
| 32,500 | FLIR Systems, Inc.(a) | 1,063,400 | ||||||
| 2,100 | Hirose Electric Co., Ltd. | 218,940 | ||||||
| 2,000 | Keyence Corp. | 412,305 | ||||||
| 3,774 | LG Electronics, Inc. | 393,775 | ||||||
| 14,300 | Murata Manufacturing Co., Ltd. | 706,287 | ||||||
| 262 | Samsung Electronics Co., Ltd. | 179,770 | ||||||
| 2,374 | Samsung Electronics Co., Ltd. - GDR(a)(b)(L) | 830,900 | ||||||
| 73,700 | Seagate Technology | 1,340,603 | ||||||
| 124,834 | Taiwan Semiconductor - ADR | 1,428,101 | ||||||
| 4,300 | TDK Corp. | 260,858 | ||||||
| 250,600 | Texas Instruments, Inc. | 6,530,636 | ||||||
| 7,700 | Tokyo Electron Ltd. | 489,440 | ||||||
| 20,007,147 | ||||||||
| Energy - 3.7% | ||||||||
| 175,200 | AES Corp.(a) | 2,331,912 | ||||||
| 26,100 | Banpu Public Co., Inc. | 450,918 | ||||||
| 7,300 | Cameron International Corp.(a) | 305,140 | ||||||
| 16,000 | Centrais Electricas Brasileiras S.A. | 333,969 | ||||||
| 1,000 | Centrais Eletricas Brasileiras S.A. - ADR | 21,090 | ||||||
| 40,500 | CESP - Companhia Energetica de Sao Paulo(a) | 558,998 | ||||||
| 208,000 | China Longyuan Power Group Corp.(a)(b)(L) | 269,343 | ||||||
| 198,500 | China Shenhua Energy Co., Ltd. | 972,863 | ||||||
| 278,500 | El Paso Corp. | 2,737,655 | ||||||
| 12,700 | Electricite De France | 756,644 | ||||||
| 1,500 | Enersis S.A. - ADR | 34,290 | ||||||
| 25,800 | Entergy Corp. | 2,111,472 | ||||||
| 122,974 | Exelon Corp. | 6,009,739 | ||||||
| 27,300 | FirstEnergy Corp. | 1,268,085 | ||||||
| 82,200 | Nabors Industries Ltd(a) | 1,799,358 | ||||||
| 52,200 | National-Oilwell Varco, Inc.(a) | 2,301,498 | ||||||
| 2,500 | Noble Corp. | 101,750 | ||||||
| 33,200 | PG&E Corp. | 1,482,380 | ||||||
| 10,200 | Scottish & Southern Energy PLC | 191,275 | ||||||
| 9,700 | Suntech Power Holdings Co., Ltd. - ADR(a)(L) | 161,311 | ||||||
| 63,700 | Tanjong Public Limited Co. | 313,291 | ||||||
| 3,900 | Vestas Wind Systems A/S(a) | 238,169 | ||||||
| 74,400 | Xcel Energy, Inc. | 1,578,768 | ||||||
| 26,329,918 | ||||||||
| Entertainment - 0.0% | ||||||||
| 5,900 | Hasbro, Inc. | 189,154 | ||||||
| Financial Services - 5.3% | ||||||||
| 64,000 | Ameriprise Financial, Inc. | 2,484,480 | ||||||
| 21 | Berkshire Hathaway, Inc.(a) | 2,083,200 | ||||||
| 10,996 | BNP Paribas(b) | 881,168 | ||||||
| 39,100 | Camden Property Trust(L) | 1,656,667 | ||||||
| 774,400 | Citigroup, Inc. | 2,563,264 | ||||||
| 6,400 | CME Group, Inc. | 2,150,080 | ||||||
| 34,800 | Comerica, Inc.(L) | 1,029,036 | ||||||
| 4,300 | Companhia Brasileira de Meios de Pagamen(b) | 37,887 | ||||||
| 37,400 | Credit Suisse Group - ADR | 1,838,584 | ||||||
| 7,282 | Danone S.A. | 447,107 | ||||||
| 36,660 | Goldman Sachs Group, Inc. | 6,189,674 | ||||||
| 13,000 | Hong Kong Exchanges & Clearing Ltd. | 233,730 | ||||||
| 195,500 | Invesco Ltd. | 4,592,295 | ||||||
| 10,100 | Mastercard, Inc. | 2,585,398 | ||||||
| 75,200 | Morgan Stanley | 2,225,920 | ||||||
| 32,100 | PHH Corp.(a)(L) | 517,131 | ||||||
| 12,400 | SEI Investments Co. | 217,248 | ||||||
| 8,900 | TD Ameritrade Holding Corp.(a) | 172,482 | ||||||
| 136,100 | The Charles Schwab Corp. | 2,561,402 | ||||||
| 59,700 | U.S. Bancorp | 1,343,847 | ||||||
| 19,788 | UBS AG(a)(b) | 307,021 | ||||||
| 80,800 | UDR, Inc. | 1,328,352 | ||||||
| 37,445,973 | ||||||||
| Food��& Beverages - 4.6% | ||||||||
| 85,100 | Archer Daniels Midland Co. | 2,664,481 | ||||||
| 23,400 | Bunge Ltd. | 1,493,622 | ||||||
| 112,571 | Coca-Cola Amatil Ltd. | 1,165,873 | ||||||
| 64,200 | Coca-Cola Co. | 3,659,400 | ||||||
| 40,100 | Coca-Cola Enterprises, Inc. | 850,120 | ||||||
| 54,100 | Dr Pepper Snapple Group, Inc.(a) | 1,531,030 | ||||||
| 11,500 | Fomento Economico Mexicano SA de CV - ADR | 550,620 | ||||||
| 32,200 | General Mills, Inc. | 2,280,082 | ||||||
| 30,600 | Hansen Natural Corp.(a) | 1,175,040 | ||||||
| 66,200 | Hormel Foods Corp. | 2,545,390 | ||||||
| 29,400 | Kellogg Co. | 1,564,080 | ||||||
| 399 | Lindt & Spruengli AG | 856,281 | ||||||
| 9,700 | Magnit OJSC - GDR(a) | 152,775 | ||||||
| 23,500 | Marfrig Alimentos SA(a) | 258,082 | ||||||
| 4,400 | Metro AG | 268,515 | ||||||
| 48,280 | Nestle SA | 2,342,942 | ||||||
| 81,400 | PepsiCo, Inc. | 4,949,120 | ||||||
| 48,900 | Unilever NV | 1,594,786 | ||||||
| 57,600 | Unilever NV - ADR | 1,862,208 | ||||||
| 7,950 | Unilever PLC | 256,046 | ||||||
| 12,614 | Woolworths Ltd. | 317,254 | ||||||
| 32,337,747 | ||||||||
| Forest Products & Paper - 0.3% | ||||||||
| 45,600 | International Paper Co. | 1,221,168 | ||||||
| 172,000 | Nine Dragons Paper Holdings Ltd. | 277,298 | ||||||
| 87,132 | Sappi | 419,131 | ||||||
| 7,300 | Sappi Ltd. - ADR(L) | 34,748 | ||||||
| 28,014 | Stora Enso Oyj | 195,978 | ||||||
| 9,749 | UPM-Kymmene Corp. | 116,277 | ||||||
| 2,264,600 | ||||||||
| Health Care Services - 2.8% | ||||||||
| 46,200 | Aetna, Inc. | 1,464,540 | ||||||
| 15,800 | DaVita, Inc.(a) | 928,092 | ||||||
| 27,900 | Express Scripts, Inc., Class A(a) | 2,411,955 | ||||||
| 29,100 | Health Net, Inc.(a) | 677,739 | ||||||
| 3,500 | Laboratory Corp. of America Holdings(a)(L) | 261,940 | ||||||
| 36,400 | Mckesson Corp. | 2,275,000 | ||||||
| 29,800 | Quest Diagnostics, Inc. | 1,799,324 | ||||||
| 18,800 | Stryker Corp. | 946,956 | ||||||
| 2,206 | Synthes, Inc. | 288,532 | ||||||
| 172,320 | UnitedHealth Group, Inc. | 5,252,313 | ||||||
| 33,800 | Varian Medical Systems, Inc.(a) | 1,583,530 | ||||||
| 33,400 | Wellpoint, Inc.(a) | 1,946,886 | ||||||
| 19,836,807 | ||||||||
| Household Durables - 0.3% | ||||||||
| 74,800 | Newell Rubbermaid, Inc. | 1,122,748 | ||||||
| 9,200 | Whirlpool Corp. | 742,072 | ||||||
| 1,864,820 | ||||||||
| Insurance - 3.2% | ||||||||
| 10,400 | AFLAC, Inc. | 481,000 | ||||||
| 5,500 | Allianz AG | 687,135 | ||||||
| 41,300 | Allied World Assurance Co. Holdings Ltd.(L) | 1,902,691 | ||||||
The accompanying notes are an integral part of these financial statements.
7
Table of Contents
portfolio of investments (continued)
NEW COVENANT GROWTH FUND
SCHEDULE OF INVESTMENTS at December 31, 2009 (Unaudited)
SCHEDULE OF INVESTMENTS at December 31, 2009 (Unaudited)
| Shares | Value | |||||||
COMMON STOCKS (cont.) | ||||||||
| Insurance (cont.) | ||||||||
| 7,100 | Aon Corp. | $272,214 | ||||||
| 13,650 | AXA SA(b)(L) | 323,653 | ||||||
| 56,200 | Axis Capital Holdings Ltd. | 1,596,642 | ||||||
| 26,100 | Everest Re Group Ltd. | 2,236,248 | ||||||
| 141,000 | Genworth Financial, Inc.(a) | 1,600,350 | ||||||
| 62,400 | Hartford Financial Services Group, Inc. | 1,451,424 | ||||||
| 5,200 | Humana, Inc.(a) | 228,228 | ||||||
| 116,900 | Marsh & McLennan Cos., Inc. | 2,581,152 | ||||||
| 5,972 | Muenchener Rueckversicherungs AG | 930,340 | ||||||
| 41,000 | Prudential Financial, Inc. | 2,040,160 | ||||||
| 27,800 | Prudential PLC | 287,376 | ||||||
| 8,800 | RenaissanceRe Holdings, Ltd. | 467,720 | ||||||
| 36,200 | The Allstate Corp. | 1,087,448 | ||||||
| 51,239 | The Travelers Cos., Inc. | 2,554,777 | ||||||
| 7,400 | Tokio Marine Holdings, Inc. | 201,020 | ||||||
| 93,400 | UnumProvident Corp.(L) | 1,823,168 | ||||||
| 22,752,746 | ||||||||
| Internet - 3.1% | ||||||||
| 35,700 | Akamai Technologies, Inc.(a) | 904,281 | ||||||
| 27,100 | Amazon.com, Inc.(a) | 3,645,492 | ||||||
| 9,551 | AOL, Inc.(a) | 222,349 | ||||||
| 10,000 | B2W Companhia Global do Varejo | 274,555 | ||||||
| 44,000 | eBay, Inc.(a) | 1,035,760 | ||||||
| 46,000 | Expedia, Inc.(a) | 1,182,660 | ||||||
| 22,000 | Genpact Limited(a) | 327,800 | ||||||
| 6,500 | Global Payments, Inc. | 350,090 | ||||||
| 11,705 | Google, Inc., Class A(a) | 7,256,866 | ||||||
| 63,500 | Softbank Corp. | 1,479,519 | ||||||
| 15,800 | Sohu Com, Inc.(a) | 905,024 | ||||||
| 148,700 | Symantec Corp.(a) | 2,660,243 | ||||||
| 16,800 | Tencent Holdings Ltd. | 365,104 | ||||||
| 43,400 | VeriSign, Inc.(a)(L) | 1,052,016 | ||||||
| 21,661,759 | ||||||||
| Leisure Equipment & Products - 0.2% | ||||||||
| 60,600 | Mattel, Inc. | 1,210,788 | ||||||
| Lodging - 0.3% | ||||||||
| 70,500 | Host Hotels & Resorts, Inc. | 822,735 | ||||||
| 56,100 | Wyndham Worldwide Corp. | 1,131,537 | ||||||
| 1,954,272 | ||||||||
| Machinery & Equipment - 0.7% | ||||||||
| 7,170 | Andritz Ag | 416,486 | ||||||
| 38,700 | Caterpillar, Inc. | 2,205,513 | ||||||
| 17,600 | Joy Global, Inc. | 907,984 | ||||||
| 13,200 | Kurita Water Industries Ltd. | 411,016 | ||||||
| 2,800 | PACCAR, Inc. | 101,556 | ||||||
| 8,200 | SMC Corp. | 927,106 | ||||||
| 4,969,661 | ||||||||
| Manufacturing - 4.0% | ||||||||
| 10,200 | Altera Corp. | 230,826 | ||||||
| 12,900 | Analog Devices, Inc. | 407,382 | ||||||
| 18,600 | ASML Holding N.V. - ADR | 634,074 | ||||||
| 31,700 | Assa Abloy AB, Class B | 610,548 | ||||||
| 4,500 | Church & Dwight Co., Inc. | 272,025 | ||||||
| 19,700 | Danaher Corp. | 1,481,440 | ||||||
| 84,800 | Dover Corp. | 3,528,528 | ||||||
| 36,700 | Graftech International Ltd.(a) | 570,685 | ||||||
| 52,700 | Honeywell International, Inc. | 2,065,840 | ||||||
| 45,300 | Illinois Tool Works, Inc. | 2,173,947 | ||||||
| 46,100 | ITT Industries, Inc.(L) | 2,293,014 | ||||||
| 14,800 | Masco Corp. | 204,388 | ||||||
| 254,200 | ON Semiconductor Corp.(a) | 2,239,502 | ||||||
| 52,500 | Owens-Illinois, Inc.(a) | 1,725,675 | ||||||
| 91,050 | Parker Hannifin Corp. | 4,905,774 | ||||||
| 33,700 | Precision Castparts Corp. | 3,718,795 | ||||||
| 16,200 | Waters Corp.(a) | 1,003,752 | ||||||
| 28,066,195 | ||||||||
| Media - 2.3% | ||||||||
| 246,300 | Comcast Corp., Class A | 4,152,618 | ||||||
| 16,100 | Discovery Communications, Inc.(a) | 426,972 | ||||||
| 9,400 | National CineMedia, Inc. | 155,758 | ||||||
| 28,800 | Scripps Networks Interactive - Class A | 1,195,200 | ||||||
| 26,800 | SES | 605,293 | ||||||
| 18,200 | Time Warner Cable, Inc. | 753,298 | ||||||
| 172,266 | Time Warner, Inc. | 5,019,831 | ||||||
| 31,800 | Virgin Media, Inc.(L) | 535,194 | ||||||
| 21,908 | Vivendi SA | 653,091 | ||||||
| 5,497 | Washington Post Co., Class B | 2,416,481 | ||||||
| 14,901 | Wolters Kluwer NV | 326,828 | ||||||
| 16,240,564 | ||||||||
| Medical - 4.2% | ||||||||
| 18,200 | Alcon, Inc. | 2,991,170 | ||||||
| 33,600 | Allergan, Inc. | 2,117,136 | ||||||
| 58,200 | Amgen, Inc.(a) | 3,292,374 | ||||||
| 28,500 | Baxter International, Inc. | 1,672,380 | ||||||
| 24,500 | Becton Dickinson & Co. | 1,932,070 | ||||||
| 373,000 | Boston Scientific Corp.(a) | 3,357,000 | ||||||
| 25,700 | C.R. Bard, Inc. | 2,002,030 | ||||||
| 4,000 | Illumina, Inc.(a) | 122,600 | ||||||
| 76,100 | Johnson & Johnson, Inc. | 4,901,601 | ||||||
| 83,000 | Medtronic, Inc. | 3,650,340 | ||||||
| 4,300 | Resmed, Inc.(a) | 224,761 | ||||||
| 60,900 | St. Jude Medical, Inc.(a) | 2,239,902 | ||||||
| 32,000 | Thermo Fisher Scientific, Inc.(a) | 1,526,080 | ||||||
| 30,029,444 | ||||||||
| Metals & Mining - 2.1% | ||||||||
| 18,000 | Anglo American PLC(a) | 788,183 | ||||||
| 6,000 | AngloGold Ashanti | 249,016 | ||||||
| 22,400 | Barrick Gold Corp. | 882,112 | ||||||
| 21,200 | BHP Billiton PLC | 683,131 | ||||||
| 39,200 | Cameco Corp.(a) | 1,271,747 | ||||||
| 38,900 | Consol Energy, Inc. | 1,937,220 | ||||||
| 28,400 | Freeport-McMoRan Copper & Gold, Inc., Class B(a) | 2,280,236 | ||||||
| 21,900 | GMK Norilsk Nickel - ADR(a) | 300,030 | ||||||
| 4,703 | Harmony Gold Mining Co., Ltd.(L) | 48,298 | ||||||
| 8,295 | Newcrest Mining Ltd. | 263,242 | ||||||
| 53,300 | Newmont Mining Corp. | 2,521,623 | ||||||
| 47,800 | Peabody Energy Corp. | 2,161,038 | ||||||
| 21,000 | Walter Industries, Inc.(L) | 1,581,510 | ||||||
| 14,967,386 | ||||||||
| Oil & Gas - 10.4% | ||||||||
| 5,655 | Air Liquide SA | 673,100 | ||||||
| 107,800 | Baker Hughes, Inc. | 4,363,744 | ||||||
| 94,000 | BG Group PLC | 1,703,515 | ||||||
| 4,500 | Canadian Natural Resources Ltd.(a) | 327,007 | ||||||
| 11,400 | Cenovus Energy, Inc.(a) | 288,856 | ||||||
| 45,392 | ChevronTexaco Corp. | 3,494,730 | ||||||
| 129,138 | ConocoPhillips | 6,595,078 | ||||||
| 18,100 | Denbury Resources, Inc.(a) | 267,880 | ||||||
| 42,800 | Devon Energy Corp. | 3,145,800 | ||||||
| 36,100 | Dresser-Rand Group, Inc.(a) | 1,141,121 | ||||||
| 27,300 | E.ON AG | 1,143,941 | ||||||
| 17,800 | EOG Resources, Inc. | 1,731,940 | ||||||
| 51,800 | EQT Corp. | 2,275,056 | ||||||
| 135,000 | Exxon Mobil Corp. | 9,205,650 | ||||||
| 28,100 | Gazprom - ADR(a) | 685,640 | ||||||
| 12,900 | GDF Suez SA | 560,053 | ||||||
| 106,200 | Hess Corp. | 6,425,100 | ||||||
| 95,700 | Marathon Oil Corp. | 2,987,754 | ||||||
| 35,500 | Occidental Petroleum Corp. | 2,887,925 | ||||||
| 5,300 | Range Resources Corp.(L) | 264,205 | ||||||
| 15,800 | Reliance Industries Ltd. - GDR | 740,548 | ||||||
| 20,156 | Royal Dutch Shell, Class A | 609,676 | ||||||
| 1,800 | Sasol Ltd - ADR | 71,892 | ||||||
The accompanying notes are an integral part of these financial statements.
8
Table of Contents
portfolio of investments (continued)
NEW COVENANT GROWTH FUND
SCHEDULE OF INVESTMENTS at December 31, 2009 (Unaudited)
SCHEDULE OF INVESTMENTS at December 31, 2009 (Unaudited)
| Shares | Value | |||||||
COMMON STOCKS (cont.) | ||||||||
| Oil & Gas (cont.) | ||||||||
| 35,200 | Sasol Ltd. | $1,421,355 | ||||||
| 87,500 | Schlumberger Ltd. | 5,695,375 | ||||||
| 12,000 | Seadrill Ltd.(a) | 306,746 | ||||||
| 91,200 | Smith International, Inc. | 2,477,904 | ||||||
| 5,510 | S-Oil Corp. | 255,514 | ||||||
| 62,500 | UGI Corp. | 1,511,875 | ||||||
| 37,000 | Ultra Petroleum Corp.(a) | 1,844,820 | ||||||
| 145,600 | Valero Energy Corp. | 2,438,800 | ||||||
| 57,500 | Williams Cos., Inc. | 1,212,100 | ||||||
| 110,300 | XTO Energy, Inc. | 5,132,259 | ||||||
| 73,886,959 | ||||||||
| Pharmaceuticals - 6.2% | ||||||||
| 103,200 | Abbott Laboratories | 5,571,768 | ||||||
| 14,800 | Bayer AG | 1,187,276 | ||||||
| 4,900 | Cephalon, Inc.(a) | 305,809 | ||||||
| 92,400 | Eli Lilly & Co. | 3,299,604 | ||||||
| 72,800 | Forest Laboratories, Inc.(a) | 2,337,608 | ||||||
| 53,400 | Genzyme Corp.(a) | 2,617,134 | ||||||
| 91,600 | Gilead Sciences, Inc.(a) | 3,964,448 | ||||||
| 151,770 | Merck & Co., Inc.(a) | 5,545,676 | ||||||
| 44,100 | Novartis AG - ADR | 2,400,363 | ||||||
| 16,000 | Novo Nordisk A/S, Class B | 1,023,339 | ||||||
| 435,106 | Pfizer, Inc. | 7,914,578 | ||||||
| 18,673 | Roche Holding AG | 3,173,390 | ||||||
| 30,700 | Shire Ltd. | 599,997 | ||||||
| 8,200 | Shire Pharmaceuticals PLC - ADR | 481,340 | ||||||
| 10,300 | Terumo Corp. | 619,316 | ||||||
| 51,700 | Teva Pharmaceutical Industries Ltd. - ADR | 2,904,506 | ||||||
| 43,946,152 | ||||||||
| Real Estate - 0.8% | ||||||||
| 129,700 | Annaly Mortgage Management, Inc. | 2,250,295 | ||||||
| 174,000 | CapitaMalls Asia Ltd.(a)(b) | 314,596 | ||||||
| 147,920 | China Overseas Land & Investment Ltd. | 312,880 | ||||||
| 60,000 | China Resources Land | 136,508 | ||||||
| 31,000 | Kerry Properties Ltd. | 157,931 | ||||||
| 161,000 | Link Reit | 411,564 | ||||||
| 33,500 | Nordstrom, Inc. | 1,258,930 | ||||||
| 22,000 | Sun Hung Kai Properties Ltd. | 329,997 | ||||||
| 86,000 | Wharf Holdings Ltd. | 496,363 | ||||||
| 5,669,064 | ||||||||
| Restaurant - 0.2% | ||||||||
| 24,300 | Mcdonalds Corp. | 1,517,292 | ||||||
| Retail - 5.1% | ||||||||
| 13,673 | Adidas AG | 740,326 | ||||||
| 50,100 | Best Buy Co., Inc. | 1,976,946 | ||||||
| 33,000 | Big Lots, Inc.(a) | 956,340 | ||||||
| 51,630 | BJ’s Wholesale Club, Inc.(a) | 1,688,817 | ||||||
| 58,800 | Coach, Inc. | 2,147,964 | ||||||
| 4,600 | Fastenal Co.(L) | 191,544 | ||||||
| 120,300 | Gap, Inc. | 2,520,285 | ||||||
| 503,860 | GOME Electrical Appliances Holdings Ltd.(a) | 183,260 | ||||||
| 10,070 | Hennes & Mauritz AB | 559,331 | ||||||
| 28,900 | Home Depot, Inc. | 836,077 | ||||||
| 32,000 | Jeronimo Martins, SGPS, S.A.(L) | 320,427 | ||||||
| 192,000 | Li Ning Co. Ltd.(L) | 730,518 | ||||||
| 222,100 | Office Depot, Inc.(a) | 1,432,545 | ||||||
| 35,235 | Ross Stores, Inc. | 1,504,887 | ||||||
| 12,900 | Seven & I Holdings Co Ltd | 262,751 | ||||||
| 67,700 | Staples, Inc. | 1,664,743 | ||||||
| 50,300 | Tempur-Pedic International, Inc.(a) | 1,188,589 | ||||||
| 222,000 | Tesco PLC | 1,534,694 | ||||||
| 18,100 | The Sherwin-Williams Co. | 1,115,865 | ||||||
| 4,900 | Tiffany & Co. | 210,700 | ||||||
| 59,500 | TJX Cos., Inc. | 2,174,725 | ||||||
| 49,300 | Urban Outfitters, Inc.(a)(L) | 1,725,007 | ||||||
| 142,000 | Wal Mart Stores, Inc. | 7,589,900 | ||||||
| 72,000 | Walgreen Co. | 2,643,840 | ||||||
| 35,900,081 | ||||||||
| Schools - 0.9% | ||||||||
| 17,000 | Anhanguera Educacional Participacoes SA(a)(b) | 242,843 | ||||||
| 84,900 | Apollo Group, Inc., Class A(a) | 5,143,242 | ||||||
| 8,200 | ITT Educational Services, Inc.(a) | 786,872 | ||||||
| 6,172,957 | ||||||||
| Semiconductor Equipment - 0.4% | ||||||||
| 24,436 | ASML Holding N.V. | 840,724 | ||||||
| 5,300 | KLA-Tencor Corp. | 191,648 | ||||||
| 4,100 | Linear Technology Corp. | 125,214 | ||||||
| 80,000 | Xilinx, Inc. | 2,004,800 | ||||||
| 3,162,386 | ||||||||
| Technology - 2.7% | ||||||||
| 72,000 | Accenture PLC | 2,988,000 | ||||||
| 46,000 | Amphenol Corp. | 2,124,280 | ||||||
| 130,200 | ARM Holdings PLC | 373,280 | ||||||
| 3,100 | Cognizant Technology Solutions Corp.(a) | 140,430 | ||||||
| 59,900 | Ingram Micro, Inc.(a) | 1,045,255 | ||||||
| 187,625 | Intel Corp. | 3,827,550 | ||||||
| 8,100 | Juniper Networks, Inc.(a) | 216,027 | ||||||
| 101,600 | Maxim Integrated Products, Inc. | 2,062,480 | ||||||
| 90,000 | United Technologies Corp. | 6,246,900 | ||||||
| 19,024,202 | ||||||||
| Telecommunication - 4.5% | ||||||||
| 17,600 | America Movil SA, Series L - ADR | 826,848 | ||||||
| 16,500 | American Tower Corp. - Class A(a) | 712,965 | ||||||
| 250,847 | AT&T, Inc. | 7,031,241 | ||||||
| 9,200 | BCE, Inc. | 255,104 | ||||||
| 11,300 | Broadcom Corp.(a) | 355,385 | ||||||
| 41,090 | France Telecom SA | 1,026,705 | ||||||
| 145,900 | JDS Uniphase Corp.(a) | 1,203,675 | ||||||
| 133,400 | Koninklijke KPN NV | 2,264,226 | ||||||
| 34,100 | Maxis Berhad(b) | 53,480 | ||||||
| 5,099 | Mobinil | 223,567 | ||||||
| 48,400 | Neustar, Inc.(a) | 1,115,136 | ||||||
| 242 | NTT DoCoMo, Inc. | 336,750 | ||||||
| 39,300 | Partner Communications Co. Ltd. | 795,910 | ||||||
| 194,500 | Qualcomm, Inc. | 8,997,570 | ||||||
| 3,900 | Research In Motion Ltd.(a) | 264,158 | ||||||
| 9,200 | SBA Communications Corp.(a) | 314,272 | ||||||
| 7,000 | SK Telecom Co., Ltd - ADR(L) | 113,820 | ||||||
| 1,855 | SK Telecom Co., Ltd. | 270,012 | ||||||
| 711 | Swisscom AG | 271,904 | ||||||
| 9,203 | Telefonica de Espana | 257,526 | ||||||
| 47,500 | Telefonos de Mexico SA - ADR | 787,550 | ||||||
| 37,550 | Telekomunikacja Po(a) | 217,415 | ||||||
| 78,700 | Telmex Internacional S.A.B. DE CV - ADR | 1,396,925 | ||||||
| 321,965 | Telstra Corp., Ltd.(b) | 991,970 | ||||||
| 44,000 | Verizon Communications, Inc. | 1,457,720 | ||||||
| 31,541,834 | ||||||||
| Transportation - 1.8% | ||||||||
| 104,300 | British Airways PLC(a)(L) | 314,861 | ||||||
| 19,800 | Burlington Northern Santa Fe Corp. | 1,952,676 | ||||||
| 3,600 | C.H. Robinson Worldwide, Inc.(L) | 211,428 | ||||||
| 17,000 | Companhia de Concessoes Rodoviarias | 389,506 | ||||||
| 4,400 | East Japan Railway Co. | 277,318 | ||||||
| 24,200 | Expeditors International of Washington, Inc. | 840,466 | ||||||
| 61,800 | J.B. Hunt Transport Services, Inc.(L) | 1,994,286 | ||||||
| 60,000 | Mitsui O.S.K. Lines Ltd. | 315,026 | ||||||
| 28,600 | Norfolk Southern Corp. | 1,499,212 | ||||||
| 163,078 | Qantas Airways Ltd. | 437,988 | ||||||
| 175,400 | Southwest Airlines Co. | 2,004,822 | ||||||
The accompanying notes are an integral part of these financial statements.
9
Table of Contents
portfolio of investments (continued)
NEW COVENANT GROWTH FUND
SCHEDULE OF INVESTMENTS at December 31, 2009 (Unaudited)
SCHEDULE OF INVESTMENTS at December 31, 2009 (Unaudited)
| Shares | Value | |||||||
COMMON STOCKS (cont.) | ||||||||
| Transportation (cont.) | ||||||||
| 25,100 | United Parcel Service, Inc. | $1,439,987 | ||||||
| 62,990 | Werner Enterprises, Inc. | 1,246,572 | ||||||
| 12,924,148 | ||||||||
| Waste Management - 0.6% | ||||||||
| 48,500 | Veolia Environnement | 1,607,814 | ||||||
| 70,400 | Waste Management, Inc. | 2,380,224 | ||||||
| 3,988,038 | ||||||||
| Total Common Stocks (Cost $587,377,461) | 693,352,806 | |||||||
PREFERRED STOCKS - 0.2% | ||||||||
| Commercial Banks - 0.1% | ||||||||
| 35,000 | Banco Bradesco S.A. | 765,450 | ||||||
| Metals & Mining - 0.1% | ||||||||
| 17,900 | Vale SA | 444,278 | ||||||
| Telecommunication - 0.1% | ||||||||
| 16,700 | Tele Norte Leste Participacoes SA | 357,714 | ||||||
| Total Preferred Stocks (Cost $1,179,832) | 1,567,442 | |||||||
| Principal | ||||||||
| Amount | ||||||||
SHORT TERM INVESTMENTS - 1.8% | ||||||||
| $13,011,959 | JP Morgan Cash Trade Execution | $13,011,959 | ||||||
| Total Short Term Investments (Cost $13,011,959) | 13,011,959 | |||||||
INVESTMENTS HELD AS COLLATERAL FOR LOANED SECURITIES - 1.6% | ||||||||
| 1,169,411 | GSAA Home Equity Trust ABS, 0.32%, 01/29/10(c) | 670,701 | ||||||
| 3,656,987 | JP Morgan Prime Money Market | 3,656,987 | ||||||
| 7,000,000 | Monumental Global Funding II MTN, 0.23%, 05/26/10(c) | 6,971,335 | ||||||
| Total Investments Held As Collateral For Loaned Securities (Cost $11,826,398) | 11,299,023 | |||||||
TOTAL INVESTMENTS — 101.8% | ||||||||
| (Cost $613,395,650) | $722,216,249 | |||||||
Liabilities in Excess of Other Assets — (1.8)% | (13,007,657 | ) | ||||||
NET ASSETS — 100.00% | $709,208,592 | |||||||
Percentages are stated as a percent of net assets.
Footnotes:
| (a) | Non-income producing security. | |
| (b) | Security exempt from registration under Rule 144A of the Securities Act of 1933 or otherwise restricted as to resale. These securities may be resold in transactions exempt from registration, normally to qualified institutional buyers. The Advisor, using procedures approved by the Board of Trustees, has deemed these securities to be liquid. | |
| (c) | Variable or Floating Rate Security. Rate disclosed is as of December 31, 2009. | |
| (L) | A portion or all of the security is on loan. |
Abbreviations:
| ABS | Asset Backed Security | |
| ADR | American Depository Receipt | |
| GDR | Global Depository Receipt | |
| MTN | Medium Term Note | |
| PLC | Public Liability Company |
The accompanying notes are an integral part of these financial statements.
10
Table of Contents
portfolio of investments (continued)
NEW COVENANT INCOME FUND
SCHEDULE OF INVESTMENTS at December 31, 2009 (Unaudited)
SCHEDULE OF INVESTMENTS at December 31, 2009 (Unaudited)
| Principal Amount | Value | |||||||
ASSET BACKED SECURITIES - 5.0% | ||||||||
| $1,394,000 | American Express Credit 2006-1 A 0.263%, 12/15/2013 | $1,384,398 | ||||||
| 300,000 | American Express Credit 2007-8 B 0.933%, 05/15/2015 | 287,636 | ||||||
| 750,000 | Atlantic City Electric 2002-1 A-3, 4.910%, 07/20/2017 | 805,071 | ||||||
| 1,000,000 | CarMax, Inc., 2007-1, 5.240%, 06/15/2012 | 1,035,462 | ||||||
| 750,000 | CenterPoint Energy Transition Bond Co., 5.090%, 08/01/2015 | 813,179 | ||||||
| 1,500,000 | Chase Issuance Trust 2006-1A 0.273%, 04/15/2013 | 1,493,827 | ||||||
| 2,200,000 | Chase Issuance Trust 2006-4A 0.253%, 10/15/2013 | 2,183,191 | ||||||
| 790,000 | Chase Issuance Trust 2007-15A 4.960%, 09/15/2012 | 813,982 | ||||||
| 3,000,000 | Chase Issuance Trust 2009-7 0.683%, 09/17/2012 | 3,004,042 | ||||||
| 3,500,000 | Citibank Credit Card Issuance Trust 5.450%, 05/10/2013 | 3,685,027 | ||||||
| 1,000,000 | Honda Auto Receivables Owner Trust 4.430%, 07/15/2015 | 1,053,677 | ||||||
| 550,000 | Nissan Auto 2008-A, 4.280%, 06/15/2014 | 572,524 | ||||||
| 1,025,000 | Nissan Auto Lease Trust 2.070%, 01/15/2015 | 1,031,439 | ||||||
| 600,000 | USAA Auto Owner 2009-1, 4.770%, 09/15/2014 | 637,191 | ||||||
| 314,871 | USAA Auto Owner, 5.360%, 06/15/2012 | 320,954 | ||||||
| Total Asset Backed Securities (Cost $18,976,198) | 19,121,600 | |||||||
CORPORATE BONDS - 21.8% | ||||||||
| 692,000 | Aegon NV 4.750%, 06/01/2013 | 696,324 | ||||||
| 800,000 | Aflac, Inc. 8.500%, 05/15/2019 | 923,122 | ||||||
| 675,000 | Allied Waste North America, Inc., 6.875%, 06/01/2017 | 717,385 | ||||||
| 600,000 | America Movil SAB De CV, 5.500%, 03/01/2014 | 638,347 | ||||||
| 850,000 | American Express Co. 8.125%, 05/20/2019 | 1,009,014 | ||||||
| 1,150,000 | American Water Capital Corp., 6.085%, 10/15/2017 | 1,203,498 | ||||||
| 700,000 | Arcelormittal Sa Luxembourg 9.850%, 06/01/2019 | 906,867 | ||||||
| 1,000,000 | Arden Realty LP, 5.250%, 03/01/2015 | 1,030,807 | ||||||
| 1,000,000 | AT&T Wireless Services, Inc., 8.125%, 05/01/2012 | 1,130,540 | ||||||
| 700,000 | AT&T, Inc., 4.850%, 02/15/2014 | 745,000 | ||||||
| 500,000 | 5.800%, 02/15/2019 | 533,927 | ||||||
| 1,000,000 | Bank of America Commercial Mortgage, 5.300%, 03/15/2017 | 981,535 | ||||||
| 50,000 | Bank of America Funding Corp., 7.625%, 06/01/2019 | 57,942 | ||||||
| 600,000 | BB&T Corp. 6.850%, 04/30/2019 | 674,141 | ||||||
| 1,000,000 | Bear Stearns Cos., Inc., 7.250%, 02/01/2018 | 1,149,643 | ||||||
| 375,000 | Blackrock, Inc. 2.250%, 12/10/2012 | 373,621 | ||||||
| 500,000 | British Telecommunications PLC 9.125%, 12/15/2010 | 535,785 | ||||||
| 1,275,000 | Canal Barge, Inc. 4.500%, 11/12/2034 | 1,224,199 | ||||||
| 2,800,000 | Carolina Power & Light Co., 6.500%, 07/15/2012 | 3,071,664 | ||||||
| 750,000 | Cisco Systems, Inc. 4.450%, 01/15/2020 | 737,209 | ||||||
| 1,000,000 | Citigroup, Inc., 6.125%, 11/21/2017(L) | 1,009,536 | ||||||
| 750,000 | Comcast Corp New 5.300%, 01/15/2014 | 801,196 | ||||||
| 250,000 | COX Communications Inc. 6.750%, 03/15/2011 | 262,937 | ||||||
| 560,000 | Credit Suisse, 5.500%, 05/01/2014(L) | 608,299 | ||||||
| 425,000 | CVS Caremark Corp., 4.875%, 09/15/2014 | 450,723 | ||||||
| 360,000 | Dartmouth College, 4.750%, 06/01/2019 | 365,306 | ||||||
| 950,000 | Deere John Capital Corp. 7.000%, 03/15/2012 | 1,054,413 | ||||||
| 986,000 | Deutsche Telekom International Finance BV 8.500%, 06/15/2010 | 1,019,070 | ||||||
| 760,000 | Duke Energy Corp. 6.250%, 01/15/2012 | 822,047 | ||||||
| 500,000 | Entergy Mississippi, Inc., 4.650%, 05/01/2011 | 516,638 | ||||||
| 750,000 | Enterprise Products Operating LLC 7.625%, 02/15/2012 | 829,417 | ||||||
| 1,656,467 | FedEx Corp., 1998-1, 6.720%, 07/15/2023 | 1,732,265 | ||||||
| 2,700,000 | Fifth Third Bancorp, 6.250%, 05/01/2013(L) | 2,782,031 | ||||||
| 430,000 | Fiserv, Inc., 6.125%, 11/20/2012 | 468,525 | ||||||
| 700,000 | General Electric Capital Corp. 6.000%, 08/07/2019 | 727,938 | ||||||
| 1,000,000 | General Mills, Inc., 6.000%, 02/15/2012 | 1,080,215 | ||||||
| Goldman Sachs Group, Inc., | ||||||||
| 1,000,000 | 6.875%, 01/15/2011 | 1,060,692 | ||||||
| 1,000,000 | 5.950%, 01/18/2018 | 1,057,661 | ||||||
| 600,000 | 7.500%, 02/15/2019 | 700,669 | ||||||
| 900,000 | Hewlett Packard Co., 6.125%, 03/01/2014 | 1,006,580 | ||||||
| 1,000,000 | Home Depot, Inc., 5.400%, 03/01/2016 | 1,048,228 | ||||||
| 615,000 | Honeywell International, Inc., 3.875%, 02/15/2014(L) | 641,326 | ||||||
| 750,000 | HSBC Finance Corp., 6.750%, 05/15/2011 | 792,918 | ||||||
| 440,000 | International Paper Co., 7.300%, 11/15/2039 | 468,246 | ||||||
| JP Morgan Chase & Co., | ||||||||
| 1,200,000 | 2.125%, 06/22/2012(L) | 1,214,501 | ||||||
| 1,100,000 | 5.750%, 01/02/2013 | 1,173,943 | ||||||
| 600,000 | Koninklijke KPN NV 8.000%, 10/01/2010 | 630,115 | ||||||
| 650,000 | Kookmin Bank 7.250%, 05/14/2014(a) | 731,060 | ||||||
| 215,000 | Korea Electric Power Corp., 7.750%, 04/01/2013 | 242,058 | ||||||
| 1,000,000 | Marsh & McLennan Cos., Inc., 6.250%, 03/15/2012 | 1,055,930 | ||||||
| Merrill Lynch & Co., | ||||||||
| 1,000,000 | 6.050%, 08/15/2012 | 1,071,881 | ||||||
| 590,000 | 6.875%, 04/25/2018 | 636,701 | ||||||
| MetLife, Inc., | ||||||||
| 1,000,000 | 5.000%, 06/15/2015 | 1,053,031 | ||||||
| Metropolitan Life Global Funding, | ||||||||
| 500,000 | 5.125%, 04/10/2013(a) | 530,093 | ||||||
| Morgan Stanley Capital 1 | ||||||||
| 915,000 | 2005-HQ6, 4.989%, 08/13/2042 | 887,128 | ||||||
| Morgan Stanley, | ||||||||
| 1,000,000 | 5.050%, 01/21/2011 | 1,037,451 | ||||||
| 1,000,000 | 5.625%, 01/09/2012 | 1,055,824 | ||||||
| 1,100,000 | 1.950%, 06/20/2012 | 1,110,846 | ||||||
| 460,000 | 6.000%, 05/13/2014 | 495,068 | ||||||
| National City Corp., | ||||||||
| 1,250,000 | 4.500%, 03/15/2010 | 1,257,727 | ||||||
| National Rural Utility Corp., | ||||||||
| 650,000 | 10.375%, 11/01/2018 | 862,639 | ||||||
| Nationwide Life Global Funding I | ||||||||
| 800,000 | 0.661%, 08/27/2010(a) | 797,184 | ||||||
| 600,000 | Pemex Finance Ltd., 10.610%, 08/15/2017 | 723,000 | ||||||
| 947,950 | Petrodrill Five Ltd., 4.390%, 04/15/2016 | 979,289 | ||||||
| 1,354,214 | Petrodrill Four Ltd., 4.240%, 01/15/2016 | 1,406,670 | ||||||
| 440,000 | Plains All American Pipeline LP, 8.750%, 05/01/2019 | 519,658 | ||||||
| 500,000 | Plum Creek Timberlands LP, 5.875%, 11/15/2015 | 512,622 | ||||||
| 725,000 | PNC Funding Corp., 5.500%, 09/28/2012 | 767,741 | ||||||
| 1,350,000 | Pooled Funding Trust I 2.740%, 02/15/2012(a) | 1,378,385 | ||||||
| 600,000 | Principal Life Global Funding I 6.250%, 02/15/2012(a) | 630,327 | ||||||
| 500,000 | Prudential Financial Inc. 5.100%, 09/20/2014 | 521,861 | ||||||
| 750,000 | Prudential Holdings LLC 8.695%, 12/18/2023(a) | 804,519 | ||||||
The accompanying notes are an integral part of these financial statements.
11
Table of Contents
portfolio of investments (continued)
NEW COVENANT INCOME FUND
SCHEDULE OF INVESTMENTS at December 31, 2009 (Unaudited)
SCHEDULE OF INVESTMENTS at December 31, 2009 (Unaudited)
| Principal Amount | Value | |||||||
CORPORATE BONDS (cont.) | ||||||||
| $1,000,000 | Rio Tinto Ltd., 5.875%, 07/15/2013 | $1,079,899 | ||||||
| 500,000 | Simon Property Group, Inc., 6.750%, 05/15/2014 | 533,343 | ||||||
| 1,000,000 | Stanford University, 4.250%, 05/01/2016 | 1,029,840 | ||||||
| 1,200,000 | SunTrust Banks, Inc., 3.000%, 11/16/2011 | 1,238,777 | ||||||
| 400,000 | TCI Communications, Inc. 8.750%, 08/01/2015 | 474,451 | ||||||
| 1,375,000 | Texas Eastern Transmission Corp. 7.300%, 12/01/2010 | 1,446,145 | ||||||
| 750,000 | Time Warner Cable, Inc. 5.000%, 02/01/2020 | 728,715 | ||||||
| 450,000 | Time Warner Cable, Inc., 8.750%, 02/14/2019 | 549,348 | ||||||
| Time Warner, Inc., | ||||||||
| 1,175,000 | 6.875%, 05/01/2012 | 1,287,020 | ||||||
| 915,000 | 5.875%, 11/15/2016(L) | 989,150 | ||||||
| 775,000 | UFJ Finance Aruba AEC 6.750%, 07/15/2013 | 863,534 | ||||||
| 1,100,000 | Vanderbilt University 5.250%, 04/01/2019 | 1,148,595 | ||||||
| Verizon Communications, Inc., | ||||||||
| 1,032,000 | 5.875%, 01/17/2012 | 1,100,067 | ||||||
| 800,000 | 6.350%, 04/01/2019 | 884,146 | ||||||
| 1,125,000 | Vessel Management Services, 5.125%, 04/16/2035 | 1,128,338 | ||||||
| 1,000,000 | Vodafone Group PLC, 5.630%, 02/27/2017 | 1,063,732 | ||||||
| 1,500,000 | Volkswagen Auto Lease Trust 3.410%, 04/15/2012 | 1,538,008 | ||||||
| 550,000 | Wells Fargo & Co., 5.625%, 12/11/2017 | 572,999 | ||||||
| 650,000 | Westpac Banking Corp. 4.200%, 02/27/2015 | 661,467 | ||||||
| 700,000 | Xerox Corp. 6.350%, 05/15/2018 | 731,373 | ||||||
| Total Corporate Bonds (Cost $79,673,672) | 82,783,645 | |||||||
NON-AGENCY MORTGAGE BACKED SECURITIES - 11.2% | ||||||||
| 1,310,000 | Banc of America Commercial Mortgage 2004-3 A5, 5.413%, 06/10/1939 | 1,321,334 | ||||||
| 3,230,000 | Banc of America Commercial Mortgage 2005-6 AM, 5.178%, 09/10/1947 | 2,763,139 | ||||||
| 4,215,000 | Banc of America Commercial Mortgage 2006-3, 5.812%, 07/10/1944 | 3,382,323 | ||||||
| 5,235,000 | Banc of America Commercial Mortgage 2006-4, 5.675%, 08/10/2016 | 4,107,834 | ||||||
| 700,000 | Banc of America Commercial Mortgage 2007-1, 5.451%, 01/15/1949 | 618,878 | ||||||
| 1,470,000 | Bear Stearns Commercial Mortgage Securites 2007-PWR18, 6.210%, 06/11/1950 | 726,387 | ||||||
| 1,375,000 | BMW Vehicle Lease Trust 2009-1 A3, 2.910%, 08/15/2011 | 1,399,947 | ||||||
| 1,596,000 | Citigroup Commercial Mortgage Trust 2008-C7, 6.095%, 12/10/1949 | 745,188 | ||||||
| 1,540,000 | Credit Suisse First Boston Mortgage Securities Corp. 2005-C1 A4, 5.014%, 02/15/1938 | 1,513,614 | ||||||
| 1,205,000 | Credit Suisse Mortgage Capital Certificate 2006-C1 AM, 5.544%, 02/15/1939 | 990,501 | ||||||
| 915,000 | Credit Suisse of First Boston Mortgage Securities Corp. 2005-c1, 4.813%, 02/15/2038 | 914,210 | ||||||
| 3,488,586 | Deutsche ALT-A Securities, Inc. Mortgage Loan Trust 005-3 5A5, 5.250%, 06/25/1935 | 2,923,974 | ||||||
| 1,370,000 | General Electric Capital Commercial Mortgage Corp., 4.596%, 11/10/1938 | 1,346,368 | ||||||
| 1,230,000 | GMAC Commercial Mortgage Securities 2004-C2 A4, 5.301%, 08/10/1938 | 1,223,670 | ||||||
| 1,235,000 | Goldman Sachs Mortgage Securities Corp. 2007-GG10 A4, 5.805%, 08/10/1945 | 1,063,533 | ||||||
| 1,445,000 | JP Morgan Chase Commercial Mortgage Securities Corp. 2004-CB9 A4, 5.376%, 06/12/1941 | 1,457,354 | ||||||
| 1,200,000 | JP Morgan Chase Commercial Mortgage Securities Corp. 2006-LDP7 A4, 5.874%, 04/15/1945 | 1,158,761 | ||||||
| 1,305,000 | JP Morgan Chase Commercial Mortgage Securities Corp. 2007-CIBC18, 5.440%, 06/12/1947 | 1,139,886 | ||||||
| 4,165,000 | JP Morgan Chase Commercial Mortgage Securities Corp. 2007-LD12 A4, 5.882%, 02/15/1951 | 3,617,018 | ||||||
| 1,565,000 | JP Morgan Chase Commercial Mortgage Securities Corp. 2007-LDP11 A4, 5.818%, 06/15/1949 | 1,366,743 | ||||||
| 480,000 | JP Morgan Chase Commerical Mortgage Securities Corp. 2005-CIBC11 A4, 5.335%, 08/12/2037 | 474,411 | ||||||
| 550,000 | JP Morgan Chase Commerical Mortgage Securities Corp. 2006-CIBC15 5.814%, 06/12/2043 | 530,361 | ||||||
| 3,770,000 | LB-UBS Commercial Morgage Trust 2006-C6 AM, 5.413%, 09/15/1936 | 3,135,141 | ||||||
| 1,253,019 | Master Reperforming Loan Trust 2006-2 1A1, 5.803%, 05/25/1936(a) | 1,103,852 | ||||||
| 565,000 | Merrill Lynch/Countrywide Commercial Mortgage Trust 2006-4 A3, 5.172%, 12/12/1949 | 500,637 | ||||||
| 2,528,259 | TBW Morgage Backed Pass-Through Certificates 2006-2 7A1, 7.000%, 07/25/1936 | 1,383,693 | ||||||
| 1,385,000 | Wachovia Bank Commercial Mortgage Trust 2004-C12 A4, 5.240%, 07/15/1941 | 1,375,961 | ||||||
| Total Non-Agency Mortgage Backed Securities (Cost $48,946,573) | 42,284,718 | |||||||
U.S. GOVERNMENT AGENCIES - 46.9% | ||||||||
| Fannie Mae | ||||||||
| 1,196,833 | 7.067%, 12/01/2010 | 1,197,041 | ||||||
| 4,876,802 | 6.200%, 01/01/2011 | 4,991,671 | ||||||
| 1,845,078 | 6.480%, 01/01/2011 | 1,901,483 | ||||||
| 4,420,802 | 6.100%, 04/01/2011 | 4,593,140 | ||||||
| 1,388,158 | 6.090%, 05/01/2011 | 1,459,974 | ||||||
| 1,240,924 | 6.305%, 05/01/2011 | 1,295,744 | ||||||
| 2,745,000 | 6.280%, 08/01/2011 | 2,892,470 | ||||||
| 2,578,952 | 6.130%,10/01/2011 | 2,739,274 | ||||||
| 1,392,453 | 5.936%, 11/01/2011 | 1,455,857 | ||||||
| 4,280,958 | 6.113%, 02/01/2012 | 4,585,855 | ||||||
| 1,485,339 | 5.780%, 07/01/2012 | 1,590,709 | ||||||
| 1,406,498 | 5.500%, 05/25/2014 | 1,456,338 | ||||||
| 604,928 | 6.500%, 08/01/2017 | 656,808 | ||||||
| 2,078,896 | 5.000%, 01/01/2021 | 2,190,568 | ||||||
| 1,301,970 | 4.500%, 09/25/2024 | 1,360,388 | ||||||
| 855,000 | 5.000%, 03/25/2032 | 889,823 | ||||||
| 779,065 | 4.500%, 07/25/2033 | 809,577 | ||||||
| 4,935,000 | 5.000%, 04/25/2034 | 5,095,587 | ||||||
| 5,245,284 | 5.500%, 09/01/2034 | 5,513,832 | ||||||
| 2,997,319 | 5.500%, 12/25/2034 | 3,172,520 | ||||||
| 3,185,657 | 5.500%, 02/01/2035 | 3,348,756 | ||||||
| 4,431,904 | 5.000%, 07/01/2035 | 4,563,015 | ||||||
| 1,312,372 | 5.000%, 08/25/2035 | 1,386,864 | ||||||
| 3,180,910 | 5.000%, 11/01/2035 | 3,271,036 | ||||||
| 702,220 | 5.508%, 01/01/2036 | 742,657 | ||||||
| 3,275,102 | 5.000%, 02/01/2036 | 3,367,897 | ||||||
| 4,635,522 | 5.000%, 03/01/2036 | 4,766,862 | ||||||
| 527,920 | 5.512%, 03/01/2036 | 555,320 | ||||||
| 3,176,098 | 5.500%, 07/01/2037 | 3,336,723 | ||||||
| 1,603,943 | 5.500%, 04/01/2036 | 1,681,050 | ||||||
| 2,291,356 | 6.000%, 09/01/2037 | 2,430,986 | ||||||
| 1,787,209 | 5.000%, 03/01/2038 | 1,836,350 | ||||||
| 1,871,156 | 5.500%, 05/01/2038 | 1,961,108 | ||||||
| 3,672,917 | 5.500%, 06/01/2038 | 3,849,485 | ||||||
| 1,799,299 | 5.500%, 08/01/2038 | 1,885,797 | ||||||
| 1,478,097 | 5.500%, 11/01/2038 | 1,549,154 | ||||||
The accompanying notes are an integral part of these financial statements.
12
Table of Contents
portfolio of investments (continued)
NEW COVENANT INCOME FUND
SCHEDULE OF INVESTMENTS at December 31, 2009 (Unaudited)
SCHEDULE OF INVESTMENTS at December 31, 2009 (Unaudited)
| Principal Amount | Value | |||||||
U.S. GOVERNMENT AGENCIES (cont.) | ||||||||
| $2,162,435 | 6.000%, 11/01/2038 | $2,292,856 | ||||||
| 2,522,633 | 5.900%, 07/25/2042 | 2,655,704 | ||||||
| 95,330,279 | ||||||||
| Freddie Mac | ||||||||
| 2,000,000 | 0.160%, 05/04/2011 | 2,002,568 | ||||||
| 2,000,000 | 1.500%, 06/22/2012 | 1,984,948 | ||||||
| 1,178,069 | 4.500%, 07/15/2016 | 1,214,483 | ||||||
| 2,476,046 | 6.000%, 01/15/2017 | 2,648,953 | ||||||
| 4,150,000 | 5.000%, 02/15/2020 | 4,330,711 | ||||||
| 2,335,649 | 5.000%, 12/01/2020 | 2,456,003 | ||||||
| 1,180,469 | 6.000%, 12/15/2021 | 1,232,237 | ||||||
| 1,395,261 | 5.000%, 04/01/2024 | 1,460,322 | ||||||
| 1,543,251 | 5.000%, 05/15/2024 | 1,616,022 | ||||||
| 1,230,000 | 5.000%, 03/15/2032 | 1,280,797 | ||||||
| 3,395,000 | 5.000%, 03/15/2034 | 3,493,925 | ||||||
| 2,284,090 | 5.500%, 12/01/2036 | 2,397,462 | ||||||
| 2,976,559 | 5.000%, 04/01/2038 | 3,056,077 | ||||||
| 1,882,883 | 5.000%, 08/01/2038 | 1,933,183 | ||||||
| 1,984,562 | 5.500%, 11/01/2038 | 2,081,404 | ||||||
| 7,179 | 5.000%, 12/01/2038 | 7,371 | ||||||
| 1,154,823 | 4.500%, 02/01/2039 | 1,153,615 | ||||||
| 1,571,963 | 5.000%, 03/01/2039 | 1,613,958 | ||||||
| 1,792,903 | 5.000%, 05/01/2039 | 1,840,620 | ||||||
| 37,804,659 | ||||||||
| Ginnie Mae | ||||||||
| 652,572 | 5.500%, 02/20/2037 | 685,202 | ||||||
| 2,003,230 | 4.500%, 07/20/2038 | 1,998,770 | ||||||
| 762,217 | 5.500%, 07/20/2038 | 800,240 | ||||||
| 787,938 | 5.000%, 12/20/2038 | 804,408 | ||||||
| 2,415,629 | 5.500%, 01/15/2039 | 2,534,255 | ||||||
| 1,916,644 | 5.000%, 03/15/2039 | 1,974,974 | ||||||
| 983,682 | 5.000%, 03/20/2039 | 1,004,243 | ||||||
| 9,802,092 | ||||||||
| Small Business Administration | ||||||||
| 1,128,286 | 5.250%, 09/01/2017 | 1,201,703 | ||||||
| 1,063,742 | 4.727%, 02/10/2019 | 1,091,181 | ||||||
| 1,508,194 | 3.880%, 03/01/2019 | 1,556,046 | ||||||
| 1,250,000 | 4.620%, 03/01/2019 | 1,269,940 | ||||||
| 1,158,245 | 7.300%, 08/01/2019 | 1,262,637 | ||||||
| 981,597 | 7.060%, 11/01/2019 | 1,066,248 | ||||||
| 1,187,872 | 5.310%, 08/01/2022 | 1,254,328 | ||||||
| 1,275,934 | 5.240%, 08/01/2023 | 1,329,986 | ||||||
| 1,132,631 | 4.890%, 12/01/2023 | 1,194,710 | ||||||
| 986,581 | 4.720%, 02/01/2024 | 1,026,184 | ||||||
| 1,149,429 | 4.770%, 04/01/2024 | 1,196,821 | ||||||
| 1,138,982 | 5.180%, 05/01/2024 | 1,195,303 | ||||||
| 1,246,934 | 4.880%, 11/01/2024 | 1,302,976 | ||||||
| 2,048,559 | 4.625%, 02/01/2025 | 2,124,506 | ||||||
| 1,172,086 | 5.090%, 10/01/2025 | 1,234,720 | ||||||
| 760,627 | 5.350%, 02/01/2026 | 809,317 | ||||||
| 1,731,953 | 5.570%, 03/01/2026 | 1,865,199 | ||||||
| 1,202,551 | 5.870%, 05/01/2026 | 1,293,204 | ||||||
| 968,982 | 5.370%, 10/01/2026 | 1,032,445 | ||||||
| 1,235,995 | 5.230%, 03/01/2027 | 1,308,225 | ||||||
| 1,012,776 | 5.490%, 03/01/2028 | 1,074,505 | ||||||
| 2,837,387 | 5.370%, 04/01/2028 | 3,010,670 | ||||||
| 1,110,833 | 5.600%, 09/01/2028 | 1,185,569 | ||||||
| 1,457,688 | 4.660%, 03/01/2029 | 1,508,735 | ||||||
| 1,238,816 | 4.310%, 04/01/2029 | 1,257,119 | ||||||
| 1,201,234 | 4.950%, 06/01/2029 | 1,253,675 | ||||||
| 34,905,952 | ||||||||
| Total U.S. Government Agencies (Cost $173,463,229) | 177,842,982 | |||||||
OTHER AGENCY SECURITIES - 1.1% | ||||||||
| 967,653 | Cal Dive International, Inc. 4.930%, 02/01/2027 | 973,575 | ||||||
| 1,250,000 | Federal Farm Credit Bank 3.000%, 09/22/2014 | 1,255,369 | ||||||
| Private Export Funding Corp. | ||||||||
| 478,000 | 4.550%, 05/15/2015 | 511,453 | ||||||
| 1,250,000 | 5.450%, 09/15/2017 | 1,340,829 | ||||||
| Total Other Agency Securities (Cost $4,125,069) | 4,081,226 | |||||||
MUNICIPAL BONDS - 2.2% | ||||||||
| 1,000,000 | County of Bexar TX, 6.628%, 06/15/2039 | 1,010,280 | ||||||
| 605,000 | County of Galveston TX, 5.108%, 02/01/2021 | 584,049 | ||||||
| 1,000,000 | Greater Orlando Aviation Authority, 5.250%, 10/01/2012 | 1,010,970 | ||||||
| 1,000,000 | Los Angeles Harbor Department, 5.500%, 08/01/2014 | 1,070,060 | ||||||
| 1,000,000 | Metropolitan Water District of Southern California 6.538%, 07/01/2039 | 1,004,050 | ||||||
| 1,250,000 | New York State City Transitional Finance Authority 4.466%, 08/01/2018 | 1,215,775 | ||||||
| 500,000 | New York State Housing Finance Agency 4.911%, 03/15/2019 | 495,630 | ||||||
| 665,000 | Qatar Government International Bond 4.000%, 01/20/2015(a) | 669,988 | ||||||
| 400,000 | State of California, 5.450%, 04/01/2015 | 402,860 | ||||||
| 850,000 | State of Texas, 5.333%, 10/01/2021 | 852,677 | ||||||
| Total Municipal Bonds (Cost $8,359,121) | 8,316,339 | |||||||
U.S. TREASURY OBLIGATIONS - 7.7% | ||||||||
| U.S. Treasury Bond - 2.5% | ||||||||
| 7,900,000 | 6.250%, 08/15/2023 | 9,438,035 | ||||||
| U.S. Treasury Note - 5.2% | ||||||||
| 6,675,000 | 2.250%, 05/31/2014 | 6,631,719 | ||||||
| 13,675,000 | 2.375%, 03/31/2016 | 13,087,413 | ||||||
| 19,719,132 | ||||||||
| Total U.S. Treasury Obligations (Cost $29,657,380) | 29,157,167 | |||||||
SHORT TERM INVESTMENTS - 5.4% | ||||||||
| Cash Equivalent - 4.3% | ||||||||
| 16,342,009 | JP Morgan Cash Trade Execution | 16,342,009 | ||||||
| Commercial Paper - 1.1% | ||||||||
| Fannie Mae Discount Note | ||||||||
| 4,000,000 | 0.000%, 01/22/2010 | 3,999,720 | ||||||
| Total Short Term Investments (Cost $20,341,729) | 20,341,729 | |||||||
INVESTMENTS HELD AS COLLATERAL FOR LOANED SECURITIES - 1.1% | ||||||||
| 33,821 | CWL 2006-14 2A1 ABS, 0.280%, 01/29/2010(b) | 33,505 | ||||||
| 4,027,714 | JP Morgan Prime Money Market | 4,027,714 | ||||||
| Total Investments Held As Collateral For Loaned Securities (Cost $4,061,535) | 4,061,219 | |||||||
Total Investments — 102.4% | ||||||||
| (Cost $387,604,506) | $387,990,625 | |||||||
Liabilities in Excess of Other Assets — (2.4)% | (9,169,339 | ) | ||||||
NET ASSETS — 100.00% | $378,821,286 | |||||||
Percentages are stated as a percent of net assets.
Footnotes:
Footnotes:
| (a) | Security exempt from registration under Rule 144A of the Securities Act of 1933 or otherwise restricted as to resale. These securities may be resold in transactions exempt from registration, normally to qualified institutional buyers. The Advisor, using procedures approved by the Board of Trustees, has deemed these securities to be liquid. | |
| (b) | Variable or Floating Rate Security. Rate disclosed is as of December 31, 2009. | |
| (L) | A portion or all of the security is on loan. |
Abbreviations:
| ABS | Asset Backed Security | |
| LP | Limited Partnership | |
| PLC | Public Liability Company |
The accompanying notes are an integral part of these financial statements.
13
Table of Contents
portfolio of investments (continued)
NEW COVENANT BALANCED GROWTH FUND
SCHEDULE OF INVESTMENTS at December 31, 2009 (Unaudited)
SCHEDULE OF INVESTMENTS at December 31, 2009 (Unaudited)
| Shares/Principal | ||||||||
| Amount | Value | |||||||
INVESTMENT COMPANIES - 99.1% | ||||||||
| 5,912,652 | New Covenant Growth Fund(a) | $161,947,530 | ||||||
| 3,873,917 | New Covenant Income Fund(a) | 84,877,518 | ||||||
| Total Investment Companies (Cost $249,133,981) | 246,825,048 | |||||||
CASH EQUIVALENTS - 1.0% | ||||||||
| 2,506,818 | JP Morgan Cash Trade Execution | 2,506,818 | ||||||
| Total Cash Equivalents (Cost $2,506,818) | 2,506,818 | |||||||
TOTAL INVESTMENTS — 100.1% | ||||||||
| (Cost $251,640,799) | $249,331,866 | |||||||
Liabilities in Excess of Other Assets — (0.1)% | (141,615 | ) | ||||||
NET ASSETS — 100.00% | $249,190,251 | |||||||
| (a) | Investment in affiliate. |
NEW COVENANT BALANCED INCOME FUND
SCHEDULE OF INVESTMENTS at December 31, 2009 (Unaudited)
SCHEDULE OF INVESTMENTS at December 31, 2009 (Unaudited)
| Shares/Principal | ||||||||
| Amount | Value | |||||||
INVESTMENT COMPANIES — 97.2% | ||||||||
| 1,255,692 | New Covenant Growth Fund(a) | $34,393,391 | ||||||
| 2,266,849 | New Covenant Income Fund(a) | 49,666,659 | ||||||
| Total Investment Companies (Cost $84,688,558) | 84,060,050 | |||||||
CASH EQUIVALENTS — 2.9% | ||||||||
| 2,532,537 | JP Morgan Cash Trade Execution | 2,532,537 | ||||||
| Total Cash Equivalents (Cost $2,532,537) | 2,532,537 | |||||||
TOTAL INVESTMENTS — 100.1% | ||||||||
| (Cost $87,221,095) | $86,592,587 | |||||||
Liabilities in Excess of Other Assets — (0.1)% | (117,152 | ) | ||||||
NET ASSETS — 100.00% | $86,475,435 | |||||||
| (a) | Investment in affiliate. |
The accompanying notes are an integral part of these financial statements.
14
Table of Contents
statements of assets and liabilities
NEW COVENANT FUNDS
December 31, 2009 (Unaudited)
December 31, 2009 (Unaudited)
| Balanced | Balanced | |||||||||||||||
| Growth Fund | Income Fund | Growth Fund | Income Fund | |||||||||||||
Assets: | ||||||||||||||||
| Investments, at value (Cost $613,395,650, $387,604,506, $2,506,818 and $2,532,537, respectively)(a) | $722,216,249 | $387,990,625 | $2,506,818 | $2,532,537 | ||||||||||||
| Investments in affiliates, at value (Cost $0, $0, $249,133,981 and $84,688,558, respectively) | — | — | 246,825,048 | 84,060,050 | ||||||||||||
| Cash denominated in foreign currency, at value | 2,413 | — | — | — | ||||||||||||
| Interest and dividends receivable | 711,112 | 3,012,363 | — | — | ||||||||||||
| Receivable for capital shares issued | 174,692 | 94,517 | 13,571 | 11,260 | ||||||||||||
| Receivable for investments sold | 969,464 | — | — | — | ||||||||||||
| Receivable from Adviser | — | — | 33,871 | 11,615 | ||||||||||||
| Reclaims receivable | 81,625 | — | — | — | ||||||||||||
| Prepaid expenses | 51,072 | 34,381 | 18,525 | 10,553 | ||||||||||||
| Total Assets | 724,206,627 | 391,131,886 | 249,397,833 | 86,626,015 | ||||||||||||
Liabilities: | ||||||||||||||||
| Payable for investments purchased | 683,782 | 7,978,492 | — | — | ||||||||||||
| Payable for capital shares redeemed | 537,239 | 25,368 | 95,430 | 100,404 | ||||||||||||
| Payable to custodian | 620,590 | 15,958 | — | — | ||||||||||||
| Payable for return of collateral received on securities loaned | 11,826,398 | 4,061,535 | — | — | ||||||||||||
| Payable for dividend withholding tax | 9,093 | — | — | — | ||||||||||||
| Cash denominated in foreign currency, at value | 530,525 | — | — | — | ||||||||||||
| Accrued expenses and other payables: | ||||||||||||||||
| Investment advisory, net | 566,398 | 107,544 | — | — | ||||||||||||
| Administration | 15,819 | 11,599 | 6,046 | 4,265 | ||||||||||||
| Shareholder service | 102,787 | 53,308 | 48,734 | 17,394 | ||||||||||||
| Transfer agent | 7,716 | 4,324 | 20,492 | 6,821 | ||||||||||||
| Accounting | 1,384 | 11,136 | 2,820 | 1,429 | ||||||||||||
| Chief Compliance Officer | 10,241 | 3,752 | 4,031 | 1,208 | ||||||||||||
| Other | 86,063 | 37,584 | 30,029 | 19,059 | ||||||||||||
| Total Liabilities | 14,998,035 | 12,310,600 | 207,582 | 150,580 | ||||||||||||
NET ASSETS | $709,208,592 | $378,821,286 | $249,190,251 | $86,475,435 | ||||||||||||
| Capital | 791,934,759 | 449,909,165 | 278,117,032 | 92,641,732 | ||||||||||||
| Undistributed (distributions in excess of) net investment income | (688,169 | ) | 25,667 | — | 1,131 | |||||||||||
| Accumulated net realized losses from investment and foreign currency transactions | (190,858,308 | ) | (71,499,665 | ) | (26,617,848 | ) | (5,538,920 | ) | ||||||||
| Net unrealized appreciation (depreciation) on investment transactions and translation of assets and liabilities denominated in foreign currency | 108,820,310 | 386,119 | (2,308,933 | ) | (628,508 | ) | ||||||||||
| Net assets | $709,208,592 | $378,821,286 | $249,190,251 | $86,475,435 | ||||||||||||
| Shares outstanding | 25,892,939 | 17,290,239 | 3,438,103 | 5,002,124 | ||||||||||||
| Net asset value, offering price and redemption price per share | $27.39 | $21.91 | $72.48 | $17.29 | ||||||||||||
| (a) | Includes value of securities on loan of $11,488,799, $3,977,444, $0 and $0, respectively. |
The accompanying notes are an integral part of these financial statements.
15
Table of Contents
statements of operations
NEW COVENANT FUNDS
For the six months ended December 31, 2009 (Unaudited)
For the six months ended December 31, 2009 (Unaudited)
| Balanced | Balanced | |||||||||||||||
| Growth Fund | Income Fund | Growth Fund | Income Fund | |||||||||||||
INVESTMENT INCOME: | ||||||||||||||||
| Interest | $— | $8,882,021 | $— | $— | ||||||||||||
| Dividends | 5,949,781 | — | — | — | ||||||||||||
| Dividend income from affiliates | — | — | 2,280,595 | 1,112,165 | ||||||||||||
| Foreign tax withholding | (80,357 | ) | — | — | — | |||||||||||
| Income from securities lending | 85,147 | 16,496 | — | — | ||||||||||||
| Total Investment Income | 5,954,571 | 8,898,517 | 2,280,595 | 1,112,165 | ||||||||||||
EXPENSES (Note 3): | ||||||||||||||||
| Investment advisory | 3,350,782 | 1,441,473 | — | — | ||||||||||||
| Shareholder servicing | 610,666 | 310,844 | 290,999 | 100,861 | ||||||||||||
| Other | 149,617 | 106,523 | 86,595 | 33,455 | ||||||||||||
| Accounting | 58,280 | 34,004 | 14,293 | 4,439 | ||||||||||||
| Administration | 57,311 | 35,358 | 22,894 | 6,681 | ||||||||||||
| Custodian | 80,055 | 3,708 | 10 | 6 | ||||||||||||
| Transfer agent | 20,162 | 16,158 | 41,602 | 17,981 | ||||||||||||
| Chief Compliance Officer | 21,563 | 9,502 | 7,921 | 2,573 | ||||||||||||
| Total expenses before contractual fee reductions | 4,348,436 | 1,957,570 | 464,314 | 165,996 | ||||||||||||
| Expenses contractually reduced by Adviser | (339,895 | ) | (310,844 | ) | (194,344 | ) | (67,239 | ) | ||||||||
| Total net expenses | 4,008,541 | 1,646,726 | 269,970 | 98,757 | ||||||||||||
NET INVESTMENT INCOME | 1,946,030 | 7,251,791 | 2,010,625 | 1,013,408 | ||||||||||||
REALIZED AND UNREALIZED GAINS FROM INVESTMENTS AND FOREIGN CURRENCY TRANSACTIONS | ||||||||||||||||
| Net realized gains (losses) on investment transactions | 7,029,065 | (38,214,025 | ) | (1,001,081 | )+ | (400,125 | )+ | |||||||||
| Net realized gains on foreign currency transactions | 15,243 | — | — | — | ||||||||||||
| Net change in unrealized appreciation on investments and foreign currency transactions | 117,447,227 | 55,748,967 | 33,042,988 | 8,482,149 | ||||||||||||
| Net realized/unrealized gains from investments and foreign currency transactions | 124,491,535 | 17,534,942 | 32,041,907 | 8,082,024 | ||||||||||||
| Change in net assets resulting from operations | $126,437,565 | $24,786,733 | $34,052,532 | $9,095,432 | ||||||||||||
| + | Represents realized losses from investment transactions with affiliates. |
The accompanying notes are an integral part of these financial statements.
16
Table of Contents
statements of changes in net assets
NEW COVENANT FUNDS
| Growth Fund | Income Fund | |||||||||||||||
| For the six | For the year | For the six | For the year | |||||||||||||
| months ended | ended | months ended | ended | |||||||||||||
| December 31, 2009# | June 30, 2009 | December 31, 2009# | June 30, 2009 | |||||||||||||
OPERATIONS: | ||||||||||||||||
| Net investment income | $1,946,030 | $7,214,551 | $7,251,791 | $21,162,279 | ||||||||||||
| Net realized gains (losses) from investment and foreign currency transactions | 7,044,308 | (179,956,214 | ) | (38,214,025 | ) | (23,733,742 | ) | |||||||||
| Net change in unrealized appreciation (depreciation) on investments and translation of assets and liabilities in foreign currency | 117,447,227 | (62,955,346 | ) | 55,748,967 | (35,428,867 | ) | ||||||||||
| Change in net assets resulting from operations | 126,437,565 | (235,697,009 | ) | 24,786,733 | (38,000,330 | ) | ||||||||||
DISTRIBUTIONS TO SHAREHOLDERS: | ||||||||||||||||
| From net investment income | (2,598,381 | ) | (6,717,989 | ) | (7,518,489 | ) | (21,145,431 | ) | ||||||||
| Tax return of capital | — | (517,962 | ) | — | — | |||||||||||
| Change in net assets from distributions to shareholders | (2,598,381 | ) | (7,235,951 | ) | (7,518,489 | ) | (21,145,431 | ) | ||||||||
CAPITAL TRANSACTIONS: | ||||||||||||||||
| Proceeds from shares issued | 15,299,214 | 65,384,239 | 10,552,325 | 17,538,879 | ||||||||||||
| Dividends reinvested | 188,524 | 564,472 | 560,795 | 1,578,804 | ||||||||||||
| Cost of shares redeemed | (28,326,852 | ) | (60,893,582 | ) | (23,006,077 | ) | (82,851,257 | ) | ||||||||
| Change in net assets from capital transactions | (12,839,114 | ) | 5,055,129 | (11,892,957 | ) | (63,733,574 | ) | |||||||||
| Change in net assets | 111,000,070 | (237,877,831 | ) | 5,375,287 | (122,879,335 | ) | ||||||||||
NET ASSETS: | ||||||||||||||||
| Beginning of period | 598,208,522 | 836,086,353 | 373,445,999 | 496,325,334 | ||||||||||||
| End of period | $709,208,592 | $598,208,522 | $378,821,286 | $373,445,999 | ||||||||||||
SHARE TRANSACTIONS: | ||||||||||||||||
| Issued | 616,906 | 2,988,749 | 481,000 | 818,415 | ||||||||||||
| Reinvested | 7,020 | 18,600 | 25,541 | 76,839 | ||||||||||||
| Redeemed | (1,101,742 | ) | (2,807,279 | ) | (1,059,342 | ) | (3,964,503 | ) | ||||||||
| Net increase (decrease) | (477,816 | ) | 200,070 | (552,801 | ) | (3,069,249 | ) | |||||||||
| Undistributed (distributions in excess of) net investment income | $(688,169 | ) | $(35,818 | ) | $25,667 | $292,365 | ||||||||||
| # | Unaudited |
The accompanying notes are an integral part of these financial statements.
17
Table of Contents
statements of changes in net assets
NEW COVENANT FUNDS
| Balanced Growth Fund | Balanced Income Fund | |||||||||||||||
| For the six | For the year | For the six | For the year | |||||||||||||
| months ended | ended | months ended | ended | |||||||||||||
| December 31, 2009# | June 30, 2009 | December 31, 2009# | June 30, 2009 | |||||||||||||
OPERATIONS: | ||||||||||||||||
| Net investment income | $2,010,625 | $6,047,336 | 1,013,408 | $2,860,789 | ||||||||||||
| Net realized losses from investment and foreign currency transactions | (1,001,081 | )+ | (10,454,971 | )+ | (400,125 | )+ | (2,919,678 | )+ | ||||||||
| Net change in unrealized appreciation (depreciation) on investments and translation of assets and liabilities in foreign currency | 33,042,988 | (57,528,038 | ) | 8,482,149 | (14,878,617 | ) | ||||||||||
| Change in net assets resulting from operations | 34,052,532 | (61,935,673 | ) | 9,095,432 | (14,937,506 | ) | ||||||||||
DISTRIBUTIONS TO SHAREHOLDERS: | ||||||||||||||||
| From net investment income | (2,016,641 | ) | (5,929,883 | ) | (1,012,277 | ) | (2,836,623 | ) | ||||||||
| From net realized gains on investments | — | (3,339,267 | ) | — | — | |||||||||||
| Tax return of capital | — | (122,690 | ) | — | (28,265 | ) | ||||||||||
| Change in net assets from distributions to shareholders | (2,016,641 | ) | (9,391,840 | ) | (1,012,277 | ) | (2,864,888 | ) | ||||||||
CAPITAL TRANSACTIONS: | ||||||||||||||||
| Proceeds from shares issued | 7,545,566 | 10,263,042 | 2,633,684 | 3,012,500 | ||||||||||||
| Dividends reinvested | 1,585,837 | 7,951,390 | 646,941 | 1,804,880 | ||||||||||||
| Cost of shares redeemed | (13,047,114 | ) | (31,111,094 | ) | (3,553,586 | ) | (11,006,677 | ) | ||||||||
| Change in net assets from capital transactions | (3,915,711 | ) | (12,896,662 | ) | (272,961 | ) | (6,189,297 | ) | ||||||||
| Change in net assets | 28,120,180 | (84,224,175 | ) | 7,810,194 | (23,991,691 | ) | ||||||||||
NET ASSETS: | ||||||||||||||||
| Beginning of period | 221,070,071 | 305,294,246 | 78,665,241 | 102,656,932 | ||||||||||||
| End of period | $249,190,251 | $221,070,071 | $86,475,435 | $78,665,241 | ||||||||||||
SHARE TRANSACTIONS: | ||||||||||||||||
| Issued | 110,411 | 146,240 | 155,402 | 196,869 | ||||||||||||
| Reinvested | 22,395 | 127,800 | 37,907 | 115,769 | ||||||||||||
| Redeemed | (186,530 | ) | (483,294 | ) | (214,820 | ) | (688,928 | ) | ||||||||
| Net decrease | (53,724 | ) | (209,254 | ) | (21,511 | ) | (376,290 | ) | ||||||||
| Undistributed net investment income | $— | $— | $1,131 | $— | ||||||||||||
| # | Unaudited | |
| + | Represents realized losses from investment transactions with affiliates. |
The accompanying notes are an integral part of these financial statements.
18
Table of Contents
financial highlights
NEW COVENANT FUNDS
For a Share outstanding throughout the period
| Growth Fund | ||||||||||||||||||||||||
| For the six months | For the year | For the year | For the year | For the year | For the year | |||||||||||||||||||
| ended | ended | ended | ended | ended | ended | |||||||||||||||||||
| December 31, | June 30, | June 30, | June 30, | June 30, | June 30, | |||||||||||||||||||
| 2009(a) | 2009 | 2008 | 2007 | 2006 | 2005 | |||||||||||||||||||
| Net Asset Value, Beginning of Period | $22.68 | $31.95 | $38.90 | $32.76 | $29.92 | $28.07 | ||||||||||||||||||
INVESTMENT ACTIVITIES: | ||||||||||||||||||||||||
| Net investment income | 0.07 | 0.29 | 0.26 | 0.26 | 0.18 | 0.21 | ||||||||||||||||||
| Net realized and unrealized gains (losses) on investments and foreign currency transactions | 4.74 | (9.29) | (4.98) | 6.17 | 2.86 | 1.85 | ||||||||||||||||||
| Total from Investment Activities | 4.81 | (9.00) | (4.72) | 6.43 | 3.04 | 2.06 | ||||||||||||||||||
DIVIDENDS: | ||||||||||||||||||||||||
| Net investment income | (0.10 | ) | (0.25) | (0.24) | (0.29) | (0.20) | (0.21) | |||||||||||||||||
| Net realized gains | — | — | (1.97) | — | — | — | ||||||||||||||||||
| Tax return of capital | — | (0.02) | (0.02) | — | — | — | ||||||||||||||||||
| Total Dividends | (0.10 | ) | (0.27) | (2.23) | (0.29) | (0.20) | (0.21) | |||||||||||||||||
| Change in net asset value per share | 4.71 | (9.27) | (6.95) | 6.14 | 2.84 | 1.85 | ||||||||||||||||||
Net Asset Value, End of Period | $27.39 | $22.68 | $31.95 | $38.90 | $32.76 | $29.92 | ||||||||||||||||||
| Total Return | 21.16% | (b) | (28.16)% | (12.61)% | 19.68% | 10.17% | 7.38% | |||||||||||||||||
RATIOS/SUPPLEMENTARY DATA: | ||||||||||||||||||||||||
| Net assets at end of period (in 000’s) | $709,208 | $598,209 | $836,086 | $1,033,536 | $906,010 | $878,583 | ||||||||||||||||||
| Ratio of expenses to average net assets | 1.18% | (c) | 1.12% | 1.10% | 1.08% | 1.07% | 1.11% | |||||||||||||||||
| Ratio of expenses to average net assets, excluding waivers | 1.28% | (c) | 1.30% | 1.29% | 1.28% | 1.28% | 1.36% | |||||||||||||||||
| Ratio of net investment income to average net assets | 0.57% | (c) | 1.15% | 0.73% | 0.73% | 0.58% | 0.75% | |||||||||||||||||
| Ratio of net investment income to average net assets, excluding waivers | 0.47% | (c) | 0.97% | 0.54% | 0.53% | 0.37% | 0.50% | |||||||||||||||||
| Portfolio turnover rate | 31% | (b) | 94% | 65% | 65% | 51% | 76% | |||||||||||||||||
| (a) | Unaudited. | |
| (b) | Not annualized. | |
| (c) | Annualized. |
The accompanying notes are an integral part of these financial statements.
19
Table of Contents
financial highlights
NEW COVENANT FUNDS
For a Share outstanding throughout the period
| Income Fund | ||||||||||||||||||||||||
| For the six months | For the year | For the year | For the year | For the year | For the year | |||||||||||||||||||
| ended | ended | ended | ended | ended | ended | |||||||||||||||||||
| December 31, | June 30, | June 30, | June 30, | June 30, | June 30, | |||||||||||||||||||
| 2009(a) | 2009 | 2008 | 2007 | 2006 | 2005 | |||||||||||||||||||
| Net Asset Value, Beginning of Period | $20.93 | $23.73 | $24.52 | $24.28 | $25.56 | $25.17 | ||||||||||||||||||
INVESTMENT ACTIVITIES: | ||||||||||||||||||||||||
| Net investment income | 0.42 | 1.11 | 1.16 | 1.12 | 1.00 | 0.94 | ||||||||||||||||||
| Net realized and unrealized gains (losses) on investments | 0.99 | (2.79) | (0.81) | 0.25 | (1.23) | 0.55 | ||||||||||||||||||
| Total from Investment Activities | 1.41 | (1.68) | 0.35 | 1.37 | (0.23) | 1.49 | ||||||||||||||||||
DIVIDENDS: | ||||||||||||||||||||||||
| Net investment income | (0.43 | ) | (1.12) | (1.14) | (1.13) | (1.04) | (1.04) | |||||||||||||||||
| Net realized gains | — | — | — | — | (0.01) | (0.06) | ||||||||||||||||||
| Tax return of capital | — | — | — | — | * | — | * | — | ||||||||||||||||
| Total Dividends | (0.43 | ) | (1.12) | (1.14) | (1.13) | (1.05) | (1.10) | |||||||||||||||||
| Change in net asset value per share | 0.98 | (2.80) | (0.79) | 0.24 | (1.28) | 0.39 | ||||||||||||||||||
Net Asset Value, End of Period | $21.91 | $20.93 | $23.73 | $24.52 | $24.28 | $25.56 | ||||||||||||||||||
| Total Return | 6.77% | (b) | (6.90)% | 1.36% | 5.65% | (0.90)% | 6.02% | |||||||||||||||||
RATIOS/SUPPLEMENTARY DATA: | ||||||||||||||||||||||||
| Net assets at end of period (in 000’s) | $378,821 | $373,446 | $496,325 | $537,345 | $526,359 | $527,208 | ||||||||||||||||||
| Ratio of expenses to average net assets | 0.86% | (c) | 0.86% | 0.85% | 0.84% | 0.84% | 0.86% | |||||||||||||||||
| Ratio of expenses to average net assets, excluding waivers | 1.02% | (c) | 1.02% | 1.01% | 1.01% | 1.01% | 1.08% | |||||||||||||||||
| Ratio of net investment income to average net assets | 3.78% | (c) | 5.15% | 4.70% | 4.49% | 4.04% | 3.68% | |||||||||||||||||
| Ratio of net investment income to average net assets, excluding waivers | 3.62% | (c) | 4.99% | 4.54% | 4.32% | 3.87% | 3.46% | |||||||||||||||||
| Portfolio turnover rate | 49% | (b) | 230% | 170% | 258% | 263% | 206% | |||||||||||||||||
| * | Less than $0.005. | |
| (a) | Unaudited. | |
| (b) | Not annualized. | |
| (c) | Annualized. |
The accompanying notes are an integral part of these financial statements.
20
Table of Contents
financial highlights
NEW COVENANT FUNDS
For a Share outstanding throughout the period
| Balanced Growth Fund | ||||||||||||||||||||||||
| For the six months | For the year | For the year | For the year | For the year | For the year | |||||||||||||||||||
| ended | ended | ended | ended | ended | ended | |||||||||||||||||||
| December 31, | June 30, | June 30, | June 30, | June 30, | June 30, | |||||||||||||||||||
| 2009(b) | 2009 | 2008 | 2007 | 2006 | 2005 | |||||||||||||||||||
| Net Asset Value, Beginning of Period | $63.31 | $82.49 | $90.86 | $81.30 | $78.20 | $74.65 | ||||||||||||||||||
INVESTMENT ACTIVITIES: | ||||||||||||||||||||||||
| Net investment income(a) | 0.58 | 1.70 | 1.83 | 1.83 | 1.52 | 1.41 | ||||||||||||||||||
| Net realized and unrealized gains (losses) on investments(a) | 9.17 | (18.25 | ) | (8.37 | ) | 9.56 | 3.10 | 3.54 | ||||||||||||||||
| Total from Investment Activities | 9.75 | (16.55 | ) | (6.54 | ) | 11.39 | 4.62 | 4.95 | ||||||||||||||||
DIVIDENDS: | ||||||||||||||||||||||||
| Net investment income | (0.58 | ) | (1.69 | ) | (1.83 | ) | (1.83 | ) | (1.52 | ) | (1.40 | ) | ||||||||||||
| Net realized gains | — | (0.93 | ) | — | — | — | — | |||||||||||||||||
| Tax return of capital | — | (0.01 | ) | — | — | — | * | — | ||||||||||||||||
| Total Dividends | (0.58 | ) | (2.63 | ) | (1.83 | ) | (1.83 | ) | (1.52 | ) | (1.40 | ) | ||||||||||||
| Change in net asset value per share | 9.17 | (19.18 | ) | (8.37 | ) | 9.56 | 3.10 | 3.55 | ||||||||||||||||
Net Asset Value, End of Period | $72.48 | $63.31 | $82.49 | $90.86 | $81.30 | $78.20 | ||||||||||||||||||
| Total Return | 15.43%(c) | (19.96)% | (7.26)% | 14.11% | 5.93% | 6.68% | ||||||||||||||||||
RATIOS/SUPPLEMENTARY DATA: | ||||||||||||||||||||||||
| Net assets at end of period (in 000’s) | $249,190 | $221,070 | $305,294 | $353,344 | $312,077 | $305,524 | ||||||||||||||||||
| Ratio of expenses to average net assets | 0.22% | (d) | 0.13% | 0.15% | 0.12% | 0.12% | 0.14% | |||||||||||||||||
| Ratio of expenses to average net assets, excluding waivers | 0.38% | (d) | 0.37% | 0.39% | 0.37% | 0.38% | 0.22% | |||||||||||||||||
| Ratio of net investment income to average net assets | 1.66% | (d) | 2.56% | 2.07% | 2.11% | 1.85% | 1.83% | |||||||||||||||||
| Ratio of net investment income to average net assets, excluding waivers | 1.50% | (d) | 2.32% | 1.83% | 1.86% | 1.59% | 1.75% | |||||||||||||||||
| Portfolio turnover rate | 1% | (c) | 7% | 17% | 7% | 10% | 5% | |||||||||||||||||
| * | Less than $0.005. | |
| (a) | Includes income or gains (losses) from affiliates. | |
| (b) | Unaudited. | |
| (c) | Not annualized. | |
| (d) | Annualized. |
The accompanying notes are an integral part of these financial statements.
21
Table of Contents
financial highlights
NEW COVENANT FUNDS
For a Share outstanding throughout the period
| Balanced Income Fund | ||||||||||||||||||||||||
| For the six months | For the year | For the year | For the year | For the year | For the year | |||||||||||||||||||
| Ended | ended | ended | ended | ended | ended | |||||||||||||||||||
| December 31, | June 30, | June 30, | June 30, | June 30, | June 30, | |||||||||||||||||||
| 2009(b) | 2009 | 2008 | 2007 | 2006 | 2005 | |||||||||||||||||||
| Net Asset Value, Beginning of Period | $15.66 | $19.01 | $20.40 | $18.99 | $18.90 | $18.24 | ||||||||||||||||||
INVESTMENT ACTIVITIES: | ||||||||||||||||||||||||
| Net investment income(a) | 0.20 | 0.56 | 0.60 | 0.59 | 0.52 | 0.48 | ||||||||||||||||||
| Net realized and unrealized gains (losses) on investments(a) | 1.63 | (3.35 | ) | (1.39 | ) | 1.41 | 0.09 | 0.66 | ||||||||||||||||
| Total from Investment Activities | 1.83 | (2.79 | ) | (0.79 | ) | 2.00 | 0.61 | 1.14 | ||||||||||||||||
DIVIDENDS: | ||||||||||||||||||||||||
| Net investment income | (0.20 | ) | (0.55 | ) | (0.60 | ) | (0.59 | ) | (0.52 | ) | (0.48 | ) | ||||||||||||
| Net realized gains | — | — | — | — | — | — | ||||||||||||||||||
| Tax return of capital | — | (0.01 | ) | — | — | * | — | — | ||||||||||||||||
| Total Dividends | (0.20 | ) | (0.56 | ) | (0.60 | ) | (0.59 | ) | (0.52 | ) | (0.48 | ) | ||||||||||||
| Change in net asset value per share | 1.63 | (3.35 | ) | (1.39 | ) | 1.41 | 0.09 | 0.66 | ||||||||||||||||
Net Asset Value, End of Period | $17.29 | $15.66 | $19.01 | $20.40 | $18.99 | $18.90 | ||||||||||||||||||
| Total Return | 11.73%(c) | (14.60)% | (3.95)% | 10.65% | 3.26% | 6.32% | ||||||||||||||||||
RATIOS/SUPPLEMENTARY DATA: | ||||||||||||||||||||||||
| Net assets at end of period (in 000’s) | $86,475 | $78,665 | $102,657 | $121,855 | $122,512 | $124,809 | ||||||||||||||||||
| Ratio of expenses to average net assets | 0.23% | (d) | 0.16% | 0.20% | 0.15% | 0.15% | 0.17% | |||||||||||||||||
| Ratio of expenses to average net assets, excluding waivers | 0.39% | (d) | 0.40% | 0.44% | 0.40% | 0.41% | 0.25% | |||||||||||||||||
| Ratio of net investment income to average net assets | 2.40% | (d) | 3.47% | 2.97% | 2.95% | 2.71% | 2.58% | |||||||||||||||||
| Ratio of net investment income to average net assets, excluding waivers | 2.24% | (d) | 3.23% | 2.73% | 2.70% | 2.45% | 2.50% | |||||||||||||||||
| Portfolio turnover rate | 1% | (c) | 10% | 10% | 7% | 13% | 6% | |||||||||||||||||
| * | Less than $0.005. | |
| (a) | Includes income or gains (losses) from affiliates. | |
| (b) | Unaudited. | |
| (c) | Not Annualized. | |
| (d) | Annualized. |
The accompanying notes are an integral part of these financial statements.
22
Table of Contents
notes to financial statements
NEW COVENANT FUNDS
December 31, 2009 (Unaudited)
December 31, 2009 (Unaudited)
1. Organization
New Covenant Funds (the “Trust”), an open-end, diversified management investment company, was organized as a Delaware business trust on September 30, 1998. It currently consists of four investment funds: New Covenant Growth Fund (“Growth Fund”), New Covenant Income Fund (“Income Fund”), New Covenant Balanced Growth Fund (“Balanced Growth Fund”), and New Covenant Balanced Income Fund (“Balanced Income Fund”), (individually, a “Fund,” and collectively, the “Funds”). The Funds commenced operations on July 1, 1999. The Trust’s authorized capital consists of an unlimited number of shares of beneficial interest of $0.001 par value. The Funds’ investment advisor is One Compass Advisors, a wholly owned subsidiary of the Presbyterian Church (U.S.A.) Foundation (the “Adviser”).
The objectives of the Funds are as follows:
Growth Fund | Long-term capital appreciation. Dividend income, if any, will be incidental. | |
Income Fund | High level of current income with preservation of capital. | |
Balanced Growth Fund | Capital appreciation with less risk than would be present in a portfolio of only common stocks. | |
Balanced Income Fund | Current income and long-term growth of capital. |
2. Significant Accounting Policies
The preparation of financial statements in conformity with accounting principles generally accepted in the United States (“GAAP”) requires management to make estimates and assumptions that affect the reported amounts of assets and liabilities and disclosure of contingent assets and liabilities at the date of the financial statements and the reported amounts of income and expenses during the reporting period. Actual results could differ from those estimates. The following is a summary of the significant accounting policies consistently followed by the Funds in the preparation of their financial statements. The policies are in conformity with GAAP.
Portfolio Valuation: Fund investments are recorded at market value. Portfolio securities listed on a domestic or foreign exchange are valued at the last sale price on the day of valuation or, if there was no sale that day, at the last reported bid price as of the close of trading. Equity securities traded on NASDAQ use the official closing price. Equity securities which are traded in the over-the-counter market only, but which are not included on NASDAQ, are valued at the mean between the last preceding bid and ask prices. Debt securities with a remaining maturity of sixty days or more are valued using a pricing service when such prices are believed to reflect fair market value. Debt securities with a remaining maturity of less than sixty days are valued at amortized cost, which approximates market value. Open-end funds are valued at net asset value. Closed-end funds and exchange-traded funds are valued at market value. All other assets and securities with no readily determinable market values are valued using procedures adopted by the Board of Trustees. Factors used in determining fair value include but are not limited to: type of security or asset, fundamental analytical data relating to the investment in the security, evaluation of the forces that influence the market in which the security is purchased and sold, and information as to any transactions or offers with respect to the security. As of December 31, 2009, the Funds did not hold any securities for which market quotations were not readily available.
Foreign securities traded outside the United States are generally valued as of the time their trading is complete, which is usually different from the close of the New York Stock Exchange (“NYSE”). Occasionally, events affecting the value of such securities may occur between such times and the close of the NYSE that will not be reflected in the security’s market value. If events materially affecting the value of such securities occur during such period, these securities will be valued at their fair value according to procedures adopted by the Board of Trustees. All securities and other assets of a Fund initially expressed in foreign currencies will be converted to U.S. dollar values at the foreign exchange rate every business day, generally at 4:00 PM ET.
The Funds have adopted authoritative fair valuation accounting standards which establish a definition of fair value and set out a hierarchy for measuring fair value. These standards require additional disclosures about the various inputs and valuation techniques used to develop the measurements of fair value and a discussion in changes in valuation techniques and related inputs during the period. These inputs are summarized in the three broad levels listed below.
The Funds have performed an analysis of all investments to determine the significance and character of all inputs to their fair value determination.
Level 1 — Quoted unadjusted prices for identical instruments in active markets to which the Fund has access at the date of measurement.
Level 2 — Quoted prices for similar instruments in active markets; quoted prices for identical or similar instruments in markets that are not active; and model-derived valuations in which all significant inputs and significant value drivers are observable in active markets. Level 2 inputs are those in markets for which there are few transactions, the prices are not current, little public information exists or instances where prices vary substantially over time or among brokered market makers.
23
Table of Contents
notes to financial statements
NEW COVENANT FUNDS
December 31, 2009 (Unaudited)
December 31, 2009 (Unaudited)
Level 3 — Model derived valuations in which one or more significant inputs or significant value drivers are unobservable. Unobservable inputs are those inputs that reflect the Fund’s own assumptions of what market participants would use to price the asset or liability based on the best available information.
The following table provides the fair value measurements of applicable Fund assets by level within the fair value hierarchy for each Fund as of December 31, 2009. These assets are measured on a recurring basis.
| Growth Fund | Level 1 | Level 2 | Level 3 | Total Market Value | ||||||||||||
| Equity | ||||||||||||||||
| Common Stocks | $673,911,565 | $15,956,647 | $— | $689,868,212 | ||||||||||||
| Real Estate Investment Trusts | $6,469,613 | — | — | $6,469,613 | ||||||||||||
| Preferred Stocks | $1,567,442 | — | — | $1,567,442 | ||||||||||||
| Total Equity | $681,948,620 | $15,956,647 | $— | $697,905,267 | ||||||||||||
| Fixed Income | ||||||||||||||||
| Medium Term Note | $— | $6,971,335 | $— | $6,971,335 | ||||||||||||
| Money Market Fund | — | 3,656,987 | — | 3,656,987 | ||||||||||||
| Asset Backed Securities | — | 670,701 | — | 670,701 | ||||||||||||
| Total Fixed Income | $— | $11,299,023 | $— | $11,299,023 | ||||||||||||
| Short-Term Investments | $— | $13,011,959 | $— | $13,011,959 | ||||||||||||
| Total Investment in Securities | $681,948,620 | $40,267,629 | $— | $722,216,249 | ||||||||||||
| Income Fund | Level 1 | Level 2 | Level 3 | Total Market Value | ||||||||||||
| Fixed Income | ||||||||||||||||
| U.S. Government Agencies | $— | $177,842,982 | $— | $177,842,982 | ||||||||||||
| Corporate Bonds | — | 82,783,645 | — | 82,783,645 | ||||||||||||
| Non-Agency Mortgage Backed | — | 42,284,718 | — | 42,284,718 | ||||||||||||
| U.S. Treasury Obligations | — | 29,157,167 | — | 29,157,167 | ||||||||||||
| Asset-Backed Securities | — | 19,155,105 | — | 19,155,105 | ||||||||||||
| Municipal Bond | — | 8,316,339 | — | 8,316,339 | ||||||||||||
| Other Agency Securities | — | 4,081,226 | — | 4,081,226 | ||||||||||||
| Money Market Fund | — | 4,027,714 | — | 4,027,714 | ||||||||||||
| Total Fixed Income | $— | $367,648,896 | $— | $367,648,896 | ||||||||||||
| Short-Term Investments | $— | $20,341,729 | $— | $20,341,729 | ||||||||||||
| Total Investment in Securities | $— | $387,990,625 | $— | $387,990,625 | ||||||||||||
| Balanced Growth Fund | Level 1 | Level 2 | Level 3 | Total Market Value | ||||||||||||
| Equity | ||||||||||||||||
| Investment Companies | $246,825,048 | $— | $— | $246,825,048 | ||||||||||||
| Total Equity | $246,825,048 | $— | $— | $246,825,048 | ||||||||||||
| Short-Term Investments | $— | $2,506,818 | $— | $2,506,818 | ||||||||||||
| Total Investment in Securities | $246,825,048 | $2,506,818 | $— | $249,331,866 | ||||||||||||
| Balanced Income Fund | Level 1 | Level 2 | Level 3 | Total Market Value | ||||||||||||
| Equity | ||||||||||||||||
| Investment Companies | $84,060,050 | $— | $— | $84,060,050 | ||||||||||||
| Total Equity | $84,060,050 | $— | $— | $84,060,050 | ||||||||||||
| Short-Term Investments | $— | $2,532,537 | $— | $2,532,537 | ||||||||||||
| Total Investment in Securities | $84,060,050 | $2,532,537 | $— | $86,592,587 | ||||||||||||
Securities Transactions and Investment Income: During the period, security transactions are accounted for no later than one business day following the trade date. For financial reporting purposes, however, security transactions are accounted for on trade date on the last business day of the reporting period. Securities sold are determined on a specific identification basis. Interest income is recognized on the accrual basis and includes, where applicable, the amortization of premium or accretion of discount for both
24
Table of Contents
notes to financial statements
NEW COVENANT FUNDS
December 31, 2009 (Unaudited)
December 31, 2009 (Unaudited)
financial reporting and tax purposes. Dividend income is recorded on the ex-dividend date. Gains or losses realized on sales of securities are determined by comparing the identified cost of the security lot sold with the net sales proceeds.
Options: The Income Fund may purchase or write options which are traded over-the-counter to hedge fluctuation risks in the prices of certain securities. When the Fund writes a call or put option, an amount equal to the premium received is reflected as a liability. The liability is subsequently “marked-to-market” to reflect the current market value of the option written. The premium paid by the Fund for the purchase of a call or put option is recorded as an investment and subsequently “marked-to-market” to reflect the current market value of the option purchased. The Fund is subject to the risk of an imperfect correlation between movement in the price of the option and the price of the underlying security. Risks may also arise due to illiquid secondary markets for the options. There were no options outstanding at December 31, 2009.
Foreign Currency Translation: The books and records of the Funds are maintained in U.S. dollars. Investment valuation and other assets and liabilities initially expressed in foreign currencies are converted each business day into U.S. dollars based upon current exchange rates. Purchases and sales of foreign investments and income and expenses are converted into U.S. dollars based upon exchange rates prevailing on the respective dates of such transactions. That portion of unrealized gains or losses on investments due to fluctuations in foreign currency exchange rates is not separately disclosed.
The Funds do not isolate the portion of gains and losses on investments in securities that is due to changes in the foreign exchange rates from that which is due to changes in the market prices of such securities. The Funds report gains and losses on foreign currency related transactions as realized and unrealized gains and losses for financial reporting purposes, whereas such gains and losses are treated as ordinary income or loss for U.S. federal income tax purposes.
Foreign Currency Forward Contracts: The Growth Fund may enter into foreign currency forward contracts as hedges against either specific transactions or portfolio positions. All commitments are “marked-to-market” daily at the applicable foreign exchange rate and any resulting unrealized gains or losses are recorded currently. The Fund realizes gains and losses at the time foreign currency forward contracts are extinguished.
Loans of Portfolio Securities: The Growth Fund and the Income Fund may lend their securities pursuant to a securities lending agreement (“Lending Agreement”) with JPMorgan Chase Bank, N.A. (“JPMorgan”). Security loans made pursuant to the Lending Agreement are required at all times to be secured by collateral valued at at least 102% of the market value of the securities loaned. Cash collateral received is invested by JPMorgan pursuant to the terms of the Lending Agreement. All such investments are made at the risk of the Funds and, as such, the Funds are liable for investment losses. To the extent a loan is secured by non-cash collateral, the borrower is required to pay a loan premium. Non-cash collateral received cannot be sold or repledged. Net income earned on the investment of cash collateral and loan premiums received on non-cash collateral are allocated between JPMorgan and the Funds in accordance with the Lending Agreement. Income allocated to the Funds is included in investment income in the respective Statements of Operations.
At December 31, 2009, the cash collateral received by the Growth Fund and the Income Fund was invested in a money market mutual fund and other short-term securities, at the time of purchase; however, such investments are subject to risk of payment delays or default on the part of the issuer or counterparty or otherwise may not generate sufficient interest to support the costs associated with securities lending activities. The investments purchased with the cash collateral are valued daily based on the investment ’s prior day’s valuation, in connection with the calculation of the Growth Fund and Income Fund’s net asset value. A Fund could also experience delays in recovering its securities and possible loss of income or value if the borrower fails to return the borrowed securities, although this risk is mitigated by the collateral and by the Lending Agreement. Information on the investment of cash collateral is shown in the Portfolios of Investments. The Growth Fund and the Income Fund receive payments from borrowers equivalent to the dividends and interest that would have been earned on the securities lent while simultaneously seeking to earn income on the investment cash collateral. One of the risks is that, from time to time, the cost of borrowing cash could exceed income generated from the securities in the reinvestment portfolio. There is also the risk that, when lending portfolio securities, the securities may not be available to a Fund on a timely basis and a Fund may, therefore, lose the opportunity to sell the securities at a desirable price. In addition, in the event that a borrower of securities would file for bankruptcy or become insolvent, disposition of the securities may be delayed pending court action. However, loans will be made only to borrowers deemed by the Adviser to be creditworthy under guidelines established by the Board of Trustees and when, in the judgment of the Adviser, the consideration which can be earned currently from such securities loans justifies the attendant risks. Loans are subject to termination by the Funds or the borrower at any time, and are, therefore, not considered to be illiquid investments.
The value of the loaned securities and related collateral at December 31, 2009, was as follows:
| Value of | Value of | |||||||
| Fund | Securities Loaned | Cash Collateral | ||||||
| Growth Fund | $11,488,799 | $11,826,397 | ||||||
| Income Fund | 3,977,444 | 4,061,535 | ||||||
25
Table of Contents
notes to financial statements
NEW COVENANT FUNDS
December 31, 2009 (Unaudited)
December 31, 2009 (Unaudited)
All collateral received as cash and securities is received, held and administered by the Funds’ custodian for the benefit of the Funds in the applicable custody account or other account established for the purpose of holding collateral.
Repurchase Agreements: The Funds may enter into repurchase agreements which are secured by obligations of the U.S. government with a bank, broker-dealer or other financial institution. Each repurchase agreement is at least 102% collateralized and marked-to-market. However, in the event of default or bankruptcy by the counterparty to the repurchase agreement, realization of the collateral may by subject to certain costs, losses or delays.
Forward Commitments, When-Issued Securities and Delayed-Delivery Transactions: The Growth Fund and the Income Fund may purchase or sell securities on a when-issued or delayed-delivery basis and make contracts to purchase or sell securities for a fixed price at a future date beyond customary settlement time. Debt securities are often issued on that basis. No income will accrue on securities purchased on a when-issued or delayed-delivery basis until the securities are delivered. Securities purchased or sold on a when-issued, delayed-delivery of forward-commitment basis involve a risk of loss if the value of the security to be purchased declines prior to settlement date. Although the Funds would generally purchase securities on a when-issued, delayed-delivery or forward-commitment basis with the intention of acquiring the securities, the Funds may dispose of such securities prior to settlement if the Adviser or applicable sub-advisor deems it appropriate to do so.
The Funds may dispose of or renegotiate a when-issued or forward commitment. The Funds will normally realize a capital gain or loss in connection with these transactions.
When the Funds purchase securities on a when-issued, delayed-delivery or forward-commitment basis, the Funds will maintain cash, U.S. government securities or other liquid portfolio securities having a value (determined daily) at least equal to the amount of the Funds’ purchase commitments. In the case of a forward commitment to sell portfolio securities, the custodian will hold the portfolio securities in a segregated account while the commitment is outstanding. These procedures are designed to ensure that the Funds will maintain sufficient assets at all times to cover their obligations under when-issued purchases, forward commitments and delayed-delivery transactions.
As of December 31, 2009, the Funds had no outstanding when-issued or delayed-delivery purchase commitments with corresponding assets segregated.
Dividends and Distributions to Shareholders: Dividends from net investment income of all Funds are declared and paid quarterly. For all Funds, all net realized long-term or short-term capital gains, if any, will be declared and distributed at least annually.
Income dividends and capital gain distributions are determined in accordance with income tax regulations, which may differ from GAAP. These differences are primarily due to differing treatments of income, gains and losses on various investment securities held by a Fund, timing differences in the recognition of income, gains and losses and differing characterizations of distributions made by the Fund.
These “book/tax” differences are either considered temporary or permanent in nature. To the extent these differences are permanent in nature, such amounts are reclassified within the composition of net assets based on their federal tax-basis treatment; temporary differences do not require reclassifications. To the extent that distributions exceed net investment income and net realized gains for tax purposes, they are reported as returns of capital.
Federal Income Taxes: It is each Fund’s intention to continue to qualify annually as a regulated investment company by complying with the appropriate provisions of the Internal Revenue Code of 1986, as amended. Accordingly, no provision for federal income tax has been made.
The Funds have reviewed the tax positions taken on federal income tax returns for each of the three open tax years and as of December 31, 2009, and has determined that no provision for income tax is required in the Funds’ financial statements. Foreign securities held by a Fund may be subject to foreign taxation on dividend and interest income received. Foreign taxes, if any, are recorded based on tax regulations and rates that exist in the foreign markets in which the Funds invest.
Allocation of Expenses: Expenses directly attributable to a Fund are charged directly to that Fund, while expenses which are attributable to more than one Fund of the Trust are allocated among the respective Funds based upon relative net assets or some other reasonable method.
Accounting for Derivatives. The Trust adopted an accounting standard involving disclosures of derivatives and hedging activities that is effective for fiscal years beginning after November 15, 2008. The standard is intended to improve financial reporting for derivative instruments by requiring enhanced disclosure that enables investors to understand how and why an entity uses derivatives, how derivatives are accounted for, and how derivative instruments affect an entity’s results of operations and financial position. The standard does not have any impact on the Funds’ financial disclosures because the Funds have not maintained any positions in derivative instruments or engaged in hedging activities.
3. Investment Advisory and Other Agreements
The Trust, on behalf of each Fund, has entered into an Investment Advisory Agreement with the Adviser. Under the Agreement, the Adviser is responsible for managing the Funds’ investments as well as furnishing the Funds with certain administrative services. The
26
Table of Contents
notes to financial statements
NEW COVENANT FUNDS
December 31, 2009 (Unaudited)
December 31, 2009 (Unaudited)
Growth Fund pays the Adviser a monthly fee at the annual rate of 0.99% of the Growth Fund’s average daily net assets and the Income Fund pays the Adviser a monthly fee at the annual rate of 0.75% of the Income Fund’s average daily net assets. The Adviser does not receive advisory fees for the Balanced Growth and Balanced Income Funds (the “Balanced Funds”). The Adviser has entered into Sub-Advisory Agreements with eight sub-advisors to assist in the selection and management of the Growth Fund’s and Income Fund’s investment securities. It is the responsibility of the Sub-Advisers, under the direction of the Adviser, to make day-to-day investment decisions for these Funds. The Adviser, not the Funds, pays each Sub-Adviser a quarterly fee for their services. The Adviser pays the Sub-Adviser’s fee directly from its own advisory fees. The sub-advisory fees are based on the assets of a Fund for which the Sub-Adviser is responsible for making investment decisions.
The following are the Sub-Advisers for the Growth Fund: Capital Guardian Trust Company, Santa Barbara Asset Management Inc., Sound Shore Management Inc., TimesSquare Capital Management and Wellington Management Company, LLP.
The following are the Sub-Advisers for the Income Fund: Ernest Partners, LLC, Sterling Capital Management, LLC and Robert W. Baird & Company, Incorporated.
The Trust employs a Chief Compliance Officer (“CCO”) who receives a portion of her compensation as approved by the Board of Trustees, as well as reimbursement of out-of-pocket expenses. The CCO is also an employee of the Adviser. For the six months ended December 31, 2009, the Growth Fund, the Income Fund, the Balanced Growth Fund, and the Balanced Income Fund were allocated a portion of the CCO’s compensation of $21,563, $9,502, $7,921 and $2,573, respectively.
The Trust is a party to Shareholder Services Agreements pursuant to which each Fund is authorized to make payments to certain entities which may include investment advisors, banks, trust companies and other types of organizations (“Authorized Service Providers”) for providing administrative services with respect to shares of the Funds attributable to or held in the name of the Authorized Service Provider for its clients or other parties with whom they have a servicing relationship. Under the terms of the Shareholder Services Agreements, each Fund is authorized to pay monthly an Authorized Service Provider (which may include affiliates of the Funds) a shareholder services fee at the rate of 0.25% on an annual basis of the average daily net assets of the shares of the Fund attributable to or held in the name of the Authorized Service Provider for providing certain administrative services to Fund shareholders with whom the Authorized Service Provider has a servicing relationship. In connection with the Shareholder Services Agreement, the Adviser has agreed to waive the amount of the investment advisory fees payable to it by any Fund to the extent of the amount paid in fees by a Fund to any affiliated Authorized Service Provider under the Shareholder Services Agreements. Effective July 1, 2009 through October 31, 2010, the Adviser agrees to waive up to 0.17% on an annual basis of the average daily net assets for the Growth Fund, the Balanced Growth Fund and the Balanced Income Fund.
The Trust has entered into servicing agreements with U.S. Bancorp Fund Services, LLC (“USBFS”), an indirect, wholly-owned subsidiary of U.S. Bancorp. Under the servicing agreements, USBFS provides transfer agency, administrative and fund accounting services to the Funds. Under the terms of the Transfer Agency Agreement, USBFS is entitled to account based fees and annual fund level fees, as well as reimbursement of out-of-pocket expenses incurred in providing transfer agency services. Under the Fund Accounting Agreement, USBFS is entitled to a fee computed at an annual rate of 0.02% of the Trust’s average daily net assets for the first $500,000,000, 0.01% for $500,000,001 to $1,000,000,000, and 0.0075% over $1,000,000,000. Under the Administration Agreement, USBFS is entitled to a fee computed at an annual rate of 0.03% of the Trust’s average daily net assets for the first $500,000,000, 0.02% for $500,000,001 to $1,000,000,000, and 0.01% over $1,000,000,000.
The Trust issues shares of the Funds pursuant to a Distribution Agreement with New Covenant Funds Distributor, Inc. (the “Distributor”), a wholly-owned subsidiary of New Covenant Trust Company, N.A., a subsidiary of the Presbyterian Church (U.S.A.) Foundation, under which the Distributor serves as the principal distributor of the Funds’ shares. The Funds do not pay the Distributor in its capacity as principal distributor.
The Trust has a Custodian Agreement with JPMorgan Chase & Co.
No officer, trustee or employee of the Trust, USBFS, or any affiliate thereof, except the CCO, receives any compensation from the Funds for serving as a Trustee or officer of the Trust. The Funds reimburse expenses incurred by the Trustees and Officers in attending Board and Committee meetings.
27
Table of Contents
notes to financial statements
NEW COVENANT FUNDS
December 31, 2009 (Unaudited)
December 31, 2009 (Unaudited)
A summary of each Balanced Fund’s investment in the Growth Fund and Income Fund for the six months ended December 31, 2009, is as follows:
| Share Activity | ||||||||||||||||||||||||||||
| Balance | Balance | Realized | Value | |||||||||||||||||||||||||
| Fund | June 30, 2009 | Purchases | Sales | December 31, 2009 | Gain (Loss) | Income | December 31, 2009 | |||||||||||||||||||||
| Balanced Growth Fund | ||||||||||||||||||||||||||||
| Growth Fund | 6,006,005 | 49,918 | 143,271 | 5,912,652 | $(685,304 | ) | $590,026 | $161,947,530 | ||||||||||||||||||||
| Income Fund | 3,939,855 | 35,884 | 101,822 | 3,873,917 | (315,778 | ) | 1,690,569 | 84,877,518 | ||||||||||||||||||||
| Balanced Income Fund | ||||||||||||||||||||||||||||
| Growth Fund | 1,269,591 | 17,292 | 31,191 | 1,255,692 | (156,162 | ) | 125,250 | 34,393,391 | ||||||||||||||||||||
| Income Fund | 2,295,605 | 34,093 | 62,849 | 2,266,849 | (243,963 | ) | 986,914 | 49,666,659 | ||||||||||||||||||||
4. Purchases and Sales of Securities
The cost of purchases and proceeds from sales of securities, excluding U.S. government and other short-term investments, for the six months ended December 31, 2009, were as follows:
| Purchases | Sales | |||||||||||||||
| (excluding | (excluding | |||||||||||||||
| Short-Term | Short-Term | |||||||||||||||
| Investments & | Investments & | Purchases of | Sales of | |||||||||||||
| Fund | U.S. Government) | U.S. Government) | U.S. Government | U.S. Government | ||||||||||||
| Growth Fund | $200,363,495 | $211,543,585 | $— | $— | ||||||||||||
| Income Fund | 83,091,758 | 134,497,070 | 94,386,548 | 50,823,571 | ||||||||||||
| Balanced Growth Fund | 3,143,484 | 5,994,729 | — | — | ||||||||||||
| Balanced Income Fund | 1,202,691 | 2,078,714 | — | — | ||||||||||||
5. Risk Factors
The performance of a Fund’s investments in non-U.S. companies and in companies operating internationally or in foreign countries will depend principally on economic conditions in their product markets, the securities markets where their securities are traded, and currency exchange rates. These risks are present because of uncertainty in future exchange rates back into U.S. dollars and possible political instability, which could affect foreign financial markets and local economies. There are also risks related to social and economic developments abroad, as well as risks resulting from the differences between the regulations to which U.S. and foreign issuers and markets are subject.
The Funds will not invest more than 15% of the value of their net assets in securities that are illiquid because of restrictions on transferability or other reasons. Repurchase agreements with deemed maturities in excess of seven days are subject to this 15% limit. The Funds may purchase securities which are not registered under the Securities Act of 1933 (the “Securities Act”) but which can be sold to “qualified institutional buyers” in accordance with Rule 144A under the Securities Act. In some cases, such securities are classified as “illiquid securities;” however, any such security will not be considered illiquid so long as it is determined by the Adviser, under guidelines approved by the Board of Trustees, that an adequate trading market exists for that security. This investment practice could have the effect of increasing the level of illiquidity in a Fund during any period that qualified institutional buyers become uninterested in purchasing these restricted securities.
The Income Fund may invest a limited amount of assets in debt securities which are rated below investment grade (hereinafter referred to as “lower-rated securities”) or which are unrated but deemed equivalent to those rated below investment grade by the portfolio managers. The lower the ratings of such debt securities, the greater their risks. These debt instruments generally offer a higher current yield than that available from higher-grade issues, and typically involve greater risks. The yields on lower-rated securities will fluctuate over time. In general, prices of all bonds rise when interest rates fall and fall when interest rates rise. Lower-rated securities are subject to adverse changes in general economic conditions and to changes in the financial condition of their issuers. During periods of economic downturn or rising interest rates, issuers of these instruments may experience financial stress that could adversely affect their ability to make payments of principal and interest, and increase the possibility of default.
The Balanced Funds invest their assets primarily in the Growth Fund and the Income Fund. By investing primarily in shares of these Funds, shareholders of the Balanced Funds indirectly pay a portion of the operating expenses, management expenses and brokerage costs of the underlying Funds as well as their own operating expenses. Thus, shareholders of the Balanced Funds may indirectly pay slightly higher total operating expenses and other costs than they would pay by directly owning shares of the Growth Fund and Income Fund. Total fees and expenses to be borne by investors in either Balanced Fund will depend on the portion of the Funds’
28
Table of Contents
notes to financial statements
NEW COVENANT FUNDS
December 31, 2009 (Unaudited)
December 31, 2009 (Unaudited)
assets invested in the Growth Fund and in the Income Fund. A change in the asset allocation of either Balanced Fund could increase or reduce the fees and expenses actually borne by investors in that Fund. The Balanced Funds are also subject to rebalancing risk. Rebalancing activities, while undertaken to maintain a Fund’s investment risk-to-reward ratio, may cause the Fund to under-perform other funds with similar investment objectives. For the Balanced Growth Fund, it is possible after rebalancing from equities into a greater percentage of fixed-income securities, that equities will outperform fixed-income investments. For the Balanced Income Fund, it is possible that after rebalancing from fixed-income securities into a greater percentage of equity securities, that fixed-income securities will outperform equity investments. The performance of the Balanced Growth Fund and the Balanced Income Fund depends on the performance of the underlying Funds in which they invest.
| 6. | Federal Income Taxes |
As of June 30, 2009, the Funds had available for federal tax purposes unused capital loss carryforwards expiring as follows:
| 2012 | 2013 | 2014 | 2015 | 2016 | 2017 | Total | ||||||||||||||||||||||
| Growth Fund | $— | $— | $— | $— | $— | $61,581,089 | $61,581,089 | |||||||||||||||||||||
| Income Fund | — | — | 1,591,357 | 5,673,243 | 517,116 | 6,784,158 | 14,565,874 | |||||||||||||||||||||
| Balanced Growth Fund | — | — | — | — | — | 764,364 | 764,364 | |||||||||||||||||||||
| Balanced Income Fund | 1,227,811 | 792,155 | — | — | — | 335,058 | 2,355,024 | |||||||||||||||||||||
Under tax law, certain capital and foreign currency losses realized after October 31, and within the taxable year may be deferred and treated as occurring on the first business day of the following fiscal year. For the year ended June 30, 2009, the Funds deferred to July 1, 2010, post-October capital losses of:
| Post-October Losses | ||||
| Growth Fund | $125,248,772 | |||
| Income Fund | 18,719,766 | |||
| Balanced Growth Fund | 8,440,942 | |||
| Balanced Income Fund | 1,644,919 | |||
As of June 30, 2009, the components of accumulated earnings/(deficit) on a tax basis were as follows:
| Total | ||||||||||||||||||||||||||||
| Undistributed | Undistributed | Accumulated | Unrealized | Accumulated | ||||||||||||||||||||||||
| Ordinary | Long-Term | Accumulated | Dividends | Capital and | Appreciation/ | Earnings/ | ||||||||||||||||||||||
| Income | Capital Gains | Earnings | Payable | Other Losses | (Depreciation)* | (Deficit) | ||||||||||||||||||||||
| Growth Fund | $— | $— | $— | $— | $(186,828,060 | ) | $(19,737,291 | ) | $(206,565,351 | ) | ||||||||||||||||||
| Income Fund | 292,365 | — | 292,365 | — | (33,285,640 | ) | (55,362,848 | ) | (88,356,123 | ) | ||||||||||||||||||
| Balanced Growth Fund | — | — | — | — | (9,205,306 | ) | (51,763,382 | ) | (60,968,688 | ) | ||||||||||||||||||
| Balanced Income Fund | — | — | — | — | (3,999,943 | ) | (10,249,509 | ) | (14,249,452 | ) | ||||||||||||||||||
| * | The difference between the book-basis and tax basis unrealized appreciation (depreciation) is attributable primarily to: tax deferral of losses on wash sales, passive foreign investment companies (“PFICs”) and the difference between book and tax amortization methods for premium and market discount, and the return of capital adjustments from real estate investment trusts. |
At June 30, 2009, the cost, gross unrealized appreciation and gross unrealized depreciation on securities, for federal income tax purposes, were as follows:
| Net Unrealized | ||||||||||||||||
| Tax Unrealized | Tax Unrealized | Appreciation | ||||||||||||||
| Tax Cost | Appreciation | (Depreciation) | (Depreciation) | |||||||||||||
| Growth Fund | $677,848,076 | $67,317,527 | $(87,054,818 | ) | $(19,737,291 | ) | ||||||||||
| Income Fund | 442,838,172 | 7,091,999 | (62,454,847 | ) | (55,362,848 | ) | ||||||||||
| Balanced Growth Fund | 274,306,759 | 2,508,310 | (54,271,692 | ) | (51,763,382 | ) | ||||||||||
| Balanced Income Fund | 89,554,146 | 1,152,506 | (11,402,015 | ) | (10,249,509 | ) | ||||||||||
29
Table of Contents
notes to financial statements
NEW COVENANT FUNDS
December 31, 2009 (Unaudited)
December 31, 2009 (Unaudited)
8. Subsequent Events
As of February 26, 2010, the date the financial statements were available to be issued, no subsequent events or transactions had occurred that would have materially impacted the financial statements.
In January 2010, the Financial Accounting Standards Board issued Accounting Standards Update (ASU) No. 2010-6, Fair Value Measurements and Disclosures (Topic 820): Improving Disclosures about Fair Value Measurements. ASU No. 2010-6 enhances and clarifies existing fair value measurement disclosure requirements and is effective for interim and annual periods beginning after December 15, 2009. The Funds are currently evaluating the impact, if any, of applying the provisions of ASU No. 2010-6.
30
Table of Contents
supplemental data
NEW COVENANT FUNDS
December 31, 2009 (Unaudited)
December 31, 2009 (Unaudited)
Proxy Voting Policy and Proxy Voting Records
A description of the policies and procedures that the Trust uses to determine how to vote proxies related to portfolio securities is available (i) without charge, upon request, by calling 800-858-6127 and (ii) on the Securities and Exchange Commission’s website at http://www.sec.gov. Information regarding how each Fund voted proxies related to securities held during the most recent 12 month period ended June 30 is (i) available without charge, upon request, by calling 800-858-6127; (ii) on the Funds’ website at http://www.newcovenantfunds.com and (iii) on the Securities and Exchange Commission’s website at http://www.sec.gov.
Quarterly Holdings
Portfolio holdings statements for the Funds for the quarters ended March 31 and September 30 are available, without charge, on the Securities and Exchange Commission’s website at http://www.sec.gov.
Additional Fund Information — Hypothetical Cost of Investing
As a shareholder of the New Covenant Funds, you incur ongoing costs, including management fees and other Fund expenses. This example is intended to help you understand your ongoing costs (in dollars) of investing in the New Covenant Funds and to compare these costs with the ongoing costs of investing in other mutual funds.
The example is based on an investment of $1,000 invested at the beginning of the period and held for the entire period from July 1, 2009 through December 31, 2009.
Actual Expenses
The table below provides information about actual account values and actual expenses. You may use the information below, together with the amount you invested, to estimate the expenses that you paid over the period. Simply divide your account value by $1,000 (for example, an $8,600 account value divided by $1,000 = 8.6), then multiply the result by the number in the table under the heading entitled “Expenses Paid During Period” to estimate the expenses you paid on your account during this period.
| Beginning | Ending | Expenses Paid | Expense Ratio | |||||||||||||
| Account Value | Account Value | During Period* | During Period** | |||||||||||||
| 7/1/09 | 12/31/09 | 7/1/09 - 12/31/09 | 7/1/09 - 12/31/09 | |||||||||||||
| Growth Fund | $1,000.00 | $1,211.60 | $6.58 | 1.18% | ||||||||||||
| Income Fund | 1,000.00 | 1,067.70 | 4.48 | 0.86% | ||||||||||||
| Balanced Growth Fund | 1,000.00 | 1,154.30 | 1.19 | 0.22% | ||||||||||||
| Balanced Income Fund | 1,000.00 | 1,117.30 | 1.23 | 0.23% | ||||||||||||
Hypothetical Example for Comparison Purposes
The table below provides information about hypothetical account values and hypothetical expenses based on each of the New Covenant Funds’ actual expense ratios and an assumed rate of return of 5% per year before expenses, which is not the Fund’s actual return. The hypothetical account values and expenses may not be used to estimate the actual ending account balance or expenses you paid for the period. You may use this information to compare this 5% hypothetical example with the 5% hypothetical examples that appear in the shareholder reports of other funds.
| Beginning | Ending | Expenses Paid | Expense Ratio | |||||||||||||
| Account Value | Account Value | During Period* | During Period** | |||||||||||||
| 7/1/09 | 12/31/09 | 7/1/09 - 12/31/09 | 7/1/09 - 12/31/09 | |||||||||||||
| Growth Fund | $1,000.00 | $1,019.26 | $6.01 | 1.18% | ||||||||||||
| Income Fund | 1,000.00 | 1,020.87 | 4.38 | 0.86% | ||||||||||||
| Balanced Growth Fund | 1,000.00 | 1,024.10 | 1.12 | 0.22% | ||||||||||||
| Balanced Income Fund | 1,000.00 | 1,024.05 | 1.17 | 0.33% | ||||||||||||
| * | Expenses are equal to the average account value times the Fund’s annualized expense ratio (reflecting fee waivers in effect) multiplied by 184/365 (to reflect the one-half year period) | |
| ** | Annualized. |
31
Table of Contents

This report is authorized for distribution only if preceded by a current prospectus.
Shares of New Covenant Funds are distributed by New Covenant Funds Distributors, Inc.,
200 East Twelfth Street, Jeffersonville, IN 47130.
Shares of New Covenant Funds are distributed by New Covenant Funds Distributors, Inc.,
200 East Twelfth Street, Jeffersonville, IN 47130.
NCF 14-09-17
Table of Contents
Item 2. Code of Ethics.
The registrant has adopted a code of ethics that applies to the registrant’s principal executive officer and principal financial officer. The registrant has not made any amendments to its code of ethics during the period covered by this report. The registrant has not granted any waivers from any provisions of the code of ethics during the period covered by this report.
Item 3. Audit Committee Financial Expert.
Not applicable for semi-annual reports
Item 4. Principal Accountant Fees and Services.
Not applicable for semi-annual reports
Item 5. Audit Committee of Listed Registrants.
Not applicable to registrants who are not listed issuers (as defined in Rule 10A-3 under the Securities Exchange Act of 1934).
Item 6. Investments.
Not Applicable
Item 7. Disclosure of Proxy Voting Policies and Procedures for Closed-End Management Investment Companies.
Not applicable to open-end investment companies.
Item 8. Portfolio Managers of Closed-End Management Investment Companies.
Not applicable to open-end investment companies.
Item 9. Purchases of Equity Securities by Closed-End Management Investment Company and Affiliated Purchasers.
Not applicable to open-end investment companies.
1
Table of Contents
Item 10. Submission of Matters to a Vote of Security Holders.
Not Applicable.
Item 11. Controls and Procedures.
| (a) | The Registrant’s [President/Chief Executive Officer] and [Treasurer/Chief Financial Officer] have reviewed the Registrant’s disclosure controls and procedures (as defined in Rule 30a-3(c) under the Investment Company Act of 1940 (the “Act”)) as of a date within 90 days of the filing of this report, as required by Rule 30a-3(b) under the Act and Rules 13a-15(b) or 15d-15(b) under the Securities Exchange Act of 1934. Based on their review, such officers have concluded that the disclosure controls and procedures are effective in ensuring that information required to be disclosed in this report is appropriately recorded, processed, summarized and reported and made known to them by others within the Registrant and by the Registrant’s service provider. | |
| (b) | There were no changes in the Registrant’s internal control over financial reporting (as defined in Rule 30a-3(d) under the Act) that occurred during the second fiscal quarter of the period covered by this report that has materially affected, or is reasonably likely to materially affect, the Registrant’s internal control over financial reporting. |
Item 12. Exhibits.
| (a) | (1) Any code of ethics or amendment thereto, that is the subject of the disclosure required by Item 2, to the extent that the registrant intends to satisfy Item 2 requirements through filing an exhibit. Not applicable. |
(2) A separate certification for each principal executive and principal financial officer pursuant to Section 302 of the Sarbanes-Oxley Act of 2002. Filed herewith.
(3) Any written solicitation to purchase securities under Rule 23c-1 under the Act sent or given during the period covered by the report by or on behalf of the registrant to 10 or more persons. Not applicable to open-end investment companies.
| (b) | Certifications pursuant to Section 906 of the Sarbanes-Oxley Act of 2002. Furnished herewith. |
2
Table of Contents
SIGNATURES
Pursuant to the requirements of the Securities Exchange Act of 1934 and the Investment Company Act of 1940, the registrant has duly caused this report to be signed on its behalf by the undersigned, thereunto duly authorized.
| New Covenant Funds | ||||
| By | /s/ Michael Ricks | |||
| Date | 3/1/2010 | |||
Pursuant to the requirements of the Securities Exchange Act of 1934 and the Investment Company Act of 1940, this report has been signed below by the following persons on behalf of the registrant and in the capacities and on the dates indicated.
| By | /s/ Robert E. Leech | |||
| Date | 2/25/2010 | |||
| By | /s/ Michael Ricks | |||
| Date | 3/1/2010 | |||
3