FORM 6-K
SECURITIES AND EXCHANGE COMMISSION
Washington, D.C. 20549
Report of Foreign Private Issuer
Pursuant to Rule 13s – 16 or 15d – 16 of
the Securities Exchange Act of 1934
For the month of May 2007
Acambis plc
(Translation of registrant’s name into English)
Peterhouse Technology Park
100 Fulbourn Road
Cambridge CB1 9PT
England
(address of principal executive offices)
(Indicate by check mark whether the registrant files or will file annual reports under cover of
Form 20-F or Form 40-F).
Forms 20-F ![]() Form 40-F
Form 40-F ![]()
(Indicate by check mark whether the registrant by furnishing the information contained in this Form is
also thereby furnishing the information to the Commission pursuant to Rule 12g3-2(b) under the
Securities Exchange Act of 1934).
Yes ![]() No
No 
(If “Yes” is marked, indicate below the file number assigned to the registrant in connection with
Rule 12g3-2(b): 82- ).
Enclosure:
Annual Report 2006
Financials
General information
About Acambis
Acambis is a biopharmaceutical company operating in the infectious disease arena, with a focus on developing new vaccines. We are headquartered in Cambridge, UK. The majority of our operations are based in the US, with R&D in Cambridge, MA and manufacturing facilities in Canton, MA and Rockville, MD. We are a UK public limited company with shares listed on the LSE since 1995. At the end of 2006 we employed 263 people.
About this Annual Report
This is the Annual Report for the year ended 31 December 2006. It contains the Annual Report and Financial Statements in accordance with UK regulations. References to the Group and Acambis throughout this document relate to Acambis plc and all of its subsidiary and associated undertakings. References to the Company are to Acambis plc, the ultimate holding company. For further information on Acambis, please visit our website at www.acambis.com.
Cautionary statement regarding forward-looking statements
Under the safe harbour provisions of the US Private Securities Litigation Reform Act of 1995, the Company cautions investors that any forward-looking statements or projections made in this document are subject to risks and uncertainties that may cause actual results to differ materially from those projected. These forward-looking statements are based on estimates and assumptions made by the management of Acambis and are believed to be reasonable, though are inherently uncertain and difficult to predict. Actual results or experience could differ materially from the forward-looking statements. Factors that may affect the Group’s operations are discussed in the business review and the corporate governance statement contained within this Annual Report and in documents as filed with the US SEC from time to time.
Definitions for abbreviations used throughout this document are provided on page 85.
Facing the future
Events in 2006 meant that we started 2007 in a different place from where we intended to be. In particular, we were not awarded a contract under the US Government MVA attenuated smallpox vaccine tender process.
The decision was a setback but we have already laid the groundwork for progress going forwards. We have outlined our strategy for reducing reliance on our biodefence activities and building a product portfolio that can deliver sustainable returns for shareholders. We have reviewed our operating model and cost base, and are implementing changes to ensure effective use of the resources to deliver our strategy. We have also strengthened our financial position through a series of transactions.
With our attractive product pipeline, near-term revenue-generating opportunities, established capabilities in critical areas and valuable manufacturing assets, Acambis has the potential to become one of the UK’s leading biotechnology companies.
01
|
| ‘The disappointing MVA decision overshadowed the good progress we | ||
|
|
|
|
|
In 2006, we initiated the transformation of Acambis into a high-value biotechnology company that is supported by, rather than reliant on, its biodefence revenues. Although Acambis faced significant challenges during 2006, we also made good progress with our R&D pipeline and continued this success into 2007. The greatest challenge was the decision of the US Department of Health and Human Services not to award Acambis a contract under the MVA attenuated smallpox vaccine tender process. This decision was disappointing, particularly in view of our record of successfully delivering substantial quantities of our ACAM2000 vaccine to the US Government. This outcome overshadowed positive clinical data from several of our key R&D pipeline programmes. This success has continued into 2007 with the publication of exceptional data for our single-dose JE vaccine in a large Phase 3 pivotal study. In addition, the financial position of the Group has been strengthened through a settlement with Novartis relating to ARILVAX, the sale of the US marketing operations and a further ACAM2000 order from the CDC, which in total generated cash proceeds of $65.9m (c. £35.0m). In 2007, we also established a commercialisation partnership with sanofi pasteur relating to ChimeriVax-JE, for which we will receive milestones worth € 7.5m (c. £5.0m) in the first half of 2007 and which will generate royalties on sales, payments for supply of bulk-manufactured product and a further €22.5m (c. £15.0m) in milestone payments following marketing authorisations. Strategy When we announced our third quarter results in November 2006, the Board re-emphasised the Group’s strategy, which is to expand our R&D portfolio further, supported by cash derived from the biodefence contracts, in |
| order to reduce Acambis’ future reliance on biodefence. The negative MVA vaccine decision, communicated a matter of weeks later, underlined the importance of pursuing this strategy. Management changes In view of the increasing emphasis upon expanding our non-biodefence pipeline, the Board reviewed the management, together with the Group’s cost base and its operational capabilities. This aimed to ensure that our resources, including the management, operational and financial assets, are appropriate to address Acambis’ changing strategic goals. Following this review, the Board decided to seek new leadership for the Group. This resulted in the appointment of Ian Garland as CEO, with effect from 1 June 2007, whom I am very pleased to welcome to Acambis. He replaces Gordon Cameron, who has served with the Group for ten years and as CEO since 2004, and who continues in his role until Ian Garland’s arrival to ensure a smooth transition. In addition, David Lawrence, who joined Acambis as CFO in August 2004, left at the beginning of March 2007 and was replaced by Elizabeth Brown as Acting CFO. I wish to take this opportunity to highlight that Gordon Cameron has overseen substantial advances in Acambis’ business and operations during the past three years, including the successful implementation of the major US biodefence contracts, underpinning the development of the Group. The Board thanks Gordon for his important contribution over the last few years and wishes him every success in his future career. The arrival of Dr Michael Watson, who recently joined us from Sanofi Pasteur MSD as Executive Vice President, R&D, also augments the management team and is greatly assisting the integration of our Research, Development, Clinical and Medical Affairs activities. |
| Organisational changes In parallel with the management changes, Acambis implemented a wide-ranging restructuring, which aims to focus our operational and financial resources upon the key R&D programmes and core capabilities. It also seeks to lower significantly the Group’s cost base, which is expected to be reduced by approximately £7.0m per annum, with initial full-year savings in 2008. Board changes During 2006, we increased the extent of industry experience on the Board by appointing John Lambert and Dr William Jenkins as Non-executive Directors, both of whom have exceptional knowledge in their areas of expertise. I believe that these appointments will further enhance Acambis’ ability to achieve successfully the necessary reorientation of its business as it goes forward. Finally, I would like to record the Board’s thanks to all our staff for their continued commitment and to our investors for their support during this particularly challenging period.
|
Chairman’s review | ||||
Overcoming the challenges of 2006 to build | ||||

02

Introducing Ian Garland
What was your most recent role?
Since 2004, I have been CFO at Arrow Therapeutics Ltd, which was a privately owned biotechnology company until it was acquired by AstraZeneca plc for $150m in February 2007. We were engaged in the discovery and development of novel anti-viral products and our successes included a major R&D collaboration with Novartis.
What’s your background?
I’m a Chartered Accountant by training, having qualified at KPMG where I specialised in the pharmaceutical sector. Since then, my industry experience has been mainly with biotechnology companies, both here in the UK and in the US.
How is your experience applicable?
Some of my most relevant experience was gained when I was President and COO of Celltech Pharmaceuticals, Inc., the US operations of Celltech Group plc, which, given that the majority of Acambis’ operations are based in the US, will be highly relevant. We had a turnover of around $300m and approximately 1,000 employees. I was responsible for all US activities, including marketing, manufacturing and supply chain management, and US-based development and support functions. I worked closely with Peter Fellner during this time and successfully achieved significant US sales and earnings growth, the approval of two US New Drug Applications and the divestment of several non-core businesses.
03
Our strategy for growth
In 2006, we undertook a strategic review to assess a
range of options for Acambis’ growth and development.
In our view, the non-biodefence R&D pipeline is the
primary growth area for the Group and, by leveraging
our proven vaccine development expertise and
biodefence revenues, we aim to develop a high-value
portfolio that can deliver sustained growth in
shareholder returns.
Building value through the pipeline
To build our pipeline into an increasingly valuable portfolio, we aim to drive our key projects – C. difficile, influenza, ChimeriVax-JE and ChimeriVax-West Nile – through to licensure as quickly and effectively as possible. To achieve this, we are focusing our own operations on the critical value-generating activities, will seek appropriate partners and will build the portfolio through in-licensing and acquisition.
To utilise our resources most effectively, our R&D operations are now focusing primarily on activities through to Phase 2 clinical studies, although we may still complete Phase 3 clinical studies in some cases.
We also intend to continue to invest in developing scalable manufacturing processes for our product candidates in order to increase the value we can generate in a project before it is partnered or out-licensed. In this, we have an established expertise in manufacturing live, viral vaccines and a flexible manufacturing asset that has the potential to be exploited further.
To supplement our in-house expertise, we will seek partners for development and/or
commercialisation of our products. We have already established critical commercialisation partnerships for ChimeriVax-JE with sanofi pasteur and Bharat Biotech, and will be exploring partnering opportunities for ChimeriVax-West Nile as we progress through Phase 2 clinical trials.
We are keen to expand the portfolio by adding projects that address significant market opportunities. Acquisitions – of products and/or companies – form a major part of that growth strategy, alongside the output from our own innovative research programmes.
Using our biodefence assets effectively
In recent years, much management and investor attention has been focused on our biodefence-related activities. To date, the biodefence side of our business has brought significant benefits in terms of both cash and capabilities but the uncertainty associated with bidding for such contracts has been detrimental.
The single remaining priority in the biodefence arena is to finalise an ACAM2000 warm-base manufacturing contract that can deliver sustainable revenues for several years.
In addition to the revenues, the particular advantage to us of warm-base manufacturing is the utilisation that we achieve for our manufacturing assets, which are potentially valuable for the rest of our portfolio.
Restructuring our operations and cost base
In March 2007, we announced that we are restructuring to increase the focus of resources upon key programmes and core operational capabilities, and significantly lower Acambis’ cost base.
We intend to reduce our cost base by around 20%, with the majority of the cost-saving initiatives being implemented in 2007. The headcount will be reduced from 263 by approximately 15% during this year across the organisation.
The cash costs of the restructuring, all of which will be incurred in 2007, are expected to be around £3.0m, which will be offset by the savings achieved during this year. Following the full implementation, it is expected that the cost base will decrease by approximately £7.0m per annum, with the first full year of savings being 2008.
04

Introducing Michael Watson
Early in 2007, we announced the appointment of Dr Michael Watson, 42, as our Executive Vice President, R&D and an Executive Director. This was an external appointment into a role that is broader than the previous Board position of CSO as it encompasses our Development, Clinical and Medical Affairs activities as well as Research. Mike is responsible for overseeing the vaccine product portfolio, including enhancing the portfolio through in-house R&D and/or licensing of product candidates, and is based in our US offices in Cambridge, MA, where the R&D functions are located.
What’s your background?
I’m a medic by training and initially worked in internal medicine, infectious disease and tropical medicine at various UK hospitals. In 1993, I moved into the pharmaceutical industry to work on clinical and pre-clinical development for Bristol-Myers Squibb and Takeda Europe Pharmaceuticals. For the last 10 years, I’d been working for Sanofi Pasteur MSD, the European vaccines joint venture between sanofi pasteur and Merck.
What was your most recent role?
My main role was leading development, strategy planning and implementation of Phase 3, Phase 4 and epidemiology studies for more than 15 vaccines developed by sanofi pasteur and Merck. I was also the European Project Leader for Gardasil®, the human papillomavirus vaccine developed by Merck.
How is your experience applicable?
I’ve spent the last 10 years working exclusively with vaccines, which has given me a good understanding of what it takes to get a vaccine through to licensure and a strategic understanding of how to manage a product portfolio. I have detailed knowledge of clinical development and medical affairs, and have had useful experience with pre-clinical projects as well.
Why Acambis?
I’ve always been interested in vaccines and am particularly attracted to the field as I have a strong personal interest in infectious diseases. I’m delighted to have joined Acambis at a pivotal stage in its growth and development. I believe it has some great opportunities in its pipeline and I look forward to applying my existing expertise to drive forward and develop its portfolio.
05
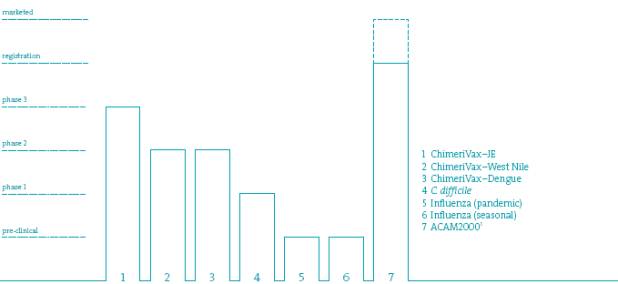
ChimeriVax-JE
Best product, best partners
‘Immunization is the only reliable tool to control JE. An improved
JE vaccine would be safe, efficacious, affordable, administered
in a single dose, and easily added to immunization programs.’
PATH, Japanese Encephalitis Project
06
| – | Targeting development of the ideal JE vaccine |
| – | High-yield, cost-effective manufacturing suits needs |
| – | Partnerships established with leading vaccine |
About JE
First documented in Japan in 1871, JE now affects wide swathes of Asia and has spread as far as Australia. This mosquito-borne viral disease is the leading viral cause of encephalitis (inflammation of the brain) in Asia, where an estimated three billion people live in JE-endemic regions. According to the WHO, approximately 30,000 to 50,000 people suffer from JE annually, mainly in Asia1, resulting in a high level of mortality (c. 30% of cases) and debilitating sequelae among a high proportion of survivors. Although JE vaccines have been available for decades, various drawbacks limit their use, including multiple-dose administration, safety concerns and non-GMP-compliant production.
The commercial opportunity
There is significant potential for second-generation JE vaccines to overtake and expand the existing JE vaccine market, which we estimate is currently worth $100-150m per annum. As the endemic region represents the largest commercial opportunity, this has been the primary focus for our activities, with activities targeted at achieving licensure in that region first. Licensure in Europe and the US will be pursued thereafter.
About ChimeriVax2-JE
We have completed Phase 3 pivotal trials (safety and efficacy) in the US and Australia. Positive data from the safety trial were published in October 2006 and in March 2007 we reported outstanding results from
the efficacy trial. Clinical results show that ChimeriVax-JE requires only one dose for adequate protection against JE versus two or more required with other JE vaccines.
ChimeriVax-JE has the potential to transform the use of JE vaccines. It produces a rapid onset of immunity after a single dose, has an excellent safety profile and provides at least three years’ duration of immunity without the need for a booster. In addition, the high-yield, GMP-compliant bulk production process we have developed at our Canton, MA facility supports cost-effective manufacture on a scale sufficient to meet the needs of all markets.
Commercialisation of ChimeriVax-JE
In preparation for licensure of ChimeriVax-JE, we have established agreements with two leading companies ideally suited to successful commercialisation of the vaccine.
Sanofi pasteur is a world leader in vaccines and, in our view, the best worldwide partner for ChimeriVax-JE. Under the agreement, established in February 2007, Acambis granted sanofi pasteur marketing, distribution and certain manufacturing rights to ChimeriVax-JE worldwide, excluding India and the Indian subcontinent and the US. Sanofi pasteur plans to introduce the new vaccine in Europe and throughout the Asia Pacific region, with particular focus on the large endemic countries, including Thailand and China. We will receive royalties on sales and payment for the supply of bulk-manufactured ChimeriVax-JE product. In addition, we are
entitled to payments of up to 30m (c. £20m), with the milestones tied to near-term deliverables ( 7.5m in 2007) and marketing authorisation of ChimeriVax-JE in key endemic countries and in the European Union. Sanofi pasteur also holds an option to the US market, which if exercised would generate further revenues in the form of upfront, milestone and royalty payments. We will supply sanofi pasteur with bulk ChimeriVax-JE vaccine from our facility in Canton, MA.
In addition, Acambis has a marketing and distribution agreement for India and the Indian subcontinent with Bharat Biotech, one of India’s leading biotechnology companies. Bharat Biotech will be responsible for end-stage fill/finish processing of ChimeriVax-JE at its facilities in India and, once ChimeriVax-JE is approved, will market and distribute the vaccine in India and neighbouring countries. Bulk vaccine will continue to be manufactured for Bharat Biotech at our Canton, MA facility.
These partners are, we believe, perfectly suited to ensure this ideal vaccine is commercialised successfully and reaches those who need it most.
Notes
1 WHO, Water Related Disease, Japanese encephalitis.
2 ChimeriVax™ is a proprietary vaccine technology developed by Acambis with St Louis University.
07
Our R&D pipeline
ChimeriVax-West Nile
The most advanced West Nile virus vaccine in development
‘Although the prevalence of West Nile virus disease fluctuates seasonally
and regionally, it continues to pose a serious public health threat,
especially to older adults and people with weakened immune systems.’
Dr Anthony Fauci, NIAID
08
| – | A new endemic disease in the US, the world’s largest |
– | Utilises Acambis’ proprietary ChimeriVax technology | |
– | Encouraging data from Phase 1 and Phase 2 trials |
About West Nile
In 1999, the previously little known West Nile virus reached the US and started its rapid sweep through all 48 mainland states and into Canada and Mexico. Since then, almost 24,000 cases of West Nile virus-related disease have been recorded in the US, resulting in 950 deaths. In 2003, the virus had a greater impact than in any of the previous years. It spread through a total of 45 US states, causing more than 9,800 cases of West Nile disease and 264 deaths, according to the CDC.1 The West Nile virus continued to be a serious problem for the US in 2004 with 2,539 cases and 100 deaths and in 2005 with 3,000 cases reported and 119 deaths. In 2006, the burden was higher compared with the previous year: a 42% increase in the number of cases to 4,261 and a 46% rise in deaths to 174.2
About ChimeriVax3-West Nile
Work by companies to develop a vaccine started almost as soon as the news of this new threat to the US broke in August 1999. In this race, Acambis was ideally placed as our proprietary ChimeriVax technology naturally targets flaviviruses such as West Nile.
As a result, ChimeriVax-West Nile is, today, the most advanced West Nile virus vaccine candidate in development, having undergone a Phase 1 trial and entered Phase 2 clinical testing. The first part of the Phase 2 trial, completed in 2006, recorded seroconversion in over 97% of subjects. The second part of the Phase 2 trial, currently
ongoing, is taking ChimeriVax-West Nile into the target population for the first time by testing the safety, tolerability and immunogenicity of our vaccine in healthy elderly subjects.
The clinical testing path to licensure has yet to be defined and will require discussion with the FDA. Typically, Phase 3 testing of a new vaccine that has no established threshold for demonstrating efficacy would require a field trial to demonstrate that the vaccine effectively reduces the disease burden in the specific area. In this instance, the sporadic nature of the West Nile outbreaks could make it challenging to define appropriate locations for efficacy trial sites.
However, in 2002, the FDA established an alternative approach, known as the ‘animal efficacy rule’, under which efficacy could be demonstrated through animal models and the large-scale Phase 3 trials would focus on the safety profile of the vaccine. In our view, although this approach has yet to be tested, the situation with West Nile lends itself to the use of the animal efficacy rule.
The market potential
Of those infected with West Nile virus, approximately 80% show no symptoms and 20% experience mild flu-like symptoms. However, about 1% of those infected develop severe illness, which manifests as encephalitis or aseptic meningitis (inflammation of the membranes that cover the brain and spinal cord due to
infection by a virus) and, among these, case fatality rates range from 3% to 15%. The CDC has identified those most at risk from severe disease as people aged 50 and above.
The virus’ unpredictable occurrence, with random outbreaks in Europe, Africa and the Middle East, and only an eight-year record in the US make an assessment of the market potential particularly challenging. However, the US is the largest single vaccine market in the world and with over 85 million people there within the at-risk age group, this could be a significant market opportunity.
Successful commercialisation of the vaccine is likely to be influenced by achieving a recommendation by the American Committee on Immunization Practise, which defines vaccination policy in the US.
As we do not have the in-house expertise necessary for successful commercialisation of ChimeriVax-West Nile and in order to focus our resources on certain other vaccine candidates in our pipeline, we have decided that we will explore the potential to partner this project once we have established proof-of-principle in the target population.
Notes
1 CDC: Cases of West Nile Human Disease.
2 Ibid.
3 ChimeriVax™ is a proprietary vaccine technology developed by Acambis with St Louis University.
09
Our R&D pipeline
Clostridium difficile
The only vaccine approach in development
‘Clostridium difficile-associated disease (CDAD) is increasing in incidence
and severity and may be becoming more difficult to treat... Recurrence
is one of the most frustrating and challenging complications of CDAD.’
CDC review paper
10
– | Fighting the leading cause of hospital-acquired infections | |
– | Targeting prevention of relapses and primary infection | |
– | Annual healthcare cost in US exceeds $1bn |
About C. difficile
C. difficile is the leading cause of hospital-acquired infections, with 14 times as many C. difficile-related cases as there are cases of MRSA-related disease in the UK.1 In fact, the occurrence may be under-reported as reporting recommendations from the National Clostridium difficile Standards Group are not being followed consistently. Moreover, only cases in those aged 65 and over are traced through mandatory reporting. Recently, there have been reports from developed countries of CDAD incidences in age groups previously considered at low risk.
Estimates suggest that this spore-forming bacterium is responsible for at least 350,000 cases of CDAD in the US every year (based on an assumed infection of 1% of the hospital population each year) and that associated annual costs to the healthcare system exceed $1bn.2
C. difficile bacteria naturally inhabit the gastro-intestinal tract and can be found in low numbers in a small proportion (less than 5%) of the healthy adult population and generally only become a problem when the natural balance of the gut is disturbed, usually as a result of antibiotic treatment. Indeed, treatment with antibiotics is listed as one of the key risk factors for CDAD, alongside age, duration of hospital stay and prior CDAD.
Up to 25% of cases of infections can be successfully treated with a course of different antibiotics after stopping the inciting antibiotic. Nevertheless, an estimated 20% of treated patients experience at least one relapse of CDAD. In such cases, further treatments using antibiotics of last resort or even surgery, in some severe cases, are used.
Concerns have been raised following identification of a more virulent strain of C. difficile, which has been implicated in numerous outbreaks in North America and Europe. It is known to produce significantly more of the toxins that cause disease than other strains of the C. difficile bacterium.
The commercial opportunity
With the emergence of the more virulent strain, coupled with aging populations and the growing financial burden on healthcare systems, there is a clear need for a preventive approach to CDAD.
The disease problem lends itself to a two-pronged approach for development of a vaccine such as Acambis’. The first target is a vaccine to prevent reinfection in patients who have relapsed and for whom current preventive measures and treatments can be inadequate. The second target is a vaccine for primary prevention, targeted at high-risk individuals, including patients in nursing homes and long-term care facilities and
those who will be receiving courses of antibiotic treatments in hospitals. A prophylactic vaccine may eventually overcome treatment failures, antibiotic resistance, virulent strains and epidemic outbreaks, particularly if it can be extended beyond the high-risk target population.
About Acambis’ C. difficile programme
Currently, Acambis’ product is the only vaccine against C. difficile to have entered the clinical stage of development. In 2006, we completed initial clinical trials that showed positive results in both healthy adults and healthy elderly subjects aged 65 years and above.
Notes
1 HPA: Quarterly Reporting Results for Clostridium difficile Infections and MRSA Bacteraemia, January 2007.
2 Kyne et al., Clinical Infectious Diseases
2002; 34:346-353.
11
Our R&D pipeline
Influenza vaccine
Targeting the ‘holy grail’ of influenza vaccines
‘At the present time, if an influenza pandemic were to occur,
the potential vaccine supply would fall several billion doses short of the
amount needed to provide protection to the global population.’
WHO
12
– Universal vaccination against pandemic and seasonal influenza
– Highly novel approach in highly competitive market
– Targeting the world’s single largest vaccine opportunity
About influenza
Today, influenza represents the single largest vaccine market in the world. It is also still a major global threat, resulting in an estimated one billion cases and 300,000 to 500,000 deaths every year, yet no lasting immunity against the virus is acquired, after either natural infection or immunisation, because of the virus’ ability to mutate.
This ability also creates the potential for pandemics, which are caused by mutation of the influenza virus into a particularly virulent strain. Three pandemics occurred in the 20th century, all caused by ‘A’ strains of the influenza virus. Experts believe the next pandemic could cause disease in two billion people. Based on best-case scenarios modelled on the mild pandemic of 1968, this could result in two to seven million deaths. However, if the death toll associated with the 1918 influenza virus were applied to today’s world population, there could be 180 to 360 million deaths globally.1
The influenza vaccine market
Each year influenza vaccines are reformulated using the three most prevalent virus strains, as identified by the WHO. Vaccine manufacturers then have up to six months to produce sufficient quantities of vaccine for the season’s vaccination programme, using egg-based production. This approach
requires annual vaccinations to address the changing virus targets and can often lead to vaccine shortages during the influenza season. The significant lead-time for production is also not well suited to addressing pandemics.
The influenza vaccine market is dominated by some of the world’s largest vaccines companies – sanofi pasteur, GSK and Novartis. Increased government funding has expanded the vaccine market to an estimated $2bn or 390 million doses a year, with 110-115 million doses ordered by the US alone. The WHO wants annual production to increase to more than 600 million doses and analysts estimate the market could grow to $4bn by 2011.2
In 2005-2007, the US Government awarded contracts worth $1.3bn to accelerate development and production of new cell-based technologies for seasonal and pre-pandemic H5N1 influenza vaccines within the US and to develop adjuvant-based vaccines and adjuvants for H5N1 avian influenza. The US Government has indicated that it will also invest in next-generation influenza vaccines in the future.
About Acambis’ programme
To be able to compete in such a significant market, we are targeting a highly novel approach: universal vaccination. We aim
to develop the ‘holy grail’ of influenza vaccines – a vaccine that targets all strains of the influenza virus, whether pandemic or seasonal.
Such an approach has huge potential, offering the opportunity to vaccinate at any time of the year, to provide immunity for more than one influenza season and to stockpile vaccine doses in preparation for a pandemic.
Our programme has several elements, the first of which is to take to proof-of-concept a vaccine candidate targeting all ‘A’ strains of the influenza virus. ACAM-FLU-A, utilises M2e, part of the highly conserved protein M2, which is common to all influenza ‘A’ strains.
Concurrently, work is ongoing to identify an equivalent component in the influenza ‘B’ strains, with a view, ultimately, to combining the two to create a universal influenza vaccine.
Notes
1 Kamps-Hoffmann-Preiser,
Influenza Report 2006.
2 The RPM Report, Cole Werble, Flu Speed Ahead for Vaccines Market, Vol. 1, No 10, October 2006.
13
Business review
Operational highlights
In our 2005 Annual Report, we set out our eight priorities for 2006. Our progress in 2006 and early 2007 was as follows:
01 | Complete filing of ACAM2000 licence application with the FDA In August 2006, the FDA accepted our BLA filing to apply for licensure of ACAM 2000. In January 2007, we received a Complete Response Letter requesting additional information that the FDA required to complete its review of the BLA. This was submitted in March 2007. |
02 | Secure ACAM2000 US Government warm-base manufacturing contract Although a final contract is outstanding, pending licensure of ACAM2000 by the FDA, we succeeded in securing an additional $30m order from the CDC in 2006, to facilitate the initiation of work on warm-base manufacturing in advance of finalisation of the contract. This order was completed in December 2006. |
03 | Secure MVA3000 US Government contract In November 2006 , the US Department of Health and Human Services informed us that our proposal for a contract was no longer in the competitive range. Our MVA3000 programme is being wound down during 2007. |
04 | Complete MVA litigation process at the ITC In September 2006, the judge at the ITC ruled in our favour, invalidating each of the patent claims asserted against Acambis and denying BN’s request for an exclusionary order. However, the ITC reviewed the decision and remanded the case back to the same judge, with a target date for completion of 19 October 2007. |
05 | Complete ChimeriVax-JE pivotal Phase 3trials We undertook two pivotal Phase 3 trials in 2006. Positive data from our safety trial were published in October 2006 and were followed in March 2007 with excellent data from the efficacy trial. In February 2007, we announced a commercialisation partnership with sanofi pasteur. |
06 | Commence ChimeriVax-JE Phase 2 paediatric trial in India There were several regulatory hurdles to overcome before we could undertake this trial in India. The trial was initiated in December 2006 and the first subjects were vaccinated in January 2007. This is the first time our vaccine has been tested in infants and children, who are the target population for the endemic region. |
07 | Complete ChimeriVax-West Nile Phase 2 trial The first part of the Phase 2 trial was completed and positive data were announced in September 2006. In the first quarter of 2007, we initiated the second part of the trial. We are testing ChimeriVax-West Nile in elderly subjects, who are the key target population. |
08 | Commence C.difficile Phase 2 trial Although we successfully completed our two Phase 1 trials in 2006 and announced positive data, we have since decided to modify the formulation of the vaccine to improve its stability profile. We will then manufacture new vaccine lots for the next stage of clinical development, which we anticipate will be in 2008. |
14

During 2006, we made good progress with our R&D
pipeline, with positive clinical data from several of our
key R&D pipeline programmes. We have continued this
success into 2007, most notably with the publication
of exceptional data for our single-dose JE vaccine and
establishing a commercialisation partnership for this
vaccine with one of the world’s leading vaccine companies.
Gordon Cameron
Chief Executive Officer
|
R&D update
ChimeriVax-JE: excellent efficacy and safety data reported, partnership with a global vaccine player secured, Indian paediatric trial underway
Since the start of 2007, we have announced the achievement of three important milestones for our ChimeriVax-JE programme: (i) publication of pivotal Phase 3 efficacy data; (ii) establishment of a worldwide commercialisation partnership with sanofi pasteur; and (iii) commencement of the paediatric study in India.
In the Phase 3 efficacy trial, our single-dose ChimeriVax-JE vaccine was tested for non-inferiority to the three-dose JE-VAX®, a licensed JE vaccine, based on development of neutralising antibodies against the relevant homologous JE virus. With seroconversion rates of 99.1% in the ChimeriVax-JE group compared with 74.8% in the JE-VAX group, we were able to demonstrate not only non-inferiority but also statistical superiority (p<0.001).
This followed the reporting of excellent results from our pivotal Phase 3 safety trial in October 2006, which showed that vaccination with ChimeriVax-JE was systemically and
locally well tolerated. Almost all adverse events which were recorded were mild or moderate, although there was one serious adverse event considered to be vaccine-related, which resolved without complications. In total, more than 2,800 subjects were recruited for these two trials and the data will support filings for the endemic and travel vaccine markets.
In February 2007, we established a major partnership agreement with sanofi pasteur, the vaccines business of the sanofi-aventis Group and one of the world’s leading vaccine companies. Under the agreement, we have granted sanofi pasteur marketing, distribution and certain manufacturing rights to ChimeriVax-JE worldwide, excluding India and the Indian subcontinent, where we have an existing agreement with Bharat Biotech, and also excluding the US, for which sanofi pasteur has been granted an option.
We will receive royalties on sales and payment for the supply of bulk-manufactured ChimeriVax-JE product, which we will continue to produce at our Canton, MA facility. In addition, we will receive milestone payments for initial technology transfer activities and following marketing
authorisation of ChimeriVax-JE in key endemic countries and in the European Union. The payments are together worth up to €30m (c. £20m), of which milestones of €7.5m (c. £5m) will be recorded in the first half of 2007. The US-related option, if exercised, would generate additional upfront and milestone payments, and also provide revenues from royalty payments. As sanofi pasteur is responsible for lyophilisation and fill/finish of the bulk ChimeriVax-JE in the designated regions, we are currently undertaking a technology transfer process.
We believe that our agreements with both sanofi pasteur and Bharat Biotech combine the best JE vaccine candidate with the best partners.
To support licence applications in the endemic regions, we are conducting a paediatric trial in India, which is the first trial of ChimeriVax-JE in infants and children. The trial aims to evaluate the safety and immunogenicity of one dose of ChimeriVax-JE compared with two doses of the currently licensed JE vaccine, a locally produced inactivated mouse-brain vaccine.
15
Business review
R&D and biodefence
franchise update
ChimeriVax-West Nile: leading vaccine candidate status maintained as trial underway in target population
Having completed the first part of a Phase 2 trial of ChimeriVax-West Nile in 2006, we are currently conducting the second part of the trial in one of the key target populations for the vaccine: elderly subjects. The second part of the Phase 2 trial includes approximately 100 subjects aged 41 years and above, which includes those who are considered by the CDC to be most at risk from severe disease resulting from West Nile virus infection. We are comparing the safety, tolerability and immunogenicity of ChimeriVax-West Nile against placebo.
During 2006, we published positive data from the first part of the Phase 2 trial, which tested safety and immunogenicity in healthy adults. The data showed that ChimeriVax-West Nile elicits a high immune response after a single dose, with over 97% of all subjects who received ChimeriVax-West Nile seroconverting 28 days after a single vaccination.
We have initiated partnership discussions with a view to out-licensing the programme after the conclusion of our Phase 2 trial.
C. difficile: positive clinical trial data published in 2006, formulation work ongoing in 2007
In 2006, we reported positive results from two Phase 1 trials that evaluated the safety, tolerability and immunogenicity of our vaccine against C. difficile-associated disease. In the first trial, our vaccine was tested in young healthy adults at different dose levels. The second trial focused on healthy elderly subjects aged 65 years and above, who are the principal target population for the vaccine. The two trials both produced positive results, with antibody responses seen in all subjects who received our vaccine. There were no vaccine-related serious adverse events and the most common vaccine-related side effects were mild in nature.
Currently, we are in the process of improving the formulation of the vaccine to enhance its stability profile. We will then manufacture new vaccine lots for the next stage of clinical development, which we anticipate will be in 2008.
Influenza: application submitted to FDA for clinical trials
In the second quarter of 2007, we expect to submit an IND application to the FDA to initiate clinical testing of our ACAM-FLU-A vaccine candidate. ACAM-FLU-A is the first vaccine candidate being developed under our influenza programme and is designed to function as a universal vaccine against all ‘A’ strains of influenza by targeting a conserved peptide component present in ‘A’ strains of the virus. As such, it could be a candidate pandemic influenza vaccine, as well as becoming one of the components for a universal seasonal vaccine.
Our influenza programme is intended to be a highly innovative approach to one of the major killer diseases in the world today.
Note
1 | ACAM2000 is sold to governments under an FDA IND application. |
16
Biodefence franchise update
ACAM2000: additional US Government order completed and progressing toward licence approval
In December 2006, we successfully completed delivery of an additional 10 million doses of our ACAM2000 smallpox vaccine to the CDC. This generated revenue of approximately £16m, for which we received payment in January 2007. This brought the number of doses produced to date for the US Government to 192.5 million and the order was intended to incentivise us to continue work to establish a warm-base manufacturing capability for ACAM2000. Under a warm-base manufacturing contract, we would maintain an ongoing production readiness capability through annual production runs. Finalisation of a warm-base manufacturing contract with the US Government is expected to follow after US licensure of ACAM2000.
In January 2007, as part of the normal review process, we received a Complete Response Letter from the FDA in response to our ACAM2000 BLA. In the Complete Response Letter, the FDA requested additional information that it required to complete its review of the BLA and we provided that information in early March 2007. The next key step in the review process is for the FDA to hold a Vaccines and Related Biological Products Advisory Committee meeting for ACAM2000. The next scheduled meeting is in May 2007 and we are hoping to have ACAM2000 reviewed at that meeting.
MVA3000: winding down activities during 2007
On 14 November 2006, we were notified by DHHS that our proposal for the supply of doses of MVA3000 attenuated smallpox vaccine was no longer being considered for a contract award under DHHS’s tender process. DHHS has since debriefed us and explained its rationale for this decision, which centred on issues relating to the technical specification of our MVA3000 product.
We are completing certain activities under our existing MVA R&D contract with the NIH and, as a result of DHHS’s decision, have agreed to wind down the programme by the end of that contract in September 2007.
MVA litigation: ITC decision
In September 2006, a judge at the ITC ruled in our favour in the litigation with Bavarian Nordic relating to MVA, following an evidentiary hearing held in May 2006. The judge invalidated each of the patent claims asserted against Acambis and denied Bavarian Nordic’s request for an exclusionary order. In November 2006, the ITC decided to review the decision and, in February 2007, announced that the case would be remanded back to the same judge. The target date for completion of the investigation has been set at 19 October 2007. Cases are also ongoing at the District Court of Delaware, US and the Commercial Court in Vienna, Austria.
Given the US Government’s decision in November 2006 not to award us a contract, all three cases are now largely immaterial to our strategic goals.
ARILVAX settlement
In September 2006, we announced that Novatis had agreed to pay us $19.0m (£10.1m) in cash to settle a dispute related to the ARILVAX yellow fever vaccine. Acambis had US sales rights to the vaccine and had previously completed Phase 3 clinical trials with a view to applying for US licensure. The dispute arose under an agreement that had been established in 1999 and resulted from non-performance by predecessor companies acquired by Novartis.
Sale of BPC
We further strengthened our financial position through the sale of our BPC business to Crucell for $17.0m (£9.0m), which was completed in September 2006. Acambis originally acquired BPC in 2003 to help build a travel vaccines franchise in the US. However, following the termination of the ARILVAX licensing agreement, BPC was no longer a strategic asset and its sale crystallised value and cash in the short term.
US Listing and SEC registration: de-listing from NASDAQ completed, deregistration from the SEC ongoing
In 2006, we announced our intention to deregister voluntarily from the US Securities Exchange Act of 1934 and to de-list our stock from NASDAQ. In our view, the listing was no longer in shareholders’ best interests. On 21 December 2006, we completed our voluntary de-listing from NASDAQ and terminated our ADR facility, which became effective at the close of trading on 14 February 2007. The process to deregister from the SEC is ongoing.
Our obligation to report to the SEC is expected to be suspended in the second quarter of 2007. Our ongoing obligations under our LSE listing are unaffected by this process.
As a result of our de-listing and deregistration, we expect to achieve annual cost savings of around £0.4m per annum. This is in addition to the £7.0m cost savings achievable from the cost base review.
|
17
Business review
Financial highlights
Income statement highlights
|
| 2006 |
| 2005 |
|
|
| £m |
| £m |
|
Revenue |
| 30.9 |
| 40.9 |
|
Cost of sales |
| (14.6 | ) | (27.6 | ) |
�� |
|
|
|
|
|
Gross profit |
| 16.3 |
| 13.3 |
|
Research and development costs |
| (37.0 | ) | (34.1 | ) |
Sales and marketing costs |
| (2.6 | ) | (2.6 | ) |
Administrative costs |
| (8.6 | ) | (7.7 | ) |
Other operating income |
| 14.7 |
| 0.4 |
|
|
|
|
|
|
|
Operating loss |
| (17.2 | ) | (30.7 | ) |
Net finance income |
| 1.3 |
| 3.0 |
|
|
|
|
|
|
|
Pre-tax loss |
| (15.9 | ) | (27.7 | ) |
Taxation |
| (0.6 | ) | 0.7 |
|
Loss after taxation |
| (16.5 | ) | (27.0 | ) |
Balance sheet highlights
|
| 2006 |
| 2005 |
|
|
| £m |
| £m |
|
Non-current assets |
| 28.3 |
| 39.8 |
|
Current assets |
|
|
|
|
|
Cash and liquid investments |
| 34.4 |
| 68.0 |
|
Trade and other receivables |
| 17.5 |
| 20.6 |
|
Inventory |
| 1.5 |
| 3.6 |
|
Other current assets |
| 0.6 |
| 1.4 |
|
|
|
|
|
|
|
Liabilities |
|
|
|
|
|
Current liabilities |
| (15.6 | ) | (46.8 | ) |
Non-current liabilities |
| (1.6 | ) | (3.6 | ) |
Net assets |
| 65.1 |
| 83.0 |
|
18
Commentary reflects the 2006 numbers, unless otherwise indicated
Revenue: This is in line with the revenue guidance of around £30m given in 2006. The main sources of revenue were product sales of ACAM2000 to the US Government, two contracts with the NIH for MVA3000 and product sales of Vivotif, up to the time that the BPC business was sold to Crucell in September. The higher levels in 2005 reflected more intensive levels of activity on government contracts.
Cost of sales: This represents costs relating to each of the above revenue items and certain costs of operating our manufacturing facilities.
Gross profit: The margin increased to 52.8%, representing the change in the mix of revenues recorded.
R&D costs: Expenditure was slightly below guidance provided during 2006. The costs were net of a £1.2m credit relating to ARILVAX as a result of reaching settlement with Novartis. The two Phase 3 trials for ChimeriVax-JE contributed a significant proportion to these costs in 2006. We continued to expense process development and manufacturing costs for work on our R&D projects against R&D costs.
Administrative costs: This included costs associated with the MVA litigation, aborted acquisition costs and foreign exchange movements.
Other operating income: Two items were recorded in the third quarter. The first, £10.1m, relates to the $19.0m settlement received from Novartis for the ARILVAX programme. The second relates to the sale of the BPC business to Crucell on which other operating income of £4.6m was recorded. This represented £9.0m ($17.0m) of proceeds, which was offset by the value of fixed assets, working capital, goodwill, other intangible assets and related deferred tax liabilities on the balance sheet.
Net finance income: Finance income reduced as a result of lower cash levels during 2006 compared with 2005. Finance costs primarily comprised interest payable on the lease-financing facility, which was paid down in full at the end of 2006.
Pre-tax loss: The difference seen over 2005 is in part due to other operating income relating to ARILVAX and the sale of the BPC business.
Taxation: The charge in 2006 relates to adjustments to tax in respect of prior periods.
Cash and liquid investments: The reduction in cash during the year is a result of increased investment in the R&D pipeline, repayment of our lease-financing facility and the net cash outflow from working capital movements as described below.
Trade and other receivables: The balance at the end of 2006 included the amount owing from the US Government for the 10 million-dose ACAM2000 shipment made in the fourth quarter. This trade debtor was settled in January 2007.
Inventory: This principally represents work-in-progress and finished goods in relation to our ACAM2000 vaccine. The reduction seen in 2006 is predominantly a result of the shipment of ACAM2000 inventory during the fourth quarter of 2006. In 2005, the balance also included stocks of Vivotif, which were transferred to Crucell in September 2006 as part of the sale of the BPC business and are, therefore, no longer represented in the inventory balance.
Liabilities: A reduction in accruals and trade payables was seen during 2006, principally relating to payment of creditors for the completion of the Phase 3 clinical trials for ChimeriVax-JE and for the production of 500,000 doses of MVA3000. Current liabilities at the end of 2006 represent more normalised levels. At the end of 2006, we made our final payment to settle our lease-financing facility, resulting in a nil balance at 31 December 2006 (31 December 2005 – £7.1m). The remaining balance at 31 December 2006 includes £1.3m (31 December 2005 – £1.7m), relating to the discounted value of the future payments for our Rockville fill/finish facility acquired in 2005, payable between 2006 and 2017.
19
Business review
Risk
Last year we identified five major risks to the Group in 2006. During the year, four of those five risks materialised. Some of those risks were outside the Group’s control and in those cases our only input was in managing or mitigating the impact of the effects once the event had occurred.
The management of the Group has for some time been considering ways of diversifying the portfolio and reducing our reliance on biodefence, which contributed to some of our key risks in 2006. This new strategy was announced in November 2006.
Key risks for 2007
1 Failure to obtain timely licensure of ACAM2000
The timing of and/or any actual award of licensure for ACAM2000 is somewhat outside our control. We are continuing to progress those areas over which we have some control or influence and are taking other steps to manage this risk, including the following:
– | Filing the BLA, which was agreed as filed by the FDA in August 2006; |
– | Responding quickly to the Complete Response Letter issued by the FDA during the first quarter of 2007; and |
– | Preparing for an Advisory Committee meeting to the maximum extent possible. This is expected to be the final step before product licensure. |
2 Failure to obtain an ACAM2000 warm-base manufacturing contract
We continue to pursue a warm-base manufacturing contract for the production of ACAM2000 vaccines for the US Government. We expect to secure the contract in 2007. However, the ultimate decision to award a contract is outside our
control. The steps we are taking internally to manage this risk include:
– | Continuing to build on our existing track record of delivering on all existing contractual obligations (including delivery of a 10 million-dose order in December 2006) up to and including gaining ACAM2000 product licensure, expected in 2007; |
– | Continuing to review all options for maximising utilisation of our manufacturing facilities should a warm-base manufacturing contract not materialise; and |
– | Maintaining our strong relationship with the US Government. |
3 Failure to reap the benefits of the restructuring announced in March 2007
The Group announced a restructuring programme in March 2007, which intends to increase the focus on resources for key programmes and core operational capabilities, and significantly lower the Group’s cost base. The risk is that the cost savings anticipated by the restructuring cannot be realised and/or the business is not able to make the anticipated progress. The steps we are taking to manage this risk include:
– | Appointment of a new highly experienced and well-regarded CEO from 1 June 2007 to take the Group through the next stage of its development; |
– | Development of the refocused senior management team, including the appointment to the Board of Dr Michael Watson as Executive Vice President, R&D; |
– | Setting of budgets with anticipated savings and careful monitoring against these; and |
– | Continued development of a focused project management capability to track progress of R&D projects against timelines. |
4 One or more products in development fails to achieve the desired safety or efficacy outcomes
Development of novel vaccines is core to Acambis’ business and we are continually bringing new projects through our pipeline. Failure of products in later stages of development can be particularly damaging to the market perception and valuation of Acambis.
The steps we are taking to manage this risk include:
– | Ensuring that we have experienced personnel and/or access to external expertise in critical areas, including research, product development, management of clinical trials and liaison with regulatory authorities; |
– | Exploiting our ChimeriVax technology platform to develop new vaccines, thereby benefiting from the knowledge gained from ChimeriVax-based vaccine candidates that have previously been tested in clinical trials; |
– | Undertaking appropriate pre-clinical testing in advance of entering the clinical development stage; and |
– | Conducting all necessary tests to understand a product candidate’s characteristics before entering extensive and expensive late-stage clinical trials. |
|
20
Corporate responsibility
Acambis’GoodCorporation performance in 2004-2006
In 2006, we underwent our third annual audit by GoodCorporation, an independent corporate responsibility verification organisation. To achieve GoodCorporation membership, organisations are annually assessed and must meet minimum criteria on the existence and effectiveness of management practices in around 60 areas. The verification report is based on site visits and interviews with all stakeholder groups.
We made further improvements during 2006 and again succeeded in achieving GoodCorporation membership. Our performance over the three years is shown below. A full breakdown of our performance for each of the stakeholder areas is provided on our website at www.acambis.com.
Having completed three years of review with GoodCorporation, we are confident we have established a strong baseline for our performance in areas of importance to our key stakeholders. We now aim to focus attention more specifically on those areas of greatest relevance to our business. To achieve that, we are reviewing how best to assess our ongoing performance in significant areas, including whether to introduce alternative audit systems. We are also considering key performance indicators with a view to giving a greater insight into our corporate responsibility performance.

21
Board of Directors
Acambis has made a number of Board changes to
establish the necessary leadership to achieve the
reorientation of its business.
|
|
|
|
|
Dr Peter Fellner** |
| Gordon Cameron, OBE* |
| Ian Garland |


Peter Fellner, 63, was appointed a Non-executive Director in February 2006 and became Chairman on 1 October 2006. Peter was Celltech Group plc’s CEO from 1990 to 2003 and Chairman from 2003 until its acquisition by the major European biopharmaceutical company, UCB SA, in 2004. Before Celltech, Peter was CEO of Roche UK from 1986 to 1990, having previously been Director of the Roche UK Research Centre from 1984 to 1986. He is Chairman of Vernalis plc and Astex Therapeutics Limited and a Director of UCB SA, QinetiQ Group plc, Evotec AG and Bespak plc. He is also a Director of Oxford University’s technology transfer group, Isis Innovation Limited, and a Member of the UK’s Medical Research Council. Peter is Chairman of the Nominations Committee. * Member of the Nominations Committee ** Member of the Nominations and Remuneration Committees *** Member of the Audit, Nominations and Remuneration Committees
|
| Gordon Cameron, 41, was appointed CEO on 23 February 2004, having previously served as CFO since 1 March 1997. Gordon joined Acambis in 1996 from the corporate finance department at N M Rothschild & Sons Limited where he had advised Acambis on its listing on the LSE. From 31 March 2001 until his appointment as CEO, Gordon was additionally President of Acambis’ US subsidiary Acambis Inc. During this time Gordon was instrumental in Acambis’ winning and executing on the major smallpox vaccine supply and R&D contracts with the US Government. In 2004, he was appointed an Officer of the Order of the British Empire for services to the British biotechnology industry in the US. Gordon will be leaving Acambis on 1 June 2007 and will be replaced by Ian Garland as CEO. |
| Ian Garland, 41, has been appointed CEO with effect from 1 June 2007. He replaces Gordon Cameron who has served as CEO since 2004. Since 2004, Ian Garland has been CFO of Arrow Therapeutics Ltd, a company engaged in the discovery and development of novel anti-viral products. He recently oversaw its acquisition by AstraZeneca plc for $150 million, which was completed on 28 February 2007. Previously, in June 2005, Arrow concluded a major R&D collaboration with Novartis. From 2003 to 2004 Ian was CFO of Amarin Corporation plc. Prior to that, from 1999 to 2003, Ian was President and COO of Celltech Pharmaceuticals Inc., which had a turnover of around $300m and approximately 1,000 employees, encompassing the US operations of Celltech Group plc. He was responsible for all US activities, including marketing, manufacturing and supply chain management, and US-based development and support functions. During this time, he achieved significant US sales and earnings growth, the approval of two US New Drug Applications and the divestment of several non-core businesses. Between 1995 and 1999 Ian had finance roles at Medeva plc, which was subsequently acquired by Celltech, and at Pepsi Cola, Inc. based in the US. From 1988 to 1995 he worked at KPMG, specialising in the pharmaceutical sector, following qualification as a Chartered Accountant.
|
22
|
|
|
| |
|
| |||
Dr Michael Watson |
| Elizabeth Brown, Acting CFO and Company Secretary |
| |
Michael Watson, 42, was appointed to the Board as Executive Vice President, R&D, on 18 January 2007 and took up his duties on 26 March 2007. He is a UK physician with a clinical background in gastro-enterology and infectious diseases and is a member of the Royal College of Physicians and the Faculty of Pharmaceutical Medicine. He has worked in pharmaceutical clinical development since 1993 and since 1998 for Sanofi Pasteur MSD, firstly as UK Medical Director, then since 2001 as Director of Clinical Development and later on as European Director of Clinical and Epidemiology based in Lyon, France. At Sanofi Pasteur MSD he led the team that developed and licensed Pediacel® in the UK and the Sanofi Pasteur MSD European Gardasil® project team. He is on the editorial board of the Journal of Clinical Virology and is an associate editor of Human Vaccines. He has also served as a board member of the Pharmaceutical Section of the Royal Society of Medicine and is a member of the Clinical group of the European Vaccine Manufacturers Association, whose activities include establishing a European clinical development framework for pandemic influenza vaccines. |
| Elizabeth Brown, 35, was appointed Acting CFO to replace David Lawrence who left Acambis on 6 March 2007. Elizabeth is a certified accountant and joined Acambis in 1996. In her core role as Vice President of Financial Management, Elizabeth is responsible for financial performance measurement, budgeting and long-term financial planning. In addition, Elizabeth has, in the last few years, overseen the development of Acambis’ risk management systems. She has served as Company Secretary since 1 July 2002. |
| |
|
|
|


23
Board of Directors | ||||||
|
|
|
|
| ||
|
| During 2006 we expanded our complement of Non- | ||||
|
|
|
|
| ||
| Directors’ information The Directors who served during the year were: Executive: Gordon Cameron, David Lawrence (resigned 6 March 2007) and Dr Thomas Monath (resigned 1 September 2006). Non-executive: Dr Peter Fellner (appointed 6 February 2006), Dr Randal Chase, Alan Dalby, Ross Graham, Dr William Jenkins (appointed 1 December 2006), John Lambert (appointed 1 December 2006), Michael Lytton (resigned 11 April 2006) and Alan Smith (resigned 30 September 2006). The usual business address of all the Directors is Peterhouse Technology Park, 100 Fulbourn Road, Cambridge CB1 9PT, UK. In accordance with the Company’s Articles of Association, Ross Graham and Dr Randal Chase will retire by rotation and, being eligible, offer themselves for re-election. In addition, Dr Michael Watson, Dr William Jenkins and John Lambert, who have been appointed to the Board since the last AGM, offer themselves for election at the AGM. Board changes Since the beginning of 2007, we have appointed Dr Watson Executive Vice President, R&D. On 1 June 2007 Ian Garland will become Acambis’ CEO. |
|
|
|
|
|
| Dr Randal Chase*** Randal Chase, 57, was appointed to the Board of Acambis as a Non-executive Director on 1 October 2004. The Board considers Randal to be an independent Non-executive Director. He was President of Shire Biologics until its sale to ID Biomedical in 2004. Previously in his career, Randal was President of North American Vaccine and President of Aventis Pasteur Canada. He has a PhD in biochemistry from the University of British Columbia. Randal is currently Chairman of Medicago Inc. and a Director of Conjuchem Biotechnology, both of which are listed on the Toronto Stock Exchange. He is a Director of Bioject, which is NASDAQ-listed, and is acting part-time President and CEO of Immunovaccine Technologies, a privately held company. |
| Alan Dalby*** Alan Dalby, 70, became a Non-executive Director of Acambis on 1 May 1998. He is the Senior Independent Non-executive Director and Chairman of the Remuneration Committee. The Board considers Alan to be an independent Non-executive Director. Alan was previously an Executive Director of SmithKline, a predecessor company to GlaxoSmithKline plc, and retired from the role of Chairman of Reckitt Benckiser plc in 2001. | |||
* Member of the Nominations Committee ** Member of the Nominations and Remuneration Committees *** Member of the Audit, Nominations and Remuneration Committees |
|
|
|
|
| |


24
|
|
|
|
|
|
|
|
|
|
|
|
|
|
|
|
|
|
|
|
|
|
|
|
|
|
|
|
|
|
Ross Graham*** |
| Dr William Jenkins** |
| John Lambert*** |


Ross Graham, 59, was appointed to the Board of Acambis as a Non-executive Director on 25 March 2004. The Board considers him to be an independent Non-executive Director. He is Chairman of the Audit Committee and has been identified by the Board as having relevant financial experience. Ross was Corporate Development Director of Misys plc, which he joined as Finance Director in 1987 at the time of its flotation, and was appointed Corporate Development Director in 1998 with Board responsibility for corporate transactions and management of strategic alliances. He stepped down from Misys’ Board of Directors at the end of 2003 after more than 16 years. Prior to his career at Misys, Ross was a Partner with Arthur Young, a predecessor firm to Ernst & Young, where he qualified as a Chartered Accountant. He is also a Non-executive Director of Wolfson Microelectronics plc and Psion plc. |
| Dr William Jenkins, 59, was appointed to the Board of Acambis as a Non-executive Director on 1 December 2006. The Board considers him to be an independent Non-executive Director. William has extensive experience in clinical research, product development and regulatory affairs within major pharmaceutical companies. Between 1992 and 1999, he led Ciba-Geigy and then Novartis’ worldwide medicine, clinical development and regulatory affairs functions. Prior to that, William worked for Glaxo Wellcome plc from 1988 to 1992 as Head of Worldwide Clinical Research. He had previously worked at Medicines Division of the UK Department of Health, becoming Principal Medical Officer in 1986. William is active in the life-sciences sector through his pharmaceutical consulting business and also currently serves as a Non-executive Director of several life-science companies, including Evotec AG and BTG plc. |
| John Lambert, 55, was appointed to the Board of Acambis as a Non-executive Director on 1 December 2006. The Board considers him to be an independent Non-executive Director. John has over 30 years’ experience in the vaccine industry. He was President of Chiron Corporation’s global vaccines business from 2001 to 2005. Prior to that, he was President of Aventis Pasteur MSD, responsible for the European development and commercialisation of vaccines developed by Aventis Pasteur (now sanofi pasteur) and Merck. John joined the Aventis Group in 1987, where his responsibilities included creating its vaccines operation in the UK and its Australasian business unit, and he was part of the team that established the joint venture with Merck. His professional career began with Servier Laboratories, UK in 1972. John has also held important trade association positions including serving on the Board of the Global Alliance for Vaccines and Immunisation in 2004 and 2005 as the Vaccines Industry Representative and as President of the European Vaccine Manufacturers Association between 2001 and 2003. He is currently an independent consultant through his own organisation, J G Solutions Limited. He is also Chairman of Cambridge Biostability Ltd and Vice President of Farmaprojects S.A. |
25
Directors’ report for the year ended 31 December 2006
The Directors’ report on the affairs of the Group is presented below. The Group financial statements and Auditors’ report for the year ended 31 December 2006 are presented within this document.
Principal activities and business review
A review of the business and future developments of the Group, including KPIs (noted in operational highlights on page 14), are set out in the business review and the strategy statement. The principal activities of the Group are the research, development and manufacture of vaccines to prevent and treat infectious diseases.
Principal risks and uncertainties
Principal risks and uncertainties faced by the Group are discussed within the corporate governance statement.
Results and dividends
The loss for the year after taxation amounted to £16.5m (2005 – £27.0m). The Directors do not recommend a final dividend for the year (2005 – £nil). In the year ended 31 December 2006, the Group generated revenues of £30.9m (2005 – £40.9m). Further details of the results for the year and future developments for the Group are set out in the business review of 2006 and the strategy statement.
Research and development
As discussed within the financial highlights in the business review, the Group incurred R&D costs of £37.0m (2005 – £34.1m) during the year, which have been written off to the income statement in accordance with the Group’s accounting policy.
Directors and their interests
The Directors who served during 2006 are shown in the Board of Directors section. The interests of the Directors in the Company’s shares and options to purchase shares in the Company are shown in the remuneration report. At 31 December 2006, the Directors in office held an aggregate 337,441 shares, representing 0.31% of the current issued capital. None of the Directors had an interest in a contract of significance to which the Company or any of its subsidiary undertakings was party during the year.
Policy on payment of creditors
It is the Group’s policy that payments to suppliers should be made in accordance with those terms and conditions agreed between the Group and its suppliers, provided that all trading terms and conditions have been met. At 31 December 2006, the Company had an average of five days (2005 – nil days) of purchases outstanding in trade creditors. At 31 December 2006, the Group had an average of 36 days (2005 – 90 days) of purchases outstanding in trade creditors.
Corporate responsibility
The Directors recognise the importance of corporate responsibility and, as a result, have included a report on Acambis’ current activities in this area in the business review.
Financial risk management
As discussed in note 15 to the Group financial statements, the main financial risks arising from the Group’s activities and involving the use of financial instruments are foreign currency risk, interest rate risk and liquidity risk.
Political and charitable donations
During the year, the Group made charitable contributions amounting to £15,000 (2005 – £30,000). Of this total, £2,000 related to medical research (2005 – £1,000), £6,000 to biotechnology-related education initiatives (2005 –£6,000), £2,000 to local charities (2005 – £3,000), £3,000 to national charities (2005 – £12,000) and £2,000 to international charities (2005 – £8,000). No political donations were made during the year (2005 – £nil).
Employees participated in various charitable fundraising activities during the year in aid of local and national charities.
26
Employees
Acambis seeks to involve its employees in its corporate objectives, plans and performance and in other relevant matters of interest to employees through various communication methods, including regular employee meetings. Employees of Acambis are not part of any labour unions. The Directors consider there to be a good relationship between employees and management. The Group is an equal opportunities employer and does not discriminate in the recruitment and promotion of staff, including applicants who are disabled. If an employee becomes disabled it is the policy, wherever practicable, to provide continued employment. All employees are encouraged to share in the growth of the Group, being eligible to participate in share option schemes.
Health, safety and environmental issues
The Group is committed to achieving high health, safety and environmental standards and aims for continuous improvement in health, safety and environmental performance. In the UK, Acambis is a member of the British Safety Council. In the US Acambis is a member of the National Safety Council and contracts with Mount Auburn Hospital’s Occupational Health Service to provide medical surveillance and prevention and treatment of work-related injuries and illnesses, including administering appropriate immunisations. The Group has an excellent health and safety record. The Group seeks to minimise the environmental impact of its activities. Waste materials are recycled, where possible, and specialist disposal companies handle hazardous waste.
Other information and AGM
Information regarding the substantial shareholders of Acambis, this year’s AGM, the appointment of the Group’s Auditors and special business to be conducted at the AGM is contained within the shareholder information section of this document.
Disclosure of information to auditors
So far as each of the Directors is aware, there is no relevant audit information of which the Company’s Auditors are unaware. Each Director has taken all the steps that he ought to have taken as a Director in order to make himself aware of any relevant audit information and to establish that the Company’s auditors are aware of that information.
By order of the Board
Elizabeth Brown
Company Secretary
16 April 2007
27
Corporate governance statement
The following statement describes the main principles of corporate governance and how they have been applied by Acambis.
Compliance with the Code of Best Practice
Acambis has complied throughout the year with the provisions of the Code of Best Practice set out in Section 1 of the Combined Code published in July 2003 by the Financial Reporting Council, except in those areas highlighted in the comply or explain section presented on page 31.
Statement of applying the Principles of Good Governance
Acambis has applied the Principles of Good Governance set out in Section 1 of the Combined Code by complying with the Code of Best Practice, as reported above. Further explanation of how the principles have been applied is set out below and, in relation to Directors’ remuneration, in the remuneration report.
The BIA Code of Best Practice
Acambis, as a member of the BIA, has also complied with the principles in the BIA Code and maintains and develops procedures to support compliance with its specific provisions. The BIA Code was introduced in 1999, is obligatory for all BIA members and includes principles and provisions relating to corporate governance matters, access to external advice, confidentiality, dealings in a company’s shares and standards of public announcements. It is intended to operate by reference to the particular circumstances of bioscience companies in support of the Combined Code. Acambis has also implemented Part 2 of the BIA’s Best Practice Guidance on Financial & Corporate Communications, which was introduced on 1 September 2006.
Internal control
The Board has applied principle C.2 of the Combined Code by establishing a process for identifying, evaluating and managing the significant risks faced by the Group. This process has been in place since the start of 2000 and is in accordance with Internal Control: Guidance for Directors on the Combined Code published in September 1999. The Board is responsible for the Group’s system of internal control and for reviewing its effectiveness. Such a system manages rather than eliminates the risk of failure to achieve business objectives and can only provide reasonable and not absolute assurances against material misstatement or loss.
The Board regularly reviews the risks to which the business is exposed and the controls in place to mitigate those risks. It delegates the operational management of the business risk process to the Executive Directors. The Executive Committee has oversight of the day-to-day operational activities of Acambis and remains responsible for managing the risk reviews.
In compliance with provision C.2.1 of the Combined Code, the Board reviews the effectiveness of the Group’s system of internal control. The Board’s monitoring covers all material controls, including financial, operational and compliance controls and risk management. It is based, principally, on reviewing reports from management to consider whether significant risks are identified, evaluated, managed and controlled, and whether any significant weaknesses are promptly remedied or indicate a need for more extensive monitoring. The Board also receives, via the work performed by the Audit Committee, regular updates from the Company’s Auditors in this respect. The Board has also performed a specific assessment for the purpose of this Annual Report considering all significant aspects of internal control arising during the year. The internal audit function continued during 2006. The Audit Committee assists the Board in discharging its review responsibilities.
As of the date of this Annual Report, based on the assessment of the Board of Directors, there were no changes in the Group’s internal controls or in other factors that could have a significant adverse effect on these controls subsequent to the date of their evaluation.
Risk factors
As with any business, there are risks and uncertainties relevant to Acambis’ business. These have been qualified by reference to factors that affect the majority of businesses, factors that are common to businesses in the biotechnology sector, factors common to businesses working in vaccines and those specific to Acambis.
28
Risks common to most businesses
The following risk factors, whilst pertinent to Acambis, are considered to be common to most businesses. |
• | Failure to maintain legal and regulatory compliance including those relating to a listing on the LSE |
• | New or revised accounting standards and rules causing a material adverse impact on reported financial results |
• | Failure to balance the product portfolio against market projections and demands |
• | Increasing cost and decreasing availability of insurance |
• | Lack of control over external economic factors affecting business |
• | Political unrest, legal and regulatory changes or nationalisation in jurisdictions where a business operates |
• | Unforeseen events which would be classified as force majeure, e.g., fire, flood, loss of utilities |
• | Inability to trade as a going concern (e.g., through inaccurate forecasts, unexpected calls on reserves or significant increases in working capital) |
• | Impact of issues arising from reviews by tax authorities |
Risks common to biotech businesses
The following risk factors, whilst pertinent to Acambis, are considered to be common to the majority of biotechnology businesses.
• | Recall or withdrawal of licensed products |
• | Failure of projects in development or clinical trial, or delays in progressing development |
• | Inability to take any particular research project through to market due to safety and efficacy, regulatory approvals, manufacture or IP issues, or lack of funds |
• | IP issues from challenges by others or lack of protection for own products |
• | High front-end costs associated with product development, which may have lead times to market of several years |
• | High product attrition rate, even after licensure |
• | Ethical issues, relating to in vivo testing and the conduct of clinical trials in humans |
• | Limited control over the type and cost of trial required to obtain licensure, including the imposition of additional trials |
• | Insufficient funds for products or operations and consequent delay, reduction or elimination of some development programmes |
• | Negative impact of intense competition in areas in which the business is engaged |
• | Competitors who may have greater financial and human resources and more experience |
• | New research and discoveries that may render product candidates obsolete before they generate any income |
• | Competition for employees in the biotechnology sector that may lead to increased costs or decreased availability of staff |
• | Loss of key employees, which could delay or halt the development of products |
• | Some products may not be successfully commercialised without co-operation of collaborators. Such cooperation may be at significant cost in lost royalties or share of future income, or appropriate co-operation may not be available |
29
Corporate governance statement
Risks common to vaccine companies
The following risk factors, whilst pertinent to Acambis, are considered to be common to the majority of companies working in the vaccine field.
• | Increasing demands of the vaccine regulatory environment, e.g., under the FDA and EMEA, which could increase the cost of product development and also the time required to obtain licensure |
• | Barriers to market such as inertia, doctor/patient attitudes and competitiveness in terms of product pricing and safety or efficacy profile |
• | Constraints on government and private healthcare budgets and drivers to reduce healthcare and insurance costs |
• | Legal factors, product liability claims, environmental concerns or patent disputes with competitors that could give rise to liabilities for which there may be no, limited or prohibitively expensive insurance coverage |
Risks specific to Acambis
The key risks for 2007 are discussed in detail in the risk section on page 20. The following additional risk factors are considered to be specific to Acambis.
• | No track record of having achieved registration of any product, although expertise does exist within the Group |
• | Reliance on the smallpox franchise and the US Government for the vast majority of our revenue |
• | Stocks of ACAM2000 smallpox vaccine held may become surplus to requirements |
• | Impact of fluctuations in the exchange rate with other currencies, particularly the US dollar |
• | Reliance on only one fully functional manufacturing facility, based in the US, which could be lost or damaged |
• | Lack of substantial recurrent revenue stream |
• | Outstanding IP litigation with Bavarian Nordic on MVA |
• | Managing and maintaining suspension and eventual termination of SEC reporting requirements |
• | Acambis’ stated aim of partnering late-stage projects may not be achievable |
Comply or explain: Compliance with the Combined Code
The Combined Code (the code) published by the Financial Reporting Council incorporates the previous code (as published in 1998 by the Hampel Committee) and related guidance that had been issued since that date: the Turnbull Guidance on Internal Control; the Smith Guidance on Audit Committees; and various items of good practice guidance from the Higgs Report. The July 2003 code has been applicable for reporting years beginning on or after 1 November 2003 and, therefore, was adopted by Acambis from our 2004 financial year. The overriding principle of the code republished in 2003 is that companies must comply with it or explain why they have not done so. The code was updated in June 2006 and, when available for adoption in Acambis’ 2007 financial year, is not expected to result in significant changes to the Company’s corporate governance practices.
30
Comply or explain: Compliance with the Combined Code (continued)
The following section highlights the areas where we did not comply with the code for the whole of 2006 and notes the progress we have made to address those areas:
Code provision |
| Difference from code |
| Action to address difference |
Code C.3.1 Audit Committee membership |
| For a period of four months in 2006 the Audit Committee only had two members the earlier reorganisation of committees and the resignation of Michael Lytton before the anticipated new Non-executive Directors were appointed |
| Reappointment of Alan Dalby to the Committee |
Code A.6.1 Board evaluation The Board should state in the Annual Report how performance evaluation of the Board, its committees and its individual directors has been conducted |
| No formal Board evaluation took place in 2006 |
| The Board agreed to postpone evaluation until 2007 when the full complement of Directors has been in post for a reasonable period |
Code C.3.4 Whistleblowing |
| The Whistleblowing policy was not in place for the whole of 2006 |
| Addressed by Company-wide roll-out in late January 2006 |
Directors’ attendance at Board and Committee meetings during 20061
Director | Board | Audit Committee | Nominations Committee | Remuneration Committee | |||
Dr Peter Fellner2 | 12/12 |
| n/a |
| 1/1 |
| 3/3 |
Gordon Cameron | 13/13 |
| n/a |
| 1/1 |
| n/a |
David Lawrence3 | 13/13 |
| n/a |
| n/a |
| n/a |
Dr Thomas Monath4 | 5/7 |
| n/a |
| n/a |
| n/a |
Dr Randal Chase | 11/13 |
| 6/6 |
| 2/2 |
| 5/5 |
Alan Dalby5 | 10/13 |
| 2/2 |
| 2/2 |
| 4/5 |
Ross Graham6 | 12/13 |
| 5/6 |
| 1/2 |
| 4/4 |
John Lambert7 | 1/1 |
| n/a |
| n/a |
| n/a |
Michael Lytton8 | 2/3 |
| 1/1 |
| 1/1 |
| 1/2 |
Dr William Jenkins9 | 1/1 |
| n/a |
| n/a |
| n/a |
Alan Smith10 | 8/8 |
| n/a |
| 1/1 |
| n/a |
| Notes | |
1 | Meetings include scheduled Board and Committee meetings. |
2 | Dr Fellner was appointed to the Board on 6 February 2006 and became Chairman of both the Board and the Nominations Committee on 1 October 2006. He served on the Remuneration Committee from his appointment until he became Chairman and, following a change in the Combined Code, was reappointed to the Committee in March 2007. |
3 | Mr Lawrence resigned from the Board on 6 March 2007. |
4 | Dr Monath resigned from the Board on 1 September 2006. |
5 | Mr Dalby is Chairman of the Remuneration Committee. |
6 | Mr Graham is Chairman of the Audit Committee. |
7 | Mr Lambert was appointed to the Board on 1 December 2006. |
8 | Mr Lytton resigned from the Board on 11 April 2006. |
9 | Dr Jenkins was appointed to the Board on 1 December 2006. |
10 | Mr Smith was Chairman of both the Board and the Nominations Committee until his resignation from the Board on 30 September 2006. |
31
Board and Committee reports
The role of the Board and its committees is described below.
The Board of Directors
The Board currently comprises the Chairman, two Executive Directors and five independent Non-executive Directors. It meets, in person, at least six times a year, with additional meetings as required. The Chairman also meets with the Non-executive Directors without the Executive Directors being present and the Non-executive Directors meet without the Chairman being present. During 2006, the Board met 13 times. Alan Dalby has been identified as the Senior Independent Director. It oversees and approves Acambis’ business and commercial strategy, major transactions, financial statements and operating and capital expenditure budgets, and monitors progress. The information provided to the Board includes strategic and operational reviews, management accounting summaries and specific reports that provide details in respect of the ongoing running of the business. The Executive Directors are fully involved with the management of the Group’s strategic direction. A formal schedule of matters reserved for the Board exists and is available on the Company’s website. The Board is apprised of views of the investment community via biannual independent perception audits and weekly updates on analyst publications. All Directors have access to professional advice and training at the Company’s cost and to the services of the Company Secretary in the furtherance of their duties. The Board ensures that all newly appointed Directors receive a formal induction including, but not limited to, latest analyst reports, shareholder perception reports, Board and Committee minutes, meetings with senior management and internal corporate literature. Led by the Senior Independent Director, the Non-executive Directors meet without the Chairman present at least annually to appraise the Chairman’s performance. The Board delegates the day-to-day responsibility of managing the Group to a number of committees, details of which are set out below. Written terms of reference exist for the Audit, Nominations and Remuneration Committees. These were available during the year and are published on the Company’s website.
Audit Committee
The Audit Committee currently consists of Ross Graham, Dr Randal Chase, Alan Dalby and John Lambert, who are all independent Non-executive Directors, and it is chaired by Ross Graham. It examines and reviews, on behalf of the Board, internal financial controls, financial and accounting policies and practices, the form and content of financial reports and statements, compliance with corporate governance best practice and the appointment and work of the external Auditors. During 2006, Ernst & Young LLP assisted the Company in developing a tax strategy for the Group. The Audit Committee reviews non-audit services provided by the external Auditors on an ongoing basis to ensure that auditor objectivity and independence are safeguarded. In advance of any non-audit service engagements, the Audit Committee reviews whether objectivity and independence may be impaired and where appropriate engages alternative external accountants. The Audit Committee reviews the type of service and fee level in this respect. The policy to ensure that the external Auditors do not provide prohibited services remains in place. The Audit Committee reports to the Board on these matters. The external Auditors, PricewaterhouseCoopers LLP, have provided the Company written assurances under International Standard on Auditing (UK and Ireland) 260 ‘Communication of audit matters with those charged with governance’, that they are independent accountants with respect to the Company, within the meaning of UK regulatory and professional requirements, and that the objectivity of the audit engagement partner and the audit staff is not impaired.
The CEO, the CFO (or Acting CFO) and the external Auditors may be in attendance at meetings. The Audit Committee meets, as a minimum, four times a year and at least once during the year without any Executive Directors present. During 2006, the Audit Committee met six times.
32
Nominations Committee
The Nominations Committee comprises all of the Non-executive Directors and the CEO and is chaired by the Chairman. It has responsibility for proposing to the Board any new appointments of both Executive and Non-executive Directors. The Chairman would not chair the Nominations Committee if it were dealing with the appointment of the successor to the Chairman. The Nominations Committee also reviews succession plans. The Nominations Committee met twice during 2006.
With respect to the process followed to appoint new Directors to the Board, it is the Nominations Committee’s policy to appoint an executive search agency to conduct an international search. The Board provides a role specification. Candidates are selected by the executive search agency, from which a shortlist is prepared. Interviews are conducted by Non-executive and Executive Directors as appropriate. The qualification for recruitment for Board Directors includes a requirement that all Non-executive Directors are free from any relationship with the executive management of the Company that could materially interfere with the exercise of their independent judgement.
The Board considers all current Non-executive Directors to be independent. During 2006 Dr Thomas Monath was a Non-executive Director but was not considered to be independent by virtue of his previous status as an Executive Director.
During 2006, the Nominations Committee oversaw the appointment of Dr Peter Fellner, Dr William Jenkins and John Lambert, and in 2007 the appointment of Ian Garland and Dr Michael Watson.
Remuneration Committee
The Remuneration Committee comprises all of the Non-executive Directors and is chaired by Alan Dalby. It determines, on behalf of the Board, the Group’s policy for executive remuneration and the individual remuneration packages for the Executive Directors and senior management. The CEO may be in attendance at meetings, except when his own remuneration is being considered. The Committee met five times in 2006 and has access to professional advice in the furtherance of its duties. During 2006, The Hay Group assisted the Company in relation to remuneration generally, and specifically in designing and implementing a long-term incentives strategy. The Hay Group does not have any other links with the Company. The CEO and the Company Secretary assisted the Committee in its discussions, except in relation to their own remuneration. The remuneration report is set out on pages 34 to 43. Information on the remuneration of key management personnel is given in note 26 on page 80.
33
Remuneration report
The Principles of Good Governance relating to Directors’ remuneration are described below. The remuneration report relates to the 2006 financial year and subsequent years.
In accordance with the Directors’ Remuneration Report Regulations 2002, a resolution is being put to the Company’s shareholders at this year’s AGM (see page 84) to approve the Remuneration Committee’s report.
Those sections which our Auditors, PricewaterhouseCoopers LLP, have audited have been specifically identified within this report.
Policy on Executive Director remuneration
The Remuneration Committee (whose members and terms of reference are set out on page 33) is aware that it must both attract and retain individuals of the highest calibre. Therefore, it aims to ensure that remuneration packages are competitive with comparable publicly listed companies and that they fairly and responsibly reward individuals for their contribution to the success of the Group, in order to align their interests with those of our shareholders. The Committee considers it to be appropriate that a significant proportion of Directors’ remuneration be performance-related through an annual bonus scheme and longer-term incentives. The performance conditions attached to these components have been structured such that they are specific to Acambis.
Components of Executive Directors’ remuneration
Basic salary and benefits
In determining the basic salary of each Director, the Committee takes into account, and intends to take into account in respect of future financial years, the individual’s responsibilities and any responsibility changes. Pay levels are set in the light of an independent assessment of market practices, by comparison with salary levels in a group of similar-sized biotechnology companies in the UK. For US-based Executive Directors, salary levels in companies of a size similar to Acambis Inc. are also reviewed. The Committee also takes into consideration the percentage increase awarded to all other employees when reviewing the Executive Director salary increases. Basic salaries for Executive Directors are reviewed annually.
Benefits offered to all Executive Directors comprise private healthcare, life assurance, permanent health insurance and private telephone. In addition, Executive Directors may receive a car allowance. In the event that Executive Directors are required to relocate or are assigned outside their home office, certain travel or accommodation benefits may be provided, which the Committee will determine on a case-by-case basis.
Annual bonus
Bonuses are non-pensionable and based on a percentage of basic salary. The maximum annual bonus is 125% of basic salary, up to a maximum of 40% of which will be deferred for three years in the form of Acambis shares under the Acambis 2006 Deferred Bonus Plan. The deferral will be compulsory with no matching and will be lost on resignation or dismissal during the deferral period. This maximum percentage of 125% can only be achieved for significantly outperforming budgeted targets.
Bonuses are paid at the discretion of the Committee in recognition of the Directors’ contributions to the success of the Group. Objectives are set that are considered to be both challenging and realistic. The performance metrics on which bonus payments are assessed are a mix of short-term financial, product development and business development targets. Some of the objectives against which bonuses were measured in 2006 are set out on page 14.
No bonuses were awarded to Executive Directors for the year ended 31 December 2006.
34
Long-term incentives
The Committee principally seeks to incentivise Executive Directors by offering participation in share-based long-term incentive schemes.
Executive Directors currently participate in grants of share options under the Acambis 1995 savings-related share option scheme, the Acambis 2006 Approved Share Option Plan (the ‘Approved Plan’), the Acambis 2006 Unapproved Share Option Plan (the ‘Unapproved Plan’) and the Acambis 2006 Deferred Bonus Plan. Grants made under the Unapproved Plan may be in the form of Share Settled Share Appreciation Rights, which operate in a similar fashion to share options. These plans and the performance conditions that apply to awards under these plans are described in more detail below. Up to and including the 2006 AGM the Group operated the 1996 Approved Share Option Scheme and the Acambis 1999 Share Option Plan.
Details of outstanding awards made under these plans are shown on pages 39 and 40.
The Committee has established a policy that it believes to be balanced whereby Executive Directors can receive an annual grant of options of up to two times basic salary per annum (granted in two half-yearly tranches) and 40% of any bonus will be deferred for three years in the form of Acambis shares under the Acambis 2006 Deferred Bonus Plan.
Up to and including the 2006 AGM the Company operated the LTIP, which was designed to encourage participants to focus their efforts on longer-term growth in shareholder value and to encourage their commitment to remain within the Acambis Group. Details of outstanding awards made under the LTIP are shown in a table on page 41.
The Company continues to operate an HM Revenue and Customs-approved savings-related scheme and an Employee Share Purchase Plan, which are available to all UK and US employees respectively, provided they enter into savings contracts.
General performance conditions for Share Option Plans
Awards made to Executive Directors under the Approved and Unapproved Plans are subject to performance conditions comparing Acambis’ TSR with that of a group of other companies within the industry, as detailed on page 42. The Committee has chosen this group as being the most appropriate for Acambis. The TSR condition seeks to align the interests of Executive Directors with the interests of shareholders by requiring superior relative TSR performance compared with other pharmaceutical and biotechnology companies before options can be exercised. The maximum allocation of shares would be achieved if Acambis were ranked in the upper quartile of the comparator group, being prorated down to a 30% allocation at a ranking at the median. No allocation will be made if Acambis’ ranking falls below the median. The performance condition is measured over a single three-year period.
For the purposes of the TSR calculation, the Company’s TSR and that of the comparator group will be averaged over the three months preceding the commencement of the period and the three months preceding a measurement date to ensure that results are not influenced by short-term volatility. TSR calculations are performed by an independent party.
Awards to Executive Directors under the Approved and Unapproved Plans, and any outstanding awards made since 2003 under historical share option schemes and the LTIP (except for the SAYE scheme) are subject to an additional performance condition that requires the Committee to be satisfied that there has been improvement in the Company’s underlying financial performance over the relevant performance period.
Executive Directors’ share ownership guidelines
From April 2006, the Company has operated a policy to encourage Directors to build and maintain a shareholding of 100% of salary, recognising that fluctuations in share price will cause the actual percentage to vary. It is envisaged that this shareholding will be built up over time through share purchases and through retaining a portion of net gains under the Company’s long-term incentive plans.
Pension scheme
In the UK, the Company operates a self-administered, defined contribution, HM Revenue and Customs-approved pension scheme for the Executive Directors. The Company contributes 18% of basic salary into this scheme on behalf of each Executive Director. No other benefits are pensionable.
In the US, the Group offers a 401k Savings and Retirement Plan for all employees, including Executive Directors based in the US. Participants may contribute up to 15% of their annual compensation into the plan. The Company can make discretionary matching contributions up to a maximum of 3% of basic salary. Pension costs for each Director are shown on page 38.
35
Remuneration report
Directors’ service contracts
Copies of the Directors’ service contracts are available for inspection at the Company’s registered office and for 15 minutes prior to and for the duration of the AGM. Details of the service contracts of those who served as Directors during the year are:
Director | Contract date | Notice period |
Executive: |
|
|
Gordon Cameron1 | 1 March 1997 | 12 months |
David Lawrence2 | 8 July 2004 | 12 months |
Dr Thomas Monath3 | 12 March 2002 | 12 months |
Non-executive: |
|
|
Dr Peter Fellner4 | 6 February 2006 | 3 months |
Dr Randal Chase5 | 1 October 2004 | 3 months |
Alan Dalby | 25 March 1998 | 3 months |
Ross Graham5 | 25 March 2004 | 3 months |
Dr William Jenkins6 | 1 December 2006 | 3 months |
John Lambert6 | 1 December 2006 | 3 months |
Michael Lytton7 | 12 March 2001 | 3 months |
Dr Thomas Monath3 | 23 June 2006 | Fixed-term contract expired 1 September 2006 |
Alan Smith8 | 1 January 1998 | 3 months |
Notes
1 | Mr Cameron will resign from the Board on 1 June 2007. |
2 | Mr Lawrence resigned from the Board on 6 March 2007. |
3 | Dr Monath resigned as an Executive Director on 30 June 2006. He became a Non-Executive Director on 1 July 2006 and resigned from the Board on 1 September 2006. |
4 | Dr Fellner was appointed to the Board on 6 February 2006 and became Chairman of the Board on 1 October 2006. |
5 | Mr Graham and Dr Chase will retire and face re-election as Directors of the Company at the 2007 AGM, being Directors who are retiring by rotation in accordance with the Articles of Association of the Company. |
6 | Dr Jenkins and Mr Lambert were appointed to the Board on 1 December 2006 and will face re-election as Directors of the Company at the 2007 AGM, having been appointed to their roles since the 2006 AGM. |
7 | Mr Lytton resigned from the Board on 11 April 2006. |
8 | Mr Smith resigned from the Board on 30 September 2006. |
Dr Michael Watson was appointed to the Board on 18 January 2007 and took up his position on 26 March 2007. He will face re-election as a Director of the Company at the 2007 AGM, having been appointed to his role since the 2006 AGM. Ian Garland will be appointed to the Board on 1 June 2007.
All Executive Directors have rolling contracts with 12-month notice periods, in line with current best practice. On early termination of contract, an Executive Director would be entitled to basic salary and benefits for the notice period.
The Committee believes that, in the event of early termination of an Executive Director’s contract, it is appropriate to examine the specific circumstances of each case. Where appropriate, the Committee may agree to a phased payment of compensation over a fixed term. During this term, if the Executive Director were to find a new position the principle of mitigation would apply and payments would cease. The Committee does, however, reserve the right to make a payment in lieu of any period of notice.
The Board believes that it is in the Company’s best interest for Executive Directors to serve a minimum three-year term before retiring by rotation.
External appointments
The Committee recognises that Executive Directors may be invited to take up Non-executive directorships or public service appointments and that these can broaden the experience and knowledge of the Director, from which the Company would benefit. Accordingly, subject to Board approval, they may accept Non-executive appointments, as long as these are not likely to lead to a conflict of interest. They are also allowed to retain any fees paid under such appointments. During the year, none of the Executive Directors held other Non-executive positions.
36
Non-executive Directors’ fees and terms
The Non-executive Directors’ fees are determined, and it is intended shall be determined in future financial years, by the Board on the basis of independent advice on current levels payable by similar businesses. Fees are reviewed periodically. Non-executive Directors are not eligible for and do not participate in pensions, incentives, bonuses or any similar payments other than out-of-pocket travel and accommodation costs in connection with the performance of their duties. Non-executive Directors’ fees comprise a basic fee plus an additional fee for chairing a committee. Consideration is given to the time commitment required of Non-executive Directors when setting their fees. Non-executive Directors’ fees are not dependent on specific meeting attendance or linked to the number of hours spent on Group matters.
Non-executive Directors are expected to attend all relevant meetings of the Board, and of any Committees of which they are members. Under the terms of their contracts, Non-executive Directors do not take any part of their fees in the form of Acambis shares. Non-executive Directors are entitled to their fees during any notice period.
The Board believes that it is in the Company’s best interest for Non-executive Directors to serve a minimum three-year term before retiring by rotation. Typically, they are expected to serve two three-year terms, although they may be invited to continue in office for a further period.
Directors’ interests in shares (unaudited)
The Directors who served during the year had the following beneficial interests in the shares of the Company:
| Number of | Number of |
| ordinary 10p | ordinary 10p |
| shares held at | shares held at |
31 December 2006 | 31 December 2005 or | |
| date of appointment | |
|
| if later |
Gordon Cameron1 | 292,413 | 283,442 |
Dr Randal Chase | 10,000 | 10,000 |
Alan Dalby | 5,000 | 5,000 |
Dr Peter Fellner | 14,000 | – |
Ross Graham | 6,128 | 6,128 |
Dr William Jenkins | – | – |
John Lambert | – | – |
David Lawrence2 | 9,900 | 800 |
Michael Lytton3 | 4,700 | 21,789 |
Dr Thomas Monath4 | 10,000 | 70,842 |
Alan Smith5 | 1,800 | 1,800 |
Notes
1 | 5,000 of the shares owned by Mr Cameron are held in trust on his behalf by the Trustees of the Acambis Employees’ Trust (2005 – 40,885 shares). Mr Cameron will resign from the Board on 1 June 2007. |
2 | Mr Lawrence holds 6,600 shares on behalf of certain family members (connected persons). He resigned from the Board on 6 March 2007. |
3 | Mr Lytton resigned from the Board on 11 April 2006. |
4 | Dr Monath resigned from the Board on 1 September 2006. |
5 | Mr Smith resigned from the Board on 30 September 2006. |
Individually, each of the Directors beneficially owns less than 1% of the total issued share capital. As at 31 December 2006, the Directors had no interests in shares of any other Group company. On 20 March 2007, Mr Graham purchased 14,580 shares. Except for these purchases, there have been no changes in the interests of the current Directors in the share capital of the Company since 31 December 2006.
The Executive Directors also have an interest as potential beneficiaries in the 76,001 ordinary shares held at 3 April 2007 by the Trustees of the Acambis Employees’ Trust.
37
Remuneration report
Components of Executive Directors’ remuneration (continued)
Directors’ remuneration (audited)
The total remuneration of the Directors for the year ended 31 December 2006 (shown below) comprised salaries, benefits, bonuses, pension contributions and Non-executive Director fees. During the year, no Directors waived emoluments (2005 – £nil). The remuneration received by each Director who served during the year was as follows:
|
| Basic |
|
|
|
|
| Total |
| Total |
| Pension |
| Pension |
|
| salary/fees8 |
| Benefits9 |
| Bonus |
| 2006 |
| 2005 |
| 2006 |
| 2005 |
Directors |
| £’000 |
| £’000 |
| £’000 |
| £’000 |
| £’000 |
| £’000 |
| £’000 |
Executive: |
|
|
|
|
|
|
|
|
|
|
|
|
|
|
Gordon Cameron1 |
| 374 |
| 7 |
| – |
| 381 |
| 490 |
| 65 |
| 63 |
David Lawrence2 |
| 207 |
| 9 |
| – |
| 216 |
| 267 |
| 35 |
| 34 |
Dr Thomas Monath3 |
| 93 |
| 14 |
| – |
| 107 |
| 238 |
| – |
| 4 |
Total |
| 674 |
| 30 |
| – |
| 704 |
| 995 |
| 100 |
| 101 |
Non-executive: |
|
|
|
|
|
|
|
|
|
|
|
|
|
|
Dr Peter Fellner4 |
| 49 |
| – |
| – |
| 49 |
| – |
| – |
| – |
Dr Randal Chase |
| 36 |
| – |
| – |
| 36 |
| 33 |
| – |
| – |
Alan Dalby |
| 41 |
| – |
| – |
| 41 |
| 37 |
| – |
| – |
Ross Graham |
| 44 |
| – |
| – |
| 44 |
| 37 |
| – |
| – |
Dr William Jenkins5 |
| 3 |
| – |
| – |
| 3 |
| – |
| – |
| – |
John Lambert5 |
| 3 |
| – |
| – |
| 3 |
| – |
| – |
| – |
Michael Lytton6 |
| 20 |
| – |
| – |
| 20 |
| 34 |
| – |
| – |
Dr Thomas Monath3 |
| – |
| – |
| – |
| – |
| – |
| – |
| – |
Alan Smith7 |
| 58 |
| – |
| – |
| 58 |
| 70 |
| – |
| – |
Total |
| 254 |
| – |
| – |
| 254 |
| 211 |
| – |
| – |
Total |
| 928 |
| 30 |
| – |
| 958 |
| 1,206 |
| 100 |
| 101 |
Notes
1 | Mr Cameron will resign from the Board on 1 June 2007. |
2 | Remuneration paid to Mr Lawrence included a benefit valued at £5,000 (2005 – £10,000) in relation to provision by the Group of travel costs and accommodation. He resigned from the Board on 6 March 2007. |
3 | Dr Monath became a Non-executive Director on 1 July 2006 and resigned from the Board on 1 September 2006. Under the terms of his appointment as a Non-executive Director he did not receive any fees. |
4 | Dr Fellner was appointed to the Board on 6 February 2006 and became Chairman on 1 October 2006. |
5 | Dr Jenkins and Mr Lambert were appointed to the Board on 1 December 2006. |
6 | Mr Lytton resigned from the Board on 11 April 2006. |
7 | Mr Smith resigned from the Board on 30 September 2006. |
8 | All Executive Directors, with the exception of Dr Monath, received a car allowance, which is included within ‘basic salary’. |
9 | Benefits offered to all Executive Directors comprise private healthcare, life assurance, permanent health insurance and private telephone. |
38
Directors’ interests in share options and performance conditions (audited)
The Directors who held office during 2006 held options to acquire ordinary shares of the Company under the Acambis 1996 Approved Share Option Scheme (1996 Scheme), the Acambis 1995 Savings-Related Share Option Scheme (SAYE Scheme), the Acambis 1999 Share Option Plan (1999 Plan), the Acambis 2006 Approved Share Option Plan (2006A Plan) and the Acambis 2006 Unapproved Share Option Plan (2006U Plan) as follows:
|
|
|
|
|
|
|
|
|
|
|
|
|
|
|
|
| % performance |
|
|
|
|
|
|
|
|
|
|
|
|
|
|
|
|
|
| condition |
|
|
|
|
|
|
|
|
|
|
|
|
|
| Earliest |
|
|
| met at |
|
|
|
| 1 Jan |
|
|
|
|
| 31 Dec |
| Exercise |
| date of |
| Expiry |
| 31 Dec |
|
Director | Scheme |
| 2006 |
| Granted |
| Lapsed |
| 2006 |
| price £ |
| exercise |
| date |
| 200610 |
|
Gordon Cameron7 | 1996 | 1 | 17,685 |
| – |
| (17,685 | ) | – |
| 1.70 |
| 20 Dec 99 |
| 20 Dec 06 |
| 100% |
|
| 1999 | 2 | 13,911 |
| – |
| – |
| 13,911 |
| 3.33 |
| 31 Dec 04 |
| 31 Dec 11 |
| 100% |
|
| 1999 | 2 | 30,545 |
| – |
| – |
| 30,545 |
| 3.04 |
| 26 Apr 05 |
| 26 Apr 12 |
| 53% |
|
| 1999 | 2 | 39,116 |
| – |
| – |
| 39,116 |
| 2.33 |
| 26 Sep 05 |
| 26 Sep 12 |
| 61% |
|
| 1999 | 3 | 27,469 |
| – |
| – |
| 27,469 |
| 3.23 |
| 14 May 06 |
| 14 May 13 |
| nil |
|
| 1999 | 3 | 32,561 |
| – |
| – |
| 32,561 |
| 2.76 |
| 19 Dec 06 |
| 19 Dec 13 |
| nil |
|
| 1999 | 4 | 43,350 |
| – |
| – |
| 43,350 |
| 3.46 |
| 24 Mar 07 |
| 24 Mar 14 |
| nil |
|
| 1999 | 4 | 60,440 |
| – |
| – |
| 60,440 |
| 2.73 |
| 12 Oct 07 |
| 12 Oct 14 |
| nil |
|
| 1999 | 4 | 78,538 |
| – |
| – |
| 78,538 |
| 2.19 |
| 31 May 08 |
| 31 May 15 |
| nil |
|
| 1999 | 4 | 68,525 |
| – |
| – |
| 68,525 |
| 2.51 |
| 13 Sep 08 |
| 13 Sep 15 |
| nil |
|
| 1999 | 4 | – |
| 183,502 |
| – |
| 183,502 |
| 1.97 |
| 27 Mar 09 |
| 27 Mar 16 |
| nil |
|
| 2006U | 5 | – |
| 233,225 |
| – |
| 233,225 |
| 1.55 |
| 03 Oct 09 |
| 03 Oct 16 |
| nil |
|
| SAYE | 6 | 5,250 |
| – |
| (5,250 | ) | – |
| 1.80 |
| 01 Dec 05 |
| 01 Jun 06 |
| n/a |
|
| SAYE | 6 | 4,651 |
| – |
| (4,651 | ) | – |
| 2.01 |
| 01 Dec 08 |
| 01 Jun 09 |
| n/a |
|
| SAYE | 6 | – |
| 8,008 |
| – |
| 8,008 |
| 1.18 |
| 01 Dec 09 |
| 01 Jun 10 |
| n/a |
|
Total |
|
| 422,041 |
| 424,735 |
| (27,586 | ) | 819,190 |
|
|
|
|
|
|
|
|
|
David Lawrence8 | 1996 | 4 | 10,989 |
| – |
| – |
| 10,989 |
| 2.73 |
| 12 Oct 07 |
| 12 Oct 14 |
| nil |
|
| 1999 | 4 | 117,216 |
| – |
| – |
| 117,216 |
| 2.73 |
| 12 Oct 07 |
| 12 Oct 14 |
| nil |
|
| 1999 | 4 | 42,808 |
| – |
| – |
| 42,808 |
| 2.19 |
| 31 May 08 |
| 31 May 15 |
| nil |
|
| 1999 | 4 | 37,350 |
| – |
| – |
| 37,350 |
| 2.51 |
| 13 Sep 08 |
| 13 Sep 15 |
| nil |
|
| 1999 | 4 | – |
| 100,000 |
| – |
| 100,000 |
| 1.97 |
| 27 Mar 09 |
| 27 Mar 16 |
| nil |
|
| 2006U | 5 | – |
| 127,096 |
| – |
| 127,096 |
| 1.55 |
| 03 Oct 09 |
| 03 Oct 16 |
| nil |
|
| SAYE | 6 | 4,651 |
| – |
| (4,651 | ) | – |
| 2.01 |
| 01 Dec 08 |
| 01 Jun 09 |
| n/a |
|
| SAYE | 6 | – |
| 8,008 |
| – |
| 8,008 |
| 1.18 |
| 01 Dec 09 |
| 01 Jun 10 |
| n/a |
|
Total |
|
| 213,014 |
| 235,104 |
| (4,651 | ) | 443,467 |
|
|
|
|
|
|
|
|
|
Dr Thomas Monath9 | 1999 | 2 | 30,403 |
| – |
| (30,403 | ) | – |
| 3.04 |
| 26 Apr 05 |
| 17 Nov 06 |
| 53% |
|
| 1999 | 2 | 38,575 |
| – |
| (38,575 | ) | – |
| 2.33 |
| 26 Sep 05 |
| 17 Nov 06 |
| 61% |
|
| 1999 | 3 | 26,993 |
| – |
| (26,993 | ) | – |
| 3.23 |
| 14 May 06 |
| 17 Nov 06 |
| nil |
|
| 1999 | 3 | 30,752 |
| – |
| (30,752 | ) | – |
| 2.76 |
| 17 May 06 |
| 17 Nov 06 |
| nil |
|
| 1999 | 4 | 23,470 |
| – |
| (23,470 | ) | – |
| 3.46 |
| 17 May 06 |
| 17 Nov 06 |
| nil |
|
| 1999 | 4 | 31,834 |
| – |
| (31,834 | ) | – |
| 2.73 |
| 17 May 06 |
| 17 Nov 06 |
| nil |
|
| 1999 | 4 | 40,709 |
|
|
| (40,709 | ) | – |
| 2.19 |
| 17 May 06 |
| 17 Nov 06 |
| nil |
|
| 1999 | 4 | 35,995 |
|
|
| (35,995 | ) | – |
| 2.51 |
| 17 May 06 |
| 17 Nov 06 |
| nil |
|
| 1999 | 4 | – |
| 99,925 |
| (99,925 | ) | – |
| 1.97 |
| 17 May 06 |
| 17 Nov 06 |
| nil |
|
Total |
|
| 258,731 |
| 99,925 |
| (358,656 | ) | – |
|
|
|
|
|
|
|
|
|
39
Remuneration report
Components of Executive Directors’ remuneration (continued)
Directors’ interests in share options and performance conditions (continued)
Notes
1 | The performance condition for those options granted under the 1996 Scheme until the end of 2000 is that either: |
| a) | the percentage growth in the Company’s share price over the three years from the date of grant must exceed the percentage growth in the total return for the FTSE All-Share index over that three-year period; or |
| b) | the average percentage share price movements of the Company over each of the three years beginning on a date not earlier than the grant date and ending on the date of exercise must exceed the average movements in the FTSE All-Share Index over each of those three years. |
2 | The performance condition for those options granted under the 1999 Plan compares the Company’s TSR to the TSR of a chosen group of pharmaceutical and biotechnology companies over a three-year period. A median ranking must be achieved before any part of the option may be exercised (50% of the option) and an upper quartile ranking must be achieved for the option to vest in full. This condition, if not initially achieved in full, can be further measured over a four- or five-year period measured from the same fixed-base point. |
3 | The performance condition for these options granted under the 1999 Plan is the same as that outlined in note 2, except that only 30% of the option may be exercised if the Company achieves a median ranking. Performance can only be re-measured once over a four-year period and there is also a requirement before the option can be exercised for the Committee to be satisfied with the Company’s underlying financial performance over the performance period. |
4 | The performance condition for these options granted under the 1996 Scheme and the 1999 Plan is the same as that outlined in note 3, except that the performance is measured only once at the end of the three-year period. |
5 | The performance condition for these options granted under the 2006U Plan is the same as that outlined at note 4 above. |
6 | No performance conditions apply to SAYE options. |
7 | Following Mr Cameron’s notification on 5 March 2007 to the Company of his intended resignation as an Executive Director on 1 June 2007, the Remuneration Committee exercised its discretion to permit vesting of certain of Mr Cameron’s outstanding options in accordance with the 1999 Plan and the 2006U Plan. |
8 | Following Mr Lawrence’s resignation from the Board on 6 March 2007, the Remuneration Committee exercised its discretion to permit vesting of certain of Mr Lawrence’s options in accordance with the 1996 Scheme, the 1999 Plan and the 2006U Plan. |
9 | Following Dr Monath’s notification to the Company on 17 May 2006 of his intended resignation as an Executive Director the Remuneration Committee exercised its discretion to permit vesting of certain of Dr Monath’s outstanding options in accordance with the 1999 Plan. A time apportionment factor was applied to options under the 1999 Plan from the grant date to 17 May 2006 relative to the three-year vesting period. These options vested on 17 May 2006 and were exercisable until 17 November 2006, but none was exercised before the expiry date. |
10 | Data in this column are intended to illustrate the percentage of the awards that would have vested at 31 December 2006 based on the performance conditions applying to those grants. Should the awards have vested at 31 December 2006, a time apportionment factor could also have applied based on the period of time from the date of award to 31 December 2006, where the full three years to vest had not been reached. Data in the performance condition column for Dr Monath illustrate the percentage of awards that vested on 17 May 2006. These data are unaudited. |
All of these options were granted for nil consideration and are held over 10p ordinary shares in the Company. The market value of the options at the time of grant is as detailed in the ‘Exercise price’ column, with the exception of SAYE options, which are granted at 20% below market value. The market price of shares at 31 December 2006 was 103.5p and the range during the year was 94.8p to 229.3p per share
Further information on each of the Company’s share option schemes, including the number of options outstanding, exercise prices and exercise periods, is set out in note 23 to the financial statements.
40
Long-term share incentive plan (audited)
Awards have been made to Executive Directors of the Company under the LTIP1 as follows:
|
|
|
|
|
|
|
|
|
|
|
| % performance | |
|
|
|
|
|
|
|
|
|
|
|
| conditions | |
|
|
|
|
|
|
|
|
|
|
|
|
| met at |
| 1 Jan |
|
|
|
|
|
|
| 31 Dec | Value | Award | Vesting | 31 Dec |
Directors | 2006 |
| Awarded |
| Vested |
| Lapsed |
| 2006 | vested £ | date | date | 200611 |
Gordon Cameron2 | 54,939 | 4 | – |
| – |
| (54,939 | ) | – | – | 14 May 03 | 14 May 06 | n/a |
| 86,704 | 5 | – |
| – |
| – |
| 86,704 | – | 24 Mar 04 | 24 Mar 07 | nil |
| 8,971 | 6 | – |
| (8,971 | ) | – |
| – | 14,511 | 05 Oct 04 | 05 Oct 06 | n/a |
| 1,250 | 7 | – |
| – |
| – |
| 1,250 | – | 27 May 05 | 27 May 07 | n/a |
| 157,077 | 5 | – |
| – |
| – |
| 157,077 | – | 31 May 05 | 31 May 08 | nil |
| – |
| 91,751 | 8 | – |
| – |
| 91,751 | – | 27 Mar 06 | 27 Mar 09 | nil |
Total | 308,941 |
| 91,751 |
| (8,971 | ) | (54,939 | ) | 336,782 | 14,511 |
|
| nil |
David Lawrence3 | 85,616 | 5 |
|
| – |
| – |
| 85,616 | – | 31 May 05 | 31 May 08 | nil |
| – |
| 50,000 | 8 | – |
| – |
| 50,000 | – | 27 Mar 06 | 27 Mar 09 | nil |
Total | 85,616 |
| 50,000 |
| – |
| – |
| 135,616 |
|
|
|
|
Dr Thomas Monath | 53,987 | 4 | – |
| – |
| (53,987 | ) | – | – | 14 May 03 | 14 May 06 | nil |
| 46,943 | 5 | – |
| – |
| (46,943 | ) | – | – | 24 Mar 04 | 24 Mar 07 | nil |
| 2,500 | 10 | – |
| – |
| (2,500 | ) | – | – | 27 May 05 | 27 May 07 | n/a |
| 81,418 | 5,9 | – |
| – |
| (81,418 | ) | – | – | 31 May 05 | 31 May 08 | nil |
| – |
| 49,962 | 8 | – |
| (49,962 | ) | – | – | 27 Mar 06 | 27 Mar 09 | nil |
Total | 184,848 |
| 49,962 |
| – |
| (234,810 | ) | – | – |
|
|
|
Notes
1 | The exercise price for all awards made under the LTIP is £1 in total, for the exercise of any number of shares comprised in an award. All LTIP awards are held over ordinary 10p shares in the Company. Since the 2006 AGM, no further awards under the LTIP have been or will be made. |
2 | Following Mr Cameron’s notification on 5 March 2007 to the Company of his intended resignation as an Executive Director on 1 June 2007, the Remuneration Committee exercised its discretion to permit vesting of certain of Mr Cameron’s outstanding options in accordance with the LTIP. |
3 | Following Mr Lawrence’s resignation from the Board on 6 March 2007 all of his awards under the LTIP lapsed. |
4 | The performance condition for these awards compares the Company’s TSR to the TSR of a chosen group of pharmaceutical and biotechnology companies over a three-year period. A median ranking must be achieved before any part of the award may vest (30% of the award) and an upper quartile ranking must be achieved for the award to vest in full. After three years, vested plan shares may be left in the Trust and participants can then receive a grant of a further one matching share for each four plan shares so deposited. The matching shares will vest provided the participant remains employed and does not withdraw those plan shares for a further two years. The matching award component was not offered after 2003. |
5 | The performance condition for these awards compares the Company’s TSR to the TSR of a chosen group of pharmaceutical and biotechnology companies over a three-year period. A median ranking must be achieved before any part of the award may vest (30% of the award) and an upper quartile ranking must be achieved for the award to vest in full. |
6 | Following the exercise of an LTIP award on 5 October 2004, at which time the share price was 294p per share, Mr Cameron elected to leave 35,885 of those plan shares with the Trust. Under the rules of the plan, Mr Cameron was entitled to receive an additional 8,971 shares, being matching shares for each four plan shares so deposited, so long as he retains those shares in the Trust for a period of two years from the date of award. On 5 October 2006, at which time the share price was 161.75p per share, these awards vested. No performance conditions were attached to those shares. |
7 | Following the exercise of an LTIP award on 27 May 2005, at which time the share price was 219p per share, Mr Cameron elected to leave 5,000 of those plan shares with the Trust. Under the rules of the Plan, Mr Cameron was entitled to receive an additional 1,250 shares, one matching share for each four plan shares so deposited, so long as he retains those shares in the Trust for a period of two years from the date of award. |
8 | These awards were made on 27 March 2006, at which time the share price was 196.75p per share. |
9 | These awards were made on 31 May 2005, at which time the share price was 217.75p per share. |
10 | Following the exercise of an LTIP award on 27 May 2005, at which time the share price was 219p per share, Dr Monath elected to leave 10,000 of those Plan shares with the Trust. Under the rules of the Plan, Dr Monath would have been entitled to receive a grant of a further one matching share for each four plan shares deposited, provided he remained in employment for two years and left the shares on deposit. Dr Monath notified the Company of his intended resignation on 17 May 2006, at which point this entitlement lapsed. |
11 | Data in this column are intended to illustrate the percentage of the awards that would have vested at 31 December 2006 based on the performance conditions applying to those awards. Should the awards have vested at 31 December 2006, a time apportionment factor would also have applied based on the period of time from the date of award to 31 December 2006, where the full three years to vest had not been reached. These data are unaudited. |
41
Remuneration report
Components of Executive Directors’ remuneration (continued)
Gains made by Directors on share options and LTIPs (audited)
The table below shows gains made by individual Directors from the exercise of share options and previously granted LTIPs. The gains are calculated as at the exercise date, although the shares may have been retained.
| 2006 |
| 2005 |
| £’000 |
| £’000 |
Gordon Cameron | 15 |
| 45 |
Dr Thomas Monath | – |
| 45 |
Total gains on share options and LTIPs | 15 |
| 90 |
Acambis’ TSR performance (unaudited)
Acambis’ TSR performance (share price growth plus dividends paid) is compared to a ‘broad equity market index’ comparator group over the past five years, as required by legislation. This comparator group comprises all pharmaceutical and biotechnology companies listed on LSE and AIM with a market capitalisation greater than £60m but excluding Alliance UniChem Plc, AstraZeneca PLC, GSK plc and Shire Pharmaceuticals Group plc. This index has been chosen as the most appropriate form of ‘broad equity market index’ and because Acambis is a constituent of this sector. The composition of companies in this index is reviewed and is subject to change each year. For 2007 these companies are:
AGI Therapeutics plc | GW Pharmaceuticals plc |
Allergy Therapeutics plc | Innovata plc |
Alizyme plc | Oxford BioMedica plc |
Antisoma plc | Prostrakan Group plc |
Ardana plc | Protherics PLC |
ARK Therapeutics Group PLC | Sinclair Pharma plc |
Axis-Shield plc | SkyePharma PLC |
Dechra Pharmaceuticals PLC | Vectura Group PLC |
Goldshield Group PLC | Vernalis Group plc |
The following table details the five-year rebased TSR performance of Acambis and its chosen index.
|
|
|
| Pharmaceuticals |
|
| Acambis |
| & Biotech Index |
31 December 2001 |
| 0 | % | 0% |
31 December 2002 |
| -21 | % | -39% |
31 December 2003 |
| -13 | % | 0% |
31 December 2004 |
| -28 | % | -9% |
31 December 2005 |
| -41 | % | -2% |
31 December 2006 |
| -70 | % | -11% |
42
Total Shareholder Return (TSR)
TSR rebased to 100

On behalf of the Board
Alan Dalby
Non-executive Director and Chairman of the Remuneration Committee
16 April 2007
43
Directors’ responsibilities
Company law requires the Directors to prepare financial statements for each financial year. Under the law the Directors have prepared the Group and Company financial statements in accordance with IFRS as adopted by the European Union. The financial statements are required by law to give a true and fair view of the state of affairs of the Company and the Group and of the profit or loss of the Group for that period.
Financial statements, including adoption of going concern basis
• | After making enquiries, the Directors have a reasonable expectation that the Company and the Group have adequate resources to continue in operational existence for the foreseeable future. For this reason, they continue to adopt the going concern basis in preparing the financial statements. |
• | In preparing the financial statements, the Directors are required to: |
| – | select suitable accounting policies and then apply them consistently; |
| – | make judgements and estimates that are reasonable and prudent; |
| – | state that the financial statements comply with IFRSs as adopted by the EU; and |
| – | prepare the financial statements on the going concern basis unless it is inappropriate to presume that the Group will continue in business. |
• | The Directors are responsible for keeping proper accounting records that disclose with reasonable accuracy at any time the financial position of the Company and the Group and enable them to ensure that the financial statements comply with the Companies Act 1985. They are also responsible for safeguarding the assets of the Company and the Group and hence for taking reasonable steps for the prevention and detection of fraud and other irregularities. |
• | The Directors are responsible for the maintenance and integrity of the Group’s website. The Company notes that UK legislation governing the preparation and dissemination of financial information may differ from that in other jurisdictions. |
By order of the Board
Elizabeth Brown
Company Secretary
16 April 2007
44
Independent Auditors’ report to the members of Acambis plc
We have audited the Group and parent Company financial statements (the ‘‘financial statements’’) of Acambis plc for the year ended 31 December 2006, which comprise the consolidated income statement, consolidated statement of recognised income and expenses, the consolidated and Company balance sheets, the consolidated and Company cash flow statements and the related notes. These financial statements have been prepared under the accounting policies set out therein. We have also audited the information in the Directors’ remuneration report that is described as having been audited.
Respective responsibilities of Directors and Auditors
The Directors’ responsibilities for preparing the Annual Report, the Directors’ remuneration report and the financial statements in accordance with applicable law and IFRS as adopted by the European Union are set out in the statement of Directors’ responsibilities.
Our responsibility is to audit the financial statements and the part of the Directors’ remuneration report to be audited in accordance with relevant legal and regulatory requirements and International Standards on Auditing (UK and Ireland). This report, including the opinion, has been prepared for and only for the Company’s members as a body in accordance with Section 235 of the Companies Act 1985 and for no other purpose. We do not, in giving this opinion, accept or assume responsibility for any other purpose or to any other person to whom this report is shown or into whose hands it may come save where expressly agreed by our prior consent in writing.
We report to you our opinion as to whether the financial statements give a true and fair view and whether the financial statements and the part of the Directors’ remuneration report to be audited have been properly prepared in accordance with the Companies Act 1985 and, as regards the Group financial statements, Article 4 of the IAS Regulation. We also report to you whether, in our opinion, the information given in the Directors’ report is consistent with the financial statements.
In addition, we report to you if, in our opinion, the Company has not kept proper accounting records, if we have not received all the information and explanations we require for our audit or if information specified by law regarding Directors’ remuneration and other transactions is not disclosed.
We review whether the corporate governance statement reflects the Company’s compliance with the nine provisions of the 2003 FRC Combined Code specified for our review by the Listing Rules of the Financial Services Authority, and we report if it does not. We are not required to consider whether the Board’s statements on internal control cover all risks and controls, or form an opinion on the effectiveness of the Group’s corporate governance procedures or its risk and control procedures.
We read other information contained in the Annual Report and consider whether it is consistent with the audited financial statements. The other information comprises only the Directors’ report, the unaudited part of the remuneration report, the corporate governance statement, the Chairman’s review, the strategy statement, the ‘Our R&D pipeline’ section, the business review, the summarised Group statements and the information contained in the borders from the consolidated income statement onwards. We consider the implications for our report if we become aware of any apparent misstatements or material inconsistencies with the financial statements. Our responsibilities do not extend to any other information.
Basis of audit opinion
We conducted our audit in accordance with International Standards on Auditing (UK and Ireland) issued by the Auditing Practices Board. An audit includes examination, on a test basis, of evidence relevant to the amounts and disclosures in the financial statements and the part of the Directors’ remuneration report to be audited. It also includes an assessment of the significant estimates and judgments made by the Directors in the preparation of the financial statements and of whether the accounting policies are appropriate to the Group’s and Company’s circumstances, consistently applied and adequately disclosed.
We planned and performed our audit so as to obtain all the information and explanations that we considered necessary in order to provide us with sufficient evidence to give reasonable assurance that the financial statements and the part of the Directors’ remuneration report to be audited are free from material misstatement, whether caused by fraud or other irregularity or error. In forming our opinion we also evaluated the overall adequacy of the presentation of information in the financial statements and the part of the Directors’ remuneration report to be audited.
Opinion
In our opinion:
• | the Group financial statements give a true and fair view, in accordance with IFRS as adopted by the European Union, of the state of the Group’s affairs as at 31 December 2006 and of its loss and cash flows for the year then ended; |
• | the parent Company financial statements give a true and fair view, in accordance with IFRS as adopted by the European Union as applied in accordance with the provisions of the Companies Act 1985, of the state of the Parent Company’s affairs as at 31 December 2006 and cash flows for the year then ended; |
• | the financial statements and the part of the Directors’ remuneration report to be audited have been properly prepared in accordance with the Companies Act 1985 and, as regards the Group financial statements, Article 4 of the IAS Regulation; and |
• | the information given in the Directors’ report is consistent with the financial statements. |
PricewaterhouseCoopers LLP
Chartered Accountants and Registered Auditors
Cambridge, UK
16 April 2007
45
Consolidated income statement for the year ended 31 December 2006
|
| Notes |
| 2006 |
| 2005 |
| |
Revenue |
| 2 |
| 30.9 |
| 40.9 |
| |
Cost of sales |
|
|
| (14.6 | ) | (27.6 | ) | |
A | Gross profit |
|
|
| 16.3 |
| 13.3 |
|
Research and development costs |
|
|
| (37.0 | ) | (34.1 | ) | |
Sales and marketing costs |
|
|
| (2.6 | ) | (2.6 | ) | |
Administration costs |
| 3 |
| (8.6 | ) | (7.7 | ) | |
Other operating income: |
|
|
|
|
|
|
| |
– Settlement of ARILVAX agreement |
| 3 |
| 10.1 |
| – |
| |
– Profit on sale of business operation |
| 3 |
| 4.6 |
| – |
| |
– Fair value of shares received for grant of licence |
| 3 |
| – |
| 0.4 |
| |
Operating loss |
| 4 |
| (17.2 | ) | (30.7 | ) | |
Finance income |
| 3 |
| 2.0 |
| 4.0 |
| |
Finance costs |
| 3 |
| (0.7 | ) | (1.0 | ) | |
Loss on ordinary activities before taxation |
|
|
| (15.9 | ) | (27.7 | ) | |
Taxation – UK |
| 5 |
| (0.8 | ) | (1.7 | ) | |
Taxation – overseas |
| 5 |
| 0.2 |
| 2.4 |
| |
Loss on ordinary activities after taxation attributable to shareholders |
|
|
| (16.5 | ) | (27.0 | ) | |
Basic loss per ordinary share (in pence) |
| 6 |
| (15.4 | ) | (25.2 | ) | |
Diluted loss per ordinary share (in pence) |
| 6 |
| (15.4 | ) | (25.2 | ) |
A statement of changes in equity is given in note 22.
The accompanying notes are an integral part of this consolidated income statement.
All amounts in 2006 and 2005 arise from continuing operations.
Consolidated statement of recognised income and expenses for the year ended 31 December 2006
| 2006 |
| 2005 |
| |
(Loss)/gain on foreign currency exchange | (1.8 | ) | 1.6 |
| |
Revaluation of available-for-sale investment (net of deferred tax) | – |
| 0.1 |
| |
Foreign currency exchange realised on sale of business operation | (0.1 | ) | – |
| |
Net (expense)/income recognised directly in equity | (1.9 | ) | 1.7 |
| |
Loss for the year | (16.5 | ) | (27.0 | ) | |
Total expense recognised for the year | (18.4 | ) | (25.3 | ) |
| The information contained in this border has not been audited |
| A Gross profit |
46
Consolidated balance sheet at 31 December 2006
|
|
| 2006 |
| 2005 |
|
| Notes |
| £m |
| £m |
|
Assets |
|
|
|
|
|
|
Non-current assets |
|
|
|
|
|
|
Goodwill | 8 |
| 12.4 |
| 14.9 |
|
Other intangible assets | 9 |
| 0.7 |
| 4.2 |
|
Property, plant and equipment | 10 |
| 14.6 |
| 19.8 |
|
Deferred tax asset | 5 |
| – |
| 0.3 |
|
Financial assets: available-for-sale investment | 12 |
| 0.6 |
| 0.6 |
|
|
|
| 28.3 |
| 39.8 |
|
Current assets |
|
|
|
|
|
|
Inventory | 13 |
| 1.5 |
| 3.6 |
|
Current tax assets |
|
| 0.6 |
| 1.3 |
|
Trade and other receivables | 14 |
| 17.5 |
| 20.6 |
|
Financial assets: derivative financial instruments | 15 |
| – |
| 0.1 |
|
Liquid investments | 15 |
| 7.5 |
| 18.8 |
|
Cash and cash equivalents | 16 |
| 26.9 |
| 49.2 |
|
|
|
| 54.0 |
| 93.6 |
|
Liabilities |
|
|
|
|
|
|
Current liabilities |
|
|
|
|
|
|
Financial liabilities: |
|
|
|
|
|
|
– short-term borrowings | 17 |
| (3.6 | ) | (4.0 | ) |
– short-term financial liabilities | 17 |
| (0.1 | ) | (7.2 | ) |
Trade and other payables | 18 |
| (3.2 | ) | (16.1 | ) |
Accruals and deferred income |
|
| (6.6 | ) | (14.1 | ) |
Income tax payable |
|
| (2.1 | ) | (3.1 | ) |
Provisions | 19 |
| – |
| (2.3 | ) |
|
|
| (15.6 | ) | (46.8 | ) |
Net current assets |
|
| 38.4 |
| 46.8 |
|
Non-current liabilities |
|
|
|
|
|
|
Investment in Joint Venture | 20 |
| (0.3 | ) | (0.3 | ) |
Non-current financial liabilities | 17 |
| (1.3 | ) | (1.6 | ) |
Deferred tax liabilities | 5 |
| – |
| (1.7 | ) |
|
|
| (1.6 | ) | (3.6 | ) |
Net assets |
|
| 65.1 |
| 83.0 |
|
Shareholders’ equity |
|
|
|
|
|
|
Share capital | 21 |
| 10.7 |
| 10.7 |
|
Share premium | 22 |
| 98.0 |
| 98.0 |
|
Other reserves | 22 |
| (2.8 | ) | (0.9 | ) |
Retained earnings | 22 |
| (40.8 | ) | (24.8 | ) |
Total shareholders’ equity |
|
| 65.1 |
| 83.0 |
|
The financial statements on pages 46 to 80 were approved by the Board of Directors on 16 April 2007 and were signed on its behalf by Gordon Cameron, Chief Executive Officer.
47
Company balance sheet at 31 December 2006
|
| 2006 |
| 2005 |
| |
A | Notes | £m |
| £m |
| |
Assets |
|
|
|
|
| |
Non-current assets |
|
|
|
|
| |
Investments in subsidiaries | 11 | 58.0 |
| 15.9 |
| |
Amounts owed by subsidiary undertakings |
| – |
| 29.2 |
| |
|
| 58.0 |
| 45.1 |
| |
Current assets |
|
|
|
|
| |
Trade and other receivables | 14 | 0.4 |
| 2.5 |
| |
Amounts owed by subsidiary undertakings |
| 28.0 |
| 17.6 |
| |
Financial assets: derivative financial instruments | 15 | – |
| 0.1 |
| |
Liquid investments | 15 | 7.5 |
| 18.8 |
| |
Cash and cash equivalents | 16 | 24.7 |
| 42.5 |
| |
|
| 60.6 |
| 81.5 |
| |
Liabilities |
|
|
|
|
| |
Current liabilities |
|
|
|
|
| |
Accruals and deferred income |
| (0.6 | ) | (1.1 | ) | |
Income tax payable |
| (0.5 | ) | (2.1 | ) | |
|
| (1.1 | ) | (3.2 | ) | |
Net current assets |
| 59.5 |
| 78.3 |
| |
Net assets |
| 117.5 |
| 123.4 |
| |
Shareholders’ equity |
|
|
|
|
| |
Share capital | 21 | 10.7 |
| 10.7 |
| |
Share premium | 22 | 97.8 |
| 97.8 |
| |
Retained earnings | 22 | 9.0 |
| 14.9 |
| |
Total shareholders’ equity |
| 117.5 |
| 123.4 |
|
The financial statements on pages 46 to 80 were approved by the Board of Directors on 16 April 2007 and were signed on its behalf by Gordon Cameron, Chief Executive Officer.
| The information contained in this border has not been audited | |||
| A Company balance sheet |
|
| |
| The Company information relates to Acambis plc, the holding company that owns the Group’s subsidiaries, the principal ones being Acambis Research Limited in the UK and Acambis Inc. in the US. The Company’s accounts are consolidated with those of the subsidiaries to produce the Group’s accounts. |
| The structure of the principal companies in the Group is as follows: | |
|
|
| 100% Acambis Research Limited 100% Acambis Inc. | |
|
|
| ||
48
Consolidated cash flow statement for the year ended 31 December 2006
|
|
| 2006 |
| 2005 |
| |
| Notes |
| £m |
| £m |
| |
Operating activities |
|
|
|
|
|
| |
Loss on ordinary activities before tax |
|
| (15.9 | ) | (27.7 | ) | |
Depreciation and amortisation |
|
| 3.8 |
| 5.3 |
| |
A | Increase in working capital |
|
| (21.7 | ) | (2.8 | ) |
B | Profit on sale of business operations |
|
| (4.6 | ) | – |
|
Other non-cash movements |
|
| 2.4 |
| (0.7 | ) | |
Net finance costs |
|
| (1.3 | ) | (3.0 | ) | |
Taxes paid |
|
| (1.1 | ) | (0.4 | ) | |
Cash flows used in operating activities |
|
| (38.4 | ) | (29.3 | ) | |
Investing activities |
|
|
|
|
|
| |
Purchase of business operations |
|
| – |
| (1.7 | ) | |
Proceeds from sale of business operation |
|
| 9.0 |
| – |
| |
Purchase of intangibles |
|
| (0.2 | ) | (0.4 | ) | |
Purchase of property, plant and equipment |
|
| (0.9 | ) | (3.7 | ) | |
Proceeds from sale of property, plant and equipment |
|
| 0.5 |
| – |
| |
Cash flows from/(used in) investing activities |
|
| 8.4 |
| (5.8 | ) | |
Financing activities |
|
|
|
|
|
| |
Interest element of finance lease payments |
|
| (0.4 | ) | (0.6 | ) | |
Interest paid |
|
| (0.2 | ) | (0.2 | ) | |
Interest received |
|
| 2.2 |
| 3.8 |
| |
Proceeds from issues of shares |
|
| – |
| 0.2 |
| |
Purchase of own shares | 22 |
| – |
| (0.2 | ) | |
Capital element of finance lease payments |
|
| (6.6 | ) | (3.3 | ) | |
Purchase of liquid investments |
|
| (13.6 | ) | (34.8 | ) | |
Sale of liquid investments |
|
| 24.9 |
| 36.8 |
| |
Cash flows from financing activities |
|
| 6.3 |
| 1.7 |
| |
Decrease in cash and cash equivalents |
|
| (23.7 | ) | (33.4 | ) | |
Net foreign exchange difference |
|
| (2.2 | ) | 1.6 |
| |
Cash and cash equivalents at 1 January | 16 |
| 49.2 |
| 81.0 |
| |
Cash and cash equivalents at 31 December | 16 |
| 23.3 |
| 49.2 |
|
The accompanying notes are an integral part of this consolidated cash flow statement.
| The information contained in this border has not been audited |
| ||||
|
| A Increase in working capital Working capital includes trade payables and the high balance in 2005 is in part due to the invoice payable for the production of 500,000 doses of MVA3000 shipped in the last quarter of 2005. |
|
| B Profit on sale of business operation On sale of the BPC business, Acambis received cash of £9.0m ($17.0m) and sold assets with a total value of £4.5m (see note 3ii). |
|
49
Company cash flow statement for the year ended 31 December 2006
|
|
| 2006 |
| 2005 |
|
| Notes |
| £m |
| £m |
|
Operating activities |
|
|
|
|
|
|
(Loss)/profit on ordinary activities before tax |
|
| (6.2 | ) | 6.9 |
|
Increase in working capital |
|
| (27.6 | ) | (33.0 | ) |
Other non-cash movements |
|
| 7.8 |
| 3.6 |
|
Net finance costs |
|
| (7.2 | ) | (6.3 | ) |
Taxes paid |
|
| (1.3 | ) | (1.7 | ) |
Cash flows used in operating activities |
|
| (34.5 | ) | (30.5 | ) |
Financing activities |
|
|
|
|
|
|
Interest received |
|
| 7.0 |
| 5.8 |
|
Proceeds from issues of shares |
|
| – |
| 0.2 |
|
Purchase of own shares | 22 |
| – |
| (0.2 | ) |
Purchase of liquid investments |
|
| (13.6 | ) | (34.8 | ) |
Sale of liquid investments |
|
| 24.9 |
| 33.8 |
|
Cash flows from financing activities |
|
| 18.3 |
| 4.8 |
|
Decrease in cash and cash equivalents |
|
| (16.2 | ) | (25.7 | ) |
Cash and cash equivalents at 1 January | 16 |
| 42.5 |
| 70.3 |
|
Net foreign exchange difference |
|
| (1.6 | ) | (2.1 | ) |
Cash and cash equivalents at 31 December | 16 |
| 24.7 |
| 42.5 |
|
The accompanying notes are an integral part of this Company cash flow statement. |
50
Notes to the Group financial statements 31 December 2006
1 | ACCOUNTING POLICIES |
Basis of preparation
The consolidated financial statements of Acambis plc have been prepared in accordance with IFRS and International Financial Reporting Interpretations Committee interpretations that have been adopted for use in the European Union, and with those parts of the Companies Act 1985 applicable to companies reporting under IFRS. The consolidated financial statements have been prepared on a historical cost basis as modified by the revaluation of available-for-sale investments, except for derivative financial instruments, which have been measured at fair value. The consolidated financial statements are presented in pounds sterling and all values are rounded to one decimal point of the nearest million (£m) except where otherwise indicated.
The preparation of financial statements in conformity with generally accepted accounting principles requires the use of estimates and assumptions that affect the reported amounts of assets and liabilities at the date of the financial statements and of revenues and expenses during the reporting period. Although these estimates are based on management’s best knowledge of the amount, event or action, actual results may ultimately differ from those estimates.
Basis of consolidation
The Group financial statements include and consolidate the financial statements of Acambis plc and each of its subsidiary undertakings. Acquisitions made by the Group are accounted for under the acquisition method of accounting and the Group financial statements include the results of such subsidiaries from the relevant date of acquisition. Intra-Group transactions and profits are eliminated fully on consolidation.
Revenue
Group revenue comprises the value of sales from products and income (excluding VAT and taxes, trade discounts and intra-Group transactions) derived from contract research fees and licence fees receivable from third parties in the normal course of business. Revenue from product sales is recognised when, amongst other criteria, the risks and rewards of ownership have been transferred to the customer. The Group applies the criteria set out in IAS18 ‘Revenue’ in determining whether revenue may be recognised on bill-and-hold transactions entered into by the Group. Where the Group is required to undertake R&D activities any associated revenue is deferred and recognised over the period over which the services are performed. Contract research fees are recognised in the accounting period in which the related work is carried out. Milestones receivable are recognised when they fall contractually due.
Profit is recognised on long-term contracts when the final outcome can be assessed with reasonable certainty by including turnover and related costs within the income statement as contract activity progresses. Revenue is recognised according to the extent of performance under the contract. In determining the degree of contractual performance, reference is made to the costs incurred in relation to the total estimated expected costs, as costs incurred are a fair reflection of the services performed to date.
The ACAM2000 smallpox vaccine contract with the CDC, awarded to Acambis in November 2001, is a fixed-fee arrangement requiring the delivery of products as well as a concurrent R&D programme. The two transactions are linked in such a way that the commercial effect cannot be understood without reference to the series of transactions as a whole. In accordance with IAS18, this arrangement has, therefore, been treated as a single long-term contract, whose elements have not been accounted for separately.
Revenue and profits are recognised according to the extent of performance under the contract, as described above. Manufacturing costs in respect of this contract are deemed to be incurred when the risks and rewards of ownership have been transferred, as described above; R&D costs are recognised as incurred.
51
Notes to the Group financial statements 31 December 2006
1 | ACCOUNTING POLICIES (CONTINUED) |
Cost of sales
The Group has classified manufacturing costs and costs that are directly attributable to funded research and vaccine manufacture as cost of sales.
Research and development costs
Research costs are expensed as incurred. Internally generated expenditure arising from development (or from the development phase of an internal project) is capitalised if, and only if, it satisfies all of six specified criteria in IAS38 ‘Intangible assets’. It is management’s opinion that it is not possible to satisfy the requirement to demonstrate the technical feasibility of a project, and that it will generate probable future economic benefits, until final regulatory approval has been obtained.
Share-based payment transactions
Employees (including Directors) of the Group may receive some remuneration in the form of share-based payment transactions, whereby employees render services in exchange for shares or rights over shares (equity-settled transactions).
The cost of equity-settled transactions with employees is measured by reference to the fair value at the date at which they are granted. Fair value is determined in conjunction with an external valuer, using a binomial option pricing model for the SAYE Scheme and the ESPP. The fair value of awards made under the 1996 Acambis Share Option Scheme, the 1999 Acambis Share Option Plan, the LTIP, the Acambis 2006 Approved Share Option Plan and the Acambis 2006 Unapproved Share Option Plan is measured using a binomial option pricing model adjusted to reflect the TSR market-based performance condition. For all options and awards with a TSR market-based performance condition, the pricing model used follows similar principles to the Monte Carlo approach to value the award and takes into account the fact that TSR vesting and share price performance are not independent.
The cost of equity-settled transactions is recognised, together with a corresponding increase in equity, over the period in which the performance conditions are fulfilled, ending on the date on which the relevant employees become fully entitled to the award (vesting date). The cumulative expense recognised for equity-settled transactions at each reporting date until the vesting date reflects the extent to which the vesting period has expired and the number of awards that, in the opinion of the Directors, will ultimately vest. The cost is allocated to R&D costs, sales and marketing costs and administration costs on the basis of headcount.
No expense is recognised for awards that do not ultimately vest, except for awards where vesting is conditional upon a market condition. These are treated as vesting, irrespective of whether or not the market condition is satisfied, provided that all other performance conditions are satisfied.
In a profitable year, the dilutive effect of outstanding options is reflected as additional share dilution in the computation of earnings per share. The Group has an employee share incentive plan and an employee share trust for the granting of non-transferable options to Directors and senior employees. Shares in the Group held by the employee share trust are treated as treasury shares and presented in the balance sheet as a deduction from equity.
The Group has taken advantage of the transitional provisions of IFRS2 ‘Share-based payments’ in respect of equity-settled awards and has applied IFRS2 only to equity-settled awards granted after 7 November 2002 that had not vested on 31 December 2004.
In the Company accounts, the granting of options to employees of subsidiaries is deemed a capital contribution.
Taxation
The tax expense represents the sum of the tax currently payable and deferred tax, including UK corporation tax and foreign tax.
The tax currently payable is based on taxable profit for the year. Taxable profit differs from net profit as reported in the income statement because it excludes items of income or expense that are taxable or deductible in other years and it further excludes items that are never taxable or deductible. The Group’s liability for current tax is calculated using tax rates that have been enacted or substantially enacted by the balance sheet date.
52
1 | ACCOUNTING POLICIES (CONTINUED) |
Taxation (continued)
Deferred income tax is provided, using the liability method, on all temporary differences at the balance sheet date between the tax bases of assets and liabilities and their carrying amounts for financial reporting purposes.
Deferred income tax assets and liabilities are recognised for all deductible temporary differences and carry-forward of unused tax losses, to the extent that it is probable that taxable profit will be available against which the deductible temporary differences and carry-forward of unused tax losses can be utilised:
| • | except where the deferred income tax asset or liability relating to the deductible temporary difference arises from the initial recognition of an asset or liability in a transaction that is not a business combination and, at the time of the transaction, affects neither the accounting profit nor taxable profit or loss; and |
| • | in respect of deductible temporary differences associated with investments in subsidiaries and interests in joint ventures, deferred tax assets or liabilities are only recognised to the extent that it is probable that the temporary differences will reverse in the foreseeable future and taxable profit will be available against which the temporary difference can be utilised. |
In the UK and the US, the Group is entitled to a tax deduction for the amount treated as compensation on exercise of certain employee share options under each jurisdiction’s tax rules. As explained under ‘Share-based payment transactions’ above, a compensation expense is recorded in the Group’s income statement over the period from the grant date to the vesting date of the relevant options. As there is a temporary difference between the accounting and tax bases, a deferred tax asset is recorded. The deferred tax asset arising is calculated by comparing the estimated amount of tax deduction to be obtained in the future (based on the Company’s share price at the balance sheet date) with the cumulative amount of the compensation expense recorded in the income statement. If the amount of estimated future tax deduction exceeds the cumulative amount of the remuneration expense at the statutory tax rate, the excess is recorded directly in equity, against the profit and loss reserve.
Under the transitional provisions of IFRS2, no compensation charge is recorded in respect of options granted before 7 November 2002 or in respect of those options that have been exercised or have lapsed before 31 December 2004. Nevertheless, tax deductions have arisen and will continue to arise on these options. The tax effects arising in relation to these options are recorded directly in equity, against the profit and loss reserve.
The carrying amount of deferred income tax assets is reviewed at each balance sheet date and reduced to the extent that it is no longer probable that sufficient taxable profit will be available to allow all or part of the deferred income tax asset to be utilised.
Deferred income tax assets and liabilities are measured at the tax rates that apply to the period when the asset is realised or the liability is settled, based on tax rates (and tax laws) that have been enacted or substantially enacted at the balance sheet date. Income tax relating to items recognised directly in equity is recognised in equity and not in the income statement.
Goodwill
Goodwill on acquisition is initially measured at cost, being the excess of the cost of the business combination over the acquirer’s interest in the net fair value of the identifiable assets, liabilities and contingent liabilities. The fair value of the consideration is determined by applying appropriate discounts to contingent and deferred consideration, to the level where the Group considers those liabilities will be payable. Where the consideration for the acquisition of a business includes non-interest bearing cash payments due after more than one year, the liability is recorded at its present value, after applying a discount rate that approximates to that which a lender would typically require for a similar transaction, and taking into account the risk/likelihood of the payment being made.
Where revisions are made to the expected amounts of contingent consideration payable as a result of changes to estimates, such changes are accounted for at the date of the change in estimate.
Following initial recognition, goodwill is not amortised but is measured at cost less any accumulated impairment losses. Goodwill is reviewed for impairment annually or more frequently if events or changes in circumstances indicate that the carrying value may be impaired.
Intangible assets
Separately identifiable acquired intangible assets are capitalised at cost except for those acquired from a business acquisition, which are capitalised at fair value as at the date of acquisition. Following initial recognition, the cost model is applied. The useful lives of these intangible assets are assessed to be either finite or indefinite. Where amortisation is charged on assets with finite lives, this expense is taken to the income statement. In the case of assets acquired relating to BPC this was through the ‘Cost of sales’ line item until the sale of trade and assets of BPC in September 2006.
53
Notes to the Group financial statements 31 December 2006
1 | ACCOUNTING POLICIES (CONTINUED) |
Intangible assets (continued)
Intangible assets are tested for impairment when a trigger event occurs. Useful lives are also examined on an annual basis and adjustments, where applicable, are made on a prospective basis. Useful lives are as follows:
| • | Distribution contract – 88 months |
| • | Software assets – three years |
| • | R&D technology – variable, depending on technology. |
Property, plant and equipment
Property, plant and equipment is stated at cost less accumulated depreciation and any impairment in value. Land and assets under construction are not depreciated. Depreciation is calculated on a straight-line basis over the estimated useful life of the asset as follows:
| • | Freehold buildings – 39 years |
| • | Leasehold buildings – 15 years or term of lease if shorter |
| • | Laboratory and manufacturing equipment – four to seven years |
| • | Office equipment – three to five years. |
The carrying values of property, plant and equipment are reviewed for impairment when events or changes in circumstances indicate the carrying value may not be recoverable. If any such indication exists and where the carrying values exceed the estimated recoverable amount, the assets or cash-generating units are written down to their recoverable amount. The recoverable amount of property, plant and equipment is the greater of net selling price and value in use. In assessing value in use, the estimated future cash flows are discounted to their present value using a pre-tax discount rate that reflects current market assessments of the time value of money and the risks specific to the asset. For an asset that does not generate largely independent cash inflows, the recoverable amount is determined for the cash-generating unit to which the asset belongs. Impairment losses are recognised in the income statement.
An item of property, plant and equipment is de-recognised upon disposal or when no future economic benefits are expected to arise from the continued use of the asset. Any gain or loss arising on de-recognition of the asset (calculated as the difference between the net disposal proceeds and the carrying amount of the item) is included in the income statement in the year the item is de-recognised.
The Group does not capitalise interest charges on loans to fund the purchase of tangible fixed assets.
Investments
Investments in subsidiaries are shown at cost less any provision for impairment. Available-for-sale investments are recorded at fair value. Unrealised holding gains and any temporary unrealised holding losses after the initial recognition are reflected through reserves, net of related taxes. Impairment losses and realised gains and losses are reported in the income statement.
Investments in joint ventures
Investments in joint ventures are carried in the balance sheet at cost as adjusted by post-acquisition changes in the Group’s share of the net assets of the joint ventures, less any impairment in the value of the individual investments. The Group’s share of net profits and losses of joint ventures is included in the income statement net of interest and tax.
Inventories, excluding long-term contracts
Inventories are valued at the lower of cost and net realisable value.
Costs incurred in bringing each product to its present location and condition are accounted for as follows:
| Raw materials | – purchase cost on a first-in, first-out basis |
| Finished goods and work-in-progress | – cost of direct materials and labour and a proportion of manufacturing overheads based on normal operating capacity but excluding borrowing costs. |
Net realisable value is the estimated selling price in the ordinary course of business, less estimated costs of completion and the estimated costs necessary to make the sale.
54
1 | ACCOUNTING POLICIES (CONTINUED) |
Financial instruments
From time to time, the Group uses derivative financial instruments in the form of sterling and foreign currency contracts to hedge its risks associated with foreign currency fluctuations and those in the form of yield-enhancing deposits to maximise interest rates. Such derivative financial instruments are stated at fair value with movements in fair value recorded in the income statement. The fair value of forward exchange contracts is calculated by reference to current forward exchange rates for contracts with similar maturity profiles.
The Group makes certain deposits in foreign currencies for fixed terms (dual currency deposits), which, at the option of the bank, mature in that foreign currency or are converted to another currency at a pre-agreed exchange rate. The Group considers that such arrangements contain an embedded derivative element, which is separated from the host contract and accounted for as a derivative financial instrument under IAS39 ‘Recognition and measurement of financial instruments’. This is initially stated in the balance sheet at cost. After initial recognition, it is measured at fair value with movements in fair value recorded in the income statement. A gain or loss arising from a change in the fair value of a financial asset or financial liability classified as at fair value through the profit or loss account is recognised in the income statements.
Cash and cash equivalents
Cash and cash equivalents comprise cash at bank and in hand and short-term deposits with an original maturity of three months or less. Bank overdrafts are shown within current liabilities on the balance sheet.
Borrowing costs
Borrowing costs are recognised as an expense when incurred.
Leases
Finance leases, which transfer to the Group the risks and benefits incidental to ownership of the leased item, are capitalised at the inception of the lease at the fair value of the leased property or, if lower, at the present value of the minimum lease payments. Lease payments are apportioned between the finance charges and reduction of the lease liability so as to achieve a constant rate of interest on the remaining balance of the liability. Finance charges are charged directly against income.
Where the Group enters into transactions which meet the criteria for a sale and finance leaseback, the difference between the sale price of the asset and its previous carrying value is deferred and amortised over the lease term.
Capitalised leased assets are depreciated over the shorter of the estimated useful life of the asset or the lease term. Leases where the lessor retains the risks and benefits of ownership of the asset are classified as operating leases.
Operating lease payments are recognised as an expense in the income statement on a straight-line basis over the lease term.
Provisions
Provisions are recognised when the Group has a present obligation (legal or constructive) as a result of a past event, it is probable that costs will be required to be incurred to settle the obligation and a reliable estimate can be made of the amount of the obligation.
Foreign currency and translation
Transactions denominated in foreign currencies are recorded in the functional currency of the Group entity at actual exchange rates as at the date of the transaction. Monetary assets and liabilities denominated in foreign currencies are translated at the rates ruling at the balance sheet date. All differences are taken to the income statement except where financing of a foreign subsidiary through long-term loans and deferred trading balances is intended to be as permanent as equity. Such loans and inter-company balances are treated as part of the net investment and, as such, any exchange differences arising are dealt with as adjustments to reserves.
Assets and liabilities of overseas subsidiary and joint venture undertakings are translated into sterling at rates of exchange ruling at the balance sheet date. The results and cash flows of overseas subsidiary and joint venture undertakings are translated into sterling using average rates of exchange. Exchange adjustments arising when the opening net assets and the profits for the year retained by overseas subsidiary and joint venture undertakings are translated into sterling are taken directly to equity. On disposal of a foreign entity, accumulated exchange differences are recognised in the income statement as a component of the gain or loss on disposal.
Goodwill and fair value adjustments arising on the acquisition of a foreign entity are treated as assets and liabilities of the acquiring company and are recorded at the exchange rate at the date of the transaction.
55
Notes to the Group financial statements 31 December 2006
1 | ACCOUNTING POLICIES (CONTINUED) |
| ESOP trust |
The Company recognises the assets and liabilities of the ESOP trust in its own accounts and shares held by the trust are recorded at cost as a deduction in arriving at shareholders’ funds until such time as the shares vest unconditionally to employees. The trust is a separately administered trust, funded by loans from the Company, whose assets comprise shares in the Company.
Future pronouncements
At the date of approval of these financial statements the following standards and interpretations which have not been applied in these financial statements were in issue but not yet effective:
| • | IFRIC8 ‘Scope of IFRS2’, requiring that, if the identifiable consideration given appears to be less than the fair value of the equity instruments granted or liability incurred, IFRS2 will apply as there is unidentifiable consideration which has been or will be received; | |
| • | IFRIC10 ‘Interim reporting and impairment’, requiring that any impairment recognised in a previous interim period in respect of goodwill or investment in either an equity instrument of a financial asset should not be reversed; | |
| • | An amendment to IAS1 ‘Presentation of financial statements’, requiring that qualitative and quantitative information be presented; |
| • | IFRS7 ‘Financial instruments: Disclosures’, which replaces IAS30 ‘Disclosures in the financial statements of banks and similar institutions’, and the disclosure requirements of IAS32 ‘Financial instruments: disclosure and presentation’, and locates in one place all disclosures relating to financial instruments. The new requirements incorporate many of IAS32’s disclosures as well as additional qualitative and quantitative disclosures on the risks arising from financial instruments; | |
| • | IFRIC9 ‘Reassessment of embedded derivatives’, requiring that management should only assess whether an embedded derivative is required to be separated from the host contract when the entity becomes party to the contract unless there is a change in the terms of the contract that significantly modifies the cash flows that otherwise would be required under the contract, in which case reassessment is required. IFRIC9 is not relevant to the Group’s operations. |
The Directors believe the adoption of these standards and interpretations in future periods will have no material impact on the financial statements when they come into effect for periods after 1 January 2007.
At the date of approval of these financial statements the following interpretation, which has not been applied in these financial statements as it is not relevant to the Group’s operations, was in issue but not yet effective:
| • | IFRIC7 ‘Applying the restatement approach under IAS29 “Financial reporting in hyperinflationary economies” ’, requiring prior period financial statements to be restated as if the entity had always applied IAS29. As none of the Group’s entities has a currency of a hyperinflationary economy as its functional currency, IFRIC7 is not relevant to the Group’s operations. |
56
2 | SEGMENTAL INFORMATION |
The Group’s primary reporting format is business segments and its secondary format is geographic segments. At 31 December 2006, the Group is organised on a worldwide basis in one business segment of vaccines and into two geographical areas of Europe and North America. Transfer prices between segments are set on an arm’s length basis in a manner similar to transactions with third parties. The Group’s geographical segments are determined by location of operations.
Geographical segment
The following table presents revenue and certain asset and capital expenditure information regarding the Group’s geographic segments.
|
|
|
|
| Europe |
| North America |
| Total Group |
| ||||
|
|
| 2006 |
| 2005 |
| 2006 |
| 2005 |
| 2006 |
| 2005 |
|
|
|
| £m |
| £m |
| £m |
| £m |
| £m |
| £m |
|
| Revenue: |
|
|
|
|
|
|
|
|
|
|
|
|
|
| Sales to external customers |
| 1.4 |
| 1.8 |
| 29.5 |
| 39.1 |
| 30.9 |
| 40.9 |
|
| Other segment information: |
|
|
|
|
|
|
|
|
|
|
|
|
|
A | Total assets |
| 46.7 |
| 79.3 |
| 35.6 |
| 54.1 |
| 82.3 |
| 133.4 |
|
| Total assets |
| 46.7 |
| 79.3 |
| 35.6 |
| 54.1 |
| 82.3 |
| 133.4 |
|
| Capital additions: |
|
|
|
|
|
|
|
|
|
|
|
|
|
| Tangible fixed assets |
| – |
| – |
| 0.9 |
| 5.2 |
| 0.9 |
| 5.2 |
|
| Intangible assets |
| – |
| – |
| 0.2 |
| 0.6 |
| 0.2 |
| 0.6 |
|
The Company’s business is to invest in its subsidiaries and, therefore, it operates as a single segment.
The information contained in this border has not been audited
A | Total assets |
| This analysis shows the total of non-current assets and current assets split between the Group’s operations in the UK and the US.
|
57
Notes to the Group financial statements 31 December 2006
3 | INCOME AND EXPENSES |
i) Administration costs
|
|
| 2006 |
| 2005 |
|
|
|
| £m |
| £m |
|
| Administration costs |
| 7.0 |
| 5.4 |
|
| Legal costs |
| 1.6 |
| 2.3 |
|
| Total administration costs |
| 8.6 |
| 7.7 |
|
Legal costs represent costs in defending the IP litigation brought against Acambis by Bavarian Nordic.
ii) Other operating income
Settlement of ARILVAX agreement
In September 2006, Novartis agreed to pay Acambis $19.0m (£10.1m) in cash to settle a dispute relating to the ARILVAX yellow fever vaccine. This dispute arose under an agreement that had been established in 1999 and resulted from non-performance by predecessor companies acquired by Novartis. Acambis had US sales rights to the vaccine and had previously completed Phase 3 clinical trials with a view to applying for US licensure.
Under the settlement agreement, Novartis paid $19.0m (£10.1m) in September 2006 to compensate Acambis. In addition, Novartis has granted Acambis an exclusive option to negotiate a licence to the worldwide rights to the ARILVAX product from Novartis. As a result of reaching the settlement with Novartis, an amount relating to the ARILVAX programme of £1.2m (2005 – £nil) was credited to R&D costs.
Profit on sale of business operation
In September 2006, Acambis sold the trade and assets of BPC to Crucell, as BPC was no longer a strategic asset for Acambis following the termination of the ARILVAX licensing agreement. The sale agreement and consequential termination of the product distribution agreement between BPC and Crucell resulted in Acambis receiving cash proceeds of $17.0m (£9.0m). Profit on disposal arose as follows:
|
| £m |
|
| Net assets disposed of: |
|
|
| Goodwill | (2.4 | ) |
| Intangible assets | (2.7 | ) |
| Fixed assets and working capital | (0.6 | ) |
| Deferred tax liability | 1.2 |
|
| Total | (4.5 | ) |
| Proceeds | 9.0 |
|
| Foreign exchange gain previously recognised through reserves | 0.1 |
|
| Profit on disposal | 4.6 |
|
Fair value of shares received
In May 2005, the Group sold information and rights of a previous R&D project in exchange for shares, valued at £0.4m at the time. The shares are held on the balance sheet as a financial asset (see note 12).
58
3 | INCOME AND EXPENSES (CONTINUED) |
iii) Finance income
|
|
| 2006 |
| 2005 |
|
|
|
| £m |
| £m |
|
| Unwinding of discounts in relation to deferred debtors |
| – |
| 0.2 |
|
| Interest receivable |
| 2.0 |
| 3.8 |
|
| Total finance income |
| 2.0 |
| 4.0 |
|
iv) Finance costs
|
|
| 2006 |
| 2005 |
|
|
|
| £m |
| £m |
|
| On bank overdrafts |
| 0.2 |
| 0.2 |
|
| Interest element of finance leases |
| 0.5 |
| 0.6 |
|
| Unwinding of discounts in relation to contingent and deferred consideration |
| – |
| 0.2 |
|
| Total finance costs |
| 0.7 |
| 1.0 |
|
v) Staff costs
|
|
| 2006 |
| 2005 |
|
|
|
| £m |
| £m |
|
| Wages and salaries |
| 14.5 |
| 14.4 |
|
| Social security costs |
| 1.1 |
| 1.1 |
|
| Other pension and 401k costs |
| 0.5 |
| 0.4 |
|
| Cost of share-based payments |
| 0.5 |
| 0.8 |
|
| Total employee benefits |
| 16.6 |
| 16.7 |
|
The average monthly number of employees during the year (including Executive Directors) was:
|
|
|
|
|
|
|
|
|
|
|
|
|
| UK |
| US |
| 2006 |
| 2005 |
|
|
|
| Number |
| Number |
| Number |
| Number |
|
| Research and development |
| 6 |
| 109 |
| 115 |
| 101 |
|
| Sales and marketing |
| 3 |
| 14 |
| 17 |
| 22 |
|
| Manufacturing |
| – |
| 77 |
| 77 |
| 90 |
|
| Administration |
| 21 |
| 55 |
| 76 |
| 62 |
|
|
|
| 30 |
| 255 |
| 285 |
| 275 |
|
At 31 December 2006, the Group had 263 employees (2005 – 285) and the Company had two employees, both of whom were Directors (2005 – three). The staff costs for the Company are shown in the remuneration report.
59
Notes to the Group financial statements 31 December 2006
4 | OPERATING LOSS |
The following items are included in operating loss:
|
|
| 2006 |
| 2005 |
|
|
|
| £m |
| £m |
|
| Depreciation of fixed assets: |
|
|
|
|
|
| – owned |
| 2.9 |
| 3.1 |
|
| – held under finance leases |
| 0.3 |
| 1.9 |
|
A | Cost of share-based payments (note 23) |
| 0.5 |
| 0.8 |
|
| Operating lease charges for plant and equipment |
| 0.1 |
| 0.1 |
|
| Operating lease charges for property |
| 2.2 |
| 2.2 |
|
| Loss on disposal of fixed assets |
| – |
| 0.1 |
|
| Repairs and maintenance costs for property, plant and equipment |
| 0.4 |
| 0.5 |
|
| Exchange (gain)/loss on foreign currency borrowings |
| (0.4 | ) | 0.4 |
|
| Cost of inventories recognised as expenses |
| 3.7 |
| 3.0 |
|
| Amortisation of intangibles in cost of sales |
| 0.5 |
| 0.7 |
|
| Amortisation of intangibles in operating expenses |
| 0.1 |
| 0.2 |
|
During the year the Group (including its overseas subsidiaries) obtained the following services from the Company’s auditor and its associates:
|
|
| 2006 |
| 2005 |
|
|
|
| £m |
| £m |
|
| Fees payable to Company’s auditors for the audit of parent company and consolidated financial statements |
| 0.1 |
| 0.2 |
|
| Fees payable to Company’s auditor and its associates for other services: |
|
|
|
|
|
| – Other services supplied pursuant to legislation |
| 0.2 |
| – |
|
| – Services relating to taxation |
| 0.2 |
| 0.2 |
|
| – Services relating to corporate finance transactions entered into or proposed to be entered into by or on |
|
|
|
|
|
| behalf of the Company or any or its associates |
| 0.7 |
| 0.1 |
|
|
|
| 1.2 |
| 0.5 |
|
| The information contained in this border has not been audited |
| A Cost of share-based payments |
60
5 | INCOME TAX |
Tax is charged on profits made in the country where each Group company is based. Major components of income tax expense for the year are as follows:
|
|
| 2006 |
| 2005 |
|
| Analysis of charge/(credit) in the consolidated income statement |
| £m |
| £m |
|
| Current income tax |
| 0.5 |
| (0.3 | ) |
| Deferred taxation |
| 0.1 |
| (0.4 | ) |
| Income tax expense/(benefit) in the consolidated income statement |
| 0.6 |
| (0.7 | ) |
|
|
|
|
|
|
|
| Tax on items charged to equity |
|
|
|
|
|
| Deferred tax on revaluation of available-for-sale investment |
| – |
| 0.1 |
|
| Income tax expense reported in equity |
| – |
| 0.1 |
|
A reconciliation of income tax expense applicable to accounting loss before tax at the statutory income tax rate to total taxation for the Group is as follows:
|
|
| 2006 |
| 2005 |
|
|
|
| £m |
| £m |
|
| Loss before tax |
| (15.9 | ) | (27.7 | ) |
| At the standard rate of corporation tax in the UK of 30% (2005 – 30%) |
| (4.8 | ) | (8.3 | ) |
| Effects of: |
|
|
|
|
|
| Utilisation of tax losses |
| (1.3 | ) | (2.9 | ) |
| Losses carried forward |
| 4.6 |
| 13.7 |
|
| Expenses not deductible for tax purposes |
| 1.3 |
| 0.2 |
|
| Adjustments in respect of foreign tax rates |
| 0.2 |
| (3.5 | ) |
| Other timing differences |
| (0.2 | ) | (0.5 | ) |
| Adjustments to tax in respect of prior period |
| 0.8 |
| 0.6 |
|
| Total taxation |
| 0.6 |
| (0.7 | ) |
Movements in the deferred tax account are as follows:
|
| Deferred tax asset |
| Deferred tax liability |
| ||||
|
| 2006 |
| 2005 |
| 2006 |
| 2005 |
|
|
| £m |
| £m |
| £m |
| £m |
|
| At 1 January | 0.3 |
| – |
| (1.7 | ) | (1.7 | ) |
| (Charge)/credit to income statement | (0.3 | ) | 0.3 |
| 0.2 |
| 0.1 |
|
| Exchange differences | – |
| – |
| 0.3 |
| – |
|
| Charge to equity | – |
| – |
| – |
| (0.1 | ) |
A | Disposed liability | – |
| – |
| 1.2 |
| – |
|
| At 31 December | – |
| 0.3 |
| – |
| (1.7 | ) |
The Company has no deferred tax balances.
No deferred tax is recognised on the unremitted earnings of overseas subsidiaries and joint ventures. The Directors have determined that, as earnings are continually reinvested by the Group, undistributed earnings of the subsidiaries and joint ventures will not be distributed in the foreseeable future.
Deferred tax assets and liabilities are only offset where there is a legally enforceable right of offset and there is an intention to settle the balances net. No balances have been offset in the current or previous years.
| The information contained in this border has not been audited |
|
| A Disposed liability |
|
61
Notes to the Group financial statements 31 December 2006
5 | INCOME TAX (CONTINUED) | |||||
Unrecognised deferred tax assets | ||||||
|
|
| 2006 |
| 2005 |
|
|
|
| £m |
| £m |
|
| Tax losses |
| 14.7 |
| 7.9 |
|
| R&D tax credit |
| 2.1 |
| 0.7 |
|
| Short-term timing differences |
| (0.7 | ) | (0.6 | ) |
| Other |
| 0.3 |
| 0.4 |
|
| At 31 December |
| 16.4 |
| 8.4 |
|
Deferred tax assets have not been recognised in respect of tax losses because there is insufficient probability that they will be recoverable in the foreseeable future. | |
6 | EARNINGS PER ORDINARY SHARE (BASIC AND FULLY DILUTED) |
Basic EPS is calculated by dividing the earnings attributable to ordinary shareholders by the weighted average number of ordinary shares in issue during the year, excluding those held in the employee share trust (see note 22), which are treated as cancelled until the shares vest unconditionally with the employees.
For fully diluted EPS, the weighted average number of ordinary shares in issue is adjusted to assume conversion of dilutive potential ordinary shares. The Group’s potentially dilutive securities consist of share options and performance shares. As the Group is loss-making, none of the potentially dilutive securities are currently dilutive.
For basic and diluted EPS, the weighted average numbers of shares used in the calculations are set out below:
|
|
|
| 2006 |
|
|
| 2005 |
|
|
|
|
| Weighted |
|
|
| Weighted |
|
|
|
|
| average |
|
|
| average |
|
|
| Earnings |
| number |
| Earnings |
| number |
|
|
| £m |
| of shares |
| £m |
| of shares |
|
| Basic EPS |
|
|
|
|
|
|
|
|
| Loss attributable to ordinary shareholders | (16.5 | ) | 107,285,860 |
| (27.0 | ) | 107,211,367 |
|
| Effect of dilutive securities: |
|
|
|
|
|
|
|
|
| Options | – |
| – |
| – |
| – |
|
| Adjusted loss | (16.5 | ) | 107,285,860 |
| (27.0 | ) | 107,211,367 |
|
|
|
| 2006 |
|
|
| 2005 |
|
|
|
| Per share |
|
|
| Per share |
|
|
|
| amount |
|
|
| amount |
|
|
|
| pence |
|
|
| pence |
|
| Basic EPS |
|
|
|
|
|
|
|
| Loss attributable to ordinary shareholders |
| (15.4 | ) |
|
| (25.2 | ) |
| Effect of dilutive securities: |
|
|
|
|
|
|
|
| Options |
| – |
|
|
| – |
|
| Diluted EPS |
| (15.4 | ) |
|
| (25.2 | ) |
7 | PARENT COMPANY RESULTS FOR THE YEAR |
As permitted by Section 230 of the Companies Act 1985, a separate income statement for the Company is not presented. The Company’s loss for the year was £6.4m (2005 – profit of £9.1m). The Company had no recognised income and expenses other than its loss and, therefore, no separate statement of recognised income and expenses has been presented.
62
8 | GOODWILL |
|
| £m |
|
| Cost |
|
|
| At 1 January 2006 | 20.5 |
|
| Disposal | (2.4 | ) |
A | Exchange movement | (0.1 | ) |
| At 31 December 2006 | 18.0 |
|
| Amortisation at 1 January and 31 December 2006 | 5.6 |
|
| Net book value at 31 December 2006 | 12.4 |
|
|
| £m |
|
| Cost |
|
|
| At 1 January 2005 | 21.0 |
|
| Adjustment to contingent consideration | (0.8 | ) |
A | Exchange movement | 0.3 |
|
| At 31 December 2005 | 20.5 |
|
| Amortisation at 1 January and 31 December 2005 | 5.6 |
|
| Net book value at 31 December 2005 | 14.9 |
|
Goodwill arose when Acambis Inc. was acquired in 1999 and when BPC was acquired in August 2003.
The goodwill associated with BPC was written off following the disposal of the trade and assets of BPC in September 2006.
Impairment testing of goodwill
Goodwill acquired through business combinations has been allocated to the business as a whole. Acambis operates as a global business and does not have cash-generating units at a level lower than the Group as a whole.
During the year, the goodwill has been tested for impairment in accordance with IAS36 ‘Impairment of assets’. Value in use (being discounted cash flows on projects) is estimated to be in excess of current market value of the Group based on market capitalisation, which is significantly higher than the book value. As no reasonably possible change in estimates could therefore trigger an impairment, no detailed sensitivity analysis has been performed or presented in these accounts. No impairment charges have been made in the year.
The information contained in this border has not been audited
A | Exchange movement |
|
63
Notes to the Group financial statements 31 December 2006
9 | OTHER INTANGIBLE ASSETS |
|
| Distribution |
| Software |
| R&D |
|
|
|
|
| contract |
| assets |
| technology |
| Total |
|
|
| £m |
| £m |
| £m |
| £m |
|
| Cost |
|
|
|
|
|
|
|
|
| At 1 January 2006 | 5.2 |
| 0.8 |
| 0.4 |
| 6.4 |
|
| Additions | – |
| 0.1 |
| 0.1 |
| 0.2 |
|
| Disposals | (4.8 | ) | (0.1 | ) | – |
| (4.9 | ) |
A | Exchange movement | (0.4 | ) | (0.1 | ) | – |
| (0.5 | ) |
| At 31 December 2006 | – |
| 0.7 |
| 0.5 |
| 1.2 |
|
| Amortisation |
|
|
|
|
|
|
|
|
| At 1 January 2006 | 1.7 |
| 0.5 |
| – |
| 2.2 |
|
| Charge for year | 0.5 |
| 0.1 |
| – |
| 0.6 |
|
| Disposals | (2.1 | ) | – |
| – |
| (2.1 | ) |
A | Exchange movement | (0.1 | ) | (0.1 | ) | – |
| (0.2 | ) |
| At 31 December 2006 | – |
| 0.5 |
| – |
| 0.5 |
|
| Net book value at 31 December 2006 | – |
| 0.2 |
| 0.5 |
| 0.7 |
|
|
| Distribution |
| Software |
| R&D |
|
|
|
|
| contract |
| assets |
| technology |
| Total |
|
|
| £m |
| £m |
| £m |
| £m |
|
| Cost |
|
|
|
|
|
|
|
|
| At 1 January 2005 | 4.7 |
| 0.6 |
| – |
| 5.3 |
|
| Additions | – |
| 0.2 |
| 0.4 |
| 0.6 |
|
A | Exchange movement | 0.5 |
| – |
| – |
| 0.5 |
|
| At 31 December 2005 | 5.2 |
| 0.8 |
| 0.4 |
| 6.4 |
|
| Amortisation |
|
|
|
|
|
|
|
|
| At 1 January 2005 | 0.9 |
| 0.3 |
| – |
| 1.2 |
|
| Charge for year | 0.7 |
| 0.2 |
| – |
| 0.9 |
|
A | Exchange movement | 0.1 |
| – |
| – |
| 0.1 |
|
| At 31 December 2005 | 1.7 |
| 0.5 |
| – |
| 2.2 |
|
| Net book value at 31 December 2005 | 3.5 |
| 0.3 |
| 0.4 |
| 4.2 |
|
The information contained in this border has not been audited
| A | Exchange movement
|
64
10 | PROPERTY, PLANT AND EQUIPMENT |
|
|
|
|
|
|
|
| |||||
|
|
| Freehold |
| Short |
| Manufacturing |
|
|
|
|
|
|
|
|
|
| land and |
| leasehold |
| and laboratory |
| Office |
| Assets in |
|
|
|
|
|
| buildings |
| improvements |
| equipment |
| equipment |
| construction |
| Total |
|
|
|
| £m |
| £m |
| £m |
| £m |
| £m |
| £m |
|
| Cost |
|
|
|
|
|
|
|
|
|
|
|
|
|
| 1 January 2006 |
| 0.6 |
| 23.4 |
| 8.5 |
| 3.0 |
| 4.0 |
| 39.5 |
|
| Additions |
| – |
| – |
| – |
| – |
| 0.9 |
| 0.9 |
|
| Disposals |
| (0.6 | ) | – |
| – |
| (0.1 | ) | – |
| (0.7 | ) |
| Transfers |
| 10.4 |
| (10.2 | ) | 0.3 |
| 0.5 |
| (1.0 | ) | – |
|
A | Exchange movement |
| (0.1 | ) | (1.9 | ) | (1.3 | ) | (0.4 | ) | (0.5 | ) | (4.2 | ) |
| At 31 December 2006 |
| 10.3 |
| 11.3 |
| 7.5 |
| 3.0 |
| 3.4 |
| 35.5 |
|
| Depreciation |
|
|
|
|
|
|
|
|
|
|
|
|
|
| At 1 January 2006 |
| – |
| 13.7 |
| 3.9 |
| 2.1 |
| – |
| 19.7 |
|
| Charge for year |
| – |
| 1.3 |
| 1.3 |
| 0.6 |
| – |
| 3.2 |
|
| Disposals |
| – |
| – |
| – |
| (0.1 | ) | – |
| (0.1 | ) |
| Transfers |
| 5.5 |
| (5.5 | ) | – |
| – |
| – |
| – |
|
A | Exchange movement |
| – |
| (0.9 | ) | (0.8 | ) | (0.2 | ) | – |
| (1.9 | ) |
| At 31 December 2006 |
| 5.5 |
| 8.6 |
| 4.4 |
| 2.4 |
| – |
| 20.9 |
|
| Net book value |
|
|
|
|
|
|
|
|
|
|
|
|
|
| At 31 December 2006 |
| 4.8 |
| 2.7 |
| 3.1 |
| 0.6 |
| 3.4 |
| 14.6 |
|
| Net book value of assets held under finance leases included above: |
|
|
|
|
|
|
|
|
|
|
|
|
|
| At 1 January 2006 |
| – |
| 3.5 |
| 0.7 |
| – |
| – |
| 4.2 |
|
| At 31 December 2006 |
| – |
| – |
| – |
| – |
| – |
| – |
|
|
|
| Freehold |
| Short |
| Manufacturing |
|
|
|
|
|
|
|
|
|
| land and |
| leasehold |
| and laboratory |
| Office |
| Assets in |
|
|
|
|
|
| buildings |
| improvements |
| equipment |
| equipment |
| construction |
| Total |
|
|
|
| £m |
| £m |
| £m |
| £m |
| £m |
| £m |
|
| Cost |
|
|
|
|
|
|
|
|
|
|
|
|
|
| 1 January 2005 |
| 0.6 |
| 19.4 |
| 6.8 |
| 2.6 |
| 1.0 |
| 30.4 |
|
| Additions |
| – |
| – |
| – |
| – |
| 5.2 |
| 5.2 |
|
| Disposals |
| – |
| – |
| – |
| (0.3 | ) | – |
| (0.3 | ) |
| Transfers |
| – |
| 1.7 |
| 0.4 |
| 0.4 |
| (2.5 | ) | – |
|
A | a Exchange movement |
| – |
| 2.3 |
| 1.3 |
| 0.3 |
| 0.3 |
| 4.2 |
|
| At 31 December 2005 |
| 0.6 |
| 23.4 |
| 8.5 |
| 3.0 |
| 4.0 |
| 39.5 |
|
| Depreciation |
|
|
|
|
|
|
|
|
|
|
|
|
|
| At 1 January 2005 |
| – |
| 8.6 |
| 2.0 |
| 1.3 |
| – |
| 11.9 |
|
| Charge for year |
| – |
| 3.1 |
| 1.2 |
| 0.7 |
| – |
| 5.0 |
|
| Impairment |
| – |
| 0.9 |
| – |
| – |
| – |
| 0.9 |
|
| Disposals |
| – |
| – |
| – |
| (0.2 | ) | – |
| (0.2 | ) |
A | a Exchange movement |
| – |
| 1.1 |
| 0.7 |
| 0.3 |
| – |
| 2.1 |
|
| At 31 December 2005 |
| – |
| 13.7 |
| 3.9 |
| 2.1 |
| – |
| 19.7 |
|
| Net book value |
|
|
|
|
|
|
|
|
|
|
|
|
|
| At 31 December 2005 |
| 0.6 |
| 9.7 |
| 4.6 |
| 0.9 |
| 4.0 |
| 19.8 |
|
Net book value of assets held under finance |
|
|
|
|
|
|
|
|
|
|
|
|
| |
| leases included above: |
|
|
|
|
|
|
|
|
|
|
|
|
|
| At 1 January 2005 |
| – |
| 4.8 |
| 0.8 |
| – |
| – |
| 5.6 |
|
| At 31 December 2005 |
| – |
| 3.5 |
| 0.7 |
| – |
| – |
| 4.2 |
|
The Company does not have any property, plant and equipment.
65
Notes to the Group financial statements 31 December 2006
11 | SUBSIDIARIES AND JOINT VENTURES |
|
|
|
|
|
| Investment in subsidiaries |
|
|
|
|
|
|
|
|
|
| Company |
|
|
|
| 2006 |
| 2005 |
|
|
|
| £m |
| £m |
|
| At 1 January |
| 15.9 |
| 15.5 |
|
| Deemed capital contribution |
| 0.2 |
| 0.4 |
|
| Additions |
| 41.9 |
| – |
|
| At 31 December |
| 58.0 |
| 15.9 |
|
During the year loans to Acambis Inc., a subsidiary, with a value of £41.9m were capitalised.
The consolidated financial statements include the financial statements of Acambis plc and the following subsidiaries:
A | Company name | Main business |
| Country of |
| Parent | % |
| Acambis Research Limited | Corporate administration and sales |
| England and Wales |
| Acambis plc | 100 |
| Acambis Inc. | R&D, sales and manufacturing |
| US |
| Acambis plc | 100 |
| Smallpox Biosecurity Limited | Non-trading during 2006 |
| England and Wales |
| Acambis plc | 100 |
| Berna Products Corporation | Non-trading from 1 October 2006 |
| US |
| Acambis Inc. | 100 |
| Joint venture |
As described in note 20, the Group has an interest in a Joint Venture. Since May 1999, Acambis has performed a pre-agreed work programme on behalf of the Joint Venture. Costs incurred by the Group on behalf of the Joint Venture and corresponding turnover received from the Joint Venture have been included in the Group’s financial statements. |
12 | FINANCIAL ASSETS: AVAILABLE-FOR-SALE INVESTMENT |
|
|
|
|
|
|
|
|
|
| Group |
|
|
|
| 2006 |
| 2005 |
|
|
|
| £m |
| £m |
|
| At 1 January |
| 0.6 |
| – |
|
| Additions |
| – |
| 0.4 |
|
| Revaluation surplus transfer to equity (note 22) |
| – |
| 0.2 |
|
| At 31 December |
| 0.6 |
| 0.6 |
|
In May 2005, the Group sold information and rights of a previous R&D project to Cambridge Biostability Limited, an unquoted UK company, in exchange for 1,425,200 shares. The investment represents less than a 20% shareholding in that company.
The Company does not have any available-for-sale investments.
| The information contained in this border has not been audited |
| A Subsidiaries |
66
13 | INVENTORY |
|
|
|
|
|
|
|
|
|
| Group |
|
|
|
| 2006 |
| 2005 |
|
|
|
| £m |
| £m |
|
| Raw materials |
| 0.3 |
| 0.4 |
|
| Work-in-progress |
| 0.5 |
| 0.5 |
|
| Finished goods |
| 0.7 |
| 2.7 |
|
A |
|
| 1.5 |
| 3.6 |
|
The amount of inventory write-down recognised as an expense in 2006 was £1.1m (2005 – £1.8m). This expense is included in the cost of sales line.
At 31 December 2006 and 31 December 2005, the Company did not hold any inventory.
14 | TRADE AND OTHER RECEIVABLES |
|
|
|
|
|
|
|
|
|
|
|
|
|
| Group |
|
|
| Company |
|
|
|
| 2006 |
| 2005 |
| 2006 |
| 2005 |
|
|
|
| £m |
| £m |
| £m |
| £m |
|
B | Trade receivables |
| 15.4 |
| 12.4 |
| – |
| – |
|
| Other receivables |
| 0.1 |
| 0.2 |
| – |
| 0.5 |
|
| Prepayments and accrued income |
| 1.7 |
| 4.8 |
| 0.4 |
| 0.3 |
|
| Settlement of Canton agreement |
| – |
| 2.9 |
| – |
| 1.7 |
|
C | Amount due from Joint Venture |
| 0.3 |
| 0.3 |
| – |
| – |
|
|
|
| 17.5 |
| 20.6 |
| 0.4 |
| 2.5 |
|
Trade receivables are non-interest-bearing and are generally on terms of 30 to 60 days. There was no provision for impairment against trade receivables at 31 December 2006 (2005 – £0.1m).
15 | FINANCIAL INSTRUMENTS |
The Group’s financial instruments comprise primarily cash and liquid resources, an overdraft facility, foreign currency contracts, current and non-current liabilities on the fill/finish facility and various items, such as trade debtors and trade creditors, which arise directly from its operations. The main purpose of these financial instruments is to provide working capital for the Group’s operations.
The main risks arising from the Group’s activities and involving the use of financial instruments are foreign currency risk, interest rate risk and liquidity risk. The Board reviews and agrees the Group’s objectives and policies for managing each of these risks. Details of the Group’s objectives and policies, both during the year and since the year-end, are set out below, along with numerical disclosures for each category of financial instrument. Except where indicated, these disclosures are indicative of the situation throughout the year.
Foreign currency risk
The Group has operations and trade in the US, with revenues, expenses and financing denominated principally in US dollars. Through these overseas operations, the Group is subject to foreign exchange risk, including the risk of fluctuations in the Group’s net investment in, and reported profits from, foreign subsidiaries when translated into sterling. In addition, the UK trading subsidiary enters into contracts in a variety of foreign currencies.
The Group had overall surplus cash funds throughout the year but had to determine in which currency to hold cash available for working capital and surplus funds. This was done with reference to anticipated future expenditure patterns and relative returns on funds held in different currencies. The Group’s current policy is to hold surplus funds in sterling over the long term, to mitigate the risk of fluctuations in the Group’s net assets when reported in sterling.
| The information contained in this border has not been audited | |||||
A Inventory |
| B Trade receivables |
| C Amount due from Joint Venture
| |
67
Notes to the Group financial statements 31 December 2006
15 | FINANCIAL INSTRUMENTS (CONTINUED) |
Foreign currency risk (continued)
During the year, the Group used dual currency deposits for sterling, euro and US dollar deposits, allowing an enhanced interest rate to be earned, which may, at maturity, be converted into sterling or dollars at the banks’ discretion, at a rate previously agreed. The Group had no dual currency deposits outstanding at the year-end (2005 – none).
From time to time, the Group makes use of forward contracts in order to reduce uncertainty over the sterling value of anticipated US dollar receipts, thereby reducing uncertainty over the level of the Group’s profits when reported in sterling. Typically, in 2006 the Group took out forward contracts only for known significant foreign currency transactions. The Group had forward contracts to buy dollars and sell sterling outstanding at the year-end totalling £4.6m, which all matured by 30 March 2007 (2005 – one forward contract to buy sterling and sell dollars of £4.0m).
Where Group companies have monetary assets and liabilities denominated in currencies other than their functional currency, these balances are translated into that subsidiary’s functional currency. With the exception of gains and losses on those inter-company balances that are considered to be ‘as permanent as equity’ and which are recorded in reserves, foreign exchange gains and losses arising are recorded immediately in the income statement. These amounts include euro-and sterling-denominated cash balances held in the US, US dollar- and euro-denominated balances held by the Company and a US dollar-denominated overdraft facility held by a UK subsidiary. In addition, the Group has other current assets and liabilities denominated in foreign currencies that the Board does not consider to be significant.
Liquidity risk
The Board monitors the level of cash and liquid resources on a regular basis, and management monitors the level on a daily basis, to ensure that the Group has sufficient liquid funds to enable it to meet its commitments as they fall due. This is achieved through the production and review of cash forecasts, including sensitivity analyses. Approximately 60% of the Group’s cash and liquid resources are managed on a discretionary basis by a third party within strict parameters that have been set by the Board. The remainder is invested in managed funds or invested in bank deposits within the parameters set by the Board. These parameters include the requirement that the institutions used must have a minimum rating of Aa2 long-term or P-1 short-term, and a maximum investment with any one counter-party of £20m.
Interest rate risk
The Group finances its operations predominantly through cash and liquid resources generated through operating activities, from the issuance of equity shares, through finance leases and through an overdraft facility. It is the Group’s policy to invest surplus cash on deposit or in money market funds managed by professional money managers. The performance of the investments is reviewed by management on a regular basis to ensure that competitive rates of return are being achieved, subject to the Board’s requirement relating to the accessibility of funds and standing of financial institutions used. Management reviews regularly the financing facilities available to the Group to ensure competitive rates of interest are being obtained. During the year, the Group invested in cash deposits, which accrue interest dependent on the sterling LIBOR (London interbank offered rate). A deposit of £5.0m was outstanding at the year-end and was valued at £5.0m (2005 – deposit £10m, valued at £10m). The finance lease present during the year was repaid prior to the year-end.
68
15 | FINANCIAL INSTRUMENTS (CONTINUED) |
Interest rate risk (continued)
The following table sets out the carrying value, by maturity, for each financial instrument that is exposed to interest rate risk.
|
|
|
|
|
| Group |
|
|
|
|
| Company |
|
| 2006 | Within |
| One – two |
|
|
| Within |
| One – two |
|
|
|
|
| one year |
| years |
| Total |
| one year |
| years |
| Total |
|
|
| £m |
| £m |
| £m |
| £m |
| £m |
| £m |
|
| Floating rate: |
|
|
|
|
|
|
|
|
|
|
|
|
| Cash | 6.0 |
| – |
| 6.0 |
| 4.2 |
| – |
| 4.2 |
|
| Bank overdraft | (3.6 | ) | – |
| (3.6 | ) | – |
| – |
| – |
|
| Fixed rate: |
|
|
|
|
|
|
|
|
|
|
|
|
| Short-term deposits | 20.9 |
| – |
| 20.9 |
| 20.5 |
| – |
| 20.5 |
|
| Liquid investments | 2.5 |
| 5.0 |
| 7.5 |
| 2.5 |
| 5.0 |
| 7.5 |
|
| Obligations under finance leases | – |
| – |
| – |
| – |
| – |
| – |
|
|
|
|
|
|
| Group |
|
|
|
|
| Company |
|
| 2005 | Within |
| One – two |
|
|
| Within |
| One – two |
|
|
|
|
| one year |
| years |
| Total |
| one year |
| years |
| Total |
|
|
| £m |
| £m |
| £m |
| £m |
| £m |
| £m |
|
| Floating rate: |
|
|
|
|
|
|
|
|
|
|
|
|
| Cash | 11.0 |
| – |
| 11.0 |
| 6.5 |
| – |
| 6.5 |
|
| Fixed rate: |
|
|
|
|
|
|
|
|
|
|
|
|
| Short-term deposits | 38.2 |
| – |
| 38.2 |
| 36.0 |
| – |
| 36.0 |
|
| Liquid investments | 8.8 |
| 10.0 |
| 18.8 |
| 8.8 |
| 10.0 |
| 18.8 |
|
| Obligations under finance leases | (7.1 | ) | – |
| (7.1 | ) | – |
| – |
| – |
|
Credit risk
The Group’s main customer is the US Government and, therefore, it assesses the credit risk as low. There are no other significant concentrations of credit risk.
Fair values of financial assets and financial liabilities
There is no material difference between the book values and fair values of the Group’s financial assets and liabilities as at 31 December 2006, due to short maturity. Fair values have been calculated by discounting cash flows at prevailing interest rates.
The fair value of derivative financial instruments is as follows:
|
|
|
| Group |
|
|
| Company |
|
|
| 2006 |
| 2005 |
| 2006 |
| 2005 |
|
|
| £m |
| £m |
| £m |
| £m |
|
| Assets: |
|
|
|
|
|
|
|
|
| Forward currency contracts | – |
| – |
| – |
| – |
|
| Currency deposit contract | – |
| 0.1 |
| – |
| 0.1 |
|
In accordance with IAS39, the Group has reviewed all contracts for embedded derivatives that are required to be separately accounted for if they do not meet certain requirements set out in the standard. This derivative is fair-valued based on discounted future cash flows with gains and losses passing through the income statement as hedge accounting is not available.
The Group has an embedded derivative deposit which accrues interest dependent on sterling LIBOR.
The Group also uses dual currency deposits and forward contracts, as noted above under ‘foreign currency risk’.
69
Notes to the Group financial statements 31 December 2006
16 | CASH AND CASH EQUIVALENTS |
Cash, cash equivalents and bank overdrafts include the following for the purposes of the cash flow statement.
|
|
|
| Group |
|
|
| Company |
|
|
| 2006 |
| 2005 |
| 2006 |
| 2005 |
|
|
| £m |
| £m |
| £m |
| £m |
|
| Cash and cash equivalents | 26.9 |
| 49.2 |
| 24.7 |
| 42.5 |
|
| Bank overdrafts (see note 17) | (3.6 | ) | – |
| – |
| – |
|
|
| 23.3 |
| 49.2 |
| 24.7 |
| 42.5 |
|
As explained in note 17, the bank overdraft was previously secured by Novartis and was treated as a liability to that company. Following revision to this agreement in September 2006, Acambis has assumed the overdraft. The weighted average interest rate received in the year was 3.3% for cash at bank. Short-term deposits are made for varying periods of between one day and three months (the weighted average maturity being six days) and have earned interest at 4.8%.
The Group had cash and liquid resources of £34.4m at 31 December 2006 (2005 – £68.0m). Of this amount, deposits with an original maturity of more than three months of £7.5m (2005 – £18.8m) have been classified as liquid investments. The majority of these resources are invested in managed funds or on bank deposit, denominated in sterling, US dollars and euros. Approximately 17% of the Group’s cash and liquid resources is available for use with a day’s notice (2005 – 16%), with the remainder being invested on deposits of up to 18 months. The Group had £0.2m of restricted cash on deposit at the year-end (2005 – £0.7m).
17 | FINANCIAL LIABILITIES |
|
|
|
| Group |
|
|
| 2006 |
| 2005 |
|
|
| £m |
| £m |
|
| Current: |
|
|
|
|
| Short-term borrowings – bank overdraft | 3.6 |
| 4.0 |
|
| Short-term financial liabilities – obligations under finance leases | – |
| 7.1 |
|
| Short-term financial liabilities – other financial liabilities | 0.1 |
| 0.1 |
|
|
| 0.1 |
| 7.2 |
|
| Total current financial liabilities | 3.7 |
| 11.2 |
|
| Non-current: |
|
|
|
|
| Other financial liabilities | 1.3 |
| 1.6 |
|
The Company had no financial liabilities at 31 December 2006 (2005 – nil).
Short-term borrowings
Until September 2006, the overdraft was underwritten by Novartis as part of the ARILVAX agreement. Following the signing of a revised agreement with Novartis in September 2006, this overdraft is now secured through an Acambis plc cash deposit with Barclays Bank PLC.
The overdraft facility was fully utilised at 31 December 2006 (2005 – fully utilised) and was renewed in September 2006 until further notice.
During the year, an exchange gain of £0.4m (2005 – loss of £0.4m) was recorded in the income statement, resulting from the revaluation of this US dollar-denominated facility.
Obligations under finance leases
The Group had a $40.0m (c. £21.0m) finance lease facility, which was paid off in December 2006 relating to the purchase and sale-and-leaseback of capital assets within its manufacturing plant. This was arranged through Baxter and was approved by shareholders in December 2001. In 2001, the Group drew down $18.6m (£14.0m) and made no further draw-downs from the facility. The repayment schedule for the lease financing required that interest only was repaid in 2003 and capital and interest were repayable over 2004 to 2006. The Group had an option to repurchase all of the facility’s assets in December 2003, and on each anniversary thereafter, for the capital balance outstanding at that time, plus any accrued but unpaid interest due at the time and a make-whole payment (discounted to present value) equal to the projected future interest stream payable to the end of the lease term. This was exercised in December 2006.
70
17 | FINANCIAL LIABILITIES (CONTINUED) |
| Other financial liabilities |
In May 2005, the Group leased a fill/finish facility for c. £1.8m ($3.0m) upfront and a further c. £2.6m ($4.5m) in equal instalments between 2006 and 2017. The balance relating to the discounted value of future payments is £1.4m at 31 December 2006 (2005 – £1.7m). £0.1m is included in ‘current other financial liabilities’ (2005 – £0.1m), and £1.3m in ‘non-current other financial liabilities’ (2005 – £1.6m).
18 | CURRENT LIABILITIES |
|
|
|
|
|
| Trade and other payables |
|
|
|
|
|
|
|
|
|
| Group |
|
|
|
| 2006 |
| 2005 |
|
|
|
| £m |
| £m |
|
A | Trade payables |
| 3.1 |
| 16.0 |
|
| Other taxation and social security |
| 0.1 |
| 0.1 |
|
|
|
| 3.2 |
| 16.1 |
|
The Company had no trade and other payables at 31 December 2006 (2005 – nil).
19 | PROVISIONS |
|
|
|
|
|
|
|
|
|
| Group |
|
|
|
| 2006 |
| 2005 |
|
|
|
| £m |
| £m |
|
| At 1 January |
| 2.3 |
| – |
|
| Additions |
| 1.6 |
| 2.3 |
|
| Utilised |
| (3.7 | ) | – |
|
| Exchange movement |
| (0.2 | ) | – |
|
| At 31 December |
| – |
| 2.3 |
|
In August 2005, Bavarian Nordic filed legal actions against Acambis in the US in relation to IP on its MVA smallpox vaccine. An administrative law judge at the ITC ruled in favour of Acambis in September 2006. A final decision, following a review of the initial determination, is expected in the fourth quarter of 2007. A further suit was filed in Austria in February 2006. Bavarian Nordic alleges use of trade secrets, misappropriation and patent infringement. Acambis strongly believes these allegations are without foundation and is vigorously defending its position but, given that the cases are now largely irrelevant to the Group’s strategic goals and that future costs are not expected to be significant, no provision has been made at 31 December 2006.
The Company has no provisions.
20 | INVESTMENT IN JOINT VENTURE |
The Group has a 50% interest in the Pasteur Mérieux-OraVax joint venture (the Joint Venture), whose principal business is to develop, manufacture, market and sell immunotherapeutic and preventative vaccines against H. pylori infection in humans. The Joint Venture represents collaboration between two partnerships, Mérieux-OraVax SNC and OraVax-Mérieux Co., incorporated in Delaware, US. These partnerships were formed in March 1995 between the companies now known as Acambis Inc. and sanofi pasteur. The Joint Venture trades under the name of Pasteur Mérieux-OraVax and its accounting year-end is 31 December. The R&D budgets of the two partnerships are established by joint committees in which each of the parties has an equal participation and role. The parties pay approximately equal shares of the agreed budgets. The Joint Venture is being wound down.
| The information contained in this border has not been audited |
|
| A Trade payables |
|
71
Notes to the Group financial statements 31 December 2006
20 | INVESTMENT IN JOINT VENTURE (CONTINUED) |
|
|
|
|
|
| The following information is given in respect of the Group’s share of the Joint Venture: |
| ||||
|
|
| 2006 |
| 2005 |
|
|
|
| £m |
| £m |
|
Loss before tax |
| – |
| – |
| |
| Current assets |
| 0.6 |
| 0.7 |
|
| Liabilities due within one year |
| (0.9 | ) | (1.0 | ) |
|
|
| (0.3 | ) | (0.3 | ) |
Given the nature of this Joint Venture as a collaboration between two partners, the following table provides an alternative analysis of the amounts shown above:
|
|
| 2006 |
| 2005 |
|
|
|
| £m |
| £m |
|
| Share of cumulative amounts invested by the partners |
| 14.9 |
| 17.0 |
|
| Share of cumulative losses incurred by the Joint Venture |
| (15.2 | ) | (17.3 | ) |
|
|
| (0.3 | ) | (0.3 | ) |
21 | CALLED-UP SHARE CAPITAL |
|
|
|
|
|
|
|
|
|
|
|
|
|
|
|
| Group and Company |
| ||
|
|
|
|
| 2006 |
|
|
| 2005 |
|
|
|
| Number |
| £m |
| Number |
| £m |
|
| Authorised shares of 10p each |
|
|
|
|
|
|
|
|
|
| At 1 January and 31 December |
| 140,000,000 |
| 14.0 |
| 140,000,000 |
| 14.0 |
|
| Allotted, called-up and fully paid ordinary shares of 10p each |
|
|
|
|
|
|
|
|
|
| At 1 January |
| 107,351,407 |
| 10.7 |
| 107,219,329 |
| 10.7 |
|
| Exercise of share options |
| 22,820 |
| – |
| 132,078 |
| – |
|
| At 31 December |
| 107,374,227 |
| 10.7 |
| 107,351,407 |
| 10.7 |
|
All shares have equal voting rights.
As described in note 22, Acambis Employees Trustees Limited holds 76,001 shares, which will be used to satisfy awards made under the LTIP and the deferred bonus plan. Consideration of less than £0.1m was received in 2006 through the exercise of share options (2005 – £0.2m).
22 | STATEMENT OF CHANGES IN EQUITY |
|
|
|
|
|
|
|
|
|
|
|
|
|
|
|
|
|
|
|
|
|
| Group |
|
|
|
|
|
| Share |
|
|
|
|
|
|
|
|
|
| Share |
| premium |
| Retained |
| Other |
|
|
|
|
|
| capital |
| account |
| earnings |
| reserves |
| Total |
|
|
|
| £m |
| £m |
| £m |
| £m |
| £m |
|
| At 1 January 2006 |
| 10.7 |
| 98.0 |
| (24.8 | ) | (0.9 | ) | 83.0 |
|
| Loss on foreign currency exchange |
| – |
| – |
| – |
| (1.8 | ) | (1.8 | ) |
| Total income and expense recognised directly in equity |
| – |
| – |
| – |
| (1.8 | ) | (1.8 | ) |
| Loss for the year |
| – |
| – |
| (16.5 | ) | – |
| (16.5 | ) |
| Foreign currency exchange realised on sale of business operation |
| – |
| – |
| – |
| (0.1 | ) | (0.1 | ) |
Total income and expense recognised |
| – |
| – |
| (16.5 | ) | (1.9 | ) | (18.4 | ) | |
| Credit in respect of employee share schemes |
| – |
| – |
| 0.5 |
| – |
| 0.5 |
|
| At 31 December 2006 |
| 10.7 |
| 98.0 |
| (40.8 | ) | (2.8 | ) | 65.1 |
|
72
22 | STATEMENT OF CHANGES IN EQUITY (CONTINUED) |
|
|
|
|
|
|
|
| |||
|
|
|
|
|
|
|
|
|
|
| Group |
|
|
|
|
|
| Share |
|
|
|
|
|
|
|
|
|
| Share |
| premium |
| Retained |
| Other |
|
|
|
|
|
| capital |
| account |
| earnings |
| reserves |
| Total |
|
|
|
| £m |
| £m |
| £m |
| £m |
| £m |
|
| At 1 January 2005 |
| 10.7 |
| 97.8 |
| 1.5 |
| (2.5 | ) | 107.5 |
|
| Gain on foreign currency exchange |
| – |
| – |
| – |
| 1.6 |
| 1.6 |
|
| Total income and expense recognised directly in equity |
| – |
| – |
| – |
| 1.6 |
| 1.6 |
|
| Loss for the year |
| – |
| – |
| (27.0 | ) | – |
| (27.0 | ) |
| Total income and expense recognised |
| – |
| – |
| (27.0 | ) | 1.6 |
| (25.4 | ) |
| Issue of new shares |
| – |
| 0.2 |
| – |
| – |
| 0.2 |
|
| Purchase of treasury shares |
| – |
| – |
| (0.2 | ) | – |
| (0.2 | ) |
| Revaluation of available-for-sale investment (net of deferred tax) |
| – |
| – |
| 0.1 |
| – |
| 0.1 |
|
| Credit in respect of employee share schemes |
| – |
| – |
| 0.8 |
| – |
| 0.8 |
|
| At 31 December 2005 |
| 10.7 |
| 98.0 |
| (24.8 | ) | (0.9 | ) | 83.0 |
|
The amount shown in ‘other reserves’ relates to foreign currency translation.
|
|
|
|
|
|
|
|
| Company |
|
|
|
|
|
| Share |
|
|
|
|
|
|
|
| Share |
| premium |
| Retained |
|
|
|
|
|
| capital |
| account |
| earnings |
| Total |
|
|
|
| £m |
| £m |
| £m |
| £m |
|
| At 1 January 2006 |
| 10.7 |
| 97.8 |
| 14.9 |
| 123.4 |
|
| Loss for the year |
| – |
| – |
| (6.4 | ) | (6.4 | ) |
| Total income and expense recognised for the year |
| – |
| – |
| (6.4 | ) | (6.4 | ) |
| Credit in respect of employee share schemes |
| – |
| – |
| 0.3 |
| 0.3 |
|
| Deemed capital contribution |
| – |
| – |
| 0.2 |
| 0.2 |
|
| At 31 December 2006 |
| 10.7 |
| 97.8 |
| 9.0 |
| 117.5 |
|
|
|
|
|
|
|
|
|
| Company |
|
|
|
|
|
| Share |
|
|
|
|
|
|
|
| Share |
| premium |
| Retained |
|
|
|
|
|
| capital |
| account |
| earnings |
| Total |
|
|
|
| £m |
| £m |
| £m |
| £m |
|
| At 1 January 2005 |
| 10.7 |
| 97.6 |
| 5.2 |
| 113.5 |
|
| Profit for the year |
| – |
| – |
| 9.1 |
| 9.1 |
|
| Total income and expense recognised for the year |
| – |
| – |
| 9.1 |
| 9.1 |
|
| Issue of new shares |
| – |
| 0.2 |
| – |
| 0.2 |
|
| Purchase of treasury shares |
| – |
| – |
| (0.2 | ) | (0.2 | ) |
| Credit in respect of employee share schemes |
| – |
| – |
| 0.4 |
| 0.4 |
|
| Deemed capital contribution |
| – |
| – |
| 0.4 |
| 0.4 |
|
| At 31 December 2005 |
| 10.7 |
| 97.8 |
| 14.9 |
| 123.4 |
|
At 31 December 2006, Acambis Employees’ Trustees Limited held 76,001 (2005 – 84,972) ordinary shares in the Company with a total nominal value of £0.01m (2005 – £0.01m). The cost of these shares of £0.2m (2005 – £0.2m) is shown as a deduction to retained earnings. The total market value of these shares at 31 December 2006 is £0.1m (2005 – £0.2m). All shares held by the trust have been allocated to long-term incentive awards and a charge has been made in respect of all of these awards. All costs relating to the administration of the trust are included within the accounts of the Company as they arise.
73
Notes to the Group financial statements 31 December 2006
23 | SHARE-BASED PAYMENTS |
Summary of share schemes in operation during the year
Acambis had the following share-based payment schemes in operation during the year. All options have a three-year vesting period, except the ESPP, which has a two-year vesting period.
1996 and 1999 Schemes
The 1996 Scheme and the 1999 Plan involve the grant of market-value share options to participants with exercise prices equal to the share price at the date of grant. The options are subject to a market-based performance condition (Acambis’ TSR performance against a comparator group). The options granted have a maximum contractual life of ten years, with the exception of the 15 October 2005 and 28 October 2003 options granted to employees, which have a maximum contractual life of four years. For all options granted after 1 January 2004 (to employees or Directors), performance is measured over three years and there is no retesting of the performance condition. Following the introduction of the 2006 Option Plans, the 1996 and 1999 Schemes will no longer be used for new grants. Further information regarding the operation of the Schemes is in the remuneration report.
SAYE Scheme
The SAYE Scheme is based on a three-year monthly savings contract and eligible employees are granted share options with an exercise price of up to 20% below the share price when the invitation is issued. The options granted have a maximum contractual life of three years and six months. Vesting of the options is not subject to the achievement of a performance target.
ESPP
The ESPP is based on a two-year monthly savings contract and eligible employees are granted share options with an exercise price of up to a 15% discount to the share price at the time of invitation. The options granted have a maximum contractual life of two years and three months. Vesting of the options is not subject to the achievement of a performance target.
2006 Option Plans
The 2006 Approved and Unapproved Plans involve the grant of market-value share options to participants with exercise prices equal to share price at date of grant. Grants to Directors are subject to a market-based performance condition (Acambis’ TSR performance against a comparator group), which is measured over the three-year vesting period. Options granted in 2006 to Directors have a ten-year life, and options granted to employees have a maximum contract life of four years. Further information regarding the operation of the Plans is in the remuneration report.
2006 Deferred Bonus Plan
The 2006 Deferred Bonus Plan provides for part of an employee’s bonus to be taken in the form of shares, the entitlement to which will be deferred for three years. Awards under the Deferred Bonus Plan are not performance-linked. No awards were made in 2006. Further information regarding the operation of the Plan is in the remuneration report.
74
23 | SHARE-BASED PAYMENTS (CONTINUED) |
LTIP
The LTIP involves the grant of nil-cost share options to participants. The options are subject to a market-based performance condition (Acambis’ TSR performance against a comparator group). The options granted have a maximum contractual life of three years and six months. For all options granted under the LTIP, performance is measured over three years and there is no retesting of the performance condition. Further information regarding the operation of the schemes is in the remuneration report. Following the introduction of the 2006 Deferred Bonus Plan, the LTIP will no longer be used for new awards.
Options outstanding under all schemes are as follows:
|
|
| 1 January |
|
|
|
|
|
|
| 31 December |
|
|
|
| 2006 |
| Granted |
| Exercised |
| Lapsed |
| 2006 |
|
| Scheme |
| ’000 |
| ’000 |
| ’000 |
| ’000 |
| ’000 |
|
| 2006 Unapproved |
| – |
| 1,254 |
| – |
| (4 | ) | 1,250 |
|
| 2006 Approved |
| – |
| 78 |
| – |
| (1 | ) | 77 |
|
| 1996 |
| 200 |
| 3 |
| – |
| (98 | ) | 105 |
|
| 1999 |
| 3,533 |
| 451 |
| (21 | ) | (1,321 | ) | 2,642 |
|
| SAYE |
| 81 |
| 106 |
| (2 | ) | (69 | ) | 116 |
|
| ESPP |
| 75 |
| 77 |
| – |
| (55 | ) | 97 |
|
| 1990 US1 |
| 14 |
| – |
| – |
| – |
| 14 |
|
| 1995 US2 |
| 127 |
| – |
| – |
| (82 | ) | 45 |
|
| LTIP |
| 586 |
| 142 |
| – |
| (240 | ) | 488 |
|
| Total |
| 4,616 |
| 2,111 |
| (23 | ) | (1,870 | ) | 4,834 |
|
| Weighted average exercise price (£) |
| 2.13 |
| 1.09 |
| 0.68 |
| 2.54 |
| 1.68 |
|
|
|
| 1 January |
|
|
|
|
|
|
| 31 December |
|
|
|
| 2005 |
| Granted |
| Exercised |
| Lapsed |
| 2005 |
|
| Scheme |
| ’000 |
| ’000 |
| ’000 |
| ’000 |
| ’000 |
|
| 1996 |
| 233 |
| 36 |
| (10 | ) | (59 | ) | 200 |
|
| 1999 |
| 3,173 |
| 806 |
| (104 | ) | (342 | ) | 3,533 |
|
| SAYE |
| 105 |
| 38 |
| (12 | ) | (50 | ) | 81 |
|
| ESPP |
| 85 |
| 50 |
| – |
| (60 | ) | 75 |
|
| 1990 US1 | 121 |
| – |
| – |
| (107 | ) | 14 |
| |
| 1995 US2 |
| 155 |
| – |
| – |
| (28 | ) | 127 |
|
| LTIP |
| 370 |
| 334 |
| (41 | ) | (77 | ) | 586 |
|
| Total |
| 4,242 |
| 1,264 |
| (167 | ) | (723 | ) | 4,616 |
|
|
|
|
|
|
|
|
|
|
|
|
|
|
Notes
1 | The OraVax 1990 Stock Incentive Plan. |
2 | The OraVax 1995 Stock Incentive Plan. |
75
Notes to the Group financial statements 31 December 2006
23 | SHARE-BASED PAYMENTS (CONTINUED) |
The following table shows outstanding options, divided into ranges to help assess the number and timing of additional shares that may be issued and the cash that may be received upon exercise of those options.
| Year of grant | Weighted average | Period exercisable under | Number outstanding |
| 1997 | $4.88 | 2000-2007 | 54 |
| 1999 | $1.68 | 2002-2009 | 5 |
| 1999 | £0.39 | 2002-2009 | 74 |
| 2000 | £0.92 | 2003-2006 | 250 |
| 2001 | £1.39 | 2004-2011 | 251 |
| 2002 | £2.67 | 2005-2012 | 211 |
| 2003 | £3.01 | 2006-2013 | 261 |
| 2004 | £nil | 2007-2008 | 96 |
| 2004 | £2.73 | 2007-2008 | 458 |
| 2004 | £3.10 | 2007-2014 | 233 |
| 2005 | £nil | 2008 | 250 |
| 2005 | £2.45 | 2008-2009 | 277 |
| 2005 | £2.29 | 2008-2015 | 477 |
| 2006 | £nil | 2009 | 142 |
| 2006 | £1.43 | 2009-2010 | 1,038 |
| 2006 | £1.55 | 2008-2016 | 431 |
| 2006 | £1.98 | 2009-2016 | 326 |
| Total |
|
| 4,834 |
The weighted average share price of the 631,000 options exercisable at 31 December 2006 was £2.65 (2005 – 1,420,000 options at £2.70).
Whilst they have no present intention of utilising such authority, at the AGM to be held on 25 May 2007 the Directors will seek authority from the shareholders to allot shares up to an aggregate nominal value of £3,232,866 (32,328,659 ordinary shares of 10p each), being the unissued ordinary shares of the Company at 3 April 2007. Currently, the Directors have authority to allot shares up to an aggregate nominal value of £3,264,670.
Financial details of share options
The Group operates an HM Revenue and Customs-approved SAYE scheme in the UK and an ESPP scheme in the US.
Charge in the income statement
In accordance with the transitional provisions of IFRS2, Acambis has recognised an expense in respect of all grants under these plans made after 7 November 2002 which remained unvested at 31 December 2004. Acambis recognised a total expense of £0.5m in 2006 (2005 – £0.8m) in accordance with IFRS2.
For options exercised during the year, the weighted average share price at the date of exercise was £1.94 (2005 – £2.30).
The weighted average fair values for grants made in the year are as noted in the table below. Grants made to employees and Directors under the 2006 and 1999 Plans are shown separately since different inputs have been used for these grants.
|
| 2006 |
| 2005 |
|
| Weighted average fair value | £ |
| £ |
|
| 1996 Plan | 0.54 |
| 0.83 |
|
| 1999 Plan (Employee grants) | 0.47 |
| 0.68 |
|
| 1999 Plan (Director grants) | 0.61 |
| 0.84 |
|
| LTIP | 1.15 |
| 1.41 |
|
| 2006 Approved | 0.38 |
| – |
|
| 2006 Unapproved Plan (Employee grants) | 0.37 |
| – |
|
| 2006 Unapproved Plan (Director grants) | 0.42 |
| – |
|
| ESPP | 0.49 |
| 0.62 |
|
| SAYE | 0.67 |
| 0.88 |
|
76
23 | SHARE-BASED PAYMENTS (CONTINUED) |
The assumptions used in the calculation of the fair values in the above table are:
| • | Expected volatility was based on the historical volatility of the Company’s share price: |
| – | over the three years prior to the grant date for employee grants under the 1996 Plan, 1999 Plan and 2006 Plans, and all grants under the SAYE Scheme and LTIP; |
| – | over the four years prior to the grant date for Director grants under the 1996 Plan, 1999 Plan and 2006 Plans; and |
| – | over the two years prior to the grant date for all grants under the ESPP. |
| • | A zero dividend yield assumption has been used in the calculation of these fair values. |
1996 Plan, 1999 Plan, LTIP and 2006 Plans
The fair value of shares awarded under the 2006 Approved Plan, 2006 Unapproved Plan, 1996 Plan and 1999 Plan is calculated using a binomial option pricing model adjusted to reflect the TSR market-based performance condition where applicable. The awards were calculated using the following assumptions:
1996 Plan
|
| 2006 |
| 2005 |
|
| Weighted average share price (£) | 2.11 |
| 2.58 |
|
| Weighted average exercise price (£) | 2.11 |
| 2.58 |
|
| Weighted average volatility (%) | 31.6 |
| 41.4 |
|
| Weighted average correlation (%) | 4.0 |
| 5.0 |
|
| Weighted average expected life (years) | 3.5 |
| 3.5 |
|
| Weighted average risk-free interest rate (%) | 4.5 |
| 4.6 |
|
1999 Plan (employee grants)
|
| 2006 |
| 2005 |
|
| Weighted average share price (£) | 1.93 |
| 2.41 |
|
| Weighted average exercise price (£) | 1.93 |
| 2.41 |
|
| Weighted average volatility (%) | 31.8 |
| 36.9 |
|
| Weighted average correlation (%) | 4.0 |
| 4.3 |
|
| Weighted average expected life (years) | 3.5 |
| 3.1 |
|
| Weighted average risk-free interest rate (%) | 4.6 |
| 4.3 |
|
1999 Plan (Director grants)
|
| 2006 |
| 2005 |
|
| Weighted average share price (£) | 1.97 |
| 2.34 |
|
| Weighted average exercise price (£) | 1.97 |
| 2.34 |
|
| Weighted average volatility (%) | 37.6 |
| 47.9 |
|
| Weighted average correlation (%) | 4.0 |
| 4.5 |
|
| Weighted average expected life (years) | 4.0 |
| 4.0 |
|
| Weighted average risk-free interest rate (%) | 4.5 |
| 4.3 |
|
LTIP
|
| 2006 |
| 2005 |
|
| Weighted average share price (£) | 1.97 |
| 2.19 |
|
| Weighted average exercise price (£) | – |
| – |
|
| Weighted average volatility (%) | 30.8 |
| 40.8 |
|
| Weighted average correlation (%) | 4.0 |
| 5.0 |
|
| Weighted average expected life (years) | 3.0 |
| 3.0 |
|
| Weighted average risk-free interest rate (%) | 4.5 |
| 4.3 |
|
2006 Approved Plan
|
| 2006 |
| 2005 |
|
| Weighted average share price (£) | 1.46 |
| N/A |
|
| Weighted average exercise price (£) | 1.46 |
| N/A |
|
| Weighted average volatility (%) | 32.4 |
| N/A |
|
| Weighted average correlation (%) | 5.0 |
| N/A |
|
| Weighted average expected life (years) | 3.5 |
| N/A |
|
| Weighted average risk-free interest rate (%) | 4.9 |
| N/A |
|
77
Notes to the Group financial statements 31 December 2006
23 | SHARE-BASED PAYMENTS (CONTINUED) |
2006 Unapproved Plan (employee grants) | |||||||
|
| 2006 |
| 2005 |
| ||
| Weighted average share price (£) | 1.46 |
| N/A |
| ||
| Weighted average exercise price (£) | 1.46 |
| N/A |
| ||
| Weighted average volatility (%) | 32.4 |
| N/A |
| ||
| Weighted average correlation (%) | 5.0 |
| N/A |
| ||
| Weighted average expected life (years) | 3.7 |
| N/A |
| ||
| Weighted average risk-free interest rate (%) | 4.9 |
| N/A |
| ||
2006 Unapproved Plan (Director grants)
|
| 2006 |
| 2005 |
|
| Weighted average share price (£) | 1.55 |
| N/A |
|
| Weighted average exercise price (£) | 1.55 |
| N/A |
|
| Weighted average volatility (%) | 35.5 |
| N/A |
|
| Weighted average correlation (%) | 5.0 |
| N/A |
|
| Weighted average expected life (years) | 3.5 |
| N/A |
|
| Weighted average risk-free interest rate (%) | 4.9 |
| N/A |
|
The 1996 Plan, 1999 Plan and the LTIP have a TSR market-based performance condition, such that the Company’s TSR over the performance period will be compared with the TSR of the comparator companies on the date of grant. The maximum number of shares would vest if Acambis were ranked in the upper quartile of the comparator group, being prorated down to a 30% vesting at a ranking of the median. No shares vest if Acambis’ ranking falls below the median. The fair value of options under the 1996 Plan, 1999 Plan and LTIP has been adjusted to take into account this market-based performance condition using a pricing model based on expectations about volatility and the correlation of share price returns in the group of comparator companies and which incorporates into the valuation the interdependency between share price performance and TSR vesting.
ESPP and SAYE grants
The fair value of options granted under the ESPP and SAYE scheme are calculated using a binomial option pricing model with the following assumptions:
ESPP
|
| 2006 |
| 2005 |
|
| Weighted average share price (£) | 1.84 |
| 2.17 |
|
| Weighted average exercise price (£) | 1.57 |
| 1.87 |
|
| Weighted average volatility (%) | 25.9 |
| 32.4 |
|
| Expected life (years) | 2.1 |
| 2.1 |
|
| Weighted average risk-free interest rate (%) | 4.7 |
| 4.4 |
|
SAYE
|
| 2006 |
| 2005 |
|
| Weighted average share price (£) | 1.58 |
| 2.39 |
|
| Weighted average exercise price (£) | 1.18 |
| 2.01 |
|
| Weighted average volatility (%) | 33.0 |
| 34.7 |
|
| Expected life (years) | 3.3 |
| 3.3 |
|
| Weighted average risk-free interest rate (%) | 4.9 |
| 4.3 |
|
For the options granted under the 1996 Plan and 1999 Plan prior to 1 January 2004 where the TSR condition is retested at the end of year four (if not met at the end of year three) and/or at the end of year five (if not met at the end of year four), a three years and six months vesting period has been used to approximate the impact of the retesting condition on the fair value. This retesting condition applies to a limited number of option grants and does not apply to new option grants.
78
24 | FINANCIAL COMMITMENTS |
| i) | Lease commitments |
The minimum lease payments under operating leases are as follows:
|
|
|
|
|
|
|
| Group |
|
|
| Land and buildings |
| Plant and machinery |
| ||||
|
| 2006 |
| 2005 |
| 2006 |
| 2005 |
|
|
| £m |
| £m |
| £m |
| £m |
|
| Total commitments under operating leases: |
|
|
|
|
|
|
|
|
| Due within one year | 2.0 |
| 2.3 |
| 0.1 |
| 0.1 |
|
| Due within one to five years | 7.7 |
| 9.6 |
| 0.1 |
| 0.2 |
|
| Due beyond five years | 7.1 |
| 8.2 |
| – |
| – |
|
|
| 16.8 |
| 20.1 |
| 0.2 |
| 0.3 |
|
|
|
|
|
|
|
|
| Company |
|
|
| Land and buildings |
| Plant and machinery |
| ||||
|
| 2006 |
| 2005 |
| 2006 |
| 2005 |
|
|
| £m |
| £m |
| £m |
| £m |
|
| Total commitments under operating leases: |
|
|
|
|
|
|
|
|
| Due within one year | 0.6 |
| 0.6 |
| – |
| – |
|
| Due within one to five years | 2.3 |
| 2.3 |
| – |
| – |
|
| Due beyond five years | 6.5 |
| 7.1 |
| – |
| – |
|
|
| 9.4 |
| 10.0 |
| – |
| – |
|
| ii) | Capital commitments |
| A | At the end of the year, capital commitments contracted but not provided for were £2.4m (2005 – £0.1m). | |
|
|
| iii) | Pension arrangements |
The Group provides pension benefits to all full-time employees on a defined contribution basis. The Company operates a self-administered, HM Revenue and Customs-approved pension scheme for UK Executive Directors. Other employees may operate private personal pension schemes. The normal age of retirement for UK staff is 65 years. In the US, the Group offers a ‘401k Savings and Retirement Plan’ for all employees, including Executive Directors. The Group pension cost (including 401k costs) for the year was £0.5m (2005 – £0.4m). At the year-end, the Group owed £nil (2005 – £0.2m) to the pension schemes. This amount is shown in the balance sheet under ‘accruals and deferred income’. | ||
25 | POST BALANCE SHEET EVENTS |
Acambis has initiated a wide-ranging restructuring, following an extensive review of its operations and cost base. The restructuring aims to increase the focus of its resources upon key programmes and core operational capabilities, and significantly lower its cost base.
The information contained in this border has not been audited
A | Capital commitments |
|
79
Notes to the Group financial statements 31 December 2006
26 | RELATED PARTY TRANSACTIONS |
For the year ended 31 December 2006, the Group has included turnover of £nil (2005 – £nil) in respect of costs incurred in performing services for the Joint Venture and a loss of £nil (2005 – £nil) within its Group financial statements. At 31 December 2006, the amounts the Group owed to the Joint Venture amounted to £0.3m (2005 – £0.4m).
Amounts owed by the Joint Venture to the Group at 31 December 2006 were £0.3m (2005 – £0.3m).
In 2006, the Company settled transactions on behalf of subsidiaries of £16.6m (2005 – £8.8m). The inter-Company balances outstanding at 31 December are detailed on the Company balance sheet. In 2006 the Company charged £nil to subsidiaries relating to management charges (2005 – credit of £3.6m) and charged £5.4m to subsidiaries relating to interest (2005 – £3.4m).
Directors’ remuneration, interests in share options and transactions
Full disclosure of Directors’ remuneration, interests in share options and transactions is given in that part of the remuneration report that is required to be audited. Aggregate gains made by Directors on the exercise of share options were £nil (2005 – £0.1m).
Key management compensation
The remuneration received by key management personnel, including the Directors, is as follows:
|
|
| 2006 |
| 2005 |
|
|
|
| £m |
| £m |
|
Salaries and short-term employee benefits |
| 1.5 |
| 1.6 |
| |
| Post-employment benefits |
| 0.1 |
| 0.1 |
|
| Share-based payments |
| 0.4 |
| 0.3 |
|
|
|
| 2.0 |
| 2.0 |
|
Key management personnel are those persons having authority and responsibility for planning, directing and controlling the activities of the Group, directly or indirectly, including all Executive and Non-executive Directors.
Directors’ interests
No Director or key management personnel had any disclosable related party transactions with the Group during the year.
80
Summarised Group statements
SELECTED FINANCIAL INFORMATION
The following selected financial information for each of the fiscal years in the five-year period ended 31 December 2006 has been derived from Acambis’ audited Group financial statements.
The Group financial statements for the two-year period ended 31 December 2006 are included elsewhere in this Annual Report.
UITF38 and UITF17 (revised) were not adopted in the 2002 results but were adopted in the 2003 results.
|
|
|
| Year ended 31 December |
| ||||||
|
| 2006 |
| 2005 |
| 2004 |
| 2003 |
| 2002 |
|
|
| £m |
| £m |
| £m |
| £m |
| £m |
|
|
| IFRS |
| IFRS |
| IFRS |
| UK GAAP |
| UK GAAP |
|
Statement of operations data: |
|
|
|
|
|
|
|
|
|
|
|
Turnover (revenues) |
| 30.9 |
| 40.9 |
| 85.5 |
| 169.1 |
| 79.7 |
|
Cost of sales |
| (14.6 | ) | (27.6 | ) | (35.0 | ) | (98.4 | ) | (49.2 | ) |
Gross profit |
| 16.3 |
| 13.3 |
| 50.5 |
| 70.7 |
| 30.5 |
|
Research and development costs |
| (37.0 | ) | (34.1 | ) | (29.3 | ) | (19.9 | ) | (16.5 | ) |
Sales and marketing costs |
| (2.6 | ) | (2.6 | ) | (2.8 | ) | (1.3 | ) | – |
|
Administrative costs including costs relating to Canton plant impairment, restructuring costs and settlement of BTG agreement |
| (8.6 | ) | (7.7 | ) | (5.5 | ) | (11.9 | ) | (4.3 | ) |
Other operating income: |
|
|
|
|
|
|
|
|
|
|
|
– settlement of Canton agreement |
| – |
| – |
| 10.2 |
| – |
| – |
|
– fair value of shares received for grant of licence |
| – |
| 0.4 |
| – |
| – |
|
|
|
– settlement of ARILVAX agreement |
| 10.1 |
| – |
| – |
| – |
| – |
|
– profit on sale of business operation |
| 4.6 |
| – |
| – |
| – |
| – |
|
Operating (loss)/profit |
| (17.2 | ) | (30.7 | ) | 23.1 |
| 37.6 |
| 9.7 |
|
Non-operating income |
| – |
| – |
| – |
| 0.9 |
| 0.4 |
|
Finance income |
| 2.0 |
| 4.0 |
| 4.8 |
| 2.1 |
| 0.7 |
|
Finance costs |
| (0.7 | ) | (1.0 | ) | (0.9 | ) | (1.0 | ) | (1.2 | ) |
(Loss)/profit before tax |
| (15.9 | ) | (27.7 | ) | 27.0 |
| 39.6 |
| 9.6 |
|
Taxation |
| (0.6 | ) | 0.7 |
| (7.3 | ) | (3.9 | ) | – |
|
(Loss)/profit for the year attributable to equity holders of the parent |
| (16.5 | ) | (27.0 | ) | 19.7 |
| 35.7 |
| 9.6 |
|
(Loss)/earnings per ordinary share (basic) |
| (15.4 | )p | (25.2 | )p | 18.5 | p | 34.5 | p | 10.0 | p |
Basic number of shares – weighted average |
| 107,285,860 |
| 107,211,367 |
| 106,300,080 |
| 102,823,221 |
| 96,101,507 |
|
(Loss)/earnings per ordinary share (fully diluted) |
| (15.4 | )p | (25.2 | )p | 18.1 | p | 34.0 | p | 9.7 | p |
Fully diluted number of shares – weighted average |
| 107,285,860 |
| 107,211,367 |
| 108,649,389 |
| 104,393,147 |
| 98,976,882 |
|
|
|
|
|
|
| At 31 December |
| ||||
|
| 2006 |
| 2005 |
| 2004 |
| 2003 |
| 2002 |
|
|
| £m |
| £m |
| £m |
| £m |
| £m |
|
|
| IFRS |
| IFRS |
| IFRS |
| UK GAAP |
| UK GAAP |
|
Balance sheet data: |
|
|
|
|
|
|
|
|
|
|
|
Non-current assets |
| 28.3 |
| 39.8 |
| 40.5 |
| 40.3 |
| 39.6 |
|
Cash and liquid investments |
| 34.4 |
| 68.0 |
| 101.8 |
| 125.2 |
| 11.8 |
|
Current assets (excluding cash and liquid investments) |
| 19.6 |
| 25.6 |
| 21.6 |
| 30.5 |
| 102.4 |
|
Current liabilities |
| (15.6 | ) | (46.8 | ) | (47.6 | ) | (96.9 | ) | (88.4 | ) |
Non-current liabilities |
| (1.6 | ) | (3.6 | ) | (8.8 | ) | (12.6 | ) | (19.1 | ) |
Share capital |
| 10.7 |
| 10.7 |
| 10.7 |
| 10.6 |
| 9.9 |
|
Shareholders’ equity (net assets) |
| 65.1 |
| 83.0 |
| 107.5 |
| 86.5 |
| 46.3 |
|
81
Shareholder information
SUBSTANTIAL SHAREHOLDINGS
The shareholdings in the table set out below represent the shareholdings amounting to 3% or more of the ordinary share capital of the Company that had been notified to the Company in accordance with Sections 198 to 208 of the Companies Act 1985 at the time of publication of the 2006 and 2005 Annual Reports.
The figures in the column entitled ‘2005 Annual Report’ do not necessarily represent the current shareholdings or percentages held by the respective shareholders.
| As at 3 April 2007 | 2005 Annual Report | ||||||||
|
| Number of |
|
|
| Number of |
|
|
|
|
| shares held |
| Percentage |
| shares held |
| Percentage |
|
AMVESCAP PLC |
| 31,175,065 |
| 28.95 |
| 30,198,065 |
| 28.13 |
|
The Goldman Sachs Group, Inc. |
| 11,186,455 |
| 10.39 |
| 4,258,375 |
| 3.97 |
|
Legal and General Group plc |
| 7,315,855 |
| 6.79 |
| 6,467,972 |
| 6.03 |
|
F&C Asset Management plc |
| 5,198,913 |
| 4.83 |
| 10,646,451 |
| 9.92 |
|
Phylon Fund Limited |
| 4,400,000 |
| 4.09 |
| 3,922,000 |
| 3.65 |
|
JPMorgan Fleming Mercantile Investment Trust Plc |
| 3,476,005 |
| 3.23 |
| – |
| nil |
|
HBOS plc |
| 3,260,033 |
| 3.03 |
| 3,260,033 |
| 3.04 |
|
As far as is known to the Directors, the Company is not directly or indirectly owned or controlled by another corporation or by any other government, and the only shareholders directly or indirectly owning more than 10% of the Company are shown in the above table. All shareholders have the same voting rights.
ANALYSIS OF SHARE REGISTER AT 3 APRIL 2007
|
|
|
|
|
|
|
| Percentage |
|
|
| Number |
| Percentage of |
| Number |
| of issued |
|
Shareholding |
| of holders |
| total holders |
| of shares |
| share capital |
|
1-1,000 |
| 1,304 |
| 57.34 |
| 649,852 |
| 0.60 |
|
1,001-5,000 |
| 611 |
| 26.87 |
| 1,398,059 |
| 1.30 |
|
5,001-100,000 |
| 280 |
| 12.31 |
| 5,944,209 |
| 5.52 |
|
100,001-500,000 |
| 45 |
| 1.98 |
| 12,618,036 |
| 11.72 |
|
500,001-1,000,000 |
| 17 |
| 0.75 |
| 13,180,691 |
| 12.24 |
|
1,000,001 and over |
| 17 |
| 0.75 |
| 73,880,494 |
| 68.62 |
|
|
| 2,274 |
| 100.00 |
| 107,671,341 |
| 100.00 |
|
US record holders, including ADR holders, held approximately 6.61% of the issued share capital of ordinary 10p shares.
82
NATURE OF TRADING MARKET
Comparative market price information
Acambis shares are traded on the LSE under the symbol ‘ACM’.
The following tables set out the high and low closing mid-market prices for Acambis’ shares and close prices for ADRs:
|
|
| Shares |
|
| High | Low |
Calendar year | Pence per ordinary share | ||
2002 |
| 379.0 | 181.0 |
2003 |
| 396.0 | 207.5 |
2004 |
| 371.0 | 244.3 |
2005 | First quarter | 283.0 | 237.8 |
| Second quarter | 240.8 | 212.0 |
| Third quarter | 262.5 | 220.0 |
| Fourth quarter | 240.0 | 203.5 |
2006 | First quarter | 229.3 | 194.8 |
| Second quarter | 192.8 | 132.0 |
| Third quarter | 179.3 | 127.0 |
| Fourth quarter | 173.3 | 94.8 |
|
| Shares |
| High | Low |
| Pence per ordinary share | |
Monthly high and low prices (for the last full six months) are as follows: |
|
|
October 2006 | 173.3 | 143.0 |
November 2006 | 160.0 | 94.8 |
December 2006 | 107.0 | 99.5 |
January 2007 | 107.5 | 102.0 |
February 2007 | 137.0 | 105.5 |
March 2007 | 142.8 | 118.3 |
As of 3 April 2007, the mid-market price of an Acambis share was 125.5p. The number of outstanding ordinary 10p shares at that date was 107,671,341.
83
Shareholder information
Comparative dividend information
Acambis has never paid any cash dividends on its shares and does not anticipate paying cash dividends for the foreseeable future.
Annual General Meeting
The AGM of the Company will be held at 11.00 a.m. on 25 May 2007 at the offices of Morrison & Foerster MNP, CityPoint, One Ropemaker Street, London EC2Y 9AW. The Notice of AGM accompanies this Annual Report. In addition to the reappointment of PricewaterhouseCoopers LLP as Auditors, authority in respect of special business is being sought:
• | to amend the Company’s Articles of Association in order to allow notices to shareholders to be placed on Acambis’ website; |
• | to amend the Company’s Articles of Association to allow the Company to require US shareholders to transfer their ordinary shares to persons that are not US shareholders; |
• | to give the Company the authority to purchase up to 10% of its own issued ordinary shares at a price of not less than 10p per share and not more than 5% above the average of the middle market quotations of the Company’s shares as shown in the LSE Daily Official List for the five dealing days before the purchase is made. This authority shall expire at the conclusion of the Company’s next AGM or 15 months from the passing of this resolution, whichever is the earlier; and |
• | to disapply the statutory pre-emption rights in respect of the allotment of new shares pursuant to rights issues or otherwise for cash up to an aggregate nominal value of £538,357, being 5% of the currently issued ordinary shares of the Company in accordance with the current guidelines of the Investment Committee of the Association of British Insurers and the National Association of Pension Funds. This authority shall expire at the conclusion of the Company’s next AGM or 15 months from the passing of this resolution, whichever is the earlier. |
Memorandum and Articles of Association
A copy of both the Memorandum and Articles of Association of the Company has been filed with the Registrar of Companies. The Memorandum contains the fundamental provisions of the Company’s constitution.
The Articles contain the rules for the internal management and control of the Company.
Documents on display
Certain documents referred to in this Annual Report are available for inspection at the registered office of the Company.
84
Abbreviations and definitions
The following abbreviations are used throughout this document:
ADR | American Depositary Receipt |
AGM | Annual General Meeting |
AIM | Alternative Investment Market |
Arrow | Arrow Therapeutics Ltd |
Baxter | Baxter International Inc. or subsidiaries thereof |
Bharat Biotech | Bharat Biotech International Limited |
BIA | BioIndustry Association |
BLA | Biologics License Application |
Bavarian Nordic | Bavarian Nordic A/S |
BPC | Berna Products Corporation |
BTG | BTG International Limited |
CDAD | Clostridium difficile-associated disease |
CDC | US Centers for Disease Control and Prevention |
C.difficile | Clostridium difficile |
CEO | Chief Executive Officer |
CFO | Chief Financial Officer |
COO | Chief Operating Officer |
Crucell | Crucell NV |
CSO | Chief Scientific Officer |
DHHS | US Department of Health and Human Services |
EMEA | European Medicines Agency |
EPS | Earnings per Ordinary Share |
ESOP | Employee Share Ownership Plan |
ESPP | Employee Share Purchase Plan |
FDA | US Food and Drug Administration |
FRC | Financial Reporting Council |
GAAP | Generally Accepted Accounting Principles |
GMP | Good Manufacturing Practice |
GSK | GlaxoSmithKline |
HPA | UK Health Protection Agency |
IAS | International Accounting Standards |
IFRS | International Financial Reporting Standards |
IND | Investigational New Drug |
IP | Intellectual Property |
ITC | International Trade Commission |
JE | Japanese encephalitis |
KPI | Key performance indicator |
LSE | London Stock Exchange |
LTIP | Acambis Share Incentive Plan |
MA | Massachusetts |
Merck | Merck & Co |
MD | Maryland |
MRSA | Methicillin-resistant Staphylococcus aureus |
MVA | Modified Vaccinia Ankara |
NIAID | US National Institute of Allergy and Infectious Disease |
NIH | US National Institutes of Health |
OBE | Officer of the Order of the British Empire |
PATH | Program for Appropriate Technology in Health |
R&D | Research and development |
SAYE | Save-As-You-Earn |
SEC | US Securities and Exchange Commission |
TSR | Total Shareholder Return |
WHO | World Health Organization |
85
Glossary
Antibodies |
| any of various blood proteins used by the immune system to identify and |
|
| neutralise foreign objects such as viruses and bacteria |
Animal Efficacy Rule |
| The animal efficacy rule permits the FDA to rely on animal evidence when |
|
| 1 the agent’s mechanism of toxicity is well understood; |
|
| 2 the endpoints in the animal trials are clearly related to benefit in humans; |
|
| 3 the drug’s effect is demonstrated in a species expected to react similarly |
|
| to humans; and |
|
| 4 data allow selection of an effective human dose |
attenuated vaccines |
| bacteria or viruses than have been genetically weakened to make them less |
|
| virulent and useable as vaccines |
BLA |
| a marketing authorisation application in the US for a biological medicinal |
|
| product; it comprises pre-clinical, clinical, manufacturing and quality data for |
|
| a biological agent |
bulk manufacturing |
| the first stage of vaccine production, which produces large quantities of material |
|
| for purification |
clinical trials/ |
| testing of a new product in humans to collect data on aspects of the product’s |
clinical development |
| profile, including safety, efficacy, immunogenicity and dose regimen |
efficacy |
| the extent to which a drug or vaccine is effective |
encephalitis |
| inflammation of the brain |
endemic |
| restricted or peculiar to a locality or region; a disease that is well-established |
|
| within a given locality or region |
fill/finish |
| the process of putting freeze-dried vaccine material into a vial or appropriate |
|
| equivalent and labelling accordingly |
GMP |
| good manufacturing practice, representing formal standards of facilities |
|
| cleanliness, process, quality controls and documentation set out and periodically |
|
| monitored by the main medicines control agencies to which a company has to |
|
| conform in order to manufacture a medicinal product for human use |
immunogenic |
| related to or producing an immune response |
immunogenicity |
| the ability of a vaccine to generate an appropriate immune response |
inactivated |
| a vaccine that has been developed through inactivating (killing) a virulent |
|
| organism with either formaldehyde or beta-propiolactone |
investigational |
| the description given to a vaccine candidate once it has performed well in pre-clinical |
|
| evaluations and gone on to be used in clinical trials on human volunteers |
86
Japanese encephalitis |
| a disease caused by a mosquito-borne flavivirus that affects the membranes |
|
| around the brain |
lyophilisation |
| the process of removing water via application of a vacuum, used as a drying |
|
| method for long-term preservation of vaccines in a solid state and for long-term |
|
| storage of live vaccines |
Phase 1 |
| the first in a series of human clinical trials, used to determine whether the new |
|
| potential vaccine is likely to cause any adverse reactions, usually in healthy adults. |
|
| Phase 1 trials of vaccines can also provide initial insight into the product’s |
|
| immunogenicity. Studies are normally conducted on a volunteer group of tens |
|
| of people |
Phase 2 |
| the second phase of the human testing of new vaccines. Normally the point at |
|
| which the effect of different dose levels is tested, as well as further testing of the |
|
| safety and immunogenicity profile of the vaccine. Studies are usually conducted |
|
| on a volunteer group typically numbering in the hundreds |
Phase 3 |
| the third phase of the human testing of new vaccines and the final phase before |
|
| licence application. An extensive safety and immunogenicity database is built and |
|
| the efficacy of the vaccine is tested through agreed end points. Trial group sizes |
|
| are typically in the thousands at this stage |
purification |
| the second stage of manufacturing, involving a process to remove the growing |
|
| medium from bulk vaccine material, leaving only the larger quantities of |
|
| vaccine generated |
regulatory authorities |
| the government bodies that assess, license and control the development, clinical |
|
| testing and production of vaccines. They ensure that development and production |
|
| occur within the boundaries of and in accordance with national and international |
|
| legislation and guidelines |
safety profile |
| the types and numbers of adverse reactions that a normal, healthy individual may |
|
| experience following vaccination |
seroconversion |
| the production of neutralising antibodies in response to vaccination; often used in |
|
| vaccine trials as an immunogenicity marker based on a defined increase in |
|
| antibodies titres compared with pre-vaccination base-line levels |
titres |
| the quantity of antibodies found in a patient’s blood |
warm-base |
| ongoing production readiness capability to sustain a state of readiness sufficient |
manufacturing |
| to enable an escalation of vaccine production |
87
Company information and advisers
Acambis plc |
| Analyst coverage of Acambis |
Peterhouse Technology Park |
| Bridgewell Limited |
100 Fulbourn Road |
| Credit Suisse Securities (EUROPE) LTD |
Cambridge CB1 9PT, UK |
| Deutsche Bank AG/London |
Telephone +44 (0) 1223 275 300 |
| Evolution Securities Ltd |
Fax +44 (0) 1223 416 300 |
| Jefferies International, Ltd |
Email: acambis@acambis.com |
| JPMorgan Cazenove Limited |
www. acambis.com |
| Lehman Brothers (International) |
|
| Merrill Lynch |
Company secretary, registered office and group headquarters |
| Nomura Code Securities Limited |
Elizabeth Brown |
| Numis Securities Limited |
Peterhouse Technology Park |
| PiperJaffray Ltd |
100 Fulbourn Road |
| The Goldman Sachs Group, Inc. |
Cambridge CB1 9PT, UK |
| UBS Limited |
Telephone +44 (0) 1223 275 300 |
|
|
|
| Announcements |
Registered number – 2863682 |
| First quarter results – May |
Date of incorporation – 19 October 1993 |
| Second quarter/interim results – September |
Country of jurisdiction – England and Wales |
| Third quarter results – November |
|
| Final results – March |
Acambis US operations |
|
|
Acambis Inc. |
| CORPORATE ADVISERS |
38 Sidney Street |
| Legal advisers |
Cambridge |
| Morrison & Foerster MNP |
Massachusetts 02139, US |
| CityPoint |
Telephone +1 617 761 4200 |
| One Ropemaker Street |
|
| London EC2Y 9AW, UK |
Shareholder information |
|
|
The share price is obtainable in most UK national newspapers |
| Bankers |
and on Acambis’ website at www.acambis.com. |
| Barclays Bank PLC |
LSE mnemonic – ACM |
| Corporate Banking |
Reuters reference – ACM.L |
| PO Box 885 |
|
| Mortlock House |
|
| Vision Park |
|
| Histon Cambridge CB4 9DE, UK |
|
|
|
|
| Registrars |
|
| Capita Registrars |
|
| Northern House |
|
| Woodsome Park |
|
| Fenay Bridge |
|
| Huddersfield |
|
| West Yorkshire HD8 0LA, UK |
|
| |
| Auditors | |
|
| PricewaterhouseCoopers LLP |
|
| Abacus House |
|
| Castle Park |
|
| Cambridge CB3 0AN, UK |
88
![]()

SIGNATURE
Pursuant to the requirements of the Securities Exchange Act of 1934, the registrant Peptide Therapeutics Group has duly caused this report to be signed on its behalf by the undersigned, thereunto duly authorized.
| Date: 2 May 2007 | ACAMBIS PLC | |
| By: | /s/ Lyndsay Wright | |
| Name: Lyndsay Wright | ||
| Title: Director of Communications |