UNITED STATES SECURITIES AND EXCHANGE COMMISSION |
| Washington, D.C. 20549 |
| |
| FORM 20-F |
| |
| | REGISTRATION STATEMENT PURSUANT TO SECTION 12(b) OR (g) OF THE SECURITIES EXCHANGE ACT OF 1934 or |
| | |
| X | ANNUAL REPORT PURSUANT TO SECTION 13 OR 15(d) OF THE SECURITIES EXCHANGE ACT OF 1934 for the fiscal year ended February 28, 2009 or |
| | |
| | TRANSITION REPORT PURSUANT TO SECTION 13 OR 15(d) OF THE SECURITIES EXCHANGE ACT OF 1934 or |
| | |
| | SHELL COMPANY REPORT PURSUANT TO SECTION 13 OR 15(d) OF THE SECURITIES EXCHANGE ACT OF 1934 Date of event requiring this shell company report _______________________ |
| | |
| Commission File Number 000-29948 |
| | STARFIELD RESOURCES INC. | |
| | (Exact name of registrant as specified in its charter) | |
| | | |
| | Alberta, Canada | |
| | (Jurisdiction of incorporation or organization) | |
| | | |
| | 130 Adelaide Street, Suite 2210, Toronto, Ontario, Canada M5H 3P5 | |
| | (Address of principal executive offices) | |
| | | |
| | Securities to be registered pursuant to Section 12(b) of the Act: | |
| | None | |
| | | |
| Securities registered pursuant to Section 12(g) of the Act: |
| | Common Shares, without par value | |
| | (Title of class) | |
| |
| |
| Securities for which there is a reporting obligation pursuant to Section 15(d) of the Act. Title of class ___None_________ |
| |
| Indicate the number of outstanding shares of each of the issuer’s classes of capital or common stock as of the close of the period covered by the annual report. 332,685,899 |
| |
Indicate by check mark if the registrant is a well-known seasoned issuer, as defined in Rule 405 of the Securities Act. Yes o No x |
| |
If this report is an annual report or transition report, indicate by check mark if the registrant is not required to file reports pursuant to Section 13 or 15(d) of the Securities Exchange Act of 1934.
Yes o No x |
| |
Indicate by check mark whether the registrant (1) has filed all reports required to be filed by Section 13 or 15(d) of the Securities Exchange Act of 1934 during the preceding 12 months (or for such shorter period that the registrant was required to file such reports), and (2) has been subject to such filing requirements for the past 90 days. Yes x No o |
| |
| Indicate by check mark whether the registrant is a large accelerated filer, an accelerated filer, or a non-accelerated filer. See definition of “accelerated filer and large accelerated filer” in Rule 12b-2 of the Exchange Act. (Check one): �� |
| |
| Large accelerated filer o | Accelerated filer x | Non-accelerated filer o |
| |
| Indicate by check mark which basis of accounting the registrant has used to prepare the financial statements included in this filing: |
| |
| U.S. GAAP o | International Financial Reporting Standards as issued by the International Accounting Standards Board o | Other x |
| |
If “Other” has been checked in response to the previous question, indicate by check mark which financial statement the registrant has elected to follow. Item 17 x Item 18 o |
| |
If this is an annual report, indicate by check mark whether the registrant is a shell company (as defined in Rule 12b-2 of the Act). Yes o No x |
TABLE OF CONTENTS
| Part I | | 1 |
| | | |
| Item 1. | IDENTITY OF DIRECTORS, SENIOR MANAGEMENT AND ADVISERS. | 1 |
| Item 1.A. | Directors and Senior Management. | 1 |
| Item 1.B. | Advisers. | 1 |
| Item 1.C. | Auditors. | 1 |
| Item 2. | OFFER STATISTICS AND EXPECTED TIMETABLE. | 1 |
| Item 2.A. | Offer statistics. | 1 |
| Item 2.B. | Method and expected timetable. | 1 |
| Item 3. | KEY INFORMATION. | 1 |
| Item 3.A. | Selected financial data. | 1 |
| Item 3.B. | Capitalization and indebtedness. | 3 |
| Item 3.C. | Reasons for the offer and use of proceeds. | 3 |
| Item 3.D. | Risk factors. | 3 |
| Item 4. | INFORMATION ON THE COMPANY. | 6 |
| Item 4.A. | History and development of the company. | 6 |
| Item 4.B. | Business overview. | 7 |
| Item 4.C. | Organizational structure. | 7 |
| Item 4.D. | Property, plants and equipment. | 8 |
| Item 5. | OPERATING AND FINANCIAL REVIEW AND PROSPECTS. | 22 |
| Item 5.A. | Operating results. | 22 |
| Item 5.B. | Liquidity and capital resources. | 27 |
| Item 5.C. | Research and development, patents and licenses, etc. | 30 |
| Item 5.D. | Trend information. | 30 |
| Item 5.E. | Off-balance sheet arrangements. | 30 |
| Item 5.F. | Tabular disclosure of contractual obligations. | 30 |
| Item 6. | DIRECTORS, SENIOR MANAGEMENT AND EMPLOYEES | 30 |
| Item 6.A. | Directors and senior management. | 30 |
| Item 6.B. | Compensation. | 33 |
| Item 6.C. | Board practices. | 35 |
| Item 6.D. | Employees. | 35 |
| Item 6.E. | Share ownership. | 36 |
| Item 7. | MAJOR SHAREHOLDERS AND RELATED PARTY TRANSACTIONS. | 39 |
| Item 7.A. | Major shareholders. | 39 |
| Item 7.B. | Related party transactions. | 40 |
| Item 7.C. | Interests of experts and counsel. | 40 |
| Item 8. | FINANCIAL INFORMATION | 40 |
| Item 8.A. | Consolidated statements and other financial information. | 40 |
| Item 8.B. | Significant changes. | 40 |
| Item 9. | THE OFFER AND LISTING. | 40 |
| Item 9.A. | Offer and listing details. | 40 |
| Item 9.B. | Plan of distribution. | 42 |
| Item 9.C. | Markets. | 42 |
| Item 9.D. | Selling shareholders. | 42 |
| Item 9.E. | Dilution. | 42 |
| Item 9.F. | Expenses of the issue. | 42 |
| Item 10. | ADDITIONAL INFORMATION. | 42 |
| Item 10.A. | Share capital. | 42 |
| Item 10.B. | Memorandum and articles of association. | 42 |
| Item 10.C. | Material contracts. | 44 |
| Item 10.D. | Exchange controls. | 44 |
| Item 10.E. | Taxation. | 45 |
| Item 10.F. | Dividends and paying agents. | 46 |
| Item 10.G. | Statement by experts. | 46 |
| Item 10.H. | Documents on display. | 46 |
| Item 10.I. | Subsidiary information. | 46 |
| Item 11. | QUANTITATIVE AND QUALITATIVE DISCLOSURE ABOUT MARKET RISK. | 46 |
| Item 11.A. | Quantitative information about market risk. | 46 |
| Item 11.B. | Qualitative information about market risk. | 47 |
| Item 11.C. | Interim periods. | 47 |
| Item 11.D. | Safe harbor. | 47 |
| Item 11.E. | Small business issuers. | 48 |
| Item 12. | DESCRIPTION OF SECURITIES OTHER THAN EQUITY SECURITIES. | 48 |
| Item 12.A. | Debt securities. | 48 |
| Item 12.B. | Warrants and rights. | 48 |
| Item 12.C. | Other securities. | 48 |
| Item 12.D. | American depositary shares. | 48 |
| Item 13. | DEFAULTS, DIVIDEND ARREARAGES AND DELINQUENCIES. | 48 |
| Item 14. | MATERIAL MODIFICATIONS TO THE RIGHTS OF SECURITY HOLDERS AND USE OF PROCEEDS. | 48 |
| Item 15. | CONTROLS AND PROCEDURES. | 48 |
| Item 15.A. | Disclosure controls and procedures. | 48 |
| Item 15.B. | Management’s annual report on internal control over financial reporting. | 48 |
| Item 15.C. | Attestation report of the registered public accounting firm. | 48 |
| Item 15.D. | Changes in internal control over financial reporting. | 49 |
| Item 15T. | CONTROLS AND PROCEDURES. | 49 |
| Item 16. | [RESERVED.] | 49 |
| Item 16A. | AUDIT COMMITTEE FINANCIAL EXPERT. | 49 |
| Item 16B. | CODE OF ETHICS. | 49 |
| Item 16C. | PRINCIPAL ACCOUNTANT FEES AND SERVICES. | 49 |
| Item 16D. | EXEMPTIONS FROM THE LISTING STANDARDS FOR AUDIT COMMITTEES. | 49 |
| Item 16E. | PURCHASES OF EQUITY SECURITIES BY THE ISSUER AND AFFILIATED PURCHASERS. | 49 |
| Item 17. | FINANCIAL STATEMENTS. | 49 |
| Item 18. | FINANCIAL STATEMENTS. | 50 |
| Item 19. | EXHIBITS. | 50 |
| SIGNATURES | 51 |
NOTE TO US READERS - DIFFERENCES REGARDING THE DEFINITIONS OF RESOURCE AND RESERVE ESTIMATES IN THE U.S. AND CANADA
| | |
| Mineral Reserve | The terms “mineral reserve,” “proven mineral reserve” and “probable mineral reserve” used in Starfield Resources Inc.’s (the “Registrant”) disclosure are Canadian mining terms that are defined in accordance with National Instrument 43-101 - Standards of Disclosure for Mineral Projects (“NI 43-101”) under the guidelines set out in the Canadian Institute of Mining, Metallurgy and Petroleum (the “CIM”) Best Practice Guidelines for the Estimation of Mineral Resource and Mineral Reserves (the “CIM Standards”), adopted by the CIM Council on November 23, 2003. These definitions differ from the definitions in the United States Securities and Exchange Commission (the “SEC”) Industry Guide 7 under the Securities Act of 1933, as amended (the “Securities Act”). Under Industry Guide 7 standards, mineralization may not be classified as a “reserve” unless the determination has been made that the mineralization could be economically and legally produced or extracted at the time the reserve determination is made. Under Industry Guide 7 standards, a “final” or “bankable” feasibility study is required to report reserves, the three-year historical average price is used in any reserve or cash flow analysis to designate reserves and the primary environmental analysis or report must be filed with the appropriate governmental authority. |
| Mineral Resource | The terms “mineral resource,” “measured mineral resource,” “indicated mineral resource” and “inferred mineral resource” used in the Registrant’s disclosure are Canadian mining terms that are defined in accordance with NI 43-101 under the guidelines set out in the CIM Standards; however, these terms are not defined terms under Industry Guide 7 and are normally not permitted to be used in reports and registration statements filed with the SEC. Investors are cautioned not to assume that any part or all of mineral deposits in these categories will ever be converted into reserves. “Inferred mineral resources” have a great amount of uncertainty as to their existence, and great uncertainty as to their economic feasibility. It cannot be assumed that all or any part of an inferred mineral resource will ever be upgraded to a higher category. Under Canadian rules, estimates of inferred mineral resources may not form the basis of feasibility or pre-feasibility studies, except in rare cases. Investors are cautioned not to assume that all or any part of an inferred mineral resource exists or is economically mineable. |
Accordingly, information contained in this report containing descriptions of the Registrant’s mineral deposits may not be comparable to similar information made public by U.S. companies subject to the reporting and disclosure requirements under the United States federal securities laws and the rules and regulations thereunder.
PART I
| ITEM 1. | IDENTITY OF DIRECTORS, SENIOR MANAGEMENT AND ADVISERS. |
| Item 1.A. | Directors and Senior Management. |
No disclosure required.
No disclosure required.
No disclosure required.
| ITEM 2. | OFFER STATISTICS AND EXPECTED TIMETABLE. |
| | Item 2.A.Offer statistics. |
Not Applicable
| Item 2.B. | Method and expected timetable. |
Not Applicable
| Item 3.A. | Selected financial data. |
The information in Table No. 1 was extracted from the more detailed financial statements and related notes included herein and should be read in conjunction with such financial statements and with the information appearing under the heading ITEM 5, “OPERATING AND FINANCIAL REVIEW AND PROSPECTS.” Table No. 1 is derived from the financial statements of the Company, which have been prepared in accordance with Canadian Generally Accepted Accounting Principles (“GAAP”), the application of which, in the case of the Company, conforms in all material respects for the periods presented with US GAAP, except as disclosed in notes to the financial statements.
Table No. 1 Selected Financial Data (CDN$ in 000, except per share data) | |
| | | Year Ended 2/28/09 | | | Year Ended 2/29/08 | | | Year Ended 2/28/07 | | | Year Ended 2/28/06 | | | Year Ended 2/28/05 | |
| General and Administrative Expenses | | $ | 3,455 | | | $ | 5,132 | | | $ | 3,113 | | | $ | 2,340 | | | $ | 1,932 | |
| Net Income (Loss) | | $ | (3,142 | ) | | $ | (11,840 | ) | | $ | (2,100 | ) | | $ | (2,696 | ) | | $ | (1,922 | ) |
| Basic and diluted Earnings (Loss) Per Share | | $ | (0.01 | ) | | $ | (0.04 | ) | | $ | (0.01 | ) | | $ | (0.02 | ) | | $ | (0.02 | ) |
| Net Income (Loss) US GAAP | | $ | (28,347 | ) | | $ | (25,010 | ) | | $ | (21,484 | ) | | $ | (14,731 | ) | | $ | (11,830 | ) |
| Basic and diluted EPS (Loss) US GAAP | | $ | (0.09 | ) | | $ | (0.08 | ) | | $ | (0.11 | ) | | $ | (0.11 | ) | | $ | (0.11 | ) |
| Wtg. Avg. No. Shares US GAAP | | | 319,325 | | | | 298,702 | | | | 189,474 | | | | 139,439 | | | | 108,333 | |
| Dividends Per Share | | $ | 0 | | | $ | 0 | | | $ | 0 | | | $ | 0 | | | $ | 0 | |
| Dividends Per Share US GAAP | | $ | 0 | | | $ | 0 | | | $ | 0 | | | $ | 0 | | | $ | 0 | |
| Wtg. Avg. No. Shares Cdn GAAP | | | 319,325 | | | | 298,702 | | | | 189,474 | | | | 139,439 | | | | 108,333 | |
Working Capital(1) | | $ | 4,145 | | | $ | 10,819 | | | $ | (1,913 | ) | | $ | 803 | | | $ | 840 | |
| Mineral Properties | | $ | 105,379 | | | $ | 76,664 | | | $ | 63,581 | | | $ | 46,375 | | | $ | 34,051 | |
| Long Term Debt | | $ | 9 | | | $ | 69 | | | $ | 185 | | | Nil | | | Nil | |
| Long Term Debt (US GAAP) | | $ | 9 | | | $ | 69 | | | $ | 185 | | | Nil | | | Nil | |
| Shareholder’s Equity | | $ | 105,042 | | | $ | 85,996 | | | $ | 60,942 | | | $ | 45,553 | | | $ | 34,855 | |
| Capital Shares | | $ | 120,918 | | | $ | 102,513 | | | $ | 72,516 | | | $ | 56,768 | | | $ | 43,249 | |
| Capital Shares (US GAAP) | | $ | 129,116 | | | $ | 109,961 | | | $ | 78,998 | | | $ | 61,655 | | | $ | 46,761 | |
| Total Assets | | $ | 111,046 | | | $ | 90,315 | | | $ | 65,064 | | | $ | 48,923 | | | $ | 35,689 | |
| Total Assets (US GAAP) | | $ | 8,361 | | | $ | 13,651 | | | $ | 1,483 | | | $ | 2,549 | | | $ | 1,638 | |
| | (1) | Current assets less current liabilities |
Exchange Rates
In this Annual Report, unless otherwise specified, all dollar amounts are expressed in Canadian Dollars (CDN$). The Government of Canada permits a floating exchange rate to determine the value of the Canadian Dollar against the U.S. Dollar (US$).
Table No. 2 sets forth the exchange rates for the Canadian Dollar at the end of five most recent fiscal years ended February 28th or 29th, the average rates for the period, and the range of our high and low rates for the period.
For purposes of this table, the rate of exchange means the noon buying rate in New York City for cable transfers in foreign currencies as certified for customs purposes by the Federal Reserve Bank of New York. The table sets forth the number of Canadian Dollars required under that formula to buy one U.S. Dollar. The average rate means the average of the exchange rates on the last day of each month during the period.
Table No. 2 U.S. Dollar/Canadian Dollar | |
| Period | | Average | | | High | | | Low | | | Close | |
| April 2009 | | $ | 1.22 | | | $ | 1.26 | | | $ | 1.19 | | | $ | 1.19 | |
| March 2009 | | $ | 1.26 | | | $ | 1.30 | | | $ | 1.22 | | | $ | 1.26 | |
| February 2009 | | $ | 1.25 | | | $ | 1.27 | | | $ | 1.21 | | | $ | 1.27 | |
| January 2009 | | $ | 1.22 | | | $ | 1.27 | | | $ | 1.18 | | | $ | 1.24 | |
| December 2008 | | $ | 1.23 | | | $ | 1.30 | | | $ | 1.20 | | | $ | 1.22 | |
| November 2008 | | $ | 1.22 | | | $ | 1.29 | | | $ | 1.15 | | | $ | 1.24 | |
Fiscal Year Ended 2/28/09 | | $ | 1.10 | | | $ | 1.30 | | | $ | 0.98 | | | $ | 1.27 | |
| Fiscal Year Ended 2/29/08 | | $ | 1.05 | | | $ | 1.18 | | | $ | 0.92 | | | $ | 0.98 | |
| Fiscal Year Ended 2/28/07 | | $ | 1.14 | | | $ | 1.19 | | | $ | 1.10 | | | $ | 1.17 | |
| Fiscal Year Ended 2/28/06 | | $ | 1.19 | | | $ | 1.26 | | | $ | 1.14 | | | $ | 1.14 | |
| Fiscal Year Ended 2/28/05 | | $ | 1.28 | | | $ | 1.40 | | | $ | 1.18 | | | $ | 1.23 | |
| Item 3.B. | Capitalization and indebtedness. |
No disclosure required.
| Item 3.C. | Reasons for the offer and use of proceeds. |
No disclosure required.
The securities of the Company are highly speculative and subject to a number of risks. These risks might impede the Company from reaching its business objectives, which include successfully exploring and developing further mineral resources. It should be noted that the following risk factors are not an exhaustive list and other risk factors may apply.
The Company Has Engaged in Exploration and Has No History of Development Activities
The Company has no history of development of its Resource Property. The Company may experience higher costs than budgeted and unexpected delays. The Company must also continue to locate and retain qualified personnel to conduct its exploration work. Further adverse changes in any one of such factors or the failure to locate and retain such personnel will have an adverse effect on the Company, its business and results of operations.
The Company Currently Depends on a Single Property
The Company’s only material mineral property is the Ferguson Lake Property. Unless the Company acquires or develops additional properties or projects, the Company will be solely dependent upon the operation of the Resource Property for its revenue and profits, if any.
The Mining Industry Is Speculative and of a Very High Risk Nature
Mining activities are speculative by their nature and involve a high degree of risk, which even a combination of experience, knowledge and careful evaluation may not be able to overcome. The Company’s drilling activities are in the advanced exploration stage, and such advanced exploration is subject to the risk that previously reported inferred mineralization is not economic. If this occurs, the Company’s existing resources may not be sufficient to support a profitable mining operation.
The Company’s mining activities are subject to a number of factors beyond its control, including, intense industry competition and changes in economic conditions (including some operating costs, such as electrical power). Its operations are subject to all the hazards normally incidental to exploration, development and production of base and precious metals, any of which could result in work stoppages, damage to or loss of property and equipment and possible environmental damage. An adverse change in any one of such factors, hazards and risks would have a material adverse effect on the Company, its business and results of operations. This might result in the Company not meeting its business objectives.
The Exploration Work Conducted on the Resource Property May Not Result in the Discovery of Commercial Quantities of Nickel, Copper, Cobalt, Platinum or Palladium deposits.
Problems, such as unusual and unexpected rock formations, environmental pollution, flooding, cave-ins, and industrial accidents, are involved in mineral exploration and often result in unsuccessful exploration efforts. In such a case, the Company would be unable to complete its business plan and any funds spent on such exploration will probably be lost.
Going Concern; The Company is Experiencing Negative Cash Flow
The Company’s ability to continue as a going concern is dependent on its ability to successfully develop and operate the Resource Property and secure additional financing. The Company currently has limited cash on hand and no revenue from operations. Since it is experiencing negative cash flow, its cash reserves are being depleted. The success of the Company’s business will depend upon its ability to generate cash flow from operations to a point where it becomes profitable. Presently, the Company must obtain additional funds through the sale of equity and/or debt capital. Alternatively, the Company could offer an interest in its mining properties to be earned by another party or to obtain project or operating financing from financial institutions, neither of which is currently intended. Accordingly, if the Company cannot commence commercial operations, increase its’ cash flow and become profitable, it will have to raise additional funds. If such funds are not available on acceptable terms, there would be a material adverse effect on the Company, its business and results of operations, and it may not achieve its business objectives.
The Mining Industry Is Competitive
The mineral exploration and mining business is competitive in all phases of exploration, development and production. The Company competes with a number of other entities in the search for and acquisition of mineral properties, many of whom have more advanced properties that are better able to attract equity investments and other capital. As a result of this competition, the Company may be unable to acquire attractive properties in the future on terms it considers acceptable or to recruit and retain qualified employees, which could have an adverse effect of the Company, its business and results of operations.
The Company is Dependent on Various Key Personnel
The Company’s success is dependent upon the performance of key personnel. The Company does not maintain life insurance for key personnel and the loss of the services of senior management or key personnel could have a material and adverse effect on the Company, its business and results of operations.
The Company’s Activities might Suffer Losses from or Liabilities for Risks which are not Insured
Hazards, such as unusual or unexpected geological formations and other conditions, are inherent in mineral exploration and development. The Company may become subject to liability for pollution, cave-ins or hazards against which it cannot insure or against which it may elect not to insure. The occurrence of such liabilities could have a material, adverse effect on the Company’s financial position and results of operation.
The Company currently carries general commercial liability, tenant’s legal liability, building, contents and contractors equipment insurance, as well as directors’ and officers’ insurance. Additionally, all contractors carry their own general and equipment liability insurance. Although the Company intends to maintain liability insurance in an amount which it considers adequate, the nature of these risks is such that liabilities might exceed policy limits, the liabilities and hazards might not be insurable against, or the Company might not elect to insure itself against such liabilities due to high premium costs or other reasons.
The Company’s insurance will not cover all the potential risks associated with a mining company’s operations. The Company may also be unable to maintain insurance to cover these risks at economically feasible premiums. Insurance coverage may not continue to be available or may not be adequate to cover any resulting liability. Moreover, insurance against risks such as environmental pollution or other hazards as a result of exploration and production is not generally available to the Company or to other companies in the mining industry on acceptable terms. The Company might also become subject to liability for environmental occurrences, pollution or other hazards for which it may not be insured against, or for which the Company may elect not to insure against because of premium costs or other reasons. Losses from these events may cause the Company to incur significant costs that could have a material adverse effect upon its financial condition and results of operations.
There is Uncertainty of the Nature and Amount of the Company’s Resources
While the Company has carried out, and will carry out on an annual basis, estimates of its mineral resources, this should not be construed as a guarantee that such estimates are accurate. If such estimates prove to be materially inaccurate, the Company’s revenues, operations and financial condition could be materially adversely affected.
The Company may Experience Uncertainty in Marketing the Nickel, Copper, Platinum, Palladium and Cobalt which it may Potentially Mine
The Company’s future revenues are expected to be in large part derived from the mining and sale of nickel, copper, platinum, palladium and cobalt. The price of these metals fluctuate and are affected by numerous factors beyond the Company’s control, including international economic and political trends, expectations of inflation, currency exchange fluctuations, interest rates, global or regional consumption patterns, speculative activities and increased production due to new mine development and improved mining and production methods. Any unfavorable change in these factors could cause the Company’s revenues, operations and financial condition to be materially adversely affected.
The Company’s Activities are Subject to Extensive Governmental Regulation and Permitting Requirements
Exploration, development and mining of minerals are subject to extensive federal, provincial and local laws and regulations governing acquisition of the mining interests, prospecting, development, mining, production, exports, taxes, labour standards, occupational health, waste disposal, toxic substances, water use, land use, land claims of First Nations and local people, environmental protection and remediation, endangered and protected species, mine safety and other matters. These laws and regulations are administered by various governmental authorities including the Governments of Canada, Nunavut and the Kivalliq Designated Inuit Organizations.
In addition, the current and future operations of the Company, from current exploration through future development activities and production, require permits, licenses and approvals from some of these governmental authorities. The Company has obtained all government licenses, permits and approvals necessary for the operation of its business to date, however, additional licenses, permits and approvals may be required. The failure to obtain any licenses, permits or approvals that may be required, or the revocation of existing ones would have a material and adverse effect on the Company, its business and results of operations.
The Company’s Activities are Subject to Aboriginal Consultation and Accommodation
In 1993, Canada entered into the Nunavut Land Claims Agreement with the Inuit of the Nunavut Settlement Area, which resulted in the creation of the Nunavut Territory. Pursuant to that agreement, in order for the Company to proceed with exploitation of minerals from its properties, it may be required to enter into an Inuit Impact and Benefit Agreement (“IIBA”). The terms of such an IIBA are uncertain, as they would be the product of future negotiations between the Company and the Kivalliq Inuit Association.
Although the Company reviewed its title to properties in which it has a material interest, there is no guarantee that title to such properties will not be challenged or impugned. Title to, and the area of, resource claims may be disputed. The Company’s interests may be subject to prior unregistered agreements or transfers, aboriginal land claims, aboriginal rights, treaty rights, and title may be affected by undetected defects. Although a land claim agreement has been reached between the Inuit and the Canadian government, no modern agreement has been reached with any First Nation or Métis group which might have an interest in the area of the Company’s properties. There may be valid challenges to the title of the Company’s properties, which, if successful, could impair future development of the properties and/or the Company’s operations.
The Company’s Activities are Subject to Environmental Risks
All phases of the Company’s operations are subject to federal, provincial and local environmental regulation in the various jurisdictions in which it operates, which could potentially make operations expensive or prohibit them all together. These regulations mandate, among other things, the maintenance of air and water quality standards and land reclamation. They also set forth limitations on the generation, transportation, storage and disposal of solid and hazardous waste. Environmental legislation is evolving in a manner which will require stricter standards and enforcement, increased fines and penalties for non-compliance, more stringent environmental assessments of proposed projects and a heightened degree of responsibility for companies and their officers, directors and employees. Future changes in environmental regulations or the failure to comply with such regulations, may adversely affect the Company’s operations, its business and results of operations.
The Company’s Directors and Officers may have Conflicts of Interest
Certain of the directors and officers of the Company also serve as directors, officers and/or significant shareholders of other companies involved in natural resource exploration and development. Such directors and officers may have a conflict of interest with respect to the interests of these other entities and the Company, which could have a material adverse affect on the Company, its business or results of operations.
Certain Groups are Opposed to Mining
In North America there are organizations opposed to mining. The Company believes it has the support of representatives from the local communities and Inuit people nearest the Ferguson Lake Property and from various levels of the federal government and the Nunavut government having jurisdiction over the Resource Property. Although the Company intends to comply with all environmental laws and permitting obligations in conducting its business, there is a risk that those opposed to its operation at the Ferguson Lake Property will attempt to interfere with the Company’s operations, whether by legal process, regulatory process or otherwise. Such interference could have a negative impact on the Company’s ability to operate its properties in the manner that is most efficient or appropriate, if at all, and any such impact could materially adversely affect the financial condition and results of operations of the Company.
| ITEM 4. | INFORMATION ON THE COMPANY. |
| Item 4.A. | History and development of the Company. |
Starfield is a Canadian-based natural resource exploration company. The Company was incorporated on April 22, 1994, under the Business Corporations Act (Alberta), and changed its name to Starfield Resources Inc. in 1997. On October 27, 2006, the Company filed articles of continuance in British Columbia, which are filed as an exhibit to the Company’s filings with the SEC. The Company is also governed by the Business Corporations Act (British Columbia) and a reporting issuer in the provinces of British Columbia, Alberta and Ontario and in the North West Territories. The Company’s registered office is located at 2900-550 Burrard Street, Vancouver, British Columbia V6C 0A3, and the head office is located at 130 Adelaide Street West, Suite 2210, Toronto, Ontario M5H 3P5. In December 1999, the Company acquired a 100% interest in certain mineral claims in the Ferguson Lake area of the Nunavut Territory, Canada known as the “Resource Property” or the “Ferguson Lake Property” and a five-kilometer area of influence around the claims.
The Ferguson Lake Property covers more than 0.6 million acres. Since 1999, the Company has completed more than 151,000 metres of diamond drilling in 410 holes. The Company has received a National Instrument 43-101 report on the Ferguson Lake Property entitled Preliminary Assessment of the Ferguson Lake Project, Nunavut Territory, Canada dated April 30, 2008 and authored by Graham G. Clow, P.Eng, R. Dennis Bergen, P.Eng, Jason J. Cox, P.Eng, G. Bryn Harris, Ph.D., FIMM and James G. Lavigne, P.Geo., M.Sc. (the “2008 Report”). The 2008 Report updates the resource estimates provided in the report dated July 15, 2007. The 2008 Report and earlier reports are filed on SEDAR (www.sedar.com). The Company, which was listed on the TSX Venture Exchange, applied to list its common shares on the TSX. That application was approved, and on April 24, 2007 the Company’s common shares began trading on the TSX under the symbol “SRU”.
Capital Expenditures
Fiscal 2007: $16.4 million for mineral property exploration and acquisition of equipment.
Fiscal 2008: $13.1 million for mineral property exploration and acquisition of equipment.
Fiscal 2009: $25.0 million for mineral property exploration and acquisition of equipment.
| Item 4.B. | Business overview |
The Company is an advanced exploration company focused on the Ferguson Lake nickel-copper-platinum-palladium-cobalt property located in Nunavut, Canada. The Company’s overall business objective is to explore, develop and commence production on the Ferguson Lake Property. Significant exploration and diamond drilling was undertaken during the year. The diamond drilling was primarily designed to upgrade the confidence in the existing copper-nickel-cobalt sulphide mineralization through a series of interspaced and extended drill holes. Additionally, as in the fiscal 2008 program, a portion of the drilling was extended beneath the massive sulphide resource in an effort to further define the geometry and continuity of the low-sulphide platinum group metals (“PGM”) occurrence. The massive sulphide mineralization comprising the West Zone is currently being remodelled, and at the same time existing data is being utilized to construct the initial model for the low sulphide PGM mineralization located in the footwall, below the West Zone.
The Corporation has recently completed flying a combined DigHEM electro-magnetic survey and Horizontal Magnetic Gradiometer to further delineate possible diamond and gold targets in the vicinity of the Y Lake Trend. Although the results are still pending, the survey is expected to identify high potential geologic structures or horizons at a higher degree of resolution than the previous airborne survey. Surveying was completed by the beginning of May with a preliminary interpretation available in due course, typically 8 to 10 weeks after completion of the survey. Pending the results of this airborne survey, additional ground reconnaissance work, rock-chip sampling of targeted areas and closely spaced follow-up till sampling would be the next step. Additional diamond drilling will also take place if warranted.
Competitive Conditions
Competition in the mineral exploration and production industry is intense. The Company competes with other mineral exploration companies, many of whom have greater financial resources and technical facilities for the acquisition and development of, and production from, mineral concessions, claims, leases and other interests, as well as for the recruitment and retention of qualified employees and consultants. Based on the Company’s management’s assessment, the Company’s competitors include other small to medium sized metallic mineral exploration companies that are looking for similar resource properties. Companies actively exploring in the Ferguson Lake area include, among others, De Beers Canada Exploration Inc., Rio Tinto and BHP Billiton Diamonds Inc.
Material Effects of Government Regulations
The Company’s current and anticipated future operations, including further exploration and/or production activities require permits from numerous Canadian federal, provincial and territorial governmental authorities. Such operations are subject to various laws governing land use, the protection of the environment, mining production, exports, taxes, labor standards, occupational health, waste disposal, toxic substances, well safety and other matters. Unfavorable amendments to current laws, regulations and permits governing operations and activities of resource exploration companies, or more stringent implementation thereof, could have a materially adverse impact on the Company and cause increases in capital expenditures which could result in a cessation of operations.
Environmental legislation is evolving in a manner such that standards, enforcement, fines and penalties for non-compliance are increasingly stringent. Companies and their directors, officers and employees carry a heightened degree of responsibility in respect of environmental assessments. The cost of compliance with changes in government regulations has the potential to reduce the profitability of future operations.
| Item 4.C. | Organizational structure. |
The Company was incorporated under the Business Corporations Act (Alberta, Canada) on April 22, 1994, registered in the province of British Columbia as an extra-provincial company on April 22, 1998 and in the Nunavut Territory, Canada as an extra-territorial corporation on March 18, 2003. The Alberta registration was discontinued and continued in British Columbia on October 27, 2006. The Company’s major business activity is the exploration and future development of mineral properties, particularly its Ferguson Lake nickel-copper-cobalt-platinum-palladium project in Nunavut, Canada. All of the Company’s properties are located in Canada.
The Company does not belong to any groups and does not have any subsidiaries.
| Item 4.D. | Property, plant and equipment. |
The Company’s executive offices are located at 130 Adelaide Street West, Suite 2210, Toronto, Ontario, Canada M5H 3P5. Its registered office is located at 2900-550 Burrard Street, Vancouver, British Columbia V6C 0A3.
Project Description and Location
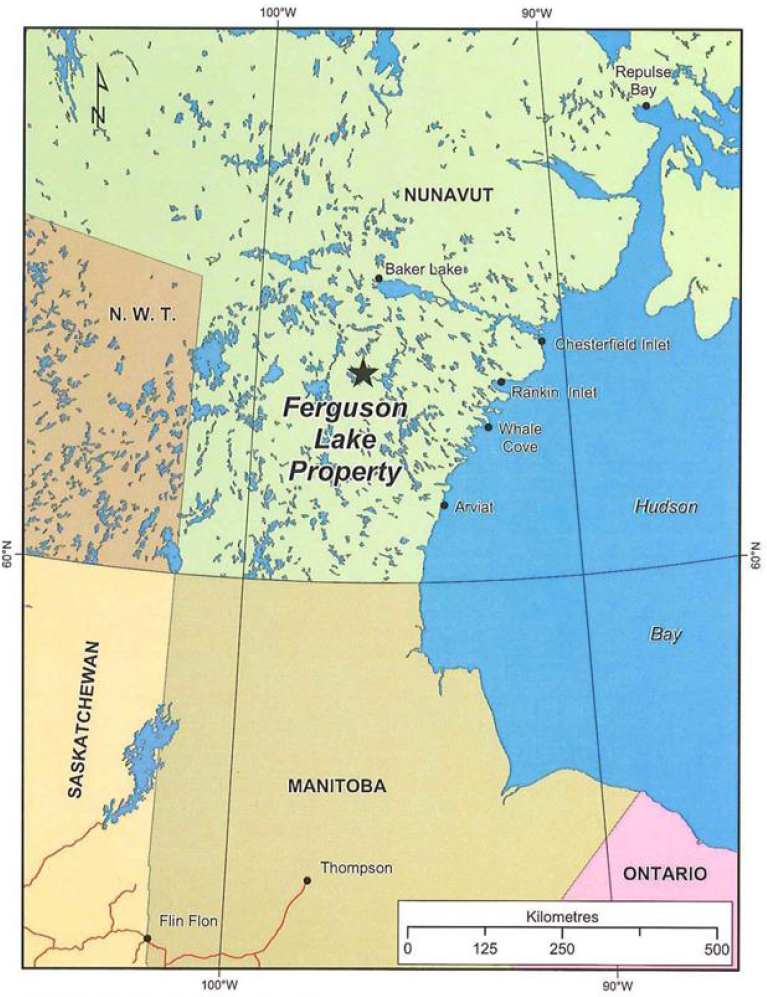
The Ferguson Lake Property consists of 266 mineral claims comprising an area of 252,929 hectares (625,000 acres) in the Kivalliq region of southern Nunavut Territory some 240 kilometres west of Rankin Inlet and 160 kilometres south-southwest of Baker Lake. erguson Lake, central to the large property area, is midway between Yathkyed and Kaminuriak Lakes. The Ferguson Lake Property measures 125 kilometres in an east-west direction and approximately 80 kilometres north-south. These mineral claims are issued pursuant to the Canada Mining Regulations, C.R.C.C. 1516.
All of the mineral claims are contiguous and extend east, west, south and northwest of Ferguson Lake between latitudes 62° 30’ and 63° 15’ North and longitudes 96° 00’ and 98° 15’ West.
In 2006 and 2007, the Company contracted McElhanney Associates Land Surveying Ltd., a Canada Land Surveyor, to conduct Canadian Legal Survey (“CLS”) work at the Ferguson Lake Property so that certain mineral claims could be converted to mining leases as required under the Canada Mining Regulations. The work entailed a detailed CLS of the key mineral claims hosting the mineral resources at the Ferguson Lake Property. The CLS was completed in 2007.
The Mining Recorder administers most of the subsurface rights of Crown Lands in Nunavut and grants the mining lease status of mineral claims. Mining application and registry is an ongoing process. The Company’s mining claims are in good order and are maintained as such.
Parts of the current Resource Property were initially located in 1997 by way of one Prospecting Permit covering the northwest quarter of NTS map-area, and three contiguous mineral claims. Additional mineral claims were located in 1998 and 1999 to cover the area of the Prospecting Permit which expired February 1, 2000. A number of these claims were allowed to lapse following detailed prospecting in 2001. The mineral claims acquired by the Company prior to 2003 included the area of a former Mining Lease previously held by Canadian Nickel Company, Ltd., a subsidiary of Vale Inco Ltd (formerly Inco Limited, “Inco”).
Most of the mineral claims comprising the expanded property area were located between January and November of 2005.
Mineral claims in Nunavut are valid for two years from the recording date and may be renewed for an additional year by completing representation (assessment) work in the amount of $4.00/acre within the initial two-year period. Annual work in the amount of $2.00/acre is required to renew the claims beyond the third year. Representation work for the various mineral claims has been routinely filed on an annual basis since 1999.
Land use permits, including an Exploration Permit, Right of Way for winter transport, a Water Licence, and a Commercial Lease, enable exploration work to be conducted over the entire property area. These permits have been issued or renewed by the Kivalliq Inuit Association for parts of the Resource Property covering Inuit owned lands and by Indian and Northern Affairs Canada for Crown lands. Preliminary environmental studies, conducted by Rescan Environmental Services Ltd. on behalf of the Company, have been ongoing since 1999.
The majority of exploration work completed since 1999 has been directed to several mineral zones east and west of Ferguson Lake.
The Company is not aware of any environmental, infrastructure, or permitting issues which would adversely affect the potential viability of the Ferguson Lake Property. The Company can not provide any assurance that agencies or government departments will approve future mine production at the Ferguson Lake Property.
The Company is in compliance and in accordance with applicable agency requirements and government regulators’ requirements and continues to operate the Ferguson Lake Property by holding all necessary permits, which are in good standing, or holding extensions to existing permits or pursuing applications being processed with the applicable authority. The Company has paid all application fees, costs, rents and securities deposits relating to these permits, extensions or applications.
Acquisition of Property Interest
The Company entered into an option agreement in February 1999 to purchase a 100% interest in the mineral claims comprising part of the Ferguson Lake Property (the “Original Ferguson Lake Property”) from a syndicate of the vendors (the “Ferguson Lake Syndicate”) in exchange for an initial cash payment, the issuance of common shares and scheduled work commitments. The issuance of additional common shares to the Ferguson Lake Syndicate was based on incurred exploration expenditures. The Company’s current 100% earned interest in the Original Ferguson Lake Property is subject to a 3% net smelter royalty (“NSR”) on potential future mineral production, a 3% gross overriding royalty on any diamond production and a $25,000 annual advance royalty payment. The Company has the right to purchase 1% of the NSR for $1 million for a period of 180 days following receipt of a positive feasibility study on the Original Ferguson Lake Property recommending commercial production. Subsequent to the purchase of the Original Ferguson Lake Property, the Company staked certain other claims that comprise the Ferguson Lake Property, and these additional staked claims are not subject to the NSR.
Accessibility, Climate, Local Resources, Infrastructure and Physiography
Access to the Ferguson Lake Property is by air from Rankin Inlet, Baker Lake, Thompson, or Churchill, all of which have scheduled airline service and offer a number of facilities. In 2008, the Company completed construction of an approximately 800 m dirt airstrip capable of handling wheel equipped aircraft.
Limited supplies and services are available in Rankin Inlet and Baker Lake, and the staging points for recent programs have been Thompson, Manitoba, 765 kilometres south of Ferguson Lake, and Yellowknife, Northwest Territories, 900 kilometres west. Both of these communities, with populations of about 15,000, are accessible from southern Canada by highway, have scheduled airline service and are major exploration and mining supply centres.
Previous and current programs involved shipping supplies, equipment and fuel by larger aircraft to an ice airstrip established on Ferguson Lake, and fuel and other supplies have also been transported to the Resource Property by winter Cat train from Baker Lake, Rankin Inlet, and Arviat. Communications in this remote area are made possible by satellite, which provides for telephone and high speed internet connections.
A subarctic climate is characterized by long winters (October through April) with mean temperatures of -30 degrees C; a short summer season with mean temperatures in the 15 degrees C range extends from July through mid-September. Mineral exploration is most conveniently carried out during the summer months and between March and May when geophysical surveys and diamond drilling can make use of ice-covered lakes.
There is little or no infrastructure in this remote part of Canada other than abundant water supplies. The Nunavut government has been studying the possibility of extending an all-weather road into the territory from northern Manitoba. The potential route would be approximately 150 kilometres east of Ferguson Lake, making a “spur road” to Ferguson Lake a reasonable possibility. Diesel generated electrical power has been used for past mining operations in the general area, including at Cullaton Lake which is 200 kilometres south of Ferguson Lake. Annual re-supply to the communities of Rankin Inlet, Arviat and Baker Lake is done by commercial barge service from Churchill Manitoba or Montreal, Quebec. Daily flights into Rankin Inlet from Southern Canada bring routine supplies and passenger service.
The area is one of low relief, featuring numerous smaller lakes and a few large river systems, notably Kazan and Ferguson Rivers. Yathkyed and Ferguson Lakes are 141 and 114 metres above sea level, respectively, and maximum elevations in the surrounding area range from 200 to 275 metres. Elevations within the current property area average less than 200 metres and range from slightly less than 100 metres at the Resource Property’s eastern boundary to 290 metres north of Yathkyed Lake. The orientations of Ferguson Lake and a number of smaller lakes reflect the dominant south-easterly glacial movement. Bedrock is fairly well exposed on numerous low hills and ridges in contrast to lower areas where bedrock may be obscured by between 6 and 25 metres of glacial debris. The terrain is typical of the barren grounds; the tree line is 150 km south of Ferguson Lake and vegetation consists principally of moss, lichen, dwarf birch and Labrador tea. Wildlife includes caribou, arctic fox, musk ox and barren ground grizzly bear.
Regional Geology
The Ferguson Lake Property is situated in the Western Churchill Province, an Archean craton which is divided into the lithologically distinct Rae and Hearne domains by the northeast-trending Snowbird Tectonic Zone.
Ferguson Lake, 100 km east of the Snowbird Tectonic Zone, is more precisely within the northwestern Hearne. The northwestern Hearne domain is bounded by northeast-trending, regional shear zones including the Tulemalu Fault Zone (part of the Snowbird Tectonic Zone) on the north and by the northeastern extension of the Tyrrell Shear Zone on the southeast.
The Ferguson Lake area includes the most northerly extension of the northeast-trending Yathkyed greenstone belt, mainly present as strongly deformed, gneissic Archean supracrustal and intrusive rocks and variably deformed Proterozoic plutons and dykes. The deformed sequences are metamorphosed to upper amphibolite facies, and protoliths of the older supracrustal rocks are comparatively rare. Where seen, they consist principally of mafic metavolcanics with cherty iron formations and lesser intermediate to felsic metavolcanics and clastic metasedimentary rocks.
The Western Churchill Province, because of its diverse geological environments which span a 1.5-billion-year interval, is host to a variety of mineral deposit types. Known mineral deposits, prospects and occurrences include mafic-ultramafic-related magmatic nickel-copper-cobalt-PGM, orogenic (mesothermal) lode gold, volcanic hosted massive sulphides, syngenetic and epigenetic uranium deposits and prospects, quartz-carbonate veins containing precious metals and diamonds associated with Phanerozoic kimberlite intrusions.
Property Geology
The oldest rocks in the southern and northeastern parts of the Ferguson Lake Property consist of east to northeast trending, mafic and intermediate volcanic rocks of Archean age that have undergone upper amphibolites grade metamorphism, and represent the northeastern continuation of the Yathkyed greenstone belt. These supracrustal rocks, which contain sulphide, oxide and silicate banded iron formations in a number of localities, are interlayered with more widespread quartz-feldspar-biotite-(hornblende) gneiss and paragneiss, and all units have been intruded by Archean tonalities, granite gneisses and smaller, complex, coarse-grained pegmatite bodies. A variety of younger (Proterozoic) dykes, sills and irregular intrusions cut the older rocks.
Pronounced layering in the supracrustal rocks trends east-northeast to northeast and dips moderately to steeply north. Medium to coarse grained, massive to weakly foliated gabbros, containing +60% hornblende and termed hornblendites in earlier reports, mainly occur within, and are conformable with, the layering in amphibolite-hornblende-biotite gneiss sequences. Petrographic studies suggest that these hornblende-rich gabbros, which are the principal host rocks for known base metal sulphides and PGM, may be metamorphic products of original tholeiitic mafic or ultramafic (pyroxenite-peridotite) intrusions.
All of the foregoing are cut by younger (mid-Proterozoic) gabbros and diabases and by late Proterozoic syenites, quartz-feldspar porphyries and fine-grained, locally biotite-rich mafic dykes.
Younger syenites, part of the Martell Syenites, and distinctly post-mineral mafic dykes, are also evident in many of the diamond drill holes completed to date. Larger bodies of this syenite occur near the east shore of Ferguson Lake and a larger body underlying Uligattilik Hill borders the Resource Property’s eastern boundary.
A structural mapping program in the areas of two of the principal mineralized zones, East and West Zones, indicated that most of the Archean rocks were subjected to high grade metamorphism and deformation. Intricate folding of the gneissic rocks and the hornblendites (gabbros) has produced antiform and synform structures which are particularly evident in the area east of Ferguson Lake. The East and West mineralized zones have in the past been interpreted as being within the south limb of a recumbent, doubly-plunging synform or canoe-shaped structure modified by numerous faults and shear zones which offset the various lithologic units.
Mineralization
The various mineral zones identified to date in that part of the Resource Property bordering Ferguson Lake are magmatic nickel-copper sulphide deposits which also contain cobalt and PGM values. Nickel-copper-cobalt-PGM mineralization at Ferguson Lake is hosted mainly by fine- to coarse-grained gabbros which include hornblendites. Three of the mineral zones (East, Central (lake) and West) are at least spatially related to the same east-northeast trending gabbro unit which is between 10 and 600 metres thick and has been traced by intermittent exposures and by diamond drilling over a strike length of more than 12 km east and west of Ferguson Lake. This and the other gabbro units hosting the several other mineral zones dip moderately to steeply north and are generally conformable with enclosing hornblende-rich gneisses.
Better grades of base and precious metals mineralization are present within massive to semi-massive sulphide lenses, pods and stringers which consist of between 80% and 90% pyrrhotite intergrown with very fine-grained pentlandite, lesser chalcopyrite and minor pyrite. Rounded magnetite grains, up to one cm in size, are a common constituent of the sulphide lenses. Better grades are contained within zones having thicknesses of between two and tens of metres.
The most significant drilling results obtained by the Company to date have been from the East and West Zones. Better grades of nickel-copper-cobalt-PGM mineralization within and marginal to the host gabbro intrusion in both of these zones are contained in lenses and pods of massive and semi-massive sulphides which have a lateral extent of 350 metres in the East Zone II to more than 4,000 metres in the West Zone. Two or more parallel lenses, separated by between 5 and 100 metres of lower grade sulphide mineralization and/or unmineralized hostrock, are evident in many of the holes drilled on the West Zone.
Other mineral zones identified east of Ferguson Lake include M Zone, discovered in 2000 and situated 1 kilometre southeast of the East Zone II. This zone was tested by ten inclined holes to test a blind, gently north-dipping Versatile Time Domain Electromagnetic (“VTEM”) conductor. The drilling confirmed that the conductive zone was due to the presence of sulphide minerals within a gabbro, a setting similar to the other known mineral zones. Assay results were not particularly impressive. Further surface geophysical surveys were conducted over this zone in 2004 and three additional holes, drilled to test a new interpretation of geophysical signatures, returned results similar to those obtained from earlier drilling.
Anomaly 51, also known as the Pointed Lake Zone, consists of a northeast-trending, gossanous gabbro approximately 50 metres wide. It is exposed along more than 2,500 metres of strike length, and is located one kilometre south of M Zone. This zone, which contains pods and stringers of massive pyrrhotite with lesser chalcopyrite and pyrite, particularly in its western half, was tested over 1,700 metres of strike length by 1,094 metres of diamond drilling in nine widely-spaced, inclined diamond drill holes in the 1950s. Several holes contained narrow intervals of copper-nickel mineralization; better grades of nickel, copper and cobalt are associated with narrow intervals (0.15 to 2.29 metres) of massive pyrrhotite and pyrite hosted by. No PGM results were reported. Nickel values were generally higher than copper as opposed to results from other zones at Ferguson Lake.
This zone (and its potential extensions) was further tested in 2000 and 2004 by eight holes which were drilled in several locations to test isolated VTEM conductors north and east of the area previously drilled. Only narrow sulphide intervals were encountered.
1999-2004 Exploration Programs
Since 1999, the principal focus of previous and current work has been directed to the West Zone, which has been traced by intermittent bedrock exposures, geophysical surveys and by a considerable amount of diamond drilling over a zone length of several kilometres. The zone has been tested by 72 Inco holes (10,833 metres) between 1951 and 1955 and by more than 95,000 metres of drilling in 234 holes by Starfield since 1999.
Between 1999 and 2004, during which time the West Zone was tested by more than 150 holes plus five wedge holes (for a total of 62,000 metres) drilled over 3 kilometres of strike length. Much of this drilling was designed to expand the zone both to depth and along strike with a number of deeper holes testing the deeper, western part of the zone between sections 52+00W and 68+00W in 2001. As shown in the resource study, most of these holes intersected intervals of several metres containing massive sulphides consisting of copper, nickel, cobalt and PGMs.
Much of the drilling undertaken on the West Zone between 2002 and 2004 was directed to definition drilling in 74 relatively shallow holes (20,200 metres) in the eastern part of the zone between sections 39+00W and 51+000W to better define near-surface sulphide mineralization.
The nature and scope of the 2002 - 2004 drilling programs consisted of collaring drill holes between existing holes such that this part of the West Zone has now been drilled on sections at an average of 30 metre spacings or less. Most holes intersected two or three (and in some cases, up to six), parallel sulphide lenses containing grades of at least 1% combined copper plus nickel, and over minimum hole lengths of 2 metres. Intervals of lower (or zero) grades between the parallel massive sulphide lenses consisting of nickel, copper, cobalt and PGMs. Most of the inclined holes drilled to date are essentially normal to the moderately north-dipping sulphide lenses, and apparent true widths of the various sulphide lenses range from 2 metres to a maximum of 45 metres, with an overall average of 7 metres. The down-dip extent of the various sulphide lenses is variable, and ranges from 20 to 250 metres. Many of the drill sections feature a well mineralized sulphide lens in one hole that may or may not continue through holes drilled up or down-dip of the mineralized lens.
Although most of the exploration effort west of Ferguson Lake has been devoted to the continued evaluation of the West Zone, several other mineralized targets proximal to the West Zone have also undergone limited exploration. Those zones of apparent lesser importance include the West Zone South, which is intermittently exposed over a strike length of approximately one kilometer and is associated with a gossanous gabbro. The West Zone South represents a mineralized target that is subparallel to the West Zone located approximately one kilometer to its south. Previous select surface sampling returned anomalous PGM values.
The South Discovery Zone, a sulphide-bearing gabbro unit some 3 kilometres southwest of 119 Zone has an exposed northeast strike length of 800 metres and is offset by two parallel, northwest-striking faults. Two holes drilled to test the central part of the zone in 1999 intersected 1.5 to 2 metres intervals of anomalous nickel, copper, cobalt and PGMs.
Near the western shore of Ferguson Lake, hole 11310 cut 13.5 metres grading 0.78% copper, 0.88% nickel and 1.44 grams/tonne PGM (palladium and platinum) plus a lower 5.8 metre interval containing 1.36% copper, 0.50% nickel and 0.69 grams/tonne PGM. As a result a further two holes were drilled through ice-covered Ferguson Lake by the Company in the spring of 2000 in an attempt to further test this part of the zone some 40 metres down-dip of the previous intersections. The first hole was abandoned in lake-bottom sediments; the second hole intersected gabbro host rocks over three intervals, but base and precious metals value were low. This zone was further tested by ten holes in 2003 and 2004 as part of the definition drilling program undertaken in the eastern part of the West Zone. A degree of continuity of grades in sulphide lenses was identified and a part of this zone has been incorporated into the revised resource estimates for the West Zone.
2005 to 2008 Exploration Summary
In 2005, the Company’s exploration work included 16,861 metres of diamond drilling in 29 holes plus surface and airborne geophysical surveys. Ten deep holes (11,213 metres) were drilled on three sections to test the “gap” between the 119 Zone and the known western limits of the West Zone. The 119 Zone itself was tested by an additional two holes (2,116 metres). A total of 17 holes (3,523 metres) were completed in the West Zone “Pit Area”. Eight holes were drilled in an attempt to further define footwall PGM mineralization, while the remaining nine holes (1,140 metres) were drilled at various azimuths to provide information on the continuity and consistency of base and precious metal grades for a geostatistical study.
Of particular interest in terms of low-sulphide, footwall PGM mineralization is the 1 metre length of 12.38 grams per tonne palladium and 8.42 grams per tonne platinum encountered in hole FL05-218. Also of interest is the footwall PGM-enriched sulphide lens intercepts that were intersected below the main massive sulphide lenses in four holes, particularly, the 12.02 metre footwall massive sulphide intercept in hole FL04-220 which in addition to enhanced copper and nickel grades, includes 3.74 grams per tonne palladium and 0.31 grams per tonne platinum.
Geophysical surveys undertaken in 2005 included 9,624 line kilometres of helicopter-borne VTEM (Versatile Time Domain Electromagnetic) and magnetics, and surface and borehole time domain pulse electromagnetic surveys on various parts of the Resource Property by Crone Geophysics and Exploration Ltd. Other work completed in 2005 included ongoing metallurgical testwork on drill core samples directed to the recovery of base metals and platinum group elements.
Much of the 2006 exploratory program at Ferguson Lake was directed at detailed infill diamond drilling of the West Zone Pit, West Zone Mid and Pit Extension, West Zone Main and East Zone II. Some 24,330 metres of core was recovered from 110 holes. Two holes, totalling 211 metres, were drilled to collect samples for metallurgical work, and 19 shallow holes totalling 234 metres were drilled for geotechnical purposes. An additional six holes, totalling 657 metres, were drilled at azimuth grid north to test a south dipping magnetic anomaly (termed the Clarke Plate) located in the West Zone Pit Area. Diamond drilling at Ferguson Lake in 2006 aggregated 24,987 metres.
During the fiscal 2007 drilling season, much of the drilling effort was designed to upgrade more of the existing Infered Mineral Resource into the “Measured and Indicated” categories of resources throughout the West Zone utilizing a recommended closer drill spacing pattern. The 2007 drilling program was also designed to obtain more information about the low sulphide PGM mineralization located in the footwall of the West Zone. In addition to the 116 resource delineation holes, an additional 20 geotechnical holes totaling 246 metres were also completed in this program. This resulted in a record 136 holes drilled totalling 25,023 during the program.
The 2007 mineral resource estimate completed in early 2008, forms the basis of evaluation studies undertaken by Scott Wilson Roscoe Postle Associates Ltd. (“SWRPA”), and is discussed in detail later in this report. This mineral resources estimate utilized the Inco drill results as well as those of the Company’s during the period 1999-2007.
During the fall of 2007, the Company completed a 19 hole drill program in the Main West Zone of Ferguson Lake. This initiative targeted the low-sulphide, PGM style of mineralization hosted in the Ferguson Lake Sulphide Intrusive Complex. This potentially high-grade, low-sulphide mineralization was identified along strike during previous drilling. It is situated approximately 30 to 50 metres below the PGM-bearing massive sulphide Main West Zone lenses in the footwall gabbro unit. The massive sulphide base metal/PGM resource that is currently identified and qualified in Starfield’s NI 43-101 compliant July 2007 filing did not include this deeper, unique PGM mineralization.
In February 2008, the Company released complete fire-assay results from this PGM drill program. The results showed some high concentrations of PGMs. The data indicates significant mineralization at previously under-explored depths, but its extent and continuity are still not known.
Two areas where previous drilling had identified the potential high grade, low sulphide PGM were chosen as prospective targets to test the footwall mineralized horizon in greater detail. The fiscal 2008 drilling program focused on further definition of the geometry and continuity of the low sulphide PGM mineralization through the use of closely spaced drilling, both up and down dip and along strike.
Previous drilling has identified the presence of rhodium at Ferguson Lake (Hole FL02-132 contained a 0.1-metre interval assaying 2.58 grams per tonne). The indications of rhodium at Ferguson Lake were considered to be significant because of the strong price of this commodity. At the time of the release the price of Rhodium was US$9,380 per ounce, which is equivalent to just over US$300 per gram.
In March 2008, the Company announced results of check assays and rhodium assays of this diamond drilling program. The check assays for platinum and palladium verified the prior results and three intersections assayed positive for rhodium, as follows:
| | • | A 1.35 metre thick interval from hole FL07-363 assayed 0.012 grams per tonne of rhodium from a depth of 142.95 metres to 144.30 metres. |
| | • | A 0.75 metre thick interval from hole FL07-374 assayed 0.009 grams per tonne of rhodium from a depth of 254.00 metres to 254.75 metres. |
| | • | A 1.09 metre thick interval from hole Fl07-379 assayed 0.021 grams per tonne rhodium from a depth of 185.35 metres to 186.44 metres. |
Sampling Methods, Security and Analytical Procedures
Previous diamond drilling, core logging and sampling at the Ferguson Lake Property has been supervised and performed by John Nicholson, P.Geo., and Brian Game, P.Geo., both Qualified Persons in accordance with NI 43-101. Current diamond drilling, core logging and sampling at the Ferguson Lake Property are being supervised and performed by Don Cowan, MSc, P.Eng., and Ray Irwin, P.Geo., both Qualified Persons in accordance with NI 43-101.
In May 2007, the Company released a summary of its newly compiled National Instrument 43-101 2007 mineral resource for its Ferguson Lake property in Nunavut, Canada.
Jaime Lavigne, P.Geo., a Qualified Person, has updated the resource estimate to include fiscal 2007’s 116 resource definition diamond drill holes and 20 additional geotechnical holes.
NQ and BQ thin-wall sized core samples are logged and marked for sampling and subsequently halved by diamond saw, with one-half of the core comprising the sample and one-half retained as a rock record in core boxes stored for future reference at the Ferguson Lake camp. The one-half core comprising a sample is tagged, secured and bagged for air shipment from site to the sample preparation laboratories in Vancouver.
Pre-2008 samples are prepared at Acme Analytical Laboratories Ltd. in Vancouver, an ISO accredited laboratory which participates in proficiency testing and quality assurance and control procedures for sample preparation and analysis. Acme issues signed Certificates of Analysis and Assay Reports. The one-half drill core samples from sample intervals of generally one meter in length are crushed, riffle split and pulverized prior to analysis. Splits of massive sulphide samples weighing between 10-15 grams are then fire assayed for platinum and palladium. The doré bead is digested and then platinum and palladium are determined by ICP-ES (Group 6). The massive sulphide samples are also assayed for copper, nickel and cobalt, whereby 0.3g to 1.0g are digested by 4-acid digestion and then analyzed by ICP-ES (Group 7TD).
Low-sulphide PGM samples are analyzed at Acme, where a 30g sample is digested by aqua regia, and then ICP-MS analysis is conducted for a suite of 51 elements plus platinum and palladium (Group 1F-MS). This geochemical ultratrace method allows for a screening of the samples prior to assay determinations being implemented. All samples containing greater than 500ppb palladium and/or 100ppb platinum as determined by ICP-MS are then forwarded for 1AT (29.2g) fire assay determination for platinum and palladium (Group 6). All samples containing greater than 5,000ppm copper and/or 4,000ppm nickel are sent for 4-acid ICP-ES assay determinations (Group 7TD).
In the 2008 program, drill samples were prepared by either Acme Analytical Laboratories, Yellowknife, NWT or by ALS Chemex Laboratories, Yellowknife, NWT with analyses performed at the respective analytical facility located in Vancouver, BC. Check assays were routinely performed on every twentieth sample from each laboratory by SGS Mineral Services in Toronto, ON. All three labs are ISO accredited, meaning that they participate in proficient testing and quality assurance and control procedures for sample preparation and analysis. The 2008 analytical procedure was the same as previously described except that all samples found to contain platinum values greater than 100 ppb and/or palladium values greater than 500 ppb were subsequently fire assay checked using a 1 AT (29.2 g) sample.
Data Verification
Quality control of core samples is maintained by routinely analyzing a number of sample blanks, duplicates and control reference standards of a similar matrix and content as samples provided. Selected high-grade samples are routinely subjected to repeat assay determinations. Interlaboratory checks have been an ongoing part of the Ferguson Lake program since 1999. As noted in the previous section, the facilities of Acme Analytical Laboratories Ltd. have been used for project analyses since 2002, Bondar Clegg was the laboratory of record in 2000 and 2001 and check analyses during those years were performed by ALS Chemex. Between 2001 and 2007, most of the analytical work has been undertaken by Acme, while using ALS Chemex for necessary check analyses. As previously stated, during the 2008 Exploration Program, sample preparation and initial analyses were performed by either Acme Analytical Laboratories or ALS Chemex Laboratories with check analyses performed by SGS Mineral Services I Toronto, ON.
A number of interlaboratory checks of samples have been undertaken over the past several years. An example is the 2004 analytical work undertaken by ALS Chemex of 24 core sample pulps initially analyzed by Acme Laboratories. In summary, the results for copper are virtually identical, while Acme’s nickel values are in general almost 10% higher. Palladium values determined by the two laboratories correspond reasonably well, but there are apparent difficulties in reproducing consistently similar platinum values.
N.C. Carter, Ph.D., P.Eng., undertook a thorough review of 1950s Inco drilling results in late 1999 and has confidence in those results and in the sampling, preparation and analytical procedures used in the more recent drilling programs.
All sample results have been transmitted by the laboratory directly to the designated person at the Company who dispersed the results to the writers of the technical reports for initial review of results and the calculation of weighted average grades for the mineralized intervals encountered in the holes drilled to date. These data have been subsequently reported to the Company on a timely basis.
2008 Mineral Resource Estimates
The information under this heading “Mineral Resource Estimates” is extracted from the 2008 Report. James G. Lavigne estimated the Mineral Resource Estimates which were reported in the 2007 Report and adopted in the 2008 Report. The mineral resource estimates and geostatical analysis were reviewed by James G. Lavigne in the preparation of the 2008 Report, and the 2008 Report concludes that the Mineral Resource Estimate is in compliance with NI 43-101 and the definitions set out by the CIM Standards on Mineral Resources and Reserves Definitions and Guidelines adopted by the CIM Council in December 2005.
Drill Hole Database. Mineral resources have been estimated for the Ferguson Lake Property exclusively from diamond drill hole data. No systematic excavations or surface sampling have been completed that contribute to the resource estimation database. A total of 540 diamond drill holes have been completed on the Resource Property, and include those drilled by Inco during the 1950’s and those drilled by the Company from the period 1999 to 2006, for total metres drilled of 157,219.
Sample and Assay Data. The assay database of mineralized samples used in the resource calculations now numbers a total of 24,371 samples. All of the drill core samples collected by the Company have been analyzed by assay methods for nickel, copper, cobalt, platinum and palladium. In addition, the Company has collected whole rock and trace element geochemical data on selected samples. The Inco samples were initially assayed only for nickel and copper. Subsequent to the Inco field programs at the Ferguson Lake Property (conducted to 1957), Inco re-assayed selected core samples for platinum, palladium, and gold. However, Inco has reported this precious metal data only as a total summation (i.e. platinum+palladium+gold equals total PGM). The total number of samples assayed account for a total of 26,896 metres of core analyzed.
Lithology. Logging by both Inco and the Company included the identification and documentation of rock types. This includes the major distinction between the intrusion, the country rocks to the intrusion, and massive sulphides. The country rocks are broken out into several types of amphibolites, gneisses, and granitic rocks. The intrusion is mainly described as gabbro with lesser hornblendite. Hornblendite is usually spatially associated with massive sulphide. Massive sulphide was broken out as a rock type in the lithological description of the core. Mafic to felsic dykes have been logged as cross cutting the country rocks and the intrusion.
Specific Gravity. During 2002, the specific gravity was determined on 100 core samples. The samples were selected grab samples of core collected to be representative of the major rock types including massive and semi-massive sulphide.
During 2006, the specific gravity has been determined on a total of 1,342 drill core samples at Acme Analytical Laboratories Ltd. during the course of sample processing for base and precious metal analyses. The specific gravity was determined during 2006 using the water immersion method.
Data Verification. In June 2007, R. Dennis Bergen, one of the authors of the 2008 Report visited the Ferguson Lake Property. During that visit, three core samples were collected from areas identified by the Company’s geologist as portions of the resource estimate. The samples collected are not representative of the whole deposit nor were there sufficient samples collected to provide a statistical comparison with the Company’s samples. The analyses undertaken did indicate the presence of copper, nickel, cobalt and palladium in quantities similar to those in the resource estimate, and the presence of palladium was noted.
In addition, during the period September 2006 to November 2006, the author of the 2007 Report visited the Ferguson Lake Property on two occasions for a total of fifteen days on site. During these visits, a number of 2006 as well as historical drill holes were examined and compared with drill log descriptions and assay data. It was concluded that the geological logging and sample descriptions are representative of the lithological units and distribution of sulphide mineralization. The sampling is appropriate for the deposit type, and the assay data is consistent with the sulphide abundance, textures, and mineralogy. Survey procedures used at the Ferguson Lake Property for drill hole location and down hole trajectory are completed to exploration industry standards. It was concluded on the basis of the field visits that the drill hole exploration data collection procedures utilized at the Ferguson Lake Property would support resource estimation to NI 43-101 standards.
The diamond drill programs have been managed for the Company since 1999 by Nicholson and Associates, a professional geological services company based in Vancouver and managed by Professional Geologists. Nicholson and Associates were responsible for data collection, data base management, drilling and analytical QA/QC, and data verification for the Ferguson Lake Property. The author has relied upon Nicholson and Associates for the provision of the verified database for resource modeling. Aspects of drilling, sample security, assaying, data handling and verification are contained in the appropriate sections of this report. Verification of Inco data has been referenced in the Carter Report.
Estimation Methodology
Standards and Scope
The mineral resource estimate for the Ferguson Lake Property has been prepared and reported here in compliance with NI 43-101 for Mineral Resources and Mineral Reserves. James G. Lavigne, Professional Geologist and Qualified Person as defined in NI 43-101, is responsible for the preparation and reporting of the resource estimate. As per NI 43-101, Mineral Reserves estimates can only be based on the results of a preliminary feasibility study or feasibility study of a mineral project. Thus, no reserves have been estimated for the Ferguson Lake Property. As per NI 43-101, Mineral Resources which are not Mineral Reserves do not have demonstrated economic viability.
Description of Domains
Massive sulphide intersections on the Ferguson Lake Property cover a strike length of approximately 15 kilometres. For the purposes of resource estimation, the Resource Property has been divided into three domains; the East Zone, the Main West Zone, and the West Extension Zone. Drill spacing, and therefore the amount of geological and assay information, is variable across the zones, and, accordingly, different approaches to resource estimation have been utilized.
Main West Zone
The central domain, (the Main West Zone) has been the target of the most detailed drilling and past geostatistical studies, and is the area from which past indicated (and measured) resources have been reported. Drill hole spacing in the Main West Zone is variable from 25 metres in selected test areas of the zone to a maximum of approximately 100 metres. The Pit Area was the object of a past geostatistical resource study and estimation. The drill density and historical work in the West Main Zone supports resource estimation using a geostatistical block model methodology based on a geological interpretation of the intrusion and mineralization.
West Extension and the East Zones
Drilling in the West Extension Zone has intersected mineralization between approximately 600 and 1,200 metres below surface. Drilling has been completed on 200 metre spaced sections, with holes on section spaced irregularly, with an average of approximately 100 metres. All of the drilling in the West Extension Zone has been completed by the Company. Similarly, the East Zone is characterized by comparatively widely spaced drilling but does include clusters of more detailed drilling in specific target areas. The East Zone contains a higher proportion of Inco drill holes. Given the drill hole spacing, a detailed geological model was not created for the West Extension or the East Zones and a polygonal approach to estimation was utilized.
Main West Zone
Geological Model
Diamond drill holes in the Main West Zone are commonly characterized by multiple intersections of massive sulphide which can be of a highly variable width. Massive sulphide within the Main West Zone has been interpreted as a series of stacked lenses or sheets with a moderate north dip and approximate east-west strike. Massive sulphide intersections interpreted on section are based on the occurrence of greater than 50% sulphide as estimated on a sample-by-sample basis, and incorporate inclusions of weakly mineralized to barren host of rock. Three dimensional interpretation resulted in 56 individual lenses of massive sulphide across the Main West Zone of variable size and extent.
Results and Classification
As per NI 43-101, a mineral resource is an inventory of mineralization that under realistically assumed and justifiable technical and economic conditions might become economically extractable. The economic and technical parameters used to evaluate the massive sulphide block model are summarized in the table below. No economic, environmental, legal, socio-economic, or governmental factors were known to the author of the 2008 Report that would impact the estimate of mineral resources at the Ferguson Lake Property.
Using the metal price, exchange rate, royalty payable, and recovery data, a dollar value was calculated for each block or partial block in massive sulphide. Resource cut-off value is established by the estimated operating costs. Blocks with value equal to or greater than CDN$75 for the open pit model and CDN$110 for the underground model have been deemed resources.
| Economic and Recovery Factors: | |
| Metal | Price per pound | Recovery |
| Nickel | US$7.00 | 93% |
| Copper | US$1.75 | 93% |
| Cobalt | US$15.00 | 64% |
| US$/CDN$ Exchange Rate: 1.18 |
| Royalty Payable: 3% NSR |
| Operating Costs: | |
| Basis Open Pit Mining - Cost per tonne milled: | CDN$75.00 |
| Basis Underground Mining - Cost per tonne milled: | CDN$110.00 |
*Economic, mining, and processing values used to establish block value and cut-off value have been established for the Ferguson Lake Project by Scott Wilson Roscoe Postle Associated Ltd and NeoFerric.
Resource blocks in the West Main Zone have been classified as indicated resources and inferred resources. During block interpolation, the following data were recorded: a) the number of samples used to interpolate each block, b) the number of octants used for the interpolation of each block, and c) the block variance for nickel grade estimation. Classification of resource as indicated was based in part on consideration of the block model of these statistics in individual blocks, neighbouring blocks, and groups of blocks. Classification as indicated was also based on a) regular and tighter drill hole spacing and b) contours of sulphide thickness, and therefore interpretation of thicker and apparently more continuous massive sulphide. Other resources outside of the blocks are classified as inferred resources. No blocks have been classified as measured resources.
West Extension and the East Zones
Assays and Intersections
Massive sulphide intersections in diamond drill holes in the West Extension and the East Zones were evaluated for economic potential using the data and parameters contained in the previous table set out above. The cut-off value of CDN$75 was used for evaluation of intersections in the East Zone and the cut-off value of CDN$110 was used for evaluation of intersections in the West Extension Zone. Intersections above cut-off value were incorporated into the resource estimate. In both the West Extension and the East Zones, a horizontal and vertical width of 2.5 metres was used as a minimum width. As the West Extension Zone includes only holes drilled by the Company, all of the Ni, Cu, and Co assay data were used to calculate intersection values. However, the intersection values used for the Inco holes in the East Zone, which do not have associated Co assay data, included an average Co grade of 0.08% Co, based on the average block grade from the Main West Zone.
Summary
The resources for the Ferguson Lake Property, including the East, Main West, and West Extension zones are summarized in the Mineral Resources table below as estimated by James G Lavigne and reported in 2007.
| WEST ZONE INDICATED RESOURCES |
MAIN WEST ZONE | Tonnes (Mt) | Ni (%) | Cu (%) | Co (%) | Pt (gpt)* | Pd (gpt)* |
Pit Area: | 8.3 | 0.71 | 0.93 | 0.08 | 0.24 | 1.57 |
Underground: | 7.0 | 0.70 | 1.17 | 0.08 | 0.32 | 1.74 |
Total Indicated Resources | 15.3 | 0.71 | 1.04 | 0.08 | 0.28 | 1.64 |
| PROPERTY-WIDE INFERRED RESOURCES |
ALL ZONES | Tonnes (Mt) | Ni (%) | Cu (%) | Co % | Pt (gpt)* | Pd (gpt)* |
Main West Zone Pit Area | 3.4 | 0.59 | 0.71 | 0.07 | 0.15 | 1.20 |
Main West Zone Underground | 1.3 | 0.64 | 1.19 | 0.07 | 0.36 | 1.73 |
Extension West Zone | 14.7 | 0.71 | 1.23 | 0.08 | 0.31 | 1.88 |
East Zone | 9.5 | 0.65 | 0.75 | ** | ** | ** |
Total Inferred Resources | 28.9 | 0.67 | 1.01 | 0.08 | .28 | 1.75 |
| Notes: | | Mt = millions of tonnes |
| * | | gpt = grams per metric tonne |
| ** | | Platinum, palladium, and cobalt grades were not estimated for the East Zone as the East Zone contains a higher proportion of historical INCO holes for which cobalt or individual platinum or palladium grades have not been determined. |
ADVISORY NOTE TO U.S. INVESTORS: The SEC does not recognize the terms “indicated resources” nor “inferred resources.” The estimation of indicated and inferred resources involves greater uncertainty as to their existence and economic viability than an estimation of proven and probable reserves or of other categories of resources. There can be no assurance that mineral resources in these categories exist or can be upgraded into measured or indicated resources or converted into reserves.
Current Exploration and Development
The following information under this heading is provided by the Company and is not extracted from the 2008 Report.
Significant exploration and diamond drilling was undertaken during the year. The diamond drilling was primarily designed to upgrade the confidence in the existing copper-nickel-cobalt sulphide mineralization through a series of interspaced and extended drill holes. Additionally, as in the fiscal 2008 program, a portion of the drilling was extended beneath the massive sulphide resource in an effort to further define the geometry and continuity of the low-sulphide PGM occurrence. The massive sulphide mineralization comprising the West Zone is currently being remodeled, and at the same time existing data is being utilized to construct the initial model for the low sulphide PGM mineralization located in the footwall of the West Zone.
The Company also began a program designed to assess the diamond, gold and base metal potential of the remainder of the claim block. This effort included processing and mineralogical study of 1100 till samples taken in 2005 and 2006 along with a thorough review of existing geophysics, and ground reconnaissance. This work resulted in the discovery of a diamond and three grains of native gold in separate till samples. Both the diamond discovery and the gold find in the Y Lake area are being followed up by a helicopter borne geophysical program consisting of a combined DigHEM and Horizontal Magnetic Gradiometer survey which will potentially define possible kimberlite bodies as well as sulphide-bearing structures and sulphide-bearing horizons that could host either base metals and/or gold mineralization Results are pending.
Drilling Program
The fiscal 2009 drilling program, which was undertaken in two phases, was designed to convert more of the massive sulphide mineralization comprising the West Zone from the Inferred Mineral Resource category to the Indicated category; to further define the geometry and continuity of the low sulphide PGM mineralization located in the footwall of the West Zone; to better define the massive sulphide mineralization in the West Zone Extension; and to begin evaluating some of the more promising exploration targets outside of the known resource area. During the fiscal program, a total of 51 holes were attempted, with 45 completed to planned depth, while six other holes were abandoned due to drilling difficulties, resulting in a total of 19,092 metres drilled. Of the holes completed, 34 were drilled on the West Zone, five were drilled on the North Zone, one was drilled on the Grizzly Trend, three were drilled on the Y Lake Trend and two were on the West Zone Extension.
Exploration targets located outside of the resource area were selected for investigation based on a combination of encouraging results, namely airborne geophysics (VTEM survey), rock chip geochemical sampling and reconnaissance geologic mapping.
| | • | Five widely spaced angle holes totaling 2,167 metres were completed along the North Zone, which is 1.5 km north of the West Zone. The holes intersected intervals of sub-massive sulphides, as well as veinlet-controlled and disseminated sulphides. |
| | • | Three widely spaced angled core holes, totaling 1,243 metres, were completed on the Y Lake trend, which is located 20km south of the West Zone. These holes intersected sulphide-bearing intervals that contained geochemically anomalous copper, nickel, silver, gold, arsenic, and tellurium. |
| | • | One angled hole, totaling 420 metres was completed on the Grizzly Trend, which is located 8 km south of the West Zone. This hole intersected several intervals of veinlet-controlled and disseminated sulphides containing anomalous copper, silver and tellurium. |
It should be noted that the elements arsenic and tellurium are commonly associated with gold mineralization in many gold deposits. Since they occur in higher geochemical concentrations than gold, they often serve as good indicators, plus pathfinders, to gold mineralization. As a result, they may be used to vector or direct exploration to the part of a hydrothermal system having the highest exploration potential.
Surface Exploration Program
In an effort to further evaluate its large land holding, Starfield embarked on a grassroots surface exploration program to examine the kimberlite and gold potential of the Company’s 266 active claims comprising the Ferguson Lake project. In addition to the favourable geologic setting, the potential presence of kimberlites is reinforced by the active diamond exploration being undertaken by other companies on ground surrounding the Ferguson Lake project.
Processing and selection (“picking”) of the 1,100 till samples collected during the 2005/2006 project-wide sampling program have been completed and planned mineralogical studies based on scanning electron microscope (SEM) and microprobe analyses have been completed on 1,825 picked grains. In addition to the discovery of a microdiamond during picking, these mineralogical studies identified and confirmed that some garnet and ilmenite grains of possible kimberlitic origin were present in widely spaced samples.
Although the exploration significance of the microdiamond has not yet been determined, since the recently completed mineralogical studies are somewhat inconclusive and the results of the recently completed airborne geophysical survey are pending, the presence of the microdiamond must still be considered encouraging. No striations were observed on the diamond and the crystal was not broken which suggests proximity to a nearby source; the size of the microdiamond is consistent with the size fraction (-35 to + 60 microns) being processed at the time; the possibility of off-site contamination has been disproven; the microdiamond bearing sample is located near a sample containing a possible ilmenite grain of kimberlitic origin and the sample in which the microdiamond was found is proximal to a geophysical anomaly previously interpreted as a possible kimberlitic body.
Additionally, during selection, three small grains of gold were identified in three separate widely spaced samples. Two of the samples occur north of the western end of the Y Lake Trend in or adjacent to a series of till samples in which anomalous gold was previously detected by multi element analysis of the 2005/2006 till samples. The third grain of gold was found in a till sample collected approximately 20km north of the current property boundary.
The Company has recently completed flying a combined DigHEM electro-magnetic survey and Horizontal Magnetic Gradiometer to further delineate possible diamond and gold targets in the vicinity of the Y Lake Trend. Although the results are still pending, the survey is expected to identify high potential geologic structures or horizons at a higher degree of resolution than the previous airborne survey. Surveying was completed by the beginning of May with a preliminary interpretation available in due course, typically 8 to 10 weeks after completion of the survey. Pending the results of this airborne survey, additional ground reconnaissance work, rock-chip sampling of targeted areas and closely spaced follow-up till sampling would be the next step. Additional diamond drilling will also take place if warranted.
ITEM 4A. UNRESOLVED STAFF COMMENTS.
None.
| ITEM 5. | OPERATING AND FINANCIAL REVIEW AND PROSPECTS. |
| Item 5.A. | Operating results. |
Overview
The Company’s financial statements are stated in Canadian Dollars (CDN$) and are prepared in accordance with Canadian GAAP, the application of which, in the case of the Company, conforms in all material respects for the periods presented with US GAAP except as noted in notes to the financial statements. The value of the U.S. Dollar in relationship to the Canadian Dollar was $1.27 at February 28, 2009 and $1.19 at April 30, 2009.
Starfield is a Canadian-based natural resource exploration company. The Company has financed its activities through issuances of equity capital. The Company anticipates having to raise additional funds by equity issuance in the next several years, as the Company does not expect to generate material revenue from mining operations or to achieve self-sustaining commercial mining operations for several years.
The most recent significant financings are described in Item 5B, “Liquidity and Capital Resources”.
Results of Operations
During the twelve months ended February 28, 2009, the Company spent $28.7 million (2008 - - $13.1 million) on exploration at its Ferguson Lake nickel-copper-platinum-palladium-cobalt project.
Deferred exploration costs incurred in the twelve months ended February 28, 2009 and February 29, 2008 were as follows:
| | | | 2009
$’000 | | | | 2008
$’000 | |
| Acquisition and maintenance costs | | | 316 | | | | 190 | |
| Exploration costs | | | | | | | | |
Compensation | | | 7,457 | | | | 2,568 | |
Aircraft support including helicopter moves | | | 4,070 | | | | 3,030 | |
Diamond drilling | | | 3,525 | | | | 829 | |
Camp support costs including fuel | | | 8,492 | | | | 4,329 | |
Analytical and geophysical services | | | 4,855 | | | | 2,137 | |
| | | | 28,715 | | | | 13,083 | |
Exploration expenditures (adjusted for non-cash expenditures and amounts unpaid at year end) for the fiscal year ended February 28, 2009 are $12.1 million higher than the same period in the prior year. This is primarily due to the more extensive fiscal 2009 exploration program (19,092 metres drilled) at Ferguson Lake compared to limited drilling and exploration in the prior year (5,912 metres drilled) as a result of a late third quarter start. The late start of the fiscal 2008 exploration program in the comparative year resulted in lower diamond drilling expenditures, fewer personnel on site, less aircraft support, decreased helicopter requirements and an overall decrease in camp costs. Compensation expenditures also include $3.3 million of capitalized stock-based compensation in the current fiscal year versus none in the previous year. During the year ended February 28, 2009, the Company began and finished construction of an airplane landing strip at the mine site that will now allow larger planes to land. In addition, Starfield completed the additional portions of the scoping study and dramatically advanced the hydromet process. Analytical and geological services were higher in the current year due to a combination of increased exploration activity as well as increased costs relating to the hydrometallurgical process.
General and corporate expenditures incurred in the twelve months ended February 28, 2009, and February 29, 2008, were as follows:
| | | | 2009
$’000 | | | | 2008
$’000 | |
| Consulting fees | | | 53 | | | | 95 | |
| Directors fees | | | 217 | | | | 282 | |
| Investor relations | | | 370 | | | | 1,368 | |
| Legal and audit | | | 592 | | | | 778 | |
| Management and administrative compensation | | | 1,391 | | | | 1,633 | |
| Rent and office | | | 456 | | | | 421 | |
| Transfer and regulatory fees | | | 130 | | | | 265 | |
| Travel and conferences | | | 246 | | | | 290 | |
| | | | 3,455 | | | | 5,132 | |
The fiscal 2009 general and administrative expenses decreased by $1.7 million over the fiscal year in 2008 primarily due to decreases in investor relations of $1.0 million combined with decreases in legal and audit fees and compensation. Significant changes are as follows:
| | • | Consulting fees were higher in the prior period due to one-time recruiting fees for senior personnel; |
| | • | Directors’ fees decreased relative to the same period in 2008 due to ‘catch-up’ compensation paid to directors in 2008 for unpaid prior fees. In addition, the board consists of one fewer director in the current fiscal year; |
| | • | Investor relations expenditures decreased in the current period due to a prior year settlement of two investor relations contracts. This decrease was partially offset by an increase in activity and expenditure in the current year due to an analyst tour of the Ferguson Lake project, increased conference activity in the first nine months of the year and the addition of an online forum geared towards small-cap companies; |
| | • | Legal expenses were reduced in the current period. The Company paid legal fees associated with the initial TSX listing and commercial lease negotiations paid in 2008 and there were no comparable expenditures in the current fiscal year. Audit fees were also lower, due to higher fees in 2008 from increased filing requirements, the hiring of an interim controller and additional accounting support staff; |
| | • | Management compensation decreased in the current year due to severance payments made to former employees in the prior year. There were no comparable expenditures in fiscal 2009. This increase was somewhat offset by the addition of a new full time employee in fiscal 2009; |
| | • | Rent and office expenditures increased due mainly to increased insurance coverage and to the payment of rent at a higher rate for a full year in the current period compared to payment at this rate in the prior period for only nine months after the corporate office was moved to Toronto; |
| | • | Transfer and regulatory fees decreased in the current year due to the payment of initial TSX listing fees in fiscal 2008. There was no comparable expenditure in the current year; and |
| | • | Travel and conference expenses are lower in the current period due to decreased conference attendance and domestic travel as management reduced discretionary expenditures. |
During the year ended February 28, 2009, the Company granted 1,850,000 stock options (February 29, 2008 - 16,125,000) to directors, officers, employees and consultants. In the current fiscal year, there were fewer additions to the management team resulting in fewer stock options granted as part of their retention package. In comparison, in the prior fiscal year, a significant number of options were issued as the Company experienced significant turnover of both management and directors. Starfield recognized $4.0 million in stock-based compensation expense, with a corresponding credit to contributed surplus on the balance sheet, of which $3.3 million of the expense was capitalized to mineral properties (February 20, 2008 - $8.3 million, no capitalization). The Company realizes the fair market value of the stock-based compensation over the vesting period of the options. The fair value of the options granted is calculated using the Black-Scholes option pricing model with the following weighted average assumptions: a five year expected term, volatility of 79%, risk-free interest rate of 2.97% and an expected dividend yield of 0%. Options vest equally, with one quarter vesting immediately, and the remainder vesting equally after six, twelve, and eighteen months, respectively, from the date of grant.
Fiscal 2008 vs. Fiscal 2007
During the twelve months ended February 29, 2008, the Company spent $13.1 million (2007 - - $17.3 million) on exploration at its Ferguson Lake nickel-copper-cobalt-platinum-palladium project.
Deferred exploration costs incurred in the twelve months ended February 29, 2008 were as follows:
| | | | 2008
$’000 | | | | 2007
$’000 | |
| Acquisition and maintenance costs | | | 190 | | | | 22 | |
| Exploration costs | | | | | | | | |
Compensation | | | 2,568 | | | | 2,679 | |
Aircraft support including helicopter moves | | | 3,030 | | | | 5,048 | |
Diamond drilling | | | 829 | | | | 3,174 | |
Camp support costs including fuel | | | 4,329 | | | | 4,221 | |
Analytical and geophysical services | | | 2,137 | | | | 1,834 | |
Mobilization and demobilization | | | - | | | | 228 | |
| | | | 13,083 | | | | 17,206 | |
Deferred exploration expenditures incurred over the twelve months ended February 29, 2008 were $4.1 million lower than during the corresponding period in 2007. Aircraft support for the period decreased as a result of less regional exploration and decreased drill moves. The Company completed 5,912 meters of diamond drilling (2007 -25,023 meters) with a resulting decrease in drilling expenditures. The fiscal 2008 drilling program was more targeted to the lower PGM zone and required less drilling than in fiscal 2007. In fiscal 2007, the Company undertook a broader drill campaign. Camp support costs for the period increased primarily as a result of continued construction of the new camp. Analytical costs for the period were higher as a result of bench testing and associated labwork related to the hydromet process. Mobilization and demobilization decreased due to less drilling and no movement of the drills across the property.
General and Corporate expenditures incurred in the twelve months ended February 29, 2008, and February 28, 2007, were as follows:
| | | | 2008
$’000 | | | | 2007
$’000 | |
| Consulting fees | | | 95 | | | | 235 | |
| Directors fees | | | 282 | | | | 108 | |
| Investor relations | | | 383 | | | | 298 | |
| Settlement of investor relations contracts | | | 985 | | | | - | |
| Legal and audit | | | 778 | | | | 449 | |
| Management and administrative compensation | | | 1,633 | | | | 927 | |
| Rent and office services | | | 421 | | | | 261 | |
| Transfer and regulatory fees | | | 265 | | | | 149 | |
| Travel and conferences | | | 290 | | | | 686 | |
| | | | 5,132 | | | | 3,113 | |
The twelve months General and Administrative expenses increased $2.0 million over the previous year mainly because of the following:
| | • | Compensation increased as a result of hiring a new CEO, CFO and VP-Operations, as well as costs related to the severance payments paid to the previous CEO and CFO; |
| | • | Consulting fees decreased due to the Company utilizing fewer outside consultants than in the prior year; |
| | • | Directors fees increased, reflecting the addition of a director, a general fee increase, and the payment of the balance of the fiscal 2007 fees; (No director fees were paid in the first quarter of fiscal 2007); |
| | • | Settlement of investor relations contracts in fiscal 2008 was the result of shares and warrants issued in order to settle the cancellation of contracts with two companies; |
| | • | Legal expenses increased due to the preparation of collaborative agreements with metallurgical specialists, termination agreements with various suppliers, the successful efforts to obtain a TSX listing, and negotiation of the commercial lease for the Ferguson Lake property. Audit expenses increased due to increased filing requirements, and include the Company’s 2007 income tax return plus the hiring of an interim controller and additional accounting support staff; |
| | • | Rent and office increased due to the new Toronto office lease and a short period in the year when the Company was maintaining offices in Vancouver and Toronto; |
| | • | Transfer and regulatory fees increased mainly as a result of the completion of a private placement in March 2007, as well as incremental listing fees related to being listed on the TSX compared to the TSX Venture; and |
| | • | Travel and conference expenses decreased because of significantly reduced domestic and overseas travel and conference attendance. |
During the twelve months ended February 29, 2008, the Company granted 16,125,000 stock options (2007 - 9,540,000) to directors, employees and consultants. During fiscal 2008, there was a complete change in management and a majority of the board of directors. The recruitment and retention of these key individuals accounted for the increase in granting of options compared to the prior year. The Company recognized $ 8,319 (2007 - $1,645) in stock-based compensation expense, with a corresponding credit to contributed surplus. The Company realizes the fair market value of the stock-based compensation over the vesting period of the options. The fair value of the options granted is calculated using the Black-Scholes option pricing model with the following assumptions: a five year expected term, 62% volatility, risk-free interest rate of 4.22% and an expected dividend yield of 0%. Options vest equally as to one quarter immediately, and after six, twelve, and eighteen months from the date of grant.
Fiscal 2007 vs. Fiscal 2006
Deferred mineral costs incurred in the twelve months ended February 28, 2007 were as follows:
| | | | 2007
$’000 | | | | 2006
$’000 | |
| Acquisition Costs | | | 22 | | | | 216 | |
| Exploration Costs | | | | | | | | |
Compensation | | | 2,679 | | | | 2,703 | |
Aircraft support including helicopter moves | | | 5,048 | | | | 2,726 | |
Diamond drilling | | | 3,174 | | | | 2,123 | |
Camp support costs including fuel | | | 4,221 | | | | 2,479 | |
Analytical and geophysical services | | | 1,834 | | | | 2,384 | |
Mobilization and demobilization | | | 228 | | | | 24 | |
| | | | 17,206 | | | | 12,655 | |
Deferred exploration expenditures incurred over the twelve months ended February 28, 2007 were $4.5 million higher than during the corresponding period in 2006. Aircraft support for the period increased as a result of helicopter-supported increase in regional exploration, increased number of drill moves, and support for the camp relocation and construction. The company completed 25,023 meters of diamond drilling (2006 -16,861 meters) with a resulting increase in drilling expenditures. Camp support costs for the period increased primarily as a result of relocating and establishing a new camp (approximately $1.7 million). Mobilization and demobilization increased due to incremental activity and drilling throughout the year.
General and Corporate expenditures incurred in the twelve months ended February 28, 2007, and February 28, 2006, were as follows:
| General and Corporate | | | 2007
$’000 | | | | 2006
$’000 | |
| Advertising and promotion | | | 181 | | | | 100 | |
| Computer fees | | | 13 | | | | 27 | |
| Consulting fees | | | 235 | | | | 403 | |
| Directors fees | | | 108 | | | | - | |
| Interest on obligations under capital lease | | | 18 | | | | - | |
| Investor relations | | | 237 | | | | 50 | |
| Legal and audit | | | 449 | | | | 180 | |
| Management and administrative compensation | | | 837 | | | | 96 | |
| Office equipment rent | | | 28 | | | | 27 | |
| Rent and office | | | 271 | | | | 408 | |
| Telephone | | | 22 | | | | 17 | |
| Transfer and regulatory fees | | | 148 | | | | 113 | |
| Travel and conferences | | | 566 | | | | 916 | |
| | | | 3,113 | | | | 2,341 | |
The twelve months General and Administrative expenses increased over the previous year by mainly because of the following:
| | • | Legal and audit expenses increased because of hiring an interim controller and additional support staff; the recognition of the annual audit fee; amounts paid to legal counsel for preparing collaborative agreements with metallurgical specialists; and the efforts to obtain a TSX listing. |
| | • | Advertising and promotion expenditures increased due to the use of additional advertising companies; |
| | • | Consulting fees decreased and investor relations expenditures increased as a result of engaging corporate finance specialists as well as accrued costs of termination of consultants in March 2007; |
| | • | The increase in directors fees reflects the addition of a new director and a general fee increase; |
| | • | Management and administrative compensation increased as a result of hiring a new CFO; increased compensation paid to the President, Vice President of Finance, and the in-house geological specialist; and accrued costs of termination of consultants in March 2007 ; |
| | • | Rent and office services decreased because of sublet income, a lease cancellation refund, and reduced office consultant expenses; |
| | • | Travel and conference expenses decreased because of reduced conference attendance; and |
| | • | Transfer and regulatory fees increased mainly as a consequence of the completion of a private placement in the amount of $16.5 million in May 2006 |
During the twelve months ended February 28, 2007, the Company granted 9,540,000 stock options (2006 - nil) to directors, employees and consultants. The Company recognized $1,644,628 (2006 - $nil) in stock-based compensation expense, with a corresponding credit to contributed surplus. The Company realizes the fair market value of the stock-based compensation over the vesting period of the options. The fair value of the options granted is calculated using the Black-Scholes option pricing model with the following assumptions: a five year expected term, 61% volatility, risk-free interest rate of 4.12% and an expected dividend yield of 0%. Options vest as to one quarter immediately, and after six, twelve, and eighteen months from the date of grant.
| Item 5.B. | Liquidity and capital resources. |
The Company’s primary source of funds since incorporation has been through private placements of its common shares and the exercise of stock options and common share purchase warrants. The Company has no revenue from mining to date and does not anticipate mining revenues in the foreseeable future. The activities of the Company, principally the acquisition and exploration of mineral properties, are financed through the completion of offerings involving the sale of equity securities. As of the date of this report, the Company had approximately $2.2 million in cash. The management believes it has sufficient resources to maintain operations throughout the year.
Fiscal 2009 ended February 28, 2009
On May 6, 2008, the Company issued 15,000,000 flow-through common shares at a price of $1.00 per share for gross proceeds of $15.0 million and 5,555,556 common shares at a price of $0.90 per share for gross proceeds of $5.0 million, for aggregate gross proceeds of $20.0 million. The Company incurred issuance costs of $1.0 million.
On February 26, 2009, the Company issued 9,210,000 flow-through common shares at a price of $0.25 per share for gross proceeds of $2.3 million. The Company incurred issuance costs of $0.2 million. As part of the equity financing, the Company issued 407,100 broker warrants which entitle the holder to purchase one common share at a price of $0.40 until February 25, 2011.
Starfield is using the proceeds from the offering for general exploration expenditures and working capital purposes.
Since Starfield is an advanced exploration company, it does not have the ability to generate significant amounts of cash and cash equivalents in the short term. To maintain the Company's capacity to meet planned growth or to fund future development activities, the Company must utilize its current cash reserves, income from investments, and cash from the sale of securities. In this regard, advanced exploration stage companies are heavily reliant on the equity market to fund activities usually through private placements. Today’s equity markets make this alternative difficult without incurring significant dilution to existing shareholders.
As at February 28, 2009, Starfield had $3.9 million in cash (February 29, 2008 - $10.9 million) and working capital of $4.1 million, (February 29, 2009 - $10.8 million). Included in this amount is approximately $2.2 million of flow-through funds that the Company is obligated to spend on exploration by December 31, 2009. While Starfield has modest working capital requirements, all efforts are being made to reduce all discretionary expenditures to ensure the Company remains viable and retains its assets until financial markets have stabilized. The decrease in cash and working capital at February 28, 2009 compared to February 29, 2008, is primarily a result of funding the Company’s exploration program and the development of the hydromet process during the current fiscal year.
There are 1.2 million warrants outstanding (February 29, 2008 - 800,000) at a weighted average exercise price of $1.24, which, if fully exercised, would raise almost $1.5 million (February 29, 2008 - $1.3 million). The dollar value contribution of only in-the-money warrants is $nil.
There are also 19.4 million share purchase options outstanding (February 29, 2008 - 20.0 million) with a weighted average exercise price of $0.97 that would contribute approximately $18.8 million (February 29, 2008 - $19.2 million) if exercised in full. The dollar value contribution of only in-the-money options is $nil.
The Company’s long-term debt consists of capital lease obligations, and its credit and interest rate risks are limited to interest-bearing cash balances. Accounts payable and accrued liabilities are short-term and non-interest bearing.
As of the date of this report, the Company had approximately $2.5 million in cash, which is held at the Royal Bank of Canada in Toronto. Although the current financial markets are generally poor, Starfield continues to consider opportunities for equity financing or joint venture partnerships.
Fiscal 2008 ended February 29, 2008
On March 27, 2007, the Company issued 27,142,855 flow-through common shares at a price of $0.28 per share for gross proceeds of $7,600,000 and 31,249,999 units at a price of $0.24 per unit for gross proceeds of $7,500,000. Each unit consists of one common share and one-half of one transferable common shares purchase warrant. Each whole warrant entitles the holder to acquire one common share at an exercise price of $0.30 per share for a period of 2 years. After four months from the date of issue, in the event that the common shares trades at a closing price of greater than $0.375 per share for a period of 20 consecutive trading days, the Company may accelerate the expiry date of the warrants by giving notice to the holders thereof and, in such case, the warrants will expire on the 30th day after the date on which such notice is given by the Company. On August 28, 2007, the Company exercised its acceleration right in accordance with the terms outlined above. The expiry date was accelerated and 15,624,997 warrants were exercised generating gross proceeds of $4,687,499. The Corporation intends to use the proceeds from the offering for general exploration expenditures and general working capital purposes.
The agents received a cash commission fee of $910,000 and, in addition, the Company issued 4,062,500 non-transferable broker warrants to Westwind Partners Inc. with each broker warrant entitling the holder to buy one common share at $0.24. The broker warrants are exercisable, in whole or in part, for a period of 24 months. The broker warrants are also subject to the same acceleration feature as the warrants that were issued to the investors in the March 27, 2007 offering. The expiry date was accelerated and all 4,062,500 warrants were exercised for gross proceeds of $975,000.
In recognition of certain contractual commitments that had been made by the Company in regard to past financings where capital market services were provided to the Company by Max Capital Markets Ltd. (“Max Capital”), the Company also issued 507,500 warrants to Max Capital along with cash consideration of $142,100. Each one of these warrants entitle Max Capital to buy a Common Share at $0.24 for a period of 24 months following the Closing Date (subject to the same expiry date acceleration feature as the Warrants that were issued to the investors in the March 27, 2007 offering). The expiry date was accelerated and all 507,500 warrants were exercised for gross proceeds of $121,800.
The Company is using the proceeds from the March 27, 2007 offering for general exploration expenditures and general working capital purposes.
On September 5, 2007, the Company issued 150,000 common shares and 800,000 warrants to settle and terminate previously signed investor relations services contracts. Each warrant entitles the holder to acquire one common share at an exercise price of $1.67 per share for a period of 5 years. The warrants were valued using the Black-Scholes option pricing model with the following assumptions: 4.27% risk-free interest rate, 5 year expected life, 60% annualized volatility, and 0% dividend rate.
As at February 29, 2008, Starfield had $10.9 million in cash (2007: $0.5 million) and a working capital of $10.8 million, (2007: a deficiency of $1.9 million). The increase in cash and working capital is a reflection of the private placement in May 2007 along with proceeds received on the exercise of options and warrants throughout the year.
As at February 29, 2008, there are 800,000 warrants outstanding (2007: 22,202,152) at a weighted average exercise price of $1.67, which, if fully exercised, would raise $1.3 million (2007: $15.3 million).
As at February 29, 2008, there are also 19,957,500 stock purchase options outstanding (2007: 19,115,000) with a weighted average exercise price of $0.96, that would contribute approximately $19.2 million (2007: $7.8 million) if exercised in full.
As at February 29, 2008, the Company’s long-term debt consists of capital lease obligations, and its credit and interest rate risks are limited to interest bearing assets of cash. Accounts payable and accrued liabilities are short-term and non-interest bearing.
Fiscal 2007 Ended February 28, 2007
On December 29, 2006, the Company issued 5,884,865 flow-through common shares at $0.30/share for gross proceeds of $1.8 million.
Starfield used the proceeds from the offering for general exploration expenditures and general working capital purposes.
In May 2006, the Corporation issued 24,424,501 units at $0.53 per unit and 5,571,796 flow-through shares at $0.65 per share for gross proceeds of $16,566,653. Each unit consisted of one common share and one-half of one transferable common share purchase warrant; each whole warrant entitles the holder to acquire one additional common share at an exercise price of $0.75 per share expiring May 10, 2007. The Corporation paid issuance costs of $1,183,509 and granted finder’s warrants, valued at $107,810, entitling the holder to acquire an additional 1,002,347 common shares of the Corporation at an exercise price of $0.65 per share expiring May 10, 2007 (859,182) and May 23, 2007 (143,165). The finder’s warrants were valued using the Black-Scholes option pricing model with an expected volatility of 56%, a risk free interest rate of 4.11%, an expected life of 1 year and an expected dividend yield of 0%. The Corporation also granted the agent the right to participate in up to 50% of any further private placements to May 2007. Of the 12,212,249 purchase warrants issued, 10,075,457 warrants expired and 2,136,792 purchase warrants were exercised for gross proceeds of $1,602,594. All but 182 of the 1,002,347 finder’s warrants were exercised for gross proceeds of $651,407.
As at February 28, 2007, Starfield had $0.5 million in cash (2006: $2.1 million) and a working capital deficiency of $1.9 million, (2006: a surplus of $0.8 million). The decrease in cash and working capital is a reflection of the extensive exploration activities undertaken in excess of funding.
As at February 28, 2007, there are 22,202,152 warrants outstanding (2006: 28,612,259) at a weighted average exercise price of $0.69, which, if fully exercised, would raise $15.3 million (2006: $17.3 million).
As at February 28, 2007, there are also 19,115,000 share purchase options outstanding (2006: 11,472,000) with a weighted average exercise price of $0.41 that would contribute approximately $7.8 million (2006: $4.7 million) if exercised in full.
As at February 28, 2007, the Company’s long-term debt consists of capital lease obligations, and its credit and interest rate risks are limited to interest bearing assets of cash. Accounts payable and accrued liabilities are short-term and non-interest bearing.
Variation in Operating Results
The Company is presently exploring its properties for sufficient reserves to justify production. However, to date no reserves have been discovered and none of the properties are yet in production and consequently, do not produce any revenue. As a result there is little variation expected in operating results from year to year and little is to be expected until such time, if any, as a production decision is made on its properties.
The Company derives interest income on its bank deposits, which depend on the Company’s ability to raise funds.
Management, periodically through the exploration process, reviews results both internally and externally through mining-related professionals. Decisions to abandon, reduce or expand exploration efforts are based upon many factors including general and specific assessments of mineral deposits, the likelihood of increasing or decreasing those deposits, land costs, estimates of future mineral prices, potential extraction methods and costs, the likelihood of positive or negative changes to the environment, permitting, taxation, labor and capital costs. There cannot be a pre-determined hold period for any property as geological or economic circumstances render each property unique.
The Company’s financial statements are stated in Canadian Dollars (CDN$) and are prepared in accordance with Canadian GAAP, the application of which, in the case of the Company, conforms in all material respects for the periods presented with US GAAP except as noted in Note 14 to the financial statements.
| Item 5.C. | Research and development, patents and licenses, etc. |
The Company conducts no research and development activities, and has no patents and licenses, nor is it dependent upon any for its business.
| Item 5.D. | Trend information. |
The Company does not know of any trends, demands, commitments, events or uncertainties that will result in, or that are reasonably likely to result in, the Company’s liquidity either materially increasing or decreasing at present or in the foreseeable future. Material increases or decreases in the Company’s liquidity are substantially determined by the success or failure of the Company’s exploration programs or the future acquisition of projects.
| Item 5.E. | Off-balance sheet arrangements. |
The Company has no off-balance sheet arrangements.
| Item 5.F. | Tabular disclosure of contractual obligations. |
The Company currently leases office space in Toronto, and exploration equipment at the Ferguson Lake Property.
Table No. 5 Contractual Obligations as of February 28, 2009 Payments Due by Period |
| Contractual Obligations as of February 28, 2009 | Total | Less than 1 year | 1-3 years | 3-5 years | More than 5 years |
| Capital (Finance) Lease Obligations (1) | 82 | 70 | 12 | - | - |
| Operating Lease Obligations (2) | 857 | 178 | 553 | 126 | - |
| Kivalliq Inuit Association commercial lease | 288 | 96 | 192 | - | - |
| Airborne survey | 464 | 464 | - | - | - |
| Total | 1,691 | 808 | 757 | 126 | - |
| (1) | The leases are for exploration equipment. |
| (2) | Operating lease obligations represent the lease on the Company’s current office in Toronto. |
| ITEM 6. | DIRECTORS, SENIOR MANAGEMENT AND EMPLOYEES |
| Item 6.A. | Directors and senior management. |
Table No. 6 lists the names of each director and executive office of the Company as of February 28, 2009, and includes those elected at the annual and general shareholders meeting held on July 9, 2009. The directors have served in their respective capacities since their election and/or appointment and will serve until the next annual general meeting or until a successor is duly elected or appointed. Officers of the Company are appointed by the board of directors (“the Board”).
All directors are residents and citizens of Canada with the exception of Mr. Stuart Bottomley who is a citizen and resident of the United Kingdom.
Table No. 6 Directors and Senior Management |
Name | Position | Age | Date of First Election or Appointment |
| André J. Douchane | President and Chief Executive Officer | 58 | February, 2007 |
| Greg Van Staveren | Chief Financial Officer | 48 | September, 2007 |
| Fred Mason | Vice President, Operations | 60 | September, 2007 |
| Raymond Irwin | Vice President, Exploration | 60 | April, 2008 |
| Henry M. Giegerich (2)(3)(4) | Director | 78 | January, 2000 |
| Ross Glanville (1)(4) | Director | 62 | August, 2004 |
| Norman Betts (1)(2)(3) | Director | 54 | March, 2006 |
| H. Stuart Bottomley (4) | Director | 64 | January, 2007 |
| Shirley Mears (1)(2)(3) | Director | 54 | July, 2007 |
| Ulrich E. Rath (4) | Director | 62 | July, 2007 |
(1) Member of Audit Committee.
(2) Member of the Corporate Governance and Nominating Committee.
(3) Member of the Compensation Committee.
(4) Member of the Technical Committee.
André Douchane joined the Company in February 2007. He is a graduate of the New Mexico Institute of Mining and Technology. From 1991 to 1995, he was Vice President of Operations for Battle Mountain Gold, President, Battle Mountain North America, where he was responsible for six mining operations world-wide (two in the United States, two in South America, and two in Australia) and for all development projects. From 1996 to 2001, Mr. Douchane was Vice President of Operations for Franco-Nevada Mining Corp, where he was responsible for putting together the team that permitted, designed, engineered, developed, constructed, and managed the operations of Franco-Nevada’s high-grade underground gold mine and mill in Midas, Nevada. From 2001 to 2002, he was President and Chief Operating Officer of Chief Consolidated Mining Co, where he was responsible for operations at Utah holdings, underground gold mine and mill. From 2002 to 2003, he was President of Management Inc., a full service management consulting company. From 2003 to 2005, Mr. Douchane was President and Chief Executive Officer of North American Palladium Ltd. Since 2006, he has served as Chairman of the Board of North American Palladium Ltd.
Greg Van Staveren joined the Company in September 2007. Mr. Van Staveren is currently the President of Strategic Financial Services, a private consulting company providing business advisory services. Mr. Van Staveren is a Chartered Accountant and a Certified Public Accountant and holds a Bachelor of Math (Honours) degree from the University of Waterloo. From February 1998 until September 2001, Mr. Van Staveren was the Chief Financial Officer of MartinRea International Inc. (MRE-TSX), and prior to that he was a partner in the mining group of KPMG, where he provided accounting, and advisory services to his clients. He had been with KPMG since 1980.
Fred Mason joined the Company in October 2007. Mr. Mason is a geological engineer and holds a Bachelor of Science and Engineering degree from the University of Saskatchewan (Saskatoon). Mr. Mason was construction manager at New Gold Inc. from August 2006 to August 2007, and prior to that, he was Vice President and General Manager for the Refugio Project in Chile for Kinross Gold Corp. from August 2003 to July 2006.
Raymond Irwin joined the company in April 2008. He is a graduate of New Mexico State University with a Bachelor of Science degree in geology. He has more than 35 years of minerals exploration, mine development and mine operating experience, and is a Registered Professional Geologist in Virginia, North Carolina, Kentucky and Utah as well as a member of the American Institute of Professional Geologists and the Society of Mining, Metallurgy and Exploration. Most recently, Mr. Irwin served as Chief Geologist for Chief Consolidated Mining Company from March 2000 to November 2002; Chief Geologist for U.S. Energy Corporation from November 2002 to October 2004; Senior Environmental Engineer for the Virginia DEQ from January 2005 to November 2005 and Senior Geologist for Freeport-McMoran Copper & Gold Inc. from November 2005 to April 2008.
Henry Giegerich joined the Company as a director in January 2000. He is a graduate of the University of British Columbia and is a Professional Engineer, and has been a member of the Association of Professional Engineers of British Columbia since 1956. From 1982 to 1987, he was President & General Manager of Cominco Alaska Inc. and in this position was responsible for the development of the Red Dog Mine in northwest Alaska. From 1971 to 1981 he was with Cominco Ltd., including Project Engineer on the Black Angel Mine Project in Greenland, Project Manager for the Polaris Mine Project on Little Cornwallis Island, NWT, and finally Cominco Vice President, Northern Group, responsible for operations of the Con Mine (Yellowknife, NWT), Pine Point Mine (Pine Point, NWT) and the Polaris Mine. Since 1988 Mr. Giegerich has acted as a mineral industry consultant to various clients throughout the world and currently serves as a director of Phoscan Chemical Corp., Zincore Metals Corp. and Canada Zinc Metals Corporation, all of which are mineral exploration companies traded on the TSX Venture Exchange.
Ross Glanville joined the Company as a director in August 2004. He graduated from the University of British Columbia in 1970 with a Bachelor of Applied Science Degree (Mining Engineering), and became a member of the Association of Professional Engineers of British Columbia (P.Eng.) in 1972. In 1974, Glanville obtained a Master of Business Administration Degree (MBA), specializing in finance and securities analysis. In 1980, Glanville became a member of the Certified General Accountants of B.C. (CGA). He was formerly President of Giant Bay Resources Ltd. and Vice President of Wright Engineers Ltd. (now Fluor Corporation), and has been a director of a number of mineral resource companies. Glanville is the President of Ross Glanville & Associates, a mineral consulting firm which has valued more than six hundred mining/exploration properties and/or companies worldwide. He has also provided more than two hundred fairness opinions for mergers, amalgamations, and acquisitions of public and private companies. Glanville has also acted in more than 50 court cases and assessment appeal board hearings in Canada, the U.S.A., Australia, and the U.K. He currently serves as a director of Baja Mining Corp. (listed on the TSX Exchange), and Archon Minerals Limited and Nevada Geothermal Power Corp. (both traded on the TSX Venture Exchange).
Norman Betts joined the Company as a director in March 2006. He joined the faculty of the University of New Brunswick in 1981, and served as assistant dean of the MBA program and associate dean of faculty. He currently holds the position of associate professor in the Faculty of Business Administration. He was elected to the Legislative Assembly of the Province of New Brunswick in 1999 and served as both Minister of Finance and Minister of Business. He currently serves as a director of several companies, including New Brunswick Power, the primary power utility in New Brunswick; a director and chair of the audit committee for Minacs Worldwide, a business solutions company traded on the TSX Exchange; a director of Tembec Inc., a forest products company traded on the TSX Exchange; and a director and chair of the audit committee of Tanzanian Royalty Exploration Corporation, a mineral exploration company traded on the TSX and American Stock Exchange.
Stuart Bottomley joined the Company as a director in 2007. He worked initially as a stockbroker in the City of London and became a portfolio manager in 1972. He worked with the Target Group of Unit Trusts for 12 years, the last four under the ownership of Jacob Rothschild. In 1984, he joined Fidelity International in London, working for the ERISA group, focused on UK and European markets. Since leaving Fidelity, Mr. Bottomley has consulted for numerous private and public companies. He is currently a Non-executive Director of Centamin Egypt Plc., African Consolidated Resources Plc., Polar Star Mining Corporation and Verona Pharma Plc.
Shirley Mears joined the Company as a director in July 2007. She is a board director and chair of the audit committee of New Brunswick Power Holding Corporation. Her previous posts include VP Finance of Edgewater Computer Systems Inc., Senior VP and CFO with Hydro Ottawa Holding Inc., VP and Treasurer of Zarlink Semiconductor Inc. and VP, Treasurer and VP Human Resources Canada and Corporate Taxation of Mitel Corporation.
Ulrich Rath joined the Company as a director in July 2007. From 1999 to 2001 he was President and Chief Executive Officer of Compañía Minera Milpo S.A.A. in Lima, Peru, where he was responsible for the transformation of a one-mine family controlled/operated company into an international Peruvian mining company with two operations and a focus on the development of medium-sized mines such as Cerro Lindo. From 2002 to 2003 he was President, Chief Executive Officer, and Director of Chimera Gold Corp (formerly EAGC Ventures Ltd.), where he was responsible for facilitating a US$67 million acquisition of gold. Since 2004 Mr. Rath has served as President and Chief Executive Officer of Chariot Resources Ltd.
No director and/or executive officer has been the subject of any order, judgment, or decree of any governmental agency or administrator or of any court of competent jurisdiction, revoking or suspending for cause any license, permit or other authority of such person or of any corporation of which he/she is a director and/or executive officer, to engage in the securities business or in the sale of a particular security or temporarily or permanently restraining or enjoining any such person or any corporation of which he /she is an officer or director from engaging in or continuing any conduct, practice, or employment in connection with the purchase or sale of securities, or convicting such person of any felony or misdemeanor involving a security or any aspect of the securities business or of theft or of any felony.
There are no family relationships between any two or more directors or executive officers. There are no material arrangements or understandings between any two or more directors or executive officers.
As of the date hereof, the directors and executive officers of the Company, as a group beneficially own, directly or indirectly, or exercise control or direction over an aggregate 4,116,500 common shares or 1.2% of the Company’s issued and outstanding common shares at May 29, 2009.
During the fiscal year ended February 28, 2009, compensation paid to the directors was as follows:
Directors
| Henry Giegerich | $41,000 | | Board member, member of Technical, Environmental, Health and Safety Committee and member of Governance, Nominating and Compensation Committee |
| Robert Maddigan | 24,000 | | Former board member, and former member of Technical, Environmental, Health and Safety Committee |
| Ross Glanville | 42,000 | | Board member, member of Audit and Chair of Technical, Environmental, Health and Safety Committees |
| Norman Betts | 67,000 | | Board member, Chairman of the Board, Chair of Governance, Nominating and Compensation Committee and member of Audit Committee |
| Stuart Bottomley | 42,000 | | Board member and member of Technical, Environmental, Health and Safety Committee |
| Shirley Mears | 45,000 | | Board member, Chair of Audit Committee and member of Governance, Nominating and Compensation Committee |
| Ulrich Rath | 34,000 | | Board member and member of Technical, Environmental, Health and Safety Committee |
| TOTAL: | $295,000 | | |
For the year ending February 28, 2009, it is intended that directors receive a basic board retainer of $24,000 plus $1,000 per meeting for meetings attended in person or $500 per meeting for meetings attended by phone. A fee of $8,000 will be paid to the chair of the audit committee, and $3,000 to the chair of any other committee. A travel fee for board meetings of $1,000 per day will also be paid with a one day travel allowance for each set of board meetings. The chairman of the Board will receive an annual retainer of $60,000 plus travel fees.
Directors are entitled to reimbursement for reasonable travel and other out-of-pocket expenses incurred in connection with attendance at meetings of the Board. The Board may award special remuneration to any director undertaking any special services on behalf of the Company other than services ordinarily required of a director.
The Company also may grant stock options to executive officers, consultants and employees as indicated below under Item 6.E. “SHARE OWNERSHIP”.
During the fiscal year ended February 28, 2009, the Company granted the following stock options to executives and directors:
| Option holder | Exercise price | Options granted | Expiry date |
| Raymond Irwin | $0.87 | 1,250,000 | 01/04/2013 |
Officers
The Company entered into an employment agreement with Mr. André Douchane and 1726582 Ontario Inc., a corporation of which Mr. Douchane is a principal effective February 1, 2007, provides for an annual salary of $250,000, plus bonus payments, the size of which will vary based on performance. Mr. Douchane was also granted 2,000,000 stock options as described below. The agreement may be terminated by Mr. Douchane giving 90 days’ written notice to the Company. The Company may terminate the agreement with cause without provision of notice or payment of fees in lieu of notice. Without cause, the Company shall provide 90 days’ written notice to terminate the agreement. If the Company terminates the agreement without cause within 12 months of a change of control or Mr. Douchane terminates the agreement, the Company shall provide a lump sum payment to Mr. Douchane in the amount of 24 months’ fees, plus an amount equal to the average bonus paid to him in the 3 prior fiscal years. In addition, upon a change of control, all unvested options granted to him shall be automatically accelerated, vested and exercisable.
The Company entered into an services agreement with Mr. Greg Van Staveren and 2013026 Ontario Inc. (operating as Strategic Financial Services), a corporation wholly owned by Mr. Van Staveren, for the provision of the services as Chief Financial Officer to the Company. The agreement is effective September 14, 2007, provides for a monthly fee of $16,666.66 (plus GST), plus bonus payments, the size of which will vary based on performance. Mr. Van Staveren was also granted 1,750,000 stock options as described below. The agreement may be terminated by Mr. Van Staveren giving 90 days’ written notice to the Company. The Company may terminate the agreement with cause without provision of notice or payment of fees in lieu of notice. Without cause, the Company shall provide 90 days’ written notice to terminate the agreement. If the Company terminates the agreement without cause within 12 months of a change of control or Mr. Van Staveren terminates the agreement, the Company shall provide a lump sum payment to Mr. Van Staveren in the amount of 24 months’ fees, and all unvested options granted to him shall be automatically accelerated, vested and exercisable.
The Company entered into an employment agreement with Mr. Fred Mason for the provision of the services as Vice-President - Operations to the Company. The agreement is effective October 1, 2007 and provides for a base salary of $200,000 per year, plus bonus payments (amounting to a maximum of 70% of base salary), the size of which will vary based on performance. Mr. Mason was also granted 1,250,000 stock options as described below. The agreement may be terminated by Mr. Mason giving 4 weeks’ written notice to the Company. The Company may terminate the agreement with cause without provision of notice or payment of fees in lieu of notice. The Company may terminate the agreement without cause by providing a lump sum payment to Mr. Mason in the amount of up to 12 months’ fees.
The Company entered into a services agreement with Mr. Raymond Irwin and Raymond Irwin Consulting, for the provision of services as Vice-President - Exploration to the Company. The agreement is effective April 1, 2008 and provides for a monthly fee of USD $15,000, plus bonus payments (amounting to a maximum of 70% of base salary), the size of which will vary based on performance. Mr. Irwin was also granted 1,250,000 stock options as described below. The agreement may be terminated by Mr. Irwin giving 90 days written notice to the Company. The Company may terminate the agreement with cause without provision of notice or payment of fees in lieu of notice. The Company may terminate the agreement without cause by providing Mr. Irwin 90 days written notice or payment of fees in lieu of notice.
Other Compensation
Except for the stock option program discussed in Item 6, the Company has no material bonus or profit sharing plans pursuant to which cash or non-cash compensation is or may be paid to the Company’s executive officers or directors.
Fees and executive stock options compensation are anticipated to be increased to more closely reflect industry standards if the Company is successful at establishing economic mineral reserves on one or more of its properties which results in operating revenues or a significant level of financing.
| Item 6.C. | Board practices. |
The Company currently has three board of director committees: the Audit Committee, the Governance, Nominating and Compensation Committee, and the Technical, Environmental, Health and Safety Committee.
The Audit Committee recommends to the Board the engagement of the independent auditors of the Company and reviews with the independent auditors the scope and results of the Company’s audits, the Company’s internal accounting controls, and the professional services furnished by the independent auditors to the Company. The current members of the Audit Committee are: Norman Betts, Ross Glanville, and Shirley Mears (Chair).
��
The members of the Governance, Nominating and Compensation Committee are Norman Betts (Chair), Henry Giegerich and Shirley Mears, all of whom are independent directors of the Company. None of the Company’s executive officers have served on the Governance, Nominating and Compensation Committee, or any predecessor thereof, (or in the absence of such committee the entire board of directors) of another issuer whose executive officer is a member of the Governance, Nominating and Compensation Committee or board of directors.
The role of the Governance, Nominating and Compensation Committee is to:
| | i. | develop and monitor the effectiveness of the Company’s system of corporate governance; |
| | ii. | establish procedures for the identification of new nominees to the Board and lead the candidate selection process; |
| | iii. | develop and implement orientation procedures for new directors; |
| | iv. | assess the effectiveness of directors, the Board and the various committees of the Board; |
| | v. | ensure appropriate corporate governance and the proper delineation of the roles, duties and responsibilities of management, the Board, and its committees; |
| | vi. | assist the Board in setting the objectives for the CEO and evaluating CEO performance; |
| | vii. | establish a remuneration and benefits plan for directors, senior management and other key employees; |
| | viii. | review the adequacy and form of compensation of directors and senior management; |
| | ix. | establish a plan of succession; |
| | x. | undertake the performance evaluation of the CEO in consultation with the chair of the Board, if not the CEO; and |
| | xi. | make recommendations to the Board. |
As of February 28, 2009, the Company had 15 employees and 7 consultants under contract. The employees are not unionized. The relationship of the Company with its staff is considered to be excellent.
| Item 6.E. | Share ownership. |
The Company is a publicly-owned Canadian corporation, the shares of which are owned primarily by Canadian residents, with some US residents and residents of other countries. The Company is not controlled directly or indirectly by another corporation or any foreign government, except as described below.
As of May 29, 2009, the directors and executive officers of the Company, as a group, beneficially own, directly or indirectly, or exercise control or direction over an aggregate of 4,129,000 shares, or approximately 1.2% of the Company’s issued and outstanding common shares. Table No. 7 lists, as of May 29, 2009, directors and executive officers who beneficially own the Company’s voting securities and the amount of the Company’s voting securities owned by the directors and executive officers as a group. Further details of each director’s and executive officer’s stock option ownership are provided in Table No. 8 below.
Table No. 7
| Name and Position | Voting Securities Beneficially Owned or Controlled as at May 29, 2009 |
Norman Betts Director | 272,500 shares 1,262,500 options |
H. Stuart Bottomley Director | 1,650,000 shares 1,540,000 options |
Henry Giegerich Director | 300,000 shares 1,090,000 options |
Ross Glanville Director | 75,000 shares 1,165,000 options |
Shirley Mears Director | 32,000 shares 1,540,000 options |
Ulrich E. Rath Director | 1,540,000 options |
André J. Douchane President and CEO | 1,000,000 shares 1,700,000 options |
Greg Van Staveren CFO | 420,000 shares 1,925,000 options |
Fred Mason Vice President, Operations | 379,500 shares 1,375,000 options |
Raymond Irwin Vice President, Exploration | 1,250,000 options |
Stock Options
Options to purchase common shares from the Company are granted to directors, consultants and employees of the Company on terms and conditions acceptable to the regulatory authorities in Canada, including the TSX. The exercise prices for stock options were determined in accordance with TSX guidelines and reflect the closing price of the Company’s common shares on the trading day immediately preceding the relevant date.
The Company’s Stock Option Plan was originally approved by shareholders on November 28, 1997. An amended and restated Stock Option Plan (the “Plan”) was approved by shareholders at the Annual Special Meeting held on July 28, 2006. The details of the Plan are as follows:
The purpose of the Plan is to assist the Company in attracting and retaining directors, officers, advisors, employees and other persons engaged to provide ongoing services to the Company as an incentive for such persons to put forth maximum effort for the continued success and growth of the Company and in combination with these goals, to encourage their participation in the performance of the Company.
The number of common shares reserved for issuance under the Plan may not exceed 10% of the issued and outstanding common shares. The Board of Directors (the “Board”) may from time to time grant options to acquire all or part of the common shares under the Plan to directors, officers, advisors, employees, and other persons or companies engaged to provide ongoing services to the Company. The options are non-assignable and non-transferable otherwise than by will or by laws governing the devolution of property in the event of death. Each option entitles the holder to purchase one common share. The exercise price for options granted under the Plan will be determined by the Board on the date of the grant, which price may not be less than the market value. The market value is defined as the last daily closing price per share on the exchange on the trading day immediately preceding the relevant date. The term of the options is determined by the Board, which term may not exceed 10 years from the date of the grant. The Board also has the authority to determine the vesting conditions of the options, and certain other terms and conditions. Options may be exercised as soon as they are vested.
Options granted under the Plan will be subject to certain restrictions which include:
(a) the number of common shares which may be issued pursuant to the Plan to any one person may not exceed 5% of the common shares issued and outstanding on a non-diluted basis from time to time;
(b) the number of common shares which may be reserved for issuance pursuant to the Plan to all insiders of the Company may not exceed 10% of the issued and outstanding common shares on a non-diluted basis from time to time;
(c) the number of common shares which may be issued pursuant to the Plan to all insiders of the Company within a one-year period may not exceed 10% of the issued and outstanding shares on a non-diluted basis from time to time.
An optionee whose employment with the Company is terminated as a result of retirement, disability or redundancy will have 60 days from the date of termination to exercise any options that have vested as of the termination date. An optionee whose employment with the Company is terminated, other than for cause, at any time in the six months following a change of control of the Company, shall have 90 days from the date of termination to exercise any option granted, and all options granted will immediately vest on the date of the termination. In the event of the death of an optionee, either prior to termination or after retirement or disability, the optionee’s legal representative will have one year from the date of the optionee’s death to exercise any options that had vested on the date of the optionee’s death. In the event of any other termination, the optionee shall have 30 days from the date of termination to exercise any options that had vested on the termination date. In the event that an optionee is terminated for cause, any options not exercised prior to the termination shall lapse.
In the event that the Company:
(a) subdivides, consolidates, or reclassifies the Company’s outstanding common shares, or makes another capital adjustment or pays a stock dividend, the number of common shares receivable under the Plan will be increased or reduced proportionally; and
(b) amalgamates, consolidates with or merges with or into another body corporate, holders of options under the Plan will, upon exercise thereafter of such option, be entitled to receive and compelled to accept, in lieu of common shares, such other securities, property or cash with the holder would have received upon such amalgamation, consolidation or merger if the option was exercised immediately prior to the effective date of such amalgamation, consolidation or merger.
Subject where required, to TSX and/or applicable securities regulatory authorities’ approval, the Board may from time to time amend, suspend or terminate the Plan in whole or in part. Shareholder approval is required for amendments to the Plan that involve:
(a) amendments to the number of securities issuable under the arrangement, including an increase to a fixed maximum number or a fixed maximum percentage or a change from a fixed maximum number to a fixed maximum percentage;
(b) the introduction of a provision permitting reloading upon exercise;
(c) any change to the eligible participants which would have the potential of broadening or increasing insider participation;
(d) the addition of any form of financial assistance;
(e) any amendment to a financial assistance provision which is more favorable to participants;
(f) the addition of a cashless exercise feature, payable in cash or securities, which does not provide for a full deduction of the number of underlying securities from the reserved shares;
(g) the addition of a deferred or restricted share unit or any other provision which results in participants receiving securities while no cash consideration is received by the issuer; and
(h) in circumstances where the amendment could lead to a significant or unreasonable dilution in the issuer’s outstanding securities or may provide additional benefits to eligible participants, especially insiders, at the expense of the issuer and its existing security holders.
The Plan and any outstanding options may be amended or terminated by the Board if the amendment or termination is required by any securities regulators, a stock exchange or a market, as a condition of approval to a distribution to the public of the common shares, or to obtain or maintain a listing or quotation of the Company’s common shares. The Board may also amend or terminate any outstanding option, including, but not limited to, substituting another award of the same or of a different type or changing the date of exercise; provided, however, that the holder of the option must consent to such action if it would materially and adversely affect the holder.
Stock Options Outstanding
The names and titles of the directors/executive officers of the Company to whom outstanding stock options have been granted and the number of common shares subject to such options are set forth in Table No. 8 as of May 29, 2009.
Table No. 8
| Option holder | Exercise price | Expiry date | Quantity remaining | Total |
| André J. Douchane | $1.05 | 15/01/2013 | 200,000 | |
| | $0.285 | 01/02/2012 | 1,500,000 | 1,700,000 |
| Greg Van Staveren | $1.18 | 13/09/2012 | 1,750,000 | |
| | $1.05 | 15/01/2013 | 125,000 | 1,925,000 |
| Fred Mason | $1.59 | 28/09/2012 | 1,250,000 | |
| | $1.05 | 15/01/2013 | 125,000 | 1,375,000 |
| Raymond Irwin | $0.87 | 01/04/2013 | 1,250,000 | 1,250,000 |
| Norman Betts | $0.32 | 23/04/2012 | 525,000 | |
| | $1.05 | 15/01/2013 | 175,000 | |
| | $0.285 | 01/02/2012 | 562,500 | 1,262,500 |
| H. Stuart Bottomley | $0.32 | 23/04/2012 | 750,000 | |
| | $1.05 | 15/01/2013 | 140,000 | |
| | $0.40 | 31/01/2010 | 500,000 | |
| | $0.285 | 01/02/2012 | 150,000 | 1,540,000 |
| Henry Giegerich | $0.32 | 23/04/2012 | 750,000 | |
| | $1.05 | 15/01/2013 | 140,000 | |
| | $0.60 | 31/01/2010 | 100,000 | |
| | $0.29 | 01/02/2012 | 100,000 | 1,090,000 |
| Ross Glanville | $0.32 | 23/04/2013 | 375,000 | |
| | $1.05 | 15/01/2013 | 140,000 | |
| | $0.40 | 31/01/2010 | 100,000 | |
| | $0.40 | 27/08/2009 | 200,000 | |
| | $0.60 | 11/03/2011 | 100,000 | |
| | $0.29 | 01/02/2012 | 250,000 | 1,165,000 |
| Shirley Mears | $1.71 | 12/07/2012 | 1,400,000 | |
| | $1.05 | 15/01/2013 | 140,000 | 1,540,000 |
| Ulrich Rath | $1.71 | 12/07/2012 | 1,400,000 | |
| | $1.05 | 15/01/2013 | 140,000 | 1,540,000 |
| ITEM 7. | MAJOR SHAREHOLDERS AND RELATED PARTY TRANSACTIONS. |
| Item 7.A. | Major shareholders. |
Holdings By Major Shareholders.
As of May 29, 2009, Mr. Seymour Schulich, either directly or indirectly, held 50,000,000 shares or 15.0% of common shares of the Company.
No shareholders of the Company have different voting rights from any other shareholder.
Share Ownership by Country.
The Company researched the indirect holdings by depositories and other financial institutions and believes it has approximately 5,500 Canadian shareholders.
Control of Company.
The Company is a publicly owned Canadian corporation, the shares of which are owned primarily by Canadian residents with some U.S. and other foreign residents. The Company is not controlled by any foreign government or other person(s) except as described in Item 4.A., “History and Growth of the Company,” Item 6.E., “Share Ownership,” and Item 7.A., “Holdings by Major Shareholders”.
Change of Control of Company Arrangements.
None known.
| Item 7.B. | Related party transactions. |
During the year ended February 28, 2009, and the period up to and including May 31, 2009, other than the item discussed below, the Company had no transactions with related parties.
A former director of the Company is a major shareholder of Ferguson Simek Clark International (“FSC”), a professional engineering consulting practice specializing in cold climate and remote location projects. During the second quarter of fiscal 2009, the Company ceased to be a related party of FSC. During the year ended February 28, 2009, the Company incurred costs of $0.1 million with that entity (2008 - $0.9 million, 2007 - $0.3 million).
The transactions were in the normal course of operations and were measured at the exchange amount, which is the amount of consideration established and agreed to by the related parties.
| Item 7.C. | Interests of experts and counsel. |
No disclosure required.
| ITEM 8. | FINANCIAL INFORMATION |
| Item 8.A. | Consolidated statements and other financial information. |
See the Company’s consolidated financial statements beginning on page F-1.
The Company’s financial statements are stated in Canadian Dollars (CDN$) and are prepared in accordance with Canadian Generally Accepted Accounting Principles (GAAP), the application of which, in the case of the Company, conforms in all material respects for the periods presented with United States GAAP, except as discussed in footnotes to the financial statements.
The Company has not declared any dividend to date and has no present intention to declare any such dividend in the foreseeable future.
| Item 8.B. | Significant changes. |
No significant changes have occurred since the annual financial statements dated February 28, 2009.
| ITEM 9. | THE OFFER AND LISTING. |
| Item 9.A. | Offer and listing details. |
Until April 24, 2007, the Company’s common shares were traded on the TSX Venture Exchange (formerly the Canadian Venture Exchange. Thereafter, the common shares began trading on the Toronto Stock Exchange under the symbol “SRU”. The common shares are traded on Over the Counter (“OTC”) Bulletin Board in the United States, having the trading symbol “SRFDF”. Since 2004, the common shares of Starfield were admitted to trade on the Frankfurt Stock Exchange in Germany.
Table No. 10 lists the high and low sales prices on the TSX Venture Exchange or the Toronto Stock Exchange for the five most recent financial years, the two most recent financial years by quarter end and the most recent six months for the Company’s common shares. Table No. 10a lists the high and low sales prices for the five most recent financial years, the two most recent financial years by quarter end and the most recent six months for the Company’s common shares on the OTC Bulletin Board in the United States.
Table No. 10 TSX Venture Exchange/TSX Exchange Common Shares Trading Activity (in Canadian Dollars) | |
| | | High | | | Low | |
| Fiscal Year Ended 2/28/09 | | $ | 1.38 | | | $ | 0.07 | |
| Fiscal Year Ended 2/29/08 | | $ | 1.93 | | | $ | 0.23 | |
| Fiscal Year Ended 2/28/07 | | $ | 0.64 | | | $ | 0.21 | |
| Fiscal Year Ended 2/28/06 | | $ | 0.90 | | | $ | 0.335 | |
| Fiscal Year Ended 2/28/05 | | $ | 0.61 | | | $ | 0.32 | |
| Quarter Ended 2/28/09 | | $ | 0.32 | | | $ | 0.07 | |
| Quarter Ended 11/30/08 | | $ | 0.09 | | | $ | 0.09 | |
| Quarter Ended 8/31/08 | | $ | 1.38 | | | $ | 0.64 | |
| Quarter Ended 5/31/08 | | $ | 1.15 | | | $ | 0.70 | |
| Quarter Ended 2/29/08 | | $ | 1.40 | | | $ | 0.73 | |
| Quarter Ended 11/30/07 | | $ | 1.77 | | | $ | 1.15 | |
| Quarter Ended 8/31/07 | | $ | 1.93 | | | $ | 1.00 | |
| Quarter Ended 5/31/07 | | $ | 1.59 | | | $ | 0.23 | |
| April 2009 | | $ | 0.24 | | | $ | 0.14 | |
| March 2009 | | $ | 0.20 | | | $ | 0.14 | |
| February 2009 | | $ | 0.26 | | | $ | 0.17 | |
| January 2009 | | $ | 0.32 | | | $ | 0.15 | |
| December 2008 | | $ | 0.18 | | | $ | 0.07 | |
| November 2008 | | $ | 0.30 | | | $ | 0.09 | |
Table 10a. OTC Bulletin Board Stock Trading Activity (US Dollars) | |
| | | High | | | Low | |
| Fiscal Year Ended 2/28/09 | | $ | 1.33 | | | $ | 0.06 | |
| Fiscal Year Ended 2/29/08 | | $ | 1.82 | | | $ | 0.19 | |
| Fiscal Year Ended 2/28/07 | | $ | 0.58 | | | $ | 0.17 | |
| Fiscal Year Ended 2/28/06 | | $ | 0.74 | | | $ | 0.28 | |
| Fiscal Year Ended 2/28/05 | | $ | 0.50 | | | $ | 0.24 | |
| Quarter Ended 2/28/09 | | $ | 0.28 | | | $ | 0.06 | |
| Quarter Ended 11/30/08 | | $ | 0.81 | | | $ | 0.07 | |
| Quarter Ended 8/31/08 | | $ | 1.33 | | | $ | 0.61 | |
| Quarter Ended 5/31/08 | | $ | 1.17 | | | $ | 0.69 | |
| Quarter Ended 2/29/08 | | $ | 1.37 | | | $ | 0.71 | |
| Quarter Ended 11/30/07 | | $ | 1.79 | | | $ | 1.11 | |
| Quarter Ended 8/31/07 | | $ | 1.82 | | | $ | 0.95 | |
| Quarter Ended 5/31/07 | | $ | 1.41 | | | $ | 0.19 | |
| April 2009 | | $ | 0.20 | | | $ | 0.10 | |
| March 2009 | | $ | 0.15 | | | $ | 0.12 | |
| February 2009 | | $ | 0.22 | | | $ | 0.13 | |
| January 2009 | | $ | 0.28 | | | $ | 0.15 | |
| December 2008 | | $ | 0.15 | | | $ | 0.06 | |
| November 2008 | | $ | 0.26 | | | $ | 0.07 | |
| Item 9.B. | Plan of distribution. |
No disclosure required.
The common shares of the Company are currently listed for trading on the TSX under the trading symbol “SRU”. Prior to April 24, 2007, the common shares traded on the TSX Venture Exchange. The common shares are traded on OTC Bulletin Board in the United States, having the trading symbol “SRFDF”.
| Item 9.D. | Selling shareholders. |
No disclosure required.
No disclosure required.
| Item 9.F. | Expenses of the issue. |
No disclosure required.
| | ITEM 10.ADDITIONAL INFORMATION. |
No disclosure required.
| Item 10.B. | Memorandum and articles of association. |
Objects and Purposes
The Company is a registered extraprovincial company (Continuation Number C0773019) under the laws of British Columbia with certificate number A0047152. The Company’s Articles of Incorporation place no restrictions upon the type of business that the company may engage in.
Directors
Disclosure of Interest of Directors/Officers
As described in the Articles and By-Laws of the Company:
(a) Director shall not vote on any resolution to approve a contract in which he/she has a disclosable interest unless the contract is an arrangement by way of security for money lent to or obligations undertaken by him/her, or by a body corporate, in which he/she has an interest for the benefit of the Company or its affiliate, a contract relating primarily to his remuneration as a director, officer, employee or agent of the Company or an affiliate, a contract for indemnity or insurance pursuant to the Act, or a contract with an affiliate.
(b) In the absence of an independent quorum, directors cannot vote compensation to themselves or any members of their body.
(c) The Board of Directors may from time to time, in such amounts and on such terms as it deems expedient, charge, mortgage, hypothecate or pledge all or any of the currently owned or subsequently acquired real or personal, movable or immovable, property of the Company, including book debts, rights, powers, franchises and undertaking, to secure any debt obligations or any money borrowed, or other debt or liability of the Company.
(d) The Company’s Articles and By-Laws does not require retirement or non-retirement of directors under an age limit requirement.
(e) A director need not be a shareholder of the Company.
General Description of Capital Structure
Common Shares
The Company is authorized to issue an unlimited number of common shares, without par value, of which 332,685,899 were issued and outstanding at the February 28, 2009 year-end and 332,685,899 were issued and outstanding as of May 29, 2009. Holders of common shares are entitled to receive notice of any meeting of shareholders of the Company, and to attend and to cast one vote per common share at all such meetings. Holders of common shares do not have cumulative voting rights with respect to the election of directors and, accordingly, holders of a majority of the outstanding common shares entitled to vote in any election of directors may elect all directors standing for election. Holders of common shares are entitled to receive dividends, if any, on a pro rata basis, such dividends, as and when declared by the Company’s board of directors in its discretion. Upon the liquidation, dissolution or winding up of the Company, holders of common shares are entitled to receive on a pro rata basis the net assets of the Company after payment of debts and other liabilities, in each case subject to the rights, privileges, restrictions and conditions attending to any other series or class of shares ranking senior in priority to or on a pro rata basis with the holders of common shares with respect to dividends or liquidation. The common shares do not carry any pre-emptive subscription, redemption or conversion rights.
The Company is authorized to issue an unlimited number of First Preferred Shares and Second Preferred Shares. No First Preferred Shares or Second Preferred Shares are issued and outstanding.
Special Rights and Restrictions Attached to First and Second Preferred Shares
The First Preferred Shares and Second Preferred Shares, respectively, may include one or more series of shares and, subject to the Business Corporations Act, the directors may, by resolution, if none of the shares of any particular series are issued, alter the Articles of the Company and authorize the alteration of the Notice of Articles of the Company, as the case may be, to do one or more of: (a) determine the maximum number of shares of that series that the Company is authorize to issue, determine that there is no such maximum number, or alter any such determination; (b) create an identifying name by which the shares of that series may be identified, or alter any such identifying name; and (c) attach special rights and restrictions to the shares of that series, or alter any such special rights or restrictions.
With respect to the payment of dividends and the distribution of assets in the event of the liquidation, dissolution or winding-up of the Company, whether voluntary or involuntary, or any other distribution of the assets of the Company among its shareholders for the purpose of winding up its affairs: (a) the First Preferred Shares of each series shall rank on a parity with the First Preferred Shares of every other series and be entitled to preference over the Second Preferred Shares, the common shares and the shares of any other class ranking junior to the First Preferred Shares; and (b) the Second Preferred Shares of each series shall rank on a parity with the Second Preferred Shares of every other series and be entitled to preference over the common shares and the shares of any other class ranking junior to the Second Preferred Shares.
The Second Preferred shares of any series shall also be entitled to such other preferences, not inconsistent with these provisions, over the Common shares and the shares of any other class ranking junior to the Second Preferred shares.
The First Preferred Shares and the Second Preferred Shares, respectively, of any series shall also be entitled to such other preferences not inconsistent with the Articles and, more particularly, not inconsistent with the priorities noted above.
Shareholders have no specified rights to share in the profits of the Company and there are no sinking fund provisions or shareholder liability to further capital calls by the Company.
There are no provisions discriminating against any existing or prospective holder of securities as a result of such shareholder owning a substantial number of shares.
A Special Shareholders’ meeting can only alter the rights of holders of the Company’s shares.
Rules pertaining to annual general meetings and extraordinary general meetings of shareholders are described in Section Ten of the Company’s By-Laws. These rules are summarized as follows:
(a) The annual meeting of shareholders shall be held at such time in each year at such place as the board, the chairman of the board, the managing director or the president may from time to time determine, for the purpose of considering the financial statements and reports required by the Act to be placed before the annual meeting, electing directors if required, appointing auditors if required and transacting such other business as may properly be brought before the meeting.
(b) Meetings of the shareholders shall be held at the registered office of the Company or elsewhere in the municipality in which the registered office is situated or, if the board shall so determine, at some other place in Alberta.
(c) The board, the chairman of the board or the president shall have power to call a special meeting of the shareholders at any time.
There are no limitations on the rights to own securities.
There are no provisions of the Company’s articles of association, charter or bylaws that would have an effect of delaying, deferring or preventing a change in control of the Company and that would operate only with respect to a merger, acquisition or corporate restructuring involving the Company.
Shareholder ownership must be disclosed by any shareholder who owns more than 10% of the Company’s common shares.
Discriminatory Rights Against Significant Shareholders
The Company’s articles/by-laws do not address these issues. Accordingly, Alberta law and any exchange upon which the common shares trade govern the shareholders’ rights regarding these issues.
Modification of Rights of Shareholders
Provisions as to the modification, amendment or variation of such shareholder rights or provisions are contained in the “Business Corporations Act” of British Columbia, Canada. Unless the “Business Corporations Act” or the Company's Articles or Memorandum otherwise provide, any action to be taken by a resolution of the members may be taken by an ordinary resolution or by a vote of a majority or more of the shares represented at the shareholders' meeting.
| Item 10.C. | Material contracts. |
The Company has entered into employment agreements with each of its principle executive officers. The terms of those agreements are described in Item 6.B.
| Item 10.D. | Exchange controls. |
There are no governmental laws, decrees or regulations in Canada relating to restrictions on the export or import of capital, or affecting the remittance of interest, dividends or other payments to non-resident holders of the Company’s common shares. Any remittances of dividends to United States residents are, however, subject to a 15% withholding tax (5% if the shareholder is a corporation owning at least 10% of the common shares of the Company) pursuant to Article X of the reciprocal treaty between Canada and the United States.
Except as provided in the Investment Canada Act (the “ICA”), there are no limitations under the laws of Canada, the Province of British Columbia or in the Articles of Incorporation of the Company on the right of foreigners to hold or vote the common shares of the Company.
The ICA, which became effective on June 30, 1985, and regulates the acquisition by non-Canadians of control of a Canadian business enterprise. In effect, the ICA required review by Investment Canada, the agency which administers the ICA, and approval by the Canadian government in the case of an acquisition of control of a Canadian business by a non-Canadian where: (i) in the case of acquisition (for example, through a share purchase or asset purchase), the assets of the business are $5 million or more in value; or (ii) in the case of an indirect acquisition (for example, the acquisition of the foreign parent of the Canadian business) where the Canadian business has assets of $50 million or more in value or if the Canadian business represents more than 50% of the assets of the original group and the Canadian business has assets of $5 million or more in value. Review and approval are also required for the acquisition or establishment of a new business in areas concerning "Canada's cultural heritage or national identity" such as book publishing, film production and distribution, television and radio, production and distribution of music, and the oil and natural gas industry, regardless of the size of the investment.
In the context of the Company, in essence, three methods of acquiring control of a Canadian business are regulated by the ICA: (i) the acquisition of all or substantially all of the assets used in carrying on the Canadian business; (ii) the acquisition, directly or indirectly, of voting shares of a Canadian corporation carrying on the Canadian business; (iii) the acquisition of voting of an entity which controls, directly or indirectly, another entity carrying on a Canadian business. An acquisition of a majority of the voting interests of an entity, including a corporation, is deemed to be an acquisition of control under the ICA. An acquisition of less than one- third of the voting shares of a corporation is deemed not to be an acquisition of control. An acquisition of less than a majority, but one-third or more, of the voting shares of a corporation is presumed to be an acquisition of control unless it can be established that on the acquisition the corporation is not, in fact, controlled by the acquirer through the ownership of voting shares. For partnerships, trusts, joint ventures or other unincorporated entities, an acquisition of less than a majority of the voting interests is deemed not to be an acquisition of control.
As a result of the cumulative impact of the Free Trade Agreement between Canada and the United States to relax the restriction of the ICA, except where the Canadian business is in the cultural, oil and gas, uranium, financial services or transportation sectors, the threshold for direct acquisition of control by U.S. Investors and other foreign investors acquiring control of a Canadian business from U.S. Investors has been raised from $5 million to $223 million of gross assets, and indirect acquisitions are not reviewable.
In addition to the foregoing, the ICA requires that all other acquisitions of control of Canadian businesses by non-Canadians are subject to formal notification to the Canadian government. These provisions require a foreign investor to give notice in the required form, which notices are for information, as opposed to review, purposes.
The following summary of the material Canadian federal income tax consequences generally applicable in respect of the common shares reflects the Company’s opinion. The tax consequences to any particular holder of common shares will vary according to the status of that holder as an individual, trust, corporation or member of a partnership, the jurisdiction in which that holder is subject to taxation, the place where that holder is resident and, generally, according to that holder’s particular circumstances. This summary is applicable only to holders who are resident in the United States, have never been resident in Canada, deal at arm’s length with the Company, hold their common shares as capital property and who will not use or hold the common shares in carrying on business in Canada. Special rules, which are not discussed in this summary, may apply to a United States holder that is an issuer that carries on business in Canada and elsewhere.
This summary is based upon the provisions of the Income Tax Act of Canada and the regulations thereunder (collectively, the "Tax Act" or “ITA”) and the Canada-United States Tax Convention (the “Tax Convention”) as at the date of the Registration Statement and the current administrative practices of Canada Customs and Revenue Agency. This summary does not take into account provincial income tax consequences.
Each holder should consult his own tax advisor with respect to the income tax consequences applicable to him in his own particular circumstances.
Canadian Federal Income Tax Considerations
If a non-resident were to dispose of common shares of the Company to another Canadian corporation which deals or is deemed to deal on a non-arm’s length basis with the non-resident and which, immediately after the disposition, is connected with the Company (i.e., which holds shares representing more than 10% of the voting power and more than 10% of the market value of all issued and outstanding shares of the Company), the amount by which the fair market value of any consideration (other than any shares of the purchaser corporation) exceeds the paid-up capital of the common shares sold will be deemed to be taxable as a dividend paid by the purchasing corporation, either immediately or eventually by means of a deduction in computing the paid-up capital of the purchasing corporation, and subject to withholding taxes as described below.
Under the Tax Act, a gain from the sales of common shares by a non-resident will not be subject to Canadian tax, provided the shareholder (and/or persons who do not deal at arm’s length with the shareholder) have not held a “substantial interest” in the Company (25% or more of the shares of any class of the Company’s shares) at any time in the five years preceding the disposition. Generally, the Tax Convention will exempt from Canadian taxation any capital gain realized by the resident of the United States, provided that the value of the common shares is not derived principally from real property situated in Canada.
Dividends
In the case of any dividends paid to non-residents, the Canadian tax is withheld by the Company, which remits only the net amount to the shareholder. By virtue of Article X of the Tax Convention, the rate of tax on dividends paid to residents of the United States is generally limited to 15% of the gross dividend (or 5% in the case of certain corporate shareholders owning at least 10% of the Company’s voting shares). In the absence of the treaty provisions, the rate of Canadian withholding tax imposed on non-residents is 25% of the gross dividend. Shares dividends received by non-residents from the Company are taxable by Canada as ordinary dividends.
Where a holder disposes of common shares to the Company (unless the Company acquired the common shares in the open market in the manner in which shares would normally be purchased by any member of the public), and such disposition will result in a deemed dividend to the U.S. holder equal to the amount by which the consideration paid by the Company exceeds the paid-up capital of such shares, the amount of such dividend will be subject to withholding tax as described above.
| Item 10.F. | Dividends and paying agents. |
No disclosure required.
Item 10.G. | Statement by experts. |
No disclosure required.
| Item 10.H. | Documents on display. |
The Company files annual reports and furnishes other information with the SEC. You may read and copy any document that we file at the SEC's Public Reference Room at 100 F Street, N.W., Washington, D.C. 20549 or by accessing the Commission’s website (http://www.sec.gov). The Company also files its annual reports and other information with the Canadian Securities Administrators via SEDAR (www.sedar.com).
| Item 10.I. | Subsidiary information. |
Not applicable.
| ITEM 11. | QUANTITATIVE AND QUALITATIVE DISCLOSURE ABOUT MARKET RISK. |
| Item 11.A. | Quantitative information about market risk. |
The Company does not hold any market risk sensitive instruments. It holds cash in its bank account in Canadian dollars. From time to time, the Company funds certain operations, exploration and administrative expenses in US dollars on a cash call basis using US dollar currency converted from its Canadian dollar bank accounts held in Canada. Management believes the foreign exchange risk derived from currency conversions is negligible and therefore does not hedge its foreign exchange risk. There is possible commodity price risk, but the company is not yet in production. This is discussed in the qualitative section below.
| Item 11.B. | Qualitative information about market risk. |
The Company's risk exposures and the impact on the Company's financial instruments are summarized below:
Credit risk
The Company's credit risk is primarily attributable to receivables. The Company has no significant concentration of credit risk arising from operations. Financial instruments included in receivables consist of goods and services tax due from the Federal Government of Canada. Management believes that the credit risk concentration with respect to financial instruments included in receivables is remote.
Liquidity risk
The Company's approach to managing liquidity risk is to ensure that it will have sufficient liquidity to meet liabilities when due. As at February 28, 2009, the Company had a cash balance of $3,899 (February 29, 2008 - $10,915) to settle current liabilities of $988 (February 29, 2008 - $2,111). All of the Company's financial liabilities have contractual maturities of less than 30 days and are subject to normal trade terms.
Market risk
(a) Interest rate risk
The Company has cash balances and no interest-bearing debt. The Company's current policy is to invest excess cash in investment-grade short-term deposit certificates issued by its banking institutions. The Company periodically monitors the investments it makes and is satisfied with the credit ratings of its banks.
(b) Foreign currency risk
The Company is exposed to price risk with respect to commodity prices. Changes in commodity prices will impact the economics of development of the Company’s mineral properties. The Company closely monitors commodity prices to determine the appropriate course of action to be taken by the Company.
Sensitivity analysis
The Company has designated its cash and cash equivalents and short term investments as held-for-trading, which are measured at fair value. Accounts payable and accrued liabilities are classified as other financial liabilities, which are measured at amortized cost.
As at February 28, 2009, the carrying and fair value amounts of the Company's financial instruments are the same.
The Company does not hold significant balances in foreign currencies to give rise to exposure to foreign exchange risk.
| Item 11.C. | Interim periods. |
Not applicable.
No disclosure required.
| Item 11.E. | Small business issuers. |
No disclosure required.
| ITEM 12. | DESCRIPTION OF SECURITIES OTHER THAN EQUITY SECURITIES. |
| Item 12.A. | Debt securities. |
No disclosure required.
| Item 12.B. | Warrants and rights. |
No disclosure required.
| Item 12.C. | Other securities. |
No disclosure required.
| Item 12.D. | American depositary shares. |
Not applicable.
| ITEM 13. | DEFAULTS, DIVIDEND ARREARAGES AND DELINQUENCIES. |
No disclosure required.
| ITEM 14. | MATERIAL MODIFICATIONS TO THE RIGHTS OF SECURITY HOLDERS AND USE OF PROCEEDS. |
Not applicable.
| ITEM 15. | CONTROLS AND PROCEDURES. |
| Item 15.A. | Disclosure controls and procedures. |
Under the supervision and with the participation of our management, including the Chief Executive Officer (“CEO”) and Chief Financial Officer (“CFO”), we conducted an evaluation of our disclosure controls and procedures, as such term is defined under Rule 13a-15(e) promulgated under the Securities Exchange Act of 1934, as amended (the Exchange Act). Based on this evaluation, the CEO and CFO concluded that our disclosure controls and procedures were effective as at February 28, 2009.
| Item 15.B. | Management’s annual report on internal control over financial reporting. |
The Company’s management is responsible for establishing and maintaining adequate internal control over financial reporting.
Management has evaluated the effectiveness of the Company’s internal control over financial reporting as at February 28, 2009 based on criteria established in Internal Control - Integrated Framework issued by the Committee of Sponsoring Organizations of the Treadway Commission (COSO). Based on that evaluation, management has concluded that the Company’s internal control over financial reporting was effective as at February 28, 2009.
The effectiveness of the Company’s internal control over financial reporting as at February 28, 2009, has been audited by PricewaterhouseCoopers LLP, our independent auditors, as stated in their report which appears herein.
| Item 15.C. | Audit report of the independent auditors. |
See Item 17.
| Item 15.D. | Changes in internal control over financial reporting. |
During the year ended February 28, 2009, there were no changes in the Company’s internal controls over financial reporting, that materially affected, or are reasonably likely to affect, its internal control over financial reporting.
| ITEM 15T. | CONTROLS AND PROCEDURES. |
No disclosure required.
| ITEM 16A. | AUDIT COMMITTEE FINANCIAL EXPERT. |
The Company’s designated “Audit Committee Financial Expert” is Shirley Mears, the chairperson of the Company’s Audit Committee. All three members of the Audit Committee are considered independent. Each has extensive public company operational and directorial experience and has a high degree of financial knowledge.
The Company currently has a Governance, Nominating and Compensation Committee that oversees a stated policy of adherence to a high standard of conduct for officers and directors. A copy of the Code of Ethics will be provided for no charge upon request to the Company’s secretary.
| ITEM 16C. | PRINCIPAL ACCOUNTANT FEES AND SERVICES. |
External Auditor Service Fees (By Category)
| Fiscal year ended December 31 | | 2009 | | | 2008 | |
| Audit Fees (for audit of the Company’s annual financial statements for the respective year and reviews of the Company’s quarterly financial statements) | | $ | 97,000 | | | $ | 92,630 | |
| Audit-Related Fees (for accounting consultation) | | $ | 0 | | | $ | 0 | |
| Tax Fees | | $ | 10,100 | | | $ | 5,278 | |
| Total Fees | | $ | 107,100 | | | $ | 97,908 | |
The policy of the Audit Committee regarding the engagement of non-audit services is set out in Section 3 of the Audit Committee’s Charter.
| ITEM 16D. | EXEMPTIONS FROM THE LISTING STANDARDS FOR AUDIT COMMITTEES. |
Not applicable.
| ITEM 16E. | PURCHASES OF EQUITY SECURITIES BY THE ISSUER AND AFFILIATED PURCHASERS. |
The Company did not purchase any shares of its common shares.
| ITEM 17. | FINANCIAL STATEMENTS. |
The financial statements and notes thereto as required by this item are attached hereto and found immediately following the text of this annual report.
| ITEM 18. | FINANCIAL STATEMENTS. |
The Company has elected to provide financial statements pursuant to Item 17.
The following is a list of exhibits filed as part of this annual report on Form 20-F. We are incorporating by reference to our previous SEC filings each exhibit that contains a footnote. For exhibits incorporated by reference, the location of the exhibit in the previous filing is indicated in parentheses.
Exhibit Number | Description | |
| 1.1 | Articles of Amendment re: Name Change dated 12/4/97 | Incorporated by reference to Form 20-F and Form 6-Ks |
| 1.2 | Articles of Amendment re: Name Change dated 9/19/94 | Incorporated by reference to Form 20-F and Form 6-Ks |
| 1.3 | Articles of Incorporation dated 4/20/94 | Incorporated by reference to Form 20-F and Form 6-Ks |
| 1.4 | Certificate of Registration dated 4/22/98 | Incorporated by reference to Form 20-F and Form 6-Ks |
| 1.5 | Certificate of Continuation and Articles dated October 27, 2006 | Incorporated by reference to Exhibit 99.1 to Form 6-K filed on May 19, 2009 |
| 2. | Instruments defining the rights of holders of securities being registered | - -Refer to Exhibit No. 1.3 - - |
| 12. | Certifications | Attached hereto |
| 13. | Certifications | Attached hereto |
| 99 | Attestation Report | Included with Audited Statements Refer to Item 17 |
SIGNATURES
The registrant hereby certifies that it meets all of the requirements for filing on Form 20-F and that it has duly caused and authorized the undersigned to sign this annual report on its behalf.
| | STARFIELD RESOURCES INC. | |
| | | | |
| Date: June 3, 2009 | By: | /s/André Douchane | |
| | | André Douchane | |
| | | President and Chief Executive Officer | |
| | | | |
STARFIELD RESOURCES INC.
(An Exploration Company)
AUDITED FINANCIAL STATEMENTS
February 28, 2009
June 1, 2009
Independent Auditors’ Report
To the Shareholders of Starfield Resources Inc.
We have completed integrated audits of Starfield Resources Inc.’s 2009 and 2008 financial statements and of its internal control over financial reporting as at February 28, 2009 and an audit of its 2008 financial statements. Our opinions, based on our audits, are presented below.
Financial statements
We have audited the accompanying balance sheets of Starfield Resources Inc. as at February 28, 2009 and February 29, 2008, and the related statements of operations and comprehensive loss, changes in shareholders’ equity and cash flows for each of the years in the two year period ended February 28, 2009. These financial statements are the responsibility of the Company’s management. Our responsibility is to express an opinion on these financial statements based on our audits. We conducted our audits of the Company’s financial statements in accordance with Canadian generally accepted auditing standards and the standards of the Public Company Accounting Oversight Board (United States). Those standards require that we plan and perform an audit to obtain reasonable assurance about whether the financial statements are free of material misstatement. An audit of financial statements includes examining, on a test basis, evidence supporting the amounts and disclosures in the financial statements. A financial statement audit also includes assessing the accounting principles used and significant estimates made by management, and evaluating the overall financial statement presentation. We believe that our audits provide a reasonable basis for our opinion. In our opinion, the financial statements referred to above present fairly, in all material respects, the financial position of the Company as at February 28, 2009 and February 29, 2008 and the results of its operations and its cash flows for each of the years in the two year period ended February 28, 2009 in accordance with Canadian generally accepted accounting principles.
The financial statements as at February 28, 2007 and the year then ended were audited by other auditors who expressed an opinion without reservation on those statements in their report dated March 30, 2007.
Internal control over financial reporting
We have also audited Starfield Resources Inc.’s internal control over financial reporting as at February 28, 2009, based on criteria established in Internal Control - Integrated Framework issued by the Committee of Sponsoring Organizations of the Treadway Commission (COSO). The Company’s management is responsible for maintaining effective internal control over financial reporting and for its assessment of the effectiveness of internal control over financial reporting, included in Management’s Annual Report on Internal Control over Financial Reporting appearing under item 15.B on this Annual Report on form 20-F. Our responsibility is to express an opinion on the Company’s internal control over financial reporting based on our audit. We conducted our audit of internal control over financial reporting in accordance with the standards of the Public Company Accounting Oversight Board (United States). Those standards require that we plan and perform the audit to obtain reasonable assurance about whether effective internal control over financial reporting was maintained in all material respects. An audit of internal control over financial reporting includes obtaining an understanding of internal control over financial reporting, assessing the risk that a material weakness exists, testing and evaluating the design and operating effectiveness of internal control based on the assessed risk, and performing such other procedures as we consider necessary in the circumstances. We believe that our audit provides a reasonable basis for our opinion.
A company’s internal control over financial reporting is a process designed to provide reasonable assurance regarding the reliability of financial reporting and the preparation of financial statements for external purposes in accordance with generally accepted accounting principles. A company’s internal control over financial reporting includes those policies and procedures that (i) pertain to the maintenance of records that, in reasonable detail, accurately and fairly reflect the transactions and dispositions of the assets of the company; (ii) provide reasonable assurance that transactions are recorded as necessary to permit preparation of financial statements in accordance with generally accepted accounting principles, and that receipts and expenditures of the company are being made only in accordance with authorizations of management and directors of the company; and (iii) provide reasonable assurance regarding prevention or timely detection of unauthorized acquisition, use, or disposition of the company’s assets that could have a material effect on the financial statements.
STARFIELD RESOURCES INC. | 2
Because of its inherent limitations, internal control over financial reporting may not prevent or detect misstatements. Also, projections of any evaluation of effectiveness to future periods are subject to the risk that controls may become inadequate because of changes in conditions, or that the degree of compliance with the policies or procedures may deteriorate.
In our opinion, the Company maintained, in all material respects, effective internal control over financial reporting as at February 28, 2009 based on criteria established in Internal Control - Integrated Framework issued by the COSO.
Signed “PricewaterhouseCoopers LLP”
Chartered Accountants, Licensed Public Accountants
STARFIELD RESOURCES INC. | 3
REPORT OF INDEPENDENT REGISTERED
PUBLIC ACCOUNTING FIRM
To the Shareholders of
Starfield Resources Inc.
We have audited the statements of operations and deficit and cash flows of Starfield Resources Inc. for the year ended February 28, 2007. These financial statements are the responsibility of the Company's management. Our responsibility is to express an opinion on these financial statements based on our audits.
We conducted our audits in accordance with Canadian generally accepted auditing standards and with the standards of the Public Company Accounting Oversight Board (United States). Those standards require that we plan and perform an audit to obtain reasonable assurance whether the financial statements are free of material misstatement. An audit includes examining, on a test basis, evidence supporting the amounts and disclosures in the financial statements. An audit also includes assessing the accounting principles used and significant estimates made by management, as well as evaluating the overall financial statement presentation.
In our opinion, these financial statements present fairly, in all material respects and the results of its operations and cash flows of the Company for the year ended February 28, 2007 in accordance with Canadian generally accepted accounting principles.
| /s/ Davidson & Company LLP |
| |
| Chartered Accountants |
Vancouver, Canada
March 30, 2007
STARFIELD RESOURCES INC. | 4
Balance Sheets
As at February 28, 2009 and February 29, 2008
(in thousands of Canadian dollars)
| | | February 28, | | | February 29, | |
| | | 2009 | | | 2008 | |
| | | | | | | |
| ASSETS | | | | | | |
| Current Assets | | | | | | |
Cash | | $ | 3,899 | | | $ | 10,915 | |
Receivables | | | 769 | | | | 316 | |
Prepaid expenses and deposits (Note 5) | | | 465 | | | | 1,699 | |
| Total current assets | | | 5,133 | | | | 12,930 | |
| | | | | | | | | |
Mineral properties (Note 6) | | | 105,379 | | | | 76,664 | |
Equipment (Note 7) | | | 534 | | | | 721 | |
| Total assets | | $ | 111,046 | | | $ | 90,315 | |
| | | | | | | | | |
| | | | | | | | | |
| LIABILITIES | | | | | | | | |
| Current Liabilities | | | | | | | | |
Accounts payable and accrued liabilities | | $ | 918 | | | $ | 1,995 | |
Current portion of capital lease obligation (Note 8) | | | 70 | | | | 116 | |
| Total current liabilities | | | 988 | | | | 2,111 | |
| | | | | | | | | |
Capital lease obligations (Note 8) | | | 9 | | | | 69 | |
Future income tax liability (Note 9) | | | 5,007 | | | | 2,139 | |
| Total long-term liabilities | | | 5,016 | | | | 2,208 | |
| | | | | | | | | |
| SHAREHOLDERS' EQUITY | | | | | | | | |
Share capital | | | 120,918 | | | | 102,513 | |
Contributed surplus | | | 12,341 | | | | 8,575 | |
Warrants | | | 751 | | | | 734 | |
Deficit | | | (28,968 | ) | | | (25,826 | ) |
| Total shareholders' equity | | | 105,042 | | | | 85,996 | |
| Total liabilities and shareholders' equity | | $ | 111,046 | | | $ | 90,315 | |
Nature and continuance of operations (Note 1)
Commitments and contingencies (Note 13)
The accompanying notes are an integral part of these financial statements.
On behalf of the Board:
| | | | |
| | | | |
| (signed) | Director | (signed) | Director |
| Norman Betts | | Shirley Mears | |
STARFIELD RESOURCES INC. | 5
Statements of Operations and Comprehensive Loss
For the years ended February 28, 2009, February 29, 2008 and February 28, 2007
(in thousands of Canadian dollars except loss per share)
| | | | | | | | | | |
| | | 2009 | | | 2008 | | | 2007 | |
| Expenses | | | | | | | | | |
General and administrative | | | | | | | | | |
Consulting | | $ | 53 | | | $ | 95 | | | $ | 235 | |
Directors' fees | | | 217 | | | | 282 | | | | 108 | |
Investor relations | | | 370 | | | | 1,368 | | | | 298 | |
Legal and audit | | | 592 | | | | 778 | | | | 449 | |
Management compensation | | | 1,391 | | | | 1,633 | | | | 927 | |
Rent and office services | | | 456 | | | | 421 | | | | 261 | |
Transfer and regulatory fees | | | 130 | | | | 265 | | | | 149 | |
Travel and conferences | | | 246 | | | | 290 | | | | 686 | |
| | | | 3,455 | | | | 5,132 | | | | 3,113 | |
| Amortization of equipment | | | 160 | | | | 45 | | | | 5 | |
Stock-based compensation (Note 11) | | | 737 | | | | 8,319 | | | | 1,645 | |
| Interest income | | | (376 | ) | | | (483 | ) | | | (150 | ) |
| Loss before income taxes | | | 3,976 | | | | 13,013 | | | | 4,613 | |
| Future income tax recovery | | | (834 | ) | | | (1,173 | ) | | | (2,513 | ) |
| Net loss and comprehensive loss for the year | | $ | 3,142 | | | $ | 11,840 | | | $ | 2,100 | |
| Basic and diluted net loss per share | | $ | 0.01 | | | $ | 0.04 | | | $ | 0.01 | |
| Weighted average number of shares outstanding | | | 319,325 | | | | 298,702 | | | | 189,474 | |
The accompanying notes are an integral part of these financial statements.
STARFIELD RESOURCES INC. | 6
Statements of Cash Flow
For the years ended February 28, 2009, February 29, 2008 and February 28, 2007
(in thousands of Canadian dollars)
| | | | | | | | | | |
| | | 2009 | | | 2008 | | | 2007 | |
| OPERATING ACTIVITIES | | | | | | | | | |
Net loss for the year | | $ | (3,142 | ) | | $ | (11,840 | ) | | $ | (2,100 | ) |
Non-cash charges (credits) to earnings: | | | | | | | | | | | | |
Future income tax recovery | | | (834 | ) | | | (1,173 | ) | | | (2,513 | ) |
Stock based compensation expense | | | 737 | | | | 8,319 | | | | 1,645 | |
Amortization of equipment | | | 160 | | | | 45 | | | | 5 | |
Settlement of investor relations contracts | | | - | | | | 985 | | | | - | |
Changes in non-cash working capital: | | | | | | | | | | | | |
Increase in receivables | | | (453 | ) | | | (141 | ) | | | (23 | ) |
Decrease (increase) in prepaid expenses and deposits | | | 1,234 | | | | (1,616 | ) | | | (40 | ) |
Increase (decrease) in accounts payable and accrued liabilities | | | (1,527 | ) | | | (541 | ) | | | 57 | |
| Net cash used in operating activities | | | (3,825 | ) | | | (5,962 | ) | | | (2,969 | ) |
| INVESTING ACTIVITIES | | | | | | | | | | | | |
Mineral properties | | | (24,956 | ) | | | (12,873 | ) | | | (16,154 | ) |
Acquisition of equipment | | | (18 | ) | | | (257 | ) | | | (235 | ) |
| Net cash provided used in investing activities | | | (24,974 | ) | | | (13,130 | ) | | | (16,389 | ) |
| FINANCING ACTIVITIES | | | | | | | | | | | | |
Issuance of shares and units | | | 23,096 | | | | 31,082 | | | | 19,115 | |
Repayment of capital lease obligations | | | (106 | ) | | | (141 | ) | | | (104 | ) |
Share issue costs | | | (1,207 | ) | | | (1,440 | ) | | | (1,281 | ) |
| Net cash provided by financing activities | | | 21,783 | | | | 29,501 | | | | 17,730 | |
| Increase (decrease) in cash | | | (7,016 | ) | | | 10,409 | | | | (1,628 | ) |
| Cash at beginning of year | | | 10,915 | | | | 506 | | | | 2,134 | |
| Cash at end of year | | $ | 3,899 | | | $ | 10,915 | | | $ | 506 | |
| Supplemental Disclosures | | | | | | | | | | | | |
Interest received | | $ | 376 | | | $ | 483 | | | $ | 150 | |
Taxes paid | | $ | - | | | $ | - | | | $ | - | |
The accompanying notes are an integral part of these financial statements.
STARFIELD RESOURCES INC. | 7
Statements of Changes in Shareholders’ Equity
As at February 28, 2009, February 29, 2008 and February 2007
(in thousands of Canadian dollars)
| | | February 28, 2009 | | | February 29, 2008 | | | February 28, 2007 | |
| | | Number | | | Amount | | | Number | | | Amount | | | Number | | | Amount | |
| Share Capital | | | | | | | | | | | | | | | | | | |
Authorized | | | | | | | | | | | | | | | | | | |
Unlimited common shares, no par value | | | | | | | | | | | | | | | | | | |
Unlimited number of First Preferred shares | | | | | | | | | | | | | | | | | | |
Unlimited number of Second Preferred shares | | | | | | | | | | | | | | | | | | |
Issued | | | | | | | | | | | | | | | | | | |
Common Shares | | | | | | | | | | | | | | | | | | |
Balance at beginning of year | | | 301,151,593 | | | $ | 102,513 | | | | 200,849,847 | | | $ | 72,516 | | | | 163,350,351 | | | $ | 56,768 | |
Capital stock issued: | | | | | | | | | | | | | | | | | | | | | | | | |
Private placements (Note 10) | | | 29,765,556 | | | | 22,285 | | | | 58,392,854 | | | | 14,147 | | | | 35,881,162 | | | | 18,332 | |
Exercise of warrants | | | - | | | | - | | | | 28,333,890 | | | | 10,538 | | | | 1,033,334 | | | | 620 | |
Exercise of options (Note 11) | | | 1,768,750 | | | | 794 | | | | 13,425,002 | | | | 5,444 | | | | 585,000 | | | | 162 | |
On contract termination | | | - | | | | - | | | | 150,000 | | | | 251 | | | | - | | | | - | |
Transfer to capital stock: | | | | | | | | | | | | | | | | | | | | | | | | |
Transfer from warrants on exercise of warrants | | | - | | | | - | | | | - | | | | 953 | | | | - | | | | - | |
Transferred from contributed surplus on
exercise of stock options | | | - | | | | 235 | | | | - | | | | 2,156 | | | | - | | | | 11 | |
Flow-through tax benefits renounced | | | - | | | | (4,050 | ) | | | - | | | | (2,052 | ) | | | - | | | | (1,929 | ) |
Share issuance costs | | | - | | | | (1,207 | ) | | | - | | | | - | | | | - | | | | - | |
Future taxes on share issuance costs | | | - | | | | 348 | | | | - | | | | (1,440 | ) | | | - | | | | (1,448 | ) |
Balance at end of year | | | 332,685,899 | | | | 120,918 | | | | 301,151,593 | | | | 102,513 | | | | 200,849,847 | | | | 72,516 | |
| Warrants | | | | | | | | | | | | | | | | | | | | | | | | |
Balance at beginning of year | | | 800,000 | | | | 734 | | | | 22,202,153 | | | | - | | | | 28,612,259 | | | | - | |
Issued (Note 10) | | | 407,100 | | | | 17 | | | | 20,994,997 | | | | 1,687 | | | | 13,214,596 | | | | - | |
Exercised | | | - | | | | - | | | | (28,333,892 | ) | | | (953 | ) | | | (1,033,334 | ) | | | - | |
Expired | | | - | | | | - | | | | (14,063,258 | ) | | | - | | | | (18,591,368 | ) | | | - | |
Balance at end of year | | | 1,207,100 | | | | 751 | | | | 800,000 | | | | 734 | | | | 22,202,153 | | | | - | |
| Contributed surplus | | | | | | | | | | | | | | | | | | | | | | | | |
Balance at beginning of year | | | | | | | 8,575 | | | | | | | | 2,412 | | | | | | | | 670 | |
Stock based compensation expense | | | | | | | 4,001 | | | | | | | | 8,319 | | | | | | | | 1,645 | |
Share issuance costs | | | | | | | - | | | | | | | | - | | | | | | | | 108 | |
Transferred to share capital on exercise of stock options | | | | | | | (235 | ) | | | | | | | (2,156 | ) | | | | | | | (11 | ) |
Balance at end of year | | | | | | | 12,341 | | | | | | | | 8,575 | | | | | | | | 2,412 | |
| Deficit | | | | | | | | | | | | | | | | | | | | | | | | |
Balance at beginning of year | | | | | | | (25,826 | ) | | | | | | | (13,986 | ) | | | | | | | (11,886 | ) |
Net loss | | | | | | | (3,142 | ) | | | | | | | (11,840 | ) | | | | | | | (2,100 | ) |
Balance at end of year | | | | | | | (28,968 | ) | | | | | | | (25,826 | ) | | | | | | | (13,986 | ) |
| Shareholders' equity at end of year | | | | | | $ | 105,042 | | | | | | | $ | 85,996 | | | | | | | $ | 60,942 | |
The accompanying notes are an integral part of these financial statements.
STARFIELD RESOURCES INC. | 8
| Notes to the Financial Statements |
| For the year ended February 28, 2009 |
| (in thousands of Canadian dollars, unless otherwise noted) |
| |
| 1. | Nature and Continuance of Operations |
The Company was incorporated under the Business Corporations Act (Alberta, Canada) on April 22, 1994, registered in the province of British Columbia as an extra-provincial company on April 22, 1998 and in the Nunavut Territory, Canada as an extra-territorial corporation on March 18, 2003. The Alberta registration was discontinued and continued in British Columbia on October 27, 2006. The Company’s major business activity is the exploration and development of mineral properties, particularly its Ferguson Lake nickel-copper-platinum-palladium-cobalt project in Nunavut, Canada. All of the Company’s properties are located in Canada.
The Company is an advanced exploration company focused on its Ferguson Lake property. Starfield owns a 100% undivided interest in the Ferguson Lake nickel-copper-platinum-palladium-cobalt property (Note 6). The Company has also commenced an exploration program for diamonds and other minerals on other parts of its property.
As an advanced exploration company, the Company’s income is limited to interest income and other incidental income. The Company continues to be dependent upon its ability to finance its development and exploration programs through financing activities that may include issuances of additional debt or equity securities. The recoverability of the carrying value of exploration projects, and ultimately, the Company’s ability to continue as a going concern, is dependent upon the existence and economic recovery of mineral reserves, confirmation of the Company’s interest in the underlying mineral claims, the ability to raise long-term financing to complete the development of the properties, and upon future profitable production or, alternatively, upon the Company’s ability to dispose of its interest on an advantageous basis, all of which are uncertain.
| 2. | Summary of Significant Accounting Policies |
a) Use of estimates
The preparation of financial statements in conformity with Canadian generally accepted accounting principles requires management to make estimates and assumptions which affect the reported amounts of assets and liabilities at the date of the financial statements and revenues and expenses for the year reported. By their nature, these estimates are subject to measurement uncertainty and the effect on the financial statements of changes in such estimates in future years could be significant. Actual results will likely differ from those estimates.
b) Financial instruments
The Company’s financial instruments consist of cash, receivables, refundable deposits, accounts payable and accrued liabilities. Financial assets and liabilities are initially recognized at fair value and their subsequent measurement is dependent on their classification. Starfield has classified its cash and refundable deposits as held for trading. Receivables are classified as loans and receivables. Accounts payable and accrued liabilities are classified as other financial liabilities. Unless otherwise noted, it is management’s opinion that the Company is not exposed to significant interest, currency or credit risks arising from these financial instruments. The fair value of these financial instruments approximates their carrying value, due to their short term maturity.
c) Mineral properties
The cost of each mineral property, or interest therein, together with exploration costs are capitalized until the properties to which they relate are placed into production, sold or abandoned or management has determined there to be an impairment in value. Costs of abandoned properties are written off to operations.
STARFIELD RESOURCES INC. | 9
| Notes to the Financial Statements |
| For the year ended February 28, 2009 |
| (in thousands of Canadian dollars, unless otherwise noted) |
| |
These costs will be amortized on the basis of units produced in relation to the proven and probable reserves available on the related property following commencement of production. Each project is assessed on an
annual basis for impairment by comparing the present value of the future cash flows (fair value) to the capitalized book value. If the book value exceeds the fair value, the project will be written down to reflect the new fair value.
Although the Company has taken steps to verify the title to resource properties in which it has an interest, in accordance with industry standards for the current stage of exploration of such properties, these procedures do not guarantee the Company’s title. Property title may be subject to unregistered prior agreements, transfers or native land claims and title may be affected by undetected defects.
d) Amortization of equipment
Equipment is recorded at cost with amortization provided on a declining balance and straight-line basis as follows:
| Furniture and fixtures | 20% |
| Exploration equipment | 30% |
| Equipment under capital lease | 30% |
| Leasehold improvement | straight-line over 18 months |
In the year of acquisition only one-half of the normal rate is applied. Amortization related to exploration equipment is deferred to mineral properties, as they are part of exploration costs.
e) Leases
Leases that substantially transfer all of the benefits and risks of ownership of property to the Company, or otherwise meet the criteria for capitalization under Canadian generally accepted accounting principles, are accounted for as capital leases. An asset is recorded at the time a capital lease is entered into together with its related long-term obligation to reflect its purchase and financing. Rental payments under operating leases are expensed as incurred.
f) Flow-through common shares
Resource expenditure deductions for income tax purposes related to exploration activities funded by flow-through share arrangements are renounced to investors in accordance with Canadian income tax legislation. The Company records a future income tax liability and a reduction in capital stock for the estimated tax benefits transferred to shareholders. When the Company renounces flow-through expenditures, a portion of the Company’s future income tax assets that were not recognized in previous years, due to the recording of a valuation allowance, will be recognized as a recovery of future income taxes in the statement of operations.
g) Loss per share
The Company uses the treasury stock method to compute the dilutive effect of options, warrants and similar instruments. Under this method the dilutive effect on earnings per share is recognized on the use of the proceeds that could be obtained upon exercise of options, warrants and similar instruments. It assumes that the proceeds would be used to purchase common shares at the average market price during the year. For loss per share the dilutive effect has not been computed as it proved to be anti-dilutive. Basic loss per share is calculated using the weighted-average number of shares outstanding during the year.
STARFIELD RESOURCES INC. | 10
| Notes to the Financial Statements |
| For the year ended February 28, 2009 |
| (in thousands of Canadian dollars, unless otherwise noted) |
| |
h) Stock-based compensation
The Company follows the fair value method of accounting for its stock-based compensation. The fair value of the stock options awarded is determined at the grant date using the Black-Scholes option pricing model and the associated value is recognized over the vesting period through a charge to statement of operations or capitalized to mineral properties. Consideration paid for the shares on the exercise of stock options is credited to capital stock.
i) Income taxes
Income taxes are provided for in accordance with the asset and liability method. Under this method of tax allocation, future income tax assets and liabilities are determined based on differences between the financial statement carrying values and their respective income tax bases (temporary differences). Future income tax assets and liabilities are measured using the enacted tax rates expected to be in effect when the temporary differences are likely to reverse. The effect on future income tax assets and liabilities of a change in rates is included in operations in the year in which the change is enacted or substantively enacted. The amount of future income tax assets recognized is limited to the amount that is more likely than not to be realized.
j) Changes in accounting policies
The CICA has issued three new standards which the Company adopted commencing in the quarter ended May 31, 2008.
Handbook Section 1535 specifies the disclosure of (i) an entity’s objectives, policies and processes for managing capital; (ii) quantitative data about what the entity regards as capital; (iii) whether the entity has complied with any capital requirements; and (iv) if it has not complied, the consequences of such noncompliance. The Company has included disclosures recommended by the new Handbook section in note 3 to these financial statements.
Handbook Sections 3862 and 3863 replace Handbook Section 3861, Financial Instruments - Disclosure and Presentation, revising and enhancing its disclosure requirements, and carrying forward unchanged its presentation requirements. These new sections place increased emphasis on disclosures about the nature and extent of risks arising from financial instruments and how the entity manages those risks. The Company has included disclosures recommended by the new Handbook sections in note 4 to these financial statements.
Handbook Section 3064, Goodwill and intangible assets, establishes revised standards for recognition, measurement, presentation and disclosure of goodwill and intangible assets. Concurrent with the introduction of this standard, the CICA withdrew EIC 27, Revenues and expenses during the pre-operating period. The Company will adopt the requirements commencing in the quarter ended May 31, 2009 and is considering the impact this will have on the Company’s financial statements.
k) New accounting pronouncements
In October 2008, the CICA issued Handbook Section 1582, Business Combinations, which establishes new standards for accounting for business combinations. It provides the Canadian equivalent to IFRS 3. This is effective for business combinations for which the acquisition date is on or after the beginning of the first annual reporting period beginning on or after January 1, 2011. The Company will assess the impact of this section prior to implementation.
Also in October 2008, the CICA issued Handbook Sections 1601, Consolidated Financial Statements and 1602, Non-controlling Interests to replace Section 1600, Consolidated Financial Statements. Section 1601 establishes standards for the preparation of consolidated financial statement whereas Section 1602 establishes standards to provide guidance on accounting for non-controlling interests subsequent to a business combination. It is equivalent to the corresponding provisions found in International Accounting Standards (“IAS”) 27. This is effective for fiscal years beginning on or after January, 2011. The Company does not expect these standards to have any material impact on its financial statements.
STARFIELD RESOURCES INC. | 11
| Notes to the Financial Statements |
| For the year ended February 28, 2009 |
| (in thousands of Canadian dollars, unless otherwise noted) |
| |
In March 2009, the CICA approved EIC 174, Mining Exploration Costs. This guidance clarified when exploration costs related to mineral properties may be capitalized and, if exploration costs are initially capitalized, when should impairment be assessed to determine whether a write-down is required. The guidance further clarified what conditions indicate impairment. This guidance is applicable to financial statements filed after March 27, 2009. The Company has considered this guidance in assessing the value of its mineral properties and has determined that there is no impairment in value at February 28, 2009.
l) Comparative data
Certain of the prior year’s comparative numbers have been reclassified to reflect the current year’s financial statement presentation.
The Company manages its capital structure and makes adjustments to it, based on the funds available to the Company, in order to support the acquisition, exploration and development of mineral properties. The board of directors does not establish quantitative return on capital criteria for management, but rather relies on the expertise of the Company's management to sustain future development of the business.
The properties in which the Company currently has an interest are in the advanced exploration stage; as such, the Company is dependent on external financing to fund its activities. In order to carry out the planned exploration and development, and pay for administrative costs, the Company will spend its existing working capital, and raise additional amounts as needed. The Company will continue to assess new properties, from time to time, and to acquire an interest in additional properties if it considers there to be sufficient geologic or economic potential, and if it has adequate financial resources to do so. Companies in this stage typically rely upon equity financing or joint venture partnerships to fund the advancement of projects. The current financial markets are very difficult and there is no certainty with respect to the Company’s ability to raise capital.
Management reviews its capital management approach on an ongoing basis and believes that this approach, given the relative size of the Company, is reasonable.
There were no changes in the Company's approach to capital management during the year ended February 28, 2009. The Company is not subject to externally imposed capital requirements.
The Company's risk exposures and the impact on the Company's financial instruments are summarized below:
Credit risk
The Company's credit risk is primarily attributable to short-term investments and receivables. The Company has no significant concentration of credit risk arising from operations. Short-term investments are classified as cash equivalents and consist of overnight deposits, which have been invested with reputable financial institutions, from which management believes the risk of loss to be remote. Financial instruments included in receivables consist of goods and services tax due from the Federal Government of Canada. Management believes that the credit risk concentration with respect to financial instruments included in receivables is remote.
STARFIELD RESOURCES INC. | 12
| Notes to the Financial Statements |
| For the year ended February 28, 2009 |
| (in thousands of Canadian dollars, unless otherwise noted) |
| |
Liquidity risk
The Company's approach to managing liquidity risk is to ensure that it will have sufficient liquidity to meet liabilities when due. As at February 28, 2009, the Company had a cash balance of $3,899 (February 29, 2008 - $10,915) to settle current liabilities of $988 (February 29, 2008 - $2,111). All of the Company's financial liabilities have contractual maturities of less than 30 days and are subject to normal trade terms with the exception of Starfield’s capital leases which have maturities of July 2009 and July 2010, respectively.
Market risk
(a) Interest rate risk
The Company has cash balances and no interest-bearing debt. The Company's current policy is to invest excess cash in investment-grade short-term deposit certificates issued by its banking institutions. The Company periodically monitors the investments it makes and is satisfied with the credit ratings of its banks.
(b) Foreign currency risk
The Company's functional currency is the Canadian dollar and major purchases are transacted in Canadian dollars. From time to time, the Company funds certain operations, exploration and administrative expenses in US dollars on a cash call basis using US dollar currency converted from its Canadian dollar bank accounts held in Canada. Management believes the foreign exchange risk derived from currency conversions is not significant and therefore does not hedge its foreign exchange risk.
(c) Price risk
The Company is exposed to price risk with respect to commodity prices. Changes in commodity prices will impact the economics of development of the Company’s mineral properties. The Company closely monitors commodity prices to determine the appropriate course of action to be taken by the Company.
Sensitivity analysis
The Company has designated its cash and cash equivalents and short term investments as held-for-trading, which are measured at fair value. Accounts payable and accrued liabilities are classified as other financial liabilities, which are measured at amortized cost.
As at February 28, 2009, the carrying and fair value amounts of the Company's financial instruments are the same.
The Company does not hold significant balances in foreign currencies to give rise to exposure to foreign exchange risk.
| 5. | Prepaid Expenses and Deposits |
| | | February 28, | | | February 29, | |
| | | 2009 | | | 2008 | |
| Deposits - property leases | | $ | 274 | | | $ | 274 | |
| Prepaid insurance | | | 98 | | | | 73 | |
| Prepaid drilling | | | - | | | | 981 | |
| Prepaid fuel | | | - | | | | 297 | |
| Other | | | 93 | | | | 74 | |
| | | $ | 465 | | | $ | 1,699 | |
Deposits consist of $274 on deposit with the Kivalliq Inuit Association as reclamation, wildlife and environmental bonds.
STARFIELD RESOURCES INC. | 13
| Notes to the Financial Statements |
| For the year ended February 28, 2009 |
| (in thousands of Canadian dollars, unless otherwise noted) |
| |
| | | February 28, | | | February 29, | |
| | | 2009 | | | 2008 | |
| Property acquisitions and maintenance costs | | | | | | |
| Balance, beginning of year | | $ | 2,378 | | | $ | 2,188 | |
| Maintenance | | | 316 | | | | 190 | |
| Balance, end of year | | $ | 2,694 | | | $ | 2,378 | |
| | | | | | | | | |
| Exploration costs | | | | | | | | |
| Balance, beginning of year | | $ | 74,286 | | | $ | 61,393 | |
Compensation (Note 11) | | | 7,457 | | | | 2,568 | |
| Air support including helicopter moves | | | 4,070 | | | | 3,030 | |
| Diamond drilling | | | 3,525 | | | | 829 | |
| Camp support costs, including fuel | | | 8,492 | | | | 4,329 | |
| Analytical and geophysical services | | | 4,855 | | | | 2,137 | |
| Balance, end of year | | $ | 102,685 | | | $ | 74,286 | |
| Mineral properties | | $ | 105,379 | | | $ | 76,664 | |
| | | | | | | | | |
The Company owns a 100% undivided interest in the Ferguson Lake nickel-copper-platinum-palladium-cobalt property, subject to a 3% net smelter royalty (“NSR”) on mineral production, a 3% gross overriding royalty on diamond production and a $50 annual advance royalty payment. The Company has the right to purchase 1% of the 3% NSR for $1,000 up to 180 days after receipt of a positive feasibility study recommending commercial production.
| | | February 28, 2009 | | | February 29, 2008 | |
| | | | | | | | | Net | | | | | | | | | Net | |
| | | | | | Accumulated | | | book | | | | | Accumulated | | | book | |
| | | Cost | | | amortization | | | value | | | Cost | | | amortization | | | value | |
| Furniture and fixtures | | $ | 338 | | | $ | 147 | | | $ | 191 | | | $ | 320 | | | $ | 90 | | | $ | 230 | |
| Exploration equipment | | | 366 | | | | 263 | | | | 103 | | | | 366 | | | | 219 | | | | 147 | |
| Equipment under capital lease | | | 578 | | | | 338 | | | | 240 | | | | 578 | | | | 234 | | | | 344 | |
| | | $ | 1,282 | | | $ | 748 | | | $ | 534 | | | $ | 1,264 | | | $ | 543 | | | $ | 721 | |
Amortization on exploration equipment of $44 (2008 - $210) was deferred to mineral properties.
8. | Capital Lease Obligations |
Future minimum lease payments under capital leases for equipment are as follows:
| | | February 28, | | | February 29, | |
| | | 2009 | | | 2008 | |
| Leases payable | | $ | 79 | | | $ | 185 | |
| Less: current portion | | | (70 | ) | | | (116 | ) |
| | | $ | 9 | | | $ | 69 | |
STARFIELD RESOURCES INC. | 14
| Notes to the Financial Statements |
| For the year ended February 28, 2009 |
| (in thousands of Canadian dollars, unless otherwise noted) |
| |
Leases payable bear interest at rates from 6.9% to 7.6% per annum, and are repayable in monthly instalments totalling $10 including interest. The leases are secured by equipment.
Estimated minimum lease payments are as follows:
| 2009 | | $ | - | | | $ | 116 | |
| 2010 | | | 70 | | | | 69 | |
| 2011 | | | 12 | | | | 13 | |
| | | | 82 | | | | 198 | |
| Less: amount representing interest | | | (3 | ) | | | (13 | ) |
| Balance of obligation | | $ | 79 | | | $ | 185 | |
A reconciliation of income taxes at statutory rates and reported taxes for the years ended February 28, 2009, February 29, 2008 and February 28, 2007 is as follows:
| | | 2009 | | | 2008 | | | 2007 | |
| | | | | | | | | | |
| Loss for year before income tax recovery | | $ | 3,976 | | | $ | 13,013 | | | $ | 4,613 | |
| Income tax recovery at statutory rates | | $ | 1,233 | | | $ | 3,513 | | | $ | 1,606 | |
| Adjusted for the effect of: | | | | | | | | | | | | |
| Non-deductible expenses | | | (3 | ) | | | (4 | ) | | | (78 | ) |
| Non-deductible stock compensation | | | (228 | ) | | | (2,246 | ) | | | (589 | ) |
| Resource loss for tax purposes and impact of rate change | | | (168 | ) | | | (90 | ) | | | 1,574 | |
| Recovery of income taxes | | $ | 834 | | | $ | 1,173 | | | $ | 2,513 | |
| | | | | | | | | | | | | |
The significant components of the Company’s future income tax assets and liabilities are as follows:
| | | February 28, | | | February 29, | | | February 28, | |
| | | 2009 | | | 2008 | | | 2007 | |
| Future income tax assets | | | | | | | | | |
| Loss carryforwards | | $ | 4,824 | | | $ | 3,659 | | | $ | 3,130 | |
| Equipment | | | 53 | | | | 25 | | | | (108 | ) |
| Share issuance costs | | | 661 | | | | 672 | | | | 378 | |
| | | | 5,538 | | | | 4,356 | | | | 3,400 | |
| Future income tax liabilities | | | | | | | | | | | | |
| Resource deductions | | | 10,545 | | | | 6,495 | | | | 4,660 | |
| Net future income tax liabilities | | $ | 5,007 | | | $ | 2,139 | | | $ | 1,260 | |
The Company has non-capital losses of approximately $17,868 (2008 - $13,550) available for deduction against future years’ taxable income. These losses, if not utilized with expire through 2029. Subject to certain restrictions, the Company also has resource expenditures available to reduce taxable income in future years.
The benefit associated with these non-capital losses has been recorded for accounting purposes.
STARFIELD RESOURCES INC. | 15
| Notes to the Financial Statements |
| For the year ended February 28, 2009 |
| (in thousands of Canadian dollars, unless otherwise noted) |
| |
10. Financing
On May 6, 2008, the Company issued 15,000,000 flow-through common shares at a price of $1.00 per share for gross proceeds of $15,000 and 5,555,556 common shares at a price of $0.90 per share for gross proceeds of $5,000, with aggregate proceeds totaling $20,000. The Company paid issuance costs of $1,026, with a future tax impact of $299.
On February 26, 2009, the Company issued 9,210,000 flow-through common shares at a price of $0.25 per share for gross proceeds of $2,302. A portion of the proceeds was allocated to the broker warrants issued as described below. The Company paid issuance costs of $181, with a future tax impact of $49.
As part of the February 26, 2009 equity financing, the Company issued 407,100 broker warrants which entitles the holder to purchase one common share at a price of $0.40 until February 25, 2011. A relative fair value calculation was used to present the carrying value of the warrants. The 407,100 broker warrants were assigned a fair value of $17. The fair value of the warrants issued was estimated using a Black-Scholes pricing model with the following assumptions:
| Risk-free interest rate | 1.23% |
| Expected life of options | 2 years |
| Annualized volatility | 93.00% |
| Dividend rate | |
In aggregate, the Company issued a total of 29,765,556 common shares for gross proceeds of $22,285 and 407,100 broker warrants with proceeds of $17. The total issuance costs were $1,207 with a future tax impact of $348.
Flow-through shares
During the year ended February 28, 2009, the Company issued 24,210,000 (February 29, 2008- 27,142,855) flow-through shares and has renounced $15,000 (February 29, 2008 - $7,600) of expenditures to the flow-through shareholders.
11. Stock Options
The Company has a stock option plan whereby, from time to time, at the discretion of the board of directors, stock options are granted to directors, officers and certain consultants enabling them, as a group, to acquire up to 10% of the issued and outstanding common stock of the Company. The exercise price of each option is based on the closing market price of the Company’s common stock on the date prior to the grant date less an applicable discount. The options can be granted for a maximum term of 10 years and vest at the discretion of the board of directors. Options vest equally with one quarter vesting immediately, and the remainder vesting equally after six, twelve, and eighteen months, respectively, from the date of grant.
STARFIELD RESOURCES INC. | 16
| Notes to the Financial Statements |
| For the year ended February 28, 2009 |
| (in thousands of Canadian dollars, unless otherwise noted) |
| |
Stock options transactions are summarized as follows:
| | | Twelve months ended | | | Twelve months ended | | | Twelve months ended | |
| | | February 28, 2009 | | | February 29, 2008 | | | February 28, 2007 | |
| | | | | | Weighted | | | | | | Weighted | | | | | | Weighted | |
| | | | | | average | | | | | | average | | | | | | average | |
| | | Number | | | exercise | | | Number | | | exercise | | | Number | | | exercise | |
| | | (000's) | | | price | | | (000's) | | | price | | | (000's) | | | price | |
| Balance at beginning of year | | | 19,958 | | | $ | 0.96 | | | | 19,115 | | | $ | 0.41 | | | | 11,472 | | | $ | 0.39 | |
Granted | | | 1,850 | | | | 0.77 | | | | 16,125 | | | | 1.12 | | | | 9,540 | | | | 0.44 | |
Exercised | | | (1,769 | ) | | | 0.45 | | | | (13,425 | ) | | | 0.44 | | | | (585 | ) | | | 0.28 | |
Cancelled or expired | | | (611 | ) | | | 1.39 | | | | (1,857 | ) | | | 0.54 | | | | (1,312 | ) | | | 0.50 | |
| Balance at end of year | | | 19,428 | | | $ | 0.97 | | | | 19,958 | | | $ | 0.96 | | | | 19,115 | | | $ | 0.41 | |
| | | | | | | | | | | | | | | | | | | | | | | | | |
The following stock options were outstanding at February 28, 2009:
| | | | Number | | | Number | | | Weighted | | | | | | | |
| | | | outstanding | | | exercisable | | | average | | | Weighted | | | | |
| | | | as at | | | as at | | | remaining | | | average | | | Weighted | |
| Expiry | | | February 28, | | | February 28, | | | contractual | | | exercise | | | average | |
| date | | | 2009 | | | 2009 | | | life (years) | | | price | | | fair value | |
| 27-Aug-09 | | | | 200,000 | | | | 200,000 | | | | 0.50 | | | $ | 0.40 | | | $ | 0.05 | |
| 31-Jan-10 | | | | 600,000 | | | | 600,000 | | | | 0.94 | | | | 0.40 | | | $ | 0.05 | |
| 11-Mar-11 | | | | 200,000 | | | | 200,000 | | | | 2.06 | | | | 0.60 | | | $ | 0.31 | |
| 1-Feb-12 | | | | 2,562,500 | | | | 2,562,500 | | | | 2.97 | | | | 0.29 | | | $ | 0.14 | |
| 23-Apr-12 | | | | 2,400,000 | | | | 2,400,000 | | | | 3.19 | | | | 0.32 | | | $ | 0.18 | |
| 4-May-12 | | | | 1,100,000 | | | | 1,100,000 | | | | 3.23 | | | | 0.29 | | | $ | 0.16 | |
| 15-May-12 | | | | 1,000,000 | | | | 750,000 | | | | 3.26 | | | | 1.08 | | | $ | 0.59 | |
| 12-Jul-12 | | | | 2,800,000 | | | | 2,800,000 | | | | 3.42 | | | | 1.71 | | | $ | 0.95 | |
| 13-Sep-12 | | | | 1,750,000 | | | | 1,312,500 | | | | 3.59 | | | | 1.18 | | | $ | 0.65 | |
| 28-Sep-12 | | | | 1,250,000 | | | | 937,500 | | | | 3.63 | | | | 1.59 | | | $ | 0.87 | |
| 12-Oct-12 | | | | 2,000,000 | | | | 1,500,000 | | | | 3.67 | | | | 1.69 | | | $ | 0.93 | |
| 15-Jan-13 | | | | 1,715,000 | | | | 1,286,250 | | | | 3.94 | | | | 1.05 | | | $ | 0.66 | |
| 1-Apr-13 | | | | 1,250,000 | | | | 625,000 | | | | 4.15 | | | | 0.87 | | | $ | 0.54 | |
| 5-Aug-13 | | | | 400,000 | | | | 200,000 | | | | 4.50 | | | | 0.73 | | | $ | 0.50 | |
| 30-Jan-14 | | | | 200,000 | | | | 50,000 | | | | 4.99 | | | | 0.25 | | | $ | 0.18 | |
| | | | | 19,427,500 | | | | 16,523,750 | | | | 3.38 | | | $ | 0.97 | | | $ | 0.54 | |
During the year ended February 28, 2009, the Company granted 1,850,000 stock options (February 29, 2008 - 16,125,000) with a fair value of $913 (February 29, 2008- $11,748) to directors, employees and consultants. The Company recognized $4,001 in stock-based compensation with a corresponding credit to contributed surplus on the balance sheet, of which $3,264 was capitalized to the compensation category under mineral properties (February 29, 2008 - $8,319, no capitalization). The compensation recognized was calculated using the Black-Scholes option pricing model. The weighted average fair value of options granted during the current year was $0.49 (February 29, 2008 - $0.63).
STARFIELD RESOURCES INC. | 17
| Notes to the Financial Statements |
| For the year ended February 28, 2009 |
| (in thousands of Canadian dollars, unless otherwise noted) |
| |
The following weighted average assumptions were used in the valuation of stock options granted in the year ended February 28, 2009:
| Risk-free interest rate | 2.97% |
| Expected life of options | 5 years |
| Annualized volatility | 79.13% |
| Dividend rate | 0.00% |
| | |
The estimated value of the options granted will be recognized over the vesting period. As at February 28, 2009, there is $288 (February 29, 2008- $3,620) remaining to be charged to earnings or capitalized to mineral properties in future periods relating to stock option grants.
12. Related Party Transactions
A former director of the Company is a major shareholder of Ferguson Simek Clark International (“FSC”), a professional engineering consulting practice specializing in cold climate and remote location projects. During the second quarter, Starfield ceased to be a related party of FSC. During the year ended February 28, 2009, the Company incurred costs of $64 (February 29, 2008 - $891) with that entity. At February 28, 2009, the Company had an amount owing to FSC of $nil (February 29, 2008 - $13).
The transactions were in the normal course of operations and were measured at the exchange amount, which is the amount of consideration established and agreed to by the related parties.
13. Commitments and Contingencies
Leases
The Company entered into a new lease for its corporate office in Toronto which expires October 31, 2013. Minimum annual rents are $176 (February 29, 2008 - $147). The total minimum obligation remaining under this lease is $857 (February 29, 2008 - $98).
The Company entered into a 5 year commercial lease on 2,740 hectares within its Ferguson Lake property which expires in July 2012. Minimum annual rents are $96.
The minimum lease payments on the new leases are as follows:
| 2010 | | $ | 274 | |
| 2011 | | | 277 | |
| 2012 | | | 280 | |
| 2013 | | | 187 | |
| 2014 | | | 127 | |
| | | $ | 1,145 | |
STARFIELD RESOURCES INC. | 18
| Notes to the Financial Statements |
| For the year ended February 28, 2009 |
| (in thousands of Canadian dollars, unless otherwise noted) |
| |
14. Differences between Canadian and United States Generally Accepted Accounting Principles
These financial statements have been prepared in accordance with generally accepted accounting principles in Canada (Canadian GAAP), which conforms in all material respects with those in the United States (U.S. GAAP), except for the following measurement differences as it relates to the Company:
Exploration Expenditures
In accordance with EITF 04-02, the Company classifies the costs of acquiring its mineral interests as tangible assets resulting in no difference between Canadian and U.S. GAAP. Under U.S. GAAP exploration expenditures on mineral properties, other than acquisition costs, prior to the establishment of proven or probable reserves are expensed as incurred. Under Canadian GAAP these expenditures may be deferred.
Flow-through Shares and Future Income Tax Recovery
Under Canadian income tax legislation, the Company is permitted to issue shares whereby the Company agrees to incur qualifying expenditures (as defined under the Income Tax Act of Canada) and renounce the related income tax deductions to the investors. Under Canadian GAAP, flow-through shares are accounted for as part of the issuance of capital stock at the price paid for the shares, net of any future income tax liability. Under U.S. GAAP, any difference between the fair value of the non flow-through shares and the fair value of the flow-through shares must be recorded as a liability if a premium is paid by investors for the flow-through shares. The liability is charged to income as the flow-through share proceeds are expended on qualifying expenditures and the related income tax deductions are renounced to investors.
During the year ended February 28, 2007, the Company issued and renounced 11,456,661 flow-through shares for total proceeds of $5,387. As the value of the consideration received for the flow-through shares issued during the year ended February 28, 2007 exceeded the fair value of the non-flow through shares on the date issued by $334, the Company recorded the difference in capital stock and related income tax expenses on renunciation.
During the year ended February 29, 2008, the Company issued and renounced 27,142,855 flow-through shares for total proceeds of $7,600. As the value of the consideration received for the flow-through shares issued during the year ended February 29, 2008 exceeded the fair value of the non-flow through shares on the date issued by $1,086, the Company recorded the difference in capital stock and related income tax expenses on renunciation.
During the year ended February 28, 2009, the Company issued and renounced 15,000,000 flow-through shares for total proceeds of $15,000. As the value of the consideration received for the flow-through shares issued during the year ended February 28, 2009 exceeded the fair value of the non-flow through shares on the date issued by $1,650, the Company recorded the difference in capital stock and related income tax expenses on renunciation.
Comprehensive Income
Under U.S. GAAP, Statement of Financial Accounting Standards No. 130, “Reporting Comprehensive Income” (“SFAS 130”) requires that companies report comprehensive income as a measure of overall performance. Comprehensive income includes all changes in equity during a year except those resulting from investments by owners and distribution to owners. The Company has determined that comprehensive income (loss) consisted only of the net loss for the year in all of the years presented.
STARFIELD RESOURCES INC. | 19
| Notes to the Financial Statements |
| For the year ended February 28, 2009 |
| (in thousands of Canadian dollars, unless otherwise noted) |
| |
The following summarizes the balance sheet items prepared under U.S. GAAP, where there are material variations from Canadian GAAP:
| | | 2009 | | | 2008 | |
| Mineral properties | | $ | 2,694 | | | $ | - | |
| Future income tax liability | | | 1,303 | | | | - | |
| Share capital | | | 129,116 | | | | 109,961 | |
| Additional paid-in capital | | | 12,396 | | | | 8,630 | |
| Deficit | | | (136,202 | ) | | | (107,855 | ) |
The following table is a reconciliation of the loss for the year between Canadian GAAP and U.S. GAAP:
| | | | | | | | | | |
| | | 2009 | | | 2008 | | | 2007 | |
| | | | | | | | | | |
| Loss for the year under Canadian GAAP | | $ | 3,142 | | | $ | 11,840 | | | $ | 2,100 | |
| | | | | | | | | | | | | |
| U.S. GAAP material adjustments | | | | | | | | | | | | |
Write-off of mineral property expenditures | | | 26,021 | | | | 13,083 | | | | 17,206 | |
Future income tax expense | | | (1,650 | ) | | | - | | | | - | |
Future income tax recovery | | | 834 | | | | 87 | | | | 2,178 | |
| | | | | | | | | | | | | |
| Net loss for the year under U.S. GAAP | | $ | 28,347 | | | $ | 25,010 | | | $ | 21,484 | |
| | | | | | | | | | | | | |
| Basic and diluted net loss per share under U.S. GAAP | | $ | 0.09 | | | $ | 0.08 | | | $ | 0.11 | |
| | | | | | | | | | | | | |
| Weighted average number of shares outstanding | | | 319,325 | | | | 298,702 | | | | 189,474 | |
The following table is a reconciliation of the shareholder’s equity for the year between Canadian GAAP and U.S. GAAP:
| | | | | | | | | | |
| | | 2009 | | | 2008 | | | 2007 | |
| | | | | | | | | | |
| Shareholders' equity under Canadian GAAP | | $ | 105,042 | | | $ | 85,996 | | | $ | 60,942 | |
| | | | | | | | | | | | | |
| U.S. GAAP material adjustments | | | | | | | | | | | | |
| Write-off of deferred exploration expenditures | | | (102,685 | ) | | | (76,664 | ) | | | (63,581 | ) |
| Future income tax expense | | | 4,287 | | | | 2,721 | | | | 1,843 | |
| Future income tax recovery | | | (583 | ) | | | (583 | ) | | | (583 | ) |
| | | | | | | | | | | | | |
| Shareholders' equity under U.S. GAAP | | $ | 6,061 | | | $ | 11,470 | | | $ | (1,379 | ) |
STARFIELD RESOURCES INC. | 20
| Notes to the Financial Statements |
| For the year ended February 28, 2009 |
| (in thousands of Canadian dollars, unless otherwise noted) |
| |
The following table summarizes the effect on cash flows after considering the U.S. GAAP adjustments:
Cash flows from operating activities:
| | | 2009 | | | 2008 | | | 2007 | |
| | | | | | | | | | |
| Cash flows from operating activities per Canadian GAAP | | $ | (3,825 | ) | | $ | (5,962 | ) | | $ | (2,969 | ) |
| Mineral properties expensed as incurred | | | (22,262 | ) | | | (12,873 | ) | | | (16,154 | ) |
| | | | | | | | | | | | | |
| Cash flows from operating activities per U.S. GAAP | | $ | (26,087 | ) | | $ | (18,835 | ) | | $ | (19,123 | ) |
| | | | | | | | | | | | | |
| Cash flows from investing activities: | | | | | | | | | | | | |
| | | | | | | | | | | | | |
| | | 2009 | | | 2008 | | | 2007 | |
| | | | | | | | | | | | | |
| Cash flows from investing activities per Canadian GAAP | | $ | (24,974 | ) | | $ | (13,130 | ) | | $ | (16,389 | ) |
| Mineral properties expensed as incurred | | | 22,262 | | | | 12,873 | | | | 16,154 | |
| | | | | | | | | | | | | |
| Cash flows from investing activities per U.S. GAAP | | $ | (2,712 | ) | | $ | (257 | ) | | $ | (235 | ) |
| | | | | | | | | | | | | |
Recent accounting pronouncements
Fair Value Measurements
In September 2006, the FASB issued SFAS 157 "Fair Value Measurements", which defines fair value, establishes a framework for measuring fair value under U.S. GAAP and expands disclosures about fair values. This standard does not require any new fair value measurements. The standard is applicable for fiscal years beginning after November 15, 2007. FAS 157-2 delays the effective date of FAS 157 to fiscal years beginning after November 15, 2008 and interim periods within those fiscal years, for nonfinancial assets and nonfinancial liabilities that are recognized or disclosed at fair value in the financial statements on a nonrecurring basis. The Company does not expect the implementation of SFAS No. 157 will have any material impact on its financial position and results of operations. .
Fair Value Option for Financial Assets and Financial Liabilities
In February 2007, the FASB issued SFAS 159, "The Fair Value Option for Financial Assets and Financial Liabilities". This standard permits a company to choose to record certain financial assets, financial liabilities and firm commitments at fair value. SFAS 159 also establishes presentation and disclosure requirements designed to facilitate comparisons between companies that choose different measurement attributes for similar types of assets and liabilities. The standard is effective for fiscal years beginning after November 15, 2007. The Company does not expect the implementation of SFAS No. 159 will have any material impact on its financial position and results of operations.
Accounting Standards in Canada
Over the next two years, the CICA will adopt its new strategic plan for the direction of accounting standards in Canada, which was ratified in January 2006. As part of that plan, accounting standards in Canada for public companies will converge with International Financial Reporting Standards (“IFRS”) over the next two years. The Company continues to monitor and assess the impact of convergence of Canadian GAAP and IFRS.
STARFIELD RESOURCES INC. | 21
| Notes to the Financial Statements |
| For the year ended February 28, 2009 |
| (in thousands of Canadian dollars, unless otherwise noted) |
| |
Business Combinations
In December 2007, the FASB issued SFAS No. 141 (Revised) “Business Combinations”. SFAS 141 (Revised) establishes principles and requirements for how the acquirer of a business recognizes and measures in its financial statements the identifiable assets acquired, the liabilities assumed, and any non-controlling interest in the acquiree. The statement also provides guidance for recognizing and measuring the goodwill acquired in the business combination and determines what information to disclose to enable users of the financial statements to evaluate the nature and financial effects of the business combination. The guidance will become effective for the fiscal year beginning after December 15, 2008. The will apply the provisions for future business combinations beginning March 1, 2009.
Non-controlling Interests in Consolidated Financial Statements
In December 2007, the FASB issued SFAS No. 160, “Non-controlling Interests in Consolidated Financial Statements”. This Statement amends ARB 51 to establish accounting and reporting standards for the non-controlling (minority) interest in a subsidiary and for the deconsolidation of a subsidiary. It clarifies that a non-controlling interest in a subsidiary is an ownership interest in the consolidated entity that should be reported as equity in the consolidated financial statements. The Company does not expect the implementation of SFAS No. 160 will have any material impact on its financial position and results of operations.
STARFIELD RESOURCES INC. | 22