UNITED STATES
SECURITIES AND EXCHANGE COMMISSION
Washington, D.C. 20549
FORM N-CSR
CERTIFIED SHAREHOLDER REPORT
OF
REGISTERED MANAGEMENT INVESTMENT COMPANIES
Investment Company Act file number: 811-00834
Name of Registrant: Vanguard Windsor Funds
Address of Registrant:
P.O. Box 2600
Valley Forge, PA 19482
Name and address of agent for service:
Anne E. Robinson, Esquire
P.O. Box 876
Valley Forge, PA 19482
Registrant’s telephone number, including area code: (610) 669-1000
Date of fiscal year end: October 31
Date of reporting period: October 31, 2016 – April 30, 2017
Item 1: Reports to Shareholders
Semiannual Report | April 30, 2017
Vanguard Windsor™ Fund
A new format, unwavering commitment
As you begin reading this report, you’ll notice that we’ve made some improvements to the opening sections—based on feedback from you, our clients.
Page 1 starts with a new ”Your Fund’s Performance at a Glance,” a concise, handy summary of how your fund performed during the period.
In the renamed ”Chairman’s Perspective,” Bill McNabb will focus on enduring principles and investment insights.
We’ve modified some tables, and eliminated some redundancy, but we haven’t removed any information.
At Vanguard, we’re always looking for better ways to communicate and to help you make sound investment decisions. Thank you for entrusting your assets to us.
| Contents | |
| Your Fund’s Performance at a Glance. | 1 |
| Chairman’s Perspective. | 2 |
| Advisors’ Report. | 6 |
| Fund Profile. | 10 |
| Performance Summary. | 12 |
| Financial Statements. | 13 |
| About Your Fund’s Expenses. | 27 |
| Trustees Approve Advisory Arrangements. | 29 |
| Glossary. | 31 |
Please note: The opinions expressed in this report are just that—informed opinions. They should not be considered promises or advice.
Also, please keep in mind that the information and opinions cover the period through the date on the front of this report. Of course, the
risks of investing in your fund are spelled out in the prospectus.
See the Glossary for definitions of investment terms used in this report.
About the cover: No matter what language you speak, Vanguard has one consistent message and set of principles. Our primary
focus is on you, our clients. We conduct our business with integrity as a faithful steward of your assets. This message is shown
translated into seven languages, reflecting our expanding global presence.
Your Fund’s Performance at a Glance
• Vanguard Windsor Fund returned nearly 15% for the six months ended April 30, 2017,
ahead of the 11.69% return of its benchmark, the Russell 1000 Value Index, and the 12.70%
return of its multi-capitalization value fund peers.
• Growth stocks surpassed value stocks, while small-cap stocks exceeded mid- and
large-caps.
• Windsor Fund’s two advisors invest in large- and mid-cap stocks they believe have
the potential to recover well after being out of favor. Financials, the fund’s largest sector
holding, contributed more than 6 percentage points to results and outperformed the
benchmark sector return. Banks, asset managers, and investment banking and brokerage
firms led the sector.
• Ten of 11 industry sectors posted positive results. Energy had the only negative
outcome, returning about –1%. Within that sector, oil and gas exploration and production
companies lagged the most.
| Total Returns: Six Months Ended April 30, 2017 | |
| Total | |
| Returns | |
| Vanguard Windsor Fund | |
| Investor Shares | 14.87% |
| Admiral™ Shares | 14.87 |
| Russell 1000 Value Index | 11.69 |
| Multi-Cap Value Funds Average | 12.70 |
Admiral Shares carry lower expenses and are available to investors who meet certain account-balance requirements.
| Expense Ratios | |||
| Your Fund Compared With Its Peer Group | |||
| Investor | Admiral | Peer Group | |
| Shares | Shares | Average | |
| Windsor Fund | 0.30% | 0.20% | 1.10% |
The fund expense ratios shown are from the prospectus dated February 23, 2017, and represent estimated costs for the current fiscal year. For the six months ended April 30, 2017, the fund’s annualized expense ratios were 0.31% for Investor Shares and 0.20% for Admiral Shares. The peer-group expense ratio is derived from data provided by Lipper, a Thomson Reuters Company, and captures information through year-end 2016.
Peer group: Multi-Cap Value Funds.
1
Chairman’s Perspective

Bill McNabb
Chairman and Chief Executive Officer
Dear Shareholder,
“Buy what you know.”
It’s one of the adages of investing, and it has plenty of intuitive appeal. After all, the familiar seems inherently less risky. It’s no wonder that many investors heavily tilt their portfolios toward the stocks and bonds of their home country. This is known in investing parlance as “home bias.”
U.S. investors sometimes think they can get all the global diversification they need by owning shares of U.S.-based multinational companies. And that may seem like the best of both worlds: international diversification without ever leaving the friendly confines of home.
The potential pitfall is that, as Vanguard research has suggested, the performance of a company’s shares tends to be highly correlated to its domestic market, regardless of where that company conducts most of its business.
Americans aren’t alone in being portfolio homebodies. Vanguard has found that in a range of developed countries—Australia, Canada, Japan, and the United Kingdom, as well as the United States—investors held a greater percentage of domestic stocks than would be indicated if they had taken their cues from a globally diversified, market-weighted benchmark. (You can see this tendency in the chart later in this letter.)
2
Why home bias exists
Vanguard’s Investment Strategy Group identified a range of reasons why investors might not embrace global diversification, including concerns about currency risk and an expectation that their home country will deliver outsized returns.
One factor we identified—preference for the familiar—seems particularly relevant. With so much global uncertainty about geopolitics, monetary policy, and the economic outlook, it’s understandable why investors may not want to stray too far from home.
But in their aversion to the unknown, investors can end up increasing, rather than lessening, their risks. That’s because they’re sacrificing broad global diversification—one of the best ways I know of to help control risk.
In many cases, individual country markets are much less diversified than the global market in total. Global investing, then, can be an answer for investors who want to reduce concentration risk. That can include overconcentration in a particular country, region, or industry.
And the good news is that global investing is easier than ever, thanks to the wide availability of low-cost, internationally diversified stock and bond funds. It’s possible, in a sense, to own the whole world with just a couple of funds.
| Market Barometer | |||
| Total Returns | |||
| Periods Ended April 30, 2017 | |||
| Six | One | Five Years | |
| Months | Year | (Annualized) | |
| Stocks | |||
| Russell 1000 Index (Large-caps) | 13.46% | 18.03% | 13.63% |
| Russell 2000 Index (Small-caps) | 18.37 | 25.63 | 12.95 |
| Russell 3000 Index (Broad U.S. market) | 13.83 | 18.58 | 13.57 |
| FTSE All-World ex US Index (International) | 10.55 | 12.98 | 5.60 |
| Bonds | |||
| Bloomberg Barclays U.S. Aggregate Bond Index | |||
| (Broad taxable market) | -0.67% | 0.83% | 2.27% |
| Bloomberg Barclays Municipal Bond Index | |||
| (Broad tax-exempt market) | -0.34 | 0.14 | 3.16 |
| Citigroup Three-Month U.S. Treasury Bill Index | 0.23 | 0.37 | 0.11 |
| CPI | |||
| Consumer Price Index | 1.16% | 2.20% | 1.22% |
3
Expanding our opportunities
A key to overcoming home bias is reframing the way we look at investing outside our home countries. Take, for example, automakers or pharmaceutical companies. There are well-regarded firms in both industries located throughout the world. Over the next five years, nobody can know for sure whether a Japanese or U.S. or European company will produce a popular new sedan that outsells the competition or come up with new treatments to combat illness. So why not own them all? And that includes their bonds along with their stocks.
Full global diversification also allows you to capitalize on opportunities in both developed and emerging economies. Betting on which individual country—let alone company—will be the next market darling can be a fool’s errand.
A better choice can be to harness the potential of all markets. In my personal investment account, I have an emerging markets position that complements my developed-market holdings. Not only can global diversification help control risk, but it can also expand our set of opportunities among stocks and bonds.
Home bias shows investors across the world are fixated on the familiar
Investors often own a greater share of their home country’s stocks than would be indicated
by the allocations of a globally diversified, market-capitalization-weighted index fund.
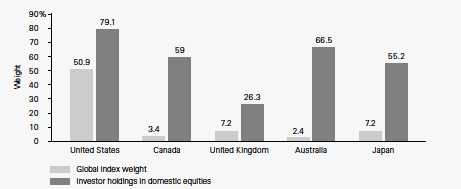
Notes: Data as of December 31, 2014 (the latest available from the International Monetary Fund, or IMF), in U.S. dollars. Domestic investment is calculated by subtracting total foreign investment (as reported by the IMF) in a given country from its market capitalization in the MSCI All Country World Index. Given that the IMF data are voluntary, there may be some discrepancies between the market values in the survey and the MSCI ACWI.
Sources: Vanguard, based on data from the IMF’s Coordinated Portfolio Investment Survey (2014), Bloomberg, Thomson Reuters Datastream, and FactSet.
4
Ultimately, I believe we have the best chance for investment success by giving ourselves more opportunities, not fewer. Own the whole haystack and you never have to worry about finding the needle.
Thank you for entrusting your assets to Vanguard.

F. William McNabb III
Chairman and Chief Executive Officer
May 12, 2017
5
Advisors’ Report
For the fiscal period ended April 30, 2017, Investor Shares and lower-cost Admiral Shares of Vanguard Windsor Fund returned 14.87%. Your fund is managed by two independent advisors, a strategy that enhances the fund’s diversification by providing exposure to distinct yet complementary investment approaches. It is not uncommon for different advisors to have different views about individual securities or the broader investment environment.
The advisors, the percentage and amount of fund assets that each manages, and brief descriptions of their investment
strategies are presented in the table below. The advisors have also prepared a discussion of the investment environment that existed during the period and of how their portfolio positioning reflects this assessment. (Please note that the Pzena Investment Management discussion refers to industry sectors as defined by Russell classifications, rather than by the Global Industry Classification Standard used elsewhere in this report.)
These reports were prepared on May 16, 2017.
| Vanguard Windsor Fund Investment Advisors | |||
| Fund Assets Managed | |||
| Investment Advisor | % | $ Million | Investment Strategy |
| Wellington Management | 69 | 12,725 | Seeks to provide long-term total returns above both the |
| Company LLP | S&P 500 and value-oriented indexes over a complete | ||
| market cycle through bottom-up, fundamentally driven | |||
| stock selection focused on undervalued securities. | |||
| Pzena Investment Management, | 29 | 5,346 | Uses a fundamental, bottom-up, deep-value-oriented |
| LLC | investment strategy. Seeks to buy good businesses at | ||
| low prices, focusing exclusively on companies that are | |||
| underperforming their historically demonstrated | |||
| earnings power. | |||
| Cash Investments | 2 | 260 | These short-term reserves are invested by Vanguard in |
| equity index products to simulate investment in stocks. | |||
| Each advisor also may maintain a modest cash | |||
| position. | |||
6
Equity markets have provided strong returns over the past six months, following the U.S. presidential election in November. Consumer and business confidence strengthened on expectations of improved economic growth, less-burdensome regulatory oversight, fiscal stimulus, and tax reform. So far, this has outweighed fears of trade protectionism and increased geopolitical uncertainty.
The Standard & Poor’s 500 Index returned 13.3%. Market leadership shifted toward growth stocks as first-quarter U.S. GDP remained sluggish, Republicans struggled to unify behind health care reform, and investors took a slightly more skeptical view of the Trump reflation trade—the view that President Donald Trump’s policies will spur economic growth and inflation.
Our large overweight in the financial sector, particularly in banks, was fruitful. Banks could benefit from policy action from the new administration. For instance, earnings sensitivity to higher interest rates, lower tax rates, reduced regulatory costs, and higher loan growth would be positive for banks such as Comerica and Bank of America.
As these expectations became more fairly reflected in stock prices, we took advantage of the strength to reduce our relative overweight in the sector.
Information technology was another strong area of relative performance. Micron returned more than 60% and Lam Research more than 50% as the market for semiconductor memory tightened. Consensus estimates for Micron’s earnings in its upcoming fiscal year tripled during the six months. Broadcom and Skyworks Solutions, other large semiconductor holdings, returned over 30%. Despite the strong moves, these stocks all still sell at significantly lower forward price-earnings multiples than the broader market.
In materials, we enjoyed good relative returns with our chemical and fertilizer investments. We made a timely sale of our entire stake in CF Industries at prices well above current levels, as we grew concerned about tougher nitrogen fundamentals.
We are underweighted in the consumer discretionary sector, notably in retail where deflationary pressures have intensified. However, our patience with Norwegian Cruise Lines was rewarded. And we benefited from being relatively underweighted in the defensive consumer staples and utilities sectors, which considerably trailed the overall market.
One of our worst sectors, both on a relative and absolute basis, was energy. A rally in the price of crude oil following OPEC’s November agreement to cut production could not be sustained as global inventories have declined less than anticipated and U.S. shale producers again ramped up their drilling. We have pared our overall exposure to the sector and
7
continue with our preference for low-cost producers, such as Pioneer Natural Resources, that are positioned to gain market share.
We had adverse stock selection in two other sectors, health care and industrials. In health care, the election of Trump provided no relief from pressures on generic drug prices. We have relatively small positions in both Mylan and Teva Pharmaceutical Industries, which have faced numerous challenges, but we think poor investor sentiment has been priced into the stocks. Overall, we are roughly neutral weight in health care to the S&P 500 Index, with a slight preference for services and providers that could benefit as the uncertainties surrounding health care reform are resolved.
In industrials, we—and the company’s former management—badly misjudged Hertz’s challenges in executing a plan to improve profitability. We painfully eliminated our holding at a significant loss but would note that the stock has moved significantly lower since then.
Early last year it seemed to us the most obvious mispriced opportunity in the equity market was in more volatile stocks. By midyear, with the portfolio tilted in favor of cyclicals, the valuation pendulum began to swing back in our favor. The election result, and the coincident surge in optimism, reinforced the move. As you might expect, we have responded by tacking in the opposite direction. With the profit-taking in the energy and financial sectors, and new purchases that have improved relative valuations,
including Nippon Telegraph & Telephone in telecommunication services, Sempra Energy in utilities, and Post Holdings in consumer staples, we have meaningfully reduced our overweight to the more cyclical sectors since last summer.
Pzena Investment Management, LLC
Portfolio Managers:
Richard Pzena, Managing Principal
and Co-Chief Investment Officer
John J. Flynn, Principal
Benjamin S. Silver, CFA, CPA, Principal
The market rotation that began in early 2016 out of so-called bond proxies and into economically sensitive sectors continued and accelerated after the U.S. election, as the market anticipated that the new administration would lower taxes, increase infrastructure spending, and reduce regulation.
During the six months, our portfolio benefited from strength in the financial services and producer durables industries. Among our top individual contributors were Bank of America, JPMorgan Chase, Morgan Stanley, Citigroup, and Goldman Sachs, all of which reported strong earnings on a combination of higher rates and increased capital market activities. Producer durables was led by Parker-Hannifin, a leading manufacturer of motion and control systems, which reported strong bookings and raised its full-year earnings guidance. Stanley Black & Decker also rose on continued share gains in its core power tools business.
8
We outperformed in energy, the weakest sector, despite the decline in Cenovus Energy, which fell on its announced buyout of ConocoPhillips’ oil sands interest. In technology, Qualcomm, a designer of integrated chipsets for smartphones and patent holder of 3G/4G cellular technology, declined on weak first-quarter earnings and continued legal disputes.
We initiated a position in Cognizant Technology Solutions, a U.S.-listed Indian IT services company that has nearly 80% of its revenue coming from North America and 98% from existing clients. We believe Cognizant offers a compelling value proposition because of much lower costs for Indian IT labor.
Another new position, Avangrid, is a regulated utility operating in the northeastern United States with a wind renewable energy portfolio. The company is under-levered relative to its peers, and we believe the combination of a growing regulated and renewable business presents an attractive utility investment.
With pharmaceutical drug pricing and health care spending garnering more attention in the presidential election, we saw more health care names appear on our research screens. The addition of Mylan, McKesson, and Cardinal Health represent the outcome of some of this work. Mylan is a leading generic drug manufacturer viewed as best in class operationally. The stock came under pressure as the company was scrutinized for aggressive pricing of its EpiPen product. We believe that the stock
price reaction ignores the value of the generics business and that even with very conservative estimates around the EpiPen franchise, the stock is attractive at 10 times our estimate of normal earnings.
McKesson and Cardinal are two of the three leading U.S. pharmaceutical distributors. In 2016, however, drug price inflation slowed, resulting in a margin challenge. We believe margins and competition will normalize over time; the weakness has given us the opportunity to invest in capital businesses operating in a good industry structure at an attractive valuation.
To fund our new purchases, we modestly trimmed some financial positions, mainly Bank of America, Voya Financial, and Regions Financial, and we sold out of our position in Comerica. We also sold utility company Entergy, along with Hilton Grand Vacations, and Park Hotels & Resorts, both of which had been spun out from Hilton Worldwide Holdings, which we continue to hold.
We trimmed Microsoft and Seagate Technology, two incumbent technology companies that have proven resilient in the customer shift to the cloud. Valuation spreads remain wide and, looking at past cycles, we conclude that we are still in the foothills of the current value upswing. Our largest positions remain in financial services and technology, at the expense of consumer staples and utilities.
9
Windsor Fund
Fund Profile
As of April 30, 2017
Share-Class Characteristics
| Investor | Admiral | |
| Shares | Shares | |
| Ticker Symbol | VWNDX | VWNEX |
| Expense Ratio1 | 0.30% | 0.20% |
| 30-Day SEC Yield | 1.64% | 1.74% |
| Portfolio Characteristics | |||
| DJ | |||
| U.S. | |||
| Russell | Total | ||
| 1000 | Market | ||
| Value | FA | ||
| Fund | Index | Index | |
| Number of Stocks | 140 | 694 | 3,788 |
| Median Market Cap | $31.5B | $60.0B | $58.1B |
| Price/Earnings Ratio | 25.2x | 24.5x | 27.1x |
| Price/Book Ratio | 1.9x | 1.9x | 2.8x |
| Return on Equity | 11.2% | 10.2% | 24.8% |
| Earnings Growth | |||
| Rate | 6.8% | 4.8% | 9.8% |
| Dividend Yield | 1.9% | 2.4% | 1.8% |
| Foreign Holdings | 6.8% | 0.0% | 0.0% |
| Turnover Rate | |||
| (Annualized) | 26% | — | — |
| Short-Term | |||
| Reserves | 1.7% | — | — |
| Volatility Measures | ||
| Russell | DJ | |
| 1000 | U.S. Total | |
| Value | Market | |
| Index | FA Index | |
| R-Squared | 0.93 | 0.93 |
| Beta | 1.14 | 1.13 |
These measures show the degree and timing of the fund’s fluctuations compared with the indexes over 36 months.
| Ten Largest Holdings (% of total net assets) | ||
| Bank of America Corp. | Diversified Banks | 2.1% |
| American International | ||
| Group Inc. | Multi-line Insurance | 2.0 |
| Citigroup Inc. | Diversified Banks | 1.9 |
| XL Group Ltd. | Property & Casualty | |
| Insurance | 1.8 | |
| Broadcom Ltd. | Semiconductors | 1.7 |
| MetLife Inc. | Life & Health | |
| Insurance | 1.7 | |
| Bristol-Myers Squibb Co. Pharmaceuticals | 1.6 | |
| UnitedHealth Group Inc. | Managed Health | |
| Care | 1.5 | |
| Medtronic plc | Health Care | |
| Equipment | 1.5 | |
| Arrow Electronics Inc. | Technology | |
| Distributors | 1.5 | |
| Top Ten | 17.3% | |
The holdings listed exclude any temporary cash investments and equity index products.
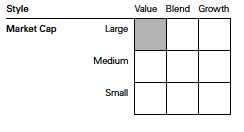
Investment Focus
1 The expense ratios shown are from the prospectus dated February 23, 2017, and represent estimated costs for the current fiscal year. For the six months ended April 30, 2017, the annualized expense ratios were 0.31% for Investor Shares and 0.20% for Admiral Shares.
10
Windsor Fund
Sector Diversification (% of equity exposure)
| DJ | |||
| U.S. | |||
| Russell | Total | ||
| 1000 | Market | ||
| Value | FA | ||
| Fund | Index | Index | |
| Consumer | |||
| Discretionary | 11.0% | 4.6% | 12.9% |
| Consumer Staples | 4.3 | 8.5 | 8.2 |
| Energy | 8.7 | 11.9 | 5.9 |
| Financials | 25.6 | 26.3 | 14.6 |
| Health Care | 12.7 | 10.9 | 13.4 |
| Industrials | 9.1 | 10.3 | 10.8 |
| Information | |||
| Technology | 18.0 | 10.1 | 21.5 |
| Materials | 3.4 | 2.9 | 3.4 |
| Real Estate | 3.3 | 4.7 | 4.1 |
| Telecommunication | |||
| Services | 1.0 | 3.5 | 2.0 |
| Utilities | 2.9 | 6.3 | 3.2 |
11
Windsor Fund
Performance Summary
All of the returns in this report represent past performance, which is not a guarantee of future results that may be achieved by the fund. (Current performance may be lower or higher than the performance data cited. For performance data current to the most recent month-end, visit our website at vanguard.com/performance.) Note, too, that both investment returns and principal value can fluctuate widely, so an investor’s shares, when sold, could be worth more or less than their original cost. The returns shown do not reflect taxes that a shareholder would pay on fund distributions or on the sale of fund shares.
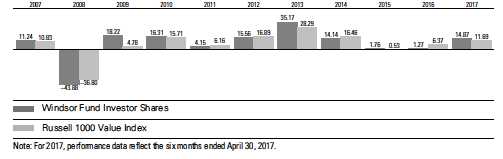
Fiscal-Year Total Returns (%): October 31, 2006, Through April 30, 2017
Average Annual Total Returns: Periods Ended March 31, 2017
This table presents returns through the latest calendar quarter—rather than through the end of the fiscal period.
Securities and Exchange Commission rules require that we provide this information.
| Inception | One | Five | Ten | |
| Date | Year | Years | Years | |
| Investor Shares | 10/23/1958 | 21.48% | 13.05% | 5.92% |
| Admiral Shares | 11/12/2001 | 21.61 | 13.16 | 6.03 |
See Financial Highlights for dividend and capital gains information.
12
Windsor Fund
Financial Statements (unaudited)
Statement of Net Assets
As of April 30, 2017
The fund reports a complete list of its holdings in regulatory filings four times in each fiscal year, at the quarter-ends. For the second and fourth fiscal quarters, the lists appear in the fund’s semiannual and annual reports to shareholders. For the first and third fiscal quarters, the fund files the lists with the Securities and Exchange Commission on Form N-Q. Shareholders can look up the fund’s Forms N-Q on the SEC’s website at sec.gov. Forms N-Q may also be reviewed and copied at the SEC’s Public Reference Room (see the back cover of this report for further information).
| Market | |||
| Value• | |||
| Shares | ($000) | ||
| Common Stocks (97.2%)1 | |||
| Consumer Discretionary (10.7%) | |||
| Delphi Automotive plc | 2,977,884 | 239,422 | |
| * | Norwegian Cruise Line | ||
| Holdings Ltd. | 3,571,581 | 192,615 | |
| Newell Brands Inc. | 3,494,430 | 166,824 | |
| * | SES SA Class A | 7,473,613 | 163,348 |
| Expedia Inc. | 1,093,320 | 146,199 | |
| DR Horton Inc. | 3,992,000 | 131,297 | |
| Lennar Corp. Class A | 2,529,220 | 127,726 | |
| Omnicom Group Inc. | 1,233,100 | 101,262 | |
| VF Corp. | 1,824,500 | 99,672 | |
| TJX Cos. Inc. | 1,130,887 | 88,933 | |
| Hilton Worldwide | |||
| Holdings Inc. | 1,450,516 | 85,537 | |
| Ford Motor Co. | 7,371,550 | 84,552 | |
| Staples Inc. | 7,849,780 | 76,692 | |
| * | Toll Brothers Inc. | 1,989,900 | 71,616 |
| News Corp. Class A | 5,447,250 | 69,289 | |
| Interpublic Group of | |||
| Cos. Inc. | 2,254,250 | 53,133 | |
| Lowe’s Cos. Inc. | 518,400 | 44,002 | |
| Kohl’s Corp. | 343,475 | 13,406 | |
| 1,955,525 | |||
| Consumer Staples (4.1%) | |||
| British American | |||
| Tobacco plc | 3,470,800 | 234,499 | |
| Ingredion Inc. | 1,143,150 | 141,545 | |
| Wal-Mart Stores Inc. | 1,520,350 | 114,300 | |
| Coty Inc. Class A | 5,507,518 | 98,309 | |
| * | Post Holdings Inc. | 949,600 | 79,947 |
| Kellogg Co. | 625,000 | 44,375 | |
| CVS Health Corp. | 522,225 | 43,052 | |
| 756,027 | |||
| Energy (8.4%) | |||
| Pioneer Natural | |||
| Resources Co. | 1,415,907 | 244,938 | |
| Royal Dutch Shell | |||
| plc ADR | 4,062,455 | 212,019 | |
| Halliburton Co. | 4,167,146 | 191,189 | |
| Anadarko Petroleum Corp. | 3,055,385 | 174,218 | |
| Exxon Mobil Corp. | 1,999,470 | 163,257 | |
| * | Concho Resources Inc. | 1,138,375 | 144,186 |
| BP plc ADR | 3,467,825 | 119,016 | |
| ConocoPhillips | 1,668,125 | 79,920 | |
| Canadian Natural | |||
| Resources Ltd. | 1,774,268 | 56,546 | |
| Murphy Oil Corp. | 1,836,625 | 48,083 | |
| Cenovus Energy Inc. | 3,809,713 | 38,021 | |
| Valero Energy Corp. | 532,000 | 34,372 | |
| Baker Hughes Inc. | 404,150 | 23,994 | |
| * | Southwestern Energy Co. | 2,455,500 | 18,441 |
| *,^ | Cobalt International | ||
| Energy Inc. | 1,505,692 | 589 | |
| 1,548,789 | |||
| Financials (24.9%) | |||
| Bank of America Corp. | 16,389,357 | 382,527 | |
| American International | |||
| Group Inc. | 5,922,351 | 360,730 | |
| Citigroup Inc. | 5,837,196 | 345,095 | |
| XL Group Ltd. | 7,845,875 | 328,350 | |
| MetLife Inc. | 6,031,475 | 312,491 | |
| Wells Fargo & Co. | 4,926,005 | 265,216 | |
| Unum Group | 4,369,669 | 202,447 | |
| Comerica Inc. | 2,698,835 | 190,808 | |
| Principal Financial | |||
| Group Inc. | 2,682,499 | 174,711 | |
| PNC Financial Services | |||
| Group Inc. | 1,427,632 | 170,959 | |
| JPMorgan Chase & Co. | 1,854,541 | 161,345 | |
| Intercontinental | |||
| Exchange Inc. | 2,104,645 | 126,700 | |
| Franklin Resources Inc. | 2,695,150 | 116,188 | |
| Morgan Stanley | 2,641,841 | 114,577 | |
| Goldman Sachs Group Inc. | 493,525 | 110,451 | |
| Voya Financial Inc. | 2,893,875 | 108,173 | |
| Ameriprise Financial Inc. | 842,324 | 107,691 | |
| M&T Bank Corp. | 608,308 | 94,537 | |
| Capital One Financial Corp. | 1,168,511 | 93,925 | |
| Axis Capital Holdings Ltd. | 1,418,271 | 93,464 | |
| UBS Group AG | 5,063,558 | 86,131 | |
13
Windsor Fund
| Market | |||
| Value• | |||
| Shares | ($000) | ||
| State Street Corp. | 1,023,350 | 85,859 | |
| Regions Financial Corp. | 5,913,150 | 81,306 | |
| Zions Bancorporation | 1,854,972 | 74,254 | |
| Allstate Corp. | 711,097 | 57,805 | |
| KeyCorp | 3,143,625 | 57,340 | |
| Citizens Financial | |||
| Group Inc. | 1,542,220 | 56,615 | |
| Torchmark Corp. | 694,384 | 53,266 | |
| Fifth Third Bancorp | 2,159,384 | 52,754 | |
| Raymond James | |||
| Financial Inc. | 403,349 | 30,057 | |
| Willis Towers Watson plc | 205,562 | 27,262 | |
| Invesco Ltd. | 695,225 | 22,901 | |
| * | Genworth Financial Inc. | ||
| Class A | 2,832,750 | 11,444 | |
| 4,557,379 | |||
| Health Care (12.3%) | |||
| Bristol-Myers Squibb Co. | 5,230,816 | 293,187 | |
| UnitedHealth Group Inc. | 1,550,392 | 271,133 | |
| Medtronic plc | 3,259,035 | 270,793 | |
| Merck & Co. Inc. | 3,280,954 | 204,502 | |
| McKesson Corp. | 1,352,263 | 187,005 | |
| Allergan plc | 765,967 | 186,789 | |
| * | HCA Holdings Inc. | 1,635,349 | 137,713 |
| * | Mylan NV | 3,402,389 | 127,079 |
| Cigna Corp. | 784,816 | 122,722 | |
| Johnson & Johnson | 799,225 | 98,680 | |
| * | Biogen Inc. | 342,629 | 92,924 |
| Eli Lilly & Co. | 899,440 | 73,808 | |
| Pfizer Inc. | 1,643,275 | 55,740 | |
| Abbott Laboratories | 1,222,510 | 53,350 | |
| Teva Pharmaceutical | |||
| Industries Ltd. ADR | 1,613,893 | 50,967 | |
| Cardinal Health Inc. | 345,150 | 25,054 | |
| 2,251,446 | |||
| Industrials (8.8%) | |||
| Eaton Corp. plc | 3,460,790 | 261,774 | |
| Honeywell International | |||
| Inc. | 1,676,397 | 219,843 | |
| * | IHS Markit Ltd. | 4,469,783 | 193,989 |
| Raytheon Co. | 942,847 | 146,339 | |
| Stanley Black & Decker Inc. | 991,300 | 134,966 | |
| Dover Corp. | 1,596,742 | 125,951 | |
| * | Sensata Technologies | ||
| Holding NV | 2,789,831 | 114,885 | |
| Parker-Hannifin Corp. | 663,360 | 106,668 | |
| JB Hunt Transport | |||
| Services Inc. | 1,146,800 | 102,822 | |
| * | Schneider National Inc. | ||
| Class B | 2,708,800 | 51,413 | |
| Kansas City Southern | 497,885 | 44,845 | |
| * | Swift Transportation Co. | 1,822,214 | 44,790 |
| American Airlines Group | |||
| Inc. | 906,054 | 38,616 | |
| L3 Technologies Inc. | 166,050 | 28,522 | |
| 1,615,423 | |||
| Information Technology (17.4%) | |||
| Broadcom Ltd. | 1,420,245 | 313,604 | |
| * | Arrow Electronics Inc. | 3,777,344 | 266,303 |
| Lam Research Corp. | 1,749,532 | 253,420 | |
| QUALCOMM Inc. | 4,205,917 | 226,026 | |
| Apple Inc. | 1,496,917 | 215,032 | |
| Skyworks Solutions Inc. | 2,131,365 | 212,582 | |
| * | CommScope Holding | ||
| Co. Inc. | 5,003,880 | 210,363 | |
| Cisco Systems Inc. | 6,164,687 | 210,031 | |
| Harris Corp. | 1,870,115 | 209,247 | |
| * | Micron Technology Inc. | 7,124,807 | 197,143 |
| Oracle Corp. | 3,473,300 | 156,160 | |
| * | VeriSign Inc. | 1,412,500 | 125,599 |
| Intel Corp. | 2,816,600 | 101,820 | |
| * | Alphabet Inc. Class A | 94,306 | 87,188 |
| Microsoft Corp. | 1,222,875 | 83,718 | |
| * | Cognizant Technology | ||
| Solutions Corp. Class A | 1,364,386 | 82,177 | |
| Hewlett Packard | |||
| Enterprise Co. | 4,242,550 | 79,039 | |
| TE Connectivity Ltd. | 721,024 | 55,786 | |
| Seagate Technology plc | 1,297,862 | 54,679 | |
| * | DXC Technology Co. | 364,452 | 27,458 |
| * | NXP Semiconductors NV | 186,262 | 19,697 |
| 3,187,072 | |||
| Materials (3.3%) | |||
| Celanese Corp. Class A | 2,292,505 | 199,540 | |
| International Paper Co. | 2,880,800 | 155,477 | |
| PPG Industries Inc. | 1,209,221 | 132,821 | |
| Methanex Corp. | 2,521,709 | 115,746 | |
| 603,584 | |||
| Other (0.4%) | |||
| 2 | Vanguard Value ETF | 703,525 | 67,074 |
| Real Estate (3.2%) | |||
| American Tower | |||
| Corporation | 2,000,165 | 251,901 | |
| Weyerhaeuser Co. | 5,465,341 | 185,111 | |
| Public Storage | 512,078 | 107,219 | |
| Boston Properties Inc. | 377,528 | 47,795 | |
| 592,026 | |||
14
Windsor Fund
| Market | |||
| Value• | |||
| Shares | ($000) | ||
| Telecommunication Services (0.9%) | |||
| Nippon Telegraph & | |||
| Telephone Corp. | 3,341,700 | 143,211 | |
| AT&T Inc. | 815,225 | 32,307 | |
| 175,518 | |||
| Utilities (2.8%) | |||
| NextEra Energy Inc. | 1,121,565 | 149,796 | |
| PG&E Corp. | 2,000,714 | 134,148 | |
| Sempra Energy | 715,700 | 80,888 | |
| Edison International | 852,150 | 68,146 | |
| Avangrid Inc. | 1,258,907 | 54,763 | |
| Entergy Corp. | 367,502 | 28,026 | |
| 515,767 | |||
| Total Common Stocks | |||
| (Cost $13,303,397) | 17,825,630 | ||
| Temporary Cash Investments (2.8%)1 | |||
| Money Market Fund (1.6%) | |||
| 3,4 | Vanguard Market | ||
| Liquidity Fund, | |||
| 1.034% | 2,903 | 290,315 | |
| Face | |||
| Amount | |||
| ($000) | |||
| Repurchase Agreement (0.7%) | |||
| Bank of America | |||
| Securities, LLC 0.790%, | |||
| 5/1/17 (Dated 4/28/17, | |||
| Repurchase Value | |||
| $128,508,000, collateralized | |||
| by Government National | |||
| Mortgage Assn. 3.50%, | |||
| 10/20/46–4/20/47, with a | |||
| value of $131,070,000) | 128,500 | 128,500 | |
| U.S. Government and Agency Obligations (0.5%) | |||
| 5 | Federal Home Loan Bank | ||
| Discount Notes, | |||
| 0.771%, 5/31/17 | 75,000 | 74,954 | |
| 6 | United States Treasury Bill, | ||
| 0.564%, 5/4/17 | 2,500 | 2,500 | |
| 6 | United States Treasury Bill, | ||
| 0.713%, 5/11/17 | 2,000 | 2,000 | |
| 6 | United States Treasury Bill, | ||
| 0.738%, 6/1/17 | 5,000 | 4,997 | |
| United States Treasury Bill, | |||
| 0.736%, 6/15/17 | 1,000 | 999 | |
| 6 | United States Treasury Bill, | ||
| 0.592%, 7/13/17 | 400 | 399 | |
| 85,849 | |||
| Total Temporary Cash Investments | |||
| (Cost $504,652) | 504,664 | ||
| Total Investments (100.0%) | |||
| (Cost $13,808,049) | 18,330,294 | ||
| Amount | |||
| ($000) | |||
| Other Assets and Liabilities (0.0%) | |||
| Other Assets | |||
| Investment in Vanguard | 1,255 | ||
| Receivables for Investment | |||
| Securities Sold | 127,257 | ||
| Receivables for Accrued Income | 17,849 | ||
| Receivables for Capital Shares Issued | 17,789 | ||
| Other Assets | 10,649 | ||
| Total Other Assets | 174,799 | ||
| Liabilities | |||
| Payables for Investment | |||
| Securities Purchased | (132,398) | ||
| Collateral for Securities on Loan | (858) | ||
| Payables to Investment Advisor | (3,353) | ||
| Payables for Capital Shares Redeemed | (4,922) | ||
| Payables to Vanguard | (28,999) | ||
| Other Liabilities | (3,453) | ||
| Total Liabilities | (173,983) | ||
| Net Assets (100%) | 18,331,110 | ||
15
Windsor Fund
At April 30, 2017, net assets consisted of:
| Amount | |
| ($000) | |
| Paid-in Capital | 13,603,846 |
| Undistributed Net Investment Income | 67,127 |
| Accumulated Net Realized Gains | 139,631 |
| Unrealized Appreciation (Depreciation) | |
| Investment Securities | 4,522,245 |
| Futures Contracts | 1,201 |
| Forward Currency Contracts | (3,018) |
| Foreign Currencies | 78 |
| Net Assets | 18,331,110 |
| Investor Shares—Net Assets | |
| Applicable to 239,724,950 outstanding | |
| $.001 par value shares of beneficial | |
| interest (unlimited authorization) | 5,210,556 |
| Net Asset Value Per Share— | |
| Investor Shares | $21.74 |
| Admiral Shares—Net Assets | |
| Applicable to 178,944,117 outstanding | |
| $.001 par value shares of beneficial | |
| interest (unlimited authorization) | 13,120,554 |
| Net Asset Value Per Share— | |
| Admiral Shares | $73.32 |
• See Note A in Notes to Financial Statements.
* Non-income-producing security.
^ Includes partial security positions on loan to broker-dealers. The total value of securities on loan is $335,000.
1 The fund invests a portion of its cash reserves in equity markets through the use of index futures contracts. After giving effect to futures
investments, the fund’s effective common stock and temporary cash investment positions represent 98.3% and 1.7%, respectively, of
net assets.
2 Considered an affiliated company of the fund as the issuer is another member of The Vanguard Group.
3 Affiliated money market fund available only to Vanguard funds and certain trusts and accounts managed by Vanguard. Rate shown is the
7-day yield.
4 Includes $858,000 of collateral received for securities on loan.
5 The issuer operates under a congressional charter; its securities are generally neither guaranteed by the U.S. Treasury nor backed by the full
faith and credit of the U.S. government.
6 Securities with a value of $7,797,000 have been segregated as initial margin for open futures contracts.
ADR—American Depositary Receipt.
See accompanying Notes, which are an integral part of the Financial Statements.
16
Windsor Fund
Statement of Operations
| Six Months Ended | |
| April 30, 2017 | |
| ($000) | |
| Investment Income | |
| Income | |
| Dividends1,2 | 172,729 |
| Interest2 | 1,304 |
| Securities Lending—Net | 190 |
| Total Income | 174,223 |
| Expenses | |
| Investment Advisory Fees—Note B | |
| Basic Fee | 11,454 |
| Performance Adjustment | (4,816) |
| The Vanguard Group—Note C | |
| Management and Administrative—Investor Shares | 5,365 |
| Management and Administrative—Admiral Shares | 7,699 |
| Marketing and Distribution—Investor Shares | 404 |
| Marketing and Distribution—Admiral Shares | 349 |
| Custodian Fees | 82 |
| Shareholders’ Reports—Investor Shares | 105 |
| Shareholders’ Reports—Admiral Shares | 32 |
| Trustees’ Fees and Expenses | 13 |
| Total Expenses | 20,687 |
| Net Investment Income | 153,536 |
| Realized Net Gain (Loss) | |
| Investment Securities Sold2 | 124,935 |
| Futures Contracts | 15,051 |
| Foreign Currencies and Forward Currency Contracts | 2,237 |
| Realized Net Gain (Loss) | 142,223 |
| Change in Unrealized Appreciation (Depreciation) | |
| Investment Securities | 2,134,886 |
| Futures Contracts | 1,733 |
| Foreign Currencies and Forward Currency Contracts | (2,800) |
| Change in Unrealized Appreciation (Depreciation) | 2,133,819 |
| Net Increase (Decrease) in Net Assets Resulting from Operations | 2,429,578 |
1 Dividends are net of foreign withholding taxes of $2,440,000.
2 Dividend income, interest income, and realized net gain (loss) from affiliated companies of the fund were $882,000, $723,000, and $5,000 respectively.
See accompanying Notes, which are an integral part of the Financial Statements.
17
Windsor Fund
Statement of Changes in Net Assets
| Six Months Ended | Year Ended | |
| April 30, | October 31, | |
| 2017 | 2016 | |
| ($000) | ($000) | |
| Increase (Decrease) in Net Assets | ||
| Operations | ||
| Net Investment Income | 153,536 | 345,737 |
| Realized Net Gain (Loss) | 142,223 | 562,705 |
| Change in Unrealized Appreciation (Depreciation) | 2,133,819 | (708,628) |
| Net Increase (Decrease) in Net Assets Resulting from Operations | 2,429,578 | 199,814 |
| Distributions | ||
| Net Investment Income | ||
| Investor Shares | (61,323) | (81,017) |
| Admiral Shares | (158,134) | (198,361) |
| Realized Capital Gain1 | ||
| Investor Shares | (142,531) | (320,822) |
| Admiral Shares | (349,849) | (735,205) |
| Total Distributions | (711,837) | (1,335,405) |
| Capital Share Transactions | ||
| Investor Shares | (187,574) | (142,182) |
| Admiral Shares | 202,342 | 291,239 |
| Net Increase (Decrease) from Capital Share Transactions | 14,768 | 149,057 |
| Total Increase (Decrease) | 1,732,509 | (986,534) |
| Net Assets | ||
| Beginning of Period | 16,598,601 | 17,585,135 |
| End of Period2 | 18,331,110 | 16,598,601 |
1 Includes fiscal 2017 and 2016 short-term gain distributions totaling $0 and $9,986,000 respectively. Short-term gain distributions are treated as ordinary income dividends for tax purposes.
2 Net Assets—End of Period includes undistributed (overdistributed) net investment income of $67,127,000 and $132,516,000.
See accompanying Notes, which are an integral part of the Financial Statements.
18
Windsor Fund
Financial Highlights
| Investor Shares | ||||||
| Six Months | ||||||
| Ended | ||||||
| For a Share Outstanding | April 30, | Year Ended October 31, | ||||
| Throughout Each Period | 2017 | 2016 | 2015 | 2014 | 2013 | 2012 |
| Net Asset Value, Beginning of Period | $19.70 | $21.06 | $21.98 | $19.50 | $14.66 | $12.92 |
| Investment Operations | ||||||
| Net Investment Income | .192 | . 394 | . 3561 | .279 | .255 | .252 |
| Net Realized and Unrealized Gain (Loss) | ||||||
| on Investments | 2.699 | (.168) | .026 | 2.467 | 4.839 | 1.729 |
| Total from Investment Operations | 2.891 | .226 | .382 | 2.746 | 5.094 | 1.981 |
| Distributions | ||||||
| Dividends from Net Investment Income | (. 256) | (. 317) | (. 339) | (. 266) | (. 254) | (. 241) |
| Distributions from Realized Capital Gains | (.595) | (1.269) | (.963) | — | — | — |
| Total Distributions | (.851) | (1.586) | (1.302) | (.266) | (.254) | (.241) |
| Net Asset Value, End of Period | $21.74 | $19.70 | $21.06 | $21.98 | $19.50 | $14.66 |
| Total Return2 | 14.87% | 1.27% | 1.76% | 14.14% | 35.17% | 15.56% |
| Ratios/Supplemental Data | ||||||
| Net Assets, End of Period (Millions) | $5,211 | $4,896 | $5,379 | $7,179 | $7,126 | $6,711 |
| Ratio of Total Expenses to | ||||||
| Average Net Assets3 | 0.31% | 0.30% | 0.39% | 0.38% | 0.37% | 0.35% |
| Ratio of Net Investment Income to | ||||||
| Average Net Assets | 1.69% | 2.01% | 1.64%1 | 1.33% | 1.49% | 1.80% |
| Portfolio Turnover Rate | 26% | 26% | 28% | 38% | 40% | 68% |
The expense ratio, net investment income ratio, and turnover rate for the current period have been annualized.
1 Net investment income per share and the ratio of net investment income to average net assets include $.052 and 0.24%, respectively, resulting from income received from Covidien Ltd. in January 2015.
2 Total returns do not include account service fees that may have applied in the periods shown. Fund prospectuses provide information about any applicable account service fees.
3 Includes performance-based investment advisory fee increases (decreases) of (0.05%), (0.06%), 0.03%, 0.03%, 0.02%, and (0.01%).
See accompanying Notes, which are an integral part of the Financial Statements.
19
Windsor Fund
Financial Highlights
| Admiral Shares | ||||||
| Six Months | ||||||
| Ended | ||||||
| For a Share Outstanding | April 30, | Year Ended October 31, | ||||
| Throughout Each Period | 2017 | 2016 | 2015 | 2014 | 2013 | 2012 |
| Net Asset Value, Beginning of Period | $66.48 | $71.04 | $74.17 | $65.81 | $49.47 | $43.59 |
| Investment Operations | ||||||
| Net Investment Income | .626 | 1.398 | 1.2911 | 1.016 | .924 | .900 |
| Net Realized and Unrealized Gain (Loss) | ||||||
| on Investments | 9.128 | (.545) | .062 | 8.314 | 16.329 | 5.844 |
| Total from Investment Operations | 9.754 | .853 | 1.353 | 9.330 | 17.253 | 6.744 |
| Distributions | ||||||
| Dividends from Net Investment Income | (.907) | (1.134) | (1.235) | (.970) | (.913) | (.864) |
| Distributions from Realized Capital Gains | (2.007) | (4.279) | (3.248) | — | — | — |
| Total Distributions | (2.914) | (5.413) | (4.483) | (.970) | (.913) | (.864) |
| Net Asset Value, End of Period | $73.32 | $66.48 | $71.04 | $74.17 | $65.81 | $49.47 |
| Total Return2 | 14.87% | 1.41% | 1.85% | 14.24% | 35.32% | 15.71% |
| Ratios/Supplemental Data | ||||||
| Net Assets, End of Period (Millions) | $13,121 | $11,703 | $12,206 | $10,884 | $9,144 | $5,795 |
| Ratio of Total Expenses to | ||||||
| Average Net Assets3 | 0.20% | 0.20% | 0.29% | 0.28% | 0.27% | 0.25% |
| Ratio of Net Investment Income to | ||||||
| Average Net Assets | 1.80% | 2.11% | 1.74%1 | 1.43% | 1.59% | 1.90% |
| Portfolio Turnover Rate | 26% | 26% | 28% | 38% | 40% | 68% |
The expense ratio, net investment income ratio, and turnover rate for the current period have been annualized.
1 Net investment income per share and the ratio of net investment income to average net assets include $.177 and 0.24%, respectively, resulting from income received from Covidien Ltd. in January 2015.
2 Total returns do not include account service fees that may have applied in the periods shown. Fund prospectuses provide information about any applicable account service fees.
3 Includes performance-based investment advisory fee increases (decreases) of (0.05%), (0.06%), 0.03%, 0.03%, 0.02%, and (0.01%).
See accompanying Notes, which are an integral part of the Financial Statements.
20
Windsor Fund
Notes to Financial Statements
Vanguard Windsor Fund is registered under the Investment Company Act of 1940 as an open-end investment company, or mutual fund. The fund offers two classes of shares: Investor Shares and Admiral Shares. Investor Shares are available to any investor who meets the fund’s minimum purchase requirements. Admiral Shares are designed for investors who meet certain administrative, service, and account-size criteria.
A. The following significant accounting policies conform to generally accepted accounting principles for U.S. investment companies. The fund consistently follows such policies in preparing its financial statements.
1. Security Valuation: Securities are valued as of the close of trading on the New York Stock Exchange (generally 4 p.m., Eastern time) on the valuation date. Equity securities are valued at the latest quoted sales prices or official closing prices taken from the primary market in which each security trades; such securities not traded on the valuation date are valued at the mean of the latest quoted bid and asked prices. Securities for which market quotations are not readily available, or whose values have been affected by events occurring before the fund’s pricing time but after the close of the securities’ primary markets, are valued at their fair values calculated according to procedures adopted by the board of trustees. These procedures include obtaining quotations from an independent pricing service, monitoring news to identify significant market- or security-specific events, and evaluating changes in the values of foreign market proxies (for example, ADRs, futures contracts, or exchange-traded funds), between the time the foreign markets close and the fund’s pricing time. When fair-value pricing is employed, the prices of securities used by a fund to calculate its net asset value may differ from quoted or published prices for the same securities. Investments in Vanguard Market Liquidity Fund are valued at that fund’s net asset value. Temporary cash investments are valued using the latest bid prices or using valuations based on a matrix system (which considers such factors as security prices, yields, maturities, and ratings), both as furnished by independent pricing services.
2. Foreign Currency: Securities and other assets and liabilities denominated in foreign currencies are translated into U.S. dollars using exchange rates obtained from an independent third party as of the fund’s pricing time on the valuation date. Realized gains (losses) and unrealized appreciation (depreciation) on investment securities include the effects of changes in exchange rates since the securities were purchased, combined with the effects of changes in security prices. Fluctuations in the value of other assets and liabilities resulting from changes in exchange rates are recorded as unrealized foreign currency gains (losses) until the assets or liabilities are settled in cash, at which time they are recorded as realized foreign currency gains (losses).
3. Futures and Forward Currency Contracts: The fund uses index futures contracts to a limited extent, with the objective of maintaining full exposure to the stock market while maintaining liquidity. The fund may purchase or sell futures contracts to achieve a desired level of investment, whether to accommodate portfolio turnover or cash flows from capital share transactions. The primary risks associated with the use of futures contracts are imperfect correlation between changes in market values of stocks held by the fund and the prices of futures contracts, and the possibility of an illiquid market. Counterparty risk involving futures is mitigated because a regulated clearinghouse is the counterparty instead of the clearing broker. To further mitigate counterparty risk, the fund trades futures contracts on an exchange, monitors the financial strength of its clearing brokers and clearinghouse, and has entered into clearing agreements with its clearing brokers. The clearinghouse imposes initial margin requirements to secure the fund’s performance and requires daily settlement of variation margin representing changes in the market value of each contract.
21
Windsor Fund
The fund enters into forward currency contracts to provide the appropriate currency exposure related to any open futures contracts or to protect the value of securities and related receivables and payables against changes in foreign exchange rates. The fund’s risks in using these contracts include movement in the values of the foreign currencies relative to the U.S. dollar and the ability of the counterparties to fulfill their obligations under the contracts. The fund mitigates its counterparty risk by entering into forward currency contracts only with a diverse group of prequalified counterparties, monitoring their financial strength, entering into master netting arrangements with its counterparties, and requiring its counterparties to transfer collateral as security for their performance. In the absence of a default, the collateral pledged or received by the fund cannot be repledged, resold, or rehypothecated. The master netting arrangements provide that, in the event of a counterparty’s default (including bankruptcy), the fund may terminate the forward currency contracts, determine the net amount owed by either party in accordance with its master netting arrangements, and sell or retain any collateral held up to the net amount owed to the fund under the master netting arrangements. The forward currency contracts contain provisions whereby a counterparty may terminate open contracts if the fund’s net assets decline below a certain level, triggering a payment by the fund if the fund is in a net liability position at the time of the termination. The payment amount would be reduced by any collateral the fund has pledged. Any assets pledged as collateral for open contracts are noted in the Statement of Net Assets. The value of collateral received or pledged is compared daily to the value of the forward currency contracts exposure with each counterparty, and any difference, if in excess of a specified minimum transfer amount, is adjusted and settled within two business days.
Futures contracts are valued at their quoted daily settlement prices. Forward currency contracts are valued at their quoted daily prices obtained from an independent third party, adjusted for currency risk based on the expiration date of each contract. The aggregate settlement values and notional amounts of the contracts are not recorded in the Statement of Net Assets. Fluctuations in the value of the contracts are recorded in the Statement of Net Assets as an asset (liability) and in the Statement of Operations as unrealized appreciation (depreciation) until the contracts are closed, when they are recorded as realized gains (losses) on futures or forward currency contracts.
During the six months ended April 30, 2017, the fund’s average investments in long and short futures contracts represented 1% and 0% of net assets, respectively, based on the average of aggregate settlement values at each quarter-end during the period. The fund’s average investment in forward currency contracts represented less than 1% of net assets, based on the average of notional amounts at each quarter-end during the period.
4. Repurchase Agreements: The fund enters into repurchase agreements with institutional counterparties. Securities pledged as collateral to the fund under repurchase agreements are held by a custodian bank until the agreements mature, and in the absence of a default, such collateral cannot be repledged, resold, or rehypothecated. Each agreement requires that the market value of the collateral be sufficient to cover payments of interest and principal. The fund further mitigates its counterparty risk by entering into repurchase agreements only with a diverse group of prequalified counterparties, monitoring their financial strength, and entering into master repurchase agreements with its counterparties. The master repurchase agreements provide that, in the event of a counterparty’s default (including bankruptcy), the fund may terminate any repurchase agreements with that counterparty, determine the net amount owed, and sell or retain the collateral up to the net amount owed to the fund. Such action may be subject to legal proceedings, which may delay or limit the disposition of collateral.
22
Windsor Fund
5. Federal Income Taxes: The fund intends to continue to qualify as a regulated investment company and distribute all of its taxable income. Management has analyzed the fund’s tax positions taken for all open federal income tax years (August 31, 2013–2016), and for the period ended April 30, 2017, and has concluded that no provision for federal income tax is required in the fund’s financial statements.
6. Distributions: Distributions to shareholders are recorded on the ex-dividend date.
7. Securities Lending: To earn additional income, the fund lends its securities to qualified institutional borrowers. Security loans are subject to termination by the fund at any time, and are required to be secured at all times by collateral in an amount at least equal to the market value of securities loaned. Daily market fluctuations could cause the value of loaned securities to be more or less than the value of the collateral received. When this occurs, the collateral is adjusted and settled on the next business day. The fund further mitigates its counterparty risk by entering into securities lending transactions only with a diverse group of prequalified counterparties, monitoring their financial strength, and entering into master securities lending agreements with its counterparties. The master securities lending agreements provide that, in the event of a counterparty’s default (including bankruptcy), the fund may terminate any loans with that borrower, determine the net amount owed, and sell or retain the collateral up to the net amount owed to the fund; however, such actions may be subject to legal proceedings. While collateral mitigates counterparty risk, in the event of a default, the fund may experience delays and costs in recovering the securities loaned. The fund invests cash collateral received in Vanguard Market Liquidity Fund, and records a liability in the Statement of Net Assets for the return of the collateral, during the period the securities are on loan. Securities lending income represents fees charged to borrowers plus income earned on invested cash collateral, less expenses associated with the loan. During the term of the loan, the fund is entitled to all distributions made on or in respect of the loaned securities.
8. Credit Facility: The fund and certain other funds managed by The Vanguard Group (“Vanguard”) participate in a $3.1 billion committed credit facility provided by a syndicate of lenders pursuant to a credit agreement that may be renewed annually; each fund is individually liable for its borrowings, if any, under the credit facility. Borrowings may be utilized for temporary and emergency purposes, and are subject to the fund’s regulatory and contractual borrowing restrictions. The participating funds are charged administrative fees and an annual commitment fee of 0.10% of the undrawn amount of the facility; these fees are allocated to the funds based on a method approved by the fund’s board of trustees and included in Management and Administrative expenses on the fund’s Statement of Operations. Any borrowings under this facility bear interest at a rate based upon the higher of the one-month London Interbank Offered Rate, federal funds effective rate, or overnight bank funding rate plus an agreed-upon spread.
The fund had no borrowings outstanding at April 30, 2017, or at any time during the period then ended.
9. Other: Dividend income is recorded on the ex-dividend date. Interest income includes income distributions received from Vanguard Market Liquidity Fund and is accrued daily. Premiums and discounts on debt securities purchased are amortized and accreted, respectively, to interest income over the lives of the respective securities. Security transactions are accounted for on the date securities are bought or sold. Costs used to determine realized gains (losses) on the sale of investment securities are those of the specific securities sold.
23
Windsor Fund
Each class of shares has equal rights as to assets and earnings, except that each class separately bears certain class-specific expenses related to maintenance of shareholder accounts (included in Management and Administrative expenses) and shareholder reporting. Marketing and distribution expenses are allocated to each class of shares based on a method approved by the board of trustees. Income, other non-class-specific expenses, and gains and losses on investments are allocated to each class of shares based on its relative net assets.
B. The investment advisory firms Wellington Management Company LLP, and Pzena Investment Management, LLC, each provide investment advisory services to a portion of the fund for a fee calculated at an annual percentage rate of average net assets managed by the advisor. The basic fee of Wellington Management Company, LLP, is subject to quarterly adjustments based on performance relative to the S&P 500 Index for the preceding three years. The basic fee of Pzena Investment Management Company, LLC, is subject to quarterly adjustments based on performance relative to the Russell 1000 Value Index for the preceding three years.
Vanguard manages the cash reserves of the fund as described below.
For the six months ended April 30, 2017, the aggregate investment advisory fee represented an effective annual basic rate of 0.13% of the fund’s average net assets, before a decrease of $4,816,000 (0.05%) based on performance.
C. In accordance with the terms of a Funds’ Service Agreement (the “FSA”) between Vanguard and the fund, Vanguard furnishes to the fund corporate management, administrative, marketing, distribution, and cash management services at Vanguard’s cost of operations (as defined by the FSA). These costs of operations are allocated to the fund based on methods and guidelines approved by the board of trustees. Vanguard does not require reimbursement in the current period for certain costs of operations (such as deferred compensation/benefits and risk/insurance costs); the fund’s liability for these costs of operations is included in Payables to Vanguard on the Statement of Net Assets.
Upon the request of Vanguard, the fund may invest up to 0.40% of its net assets as capital in Vanguard. At April 30, 2017, the fund had contributed to Vanguard capital in the amount of $1,255,000, representing 0.01% of the fund’s net assets and 0.50% of Vanguard’s capitalization. The fund’s trustees and officers are also directors and employees, respectively, of Vanguard.
D. Various inputs may be used to determine the value of the fund’s investments. These inputs are summarized in three broad levels for financial statement purposes. The inputs or methodologies used to value securities are not necessarily an indication of the risk associated with investing in those securities.
Level 1—Quoted prices in active markets for identical securities.
Level 2—Other significant observable inputs (including quoted prices for similar securities, interest rates, prepayment speeds, credit risk, etc.).
Level 3—Significant unobservable inputs (including the fund’s own assumptions used to determine the fair value of investments).
24
Windsor Fund
The following table summarizes the market value of the fund’s investments as of April 30, 2017, based on the inputs used to value them:
| Level 1 | Level 2 | Level 3 | |
| Investments | ($000) | ($000) | ($000) |
| Common Stocks | 17,284,572 | 541,058 | — |
| Temporary Cash Investments | 290,315 | 214,349 | — |
| Futures Contracts—Liabilities1 | (433) | — | — |
| Forward Currency Contracts—Liabilities | — | (3,018) | — |
| Total | 17,574,454 | 752,389 | — |
| 1 Represents variation margin on the last day of the reporting period. |
E. At April 30, 2017, the aggregate settlement value of open futures contracts and the related unrealized appreciation (depreciation) were:
| ($000) | ||||
| Aggregate | ||||
| Number of | Settlement | Unrealized | ||
| Long (Short) | Value | Appreciation | ||
| Futures Contracts | Expiration | Contracts | Long (Short) | (Depreciation) |
| E-mini S&P 500 Index | June 2017 | 1,604 | 190,916 | 1,201 |
Unrealized appreciation (depreciation) on open futures contracts is required to be treated as realized gain (loss) for tax purposes.
At April 30, 2017, the fund had open forward currency contracts to receive and deliver currencies as follows. Unrealized appreciation (depreciation) on open forward currency contracts is treated as realized gain (loss) for tax purposes.
| Unrealized | ||||||
| Contract | Appreciation | |||||
| Contract Amount (000) | ||||||
| Settlement | (Depreciation) | |||||
| Counterparty | Date | Receive | Deliver | ($000) | ||
| BNP Paribas | 6/21/17 | USD | 132,821 | JPY | 15,076 | (2,713) |
| Goldman Sachs Bank AG | 6/21/17 | USD | 11,276 | JPY | 1,288 | (305) |
| (3,018) | ||||||
| JPY—Japanese yen. | ||||||
| USD—U.S. dollar. | ||||||
F. Distributions are determined on a tax basis and may differ from net investment income and realized capital gains for financial reporting purposes. Differences may be permanent or temporary. Permanent differences are reclassified among capital accounts in the financial statements to reflect their tax character. Temporary differences arise when certain items of income, expense, gain, or loss are recognized in different periods for financial statement and tax purposes. These differences will reverse at some time in the future. Differences in classification may also result from the treatment of short-term gains as ordinary income for tax purposes.
25
Windsor Fund
During the six months ended April 30, 2017, the fund realized net foreign currency gains of $532,000, which increased distributable net income for tax purposes; accordingly, such gains have been reclassified from accumulated net realized gains to undistributed net investment income.
At April 30, 2017, the cost of investment securities for tax purposes was $13,808,049,000. Net unrealized appreciation of investment securities for tax purposes was $4,522,245,000, consisting of unrealized gains of $4,992,803,000 on securities that had risen in value since their purchase and $470,558,000 in unrealized losses on securities that had fallen in value since their purchase.
G. During the six months ended April 30, 2017, the fund purchased $2,300,169,000 of investment securities and sold $3,020,865,000 of investment securities, other than temporary cash investments.
| H. Capital share transactions for each class of shares were: | ||||
| Six Months Ended | Year Ended | |||
| April 30, 2017 | October 31, 2016 | |||
| Amount | Shares | Amount | Shares | |
| (000) | (000) | (000) | (000) | |
| Investor Shares | ||||
| Issued | 180,319 | 8,493 | 345,135 | 18,933 |
| Issued in Lieu of Cash Distributions | 198,052 | 9,526 | 390,759 | 20,211 |
| Redeemed | (565,945) | (26,740) | (878,076) | (46,152) |
| Net Increase (Decrease)—Investor Shares | (187,574) | (8,721) | (142,182) | (7,008) |
| Admiral Shares | ||||
| Issued | 402,343 | 5,615 | 730,078 | 11,200 |
| Issued in Lieu of Cash Distributions | 475,612 | 6,786 | 877,678 | 13,461 |
| Redeemed | (675,613) | (9,501) | (1,316,517) | (20,440) |
| Net Increase (Decrease)—Admiral Shares | 202,342 | 2,900 | 291,239 | 4,221 |
I. Management has determined that no material events or transactions occurred subsequent to April 30, 2017, that would require recognition or disclosure in these financial statements.
26
About Your Fund’s Expenses
As a shareholder of the fund, you incur ongoing costs, which include costs for portfolio management, administrative services, and shareholder reports (like this one), among others. Operating expenses, which are deducted from a fund’s gross income, directly reduce the investment return of the fund.
A fund’s expenses are expressed as a percentage of its average net assets. This figure is known as the expense ratio. The following examples are intended to help you understand the ongoing costs (in dollars) of investing in your fund and to compare these costs with those of other mutual funds. The examples are based on an investment of $1,000 made at the beginning of the period shown and held for the entire period.
The accompanying table illustrates your fund’s costs in two ways:
• Based on actual fund return. This section helps you to estimate the actual expenses that you paid over the period. The ”Ending Account Value“ shown is derived from the fund‘s actual return, and the third column shows the dollar amount that would have been paid by an investor who started with $1,000 in the fund. You may use the information here, together with the amount you invested, to estimate the expenses that you paid over the period.
To do so, simply divide your account value by $1,000 (for example, an $8,600 account value divided by $1,000 = 8.6), then multiply the result by the number given for your fund under the heading ”Expenses Paid During Period.“
• Based on hypothetical 5% yearly return. This section is intended to help you compare your fund‘s costs with those of other mutual funds. It assumes that the fund had a yearly return of 5% before expenses, but that the expense ratio is unchanged. In this case—because the return used is not the fund’s actual return—the results do not apply to your investment. The example is useful in making comparisons because the Securities and Exchange Commission requires all mutual funds to calculate expenses based on a 5% return. You can assess your fund’s costs by comparing this hypothetical example with the hypothetical examples that appear in shareholder reports of other funds.
Note that the expenses shown in the table are meant to highlight and help you compare ongoing costs only and do not reflect transaction costs incurred by the fund for buying and selling securities. Further, the expenses do not include any purchase, redemption, or account service fees described in the fund prospectus. If such fees were applied to your account, your costs would be higher. Your fund does not carry a “sales load.”
The calculations assume no shares were bought or sold during the period. Your actual costs may have been higher or lower, depending on the amount of your investment and the timing of any purchases or redemptions.
You can find more information about the fund’s expenses, including annual expense ratios, in the Financial Statements section of this report. For additional information on operating expenses and other shareholder costs, please refer to your fund’s current prospectus.
27
| Six Months Ended April 30, 2017 | |||
| Beginning | Ending | Expenses | |
| Account Value | Account Value | Paid During | |
| Windsor Fund | 10/31/2016 | 4/30/2017 | Period |
| Based on Actual Fund Return | |||
| Investor Shares | $1,000.00 | $1,148.73 | $1.65 |
| Admiral Shares | 1,000.00 | 1,148.73 | 1.07 |
| Based on Hypothetical 5% Yearly Return | |||
| Investor Shares | $1,000.00 | $1,023.26 | $1.56 |
| Admiral Shares | 1,000.00 | 1,023.80 | 1.00 |
The calculations are based on expenses incurred in the most recent six-month period. The fund’s annualized six-month expense ratios for that period are 0.31% for Investor Shares and 0.20% for Admiral Shares. The dollar amounts shown as “Expenses Paid” are equal to the annualized expense ratio multiplied by the average account value over the period, multiplied by the number of days in the most recent six-month period, then divided by the number of days in the most recent 12-month period (181/365).
28
Trustees Approve Advisory Arrangements
The board of trustees of Vanguard Windsor Fund has renewed the fund’s investment advisory arrangements with Pzena Investment Management, LLC (Pzena), and Wellington Management Company LLP (Wellington Management). The board determined that renewing the fund’s advisory arrangements was in the best interests of the fund and its shareholders.
The board based its decision upon an evaluation of each advisor’s investment staff, portfolio management process, and performance. This evaluation included information provided to the board by Vanguard’s Portfolio Review Department, which is responsible for fund and advisor oversight and product management. The Portfolio Review Department met regularly with the advisors and made monthly presentations to the board during the fiscal year that directed the board’s focus to relevant information and topics.
The board, or an investment committee made up of board members, also received information throughout the year during advisor presentations. For each advisor presentation, the board was provided with letters and reports that included information about, among other things, the advisory firm and the advisor’s assessment of the investment environment, portfolio performance, and portfolio characteristics.
In addition, the board received monthly reports, which included a Market and Economic Report, a Fund Dashboard Monthly Summary, and a Fund Performance Report.
Prior to their meeting, the trustees were provided with a memo and materials that summarized the information they received over the course of the year. They also considered the factors discussed below, among others. However, no single factor determined whether the board approved the arrangements. Rather, it was the totality of the circumstances that drove the board’s decision.
Nature, extent, and quality of services
The board reviewed the quality of the fund’s investment management services over both the short and long term and took into account the organizational depth and stability of each advisor. The board considered the following:
Pzena. Founded in 1995, Pzena is a global investment management firm that employs a classic value investment approach. Pzena seeks to buy good businesses at low prices, focusing exclusively on companies that are underperforming their historically demonstrated earnings power. Pzena’s research team conducts intensive fundamental research, buying companies only when the problems are judged to be temporary, management has a viable strategy to generate earnings recovery, and there is meaningful downside protection in case earnings do not recover. Pzena has advised a portion of the fund since 2012.
Wellington Management. Founded in 1928, Wellington Management is among the nation’s oldest and most respected institutional investment managers. Using a bottom-up, fundamentally driven approach, Wellington Management invests in solid companies whose current fundamentals are depressed relative to longer-term earnings potential. The advisor has the ability to seek undervalued stocks across the capitalization spectrum. The investment team has the support of Wellington Management’s global industry analysts in conducting its research-intensive approach. Wellington Management has advised the fund since its inception in 1958.
The board concluded that each advisor’s experience, stability, depth, and performance, among other factors, warranted continuation of the advisory arrangements.
29
Investment performance
The board considered the short- and long-term performance of the fund and each advisor, including any periods of outperformance or underperformance compared with a relevant benchmark index and peer group. The board concluded that the performance was such that the advisory arrangements should continue. Information about the fund’s most recent performance can be found in the Performance Summary section of this report.
Cost
The board concluded that the fund’s expense ratio was well below the average expense ratio charged by funds in its peer group and that the fund’s advisory fee rate was also well below the peer-group average. Information about the fund’s expenses appears in the About Your Fund’s Expenses section of this report as well as in the Financial Statements section, which also includes information about the fund’s advisory fee rate.
The board did not consider the profitability of Pzena or Wellington Management in determining whether to approve the advisory fees, because the firms are independent of Vanguard and the advisory fees are the result of arm’s length negotiations.
The benefit of economies of scale
The board concluded that the fund’s shareholders will benefit from economies of scale because of breakpoints in the advisory fee schedules for Pzena and Wellington Management. The breakpoints reduce the effective rate of the fees as the fund’s assets managed by each advisor increase.
The board will consider whether to renew the advisory arrangements again after a one-year period.
30
Glossary
30-Day SEC Yield. A fund’s 30-day SEC yield is derived using a formula specified by the U.S. Securities and Exchange Commission. Under the formula, data related to the fund’s security holdings in the previous 30 days are used to calculate the fund’s hypothetical net income for that period, which is then annualized and divided by the fund’s estimated average net assets over the calculation period. For the purposes of this calculation, a security’s income is based on its current market yield to maturity (for bonds), its actual income (for asset-backed securities), or its projected dividend yield (for stocks). Because the SEC yield represents hypothetical annualized income, it will differ—at times significantly—from the fund’s actual experience. As a result, the fund’s income distributions may be higher or lower than implied by the SEC yield.
Beta. A measure of the magnitude of a fund’s past share-price fluctuations in relation to the ups and downs of a given market index. The index is assigned a beta of 1.00. Compared with a given index, a fund with a beta of 1.20 typically would have seen its share price rise or fall by 12% when the index rose or fell by 10%. For this report, beta is based on returns over the past 36 months for both the fund and the index. Note that a fund’s beta should be reviewed in conjunction with its R-squared (see definition). The lower the R-squared, the less correlation there is between the fund and the index, and the less reliable beta is as an indicator of volatility.
Dividend Yield. Dividend income earned by stocks, expressed as a percentage of the aggregate market value (or of net asset value, for a fund). The yield is determined by dividing the amount of the annual dividends by the aggregate value (or net asset value) at the end of the period. For a fund, the dividend yield is based solely on stock holdings and does not include any income produced by other investments.
Earnings Growth Rate. The average annual rate of growth in earnings over the past five years for the stocks now in a fund.
Equity Exposure. A measure that reflects a fund’s investments in stocks and stock futures. Any holdings in short-term reserves are excluded.
Expense Ratio. A fund’s total annual operating expenses expressed as a percentage of the fund’s average net assets. The expense ratio includes management and administrative expenses, but does not include the transaction costs of buying and selling portfolio securities.
Foreign Holdings. The percentage of a fund represented by securities or depositary receipts of companies based outside the United States.
Inception Date. The date on which the assets of a fund (or one of its share classes) are first invested in accordance with the fund’s investment objective. For funds with a subscription period, the inception date is the day after that period ends. Investment performance is measured from the inception date.
Median Market Cap. An indicator of the size of companies in which a fund invests; the midpoint of market capitalization (market price x shares outstanding) of a fund’s stocks, weighted by the proportion of the fund’s assets invested in each stock. Stocks representing half of the fund’s assets have market capitalizations above the median, and the rest are below it.
Price/Book Ratio. The share price of a stock divided by its net worth, or book value, per share. For a fund, the weighted average price/book ratio of the stocks it holds.
31
Price/Earnings Ratio. The ratio of a stock’s current price to its per-share earnings over the past year. For a fund, the weighted average P/E of the stocks it holds. P/E is an indicator of market expectations about corporate prospects; the higher the P/E, the greater the expectations for a company’s future growth.
R-Squared. A measure of how much of a fund’s past returns can be explained by the returns from the market in general, as measured by a given index. If a fund’s total returns were precisely synchronized with an index’s returns, its R-squared would be 1.00. If the fund’s returns bore no relationship to the index’s returns, its R-squared would be 0. For this report, R-squared is based on returns over the past 36 months for both the fund and the index.
Return on Equity. The annual average rate of return generated by a company during the past five years for each dollar of shareholder’s equity (net income divided by shareholder’s equity). For a fund, the weighted average return on equity for the companies whose stocks it holds.
Short-Term Reserves. The percentage of a fund invested in highly liquid, short-term securities that can be readily converted to cash.
Turnover Rate. An indication of the fund’s trading activity. Funds with high turnover rates incur higher transaction costs and may be more likely to distribute capital gains (which may be taxable to investors). The turnover rate excludes in-kind transactions, which have minimal impact on costs.
32
This page intentionally left blank.
This page intentionally left blank.
This page intentionally left blank.
The People Who Govern Your Fund
The trustees of your mutual fund are there to see that the fund is operated and managed in your best interests since, as a shareholder, you are a part owner of the fund. Your fund’s trustees also serve on the board of directors of The Vanguard Group, Inc., which is owned by the Vanguard funds and provides services to them on an at-cost basis.
A majority of Vanguard’s board members are independent, meaning that they have no affiliation with Vanguard or the funds they oversee, apart from the sizable personal investments they have made as private individuals. The independent board members have distinguished backgrounds in business, academia, and public service. Each of the trustees and executive officers oversees 197 Vanguard funds.
The following table provides information for each trustee and executive officer of the fund. The mailing address of the trustees and officers is P.O. Box 876, Valley Forge, PA 19482. More information about the trustees is in the Statement of Additional Information, which can be obtained, without charge, by contacting Vanguard at 800-662-7447, or online at vanguard.com.
InterestedTrustee1
F. William McNabb III
Born 1957. Trustee Since July 2009. Chairman of the Board. Principal Occupation(s) During the Past Five Years and Other Experience: Chairman of the Board of The Vanguard Group, Inc., and of each of the investment companies served by The Vanguard Group, since January 2010; Director of The Vanguard Group since 2008; Chief Executive Officer and President of The Vanguard Group, and of each of the investment companies served by The Vanguard Group, since 2008; Director of Vanguard Marketing Corporation; Managing Director of The Vanguard Group (1995–2008).
Independent Trustees
Emerson U. Fullwood
Born 1948. Trustee Since January 2008. Principal Occupation(s) During the Past Five Years and Other Experience: Executive Chief Staff and Marketing Officer for North America and Corporate Vice President (retired 2008) of Xerox Corporation (document management products and services); Executive in Residence and 2009–2010 Distinguished Minett Professor at the Rochester Institute of Technology; Lead Director of SPX FLOW, Inc. (multi-industry manufacturing); Director of the United Way of Rochester, the University of Rochester Medical Center, Monroe Community College Foundation, North Carolina A&T University, and Roberts Wesleyan College.
Rajiv L. Gupta
Born 1945. Trustee Since December 2001.2 Principal Occupation(s) During the Past Five Years and Other Experience: Chairman and Chief Executive Officer (retired 2009) and President (2006–2008) of Rohm and Haas Co. (chemicals); Director of Arconic Inc. (diversified manufacturer), HP Inc. (printer and personal computer manufacturing), and Delphi Automotive plc (automotive components); Senior Advisor at New Mountain Capital.
Amy Gutmann
Born 1949. Trustee Since June 2006. Principal Occupation(s) During the Past Five Years and Other Experience: President of the University of Pennsylvania; Christopher H. Browne Distinguished Professor of Political Science, School of Arts and Sciences, and Professor of Communication, Annenberg School for Communication, with secondary faculty appointments in the Department of Philosophy, School of Arts and Sciences, and at the Graduate School of Education, University of Pennsylvania; Trustee of the National Constitution Center; Chair of the Presidential Commission for the Study of Bioethical Issues.
JoAnn Heffernan Heisen
Born 1950. Trustee Since July 1998. Principal Occupation(s) During the Past Five Years and Other Experience: Corporate Vice President and Member of the Executive Committee (1997–2008), Chief Global Diversity Officer (retired 2008), Vice President and Chief Information Officer (1997–2005), Controller (1995–1997), Treasurer (1991–1995), and Assistant Treasurer (1989–1991) of Johnson & Johnson (pharmaceuticals/medical devices/consumer products); Director of Skytop Lodge Corporation (hotels) and the Robert Wood Johnson Foundation; Member of the Advisory Board of the Institute for Women’s Leadership at Rutgers University.
F. Joseph Loughrey
Born 1949. Trustee Since October 2009. Principal Occupation(s) During the Past Five Years and Other Experience: President and Chief Operating Officer (retired 2009) of Cummins Inc. (industrial machinery); Chairman of the Board of Hillenbrand, Inc. (specialized consumer services), Oxfam America, and the Lumina Foundation for Education; Director of SKF AB (industrial machinery), Hyster-Yale Materials Handling, Inc. (forklift trucks), and the V Foundation for Cancer Research; Member of the Advisory Council for the College of Arts and Letters and Chair of the Advisory
Board to the Kellogg Institute for International Studies, both at the University of Notre Dame.
Mark Loughridge
Born 1953. Trustee Since March 2012. Principal Occupation(s) During the Past Five Years and Other Experience: Senior Vice President and Chief Financial Officer (retired 2013) at IBM (information technology services); Fiduciary Member of IBM’s Retirement Plan Committee (2004–2013); Director of the Dow Chemical Company; Member of the Council on Chicago Booth.
Scott C. Malpass
Born 1962. Trustee Since March 2012. Principal Occupation(s) During the Past Five Years and Other Experience: Chief Investment Officer and Vice President at the University of Notre Dame; Assistant Professor of Finance at the Mendoza College of Business at Notre Dame; Member of the Notre Dame 403(b) Investment Committee, the Board of Advisors for Spruceview Capital Partners, and the Investment Advisory Committee of Major League Baseball; Board Member of TIFF Advisory Services, Inc., and Catholic Investment Services, Inc. (investment advisors); Member of the Board of Superintendence of the Institute for the Works of Religion.
André F. Perold
Born 1952. Trustee Since December 2004. Principal Occupation(s) During the Past Five Years and Other Experience: George Gund Professor of Finance and Banking, Emeritus at the Harvard Business School (retired 2011); Chief Investment Officer and Co-Managing Partner of HighVista Strategies LLC (private investment firm); Overseer of the Museum of Fine Arts Boston.
Peter F. Volanakis
Born 1955. Trustee Since July 2009. Principal Occupation(s) During the Past Five Years and Other Experience: President and Chief Operating Officer (retired 2010) of Corning Incorporated (communications equipment); Chairman of the Board of Trustees of Colby-Sawyer College; Member of the Board of Hypertherm, Inc. (industrial cutting systems, software, and consumables).
Executive Officers
Glenn Booraem
Born 1967. Investment Stewardship Officer Since February 2017. Principal Occupation(s) During the Past Five Years and Other Experience: Principal of The Vanguard Group, Inc.; Treasurer (2015–2017), Controller (2010–2015), and Assistant Controller (2001–2010) of each of the investment companies served by The Vanguard Group.
Thomas J. Higgins
Born 1957. Chief Financial Officer Since September 2008. Principal Occupation(s) During the Past Five Years and Other Experience: Principal of The Vanguard Group, Inc.; Chief Financial Officer of each of the investment companies served by The Vanguard Group; Treasurer of each of the investment companies served by The Vanguard Group (1998–2008).
Peter Mahoney
Born 1974. Controller Since May 2015. Principal Occupation(s) During the Past Five Years and Other Experience: Principal of The Vanguard Group, Inc.; Controller of each of the investment companies served by The Vanguard Group; Head of International Fund Services at The Vanguard Group (2008–2014).
Anne E. Robinson
Born 1970. Secretary Since September 2016. Principal Occupation(s) During the Past Five Years and Other Experience: Managing Director of The Vanguard Group, Inc.; General Counsel of The Vanguard Group; Secretary of The Vanguard Group and of each of the investment companies served by The Vanguard Group; Director and Senior Vice President of Vanguard Marketing Corporation; Managing Director and General Counsel of Global Cards and Consumer Services at Citigroup (2014–2016); Counsel at American Express (2003–2014).
Michael Rollings
Born 1963. Treasurer Since February 2017. Principal Occupation(s) During the Past Five Years and Other Experience: Managing Director of The Vanguard Group, Inc.; Treasurer of each of the investment companies served by The Vanguard Group; Executive Vice President and Chief Financial Officer of MassMutual Financial Group (2006–2016).
| Vanguard Senior ManagementTeam | |
| Mortimer J. Buckley | James M. Norris |
| John James | Thomas M. Rampulla |
| Martha G. King | Glenn W. Reed |
| John T. Marcante | Karin A. Risi |
| Chris D. McIsaac | |
Chairman Emeritus and Senior Advisor
John J. Brennan
Chairman, 1996–2009
Chief Executive Officer and President, 1996–2008
Founder
John C. Bogle
Chairman and Chief Executive Officer, 1974–1996
1 Mr. McNabb is considered an “interested person,” as defined in the Investment Company Act of 1940, because he is an officer of the Vanguard funds.
2 December 2002 for Vanguard Equity Income Fund, the Vanguard Municipal Bond Funds, and the Vanguard State Tax-Exempt Funds.
 | |
| P.O. Box 2600 | |
| Valley Forge, PA 19482-2600 | |
| Connect with Vanguard® > vanguard.com | |
| Fund Information > 800-662-7447 | CFA® is a registered trademark owned by CFA Institute. |
| Direct Investor Account Services > 800-662-2739 | |
| Institutional Investor Services > 800-523-1036 | |
| Text Telephone for People | |
| Who Are Deaf or Hard of Hearing> 800-749-7273 | |
| This material may be used in conjunction | |
| with the offering of shares of any Vanguard | |
| fund only if preceded or accompanied by | |
| the fund’s current prospectus. | |
| All comparative mutual fund data are from Lipper, a | |
| Thomson Reuters Company, or Morningstar, Inc., unless | |
| otherwise noted. | |
| You can obtain a free copy of Vanguard’s proxy voting | |
| guidelines by visiting vanguard.com/proxyreporting or by | |
| calling Vanguard at 800-662-2739. The guidelines are | |
| also available from the SEC’s website, sec.gov. In | |
| addition, you may obtain a free report on how your fund | |
| voted the proxies for securities it owned during the 12 | |
| months ended June 30. To get the report, visit either | |
| vanguard.com/proxyreporting or sec.gov. | |
| You can review and copy information about your fund at | |
| the SEC’s Public Reference Room in Washington, D.C. To | |
| find out more about this public service, call the SEC at | |
| 202-551-8090. Information about your fund is also | |
| available on the SEC’s website, and you can receive | |
| copies of this information, for a fee, by sending a | |
| request in either of two ways: via email addressed to | |
| publicinfo@sec.gov or via regular mail addressed to the | |
| Public Reference Section, Securities and Exchange | |
| Commission, Washington, DC 20549-1520. | |
| © 2017 The Vanguard Group, Inc. | |
| All rights reserved. | |
| Vanguard Marketing Corporation, Distributor. | |
| Q222 062017 | |
Semiannual Report | April 30, 2017
Vanguard Windsor™ II Fund
A new format, unwavering commitment
As you begin reading this report, you’ll notice that we’ve made some improvements to the opening sections—based on feedback from you, our clients.
Page 1 starts with a new ”Your Fund’s Performance at a Glance,” a concise, handy summary of how your fund performed during the period.
In the renamed ”Chairman’s Perspective,” Bill McNabb will focus on enduring principles and investment insights.
We’ve modified some tables, and eliminated some redundancy, but we haven’t removed any information.
At Vanguard, we’re always looking for better ways to communicate and to help you make sound investment decisions. Thank you for entrusting your assets to us.
| Contents | |
| Your Fund’s Performance at a Glance. | 1 |
| Chairman’s Perspective. | 2 |
| Advisors’ Report. | 6 |
| Fund Profile. | 11 |
| Performance Summary. | 13 |
| Financial Statements. | 14 |
| About Your Fund’s Expenses. | 28 |
| Trustees Approve Advisory Arrangements. | 30 |
| Glossary. | 32 |
Please note: The opinions expressed in this report are just that—informed opinions. They should not be considered promises or advice. Also, please keep in mind that the information and opinions cover the period through the date on the front of this report. Of course, the risks of investing in your fund are spelled out in the prospectus.
See the Glossary for definitions of investment terms used in this report.
About the cover: No matter what language you speak, Vanguard has one consistent message and set of principles. Our primary focus is on you, our clients. We conduct our business with integrity as a faithful steward of your assets. This message is shown translated into seven languages, reflecting our expanding global presence.
Your Fund’s Performance at a Glance
• Your fund returned almost 13% for the six months ended April 30, 2017, about
1 percentage point more than its benchmark, the Russell 1000 Value Index, and a bit
more than the average return of its large-cap value fund peers. For the period, growth
stocks bested their value counterparts, while small-capitalization stocks outpaced
mid- and large-caps.
• Each of the fund’s five advisors uses a value-oriented strategy and manages its
piece of the portfolio with a long-term focus.
• Each of the fund’s 11 sectors had positive returns; eight posted double-digit returns.
Financial stocks, which outperformed their benchmark counterparts, added more than
5 percentage points to results. Within financials, banks contributed most. Information
technology and health care stocks added about 2 percentage points apiece.
• The fund’s underweight allocation to energy stocks helped relative performance,
even though its holdings in the sector returned less than 1%.
| Total Returns: Six Months Ended April 30, 2017 | |
| Total | |
| Returns | |
| Vanguard Windsor II Fund | |
| Investor Shares | 12.76% |
| Admiral™ Shares | 12.80 |
| Russell 1000 Value Index | 11.69 |
| Large-Cap Value Funds Average | 12.58 |
Large-Cap Value Funds Average: Derived from data provided by Lipper, a Thomson Reuters Company.
Admiral Shares carry lower expenses and are available to investors who meet certain account-balance requirements.
| Expense Ratios | |||
| Your Fund Compared With Its Peer Group | |||
| Investor | Admiral | Peer Group | |
| Shares | Shares | Average | |
| Windsor II Fund | 0.33% | 0.25% | 1.09% |
The fund expense ratios shown are from the prospectus dated February 23, 2017, and represent estimated costs for the current fiscal year. For the six months ended April 30, 2017, the fund’s annualized expense ratios were 0.34% for Investor Shares and 0.26% for Admiral Shares. The peer-group expense ratio is derived from data provided by Lipper, a Thomson Reuters Company, and captures information through year-end 2016.
Peer group: Large-Cap Value Funds.
1
Chairman’s Perspective

Bill McNabb
Chairman and Chief Executive Officer
Dear Shareholder,
“Buy what you know.”
It’s one of the adages of investing, and it has plenty of intuitive appeal. After all, the familiar seems inherently less risky. It’s no wonder that many investors heavily tilt their portfolios toward the stocks and bonds of their home country. This is known in investing parlance as “home bias.”
U.S. investors sometimes think they can get all the global diversification they need by owning shares of U.S.-based multinational companies. And that may seem like the best of both worlds: international diversification without ever leaving the friendly confines of home.
The potential pitfall is that, as Vanguard research has suggested, the performance of a company’s shares tends to be highly correlated to its domestic market, regardless of where that company conducts most of its business.
Americans aren’t alone in being portfolio homebodies. Vanguard has found that in a range of developed countries—Australia, Canada, Japan, and the United Kingdom, as well as the United States—investors held a greater percentage of domestic stocks than would be indicated if they had taken their cues from a globally diversified, market-weighted benchmark. (You can see this tendency in the chart later in this letter.)
2
Why home bias exists
Vanguard’s Investment Strategy Group identified a range of reasons why investors might not embrace global diversification, including concerns about currency risk and an expectation that their home country will deliver outsized returns.
One factor we identified—preference for the familiar—seems particularly relevant. With so much global uncertainty about geopolitics, monetary policy, and the economic outlook, it’s understandable why investors may not want to stray too far from home.
But in their aversion to the unknown, investors can end up increasing, rather than lessening, their risks. That’s
because they’re sacrificing broad global diversification—one of the best ways I know of to help control risk.
In many cases, individual country markets are much less diversified than the global market in total. Global investing, then, can be an answer for investors who want to reduce concentration risk. That can include overconcentration in a particular country, region, or industry.
And the good news is that global investing is easier than ever, thanks to the wide availability of low-cost, internationally diversified stock and bond funds. It’s possible, in a sense, to own the whole world with just a couple of funds.
| Market Barometer | |||
| Total Returns | |||
| Periods Ended April 30, 2017 | |||
| Six | One | Five Years | |
| Months | Year | (Annualized) | |
| Stocks | |||
| Russell 1000 Index (Large-caps) | 13.46% | 18.03% | 13.63% |
| Russell 2000 Index (Small-caps) | 18.37 | 25.63 | 12.95 |
| Russell 3000 Index (Broad U.S. market) | 13.83 | 18.58 | 13.57 |
| FTSE All-World ex US Index (International) | 10.55 | 12.98 | 5.60 |
| Bonds | |||
| Bloomberg Barclays U.S. Aggregate Bond Index | |||
| (Broad taxable market) | -0.67% | 0.83% | 2.27% |
| Bloomberg Barclays Municipal Bond Index | |||
| (Broad tax-exempt market) | -0.34 | 0.14 | 3.16 |
| Citigroup Three-Month U.S. Treasury Bill Index | 0.23 | 0.37 | 0.11 |
| CPI | |||
| Consumer Price Index | 1.16% | 2.20% | 1.22% |
3
Expanding our opportunities
A key to overcoming home bias is reframing the way we look at investing outside our home countries. Take, for example, automakers or pharmaceutical companies. There are well-regarded firms in both industries located throughout the world. Over the next five years, nobody can know for sure whether a Japanese or U.S. or European company will produce a popular new sedan that outsells the competition or come up with new treatments to combat illness. So why not own them all? And that includes their bonds along with their stocks.
Full global diversification also allows you to capitalize on opportunities in both developed and emerging economies. Betting on which individual country—let alone company—will be the next market darling can be a fool’s errand.
A better choice can be to harness the potential of all markets. In my personal investment account, I have an emerging markets position that complements my developed-market holdings. Not only can global diversification help control risk, but it can also expand our set of opportunities among stocks and bonds.
Home bias shows investors across the world are fixated on the familiar
Investors often own a greater share of their home country’s stocks than would be indicated by the allocations of a globally diversified, market-capitalization-weighted index fund.
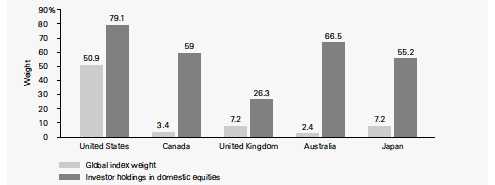
Notes: Data as of December 31, 2014 (the latest available from the International Monetary Fund, or IMF), in U.S. dollars. Domestic investment is calculated by subtracting total foreign investment (as reported by the IMF) in a given country from its market capitalization in the MSCI All Country World Index. Given that the IMF data are voluntary, there may be some discrepancies between the market values in the survey and the MSCI ACWI.
Sources: Vanguard, based on data from the IMF’s Coordinated Portfolio Investment Survey (2014), Bloomberg, Thomson Reuters Datastream, and FactSet.
4
Ultimately, I believe we have the best chance for investment success by giving ourselves more opportunities, not fewer. Own the whole haystack and you never have to worry about finding the needle.
Thank you for entrusting your assets to Vanguard.

F. William McNabb III
Chairman and Chief Executive Officer
May 12, 2017
5
Advisors’ Report
For the six months ended April 30, 2017, Vanguard Windsor II Fund returned 12.76% for Investor Shares and 12.80% for Admiral Shares. Your fund is managed by five independent advisors, a strategy that enhances its diversification by providing exposure to distinct yet complementary investment approaches. It’s not uncommon for different advisors to have different views about individual securities or the broader investment environment. The table below lists the advisors, the amount and percentage of fund assets each manages, and brief
descriptions of their investment strategies. The advisors have provided the following assessment of the investment environment during the past six months and the notable successes and shortfalls in their portfolios. These comments were prepared on May 16, 2017.
On a separate note, we want to congratulate Lazard Asset Management and portfolio managers Andrew Lacey and Christopher Blake on Lazard’s ten-year anniversary as advisor to the fund. We thank them for serving our shareholders with distinction.
| Vanguard Windsor II Fund Investment Advisors | |||
| Fund Assets Managed | |||
| Investment Advisor | % | $ Million | Investment Strategy |
| Barrow, Hanley, Mewhinney & | 51 | 24,709 | Conducts fundamental research on individual stocks |
| Strauss, LLC | exhibiting traditional value characteristics: | ||
| price/earnings and price/book ratios below the broad | |||
| market average and dividend yields above the broad | |||
| market average. | |||
| Lazard Asset Management LLC | 19 | 9,128 | Employs a relative-value approach that seeks a |
| combination of attractive valuation and high financial | |||
| productivity. The process is research-driven, relying | |||
| upon bottom-up stock analysis performed by the firm’s | |||
| global sector analysts. | |||
| Hotchkis and Wiley Capital | 14 | 6,889 | Uses a disciplined investment approach, focusing on |
| Management, LLC | such investment parameters as a company’s tangible | ||
| assets, sustainable cash flow, and potential for | |||
| improving business performance. | |||
| Sanders Capital, LLC | 14 | 6,581 | Employs a traditional, bottom-up, fundamental research |
| approach to identifying securities that are undervalued | |||
| relative to their expected total return. | |||
| Vanguard Quantitative Equity | 1 | 301 | Employs a quantitative fundamental management |
| Group | approach, using models that assess valuation, market | ||
| sentiment, earnings quality and growth, and | |||
| management decisions of companies versus their | |||
| peers. | |||
| Cash Investments | 1 | 482 | These short-term reserves are invested by Vanguard in |
| equity index products to simulate investment in stocks. | |||
| Each advisor may also maintain a modest cash | |||
| position. | |||
6
Barrow, Hanley, Mewhinney &
Strauss, LLC
Portfolio Managers:
Jeff Fahrenbruch, CFA,
Managing Director
David Ganucheau, CFA,
Managing Director
The six months under review were very good for equities, with value stocks gaining roughly 12%. During this time, the start of a new administration in Washington considered business-friendly by the market, along with increased confidence in the economic outlook, boosted equities’ performance. The global outlook for growth is improving as well. The economy in Europe, which is still growing at a rate of 1% to 2%, appears to be expanding faster than most expected. This has helped European equities, which returned about 15%.
Financials led the strong domestic equity market. We used the strength in these names to exit positions in Capital One, PNC Financial Services, and State Street as they approached full valuations. We also exited positions in Marathon Petroleum and CenterPoint Energy after sharp moves upward stretched those shares’ valuations. We bought new positions in DuPont (which we expect will be run much more efficiently under its new leader, Ed Breen) and Lowe’s (which briefly traded at a discount when the market became concerned about rising interest rates).
The portfolio’s performance was boosted by its underweight in utilities and real estate, and by its financial holdings. Health care and information technology held back performance, with both Teva Pharmaceutical Industries and QUALCOMM underper-forming because of issues we believe will prove temporary.
Lazard Asset Management LLC
Portfolio Managers:
Andrew Lacey, Deputy Chairman
Christopher Blake, Managing Director
The S&P 500 Index rose 13.3% during the period. Markets rallied toward the latter half of 2016, buoyed by increased investor confidence in the U.S. economy’s resilience to global geopolitical risks and by optimism that the Trump administration would decrease regulation and work with Congress to lower corporate taxes and increase defense and infrastructure spending. However, the pace of the rally slowed in the first four months of 2017, tempered by the failure of a proposed health care bill to gain congressional approval.
Economic data were mixed during the six months: Employment reports generally exceeded expectations, but the economy continued to grow unevenly, culminating with lackluster readings of gross domestic product growth over the last two quarters. In light of an improving employment and
7
inflation outlook, the Federal Open Market Committee elected to raise interest rates in December, and again in March.
Stock selection and an overweight position in information technology helped the portfolio’s performance, with Skyworks Solutions and Applied Materials the top contributors. Stock selection and an underweight position in the real estate sector also helped returns. Host Hotels & Resorts was the largest contributor in that sector; we sold our position in April.
Stock selection within consumer staples detracted from performance. The largest detractors included Molson Coors Brewing and Kellogg. Selection within the consumer discretionary sector also hurt returns. The largest detractors included J. C. Penney and L Brands. We sold our position in Penney in January and our position in L Brands in April.
Hotchkis and Wiley Capital
Management, LLC
Portfolio Managers:
George H. Davis, Jr.,
Chief Executive Officer
Sheldon J. Lieberman, Principal
The S&P 500 Index returned about 13% for the six months ended April 30, 2017. Aside from energy, the market’s worst-performing sector, cyclicals outperformed non-cyclicals. Financials led the way as
interest rates increased after the election. Notwithstanding equity markets near all-time highs, opportunities for active value investors remain plentiful as select market segments continue to exhibit attractive valuations for the risks at hand. We remain partial to financials, technology, industrials, and consumer discretionary.
These sectors trade at compelling valuations, while sectors viewed as bond surrogates (for example, real estate, consumer staples, regulated utilities) exhibit rich valuations. As a result, the portfolio trades at a considerable valuation discount to the market—9.7 times earnings (compared to 14.6 for the Russell 1000 Value Index and 17.0 for the S&P 500 Index) and 1.5 times book value (compared to 1.9 for the Russell 1000 Value Index and 3.0 for the S&P 500 Index).
The portfolio did well over the period, boosted by strong stock selection, especially in health care, energy, and technology. Selection was weak in telecommunication services, where our sole holding, Vodafone, returned about –4%. The largest individual contributors to relative performance were Anthem, Bank of America, Ericsson, CNH Industrial, and NRG Energy; the largest detractors were Calpine, American International Group, Vodafone, Apache, and Cobalt International Energy.
8
Sanders Capital, LLC
Portfolio Managers:
Lewis A. Sanders, Chief Executive Officer
and Co-Chief Investment Officer
John P. Mahedy, Director of Research and
Co-Chief Investment Officer
The portfolio is positioned to benefit from sustained economic growth, rising interest rates, and technology-driven innovation. Banks, a major area of investment, have already been helped by the Federal Reserve’s moves to increase interest rates. Home builders have benefited from strong demand for new single family homes, a trend we expect to continue.
We also have investments in the pharmaceutical, semiconductor, computer, and media industries for which new products and services promise to stimulate faster growth. This approach has helped relative performance and we anticipate further gains. However, in light of the strong gains in the equity market overall, we have restructured the portfolio to reduce risk, harvesting gains in volatile segments such as banks and adding to our holdings in low-volatility industries, including food and beverages.
Vanguard Quantitative Equity Group
Portfolio Managers:
James P. Stetler
Anatoly Shtekhman, CFA
Binbin Guo, Principal, Head of Equity
Research and Portfolio Strategies
The Federal Reserve increased interest rates twice during the six months under review, raising the target federal funds rate to between 0.75% and 1.00%. The Fed’s decisions came as the U.S. economy posted mostly positive results. Unemployment hit 4.4%, its lowest level since 2007. Wages ticked up and commodities, especially oil, regained some ground during the period, fueling a rise in inflation. The Fed’s positive outlook on future economic expansion carried over to the U.S. stock market, where several indexes hit all-time highs during the period.
Although our overall performance is affected by the macroeconomic factors we’ve described, our approach to investing focuses on specific stock fundamentals that we believe are more likely to produce outperformance over the long run. Those fundamentals include high quality, management decisions, consistent earnings growth, strong market sentiment, and reasonable valuation.
9
Over the six months, the results from our combined model were positive, driven primarily by our quality component. Results exceeded those of the benchmark in seven of eleven sectors and were strongest in information technology, financials, and consumer discretionary. Our energy and industrials holdings lagged the most, followed by consumer staples.
In information technology, NVIDIA and DXC Technology contributed the most to relative performance; Bank of America did the same in financials, while Steel Dynamics led materials. In energy, our underweighting of Occidental Petroleum helped relative performance but our overweighting of Southwestern Energy and Apache hindered it. Other detractors included Spirit Realty Capital in real estate, Herbalife in consumer staples, and an underweighted allocation to CSX in industrials.
10
Windsor II Fund
Fund Profile
As of April 30, 2017
| Share-Class Characteristics | ||
| Investor | Admiral | |
| Shares | Shares | |
| Ticker Symbol | VWNFX | VWNAX |
| Expense Ratio1 | 0.33% | 0.25% |
| 30-Day SEC Yield | 2.02% | 2.10% |
| Portfolio Characteristics | |||
| DJ | |||
| U.S. | |||
| Russell | Total | ||
| 1000 | Market | ||
| Value | FA | ||
| Fund | Index | Index | |
| Number of Stocks | 264 | 694 | 3,788 |
| Median Market Cap | $84.7B | $60.0B | $58.1B |
| Price/Earnings Ratio | 23.4x | 24.5x | 27.1x |
| Price/Book Ratio | 2.2x | 1.9x | 2.8x |
| Return on Equity | 23.0% | 10.2% | 24.8% |
| Earnings Growth | |||
| Rate | 4.1% | 4.8% | 9.8% |
| Dividend Yield | 2.3% | 2.4% | 1.8% |
| Foreign Holdings | 10.7% | 0.0% | 0.0% |
| Turnover Rate | |||
| (Annualized) | 35% | — | — |
| Short-Term Reserves | 1.3% | — | — |
These measures show the degree and timing of the fund’s fluctuations compared with the indexes over 36 months.
| Volatility Measures | ||
| Russell | DJ | |
| 1000 | U.S. Total | |
| Value | Market | |
| Index | FA Index | |
| R-Squared | 0.96 | 0.95 |
| Beta | 1.00 | 0.98 |
| Ten Largest Holdings (% of total net assets) | ||
| Microsoft Corp. | Systems Software | 3.2% |
| Bank of America Corp. | Diversified Banks | 2.7 |
| Pfizer Inc. | Pharmaceuticals | 2.6 |
| Citigroup Inc. | Diversified Banks | 2.6 |
| Medtronic plc | Health Care | |
| Equipment | 2.5 | |
| JPMorgan Chase & Co. | Diversified Banks | 2.3 |
| Wells Fargo & Co. | Diversified Banks | 2.3 |
| Oracle Corp. | Systems Software | 2.2 |
| United Technologies | Aerospace & | |
| Corp. | Defense | 2.2 |
| Anthem Inc. | Managed Health | |
| Care | 2.2 | |
| Top Ten | 24.8% | |
The holdings listed exclude any temporary cash investments and equity index products.
Investment Focus
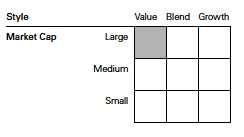
1 The expense ratios shown are from the prospectus dated February 23, 2017, and represent estimated costs for the current fiscal year. For the six months ended April 30, 2017, the annualized expense ratios were 0.34% for Investor Shares and 0.26% for Admiral Shares.
11
Windsor II Fund
Sector Diversification (% of equity exposure)
| DJ | |||
| U.S. | |||
| Russell | Total | ||
| 1000 | Market | ||
| Value | FA | ||
| Fund | Index | Index | |
| Consumer | |||
| Discretionary | 9.7% | 4.6% | 12.9% |
| Consumer Staples | 10.5 | 8.5 | 8.2 |
| Energy | 8.6 | 11.9 | 5.9 |
| Financials | 17.0 | 26.3 | 14.6 |
| Health Care | 20.1 | 10.9 | 13.4 |
| Industrials | 10.5 | 10.3 | 10.8 |
| Information | |||
| Technology | 17.0 | 10.1 | 21.5 |
| Materials | 3.0 | 2.9 | 3.4 |
| Real Estate | 0.2 | 4.7 | 4.1 |
| Telecommunication | |||
| Services | 2.9 | 3.5 | 2.0 |
| Utilities | 0.5 | 6.3 | 3.2 |
12
Windsor II Fund
Performance Summary
All of the returns in this report represent past performance, which is not a guarantee of future results that may be achieved by the fund. (Current performance may be lower or higher than the performance data cited. For performance data current to the most recent month-end, visit our website at vanguard.com/performance.) Note, too, that both investment returns and principal value can fluctuate widely, so an investor’s shares, when sold, could be worth more or less than their original cost. The returns shown do not reflect taxes that a shareholder would pay on fund distributions or on the sale of fund shares.
Fiscal-Year Total Returns (%): October 31, 2006, Through April 30, 2017
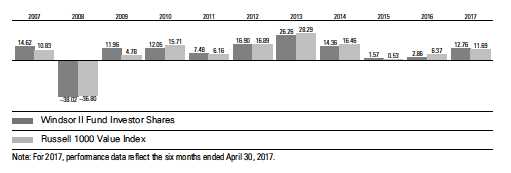
Average Annual Total Returns: Periods Ended March 31, 2017
This table presents returns through the latest calendar quarter—rather than through the end of the fiscal period.
Securities and Exchange Commission rules require that we provide this information.
| Inception | One | Five | Ten | |
| Date | Year | Years | Years | |
| Investor Shares | 6/24/1985 | 18.62% | 11.66% | 6.01% |
| Admiral Shares | 5/14/2001 | 18.71 | 11.75 | 6.10 |
See Financial Highlights for dividend and capital gains information.
13
Windsor II Fund
Financial Statements (unaudited)
Statement of Net Assets
As of April 30, 2017
The fund reports a complete list of its holdings in regulatory filings four times in each fiscal year, at the quarter-ends. For the second and fourth fiscal quarters, the lists appear in the fund’s semiannual and annual reports to shareholders. For the first and third fiscal quarters, the fund files the lists with the Securities and Exchange Commission on Form N-Q. Shareholders can look up the fund’s Forms N-Q on the SEC’s website at sec.gov. Forms N-Q may also be reviewed and copied at the SEC’s Public Reference Room (see the back cover of this report for further information).
| Market | |||
| Value• | |||
| Shares | ($000) | ||
| Common Stocks (97.9%)1 | |||
| Consumer Discretionary (9.4%) | |||
| Twenty-First Century | |||
| Fox Inc. Class A | 18,501,600 | 565,039 | |
| Carnival Corp. | 7,437,320 | 459,403 | |
| Lowe’s Cos. Inc. | 4,890,150 | 415,076 | |
| Target Corp. | 6,582,100 | 367,610 | |
| Delphi Automotive plc | 3,098,786 | 249,142 | |
| Omnicom Group Inc. | 2,680,400 | 220,114 | |
| McDonald’s Corp. | 1,402,437 | 196,243 | |
| DR Horton Inc. | 5,950,000 | 195,696 | |
| Ford Motor Co. | 16,070,600 | 184,330 | |
| Adient plc | 2,139,096 | 157,352 | |
| ^,* | Discovery | ||
| Communications Inc. | |||
| Class A | 4,810,900 | 138,458 | |
| Advance Auto Parts Inc. | 883,854 | 125,631 | |
| Lennar Corp. Class A | 2,353,181 | 118,836 | |
| General Motors Co. | 3,061,283 | 106,043 | |
| Comcast Corp. Class A | 2,697,400 | 105,711 | |
| * | Madison Square | ||
| Garden Co. Class A | 504,267 | 101,746 | |
| CBS Corp. Class B | 1,283,100 | 85,403 | |
| Genuine Parts Co. | 913,881 | 84,095 | |
| Goodyear Tire | |||
| & Rubber Co. | 2,127,900 | 77,094 | |
| * | AutoZone Inc. | 99,930 | 69,171 |
| Bed Bath & Beyond Inc. | 1,630,200 | 63,170 | |
| * | Meritage Homes Corp. | 1,390,408 | 54,156 |
| Magna International Inc. | 1,273,100 | 53,177 | |
| CalAtlantic Group Inc. | 1,297,087 | 46,981 | |
| Honda Motor Co. Ltd. | 1,390,321 | 40,466 | |
| * | Discovery | ||
| Communications Inc. | 1,401,900 | 39,225 | |
| Publicis Groupe SA | 537,720 | 38,821 | |
| Ralph Lauren Corp. | |||
| Class A | 450,637 | 36,375 | |
| Hyundai Motor Co. | 263,261 | 33,297 | |
| ^ | Honda Motor Co. | ||
| Ltd. ADR | 1,091,200 | 31,754 | |
| Harley-Davidson Inc. | 520,600 | 29,575 | |
| * | Five Below Inc. | 590,800 | 29,020 |
| Renault SA | 141,608 | 13,205 | |
| Best Buy Co. Inc. | 41,325 | 2,141 | |
| Darden Restaurants Inc. | 22,849 | 1,947 | |
| Lear Corp. | 12,653 | 1,805 | |
| * | Liberty Global plc Class A | 44,600 | 1,580 |
| Gap Inc. | 34,605 | 907 | |
| Coach Inc. | 22,826 | 899 | |
| Whirlpool Corp. | 4,281 | 795 | |
| Hasbro Inc. | 3,517 | 349 | |
| Kohl’s Corp. | 8,900 | 347 | |
| News Corp. Class B | 24,011 | 312 | |
| * | Liberty Media Corp-Liberty | ||
| Formula One Class A | 7,200 | 244 | |
| * | DISH Network Corp. | ||
| Class A | 3,781 | 244 | |
| Staples Inc. | 9,048 | 88 | |
| 4,543,073 | |||
| Consumer Staples (10.3%) | |||
| Philip Morris | |||
| International Inc. | 9,268,614 | 1,027,333 | |
| ^ | Imperial Brands plc ADR | 16,689,950 | 829,858 |
| Altria Group Inc. | 11,206,432 | 804,398 | |
| CVS Health Corp. | 9,739,300 | 802,908 | |
| Coca-Cola Co. | 8,541,847 | 368,581 | |
| Molson Coors | |||
| Brewing Co. | |||
| Class B | 2,742,078 | 262,938 | |
| Kellogg Co. | 3,360,475 | 238,594 | |
| Walgreens Boots | |||
| Alliance Inc. | 2,477,700 | 214,420 | |
| PepsiCo Inc. | 1,687,274 | 191,135 | |
| * | Nestle SA | 1,130,978 | 87,108 |
| Wal-Mart Stores Inc. | 901,213 | 67,753 | |
| Bunge Ltd. | 395,400 | 31,248 | |
| Procter & Gamble Co. | 86,527 | 7,556 | |
| Conagra Brands Inc. | 51,254 | 1,988 | |
| Tyson Foods Inc. Class A | 19,322 | 1,242 | |
| Pilgrim’s Pride Corp. | 21,973 | 570 | |
| 4,937,630 | |||
14
Windsor II Fund
| Market | |||
| Value• | |||
| Shares | ($000) | ||
| Energy (8.4%) | |||
| ConocoPhillips | 17,239,758 | 825,957 | |
| BP plc ADR | 16,720,549 | 573,849 | |
| Phillips 66 | 6,480,369 | 515,578 | |
| Occidental | |||
| Petroleum Corp. | 7,946,257 | 489,013 | |
| Chevron Corp. | 2,444,772 | 260,857 | |
| Cabot Oil & Gas Corp. | 7,238,909 | 168,232 | |
| Schlumberger Ltd. | 2,207,945 | 160,275 | |
| Marathon Oil Corp. | 9,803,100 | 145,772 | |
| Range Resources Corp. | 4,972,105 | 131,711 | |
| Hess Corp. | 2,503,900 | 122,265 | |
| EOG Resources Inc. | 1,147,800 | 106,172 | |
| Royal Dutch | |||
| Shell plc ADR | 1,934,806 | 100,978 | |
| Murphy Oil Corp. | 3,654,100 | 95,664 | |
| Apache Corp. | 1,908,929 | 92,850 | |
| Pioneer Natural | |||
| Resources Co. | 530,600 | 91,789 | |
| Cimarex Energy Co. | 467,465 | 54,544 | |
| Valero Energy Corp. | 647,708 | 41,848 | |
| * | Kosmos Energy Ltd. | 5,210,700 | 31,316 |
| Exxon Mobil Corp. | 95,039 | 7,760 | |
| ^,* | Cobalt International | ||
| Energy Inc. | 14,963,900 | 5,852 | |
| ONEOK Inc. | 34,547 | 1,818 | |
| * | Energen Corp. | 30,499 | 1,586 |
| Devon Energy Corp. | 32,729 | 1,292 | |
| * | Newfield Exploration Co. | 33,656 | 1,165 |
| * | Chesapeake Energy Corp. | 196,098 | 1,032 |
| Williams Cos. Inc. | 33,540 | 1,027 | |
| * | Southwestern Energy Co. | 133,271 | 1,001 |
| Ensco plc Class A | 55,405 | 437 | |
| Kinder Morgan Inc. | 4,200 | 87 | |
| 4,031,727 | |||
| Financials (16.6%) | |||
| Bank of America Corp. | 55,150,591 | 1,287,215 | |
| Citigroup Inc. | 20,980,161 | 1,240,347 | |
| JPMorgan Chase & Co. | 12,544,709 | 1,091,390 | |
| Wells Fargo & Co. | 20,139,496 | 1,084,310 | |
| American Express Co. | 8,735,467 | 692,286 | |
| American International | |||
| Group Inc. | 5,370,581 | 327,122 | |
| Morgan Stanley | 4,997,600 | 216,746 | |
| Fifth Third Bancorp | 8,304,129 | 202,870 | |
| Intercontinental | |||
| Exchange Inc. | 3,347,000 | 201,489 | |
| Navient Corp. | 12,975,040 | 197,221 | |
| Citizens Financial | |||
| Group Inc. | 4,569,200 | 167,735 | |
| * | SLM Corp. | 12,868,652 | 161,373 |
| BNP Paribas SA | 2,121,364 | 149,720 | |
| Capital One | |||
| Financial Corp. | 1,832,093 | 147,264 | |
| State Street Corp. | 1,398,600 | 117,342 | |
| Aon plc | 901,250 | 108,006 | |
| Travelers Cos. Inc. | 842,400 | 102,486 | |
| Barclays plc | 36,326,564 | 99,477 | |
| Goldman Sachs | |||
| Group Inc. | 328,252 | 73,463 | |
| SunTrust Banks Inc. | 1,126,924 | 64,020 | |
| Sumitomo Mitsui | |||
| Financial Group Inc. | 1,036,900 | 38,501 | |
| CIT Group Inc. | 821,600 | 38,048 | |
| Bank of New York | |||
| Mellon Corp. | 780,700 | 36,740 | |
| Allstate Corp. | 422,700 | 34,361 | |
| Prudential Financial Inc. | 284,473 | 30,447 | |
| Synchrony Financial | 1,044,121 | 29,027 | |
| Banco de Sabadell SA | 12,781,367 | 24,584 | |
| Aflac Inc. | 29,202 | 2,187 | |
| Discover Financial | |||
| Services | 33,947 | 2,125 | |
| Principal Financial | |||
| Group Inc. | 32,147 | 2,094 | |
| Everest Re Group Ltd. | 7,752 | 1,951 | |
| Regions Financial Corp. | 137,596 | 1,892 | |
| Lincoln National Corp. | 28,600 | 1,886 | |
| Unum Group | 40,311 | 1,868 | |
| Reinsurance Group | |||
| of America Inc. Class A | 12,880 | 1,610 | |
| Charles Schwab Corp. | 34,344 | 1,334 | |
| Ameriprise Financial Inc. | 7,939 | 1,015 | |
| US Bancorp | 15,698 | 805 | |
| PNC Financial Services | |||
| Group Inc. | 3,336 | 399 | |
| Leucadia National Corp. | 11,500 | 292 | |
| Chubb Ltd. | 1,421 | 195 | |
| 7,983,243 | |||
| Health Care (19.7%) | |||
| Pfizer Inc. | 36,763,320 | 1,247,012 | |
| Medtronic plc | 14,285,207 | 1,186,958 | |
| Anthem Inc. | 5,813,227 | 1,034,115 | |
| Sanofi ADR | 21,466,800 | 1,015,380 | |
| Johnson & Johnson | 7,833,070 | 967,149 | |
| * | Express Scripts | ||
| Holding Co. | 12,759,100 | 782,643 | |
| Cardinal Health Inc. | 10,323,881 | 749,411 | |
| Teva Pharmaceutical | |||
| Industries Ltd. ADR | 17,079,600 | 539,374 | |
| Merck & Co. Inc. | 8,584,552 | 535,075 | |
| UnitedHealth Group Inc. | 1,292,500 | 226,032 | |
| Zoetis Inc. | 3,250,597 | 182,391 | |
| Cigna Corp. | 1,099,218 | 171,885 | |
| Stryker Corp. | 1,118,650 | 152,550 | |
| * | Biogen Inc. | 502,005 | 136,149 |
| Allergan plc | 523,080 | 127,558 | |
| Humana Inc. | 514,400 | 114,186 | |
| GlaxoSmithKline plc ADR | 2,591,100 | 105,976 | |
| Roche Holding AG | 362,000 | 94,723 | |
| Zimmer Biomet | |||
| Holdings Inc. | 349,800 | 41,854 | |
15
Windsor II Fund
| Market | |||
| Value• | |||
| Shares | ($000) | ||
| AbbVie Inc. | 582,498 | 38,410 | |
| Eli Lilly & Co. | 36,522 | 2,997 | |
| Aetna Inc. | 21,582 | 2,915 | |
| Baxter International Inc. | 35,215 | 1,961 | |
| * | Quintiles IMS Holdings Inc. | 9,700 | 817 |
| Danaher Corp. | 5,946 | 495 | |
| Bristol-Myers Squibb Co. | 4,782 | 268 | |
| Gilead Sciences Inc. | 1,900 | 130 | |
| 9,458,414 | |||
| Industrials (10.2%) | |||
| United Technologies | |||
| Corp. | 8,805,572 | 1,047,775 | |
| Johnson Controls | |||
| International plc | 24,676,974 | 1,025,822 | |
| Honeywell | |||
| International Inc. | 4,563,361 | 598,439 | |
| General Dynamics Corp. | 2,164,300 | 419,420 | |
| Eaton Corp. plc | 3,069,900 | 232,207 | |
| United Parcel Service Inc. | |||
| Class B | 2,052,000 | 220,508 | |
| Koninklijke Philips NV | 5,029,307 | 173,109 | |
| Raytheon Co. | 1,008,183 | 156,480 | |
| Cummins Inc. | 1,030,307 | 155,514 | |
| ^,* | CNH Industrial NV | 11,893,000 | 132,012 |
| Rockwell Collins Inc. | 1,055,100 | 109,825 | |
| Boeing Co. | 580,900 | 107,368 | |
| Deere & Co. | 718,376 | 80,178 | |
| * | Copart Inc. | 2,415,410 | 74,636 |
| Stanley Black | |||
| & Decker Inc. | 488,022 | 66,444 | |
| General Electric Co. | 2,281,203 | 66,132 | |
| Parker-Hannifin Corp. | 342,021 | 54,997 | |
| Union Pacific Corp. | 424,025 | 47,474 | |
| * | Kirby Corp. | 648,750 | 45,802 |
| PACCAR Inc. | 496,900 | 33,158 | |
| Embraer SA ADR | 1,339,300 | 25,715 | |
| Emerson Electric Co. | 41,700 | 2,514 | |
| Delta Air Lines Inc. | 52,158 | 2,370 | |
| L3 Technologies Inc. | 11,404 | 1,959 | |
| Rockwell Automation Inc. | 10,847 | 1,707 | |
| Owens Corning | 27,010 | 1,644 | |
| American Airlines | |||
| Group Inc. | 38,483 | 1,640 | |
| Allison Transmission | |||
| Holdings Inc. | 36,355 | 1,406 | |
| ManpowerGroup Inc. | 12,800 | 1,293 | |
| Jacobs Engineering | |||
| Group Inc. | 20,693 | 1,136 | |
| 4,888,684 | |||
| Information Technology (16.5%) | |||
| Microsoft Corp. | 22,824,124 | 1,562,540 | |
| Oracle Corp. | 23,846,500 | 1,072,139 | |
| QUALCOMM Inc. | 12,500,932 | 671,800 | |
| Apple Inc. | 3,858,456 | 554,267 | |
| * | Alphabet Inc. Class A | 489,418 | 452,477 |
| * | Alphabet Inc. Class C | 396,656 | 359,355 |
| Cisco Systems Inc. | 10,469,183 | 356,685 | |
| Hewlett Packard | |||
| Enterprise Co. | 18,609,800 | 346,701 | |
| Samsung Electronics | |||
| Co. Ltd. | 153,400 | 300,730 | |
| * | eBay Inc. | 7,627,334 | 254,829 |
| Taiwan Semiconductor | |||
| Manufacturing Co. | |||
| Ltd. ADR | 7,567,119 | 250,245 | |
| Visa Inc. Class A | 2,529,600 | 230,750 | |
| Intel Corp. | 5,868,134 | 212,133 | |
| Corning Inc. | 7,065,500 | 203,840 | |
| Motorola Solutions Inc. | 2,342,825 | 201,413 | |
| Telefonaktiebolaget | |||
| LM Ericsson ADR | 27,493,900 | 178,435 | |
| Skyworks Solutions Inc. | 1,680,300 | 167,593 | |
| * | Vantiv Inc. Class A | 1,796,840 | 111,476 |
| Fidelity National | |||
| Information | |||
| Services Inc. | 1,108,550 | 93,329 | |
| Applied Materials Inc. | 1,844,550 | 74,907 | |
| TE Connectivity Ltd. | 948,800 | 73,409 | |
| Cypress Semiconductor | |||
| Corp. | 4,864,620 | 68,153 | |
| * | DXC Technology Co. | 627,967 | 47,311 |
| * | Palo Alto Networks Inc. | 414,900 | 44,979 |
| * | Teradata Corp. | 1,182,296 | 34,499 |
| SK Hynix Inc. | 152,562 | 7,227 | |
| International Business | |||
| Machines Corp. | 33,178 | 5,318 | |
| HP Inc. | 142,659 | 2,685 | |
| Seagate Technology plc | 41,567 | 1,751 | |
| NVIDIA Corp. | 14,481 | 1,510 | |
| * | NCR Corp. | 33,920 | 1,399 |
| Marvell Technology | |||
| Group Ltd. | 79,996 | 1,202 | |
| * | Dell Technologies Inc. | ||
| Class V | 5,800 | 389 | |
| Avnet Inc. | 9,208 | 356 | |
| 7,945,832 | |||
| Materials (2.9%) | |||
| Air Products | |||
| & Chemicals Inc. | 5,477,362 | 769,569 | |
| EI du Pont de | |||
| Nemours & Co. | 3,280,406 | 261,612 | |
| * | Crown Holdings Inc. | 2,911,600 | 163,312 |
| PPG Industries Inc. | 868,200 | 95,363 | |
| International Paper Co. | 988,300 | 53,339 | |
| Agrium Inc. | 474,750 | 44,593 | |
| LyondellBasell Industries | |||
| NV Class A | 26,611 | 2,256 | |
| * | Freeport-McMoRan Inc. | 156,670 | 1,998 |
| WestRock Co. | 36,276 | 1,943 | |
| Albemarle Corp. | 17,760 | 1,934 | |
| Steel Dynamics Inc. | 50,069 | 1,809 | |
| FMC Corp. | 4,838 | 354 | |
16
Windsor II Fund
| Market | |||
| Value• | |||
| Shares | ($000) | ||
| Dow Chemical Co. | 4,457 | 280 | |
| Celanese Corp. Class A | 2,799 | 244 | |
| 1,398,606 | |||
| Other (0.5%) | |||
| SPDR S&P500 ETF Trust | 737,143 | 175,499 | |
| 2 | Vanguard Value ETF | 630,600 | 60,121 |
| 235,620 | |||
| Real Estate (0.2%) | |||
| Prologis Inc. | 1,170,450 | 63,684 | |
| Host Hotels | |||
| & Resorts Inc. | 894,680 | 16,059 | |
| Senior Housing | |||
| Properties Trust | 85,125 | 1,832 | |
| ^ | Omega Healthcare | ||
| Investors Inc. | 53,533 | 1,767 | |
| Colony NorthStar Inc. | |||
| Class A | 126,367 | 1,652 | |
| WP Carey Inc. | 20,569 | 1,288 | |
| Uniti Group Inc. | 24,667 | 677 | |
| VEREIT Inc. | 75,691 | 633 | |
| Hospitality Properties Trust | 19,400 | 617 | |
| Spirit Realty Capital Inc. | 49,854 | 470 | |
| 88,679 | |||
| Telecommunication Services (2.8%) | |||
| Verizon | |||
| Communications Inc. | 14,962,351 | 686,921 | |
| AT&T Inc. | 13,288,785 | 526,635 | |
| Vodafone Group plc | |||
| ADR | 5,168,836 | 135,372 | |
| * | Sprint Corp. | 188,100 | 1,699 |
| 1,350,627 | |||
| Utilities (0.4%) | |||
| * | Calpine Corp. | 12,215,500 | 124,598 |
| Southern Co. | 535,800 | 26,683 | |
| PPL Corp. | 685,871 | 26,139 | |
| PG&E Corp. | 37,001 | 2,481 | |
| Edison International | 28,767 | 2,300 | |
| Exelon Corp. | 62,042 | 2,149 | |
| CenterPoint Energy Inc. | 69,833 | 1,992 | |
| UGI Corp. | 36,621 | 1,837 | |
| FirstEnergy Corp. | 58,344 | 1,747 | |
| MDU Resources | |||
| Group Inc. | 59,943 | 1,612 | |
| AES Corp. | 141,148 | 1,596 | |
| National Fuel Gas Co. | 27,284 | 1,511 | |
| NRG Energy Inc. | 45,715 | 773 | |
| 195,418 | |||
| Total Common Stocks | |||
| (Cost $35,628,745) | 47,057,553 | ||
| Temporary Cash Investments (2.1%)1 | |||
| Money Market Fund (2.1%) | |||
| 3,4 | Vanguard Market | ||
| Liquidity Fund, | |||
| 1.034% | 9,995,486 | 999,748 | |
| Face | |||
| Amount | |||
| ($000) | |||
| U.S. Government and Agency Obligations (0.0%) | |||
| United States Treasury Bill, | |||
| 0.602%, 5/18/17 | 6,500 | 6,498 | |
| 5 | United States Treasury Bill, | ||
| 0.597%, 5/25/17 | 5,000 | 4,998 | |
| United States Treasury Bill, | |||
| 0.713%, 6/1/17 | 100 | 100 | |
| 5 | United States Treasury Bill, | ||
| 0.741%, 6/8/17 | 200 | 200 | |
| 5 | United States Treasury Bill, | ||
| 0.756%–0.771%, 6/22/17 | 5,500 | 5,494 | |
| 17,290 | |||
| Total Temporary Cash Investments | |||
| (Cost $1,016,941) | 1,017,038 | ||
| Total Investments (100.0%) | |||
| (Cost $36,645,686) | 48,074,591 | ||
| Amount | |||
| ($000) | |||
| Other Assets and Liabilities (0.0%) | |||
| Other Assets | |||
| Investment in Vanguard | 3,299 | ||
| Receivables for Investment Securities Sold 526,157 | |||
| Receivables for Accrued Income | 47,777 | ||
| Receivables for Capital Shares Issued | 408,629 | ||
| Other Assets | 13,001 | ||
| Total Other Assets | 998,863 | ||
| Liabilities | |||
| Payables for Investment Securities | |||
| Purchased | (289,139) | ||
| Collateral for Securities on Loan | (77,986) | ||
| Payables to Investment Advisor | (13,950) | ||
| Payables for Capital Shares Redeemed | (527,822) | ||
| Payables to Vanguard | (74,337) | ||
| Other Liabilities | (608) | ||
| Total Liabilities | (983,842) | ||
| Net Assets (100%) | 48,089,612 | ||
17
Windsor II Fund
At April 30, 2017, net assets consisted of:
| Amount | |
| ($000) | |
| Paid-in Capital | 34,353,454 |
| Undistributed Net Investment Income | 218,797 |
| Accumulated Net Realized Gains | 2,087,975 |
| Unrealized Appreciation (Depreciation) | |
| Investment Securities | 11,428,905 |
| Futures Contracts | 460 |
| Foreign Currencies | 21 |
| Net Assets | 48,089,612 |
| Investor Shares—Net Assets | |
| Applicable to 391,683,227 outstanding | |
| $.001 par value shares of beneficial | |
| interest (unlimited authorization) | 14,472,338 |
| Net Asset Value Per Share— | |
| Investor Shares | $36.95 |
| Admiral Shares—Net Assets | |
| Applicable to 512,650,926 outstanding | |
| $.001 par value shares of beneficial | |
| interest (unlimited authorization) | 33,617,274 |
| Net Asset Value Per Share— | |
| Admiral Shares | $65.58 |
• See Note A in Notes to Financial Statements.
* Non-income-producing security.
^ Includes partial security positions on loan to broker-dealers. The total value of securities on loan is $74,483,000.
1 The fund invests a portion of its cash reserves in equity markets through the use of index futures contracts. After giving effect to futures
investments, the fund’s effective common stock and temporary cash investment positions represent 98.7% and 1.3%, respectively,
of net assets.
2 Considered an affiliated company of the fund as the issuer is another member of The Vanguard Group.
3 Affiliated money market fund available only to Vanguard funds and certain trusts and accounts managed by Vanguard. Rate shown is
the 7-day yield.
4 Includes $77,986,000 of collateral received for securities on loan.
5 Securities with a value of $6,559,000 have been segregated as initial margin for open futures contracts.
ADR—American Depositary Receipt.
See accompanying Notes, which are an integral part of the Financial Statements.
18
Windsor II Fund
Statement of Operations
| Six Months Ended | |
| April 30, 2017 | |
| ($000) | |
| Investment Income | |
| Income | |
| Dividends1,2 | 538,582 |
| Interest2 | 5,700 |
| Securities Lending—Net | 641 |
| Total Income | 544,923 |
| Expenses | |
| Investment Advisory Fees—Note B | |
| Basic Fee | 33,314 |
| Performance Adjustment | (5,656) |
| The Vanguard Group—Note C | |
| Management and Administrative—Investor Shares | 14,221 |
| Management and Administrative—Admiral Shares | 21,576 |
| Marketing and Distribution—Investor Shares | 1,101 |
| Marketing and Distribution—Admiral Shares | 960 |
| Custodian Fees | 194 |
| Shareholders’ Reports—Investor Shares | 232 |
| Shareholders’ Reports—Admiral Shares | 141 |
| Trustees’ Fees and Expenses | 35 |
| Total Expenses | 66,118 |
| Expenses Paid Indirectly | (1,211) |
| Net Expenses | 64,907 |
| Net Investment Income | 480,016 |
| Realized Net Gain (Loss) | |
| Investment Securities Sold2 | 2,113,941 |
| Futures Contracts | 16,875 |
| Foreign Currencies | (96) |
| Realized Net Gain (Loss) | 2,130,720 |
| Change in Unrealized Appreciation (Depreciation) | |
| Investment Securities | 3,017,876 |
| Futures Contracts | 797 |
| Foreign Currencies | 133 |
| Change in Unrealized Appreciation (Depreciation) | 3,018,806 |
| Net Increase (Decrease) in Net Assets Resulting from Operations | 5,629,542 |
1 Dividends are net of foreign withholding taxes of $4,951,000.
2 Dividend income, interest income, and realized net gain (loss) from affiliated companies of the fund were $790,000, $5,652,000, and $94,000, respectively.
See accompanying Notes, which are an integral part of the Financial Statements.
19
Windsor II Fund
Statement of Changes in Net Assets
| Six Months Ended | Year Ended | |
| April 30, | October 31, | |
| 2017 | 2016 | |
| ($000) | ($000) | |
| Increase (Decrease) in Net Assets | ||
| Operations | ||
| Net Investment Income | 480,016 | 1,133,226 |
| Realized Net Gain (Loss) | 2,130,720 | 2,821,008 |
| Change in Unrealized Appreciation (Depreciation) | 3,018,806 | (2,689,493) |
| Net Increase (Decrease) in Net Assets Resulting from Operations | 5,629,542 | 1,264,741 |
| Distributions | ||
| Net Investment Income | ||
| Investor Shares | (186,544) | (322,488) |
| Admiral Shares | (439,036) | (710,701) |
| Realized Capital Gain1 | ||
| Investor Shares | (754,617) | (772,959) |
| Admiral Shares | (1,716,810) | (1,596,656) |
| Total Distributions | (3,097,007) | (3,402,804) |
| Capital Share Transactions | ||
| Investor Shares | (72,288) | (908,254) |
| Admiral Shares | 864,854 | 650,239 |
| Net Increase (Decrease) from Capital Share Transactions | 792,566 | (258,015) |
| Total Increase (Decrease) | 3,325,101 | (2,396,078) |
| Net Assets | ||
| Beginning of Period | 44,764,511 | 47,160,589 |
| End of Period2 | 48,089,612 | 44,764,511 |
1 Includes fiscal 2017 and 2016 short-term gain distributions totaling $129,460,000 and $218,890,000, respectively. Short-term gain distributions are treated as ordinary income dividends for tax purposes.
2 Net Assets—End of Period includes undistributed (overdistributed) net investment income of $218,797,000 and $364,457,000.
See accompanying Notes, which are an integral part of the Financial Statements.
20
Windsor II Fund
Financial Highlights
| Investor Shares | ||||||
| Six Months | ||||||
| Ended | ||||||
| For a Share Outstanding | April 30, | Year Ended October 31, | ||||
| Throughout Each Period | 2017 | 2016 | 2015 | 2014 | 2013 | 2012 |
| Net Asset Value, Beginning of Period | $35.03 | $36.73 | $39.59 | $36.19 | $29.33 | $25.68 |
| Investment Operations | ||||||
| Net Investment Income | . 370 | . 8471 | .809 | .868 | .740 | .644 |
| Net Realized and Unrealized Gain (Loss) | ||||||
| on Investments | 4.002 | .096 | (.229) | 4.167 | 6.842 | 3.627 |
| Total from Investment Operations | 4.372 | .943 | .580 | 5.035 | 7.582 | 4.271 |
| Distributions | ||||||
| Dividends from Net Investment Income | (. 486) | (.781) | (. 827) | (. 838) | (.722) | (. 621) |
| Distributions from Realized Capital Gains | (1.966) | (1.862) | (2.613) | (.797) | — | — |
| Total Distributions | (2.452) | (2.643) | (3.440) | (1.635) | (.722) | (.621) |
| Net Asset Value, End of Period | $36.95 | $35.03 | $36.73 | $39.59 | $36.19 | $29.33 |
| Total Return2 | 12.76% | 2.86% | 1.57% | 14.36% | 26.26% | 16.90% |
| Ratios/Supplemental Data | ||||||
| Net Assets, End of Period (Millions) | $14,472 | $13,773 | $15,397 | $17,312 | $18,034 | $18,255 |
| Ratio of Total Expenses to | ||||||
| Average Net Assets3 | 0.34% | 0.33% | 0.34% | 0.36% | 0.36% | 0.35% |
| Ratio of Net Investment Income to | ||||||
| Average Net Assets | 1.98% | 2.46% | 2.12% | 2.28% | 2.25% | 2.30% |
| Portfolio Turnover Rate | 35% | 33% | 26% | 27% | 27% | 22% |
The expense ratio, net investment income ratio, and turnover rate for the current period have been annualized.
1 Calculated based on average shares outstanding.
2 Total returns do not include account service fees that may have applied in the periods shown. Fund prospectuses provide information about any applicable account service fees.
3 Includes performance-based investment advisory fee increases (decreases) of (0.02%), (0.03%), (0.02%), 0.00%, (0.01%), and (0.02%).
See accompanying Notes, which are an integral part of the Financial Statements.
21
Windsor II Fund
Financial Highlights
| Admiral Shares | ||||||
| Six Months | ||||||
| Ended | ||||||
| For a Share Outstanding | April 30, | Year Ended October 31, | ||||
| Throughout Each Period | 2017 | 2016 | 2015 | 2014 | 2013 | 2012 |
| Net Asset Value, Beginning of Period | $62.18 | $65.20 | $70.27 | $64.23 | $52.06 | $45.59 |
| Investment Operations | ||||||
| Net Investment Income | . 683 | 1.5521 | 1.492 | 1.601 | 1.366 | 1.188 |
| Net Realized and Unrealized Gain (Loss) | ||||||
| on Investments | 7.097 | .168 | (.401) | 7.398 | 12.134 | 6.424 |
| Total from Investment Operations | 7.780 | 1.720 | 1.091 | 8.999 | 13.500 | 7.612 |
| Distributions | ||||||
| Dividends from Net Investment Income | (.892) | (1.437) | (1.525) | (1.545) | (1.330) | (1.142) |
| Distributions from Realized Capital Gains | (3.488) | (3.303) | (4.636) | (1.414) | — | — |
| Total Distributions | (4.380) | (4.740) | (6.161) | (2.959) | (1.330) | (1.142) |
| Net Asset Value, End of Period | $65.58 | $62.18 | $65.20 | $70.27 | $64.23 | $52.06 |
| Total Return2 | 12.80% | 2.94% | 1.66% | 14.46% | 26.36% | 16.98% |
| Ratios/Supplemental Data | ||||||
| Net Assets, End of Period (Millions) | $33,617 | $30,991 | $31,763 | $32,898 | $27,593 | $19,032 |
| Ratio of Total Expenses to | ||||||
| Average Net Assets3 | 0.26% | 0.25% | 0.26% | 0.28% | 0.28% | 0.27% |
| Ratio of Net Investment Income to | ||||||
| Average Net Assets | 2.06% | 2.54% | 2.20% | 2.36% | 2.33% | 2.38% |
| Portfolio Turnover Rate | 35% | 33% | 26% | 27% | 27% | 22% |
The expense ratio, net investment income ratio, and turnover rate for the current period have been annualized.
1 Calculated based on average shares outstanding.
2 Total returns do not include account service fees that may have applied in the periods shown. Fund prospectuses provide information about any applicable account service fees.
3 Includes performance-based investment advisory fee increases (decreases) of (0.02%), (0.03%), (0.02%), 0.00%, (0.01%), and (0.02%).
See accompanying Notes, which are an integral part of the Financial Statements.
22
Windsor II Fund
Notes to Financial Statements
Vanguard Windsor II Fund is registered under the Investment Company Act of 1940 as an open-end investment company, or mutual fund. The fund offers two classes of shares: Investor Shares and Admiral Shares. Investor Shares are available to any investor who meets the fund’s minimum purchase requirements. Admiral Shares are designed for investors who meet certain administrative, service, and account-size criteria.
A. The following significant accounting policies conform to generally accepted accounting principles for U.S. investment companies. The fund consistently follows such policies in preparing its financial statements.
1. Security Valuation: Securities are valued as of the close of trading on the New York Stock Exchange (generally 4 p.m., Eastern time) on the valuation date. Equity securities are valued at the latest quoted sales prices or official closing prices taken from the primary market in which each security trades; such securities not traded on the valuation date are valued at the mean of the latest quoted bid and asked prices. Securities for which market quotations are not readily available, or whose values have been affected by events occurring before the fund’s pricing time but after the close of the securities’ primary markets, are valued at their fair values calculated according to procedures adopted by the board of trustees. These procedures include obtaining quotations from an independent pricing service, monitoring news to identify significant market- or security-specific events, and evaluating changes in the values of foreign market proxies (for example, ADRs, futures contracts, or exchange-traded funds), between the time the foreign markets close and the fund’s pricing time. When fair-value pricing is employed, the prices of securities used by a fund to calculate its net asset value may differ from quoted or published prices for the same securities. Investments in Vanguard Market Liquidity Fund are valued at that fund’s net asset value. Temporary cash investments are valued using the latest bid prices or using valuations based on a matrix system (which considers such factors as security prices, yields, maturities, and ratings), both as furnished by independent pricing services.
2. Foreign Currency: Securities and other assets and liabilities denominated in foreign currencies are translated into U.S. dollars using exchange rates obtained from an independent third party as of the fund’s pricing time on the valuation date. Realized gains (losses) and unrealized appreciation (depreciation) on investment securities include the effects of changes in exchange rates since the securities were purchased, combined with the effects of changes in security prices. Fluctuations in the value of other assets and liabilities resulting from changes in exchange rates are recorded as unrealized foreign currency gains (losses) until the assets or liabilities are settled in cash, at which time they are recorded as realized foreign currency gains (losses).
3. Futures Contracts: The fund uses index futures contracts to a limited extent, with the objective of maintaining full exposure to the stock market while maintaining liquidity. The fund may purchase or sell futures contracts to achieve a desired level of investment, whether to accommodate portfolio turnover or cash flows from capital share transactions. The primary risks associated with the use of futures contracts are imperfect correlation between changes in market values of stocks held by the fund and the prices of futures contracts, and the possibility of an illiquid market. Counterparty risk involving futures is mitigated because a regulated clearinghouse is the counterparty instead of the clearing broker. To further mitigate counterparty risk, the fund trades futures contracts on an exchange, monitors the financial strength of its clearing brokers and clearinghouse, and has entered into clearing agreements with its clearing brokers. The clearinghouse imposes initial margin requirements to secure the fund’s performance and requires daily settlement of variation margin representing changes in the market value of each contract.
23
Windsor II Fund
Futures contracts are valued at their quoted daily settlement prices. The aggregate settlement values of the contracts are not recorded in the Statement of Net Assets. Fluctuations in the value of the contracts are recorded in the Statement of Net Assets as an asset (liability) and in the Statement of Operations as unrealized appreciation (depreciation) until the contracts are closed, when they are recorded as realized futures gains (losses).
During the six months ended April 30, 2017, the fund’s average investments in long and short futures contracts represented less than 1% and 0% of net assets, respectively, based on the average of aggregate settlement values at each quarter-end during the period.
4. Federal Income Taxes: The fund intends to continue to qualify as a regulated investment company and distribute all of its taxable income. Management has analyzed the fund’s tax positions taken for all open federal income tax years (October 31, 2013–2016), and for the period ended April 30, 2017, and has concluded that no provision for federal income tax is required in the fund’s financial statements. 5. Distributions: Distributions to shareholders are recorded on the ex-dividend date.
6. Securities Lending: To earn additional income, the fund lends its securities to qualified institutional borrowers. Security loans are subject to termination by the fund at any time, and are required to be secured at all times by collateral in an amount at least equal to the market value of securities loaned. Daily market fluctuations could cause the value of loaned securities to be more or less than the value of the collateral received. When this occurs, the collateral is adjusted and settled on the next business day. The fund further mitigates its counterparty risk by entering into securities lending transactions only with a diverse group of prequalified counterparties, monitoring their financial strength, and entering into master securities lending agreements with its counterparties. The master securities lending agreements provide that, in the event of a counterparty’s default (including bankruptcy), the fund may terminate any loans with that borrower, determine the net amount owed, and sell or retain the collateral up to the net amount owed to the fund; however, such actions may be subject to legal proceedings. While collateral mitigates counterparty risk, in the event of a default, the fund may experience delays and costs in recovering the securities loaned. The fund invests cash collateral received in Vanguard Market Liquidity Fund, and records a liability in the Statement of Net Assets for the return of the collateral, during the period the securities are on loan. Securities lending income represents fees charged to borrowers plus income earned on invested cash collateral, less expenses associated with the loan. During the term of the loan, the fund is entitled to all distributions made on or in respect of the loaned securities.
7. Credit Facility: The fund and certain other funds managed by The Vanguard Group (“Vanguard”) participate in a $3.1 billion committed credit facility provided by a syndicate of lenders pursuant to a credit agreement that may be renewed annually; each fund is individually liable for its borrowings, if any, under the credit facility. Borrowings may be utilized for temporary and emergency purposes, and are subject to the fund’s regulatory and contractual borrowing restrictions. The participating funds are charged administrative fees and an annual commitment fee of 0.10% of the undrawn amount of the facility; these fees are allocated to the funds based on a method approved by the fund’s board of trustees and included in Management and Administrative expenses on the fund’s Statement of Operations. Any borrowings under this facility bear interest at a rate based upon the higher of the one-month London Interbank Offered Rate, federal funds effective rate, or overnight bank funding rate plus an agreed-upon spread.
The fund had no borrowings outstanding at April 30, 2017, or at any time during the period then ended.
24
Windsor II Fund
8. Other: Dividend income is recorded on the ex-dividend date. Interest income includes income distributions received from Vanguard Market Liquidity Fund and is accrued daily. Premiums and discounts on debt securities purchased are amortized and accreted, respectively, to interest income over the lives of the respective securities. Security transactions are accounted for on the date securities are bought or sold. Costs used to determine realized gains (losses) on the sale of investment securities are those of the specific securities sold.
Each class of shares has equal rights as to assets and earnings, except that each class separately bears certain class-specific expenses related to maintenance of shareholder accounts (included in Management and Administrative expenses) and shareholder reporting. Marketing and distribution expenses are allocated to each class of shares based on a method approved by the board of trustees. Income, other non-class-specific expenses, and gains and losses on investments are allocated to each class of shares based on its relative net assets.
B. The investment advisory firms Barrow, Hanley, Mewhinney & Strauss, LLC, Lazard Asset Management LLC, Hotchkis and Wiley Capital Management, LLC, and Sanders Capital, LLC, each provide investment advisory services to a portion of the fund for a fee calculated at an annual percentage rate of average net assets managed by the advisor. The basic fee of Barrow, Hanley, Mewhinney & Strauss, LLC, is subject to quarterly adjustments based on performance relative to the MSCI US Prime Market 750 Index for the preceding three years. The basic fee of Lazard Asset Management LLC is subject to quarterly adjustments based on performance relative to the S&P 500 Index for the preceding three years. The basic fee of Hotchkis and Wiley Capital Management, LLC, is subject to quarterly adjustments based on performance relative to the MSCI US Investable Market 2500 Index for the preceding five years. The basic fee of Sanders Capital, LLC, is subject to quarterly adjustments based on performance relative to the Russell 3000 Index for the preceding five years.
Vanguard provides investment advisory services to a portion of the fund as described below; the fund paid Vanguard advisory fees of $166,000 for the six months ended April 30, 2017.
For the six months ended April 30, 2017, the aggregate investment advisory fee paid to all advisors represented an effective annual basic rate of 0.14% of the fund’s average net assets, before a decrease of $5,656,000 (0.02%) based on performance.
C. In accordance with the terms of a Funds’ Service Agreement (the “FSA”) between Vanguard and the fund, Vanguard furnishes to the fund investment advisory, corporate management, administrative, marketing, and distribution services at Vanguard’s cost of operations (as defined by the FSA). These costs of operations are allocated to the fund based on methods and guidelines approved by the board of trustees. Vanguard does not require reimbursement in the current period for certain costs of operations (such as deferred compensation/benefits and risk/insurance costs); the fund’s liability for these costs of operations is included in Payables to Vanguard on the Statement of Net Assets.
Upon the request of Vanguard, the fund may invest up to 0.40% of its net assets as capital in Vanguard. At April 30, 2017, the fund had contributed to Vanguard capital in the amount of $3,299,000, representing 0.01% of the fund’s net assets and 1.32% of Vanguard’s capitalization. The fund’s trustees and officers are also directors and employees, respectively, of Vanguard.
D. The fund has asked its investment advisors to direct certain security trades, subject to obtaining the best price and execution, to brokers who have agreed to rebate to the fund part of the commissions generated. Such rebates are used solely to reduce the fund’s management and administrative expenses. For the six months ended April 30, 2017, these arrangements reduced the fund’s expenses by $1,211,000 (an annual rate of 0.00% of average net assets).
25
Windsor II Fund
E. Various inputs may be used to determine the value of the fund’s investments. These inputs are summarized in three broad levels for financial statement purposes. The inputs or methodologies used to value securities are not necessarily an indication of the risk associated with investing in those securities.
Level 1—Quoted prices in active markets for identical securities.
Level 2—Other significant observable inputs (including quoted prices for similar securities, interest rates, prepayment speeds, credit risk, etc.).
Level 3—Significant unobservable inputs (including the fund’s own assumptions used to determine the fair value of investments).
The following table summarizes the market value of the fund’s investments as of April 30, 2017, based on the inputs used to value them:
| Level 1 | Level 2 | Level 3 | |
| Investments | ($000) | ($000) | ($000) |
| Common Stocks | 46,129,694 | 927,859 | — |
| Temporary Cash Investments | 999,748 | 17,290 | — |
| Futures Contracts—Liabilities1 | (606) | — | — |
| Total | 47,128,836 | 945,149 | — |
| 1 Represents variation margin on the last day of the reporting period. |
F. At April 30, 2017, the aggregate settlement value of open futures contracts and the related unrealized appreciation (depreciation) were:
| ($000) | ||||
| Aggregate | ||||
| Number of | Settlement | Unrealized | ||
| Long (Short) | Value | Appreciation | ||
| Futures Contracts | Expiration | Contracts | Long (Short) | (Depreciation) |
| E-mini S&P 500 Index | June 2017 | 3,541 | 421,468 | 460 |
Unrealized appreciation (depreciation) on open futures contracts is required to be treated as realized gain (loss) for tax purposes.
G. Distributions are determined on a tax basis and may differ from net investment income and realized capital gains for financial reporting purposes. Differences may be permanent or temporary. Permanent differences are reclassified among capital accounts in the financial statements to reflect their tax character. Temporary differences arise when certain items of income, expense, gain, or loss are recognized in different periods for financial statement and tax purposes. These differences will reverse at some time in the future. Differences in classification may also result from the treatment of short-term gains as ordinary income for tax purposes. The fund’s tax-basis capital gains and losses are determined only at the end of each fiscal year.
During the six months ended April 30, 2017, the fund realized net foreign currency losses of $96,000, which decreased distributable net income for tax purposes; accordingly, such losses have been reclassified from accumulated net realized gains to undistributed net investment income.
26
Windsor II Fund
At April 30, 2017, the cost of investment securities for tax purposes was $36,645,686,000. Net unrealized appreciation of investment securities for tax purposes was $11,428,905,000, consisting of unrealized gains of $13,638,747,000 on securities that had risen in value since their purchase and $2,209,842,000 in unrealized losses on securities that had fallen in value since their purchase.
H. During the six months ended April 30, 2017, the fund purchased $8,005,816,000 of investment securities and sold $9,766,529,000 of investment securities, other than temporary cash investments.
| I. Capital share transactions for each class of shares were: | ||||
| Six Months Ended | Year Ended | |||
| April 30, 2017 | October 31, 2016 | |||
| Amount | Shares | Amount | Shares | |
| ($000) | (000) | ($000) | (000) | |
| Investor Shares | ||||
| Issued | 356,974 | 9,797 | 680,830 | 20,254 |
| Issued in Lieu of Cash Distributions | 919,818 | 25,896 | 1,070,182 | 31,483 |
| Redeemed | (1,349,080) | (37,164) | (2,659,266) | (77,750) |
| Net Increase (Decrease)—Investor Shares | (72,288) | (1,471) | (908,254) | (26,013) |
| Admiral Shares | ||||
| Issued | 1,270,674 | 19,715 | 2,193,824 | 36,339 |
| Issued in Lieu of Cash Distributions | 2,042,226 | 32,406 | 2,188,705 | 36,288 |
| Redeemed | (2,448,046) | (37,900) | (3,732,290) | (61,400) |
| Net Increase (Decrease)—Admiral Shares | 864,854 | 14,221 | 650,239 | 11,227 |
J. Management has determined that no material events or transactions occurred subsequent to April 30, 2017, that would require recognition or disclosure in these financial statements.
27
About Your Fund’s Expenses
As a shareholder of the fund, you incur ongoing costs, which include costs for portfolio management, administrative services, and shareholder reports (like this one), among others. Operating expenses, which are deducted from a fund’s gross income, directly reduce the investment return of the fund.
A fund’s expenses are expressed as a percentage of its average net assets. This figure is known as the expense ratio. The following examples are intended to help you understand the ongoing costs (in dollars) of investing in your fund and to compare these costs with those of other mutual funds. The examples are based on an investment of $1,000 made at the beginning of the period shown and held for the entire period.
The accompanying table illustrates your fund’s costs in two ways:
• Based on actual fund return. This section helps you to estimate the actual expenses that you paid over the period. The ”Ending Account Value“ shown is derived from the fund‘s actual return, and the third column shows the dollar amount that would have been paid by an investor who started with $1,000 in the fund. You may use the information here, together with the amount you invested, to estimate the expenses that you paid over the period.
To do so, simply divide your account value by $1,000 (for example, an $8,600 account value divided by $1,000 = 8.6), then multiply the result by the number given for your fund under the heading ”Expenses Paid During Period.“
• Based on hypothetical 5% yearly return. This section is intended to help you compare your fund‘s costs with those of other mutual funds. It assumes that the fund had a yearly return of 5% before expenses, but that the expense ratio is unchanged. In this case—because the return used is not the fund’s actual return—the results do not apply to your investment. The example is useful in making comparisons because the Securities and Exchange Commission requires all mutual funds to calculate expenses based on a 5% return. You can assess your fund’s costs by comparing this hypothetical example with the hypothetical examples that appear in shareholder reports of other funds.
Note that the expenses shown in the table are meant to highlight and help you compare ongoing costs only and do not reflect transaction costs incurred by the fund for buying and selling securities. Further, the expenses do not include any purchase, redemption, or account service fees described in the fund prospectus. If such fees were applied to your account, your costs would be higher. Your fund does not carry a “sales load.”
The calculations assume no shares were bought or sold during the period. Your actual costs may have been higher or lower, depending on the amount of your investment and the timing of any purchases or redemptions.
You can find more information about the fund’s expenses, including annual expense ratios, in the Financial Statements section of this report. For additional information on operating expenses and other shareholder costs, please refer to your fund’s current prospectus.
28
| Six Months Ended April 30, 2017 | |||
| Beginning | Ending | Expenses | |
| Account Value | Account Value | Paid During | |
| Windsor II Fund | 10/31/2016 | 4/30/2017 | Period |
| Based on Actual Fund Return | |||
| Investor Shares | $1,000.00 | $1,127.63 | $1.79 |
| Admiral Shares | 1,000.00 | 1,127.98 | 1.37 |
| Based on Hypothetical 5% Yearly Return | |||
| Investor Shares | $1,000.00 | $1,023.11 | $1.71 |
| Admiral Shares | 1,000.00 | 1,023.51 | 1.30 |
The calculations are based on expenses incurred in the most recent six-month period. The fund’s annualized six-month expense ratios for that period are 0.34% for Investor Shares and 0.26% for Admiral Shares. The dollar amounts shown as “Expenses Paid” are equal to the annualized expense ratio multiplied by the average account value over the period, multiplied by the number of days in the most recent six-month period, then divided by the number of days in the most recent 12-month period (181/365).
29
Trustees Approve Advisory Arrangements
The board of trustees of Vanguard Windsor II Fund has renewed the fund’s investment advisory arrangements with Barrow, Hanley, Mewhinney & Strauss, LLC (Barrow Hanley); Hotchkis and Wiley Capital Management, LLC (Hotchkis and Wiley); Lazard Asset Management LLC (Lazard); Sanders Capital, LLC (Sanders Capital); and The Vanguard Group, Inc. (Vanguard), through its Quantitative Equity Group. The board determined that renewing the fund’s advisory arrangements was in the best interests of the fund and its shareholders.
The board based its decision upon an evaluation of each advisor’s investment staff, portfolio management process, and performance. This evaluation included information provided to the board by Vanguard’s Portfolio Review Department, which is responsible for fund and advisor oversight and product management. The Portfolio Review Department met regularly with the advisors and made monthly presentations to the board during the fiscal year that directed the board’s focus to relevant information and topics.
The board, or an investment committee made up of board members, also received information throughout the year during advisor presentations. For each advisor presentation, the board was provided with letters and reports that included information about, among other things, the advisory firm and the advisor’s assessment of the investment environment, portfolio performance, and portfolio characteristics.
In addition, the board received monthly reports, which included a Market and Economic Report, a Fund Dashboard Monthly Summary, and a Fund Performance Report.
Prior to their meeting, the trustees were provided with a memo and materials that summarized the information they received over the course of the year. They also considered the factors discussed below, among others. However, no single factor determined whether the board approved the arrangements. Rather, it was the totality of the circumstances that drove the board’s decision.
Nature, extent, and quality of services
The board reviewed the quality of the fund’s investment management services over both the short and long term, and took into account the organizational depth and stability of each advisor. The board considered the following:
Barrow Hanley. Founded in 1979, Barrow Hanley is known for its commitment to value investing. A subsidiary of Old Mutual Asset Managers, Barrow Hanley remains independently managed. Using fundamental research, Barrow Hanley seeks to make long-term investments in quality or improving businesses that are undervalued due to short-term disappointments. The firm seeks to construct a portfolio with strict adherence to valuation factors, below-average price-to-earnings and price-to-book value ratios, and above-average current yields. Barrow Hanley has advised the fund since the fund’s inception in 1985.
Hotchkis and Wiley. Founded in 1980, Hotchkis and Wiley is a value-oriented firm that manages various large-, mid-, and small-cap portfolios. Hotchkis and Wiley invests in companies where it believes that the present value of future cash flows exceeds the market price. The firm believes that the market frequently undervalues companies due to the extrapolation of current trends, while capital flows usually cause a company’s returns and profitability to normalize over the long term. Hotchkis and Wiley seeks to identify these companies with a disciplined, bottom-up research process. The portfolio managers leverage the support of a broad analyst team, which is organized into sector teams in an effort to better understand the impact that industry dynamics and macro-economic risk factors might have on individual companies. Hotchkis and Wiley has managed a portion of the fund since 2003.
30
Lazard. Lazard provides investment management services for clients around the world in a variety of investment mandates, including international equities, domestic equities, and fixed income securities. The investment team at Lazard employs a relative value, bottom-up stock-selection process to identify stocks with sustainable financial productivity and attractive valuations. Utilizing scenario analysis, the team seeks to understand the durability and future direction of financial productivity and valuation. Lazard is a subsidiary of Lazard Freres & Co LLC and has managed a portion of the fund since 2007.
Sanders Capital. Founded in 2009, Sanders Capital employs a traditional, bottom-up, fundamental research approach to identify securities that are undervalued relative to their expected total return. The portfolio managers are supported by a well-credentialed and experienced sector analyst team, in addition to a quantitative research analyst. Sanders Capital has managed a portion of the fund since 2010.
Vanguard. Vanguard has been managing investments for more than three decades. The Quantitative Equity Group adheres to a sound, disciplined investment management process; the team has considerable experience, stability, and depth. Vanguard has managed a portion of the fund since 1991.
The board concluded that each advisor’s experience, stability, depth, and performance, among other factors, warranted continuation of the advisory arrangements.
Investment performance
The board considered the short- and long-term performance of the fund and each advisor, including any periods of outperformance or underperformance compared with a relevant benchmark index and peer group. The board concluded that the performance was such that the advisory arrangements should continue. Information about the fund’s most recent performance can be found in the Performance Summary section of this report.
Cost
The board concluded that the fund’s expense ratio was well below the average expense ratio charged by funds in its peer group and that the fund’s advisory expense rates were also well below the peer-group average. Information about the fund’s expense ratio appears in the About Your Fund’s Expenses section of this report as well as in the Financial Statements section, which also includes information about the fund’s advisory expense rates.
The board did not consider profitability of Barrow Hanley, Hotchkis and Wiley, Lazard, or Sanders Capital in determining whether to approve the advisory fees, because the firms are independent of Vanguard and the advisory fees are the result of arm’s-length negotiations. The board does not conduct a profitability analysis of Vanguard because of Vanguard’s unique “at-cost” structure. Unlike most other mutual fund management companies, Vanguard is owned by the funds it oversees and produces “profits” only in the form of reduced expenses for fund shareholders.
The benefit of economies of scale
The board concluded that the fund’s shareholders benefit from economies of scale because of breakpoints in the advisory fee schedules for Barrow Hanley, Hotchkis and Wiley, Lazard, and Sanders Capital. The breakpoints reduce the effective rate of the fees as the fund’s assets managed by each advisor increase.
The board also concluded that the fund’s at-cost arrangement with Vanguard ensures that the fund will realize economies of scale as it grows, with the cost to shareholders declining as the fund’s assets managed by Vanguard increase.
The board will consider whether to renew the advisory arrangements again after a one-year period.
31
Glossary
30-Day SEC Yield. A fund’s 30-day SEC yield is derived using a formula specified by the U.S. Securities and Exchange Commission. Under the formula, data related to the fund’s security holdings in the previous 30 days are used to calculate the fund’s hypothetical net income for that period, which is then annualized and divided by the fund’s estimated average net assets over the calculation period. For the purposes of this calculation, a security’s income is based on its current market yield to maturity (for bonds), its actual income (for asset-backed securities), or its projected dividend yield (for stocks). Because the SEC yield represents hypothetical annualized income, it will differ—at times significantly—from the fund’s actual experience. As a result, the fund’s income distributions may be higher or lower than implied by the SEC yield.
Beta. A measure of the magnitude of a fund’s past share-price fluctuations in relation to the ups and downs of a given market index. The index is assigned a beta of 1.00. Compared with a given index, a fund with a beta of 1.20 typically would have seen its share price rise or fall by 12% when the index rose or fell by 10%. For this report, beta is based on returns over the past 36 months for both the fund and the index. Note that a fund’s beta should be reviewed in conjunction with its R-squared (see definition). The lower the R-squared, the less correlation there is between the fund and the index, and the less reliable beta is as an indicator of volatility.
Dividend Yield. Dividend income earned by stocks, expressed as a percentage of the aggregate market value (or of net asset value, for a fund). The yield is determined by dividing the amount of the annual dividends by the aggregate value (or net asset value) at the end of the period. For a fund, the dividend yield is based solely on stock holdings and does not include any income produced by other investments.
Earnings Growth Rate. The average annual rate of growth in earnings over the past five years for the stocks now in a fund.
Equity Exposure. A measure that reflects a fund’s investments in stocks and stock futures. Any holdings in short-term reserves are excluded.
Expense Ratio. A fund’s total annual operating expenses expressed as a percentage of the fund’s average net assets. The expense ratio includes management and administrative expenses, but does not include the transaction costs of buying and selling portfolio securities.
Foreign Holdings. The percentage of a fund represented by securities or depositary receipts of companies based outside the United States.
Inception Date. The date on which the assets of a fund (or one of its share classes) are first invested in accordance with the fund’s investment objective. For funds with a subscription period, the inception date is the day after that period ends. Investment performance is measured from the inception date.
Median Market Cap. An indicator of the size of companies in which a fund invests; the midpoint of market capitalization (market price x shares outstanding) of a fund’s stocks, weighted by the proportion of the fund’s assets invested in each stock. Stocks representing half of the fund’s assets have market capitalizations above the median, and the rest are below it.
Price/Book Ratio. The share price of a stock divided by its net worth, or book value, per share. For a fund, the weighted average price/book ratio of the stocks it holds.
32
Price/Earnings Ratio. The ratio of a stock’s current price to its per-share earnings over the past year. For a fund, the weighted average P/E of the stocks it holds. P/E is an indicator of market expectations about corporate prospects; the higher the P/E, the greater the expectations for a company’s future growth.
R-Squared. A measure of how much of a fund’s past returns can be explained by the returns from the market in general, as measured by a given index. If a fund’s total returns were precisely synchronized with an index’s returns, its R-squared would be 1.00. If the fund’s returns bore no relationship to the index’s returns, its R-squared would be 0. For this report, R-squared is based on returns over the past 36 months for both the fund and the index.
Return on Equity. The annual average rate of return generated by a company during the past five years for each dollar of shareholder’s equity (net income divided by shareholder’s equity). For a fund, the weighted average return on equity for the companies whose stocks it holds.
Short-Term Reserves. The percentage of a fund invested in highly liquid, short-term securities that can be readily converted to cash.
Turnover Rate. An indication of the fund’s trading activity. Funds with high turnover rates incur higher transaction costs and may be more likely to distribute capital gains (which may be taxable to investors). The turnover rate excludes in-kind transactions, which have minimal impact on costs.
33
This page intentionally left blank.
This page intentionally left blank.
The People Who Govern Your Fund
The trustees of your mutual fund are there to see that the fund is operated and managed in your best interests since, as a shareholder, you are a part owner of the fund. Your fund’s trustees also serve on the board of directors of The Vanguard Group, Inc., which is owned by the Vanguard funds and provides services to them on an at-cost basis.
A majority of Vanguard’s board members are independent, meaning that they have no affiliation with Vanguard or the funds they oversee, apart from the sizable personal investments they have made as private individuals. The independent board members have distinguished backgrounds in business, academia, and public service. Each of the trustees and executive officers oversees 197 Vanguard funds.
The following table provides information for each trustee and executive officer of the fund. The mailing address of the trustees and officers is P.O. Box 876, Valley Forge, PA 19482. More information about the trustees is in the Statement of Additional Information, which can be obtained, without charge, by contacting Vanguard at 800-662-7447, or online at vanguard.com.
InterestedTrustee1
F. William McNabb III
Born 1957. Trustee Since July 2009. Chairman of the Board. Principal Occupation(s) During the Past Five Years and Other Experience: Chairman of the Board of The Vanguard Group, Inc., and of each of the investment companies served by The Vanguard Group, since January 2010; Director of The Vanguard Group since 2008; Chief Executive Officer and President of The Vanguard Group, and of each of the investment companies served by The Vanguard Group, since 2008; Director of Vanguard Marketing Corporation; Managing Director of The Vanguard Group (1995–2008).
IndependentTrustees
Emerson U. Fullwood
Born 1948. Trustee Since January 2008. Principal Occupation(s) During the Past Five Years and Other Experience: Executive Chief Staff and Marketing Officer for North America and Corporate Vice President (retired 2008) of Xerox Corporation (document management products and services); Executive in Residence and 2009–2010 Distinguished Minett Professor at the Rochester Institute of Technology; Lead Director of SPX FLOW, Inc. (multi-industry manufacturing); Director of the United Way of Rochester, the University of Rochester Medical Center, Monroe Community College Foundation, North Carolina A&T University, and Roberts Wesleyan College.
Rajiv L. Gupta
Born 1945. Trustee Since December 2001.2 Principal Occupation(s) During the Past Five Years and Other Experience: Chairman and Chief Executive Officer (retired 2009) and President (2006–2008) of Rohm and Haas Co. (chemicals); Director of Arconic Inc. (diversified manufacturer), HP Inc. (printer and personal computer manufacturing), and Delphi Automotive plc (automotive components); Senior Advisor at New Mountain Capital.
Amy Gutmann
Born 1949. Trustee Since June 2006. Principal Occupation(s) During the Past Five Years and Other Experience: President of the University of Pennsylvania; Christopher H. Browne Distinguished Professor of Political Science, School of Arts and Sciences, and Professor of Communication, Annenberg School for Communication, with secondary faculty appointments in the Department of Philosophy, School of Arts and Sciences, and at the Graduate School of Education, University of Pennsylvania; Trustee of the National Constitution Center; Chair of the Presidential Commission for the Study of Bioethical Issues.
JoAnn Heffernan Heisen
Born 1950. Trustee Since July 1998. Principal Occupation(s) During the Past Five Years and Other Experience: Corporate Vice President and Member of the Executive Committee (1997–2008), Chief Global Diversity Officer (retired 2008), Vice President and Chief Information Officer (1997–2005), Controller (1995–1997), Treasurer (1991–1995), and Assistant Treasurer (1989–1991) of Johnson & Johnson (pharmaceuticals/medical devices/consumer products); Director of Skytop Lodge Corporation (hotels) and the Robert Wood Johnson Foundation; Member of the Advisory Board of the Institute for Women’s Leadership at Rutgers University.
F. Joseph Loughrey
Born 1949. Trustee Since October 2009. Principal Occupation(s) During the Past Five Years and Other Experience: President and Chief Operating Officer (retired 2009) of Cummins Inc. (industrial machinery); Chairman of the Board of Hillenbrand, Inc. (specialized consumer services), Oxfam America, and the Lumina Foundation for Education; Director of SKF AB (industrial machinery), Hyster-Yale Materials Handling, Inc. (forklift trucks), and the V Foundation for Cancer Research; Member of the Advisory Council for the College of Arts and Letters and Chair of the Advisory
Board to the Kellogg Institute for International Studies, both at the University of Notre Dame.
Mark Loughridge
Born 1953. Trustee Since March 2012. Principal Occupation(s) During the Past Five Years and Other Experience: Senior Vice President and Chief Financial Officer (retired 2013) at IBM (information technology services); Fiduciary Member of IBM’s Retirement Plan Committee (2004–2013); Director of the Dow Chemical Company; Member of the Council on Chicago Booth.
Scott C. Malpass
Born 1962. Trustee Since March 2012. Principal Occupation(s) During the Past Five Years and Other Experience: Chief Investment Officer and Vice President at the University of Notre Dame; Assistant Professor of Finance at the Mendoza College of Business at Notre Dame; Member of the Notre Dame 403(b) Investment Committee, the Board of Advisors for Spruceview Capital Partners, and the Investment Advisory Committee of Major League Baseball; Board Member of TIFF Advisory Services, Inc., and Catholic Investment Services, Inc. (investment advisors); Member of the Board of Superintendence of the Institute for the Works of Religion.
André F. Perold
Born 1952. Trustee Since December 2004. Principal Occupation(s) During the Past Five Years and Other Experience: George Gund Professor of Finance and Banking, Emeritus at the Harvard Business School (retired 2011); Chief Investment Officer and Co-Managing Partner of HighVista Strategies LLC (private investment firm); Overseer of the Museum of Fine Arts Boston.
Peter F. Volanakis
Born 1955. Trustee Since July 2009. Principal Occupation(s) During the Past Five Years and Other Experience: President and Chief Operating Officer (retired 2010) of Corning Incorporated (communications equipment); Chairman of the Board of Trustees of Colby-Sawyer College; Member of the Board of Hypertherm, Inc. (industrial cutting systems, software, and consumables).
Executive Officers
Glenn Booraem
Born 1967. Investment Stewardship Officer Since February 2017. Principal Occupation(s) During the Past Five Years and Other Experience: Principal of The Vanguard Group, Inc.; Treasurer (2015–2017), Controller (2010–2015), and Assistant Controller (2001–2010) of each of the investment companies served by The Vanguard Group.
Thomas J. Higgins
Born 1957. Chief Financial Officer Since September 2008. Principal Occupation(s) During the Past Five Years and Other Experience: Principal of The Vanguard Group, Inc.; Chief Financial Officer of each of the investment companies served by The Vanguard Group; Treasurer of each of the investment companies served by The Vanguard Group (1998–2008).
Peter Mahoney
Born 1974. Controller Since May 2015. Principal Occupation(s) During the Past Five Years and Other Experience: Principal of The Vanguard Group, Inc.; Controller of each of the investment companies served by The Vanguard Group; Head of International Fund Services at The Vanguard Group (2008–2014).
Anne E. Robinson
Born 1970. Secretary Since September 2016. Principal Occupation(s) During the Past Five Years and Other Experience: Managing Director of The Vanguard Group, Inc.; General Counsel of The Vanguard Group; Secretary of The Vanguard Group and of each of the investment companies served by The Vanguard Group; Director and Senior Vice President of Vanguard Marketing Corporation; Managing Director and General Counsel of Global Cards and Consumer Services at Citigroup (2014–2016); Counsel at American Express (2003–2014).
Michael Rollings
Born 1963. Treasurer Since February 2017. Principal Occupation(s) During the Past Five Years and Other Experience: Managing Director of The Vanguard Group, Inc.; Treasurer of each of the investment companies served by The Vanguard Group; Executive Vice President and Chief Financial Officer of MassMutual Financial Group (2006–2016).
| Vanguard Senior ManagementTeam | |
| Mortimer J. Buckley | James M. Norris |
| John James | Thomas M. Rampulla |
| Martha G. King | Glenn W. Reed |
| John T. Marcante | Karin A. Risi |
| Chris D. McIsaac | |
Chairman Emeritus and Senior Advisor John J. Brennan
Chairman, 1996–2009
Chief Executive Officer and President, 1996–2008
Founder John C. Bogle
Chairman and Chief Executive Officer, 1974–1996
1 Mr. McNabb is considered an “interested person,” as defined in the Investment Company Act of 1940, because he is an officer of the Vanguard funds.
2 December 2002 for Vanguard Equity Income Fund, the Vanguard Municipal Bond Funds, and the Vanguard State Tax-Exempt Funds.
 | |
| P.O. Box 2600 | |
| Valley Forge, PA 19482-2600 | |
| Connect with Vanguard® > vanguard.com | |
| Fund Information > 800-662-7447 | CFA® is a registered trademark owned by CFA Institute. |
| Direct Investor Account Services > 800-662-2739 | |
| Institutional Investor Services > 800-523-1036 | |
| Text Telephone for People | |
| Who Are Deaf or Hard of Hearing> 800-749-7273 | |
| This material may be used in conjunction | |
| with the offering of shares of any Vanguard | |
| fund only if preceded or accompanied by | |
| the fund’s current prospectus. | |
| All comparative mutual fund data are from Lipper, a | |
| Thomson Reuters Company, or Morningstar, Inc., unless | |
| otherwise noted. | |
| You can obtain a free copy of Vanguard’s proxy voting | |
| guidelines by visiting vanguard.com/proxyreporting or by | |
| calling Vanguard at 800-662-2739. The guidelines are | |
| also available from the SEC’s website, sec.gov. In | |
| addition, you may obtain a free report on how your fund | |
| voted the proxies for securities it owned during the 12 | |
| months ended June 30. To get the report, visit either | |
| vanguard.com/proxyreporting or sec.gov. | |
| You can review and copy information about your fund at | |
| the SEC’s Public Reference Room in Washington, D.C. To | |
| find out more about this public service, call the SEC at | |
| 202-551-8090. Information about your fund is also | |
| available on the SEC’s website, and you can receive | |
| copies of this information, for a fee, by sending a | |
| request in either of two ways: via email addressed to | |
| publicinfo@sec.gov or via regular mail addressed to the | |
| Public Reference Section, Securities and Exchange | |
| Commission, Washington, DC 20549-1520. | |
| © 2017 The Vanguard Group, Inc. | |
| All rights reserved. | |
| Vanguard Marketing Corporation, Distributor. | |
| Q732 062017 | |
Item 2: Code of Ethics. The Registrant has adopted a code of ethics that applies to the Registrant’s principal executive officer, principal financial officer, principal accounting officer or controller or persons performing similar functions. The Code of Ethics was amended during the reporting period covered by this report to make certain technical, non-material changes.
Item 3: Audit Committee Financial Expert.
Not Applicable.
Item 4: Principal Accountant Fees and Services.
(a) Audit Fees.
Not Applicable.
Item 5: Audit Committee of Listed Registrants.
Not Applicable.
Item 6: Investments.
Not Applicable.
Item 7: Disclosure of Proxy Voting Policies and Procedures for Closed-End Management Investment Companies.
Not Applicable.
Item 8: Portfolio Managers of Closed-End Management Investment Companies.
Not Applicable.
Item 9: Purchase of Equity Securities by Closed-End Management Investment Company and Affiliated Purchasers.
Not Applicable.
Item 10: Submission of Matters to a Vote of Security Holders.
Not Applicable.
Item 11: Controls and Procedures.
(a) Disclosure Controls and Procedures. The Principal Executive and Financial Officers concluded that the Registrant’s Disclosure Controls and Procedures are effective based on their evaluation of the Disclosure Controls and Procedures as of a date within 90 days of the filing date of this report.
(b) Internal Control Over Financial Reporting. There were no significant changes in Registrant’s Internal Control Over Financial Reporting or in other factors that could significantly affect this control subsequent to the date of the evaluation, including any corrective actions with regard to significant deficiencies and material weaknesses.
Item 12: Exhibits.
(a) Certifications.
Pursuant to the requirements of the Securities Exchange Act of 1934 and the Investment Company Act of 1940, the registrant has duly caused this report to be signed on its behalf by the undersigned, thereunto duly authorized.
| VANGUARD WINDSOR FUNDS | |
| By: | /s/ F. WILLIAM MCNABB III* |
| F. WILLIAM MCNABB III | |
| CHIEF EXECUTIVE OFFICER | |
| Date: June 15, 2017 | |
Pursuant to the requirements of the Securities Exchange Act of 1934 and the Investment Company Act of 1940, this report has been signed below by the following persons on behalf of the registrant and in the capacities and on the dates indicated.
| VANGUARD WINDSOR FUNDS | |
| By: | /s/ F. WILLIAM MCNABB III* |
| F. WILLIAM MCNABB III | |
| CHIEF EXECUTIVE OFFICER | |
| Date: June 15, 2017 | |
| VANGUARD WINDSOR FUNDS | |
| By: | /s/ THOMAS J. HIGGINS* |
| THOMAS J. HIGGINS | |
| CHIEF FINANCIAL OFFICER | |
| Date: June 15, 2017 | |
* By: /s/ Anne E. Robinson
Anne E. Robinson, pursuant to a Power of Attorney filed on October 4, 2016 see file Number
33-32548, Incorporated by Reference.