UNITED STATES
SECURITIES AND EXCHANGE COMMISSION
Washington, D.C. 20549
FORM N-CSR
CERTIFIED SHAREHOLDER REPORT
OF
REGISTERED MANAGEMENT INVESTMENT COMPANIES
Investment Company Act file number: 811-00834
| Name of Registrant: | Vanguard Windsor Funds |
| Address of Registrant: | P.O. Box 2600 |
| Valley Forge, PA 19482 |
| Name and address of agent for service: | Anne E. Robinson, Esquire |
| P.O. Box 876 | |
| Valley Forge, PA 19482 |
Registrant’s telephone number, including area code: (610) 669-1000
Date of fiscal year end: October 31
Date of reporting period: November 1, 2022—October 31, 2023
Item 1: Reports to Shareholders

Your Fund’s Performance at a Glance | 1 |
Advisors' Report | 2 |
About Your Fund’s Expenses | 6 |
Performance Summary | 8 |
Financial Statements | 10 |
| • | For the 12 months ended October 31, 2023, Vanguard Windsor Fund returned 2.99% for Investor Shares and 3.08% for Admiral Shares, well ahead of the 0.13% return of its benchmark, the Russell 1000 Value Index. |
| • | Early on, inflation began to ease off multidecade highs amid aggressive interest rate hikes by central banks. Unexpected resilience in the labor market and consumer spending helped dial back expectations of a sustained recession, but the prospect of higher rates for longer weighed on market sentiment toward the close of the period. |
| • | The broad U.S. stock market, as measured by the Russell 3000 Index, returned 8.38%. Growth stocks outperformed value. By market capitalization, larger stocks fared better than smaller companies on average. |
| • | The advisors’ strong selection drove outperformance relative to the benchmark in all but two sectors. Consumer discretionary and health care contributed most to performance. Financials, the fund’s largest sector, and consumer staples detracted. |
| • | For the decade ended October 31, 2023, the fund’s average annualized return was 8.81% for Investor Shares and 8.91% for Admiral Shares, outpacing the 7.60% return of the fund's benchmark. |
| Average Annual Total Returns Periods Ended October 31, 2023 | |||
| One Year | Three Years | Five Years | |
| Stocks | |||
| Russell 1000 Index (Large-caps) | 9.48% | 9.53% | 10.71% |
| Russell 2000 Index (Small-caps) | -8.56 | 3.95 | 3.31 |
| Russell 3000 Index (Broad U.S. market) | 8.38 | 9.19 | 10.23 |
| FTSE All-World ex US Index (International) | 12.35 | 3.51 | 3.88 |
| Bonds | |||
| Bloomberg U.S. Aggregate Float Adjusted Index (Broad taxable market) | 0.53% | -5.51% | 0.03% |
| Bloomberg Municipal Bond Index (Broad tax-exempt market) | 2.64 | -2.48 | 1.00 |
| FTSE Three-Month U.S. Treasury Bill Index | 4.94 | 1.93 | 1.80 |
| CPI | |||
| Consumer Price Index | 3.24% | 5.72% | 4.00% |
| Fund Assets Managed | |||
| Investment Advisor | % | $ Million | Investment Strategy |
| Wellington Management Company llp | 69 | 14,718 | Seeks to provide long-term total returns above both the S&P 500 and value-oriented indexes over a complete market cycle through bottom-up, fundamentally driven stock selection focused on undervalued securities. |
| Pzena Investment Management, LLC | 30 | 6,247 | Uses a fundamental, bottom-up, deep-value-oriented investment strategy. Seeks to buy good businesses at low prices, focusing exclusively on companies that are underperforming their historically demonstrated earnings power. |
| Cash Investments | 1 | 262 | These short-term reserves are invested by Vanguard in equity index products to simulate investment in stocks. Each advisor may also maintain a modest cash position. |
| • | Based on actual fund return. This section helps you to estimate the actual expenses that you paid over the period. The ”Ending Account Value“ shown is derived from the fund‘s actual return, and the third column shows the dollar amount that would have been paid by an investor who started with $1,000 in the fund. You may use the information here, together with the amount you invested, to estimate the expenses that you paid over the period. |
| • | Based on hypothetical 5% yearly return. This section is intended to help you compare your fund‘s costs with those of other mutual funds. It assumes that the fund had a yearly return of 5% before expenses, but that the expense ratio is unchanged. In this case—because the return used is not the fund’s actual return—the results do not apply to your investment. The example is useful in making comparisons because the Securities and Exchange Commission requires all mutual funds to calculate expenses based on a 5% return. You can assess your fund’s costs by comparing this hypothetical example with the hypothetical examples that appear in shareholder reports of other funds. |
| Six Months Ended October 31, 2023 | |||
| Beginning Account Value 4/30/2023 | Ending Account Value 10/31/2023 | Expenses Paid During Period | |
| Based on Actual Fund Return | |||
| Windsor Fund | |||
| Investor Shares | $1,000.00 | $960.60 | $2.08 |
| Admiral™ Shares | 1,000.00 | 960.80 | 1.58 |
| Based on Hypothetical 5% Yearly Return | |||
| Windsor Fund | |||
| Investor Shares | $1,000.00 | $1,023.09 | $2.14 |
| Admiral Shares | 1,000.00 | 1,023.59 | 1.63 |

| Average Annual Total Returns Periods Ended October 31, 2023 | |||||
| One Year | Five Years | Ten Years | Final Value of a $10,000 Investment | ||
 | Windsor Fund Investor Shares | 2.99% | 10.06% | 8.81% | $23,256 |
 | Russell 1000 Value Index | 0.13 | 6.60 | 7.60 | 20,799 |
 | Dow Jones U.S. Total Stock Market Float Adjusted Index | 8.39 | 10.10 | 10.43 | 26,967 |
| One Year | Five Years | Ten Years | Final Value of a $50,000 Investment | ||
| Windsor Fund Admiral Shares | 3.08% | 10.16% | 8.91% | $117,408 | |
| Russell 1000 Value Index | 0.13 | 6.60 | 7.60 | 103,994 | |
| Dow Jones U.S. Total Stock Market Float Adjusted Index | 8.39 | 10.10 | 10.43 | 134,835 | |
| Communication Services | 5.4% |
| Consumer Discretionary | 7.7 |
| Consumer Staples | 6.4 |
| Energy | 7.7 |
| Financials | 21.5 |
| Health Care | 16.5 |
| Industrials | 11.9 |
| Information Technology | 8.7 |
| Materials | 4.8 |
| Real Estate | 3.8 |
| Utilities | 5.6 |
| Shares | Market Value• ($000) | ||
| Common Stocks (97.5%) | |||
| Communication Services (5.3%) | |||
| * | Alphabet Inc. Class A | 2,645,309 | 328,230 |
| * | Charter Communications Inc. Class A | 677,369 | 272,844 |
| * | T-Mobile US Inc. | 1,095,279 | 157,567 |
| Electronic Arts Inc. | 1,034,148 | 128,017 | |
| * | Match Group Inc. | 3,687,627 | 127,592 |
| * | Walt Disney Co. | 1,085,277 | 88,548 |
| Cable One Inc. | 27,968 | 15,379 | |
| 1,118,177 | |||
| Consumer Discretionary (7.5%) | |||
| Lear Corp. | 1,381,940 | 179,320 | |
| Gildan Activewear Inc. | 6,139,590 | 174,426 | |
| Magna International Inc. | 3,499,754 | 168,303 | |
| Wyndham Hotels & Resorts Inc. | 2,199,499 | 159,244 | |
| BYD Co. Ltd. Class H | 4,160,000 | 126,506 | |
| PVH Corp. | 1,588,525 | 118,107 | |
| Lennar Corp. Class A | 1,014,967 | 108,277 | |
| Ross Stores Inc. | 846,500 | 98,168 | |
| * | Mohawk Industries Inc. | 1,060,308 | 85,227 |
| Newell Brands Inc. | 11,866,202 | 79,741 | |
| * | Airbnb Inc. Class A | 578,763 | 68,462 |
| * | CarMax Inc. | 1,053,654 | 64,368 |
| * | Booking Holdings Inc. | 21,808 | 60,835 |
| Las Vegas Sands Corp. | 1,186,613 | 56,317 | |
| * | Skechers USA Inc. Class A | 814,984 | 39,298 |
| 1,586,599 | |||
| Consumer Staples (6.3%) | |||
| Tyson Foods Inc. Class A | 6,542,010 | 303,222 | |
| Kenvue Inc. | 14,650,378 | 272,497 | |
| Unilever plc (XLON) | 4,553,281 | 215,646 | |
| * | Dollar Tree Inc. | 1,788,384 | 198,672 |
| Philip Morris International Inc. | 2,050,335 | 182,808 | |
| Sysco Corp. | 2,360,888 | 156,975 | |
| 1,329,820 | |||
| Energy (7.5%) | |||
| Schlumberger NV | 6,070,947 | 337,909 | |
| Canadian Natural Resources Ltd. | 3,827,835 | 243,182 | |
| Shell plc ADR | 2,806,534 | 182,818 | |
| Halliburton Co. | 4,646,577 | 182,796 | |
| ConocoPhillips | 1,484,414 | 176,349 | |
| Shares | Market Value• ($000) | ||
| Diamondback Energy Inc. | 1,042,129 | 167,074 | |
| Enbridge Inc. | 4,661,632 | 149,387 | |
| NOV Inc. | 4,383,136 | 87,488 | |
| Exxon Mobil Corp. | 578,725 | 61,258 | |
| 1,588,261 | |||
| Financials (20.9%) | |||
| MetLife Inc. | 6,112,472 | 366,810 | |
| Chubb Ltd. | 1,689,228 | 362,542 | |
| Equitable Holdings Inc. | 13,577,338 | 360,750 | |
| Voya Financial Inc. | 4,718,570 | 315,059 | |
| Allstate Corp. | 2,329,353 | 298,460 | |
| Raymond James Financial Inc. | 2,398,600 | 228,922 | |
| M&T Bank Corp. | 1,823,170 | 205,562 | |
| American International Group Inc. | 3,141,758 | 192,621 | |
| Charles Schwab Corp. | 3,665,846 | 190,771 | |
| New York Community Bancorp Inc. | 20,101,100 | 190,559 | |
| Capital One Financial Corp. | 1,761,259 | 178,398 | |
| Wells Fargo & Co. | 4,481,987 | 178,249 | |
| Globe Life Inc. | 1,529,928 | 178,022 | |
| JPMorgan Chase & Co. | 1,265,602 | 175,995 | |
| Bank of America Corp. | 6,677,685 | 175,890 | |
| S&P Global Inc. | 467,496 | 163,301 | |
| Citigroup Inc. | 4,035,906 | 159,378 | |
| * | FleetCor Technologies Inc. | 642,726 | 144,723 |
| Global Payments Inc. | 1,097,881 | 116,617 | |
| Goldman Sachs Group Inc. | 328,699 | 99,796 | |
| UBS Group AG (Registered) | 4,155,129 | 97,479 | |
| Morgan Stanley | 720,717 | 51,041 | |
| Invesco Ltd. | 852,369 | 11,055 | |
| 4,442,000 | |||
| Health Care (16.1%) | |||
| Pfizer Inc. | 13,911,049 | 425,122 | |
| AstraZeneca plc ADR | 3,944,458 | 249,408 | |
| * | Centene Corp. | 3,521,500 | 242,913 |
| Quest Diagnostics Inc. | 1,743,845 | 226,874 | |
| Humana Inc. | 424,091 | 222,092 | |
| UnitedHealth Group Inc. | 407,027 | 217,987 | |
| Novartis AG (Registered) | 2,068,196 | 193,624 | |
| Baxter International Inc. | 5,535,528 | 179,517 | |
| Shares | Market Value• ($000) | ||
| Agilent Technologies Inc. | 1,490,024 | 154,024 | |
| Medtronic plc | 2,087,089 | 147,265 | |
| 1 | Fresenius Medical Care AG & Co. KGaA ADR | 8,204,589 | 136,442 |
| * | United Therapeutics Corp. | 540,969 | 120,560 |
| DENTSPLY SIRONA Inc. | 3,928,853 | 119,476 | |
| Bristol-Myers Squibb Co. | 2,252,679 | 116,081 | |
| Teleflex Inc. | 517,562 | 95,620 | |
| Cigna Group | 298,096 | 92,171 | |
| Johnson & Johnson | 616,171 | 91,403 | |
| Encompass Health Corp. | 1,395,986 | 87,333 | |
| Elevance Health Inc. | 186,825 | 84,088 | |
| Cardinal Health Inc. | 885,987 | 80,625 | |
| * | Avantor Inc. | 4,219,494 | 73,546 |
| McKesson Corp. | 95,396 | 43,440 | |
| * | Sandoz Group AG | 418,623 | 10,884 |
| CVS Health Corp. | 22,770 | 1,571 | |
| 3,412,066 | |||
| Industrials (11.6%) | |||
| Westinghouse Air Brake Technologies Corp. | 3,840,974 | 407,220 | |
| Leidos Holdings Inc. | 3,165,350 | 313,749 | |
| RTX Corp. | 2,963,951 | 241,236 | |
| General Dynamics Corp. | 893,822 | 215,688 | |
| Knight-Swift Transportation Holdings Inc. | 3,994,198 | 195,276 | |
| SS&C Technologies Holdings Inc. | 3,635,214 | 182,670 | |
| * | AerCap Holdings NV | 2,846,469 | 176,823 |
| Techtronic Industries Co. Ltd. | 16,077,250 | 146,778 | |
| General Electric Co. | 1,242,188 | 134,939 | |
| Airbus SE | 875,693 | 117,410 | |
| Dover Corp. | 886,482 | 115,198 | |
| Genpact Ltd. | 2,880,725 | 96,620 | |
| * | Middleby Corp. | 670,359 | 75,663 |
| Toro Co. | 651,082 | 52,633 | |
| 2,471,903 | |||
| Information Technology (8.5%) | |||
| Micron Technology Inc. | 4,006,877 | 267,940 | |
| QUALCOMM Inc. | 2,046,189 | 223,014 | |
| NXP Semiconductors NV | 1,204,176 | 207,636 | |
| Cognizant Technology Solutions Corp. Class A | 3,081,529 | 198,666 | |
| Seagate Technology Holdings plc | 2,699,319 | 184,228 | |
| * | Salesforce Inc. | 871,272 | 174,978 |
| Amdocs Ltd. | 1,630,266 | 130,682 | |
| Microsoft Corp. | 385,896 | 130,475 | |
| TE Connectivity Ltd. | 1,059,573 | 124,871 | |
| * | Zebra Technologies Corp. Class A | 251,897 | 52,755 |
| Samsung Electronics Co. Ltd. (XKRX) | 912,419 | 45,416 | |
| Juniper Networks Inc. | 1,231,241 | 33,145 | |
| Cisco Systems Inc. | 556,397 | 29,005 | |
| 1,802,811 | |||
| Shares | Market Value• ($000) | ||
| Materials (4.6%) | |||
| Rio Tinto plc ADR | 3,405,114 | 219,085 | |
| Dow Inc. | 3,814,708 | 184,403 | |
| Reliance Steel & Aluminum Co. | 631,347 | 160,602 | |
| PPG Industries Inc. | 1,274,398 | 156,458 | |
| CRH plc (SGMX) | 2,775,575 | 148,956 | |
| FMC Corp. | 2,164,526 | 115,153 | |
| 984,657 | |||
| Real Estate (3.8%) | |||
| American Tower Corp. | 1,519,200 | 270,706 | |
| Equinix Inc. | 229,847 | 167,706 | |
| UDR Inc. | 4,407,077 | 140,189 | |
| AvalonBay Communities Inc. | 668,187 | 110,745 | |
| Extra Space Storage Inc. | 789,347 | 81,769 | |
| * | CBRE Group Inc. Class A | 384,588 | 26,667 |
| 797,782 | |||
| Utilities (5.4%) | |||
| Edison International | 6,297,054 | 397,092 | |
| Exelon Corp. | 6,675,961 | 259,962 | |
| Duke Energy Corp. | 2,301,719 | 204,600 | |
| Iberdrola SA (XMAD) | 17,234,752 | 191,685 | |
| AES Corp. | 6,737,731 | 100,392 | |
| 1,153,731 | |||
| Total Common Stocks (Cost $19,124,786) | 20,687,807 | ||
| Temporary Cash Investments (2.5%) | |||
| Money Market Fund (1.9%) | |||
| 2,3 | Vanguard Market Liquidity Fund, 5.420% | 4,077,826 | 407,742 |
| Face Amount ($000) | |||
| Repurchase Agreements (0.6%) | |||
| Bank of America Securities, LLC 5.300%, 11/1/23 (Dated 10/31/23, Repurchase Value $120,118,000, collateralized by Ginnie Mae 4.500%–5.500%, 5/20/53–9/20/53, with a value of $122,502,000) | 120,100 | 120,100 | |
| Face Amount ($000) | Market Value• ($000) | ||
| JP Morgan Securities LLC 5.290%, 11/1/23 (Dated 10/31/23, Repurchase Value $15,002,000, collateralized by U.S. Treasury Bill 0.000%, 1/2/24, and U.S. Treasury Note/Bond 1.500%–4.625%, 2/15/25–9/30/28, with a value of $15,300,000) | 15,000 | 15,000 | |
| 135,100 | |||
| Total Temporary Cash Investments (Cost $542,794) | 542,842 | ||
| Total Investments (100.0%) (Cost $19,667,580) | 21,230,649 | ||
| Other Assets and Liabilities—Net (0.0%) | (3,753) | ||
| Net Assets (100%) | 21,226,896 | ||
| Cost is in $000. | |||
| • | See Note A in Notes to Financial Statements. |
| * | Non-income-producing security. |
| 1 | Includes partial security positions on loan to broker-dealers. The total value of securities on loan is $24,326,000. |
| 2 | Affiliated money market fund available only to Vanguard funds and certain trusts and accounts managed by Vanguard. Rate shown is the 7-day yield. |
| 3 | Collateral of $26,330,000 was received for securities on loan, of which $24,961,000 is held in Vanguard Market Liquidity Fund and $1,369,000 is held in cash. |
| ADR—American Depositary Receipt. |
| Futures Contracts | ||||
| ($000) | ||||
| Expiration | Number of Long (Short) Contracts | Notional Amount | Value and Unrealized Appreciation (Depreciation) | |
| Long Futures Contracts | ||||
| E-mini S&P 500 Index | December 2023 | 1,253 | 263,897 | (8,586) |
| ($000s, except shares, footnotes, and per-share amounts) | Amount |
| Assets | |
| Investments in Securities, at Value1 | |
| Unaffiliated Issuers (Cost $19,259,886) | 20,822,907 |
| Affiliated Issuers (Cost $407,694) | 407,742 |
| Total Investments in Securities | 21,230,649 |
| Investment in Vanguard | 766 |
| Cash | 3,229 |
| Cash Collateral Pledged—Futures Contracts | 14,373 |
| Foreign Currency, at Value (Cost $581) | 611 |
| Receivables for Investment Securities Sold | 108,303 |
| Receivables for Accrued Income | 9,850 |
| Receivables for Capital Shares Issued | 4,033 |
| Variation Margin Receivable—Futures Contracts | 1,699 |
| Total Assets | 21,373,513 |
| Liabilities | |
| Payables for Investment Securities Purchased | 96,215 |
| Collateral for Securities on Loan | 26,330 |
| Payables to Investment Advisor | 10,900 |
| Payables for Capital Shares Redeemed | 11,692 |
| Payables to Vanguard | 1,480 |
| Total Liabilities | 146,617 |
| Net Assets | 21,226,896 |
| 1 Includes $24,326,000 of securities on loan. | |
| At October 31, 2023, net assets consisted of: | |
| Paid-in Capital | 18,123,101 |
| Total Distributable Earnings (Loss) | 3,103,795 |
| Net Assets | 21,226,896 |
| Investor Shares—Net Assets | |
| Applicable to 222,867,356 outstanding $.001 par value shares of beneficial interest (unlimited authorization) | 4,505,663 |
| Net Asset Value Per Share—Investor Shares | $20.22 |
| Admiral Shares—Net Assets | |
| Applicable to 245,285,260 outstanding $.001 par value shares of beneficial interest (unlimited authorization) | 16,721,233 |
| Net Asset Value Per Share—Admiral Shares | $68.17 |
| Year Ended October 31, 2023 | |
| ($000) | |
| Investment Income | |
| Income | |
| Dividends—Unaffiliated Issuers1 | 454,655 |
| Dividends—Affiliated Issuers | 4,814 |
| Interest—Unaffiliated Issuers | 10,025 |
| Interest—Affiliated Issuers | 17,932 |
| Securities Lending—Net | 889 |
| Total Income | 488,315 |
| Expenses | |
| Investment Advisory Fees—Note B | |
| Basic Fee | 28,430 |
| Performance Adjustment | 14,998 |
| The Vanguard Group—Note C | |
| Management and Administrative—Investor Shares | 10,646 |
| Management and Administrative—Admiral Shares | 22,333 |
| Marketing and Distribution—Investor Shares | 207 |
| Marketing and Distribution—Admiral Shares | 604 |
| Custodian Fees | 126 |
| Auditing Fees | 44 |
| Shareholders’ Reports—Investor Shares | 101 |
| Shareholders’ Reports—Admiral Shares | 91 |
| Trustees’ Fees and Expenses | 13 |
| Other Expenses | 23 |
| Total Expenses | 77,616 |
| Expenses Paid Indirectly | (63) |
| Net Expenses | 77,553 |
| Net Investment Income | 410,762 |
| Realized Net Gain (Loss) | |
| Capital Gains Distributions Received – Affiliated Issuers | 1 |
| Investment Securities Sold—Unaffiliated Issuers | 1,485,447 |
| Investment Securities Sold—Affiliated Issuers | (147) |
| Futures Contracts | (5,298) |
| Foreign Currencies | 194 |
| Realized Net Gain (Loss) | 1,480,197 |
| Change in Unrealized Appreciation (Depreciation) | |
| Investment Securities—Unaffiliated Issuers | (1,171,457) |
| Investment Securities—Affiliated Issuers | (7,619) |
| Futures Contracts | (7,442) |
| Foreign Currencies | 160 |
| Change in Unrealized Appreciation (Depreciation) | (1,186,358) |
| Net Increase (Decrease) in Net Assets Resulting from Operations | 704,601 |
| 1 | Dividends are net of foreign withholding taxes of $6,799,000. |
| Year Ended October 31, | ||
| 2023 ($000) | 2022 ($000) | |
| Increase (Decrease) in Net Assets | ||
| Operations | ||
| Net Investment Income | 410,762 | 367,905 |
| Realized Net Gain (Loss) | 1,480,197 | 2,841,659 |
| Change in Unrealized Appreciation (Depreciation) | (1,186,358) | (3,898,670) |
| Net Increase (Decrease) in Net Assets Resulting from Operations | 704,601 | (689,106) |
| Distributions | ||
| Investor Shares | (649,432) | (588,332) |
| Admiral Shares | (2,398,871) | (1,942,815) |
| Total Distributions | (3,048,303) | (2,531,147) |
| Capital Share Transactions | ||
| Investor Shares | 210,390 | (200,936) |
| Admiral Shares | 1,264,284 | 1,248,509 |
| Net Increase (Decrease) from Capital Share Transactions | 1,474,674 | 1,047,573 |
| Total Increase (Decrease) | (869,028) | (2,172,680) |
| Net Assets | ||
| Beginning of Period | 22,095,924 | 24,268,604 |
| End of Period | 21,226,896 | 22,095,924 |
| Investor Shares | |||||
| For a Share Outstanding Throughout Each Period | Year Ended October 31, | ||||
| 2023 | 2022 | 2021 | 2020 | 2019 | |
| Net Asset Value, Beginning of Period | $22.74 | $26.24 | $18.55 | $21.76 | $22.02 |
| Investment Operations | |||||
| Net Investment Income1 | .371 | .359 | .356 | .408 | .419 |
| Net Realized and Unrealized Gain (Loss) on Investments | .236 | (1.131) | 9.122 | (1.412) | 1.700 |
| Total from Investment Operations | .607 | (.772) | 9.478 | (1.004) | 2.119 |
| Distributions | |||||
| Dividends from Net Investment Income | (.358) | (.330) | (.411) | (.420) | (.426) |
| Distributions from Realized Capital Gains | (2.769) | (2.398) | (1.377) | (1.786) | (1.953) |
| Total Distributions | (3.127) | (2.728) | (1.788) | (2.206) | (2.379) |
| Net Asset Value, End of Period | $20.22 | $22.74 | $26.24 | $18.55 | $21.76 |
| Total Return2 | 2.99% | -2.97% | 53.49% | -5.64% | 11.59% |
| Ratios/Supplemental Data | |||||
| Net Assets, End of Period (Millions) | $4,506 | $4,796 | $5,728 | $4,570 | $4,549 |
| Ratio of Total Expenses to Average Net Assets3 | 0.42%4 | 0.38%4 | 0.30% | 0.29% | 0.30% |
| Ratio of Net Investment Income to Average Net Assets | 1.74% | 1.51% | 1.49% | 2.14% | 2.04% |
| Portfolio Turnover Rate | 42% | 43% | 33% | 51% | 39% |
| 1 | Calculated based on average shares outstanding. |
| 2 | Total returns do not include account service fees that may have applied in the periods shown. Fund prospectuses provide information about any applicable account service fees. |
| 3 | Includes performance-based investment advisory fee increases (decreases) of 0.07%, 0.03%, (0.05%), (0.07%), and (0.05%). |
| 4 | The ratio of expenses to average net assets for the period net of reduction from broker commission abatement arrangements was 0.42% and 0.38%, respectively. |
| Admiral Shares | |||||
| For a Share Outstanding Throughout Each Period | Year Ended October 31, | ||||
| 2023 | 2022 | 2021 | 2020 | 2019 | |
| Net Asset Value, Beginning of Period | $76.67 | $88.50 | $62.58 | $73.41 | $74.29 |
| Investment Operations | |||||
| Net Investment Income1 | 1.323 | 1.281 | 1.278 | 1.448 | 1.484 |
| Net Realized and Unrealized Gain (Loss) on Investments | .794 | (3.820) | 30.747 | (4.770) | 5.735 |
| Total from Investment Operations | 2.117 | (2.539) | 32.025 | (3.322) | 7.219 |
| Distributions | |||||
| Dividends from Net Investment Income | (1.281) | (1.203) | (1.460) | (1.485) | (1.509) |
| Distributions from Realized Capital Gains | (9.336) | (8.088) | (4.645) | (6.023) | (6.590) |
| Total Distributions | (10.617) | (9.291) | (6.105) | (7.508) | (8.099) |
| Net Asset Value, End of Period | $68.17 | $76.67 | $88.50 | $62.58 | $73.41 |
| Total Return2 | 3.08% | -2.89% | 53.60% | -5.55% | 11.71% |
| Ratios/Supplemental Data | |||||
| Net Assets, End of Period (Millions) | $16,721 | $17,300 | $18,541 | $12,695 | $14,647 |
| Ratio of Total Expenses to Average Net Assets3 | 0.32%4 | 0.28%4 | 0.20% | 0.19% | 0.20% |
| Ratio of Net Investment Income to Average Net Assets | 1.84% | 1.61% | 1.58% | 2.24% | 2.14% |
| Portfolio Turnover Rate | 42% | 43% | 33% | 51% | 39% |
| 1 | Calculated based on average shares outstanding. |
| 2 | Total returns do not include account service fees that may have applied in the periods shown. Fund prospectuses provide information about any applicable account service fees. |
| 3 | Includes performance-based investment advisory fee increases (decreases) of 0.07%, 0.03%, (0.05%), (0.07%), and (0.05%). |
| 4 | The ratio of expenses to average net assets for the period net of reduction from broker commission abatement arrangements was 0.32% and 0.28%, respectively. |
| A. | The following significant accounting policies conform to generally accepted accounting principles for U.S. investment companies. The fund consistently follows such policies in preparing its financial statements. |
| B. | The investment advisory firms Wellington Management Company llp and Pzena Investment Management, LLC, each provide investment advisory services to a portion of the fund for a fee calculated at an annual percentage rate of average net assets managed by the advisor. The basic fee of Wellington Management Company llp is subject to quarterly adjustments based on performance relative to the S&P 500 Index for the preceding three years. The basic fee of Pzena Investment Management, LLC, is subject to quarterly adjustments based on performance relative to the Russell 1000 Value Index for the preceding three years. |
| C. | In accordance with the terms of a Funds' Service Agreement (the “FSA”) between Vanguard and the fund, Vanguard furnishes to the fund corporate management, administrative, marketing, distribution and cash management services at Vanguard’s cost of operations (as defined by the FSA). These costs of operations are allocated to the fund based on methods and guidelines approved by the board of trustees and are generally settled twice a month. |
| D. | The fund has asked its investment advisors to direct certain security trades, subject to obtaining the best price and execution, to brokers who have agreed to rebate to the fund part of the commissions generated. Such rebates are used solely to reduce the fund’s management and administrative expenses. For the year ended October 31, 2023, these arrangements reduced the fund’s expenses by $63,000 (an annual rate of less than 0.01% of average net assets). |
| E. | Various inputs may be used to determine the value of the fund’s investments and derivatives. These inputs are summarized in three broad levels for financial statement purposes. The inputs or methodologies used to value securities are not necessarily an indication of the risk associated with investing in those securities. |
| Level 1 ($000) | Level 2 ($000) | Level 3 ($000) | Total ($000) | |
| Investments | ||||
| Assets | ||||
| Common Stocks | 19,490,902 | 1,196,905 | — | 20,687,807 |
| Temporary Cash Investments | 407,742 | 135,100 | — | 542,842 |
| Total | 19,898,644 | 1,332,005 | — | 21,230,649 |
| Derivative Financial Instruments | ||||
| Liabilities | ||||
| Futures Contracts1 | 8,586 | — | — | 8,586 |
| 1 | Includes cumulative appreciation (depreciation) on futures contracts and centrally cleared swaps, if any, as reported in the Schedule of Investments. Only current day’s variation margin is reported within the Statement of Assets and Liabilities. |
| F. | Permanent differences between book-basis and tax-basis components of net assets are reclassified among capital accounts in the financial statements to reflect their tax character. These reclassifications have no effect on net assets or net asset value per share. As of period end, permanent differences primarily attributable to the accounting for applicable foreign currency transactions and distributions in connection with fund share redemptions were reclassified between the following accounts: |
| Amount ($000) | |
| Paid-in Capital | 72,700 |
| Total Distributable Earnings (Loss) | (72,700) |
| Amount ($000) | |
| Undistributed Ordinary Income | 683,925 |
| Undistributed Long-Term Gains | 881,656 |
| Net Unrealized Gains (Losses) | 1,538,214 |
| Capital Loss Carryforwards | — |
| Qualified Late-Year Losses | — |
| Other Temporary Differences | — |
| Total | 3,103,795 |
| Year Ended October 31, | ||
| 2023 Amount ($000) | 2022 Amount ($000) | |
| Ordinary Income* | 392,789 | 1,036,600 |
| Long-Term Capital Gains | 2,655,514 | 1,494,547 |
| Total | 3,048,303 | 2,531,147 |
| * | Includes short-term capital gains, if any. |
| Amount ($000) | |
| Tax Cost | 19,692,504 |
| Gross Unrealized Appreciation | 3,493,101 |
| Gross Unrealized Depreciation | (1,954,956) |
| Net Unrealized Appreciation (Depreciation) | 1,538,145 |
| G. | During the year ended October 31, 2023, the fund purchased $9,279,548,000 of investment securities and sold $10,403,949,000 of investment securities, other than temporary cash investments. |
| H. | Capital share transactions for each class of shares were: |
| Year Ended October 31, | |||||
| 2023 | 2022 | ||||
| Amount ($000) | Shares (000) | Amount ($000) | Shares (000) | ||
| Investor Shares | |||||
| Issued | 245,400 | 11,408 | 368,905 | 15,354 | |
| Issued in Lieu of Cash Distributions | 625,596 | 31,412 | 568,128 | 24,748 | |
| Redeemed | (660,606) | (30,875) | (1,137,969) | (47,478) | |
| Net Increase (Decrease)—Investor Shares | 210,390 | 11,945 | (200,936) | (7,376) | |
| Admiral Shares | |||||
| Issued | 1,004,026 | 13,860 | 1,376,749 | 17,029 | |
| Issued in Lieu of Cash Distributions | 2,221,690 | 33,084 | 1,801,699 | 23,298 | |
| Redeemed | (1,961,432) | (27,312) | (1,929,939) | (24,172) | |
| Net Increase (Decrease)—Admiral Shares | 1,264,284 | 19,632 | 1,248,509 | 16,155 | |
| I. | Certain of the fund’s investments are in companies that are considered to be affiliated companies of the fund because the fund owns more than 5% of the outstanding voting securities of the company or the issuer is another member of The Vanguard Group. Transactions during the period in securities of these companies were as follows: |
| Current Period Transactions | ||||||||
| Oct. 31, 2022 Market Value ($000) | Purchases at Cost ($000) | Proceeds from Securities Sold ($000) | Realized Net Gain (Loss) ($000) | Change in Unrealized App. (Dep.) ($000) | Income ($000) | Capital Gain Distributions Received ($000) | Oct. 31, 2023 Market Value ($000) | |
| Vanguard Market Liquidity Fund | 366,607 | NA1 | NA1 | 39 | (3) | 17,932 | 1 | 407,742 |
| Voya Financial Inc. | 336,421 | — | 13,560 | (186) | (7,616) | 4,814 | — | NA2 |
| Total | 703,028 | — | 13,560 | (147) | (7,619) | 22,746 | 1 | 407,742 |
| 1 | Not applicable—purchases and sales are for temporary cash investment purposes. |
| 2 | Not applicable—at October 31, 2023, the security was still held, but the issuer was no longer an affiliated company of the fund. |
| J. | Significant market disruptions, such as those caused by pandemics (e.g., COVID-19 pandemic), natural or environmental disasters, war (e.g., Russia’s invasion of Ukraine), acts of terrorism, or other events, can adversely affect local and global markets and normal market operations. Any such disruptions could have an adverse impact on the value of the fund’s investments and fund performance. |
| K. | Management has determined that no other events or transactions occurred subsequent to October 31, 2023, that would require recognition or disclosure in these financial statements. |
Philadelphia, Pennsylvania
December 19, 2023
| Matthew Benchener | Thomas M. Rampulla |
| Joseph Brennan | Karin A. Risi |
| Mortimer J. Buckley | Anne E. Robinson |
| Gregory Davis | Michael Rollings |
| John James | Nitin Tandon |
| Chris D. Mclsaac | Lauren Valente |

All rights reserved.
Vanguard Marketing Corporation, Distributor.

Your Fund’s Performance at a Glance | 1 |
Advisors' Report | 2 |
About Your Fund’s Expenses | 6 |
Performance Summary | 8 |
Financial Statements | 10 |
| • | For the 12 months ended October 31, 2023, Vanguard Windsor II Fund returned 7.02% for Investor Shares and 7.09% for Admiral Shares, well ahead of the 0.13% return of its benchmark, the Russell 1000 Value Index. |
| • | Early on, inflation began to ease off multidecade highs amid aggressive interest rate hikes by the central banks. Unexpected resilience in the labor market and consumer spending helped dial back expectations of a sustained recession, but the prospect of higher rates for longer weighed on market sentiment toward the close of the period. |
| • | The broad U.S. stock market, as measured by the Russell 3000 Index, returned 8.38%. Growth stocks outperformed value. By market capitalization, larger stocks fared better than smaller companies on average. |
| • | Information technology, the fund’s largest sector, aided performance most with strong selection and an overweight allocation relative to the benchmark. Consumer discretionary also was a net contributor. Materials and consumer staples were the only sectors to detract from performance. |
| • | For the decade ended October 31, 2023, the fund’s average annualized return was 9.14% for Investor Shares and 9.22% for Admiral Shares, outpacing the 7.60% return of the fund's benchmark. |
| Average Annual Total Returns Periods Ended October 31, 2023 | |||
| One Year | Three Years | Five Years | |
| Stocks | |||
| Russell 1000 Index (Large-caps) | 9.48% | 9.53% | 10.71% |
| Russell 2000 Index (Small-caps) | -8.56 | 3.95 | 3.31 |
| Russell 3000 Index (Broad U.S. market) | 8.38 | 9.19 | 10.23 |
| FTSE All-World ex US Index (International) | 12.35 | 3.51 | 3.88 |
| Bonds | |||
| Bloomberg U.S. Aggregate Float Adjusted Index (Broad taxable market) | 0.53% | -5.51% | 0.03% |
| Bloomberg Municipal Bond Index (Broad tax-exempt market) | 2.64 | -2.48 | 1.00 |
| FTSE Three-Month U.S. Treasury Bill Index | 4.94 | 1.93 | 1.80 |
| CPI | |||
| Consumer Price Index | 3.24% | 5.72% | 4.00% |
| • | Compounders: These are companies our analysis indicates can sustain very high |
| • | Improvers: We believe that companies can improve returns, but investors often are too optimistic about the probability of success. Our research indicates that companies that improve their returns on capital materially outperform the broad market. We typically invest 20% to 40% of our capital in such improvers. |
| Fund Assets Managed | |||
| Investment Advisor | % | $ Million | Investment Strategy |
| Lazard Asset Management LLC | 36 | 18,337 | Employs a relative-value approach that seeks a combination of attractive valuation and high financial productivity. The process is research-driven, relying upon bottom-up stock analysis performed by the firm’s global sector analysts. |
| Hotchkis and Wiley Capital Management LLC | 22 | 10,888 | Uses a disciplined investment approach, focusing on such investment parameters as a company’s tangible assets, sustainable cash flow, and potential for improving business performance. |
| Sanders Capital, LLC | 21 | 10,488 | Employs a traditional, bottom-up, fundamental research approach to identifying securities that are undervalued relative to their expected total return. |
| Aristotle Capital Management, LLC | 20 | 9,920 | Employs a fundamental, bottom-up security selection process focused on quality companies with attractive valuations and compelling catalysts. |
| Cash Investments | 1 | 677 | These short-term reserves are invested by Vanguard in equity index products to simulate investment in stocks. Each advisor may also maintain a modest cash position. |
| • | Based on actual fund return. This section helps you to estimate the actual expenses that you paid over the period. The ”Ending Account Value“ shown is derived from the fund‘s actual return, and the third column shows the dollar amount that would have been paid by an investor who started with $1,000 in the fund. You may use the information here, together with the amount you invested, to estimate the expenses that you paid over the period. |
| • | Based on hypothetical 5% yearly return. This section is intended to help you compare your fund‘s costs with those of other mutual funds. It assumes that the fund had a yearly return of 5% before expenses, but that the expense ratio is unchanged. In this case—because the return used is not the fund’s actual return—the results do not apply to your investment. The example is useful in making comparisons because the Securities and Exchange Commission requires all mutual funds to calculate expenses based on a 5% return. You can assess your fund’s costs by comparing this hypothetical example with the hypothetical examples that appear in shareholder reports of other funds. |
| Six Months Ended October 31, 2023 | |||
| Beginning Account Value 4/30/2023 | Ending Account Value 10/31/2023 | Expenses Paid During Period | |
| Based on Actual Fund Return | |||
| Windsor II Fund | |||
| Investor Shares | $1,000.00 | $997.70 | $1.66 |
| Admiral™ Shares | 1,000.00 | 998.10 | 1.26 |
| Based on Hypothetical 5% Yearly Return | |||
| Windsor II Fund | |||
| Investor Shares | $1,000.00 | $1,023.54 | $1.68 |
| Admiral Shares | 1,000.00 | 1,023.95 | 1.28 |
| Average Annual Total Returns Periods Ended October 31, 2023 | |||||
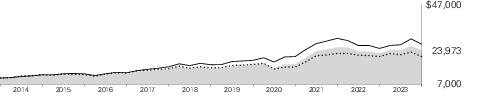
| One Year | Five Years | Ten Years | Final Value of a $10,000 Investment | ||
 | Windsor II Fund Investor Shares | 7.02% | 9.94% | 9.14% | $23,973 |
 | Russell 1000 Value Index | 0.13 | 6.60 | 7.60 | 20,799 |
 | Dow Jones U.S. Total Stock Market Float Adjusted Index | 8.39 | 10.10 | 10.43 | 26,967 |
| One Year | Five Years | Ten Years | Final Value of a $50,000 Investment | ||
| Windsor II Fund Admiral Shares | 7.09% | 10.03% | 9.22% | $120,831 | |
| Russell 1000 Value Index | 0.13 | 6.60 | 7.60 | 103,994 | |
| Dow Jones U.S. Total Stock Market Float Adjusted Index | 8.39 | 10.10 | 10.43 | 134,835 | |
| Communication Services | 7.6% |
| Consumer Discretionary | 8.2 |
| Consumer Staples | 6.8 |
| Energy | 7.4 |
| Financials | 17.9 |
| Health Care | 16.0 |
| Industrials | 9.6 |
| Information Technology | 20.6 |
| Materials | 2.9 |
| Real Estate | 1.4 |
| Utilities | 1.4 |
| Other | 0.2 |
| Shares | Market Value• ($000) | ||
| Common Stocks (95.9%) | |||
| Communication Services (7.3%) | |||
| * | Alphabet Inc. Class A | 12,954,911 | 1,607,445 |
| * | Meta Platforms Inc. Class A | 2,760,013 | 831,509 |
| * | Alphabet Inc. Class C | 4,354,150 | 545,575 |
| Comcast Corp. Class A | 5,323,513 | 219,808 | |
| * | Walt Disney Co. | 1,882,340 | 153,580 |
| * | Warner Bros Discovery Inc. | 10,268,148 | 102,065 |
| Vodafone Group plc ADR | 9,071,932 | 83,825 | |
| Omnicom Group Inc. | 753,779 | 56,466 | |
| 1 | Paramount Global Class B | 3,620,200 | 39,388 |
| * | Baidu Inc. ADR | 78,683 | 8,262 |
| 3,647,923 | |||
| Consumer Discretionary (7.8%) | |||
| * | Amazon.com Inc. | 8,970,484 | 1,193,882 |
| McDonald's Corp. | 1,392,476 | 365,066 | |
| Lennar Corp. Class A | 2,758,056 | 294,229 | |
| * | Aptiv plc | 3,041,291 | 265,201 |
| Sony Group Corp. ADR | 2,959,000 | 245,745 | |
| General Motors Co. | 8,560,224 | 241,398 | |
| Home Depot Inc. | 843,964 | 240,268 | |
| Cie Generale des Etablissements Michelin SCA ADR | 12,986,000 | 191,933 | |
| Magna International Inc. | 3,850,532 | 185,172 | |
| * | Booking Holdings Inc. | 59,700 | 166,537 |
| NIKE Inc. Class B | 1,551,630 | 159,461 | |
| * | Ulta Beauty Inc. | 241,135 | 91,947 |
| Bayerische Motoren Werke AG (XETR) | 944,435 | 87,837 | |
| * | Alibaba Group Holding Ltd. ADR | 832,401 | 68,706 |
| Mercedes-Benz Group AG | 1,059,910 | 62,359 | |
| * | Adient plc | 1,311,943 | 44,199 |
| BorgWarner Inc. (XNYS) | 1,187,000 | 43,800 | |
| 3,947,740 | |||
| Consumer Staples (6.5%) | |||
| Procter & Gamble Co. | 5,399,240 | 810,048 | |
| Coca-Cola Co. | 10,467,875 | 591,330 | |
| Sysco Corp. | 5,665,974 | 376,731 | |
| PepsiCo Inc. | 1,395,268 | 227,819 | |
| Constellation Brands Inc. Class A | 846,000 | 198,091 | |
| Shares | Market Value• ($000) | ||
| Kroger Co. | 4,340,823 | 196,943 | |
| Estee Lauder Cos. Inc. Class A | 1,329,740 | 171,364 | |
| Unilever plc ADR | 3,599,598 | 170,441 | |
| Mondelez International Inc. Class A | 2,526,973 | 167,311 | |
| Unilever plc (XLON) | 3,212,400 | 152,141 | |
| Nestle SA (Registered) | 1,126,287 | 121,457 | |
| Kenvue Inc. | 4,351,426 | 80,937 | |
| 3,264,613 | |||
| Energy (7.1%) | |||
| ConocoPhillips | 4,225,426 | 501,980 | |
| Chevron Corp. | 3,391,937 | 494,307 | |
| APA Corp. | 9,092,567 | 361,157 | |
| Halliburton Co. | 6,775,435 | 266,546 | |
| Coterra Energy Inc. | 9,502,000 | 261,305 | |
| Suncor Energy Inc. | 7,124,332 | 230,828 | |
| Marathon Oil Corp. | 7,993,987 | 218,316 | |
| NOV Inc. | 10,853,688 | 216,640 | |
| Phillips 66 | 1,839,000 | 209,775 | |
| Shell plc ADR | 3,112,712 | 202,762 | |
| Pioneer Natural Resources Co. | 656,120 | 156,813 | |
| Ovintiv Inc. (XNYS) | 2,921,110 | 140,213 | |
| Schlumberger NV | 2,479,166 | 137,990 | |
| Cenovus Energy Inc. | 4,153,200 | 79,243 | |
| Murphy Oil Corp. | 1,195,152 | 53,626 | |
| Baker Hughes Co. | 1,544,100 | 53,148 | |
| 3,584,649 | |||
| Financials (17.2%) | |||
| Wells Fargo & Co. | 20,543,567 | 817,018 | |
| Visa Inc. Class A | 2,696,151 | 633,865 | |
| Bank of America Corp. | 23,176,931 | 610,480 | |
| Intercontinental Exchange Inc. | 5,052,565 | 542,848 | |
| US Bancorp | 15,173,600 | 483,734 | |
| Citigroup Inc. | 12,084,003 | 477,197 | |
| American Express Co. | 2,901,047 | 423,640 | |
| Marsh & McLennan Cos. Inc. | 2,217,413 | 420,532 | |
| American International Group Inc. | 6,549,146 | 401,528 | |
| Capital One Financial Corp. | 2,864,300 | 290,125 | |
| Ameriprise Financial Inc. | 899,000 | 282,798 | |
| JPMorgan Chase & Co. | 1,795,175 | 249,637 | |
| Citizens Financial Group Inc. | 9,887,851 | 231,672 | |
| Shares | Market Value• ($000) | ||
| Fidelity National Information Services Inc. | 4,342,400 | 213,255 | |
| Blackstone Inc. | 2,302,000 | 212,590 | |
| Charles Schwab Corp. | 4,031,519 | 209,800 | |
| Bank of New York Mellon Corp. | 4,882,634 | 207,512 | |
| Goldman Sachs Group Inc. | 679,749 | 206,379 | |
| Commerce Bancshares Inc. | 4,493,097 | 197,067 | |
| BNP Paribas SA | 3,342,100 | 192,184 | |
| Hartford Financial Services Group Inc. | 2,435,600 | 178,895 | |
| Mitsubishi UFJ Financial Group Inc. ADR | 19,937,000 | 167,471 | |
| PNC Financial Services Group Inc. | 1,413,000 | 161,746 | |
| Cullen/Frost Bankers Inc. | 1,577,000 | 143,491 | |
| Chubb Ltd. | 594,279 | 127,544 | |
| Aon plc Class A (XNYS) | 315,774 | 97,701 | |
| First Citizens BancShares Inc. Class A | 59,258 | 81,820 | |
| ING Groep NV | 4,497,433 | 57,660 | |
| Truist Financial Corp. | 1,992,588 | 56,510 | |
| Corebridge Financial Inc. | 2,694,200 | 53,884 | |
| Discover Financial Services | 652,800 | 53,582 | |
| Equitable Holdings Inc. | 1,842,040 | 48,943 | |
| Sumitomo Mitsui Financial Group Inc. | 946,600 | 45,634 | |
| State Street Corp. | 665,188 | 42,991 | |
| NatWest Group plc | 18,280,043 | 39,774 | |
| 8,661,507 | |||
| Health Care (15.4%) | |||
| UnitedHealth Group Inc. | 1,952,269 | 1,045,557 | |
| Medtronic plc | 11,204,721 | 790,605 | |
| Elevance Health Inc. | 1,693,838 | 762,380 | |
| HCA Healthcare Inc. | 2,461,600 | 556,666 | |
| Danaher Corp. | 2,735,289 | 525,230 | |
| Cigna Group | 1,662,473 | 514,037 | |
| Johnson & Johnson | 3,096,700 | 459,364 | |
| Thermo Fisher Scientific Inc. | 787,412 | 350,217 | |
| Amgen Inc. | 1,055,000 | 269,763 | |
| * | Boston Scientific Corp. | 5,019,366 | 256,941 |
| Merck & Co. Inc. | 2,488,000 | 255,518 | |
| CVS Health Corp. | 3,469,800 | 239,451 | |
| Alcon Inc. | 2,918,000 | 208,112 | |
| GE Healthcare Inc. | 2,969,615 | 197,687 | |
| Zoetis Inc. | 1,226,959 | 192,633 | |
| Roche Holding AG | 705,449 | 181,801 | |
| * | IQVIA Holdings Inc. | 963,061 | 174,150 |
| * | Centene Corp. | 2,139,988 | 147,616 |
| Humana Inc. | 220,926 | 115,697 | |
| AstraZeneca plc ADR | 1,672,250 | 105,736 | |
| Abbott Laboratories | 941,286 | 88,999 | |
| AbbVie Inc. | 516,367 | 72,901 | |
| Zimmer Biomet Holdings Inc. | 612,008 | 63,900 | |
| Sanofi SA ADR | 1,320,391 | 59,748 | |
| GSK plc ADR | 1,567,915 | 55,975 | |
| EssilorLuxottica SA | 148,206 | 26,838 | |
| Shares | Market Value• ($000) | ||
| Novartis AG ADR | 77,905 | 7,290 | |
| 7,724,812 | |||
| Industrials (9.2%) | |||
| Honeywell International Inc. | 3,431,200 | 628,802 | |
| General Dynamics Corp. | 2,067,471 | 498,901 | |
| Parker-Hannifin Corp. | 925,000 | 341,242 | |
| Northrop Grumman Corp. | 692,542 | 326,485 | |
| RTX Corp. | 3,955,600 | 321,946 | |
| Waste Management Inc. | 1,704,686 | 280,131 | |
| * | Boeing Co. | 1,454,939 | 271,812 |
| Norfolk Southern Corp. | 1,328,779 | 253,518 | |
| General Electric Co. | 2,174,745 | 236,242 | |
| Xylem Inc. | 2,310,000 | 216,077 | |
| FedEx Corp. | 848,840 | 203,806 | |
| HEICO Corp. | 1,125,570 | 178,301 | |
| Oshkosh Corp. | 1,690,000 | 148,264 | |
| Cummins Inc. | 631,772 | 136,652 | |
| Caterpillar Inc. | 522,278 | 118,061 | |
| Nordson Corp. | 424,435 | 90,231 | |
| Daimler Truck Holding AG | 2,794,014 | 87,789 | |
| CNH Industrial NV | 7,994,599 | 87,781 | |
| PACCAR Inc. | 957,580 | 79,029 | |
| Timken Co. | 737,700 | 50,990 | |
| * | Fluor Corp. | 1,403,385 | 46,719 |
| * | Veralto Corp. | 375,666 | 25,921 |
| Siemens AG (Registered) | 189,874 | 25,196 | |
| 4,653,896 | |||
| Information Technology (19.8%) | |||
| Microsoft Corp. | 9,560,715 | 3,232,573 | |
| Apple Inc. | 3,463,848 | 591,521 | |
| * | Adobe Inc. | 1,046,341 | 556,716 |
| Taiwan Semiconductor Manufacturing Co. Ltd. ADR | 5,968,485 | 515,140 | |
| Micron Technology Inc. | 6,390,413 | 427,327 | |
| Samsung Electronics Co. Ltd. (XKRX) | 8,361,400 | 416,188 | |
| * | F5 Inc. | 2,096,600 | 317,824 |
| Amphenol Corp. Class A | 3,942,852 | 317,597 | |
| Analog Devices Inc. | 1,976,126 | 310,904 | |
| Telefonaktiebolaget LM Ericsson ADR | 69,414,080 | 309,587 | |
| Microchip Technology Inc. | 3,789,000 | 270,118 | |
| * | ANSYS Inc. | 966,000 | 268,799 |
| Applied Materials Inc. | 1,911,838 | 253,032 | |
| Cisco Systems Inc. | 4,625,086 | 241,106 | |
| * | Autodesk Inc. | 1,170,000 | 231,227 |
| Accenture plc Class A | 777,543 | 231,000 | |
| * | Salesforce Inc. | 1,117,468 | 224,421 |
| QUALCOMM Inc. | 2,002,000 | 218,198 | |
| Seagate Technology Holdings plc | 3,156,198 | 215,410 | |
| * | Teledyne Technologies Inc. | 553,800 | 207,448 |
| * | Workday Inc. Class A | 688,200 | 145,699 |
| International Business Machines Corp. | 802,918 | 116,134 | |
| TE Connectivity Ltd. | 902,266 | 106,332 | |
| Oracle Corp. | 936,525 | 96,837 | |
| Shares | Market Value• ($000) | ||
| Corning Inc. | 3,320,051 | 88,844 | |
| Cognizant Technology Solutions Corp. Class A | 866,500 | 55,863 | |
| 9,965,845 | |||
| Materials (2.7%) | |||
| Corteva Inc. | 6,320,000 | 304,245 | |
| Martin Marietta Materials Inc. | 731,000 | 298,935 | |
| RPM International Inc. | 2,399,000 | 218,957 | |
| Ecolab Inc. | 1,258,000 | 211,017 | |
| Avery Dennison Corp. | 1,090,794 | 189,874 | |
| Olin Corp. | 2,912,100 | 124,405 | |
| International Paper Co. | 1,016,629 | 34,291 | |
| 1,381,724 | |||
| Other (0.2%) | |||
| SPDR S&P 500 ETF Trust | 185,472 | 77,564 | |
| Real Estate (1.4%) | |||
| Prologis Inc. | 3,552,715 | 357,936 | |
| Equity LifeStyle Properties Inc. | 2,869,000 | 188,780 | |
| Crown Castle Inc. | 1,560,000 | 145,049 | |
| 691,765 | |||
| Utilities (1.3%) | |||
| Atmos Energy Corp. | 2,210,000 | 237,929 | |
| Xcel Energy Inc. | 3,638,000 | 215,624 | |
| Shares | Market Value• ($000) | ||
| PPL Corp. | 8,773,815 | 215,573 | |
| 669,126 | |||
| Total Common Stocks (Cost $35,034,536) | 48,271,164 | ||
| Temporary Cash Investments (3.8%) | |||
| Money Market Fund (3.8%) | |||
| 2,3 | Vanguard Market Liquidity Fund, 5.420% (Cost $1,900,975) | 19,014,811 | 1,901,291 |
| Total Investments (99.7%) (Cost $36,935,511) | 50,172,455 | ||
| Other Assets and Liabilities—Net (0.3%) | 137,760 | ||
| Net Assets (100%) | 50,310,215 | ||
| Cost is in $000. | |||
| • | See Note A in Notes to Financial Statements. |
| * | Non-income-producing security. |
| 1 | Includes partial security positions on loan to broker-dealers. The total value of securities on loan is $5,292,000. |
| 2 | Affiliated money market fund available only to Vanguard funds and certain trusts and accounts managed by Vanguard. Rate shown is the 7-day yield. |
| 3 | Collateral of $5,837,000 was received for securities on loan. |
| ADR—American Depositary Receipt. |
| Futures Contracts | ||||
| ($000) | ||||
| Expiration | Number of Long (Short) Contracts | Notional Amount | Value and Unrealized Appreciation (Depreciation) | |
| Long Futures Contracts | ||||
| E-mini S&P 500 Index | December 2023 | 3,219 | 677,962 | (20,642) |
| ($000s, except shares, footnotes, and per-share amounts) | Amount |
| Assets | |
| Investments in Securities, at Value1 | |
| Unaffiliated Issuers (Cost $35,034,536) | 48,271,164 |
| Affiliated Issuers (Cost $1,900,975) | 1,901,291 |
| Total Investments in Securities | 50,172,455 |
| Investment in Vanguard | 1,799 |
| Cash | 1,838 |
| Cash Collateral Pledged—Futures Contracts | 36,790 |
| Foreign Currency, at Value (Cost $673) | 642 |
| Receivables for Investment Securities Sold | 236,022 |
| Receivables for Accrued Income | 51,305 |
| Receivables for Capital Shares Issued | 5,944 |
| Variation Margin Receivable—Futures Contracts | 4,349 |
| Total Assets | 50,511,144 |
| Liabilities | |
| Payables for Investment Securities Purchased | 156,392 |
| Collateral for Securities on Loan | 5,837 |
| Payables to Investment Advisor | 15,178 |
| Payables for Capital Shares Redeemed | 19,948 |
| Payables to Vanguard | 3,574 |
| Total Liabilities | 200,929 |
| Net Assets | 50,310,215 |
| 1 Includes $5,292,000 of securities on loan. | |
| At October 31, 2023, net assets consisted of: | |
| Paid-in Capital | 34,940,088 |
| Total Distributable Earnings (Loss) | 15,370,127 |
| Net Assets | 50,310,215 |
| Investor Shares—Net Assets | |
| Applicable to 264,618,856 outstanding $.001 par value shares of beneficial interest (unlimited authorization) | 10,381,062 |
| Net Asset Value Per Share—Investor Shares | $39.23 |
| Admiral Shares—Net Assets | |
| Applicable to 573,675,749 outstanding $.001 par value shares of beneficial interest (unlimited authorization) | 39,929,153 |
| Net Asset Value Per Share—Admiral Shares | $69.60 |
| Year Ended October 31, 2023 | |
| ($000) | |
| Investment Income | |
| Income | |
| Dividends1 | 948,284 |
| Interest2 | 104,504 |
| Securities Lending—Net | 595 |
| Total Income | 1,053,383 |
| Expenses | |
| Investment Advisory Fees—Note B | |
| Basic Fee | 65,499 |
| Performance Adjustment | (5,032) |
| The Vanguard Group—Note C | |
| Management and Administrative—Investor Shares | 23,003 |
| Management and Administrative—Admiral Shares | 55,350 |
| Marketing and Distribution—Investor Shares | 461 |
| Marketing and Distribution—Admiral Shares | 1,447 |
| Custodian Fees | 660 |
| Auditing Fees | 46 |
| Shareholders’ Reports—Investor Shares | 406 |
| Shareholders’ Reports—Admiral Shares | 246 |
| Trustees’ Fees and Expenses | 29 |
| Other Expenses | 59 |
| Total Expenses | 142,174 |
| Expenses Paid Indirectly | (121) |
| Net Expenses | 142,053 |
| Net Investment Income | 911,330 |
| Realized Net Gain (Loss) | |
| Investment Securities Sold2 | 1,900,402 |
| Futures Contracts | 84,074 |
| Foreign Currencies | 17 |
| Realized Net Gain (Loss) | 1,984,493 |
| Change in Unrealized Appreciation (Depreciation) | |
| Investment Securities—Unaffiliated Issuers2 | 702,386 |
| Futures Contracts | (46,517) |
| Foreign Currencies | 498 |
| Change in Unrealized Appreciation (Depreciation) | 656,367 |
| Net Increase (Decrease) in Net Assets Resulting from Operations | 3,552,190 |
| 1 | Dividends are net of foreign withholding taxes of $21,384,000. |
| 2 | Interest income, realized net gain (loss), capital gain distributions received, and change in unrealized appreciation (depreciation) from an affiliated company of the fund were $103,304,000, $203,000, $5,000, and $54,000, respectively. Purchases and sales are for temporary cash investment purposes. |
| Year Ended October 31, | ||
| 2023 ($000) | 2022 ($000) | |
| Increase (Decrease) in Net Assets | ||
| Operations | ||
| Net Investment Income | 911,330 | 795,248 |
| Realized Net Gain (Loss) | 1,984,493 | 2,796,748 |
| Change in Unrealized Appreciation (Depreciation) | 656,367 | (10,644,556) |
| Net Increase (Decrease) in Net Assets Resulting from Operations | 3,552,190 | (7,052,560) |
| Distributions | ||
| Investor Shares | (743,361) | (1,012,782) |
| Admiral Shares | (2,794,952) | (3,567,050) |
| Total Distributions | (3,538,313) | (4,579,832) |
| Capital Share Transactions | ||
| Investor Shares | (380,550) | (437,223) |
| Admiral Shares | 253,217 | 1,926,529 |
| Net Increase (Decrease) from Capital Share Transactions | (127,333) | 1,489,306 |
| Total Increase (Decrease) | (113,456) | (10,143,086) |
| Net Assets | ||
| Beginning of Period | 50,423,671 | 60,566,757 |
| End of Period | 50,310,215 | 50,423,671 |
| Investor Shares | |||||
| For a Share Outstanding Throughout Each Period | Year Ended October 31, | ||||
| 2023 | 2022 | 2021 | 2020 | 2019 | |
| Net Asset Value, Beginning of Period | $39.39 | $48.48 | $34.85 | $37.22 | $37.39 |
| Investment Operations | |||||
| Net Investment Income1 | .672 | .585 | .502 | .551 | .775 |
| Net Realized and Unrealized Gain (Loss) on Investments | 1.923 | (6.039) | 15.971 | .607 | 2.628 |
| Total from Investment Operations | 2.595 | (5.454) | 16.473 | 1.158 | 3.403 |
| Distributions | |||||
| Dividends from Net Investment Income | (.647) | (.566) | (.516) | (.635) | (.844) |
| Distributions from Realized Capital Gains | (2.108) | (3.070) | (2.327) | (2.893) | (2.729) |
| Total Distributions | (2.755) | (3.636) | (2.843) | (3.528) | (3.573) |
| Net Asset Value, End of Period | $39.23 | $39.39 | $48.48 | $34.85 | $37.22 |
| Total Return2 | 7.02% | -11.93% | 49.42% | 2.93% | 10.82% |
| Ratios/Supplemental Data | |||||
| Net Assets, End of Period (Millions) | $10,381 | $10,747 | $13,734 | $10,997 | $12,119 |
| Ratio of Total Expenses to Average Net Assets3 | 0.34%4 | 0.34%4 | 0.34% | 0.34% | 0.33% |
| Ratio of Net Investment Income to Average Net Assets | 1.69% | 1.38% | 1.15% | 1.61% | 2.20% |
| Portfolio Turnover Rate | 17% | 18% | 20% | 61% | 32% |
| 1 | Calculated based on average shares outstanding. |
| 2 | Total returns do not include account service fees that may have applied in the periods shown. Fund prospectuses provide information about any applicable account service fees. |
| 3 | Includes performance-based investment advisory fee increases (decreases) of (0.01%), (0.01%), (0.00%), (0.01%), and (0.03%). |
| 4 | The ratio of expenses to average net assets for the period net of reduction from broker commission abatement arrangements was 0.34%. |
| Admiral Shares | |||||
| For a Share Outstanding Throughout Each Period | Year Ended October 31, | ||||
| 2023 | 2022 | 2021 | 2020 | 2019 | |
| Net Asset Value, Beginning of Period | $69.89 | $86.03 | $61.84 | $66.06 | $66.35 |
| Investment Operations | |||||
| Net Investment Income1 | 1.248 | 1.098 | .950 | 1.027 | 1.426 |
| Net Realized and Unrealized Gain (Loss) on Investments | 3.406 | (10.716) | 28.341 | 1.065 | 4.675 |
| Total from Investment Operations | 4.654 | (9.618) | 29.291 | 2.092 | 6.101 |
| Distributions | |||||
| Dividends from Net Investment Income | (1.204) | (1.074) | (.972) | (1.178) | (1.547) |
| Distributions from Realized Capital Gains | (3.740) | (5.448) | (4.129) | (5.134) | (4.844) |
| Total Distributions | (4.944) | (6.522) | (5.101) | (6.312) | (6.391) |
| Net Asset Value, End of Period | $69.60 | $69.89 | $86.03 | $61.84 | $66.06 |
| Total Return2 | 7.09% | -11.86% | 49.55% | 3.00% | 10.93% |
| Ratios/Supplemental Data | |||||
| Net Assets, End of Period (Millions) | $39,929 | $39,677 | $46,833 | $30,992 | $34,022 |
| Ratio of Total Expenses to Average Net Assets3 | 0.26%4 | 0.26%4 | 0.26% | 0.26% | 0.25% |
| Ratio of Net Investment Income to Average Net Assets | 1.77% | 1.46% | 1.22% | 1.69% | 2.28% |
| Portfolio Turnover Rate | 17% | 18% | 20% | 61% | 32% |
| 1 | Calculated based on average shares outstanding. |
| 2 | Total returns do not include account service fees that may have applied in the periods shown. Fund prospectuses provide information about any applicable account service fees. |
| 3 | Includes performance-based investment advisory fee increases (decreases) of (0.01%), (0.01%), (0.00%), (0.01%), and (0.03%). |
| 4 | The ratio of expenses to average net assets for the period net of reduction from broker commission abatement arrangements was 0.26%. |
| A. | The following significant accounting policies conform to generally accepted accounting principles for U.S. investment companies. The fund consistently follows such policies in preparing its financial statements. |
| B. | The investment advisory firms Lazard Asset Management LLC, Hotchkis and Wiley Capital Management, LLC, Sanders Capital, LLC, and Aristotle Capital Management, LLC, each provide investment advisory services to a portion of the fund for a fee calculated at an annual percentage rate of average net assets managed by the advisor. The basic fee of Lazard Asset Management LLC is subject to quarterly adjustments based on performance relative to the S&P 500 Index for the preceding three years. The basic fee of Hotchkis and Wiley Capital Management, LLC, is subject to quarterly adjustments based on performance relative to the MSCI US Investable Market 2500 Index for the preceding five years. The basic fee of Sanders Capital, LLC, is subject to |
| C. | In accordance with the terms of a Funds' Service Agreement (the “FSA”) between Vanguard and the fund, Vanguard furnishes to the fund corporate management, administrative, marketing, distribution and cash management services at Vanguard’s cost of operations (as defined by the FSA). These costs of operations are allocated to the fund based on methods and guidelines approved by the board of trustees and are generally settled twice a month. |
| D. | The fund has asked its investment advisors to direct certain security trades, subject to obtaining the best price and execution, to brokers who have agreed to rebate to the fund part of the commissions generated. Such rebates are used solely to reduce the fund’s management and administrative expenses. For the year ended October 31, 2023, these arrangements reduced the fund’s expenses by $121,000 (an annual rate of less than 0.01% of average net assets). |
| E. | Various inputs may be used to determine the value of the fund’s investments and derivatives. These inputs are summarized in three broad levels for financial statement purposes. The inputs or methodologies used to value securities are not necessarily an indication of the risk associated with investing in those securities. |
| Level 1 ($000) | Level 2 ($000) | Level 3 ($000) | Total ($000) | |
| Investments | ||||
| Assets | ||||
| Common Stocks | 46,774,306 | 1,496,858 | — | 48,271,164 |
| Temporary Cash Investments | 1,901,291 | — | — | 1,901,291 |
| Total | 48,675,597 | 1,496,858 | — | 50,172,455 |
| Derivative Financial Instruments | ||||
| Liabilities | ||||
| Futures Contracts1 | 20,642 | — | — | 20,642 |
| 1 | Includes cumulative appreciation (depreciation) on futures contracts and centrally cleared swaps, if any, as reported in the Schedule of Investments. Only current day’s variation margin is reported within the Statement of Assets and Liabilities. |
| F. | Permanent differences between book-basis and tax-basis components of net assets are reclassified among capital accounts in the financial statements to reflect their tax character. These reclassifications have no effect on net assets or net asset value per share. As of period end, permanent differences primarily attributable to the accounting for applicable foreign currency transactions and distributions in connection with fund share redemptions were reclassified between the following accounts: |
| Amount ($000) | |
| Paid-in Capital | 75,718 |
| Total Distributable Earnings (Loss) | (75,718) |
| Amount ($000) | |
| Undistributed Ordinary Income | 756,088 |
| Undistributed Long-Term Gains | 1,447,777 |
| Net Unrealized Gains (Losses) | 13,166,262 |
| Capital Loss Carryforwards | — |
| Qualified Late-Year Losses | — |
| Other Temporary Differences | — |
| Total | 15,370,127 |
| Year Ended October 31, | ||
| 2023 Amount ($000) | 2022 Amount ($000) | |
| Ordinary Income* | 864,330 | 1,414,463 |
| Long-Term Capital Gains | 2,673,983 | 3,165,369 |
| Total | 3,538,313 | 4,579,832 |
| * | Includes short-term capital gains, if any. |
| Amount ($000) | |
| Tax Cost | 37,006,227 |
| Gross Unrealized Appreciation | 15,768,673 |
| Gross Unrealized Depreciation | (2,602,444) |
| Net Unrealized Appreciation (Depreciation) | 13,166,229 |
| G. | During the year ended October 31, 2023, the fund purchased $8,525,083,000 of investment securities and sold $11,430,575,000 of investment securities, other than temporary cash investments. |
| H. | Capital share transactions for each class of shares were: |
| Year Ended October 31, | |||||
| 2023 | 2022 | ||||
| Amount ($000) | Shares (000) | Amount ($000) | Shares (000) | ||
| Investor Shares | |||||
| Issued | 321,789 | 8,059 | 594,292 | 13,465 | |
| Issued in Lieu of Cash Distributions | 725,857 | 19,498 | 986,376 | 22,623 | |
| Redeemed | (1,428,196) | (35,765) | (2,017,891) | (46,545) | |
| Net Increase (Decrease)—Investor Shares | (380,550) | (8,208) | (437,223) | (10,457) | |
| Admiral Shares | |||||
| Issued | 1,703,062 | 24,125 | 2,903,794 | 37,328 | |
| Issued in Lieu of Cash Distributions | 2,612,310 | 39,534 | 3,344,538 | 43,301 | |
| Redeemed | (4,062,155) | (57,683) | (4,321,803) | (57,306) | |
| Net Increase (Decrease)—Admiral Shares | 253,217 | 5,976 | 1,926,529 | 23,323 | |
| I. | Significant market disruptions, such as those caused by pandemics (e.g., COVID-19 pandemic), natural or environmental disasters, war (e.g., Russia’s invasion of Ukraine), acts of terrorism, or other events, can adversely affect local and global markets and normal market operations. Any such disruptions could have an adverse impact on the value of the fund’s investments and fund performance. |
| J. | Management has determined that no events or transactions occurred subsequent to October 31, 2023, that would require recognition or disclosure in these financial statements. |
Philadelphia, Pennsylvania
December 19, 2023
| Matthew Benchener | Thomas M. Rampulla |
| Joseph Brennan | Karin A. Risi |
| Mortimer J. Buckley | Anne E. Robinson |
| Gregory Davis | Michael Rollings |
| John James | Nitin Tandon |
| Chris D. Mclsaac | Lauren Valente |

All rights reserved.
Vanguard Marketing Corporation, Distributor.
Item 2: Code of Ethics.
The Registrant has adopted a code of ethics that applies to the Registrant’s principal executive officer, principal financial officer, principal accounting officer or controller or persons performing similar functions. The Code of Ethics was amended during the reporting period covered by this report to make certain technical, non-material changes.
Item 3: Audit Committee Financial Expert.
All members of the Audit Committee have been determined by the Registrant’s Board of Trustees to be Audit Committee Financial Experts and to be independent: F. Joseph Loughrey, Mark Loughridge, Sarah Bloom Raskin, and Peter F. Volanakis.
Item 4: Principal Accountant Fees and Services.
| (a) | Audit Fees. |
Audit Fees of the Registrant.
Fiscal Year Ended October 31, 2023: $90,000
Fiscal Year Ended October 31, 2022: $82,000
Aggregate Audit Fees of Registered Investment Companies in the Vanguard Group.
Fiscal Year Ended October 31, 2023: $9,326,156
Fiscal Year Ended October 31, 2022: $10,494,508
Includes fees billed in connection with audits of the Registrant, other registered investment companies in the Vanguard complex, The Vanguard Group, Inc., and Vanguard Marketing Corporation.
| (b) | Audit-Related Fees. |
Fiscal Year Ended October 31, 2023: $3,295,934
Fiscal Year Ended October 31, 2022: $2,757,764
Includes fees billed in connection with assurance and related services provided to the Registrant, other registered investment companies in the Vanguard complex, The Vanguard Group, Inc., and Vanguard Marketing Corporation.
| (c) | Tax Fees. |
Fiscal Year Ended October 31, 2023: $1,678,928
Fiscal Year Ended October 31, 2022: $5,202,689
Includes fees billed in connection with tax compliance, planning, and advice services provided to the Registrant, other registered investment companies in the Vanguard complex, The Vanguard Group, Inc., and Vanguard Marketing Corporation.
| (d) | All Other Fees. |
Fiscal Year Ended October 31, 2023: $25,000
Fiscal Year Ended October 31, 2022: $298,000
Includes fees billed for services related to tax reported information provided to the Registrant, other registered investment companies in the Vanguard complex, The Vanguard Group, Inc., and Vanguard Marketing Corporation.
(e) (1) Pre-Approval Policies. The policy of the Registrant’s Audit Committee is to consider, and, if appropriate, approve before the principal accountant is engaged for such services, all specific audit and non-audit services provided to: the Registrant, other registered investment companies in the Vanguard complex, The Vanguard Group, Inc., and entities controlled by The Vanguard Group, Inc. that provide ongoing services to the Registrant. In making a determination, the Audit Committee considers whether the services are consistent with maintaining the principal accountant’s independence.
In the event of a contingency situation in which the principal accountant is needed to provide services in between scheduled Audit Committee meetings, the Chairman of the Audit Committee would be called on to consider and, if appropriate, pre-approve audit or permitted non-audit services in an amount sufficient to complete services through the next Audit Committee meeting, and to determine if such services would be consistent with maintaining the accountant’s independence. At the next scheduled Audit Committee meeting, services and fees would be presented to the Audit Committee for formal consideration, and, if appropriate, approval by the entire Audit Committee. The Audit Committee would again consider whether such services and fees are consistent with maintaining the principal accountant’s independence.
The Registrant’s Audit Committee is informed at least annually of all audit and non-audit services provided by the principal accountant to the Vanguard complex, whether such services are provided to: the Registrant, other registered investment companies in the Vanguard complex, The Vanguard Group, Inc., or other entities controlled by The Vanguard Group, Inc. that provide ongoing services to the Registrant.
(2) No percentage of the principal accountant’s fees or services were approved pursuant to the waiver provision of paragraph (c)(7)(i)(C) of Rule 2-01 of Regulation S-X.
(f) For the most recent fiscal year, over 50% of the hours worked under the principal accountant’s engagement were not performed by persons other than full-time, permanent employees of the principal accountant.
(g) Aggregate Non-Audit Fees.
Fiscal Year Ended October 31, 2023: $1,703,928
Fiscal Year Ended October 31, 2022: $5,500,689
Includes fees billed for non-audit services provided to the Registrant, other registered investment companies in the Vanguard complex, The Vanguard Group, Inc., and Vanguard Marketing Corporation.
(h) For the most recent fiscal year, the Audit Committee has determined that the provision of all non-audit services was consistent with maintaining the principal accountant’s independence.
Item 5: Audit Committee of Listed Registrants.
The Registrant is a listed issuer as defined in rule 10A-3 under the Securities Exchange Act of 1934 (“Exchange Act”). The Registrant has a separately-designated standing audit committee established in accordance with Section 3(a)(58)(A) of the Exchange Act. The Registrant’s audit committee members are: F. Joseph Loughrey, Mark Loughridge, Sarah Bloom Raskin, and Peter F. Volanakis.
Item 6: Investments.
Not applicable. The complete schedule of investments is included as part of the report to shareholders filed under Item 1 of this Form.
Item 7: Disclosure of Proxy Voting Policies and Procedures for Closed-End Management Investment Companies.
Not applicable.
Item 8: Portfolio Managers of Closed-End Management Investment Companies.
Not applicable.
Item 9: Purchase of Equity Securities by Closed-End Management Investment Company and Affiliated Purchasers.
Not applicable.
Item 10: Submission of Matters to a Vote of Security Holders.
Not applicable.
Item 11: Controls and Procedures.
(a) Disclosure Controls and Procedures. The Principal Executive and Financial Officers concluded that the Registrant’s Disclosure Controls and Procedures are effective based on their evaluation of the Disclosure Controls and Procedures as of a date within 90 days of the filing date of this report.
(b) Internal Control Over Financial Reporting. There were no significant changes in the Registrant’s Internal Control Over Financial Reporting or in other factors that could significantly affect this control during the period covered by this report, including any corrective actions with regard to significant deficiencies and material weaknesses.
Item 12: Disclosure of Securities Lending Activities for Closed-End Management Investment Companies.
Not applicable.
Item 13: Exhibits.
| (a)(1) | Code of Ethics filed herewith. |
| (a)(2) | Certifications filed herewith. |
| (a)(2) | Certifications filed herewith. |
Pursuant to the requirements of the Securities Exchange Act of 1934 and the Investment Company Act of 1940, the registrant has duly caused this report to be signed on its behalf by the undersigned, thereunto duly authorized.
| VANGUARD WINDSOR FUNDS | ||
| BY: | /s/ MORTIMER J. BUCKLEY* | |
| MORTIMER J. BUCKLEY | ||
| CHIEF EXECUTIVE OFFICER | ||
Date: December 21, 2023
Pursuant to the requirements of the Securities Exchange Act of 1934 and the Investment Company Act of 1940, this report has been signed below by the following persons on behalf of the registrant and in the capacities and on the dates indicated.
| VANGUARD WINDSOR FUNDS | ||
| BY: | /s/ MORTIMER J. BUCKLEY* | |
| MORTIMER J. BUCKLEY | ||
| CHIEF EXECUTIVE OFFICER | ||
| Date: December 21, 2023 | ||
| VANGUARD WINDSOR FUNDS | ||
| BY: | /s/ CHRISTINE BUCHANAN* | |
| CHRISTINE BUCHANAN | ||
| CHIEF FINANCIAL OFFICER | ||
Date: December 21, 2023
| * By: | /s/ Anne E. Robinson |
Anne E. Robinson, pursuant to a Power of Attorney filed on July 21, 2023 (see File Number 33-53683) and to a Power of Attorney filed on March 29, 2023 (see File Number 2-11444), Incorporated by Reference.