
www.cemex.com
4Q09 RESULTS
4Q09 RESULTS
January 2010
January 2010
2

2009 achievements
§ Refinanced US$15 billion in debt
§ Issued close to US$2.3 billion in fixed income notes
§ Raised US$2.2 billion in equity and equity-like capital
§ Sold our Australian assets for approximately US$1.7 billion
§ Implemented a US$900 million cost-reduction program
§ Increased use of alternative fuels to 16%, from 10% in 2008
§ On track to achieve 25% reduction in specific CO2 emissions by
2015 from 1990 levels
2015 from 1990 levels
3
4Q09 results highlights
January - December | Fourth Quarter | ||||||||||
2009 | 2008 | % var | l-t-l % var | 2009 | 2008 | % var | l-t-l % var | ||||
Net sales | 14,544 | 20,131 | (28%) | (19%) | 3,444 | 4,148 | (17%) | (20%) | |||
Gross profit | 4,274 | 6,396 | (33%) | (23%) | 911 | 1,262 | (28%) | (31%) | |||
Operating income | 1,165 | 2,327 | (50%) | (38%) | 98 | 346 | (72%) | (75%) | |||
EBITDA | 2,657 | 4,080 | (35%) | (25%) | 474 | 750 | (37%) | (39%) | |||
FCF after maint capex | 1,215 | 2,600 | (53%) | 401 | 474 | (15%) | |||||
Millions US dollars
4
§ 2009 results reflect deconsolidation of Venezuelan assets starting August 2008
§ Australian operations reclassified as “Discontinued Operations” in 2008 and 2009
results
results

Ready Mix | Volume | (23%) | (21%) | (10%) | ||
Price (USD) | (10%) | (1%) | 0% | |||
Price (l-t-l1) | (2%) | (6%) | (2%) |
Aggregates | Volume | (20%) | (16%) | (12%) | ||
Price (USD) | (9%) | 3% | 0% | |||
Price (l-t-l1) | (2%) | (3%) | (2%) |
2009 vs. 2008 | 4Q09 vs. 4Q08 | 4Q09 vs. 3Q09 | ||||
Cement | Volume | (14%) | (8%) | (8%) | ||
Price (USD) | (9%) | 0% | (1%) | |||
Price (l-t-l1) | 1% | (4%) | (2%) |
5
Consolidated volumes and prices
1 Like-to-like prices adjusted for investments/divestments and foreign-exchange fluctuations
§ Challenging business environment prevailed during 2009, with some signs of
stabilization in the second half
stabilization in the second half

6
2010 guidance
§ Consolidated volumes expected to increase by 4% for cement and
aggregates and by 2% for ready mix
aggregates and by 2% for ready mix
– Volumes in Mexico flat for cement and growing in excess of 5% for
ready mix
ready mix
– US cement, ready-mix and aggregates volumes to have high-single-digit
increase
increase
– Spanish cement volumes similar to 2009 levels; ready-mix and
aggregates volumes declining by 11% and 2%, respectively
aggregates volumes declining by 11% and 2%, respectively
§ EBITDA to be about US$2.9 billion, on a like-to-like basis, and based
on currently prevailing exchange rates
on currently prevailing exchange rates
§ Free cash flow after maintenance capex to reach close to US$1
billion, reflecting exclusion of Australian operations, higher interest
expense, maintenance capex, and cash taxes, and lower investment
in working capital
billion, reflecting exclusion of Australian operations, higher interest
expense, maintenance capex, and cash taxes, and lower investment
in working capital
§ US$600 million from free cash flow to be used for debt reduction
during the year
during the year
www.cemex.com
REGIONAL
HIGHLIGHTS
HIGHLIGHTS
REGIONAL
HIGHLIGHTS
HIGHLIGHTS
January 2010
January 2010
7
2009 | 2008 | % var | l-t-l % var | 4Q09 | 4Q08 | % var | l-t-l % var | ||||
Net Sales | 3,113 | 3,822 | (19%) | (1%) | 723 | 820 | (12%) | (14%) | |||
EBITDA | 1,160 | 1,453 | (20%) | (3%) | 251 | 302 | (17%) | (18%) | |||
Margin | 37.3% | 38.0% | 34.8% | 36.8% |
Volume | 2009 vs. 2008 | 4Q09 vs. 4Q08 | 4Q09 vs. 3Q09 | |
Cement | (4%) | (10%) | (2%) | |
Ready-mix | (14%) | (28%) | (9%) | |
Aggregates | 4% | (9%) | (6%) |
Price (LC) | 2009 vs. 2008 | 4Q09 vs. 4Q08 | 4Q09 vs. 3Q09 | |
Cement | 2% | (3%) | (3%) | |
Ready-mix | 1% | (0%) | (0%) | |
Aggregates | 5% | 10% | 2% |
8
§ Investment in Infrastructure
increased by about 20% in 2009,
partially mitigating contraction in
residential and non-residential
sectors
increased by about 20% in 2009,
partially mitigating contraction in
residential and non-residential
sectors
§ Formal housing affected by bridge
financing constraints; some
recovery expected for 2010
financing constraints; some
recovery expected for 2010
§ Self-construction anticipated to
drop by about 1% in 2010
drop by about 1% in 2010
§ Industrial and commercial sector
expected to grow by 15% in 2010,
after two years of decline
expected to grow by 15% in 2010,
after two years of decline
Mexico
United States
2009 | 2008 | % var | l-t-l % var | 4Q09 | 4Q08 | % var | l-t-l % var | ||||
Net Sales | 2,825 | 4,698 | (40%) | (40%) | 602 | 983 | (39%) | (39%) | |||
EBITDA | 143 | 702 | (80%) | (80%) | (5) | 129 | N/A | N/A | |||
Margin | 5.1% | 14.9% | (0.7%) | 13.1% |
Volume | 2009 vs. 2008 | 4Q09 vs. 4Q08 | 4Q09 vs. 3Q09 | |
Cement | (32%) | (25%) | (14%) | |
Ready-mix | (38%) | (30%) | (12%) | |
Aggregates | (36%) | (29%) | (15%) |
Price (LC) | 2009 vs. 2008 | 4Q09 vs. 4Q08 | 4Q09 vs. 3Q09 | |
Cement | (6%) | (7%) | (0%) | |
Ready-mix | (8%) | (13%) | (4%) | |
Aggregates | (7%) | (9%) | (2%) |
9
§ Fourth quarter decline in volumes
reflecting drop in residential and
I&C sectors, as well as poor
weather during December
reflecting drop in residential and
I&C sectors, as well as poor
weather during December
§ Public construction will continue to
be main driver for demand,
supported by ARRA and other
funding
be main driver for demand,
supported by ARRA and other
funding
§ Improvement seen in existing
home sales and inventories;
cement demand from residential
sector expected to have double-
digit growth in 2010 in our markets
home sales and inventories;
cement demand from residential
sector expected to have double-
digit growth in 2010 in our markets

Spain
2009 | 2008 | % var | l-t-l % var | 4Q09 | 4Q08 | % var | l-t-l % var | ||||
Net Sales | 831 | 1,573 | (47%) | (36%) | 194 | 247 | (21%) | (14%) | |||
EBITDA | 204 | 464 | (56%) | (50%) | 44 | 60 | (27%) | (31%) | |||
Margin | 24.6% | 29.5% | 22.4% | 24.3% |
Volume | 2009 vs. 2008 | 4Q09 vs. 4Q08 | 4Q09 vs. 3Q09 | |
Cement | (40%) | (23%) | (16%) | |
Ready-mix | (44%) | (33%) | (19%) | |
Aggregates | (33%) | (15%) | (12%) |
Price (LC) | 2009 vs. 2008 | 4Q09 vs. 4Q08 | 4Q09 vs. 3Q09 | |
Cement | (10%) | (14%) | (2%) | |
Ready-mix | (8%) | (11%) | 0% | |
Aggregates | 3% | 0% | (1%) |
10
§ Cement and ready-mix volumes on
a like-to-like basis declined by
30% and 37%, respectively, for
2009
a like-to-like basis declined by
30% and 37%, respectively, for
2009
§ Construction activity affected by
economic slowdown and limited
credit availability
economic slowdown and limited
credit availability
§ Housing starts expected to
decrease to 140-150 thousand in
2009, further decline expected
decrease to 140-150 thousand in
2009, further decline expected
§ Infrastructure relatively stable, but
insufficient to compensate other
sectors
insufficient to compensate other
sectors

United Kingdom
2009 | 2008 | % var | l-t-l % var | 4Q09 | 4Q08 | % var | l-t-l % var | ||||
Net Sales | 1,184 | 1,712 | (31%) | (19%) | 285 | 318 | (10%) | (16%) | |||
EBITDA | 43 | 26 | 62% | 88% | 0 | (19) | 99% | 97% | |||
Margin | 3.6% | 1.5% | (0.1%) | (6.0%) |
Volume | 2009 vs. 2008 | 4Q09 vs. 4Q08 | 4Q09 vs. 3Q09 | |
Cement | (19%) | (14%) | (15%) | |
Ready-mix | (25%) | (23%) | (17%) | |
Aggregates | (19%) | (12%) | (17%) |
Price (LC) | 2009 vs. 2008 | 4Q09 vs. 4Q08 | 4Q09 vs. 3Q09 | |
Cement | 8% | 3% | (2%) | |
Ready-mix | 2% | (1%) | (0%) | |
Aggregates | 1% | (2%) | (1%) |
11
§ 2009 results reflected weakness
across all business segments, with
rate of decline decelerating in the
last months of the year
across all business segments, with
rate of decline decelerating in the
last months of the year
§ Mild recovery in the housing sector
expected for 2010
expected for 2010
Rest of Europe
2009 | 2008 | % var | l-t-l % var | 4Q09 | 4Q08 | % var | l-t-l % var | ||||
Net Sales | 3,345 | 4,369 | (23%) | (17%) | 843 | 922 | (9%) | (17%) | |||
EBITDA | 349 | 532 | (34%) | (27%) | 65 | 82 | (20%) | (27%) | |||
Margin | 10.4% | 12.2% | 7.8% | 8.9% |
Volume | 2009 vs. 2008 | 4Q09 vs. 4Q08 | 4Q09 vs. 3Q09 | |
Cement | (17%) | (18%) | (29%) | |
Ready-mix | (17%) | (14%) | (13%) | |
Aggregates | (13%) | (13%) | (15%) |
12
Price (LC)1 | 2009 vs. 2008 | 4Q09 vs. 4Q08 | 4Q09 vs. 3Q09 | |
Cement | 4% | 0% | (2%) | |
Ready-mix | 0% | (1%) | 1% | |
Aggregates | 4% | 7% | 1% |
§ In France, ready-mix volume
decreased by 17% and aggregates
volume by 13% during 4Q09
decreased by 17% and aggregates
volume by 13% during 4Q09
§ In Germany, cement volume
decreased by 16% during 4Q09
decreased by 16% during 4Q09
§ In most countries in the region,
infrastructure continues to be the
main driver for volume growth
infrastructure continues to be the
main driver for volume growth
§ In Eastern Europe, 2009 volumes
affected by lower confidence and
tight credit conditions; stabilization
and potential growth expected in
some markets for 2010
affected by lower confidence and
tight credit conditions; stabilization
and potential growth expected in
some markets for 2010
1 Volume-weighted, local-currency average prices

South/Central America and the Caribbean
2009 | 2008 | % var | l-t-l % var | 4Q09 | 4Q08 | % var | l-t-l % var | ||||
Net Sales | 1,368 | 2,023 | (32%) | (13%) | 322 | 378 | (15%) | (18%) | |||
EBITDA | 494 | 658 | (25%) | (4%) | 111 | 121 | (8%) | (13%) | |||
Margin | 36.1% | 32.5% | 34.5% | 31.9% |
Volume | 2009 vs. 2008 | 4Q09 vs. 4Q08 | 4Q09 vs. 3Q09 | |
Cement | (30%) | (1%) | (5%) | |
Ready-mix | (34%) | (21%) | (10%) | |
Aggregates | (40%) | (27%) | 11% |
13
Price (LC)1 | 2009 vs. 2008 | 4Q09 vs. 4Q08 | 4Q09 vs. 3Q09 | |
Cement | 14% | (2%) | (2%) | |
Ready-mix | (3%) | (6%) | (3%) | |
Aggregates | (2%) | (13%) | (3%) |
§ Colombian cement volume
remained flat for the quarter and
ready-mix volume declined by 15%
remained flat for the quarter and
ready-mix volume declined by 15%
§ In Colombia, infrastructure will
continue to be an important
contributor to 2010 volumes;
subsidy in interest rates for new
homes should also contribute to
volume growth
continue to be an important
contributor to 2010 volumes;
subsidy in interest rates for new
homes should also contribute to
volume growth
1 Volume-weighted, local-currency average prices

Africa and Middle East
2009 | 2008 | % var | l-t-l % var | 4Q09 | 4Q08 | % var | l-t-l % var | ||||
Net Sales | 1,049 | 1,071 | (2%) | 2% | 261 | 278 | (6%) | (7%) | |||
EBITDA | 333 | 296 | 12% | 15% | 68 | 72 | (6%) | (7%) | |||
Margin | 31.7% | 27.7% | 25.9% | 25.9% |
Volume | 2009 vs. 2008 | 4Q09 vs. 4Q08 | 4Q09 vs. 3Q09 | |
Cement | 22% | 7% | 1% | |
Ready-mix | (14%) | (8%) | 7% | |
Aggregates | (10%) | 12% | 23% |
14
Price (LC)1 | 2009 vs. 2008 | 4Q09 vs. 4Q08 | 4Q09 vs. 3Q09 | |
Cement | 10% | 2% | (1%) | |
Ready-mix | (3%) | (19%) | (4%) | |
Aggregates | 7% | (4%) | 4% |
§ In Egypt, cement volumes
increased by 7% during 4Q09 and
by 13% in 2009
increased by 7% during 4Q09 and
by 13% in 2009
§ The informal housing and
infrastructure sectors will continue
to be main drivers of cement
demand in 2010 in the region
infrastructure sectors will continue
to be main drivers of cement
demand in 2010 in the region
1 Volume-weighted, local-currency average prices

Asia
2009 | 2008 | % var | l-t-l % var | 4Q09 | 4Q08 | % var | l-t-l % var | ||||
Net Sales | 474 | 494 | (4%) | 1% | 122 | 105 | 17% | 14% | |||
EBITDA | 116 | 93 | 25% | 33% | 22 | 15 | 44% | 40% | |||
Margin | 24.5% | 18.8% | 17.8% | 14.5% |
Volume | 2009 vs. 2008 | 4Q09 vs. 4Q08 | 4Q09 vs. 3Q09 | |
Cement | 0% | 24% | 1% | |
Ready-mix | (18%) | (9%) | 21% | |
Aggregates | (15%) | 0% | 11% |
15
Price (LC)1 | 2009 vs. 2008 | 4Q09 vs. 4Q08 | 4Q09 vs. 3Q09 | |
Cement | 7% | (2%) | (1%) | |
Ready-mix | 3% | (6%) | (1%) | |
Aggregates | 3% | (3%) | 2% |
1 Volume-weighted, local-currency average prices

www.cemex.com
4Q09 RESULTS
4Q09 RESULTS
January 2010
January 2010
16

EBITDA and free cash flow
January - December | Fourth Quarter | ||||||||||
2009 | 2008 | % var | l-t-l % var | 2009 | 2008 | % var | l-t-l % var | ||||
Net sales | 14,544 | 20,131 | (28%) | (19%) | 3,444 | 4,148 | (17%) | (20%) | |||
EBITDA | 2,657 | 4,080 | (35%) | (25%) | 474 | 750 | (37%) | (39%) | |||
EBITDA margin | 18.3% | 20.3% | (2.0pp) | 13.8% | 18.1% | (4.3pp) | |||||
Cost of sales | 10,270 | 13,735 | (25%) | 2,532 | 2,886 | (12%) | |||||
% sales | 70.6% | 68.2% | 2.4pp | 73.5% | 69.6% | 3.9pp | |||||
SG&A | 3,109 | 4,069 | (24%) | 813 | 916 | (11%) | |||||
% sales | 21.4% | 20.2% | 1.2pp | 23.6% | 22.1% | 1.5pp | |||||
Free cash flow after maintenance capex | 1,215 | 2,600 | (53%) | 401 | 474 | (15%) | |||||
Free cash flow | 805 | 1,040 | (23%) | 334 | 195 | 71% | |||||
US$ million
17
§ Adjusting for Venezuela, divestments and the sale of emission allowances done last
year, EBITDA margin had a slight decline of 0.4pp despite a 19% decline in sales, on a
like-to-like basis
year, EBITDA margin had a slight decline of 0.4pp despite a 19% decline in sales, on a
like-to-like basis
§ Increase in SG&A as a percentage of sales mainly due to lesser economies of scale
due to lower volumes and higher transportation costs, partially offset by savings from
cost-reduction initiatives
due to lower volumes and higher transportation costs, partially offset by savings from
cost-reduction initiatives
§ Free cash flow after maintenance capex reflects lower EBITDA, higher financial
expense and investment in working capital, partially offset by lower maintenance capex
expense and investment in working capital, partially offset by lower maintenance capex

18
Other items
§ Kiln fuel and electricity costs, on a per-ton-of-cement-produced basis,
decreased by 16% for 2009 and expected to increase by 5% for 2010
decreased by 16% for 2009 and expected to increase by 5% for 2010
§ Increase in financial expenses during the quarter reflects new terms
of Financing Agreement
of Financing Agreement
§ Gain on financial instruments during the quarter reflects positive mark
-to-market contribution of our equity derivatives
-to-market contribution of our equity derivatives
§ Income tax resulting from tax losses in many of our operating
jurisdictions due to reduced volumes and local foreign-exchange
losses
jurisdictions due to reduced volumes and local foreign-exchange
losses
§ Estimated impact of the changes in the rules in Mexico for group tax
consolidation : US$799 million
consolidation : US$799 million
– Liability recognized in balance sheet; a deferred tax asset for US$628
million also recognized
million also recognized
– Expected impact on 2010 cash taxes: US$30 million
www.cemex.com
DEBT
INFORMATION
INFORMATION
DEBT
INFORMATION
INFORMATION
January 2010
January 2010
19

20
Debt-related activity in the quarter
§ Convertible securities transaction for MXN4.1 billion (approximately
US$320 million); upon conversion will represent about 17.25 million
ADSs
US$320 million); upon conversion will represent about 17.25 million
ADSs
§ Issuance of notes for close to US$2.3 billion
– US-dollar notes for US$1.25 billion (7 years, yield 9.50%) issued in December;
reopening in January for additional US$500 million (yield 8.477%)
reopening in January for additional US$500 million (yield 8.477%)
– Euro notes for €350 million (8 years, yield 9.625%) issued in December
§ Issuance of various short-term notes under our short-term
Certificados Bursátiles program, having an outstanding amount of
MXN800 million at the end of the quarter
Certificados Bursátiles program, having an outstanding amount of
MXN800 million at the end of the quarter
US$ million
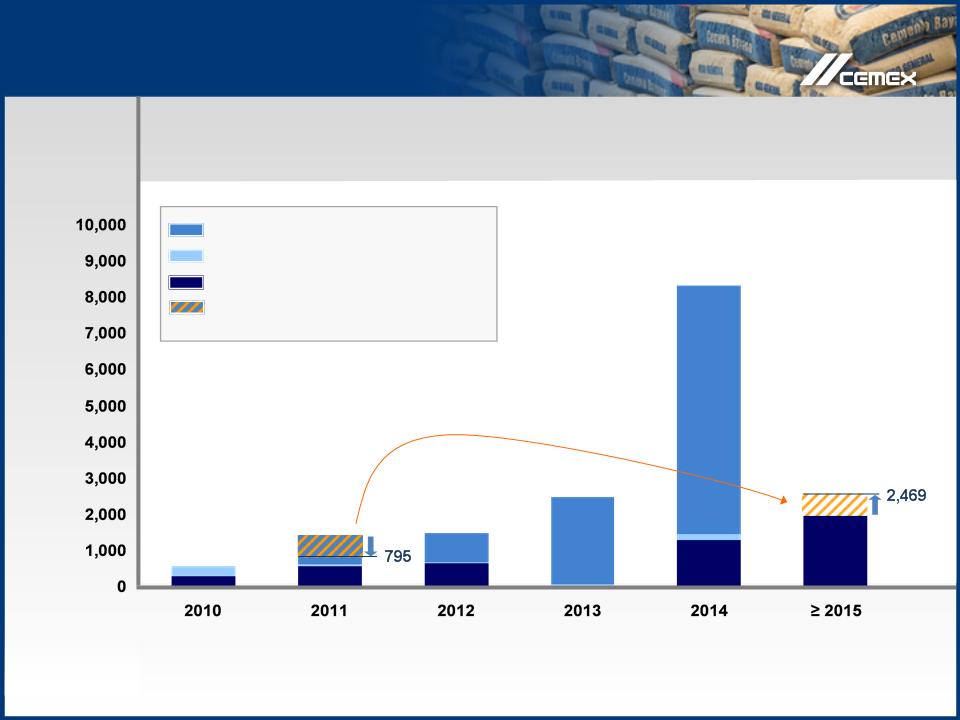
Consolidated debt maturity profile
Total debt excluding perpetual debentures as of 4Q09
US$ 16,130
Fixed Income
Financing Agreement Amortizations
Other bank / WC debt
565
1,377
1,455
2,455
8,310
1,969
21
2011 prepayments to Financing
Agreement made during January
Agreement made during January
Debt-related information
2009 | 2008 | % Var. | 2009 | ||
Total debt | 16,130 | 18,783 | (14%) | 17,448 | |
Short-term | 4% | 37% | 3% | ||
Long-term | 96% | 63% | 97% | ||
Cash and cash equivalents | 1,077 | 939 | 15% | 363 | |
Fair value cross currency swaps2 | 0 | (114) | 0 | ||
Net debt | 15,053 | 17,958 | (16%) | 17,085 | |
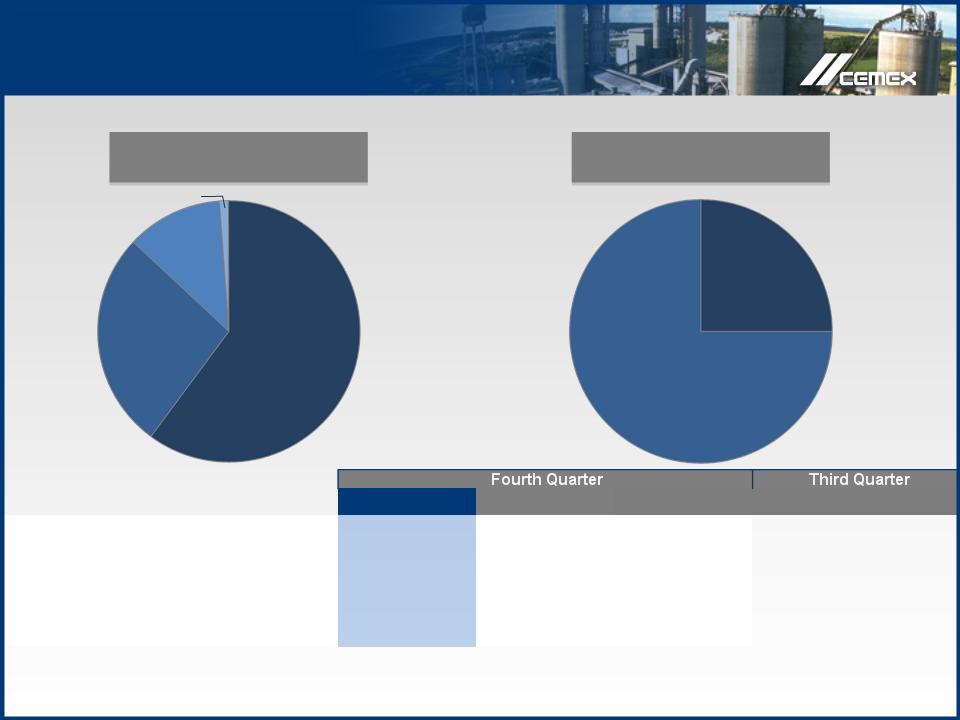
Currency denomination
Interest Rate
22
U.S.
dollar
dollar
60%
Euro
27%
Mexican
peso
peso
12%
other
Variable
75%
Fixed
25%
1 For presentation purposes in the table above, net debt includes the fair value of cross-currency swaps, if any, associated with debt.

This presentation contains certain forward-looking statements and information relating to CEMEX, S.A.B. de
C.V. and its subsidiaries (collectively, “CEMEX”) that are based on the beliefs of its management, as well as
assumptions made by and information currently available to CEMEX. Such statements reflect the current
views of CEMEX with respect to future events and are subject to certain risks, uncertainties, and assumptions.
Many factors could cause the actual results, performance or achievements of CEMEX to be materially
different from any future results, performance or achievements that may be expressed or implied by such
forward-looking statements, including, among others, changes in general economic, political, governmental,
and business conditions globally and in the countries in which CEMEX does business, changes in interest
rates, changes in inflation rates, changes in exchange rates, the level of construction generally, changes in
cement demand and prices, changes in raw material and energy prices, changes in business strategy, and
various other factors. Should one or more of these risks or uncertainties materialize, or should underlying
assumptions prove incorrect, actual results may vary materially from those described herein as anticipated,
believed, estimated, expected or targeted. CEMEX does not intend, and does not assume any obligation, to
update these forward-looking statements.
UNLESS OTHERWISE NOTED, ALL FIGURES ARE PRESENTED UNDER MEXICAN GAAP
Copyright CEMEX, S.A.B. de C.V. and its subsidiaries.
Forward looking information
23


25
Definitions
EBITDA: Operating income plus depreciation and operating
amortization
amortization
Expansion capital expenditures: consist of expansion spending on
our cement, ready-mix, and other core businesses in existing markets
our cement, ready-mix, and other core businesses in existing markets
LC: Local currency
Like-to-like percentage variation (l-t-l % var): Percentage variations
adjusted for investments/divestments and currency fluctuations
adjusted for investments/divestments and currency fluctuations
Maintenance capital expenditures: consist of maintenance spending
on our cement, ready-mix, and other core businesses in existing
markets
on our cement, ready-mix, and other core businesses in existing
markets

In the United States:
1 877 7CX NYSE
In Mexico:
52 (81) 8888 4292
E-Mail:
ir@cemex.com
Contact Information
26