 TCBI Q1 2012 Earnings April 25, 2012 Exhibit 99.2 |
 Certain matters discussed on this call may contain forward-looking statements, which are subject to risks and uncertainties. A number of factors, many of which are beyond Texas Capital Bancshares’ control, could cause actual results to differ materially from future results expressed or implied by such forward-looking statements. These risks and uncertainties include the risk of adverse impacts from general economic conditions, competition, interest rate sensitivity and exposure to regulatory and legislative changes. These and other factors that could cause results to differ materially from those described in the forward-looking statements can be found in our annual report on Form 10-K for the year ended December 31, 2011, and other filings made by Texas Capital Bancshares with the Securities and Exchange Commission. |
 3 Opening Remarks • Starting 2012 with another quarter of strong growth and profitability • Reduction in credit costs and NPAs continued in Q1-2012 • Strong growth in LHI • LHS levels remain high; growth still impacted by level of refis |
 Net Income and EPS – Outstanding growth in net income and EPS compared to Q1-2011 and Q4-2011 Operating Leverage, Core Earnings Power & NIM – Growth of Net Revenue • 35% growth from Q1-2011 – Strong growth in LHI and LHS • More favorable earning asset composition – growth in loans, highly liquid LHS and reduction in securities • Good growth in LHI with continued strong yields • LHS contribution to growth and earnings remained strong • Improved funding profile with growth in deposits and matched funding of LHS – NIM decrease of 6 bps from Q4-2011 and increase of 8 bps from Q1-2011 • Reduction in funding costs from Q1-2011, no change from Q4-2011 • LHI yields remained above 5% • Highly liquid LHS growth supported with borrowed funds; yield driven by mortgage rates for excellent spreads – Reduced credit costs with reduction in NPAs and NCOs – Dramatic improvements in ROA and ROE to 1.33% and 17.36% for Q1-2012 Financial Review 4 |
 Loan Growth – Broad-based growth in LHI • Averages increased 5% from Q4-2011 and 20% from Q1-2011 • Quarter-end balance $131 million or 2% above Q1-12 average – Average LHS balances consistent with Q4-2011 with surge at end of quarter Funding – Funding profile improved with DDA and total deposit growth – LHS match funded with borrowings, producing excellent spreads for highly liquid, short- duration earning assets Credit Costs – Total credit costs of $5.7 million for Q1-2012 • Consistent with expectations for improvement in trends • Provision of $3.0 million compared to $6.0 million in Q4-2011, primarily related to growth • OREO valuation cost of $2.7 million compared to $1.1 million in Q4-2011 • NCOs of $828,000 (6 bps), down from $3.4 million (25 bps) in Q4-2011 – Continued improvement in level of NPAs Financial Review 5 |
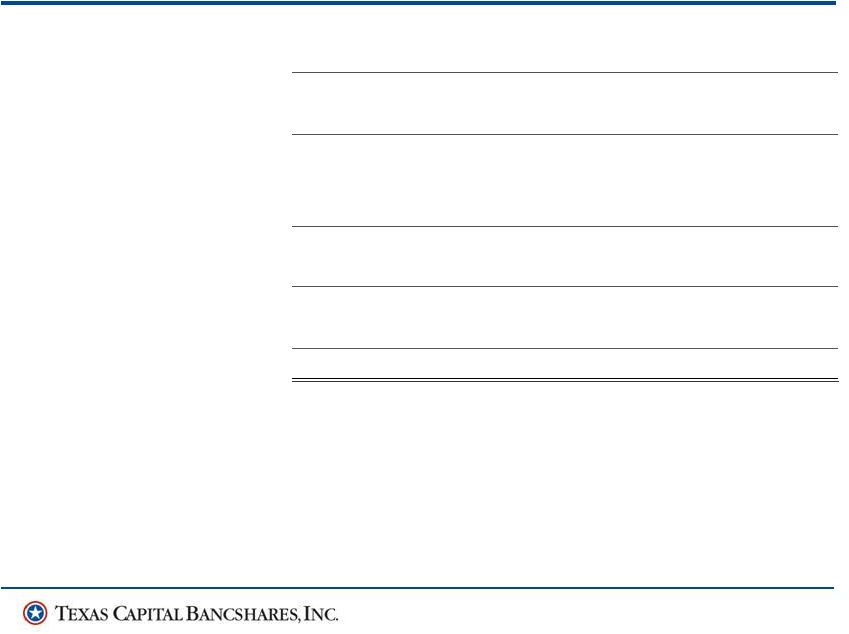 6 Q1-12 Q4-11 Q3-11 Q2-11 Q1-11 Net interest income $ 88,229 $ 88,147 $ 79,198 $ 71,094 $ 64,498 Non-interest income 9,190 8,994 7,603 7,951 7,684 Net revenue 97,419 97,141 86,801 79,045 72,182 Provision for credit losses 3,000 6,000 7,000 8,000 7,500 OREO valuation and write-down expense 2,741 1,091 1,662 725 3,320 Total provision and OREO valuation 5,741 7,091 8,662 8,725 10,820 Non-interest expense (1) 49,535 49,262 44,524 44,538 43,079 Income before income taxes 42,143 40,788 33,615 25,782 18,283 Income tax expense 15,062 15,043 11,905 9,074 6,344 Net income $ 27,081 $ 25,745 $ 21,710 $ 16,708 $ 11,939 Diluted EPS $ .70 $ .67 $ .56 $ .44 $ .31 Net interest margin 4.54% 4.60% 4.81% 4.86% 4.46% ROA 1.33% 1.28% 1.25% 1.08% .78% ROE 17.36% 17.05% 14.93% 12.13% 8.91% Efficiency (1) 50.8% 50.7% 51.3% 56.3% 59.7% Income Statement (in thousands) (1) Excluding OREO valuation charge |
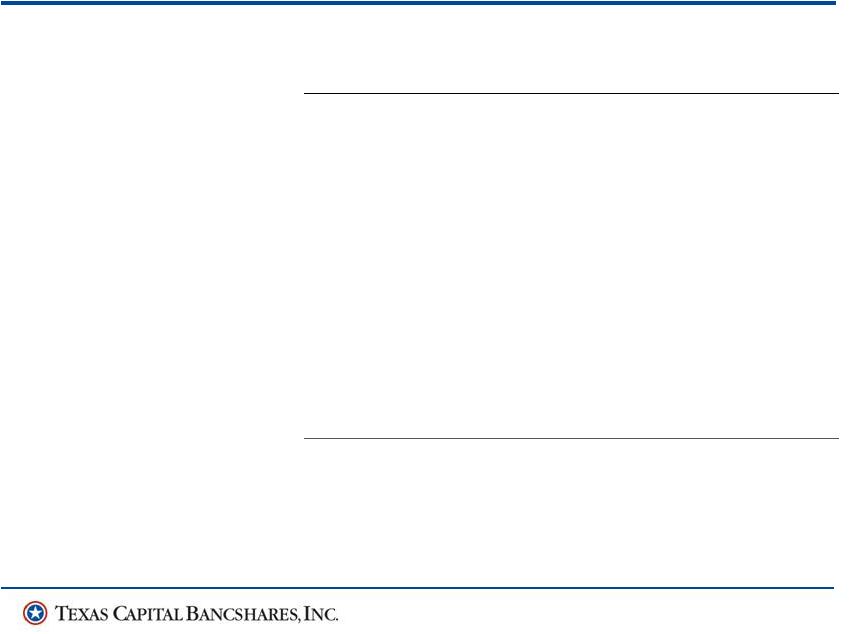 7 QTD Average Balances, Yields and Rates (in thousands) Q1 2012 Q4 2011 Q1 2011 Avg. Bal. Yield Rate Avg. Bal. Yield Rate Avg. Bal. Yield Rate Assets Securities $ 137,509 4.24% $ 139,826 4.43% $ 177,161 4.65% Fed funds sold & liquidity investments 56,318 .36% 51,149 .36% 81,476 .28% Loans held for sale 2,036,622 4.21% 2,093,883 4.23% 735,682 4.78% Loans held for investment 5,660,993 5.01% 5,395,253 5.09% 4,721,928 5.10% Total loans, net of reserve 7,627,354 4.84% 7,421,922 4.89% 5,387,468 5.12% Total earning assets 7,821,181 4.80% 7,612,897 4.85% 5,886,179 4.84% Total assets $8,209,190 $7,995,474 $6,183,239 Liabilities and Stockholders’ Equity Total interest bearing deposits $4,134,976 .34% $3,965,614 .35% $3,901,587 .39% Other borrowings 1,554,716 .19% 1,588,198 .17% 159,450 .28% Long-term debt 113,406 2.52% 113,406 2.34% 113,406 2.26% Total interest bearing liabilities 5,803,098 .34% 5,667,218 .34% 4,174,443 .55% Demand deposits 1,700,390 1,659,132 1,417,734 Stockholders’ equity 627,594 598,982 543,309 Total liabilities and stockholders’ equity $8,209,190 .24% $7,995,474 .24% $6,183,239 .37% Net interest margin 4.54% 4.60% 4.46% |
 8 QTD Averages Q1 2012 Q4 2011 Q1 2011 Q1/Q4 % Change YOY % Change Total assets 8,209,190 7,995,474 6,183,239 3% 33% Loans held for investment $5,660,993 $5,395,253 $4,721,928 5% 20% Loans held for sale 2,036,622 2,093,883 735,682 (3)% 177% Total loans 7,697,615 7,489,136 5,457,610 3% 41% Securities 137,509 139,826 177,161 (2)% (22)% Demand deposits 1,700,390 1,659,132 1,417,734 2% 20% Total deposits 5,835,366 5,624,746 5,319,321 4% 10% Stockholders’ equity 627,594 598,982 543,309 5% 16% Financial Summary (in thousands) |
 9 Financial Summary (in thousands) Period End Q1 2012 Q4 2011 Q1 2011 Q1/Q4 % Change YOY % Change Total assets 8,559,917 8,137,225 6,061,046 5% 41% Loans held for investment $5,792,349 $5,572,371 $4,711,424 4% 23% Loans held for sale 2,255,281 2,080,081 811,400 8% 178% Total loans 8,047,630 7,652,452 5,522,824 5% 46% Securities 123,828 143,710 171,990 (14)% (28)% Demand deposits 1,751,443 1,751,944 1,480,695 0% 18% Total deposits 6,063,558 5,556,257 5,221,991 9% 16% Stockholders’ equity 647,341 616,331 544,925 5% 19% |
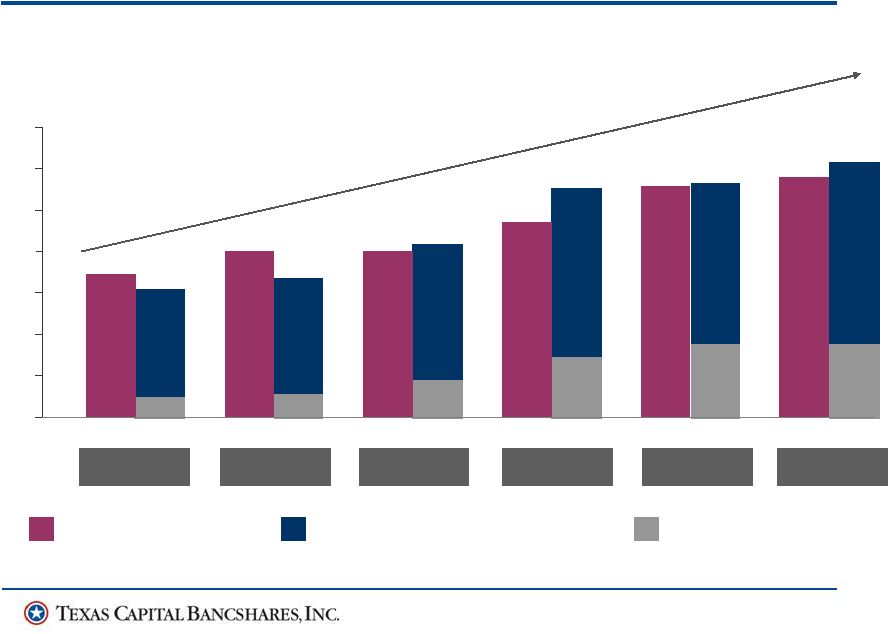
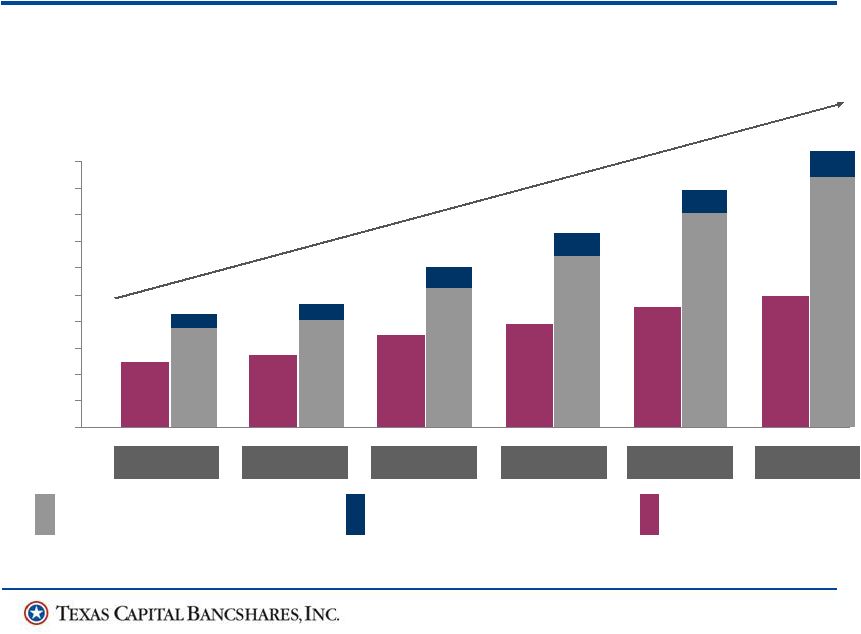 10 98,606 181,403 198,140 109,651 137,733 154,985 $0 $40,000 $80,000 $120,000 $160,000 $200,000 $240,000 $280,000 $320,000 $360,000 $400,000 367 732 1097 1462 1828 2193 2007 2008 2009 2010* 2011* ($ in thousands) Q1-2012*^ 160,379 174,207 225,951 273,937 335,169 389,676 Operating Revenue CAGR: 23% Net Interest Income CAGR: 24% Non-interest Income CAGR: 15% Non-interest Expense CAGR: 19% Net Income CAGR: 34% Revenue and Expense Growth *Excludes OREO valuation expenses ^Annualized based on 3/31/12 data Net Interest Income Non-interest Income Non-interest Expense |
 11 Deposit and Loan Growth 3,066 3,333 4,121 5,455 5,557 6,064 367 732 1097 1462 1828 2193 Loans HFI Interest Bearing Deposits Demand Deposits 4,711 5,792 5,572 3,462 4,028 4,457 $0 $1,000 $2,000 $3,000 $4,000 $5,000 $6,000 $7,000 2007 2008 2009 2010 2011 ($ in millions) Q1-2012 Demand Deposit CAGR: 33% Total Deposit CAGR: 17% Loans Held for Investment CAGR: 13% |
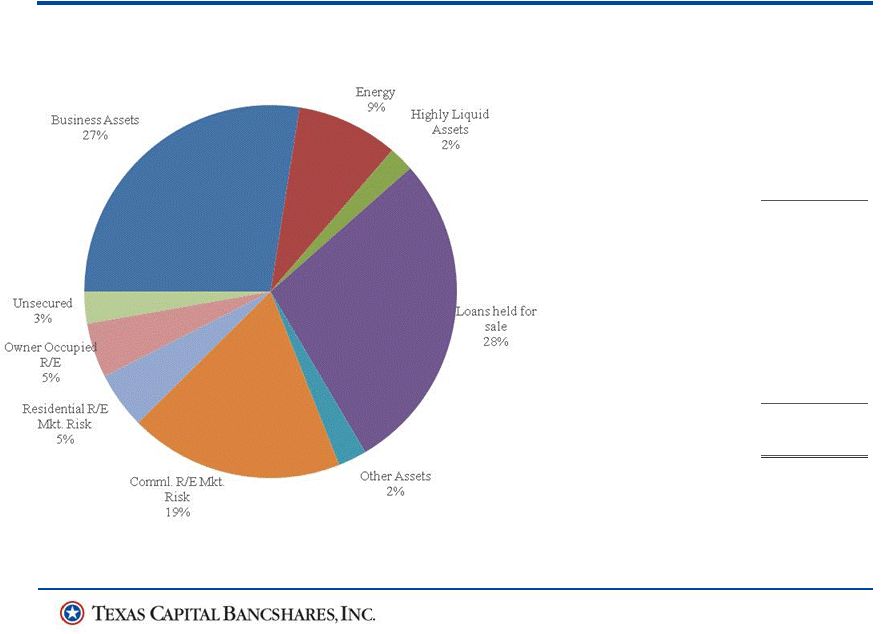 12 Loan Portfolio Statistics Non-accrual loans Commercial $ 9,486 Construction 20,699 Real estate 19,345 Consumer 293 Equipment leases 337 Total non-accrual loans $ 50,160 Non-accrual loans as % of loans held for investment .87% Non-accrual loans as % of total loans .62% OREO 32,601 Total Non-accruals + OREO $ 82,761 Non-accrual loans + OREO as % of loans held for investment + OREO 1.42% Total Loans $8,047,630 All numbers in thousands. Loan Collateral by Type 3/31/12 |
 13 Credit Quality Improved Credit Trends – Total credit cost of $5.7 million for Q1-2012, compared to $7.1 million in Q4-2011 and $10.8 million in Q1-2011 • Provision of $3.0 million for Q1-2012 compared to $6.0 million for Q4-2011 and $7.5 million in Q1-2011, reflecting better trends • NCOs of $828,000, representing 6 bps compared to 25 bps for Q4-2011 and 58 bps in 2011 • OREO valuation charge of $2.7 million compared to $1.1 million in Q4-2011 and $3.3 million in Q1-2011 – Improvement in NPA to lowest level since Q2-2009 • Decrease of $5.9 million (7%) from Q4-2011 • Reduction of $97.6 million (54%) from peak level in Q2-2010 • NPA ratio of 1.42% compared to 1.58 % in Q4-2011 and 3.01% in Q1-2011 • NPLs at $50.2 million, down $4.4 million from Q4-2011 and $66.3 million from Q1-2011 • NPL ratio at 0.62% of total loans and 0.87% of LHI – Continued reduction in credit costs and NPAs expected in remainder of 2012 |
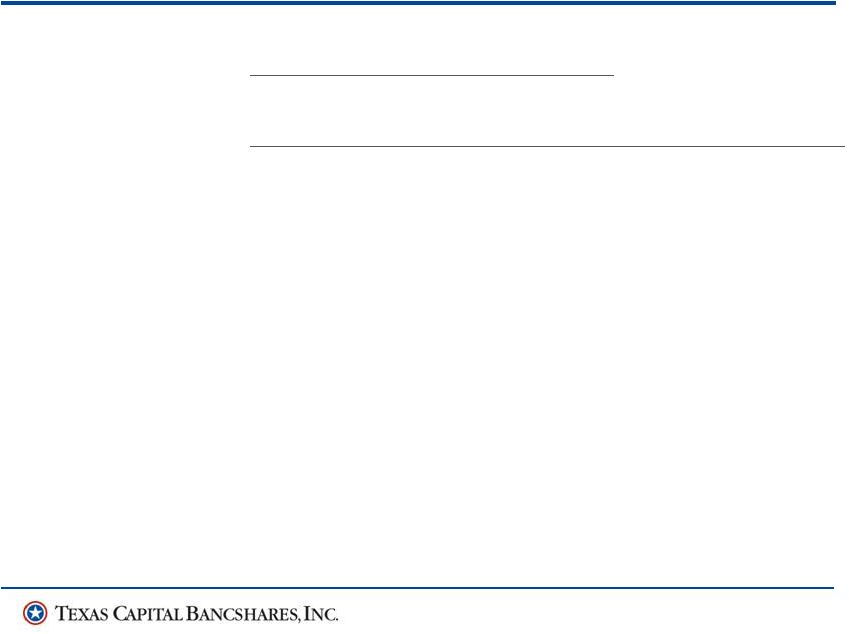
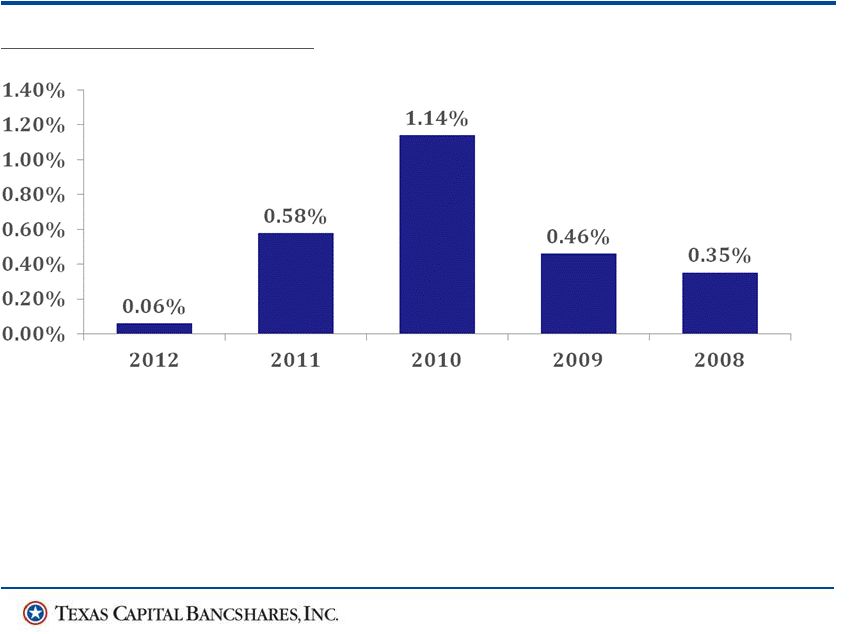 14 Credit Quality Combined reserve / Loans * 1.29% 1.31% 1.56% 1.59% 1.16% Non-accrual loans + OREO to loans * + OREO 1.42% 1.58% 3.25% 2.74% 1.81% Combined reserve to non-accruals 1.4x 1.3x .6x .7x 1.0x Net Charge-offs / Average Loans * Excludes loans held for sale. |
 15 Closing Comments • Strong core earnings and growth continuing in 2012 • Maintaining capital position needed to grow the business with exceptional ROE • Credit cost improvements continue • Loan growth potential good for LHI with strong pipeline • LHS balances to remain high • Business model to continue to produce industry-leading results |
 Q&A |