UNITED STATES
SECURITIES AND EXCHANGE COMMISSION
Washington, D.C. 20549
FORM 10-K
(Mark One)
| x | ANNUAL REPORT PURSUANT TO SECTION 13 OR 15(d) OF THE SECURITIES EXCHANGE ACT OF 1934 |
| | |
| For the fiscal year ended | December 31, 2008 |
| | or |
| | |
| o | TRANSITION REPORT PURSUANT TO SECTION 13 OR 15(d) OF THE SECURITIES EXCHANGE ACT OF 1934 |
| For the transition period from | | to | |
| | | | |
| Commission file number | 000-25367 |
| INTERNATIONAL FUEL TECHNOLOGY, INC. |
| (Exact name of registrant as specified in its charter) |
| Nevada | | 88-0357508 |
| (State or other jurisdiction of incorporation or organization) | | (I.R.S. Employer Identification No.) |
| | | |
7777 Bonhomme Avenue, Suite 1920 St. Louis, Missouri | | 63105 |
| (Address of principal executive offices) | | (Zip Code) |
Registrant’s telephone number, including area code: (314) 727-3333
Securities registered pursuant to Section 12(b) of the Act: None.
Securities registered pursuant to Section 12(g) of the Act:
| Common Stock, $0.01 Par Value |
| (Title of Class) |
Indicate by check mark if the registrant is a well-known seasoned issuer, as defined in Rule 405 of the Securities Act. o Yes x No
Indicate by check mark if the registrant is not required to file reports pursuant to Section 13 or Section 15(d) of the Act. o Yes x No
Indicate by check mark whether the registrant (1) has filed all reports required to be filed by Section 13 or 15(d) of the Securities Exchange Act of 1934 during the preceding 12 months (or for such shorter period that the registrant was required to file such reports), and (2) has been subject to such filing requirements for the past 90 days. x Yes o No
Indicate by check mark if disclosure of delinquent filers pursuant to Item 405 of Regulation S-K (§229.405 of this chapter) is not contained herein, and will not be contained, to the best of registrant’s knowledge, in definitive proxy or information statements incorporated by reference in Part III of this Form 10-K or any amendment to this Form 10-K o
Indicate by check mark whether the registrant is a large accelerated filer, an accelerated filer, a non-accelerated filer or a smaller reporting company. See the definitions of “accelerated filer large accelerated filer,” “accelerated filer” and “smaller reporting company” in Rule 12b-2 of the Exchange Act. (Check one):
| | Large accelerated filer | o | | Accelerated filer | o |
| | Non-accelerated filer | o | | Smaller Reporting Company | x |
| | (Do not check if a smaller reporting company) | | |
Indicate by check mark whether the registrant is a shell company (as defined in Rule 12b-2 of the Exchange Act).
o Yes x No
The aggregate market value of the voting and non-voting common equity held by non-affiliates computed by reference to the price at which the common equity was last sold, or the average bid and asked price of such common equity, as of the last business day of the registrant’s most recently completed second fiscal quarter was $38,520,198.
Indicate the number of shares outstanding of each of the registrant’s classes of common stock, as of the latest practicable date. 101,692,284 as of March 24, 2009
DOCUMENTS INCORPORATED BY REFERENCE
None.
INTERNATIONAL FUEL TECHNOLOGY, INC.
FORM 10-K
For The Fiscal Year Ended December 31, 2008
INDEX
| | | Page |
| Part I. | | |
| Item 1. | Business | 1 |
| Item 1A. | Risk Factors | 9 |
| Item 1B. | Unresolved Staff Comments | 14 |
| Item 2. | Properties | 14 |
| Item 3. | Legal Proceedings | 14 |
| Item 4. | Submission of Matters to a Vote of Security Holders | 15 |
| | | |
| Part II. | | |
| Item 5. | Market for Registrant’s Common Equity, Related Stockholder Matters and Issuer Purchases of Equity Securities | 16 |
| Item 6. | Selected Financial Data | 17 |
| Item 7. | Management’s Discussion and Analysis of Financial Condition and Results of Operations | 18 |
| Item 8. | Financial Statements and Supplementary Data | 28 |
| Item 9. | Changes in and Disagreements With Accountants on Accounting and Financial Disclosure | 28 |
| Item 9A(T). | Controls and Procedures | 28 |
| Item 9B. | Other Information | 30 |
| | | |
| Part III. | | |
| Item 10. | Directors, Executive Officers and Corporate Governance | 30 |
| Item 11. | Executive Compensation | 32 |
| Item 12. | Security Ownership of Certain Beneficial Owners and Management and Related Stockholder Matters | 41 |
| Item 13. | Certain Relationships and Related Transactions, and Director Independence | 43 |
| Item 14. | Principal Accountant Fees and Services | 43 |
| | | |
| Part IV. | | |
| Item 15. | Exhibits and Financial Statement Schedules | 45 |
| | | |
| Signatures | | |
| | | |
| Exhibit Index | | |
PART I
FORWARD-LOOKING STATEMENTS
We have made forward-looking statements in this document within the meaning of Section 21E of the Securities Exchange Act of 1934, as amended, that are based on management’s current reasonable expectations, estimates and projections. Words such as “expects,” “anticipates,” “intends,” “plans,” “believes,” “estimates,” variations of such words and similar expressions are intended to identify such forward-looking statements. Forward-looking statements are subject to risks and uncertainties, many of which are difficult to predict and generally beyond our control, that could cause actual results to differ materially from those expressed or implied in the forward-looking statements. Such risks include, but are not limited to, risks relating to economic, competitive and other factors affecting our operations, markets, products and services and marketing and sales strategies, as well as the risks noted under the section in this report entitled “Risk Factors.” We do not undertake any obligation to revise these forward-looking statements to reflect future events or circumstances.
INTRODUCTION
International Fuel Technology, Inc. (“IFT”) was incorporated in Nevada on April 9, 1996 by a team of individuals who sought to address the challenges of reducing harmful emissions while at the same time improving the operating performance of internal combustion engines, especially with respect to fuel economy and engine cleanliness. After our incorporation, our initial focus was product research and development, but beginning in late 2005 and early 2006, our efforts have been directed to commercializing our product slate, primarily our diesel fuel additive, DiesoLIFTTM, by focusing on marketing, sales and distribution efforts.
We are engaged in one reportable industry segment. Financial information regarding this segment is contained in our financial statements and notes thereto included in this report.
For information regarding revenues from external customers attributed to our domestic operations and to all foreign countries, see Note 1 to our financial statements for the fiscal year ended December 31, 2008.
At December 31, 2008, we had five full-time employees. None of our employees are represented by a labor union or is subject to a collective bargaining agreement. We believe that our employee relations are good.
We are a technology company that has developed a range of liquid fuel additive products that improve the combustion characteristics of petroleum-based fuels and renewable liquid fuels. This provides significant benefits including improvement in fuel economy, clean up and prevention of fuel system deposits and a reduction in harmful emissions. Unlike traditional petroleum-based fuel additives, all of our products are derived from environmentally-friendly detergent surfactants. These surfactants decrease the energy required to create new surfaces at liquid-air, liquid-water and liquid-solid (pipe wall) interfaces, which in turn create the beneficial effects of our technology. The surfactant products are manufactured by Air Products, Inc. and Multisol France (see “Manufacturing Partners”), pursuant to manufacturing and supply agreements.
We have developed additive products for diesel, pure bio-diesel, bio-diesel fuel blends, gasoline and kerosene (heating oil) fuels. The process of blending our products with fuel is easily accomplished through a variety of blending mechanisms, including automatic direct injection and manual splash blending. The surfactant base of our
technology and products is unlike other conventional fuel additive technologies. Because of the unique character of surfactant molecules, our formulations provide an effective coating of the fuel system, increasing lubricity (reducing engine wear and tear), while the detergent character of the molecules prevents deposit formation on fuel injectors. In addition, the dispersal of the surfactant molecules throughout the fuel results in greater fuel atomization through engine fuel injectors, increasing combustion efficiency, improved fuel economy and emissions reduction.
Our additive products are easily blended into motor fuels, or combined with base motor fuels plus other fuel formulations, including bio-diesel, synthetic diesel, ethanol and urea/water, creating environmentally-friendly finished fuel blends. The resulting fuel blends improve fuel economy, enhance fuel system lubricity and reduce harmful engine emissions, while decreasing usage of petroleum-based fuels through the combination of our products with the alternative and renewable fuels. With the increasing pressure from public and private efforts around the world to reduce the level of harmful engine emissions, combined with the uncertain cost of base fuel, we believe our technology is poised to become one of the leading fuel performance enhancement technologies available to facilitate the worldwide effort to address these issues.
We have funded and completed several independent laboratory testing efforts conducted by various well-regarded laboratories in the United States, Canada, Europe, South Africa, China and Thailand to confirm the efficacy of our technology. We have completed customer-focused field-testing, which has validated independent laboratory test results. Additional field-testing and various other laboratory testing efforts are currently underway to further our product commercialization efforts.
TECHNOLOGY
Our surfactant-based additive formulations are composed of a complex mixture of chemical molecules which, when blended into petroleum distillates, lower the base fuel’s overall surface tension. This allows for improved atomization of the fuel in the induction and combustion chambers, resulting in a more complete and efficient burn, improving fuel economy and reducing harmful emissions. Due to their inherent lubricity, detergency and emulsification properties, our additives also (i) substantially increase fuel lubricity; (ii) eliminate phase separation when combining petroleum-based fuels with oxygenates, such as ethanol; (iii) act as a detergent in the fuel delivery system and significantly reduce deposits on fuel injector heads; and (iv) co-solve normal amounts of free water in the system.
Once the additive is blended with a base fuel, the blend forms into and remains a stable solution. No additional mixing or agitation is required for the fuel blend to remain perfectly mixed.
The following summarizes the primary benefits of our technology:
· Fuel economy: The reduction in the fuel’s overall surface tension as it enters the combustion chamber allows for improved atomization, resulting in a more complete burn. The engine, therefore, is effectively maximizing the inherent energy in the fuel. Fuel economy is also enhanced by (i) increased lubricity which reduces friction in the fuel system, and (ii) the detergency effect which prevents the deterioration of engine performance caused by detrimental deposits.
· Lubricity: The introduction of our additive technology increases the lubricity of the fuel. In addition, the additive will adsorb to the sides of the engine fuel system. This has the effect of coating the fuel system and reducing the friction created as the fuel flows through it.
· Detergency: Because surfactants are detergents, they will act to constantly clean the fuel system and engine. The detrimental deposits, which might occur in ordinary use, are washed out and retained by fuel and lube oil filters.
· Emissions: The improved atomization of the fuel, resulting from the use of our additives, provides for a more complete combustion of the fuel. As a result, the amount of harmful carbon monoxide, unburned hydrocarbons and particulate matter (“PM”) emissions are reduced significantly. The increased fuel efficiency and economy resulting from the use of our additive means that less fuel has to be burned for the same power output. Therefore, for the same power output, less carbon dioxide and nitrogen oxides (“NOx”) (both “green house” gases) are released into the atmosphere.
· Co-solvency: An exciting benefit of our additive technology is the ability to hold limited amounts of ethanol and/or water in gasoline and diesel as a stable, homogeneous fuel. This is possible because our additives are based on surfactant physical chemistry. This enables the water and/or ethanol molecules to be distributed throughout the fuel in a stable and homogeneous manner, preventing phase separation and enhancing uniform combustion.
· Microbial contamination: If small amounts of water are present in the fuel, and phase separation occurs, aerobic and anaerobic bacterial and fungal growths may occur in the aqueous phase. The co-solving effect of our additives prevents phase separation from occurring and eliminates the environment for microbial growth. This reduces the need for biocides to treat the fuel, which can be expensive and difficult to handle.
· Corrosion inhibitors: Our fuel additives are natural corrosion inhibitors. When the additive surfactant molecules adsorb to the side of the fuel system, they provide a protective coating. Also, the ability to co-solve any free water in the fuel, and prevent phase separation, helps prevent any corrosion that may occur due to the aqueous phase.
· Reduced maintenance: The combined effects of improved lubricity, detergency, water co-solvency, corrosion inhibition, and cleaner burn resulting from the use of our additive technology extend the service life of the engine while reducing maintenance costs.
Research and development costs are expensed as incurred. Research and development expense paid to external vendors for 2008, 2007 and 2006 was $131,974, $138,247, and $530,110, respectively.
We have filed three patents resulting in five national applications pertaining to different uses of our proprietary technology relating to our fuel additives and fuel blends.
A patent application covering the chemical formulations for the additives DiesoLIFT™, GasoLIFT™ and KeroLIFT™ has been filed and is pending. We have also filed an international patent application, under the Patent Cooperation Treaty, covering our technology in many countries. In addition, we and Tomah Products, Inc. (“Tomah”), an Air Products, Inc. subsidiary (see “Manufacturing Partners”), have filed a joint patent pertaining to urea/water technology. These patent applications protect our technology in many countries.
Additional patent applications for extension of our technology are constantly evaluated as additional scientific, technical data and laboratory testing results become available.
INDEPENDENT TESTING
There are two primary methods of product testing: laboratory bench tests and field trials. We utilize both testing methods to further develop the body of test data necessary to support marketing and sales efforts. As IFT has matured, we have become aware of the importance of developing and managing specific testing protocols for field-based testing and adhering to already developed, industry recognized testing standards when engaged in laboratory bench tests. Numerous variables exist in any testing protocol and if not carefully managed, one change in one variable can skew test results. To address this challenge, standardized testing and trial evaluation protocols, both industry prescribed and custom developed, are followed whenever laboratory or field-testing is undertaken. The use of these protocols allows us to: (i) effectively analyze and interpret test results; (ii) ensure testing is structured and conducted in a controlled way; (iii) ensure we will have full access to all testing results conducted by third parties; and (iv) assist our marketing and sales efforts through potential client recognition of and attention to results generated from industry adopted testing protocols.
In addition to extensive field-based customer trials completed or under way, we have funded extensive laboratory bench testing at numerous well-known independent testing laboratories, including:
| · | M.I. Technologies, in the United Kingdom; |
| · | Southwest Research Institute, in the United States; |
| · | Forest Engineering Research Institute of Canada – FERIC; |
| · | Motive Power, in the United States; |
| · | Gerotek, in South Africa; |
| · | Prodrive Ltd, in the United Kingdom; |
| · | BfB Laboratories, in Belguim; |
| · | Tsinghua University, in China. |
Test results have confirmed the effectiveness of our additive formulations. In particular, IFT fuel blends tested have achieved: (i) an increase in fuel economy; (ii) an increase in lubricity; and (iii) a reduction in harmful emissions.
We have introduced three trademarked product brands that are being marketed around the world: DiesoLIFT™, GasoLIFT™, and KeroLIFT™.
DiesoLIFT™ 10 DiesoLIFT™ 10 is IFT’s proprietary fuel enhancing technology for use with diesel fuel and bio-diesel fuel blends. DiesoLIFT™ 10 has been scientifically proven to increase fuel economy and fuel lubricity while reducing harmful fuel emissions.
DiesoLIFT™ BD-3 DiesoLIFT™ BD-3 is a unique formulation developed for the stabilization of bio-diesel bases of various origins and corresponding bio-diesel fuel blends (B5, B-10, B-20, etc.). DiesoLIFT™ BD-3 provides protection against premature and developing oxidation and can be utilized for storage stability and deposit control.
DiesoLIFT™ EM-1 DiesoLIFT™ EM-1 is engineered to deliver the same improved lubricity, co-solvency of water, cleaning of fuel systems, improved fuel economy and environmental benefits of DiesoLIFT™ 10. However, DiesoLIFT™ EM-1 also provides oxidation stability and deposit control benefits to bio-diesel and bio-diesel fuel blends.
GasoLIFT™ GasoLIFT™ is the range of products specifically designed to apply our fuel enhancing technology to gasoline motor fuel and engines. Use of GasoLIFT™ provides similar benefits to gasoline engines as DiesoLIFT™ 10 provides to diesel engines.
KeroLIFT™ KeroLIFT™ has been specifically formulated to bring added benefits to heating oils, kerosene fuel systems and oil burners for all oil-fired equipment applications. KeroLIFTTM has a positive effect on the environment by reducing harmful emissions and “green house” gases, and by eliminating smoke.
MANUFACTURING PARTNERS
In 2001, we signed a manufacturing agreement with Tomah, a specialty chemical manufacturer. The agreement allows us to consider sourcing the supply of our products from others, but allows Tomah the right of first refusal to meet the terms of other supplier proposals. If Tomah elects not to meet the third party terms, we then have the right to contract with the third party for the manufacture and supply of our products. The agreement covers existing and to-be-developed fuel performance enhancement additive products utilizing our technology. The agreement also provides for Tomah and us to cooperate and work together to optimize the effectiveness of and reduce the manufacturing and supply costs of the additive product formulations, as well as collaborate on product research and development activities. The agreement has a 15-year term.
Tomah, headquartered in Milton, Wisconsin, with production facilities in both Wisconsin and Louisiana, was purchased by Air Products, Inc., a worldwide manufacturer and supplier of chemical, industrial gases and other industrial products, in 2005. Tomah specializes in the manufacturing of specialty chemicals with an emphasis on industrial surfactants. Tomah manufactures products for a variety of industries, including fuel additives, mining and industrial and institutional cleaning. Tomah markets and distributes its products to companies around the world. Originally founded in 1967, Tomah was acquired by Exxon in 1984 and operated as a division of Exxon Chemical until 1994, when it was spun off in a management buyout. Tomah excels at custom manufacturing and in developing products designed to meet specific needs. We chose Tomah as our manufacturing and supply partner because of its manufacturing capabilities, rapid response times, service level, industry contacts and technical expertise. We believe our relationship with Tomah and Air Products, Inc. to be excellent.
In addition, in July 2008 we signed a manufacturing agreement and a marketing and distribution agreement with Multisol France. Multisol France is part of the Multisol Group, a prominent international chemical, additives and lubricants manufacturer and distributor with operations in Europe, the Middle East and Africa. The manufacturing agreement covers existing and to-be-developed fuel performance enhancement additive products utilizing our technology. The agreement also provides for Multisol and us to cooperate and work together to optimize the effectiveness of and reduce the manufacturing and supply costs of the additive product formulations, as well as collaborate on product research and development activities. Either party may terminate the manufacturing agreement by providing the other party advance notice at least 180 days before desired termination date. The manufacturing agreement has a 15-year term. The marketing and distribution agreement has a term ending December 31, 2012 and can be terminated by either party with cause after providing at least 90 days notice of termination.
Government regulations across the globe regarding motor fuels are continually changing. Most regulation focuses on fuel emissions. However, there is also growing concern about dependence on hydrocarbon-based fuels. This is driving legislation and regulation toward mandating alternative fuels such as bio-fuels and providing incentives for their development and use. Fuels regulation exists at various levels of government and enforcement around the globe. However, we believe the consistent pattern of regulations designed to reduce harmful emissions and reduce
dependence on oil for fuel needs will only become more stringent. This will be an advantage to us as many of our product’s benefits reduce fuel consumption and improve performance of alternative fuel blends. We believe that as fuels regulatory compliance becomes more burdensome to fuel manufacturers, suppliers and users, demand for the benefits our products deliver should increase. One of our strategies is to monitor government fuel related regulatory activity in the countries strategic to our business plan. This surveillance program is designed to support the product development and intellectual property process to ensure our products respond to the changing regulatory climate and are protected as quickly as possible to maintain competitive advantage. The surveillance program also supports the marketing of our products to accentuate their attributes in helping customers meet the new regulatory compliance directives.
As an example, in January 2000, the Environmental Protection Agency in the United States (“EPA”) enacted a stringent and far-reaching set of diesel emission standards that requires the significant reduction in harmful emissions, especially PM and NOx. These regulations were phased in beginning in 2004. PM in diesel emissions is to be reduced by 90% and NOx is to be reduced by 95%. Of equal importance to diesel fuel producers, the EPA also requires 97% of the sulfur currently in diesel fuel be eliminated beginning in 2006. The elimination of sulfur in diesel fuel will likely cause a decrease in diesel fuel lubricity. Our products are well-positioned to benefit from the more stringent environmental rules, as tests have shown positive PM reduction effects and increased lubricity attributes when our products are added to base diesel fuel.
Another example is the regulation passed applicable to the European Union (“EU”) regarding the use of bio-fuels (bio-diesel and ethanol). The EU is supporting bio-fuels with the aim of reducing “green house gas” emissions, boosting the de-carbonization of transport fuels, diversifying fuel supply sources, offering new income opportunities in rural areas and developing long-term replacements for fossil fuel. In May 2003, the European Parliament and the Council adopted the “Directive on the promotion of the use of bio-fuels or other renewable fuels for transport.” This Directive aims at promoting the use of bio-fuels or other renewable fuels to replace diesel or petrol for transport purposes, with a view to contribute to objectives such as improving the security of energy supply, reducing “green house gas” emissions and creating new opportunities for sustainable rural development. The Directive requires member states to ensure that a minimum proportion of bio-fuels and other renewable fuels for transport is placed on the market and, to that effect, set indicative targets. Reference values for these targets are: 2% for the end of 2005 and 5.75% for the end of 2010, on the basis of energy content of all petrol and diesel for transport purposes. Member states may deviate from the reference values but if they do, they should report their motivations for the deviation to the Commission.
Current efforts are being demonstrated in the United States to encourage the development of alternative fuels and the required use of ethanol. In an effort to reduce dependence on foreign oil and keep up with increasing demand for petroleum products, the United States Department of Energy (“DOE”) has created and sponsored programs that encourage the use of these alternative fuels. The programs, such as the one derived from the Energy Policy and the ethanol and bio-diesel subsidy programs implemented by the DOE and other government agencies, in response to the 2005 energy legislation, provide significant incentives for the adoption of targeted fuel blends, the performance of which can be enhanced by the use of our products. We believe our products are well-positioned to help fuel producers and consumers comply with current and future fuels related regulatory standards and take advantage of existing incentive programs in the United States and the rest of the world.
Our product slate and business is a part of the hydrocarbon fuels and lubricants additive industry. The industry is composed of a few relatively large companies and a large number of smaller participants. We fall into the latter category. The large firms capture their revenue through sales of proprietary, branded products, or by sales to fuel refiners to meet state and federal fuel specifications, or fuel wholesalers and retailers trying to differentiate their own branded products. The common denominator is all industry participants produce products which are added to hydrocarbon fuels to allow the fuel, or the overall fuel system, to perform better with the additive than without. They do not make the fuel itself.
The main thrust of industry participants’ products centers around improved engine cleanliness and efficiency (e.g., detergency characteristics applicable to fuel injector nozzles), improved fuel flow (e.g., mitigation of fuel problems caused by low ambient temperature) and fuel system protection (e.g., improved lubricity). These are common focus areas for the full range of gasoline and distillate fuels. Additives designed to address specific problem areas in specific fuel applications (e.g., Cetane improver in diesel fuel) and static electricity dissipation in turbine engines are also significant.
The primary market for IFT is fuel economy improvement. Although many companies make claims regarding the ability of their respective products to improve fuel economy, we are not aware of any fuel additive formulation that has consistently demonstrated the ability to achieve the fuel economy improvement achieved by IFT products in independent laboratory testing and field trials. The potential market for IFT products is virtually every gallon of diesel fuel and bio-diesel fuel blend consumed in the world today.
The breadth of existing technologies making claims to have solved engine emissions problems runs the gamut from alternative fueled vehicles (electric cars, fuel cell vehicles, etc.) to engine magnets. Despite the vast amount of research that has been performed with the intention of solving emissions problems, no single technology has yet to gain widespread acceptance from both the public (regulatory) and private sectors. The United States government and the governments of other countries have tried using economic incentives and tax breaks to promote the development of a variety of emissions reduction technologies. However the base cost of many of these incentives coupled with issues such as lack of appropriate infrastructure (e.g., compressed natural gas storage and delivery systems) and technical limitations (e.g., keeping alternative fuels emulsified, significant loss of power and fuel economy with present alternative fuels), currently makes market acceptance of many technologies not economically feasible over the long term.
Given these limitations, it is unlikely that the global marketplace will accept just one technology, or a limited number of technologies to solve the harmful engine emissions problem. We believe the “natural selection” expected to take place over the coming decade for new technologies may evolve on a market-by-market basis and will be largely dependent upon local regulatory conditions. Signs of the changing emissions regulatory environment can be seen in:
| | · | Europe, where several countries, including the United Kingdom, France and Italy have enacted legislation providing tax breaks to companies that use fuel emulsions blending diesel and water; |
| | · | United States, where legislation has been enacted in Texas granting tax incentives to diesel – water-based emulsions and in California, where low-sulfur diesel is being phased in and agricultural lobbies are promoting the use of alternative fuels such as bio-diesel and ethanol; |
| | · | China, where the central government has supported fuel ethanol development in certain provinces which have responded by building and operating ethanol distilleries, including the largest corn-derived ethanol distillery in the world in Jilin province; |
| | · | Brazil, with a long history of fuel ethanol, where regulations require a fuel blend with up to 25% ethanol; also, a new bio-diesel program has started that requires blends increasing from 2% to 5% bio-diesel in diesel; and |
| | · | EU where the bio-fuels directive imposes a minimum proportion of 5.75% bio-fuels in 2010 (bio-diesel and bio-ethanol) on the basis of energy content of all petrol and diesel for transport purposes. |
Because the efforts to reduce harmful engine emissions are so widespread throughout the world, the market for competitive alternatives to existing solutions is relatively robust. In general, these efforts can be placed into four categories:
| | · | Fuel blends (including bio-diesel, water and ethanol); |
| | · | Additive technologies (catalysts such as metallic or precious metal additives); |
| | · | Alternative fuels (compressed natural gas, bio-diesel, and others); and |
| | · | After-market systems (catalytic converters). |
As a result of the pursuit, primarily by governments around the world, to mandate cleaner fuels and less dependence on hydrocarbon-based fuels through all the disparate efforts currently underway, we believe no one competitor or technology will come to dominate world market demand for additive technology. Rather, we believe a combination of technologies that maximizes individual product and technology strengths, limits their weaknesses, and delivers the highest cost/value relationship will be used.
Our industry and competitor product slate and technology is constantly evolving. Many competitors make very similar product benefit claims; such as detergency, lubricity and anti-corrosion, with a few now beginning to make fuel economy claims as well. Our challenge is to increase our product visibility and to rise above all the industry claims “clutter” by differentiating our products from our competitors’ products. We believe the multi-functional nature of our technology, focusing on fuel economy and providing all other traditional fuel and fuel system benefits together with the capability to mitigate adverse performance impacts of emerging alternative fuels and fuel blends, packaged into one product, differentiates our products from those of our competitors.
MARKETING AND SALES
Our primary marketing and sales focus is to identify and work with industry peers and established in-country or global commercial distributors to partner with us to secure an expanding and sustainable revenue stream. We continue to pursue direct sales to end-users where we deem direct sales to be the most efficient customer reach platform. However, where direct sale to end-users is not an efficient model for us, we seek out industry distribution partners whose focus is end-user sales. We believe established fuel and lubricant additive companies will have an interest in using our products either as a line extension of their existing products or as blend stock, either replacing existing raw materials used to formulate existing blends or as an addition to existing product blends.
Our marketing and sales efforts are primarily directed at commercial industrial users of diesel fuels within specific market segments like rail, power generation and road transport vehicles (trucks and buses). We have no current plans on attempting to penetrate the retail market either on a branded or unbranded basis. In North America, we believe direct sales to commercial industrial customers and to industry distribution partners provide the best sales and distribution model. Direct sales to end-users allow us to maximize the product value chain benefits for the end-user and us. In other areas around the world, sales to in-country distributors will likely provide the most cost-effective and efficient marketing and sales model and allows us to leverage our marketing and sales resources to the greatest benefit. This distribution model adds tremendous value to us by reaching customers we could not efficiently sell to directly, economically or politically. Utilization of distributors in these circumstances extends our product reach and boosts sales. Several distribution agreements are now in place.
We market our products within identified targeted markets and industry segments. The marketing efforts focus on those companies within the preferred industry segments that will benefit the most from usage of our products. These efforts are supplemented by sharing test data with targeted companies in order to generate industry interest in our products. Marketing efforts include sponsorship of field trials, communication through trade media with messages directed at both technical and non-technical business professionals emphasizing fuel performance enhancement through technical innovation, fuel efficiency, maintenance cost savings, improved air quality and “no harm” to engine or environment evidence. Communication openness, transparency and willingness to share trial and testing data are the keys to the engagement process.
We have assembled a marketing and technology team of experienced industry professionals to pursue commercial opportunities for our fuel additive technology. We believe significant gains are being achieved in product exposure to the targeted markets and industry segments.
We believe an expeditious means of achieving product awareness and market acceptance is through field engagements with strategic commercial users of motor fuels. We are always seeking companies recognized as leaders in their industry to try our products in a field trial setting. Formal trials have been completed with several such companies and the efficacy of our technology has been validated. Additional field trials are currently underway, or have been committed to, which upon completion should lead to additional commercial opportunities.
During the first quarter of 2009, we received a purchase order from Vision Oil Services Ltd for the sale of 600 metric tons of DiesoLIFT™ 10 at a price of 6,000 Euros (approximately $7,600) per metric ton. We received cash proceeds of approximately $2.9 million in February 2009, net of the related selling expenses, for this purchase order. We will recognize gross revenues of approximately $4.5 million after all of the DiesoLIFT™ 10 has been delivered, which we expect to occur in 2009.
We believe that our products and value proposition are well-positioned to help commercial industrial customers; (i) realize fuel economy and engine maintenance cost improvements; (ii) take advantage of existing incentive programs in the United States and the rest of the world; and (iii) conform to current and future emissions standards.
Going forward, we believe our commercial success will be facilitated by our proprietary technology, the ever-increasing cost of fuel and emissions compliance directives, the marketing and sales infrastructure now in place along with future enhancement and the professionalism and dedication of our employees and consultants.
Available Information
Our website is www.internationalfuel.com. We make available free of charge through our website our annual report on Form 10-K, quarterly reports on Form 10-Q, current reports on Form 8-K, and amendments to those reports filed or furnished pursuant to Section 13(a) or 15(d) of the Exchange Act as soon as reasonably practicable after we electronically file such material with, or furnish it to, the SEC.
Because we have transitioned from a development stage to a commercialization phase for our products with a new technology and little market and sales visibility, we may not be able to create market demand for our products.
We are currently engaged in extensive marketing and sales efforts including additional laboratory testing and customer field trials to generate purchasing interest in our products. We have only a limited marketing history. There is a substantial risk of failure associated with development stage businesses attempting to make the transition to self-sustaining commercial entities because of the lack of established customer relationships and knowledge and acceptance of the new products being marketed. We have experienced in the past, are continuing to experience, and may experience in the future, some of the problems, delays and expenses associated with this transition, many of which are beyond our control, including but not limited to those depicted below:
| · | substantial delays and expenses related to testing and further development of our products; |
| · | customer resistance relating to the marketing of a new product in the fuel additive marketplace; |
| · | competition from larger and more established companies; and |
| · | lack of market acceptance of our new products and technologies. |
We have a history of operating losses and due to our current lack of sustainable sales and the possibility of not achieving our sales goals, we may not become profitable or be able to sustain profitability.
Since our inception we have incurred significant net losses. We reported net losses of $5,063,768 and $2,722,725 for the twelve months ended December 31, 2008 and December 31, 2007, respectively. Our accumulated deficit as of December 31, 2008 was $57,644,871. We expect to continue to incur net losses in the near to mid-term future. The magnitude of these losses will depend, in large part, on our ability to realize product sales revenue from the marketing and sale of our products. To date, we have not had any material operating revenue from the sale of our products and there can be no assurance we will be able generate material revenues. Our ability to generate revenues will be dependent upon, among other things, being able to; (1) overcome negative connotations on the part of industrial fuel consumers regarding fuel additives in general; (2) convince potential customers of the efficacy and economic and environmental benefits of our products; and (3) generate the acceptance of our technology and products by potential customers and thereby create the opportunity to sell our products at a sufficient profit margin. Because we do not yet have a material, recurring revenue stream resulting from the sale of our products, there can be no assurance that we will be successful in these efforts. Should we achieve profitability, there is no assurance we can maintain, or increase, our level of profitability in the future.
We have only a limited product sales history upon which to base any projection of the likelihood we will prove successful; therefore, we may not achieve profitable operations, or even generate meaningful operating revenues.
Our fuel performance enhancing technology is a relatively new approach to increasing fuel performance in internal combustion engines and, therefore, may never prove commercially viable on a wide-scale basis. It is possible that we may not be able to reproduce, on a sustainable basis, the preliminary performance results achieved in certain of our research and development and field trial efforts.
We are not certain how many laboratory and customer field trial test programs will be necessary to demonstrate to potential customers sufficient fuel economy and other economic and environmental benefit from our products, nor is there any assurance that such test programs, even if positive results are observed, will convince potential customers of the efficacy of our products leading to subsequent sales orders. The success of any given product in the marketplace is dependent upon many factors, with one of the most important factors being the ability to demonstrate a sustainable and meaningful economic benefit to product end-users. If our products are unable to provide this sustainable economic benefit, or potential customers do not recognize these economic benefits, our business could fail.
If projected sales and revenues do not materialize as planned, we will require additional financing to continue operations.
During the first quarter of 2009, we issued 8,650,000 restricted common shares (including 4,325,000 attachable warrants), receiving cash proceeds of $2,162,500. Including these first quarter 2009 equity raise activities, the prepaid receipt of approximately $2,900,000, net of selling expenses related to a February 2009 sales order and a remaining $800,000 equity commitment from one of our Directors, we believe we have sufficient funds available to provide resources for our operations through at least 2009 and well beyond. However, failure to achieve significant, sustained sales and revenues by the end of this period will require us to obtain additional financing. Our budget for the next twelve months emphasizes continued field and laboratory testing and customer support marketing of our products. Cash requirements during the next twelve-month period are expected to average
approximately $180,000 per month, plus approximately $1,400,000 to fulfill the prepaid sales order discussed above. In addition, unexpected changes may occur in our current operations that could exhaust available cash resources sooner than anticipated. If anticipated product sales do not materialize, or are significantly less than anticipated, we may need to raise additional funds to continue operations. If this future financing is not available, our business may fail. We currently have no other firm commitments from third parties to provide any additional financing. Consequently, we cannot assure investors that additional financing, if necessary, will be available to us on acceptable terms, or at all.
Global economic conditions have created turmoil in the credit and general industrial markets that could have a significant adverse impact on our operations.
Current U.S. and worldwide economic conditions have resulted in an extraordinary tightening of credit markets coupled with higher interest rates, particularly since the bankruptcy of Lehman Brothers in the third quarter of 2008. These economic conditions have been characterized in news reports as a global economic crisis that has been marked by dramatic shifts in market conditions and government responses, and have resulted in unprecedented intervention in financial institutions and markets by governments throughout the world. The current adverse conditions have spread to markets other than the financial and credit markets, including the industrial and labor markets.
Our financial performance depends on varying conditions in the markets we are trying to penetrate, particularly the general industrial markets. Demand in these markets fluctuates in response to overall economic conditions. The weakened economy may result in decreased demand for our products, and the current economic uncertainties may cause our customers or prospective customers to continue to defer or reduce spending on the products we provide, which could reduce future earnings and cash flow.
Furthermore, the current recession (or depression) may cause some of our customers or vendors to reduce or discontinue operations, which may adversely affect our operations. If, as a result of adverse economic conditions, any of our customers enter bankruptcy or liquidate their operations, our revenues and accounts receivable could be materially adversely affected.
We are dependent on third parties for the distribution of our products outside North America and they may experience the same delays, customer acceptance problems or other product commercialization issues we have experienced, which would negatively impact our commercialization efforts in these regions.
We have entered into distribution and sales agency agreements with certain third parties to help us achieve rapid customer trialing and acceptance of our products, and to oversee certain elements of our field-testing program. If these third parties elect to discontinue their efforts, we may not be able to commercialize our products in a timely manner, or to commercialize them at all.
Although certain of these agreements contain progress milestones, we are not able to control the amount of time and effort these third parties put forth on our behalf. It is possible that any of these third parties may not perform as expected, may not achieve the contractual milestones and may breach or terminate their agreements with us before completing their work. Any failure of a third party to provide the services for which we have contracted could prevent or significantly delay us from commercializing our products.
As we currently purchase all of our product supply requirements from outside sources and have no in-house product manufacturing capability, any business complications arising with either our suppliers or with our suppliers relationship could create adverse consequences with our product supply chain.
We currently contract with outside specialty chemical manufacturing companies for the production and supply of 100% of our product needs. We have no in-house product manufacturing capability and, therefore, are exposed to
potential product supply disruptions caused by adverse business circumstances with our suppliers (for example, raw material shortages, plant breakdowns and other adverse circumstances affecting the supply of our products from suppliers). There can be no assurances that, in the event of a supply disruption, we would be able to quickly contract with another manufacturer for the continued supply of our products. We, therefore, could be without adequate supply of our products and could lose sales for an extended period of time as a result.
There is a risk that one or more of the raw material suppliers currently supplying raw materials to our contract manufacturer could stop making a building block raw material necessary for production of our product and, therefore, cause a supply shortage until substitution raw materials could be identified and located.
If the supplier were no longer able to obtain building block raw materials necessary for production of our product, suitable substitutes would have to be identified and obtained. There can be no assurances that, in the event of a raw material supply disruption, our manufacturers would be able to quickly identify and obtain a suitable substitute component and, therefore, we could be without product inventory and could lose sales for an extended period of time.
Products developed by our competitors could severely impact our product commercialization and customer acceptance efforts, thereby reducing the sales of our products and severely impacting our ability to meet our sales goals or to continue operations.
We face competition from companies who are developing and marketing products similar to those we are developing and marketing. The petroleum/fossil fuels industry has spawned a large number of efforts to create technologies that help improve the performance of internal combustion engines and reduce harmful emissions. Some of these companies have significantly greater marketing, financial and managerial resources than us. We cannot provide any assurance that our competitors will not succeed in developing and distributing products that will render our products obsolete or non-competitive. Such competition could potentially force us out of business.
Our products are designed for use in internal combustion engines and the development of alternative engine design and technology could severely reduce the market potential for our products.
Our products are designed for, and marketed to, customers utilizing internal combustion engines. Significant efforts now exist to develop alternatives to internal combustion engines. In addition, the regulatory environment is becoming increasingly restrictive with regard to the performance of internal combustion engines and the harmful emissions they produce. If alternatives to internal combustion engines become commercially viable, it is possible that the potential market for our products could be reduced, if not eliminated.
If we are unable to protect our technology and intellectual property from use by competitors, there is a risk that we will sustain losses, or that our business could fail.
Our success will depend, in part, on our ability to obtain and enforce intellectual property protection for our technology in both the United States and other countries. We have taken steps to protect our intellectual property through patent applications in the United States Patent and Trademark Office and its international counterparts under the Patent Cooperation Treaty. We cannot provide any assurance that patents will be issued as a result of these applications or that, with respect to any patents, issued or pending, the claims allowed are, or will be, sufficiently broad enough to protect the key aspects of our technology, or that the patent laws will provide effective legal or injunctive remedies to stop any infringement of our patents. In addition, we cannot provide assurance that any patent rights owned by us will not be challenged, invalidated or circumvented, or that our competitors will not independently develop or patent technologies that are substantially equivalent or superior to our technology. If we are forced to defend our patents in court, well-funded adversaries could use such actions as part of a strategy for depleting the resources of a small company such as ours. We cannot provide assurance that we will have sufficient resources to successfully prosecute our interests in any litigation that may be brought.
Because of the nature of our products, we may be subject to government approvals and regulations that reduce or prevent our ability to commercialize our products, increase our costs of operations and decrease our ability to generate income.
We are subject to United States and international laws and regulations regarding the products we sell. There is no single regulatory authority to which we must apply for certification or approval to sell our products in the United States, or outside its borders. Any changes in policy or regulations by regulatory agencies in countries in which we intend to do business may cause delays or rejections of our attempts to obtain necessary approvals for the sale of our products.
There can be no assurance that we will obtain regulatory approvals and certifications for our products in all of the markets we seek to conduct business. Even if we are granted such regulatory approvals and certifications, we may be subject to limitations imposed on the use of our products. In the future, we may be required to comply with certain restrictive regulations, or potential future regulations, rules, or directives that could adversely impact our ability to sell our products. We cannot guarantee that restrictive regulations will not, in the future, be imposed. Such potential regulatory conditions or compliance with such regulations may increase our cost of operations or decrease our ability to generate income.
We create products that may have harmful effects on the environment if not stored and handled properly prior to use, which could result in significant liability and compliance expense.
The blending of base fuels with our current or future products involves the controlled use of materials that could be hazardous to the environment. We cannot eliminate the risk of accidental contamination or discharge to the environment of these materials and any resulting problems that occur. Federal, state and local laws and regulations govern the use, manufacture, storage, handling and disposal of these materials. We may be named a defendant in any suit that arises from the improper handling, storage or disposal of these products. We could be subject to civil damages in the event of an improper or unauthorized release of, or exposure of individuals to, these materials. Claimants may sue us for injury or contamination that results from use by third parties of our products, and our liability may exceed our total assets. Compliance with environmental laws and regulations may be expensive, and current or future environmental regulations may impair our research, development and sales and marketing efforts. Although we carry product and general liability insurance with limits we deem sufficient, there can be no assurance that an event, or series of events, will not occur that will require, in the aggregate, resources in excess of these limits.
If we lose any key personnel or are unable to attract qualified personnel and consultants, we may lose business prospects and sales, or be unable to otherwise fully operate our business.
We are dependent on the principal members of our management staff, the loss of any of whom could impair our product development and commercialization efforts underway. Furthermore, we depend on our ability to attract and retain additional qualified personnel to develop and manage our future business and markets. We may have to recruit qualified personnel with competitive compensation packages, equity participation and other benefits that may reduce the working capital available for our operations. We cannot provide assurance that we will be able to obtain qualified personnel on reasonable terms, or that we will be able to retain our existing management staff.
We may have difficulties managing growth, which could lead to lost sales opportunities.
While we have not yet achieved any meaningful, sustained revenues through the sale of our products, should certain events occur, such as a large recurring order from a well-known company or endorsement of our products from a well-known commercial entity, sales may escalate rapidly. Rapid growth could strain our human and infrastructure resources, potentially leading to higher operating costs, lost sales opportunities, or both. Our ability
to manage operations and control growth will be dependent upon our ability to improve our operational, financial and management controls, reporting systems and procedures, and to attract and retain adequate numbers of qualified employees. Should we be unable to successfully provide the resources needed to manage growth, product sales and customer satisfaction could suffer and higher costs and losses could occur.
Our shares are quoted on the Over-The-Counter Bulletin Board and are subject to a high degree of volatility and liquidity risk.
Our common stock is currently quoted on the OTC Bulletin Board. As such, we believe our stock price is more volatile and the share liquidity characteristics to be of higher risk than if we were listed on one of the national exchanges. Also, if our stock were no longer quoted on the OTC Bulletin Board, the ability to trade our stock would become even more limited and investors may not be able to sell their shares.
| Item 1B. | Unresolved Staff Comments |
None.
We maintain our administrative offices at 7777 Bonhomme Avenue, Suite 1920, St. Louis, Missouri 63105. On January 1, 2002, we entered into a five-year lease agreement for office space and administrative services of $4,249 per month for approximately 2,100 square feet. On July 21, 2006, this lease agreement was extended an additional five years through December 31, 2011. The new base rent beginning January 1, 2008 is $3,819 per month and increases annually.
We believe our current facilities are adequate to meet current and near-term operating requirements.
We are subject to various lawsuits and claims with respect to matters arising out of the normal course of business. While the impact on future financial results is not subject to reasonable estimation because considerable uncertainty exists, management believes, after consulting with counsel, that it is more likely than not that the ultimate liabilities resulting from such lawsuits and claims will not materially affect our financial position, results of operations or liquidity.
In December 2005, a former employee of IFT and a former consultant to IFT filed a joint lawsuit against us and certain of our Directors in the St. Louis County, Missouri Circuit Court. The relief sought by the plaintiffs included payment of compensation up to $120,000 per year under the former employee’s Employment Agreement, issuance of up to 5,025,921 shares of IFT stock under a Share Purchase Agreement entered into between each plaintiff and IFT in April 2001, and release from the plaintiffs’ non-competition obligations. The plaintiffs also alleged they were harmed by certain misrepresentations of IFT and were seeking an undetermined amount of damages for such alleged misrepresentations. We filed counter-claims against the plaintiffs, seeking monetary damages and enforcement of the plaintiffs’ non-competition obligations. During the second quarter of 2007, this case was dismissed by the Missouri Circuit Court with no compensation paid to any party. In June 2008, the plaintiffs re-filed their lawsuit and we re-filed our counter-claims. The plaintiffs have again failed to appear for depositions and to permit discovery and we are in the process of re-filing our motion to dismiss, this time with prejudice. The case is pending. We continue to believe the plaintiffs’ claims have no merit.
On July 31, 2006, we received notice from the American Arbitration Association ("AAA") of a Demand for Arbitration dated July 27, 2006 received by the AAA naming IFT as Respondent and TPG Capital Partners (“TPG”), the prior Blencathia Acquisition Corporation (“Blencathia”) owner, as the Claimant. The arbitration had been requested by TPG to resolve an alleged aggregate proceeds shortfall from the sale of IFT securities issued in the Blencathia merger. TPG has claimed they sold some or all of the 312,000 shares and the sales have not generated at least $500,000 of proceeds, as guaranteed in the merger documents.
In an effort to resolve this matter prior to submission to binding arbitration, both TPG and IFT participated in a non-binding mediation conference on January 30, 2007, which did not resolve the matter. Informal discussions are ongoing. It is not expected that the ultimate settlement of this matter, considering we have recorded a liability for the shortfall amount, will have an additional adverse material effect on IFT.
On October 2, 2008, Giant Trading, Inc., Dion Friedland, Magnum Select Fund, Ltd., Magnum Growth Fund, Brett Friedland, Lara and Andrew Block, Cherise Metz and Charles Stride filed a lawsuit against us and certain of our Directors (Messrs. Burst, Carr and Demetriou) in the United States District Court, Southern District of Florida. On February 3, 2009, Mr. Demetriou was dismissed without prejudice from the lawsuit because he was not served with process within the statutory period. The lawsuit alleges federal securities fraud violations of Section 10(b) of the Securities Exchange Act of 1934 and Rule 10b-5 promulgated thereunder against all defendants, and violations of Section 20(a) of the Securities Act of 1933 against the individual defendants. The plaintiffs are seeking a judgment for damages of $5 million, interest, costs, and for such other relief the Court deems just and proper. We have filed for a change a venue to St. Louis, Missouri, which is currently pending. We do not believe the lawsuit has any merit and will vigorously defend our position.
On February 6, 2009 we filed an action against Fuel Technologies Ltd, Mega Connections, Ltd., FT Marketing Ltd, and the AAA, Cause No. 09SL-CC00550, in the Circuit Court of the County of St. Louis, Missouri. In this action, IFT sought injunctive relief requiring the Defendants to litigate the claims asserted before the AAA in the Circuit Court of St. Louis County, Missouri. On or about February 17, 2009 the Court entered an Order transferring these claims out of arbitration and into the Circuit Court of the County of St. Louis. The claims initially filed before the AAA, but removed to the Circuit Court by IFT, is that IFT breached various marketing and distribution agreements by misrepresenting the state of IFT’s product development. The case is in its earliest stages, no discovery has been undertaken to-date and we are unable to predict any outcome. IFT believes it has meritorious defenses and intends to vigorously defend this action.
| Item 4. | Submission of Matters to a Vote of Security Holders |
On December 10, 2008, our annual meeting of stockholders was held in St. Louis, Missouri. At this meeting the following Directors were elected to the Board of Directors: Jonathan R. Burst, Rex Carr, David B. Norris, Harry F. Demetriou and Gary Kirk. All Directors will serve on our Board of Directors until the next annual meeting of stockholders or their resignation from the Board of Directors. A summary of the vote for Directors follows:
| DIRECTOR | FOR | WITHHELD |
| | | |
| Jonathan R. Burst | 71,835,870 | 3,244,613 |
| Rex Carr | 71,850,820 | 3,229,663 |
| David B. Norris | 72,223,660 | 2,856,823 |
| Harry F. Demetriou | 71,952,370 | 3,128,113 |
| Gary Kirk | 71,952,060 | 3,128,423 |
The stockholders also voted to ratify the appointment of our independent registered public accounting firm, BDO Seidman, LLP. 72,096,620 shares, being more than a majority of our outstanding stock, were voted in favor of the ratification, 2,957,063 shares were voted against the ratification, and 26,800 shares abstained from the vote regarding ratification of the appointment of BDO Seidman, LLP as our independent registered public accounting firm for 2008. No broker non-votes were received for the vote on our Directors or ratification of our independent registered public accounting firm.
PART II
| Item 5. | Market for Registrant’s Common Equity, Related Stockholder Matters and Issuer Purchases of Equity Securities |
Our common stock is traded on the OTC Bulletin Board system under the symbol “IFUE.OB.” The range of reported high and low sales prices shown below is as reported by the OTC Bulletin Board. The quotations shown reflect inter-dealer prices, without retail mark-up, mark-down or commission and may not necessarily represent actual transactions.
| | 2008 | 2007 |
| | High | Low | High | Low |
| | | | | |
| First quarter | $0.45 | $0.16 | $0.61 | $0.36 |
| Second quarter | $0.89 | $0.37 | $0.57 | $0.27 |
| Third quarter | $0.72 | $0.33 | $0.57 | $0.28 |
| Fourth quarter | $0.43 | $0.17 | $0.35 | $0.16 |
As of the close of business on March 24, 2009, the last reported sales price per share of our common stock was $0.32. As of March 24, 2009, we estimate there were 1,477 record holders of our common stock. Such number does not include persons whose shares are held by a bank, brokerage house or clearing company, but does include such bank, brokerage houses and clearing companies.
We have not declared or paid a cash dividend to shareholders. The Board of Directors presently intends to retain any future earnings to finance our operations and does not expect to authorize cash dividends in the foreseeable future.
Performance Graph
The performance graph below and the information contained therein shall not be deemed to be “soliciting material” or to be “filed” with the SEC, or incorporated by reference into any future filing with the SEC, or subject to the liabilities of Section 18 of the Securities Exchange Act of 1934, except to the extent that IFT specifically incorporates it by reference into a document filed under the Securities Act of 1933 or the Securities Exchange Act of 1934.
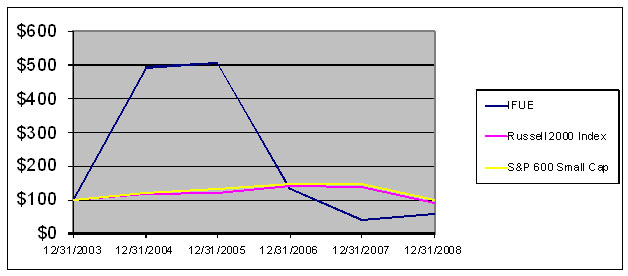
| | | 12/31/2003 | | | 12/31/2004 | | | 12/31/2005 | | | 12/31/2006 | | | 12/31/2007 | | | 12/31/2008 | |
| International Fuel Technology, Inc. | | $ | 100.00 | | | $ | 492.31 | | | $ | 505.13 | | | $ | 130.77 | | | $ | 41.03 | | | $ | 56.41 | |
| Russell 2000 Index | | $ | 100.00 | | | $ | 117.00 | | | $ | 120.88 | | | $ | 141.43 | | | $ | 137.55 | | | $ | 89.68 | |
| S&P 600 Small Cap Index | | $ | 100.00 | | | $ | 121.59 | | | $ | 129.68 | | | $ | 147.93 | | | $ | 146.12 | | | $ | 99.38 | |
The above graph compares the performance of our stock from December 31, 2003 through December 31, 2008 against the performance of the Russell 2000 Index and the S&P 600 Small Cap Index for the same period. Historical stock price performance is not necessarily indicative of future stock price performance. The graph assumes an investment of $100 on December 31, 2003 in our common stock (at the last reported sale price on such date), the Russell 2000 Index and the S&P 600 Small Cap Index and assumes the reinvestment of any dividends.
| Item 6 | Selected Financial Data |
The following tables set forth certain information concerning the statements of operations and balance sheets of IFT and should be read in conjunction with the financial statements and the notes thereto appearing elsewhere in this report.
Selected Statement of Operations Data (Dollars in Thousands, Except Loss Per Share)
| | | Fiscal Year Ended December 31, | |
| | | 2008 | | | 2007 | | | 2006 | | | 2005 | | | 2004 | |
| Revenues | | $ | 149 | | | $ | 133 | | | $ | 235 | | | $ | 563 | | | $ | 24 | |
| Operating expenses | | $ | 5,200 | | | $ | 2,885 | | | $ | 5,639 | | | $ | 5,924 | | | $ | 4,543 | |
| Net loss | | $ | (5,064 | ) | | $ | (2,723 | ) | | $ | (5,243 | ) | | $ | (5,330 | ) | | $ | (4,519 | ) |
| Basic and diluted net loss per common share | | $ | (0.06 | ) | | $ | (0.03 | ) | | $ | (0.06 | ) | | $ | (0.06 | ) | | $ | (0.06 | ) |
| Weighted-average shares | | | 91,623,385 | | | | 88,255,780 | | | | 87,896,204 | | | | 84,161,298 | | | | 77,907,412 | |
Effective February 4, 2009, IFT declared a 1 restricted share for every 25 common shares owned dividend. The weighted-average shares and loss per share presented above have been adjusted to reflect this stock dividend.
Selected Balance Sheet Data (in Thousands)
| | | Fiscal Year Ended December 31, | |
| | | 2008 | | | 2007 | | | 2006 | | | 2005 | | | 2004 | |
| Cash and cash equivalents | | $ | 299 | | | $ | 364 | | | $ | 655 | | | $ | 3,382 | | | $ | 530 | |
| Short-term investments | | $ | - | | | $ | - | | | $ | 1,507 | | | $ | 2,481 | | | $ | - | |
| Total assets | | $ | 2,857 | | | $ | 2,994 | | | $ | 5,090 | | | $ | 8,851 | | | $ | 3,819 | |
| Long-term debt | | $ | - | | | $ | 500 | | | $ | - | | | $ | - | | | $ | - | |
| Item 7. | Management’s Discussion and Analysis of Financial Condition and Results of Operations |
The following is management’s discussion and analysis of certain significant factors that have affected our financial condition, results of operations and cash flows during the periods included in the accompanying financial statements. This discussion should be read in conjunction with the financial statements and notes included elsewhere in this Form 10-K.
Overview
We are a fuel performance enhancement technology company transitioning to a commercial enterprise. We believe the macro economic environment for our technology and products is excellent now and will continue to be so for the foreseeable future. We believe ever-increasing fuel environmental regulations will likely result in increased demand for additive products to help offset adverse fuel performance and engine impacts resulting from these regulations. Our products and technology are uniquely positioned to benefit from this macro environment by offering fuel performance enhancement solutions that specifically address these macro developments and trends.
Commercial Update
Our commercial goal continues to be the bulk sale (by the ton) of DiesoLIFT™ 10 and DiesoLIFT™ BD-3 to major end-users of diesel fuel and bio-diesel fuel blends, including: railroads; stationary power generation operators; centrally-fueled truck/bus fleets; and marine vessel operators. Our primary strategy to achieve this goal is to outsource marketing and distribution by partnering with prominent fuel additive distribution companies and oil companies with existing customers and distribution channels.
IFT has emerged from the research and development phase and is in the early stages of commercializing its technology. Through distribution partners, IFT has clients that are purchasing and using DiesoLIFT™ 10 and DiesoLIFT™ BD-3. IFT products are marketed to end-users either relabeled or under IFT brand names.
Libya Oil Holdings Limited
On June 9, 2008, we entered into a Memorandum of Understanding ("MOU") with Libya Oil Holdings Limited, Tamoil, Libya Africa Investment Portfolio and Vision Oil Services Ltd (collectively referred to as "LOH"). Pursuant to the terms of the MOU, LOH will market and distribute a new premium diesel product utilizing our DiesoLIFT™ 10 proprietary fuel additive formulation (the "Product") to its network of retail petrol stations in Europe and Africa. In conjunction with the agreement, LOH also purchased 4,160,000 restricted shares of our common stock for an aggregate purchase price of $2,000,000.
LOH is an integrated oil company involved in the shipping, trading, refining, marketing and sale of crude oil and refined petroleum products. LOH also operates thousands of retail petrol stations in Africa and in Europe through Tamoil. Vision Oil Services Ltd is the exclusive distribution partner for sales of IFT’s products to Libya Oil Holdings Limited and Tamoil, which are affiliated with Vision Oil Services Ltd.
On February 26, 2009, we received the first purchase order pursuant to the MOU. IFT will sell 600 metric tons of DiesoLIFT™ 10 at a price of 6,000 Euros (approximately $7,600) per metric ton to Vision Oil Services Ltd. We received cash proceeds of approximately $2.9 million in February 2009, net of the related selling expenses, for this purchase order. We will recognize gross revenues of approximately $4.5 million after all of the DiesoLIFT™ 10 has been delivered, which we expect to occur in 2009.
We hope the success of LOH’s new premium diesel product will prompt other oil companies to follow LOH’s lead in making a meaningful commitment to improving the environment by offering fuel savings and emissions reducing diesel fuel additized with DiesoLIFT™ 10.
Railroads
IFT has been working with The Association of Train Operating Companies in the U.K. (“ATOC”) since 2005. Three rounds of extensive laboratory testing and two supporting field trials have provided clear evidence that use of DiesoLIFT™ 10 generates a significant fuel savings and economic benefit. Two ATOC rail operator members ran field trials during 2008 and achieved positive results. A final phase of expanded field trials is currently in progress with one ATOC member, which if successful, should result in major sales of DiesoLIFT™ 10 to the ATOC system.
Success with the ATOC tests and trials has also furthered IFT’s progress with rail opportunities in India, Brazil and Peru. IFT believes that success with current rail opportunities will lead to additional rail opportunities in Europe and the U.S.
Distribution Partners
| | · | Vision Oil Services Ltd (“VOS”): We signed a distribution agreement with VOS in June 2008 providing VOS with exclusive distribution rights to market and sell IFT’s products to LOH and to the continent of Africa and Jordan. VOS has purchased 600 metric tons of DiesoLIFT™ 10 (see above). |
| | · | Caldic U.K. (“Caldic”): We signed a marketing and distribution agreement with Caldic in May 2008 providing Caldic with distribution rights to IFT’s products in the U.K. Caldic has introduced our products to numerous end-user customers and is currently in the process of running field trials with selected end-users. |
| | · | Multisol France (“Multisol”): We signed a manufacturing, marketing and distribution agreement with Multisol in July 2008 providing Multisol with distribution rights to market and sell IFT’s products in France, Spain, Portugal and Belgium. Multisol is selling our additive formulations to numerous accounts, including prominent fuel additive companies who are re-packaging the formulations for resale into retail markets. |
| | · | Nordmann Rassmann (“Nordmann”): We signed a marketing and distribution agreement with Nordmann in August 2008 providing Nordmann with the right to market and sell IFT’s products in Germany, Austria, Switzerland, Sweden, Norway, Finland, Denmark, Poland, The Czech Republic, Slovakia, Slovenia, Hungary, Serbia, Romania and Bulgaria. Nordmann has introduced our products to numerous customers and made its first sale of DiesoLIFT™ BD-3 in March 2009. |
| | · | Nulon India (“Nulon”): We signed a marketing and distribution with Nulon in March 2007 providing Nulon with the right to market and sell IFT’s products in India. Nulon has conducted numerous field trials with DiesoLIFT™ 10, realizing positive results. We expect Nulon to begin generating revenues from the sale of our products in 2009. |
| | · | Tide Water Oil Co. India Ltd (“Tidewater”): Headquartered in India, Tidewater is a prominent manufacturer and distributor of additives and lubricants to the automotive and industrial markets. Tidewater intends to re-package DiesoLIFT™ 10 and sell into these targeted markets in India: power generation set users; tractor operators; the agricultural industry; and retail distribution markets. |
DiesoLIFT™ BD-3
Extensive research, development, product validation testing and no-harm testing has been completed. DiesoLIFT™ BD-3 has clearly demonstrated that it is a top performing technology in the market. The product has already been approved for use by a number of bio-diesel producers around the world. IFT distribution partners have begun to market and sell the product in their respective territories. In addition, one of the largest chemical companies in the world has completed in-house testing and evaluation of DiesoLIFT™ BD-3. Discussions have commenced regarding a partnership agreement affording this company distribution rights to market and sell DiesoLIFT™ BD-3 to accounts all over the world.
U.S. Road Transport
Multiple fleets with over the road tractors and fleets of heavy-duty equipment have been using DiesoLIFT™ 10 for many years. Average fuel economy gains have exceeded 5%.
Other Opportunities
Efforts to improve the performance of IFT fuel additive formulations are ongoing. IFT has partnered with prominent independent test laboratories, chemical companies, fuel additive distribution companies and oil companies to further the development of and enhance the performance of its products on a stand-alone basis, or as part of a fuel additive package. For example, a world-renowned oil company has extensively tested and evaluated IFT technology and is currently contemplating using IFT technology as part of an additive package to be used with the diesel fuel supplied to its retail stations and commercial accounts.
Summary
IFT has two of the top performing fuel additive technologies in the world today, DiesoLIFT™ 10 and DiesoLIFT™ BD-3, that target markets where consumption is massive and growing and environmental concerns and pressures to reduce harmful emissions are real. The time consuming process of tests and trials has generated real commercial opportunities, which should begin to produce meaningful revenues to IFT in 2009. The energy priorities of the incoming President Obama Administration should enhance the commercial opportunities for IFT’s proprietary fuel additive technologies.
Results of Operations
Comparison of the Twelve Months Ended December 31, 2008 and the Twelve Months Ended December 31, 2007
Revenues
Net revenue for the twelve months ended December 31, 2008 was $149,480, as compared to $133,420 for the twelve-month period ended December 31, 2007. This increase in net revenue was primarily due to increased sales volume from our distributor network ($19,757), partially offset by decreased sales volume to end-user customers ($3,697). Sales revenue for 2008 was split between sales to our distributor network (54% of sales revenue) and end-user customers (46% of sales revenue).
Sales revenue generated during 2008 and 2007 resulted primarily from the sale of DiesoLIFT™ 10.
Operating Expenses
Total operating expense was $5,200,117 for the twelve months ended December 31, 2008, as compared to $2,885,044 for the twelve-month period ended December 31, 2007. This represents a $2,315,073 increase from the prior period, and was primarily attributable to an increase in stock-based compensation expense, partially offset by decreases in other selling, general and administrative expense and depreciation and amortization. These fluctuations are more fully described below.
Selling, General and Administrative Expense
Selling, general and administrative expense for the twelve months ended December 31, 2008 was $5,106,406 (including stock-based compensation expense of $2,896,229) as compared to $2,622,739 (including stock-based compensation of $118,972) for the twelve-month period ended December 31, 2007, representing a $2,483,667, or 95%, increase from the prior period.
The stock-based compensation expense increase of $2,777,257 between 2008 and 2007 was primarily due to:
| (1) | the vesting and immediate expense recognition for options granted during the second quarter of 2008 relating to consulting services and commercial and equity capital activities (approximately $2,600,000); and |
| (2) | approximately $370,000 of expense reversed during the second quarter of 2007 related to options forfeited prior to vesting, partially offset by approximately $207,000 of expense recorded during the second quarter of 2007 related to the modification of option terms. |
The decrease in other selling, general and administrative expense is primarily due to:
| (1) | a decrease of $71,074 in salary expense due primarily to reduced personnel and the favorable effect (compared to the prior year) of foreign currency translation associated with salary payments made in non-U.S. currency; |
| (2) | a decrease of $68,440 in advertising and marketing expenses primarily due to less promotional samples employed during customer field trials in the current year, compared to the prior year; |
| (3) | a decrease of $59,955 in consulting expense primarily due to less travel reimbursement for consulting activities and a somewhat reduced scope in activity level in India and Indonesia; and |
| (4) | a decrease of $36,130 in other professional services primarily due to employment placement fees recorded in the prior year, which were not repeated in the current period. |
Depreciation and Amortization Expense
Depreciation and amortization expense was $7,808 for the twelve months ended December 31, 2008, as compared to $177,437 for the twelve months ended December 31, 2007. This decrease of $169,629 is primarily attributable to our intellectually property becoming fully amortized during the second quarter of 2007.
Interest Income (Expense)
Net interest income (expense) for the twelve months ended December 31, 2008 was $(13,131), compared to $28,899 for the twelve-month period ended December 31, 2007. The change in net interest income (expense) is primarily attributable to interest expense recorded related to debt that was converted to equity during the first quarter of 2008 and a lower amount of funds invested in securities, as investments were utilized to fund operations upon maturity during the third quarter of 2007.
Provision for Income Taxes
We have operated at a net loss since inception and have not recorded or paid any income taxes. We have significant net operating loss carry-forwards that would be recognized at such time as we demonstrate the ability to operate on a profitable basis for an extended period of time. The deferred income tax asset resulting primarily from the net operating loss carry-forwards has been fully reserved with a valuation allowance.
Net Loss
Net loss for the twelve months ended December 31, 2008 was $5,063,768, as compared to $2,722,725 for the twelve months ended December 31, 2007. The increase in net loss was primarily due to an increase in stock-based compensation expense, partially offset by decreases in other selling, general and administrative expense and depreciation and amortization, as described above. The basic and diluted net loss per common share for the twelve months ended December 31, 2008 and 2007 was $(0.06) and $(0.03), respectively.
Comparison of the Twelve Months Ended December 31, 2007 and the Twelve Months Ended December 31, 2006
Revenues
Net revenue for the twelve months ended December 31, 2007 was $133,420, as compared to $234,584 for the twelve-month period ended December 31, 2006. This decrease in net revenue of $101,164 was primarily due to decreased sales volume from our distributor network ($144,230), partially offset by increased sales volume to end-user customers ($43,066). Sales revenue for 2007 was split between sales to end-user customers (54% of sales revenue) and contractual purchases by our distributor network (46% of sales revenue).
Sales revenue for 2006 was due primarily to contractual purchases by our distributor network, which included net sales of approximately $184,000 to Fuel Technologies Ltd. (“FTL”), a then-related party to us. Sales revenue generated during 2007 and 2006 resulted primarily from the sale of DiesoLIFT™ 10.
At the end of the second quarter of 2006, we recorded $25,136 for a contra-revenue international marketing fee paid to FT Marketing Ltd. (“FTM”) for sales revenues and subsequent cash collections generated from FTM sales leads. These fees are included in the 2006 net revenue totals described above.
FTM is a marketing affiliate of FTL. FTL was formed for the purpose of marketing and distributing our products. Mr. Friedland, who owns more than five percent of our common stock, is the Chairman of FTL.
Operating Expenses
Total operating expense was $2,885,044 for the twelve months ended December 31, 2007, as compared to $5,638,698 for the twelve-month period ended December 31, 2006. This represents a $2,753,654 decrease from the prior period, and was primarily attributable to decreases in stock-based compensation expense, other selling, general and administrative expense, depreciation and amortization and cost of operations due to decreased sales. These fluctuations are more fully described below.
Selling, General and Administrative Expense
Selling, general and administrative expense for the twelve months ended December 31, 2007 was $2,622,739 (including stock-based compensation expense of $118,972) as compared to $5,062,882 (including stock-based compensation of $1,261,955) for the twelve-month period ended December 31, 2006, representing a $2,440,143, or 48%, decrease from the prior period.
The stock-based compensation expense decrease of $1,142,983 between 2007 and 2006 was primarily due to:
| (1) | the timing of employee options vesting in 2006 and 2007 (approximate $878,000 decrease); |
| (2) | the reversal of approximately $381,000 of expense previously recorded for unvested employee options that were forfeited during 2007. Approximately $85,000 of expense was recorded in 2007 and approximately $296,000 of expense was recorded in 2006 for applicable options (approximate $600,000 decrease); |
| (3) | lower 2007 expense related to non-employee stock–based compensation due to quarterly-revaluation and a decreasing stock price from the prior period (approximate $175,000 decrease); and |
| (4) | the modification of terms related to previously granted employee stock options (approximate $207,000 increase). |
The remaining decrease in other selling, general and administrative expense is primarily due to:
| (1) | a decrease of $735,076 in other professional services due a charge recorded in 2006 associated with a 1999 merger ($500,000) and less legal fee expense ($213,323) primarily due to less intellectual property protection litigation in the current period; and |
| (2) | a decrease of $391,863 in research and development expense as a result of increased customer field trials and reduced independent product testing activities compared to the prior period. |
Depreciation and Amortization Expense
Depreciation and amortization expense was $177,437 for the twelve months ended December 31, 2007, as compared to $407,498 for the twelve months ended December 31, 2006. This decrease of $230,061 is primarily attributable to our intellectually property becoming fully amortized during the second quarter of 2007.
Interest Income
Net interest income generated from our short-term investment in interest bearing securities for the twelve months ended December 31, 2007 was $28,899, compared to $161,135 for the twelve-month period ended December 31, 2006. The change in net interest income is primarily attributable to a lower amount of funds invested in securities, as investments were utilized to fund operations upon maturities beginning in the fourth quarter of 2006.
Provision for Income Taxes
We have operated at a net loss since inception and have not recorded or paid any income taxes. We have significant net operating loss carry-forwards that would be recognized at such time as we demonstrate the ability to operate on a profitable basis for an extended period of time. The deferred income tax asset resulting primarily from the net operating loss carry-forwards has been fully reserved with a valuation allowance.
Net Loss
Net loss for the twelve months ended December 31, 2007 was $2,722,725, as compared to $5,242,979 for the twelve months ended December 31, 2006. The decrease in net loss was primarily due to decreases in stock-based compensation expense, other selling, general and administrative expense and depreciation and amortization, as described above. The basic and diluted net loss per common share for the twelve months ended December 31, 2007 and 2006 was $(0.03) and $(0.06), respectively.
New Accounting Pronouncements
In September 2006, the Financial Accounting Standards Board (“FASB”) issued Statement of Financial Accounting Standards (“SFAS”) No. 157, Fair Value Measurements (“SFAS 157”), which provides guidance on how to measure assets and liabilities that use fair value. SFAS 157 applies whenever another GAAP standard requires (or permits) assets or liabilities to be measured at fair value but does not expand the use of fair value to any new circumstances. This standard also requires additional disclosures in both annual and quarterly reports. SFAS 157 is effective for financial statements issued for fiscal years beginning after November 15, 2007. In February 2008, the FASB agreed to defer the effective date of SFAS 157 for one year for non-financial assets and non-financial liabilities that are not recognized or disclosed at fair value in the financial statements on a recurring basis. There is no deferral for financial assets and financial liabilities, nor for the rare non-financial assets and non-financial liabilities that are re-measured at fair value at least annually. We adopted the provisions of SFAS 157 effective January 1, 2008 with no impact to our financial position and results of operations.
In February 2007, the FASB issued SFAS No. 159, The Fair Value Option for Financial Assets and Financial Liabilities ("SFAS 159"). SFAS 159 permits entities to choose to measure certain financial instruments and other eligible items at fair value when the items are not otherwise currently required to be measured at fair value, and if so chosen, specifies related accounting and disclosure requirements. SFAS 159 is effective as of the beginning of the first fiscal year that begins after November 15, 2007, with earlier adoption permitted if all of the requirements of SFAS 157 are adopted. SFAS 159 was effective for IFT as of January 1, 2008; however, we did not elect the fair value option for any eligible items.
In December 2007, the FASB issued SFAS No. 141(revised 2007), Business Combinations, Applying the Acquisition Method (“SFAS 141R”), a revision of SFAS 141, Business Combinations. SFAS 141R establishes requirements for the recognition and measurement of acquired assets, liabilities, goodwill, and non-controlling interests. SFAS 141R also provides disclosure requirements related to business combinations. SFAS 141R is effective for fiscal years beginning after December 15, 2008. SFAS 141R will be applied prospectively to business combinations with an acquisition date on or after the effective date. We do not expect the adoption of SFAS 141R will have a material impact on our financial statements.
In December 2007, the FASB issued SFAS No. 160, Non-Controlling Interests in Consolidated Financial Statements - an amendment of ARB No. 51 (“SFAS 160”). SFAS 160 establishes new standards for the accounting for and reporting of non-controlling interests (formerly minority interests) and for the loss of control of partially owned and consolidated subsidiaries. SFAS 160 does not change the criteria for consolidating a partially owned entity. SFAS 160 is effective for fiscal years beginning after December 15, 2008. The provisions of SFAS 160 will be applied prospectively upon adoption except for the presentation and disclosure requirements, which will be applied retrospectively. We do not expect the adoption of SFAS 160 will have a material impact on our financial statements.
In May 2008, the FASB issued SFAS No. 162, The Hierarchy of Generally Accepted Accounting Principles (“SFAS 162”). SFAS 162 identifies the sources of accounting principles and the framework for selecting the principles used in the preparation of financial statements of non-governmental entities that are presented in conformity with GAAP in the United States (the “GAAP hierarchy”). SFAS 162 will be effective 60 days following the SEC’s approval of the Public Company Accounting Oversight Board’s amendments to AU Section 411, “The Meaning of Present Fairly in Conformity With Generally Accepted Accounting Principles.” The FASB has stated that it does not expect SFAS 162 will result in a change in current practice.
During June 2008, the FASB issued Emerging Issues Task Force (“EITF”) Issue No. 07-05, Determining Whether an Instrument (or Embedded Feature) Is Indexed to an Entity’s Own Stock (“EITF 07-05”), which is effective for fiscal years beginning after December 15, 2008. EITF 07-05 addresses the determination of whether an instrument (or an embedded feature) is indexed to an entity's own stock, which is the first part of the scope exception in
paragraph 11(a) of FASB SFAS No. 133, Accounting for Derivative Instruments and Hedging Activities (“SFAS 133”). If an instrument (or an embedded feature) that has the characteristics of a derivative instrument under paragraphs 6–9 of SFAS 133 is indexed to an entity's own stock, it is still necessary to evaluate whether it is classified in stockholders' equity (or would be classified in stockholders' equity if it were a freestanding instrument). Other applicable authoritative accounting literature, including Issues EITF 00-19, Accounting for Derivative Financial Instruments Indexed to, and Potentially Settled in, a Company Own Stock, and EITF 05-2, The Meaning of “Conventional Debt Instrument” in Issue No. 00-19, provides guidance for determining whether an instrument (or an embedded feature) is classified in stockholders' equity (or would be classified in stockholders' equity if it were a freestanding instrument). EITF 07-05 does not address that second part of the scope exception in paragraph 11(a) of SFAS 133. We are currently evaluating the impact the adoption of EITF 07-05 will have on our financial statements.
During June 2008, the FASB issued FASB Staff Position (“FSP”) FSP EITF 03-6-1, Determining Whether Instruments Granted in Share-based Payment Transactions are Participating Securities, which effectively considers any outstanding unvested share-based payment awards that contain dividend provisions during the requisite service period and that are not required to be forfeited by the employee, to participate in the undistributed earnings of a company. Application of this FSP, specifically any changes to forfeiture estimates that result from the application should not change prior or current earnings-per-share computation. This FSP requires retroactive adoption and is effective for financial statements issued for fiscal years beginning after December 15, 2008 and interim periods within those fiscal years. Early adoption is not permitted. We are currently evaluating the impact the adoption of FSP EITF 03-6-1 will have on our financial statements.
In March 2007, the FASB ratified EITF Issue No. 06-11, Accounting for Income Tax Benefits of Dividends on Share-Based Payment Awards (“EITF 06-11), which requires companies to recognize the income tax benefit realized from dividends or dividend equivalents that are charged to retained earnings and paid to employees for non-vested equity-classified employee share-based awards as an increase to additional paid-in capital instead of a credit to income tax expense. The amount recognized in additional paid-in capital will be available to absorb potential future tax deficiencies on share–based payment awards. EITF 06-11 was effective for fiscal years beginning after December 15, 2007 and therefore is effective for IFT in fiscal year 2008. The adoption of EITF 06-11 did not have a material effect on our financial statements.
Critical Accounting Policies and Estimates
Revenue Recognition
We recognize revenue from the sale of our products when the products are shipped, and title and risk of loss has passed to the buyer. The majority of our revenues is from sales to product distributors. Product distributors do not have the option to return product that is not immediately sold to an end-user. Therefore, our revenue recognition is not conditional on whether a distributor is able to sell product to an ultimate product end-user. Our sales policies for end-users are consistent with product distributor sales policies.
Valuation of goodwill
We test goodwill for impairment at least annually in the fourth quarter. We will also review goodwill for impairment throughout the year if any events or changes in circumstances indicate the carrying value may not be recoverable.
Factors we consider important, which could trigger an impairment review, include the following:
| 1. | Significant under-performance relative to expected historical or projected future operating results; |
| 2. | Significant changes in the manner of our use of the acquired assets or the strategy for our overall business; |
| 3. | Significant negative industry or economic trends; |
| 4. | Significant decline in our stock price for a sustained period; and |
| 5 | Our market capitalization relative to net book value. |
To test impairment, we use the market approach to determine the fair value of the Company. Following this approach, the fair value of the business exceeded the carrying value of the business as of December 31, 2008. As a result, no impairment of goodwill was recorded.
Deferred income taxes
Deferred income taxes are recognized for the tax consequences of “temporary differences” by applying enacted statutory rates applicable to future years to differences between the financial statement carrying amounts and the tax basis of existing assets and liabilities. At December 31, 2008, our deferred income tax assets consisted principally of net operating loss carry-forwards, and have been fully offset with a valuation allowance because it is more likely than not that a tax benefit will not be realized from the assets in the future.
Liquidity and Capital Resources
A critical component of our operating plan affecting our ability to execute the product commercialization process is the cash resources needed to pursue our marketing and sales objectives. Until we are able to generate positive and sustainable operating cash flow, our ability to attract additional capital resources in the future will be critical to continue the funding of our operations. Current U.S. and worldwide adverse economic conditions and the tightening of credit markets may hinder our ability to attract additional capital resources in the future.
While we cannot make any assurances as to the accuracy of our projections of future capital needs, we believe that, as a result of first quarter 2009 equity raise activities ($2,162,500), cash received for a prepaid sales purchase order during the first quarter of 2009 (net cash margin expected of approximately $1,500,000) and the remaining equity commitment of $800,000 (entered into with a related party Board member of IFT and significant shareholder during 2008), we have adequate cash and cash equivalents balances and commitments to fund operations through 2009 and well beyond. If we are unable to generate positive and sustainable operating cash flows in time, we would need to raise additional capital to fund our future operations.
Cash used in operating activities was $2,065,115 for the twelve months ended December 31, 2008, compared to $2,296,701 for the twelve months ended December 31, 2007. The decrease in cash outflow from operating activities was primarily due to decreases in salary expense due to personnel changes and consulting expenses due to reduced scope in certain activities.
Cash provided by investing activities was $0 for the twelve months ended December 31, 2008, as compared to $1,506,102 for the twelve months ended December 31, 2007. The decrease in cash provided by investing activities was primarily due to all outstanding short-term investments maturing during 2007, with the proceeds utilized to fund operations.
Cash provided by financing activities was $2,000,000 for the twelve months ended December 31, 2008, as compared to $500,000 for the twelve months ended December 31, 2007. This increase in financing cash flow was primarily due to cash proceeds obtained from the issuance of 4,680,000 common shares. During 2007, we
received cash proceeds from the issuance of a $500,000 note payable to a related party non-employee Director, which was subsequently settled on March 31, 2008 with 1,040,000 shares of IFT common shares. During 2008, IFT subsequently re-purchased 520,000 of these shares for $250,000.
Net cash decreased by $65,115 for the twelve months ended December 31, 2008, as compared to a decrease in net cash of $290,599 for the twelve months ended December 31, 2007.
During the first quarter of 2009, IFT received cash proceeds of $2,162,500 from the issuance of 8,650,000 IFT common shares (including 4,325,000 attachable warrants) to accredited investors. IFT also repurchased another 520,000 shares of IFT common stock from a related party non-employee Director of IFT during the first quarter of 2009 for $250,000.
Cash used in operating activities was $2,296,701 for the twelve months ended December 31, 2007, compared to $3,704,013 for the twelve months ended December 31, 2006. The decrease in cash outflow from operating activities was due primarily to lower net losses and a $129,198 decrease in non-cash and investment working capital in 2007 compared to a corresponding $636,541 increase in 2006.
Cash provided by investing activities was $1,506,102 for the twelve months ended December 31, 2007, as compared to $944,541 of cash provided by investing activities for the twelve months ended December 31, 2006. The increase in cash provided by investing activities was primarily due to all outstanding short-term investments maturing during 2007, with the proceeds utilized to fund operations.
Cash provided by financing activities was $500,000 for the twelve months ended December 31, 2007, as compared to $32,301 for the twelve months ended December 31, 2006. This increase in financing cash flow was primarily due to cash proceeds obtained from the issuance of a $500,000 note payable to a related party non-employer Director, which was subsequently settled on March 31, 2008 with 1,040,000 shares of IFT common shares. During 2006, we received minimal proceeds from the exercise of stock options.
Net cash decreased by $290,599 for the twelve months ended December 31, 2007, as compared to a decrease in net cash of $2,727,171 for the twelve months ended December 31, 2006.
Working capital at December 31, 2008 was $26,447, as compared to $162,342 at December 31, 2007 and $2,089,475 at December 31, 2006. These decreases were primarily attributable to funding cash operating expenses for 2008 and 2007, respectively.
On January 20, 2009, our Board of Directors declared a restricted stock dividend to shareholders of record at the close of business on February 4, 2009 (the “Record Date”) in the amount of 1 restricted share for every 25 common shares owned. The distribution date was February 10, 2009. The restricted stock dividend is subject to resale conditions pursuant to Rule 144 of the Securities and Exchange Act. This stock dividend has been retroactively reflected in our financial statements and notes to the financial statements.
Effective October 27, 1999, we merged with Blencathia. Blencathia was a public shell company with immaterial assets and liabilities and 312,000 shares outstanding at the time of the merger, which it redeemed and cancelled upon the merger. In exchange, we issued 312,000 of our common shares to the prior Blencathia owner with the contractual understanding that such shares were to be sold by that owner to achieve gross cash proceeds of $500,000. Any excess proceeds were to be returned to us and any deficiency was to be made up by us issuing additional shares or paying the difference in cash. As we believed that we controlled the ultimate timing of the sale of these 312,000 shares by the prior Blencathia owner, we did not consider these shares as issued or outstanding for purposes of computing earnings per share.
In 2006, we learned that the prior Blencathia owner had, in fact, sold the 312,000 shares for aggregate proceeds of approximately $150,000, without our consent. Accordingly, in the fourth quarter of 2006, we recorded $500,000 of general expenses (representing the cost of the 1999 merger) and the deemed issuance of approximately $150,000 of common stock. The remaining $350,000 obligation has been reflected as a current accrued expense. We are in negotiations with the prior Blencathia owner to resolve this obligation and may ultimately settle the obligation with either cash or equity securities with a lower market value. Beginning in 2006, the 312,000 shares have been reflected as outstanding for loss per share computations.
Off-Balance Sheet Arrangements
At December 31, 2008, we did not have any off-balance sheet financing arrangements. We do not expect to engage in any significant off-balance sheet financing arrangements in the near future.
Contractual Obligations
| | | Payments due by period | |
| | | Total | | | Less than 1 year | | | 1-3 years | | | 3-5 years | | | More than 5 years | |
| Operating leases | | $ | 149,336 | | | $ | 50,043 | | | $ | 99,293 | | | $ | - | | | $ | - | |
| Total contractual obligations | | $ | 149,336 | | | $ | 50,043 | | | $ | 99,293 | | | $ | - | | | $ | - | |
| Item 8 | Financial Statements and Supplementary Data |
Financial statements specified by this Item, together with the report relating thereto of BDO Seidman, LLP, are presented following Item 15 of this report.
| Item 9. | Changes in and Disagreements with Accountants on Accounting and Financial Disclosure |
None.
| Item 9A(T). | Controls and Procedures |
Disclosure Controls and Procedures
Our management has evaluated, with the participation of its principal executive officer and principal financial officer, the effectiveness of our disclosure controls and procedures (as defined in Rules 13a-15(e) and 15d-15(e) under the Securities Exchange Act of 1934, as amended (“Exchange Act”)) as of December 31, 2008. Based on this evaluation, the principal executive officer and principal financial officer have identified a material weakness in our internal control over financial reporting. Therefore, the principal executive officer and principal financial officer concluded that our disclosure controls and procedures were not effective at December 31, 2008.
Management’s Report on Internal Control Over Financial Reporting
Our management is responsible for establishing and maintaining adequate internal control over financial reporting. Internal control over financial reporting is defined in Rule 13a-15(f) and Rule 15d-15(f) promulgated under the Exchange Act. Under the supervision and with the participation of our management, including our chief executive officer and chief financial officer, we conducted an evaluation of the effectiveness of our internal control over financial reporting as of December 31, 2008, based on the framework in Internal Control-Integrated Framework issued by the Committee of Sponsoring Organizations of the Treadway Commission. Based on our evaluation under the framework in Internal Control-Integrated Framework, we have identified a material weakness in our internal control over financial reporting. As a result, our management has concluded that our internal control over financial reporting was not effective as of December 31, 2008.
A material weakness is a deficiency, or combination of deficiencies, in internal control over financial reporting such that there is a reasonable possibility that a material misstatement of our annual or interim financial statements will not be prevented or detected on at timely basis.
During our 2007 review of internal controls, management identified the following material weakness: IFT has limited accounting personnel with sufficient expertise, accounting knowledge and training in generally accepted accounting principles and financial reporting requirements. Specifically, IFT lacks sufficient personnel to anticipate, identify, resolve and review complex accounting issues and to complete a timely review of the financial statements. This material weakness was not corrected during 2008.
This deficiency resulted in adjustments to the financial statements for stock-based compensation and also resulted in adjustments to financial statement presentation in both 2007 and 2008. This control deficiency, which is pervasive in impact, did not result in any material adjustments to the financial statements. There is a reasonable possibility that a material misstatement of the annual or interim financial statements would not be prevented or detected on a timely basis.
Management does consult with outside advisers, external SEC counsel and its independent registered public accounting firm regarding certain reporting issues.
Management has discussed the material weakness and related corrective actions with the Audit Committee and our independent registered public accounting firm. Other than as described above, we are not aware of any other material weakness in our internal control over financial reporting. Because of its inherent limitations, internal control over financial reporting may not prevent or detect misstatements. Projections of any evaluation of effectiveness to future periods are subject to risk that controls may become inadequate because of changes in conditions, or that the degree of compliance with the policies or procedures may deteriorate.
This annual report does not include an attestation report of IFT’s registered public accounting firm regarding internal control over financial reporting. Management’s report was not subject to attestation by IFT’s registered public accounting firm pursuant to temporary rules of the SEC that permit IFT to provide only management’s report in this annual report.
The Remediation Plan
Although as of December 31, 2008 we have not yet remediated the material weakness in our internal control over financial reporting originally identified during our 2007 review, we have made and will continue to make, improvements to our policies, procedures, systems and staffing who have significant roles in internal control to address the identified internal control deficiencies. Consequently, management has initiated the following remediation steps to address the material weakness described above:
| · | We will continue to focus on improving the skill sets of our accounting and finance function, through education and training; |
| · | We will continue to consider the engagement of qualified professional consultants to assist us in cases where we do not have sufficient internal resources, with management reviewing both the inputs and outputs of the services; and |
| · | Upon the successful completion of a financing sufficient to support operations for at least two years, we will consider the hiring of additional accounting and finance staff with the commensurate knowledge, experience and training necessary to complement the current staff in the financial reporting functions. |
| · | We will further develop our financial statement closing and reporting practices to include additional levels of checks and balances in our procedures and timely review. |
Changes in Internal Control Over Financial Reporting
There were no changes in our internal control over financial reporting (as defined in Rules 13a-15(f) and 15d-15(f) under the Exchange Act) that occurred during the quarter ended December 31, 2008, that have materially affected, or are reasonably likely to materially affect, our internal control over financial reporting. However, as discussed above, we have identified a material weakness in our internal control over financial reporting.
| Item 9B. | Other Information |
Not applicable.
PART III
| Item 10. | Directors, Executive Officers and Corporate Governance |
The following are the names of our current Directors and executive officers, their present positions with IFT and biographical information.
| Name | | Age | | Position(s) and offices held with IFT | | Dates in position or office |
| | | | | | | |
| Jonathan R. Burst | | 50 | | Chief Executive Officer, Director, Chairman | | 1999 – Present 2000 - Present |
| Rex Carr | | 81 | | Director | | 2002 - Present |
| Harry F. Demetriou | | 64 | | Director | | 2000 - Present |
| Gary Kirk | | 46 | | Director, Director of Sales and Marketing * | | 2003 - Present |
| David B. Norris | | 60 | | Director | | 2000 - Present |
| Stuart D. Beath | | 49 | | Chief Financial Officer | | 2007 – Present |
| |
| *This is a non-executive officer position. |
All Directors hold office until the next annual meeting of shareholders or until their successors are elected and qualified. At present, our Articles of Incorporation provide for not less than one nor more than nine directors. Currently, we have five directors. Our by-laws permit the Board of Directors to fill any vacancy and such director may serve until the next annual meeting of shareholders or until his successor is elected and qualified. Officers serve at the discretion of the Board of Directors.
Background of Directors and Executive Officers:
JONATHAN R. BURST has served as our Chief Executive Officer since July 1999, and as the President of IFT from July 1999 to February 2000 and January 2002 to April 2005. Mr. Burst has also served as a Director and Chairman of the Board since 2000. Mr. Burst founded Burcor International in 1998, primarily an insurance brokerage firm, and has served as President since its inception. Mr. Burst received a bachelor of arts degree in Economics from the University of Missouri in 1981.
REX CARR has served as a Director of IFT since August 2002. Mr. Carr has been the managing partner of the Rex Carr Law Firm, a law firm with offices in East St. Louis, Illinois, St. Louis, Missouri and Belleville, Illinois, since 2004. Until 2003, Mr. Carr was the senior partner of a 36-person law firm, Carr, Korein, and Tillery, with offices in Missouri and Illinois, for more than five years. He is admitted to practice in the United States Supreme Court and the Illinois and Missouri Supreme Courts.
HARRY DEMETRIOU has served as a Director of IFT since February 2000. Mr. Demetriou is currently the Chairman for Observor Acceptances, Ltd., an investment company. Mr. Demetriou was active in the shipping industry as an owner of bulk carriers for over 25 years. He has been retired from active management in the shipping industry since 1999.
GARY KIRK has served as a Director of IFT since November 2003. Mr. Kirk has served as our Director of Sales and Marketing since January 1, 2003. Mr. Kirk has extensive experience (1980 to 2003) in the petroleum industry, all with Petrochem Carless Ltd., a United Kingdom-based refiner and marketer of petroleum products. Mr. Kirk spent his first eight years as a research chemist and the remainder in Petrochem Carless’ marketing department. From 1988 to 2003, Mr. Kirk reported directly to the President of Petrochem Carless as the Marketing Manager for Performance Fuels, covering accounts in Europe and the rest of the world.
DAVID B. NORRIS has served as a Director of IFT since April 1999. Mr. Norris founded and owns Addicks Services, Inc., a construction company, and has served as its Vice President since 1983.
STUART D. BEATH has served as our Chief Financial Officer since July 2007. From 2001 until his appointment to Chief Financial Officer, Mr. Beath served as our Director of Corporate Development. Prior to coming to IFT, Mr. Beath was a First Vice President and served in the Corporate Finance Department of Stifel, Nicolaus & Company, Incorporated, a brokerage and investment banking firm, from 1993 to 1997. Mr. Beath was also a member of the Board of Directors of Anchor Gaming from 1994 to 2001, serving on the Board’s Audit Committee. From 1987 to 1993, Mr. Beath served in the Corporate Finance Department of A.G. Edwards & Sons, Inc., a brokerage and investment banking firm, where he was an Assistant Vice President of the Firm. Mr. Beath earned a bachelor of arts degree from Williams College in 1981 and a masters in business administration degree from the Darden School at the University of Virginia in 1987.
Section 16(a) Beneficial Ownership Reporting Compliance
Section 16(a) of the Exchange Act, requires our executive officers and Directors, and persons who beneficially own more than ten percent of our common stock, to file initial reports of ownership and reports of changes in ownership with the SEC. Executive officers, Directors and greater than ten percent beneficial shareholders are required by SEC regulations to furnish us with copies of all Section 16(a) forms they file. Each of Messrs. Burst, Carr, Kirk and Norris failed to file one report in 2008. Each such report related to one transaction. In addition, Mr. Demetriou failed to file two reports in 2008, each related to one transaction.
Code of Business Conduct and Ethics
We have adopted a Code of Business Conduct and Ethics that applies to the Chief Executive Officer, the Chief Financial Officer, senior financial officers and employees with financial reporting responsibilities. A copy will be provided at no charge. Requests can be sent to International Fuel Technology, Inc., 7777 Bonhomme Avenue, Suite 1920, St. Louis, Missouri 63105, attention Thomas M. Powell.
Audit Committee
We have a separately designated Audit Committee. The current members of the Audit Committee are Harry F. Demetriou and David B. Norris.
The Board of Directors has determined that David B. Norris, an independent member of the Board, satisfies all of the criteria to be an “audit committee financial expert” as defined in Item 407(d)(5)(ii) of Regulation S-K.
Procedures for Nominating Directors
There have been no material changes to the procedures by which security holders may recommend nominees to the Board of Directors since the filing of our annual report on Form 10-K for the fiscal year ended December 31, 2007.
| Item 11. | Executive Compensation |
COMPENSATION DISCUSSION AND ANALYSIS
Philosophy and Overview of Compensation
Our executive compensation philosophy is intended to provide compensation opportunities that:
| · | Attract, motivate and retain individuals of superior ability and managerial talent critical to our long-term success; |
| · | Align executives’ interests with our corporate strategies, business objectives and the long-term interests of our stockholders; |
| · | Create incentives to achieve key strategic and financial performance measures; and |
| · | Enhance the executives’ incentive to increase our stock price and maximize stockholder value. |
Total Compensation
Our executive compensation is based on three components, each of which is intended to support the overall compensation philosophy. The components are:
| · | annual variable performance bonus awards payable in cash; and |
| · | long-term equity-based incentive awards. |
These elements are described in more detail below.
The Role of the Compensation Committee
The Compensation Committee has the primary authority to determine our compensation philosophy and to make recommendations regarding compensation for our executive officers. The Compensation Committee makes recommendations to the Board concerning salaries and incentive compensation for executive officers, awards equity compensation to employees and consultants under our Consultant and Employee Stock Compensation Plan and our Amended and Restated Plan 2001 Long-Term Incentive Plan (the “Amended and Restated LTIP”) and otherwise determines compensation levels and performs such other functions regarding compensation as the Board may delegate.
The Compensation Committee has recommended to the Board, and the Board has implemented, compensation policies, plans and programs that seek to enhance stockholder value by aligning the financial interests of the executive officers with those of the stockholders. We rely heavily on incentive, including equity, compensation to attract, retain, motivate and reward executive officers. Historically, annual base salaries have been set at the time of hire and are subject to adjustment. Initial base salaries are recommended by the Chief Executive Officer to the Compensation Committee. After review, the Compensation Committee recommends to the full Board of Directors the compensation package as part of the overall Board consideration of the full employment package offered to the prospective officer. The compensation package is based on the amount deemed necessary to attract and retain the services of the executive officer candidate. Incentive compensation is variable and tied to corporate and individual performance. The incentive compensation program is designed to provide incentive to management to grow revenues, provide quality returns on investment, enhance stockholder value and contribute to the long-term growth of IFT. The incentive compensation program is reviewed at least annually to ensure it meets our current strategies and needs. The Chief Executive Officer aids the Compensation Committee by providing input regarding the annual compensation of all executive officers, other than himself. The performance of our Chief Executive Officer is reviewed annually by the Compensation Committee.
Base Salary
Salaries for executive officers are normally set at the time of hire and reviewed by the Compensation Committee on an annual or as needed basis. Based on the recommendation of the Compensation Committee, the Board may increase or decrease an officer’s base salary.
Based on the recommendations of the Compensation Committee, the Board reviews with the Chief Executive Officer the current annual salary for our executive officers other than the Chief Executive Officer. The annual salary is modified as deemed appropriate and approved by the Compensation Committee and the Board. The annual base salary for executive officers other than the Chief Executive Officer is reviewed by our Chief Executive Officer based on IFT’s corporate performance generally and on discretionary judgments of individual performance and is not necessarily tied to specific, measurable targets or criteria. Individual performance considerations include past and expected future contributions of the individual executive. The Compensation Committee reviews and recommends to the Board, and the Board establishes, the base salary of the Chief Executive Officer based on IFT’s corporate performance generally, the Compensation Committee’s and the Board’s assessments of his past performance and the expectation as to his future contributions in directing the long-term success of IFT. The assessment of the Chief Executive Officer’s individual performance is not tied to specific targets or criteria. Effective, July 1, 2008, the Chief Executive’s Officer’s base salary was increased from $250,000 to $400,000 annually and the Chief Financial Officer’s base salary was increased from $100,000 to $150,000 annually.
Annual Performance Bonus
The Compensation Committee and the Board believe that a portion of an executive officer’s annual compensation should be in the form of a bonus. The bonus awarded, if any, is determined by the Board, in its discretion, based on the recommendations of the Compensation Committee, with reference to achievement of certain corporate financial performance goals and the executive’s individual contribution which is not tied to specific targets or criteria. It is the Compensation Committee’s objective to have a substantial portion of each officer’s compensation contingent upon our performance as well as upon his or her own level of performance and contribution toward IFT’s performance. Any bonus awarded is discretionary in nature and is not based on specific corporate or individual performance targets.
In determining the discretionary bonus awarded to each executive officer, the Compensation Committee evaluates IFT’s and the executive’s performance in a number of areas. For fiscal year 2008, the individual corporate goals were designed to support key corporate objectives related to our technology, commercialization progress and revenue generating sales. Each of the executives was evaluated in relation to his contribution to the attainment of those targets. Our Chief Financial Officer received a bonus of $10,000 during 2008.
Performance-Based Long-Term Equity Incentive Awards
In accordance with our compensation philosophy, IFT’s longer-term performance-based compensation is based on equity ownership. We believe equity ownership in our Company is important to tie the ultimate level of an executive officer’s compensation to our stock performance and stockholder gains, while creating an incentive for sustained growth. To meet these objectives, our senior executive management team is normally granted equity compensation in the form of options to purchase IFT stock at time of hire as part of the attract and retain hiring program. The executive is also eligible to receive additional grants of performance-based equity compensation at the discretion of the Compensation Committee. Long-term equity incentives are provided through the grants of restricted stock or by issuing stock options to executive officers, including the Chief Executive Officer, pursuant to our Amended and Restated LTIP. The stock component of compensation is intended to retain and motivate executive officers and employees to improve long-term stockholder value. Restricted stock awards and options are granted at no less than fair market value and have increased value only if our stock price increases. The Compensation Committee and the Board believe this element of the total compensation program directly links the participant’s interests with those of the stockholders and our long-term performance. Each grant allows the officer to acquire shares of common stock at or above the market price on the grant date over a specified period of time, up to 10 years. Accordingly, the option will provide a return to the executive officer only if the market price of the shares appreciates over the option term. No performance-based incentive awards were granted to any executive officer during 2008.
Discretionary Long-Term Equity Incentive Awards
Our executive officers, along with all other IFT employees, consultants and Directors are eligible to receive grants under the Amended and Restated LTIP. The Compensation Committee determines annual awards granted pursuant to the Amended and Restated LTIP. Grants may be made following a significant change in job responsibility or in recognition of a significant achievement.
Stock options granted under the Amended and Restated LTIP generally have, but are not obligated to have, an eighteen-month vesting schedule designed to provide an incentive for continued employment. The options generally expire five years from the date of the grant. This provides a reasonable time frame during which executive officers and other employees who receive grants can benefit from the price appreciation of our common stock price. The exercise price of options granted is at least 100% of the fair market value of the underlying stock on the date of grant. No discretionary awards were granted to any executive officer during 2008.
Other Elements of Compensation and Perquisites
In order to attract, retain and pay market-based levels of compensation, we provide our employees, including our executive officers, the following benefits and perquisites:
Medical Insurance We provide to each employee and employee’s family such health, dental and vision insurance coverage as IFT may from time to time make available. We pay 100% of the premiums for this insurance for all employees.
Life and Disability Insurance We provide the Chief Executive Officer life insurance coverage pursuant to an employment agreement. In addition, we provide a nominal amount of life insurance coverage to all United States-based employees. We pay 100% of the premiums for this coverage.
Defined Contribution Plan We offer a Section 401(k) Savings/Retirement Plan (the “401(k) Plan”), a tax-qualified retirement plan, to eligible employees including our executive officers. The 401(k) Plan permits eligible employees to defer from 1% to 100% of their annual eligible compensation, subject to certain limitations imposed by the Internal Revenue Code. The employees’ elective deferrals are immediately vested and non-forfeitable in the 401(k) Plan. We currently do not make matching contributions to the 401(k) Plan.
Other We make available certain other perquisites or fringe benefits to executive officers and other employees, such as tuition reimbursement, airline club dues, commutation expense reimbursement, professional society dues and food and recreational fees incidental to official company functions, including Board meetings. The aggregate of these other benefits was less than $10,000 for each named executive officer (“NEO”) in the last fiscal year.
We do not use any benchmarking or third party consultants in connection with the analysis or determination of executive compensation. Director compensation is benchmarked periodically with similar sized technology-based companies for competitiveness.
CEO Compensation
On July 1, 2008, Mr. Burst’s annual base salary was increased from $250,000 to $400,000. For the fiscal year ended December 31, 2008, the Board did not award Mr. Burst an annual performance bonus or additional equity-based long-term compensation based on his services as Chief Executive Officer. The Compensation Committee and the Board believe that this was appropriate in light of IFT’s failure to achieve its product commercialization and sales goals for the fiscal year.
Mr. Burst is also entitled to receive equity compensation for his service on the Board. As a Director, Mr. Burst is entitled to an annual award of 10,000 restricted common shares or options of our common stock for membership on the Board. In addition, each Board member, including Mr. Burst, is entitled to receive 1,000 shares of restricted common stock or options for every three telephonic Board meetings attended. Mr. Burst received an option to purchase 10,400 common shares during the fourth quarter of 2008 for Board services provided during 2008.
Policies Regarding Tax Deductibility of Compensation
Within our performance-based compensation program, we aim to compensate NEOs in a manner that is tax-effective for IFT. Section 162(m) of the Internal Revenue Code restricts the ability of publicly-held companies to take a federal income tax deduction for compensation paid to certain of their executive officers to the extent that compensation exceeds $1 million per covered officer in any fiscal year. However, this limitation does not apply to compensation that is performance-based.
The non-performance-based compensation paid in cash to our NEOs for the 2008 fiscal year did not exceed the $1 million limit per officer, and the Compensation Committee does not anticipate that the non-performance-based compensation to be paid in cash to our NEOs for fiscal 2009 will exceed that limit.
Compensation Committee Report
Our Compensation Committee reviewed this Compensation Discussion and Analysis and discussed its contents with our management. Based on the review and discussions, the Compensation Committee has recommended to the Board that the Compensation Discussion and Analysis be included in this report.
Harry F. Demetriou, Chairman
David B. Norris
Compensation Committee Interlocks and Insider Participation
During fiscal 2008, our Compensation Committee was composed of Messrs. Demetriou and Norris. None of the Compensation Committee members has ever served as an officer of IFT or of any of its subsidiaries. None of the Compensation Committee members has had a relationship requiring disclosure under Item 404 of Regulation S-K. No executive officer of IFT has served on the Board of Directors or Compensation Committee of any other entity that has or has had one or more executive officers who served as a member of IFT’s Board or its Compensation Committee during the 2008 fiscal year.
Executive Officer Employment Agreements
In January 2002, we entered into an employment agreement with Mr. Burst to serve as our Chief Executive Officer with an initial annual base salary of $250,000, options to purchase 780,000 shares of our common stock, with 260,000 shares vesting on the first anniversary of his employment and the remaining 520,000 shares vesting on the last day of the employment period and a bonus award as deemed appropriate by the Board. The initial three-year agreement expired on December 31, 2004. With the exception of an increase in salary effective July 1, 2008, Mr. Burst continues to serve as our Chief Executive Officer under the terms of his past agreement. IFT may terminate Mr. Burst’s employment with or without cause, as such terms are defined in the agreement. Mr. Burst may elect to terminate his employment with good cause, as defined by his agreement. In addition, Mr. Burst as a Director, is entitled to receive compensation for serving on our Board of Directors.
In July 2007, we entered into an employment agreement with Mr. Beath to serve as Chief Financial Officer with an annual base salary of $100,000 and options to purchase 208,000 shares of our common stock, which vest in full on July 2, 2009. The two-year agreement expires July 2, 2009. Mr. Beath received an increase in annual base salary to $150,000 effective July 1, 2008.
For additional information regarding these agreements, see “Potential Payments Upon Termination or Change of Control.”
2008 Summary Compensation Table
The following table sets forth information concerning all cash and non-cash compensation paid or to be paid by us as well as certain other compensation awarded, earned by and paid, during the indicated fiscal year, to the Chief Executive Officer and Chief Financial Officer.
| Name and Principal Position | Year | | Salary ($) | | | Bonus ($) | | | Option Awards ($) | | | All Other Compensation | | | Total ($) | |
| | | | | | | | | | | | | | | | | |
| Jonathan R. Burst, | 2008 | | $ | 334,615 | | | $ | - | | | $ | 1,700 | 1 | | $ | 19,796 | 2 | | $ | 356,111 | |
| CEO | 2007 | | $ | 250,000 | | | $ | - | | | $ | 1,300 | 3 | | $ | 16,761 | | | $ | 268,061 | |
| | 2006 | | $ | 250,000 | | | $ | - | | | $ | 4,200 | 4 | | $ | 16,899 | | | $ | 271,099 | |
| | | | | | | | | | | | | | | | | | | | | | |
Stuart D. Beath, 5 | 2008 | | $ | 135,885 | | | $ | 10,000 | | | $ | 32,000 | 6 | | $ | 16,633 | 7 | | $ | 194,518 | |
| CFO | 2007 | | $ | 76,923 | | | $ | - | | | $ | 16,000 | 6 | | $ | 14,441 | | | $ | 107,364 | |
| | 2006 | | $ | 70,000 | | | $ | - | | | $ | - | | | $ | 14,579 | | | $ | 84,579 | |
1) Represents 10,400 options to purchase shares of our common stock granted to Mr. Burst for Board services provided during 2008. These options were valued based on the closing price of our stock on grant date ($0.22 on December 31, 2008). Assumptions used in determining the value of these options are disclosed in Note 4 to our financial statements.
2) Represents $17,476 of health insurance coverage for Mr. Burst and his family and $2,320 of life insurance premiums paid by IFT.
3) Represents 10,400 options to purchase shares of our common stock granted to Mr. Burst for Board services provided during 2007. These options were valued based on the closing price of our stock on grant date ($0.16 on December 31, 2007). Assumptions used in determining the value of these options are disclosed in Note 4 to our financial statements.
4) Represents 10,400 options to purchase shares of our common stock granted to Mr. Burst for Board services provided during 2006. These options were valued based on the closing price of our stock on grant date ($0.51 on December 31, 2006).
5) Mr. Beath was appointed to CFO effective June 30, 2007. He previously served as IFT’s Director of Corporate Development.
6) Represents 208,000 options to purchase shares of our common stock granted to Mr. Beath upon his appointment to CFO during 2007. These options were valued based on the closing price of our stock on grant date ($0.42 on July 2, 2007). Assumptions used in determining the value of these options are disclosed in Note 4 to our financial statements.
7) Represents $16,663 of health insurance coverage for Mr. Beath and his family.
Grants of Plan-Based Awards in Fiscal Year 2008
| Name | | Grant Date | | Board Action | | All Other Option Awards: Number of Securities Underlying Options (#) | | | Exercise or Base Price of Option Awards ($/Sh) | | | Grant Date Fair Value of Stock and Option Awards ($) | |
| | | | | | | | | | | | | | |
Jonathan R. Burst(1) | | 12/31/2008 | | 10/24/2008 | | | 10,400 | | | $ | 0.22 | | | $ | 1,700 | |
| (1) | Represents 10,400 options to purchase shares of our common stock granted to Mr. Burst for Board services provided during 2008. These options were valued based on the closing price of our stock on the grant date ($0.22 on December 31, 2008), as specified in the Board action dated October 24, 2008. The Board Action date of October 24, 2008 represents the date the Board authorized Board compensation for 2008 services based on a December 31, 2008 grant date. |
Outstanding Equity Awards at 2008 Fiscal Year-End
The following table provides information on all restricted stock, stock options and SAR awards (if any) held by our NEOs as of December 31, 2008.
| Name | | Number of Securities Underlying Unexercised Options Exercisable (#) | | | Number of Securities Underlying Unexercised Options Unexercisable (#) | | | Equity Incentive Plan Awards: Number of Securities Underlying Unexercised Unearned Options (#) | | | Option Exercise Price ($) | | Option Expiration Date |
| Jonathan R. Burst | | | 1,040,000 | | | | - | | | | - | | | $ | 0.24 | | 12/31/2009 |
| | | | 1,040,000 | | | | - | | | | - | | | $ | 0.48 | | 12/31/2009 |
| | | | 780,000 | | | | - | | | | - | | | $ | 0.48 | | 12/31/2009 |
| | | | 780,000 | | | | - | | | | - | | | $ | 0.48 | | 12/31/2009 |
| | | | 1,040,000 | | | | - | | | | - | | | $ | 0.72 | | 12/31/2009 |
| | | | 260,000 | | | | - | | | | - | | | $ | 0.13 | | 12/31/2009 |
| | | | 260,000 | | | | - | | | | - | | | $ | 0.13 | | 12/31/2009 |
| | | | 260,000 | | | | - | | | | - | | | $ | 0.13 | | 12/31/2009 |
| | | | 780,000 | | | | - | | | | - | | | $ | 0.96 | | 12/31/2009 |
| | | | 780,000 | | | | - | | | | - | | | $ | 1.92 | | 12/31/2010 |
| | | | 10,400 | | | | - | | | | - | | | $ | 0.49 | | 12/31/2011 |
| | | | 10,400 | | | | - | | | | - | | | $ | 0.15 | | 12/31/2012 |
| | | | 10,400 | | | | - | | | | - | | | $ | 0.21 | | 12/31/2013 |
| | | | | | | | | | | | | | | | | | |
| Stuart D. Beath | | | 364,000 | | | | - | | | | - | | | $ | 0.48 | | 12/31/2009 |
| | | | 364,000 | | | | - | | | | - | | | $ | 0.48 | | 12/31/2009 |
| | | | 260,000 | | | | - | | | | - | | | $ | 0.48 | | 12/31/2009 |
| | | | 156,000 | | | | - | | | | - | | | $ | 0.96 | | 12/31/2009 |
| | | | 208,000 | | | | - | | | | - | | | $ | 1.92 | | 12/31/2009 |
| | | | - | | | | 208,000 | | | | - | | | $ | 0.72 | | 6/30/2012 |
2008 Option Exercises and Stock Vested
Mr. Burst received 10,400 options to purchase our common stock (with an immediate vesting date) for Board services provided during 2008. We did not have any stock option exercises or any other stock vesting activity by any of our NEOs during fiscal 2008.
Potential Payments Upon Termination or Change in Control
The following table sets forth potential payments payable to our NEOs upon termination of employment or a change in control. Our Compensation Committee may in its discretion revise, amend or add to the benefits if it deems advisable. The table below reflects amounts payable to our NEOs assuming a change of control on, and/or their employment was terminated on December 31, 2008.
| Name | | Benefit | | Termination Without Cause; No Change of Control ($) | | | Change of Control; No Termination ($) | | | Termination Without Cause with Change of Control ($) | |
| | | | | | | | | | | | |
| Jonathan R. Burst | | Buy Out | | $ | 400,000 | | | $ | - | | | $ | 400,000 | |
| | | | | | | | | | | | | | | |
| Stuart D. Beath | | Buy Out | | $ | 150,000 | | | $ | - | | | $ | 166,000 | (1) |
| | (1) | Includes $16,000 representing the immediate vesting of currently unvested stock options. |
2008 Director Compensation
Directors do not receive any cash compensation for their services as members of the Board, although they are reimbursed for certain expenses incurred in connection with attendance at Board and Committee meetings.
Each non-employee and employee Director is entitled to an annual award of 10,000 restricted shares or immediately vesting options of our common stock for membership on the Board. In addition, each Board member is entitled to receive 1,000 shares of restricted stock or options for every three telephonic Board meetings attended.
For 2008 Board services, each Board member elected options as compensation for his services. The grant date fair value, computed in accordance with SFAS 123R, of each Director’s option grant during 2008 was $1,700. Assumptions used in determining the value of these options are disclosed in Note 4 to our financial statements.
Board members are also eligible to receive discretionary grants of common stock under the Consultant and Employee Stock Compensation Plan and grants of stock options, stock appreciation rights and restricted stock pursuant to the Amended and Restated LTIP. We did not make discretionary equity grants to any Directors in their capacity as Directors during the fiscal year ended December 31, 2008.
The following table provides information related to the compensation of our non-NEO Directors for fiscal 2008. For information regarding our Chairman and Chief Executive Officer’s 2008 compensation, see the 2008 Summary Compensation table and “Compensation Discussion and Analysis.”
| Name | | Option
Awards ($) | | | All Other Compensation ($) | | | Total ($) | |
| | | | | | | | | | |
Rex Carr1 | | $ | 1,700 | | | $ | - | | | $ | 1,700 | |
Harry F. Demetriou2 | | $ | 1,700 | | | $ | - | | | $ | 1,700 | |
David B. Norris3 | | $ | 1,700 | | | $ | - | | | $ | 1,700 | |
Gary Kirk4 | | $ | 1,700 | | | $ | 164,807 | 5 | | $ | 166,507 | |
(1) Mr. Carr’s IFT equity holdings as of December 31, 2008 include 14,820,298 shares of restricted common stock owned by R.C. Holding Company, of which Mr. Carr is a Director, President and 41% stockholder. Mr. Carr is deemed to be the beneficial owner of these shares. Mr. Carr also owns 130,000 shares of common stock and 5,761,568 shares of restricted common stock. Mr. Carr also has 76,960 vested options to purchase shares of IFT common stock, obtained from Board services provided from 2002 to date.
(2) Mr. Demetriou’s IFT equity holdings as of December 31, 2008 include 4,160,000 shares of restricted common stock owned by Observor Acceptances, Ltd. of which Mr. Demetriou is the sole owner. Mr. Demetriou is deemed to be the beneficial owner of such shares. Mr. Demetriou also holds 99,840 vested options to purchase shares of IFT common stock, obtained from Board services provided from 2000 to date.
(3) Mr. Norris’ IFT equity holdings as of December 31, 2008 include 1,244,425 shares of restricted common stock. Mr. Norris also holds 104,000 vested options to purchase shares of IFT common stock for non-director related services provided and 99,840 vested options to purchase shares of IFT common stock obtained from Board services provided from 2000 to date.
(4) Mr. Kirk’s IFT equity holdings as of December 31, 2008 include 2,080,000 options to purchase shares of IFT common stock, granted for employee services. Mr. Kirk also holds 65,520 vested options to purchase shares of IFT common stock, obtained from Board services provided from 2003 to date.
(5) Pursuant to his employment agreement, Mr. Kirk has an annual salary of 75,000 British Pounds, receives 3,750 British Pounds for retirement contributions, receives a health insurance stipend of 3,000 British Pounds and receives an annual auto allowance of $9,600. The total above represents foreign currency conversion to U.S. Dollars based on when payments were made to Mr. Kirk throughout the year.
| Item 12. | Security Ownership of Certain Beneficial Owners and Management and Related Stockholder Matters. |
The following table sets forth information regarding the ownership of our common stock as of March 24, 2009 by (i) each person known by IFT to own beneficially more than five percent of our common stock; (ii) each Director of IFT; (iii) each executive officer named in the Summary Compensation Table (see “Executive Compensation”); and (iv) all Directors and executive officers of IFT as a group.
| Name and Address of Beneficial Owner | | Amount and Nature of Beneficial Ownership 1 | | | Percent of Common Stock | |
| | | | | | | |
Jonathan R. Burst 2 | | | 9,418,344 | | | | 8.66 | % |
David B. Norris 3 | | | 1,448,265 | | | | 1.42 | % |
Harry F. Demetriou 4 | | | 4,259,840 | | | | 4.18 | % |
Gary Kirk 5 | | | 2,145,520 | | | | 2.07 | % |
Rex Carr 6 | | | 20,788,826 | | | | 20.43 | % |
Stuart D. Beath 7 | | | 1,701,024 | | | | 1.65 | % |
| | | | | | | | | |
All Directors and executive officers as a group (6 persons) 8 | | | 39,761,819 | | | | 34.98 | % |
| | | | | | | | | |
Dion Friedland 9 | | | 5,519,382 | | | | 5.33 | % |
Esam Bin Hashim Hakeem 10 | | | 11,960,000 | | | | 11.19 | % |
John M. Hennessy11 | | | 6,000,000 | | | | 5.79 | % |
1This table is based upon information supplied by officers, Directors and principal stockholders. Unless otherwise indicated in the footnotes to this table and subject to community property laws where applicable, we believe that each of the stockholders named in this table has sole voting and investment power with respect to the shares indicated as beneficially owned. Unless otherwise indicated, the principal address of each of the stockholders named in this table is: c/o International Fuel Technology, Inc., 7777 Bonhomme Avenue, Suite 1920, St. Louis, Missouri 63105. The number of shares beneficially owned includes shares of common stock that the owner or owners had the right to acquire on or within 60 days of March 24, 2009, including through the exercise of options or warrants. Also included are restricted shares of common stock, over which the owner or owners have voting power, but no investment power.
2Includes 52,000 restricted shares of common stock owned by Burcor Capital, LLC, of which Mr. Burst is an executive officer. Mr. Burst is deemed to be the beneficial owner of such shares. It also includes 7,051,200 shares issuable upon the exercise of options.
3Includes 203,840 shares issuable upon exercise of options.
4Includes 4,160,000 shares of restricted common stock owned by Observor Acceptances, Ltd. of which Mr. Demetriou is the sole owner. Mr. Demetriou is deemed to be the beneficial owner of such shares. Amount also includes 99,840 shares issuable upon exercise of options. In addition to the amounts disclosed above, on March 31, 2008, Mr. Demetriou agreed to settle his $500,000 note due from the Company for 1,040,000 shares of IFT common stock. These shares were subsequently repurchased from Mr. Demetriou by IFT.
5Represents 2,145,520 shares issuable upon exercise of options.
6Includes 14,820,298 shares of restricted common stock owned by R.C. Holding Company, of which Mr. Carr is a Director, President and 41% stockholder. Mr. Carr is deemed to be the beneficial owner of these shares. Also includes 130,000 shares of common stock and 5,761,568 shares of restricted common stock owned by Mr. Carr. Amount also includes 76,960 shares issuable upon exercise of options.
7Represents 349,024 shares of common stock and 1,352,000 shares issuable upon exercise of options.
8Includes 10,929,360 shares issuable upon exercise of options.
9Includes 3,656,453 shares of common stock, 1,040,000 shares issuable upon exercise of vested options and 822,929 shares issuable upon exercise of warrants owned by Magnum Select Fund, FT Marketing, Ltd. and Giant Trading of which Mr. Friedland is a Director and/or President. Mr. Friedland is deemed to be the beneficial owner of these shares. Mr. Friedland is Chairman of Fuel Technologies Ltd., one of our former distributors. Mr. Friedland’s principal address is Fuel Technologies LLP, Berkshire House, 168-173 High, Holborn, United Kingdom, WC1V 7AA.
10Includes 7,800,000 shares issuable upon exercise of options. Also includes 2,080,000 shares of restricted common stock owned by Libya Africa Investment Portfolio and 2,080,000 shares of restricted common stock owned by Vision Oil Services Limited. To IFT’s knowledge, Esam Bin Hashim Hakeem, Libya Africa Investment Portfolio and Vision Oil Services Limited are affiliates and are acting as a group for purposes of Section 13(d)(3) of the Securities Exchange Act of 1934, as amended. The principal address for this “group” is Vision Oil Services Limited, 15 Rue de Jeu-de-l’Arc, Case postale 6105, CH –1211 Geneva, Switzerland.
11Includes 2,000,000 shares issuable upon exercise of warrants. Mr. Hennessy’s principal address is 47 West Lake Road, Tuxedo Park, NY 10987.
Securities Authorized for Issuance Under Equity Compensation Plans
| Plan category | | Number of securities to be issued upon exercise of outstanding options, warrants and rights | | | Weighted-average exercise price of outstanding options, warrants and rights | | | Number of securities remaining available for future issuance under equity compensation plans (excluding securities reflected in column (a)) | |
| | | (a) | | | (b) | | | (c) | |
| Equity compensation plans approved by security holders | | | - | | | $ | - | | | | - | |
| Equity compensation plans not approved by security holders (1) (2) | | | 26,984,081 | | | $ | 0.86 | | | | 1,300,612 | |
| Total | | | 26,984,081 | | | $ | 0.86 | | | | 1,300,612 | |
| | (1) | Includes options granted to employees, Directors and non-employees under our original Long Term Incentive Plan, our Amended and Restated LTIP and options issued to non-employees under other arrangements. |
| | (2) | See Notes 3 and 4 to our financial statements. |
| Item 13 | Certain Relationships and Related Transactions, and Director Independence |
During the fourth quarter of 2007, we obtained a $500,000 loan from Harry F. Demetriou, a Director of IFT and the holder of over five (5%) percent of IFT’s common stock. Pursuant to the terms of the loan, a promissory note was executed by IFT in favor of Mr. Demetriou in connection with the loan. The loan was to accrue interest at the rate of 15% per year in arrears, was to become due and payable on January 1, 2009, and was guaranteed by Rex Carr, a Director of IFT and the holder of over five (5%) percent of IFT’s common stock. IFT also was obligated to pay any related loan fees incurred by Mr. Demetriou. On March 31, 2008, Mr. Demetriou agreed to accept 1,040,000 shares of IFT common stock in settlement of the $500,000 note. The trading price of the common stock was $0.41 per share as of March 31, 2008. As such, the settlement represented a 22% premium compared to the current stock price. The premium was incentive for the settlement in shares rather than in cash and was based on negotiations between the Company and Mr. Demetriou. On June 18, 2008, IFT repurchased 520,000 of the shares granted for the debt settlement described above for $250,000. During the first quarter of 2009, IFT repurchased the remaining 520,000 shares granted for the debt settlement for $250,000.
On December 11, 2007, we obtained an investment commitment from Mr. Carr for up to $1,000,000 of equity purchases from time to time commencing after March 1, 2008. During the first quarter of 2008, IFT sold 416,000 shares to Mr. Carr under this arrangement for $200,000.
IFT’s Board has an informal, unwritten policy that provides that any transaction required to be reported under Item 404(a) of Regulation S-K will be reviewed and approved or ratified by IFT’s Board.
Messrs. Demetriou and Norris serve on our Audit Committee and our Compensation Committee. Mr. Norris is an independent Director, as such term is defined in the listing standards of The Nasdaq Stock Market, Inc. Mr. Demetriou is not an independent Director, as such term is defined in the listing standards of The Nasdaq Stock Market, Inc.
IFT does not have a separately designated nominating committee for its Board. Each of the following directors is not deemed to be independent, as such term is defined in the listing standards of The Nasdaq Stock Market: Mr. Burst, Mr. Carr and Mr. Kirk.
| Item 14. | Principal Accountant Fees and Services |
Services Provided by our Independent Registered Public Accountants
BDO Seidman, LLP served as our independent registered public accountants for the fiscal years ended December 31, 2008 and 2007. Aggregate fees for professional services rendered for IFT by BDO Seidman, LLP for the fiscal years ended December 31, 2008 and 2007 were as follows:
| | | Fiscal year ended
December 31, 2008 | | | Fiscal year ended
December 31, 2007 | |
| Audit fees | | $ | 127,268 | | | $ | 115,080 | |
| Audit-related fees | | | - | | | | - | |
| Tax fees | | | - | | | | - | |
| All other fees | | | - | | | | - | |
| | | $ | 127,268 | | | $ | 115,080 | |
Audit Fees
Audit fees were for professional services rendered for the audits of our financial statements and for review of the financial statements included in our quarterly reports on Form 10-Q for the quarterly periods during the 2008 and 2007 fiscal years.
Audit-related Fees
During the 2008 and 2007 fiscal years, BDO Seidman, LLP did not provide any assurance and related services that are reasonably related to the performance of the audit or review of our financial statements that are not reported under the caption “Audit Fees” above. Therefore, there were no audit-related fees billed or paid during the 2008 and 2007 fiscal years.
Tax Fees
As BDO Seidman, LLP did not provide any services to us for tax compliance, tax advice and tax planning during the fiscal years ended December 31, 2008 and 2007, no tax fees were billed or paid during those fiscal years.
All Other Fees
BDO Seidman, LLP did not provide any products and services not disclosed in the table above during the 2008 and 2007 fiscal years. As a result, there were no other fees billed or paid during those fiscal years.
Audit Committee Pre-approval Policies and Procedures
The Audit Committee has certain policies and procedures in place requiring the pre-approval of audit and non-audit services to be performed by our independent registered public accountants. Such pre-approval can be given as part of the Audit Committee’s approval of the scope of the engagement of the independent public registered accountants or on an individual basis. The approved non-audit services must be disclosed in our periodic reports filed with the SEC. The Audit Committee can delegate the pre-approval of non-auditing services to one or more of its members, but the decision must be presented to the full Audit Committee at the next scheduled meeting. The charter prohibits us from retaining our independent registered public accounting firm to perform specified non-audit functions, including (i) bookkeeping, financial information systems design and implementation; (ii) appraisal or valuation services, fairness opinions, or contribution-in-kind reports; (iii) actuarial services; and (iv) internal audit outsourcing services. All work performed by BDO Seidman, LLP for us in 2008 and 2007 was pre-approved by the Audit Committee.
PART IV
| Item 15. | Exhibits and Financial Statement Schedules |
(a) The following documents are filed as part of this report
See index to financial statements and supporting schedules on page F-1 of this annual report on Form 10-K.
| | 2. | Financial statement schedules |
All schedules for which provision is made in the applicable accounting regulations of the SEC are not required under the related instructions or are inapplicable and therefore have been omitted.
The following exhibits are filed as part of the report or are incorporated by reference:
EXHIBITS
3.1 Certificate of Incorporation of International Fuel Technology, Inc. and all amendments. (Filed as Exhibit 3.1 to the registrant’s annual report on Form 10-K for the fiscal year ended December 31, 1999 and incorporated herein by reference).
3.2 By-laws of International Fuel Technology, Inc. (Filed as Exhibit 3.2 to the registrant’s annual report on Form 10-K for the fiscal year ended December 31, 1999 and incorporated herein by reference).
10.1 Consultant and Employee Stock Option Plan (Filed as Exhibit 10 to the registrant’s registration statement on Form S-8 filed on February 7, 2000 and incorporated herein by reference). *
10.2 Long Term Incentive Plan (Filed as Exhibit 10.2 to the registrant’s annual report on Form 10-K for the fiscal year ended December 31, 2005 and incorporated herein by reference). *
10.3 Amended and Restated Long Term Incentive Plan (Filed as Exhibit 10.3 to the registrant’s annual report on Form 10-K for the fiscal year ended December 31, 2006 and incorporated herein by reference). *
10.4 Jonathan R. Burst employment agreement (Filed as Exhibit 10.4 to the registrant’s annual report on Form 10-K for the fiscal year ended December 31, 2006 and incorporated herein by reference). *
10.5 Gary S. Hirstein employment agreement (Filed as Exhibit 10.2 to the registrant’s current report on Form 8-K filed on April 7, 2005 and incorporated herein by reference). *
10.6 Stuart D. Beath employment agreement (Filed as Exhibit 10.1 to the registrant’s current report on Form 8-K filed on July 3, 2007 and incorporated herein by reference). *
10.7 Non-Statutory Stock Option Agreement between International Fuel Technology, Inc. and Stuart D. Beath, dated July 2, 2007 (Filed as Exhibit 10.2 to the registrant’s current report on Form 8-K filed on July 3, 2007 and incorporated herein by reference). *
10.8 Separation Agreement and Release by and between Gary S. Hirstein and International Fuel Technology, Inc., dated June 29, 2007 (Filed as Exhibit 10.3 to the registrant’s current report on Form 8-K filed on July 3, 2007 and incorporated herein by reference). *
10.9 Judgement Note between Harry F. Demetriou and International Fuel Technology, Inc. dated November 12, 2007 and Guaranty by Rex Carr (subsequently cancelled on December 10, 2007) (Filed as Exhibit 10.10 to the registrant’s annual report on Form 10-K for the fiscal year ended December 31, 2007, incorporated herein by reference).
10.10 Note and Pledge Agreement between Harry F. Demetriou and International Fuel Technology, Inc., dated December 1, 2007 and Guaranty by Rex Carr (subsequently cancelled on March 31, 2008) (Filed as Exhibit 10.11 to the registrant’s annual report on Form 10-K for the fiscal year ended December 31, 2007, incorporated herein by reference).
10.11 Equity Investment Commitment between Rex Carr and International Fuel Technology, Inc., dated December 11, 2007 (Filed as Exhibit 10.12 to the registrant’s annual report on Form 10-K for the fiscal year ended December 31, 2007, incorporated herein by reference).
14 Code of Business Conduct and Ethics (Filed as Exhibit 14 to the registrant’s annual report on Form 10-K for the fiscal year ended December 31, 2005, incorporated herein by reference).
21 Subsidiaries
23.1 Consent of BDO Seidman, LLP
31.1 Certification of Chief Executive Officer pursuant to Rule 13(a)-14(a) under the Securities Exchange Act of 1934, as amended.
31.2 Certification of Chief Financial Officer pursuant to Rule 13(a)-14(a) under the Securities Exchange Act of 1934, as amended.
32.1 Certification of Chief Executive Officer pursuant to 18 U.S.C. Section 1350, as adopted pursuant to Section 906 of the Sarbanes-Oxley Act of 2002.
32.2 Certification of Chief Financial Officer pursuant to 18 U.S.C. Section 1350, as adopted pursuant to Section 906 of the Sarbanes-Oxley Act of 2002.
| | * Management contract or other compensatory plan, contract or arrangement. |
(b) The exhibits filed with this annual report are listed under Item 15(a)(3), immediately above.
(c) None.
| INTERNATIONAL FUEL TECHNOLOGY, INC. | |
| | |
| Report of Independent Registered Public Accounting Firm | F-2 |
| | |
| Financial Statements | |
| Balance sheets | F-3 |
| Statements of operations | F-4 |
| Statements of stockholders’ equity | F-5 |
| Statements of cash flows | F-6 |
| | |
| Notes to Financial Statements | F-7 |
REPORT OF INDEPENDENT REGISTERED PUBLIC ACCOUNTING FIRM
To the Board of Directors and Stockholders
International Fuel Technology, Inc.
St. Louis, Missouri
We have audited the accompanying balance sheets of International Fuel Technology, Inc. as of December 31, 2008 and 2007, and the related statements of operations, stockholders’ equity, and cash flows for each of the three years in the period ended December 31, 2008. These financial statements are the responsibility of the Company’s management. Our responsibility is to express an opinion on these financial statements based on our audits.
We conducted our audits in accordance with the standards of the Public Company Accounting Oversight Board (United States). Those standards require that we plan and perform the audit to obtain reasonable assurance about whether the financial statements are free of material misstatement. The Company is not required to have, nor were we engaged to perform, an audit of its internal control over financial reporting. Our audits included consideration of internal control over financial reporting as a basis for designing audit procedures that are appropriate in the circumstances, but not for the purpose of expressing an opinion on the effectiveness of the Company’s internal control over financial reporting. Accordingly, we express no such opinion. An audit also includes examining, on a test basis, evidence supporting the amounts and disclosures in the financial statements, assessing the accounting principles used and significant estimates made by management, as well as evaluating the overall financial statement presentation. We believe that our audits provide a reasonable basis for our opinion.
In our opinion, the financial statements referred to above present fairly, in all material respects, the financial position of International Fuel Technology, Inc. as of December 31, 2008 and 2007 and the results of its operations and its cash flows for each of the three years in the period ended December 31, 2008 in conformity with accounting principles generally accepted in the United States of America.
/s/ BDO SEIDMAN, LLP
Chicago, Illinois
March 30, 2009
INTERNATIONAL FUEL TECHNOLOGY, INC.
BALANCE SHEETS
| | | December 31, | | | December 31, | |
| ASSETS | | 2008 | | | 2007 | |
| Current assets | | | | | | |
| Cash and cash equivalents | | $ | 299,127 | | | $ | 364,242 | |
| Accounts receivable | | | 94,318 | | | | 62,463 | |
| Inventory | | | 221,770 | | | | 315,553 | |
| Prepaid expenses and other assets | | | 19,152 | | | | 20,793 | |
| Total current assets | | | 634,367 | | | | 763,051 | |
| | | | | | | | | |
| Property and equipment | | | | | | | | |
| Machinery, equipment and office furniture | | | 63,706 | | | | 63,706 | |
| Accumulated depreciation | | | (52,628 | ) | | | (44,820 | ) |
| Net property and equipment | | | 11,078 | | | | 18,886 | |
| | | | | | | | | |
| Purchased technology, net of accumulated amortization of $2,400,001 at December 31, 2008 and 2007, respectively (Note 1) | | | - | | | | - | |
| Goodwill(Note 1) | | | 2,211,805 | | | | 2,211,805 | |
| | | | | | | | | |
| Total assets | | $ | 2,857,250 | | | $ | 2,993,742 | |
| | | | | | | | | |
| LIABILITIES AND STOCKHOLDERS' EQUITY | | | | | | | | |
| Current liabilities | | | | | | | | |
| Accounts payable | | $ | 252,872 | | | $ | 215,671 | |
| Accrued compensation | | | 5,048 | | | | 29,901 | |
| Accrued interest payable | | | - | | | | 5,137 | |
| Other accrued expenses (Note 3) | | | 350,000 | | | | 350,000 | |
| Total current liabilities | | | 607,920 | | | | 600,709 | |
| | | | | | | | | |
| Long term liabilities | | | | | | | | |
| Note payable to related party (Note 8) | | | - | | | | 500,000 | |
| Total long term liabilities | | | - | | | | 500,000 | |
| | | | | | | | | |
| Total liabilities | | | 607,920 | | | | 1,100,709 | |
| | | | | | | | | |
| Commitments and contingencies (Notes 6 and 7) | | | | | | | | |
| | | | | | | | | |
| Stockholders’ equity (Notes 3 and 4) | | | | | | | | |
| Common stock, $0.01 par value; 150,000,000 shares authorized; 93,507,780 (net of 520,000 shares held in treasury stock) and 88,255,780 shares issued and outstanding at December 31, 2008 and December 31, 2007, respectively | | | 940,278 | | | | 882,558 | |
| Treasury Stock (Note 8) | | | (395,000 | ) | | | - | |
| Discount on common stock(Note 3) | | | (819,923 | ) | | | (819,923 | ) |
| Additional paid-in capital | | | 60,168,846 | | | | 54,411,501 | |
| Accumulated deficit | | | (57,644,871 | ) | | | (52,581,103 | ) |
| Total stockholders’ equity | | | 2,249,330 | | | | 1,893,033 | |
| Total liabilities and stockholders’ equity | | $ | 2,857,250 | | | $ | 2,993,742 | |
See accompanying Summary of Accounting Policies and Notes to Financial Statements.
INTERNATIONAL FUEL TECHNOLOGY, INC.
STATEMENTS OF OPERATIONS
| | | Year Ended December 31, 2008 | | | Year Ended December 31, 2007 | | | Year Ended December 31, 2006 | |
| | | | | | | | | | |
| Revenues | | $ | 149,480 | | | $ | 133,420 | | | $ | 234,584 | |
| | | | | | | | | | | | | |
| Operating expenses: | | | | | | | | | | | | |
| Cost of operations (exclusive of depreciation and amortization) | | | 85,903 | | | | 84,868 | | | | 168,318 | |
Selling, general and administrative expense,
including stock-based compensation expense of $2,896,229, $118,972 and $1,261,955 for 2008, 2007 and 2006, respectively | | | 5,106,406 | | | | 2,622,739 | | | | 5,062,882 | |
| Depreciation and amortization | | | 7,808 | | | | 177,437 | | | | 407,498 | |
Total operating expenses | | | 5,200,117 | | | | 2,885,044 | | | | 5,638,698 | |
| Net loss from operations | | | (5,050,637 | ) | | | (2,751,624 | ) | | | (5,404,114 | ) |
| | | | | | | | | | | | | |
| Interest income, net of (interest expense) | | | (13,131 | ) | | | 28,899 | | | | 161,135 | |
| | | | | | | | | | | | | |
| Net loss | | $ | (5,063,768 | ) | | $ | (2,722,725 | ) | | $ | (5,242,979 | ) |
| | | | | | | | | | | | | |
| Basic and diluted net loss per common share | | $ | (0.06 | ) | | $ | (0.03 | ) | | $ | (0.06 | ) |
| | | | | | | | | | | | | |
| Weighted-average common shares outstanding | | | 91,623,385 | | | | 88,255,780 | | | | 87,896,204 | |
See accompanying Summary of Accounting Polices and Notes to Financial Statements.
INTERNATIONAL FUEL TECHNOLOGY, INC.
STATEMENTS OF STOCKHOLDERS’ EQUITY
| | | Common Stock Shares | | | Common Stock Amount | | | Treasury Stock | | | Discount on Common Stock | | | Additional Paid-In Capital | | | Accumulated Deficit | | | Total | |
| Balance, December 31, 2005 | | | 88,188,593 | | | $ | 881,886 | | | $ | - | | | $ | (819,923 | ) | | $ | 52,762,265 | | | $ | (44,615,399 | ) | | $ | 8,208,829 | |
Options granted for Directors’
services (Notes 3 and 4) | | | - | | | | - | | | | - | | | | - | | | | 21,000 | | | | - | | | | 21,000 | |
Proceeds from stock options
exercised (Notes 3 and 4) | | | 67,187 | | | | 672 | | | | - | | | | - | | | | 31,629 | | | | - | | | | 32,301 | |
Expense relating to stock
option grants (Note 4) | | | - | | | | - | | | | - | | | | - | | | | 1,240,955 | | | | - | | | | 1,240,955 | |
| Other (Note 3) | | | - | | | | - | | | | - | | | | - | | | | 236,680 | | | | - | | | | 236,680 | |
| Net loss | | | - | | | | - | | | | - | | | | - | | | | - | | | | (5,242,979 | ) | | | (5,242,979 | ) |
| Balance, December 31, 2006 | | | 88,255,780 | | | | 882,558 | | | | - | | | | (819,923 | ) | | | 54,292,529 | | | | (49,858,378 | ) | | | 4,496,786 | |
Options granted for Directors’
services (Notes 3 and 4) | | | - | | | | - | | | | - | | | | - | | | | 6,500 | | | | - | | | | 6,500 | |
Expense relating to stock
option modifications (Note 4) | | | - | | | | - | | | | - | | | | - | | | | 206,764 | | | | - | | | | 206,764 | |
Net benefit relating to stock
option grants (Note 4) | | | - | | | | - | | | | - | | | | - | | | | (94,292 | ) | | | - | | | | (94,292 | ) |
| Net loss | | | - | | | | - | | | | - | | | | - | | | | - | | | | (2,722,725 | ) | | | (2,722,725 | ) |
| Balance, December 31, 2007 | | | 88,255,780 | | | | 882,558 | | | | - | | | | (819,923 | ) | | | 54,411,501 | | | | (52,581,103 | ) | | | 1,893,033 | |
| Issuances of stock | | | 4,680,000 | | | | 46,800 | | | | - | | | | - | | | | 2,203,200 | | | | - | | | | 2,250,000 | |
| Issuance of stock for services | | | 52,000 | | | | 520 | | | | - | | | | - | | | | 7,480 | | | | - | | | | 8,000 | |
Extinguishment of note payable
(Note 8) | | | 1,040,000 | | | | 10,400 | | | | - | | | | - | | | | 513,436 | | | | - | | | | 523,836 | |
Shares repurchased from Director
(Note 8) | | | - | | | | - | | | | (395,000 | ) | | | - | | | | 145,000 | | | | - | | | | (250,000 | ) |
Options granted for Directors’
services (Notes 3 and 4) | | | - | | | | - | | | | - | | | | - | | | | 8,516 | | | | - | | | | 8,516 | |
Expense relating to stock
option grants (Note 4) | | | - | | | | - | | | | - | | | | - | | | | 2,879,713 | | | | - | | | | 2,879,713 | |
| Net loss | | | - | | | | - | | | | - | | | | - | | | | - | | | | (5,063,768 | ) | | | (5,063,768 | ) |
| Balance, December 31, 2008 | | | 94,027,780 | | | $ | 940,278 | | | $ | (395,000 | ) | | $ | (819,923 | ) | | $ | 60,168,846 | | | $ | (57,644,871 | ) | | $ | 2,249,330 | |
See accompanying Summary of Accounting Policies and Notes to Financial Statements.
INTERNATIONAL FUEL TECHNOLOGY, INC.
STATEMENTS OF CASH FLOWS
| | | Year Ended December 31, 2008 | | | Year Ended December 31, 2007 | | | Year Ended December 31, 2006 | |
| Cash flows from operating activities | | | | | | | | | |
| Net loss | | $ | (5,063,768 | ) | | $ | (2,722,725 | ) | | $ | (5,242,979 | ) |
| | | | | | | | | | | | | |
Adjustments to reconcile net loss to net cash used in operating activities: | | | | | | | | | | | | |
| Depreciation and amortization | | | 7,808 | | | | 177,437 | | | | 407,499 | |
| Non-cash expense related to prior merger (Note 3) | | | - | | | | - | | | | 500,000 | |
| Bad debt provision | | | - | | | | 417 | | | | 6,053 | |
| Non-cash stock-based compensation | | | 2,896,229 | | | | 118,972 | | | | 1,261,955 | |
| Change in assets and liabilities: | | | | | | | | | | | | |
| Accounts receivable | | | (31,855 | ) | | | (43,653 | ) | | | (19,829 | ) |
| Inventory | | | 93,783 | | | | 115,810 | | | | (308,639 | ) |
| Prepaid expense and other assets | | | 1,641 | | | | 49,099 | | | | 4,388 | |
| Accounts payable | | | 37,201 | | | | 20,532 | | | | (291,615 | ) |
| Accrued interest payable | | | 18,699 | | | | 5,137 | | | | - | |
| Accrued compensation | | | (24,853 | ) | | | (17,727 | ) | | | (20,846 | ) |
| Net cash used in operating activities | | | (2,065,115 | ) | | | (2,296,701 | ) | | | (3,704,013 | ) |
| | | | | | | | | | | | | |
| | | | | | | | | | | | | |
Cash flows from investing activities Redemption of short-term investment | | | - | | | | 1,506,919 | | | | 973,581 | |
| Acquisition of machinery and office equipment | | | - | | | | (817 | ) | | | (29,040 | ) |
| Net cash provided by investing activities | | | - | | | | 1,506,102 | | | | 944,541 | |
| | | | | | | | | | | | | |
| Cash flows from financing activities | | | | | | | | | | | | |
| Proceeds from issuance of related party note payable (Note 8) | | | - | | | | 500,000 | | | | - | |
| Proceeds from issuance of common stock | | | 2,250,000 | | | | - | | | | - | |
| Purchase of treasury stock (Note 8) | | | (250,000 | ) | | | - | | | | - | |
| Proceeds from common stock options exercised | | | - | | | | - | | | | 32,301 | |
| Net cash provided by financing activities | | | 2,000,000 | | | | 500,000 | | | | 32,301 | |
| | | | | | | | | | | | | |
| Net decrease in cash and cash equivalents | | | (65,115 | ) | | | (290,599 | ) | | | (2,727,171 | ) |
| Cash and cash equivalents, beginning | | | 364,242 | | | | 654,841 | | | | 3,382,012 | |
| Cash and cash equivalents, ending | | $ | 299,127 | | | $ | 364,242 | | | $ | 654,841 | |
| | | | | | | | | | | | | |
| Schedule of non-cash investing and financing activities | | | | | | | | | | | | |
| | | | | | | | | | | | | |
| Extinguishment of note payable to related party (including accrued interest) by issuance of common stock | | $ | 523,836 | | | $ | - | | | $ | - | |
| | | | | | | | | | | | | |
See accompanying Summary of Accounting Polices and Notes to Financial Statements.
INTERNATIONAL FUEL TECHNOLOGY, INC.
NOTES TO FINANCIAL STATEMENTS
Note 1. Nature of Business and Significant Accounting Policies
Nature of Business
International Fuel Technology, Inc. ("IFT") is a company that was incorporated under the laws of the State of Nevada on April 9, 1996. We have developed a family of fuel additive product formulations. These unique fuel blends have been created to improve fuel economy, enhance lubricity (reducing engine wear and tear) and lower harmful engine emissions, while decreasing reliance on petroleum-based fuels through the use of more efficient, alternative and renewable fuels. We began transitioning from a development stage technology company to a commercial entity during 2002 and have been increasing our product marketing and sales efforts since. We are now focused on continuing to develop the body of evidence of the efficacy of our products applicable to a wide range of markets and industries within these markets through additional industry specific laboratory testing and customer field trials. In addition, we are continuing to strengthen our distributor and customer contact base. Marketing and sales efforts, in conjunction with the additional industry specific testing, will complete our transition to a commercial enterprise.
On January 20, 2009, our Board of Directors declared a restricted stock dividend to shareholders of record at the close of business on February 4, 2009 (the “Record Date”) in the amount of 1 restricted share for every 25 common shares owned. The distribution date was February 10, 2009. The restricted stock dividend is subject to resale conditions pursuant to Rule 144 of the Securities and Exchange Act. This stock dividend has been retroactively reflected in our financial statements and notes to the financial statements.
During 2008, our net revenues were split in the following manner: 46% to U.S. end-user customers and 54% to international distributors. 88% of our net revenues for 2008 was concentrated between two customers.
During 2007, our net revenues were split in the following manner: 54% to U.S. end-user customers and 46% to international distributors. 64% of our net revenues for 2007 was concentrated between five customers.
During 2006, 78% of our net revenues came from product sales to Fuel Technologies Ltd. (“FTL”), an international distributor, and its sub-distributors, primarily from the sale of DiesoLIFT™ 10. A current executive of FTL is a former Director of IFT.
Our product line revenues for 2008, 2007 and 2006 have not been significant. For 2008, 2007 and 2006, DiesoLIFT™ 10 has represented 82%, 98% and 92% of our net revenues, respectively.
Net revenues related to shipments into various foreign countries were $81,376, $61,620 and $201,743 during 2008, 2007 and 2006, respectively. The following table breaks out net revenues by foreign country:
| Country | | 2008 | | | 2007 | | | 2006 | |
| | | | | | | | | | |
| Australia | | $ | - | | | $ | - | | | $ | 69,615 | |
| Belgium | | | - | | | | 8,925 | | | | - | |
| France | | | 81,376 | | | | - | | | | - | |
| India | | | - | | | | 18,360 | | | | - | |
| South Africa | | | - | | | | - | | | | 44,452 | |
| Switzerland | | | - | | | | 5,388 | | | | - | |
| United Kingdom | | | - | | | | 25,500 | | | | 69,615 | |
| Other | | | - | | | | 3,447 | | | | 18,061 | |
| | | $ | 81,376 | | | $ | 61,620 | | | $ | 201,743 | |
We currently utilize Tomah Products, Inc. and Multisol France as our contracted product manufacturers. Both entities independently purchase required raw materials to manufacture our product.
Summaries of our significant accounting policies follow:
Use of Estimates in the Preparation of Financial Statements
The preparation of financial statements in conformity with U.S. generally accepted accounting principles (“GAAP”) requires management to make estimates and assumptions that affect the reported amounts of assets and liabilities and disclosure of contingent assets and liabilities at the date of the financial statements and the reported amounts of revenues and expenses during the reporting period. Actual results could differ from those estimates.
Revenue Recognition
We recognize revenue from the sale of our products when the products are shipped, and title and risk of loss has passed to the buyer. The majority of our revenues is from sales to product distributors. Product distributors do not have the option to return product that is not immediately sold to an end-user. Therefore, our revenue recognition is not conditional on whether a distributor is able to sell product to an ultimate product end-user. Our sales policies for end-users are consistent with product distributor sales policies.
Cash and Cash Equivalents
We maintain cash in a bank account, which, at times, exceeds federally insured limits. We have experienced no losses relating to these excess amounts of cash in a bank.
We utilize a cash management program that assesses daily cash requirements. Excess funds are invested in overnight repurchase agreements backed by U.S. Treasury securities. Repurchase agreements are not deposits, are not insured or guaranteed by the U.S. government, the Federal Deposit Insurance Corporation or any other government agency, and involve investment risk including possible loss of principal.
Short-term Investments
We purchased a debt security in November 2005 that matured in November 2006. Upon maturity, we re-invested a portion of our original investment in similar debt securities. These debt securities had interest rates of approximately 3.5%, fully matured in February 2007 and were not re-invested in such securities. We treated these debt securities as a held-to-maturity instruments. The market value of the short-term
investments approximated their costs at December 31, 2006, and related interest income is recorded in the statements of operations.
Accounts Receivable
An allowance for doubtful accounts is maintained at a level we believe sufficient to cover potential losses based on historical trends and known current factors impacting our customers. We have determined that an allowance for doubtful accounts was not necessary as of December 31, 2008 and 2007. We did, however, write-off $0, $417 and $6,053 of accounts receivable in 2008, 2007 and 2006, respectively, which we expensed in those respective years.
Inventory
Inventory, which consists of finished product, is valued at the lower of cost or market, based on the first-in, first-out (“FIFO”) method, or market, and represents purchased cost from vendors.
Machinery, Equipment and Office Furniture
Machinery, equipment and office furniture is stated at cost. Depreciation is calculated using the straight-line method over an asset’s appropriate estimated useful life, generally 3 to 5 years.
Purchased Technology
We allocated $2,400,001 of purchase price of a 2001 acquisition to acquired technology, which was being amortized over a 6-year period, or $400,000 per year. Amortization expense for 2007 was $166,667 until the asset became fully amortized during the second quarter of that year. Amortization expense for 2006 was $400,000.
Long-lived Assets
We review the carrying values of our long-lived and intangible assets for possible impairment whenever events or changes in circumstances (such as changes in operations or estimated future cash flows) indicate that the carrying amount of the assets may not be recoverable. As of December 31, 2008, there has been no impairment of long-lived assets.
Goodwill
At a minimum, goodwill impairment is tested annually in the fourth quarter of each year. Goodwill impairment would also be reviewed if any events occur during the year that might indicate impairment. We calculate the fair value of the Company on a per share basis using the market capitalization value of our common stock and compare that to the carrying value of the Company. As of December 31, 2008, no provision for impairment of goodwill has been recorded. For tax purposes, goodwill is deductible and is being amortized over 15 years.
Deferred Income Taxes
Deferred income taxes are provided on a liability method whereby deferred income tax assets are recognized for deductible temporary differences, operating losses and tax credit carry-forwards, and deferred income tax liabilities are recognized for taxable temporary differences. Temporary differences are the differences between the reported amounts of assets and liabilities and their tax bases. Deferred income tax assets are reduced by a valuation allowance when, in the opinion of management, it is more
likely than not that some or all of the deferred income tax assets will not be realized. Deferred income tax assets and liabilities are adjusted for the effects of changes in tax laws and rates on the date of enactment.
Research and Development
Research and development costs are expensed as incurred. Expense for services paid to external vendors for 2008, 2007 and 2006 was $131,974, $138,247, and $530,110, respectively.
Advertising Expenses
Advertising costs are expensed as incurred and amounted to $44,875, $113,316 and $104,979 in 2008, 2007 and 2006, respectively.
Basic and Diluted Net Earnings (Loss) Per Common Share
Basic earnings (loss) per share are based upon the weighted-average number of common shares outstanding for the period. Diluted earnings (loss) per share are based upon the weighted-average number of common and potentially dilutive common shares outstanding for the period. Pursuant to the Financial Accounting Standards Board’s (“FASB”) Statement of Financial Accounting Standards (“SFAS”) No. 128, Earnings per Share (“SFAS 128”), no adjustment is made for diluted earnings per share purposes since we are reporting a net loss, and common stock equivalents would have an anti-dilutive effect. For the fiscal years ended December 31, 2008, 2007, and 2006, 28,140,556, 17,376,556 and 18,582,710 shares, respectively, of common stock equivalents were excluded from the computation of diluted net loss per share since their effect would be anti-dilutive.
As more fully described in Note 2, IFT issued a stock dividend during the first quarter of 2009. This stock dividend has been retroactively reflected in our financial statements and notes to the financial statements.
Fair Value of Financial Instruments
The carrying amounts of accounts receivable and accounts payable approximate fair value because of their short maturity.
Accounting for Stock-based Compensation
Effective January 1, 2006, we adopted SFAS No. 123 (revised), Share-Based Payment, an amendment of FASB Statements Nos. 123 and 95 (“SFAS 123R”).
SFAS 123R requires companies to estimate the fair value of share-based awards on the grant date using an option-pricing model. We use the Black-Scholes option-pricing model as the method of valuation for our stock options. The model requires the use of various assumptions. The key assumptions are summarized as follows:
Expected volatility – we estimate the volatility of our common stock at the date of grant based on the historical volatility of our common stock for the expected term of our stock options.
Dividend yield – we estimate the dividend yield assumption based on our historical and projected dividend payouts.
Risk-free interest rate – we base risk-free interest rate on the observed interest rates appropriate for the expected term of our stock options.
Expected option life – we base the expected option life on historical experience.
Forfeiture rate assumption - we have assumed 0% for the forfeiture rate assumption based on historical experience.
SFAS 123R also requires the benefits of tax deductions in excess of recognized compensation cost to be reported as cash flow from financing activities rather than as cash flow from operations as required under Emerging Issues Task Force ("EITF") issue No. 0015, Classification in the Statement of Cash Flow of the Income Tax Benefit Received by a Company upon Exercise of a Nonqualified Employee Stock Option. There has been no net income tax impact related to stock compensation expense or exercising of stock options for us primarily due to our maintaining a full valuation allowance against our net deferred income tax assets.
The value of options and warrants issued to non-employees upon date of issuance are expensed over the related service periods. For non-employee options that are not subject to a performance criteria, we re-compute the value of the unvested options each quarter-end and adjust the related compensation expense for the new value. That new value is based on various assumptions (similar to those listed above) using end-of-quarter information.
New Accounting Pronouncements
In September 2006, the FASB issued SFAS No. 157, Fair Value Measurements (“SFAS 157”), which provides guidance on how to measure assets and liabilities at fair value. SFAS 157 applies whenever another GAAP standard requires (or permits) assets or liabilities to be measured at fair value but does not expand the use of fair value to any new circumstances. This standard also requires additional disclosures in both annual and quarterly reports. SFAS 157 is effective for financial statements issued for fiscal years beginning after November 15, 2007. In February 2008, the FASB agreed to defer the effective date of SFAS 157 for one year for non-financial assets and non-financial liabilities that are not recognized or disclosed at fair value in the financial statements on a recurring basis. There is no deferral for financial assets and financial liabilities, nor for the rare non-financial assets and non-financial liabilities that are re-measured at fair value at least annually. We adopted the provisions of SFAS 157 effective January 1, 2008 with no impact to our financial position and results of operations.
In February 2007, the FASB issued SFAS No. 159, The Fair Value Option for Financial Assets and Financial Liabilities ("SFAS 159"). SFAS 159 permits entities to choose to measure certain financial instruments and other eligible items at fair value when the items are not otherwise currently required to be measured at fair value, and if so chosen, specifies related accounting and disclosure requirements. SFAS 159 is effective as of the beginning of the first fiscal year that begins after November 15, 2007, with earlier adoption permitted if all of the requirements of SFAS 157 are adopted. SFAS 159 was effective for IFT as of January 1, 2008; however, we did not elect the fair value option for any eligible items.
In December 2007, the FASB issued SFAS No. 141(revised 2007), Business Combinations, Applying the Acquisition Method (“SFAS 141R”), a revision of SFAS 141, Business Combinations. SFAS 141R establishes requirements for the recognition and measurement of acquired assets, liabilities, goodwill, and non-controlling interests. SFAS 141R also provides disclosure requirements related to business combinations. SFAS 141R is effective for fiscal years beginning after December 15, 2008. SFAS 141R will be applied prospectively to business combinations with an acquisition date on or after the effective date. We do not expect the adoption of SFAS 141R will have a material impact on our financial statements.
In December 2007, the FASB issued SFAS No. 160, Non-Controlling Interests in Consolidated Financial Statements - an amendment of ARB No. 51 (“SFAS 160”). SFAS 160 establishes new standards for the accounting for and reporting of non-controlling interests (formerly minority interests) and for the loss of control of partially owned and consolidated subsidiaries. SFAS 160 does not change the criteria for consolidating a partially owned entity. SFAS 160 is effective for fiscal years beginning after December 15, 2008. The provisions of SFAS 160 will be applied prospectively upon adoption except for the presentation and disclosure requirements, which will be applied retrospectively. We do not expect the adoption of SFAS 160 will have a material impact on our financial statements.
In May 2008, the FASB issued SFAS No. 162, The Hierarchy of Generally Accepted Accounting Principles (“SFAS 162”). SFAS 162 identifies the sources of accounting principles and the framework for selecting the principles used in the preparation of financial statements of non-governmental entities that are presented in conformity with GAAP in the United States (the “GAAP hierarchy”). SFAS 162 will be effective 60 days following the SEC’s approval of the Public Company Accounting Oversight Board’s amendments to AU Section 411, “The Meaning of Present Fairly in Conformity With Generally Accepted Accounting Principles.” The FASB has stated that it does not expect SFAS 162 will result in a change in current practice.
During June 2008, the FASB issued EITF Issue No. 07-05, Determining Whether an Instrument (or Embedded Feature) Is Indexed to an Entity’s Own Stock (“EITF 07-05”), which is effective for fiscal years beginning after December 15, 2008. EITF 07-05 addresses the determination of whether an instrument (or an embedded feature) is indexed to an entity's own stock, which is the first part of the scope exception in paragraph 11(a) of FASB SFAS No. 133, Accounting for Derivative Instruments and Hedging Activities (“SFAS 133”). If an instrument (or an embedded feature) that has the characteristics of a derivative instrument under paragraphs 6–9 of SFAS 133 is indexed to an entity's own stock, it is still necessary to evaluate whether it is classified in stockholders' equity (or would be classified in stockholders' equity if it were a freestanding instrument). Other applicable authoritative accounting literature, including Issues EITF 00-19, Accounting for Derivative Financial Instruments Indexed to, and Potentially Settled in, a Company Own Stock, and EITF 05-2, The Meaning of “Conventional Debt Instrument” in Issue No. 00-19, provides guidance for determining whether an instrument (or an embedded feature) is classified in stockholders' equity (or would be classified in stockholders' equity if it were a freestanding instrument). EITF 07-05 does not address that second part of the scope exception in paragraph 11(a) of SFAS 133. We are currently evaluating the impact the adoption of EITF 07-05 will have on our financial statements.
During June 2008, the FASB issued FASB Staff Position (“FSP”) FSP EITF 03-6-1, Determining Whether Instruments Granted in Share-based Payment Transactions are Participating Securities, which effectively considers any outstanding unvested share-based payment awards that contain dividend provisions during the requisite service period and that are not required to be forfeited by the employee, to participate in the undistributed earnings of a company. Application of this FSP, specifically any changes to forfeiture estimates that result from the application should not change prior or current earnings-per-share computation. This FSP requires retroactive adoption and is effective for financial statements issued for fiscal years beginning after December 15, 2008 and interim periods within those fiscal years. Early adoption is not permitted. We are currently evaluating the impact the adoption of FSP EITF 03-6-1 will have on our financial statements.
In March 2007, the FASB ratified EITF Issue No. 06-11, Accounting for Income Tax Benefits of Dividends on Share-Based Payment Awards (“EITF 06-11), which requires companies to recognize the income tax benefit realized from dividends or dividend equivalents that are charged to retained earnings and paid to employees for non-vested equity-classified employee share-based awards as an increase to additional paid-in capital instead of a credit to income tax expense. The amount recognized in additional paid-in capital will be available to absorb potential future tax deficiencies on share–based payment awards. EITF 06-11 was effective for fiscal years beginning after December 15, 2007 and therefore is effective for IFT in fiscal year 2008. The adoption of EITF 06-11 did not have a material effect on our financial statements.
Note 2. Stock Dividend
On January 20, 2009, our Board of Directors declared a restricted stock dividend to shareholders of record at the close of business on February 4, 2009 (the “Record Date”) in the amount of 1 restricted share for every 25 common shares owned. The distribution date was February 10, 2009. The restricted stock dividend is subject to resale conditions pursuant to Rule 144 of the Securities and Exchange Act. This stock dividend has been retroactively reflected in our financial statements and notes to the financial statements.
Note 3. Stockholders' Equity
Effective October 27, 1999, we merged with Blencathia Acquisition Corporation (“Blencathia”). Blencathia was a public shell company with immaterial assets and liabilities and 312,000 shares outstanding at the time of the merger, which it redeemed and cancelled upon the merger. In exchange, we issued 312,000 of our common shares to the prior Blencathia owner with the contractual understanding that such shares were to be sold by that owner to achieve gross cash proceeds of $500,000. Any excess proceeds were to be returned to us and any deficiency was to be made up by us issuing additional shares or paying the difference in cash. As we believed that we controlled the ultimate timing of the sale of these 312,000 shares by the prior Blencathia owner, we did not consider these shares as issued or outstanding for purposes of computing earnings per share.
In 2006, we learned that the prior Blencathia owner had, in fact, sold the 312,000 shares for aggregate proceeds of approximately $150,000, without our consent. Accordingly, in the fourth quarter of 2006, we recorded $500,000 of general expenses (representing the cost of the 1999 merger) and the deemed issuance of approximately $150,000 of common stock (this amount is a component of the Other line item for 2006 activity in our Statements of Stockholders’ Equity). The remaining $350,000 obligation is reflected as a current accrued expense. We are in negotiations with the prior Blencathia owner to resolve this obligation and may ultimately settle the obligation with either cash or equity securities with a lower market value. Beginning in 2006, the 312,000 shares have been reflected as outstanding for earnings per share computations.
During 2008, we sold a total of 4,680,000 shares of common stock. Of this amount, 520,000 shares were sold to two Directors, representing proceeds of $250,000, and 4,160,000 shares were sold to accredited investors, representing proceeds of $2,000,000.
Late in the first quarter of 2008, we began negotiations with third parties that ultimately culminated in a successful equity raise during the second quarter of 2008. Specifically, IFT sold 4,000,000 (unadjusted for the subsequent stock dividend) shares of common stock for $2,000,000, or $0.50 per share. This transaction was agreed to on April 22, 2008 at which time the closing price of IFT’s common stock was $0.42 per share. Pursuant to an agreement, the entire $2,000,000 was received by June 9, 2008. In accordance with the accounting standards, since the agreement entitled the third party to purchase these shares of common stock over a period of time, the agreement was valued based on the fair value of the purchase option resulting in $999,000 of stock-based compensation expense. See Note 9 for stock issued in early 2009.
We did not sell any shares of common stock during 2007 or 2006. During 2005, we sold a total of 4,997,592 shares of common stock. Of this amount, 371,693 shares were sold to a Director, representing proceeds of $500,000, and 4,625,899 shares were sold to accredited investors, representing proceeds of $6,499,979. The sale of stock to accredited investors also included 1,156,473 common stock warrants, which along with the sale of common stock, was recorded to additional paid-in capital. The sales price of all stock sale transactions was based on the trading price on the date of commitment for purchase. Of the issued warrants, all were exercisable immediately and for up to 7 years. The following table indicates the exercise prices of the warrants:
| # of Warrants | | | Exercise Price | |
| | | | | |
| | 101,010 | | | $ | 0.99 | |
| | 11,927 | | | $ | 1.05 | |
| | 161,571 | | | $ | 1.35 | |
| | 558,958 | | | $ | 1.39 | |
| | 13,967 | | | $ | 1.43 | |
| | 39,000 | | | $ | 1.49 | |
| | 40,626 | | | $ | 1.54 | |
| | 229,414 | | | $ | 1.63 | |
| | 1,156,473 | | | | | |
During 2008, we also issued 52,000 common shares, valued at the settlement date’s quoted market price of $8,000 for services provided by a consulting entity. During 2008, we also issued 1,040,000 common shares to a Director in settlement of a $523,836 note payable plus unpaid accrued interest, which resulted in a deemed contribution from that Director of $145,000 representing the excess of the aggregate liabilities over the fair value of the shares. During 2008, we repurchased 520,000 of these shares for $250,000. During the first quarter of 2009, we repurchased the remaining 520,000 shares for $250,000.
During 2006, $86,680 related to Board services provided from 2001 through 2004 that had not yet been paid (originally recorded to accrued compensation) was reclassified to additional paid-in when the obligation became only payable in equity securities. This amount is a component of Other for 2006 activity in our Statements of Stockholders’ Equity.
Discount on common stock primarily represents the fair value of shares issued in 1997 and 1998 in exchange for membership interests in, and intangible assets of, entities under common control. Neither the entity nor the intangible assets had any previous carrying value. As such transactions are required to be recorded at historical carryover basis, we did not record any related assets or liabilities upon these transactions but did need to reflect the issuance of the shares in our Statements of Stockholders’ Equity.
Equity Commitment
Effective December 11, 2007, we received an investment commitment from Rex Carr, a Director of IFT and a holder of over five (5%) of our common stock. Pursuant to the terms of the commitment, Mr. Carr has agreed to invest up to an aggregate of $1,000,000 in IFT, at such time or times as we may request, in the form of a purchase or purchases of restricted common stock of IFT. IFT may elect to draw from the commitment at one time or from time to time; provided, however, that the aggregate of such draws may not exceed $1,000,000. If and when we elect to utilize available commitment funds, we will issue to Mr. Carr that number of shares of restricted common stock of IFT equal to the value of the investment then provided to IFT. The number of shares to be issued will be calculated based on the closing price of our common stock as quoted on The OTC Bulletin Board on the date of the sale. There is no stipulation regarding the duration of this commitment. During 2008, we received $200,000 (a portion of the $250,000 of 2008 equity issuances to Directors described above) from Mr. Carr for the sale of common stock reducing the total available under this commitment to $800,000 as of December 31, 2008.
Long-Term Incentive Plan
On October 23, 2001, the Board of Directors adopted our Long Term Incentive Plan (“LTIP”). The Board of Directors is responsible for the administration of this LTIP, and is the approval authority for all option grant awards under this plan. Subject to the express provisions of the LTIP, the Board of Directors shall have full authority and sole and absolute discretion to interpret and amend this LTIP, to prescribe, amend and rescind rules and regulations relating to it, and to make all other determinations which it believes to be necessary or advisable in administering this LTIP.
On October 22, 2006, our Board of Directors adopted the Amended and Restated LTIP. This plan expires on October 21, 2016.
The maximum number of shares of common stock as to which awards may be granted under this plan, subject to subsequent amendments, is 17,500,000 shares. The common stock issued upon exercise of options or on grant of stock awards may be shares previously authorized but not yet issued or shares which have been issued and reacquired by IFT as treasury stock. The Board of Directors may increase the maximum number of shares of common stock as to which awards may be granted at such time as it deems advisable. Awards may be granted to employees or consultants of IFT in their individual capacity only. As of December 31, 2008, we have only issued common stock options to employees, Directors and non-employees under our LTIP and the Amended and Restated LTIP.
The following tables summarize information about stock options (issued to employees and Directors) during the three years ended December 31, 2008:
| | | Shares | | | Exercise price per share | | | Weighted- average exercise price | |
| Outstanding at December 31, 2005 | | | 12,064,623 | | | $ | 0.10-2.14 | | | $ | 0.97 | |
| Granted | | | 161,200 | | | $ | 0.49-1.20 | | | $ | 0.97 | |
| Outstanding at December 31, 2006 | | | 12,225,823 | | | $ | 0.10-2.14 | | | $ | 0.97 | |
| Granted | | | 617,760 | | | $ | 0.10-1.84 | | | $ | 0.63 | |
| Expired | | | (10,400 | ) | | $ | 0.24 | | | $ | 0.24 | |
| Forfeited | | | (580,701 | ) | | $ | 0.49-2.14 | | | $ | 1.84 | |
| Outstanding at December 31, 2007 | | | 12,252,482 | | | $ | 0.10-2.14 | | | $ | 1.03 | |
| Granted | | | 390,000 | | | $ | 0.21-0.96 | | | $ | 0.55 | |
| Forfeited | | | (104,000 | ) | | $ | 0.72 | | | $ | 0.72 | |
| Outstanding at December 31, 2008 | | | 12,538,482 | | | $ | 0.10-2.14 | | | $ | 1.04 | |
| | | | | | | | | | | | | |
| Options excercisable at December 31, 2008 | | | 11,888,482 | | | $ | 0.10-2.14 | | | $ | 1.02 | |
| Options excercisable at December 31, 2007 | | | 11,805,282 | | | $ | 0.10-2.14 | | | $ | 1.02 | |
| Options excercisable at December 31, 2006 | | | 11,163,222 | | | $ | 0.10-2.14 | | | $ | 1.08 | |
The following table summarizes information about employee stock outstanding at December 31, 2008:
| | | | Options outstanding | | | Options exercisable | |
| Exercise price range | | | Number outstanding at December 31, 2008 | | | Weighted-average remaining contractual life (years) | | | Weighted-average exercise price | | | Number exercisable at December 31, 2008 | | | Weighted-average exercise price | |
$0.10 - $0.50 | | | | 6,166,160 | | | | 1 | | | $ | 0.38 | | | | 5,984,160 | | | $ | 0.38 | |
| | | | | | | | | | | | | | | | | | | | | | |
| $0.51 - $1.00 | | | | 3,334,760 | | | | 1 | | | $ | 0.86 | | | | 2,866,760 | | | $ | 0.86 | |
| | | | | | | | | | | | | | | | | | | | | | |
$1.01 - $1.50 | | | | 109,200 | | | | 2 | | | $ | 1.20 | | | | 109,200 | | | $ | 1.20 | |
| | | | | | | | | | | | | | | | | | | | | | |
$1.51 - $2.00 | | | | 1,974,960 | | | | 1 | | | $ | 1.90 | | | | 1,974,960 | | | $ | 1.90 | |
| | | | | | | | | | | | | | | | | | | | | | |
| $2.01 - $2.14 | | | | 953,402 | | | | 1 | | | $ | 2.14 | | | | 953,402 | | | $ | 2.14 | |
| | | | | | | | | | | | | | | | | | | | | | |
| | | | | 12,538,482 | | | | 1 | | | $ | 1.04 | | | | 11,888,482 | | | $ | 1.02 | |
The following table summarizes information about stock options issued to non-employees during the three years ended December 31, 2008:
| | | Shares | | | Exercise
price per
share | | | Weighted-average
exercise
price | |
| Outstanding at December 31, 2005 | | | 12,235,599 | | | $ | 0.24-2.26 | | | $ | 1.08 | |
| | | | | | | | | | | | | |
| Granted | | | 416,000 | | | $ | 1.80 | | | $ | 1.80 | |
| Exercised | | | (67,186 | ) | | $ | 0.48 | | | $ | 0.48 | |
| Expired | | | (1,144,000 | ) | | $ | 0.48-1.58 | | | $ | 1.49 | |
| Forfeited | | | (6,240,000 | ) | | $ | 0.34-1.92 | | | $ | 0.88 | |
| Outstanding at December 31, 2006 | | | 5,200,413 | | | $ | 0.24-2.26 | | | $ | 1.63 | |
| | | | | | | | | | | | | |
| Expired | | | (1,232,814 | ) | | $ | 0.24-0.72 | | | $ | 0.48 | |
| Outstanding at December 31, 2007 | | | 3,967,599 | | | $ | 0.48-2.26 | | | $ | 1.56 | |
| | | | | | | | | | | | | |
| Granted | | | 11,518,000 | | | $ | 0.29-0.96 | | | $ | 0.54 | |
| Expired | | | (1,040,000 | ) | | $ | 1.92-2.26 | | | $ | 2.09 | |
| Outstanding at December 31, 2008 | | | 14,445,599 | | | $ | 0.29-2.26 | | | $ | 0.71 | |
| | | | | | | | | | | | | |
| Options excercisable at December 31, 2008 | | | 11,216,399 | | | $ | 0.48-2.26 | | | $ | 0.74 | |
| Options excercisable at December 31, 2007 | | | 3,546,399 | | | $ | 0.48-2.26 | | | $ | 1.53 | |
| Options excercisable at December 31, 2006 | | | 4,779,213 | | | $ | 0.24-2.26 | | | $ | 1.27 | |
In addition to the non-employee option activity presented above, IFT’s Board authorized 11,350,000 options to non-employees during 2008, which have not yet been granted. It is possible that a smaller amount than this total will ultimately be granted.
Note 4. Stock-based Compensation
Stock-based compensation expense recorded in 2008, 2007 and 2006 is as follows:
| | | Year Ended December 31, 2008 | | | Year Ended December 31, 2007 | | | Year Ended December 31, 2006 | |
| Awards to employees/Directors | | $ | 112,916 | | | $ | (79,902 | ) | | $ | 1,094,154 | |
| Awards to non-employees | | | 2,783,313 | | | | (7,890 | ) | | | 167,801 | |
| Stock option modifications | | | - | | | | 206,764 | | | | - | |
| | | ___________ | | | ___________ | | | ___________ | |
| Total stock-based compensation expense | | $ | 2,896,229 | | | $ | 118,972 | | | $ | 1,261,955 | |
Employee and Director awards
In 2008, we granted 390,000 stock options to employees and Directors. 52,000 of these options vested immediately, with the remaining options vesting on December 31, 2009 and expiring in 2012 and 2013. During 2008, 104,000 non-vested employee options were forfeited resulting in the reversal of $17,733 of previously recorded stock-based compensation expense, including $6,333 from 2007.
In 2007, we granted 617,760 stock options to employees and Directors. 104,000 of these options were subsequently forfeited due to the departure of an employee before the options vested. 97,760 of these options vested immediately, with the remaining options having a vesting period ranging between 24 and 30 months and expire in 2010 and 2012. During 2007, 580,701 non-vested employee options were forfeited resulting in the reversal of $381,012 of previously recorded stock-based compensation expense, including $296,410 from prior years.
In 2006, we granted 161,200 stock options to employees and Directors. 52,000 of these options vested immediately and the remaining options have a vesting period ranging between 17 and 24 months, and have exercise prices ranging from $0.49 to $1.20 and expire in 2011.
The following table provides the primary assumptions used to value employee and Director stock-based compensation for the years indicated:
| | | Year Ended December 31, 2008 | | | Year Ended December 31, 2007 | | | Year Ended December 31, 2006 | |
| | | | | | | | | | |
| Weighted-average fair value of options granted | | $ | 0.38 | | | $ | 0.33 | | | $ | 1.38 | |
| Weighted-average assumptions: | | | | | | | | | | | | |
| Risk-free interest rate | | | 2.72 | % | | | 4.79 | % | | | 4.62 | % |
| Dividend yield | | | - | | | | - | | | | - | |
| Expected volatility | | | 1.2 | | | | 1.1 | | | | 1.2 | |
| Expected option life (years) | | | 5 | | | | 5 | | | | 5 | |
As of December 31, 2008, there was $110,029 of total unrecognized compensation cost related to outstanding options granted to employees and Directors. The cost is expected to be recognized over a weighted-average period of 23 months.
Non-employee awards
During 2008, we granted 11,518,000 stock options to non-employees. 5,694,000 of these options vested immediately during 2008 and expire in 2010 and 2013. 5,616,000 of these options have vesting contingent upon certain triggering events based on exercising of other related options and investor relations milestones not yet achieved (the expiration dates of these options are dependent on vesting and therefore cannot yet be determined). The remaining 208,000 options granted to non-employees during 2008 vest on December 31, 2009 and expire in 2012 and 2013. The fair value of these unvested options (without contingent vesting criteria) is being expensed over the applicable vesting period. During 2008, 1,040,000 non-employee options expired.
No options or warrants were granted to non-employees during 2007. 1,232,814 options issued to non-employees expired during 2007.
During 2006, we granted 416,000 stock options to non-employees. These options vested over a 24-month period and the fair value of the options was expensed over the vesting period. During 2006, 6,240,000 non-employee options previously issued in 2004 were cancelled, as vesting triggering events (primarily based on revenues) were not achieved within stipulated contractual time frames. Also, 1,144,000 non-employee options expired in 2006.
Services performed by non-employees who were granted options include product/distribution consulting, technology consulting, investor relations and legal services. The weighted-average fair value for such options that have had a fair value calculation applied ($0.21 for 2008 and $1.54 for 2006) was estimated at the date of grant using a Black-Scholes option pricing model with the following weighted-average assumptions: risk-free interest rates of 2.50% for 2008 and 4.51% for 2006; volatility factors of 0.91 for 2008 and 1.22 for 2006; and a weighted-average expected life of the option of approximately 2 and 5 years for 2008 and 2006, respectively.
208,000 options for services performed by non-employees who were granted options for product and technology consulting are subject to quarterly revaluation since they do not include a measurable performance commitment to determine vesting. The fair values for such options are updated quarterly for unvested options and future expense is adjusted accordingly.
As of December 31, 2008 and 2007, there was an immaterial amount of unrecognized compensation cost related to outstanding options granted to non-employees, excluding potential expense if certain triggering events are met.
The weighted-average remaining contractual term (in years) of the non-employee options outstanding at December 31, 2008, 2007 and 2006 is 1.51, 2.32 and 2.72, respectively. The weighted-average remaining contractual term (in years) for non-employee options outstanding at December 31, 2008 calculation excludes 5,621,200 options that do not yet have established expiration dates due to expirations being dependent on contingent vesting triggering events. These options have expiration dates ranging from twelve to twenty-four months from the date (contingent) vesting occurs.
The aggregate intrinsic value (defined as the excess of the market price of our common stock as of the end of the period over the exercise price of the related stock options) for all stock options (employee, Director and non-employee) outstanding and exercisable as of December 31, 2008 was $71,011.
We did not receive proceeds for stock options exercised during 2008 or 2007. In 2006, we received proceeds of $32,301 for 67,187 stock options exercised by a former Director with an intrinsic value of $42,911.
Stock option modifications
We recognized $206,764 of additional stock-based compensation expense in the second quarter of 2007 as a result of extending the expiration date of certain options from August 2007 to December 2009.
Other
Late in the first quarter of 2008, we began negotiations with third parties that ultimately culminated in a successful equity raise during the second quarter of 2008. Specifically, IFT sold 4,000,000 (unadjusted for the subsequent stock dividend) shares of common stock for $2,000,000, or $0.50 per share. This transaction was agreed to on April 22, 2008 at which time the closing price of IFT’s common stock was $0.42 per share. Pursuant to an agreement, the entire $2,000,000 was received by June 9, 2008. In accordance with the accounting standards, since the agreement entitled the third party to purchase these shares of common stock over a period of time, the agreement was valued based on the fair value of the purchase option resulting in $999,000 of stock-based compensation expense.
Note 5. Income Taxes
Deferred income taxes reflect the net income tax effects of temporary differences between the amount of assets and liabilities for financial reporting purposes and the amounts used for income tax purposes as well as income tax credit carry-forwards. The tax effects of temporary differences and credits that give rise to significant portions of the net deferred income tax asset are as follows:
| | | December 31, | |
| | | 2008 | | | 2007 | | | 2006 | |
| Net operating loss carry-forwards | | $ | 14,749,000 | | | $ | 13,685,000 | | | $ | 12,481,000 | |
| Intangible assets | | | 450,000 | | | | 630,000 | | | | 744,000 | |
| Stock-based compensation expense | | | 3,231,000 | | | | 2,076,000 | | | | 2,037,000 | |
| Non-deductible accruals | | | 162,000 | | | | 174,000 | | | | 219,000 | |
| | | | 18,592,000 | | | | 16,565,000 | | | | 15,481,000 | |
| Less valuation allowance | | | (18,592,000 | ) | | | (16,565,000 | ) | | | (15,481,000 | ) |
| Deferred tax asset | | $ | - | | | $ | - | | | $ | - | |
A valuation allowance must be established for a deferred income tax asset if it is more likely than not that a tax benefit may not be realized from the asset in the future. We have established a valuation allowance to the extent of our deferred income tax assets since it is not yet certain that absorption of the asset through future earnings will occur.
Net operating loss carry-forwards available to us for Federal tax purposes are as follows:
| Balance | | Expiration |
| | | |
| $ | 172,302 | | 2012 |
| | 729,807 | | 2013 |
| | 7,023,805 | | 2019 |
| | 4,563,340 | | 2020 |
| | 3,334,234 | | 2021 |
| | 3,107,920 | | 2022 |
| | 2,659,824 | | 2023 |
| | 2,348,545 | | 2024 |
| | 3,825,956 | | 2025 |
| | 3,566,224 | | 2026 |
| | 2,891,533 | | 2027 |
| | 2,649,526 | | 2028 |
| $ | 36,873,016 | | |
The net operating loss carry-forwards presented above may be limited or lost due to past or future changes in ownership of IFT pursuant to current income tax regulations.
The reconciliation of income tax computed at the United States federal statutory tax rate of 34% to the income tax benefit is as follows:
| | | Year ended December 31, | |
| | | 2008 | | | 2007 | | | 2006 | |
| | | | | | | | | | |
| Tax benefit at federal statutory rate | | $ | (1,722,000 | ) | | $ | (926,000 | ) | | $ | (1,783,000 | ) |
| State taxes, net of federal income tax | | | (304,000 | ) | | | (163,000 | ) | | | (315,000 | ) |
| Change in deferred tax valuation allowance | | | 2,027,000 | | | | 1,084,000 | | | | 1,893,000 | |
| Other | | | (1,000 | ) | | | 5,000 | | | | 205,000 | |
| Income tax benefit | | $ | - | | | $ | - | | | $ | - | |
In June 2006, FASB issued FASB Interpretation No. 48, Accounting for Uncertainty in Income Taxes - an interpretation of FASB Statement No. 109 (“FIN 48”), which establishes that the financial statement effects of a tax position taken or expected to be taken in a tax return are to be recognized in the financial statements when it is more likely than not, based on the technical merits, that the position will be sustained upon examination. FIN 48 became effective for fiscal years beginning after December 15, 2006. We adopted the provisions of FIN 48 effective January 1, 2007 with no impact to our financial statements. No uncertain tax positions have been identified through December 31, 2008. If we did identify any uncertain tax positions, any accrued interest related to unrecognized tax expenses and penalties would be recorded in income tax expense. Tax years going back to 1999 could remain open depending on how we utilize net operating loss carry-forwards in the future.
Note 6. Lease Commitment
We entered into a five-year operating lease for office space on January 1, 2002 that was scheduled to expire December 31, 2006. During 2006, we amended this lease, extending the term through December 31, 2011. Rent expense was $46,028, $44,499 and $55,006 during the fiscal years ended December 31, 2008, 2007 and 2006, respectively. We also entered into a five-year office equipment lease on October 4, 2005. Future minimum lease payments as of December 31, 2008 are displayed below:
| Year Ending December 31, | | | |
| 2009 | | $ | 50,043 | |
| 2010 | | | 50,306 | |
| 2011 | | | 48,987 | |
| Total Minimum Lease Payments | | $ | 149,336 | |
Note 7. Legal Proceedings
We are subject to various lawsuits and claims with respect to matters arising out of the normal course of business. While the impact on future financial results is not subject to reasonable estimation because considerable uncertainty exists, management believes, after consulting with counsel, that it is more likely than not that the ultimate liabilities resulting from such lawsuits and claims will not materially affect our financial position, results of operations or liquidity.
In December 2005, a former employee of IFT and a former consultant to IFT filed a joint lawsuit against us and certain of our Directors in the St. Louis County, Missouri Circuit Court. The relief sought by the plaintiffs included payment of compensation up to $120,000 per year under the former employee’s Employment Agreement, issuance of up to 5,025,921 shares of IFT stock under a Share Purchase Agreement entered into between each plaintiff and IFT in April 2001, and release from the plaintiffs’ non-competition obligations. The plaintiffs also alleged they were harmed by certain misrepresentations of IFT and were seeking an undetermined amount of damages for such alleged misrepresentations. We filed counter-claims against the plaintiffs, seeking monetary damages and enforcement of the plaintiffs’ non-competition obligations. During the second quarter of 2007, this case was dismissed by the Missouri Circuit Court with no compensation paid to any party. In June 2008, the plaintiffs re-filed their lawsuit and we re-filed our counter-claims. The plaintiffs have again failed to appear for depositions and to permit discovery and we are in the process of re-filing our motion to dismiss, this time with prejudice. The case is pending. We continue to believe the plaintiffs’ claims have no merit.
On July 31, 2006, we received notice from the American Arbitration Association ("AAA") of a Demand for Arbitration dated July 27, 2006 received by the AAA naming IFT as Respondent and TPG Capital Partners (“TPG”), the prior Blencathia Acquisition Corporation (“Blencathia”) owner, as the Claimant. The arbitration had been requested by TPG to resolve an alleged aggregate proceeds shortfall from the sale of IFT securities issued in the Blencathia merger. TPG has claimed they sold some or all of the 312,000 shares and the sales have not generated at least $500,000 of proceeds, as guaranteed in the merger documents.
In an effort to resolve this matter prior to submission to binding arbitration, both TPG and IFT participated in a non-binding mediation conference on January 30, 2007, which did not resolve the matter. Informal discussions are ongoing. It is not expected that the ultimate settlement of this matter, considering we have recorded a liability for the shortfall amount, will have an additional adverse material effect on IFT.
On October 2, 2008, Giant Trading, Inc., Dion Friedland, Magnum Select Fund, Ltd., Magnum Growth Fund, Brett Friedland, Lara and Andrew Block, Cherise Metz and Charles Stride filed a lawsuit against us and certain of our Directors (Messrs. Burst, Carr and Demetriou) in the United States District Court, Southern District of Florida. On February 3, 2009, Mr. Demetriou was dismissed without prejudice from the lawsuit because he was not served with process within the statutory period. The lawsuit alleges federal securities fraud violations of Section 10(b) of the Securities Exchange Act of 1934 and Rule 10b-5 promulgated thereunder against all defendants, and violations of Section 20(a) of the Securities Act of 1933 against the individual defendants. The plaintiffs are seeking a judgment for damages of $5 million, interest, costs, and for such other relief the Court deems just and proper. We have filed for a change a venue to St. Louis, Missouri, which is currently pending. We do not believe the lawsuit has any merit and will vigorously defend our position.
On February 6, 2009 we filed an action against Fuel Technologies Ltd, Mega Connections, Ltd., FT Marketing Ltd, and the AAA, Cause No. 09SL-CC00550, in the Circuit Court of the County of St. Louis, Missouri. In this action, IFT sought injunctive relief requiring the Defendants to litigate the claims asserted before the AAA in the Circuit Court of St. Louis County, Missouri. On or about February 17, 2009 the Court entered an Order transferring these claims out of arbitration and into the Circuit Court of the County of St. Louis. The claims initially filed before the AAA, but removed to the Circuit Court by IFT, is that IFT breached various marketing and distribution agreements by misrepresenting the state of IFT’s product development. The case is in its earliest stages, no discovery has been undertaken to-date and we are unable to predict any outcome. IFT believes it has meritorious defenses and intends to vigorously defend this action.
Note 8. Note payable to a Related Party
During the fourth quarter of 2007, we obtained an unsecured $500,000 loan from Harry F. Demetriou, a Director of IFT and the holder of over 5% of our common stock. Pursuant to the terms of the loan, a promissory note was executed by IFT in favor of Mr. Demetriou in connection with the loan. Terms of the loan included interest to be accrued at a rate of 15% per year in arrears with principal and interest due and payable on January 1, 2009. The loan was guaranteed by Rex Carr, a Director of IFT and the holder of over 5% percent of our common stock. All IFT obligations related to this note were extinguished effective March 31, 2008 with the issuance of 1,040,000 restricted common shares of IFT stock to Mr. Demetriou.
The shares issued were valued at $400,000 (based on a $0.40/share previous day closing) and extinguished the $500,000 of principal balance and $23,836 of accrued interest. The difference was deemed a contribution from Mr. Demetriou representing the excess of the aggregate liabilities over the fair value of the shares.
During the second quarter of 2008, IFT purchased 520,000 shares of its common stock from Mr. Demetriou for $250,000. We have applied the cost method to account for this treasury stock transaction in our financial statements. Because the amount paid by IFT was less than the fair market value of the stock on the date of purchase (the closing price of our stock was $0.79 on June 18, 2008), the difference was recorded to additional paid-in capital as Mr. Demetriou was considered a holder of economic interest in IFT in accordance with SFAS 123R.
Note 9. Subsequent Events
On January 20, 2009, our Board of Directors declared a restricted stock dividend to shareholders of record at the close of business on February 4, 2009 (the “Record Date”) in the amount of 1 restricted share for every 25 common shares owned. The distribution date was February 10, 2009. The restricted stock dividend is subject to resale conditions pursuant to Rule 144 of the Securities and Exchange Act. This stock dividend has been retroactively reflected in our financial statements and notes to the financial statements.
On February 26, 2009, we received the first purchase order pursuant to a Memorandum of Understanding (“MOU”) with Libya Oil Holdings Limited, Tamoil, Libya Africa Investment Portfolio and Vision Oil Services Ltd. Pursuant to the MOU, IFT will sell 600 metric tons of DiesoLIFT™ 10 at a price of 6,000 Euros (approximately $7,600) per metric ton to Vision Oil Services Ltd. We received cash proceeds of approximately $2.9 million in February 2009, net of the related selling expenses, for this purchase order and expect a net cash margin of approximately $1,500,000 once the product is manufactured and delivered. We will recognize gross revenues of approximately $4.5 million after all of the DiesoLIFT™ 10 has been delivered, which we expect to occur in 2009.
During the first quarter of 2009, IFT repurchased the remaining 520,000 shares outstanding relating to a prior debt settlement with Harry F. Demetriou, a Director of IFT and the holder of over five (5%) percent of IFT’s common stock, for $250,000.
In March of 2009, we issued 8,650,000 restricted common shares (including 4,325,000 attachable warrants), receiving cash proceeds of $2,162,500.
Note 10. Quarterly Statements of Operation Information (Unaudited)
| | | For the Three Month Period Ended | |
| | | March 31,
2008 | | | June 30,
2008 | | | September 30,
2008 | | | December 31,
2008 | |
| | | | | | | | | | | | | |
| Revenues | | $ | 30,597 | | | $ | 5,800 | | | $ | 76,451 | | | $ | 36,632 | |
| Net loss | | $ | (584,962 | ) | | $ | (3,374,293 | ) | | $ | (557,404 | ) | | $ | (547,109 | ) |
Basic and diluted net loss per share | | $ | (0.01 | ) | | $ | (0.04 | ) | | $ | (0.01 | ) | | $ | (0.01 | ) |
| Weighted-average common shares outstanding | | | 88,377,493 | | | | 91,022,065 | | | | 93,507,780 | | | | 93,507,780 | |
| | | | | | | | | | | | | | | | | |
| | | For the Three Month Period Ended | |
| | | March 31,
2007 | | | June 30,
2007 | | | September 30, 2007 | | | December 31, 2007 | |
| | | | | | | | | | | | | | | | | |
| Revenues | | $ | 11,872 | | | $ | 22,910 | | | $ | 34,288 | | | $ | 64,350 | |
| Net loss | | $ | (1,176,273 | ) | | $ | (536,108 | ) | | $ | (492,980 | ) | | $ | (517,364 | ) |
Basic and diluted net loss per share | | $ | (0.01 | ) | | $ | (0.01 | ) | | $ | (0.01 | ) | | $ | (0.01 | ) |
| Weighted-average common shares outstanding | | | 88,255,780 | | | | 88,255,780 | | | | 88,255,780 | | | | 88,255,780 | |
Note: Quarterly totals presented above may not total to reported annual amounts due to rounding.
SIGNATURES
Pursuant to the requirements of Section 13 or 15(d) of the Securities Exchange Act of 1934, the registrant has duly caused this report to be signed on its behalf by the undersigned, thereunto duly authorized.
INTERNATIONAL FUEL TECHNOLOGY, INC. (Registrant) |
| | | | | |
| By: | /s/ Jonathan R. Burst | | Date | March 31, 2009 |
| | Jonathan R. Burst | | | |
| | Chief Executive Officer | | | |
Pursuant to the requirements of the Securities Exchange Act of 1934, this report has been signed below by the following persons on behalf of the registrant and in the capacities and on the dates indicated.
| By: | /s/ Jonathan R. Burst | | Date | March 31, 2009 |
| | Jonathan R. Burst | | | |
| | Chairman of the Board and Chief Executive Officer (Principal executive officer) |
| By: | /s/ Stuart D. Beath | | Date | March 31, 2009 |
| | Stuart D. Beath | | | |
| | Chief Financial Officer (Principal financial and accounting officer) |
| By: | /s/ Rex Carr | | Date | March 31, 2009 |
| | Rex Carr | | | |
| | Director |
| By: | /s/ Harry F. Demetriou | | Date | March 31, 2009 |
| | Harry F. Demetriou | | | |
| | Director |
| By: | /s/ Gary Kirk | | Date | March 31, 2009 |
| | Gary Kirk | | | |
| | Director |
| By: | /s/ David B. Norris | | Date | March 31, 2009 |
| | David B. Norris | | | |
| | Director |