
UNITED STATES
SECURITIES AND EXCHANGE COMMISSION
Washington, D.C. 20549
FORM N-CSRS
CERTIFIED SHAREHOLDER REPORT OF REGISTERED
MANAGEMENT INVESTMENT COMPANIES
Investment Company Act file number: 811-09253
Wells Fargo Funds Trust
(Exact name of registrant as specified in charter)
525 Market St., San Francisco, CA 94105
(Address of principal executive offices) (Zip code)
C. David Messman
Wells Fargo Funds Management, LLC
525 Market St., San Francisco, CA 94105
(Name and address of agent for service)
Registrant’s telephone number, including area code: 800-222-8222
Date of fiscal year end: Registrant is making a filing for 11 of its series, Wells Fargo Advantage Emerging Markets Local Bond Fund, Wells Fargo Advantage International Bond Fund, Wells Fargo Advantage Strategic Income Fund, Wells Fargo Advantage Asia Pacific Fund, Wells Fargo Advantage Diversified International Fund, Wells Fargo Advantage Emerging Markets Equity Fund, Wells Fargo Advantage Emerging Markets Equity Income Fund, Wells Fargo Advantage Emerging Markets Equity Select Fund, Wells Fargo Advantage Global Opportunities Fund, Wells Fargo Advantage International Equity Fund, and Wells Fargo Advantage Intrinsic World Equity Fund. Each series has an October 31 fiscal year end.
Date of reporting period: April 30, 2014
| ITEM 1. | REPORT TO STOCKHOLDERS |

Wells Fargo Advantage
Emerging Markets Local Bond Fund

Semi-Annual Report
April 30, 2014

Reduce clutter. Save trees.
Sign up for electronic delivery of prospectuses and shareholder reports at wellsfargo.com/advantagedelivery
Contents
The views expressed and any forward-looking statements are as of April 30, 2014, unless otherwise noted, and are those of the Fund managers and/or Wells Fargo Funds Management, LLC. Discussions of individual securities, or the markets generally, or any Wells Fargo Advantage Fund are not intended as individual recommendations. Future events or results may vary significantly from those expressed in any forward-looking statements; the views expressed are subject to change at any time in response to changing circumstances in the market. Wells Fargo Funds Management, LLC and the Fund disclaim any obligation to publicly update or revise any views expressed or forward-looking statements.
NOT FDIC INSURED ¡ NO BANK GUARANTEE ¡ MAY LOSE VALUE
| | | | |
| 2 | | Wells Fargo Advantage Emerging Markets Local Bond Fund | | Letter to shareholders (unaudited) |

Karla M. Rabusch
President
Wells Fargo Advantage Funds
Global bond markets broadly rallied during the period, as low growth and low inflation expectations appeared to drive yields lower and longer-term bond prices higher, particularly in the opening months of 2014. High-yield and emerging markets debt sectors performed best, while currency markets were mixed.
Dear Valued Shareholder:
We are pleased to offer you this semi-annual report for the Wells Fargo Advantage Emerging Markets Local Bond Fund for the six-month period that ended April 30, 2014. Global bond markets broadly rallied during the period, as low growth and low inflation expectations appeared to drive yields lower and longer-term bond prices higher, particularly in the opening months of 2014. High-yield and emerging markets debt sectors performed best, while currency markets were mixed. The U.S. high-yield bond market (measured by the Barclays U.S. Corporate High Yield Index1) provided relatively strong fixed-income returns during the period, outpacing returns from the investment-grade corporate bond markets (measured by the Barclays Corporate Bond Index2) and U.S. Treasuries (measured by the Barclays U.S. Treasury Index3). U.S. mortgage-backed securities (MBS), commercial mortgage-backed securities (CMBS), and corporate bonds generated positive returns. On the whole, fixed-income markets across the globe notably rallied over the first four months of 2014, rebounding nicely from some challenging price corrections during 2013. In general, the corporate bond sector—notably, high-yield corporate bonds—was the best across all global markets, while sovereign debt issuances generally lagged behind.
At the end of 2013, currency markets were volatile while bond markets staged a recovery.
Global currency markets were mixed during the final months of 2013, with strength in eastern European currencies but weakness in Australian and Brazilian currencies. The most significant event during these waning months of 2013 was a continued sharp decline in the value of the Japanese yen. Bond markets of the smaller global economies continued to outperform the bond markets of the largest economies, while the strong demand for income across global bond markets continued to support higher-yield securities, such as corporate bonds and structured products (for example, MBS).
Simultaneously, the U.S. high-yield bond market continued to rally, building on positive gains from the previous months. Yield spreads continued to tighten significantly across the board, while U.S. Treasury yields ratcheted higher, most notably in maturities of five years and longer. Lower-rated credit tiers outperformed each respectively higher-rated credit tier, while the high-yield default rate remained historically low as refinancing levels declined modestly with rate increases but net new issuance remained strong. The rise in U.S. Treasury yields pressured security prices across the U.S. investment-grade bond markets. The corporate bond and CMBS sectors provided positive returns. By contrast, U.S. Treasuries declined in value and residential MBS had negative returns as mortgage rates shifted higher.
International and U.S. fixed-income markets rallied strongly over the first four months of 2014.
Global bond markets broadly rallied during the opening months of 2014, as low growth and low inflation expectations appeared to drive yields lower and longer-term bond prices higher. Global high-yield and emerging markets debt sectors performed best during February and March 2014. After a volatile January 2014, which saw yields and risk move higher in smaller economic regions, markets
| 1. | The Barclays U.S. Corporate High Yield Index is an unmanaged, U.S. dollar-denominated, nonconvertible, non-investment-grade debt index. The index consists of domestic and corporate bonds rated Ba and below with a minimum outstanding amount of $150 million. You cannot invest directly in an index. |
| 2. | The Barclays Corporate Bond Index is an unmanaged market-value-weighted index of investment-grade corporate fixed-rate debt issues with maturities of one year or more. You cannot invest directly in an index. |
| 3. | The Barclays U.S. Treasury Index is an unmanaged index of prices of U.S. Treasury bonds with maturities of 1 to 30 years. You cannot invest directly in an index. |
| | | | | | |
| Letter to shareholders (unaudited) | | Wells Fargo Advantage Emerging Markets Local Bond Fund | | | 3 | |
recovered in February 2014, carrying those trends into March and April 2014, which led some smaller bond markets to outperform the major markets during the period. Brazil, Italy, and Spain notably outperformed other countries, while Russia declined in value with the escalating crisis in the Ukraine in March 2014. Currency markets continued to be mixed during the late winter bond market rallies, as the Brazilian real appreciated while the Russian ruble and Polish zloty depreciated. The Japanese yen halted its precipitous decline from the waning months of 2013 and appreciated over the first four months of 2014.
Favorable conditions for U.S. fixed-income markets were restored in the early months of 2014.
Seemingly much to the surprise of many everyday investors and seasoned investment professionals alike, U.S. fixed-income markets (measured by the Barclays U.S. Aggregate Bond Index4) largely outperformed U.S. equity markets (measured by the S&P 500 Index5) during the opening months of 2014. This helped support global bond markets, particularly global corporate bonds. Reassurances from the U.S. Federal Reserve (Fed) that a highly accommodative monetary policy would continue throughout 2014 inspired bond rallies across the globe.
One positive takeaway for bond investors that helped fuel the global fixed-income rallies was former Fed Chairman Ben Bernanke’s guidance at the end of 2013. He indicated that the tapering of the Fed’s bond-buying program would proceed at a slow pace and that a reduction in quantitative easing should not be equivocated with a tightening of monetary policy. The distinction was important—although the bond-buying program was declining in volume, it was, nonetheless, still continuing. In addition, he indicated that the federal funds target rate would remain unchanged for the foreseeable future, with the implication that it would not increase until the bond-buying program was fully disbanded. These were important statements for investors that helped bolster U.S. fixed-income and global bond valuations in the opening months of 2014.
Don’t let short-term uncertainty derail long-term investment goals.
Periods of investment uncertainty can present challenges, but experience has taught us that maintaining long-term investment goals can be an effective way to plan for the future. To help you create a sound strategy based on your personal goals and risk tolerance, Wells Fargo Advantage Funds offers more than 100 mutual funds spanning a wide range of asset classes and investment styles. Although diversification cannot guarantee an investment profit or prevent losses, we believe it can be an effective way to manage investment risk and potentially smooth out overall portfolio performance. We encourage investors to know their investments and to understand that appropriate levels of risk-taking may unlock opportunities.
Reassurances from the U.S. Federal Reserve that a highly accommodative monetary policy would continue throughout 2014 inspired bond rallies across the globe.
| 4. | The Barclays U.S. Aggregate Bond Index is a broad-based benchmark that measures the investment-grade, U.S. dollar-denominated, fixed-rate taxable bond market, including Treasuries, government-related and corporate securities, MBS (agency fixed-rate and hybrid ARM passthroughs), ABS, and CMBS. You cannot invest directly in an index. |
| 5. | The S&P 500 Index consists of 500 stocks chosen for market size, liquidity, and industry group representation. It is a market-value-weighted index with each stock’s weight in the index proportionate to its market value. You cannot invest directly in an index. |
| | | | |
| 4 | | Wells Fargo Advantage Emerging Markets Local Bond Fund | | Letter to shareholders (unaudited) |
Thank you for choosing to invest with Wells Fargo Advantage Funds. We appreciate your confidence in us and remain committed to helping you meet your financial needs. For current information about your fund investments, contact your investment professional, visit our website at wellsfargoadvantagefunds.com, or call us directly at 1-800-222-8222. We are available 24 hours a day, 7 days a week.
Sincerely,

Karla M. Rabusch
President
Wells Fargo Advantage Funds
Notice to shareholders
The Fund and Wells Fargo Funds Management, LLC (“Funds Management”) have received an exemptive order from the SEC that permits Funds Management, subject to the approval of the Board of Trustees of the Fund, to select or replace certain subadvisers to manage all or a portion of the Fund’s assets and enter into, amend or terminate a sub-advisory agreement with certain subadvisers without obtaining shareholder approval (“Multi-manager Structure”). The Multi-manager Structure applies to subadvisers that are not affiliated with Funds Management or the Fund, except to the extent that affiliation arises solely because such subadvisers provide sub-advisory services to the Fund (“Non-affiliated Subadvisers”), as well as subadvisers that are indirect or direct wholly-owned subsidiaries of Funds Management or of another company that, indirectly or directly, wholly owns Funds Management (“Wholly-owned Subadvisers”).
Pursuant to the SEC order, Funds Management, with the approval of the Board of Trustees, has the discretion to terminate any subadvisers and allocate and reallocate the Fund’s assets among any other Non-affiliated Subadvisers or Wholly-owned Subadvisers. Funds Management, subject to oversight and supervision by the Board of Trustees, has responsibility to continue to oversee any subadvisers to the Fund and to recommend, for approval by the Board of Trustees, the hiring, termination and replacement of subadvisers for the Fund. In the event that a new subadviser is hired pursuant to the Multi-manager Structure, the Fund is required to provide notice to shareholders within 90 days.
Please contact your investment professional or call us directly at 1-800-222-8222 if you have any questions on this Notice to Shareholders.
This page is intentionally left blank.
| | | | |
| 6 | | Wells Fargo Advantage Emerging Markets Local Bond Fund | | Performance highlights (unaudited) |
Investment objective
The Fund seeks total return, consisting of income and capital appreciation.
Adviser
Wells Fargo Funds Management, LLC
Subadviser
First International Advisers, LLC
Portfolio managers
Tony Norris
Peter Wilson
Michael Lee
Alex Perrin
Christopher Wightman
Average annual total returns (%) as of April 30, 2014
| | | | | | | | | | | | | | | | | | | | | | | | | | |
| | | | | Including sales charge | | | Excluding sales charge | | | Expense ratios1 (%) | |
| | | Inception date | | 1 year | | | Since
inception | | | 1 year | | | Since
inception | | | Gross | | | Net2 | |
| Class A (WLBAX) | | 5-31-2012 | | | (14.04 | ) | | | (0.34 | ) | | | (9.98 | ) | | | 2.07 | | | | 1.85 | | | | 1.23 | |
| Class C (WLBEX) | | 5-31-2012 | | | (11.60 | ) | | | 1.25 | | | | (10.76 | ) | | | 1.25 | | | | 2.60 | | | | 1.98 | |
| Administrator Class (WLBDX) | | 5-31-2012 | | | – | | | | – | | | | (9.84 | ) | | | 2.19 | | | | 1.79 | | | | 1.10 | |
| Institutional Class (WLBIX) | | 5-31-2012 | | | – | | | | – | | | | (9.76 | ) | | | 2.35 | | | | 1.52 | | | | 0.90 | |
JPMorgan GBI EM Global Diversified
Composite Index3 | | – | | | – | | | | – | | | | (9.42 | ) | | | 4.01 | | | | – | | | | – | |
Figures quoted represent past performance, which is no guarantee of future results, and do not reflect taxes that a shareholder may pay on fund distributions or the redemption of fund shares. Investment return and principal value of an investment will fluctuate so that an investor’s shares, when redeemed, may be worth more or less than their original cost. Performance shown without sales charges would be lower if sales charges were reflected. Current performance may be lower or higher than the performance data quoted, which assumes the reinvestment of dividends and capital gains. Current month-end performance is available on the Fund’s website, wellsfargoadvantagefunds.com.
Index returns do not include transaction costs associated with buying and selling securities, any mutual fund fees or expenses, or any taxes. It is not possible to invest directly in an index.
For Class A shares, the maximum front-end sales charge is 4.50%. For Class C shares, the maximum contingent deferred sales charge is 1.00%. Performance including sales charge assumes the sales charge for the corresponding time period. Administrator Class and Institutional Class shares are sold without a front-end sales charge or contingent deferred sales charge.
Bond values fluctuate in response to the financial condition of individual issuers, general market and economic conditions, and changes in interest rates. In general, when interest rates rise, bond values fall and investors may lose principal value. Foreign investments are especially volatile and can rise or fall dramatically due to differences in the political and economic conditions of the host country. These risks are generally intensified in emerging markets. The use of derivatives may reduce returns and/or increase volatility. Certain investment strategies tend to increase the total risk of an investment (relative to the broader market). The Fund is exposed to high-yield securities risk and regional risk. Consult the Fund’s prospectus for additional information on these and other risks.
Please see footnotes on page 7.
| | | | | | |
| Performance highlights (unaudited) | | Wells Fargo Advantage Emerging Markets Local Bond Fund | | | 7 | |
| | | | |
| Ten largest long-term holdings4 (%) as of April 30, 2014 | |
Brazil, 10.00%, 1-1-2023 | | | 12.31 | |
Poland, 4.00%, 10-25-2023 | | | 7.70 | |
Russia, 7.00%, 1-25-2023 | | | 5.19 | |
Republic of South Africa, 7.75%, 2-28-2023 | | | 4.83 | |
Indonesia, 7.38%, 9-15-2016 | | | 4.82 | |
Thailand, 3.25%, 6-16-2017 | | | 4.77 | |
Indonesia, 8.38%, 3-15-2024 | | | 4.52 | |
Turkey, 9.00%, 3-8-2017 | | | 4.28 | |
Malaysia, 3.26%, 3-1-2018 | | | 3.91 | |
Malaysia, 4.26%, 9-15-2016 | | | 3.71 | |
|
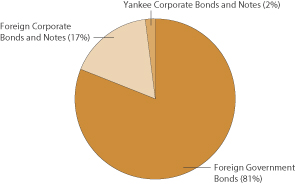
| Portfolio allocation5 as of April 30, 2014 |
|
 |
| 1. | Reflects the expense ratios as stated in the most recent prospectuses. The expense ratios shown are subject to change and may differ from the annualized expense ratios shown in the financial highlights of this report. |
| 2. | The Adviser has committed through February 28, 2015, to waive fees and/or reimburse expenses to the extent necessary to cap the Fund’s Total Annual Fund Operating Expenses After Fee Waiver, excluding certain expenses, at the amounts shown. Brokerage commissions, stamp duty fees, interest, taxes, acquired fund fees and expenses, and extraordinary expenses are excluded from the cap. Without this cap, the Fund’s returns would have been lower. |
| 3. | The JPMorgan GBI EM Global Diversified Composite Index is an unmanaged index of debt instruments of 16 emerging countries. You cannot invest directly in an index. |
| 4. | The ten largest long-term holdings are calculated based on the value of the securities divided by total net assets of the Fund. Holdings are subject to change and may have changed since the date specified. |
| 5. | Portfolio allocation is subject to change and is calculated based on the total long-term investments of the Fund. |
| | | | |
| 8 | | Wells Fargo Advantage Emerging Markets Local Bond Fund | | Fund expenses (unaudited) |
As a shareholder of the Fund, you incur two types of costs: (1) transaction costs, including sales charges (loads) on purchase payments and contingent deferred sales charges (if any) on redemptions and (2) ongoing costs, including management fees, distribution (12b-1) and/or shareholder service fees, and other Fund expenses. This example is intended to help you understand your ongoing costs (in dollars) of investing in the Fund and to compare these costs with the ongoing costs of investing in other mutual funds.
The example is based on an investment of $1,000 invested at the beginning of the six-month period and held for the entire period from November 1, 2013 to April 30, 2014.
Actual expenses
The “Actual” line of the table below provides information about actual account values and actual expenses. You may use the information in this line, together with the amount you invested, to estimate the expenses that you paid over the period. Simply divide your account value by $1,000 (for example, an $8,600 account value divided by $1,000 = 8.6), then multiply the result by the number in the “Actual” line under the heading entitled “Expenses paid during period” for your applicable class of shares to estimate the expenses you paid on your account during this period.
Hypothetical example for comparison purposes
The “Hypothetical” line of the table below provides information about hypothetical account values and hypothetical expenses based on the Fund’s actual expense ratio and an assumed rate of return of 5% per year before expenses, which is not the Fund’s actual return. The hypothetical account values and expenses may not be used to estimate the actual ending account balance or expenses you paid for the period. You may use this information to compare the ongoing costs of investing in the Fund and other funds. To do so, compare this 5% hypothetical example with the 5% hypothetical examples that appear in the shareholder reports of the other funds.
Please note that the expenses shown in the table are meant to highlight your ongoing costs only and do not reflect any transactional costs, such as sales charges (loads) and contingent deferred sales charges. Therefore, the “Hypothetical” line of the table is useful in comparing ongoing costs only and will not help you determine the relative total costs of owning different funds. In addition, if these transactional costs were included, your costs would have been higher.
| | | | | | | | | | | | | | | | |
| | | Beginning
account value
11-1-2013 | | | Ending
account value
4-30-2014 | | | Expenses
paid during
the period1 | | | Net annualized
expense ratio | |
Class A | | | | | | | | | | | | | | | | |
Actual | | $ | 1,000.00 | | | $ | 980.55 | | | $ | 6.04 | | | | 1.23 | % |
Hypothetical (5% return before expenses) | | $ | 1,000.00 | | | $ | 1,018.70 | | | $ | 6.16 | | | | 1.23 | % |
Class C | | | | | | | | | | | | | | | | |
Actual | | $ | 1,000.00 | | | $ | 975.63 | | | $ | 9.70 | | | | 1.98 | % |
Hypothetical (5% return before expenses) | | $ | 1,000.00 | | | $ | 1,014.98 | | | $ | 9.89 | | | | 1.98 | % |
Administrator Class | | | | | | | | | | | | | | | | |
Actual | | $ | 1,000.00 | | | $ | 980.64 | | | $ | 5.40 | | | | 1.10 | % |
Hypothetical (5% return before expenses) | | $ | 1,000.00 | | | $ | 1,019.34 | | | $ | 5.51 | | | | 1.10 | % |
Institutional Class | | | | | | | | | | | | | | | | |
Actual | | $ | 1,000.00 | | | $ | 981.19 | | | $ | 4.42 | | | | 0.90 | % |
Hypothetical (5% return before expenses) | | $ | 1,000.00 | | | $ | 1,020.33 | | | $ | 4.51 | | | | 0.90 | % |
| 1. | Expenses paid is equal to the annualized expense ratio of each class multiplied by the average account value over the period, multiplied by the number of days in the most recent fiscal half-year divided by the number of days in the fiscal year (to reflect the one-half-year period). |
| | | | | | |
| Portfolio of investments—April 30, 2014 (unaudited) | | Wells Fargo Advantage Emerging Markets Local Bond Fund | | | 9 | |
| | | | | | | | | | | | | | | | |
| Security name | | Interest rate | | | Maturity date | | | Principal | | | Value | |
| | | | |
Foreign Corporate Bonds and Notes @: 15.99% | | | | | | | | | | | | | | | | |
| | | | |
| Brazil: 0.63% | | | | | | | | | | | | | | | | |
BRF SA (Consumer Staples, Food Products, BRL) 144A | | | 7.75 | % | | | 5-22-2018 | | | | 460,000 | | | $ | 166,794 | |
| | | | | | | | | | | | | | | | |
| | | | |
| Germany: 4.84% | | | | | | | | | | | | | | | | |
KfW (Financials, Banks, TRY) | | | 5.00 | | | | 1-16-2017 | | | | 625,000 | | | | 268,050 | |
KfW (Financials, Banks, TRY) | | | 7.75 | | | | 2-3-2016 | | | | 1,150,000 | | | | 534,766 | |
KfW (Financials, Banks, TRY) | | | 8.50 | | | | 4-15-2015 | | | | 1,000,000 | | | | 471,455 | |
| | | | |
| | | | | | | | | | | | | | | 1,274,271 | |
| | | | | | | | | | | | | | | | |
| | | | |
| Luxembourg: 4.18% | | | | | | | | | | | | | | | | |
European Investment Bank (Financials, Banks, ZAR) | | | 6.00 | | | | 10-21-2019 | | | | 8,500,000 | | | | 731,919 | |
European Investment Bank (Financials, Banks, HUF) | | | 6.50 | | | | 1-5-2015 | | | | 80,000,000 | | | | 370,307 | |
| | | | |
| | | | | | | | | | | | | | | 1,102,226 | |
| | | | | | | | | | | | | | | | |
| | | | |
| Mexico: 1.51% | | | | | | | | | | | | | | | | |
America Movil SAB de CV (Telecommunication Services, Wireless Telecommunication Services, MXN) | | | 6.45 | | | | 12-5-2022 | | | | 3,000,000 | | | | 214,932 | |
Petroleos Mexicanos (Energy, Oil, Gas & Consumable Fuels, MXN) | | | 7.65 | | | | 11-24-2021 | | | | 2,300,000 | | | | 183,458 | |
| | | | |
| | | | | | | | | | | | | | | 398,390 | |
| | | | | | | | | | | | | | | | |
| | | | |
| Netherlands: 0.75% | | | | | | | | | | | | | | | | |
Rabobank Nederland (Financials, Banks, TRY) | | | 6.13 | | | | 5-2-2017 | | | | 460,000 | | | | 198,134 | |
| | | | | | | | | | | | | | | | |
| | | | |
| United States: 4.08% | | | | | | | | | | | | | | | | |
International Bank for Reconstruction & Development (Financials, Banks, MXN) | | | 7.50 | | | | 3-5-2020 | | | | 3,600,000 | | | | 310,454 | |
International Bank for Reconstruction & Development (Financials, Banks, ZAR) | | | 8.75 | | | | 3-1-2017 | | | | 7,800,000 | | | | 763,748 | |
| | | | |
| | | | | | | | | | | | | | | 1,074,202 | |
| | | | | | | | | | | | | | | | |
| | | | |
Total Foreign Corporate Bonds and Notes (Cost $4,774,100) | | | | | | | | | | | | | | | 4,214,017 | |
| | | | | | | | | | | | | | | | |
| | | | |
Foreign Government Bonds @: 77.19% | | | | | | | | | | | | | | | | |
Brazil (BRL) | | | 10.00 | | | | 1-1-2023 | | | | 7,975,000 | | | | 3,242,670 | |
Chile (CLP) | | | 5.50 | | | | 8-5-2020 | | | | 238,000,000 | | | | 430,737 | |
Colombia (COP) | | | 7.75 | | | | 4-14-2021 | | | | 975,000,000 | | | | 567,306 | |
Hungary (HUF) | | | 5.50 | | | | 6-24-2025 | | | | 170,500,000 | | | | 771,165 | |
Hungary (HUF) | | | 6.75 | | | | 11-24-2017 | | | | 99,500,000 | | | | 493,259 | |
Indonesia (IDR) | | | 7.38 | | | | 9-15-2016 | | | | 14,700,000,000 | | | | 1,269,554 | |
Indonesia (IDR) | | | 8.38 | | | | 3-15-2024 | | | | 13,480,000,000 | | | | 1,191,006 | |
Malaysia (MYR) | | | 3.26 | | | | 3-1-2018 | | | | 3,400,000 | | | | 1,030,278 | |
Malaysia (MYR) | | | 4.26 | | | | 9-15-2016 | | | | 3,125,000 | | | | 977,345 | |
Mexico (MXN) | | | 4.75 | | | | 6-14-2018 | | | | 4,920,000 | | | | 372,869 | |
Mexico (MXN) | | | 10.00 | | | | 12-5-2024 | | | | 8,500,000 | | | | 837,440 | |
Nigeria (NGN) | | | 15.10 | | | | 4-27-2017 | | | | 80,000,000 | | | | 522,627 | |
Poland (PLN) | | | 4.00 | | | | 10-25-2023 | | | | 6,160,000 | | | | 2,029,698 | |
Republic of South Africa (ZAR) | | | 7.75 | | | | 2-28-2023 | | | | 13,900,000 | | | | 1,273,137 | |
Romania (RON) | | | 6.00 | | | | 4-30-2016 | | | | 2,300,000 | | | | 750,646 | |
Russia (RUB) | | | 7.00 | | | | 1-25-2023 | | | | 56,150,000 | | | | 1,367,302 | |
Russia (RUB) | | | 7.50 | | | | 3-15-2018 | | | | 25,400,000 | | | | 677,333 | |
The accompanying notes are an integral part of these financial statements.
| | | | |
| 10 | | Wells Fargo Advantage Emerging Markets Local Bond Fund | | Portfolio of investments—April 30, 2014 (unaudited) |
| | | | | | | | | | | | | | | | |
| Security name | | Interest rate | | | Maturity date | | | Principal | | | Value | |
| | | | |
Foreign Government Bonds @ (continued) | | | | | | | | | | | | | | | | |
Thailand (THB) | | | 3.25 | % | | | 6-16-2017 | | | | 39,750,000 | | | $ | 1,257,003 | |
Turkey (TRY) | | | 6.30 | | | | 2-14-2018 | | | | 340,000 | | | | 147,655 | |
Turkey (TRY) | | | 9.00 | | | | 3-8-2017 | | | | 2,380,000 | | | | 1,127,021 | |
| | | | |
Total Foreign Government Bonds (Cost $21,215,823) | | | | | | | | | | | | | | | 20,336,051 | |
| | | | | | | | | | | | | | | | |
| | | | |
Yankee Corporate Bonds and Notes: 2.11% | | | | | | | | | | | | | | | | |
| | | | |
| Brazil: 0.75% | | | | | | | | | | | | | | | | |
ITAU Unibanco Holding SA (Financials, Banks) | | | 5.13 | | | | 5-13-2023 | | | $ | 200,000 | | | | 199,200 | |
Petroplus International Finance Company (Energy, Oil, Gas & Consumable Fuels) | | | 5.75 | | | | 1-20-2020 | | | | 150,000 | | | | 158,378 | |
| | | | |
| | | | | | | | | | | | | | | 357,578 | |
| | | | | | | | | | | | | | | | |
| | | | |
| United Kingdom: 0.76% | | | | | | | | | | | | | | | | |
Vedanta Resources plc (Materials, Metals & Mining) 144A | | | 6.00 | | | | 1-31-2019 | | | | 200,000 | | | | 199,248 | |
| | | | | | | | | | | | | | | | |
| | | | |
Total Yankee Corporate Bonds and Notes (Cost $565,304) | | | | | | | | | | | | | | | 556,826 | |
| | | | | | | | | | | | | | | | |
| | | | |
| | | Yield | | | | | | Shares | | | | |
| Short-Term Investments: 3.88% | | | | | | | | | | | | | | | | |
| | | | |
| Investment Companies: 3.88% | | | | | | | | | | | | | | | | |
Wells Fargo Advantage Cash Investment Money Market Fund, Select Class (l)(u) | | | 0.07 | | | | | | | | 1,020,823 | | | | 1,020,823 | |
| | | | | | | | | | | | | | | | |
| | | | |
Total Short-Term Investments (Cost $1,020,823) | | | | | | | | | | | | | | | 1,020,823 | |
| | | | | | | | | | | | | | | | |
| | | | | | | | |
| Total investments in securities | | | | | | | | |
| (Cost $27,576,050) * | | | 99.17 | % | | | 26,127,717 | |
Other assets and liabilities, net | | | 0.83 | | | | 219,033 | |
| | | | | | | | |
| Total net assets | | | 100.00 | % | | $ | 26,346,750 | |
| | | | | | | | |
| @ | Foreign bond principal is denominated in local currency. |
| 144A | Security that may be resold to “qualified institutional buyers” under Rule 144A or security offered pursuant to Section 4(2) of the Securities Act of 1933, as amended |
| (l) | Represents an affiliate of the Fund under Sections 2(a)(2) and 2(a)(3) of the Investment Company Act of 1940, as amended |
| (u) | Rate shown is the 7-day annualized yield at period end. |
| * | Cost for federal income tax purposes is $27,568,269 and unrealized appreciation (depreciation) consists of: |
| | | | |
Gross unrealized appreciation | | $ | 756,903 | |
Gross unrealized depreciation | | | (2,197,455 | ) |
| | | | |
Net unrealized depreciation | | $ | (1,440,552 | ) |
The accompanying notes are an integral part of these financial statements.
| | | | | | |
| Statement of assets and liabilities—April 30, 2014 (unaudited) | | Wells Fargo Advantage Emerging Markets Local Bond Fund | | | 11 | |
| | | | |
| | | | |
| |
Assets | | | | |
Investments | | | | |
In unaffiliated securities, at value (see cost below) | | $ | 25,106,894 | |
In affiliated securities, at value (see cost below) | | | 1,020,823 | |
| | | | |
Total investments, at value (see cost below) | | | 26,127,717 | |
Foreign currency, at value (see cost below) | | | 85,365 | |
Receivable for investments sold | | | 104,544 | |
Receivable for interest | | | 446,296 | |
Unrealized gains on forward foreign currency contracts | | | 58,172 | |
Prepaid expenses and other assets | | | 14,810 | |
| | | | |
Total assets | | | 26,836,904 | |
| | | | |
| |
Liabilities | | | | |
Payable for investments purchased | | | 381,175 | |
Unrealized losses on forward foreign currency contracts | | | 69,089 | |
Advisory fee payable | | | 4,767 | |
Distribution fees payable | | | 315 | |
Due to other related parties | | | 3,092 | |
Accrued expenses and other liabilities | | | 31,716 | |
| | | | |
Total liabilities | | | 490,154 | |
| | | | |
Total net assets | | $ | 26,346,750 | |
| | | | |
| |
NET ASSETS CONSIST OF | | | | |
Paid-in capital | | $ | 29,048,623 | |
Undistributed net investment income | | | 413,099 | |
Accumulated net realized losses on investments | | | (1,665,513 | ) |
Net unrealized losses on investments | | | (1,449,459 | ) |
| | | | |
Total net assets | | $ | 26,346,750 | |
| | | | |
| |
COMPUTATION OF NET ASSET VALUE AND OFFERING PRICE PER SHARE1 | | | | |
Net assets – Class A | | $ | 782,981 | |
Shares outstanding – Class A | | | 86,379 | |
Net asset value per share – Class A | | | $9.06 | |
Maximum offering price per share – Class A2 | | | $9.49 | |
Net assets – Class C | | $ | 512,231 | |
Shares outstanding – Class C | | | 56,645 | |
Net asset value per share – Class C | | | $9.04 | |
Net assets – Administrator Class | | $ | 12,501,808 | |
Shares outstanding – Administrator Class | | | 1,377,450 | |
Net asset value per share – Administrator Class | | | $9.08 | |
Net assets – Institutional Class | | $ | 12,549,730 | |
Shares outstanding – Institutional Class | | | 1,383,274 | |
Net asset value per share – Institutional Class | | | $9.07 | |
| |
Investments in unaffiliated securities, at cost | | $ | 26,555,227 | |
| | | | |
Investments in affiliated securities, at cost | | $ | 1,020,823 | |
| | | | |
Total investments, at cost | | $ | 27,576,050 | |
| | | | |
Foreign currency, at cost | | $ | 86,596 | |
| | | | |
| 1. | The Fund has an unlimited number of authorized shares. |
| 2. | Maximum offering price is computed as 100/95.50 of net asset value. On investments of $50,000 or more, the offering price is reduced. |
The accompanying notes are an integral part of these financial statements.
| | | | |
| 12 | | Wells Fargo Advantage Emerging Markets Local Bond Fund | | Statement of operations—Six Months Ended April 30, 2014 (unaudited) |
| | | | |
| | | | |
| |
Investment income | | | | |
Interest** | | $ | 845,129 | |
Income from affiliated securities | | | 189 | |
| | | | |
Total investment income | | | 845,318 | |
| | | | |
| |
Expenses | | | | |
Advisory fee | | | 83,020 | |
Administration fees | | | | |
Fund level | | | 6,386 | |
Class A | | | 601 | |
Class C | | | 399 | |
Administrator Class | | | 6,063 | |
Institutional Class | | | 4,867 | |
Shareholder servicing fees | | | | |
Class A | | | 939 | |
Class C | | | 623 | |
Administrator Class | | | 15,159 | |
Distribution fees | | | | |
Class C | | | 1,870 | |
Custody and accounting fees | | | 16,797 | |
Professional fees | | | 24,030 | |
Registration fees | | | 26,042 | |
Shareholder report expenses | | | 2,287 | |
Trustees’ fees and expenses | | | 4,418 | |
Other fees and expenses | | | 2,970 | |
| | | | |
Total expenses | | | 196,471 | |
Less: Fee waivers and/or expense reimbursements | | | (65,460 | ) |
| | | | |
Net expenses | | | 131,011 | |
| | | | |
Net investment income | | | 714,307 | |
| | | | |
| |
REALIZED AND UNREALIZED GAINS (LOSSES) ON INVESTMENTS | | | | |
| |
Net realized gains (losses) on: | | | | |
Unaffiliated securities | | | (1,668,291 | ) |
Forward foreign currency contract transactions | | | 2,819 | |
| | | | |
Net realized losses on investments | | | (1,665,472 | ) |
| | | | |
| |
Net change in unrealized gains (losses) on: | | | | |
Unaffiliated securities | | | 478,626 | |
Forward foreign currency contract transactions | | | (46,343 | ) |
| | | | |
Net change in unrealized gains (losses) on investments | | | 432,283 | |
| | | | |
Net realized and unrealized gains (losses) on investments | | | (1,233,189 | ) |
| | | | |
Net decrease in net assets resulting from operations | | $ | (518,882 | ) |
| | | | |
| |
** Net of foreign interest withholding taxes in the amount of | | | $6,013 | |
The accompanying notes are an integral part of these financial statements.
| | | | | | |
| Statement of changes in net assets | | Wells Fargo Advantage Emerging Markets Local Bond Fund | | | 13 | |
| | | | | | | | | | | | | | | | |
| | | Six months ended April 30, 2014 (unaudited) | | | Year ended
October 31, 2013 | |
| | | | |
Operations | | | | | | | | | | | | | | | | |
Net investment income | | | | | | $ | 714,307 | | | | | | | $ | 1,256,630 | |
Net realized gains (losses) on investments | | | | | | | (1,665,472 | ) | | | | | | | 831,853 | |
Net change in unrealized gains (losses) on investments | | | | | | | 432,283 | | | | | | | | (2,947,870 | ) |
| | | | |
Net decrease in net assets resulting from operations | | | | | | | (518,882 | ) | | | | | | | (859,387 | ) |
| | | | |
| | | | |
Distributions to shareholders from | | | | | | | | | | | | | | | | |
Net investment income | | | | | | | | | | | | | | | | |
Class A | | | | | | | (25,842 | ) | | | | | | | (43,800 | ) |
Class C | | | | | | | (15,773 | ) | | | | | | | (31,393 | ) |
Administrator Class | | | | | | | (404,732 | ) | | | | | | | (835,457 | ) |
Institutional Class | | | | | | | (413,505 | ) | | | | | | | (872,324 | ) |
Net realized gains | | | | | | | | | | | | | | | | |
Class A | | | | | | | (8,414 | ) | | | | | | | (10,611 | ) |
Class C | | | | | | | (6,176 | ) | | | | | | | (10,327 | ) |
Administrator Class | | | | | | | (150,027 | ) | | | | | | | (237,700 | ) |
Institutional Class | | | | | | | (150,600 | ) | | | | | | | (237,957 | ) |
| | | | |
Total distributions to shareholders | | | | | | | (1,175,069 | ) | | | | | | | (2,279,569 | ) |
| | | | |
| | | | |
Capital share transactions | | | Shares | | | | | | | | Shares | | | | | |
Proceeds from shares sold | | | | | | | | | | | | | | | | |
Class A | | | 14,604 | | | | 134,145 | | | | 30,903 | | | | 325,284 | |
Class C | | | 421 | | | | 3,600 | | | | 4,297 | | | | 46,499 | |
| | | | |
| | | | | | | 137,745 | | | | | | | | 371,783 | |
| | | | |
Reinvestment of distributions | | | | | | | | | | | | | | | | |
Class A | | | 3,790 | | | | 34,256 | | | | 5,235 | | | | 54,411 | |
Class C | | | 2,424 | | | | 21,949 | | | | 3,981 | | | | 41,720 | |
Administrator Class | | | 61,225 | | | | 554,759 | | | | 102,729 | | | | 1,073,157 | |
Institutional Class | | | 62,321 | | | | 564,105 | | | | 106,394 | | | | 1,110,281 | |
| | | | |
| | | | | | | 1,175,069 | | | | | | | | 2,279,569 | |
| | | | |
Payment for shares redeemed | | | | | | | | | | | | | | | | |
Class A | | | (8,043 | ) | | | (73,076 | ) | | | (13,701 | ) | | | (134,299 | ) |
Class C | | | (421 | ) | | | (3,714 | ) | | | (4,448 | ) | | | (44,699 | ) |
| | | | |
| | | | | | | (76,790 | ) | | | | | | | (178,998 | ) |
| | | | |
Net increase in net assets resulting from capital share transactions | | | | | | | 1,236,024 | | | | | | | | 2,472,354 | |
| | | | |
Total decrease in net assets | | | | | | | (457,927 | ) | | | | | | | (666,602 | ) |
| | | | |
| | | | |
Net assets | | | | | | | | | | | | | | | | |
Beginning of period | | | | | | | 26,804,677 | | | | | | | | 27,471,279 | |
| | | | |
End of period | | | | | | $ | 26,346,750 | | | | | | | $ | 26,804,677 | |
| | | | |
Undistributed net investment income | | | | | | $ | 413,099 | | | | | | | $ | 558,644 | |
| | | | |
The accompanying notes are an integral part of these financial statements.
| | | | |
| 14 | | Wells Fargo Advantage Emerging Markets Local Bond Fund | | Financial highlights |
(For a share outstanding throughout each period)
| | | | | | | | | | | | |
| | | Six months ended
April 30, 2014 (unaudited) | | | Year ended October 31 | |
| CLASS A | | | 2013 | | | 20121 | |
Net asset value, beginning of period | | $ | 9.68 | | | $ | 10.85 | | | $ | 10.00 | |
Net investment income | | | 0.22 | | | | 0.44 | | | | 0.11 | |
Net realized and unrealized gains (losses) on investments | | | (0.43 | ) | | | (0.76 | ) | | | 0.85 | |
| | | | | | | | | | | | |
Total from investment operations | | | (0.21 | ) | | | (0.32 | ) | | | 0.96 | |
Distributions to shareholders from | | | | | | | | | | | | |
Net investment income | | | (0.30 | ) | | | (0.65 | ) | | | (0.11 | ) |
Net realized gains | | | (0.11 | ) | | | (0.20 | ) | | | 0.00 | |
| | | | | | | | | | | | |
Total distributions to shareholders | | | (0.41 | ) | | | (0.85 | ) | | | (0.11 | ) |
Net asset value, end of period | | $ | 9.06 | | | $ | 9.68 | | | $ | 10.85 | |
Total return2 | | | (1.95 | )% | | | (3.28 | )% | | | 9.67 | % |
Ratios to average net assets (annualized) | | | | | | | | | | | | |
Gross expenses | | | 1.71 | % | | | 1.84 | % | | | 2.20 | % |
Net expenses | | | 1.23 | % | | | 1.23 | % | | | 1.23 | % |
Net investment income | | | 5.40 | % | | | 4.41 | % | | | 2.62 | % |
Supplemental data | | | | | | | | | | | | |
Portfolio turnover rate | | | 38 | % | | | 85 | % | | | 120 | % |
Net assets, end of period (000s omitted) | | | $783 | | | | $736 | | | | $581 | |
| 1. | For the period from May 31, 2012 (commencement of class operations) to October 31, 2012. |
| 2. | Total return calculations do not include any sales charges. Returns for periods of less than one year are not annualized. |
The accompanying notes are an integral part of these financial statements.
| | | | | | |
| Financial highlights | | Wells Fargo Advantage Emerging Markets Local Bond Fund | | | 15 | |
(For a share outstanding throughout each period)
| | | | | | | | | | | | |
| | | Six months ended
April 30, 2014 (unaudited) | | | Year ended October 31 | |
| CLASS C | | | 2013 | | | 20121 | |
Net asset value, beginning of period | | $ | 9.68 | | | $ | 10.85 | | | $ | 10.00 | |
Net investment income | | | 0.20 | | | | 0.36 | | | | 0.08 | |
Net realized and unrealized gains (losses) on investments | | | (0.44 | ) | | | (0.75 | ) | | | 0.85 | |
| | | | | | | | | | | | |
Total from investment operations | | | (0.24 | ) | | | (0.39 | ) | | | 0.93 | |
Distributions to shareholders from | | | | | | | | | | | | |
Net investment income | | | (0.29 | ) | | | (0.58 | ) | | | (0.08 | ) |
Net realized gains | | | (0.11 | ) | | | (0.20 | ) | | | 0.00 | |
| | | | | | | | | | | | |
Total distributions to shareholders | | | (0.40 | ) | | | (0.78 | ) | | | (0.08 | ) |
Net asset value, end of period | | $ | 9.04 | | | $ | 9.68 | | | $ | 10.85 | |
Total return2 | | | (2.44 | )% | | | (4.00 | )% | | | 9.35 | % |
Ratios to average net assets (annualized) | | | | | | | | | | | | |
Gross expenses | | | 2.46 | % | | | 2.60 | % | | | 2.95 | % |
Net expenses | | | 1.98 | % | | | 1.98 | % | | | 1.98 | % |
Net investment income | | | 4.64 | % | | | 3.59 | % | | | 1.89 | % |
Supplemental data | | | | | | | | | | | | |
Portfolio turnover rate | | | 38 | % | | | 85 | % | | | 120 | % |
Net assets, end of period (000s omitted) | | | $512 | | | | $525 | | | | $547 | |
| 1. | For the period from May 31, 2012 (commencement of class operations) to October 31, 2012. |
| 2. | Total return calculations do not include any sales charges. Returns for periods of less than one year are not annualized. |
The accompanying notes are an integral part of these financial statements.
| | | | |
| 16 | | Wells Fargo Advantage Emerging Markets Local Bond Fund | | Financial highlights |
(For a share outstanding throughout each period)
| | | | | | | | | | | | |
| | | Six months ended
April 30, 2014 (unaudited) | | | Year ended October 31 | |
| ADMINISTRATOR CLASS | | | 2013 | | | 20121 | |
Net asset value, beginning of period | | $ | 9.69 | | | $ | 10.85 | | | $ | 10.00 | |
Net investment income | | | 0.24 | | | | 0.46 | | | | 0.12 | |
Net realized and unrealized gains (losses) on investments | | | (0.44 | ) | | | (0.76 | ) | | | 0.85 | |
| | | | | | | | | | | | |
Total from investment operations | | | (0.20 | ) | | | (0.30 | ) | | | 0.97 | |
Distributions to shareholders from | | | | | | | | | | | | |
Net investment income | | | (0.30 | ) | | | (0.66 | ) | | | (0.12 | ) |
Net realized gains | | | (0.11 | ) | | | (0.20 | ) | | | 0.00 | |
| | | | | | | | | | | | |
Total distributions to shareholders | | | (0.41 | ) | | | (0.86 | ) | | | (0.12 | ) |
Net asset value, end of period | | $ | 9.08 | | | $ | 9.69 | | | $ | 10.85 | |
Total return2 | | | (1.94 | )% | | | (3.13 | )% | | | 9.72 | % |
Ratios to average net assets (annualized) | | | | | | | | | | | | |
Gross expenses | | | 1.65 | % | | | 1.79 | % | | | 2.16 | % |
Net expenses | | | 1.10 | % | | | 1.10 | % | | | 1.10 | % |
Net investment income | | | 5.52 | % | | | 4.48 | % | | | 2.77 | % |
Supplemental data | | | | | | | | | | | | |
Portfolio turnover rate | | | 38 | % | | | 85 | % | | | 120 | % |
Net assets, end of period (000s omitted) | | $ | 12,502 | | | $ | 12,754 | | | $ | 13,166 | |
| 1. | For the period from May 31, 2012 (commencement of class operations) to October 31, 2012. |
| 2. | Returns for periods of less than one year are not annualized. |
The accompanying notes are an integral part of these financial statements.
| | | | | | |
| Financial highlights | | Wells Fargo Advantage Emerging Markets Local Bond Fund | | | 17 | |
(For a share outstanding throughout each period)
| | | | | | | | | | | | |
| | | Six months ended
April 30, 2014 (unaudited) | | | Year ended October 31 | |
| INSTITUTIONAL CLASS | | | 2013 | | | 20121 | |
Net asset value, beginning of period | | $ | 9.68 | | | $ | 10.85 | | | $ | 10.00 | |
Net investment income | | | 0.25 | | | | 0.48 | | | | 0.13 | |
Net realized and unrealized gains (losses) on investments | | | (0.44 | ) | | | (0.76 | ) | | | 0.85 | |
| | | | | | | | | | | | |
Total from investment operations | | | (0.19 | ) | | | (0.28 | ) | | | 0.98 | |
Distributions to shareholders from | | | | | | | | | | | | |
Net investment income | | | (0.31 | ) | | | (0.69 | ) | | | (0.13 | ) |
Net realized gains | | | (0.11 | ) | | | (0.20 | ) | | | 0.00 | |
| | | | | | | | | | | | |
Total distributions to shareholders | | | (0.42 | ) | | | (0.89 | ) | | | (0.13 | ) |
Net asset value, end of period | | $ | 9.07 | | | $ | 9.68 | | | $ | 10.85 | |
Total return2 | | | (1.88 | )% | | | (2.97 | )% | | | 9.82 | % |
Ratios to average net assets (annualized) | | | | | | | | | | | | |
Gross expenses | | | 1.38 | % | | | 1.52 | % | | | 1.94 | % |
Net expenses | | | 0.90 | % | | | 0.90 | % | | | 0.90 | % |
Net investment income | | | 5.72 | % | | | 4.68 | % | | | 2.97 | % |
Supplemental data | | | | | | | | | | | | |
Portfolio turnover rate | | | 38 | % | | | 85 | % | | | 120 | % |
Net assets, end of period (000s omitted) | | $ | 12,550 | | | $ | 12,790 | | | $ | 13,177 | |
| 1. | For the period from May 31, 2012 (commencement of class operations) to October 31, 2012. |
| 2. | Returns for periods of less than one year are not annualized. |
The accompanying notes are an integral part of these financial statements.
| | | | |
| 18 | | Wells Fargo Advantage Emerging Markets Local Bond Fund | | Notes to financial statements (unaudited) |
1. ORGANIZATION
Wells Fargo Funds Trust (the “Trust”), a Delaware statutory trust organized on March 10, 1999, is an open-end management investment company registered under the Investment Company Act of 1940, as amended (the “1940 Act”). These financial statements report on the Wells Fargo Advantage Emerging Markets Local Bond Fund (the “Fund”) which is a diversified series of the Trust.
2. SIGNIFICANT ACCOUNTING POLICIES
The following significant accounting policies, which are consistently followed in the preparation of the financial statements of the Fund, are in conformity with U.S. generally accepted accounting principles which require management to make estimates and assumptions that affect the reported amounts of assets and liabilities, disclosure of contingent assets and liabilities at the date of the financial statements, and the reported amounts of revenues and expenses during the reporting period. Actual results could differ from those estimates.
Securities valuation
All investments are valued each business day as of the close of regular trading on the New York Stock Exchange (generally 4 p.m. Eastern Time).
Fixed income securities acquired with maturities exceeding 60 days are valued based on evaluated bid prices provided by an independent pricing service which may utilize both transaction data and market information such as yield, quality, coupon rate, maturity, type of issue, trading characteristics and other market data. If prices are not available from the independent pricing service or prices received are deemed not representative of market value, prices will be obtained from an independent broker-dealer.
The values of securities denominated in foreign currencies are translated into U.S. dollars at rates provided by an independent foreign currency pricing source at a time each business day specified by the Management Valuation Team of Wells Fargo Funds Management, LLC (“Funds Management”).
Short-term securities, with maturities of 60 days or less at time of purchase, generally are valued at amortized cost which approximates fair value. The amortized cost method involves valuing a security at its cost, plus accretion of discount or minus amortization of premium over the period until maturity.
Investments in registered open-end investment companies are valued at net asset value.
Investments which are not valued using any of the methods discussed above are valued at their fair value, as determined in good faith by the Board of Trustees of the Fund. The Board of Trustees has established a Valuation Committee comprised of the Trustees and has delegated to it the authority to take any actions regarding the valuation of portfolio securities that the Valuation Committee deems necessary or appropriate, including determining the fair value of portfolio securities, unless the determination has been delegated to the Management Valuation Team. The Board of Trustees retains the authority to make or ratify any valuation decisions or approve any changes to the Valuation Procedures as it deems appropriate. On a quarterly basis, the Board of Trustees receives reports on any valuation actions taken by the Valuation Committee or the Management Valuation Team which may include items for ratification.
Valuations of fair valued securities are compared to the next actual sales price when available, or other appropriate market values, to assess the continued appropriateness of the fair valuation methodologies used. These securities are fair valued on a day-to-day basis, taking into consideration changes to appropriate market information and any significant changes to the inputs considered in the valuation process until there is a readily available price provided on an exchange or by an independent pricing service. Valuations received from an independent pricing service or independent broker-dealer quotes are periodically validated by comparisons to most recent trades and valuations provided by other independent pricing services in addition to the review of prices by the adviser and/or subadviser. Unobservable inputs used in determining fair valuations are identified based on the type of security, taking into consideration factors utilized by market participants in valuing the investment, knowledge about the issuer and the current market environment.
Foreign currency translation
The accounting records of the Fund are maintained in U.S. dollars. The values of other assets and liabilities denominated in foreign currencies are translated into U.S. dollars at rates provided by an independent foreign currency pricing source at a time each business day specified by the Management Valuation Team. Purchases and sales of securities, and income and expenses are converted at the rate of exchange on the respective dates of such transactions. Net realized foreign exchange gains or losses arise from sales of foreign currencies, currency gains or losses realized between the trade and settlement dates on securities transactions, and the difference between the amounts of dividends, interest and foreign
| | | | | | |
| Notes to financial statements (unaudited) | | Wells Fargo Advantage Emerging Markets Local Bond Fund | | | 19 | |
withholding taxes recorded and the U.S. dollar equivalent of the amounts actually paid or received. Net unrealized foreign exchange gains and losses arise from changes in the fair value of assets and liabilities other than investments in securities resulting from changes in exchange rates. The changes in net assets arising from changes in exchange rates and the changes in net assets resulting from changes in market prices of securities are not separately presented. Such changes are included in net realized and unrealized gains or losses from investments.
Forward foreign currency contracts
The Fund is subject to foreign currency exchange rate risk in the normal course of pursuing its investment objectives. A forward foreign currency contract is an agreement between two parties to purchase or sell a specific currency for an agreed-upon price at a future date. The Fund enters into forward foreign currency contracts to facilitate transactions in foreign-denominated securities and to attempt to minimize the risk to the Fund from adverse changes in the relationship between currencies. Forward foreign currency contracts are recorded at the forward rate and marked-to-market daily. When the contracts are closed, realized gains and losses arising from such transactions are recorded as realized gains or losses on forward foreign currency contract transactions. The Fund could be exposed to risks if the counterparties to the contracts are unable to meet the terms of their contracts or if the value of the foreign currency changes unfavorably. The Fund’s maximum risk of loss from counterparty credit risk is the unrealized gains on the contracts. This risk may be mitigated if there is a master netting arrangement between the Fund and the counterparty.
Security transactions and income recognition
Securities transactions are recorded on a trade date basis. Realized gains or losses are recorded on the basis of identified cost.
Interest income is accrued daily and bond discounts are accreted and premiums are amortized daily based on the effective interest method. To the extent debt obligations are placed on non-accrual status, any related interest income may be reduced by writing off interest receivables when the collection of all or a portion of interest has become doubtful based on consistently applied procedures. If the issuer subsequently resumes interest payments or when the collectability of interest is reasonably assured, the debt obligation is removed from non-accrual status.
Income from foreign securities is recorded net of foreign taxes withheld where recovery of such taxes is not assured.
Distributions to shareholders
Distributions to shareholders from net investment income and net realized gains, if any, are recorded on the ex-dividend date. Such distributions are determined in conformity with federal income tax regulations, which may differ in amount or character from net investment income and realized gains recognized for purposes of U.S. generally accepted accounting principles.
Federal and other taxes
The Fund intends to continue to qualify as a regulated investment company by distributing substantially all of its investment company taxable income and any net realized capital gains (after reduction for capital loss carryforwards) sufficient to relieve it from all, or substantially all, federal income taxes. Accordingly, no provision for federal income taxes was required.
The Fund’s income and federal excise tax returns and all financial records supporting those returns for the fiscal years since the Fund’s commencement of operations are subject to examination by the federal and Delaware revenue authorities. Management has analyzed the Fund’s tax positions taken on federal, state, and foreign tax returns for all open tax years and does not believe that there are any uncertain tax positions that require recognition of a tax liability.
Class allocations
The separate classes of shares offered by the Fund differ principally in applicable sales charges, distribution, shareholder servicing, and administration fees. Shareholders of each class bear certain expenses that pertain to that particular class. All shareholders bear the common expenses of the Fund, earn income from the portfolio, and are allocated any unrealized gains and losses pro rata based on the average daily net assets of each class, without distinction between share classes. Dividends are determined separately for each class based on income and expenses allocable to each class. Realized gains and losses are allocated to each class pro rata based upon the net assets of each class on the date realized. Differences in per share dividend rates generally result from the relative weightings of pro rata income and realized gain allocations and from differences in separate class expenses, including distribution, shareholder servicing, and administration fees.
| | | | |
| 20 | | Wells Fargo Advantage Emerging Markets Local Bond Fund | | Notes to financial statements (unaudited) |
3. FAIR VALUATION MEASUREMENTS
Fair value measurements of investments are determined within a framework that has established a fair value hierarchy based upon the various data inputs utilized in determining the value of the Fund’s investments. The three-level hierarchy gives the highest priority to unadjusted quoted prices in active markets for identical assets or liabilities (Level 1) and the lowest priority to significant unobservable inputs (Level 3). The Fund’s investments are classified within the fair value hierarchy based on the lowest level of input that is significant to the fair value measurement. The inputs are summarized into three broad levels as follows:
| n | | Level 1 – quoted prices in active markets for identical securities |
| n | | Level 2 – other significant observable inputs (including quoted prices for similar securities, interest rates, prepayment speeds, credit risk, use of amortized cost, etc.) |
| n | | Level 3 – significant unobservable inputs (including the Fund’s own assumptions in determining the fair value of investments) |
The inputs or methodologies used for valuing investments in securities are not necessarily an indication of the risk associated with investing in those securities.
As of April 30, 2014, the inputs used in valuing investments in securities were as follows:
| | | | | | | | | | | | | | | | |
| Investments in securities | | Quoted prices (Level 1) | | | Other significant
observable inputs (Level 2) | | | Significant unobservable inputs (Level 3) | | | Total | |
Foreign corporate bonds and notes | | $ | 0 | | | $ | 4,214,017 | | | $ | 0 | | | $ | 4,214,017 | |
Foreign government bonds | | | 0 | | | | 20,336,051 | | | | 0 | | | | 20,336,051 | |
Yankee corporate bonds and notes | | | 0 | | | | 556,826 | | | | 0 | | | | 556,826 | |
Short-term investments | | | | | | | | | | | | | | | | |
Investment companies | | | 1,020,823 | | | | 0 | | | | 0 | | | | 1,020,823 | |
| | | $ | 1,020,823 | | | $ | 25,106,894 | | | $ | 0 | | | $ | 26,127,717 | |
As of April 30, 2014, the inputs used in valuing the Fund’s other financial instruments were as follows:
| | | | | | | | | | | | | | | | |
| | | Quoted prices (Level 1) | | | Other significant
observable inputs (Level 2) | | | Significant unobservable inputs (Level 3) | | | Total | |
Forward foreign currency contracts | | $ | 0 | | | $ | (10,917 | )* | | $ | 0 | | | $ | (10,917 | ) |
| | * | Amount represents the net unrealized losses. |
Transfers in and transfers out are recognized at the end of the reporting period. For the six months ended April 30, 2014, the Fund did not have any transfers into/out of Level 1, Level 2, or Level 3.
4. TRANSACTIONS WITH AFFILIATES AND OTHER EXPENSES
Advisory fee
The Trust has entered into an advisory contract with Funds Management, an indirect wholly owned subsidiary of Wells Fargo & Company (“Wells Fargo”). The adviser is responsible for implementing investment policies and guidelines and for supervising the subadviser, who is responsible for day-to-day portfolio management of the Fund.
Pursuant to the contract, Funds Management is entitled to receive an annual advisory fee starting at 0.65% and declining to 0.55% as the average daily net assets of the Fund increase. For the six months ended April 30, 2014, the advisory fee was equivalent to an annual rate of 0.65% of the Fund’s average daily net assets.
Funds Management has retained the services of a subadviser to provide daily portfolio management to the Fund. The fee for subadvisory services is borne by Funds Management. First International Advisors, LLC, an affiliate of Funds Management and an indirect wholly owned subsidiary of Wells Fargo, is the subadviser to the Fund and is entitled to receive a fee from Funds Management at an annual rate starting at 0.45% and declining to 0.30% as the average daily net assets of the Fund increase.
| | | | | | |
| Notes to financial statements (unaudited) | | Wells Fargo Advantage Emerging Markets Local Bond Fund | | | 21 | |
Administration and transfer agent fees
The Trust has entered into an administration agreement with Funds Management. Under this agreement, for providing administrative services, which includes paying fees and expenses for services provided by the transfer agent, sub-transfer agents, omnibus account servicers and record-keepers, Funds Management is entitled to receive from the Fund an annual fund level administration fee starting at 0.05% and declining to 0.03% as the average daily net assets of the Fund increase and a class level administration fee which is calculated based on the average daily net assets of each class as follows:
| | | | |
| | | Class level
administration fee | |
Class A, Class C | | | 0.16 | % |
Administrator Class | | | 0.10 | |
Institutional Class | | | 0.08 | |
Funds Management has contractually waived and/or reimbursed advisory and administration fees to the extent necessary to maintain certain net operating expense ratios for the Fund. Waiver of fees and/or reimbursement of expenses by Funds Management were made first from fund level expenses on a proportionate basis and then from class specific expenses. Funds Management has committed through February 28, 2015 to waive fees and/or reimburse expenses to the extent necessary to cap the Fund’s expenses at 1.23% for Class A shares, 1.98% for Class C shares, 1.10% for Administrator Class shares, and 0.90 % for Institutional Class shares.
Distribution fees
The Trust has adopted a Distribution Plan for Class C shares of the Fund pursuant to Rule 12b-1 under the 1940 Act. Distribution fees are charged to Class C shares and paid to Wells Fargo Funds Distributor, LLC, the principal underwriter, at an annual rate of 0.75% of the average daily net assets of Class C shares.
For the six months ended April 30, 2014, Wells Fargo Funds Distributor, LLC received $98 from the sale of Class A shares.
Shareholder servicing fees
The Trust has entered into contracts with one or more shareholder servicing agents, whereby Class A, Class C, and Administrator Class of the Fund is charged a fee at an annual rate of 0.25% of the average daily net assets of each respective class.
A portion of these total shareholder servicing fees were paid to affiliates of Wells Fargo.
5. INVESTMENT PORTFOLIO TRANSACTIONS
Purchases and sales of investments, excluding U.S. government obligations (if any) and short-term securities, for the six months ended April 30, 2014 were $9,858,816 and $9,383,623, respectively.
6. DERIVATIVE TRANSACTIONS
During the six months ended April 30, 2014, the Fund entered into forward foreign currency contracts for economic hedging purposes.
At April 30, 2014, the Fund had forward foreign currency contracts outstanding as follows:
Forward foreign currency contracts to buy:
| | | | | | | | | | | | | | | | | | |
| Exchange date | | Counterparty | | Contracts to
receive | | | U.S. value at April 30, 2014 | | | In exchange
for U.S. $ | | | Unrealized
gains
(losses) | |
| 5-20-2014 | | State Street Bank | | | 4,230,000 MYR | | | $ | 1,293,980 | | | $ | 1,275,441 | | | $ | 18,539 | |
| 5-27-2014 | | State Street Bank | | | 2,585,000 MXN | | | | 197,236 | | | | 193,570 | | | | 3,666 | |
| 5-27-2014 | | State Street Bank | | | 133,000,000 HUF | | | | 600,843 | | | | 587,456 | | | | 13,387 | |
| 6-6-2014 | | State Street Bank | | | 87,400,000 HUF | | | | 394,627 | | | | 393,256 | | | | 1,371 | |
| 6-9-2014 | | State Street Bank | | | 2,900,000 PLN | | | | 955,704 | | | | 945,272 | | | | 10,432 | |
| 6-11-2014 | | State Street Bank | | | 1,710,000 MYR | | | | 522,265 | | | | 528,104 | | | | (5,839 | ) |
| 6-11-2014 | | State Street Bank | | | 4,775,000 ZAR | | | | 451,221 | | | | 442,468 | | | | 8,753 | |
| 6-30-2014 | | State Street Bank | | | 150,000 TRY | | | | 69,961 | | | | 69,838 | | | | 123 | |
| 7-10-2014 | | State Street Bank | | | 12,500,000 RUB | | | | 344,834 | | | | 344,448 | | | | 386 | |
| 7-10-2014 | | State Street Bank | | | 5,025,000 RUB | | | | 138,623 | | | | 137,108 | | | | 1,515 | |
| | | | |
| 22 | | Wells Fargo Advantage Emerging Markets Local Bond Fund | | Notes to financial statements (unaudited) |
Forward foreign currency contracts to sell:
| | | | | | | | | | | | | | | | | | |
| Exchange date | | Counterparty | | Contracts to deliver | | | U.S. value at April 30, 2014 | | | In exchange for U.S. $ | | | Unrealized
losses | |
| 5-20-2014 | | State Street Bank | | | 4,230,000 MYR | | | $ | 1,293,980 | | | $ | 1,284,660 | | | $ | (9,320 | ) |
| 5-27-2014 | | State Street Bank | | | 133,000,000 HUF | | | | 600,843 | | | | 577,209 | | | | (23,634 | ) |
| 5-27-2014 | | State Street Bank | | | 2,585,000 MXN | | | | 197,236 | | | | 193,587 | | | | (3,649 | ) |
| 6-9-2014 | | State Street Bank | | | 1,300,000 PLN | | | | 428,419 | | | | 423,349 | | | | (5,070 | ) |
| 6-11-2014 | | State Street Bank | | | 4,775,000 ZAR | | | | 451,221 | | | | 437,532 | | | | (13,689 | ) |
| 6-30-2014 | | State Street Bank | | | 1,670,000 ZAR | | | | 157,320 | | | | 155,207 | | | | (2,113 | ) |
| 6-30-2014 | | State Street Bank | | | 445,000 TRY | | | | 207,552 | | | | 205,097 | | | | (2,455 | ) |
| 7-10-2014 | | State Street Bank | | | 17,525,000 RUB | | | | 483,457 | | | | 480,137 | | | | (3,320 | ) |
The Fund had average contract amounts of $3,231,153 and $2,843,206 in forward foreign currency contracts to buy and forward foreign currency contracts to sell, respectively, during the six months ended April 30, 2014.
The fair value, realized gains or losses and change in unrealized gains or losses, if any, on derivative instruments are reflected in the appropriate financial statements.
For certain types of derivative transactions, the Fund has entered into International Swaps and Derivatives Association, Inc. master agreements (“ISDA Master Agreements”) or similar agreements with approved counterparties. The ISDA Master Agreements or similar agreements may have requirements to deliver/deposit securities or cash to/with an exchange or broker-dealer as collateral and allows the Fund to offset, with each counterparty, certain derivative financial instrument’s assets and/or liabilities with collateral held or pledged. Collateral requirements differ by type of derivative. Collateral or margin requirements are set by the broker or exchange clearing house for exchange traded derivatives while collateral terms are contract specific for over-the-counter traded derivatives. Cash collateral that has been pledged to cover obligations of the Fund under the ISDA Master Agreements or similar agreements, if any, will be reported separately in the Statement of Assets and Liabilities. Securities pledged as collateral, if any, for the same purpose are noted in the Summary Portfolio of Investments. With respect to balance sheet offsetting, absent an event of default by the counterparty or a termination of the agreement, the reported amounts of financial assets and financial liabilities in the Statement of Assets and Liabilities are not offset across transactions between the Fund and the applicable counterparty. A reconciliation of the gross amounts on the Statement of Assets and Liabilities to the net amounts by derivative type, including any collateral exposure, is as follows:
| | | | | | | | | | | | | | | | |
| Derivative type | | Counterparty | | Gross amounts
of assets in the
Statement of
Assets and
Liabilities | | Amounts
subject to
netting
agreements | | | Collateral
received | | | Net
amount
of assets | |
Forward foreign currency contracts | | State Street Bank | | $58,172* | | $ | (58,172 | ) | | $ | 0 | | | $ | 0 | |
| | * | Amount represents net unrealized gains. |
| | | | | | | | | | | | | | | | |
| Derivative type | | Counterparty | | Gross amounts
of liabilities in the Statement of
Assets and
Liabilities | | Amounts
subject to
netting
agreements | | | Collateral
pledged | | | Net
amount
of liabilities | |
Forward foreign currency contracts | | State Street Bank | | $69,089** | | $ | (58,172 | ) | | $ | 0 | | | $ | 10,917 | |
| | ** | Amount represents net unrealized losses. |
7. BANK BORROWINGS
The Trust (excluding the money market funds and certain other funds in the Trust) and Wells Fargo Variable Trust are parties to a $150,000,000 revolving credit agreement with State Street Bank and Trust Company, whereby the Fund is permitted to use bank borrowings for temporary or emergency purposes, such as to fund shareholder redemption requests. Interest under the credit agreement is charged to the Fund based on a borrowing rate equal to the higher of the Federal Funds rate in effect on that day plus 1.25% or the overnight LIBOR rate in effect on that day plus 1.25%. In addition, an annual commitment fee equal to 0.10% of the unused balance is allocated to each participating fund. For the six months ended April 30, 2014, the Fund paid $13 in commitment fees.
| | | | | | |
| Notes to financial statements (unaudited) | | Wells Fargo Advantage Emerging Markets Local Bond Fund | | | 23 | |
For the six months ended April 30, 2014, there were no borrowings by the Fund under the agreement.
8. INDEMNIFICATION
Under the Trust’s organizational documents, the officers and Trustees are indemnified against certain liabilities that may arise out of performance of their duties to the Trust. Additionally, in the normal course of business, the Trust may enter into contracts with service providers that contain a variety of indemnification clauses. The Trust’s maximum exposure under these arrangements is dependent on future claims that may be made against the Fund and, therefore, cannot be estimated.
| | | | |
| 24 | | Wells Fargo Advantage Emerging Markets Local Bond Fund | | Other information (unaudited) |
PROXY VOTING INFORMATION
A description of the policies and procedures that the Fund uses to determine how to vote proxies relating to portfolio securities is available without charge, upon request, by calling 1-800-222-8222, visiting our website at wellsfargoadvantagefunds.com, or visiting the SEC website at sec.gov. Information regarding how the Fund voted proxies relating to portfolio securities during the most recent 12-month period ended June 30 is available without charge on the Fund’s website at wellsfargoadvantagefunds.com or by visiting the SEC website at sec.gov.
PORTFOLIO HOLDINGS INFORMATION
The complete portfolio holdings for the Fund are publicly available on the Fund’s website (wellsfargoadvantagefunds.com) on a monthly, 30-day or more delayed basis. In addition, top ten holdings information for the Fund is publicly available on the Fund’s website on a monthly, seven-day or more delayed basis. The Fund files its complete schedule of portfolio holdings with the SEC for the first and third quarters of each fiscal year on Form N-Q, which is available without charge by visiting the SEC website at sec.gov. In addition, the Fund’s Form N-Q may be reviewed and copied at the SEC’s Public Reference Room in Washington, DC, and at regional offices in New York City, at 233 Broadway, and in Chicago, at 175 West Jackson Boulevard, Suite 900. Information about the Public Reference Room may be obtained by calling 1-800-SEC-0330.
| | | | | | |
| Other information (unaudited) | | Wells Fargo Advantage Emerging Markets Local Bond Fund | | | 25 | |
BOARD OF TRUSTEES AND OFFICERS
Each of the Trustees and Officers1 listed in the table below acts in identical capacities for each fund in the Wells Fargo Advantage family of funds, which consists of 132 mutual funds comprising the Wells Fargo Funds Trust, Wells Fargo Variable Trust, Wells Fargo Master Trust and four closed-end funds (collectively the “Fund Complex”). This table should be read in conjunction with the Prospectus and the Statement of Additional Information2. All of the Trustees are also Members of the Audit and Governance Committees of each Trust in the Fund Complex. The mailing address of each Trustee and Officer is 525 Market Street, 12th Floor, San Francisco, CA 94105. Each Trustee and Officer serves an indefinite term, however, each Trustee serves such term until reaching the mandatory retirement age established by the Trustees.
Independent Trustees
| | | | | | |
Name and year of birth | | Position held and length of service* | | Principal occupations during past five years | | Other directorships during past five years |
Peter G. Gordon
(Born 1942) | | Trustee, since 1998; Chairman, since 2005 | | Co-Founder, Retired Chairman, President and CEO of Crystal Geyser Water Company. Trustee Emeritus, Colby College. | | Asset Allocation Trust |
Isaiah Harris, Jr.
(Born 1952) | | Trustee, since 2009 | | Retired. Prior thereto, President and CEO of BellSouth Advertising and Publishing Corp. from 2005 to 2007, President and CEO of BellSouth Enterprises from 2004 to 2005 and President of BellSouth Consumer Services from 2000 to 2003. Emeritus member of the Iowa State University Foundation Board of Governors. Emeritus Member of the Advisory Board of Iowa State University School of Business. Advisory Board Member, Palm Harbor Academy (charter school). Mr. Harris is a certified public accountant. | | CIGNA Corporation; Deluxe Corporation; Asset Allocation Trust |
Judith M. Johnson
(Born 1949) | | Trustee, since 2008;
Audit Committee Chairman, since 2008 | | Retired. Prior thereto, Chief Executive Officer and Chief Investment Officer of Minneapolis Employees Retirement Fund from 1996 to 2008. Ms. Johnson is an attorney, certified public accountant and a certified managerial accountant. | | Asset Allocation Trust |
Leroy Keith, Jr.
(Born 1939) | | Trustee, since 2010 | | Chairman, Bloc Global Services (development and construction). Trustee of the Evergreen Funds from 1983 to 2010. Former Managing Director, Almanac Capital Management (commodities firm), former Partner, Stonington Partners, Inc. (private equity fund), former Director, Obagi Medical Products Co. and former Director, Lincoln Educational Services. | | Trustee, Virtus Fund Complex (consisting of 50 portfolios as of 12/16/2013); Asset Allocation Trust |
David F. Larcker
(Born 1950) | | Trustee, since 2009 | | James Irvin Miller Professor of Accounting at the Graduate School of Business, Stanford University, Morgan Stanley Director of the Center for Leadership Development and Research and Senior Faculty of The Rock Center for Corporate Governance since 2006. From 2005 to 2008, Professor of Accounting at the Graduate School of Business, Stanford University. Prior thereto, Ernst & Young Professor of Accounting at The Wharton School, University of Pennsylvania from 1985 to 2005. | | Asset Allocation Trust |
Olivia S. Mitchell
(Born 1953) | | Trustee, since 2006 | | International Foundation of Employee Benefit Plans Professor, Wharton School of the University of Pennsylvania since 1993. Director of Wharton’s Pension Research Council and Boettner Center on Pensions & Retirement Research, and Research Associate at the National Bureau of Economic Research. Previously, Cornell University Professor from 1978 to 1993. | | Asset Allocation Trust |
Timothy J. Penny
(Born 1951) | | Trustee, since 1996 | | President and CEO of Southern Minnesota Initiative Foundation, a non-profit organization, since 2007 and Senior Fellow at the Humphrey Institute Policy Forum at the University of Minnesota since 1995. Member of the Board of Trustees of NorthStar Education Finance, Inc., a non-profit organization, since 2007. | | Asset Allocation Trust |
| | | | |
| 26 | | Wells Fargo Advantage Emerging Markets Local Bond Fund | | Other information (unaudited) |
| | | | | | |
Name and year of birth | | Position held and length of service* | | Principal occupations during past five years | | Other directorships during past five years |
Michael S. Scofield (Born 1943) | | Trustee, since 2010 | | Served on the Investment Company Institute’s Board of Governors and Executive Committee from 2008-2011 as well the Governing Council of the Independent Directors Council from 2006-2011 and the Independent Directors Council Executive Committee from 2008-2011. Chairman of the IDC from 2008-2010. Institutional Investor (Fund Directions) Trustee of Year in 2007. Trustee of the Evergreen Funds (and its predecessors) from 1984 to 2010. Chairman of the Evergreen Funds from 2000-2010. Former Trustee of the Mentor Funds. Retired Attorney, Law Offices of Michael S. Scofield. | | Asset Allocation Trust |
Donald C. Willeke (Born 1940) | | Trustee, since 1996 | | Principal of the law firm of Willeke & Daniels. General Counsel of the Minneapolis Employees Retirement Fund from 1984 until its consolidation into the Minnesota Public Employees Retirement Association on June 30, 2010. Director and Vice Chair of The Tree Trust (non-profit corporation). Director of the American Chestnut Foundation (non-profit corporation). | | Asset Allocation Trust |
| * | Length of service dates reflect the Trustee’s commencement of service with the Trust’s predecessor entities, where applicable. |
Officers
| | | | | | |
Name and year of birth | | Position held and length of service | | Principal occupations during past five years | | |
Karla M. Rabusch (Born 1959) | | President, since 2003 | | Executive Vice President of Wells Fargo Bank, N.A. and President of Wells Fargo Funds Management, LLC since 2003. | | |
Nancy Wiser1 (Born 1967) | | Treasurer, since 2012 | | Executive Vice President of Wells Fargo Funds Management, LLC since 2011. Chief Operating Officer and Chief Compliance Officer at LightBox Capital Management LLC, from 2008 to 2011. Owned and operated a consulting business providing services to various hedge funds including acting as Chief Operating Officer and Chief Compliance Officer for a hedge fund from 2007 to 2008. Chief Operating Officer and Chief Compliance Officer of GMN Capital LLC from 2006 to 2007. | | |
C. David Messman (Born 1960) | | Secretary, since 2000; Chief Legal Officer, since 2003 | | Senior Vice President and Secretary of Wells Fargo Funds Management, LLC since 2001. Vice President and Managing Counsel of Wells Fargo Bank, N.A. since 1996. | | |
Debra Ann Early (Born 1964) | | Chief Compliance Officer, since 2007 | | Chief Compliance Officer of Wells Fargo Funds Management, LLC since 2007. Chief Compliance Officer of Parnassus Investments from 2005 to 2007. Chief Financial Officer of Parnassus Investments from 2004 to 2007. | | |
David Berardi (Born 1975) | | Assistant Treasurer, since 2009 | | Vice President of Wells Fargo Funds Management, LLC since 2009. Vice President of Evergreen Investment Management Company, LLC from 2008 to 2010. Assistant Vice President of Evergreen Investment Services, Inc. from 2004 to 2008. Manager of Fund Reporting and Control for Evergreen Investment Management Company, LLC from 2004 to 2010. | | |
Jeremy DePalma1 (Born 1974) | | Assistant Treasurer, since 2009 | | Senior Vice President of Wells Fargo Funds Management, LLC since 2009. Senior Vice President of Evergreen Investment Management Company, LLC from 2008 to 2010. Vice President, Evergreen Investment Services, Inc. from 2004 to 2007. Head of the Fund Reporting and Control Team within Fund Administration from 2005 to 2010. | | |
| 1. | Nancy Wiser acts as Treasurer of 73 funds in the Fund Complex. Jeremy DePalma acts as Treasurer of 59 funds and Assistant Treasurer of 73 funds in the Fund Complex. |
| 2. | The Statement of Additional Information includes additional information about the Trustees and is available, without charge, upon request, by calling 1-800-222-8222 or by visiting the website at wellsfargoadvantagefunds.com. |
| | | | | | |
| Other information (unaudited) | | Wells Fargo Advantage Emerging Markets Local Bond Fund | | | 27 | |
BOARD CONSIDERATION OF INVESTMENT ADVISORY AND SUB-ADVISORY AGREEMENTS:
Under Section 15 of the Investment Company Act of 1940 (the “1940 Act”), the Board of Trustees (the “Board”) of Wells Fargo Funds Trust (the “Trust”), all the members of which have no direct or indirect interest in the investment advisory and sub-advisory agreements and are not “interested persons” of the Trust, as defined in the 1940 Act (the “Independent Trustees”), must determine whether to approve the continuation of the Trust’s investment advisory and sub-advisory agreements. In this regard, at an in-person meeting held on March 27-28, 2014 (the “Meeting”), the Board reviewed: (i) an investment advisory agreement with Wells Fargo Funds Management, LLC (“Funds Management”) for Wells Fargo Advantage Emerging Markets Local Bond Fund (the “Fund”) and (ii) an investment sub-advisory agreement with First International Advisors, LLC (the “Sub-Adviser”), an affiliate of Funds Management, for the Fund. The investment advisory agreement with Funds Management and the investment sub-advisory agreement with the Sub-Adviser are collectively referred to as the “Advisory Agreements.”
At the Meeting, the Board considered the factors and reached the conclusions described below relating to the selection of Funds Management and the Sub-Adviser and the continuation of the Advisory Agreements. Prior to the Meeting, the Trustees conferred extensively among themselves and with representatives of Funds Management about these matters. Also, the Board has adopted a team-based approach, with each team consisting of a sub-set of Trustees, to assist the full Board in the discharge of its duties in reviewing performance and other matters throughout the year. The Independent Trustees were assisted in their evaluation of the Advisory Agreements by independent legal counsel, from whom they received separate legal advice and with whom they met separately.
In providing information to the Board, Funds Management and the Sub-Adviser were guided by a detailed set of requests for information submitted to them by independent legal counsel on behalf of the Independent Trustees at the start of the Board’s annual contract renewal process earlier in 2014. In considering and approving the Advisory Agreements, the Trustees considered the information they believed relevant, including but not limited to the information discussed below. The Board considered not only the specific information presented in connection with the Meeting, but also the knowledge gained over time through interaction with Funds Management and the Sub-Adviser about various topics. In this regard, the Board reviewed reports of Funds Management at each of its quarterly meetings, which included, among other things, portfolio reviews and performance reports. In addition, the Board and the teams mentioned above confer with portfolio managers at various times throughout the year. The Board did not identify any particular information or consideration that was all-important or controlling, and each individual Trustee may have attributed different weights to various factors.
After its deliberations, the Board unanimously approved the continuation of the Advisory Agreements and determined that the compensation payable to Funds Management and the Sub-Adviser is reasonable. The Board considered the continuation of the Advisory Agreements for the Fund as part of its consideration of the continuation of advisory agreements for funds across the complex, but its approvals were made on a fund-by-fund basis. The following summarizes a number of important, but not necessarily all, factors considered by the Board in support of its approvals.
Nature, extent and quality of services
The Board received and considered various information regarding the nature, extent and quality of services provided to the Fund by Funds Management and the Sub-Adviser under the Advisory Agreements. This information included, among other things, a summary of the background and experience of senior management of Funds Management, and the qualifications, background, tenure and responsibilities of each of the portfolio managers primarily responsible for the day-to-day portfolio management of the Fund.
The Board evaluated the ability of Funds Management and the Sub-Adviser to attract and retain qualified investment professionals, including research, advisory and supervisory personnel. The Board further considered the compliance programs and compliance records of Funds Management and the Sub-Adviser. In addition, the Board took into account the full range of services provided to the Fund by Funds Management and its affiliates.
Fund performance and expenses
The Board considered the performance results for the Fund over various time periods ended December 31, 2013. The Board also considered these results in comparison to the performance of funds in a universe that was determined by Lipper Inc. (“Lipper”) to be similar to the Fund (the “Universe”), and in comparison to the Fund’s benchmark index and to other comparative data. Lipper is an independent provider of investment company data. The Board received a description of the methodology used by Lipper to select the mutual funds in the performance Universe. The Board noted that the performance of the Fund (Administrator Class) was lower than the average performance of the Universe for the one-year period under review. The Board also noted that the performance of the Fund was lower than its benchmark, the JPMorgan Government Bond Index Emerging Markets Global Diversified Composite Index, for the one-year period under review.
| | | | |
| 28 | | Wells Fargo Advantage Emerging Markets Local Bond Fund | | Other information (unaudited) |
The Board received an analysis of, and discussed factors contributing to, the underperformance of the Fund relative to the Universe and its benchmark for the one-year period under review. Funds Management advised the Board about the market conditions and investment decisions that it believed contributed to the underperformance. The Board noted the limited time period of performance to review and noted that it would continue to monitor the performance of the Fund.
The Board also received and considered information regarding the Fund’s net operating expense ratios and their various components, including actual management fees (which reflect fee waivers, if any, and include advisory, administration and transfer agent fees), custodian and other non-management fees, Rule 12b-1 and non-Rule 12b-1 service fees and fee waiver and expense reimbursement arrangements. The Board considered these ratios in comparison to the median ratios of funds in class-specific expense groups that were determined by Lipper to be similar to the Fund (the “Groups”). The Board received a description of the methodology used by Lipper to select the mutual funds in the expense Groups and an explanation of year-to-year variations in the funds comprising such expense Groups and their expense ratios. Based on the Lipper reports, the Board noted that the net operating expense ratios of the Fund were lower than or in range of the median net operating expense ratios of the expense Groups.
Based on its consideration of the factors and information it deemed relevant, including those described here, the Board concluded that the overall performance and expense structure of the Fund supported the re-approval of the Advisory Agreements.
Investment advisory and sub-advisory fee rates
The Board reviewed and considered the contractual investment advisory fee rates that are payable by the Fund to Funds Management for investment advisory services (the “Advisory Agreement Rates”), both on a stand-alone basis and on a combined basis with the Fund’s fund-level and class-level contractual administration fee rates (the “Management Rates”). The Board noted that the administration fees payable to Funds Management include transfer agency and sub-transfer agency costs. The Board also reviewed and considered the contractual investment sub-advisory fee rates that are payable by Funds Management to the Sub-Adviser for investment sub-advisory services (the “Sub-Advisory Agreement Rates”).
Among other information reviewed by the Board was a comparison of the Management Rates of the Fund with those of other funds in the expense Groups at a common asset level. The Board noted that the Management Rates of the Fund were in range of the average rates for the Fund’s expense Groups for all share classes.
The Board also received and considered information about the portion of the total advisory fee that was retained by Funds Management after payment of the fee to the Sub-Adviser for sub-advisory services. In assessing the reasonableness of this amount, the Board received and evaluated information about the nature and extent of responsibilities retained and risks assumed by Funds Management and not delegated to or assumed by the Sub-Adviser, and about Funds Management’s on-going oversight services. However, given the affiliation between Funds Management and the Sub-Adviser, the Board ascribed limited relevance to the allocation of the advisory fee between them.
The Board also received and considered information about the nature and extent of services offered and fee rates charged by Funds Management and the Sub-Adviser to other types of clients with investment strategies similar to those of the Fund. In this regard, the Board received information about the significantly greater scope of services, and compliance, reporting and other legal burdens and risks of managing mutual funds compared with those associated with managing assets of non-mutual fund clients such as collective funds or institutional separate accounts.
Based on its consideration of the factors and information it deemed relevant, including those described here, the Board determined that the Advisory Agreement Rates and the Sub-Advisory Agreement Rates were reasonable in light of the services covered by the Advisory Agreements.
Profitability
The Board received and considered information concerning the profitability of Funds Management, as well as the profitability of Wells Fargo as a whole, from providing services to the Fund and the fund family as a whole. The Board did not receive or consider to be necessary separate profitability information with respect to the Sub-Adviser, because its profitability information was subsumed in the collective Wells Fargo profitability analysis.
Funds Management explained the methodologies and estimates that it used in calculating profitability. Among other things, the Board noted that the levels of profitability reported on a fund-by-fund basis varied widely, depending on factors such as the size and type of fund. Based on its review, the Board did not deem the profits reported by Funds Management to be at a level that would prevent it from approving the continuation of the Advisory Agreements.
Economies of scale
With respect to possible economies of scale, the Board noted the existence of breakpoints in the Fund’s advisory fee and administration fee structure, which operate generally to reduce the Fund’s expense ratios as the Fund grows in size. It
| | | | | | |
| Other information (unaudited) | | Wells Fargo Advantage Emerging Markets Local Bond Fund | | | 29 | |
considered that, for a small fund or a fund that shrinks in size, breakpoints conversely can result in higher fee levels. The Board also considered that fee waiver and expense reimbursement arrangements and competitive fee rates at the outset are means of sharing potential economies of scale with shareholders of the Fund and the fund family as a whole. The Board considered Funds Management’s view that any analyses of potential economies of scale in managing a particular fund are inherently limited in light of the joint and common costs and investments that Funds Management incurs across the fund family as a whole.
The Board concluded that the Fund’s fee and expense arrangements, including contractual breakpoints, constituted a reasonable approach to sharing potential economies of scale with the Fund and its shareholders.
Other benefits to Funds Management and the Sub-Adviser
The Board received and considered information regarding potential “fall-out” or ancillary benefits received by Funds Management and its affiliates, including the Sub-Adviser, as a result of their relationships with the Fund. Ancillary benefits could include, among others, benefits directly attributable to other relationships with the Fund and benefits potentially derived from an increase in Funds Management’s and the Sub-Adviser’s business as a result of their relationships with the Fund. The Board noted that various affiliates of Funds Management may receive distribution-related fees, shareholder servicing payments and sub-transfer agency fees in respect of shares sold or held through them and services provided.
The Board also reviewed information about soft dollar credits earned and utilized by the Sub-Adviser, fees earned by Funds Management and the Sub-Adviser from managing a private investment vehicle for the fund family’s securities lending collateral and commissions earned by an affiliated broker from portfolio transactions.
Based on its consideration of the factors and information it deemed relevant, including those described here, the Board did not find that any ancillary benefits received by Funds Management and its affiliates, including the Sub-Adviser, were unreasonable.
Conclusion
After considering the above-described factors and based on its deliberations and its evaluation of the information described above, the Board unanimously approved the continuation of the Advisory Agreements for an additional one-year period and determined that the compensation payable to Funds Management and the Sub-Adviser is reasonable.
| | | | |
| 30 | | Wells Fargo Advantage Emerging Markets Local Bond Fund | | List of abbreviations |
The following is a list of common abbreviations for terms and entities that may have appeared in this report.
| ACA | — ACA Financial Guaranty Corporation |
| ADR | — American depositary receipt |
| ADS | — American depositary shares |
| AGC | — Assured Guaranty Corporation |
| AGM | — Assured Guaranty Municipal |
| Ambac | — Ambac Financial Group Incorporated |
| AMT | — Alternative minimum tax |
| BAN | — Bond anticipation notes |
| BHAC | — Berkshire Hathaway Assurance Corporation |
| CAB | — Capital appreciation bond |
| CCAB | — Convertible capital appreciation bond |
| CDA | — Community Development Authority |
| CDO | — Collateralized debt obligation |
| DRIVER | — Derivative inverse tax-exempt receipts |
| DW&P | — Department of Water & Power |
| DWR | — Department of Water Resources |
| ECFA | — Educational & Cultural Facilities Authority |
| EDA | — Economic Development Authority |
| EDFA | — Economic Development Finance Authority |
| ETF | — Exchange-traded fund |
| FDIC | — Federal Deposit Insurance Corporation |
| FFCB | — Federal Farm Credit Banks |
| FGIC | — Financial Guaranty Insurance Corporation |
| FHA | — Federal Housing Administration |
| FHLB | — Federal Home Loan Bank |
| FHLMC | — Federal Home Loan Mortgage Corporation |
| FICO | — The Financing Corporation |
| FNMA | — Federal National Mortgage Association |
| GDR | — Global depositary receipt |
| GNMA | — Government National Mortgage Association |
| HCFR | — Healthcare facilities revenue |
| HEFA | — Health & Educational Facilities Authority |
| HEFAR | — Higher education facilities authority revenue |
| HFA | — Housing Finance Authority |
| HFFA | — Health Facilities Financing Authority |
| HUD | — Department of Housing and Urban Development |
| IDA | — Industrial Development Authority |
| IDAG | — Industrial Development Agency |
| KRW | — Republic of Korea won |
| LIBOR | — London Interbank Offered Rate |
| LLC | — Limited liability company |
| LLLP | — Limited liability limited partnership |
| LLP | — Limited liability partnership |
| MBIA | — Municipal Bond Insurance Association |
| MFHR | — Multifamily housing revenue |
| MSTR | — Municipal securities trust receipts |
| MUD | — Municipal Utility District |
| National | — National Public Finance Guarantee Corporation |
| PCFA | — Pollution Control Financing Authority |
| PCL | — Public Company Limited |
| PCR | — Pollution control revenue |
| PFA | — Public Finance Authority |
| PFFA | — Public Facilities Financing Authority |
| PFOTER | — Puttable floating option tax-exempt receipts |
| plc | — Public limited company |
| PUTTER | — Puttable tax-exempt receipts |
| R&D | — Research & development |
| Radian | — Radian Asset Assurance |
| RAN | — Revenue anticipation notes |
| RDA | — Redevelopment Authority |
| RDFA | — Redevelopment Finance Authority |
| REIT | — Real estate investment trust |
| ROC | — Reset option certificates |
| SAVRS | — Select auction variable rate securities |
| SBA | — Small Business Authority |
| SFHR | — Single-family housing revenue |
| SFMR | — Single-family mortgage revenue |
| SPA | — Standby purchase agreement |
| SPDR | — Standard & Poor’s Depositary Receipts |
| STRIPS | — Separate trading of registered interest and |
| TAN | — Tax anticipation notes |
| TIPS | — Treasury inflation-protected securities |
| TRAN | — Tax revenue anticipation notes |
| TTFA | — Transportation Trust Fund Authority |
| TVA | — Tennessee Valley Authority |
This page is intentionally left blank.
This page is intentionally left blank.


For more information
More information about Wells Fargo Advantage Funds is available free upon request. To obtain literature, please write, email, visit the Fund’s website, or call:
Wells Fargo Advantage Funds
P.O. Box 8266
Boston, MA 02266-8266
Email: wfaf@wellsfargo.com
Website: wellsfargoadvantagefunds.com
Individual investors: 1-800-222-8222
Retail investment professionals: 1-888-877-9275
Institutional investment professionals: 1-866-765-0778
This report and the financial statements contained herein are submitted for the general information of the shareholders of Wells Fargo Advantage Funds. If this report is used for promotional purposes, distribution of the report must be accompanied or preceded by a current prospectus. Before investing, please consider the investment objectives, risks, charges, and expenses of the investment. For a current prospectus and, if available, a summary prospectus, containing this information, call 1-800-222-8222 or visit the Fund’s website at wellsfargoadvantagefunds.com. Read the prospectus carefully before you invest or send money.
Wells Fargo Funds Management, LLC, a wholly owned subsidiary of Wells Fargo & Company, provides investment advisory and administrative services for Wells Fargo Advantage Funds. Other affiliates of Wells Fargo & Company provide subadvisory and other services for the Funds. The Funds are distributed by Wells Fargo Funds Distributor, LLC, Member FINRA/SIPC, an affiliate of Wells Fargo & Company.
NOT FDIC INSURED ¡ NO BANK GUARANTEE ¡ MAY LOSE VALUE
© 2014 Wells Fargo Funds Management, LLC. All rights reserved.
| | |
 | | 225162 06-14 SA261/SAR261 04-14 |

Wells Fargo Advantage
International Bond Fund

Semi-Annual Report
April 30, 2014

Reduce clutter. Save trees.
Sign up for electronic delivery of prospectuses and shareholder reports at wellsfargo.com/advantagedelivery
Contents
The views expressed and any forward-looking statements are as of April 30, 2014, unless otherwise noted, and are those of the Fund managers and/or Wells Fargo Funds Management, LLC. Discussions of individual securities, or the markets generally, or any Wells Fargo Advantage Fund are not intended as individual recommendations. Future events or results may vary significantly from those expressed in any forward-looking statements; the views expressed are subject to change at any time in response to changing circumstances in the market. Wells Fargo Funds Management, LLC and the Fund disclaim any obligation to publicly update or revise any views expressed or forward-looking statements.
NOT FDIC INSURED ¡ NO BANK GUARANTEE ¡ MAY LOSE VALUE
| | | | |
| 2 | | Wells Fargo Advantage International Bond Fund | | Letter to shareholders (unaudited) |

Karla M. Rabusch
President
Wells Fargo Advantage Funds
Global bond markets broadly rallied during the period, as low growth and low inflation expectations appeared to drive yields lower and longer-term bond prices higher, particularly in the opening months of 2014. High-yield and emerging markets debt sectors performed best, while currency markets were mixed.
Dear Valued Shareholder:
We are pleased to offer you this semi-annual report for the Wells Fargo Advantage International Bond Fund for the six-month period that ended April 30, 2014. Global bond markets broadly rallied during the period, as low growth and low inflation expectations appeared to drive yields lower and longer-term bond prices higher, particularly in the opening months of 2014. High-yield and emerging markets debt sectors performed best, while currency markets were mixed. The U.S. high-yield bond market (measured by the Barclays U.S. Corporate High Yield Index1) provided relatively strong fixed-income returns during the period, outpacing returns from the investment-grade corporate bond markets (measured by the Barclays Corporate Bond Index2) and U.S. Treasuries (measured by the Barclays U.S. Treasury Index3). U.S. mortgage-backed securities (MBS), commercial mortgage-backed securities (CMBS), and corporate bonds generated positive returns. On the whole, fixed-income markets across the globe notably rallied over the first four months of 2014, rebounding nicely from some challenging price corrections during 2013. In general, the corporate bond sector—notably, high-yield corporate bonds—was the best across all global markets, while sovereign debt issuances generally lagged behind.
At the end of 2013, currency markets were volatile while bond markets staged a recovery.
Global currency markets were mixed during the final months of 2013, with strength in eastern European currencies but weakness in Australian and Brazilian currencies. The most significant event during these waning months of 2013 was a continued sharp decline in the value of the Japanese yen. Bond markets of the smaller global economies continued to outperform the bond markets of the largest economies, while the strong demand for income across global bond markets continued to support higher-yield securities, such as corporate bonds and structured products (for example, MBS).
Simultaneously, the U.S. high-yield bond market continued to rally, building on positive gains from the previous months. Yield spreads continued to tighten significantly across the board, while U.S. Treasury yields ratcheted higher, most notably in maturities of five years and longer. Lower-rated credit tiers outperformed each respectively higher-rated credit tier, while the high-yield default rate remained historically low as refinancing levels declined modestly with rate increases but net new issuance remained strong. The rise in U.S. Treasury yields pressured security prices across the U.S. investment-grade bond markets. The corporate bond and CMBS sectors provided positive returns. By contrast, U.S. Treasuries declined in value and residential MBS had negative returns as mortgage rates shifted higher.
International and U.S. fixed-income markets rallied strongly over the first four months of 2014.
Global bond markets broadly rallied during the opening months of 2014, as low growth and low inflation expectations appeared to drive yields lower and longer-term
| 1. | The Barclays U.S. Corporate High Yield Index is an unmanaged, U.S. dollar-denominated, nonconvertible, non-investment-grade debt index. The index consists of domestic and corporate bonds rated Ba and below with a minimum outstanding amount of $150 million. You cannot invest directly in an index. |
| 2. | The Barclays Corporate Bond Index is an unmanaged market-value-weighted index of investment-grade corporate fixed-rate debt issues with maturities of one year or more. You cannot invest directly in an index. |
| 3. | The Barclays U.S. Treasury Index is an unmanaged index of prices of U.S. Treasury bonds with maturities of 1 to 30 years. You cannot invest directly in an index. |
| | | | | | |
| Letter to shareholders (unaudited) | | Wells Fargo Advantage International Bond Fund | | | 3 | |
bond prices higher. Global high-yield and emerging markets debt sectors performed best during February and March 2014. After a volatile January 2014, which saw yields and risk move higher in smaller economic regions, markets recovered in February 2014, carrying those trends into March and April 2014, which led some smaller bond markets to outperform the major markets during the period. Brazil, Italy, and Spain notably outperformed other countries, while Russia declined in value with the escalating crisis in the Ukraine in March 2014. Currency markets continued to be mixed during the late winter bond market rallies, as the Brazilian real appreciated while the Russian ruble and Polish zloty depreciated. The Japanese yen halted its precipitous decline from the waning months of 2013 and appreciated over the first four months of 2014.
Favorable conditions for U.S. fixed-income markets were restored in the early months of 2014.
Seemingly much to the surprise of many everyday investors and seasoned investment professionals alike, U.S. fixed-income markets (measured by the Barclays U.S. Aggregate Bond Index4) largely outperformed U.S. equity markets (measured by the S&P 500 Index5) during the opening months of 2014. This helped support global bond markets, particularly global corporate bonds. Reassurances from the U.S. Federal Reserve (Fed) that a highly accommodative monetary policy would continue throughout 2014 inspired bond rallies across the globe.
One positive takeaway for bond investors that helped fuel the global fixed-income rallies was former Fed Chairman Ben Bernanke’s guidance at the end of 2013. He indicated that the tapering of the Fed’s bond-buying program would proceed at a slow pace and that a reduction in quantitative easing should not be equivocated with a tightening of monetary policy. The distinction was important—although the bond-buying program was declining in volume, it was, nonetheless, still continuing. In addition, he indicated that the federal funds target rate would remain unchanged for the foreseeable future, with the implication that it would not increase until the bond-buying program was fully disbanded. These were important statements for investors that helped bolster U.S. fixed-income and global bond valuations in the opening months of 2014.
Don’t let short-term uncertainty derail long-term investment goals.
Periods of investment uncertainty can present challenges, but experience has taught us that maintaining long-term investment goals can be an effective way to plan for the future. To help you create a sound strategy based on your personal goals and risk tolerance, Wells Fargo Advantage Funds offers more than 100 mutual funds spanning a wide range of asset classes and investment styles. Although diversification cannot guarantee an investment profit or prevent losses, we believe it can be an effective way to manage investment risk and potentially smooth out overall portfolio performance. We encourage investors to know their
Reassurances from the U.S. Federal Reserve that a highly accommodative monetary policy would continue throughout 2014 inspired bond rallies across the globe.
| 4. | The Barclays U.S. Aggregate Bond Index is a broad-based benchmark that measures the investment-grade, U.S. dollar-denominated, fixed-rate taxable bond market, including Treasuries, government-related and corporate securities, MBS (agency fixed-rate and hybrid ARM passthroughs), ABS, and CMBS. You cannot invest directly in an index. |
| 5. | The S&P 500 Index consists of 500 stocks chosen for market size, liquidity, and industry group representation. It is a market-value-weighted index with each stock’s weight in the index proportionate to its market value. You cannot invest directly in an index. |
| | | | |
| 4 | | Wells Fargo Advantage International Bond Fund | | Letter to shareholders (unaudited) |
investments and to understand that appropriate levels of risk-taking may unlock opportunities.
Thank you for choosing to invest with Wells Fargo Advantage Funds. We appreciate your confidence in us and remain committed to helping you meet your financial needs. For current information about your fund investments, contact your investment professional, visit our website at wellsfargoadvantagefunds.com, or call us directly at 1-800-222-8222. We are available 24 hours a day, 7 days a week.
Sincerely,

Karla M. Rabusch
President
Wells Fargo Advantage Funds
Notice to shareholders
The Fund and Wells Fargo Funds Management, LLC (“Funds Management”) have received an exemptive order from the SEC that permits Funds Management, subject to the approval of the Board of Trustees of the Fund, to select or replace certain subadvisers to manage all or a portion of the Fund’s assets and enter into, amend or terminate a sub-advisory agreement with certain subadvisers without obtaining shareholder approval (“Multi-manager Structure”). The Multi-manager Structure applies to subadvisers that are not affiliated with Funds Management or the Fund, except to the extent that affiliation arises solely because such subadvisers provide sub-advisory services to the Fund (“Non-affiliated Subadvisers”), as well as subadvisers that are indirect or direct wholly-owned subsidiaries of Funds Management or of another company that, indirectly or directly, wholly owns Funds Management (“Wholly-owned Subadvisers”).
Pursuant to the SEC order, Funds Management, with the approval of the Board of Trustees, has the discretion to terminate any subadvisers and allocate and reallocate the Fund’s assets among any other Non-affiliated Subadvisers or Wholly-owned Subadvisers. Funds Management, subject to oversight and supervision by the Board of Trustees, has responsibility to continue to oversee any subadvisers to the Fund and to recommend, for approval by the Board of Trustees, the hiring, termination and replacement of subadvisers for the Fund. In the event that a new subadviser is hired pursuant to the Multi-manager Structure, the Fund is required to provide notice to shareholders within 90 days.
Please contact your investment professional or call us directly at 1-800-222-8222 if you have any questions on this Notice to Shareholders.
This page is intentionally left blank.
| | | | |
| 6 | | Wells Fargo Advantage International Bond Fund | | Performance highlights (unaudited) |
Investment objective
The Fund seeks total return, consisting of income and capital appreciation.
Adviser
Wells Fargo Funds Management, LLC
Subadviser
First International Advisors, LLC
Portfolio managers
Tony Norris
Peter Wilson
Michael Lee
Alex Perrin
Christopher Wightman
Average annual total returns1 (%) as of April 30, 2014
| | | | | | | | | | | | | | | | | | | | | | | | | | | | | | | | | | |
| | | | | Including sales charge | | | Excluding sales charge | | | Expense ratios2 (%) | |
| | | Inception date | | 1 year | | | 5 year | | | 10 year | | | 1 year | | | 5 year | | | 10 year | | | Gross | | | Net3 | |
| Class A (ESIYX) | | 9-30-2003 | | | (4.65 | ) | | | 4.73 | | | | 4.86 | | | | (0.16 | ) | | | 5.71 | | | | 5.35 | | | | 1.05 | | | | 1.03 | |
| Class B (ESIUX)* | | 9-30-2003 | | | (5.69 | ) | | | 4.59 | | | | 4.82 | | | | (0.91 | ) | | | 4.92 | | | | 4.82 | | | | 1.80 | | | | 1.78 | |
| Class C (ESIVX) | | 9-30-2003 | | | (1.90 | ) | | | 4.91 | | | | 4.57 | | | | (0.90 | ) | | | 4.91 | | | | 4.57 | | | | 1.80 | | | | 1.78 | |
| Class R6 (ESIRX) | | 11-30-2012 | | | – | | | | – | | | | – | | | | 0.26 | | | | 6.06 | | | | 5.67 | | | | 0.67 | | | | 0.65 | |
| Administrator Class (ESIDX) | | 7-30-2010 | | | – | | | | – | | | | – | | | | 0.05 | | | | 5.88 | | | | 5.52 | | | | 0.99 | | | | 0.85 | |
| Institutional Class (ESICX) | | 12-15-1993 | | | – | | | | – | | | | – | | | | 0.16 | | | | 6.02 | | | | 5.65 | | | | 0.72 | | | | 0.70 | |
BofA Merrill Lynch Global Broad Market Ex. U.S. Index4 | | – | | | – | | | | – | | | | – | | | | 3.12 | | | | 5.36 | | | | 5.20 | | | | – | | | | – | |
| * | | Class B shares are closed to investment, except in connection with the reinvestment of any distributions and permitted exchanges. |
Figures quoted represent past performance, which is no guarantee of future results, and do not reflect taxes that a shareholder may pay on fund distributions or the redemption of fund shares. Investment return and principal value of an investment will fluctuate so that an investor’s shares, when redeemed, may be worth more or less than their original cost. Performance shown without sales charges would be lower if sales charges were reflected. Current performance may be lower or higher than the performance data quoted, which assumes the reinvestment of dividends and capital gains. Current month-end performance is available on the Fund’s website, wellsfargoadvantagefunds.com.
Index returns do not include transaction costs associated with buying and selling securities, any mutual fund fees or expenses, or any taxes. It is not possible to invest directly in an index.
For Class A shares, the maximum front-end sales charge is 4.50%. For Class B shares, the maximum contingent deferred sales charge is 5.00%. For Class C shares, the maximum contingent deferred sales charge is 1.00%. Performance including sales charge assumes the sales charge for the corresponding time period. Class R6, Administrator Class, and Institutional Class shares are sold without a front-end sales charge or contingent deferred sales charge.
Bond values fluctuate in response to the financial condition of individual issuers, general market and economic conditions, and changes in interest rates. In general, when interest rates rise, bond values fall and investors may lose principal value. Foreign investments are especially volatile and can rise or fall dramatically due to differences in the political and economic conditions of the host country. These risks are generally intensified in emerging markets. The use of derivatives may reduce returns and/or increase volatility. Certain investment strategies tend to increase the total risk of an investment (relative to the broader market). The Fund is exposed to high-yield securities risk, mortgage- and assetbacked securities risk, and regional risk. Consult the Fund’s prospectus for additional information on these and other risks.
Please see footnotes on page 7.
| | | | | | |
| Performance highlights (unaudited) | | Wells Fargo Advantage International Bond Fund | | | 7 | |
| | | | |
| Ten largest long-term holdings5 (%) as of April 30, 2014 | |
Italy Buoni Poliennali del Tesoro, 4.75%, 9-1-2044 | | | 5.36% | |
Bonos y Obligaciones del Estado, 5.15%, 10-31-2044 | | | 4.97% | |
Poland, 4.00%, 10-25-2023 | | | 4.76% | |
Mexico, 4.75%, 6-14-2018 | | | 4.51% | |
Malaysia, 3.31%, 10-31-2017 | | | 4.46% | |
New Zealand, 5.50%, 4-15-2023 | | | 4.44% | |
Brazil, 10.00%, 1-1-2023 | | | 3.64% | |
Australia, 3.25%, 4-21-2025 | | | 3.50% | |
Bonos y Obligaciones del Estado, 5.15%, 10-31-2028 | | | 3.42% | |
Italy Buoni Poliennali del Tesoro, 4.75%, 9-1-2028 | | | 3.42% | |
|
| Portfolio allocation6 as of April 30, 2014 |
|
 |
| 1. | Historical performance shown for Administrator Class shares prior to their inception reflects the performance of Institutional Class shares and has been adjusted to reflect the higher expenses applicable to Administrator Class shares. Historical performance shown for Class R6 shares prior to their inception reflects the performance of Institutional Class shares and includes the higher expenses applicable to Institutional Class shares. If these expenses had not been included, returns would be higher. Historical performance shown for all classes of the Fund prior to July 12, 2010, is based on the performance of the Fund’s predecessor, Evergreen International Bond Fund. |
| 2. | Reflects the expense ratios as stated in the most recent prospectuses. The expense ratios shown are subject to change and may differ from the annualized expense ratios shown in the financial highlights of this report. |
| 3. | The Adviser has committed through February 28, 2015, to waive fees and/or reimburse expenses to the extent necessary to cap the Fund’s Total Annual Fund Operating Expenses After Fee Waiver, excluding certain expenses, at the amounts shown. Brokerage commissions, stamp duty fees, interest, taxes, acquired fund fees and expenses, and extraordinary expenses are excluded from the cap. Without this cap, the Fund’s returns would have been lower. |
| 4. | The BofA Merrill Lynch Global Broad Market Ex. U.S. Index tracks the performance of investment grade debt publicly issued in the major domestic and euro bond markets, including sovereign, quasi-government, corporate, securitized and collateralized securities and excludes all securities denominated in U.S. dollars. You cannot invest directly in an index. |
| 5. | The ten largest long-term holdings are calculated based on the value of the securities divided by total net assets of the Fund. Holdings are subject to change and may have changed since the date specified. |
| 6. | Portfolio allocation is subject to change and is calculated based on the total long-term investments of the Fund. |
| | | | |
| 8 | | Wells Fargo Advantage International Bond Fund | | Fund expenses (unaudited) |
As a shareholder of the Fund, you incur two types of costs: (1) transaction costs, including sales charges (loads) on purchase payments and contingent deferred sales charges (if any) on redemptions and (2) ongoing costs, including management fees, distribution (12b-1) and/or shareholder service fees, and other Fund expenses. This example is intended to help you understand your ongoing costs (in dollars) of investing in the Fund and to compare these costs with the ongoing costs of investing in other mutual funds.
The example is based on an investment of $1,000 invested at the beginning of the six-month period and held for the entire period from November 1, 2013 to April 30, 2014.
Actual expenses
The “Actual” line of the table below provides information about actual account values and actual expenses. You may use the information in this line, together with the amount you invested, to estimate the expenses that you paid over the period. Simply divide your account value by $1,000 (for example, an $8,600 account value divided by $1,000 = 8.6), then multiply the result by the number in the “Actual” line under the heading entitled “Expenses paid during period” for your applicable class of shares to estimate the expenses you paid on your account during this period.
Hypothetical example for comparison purposes
The “Hypothetical” line of the table below provides information about hypothetical account values and hypothetical expenses based on the Fund’s actual expense ratio and an assumed rate of return of 5% per year before expenses, which is not the Fund’s actual return. The hypothetical account values and expenses may not be used to estimate the actual ending account balance or expenses you paid for the period. You may use this information to compare the ongoing costs of investing in the Fund and other funds. To do so, compare this 5% hypothetical example with the 5% hypothetical examples that appear in the shareholder reports of the other funds.
Please note that the expenses shown in the table are meant to highlight your ongoing costs only and do not reflect any transactional costs, such as sales charges (loads) and contingent deferred sales charges. Therefore, the “Hypothetical” line of the table is useful in comparing ongoing costs only and will not help you determine the relative total costs of owning different funds. In addition, if these transactional costs were included, your costs would have been higher.
| | | | | | | | | | | | | | | | |
| | | Beginning
account value
11-1-2013 | | | Ending
account value
4-30-2014 | | | Expenses
paid during
the period1 | | | Net annualized
expense ratio | |
Class A | | | | | | | | | | | | | | | | |
Actual | | $ | 1,000.00 | | | $ | 1,030.17 | | | $ | 5.18 | | | | 1.03 | % |
Hypothetical (5% return before expenses) | | $ | 1,000.00 | | | $ | 1,019.69 | | | $ | 5.16 | | | | 1.03 | % |
Class B | | | | | | | | | | | | | | | | |
Actual | | $ | 1,000.00 | | | $ | 1,026.03 | | | $ | 8.94 | | | | 1.78 | % |
Hypothetical (5% return before expenses) | | $ | 1,000.00 | | | $ | 1,015.97 | | | $ | 8.90 | | | | 1.78 | % |
Class C | | | | | | | | | | | | | | | | |
Actual | | $ | 1,000.00 | | | $ | 1,025.50 | | | $ | 8.94 | | | | 1.78 | % |
Hypothetical (5% return before expenses) | | $ | 1,000.00 | | | $ | 1,015.97 | | | $ | 8.90 | | | | 1.78 | % |
Class R6 | | | | | | | | | | | | | | | | |
Actual | | $ | 1,000.00 | | | $ | 1,031.68 | | | $ | 3.27 | | | | 0.65 | % |
Hypothetical (5% return before expenses) | | $ | 1,000.00 | | | $ | 1,021.57 | | | $ | 3.26 | | | | 0.65 | % |
Administrator Class | | | | | | | | | | | | | | | | |
Actual | | $ | 1,000.00 | | | $ | 1,030.51 | | | $ | 4.28 | | | | 0.85 | % |
Hypothetical (5% return before expenses) | | $ | 1,000.00 | | | $ | 1,020.58 | | | $ | 4.26 | | | | 0.85 | % |
Institutional Class | | | | | | | | | | | | | | | | |
Actual | | $ | 1,000.00 | | | $ | 1,030.70 | | | $ | 3.52 | | | | 0.70 | % |
Hypothetical (5% return before expenses) | | $ | 1,000.00 | | | $ | 1,021.32 | | | $ | 3.51 | | | | 0.70 | % |
| 1. | Expenses paid is equal to the annualized expense ratio of each class multiplied by the average account value over the period, multiplied by the number of days in the most recent fiscal half-year divided by the number of days in the fiscal year (to reflect the one-half-year period). |
| | | | | | |
| Portfolio of investments—April 30, 2014 (unaudited) | | Wells Fargo Advantage International Bond Fund | | | 9 | |
| | | | | | | | | | | | | | | | |
| Security name | | Interest rate | | | Maturity date | | | Principal | | | Value | |
| | | | | | | | | | | | | | | | |
| | | | |
Corporate Bonds and Notes: 0.17% | | | | | | | | | | | | | | | | |
| | | | |
| United States: 0.17% | | | | | | | | | | | | | | | | |
NBCUniversal Media LLC (Consumer Discretionary, Media) | | | 2.88 | % | | | 1-15-2023 | | | $ | 2,600,000 | | | $ | 2,531,766 | |
| | | | | | | | | | | | | | | | |
| | | | |
Total Corporate Bonds and Notes (Cost $2,595,882) | | | | | | | | | | | | | | | 2,531,766 | |
| | | | | | | | | | | | | | | | |
| | | | |
Foreign Corporate Bonds and Notes @: 19.68% | | | | | | | | | | | | | | | | |
| | | | |
| Australia: 0.96% | | | | | | | | | | | | | | | | |
General Electric Capital Corporation (Financials, Diversified Financial Services, AUD) | | | 6.00 | | | | 3-15-2019 | | | | 1,405,000 | | | | 1,398,975 | |
Telstra Corporation Limited (Telecommunication Services, Diversified Telecommunication Services, EUR) | | | 3.75 | | | | 5-16-2022 | | | | 8,000,000 | | | | 12,497,798 | |
| | | | |
| | | | | | | | | | | | | | | 13,896,773 | |
| | | | | | | | | | | | | | | | |
| | | | |
| Belgium: 0.51% | | | | | | | | | | | | | | | | |
Anheuser-Busch InBev NV (Consumer Staples, Beverages, EUR) | | | 2.88 | | | | 9-25-2024 | | | | 5,000,000 | | | | 7,302,438 | |
| | | | | | | | | | | | | | | | |
| | | | |
| Bermuda: 0.53% | | | | | | | | | | | | | | | | |
Bacardi Limited (Consumer Staples, Beverages, EUR) | | | 2.75 | | | | 7-3-2023 | | | | 5,350,000 | | | | 7,584,823 | |
| | | | | | | | | | | | | | | | |
| | | | |
| Brazil: 0.34% | | | | | | | | | | | | | | | | |
BRF SA (Consumer Staples, Food Products, BRL) 144A | | | 7.75 | | | | 5-22-2018 | | | | 13,500,000 | | | | 4,895,056 | |
| | | | | | | | | | | | | | | | |
| | | | |
| Czech Republic: 0.80% | | | | | | | | | | | | | | | | |
EP Energy LLC (Energy, Oil, Gas & Consumable Fuels, EUR) | | | 5.88 | | | | 11-1-2019 | | | | 7,500,000 | | | | 11,575,696 | |
| | | | | | | | | | | | | | | | |
| | | | |
| France: 1.12% | | | | | | | | | | | | | | | | |
Autoroutes Du Sud de la France (Industrials, Transportation Infrastructure, EUR) | | | 2.95 | | | | 1-17-2024 | | | | 1,000,000 | | | | 1,437,806 | |
Casino Guichard Perrachon SA (Consumer Staples, Food & Staples Retailing, EUR) | | | 3.31 | | | | 1-25-2023 | | | | 4,300,000 | | | | 6,292,696 | |
Casino Guichard Perrachon SA (Consumer Staples, Food & Staples Retailing, EUR) | | | 4.73 | | | | 5-26-2021 | | | | 3,500,000 | | | | 5,648,895 | |
Financiere Quick S.A.S. (Consumer Discretionary, Hotels, Restaurants & Leisure,
EUR) 144A± | | | 5.08 | | | | 4-15-2019 | | | | 1,000,000 | | | | 1,383,881 | |
Numericable Group SA (Consumer Discretionary, Media, EUR) 144A%% | | | 5.38 | | | | 5-15-2022 | | | | 1,000,000 | | | | 1,437,641 | |
| | | | |
| | | | | | | | | | | | | | | 16,200,919 | |
| | | | | | | | | | | | | | | | |
| | | | |
| Germany: 1.82% | | | | | | | | | | | | | | | | |
Daimler AG (Consumer Discretionary, Automobiles, EUR) | | | 2.00 | | | | 6-25-2021 | | | | 5,050,000 | | | | 7,113,504 | |
Daimler AG (Consumer Discretionary, Automobiles, EUR) | | | 2.25 | | | | 1-24-2022 | | | | 2,700,000 | | | | 3,844,494 | |
KfW (Financials, Banks, AUD) | | | 5.00 | | | | 3-19-2024 | | | | 12,650,000 | | | | 12,114,997 | |
Unitymedia Hessen GmbH & Company (Consumer Discretionary, Media, EUR) 144A | | | 5.13 | | | | 1-21-2023 | | | | 1,700,000 | | | | 2,490,569 | |
Unitymedia Hessen GmbH & Company (Consumer Discretionary, Media, EUR) 144A | | | 5.75 | | | | 1-15-2023 | | | | 500,000 | | | | 750,036 | |
| | | | |
| | | | | | | | | | | | | | | 26,313,600 | |
| | | | | | | | | | | | | | | | |
| | | | |
| Ireland: 0.71% | | | | | | | | | | | | | | | | |
AG Spring Finance II Limited (Financials, Diversified Financial Services, EUR) 144A | | | 7.50 | | | | 6-1-2018 | | | | 3,600,000 | | | | 5,172,560 | |
General Electric Capital Corporation (Financials, Diversified Financial Services, EUR) | | | 2.63 | | | | 3-15-2023 | | | | 3,500,000 | | | | 5,031,611 | |
| | | | |
| | | | | | | | | | | | | | | 10,204,171 | |
| | | | | | | | | | | | | | | | |
| | | | |
| Italy: 0.74% | | | | | | | | | | | | | | | | |
Fiat Industrial SpA (Financials, Consumer Finance, EUR) | | | 6.25 | | | | 3-9-2018 | | | | 3,000,000 | | | | 4,730,584 | |
Luxottica Group SpA (Consumer Discretionary, Textiles, Apparel & Luxury Goods, EUR) | | | 3.63 | | | | 3-19-2019 | | | | 3,000,000 | | | | 4,610,276 | |
Marcolin SpA (Consumer Discretionary, Textiles, Apparel & Luxury Goods, EUR) 144A | | | 8.50 | | | | 11-15-2019 | | | | 900,000 | | | | 1,329,774 | |
| | | | |
| | | | | | | | | | | | | | | 10,670,634 | |
| | | | | | | | | | | | | | | | |
The accompanying notes are an integral part of these financial statements.
| | | | |
| 10 | | Wells Fargo Advantage International Bond Fund | | Portfolio of investments—April 30, 2014 (unaudited) |
| | | | | | | | | | | | | | | | |
| Security name | | Interest rate | | | Maturity date | | | Principal | | | Value | |
| | | | | | | | | | | | | | | | |
| | | | |
| Luxembourg: 3.86% | | | | | | | | | | | | | | | | |
Befesa Zinc Aser SA (Utilities, Water Utilities, EUR) | | | 8.88 | % | | | 5-15-2018 | | | | 4,025,000 | | | $ | 5,963,240 | |
European Investment Bank (Financials, Banks, NOK) | | | 3.00 | | | | 5-22-2019 | | | | 35,500,000 | | | | 6,111,258 | |
European Investment Bank (Financials, Banks, NZD) | | | 4.75 | | | | 1-22-2019 | | | | 10,400,000 | | | | 8,969,025 | |
European Investment Bank (Financials, Banks, AUD) | | | 6.50 | | | | 8-7-2019 | | | | 22,400,000 | | | | 23,299,599 | |
Gestamp Funding Luxembourg SA (Consumer Discretionary, Auto Components, EUR) | | | 5.88 | | | | 5-31-2020 | | | | 1,500,000 | | | | 2,222,534 | |
Heidelbergcement AG (Industrials, Building Products, EUR) | | | 8.50 | | | | 10-31-2019 | | | | 1,730,000 | | | | 3,084,147 | |
Play Finance 2 SA (Telecommunication Services, Wireless Telecommunication Services, EUR) 144A | | | 5.25 | | | | 2-1-2019 | | | | 1,600,000 | | | | 2,291,901 | |
Servus Luxembourg Holding SCA (Consumer Discretionary, Automobiles, EUR) 144A | | | 7.75 | | | | 6-15-2018 | | | | 2,550,000 | | | | 3,798,826 | |
| | | | |
| | | | | | | | | | | | | | | 55,740,530 | |
| | | | | | | | | | | | | | | | |
| | | | |
| Mexico: 0.65% | | | | | | | | | | | | | | | | |
America Movil SAB de CV (Telecommunication Services, Wireless Telecommunication Services, EUR) | | | 3.00 | | | | 7-12-2021 | | | | 6,000,000 | | | | 8,869,907 | |
Petroleos Mexicanos (Energy, Oil, Gas & Consumable Fuels, MXN) 144A | | | 7.19 | | | | 9-12-2024 | | | | 6,050,000 | | | | 451,485 | |
| | | | |
| | | | | | | | | | | | | | | 9,321,392 | |
| | | | | | | | | | | | | | | | |
| | | | |
| Netherlands: 1.71% | | | | | | | | | | | | | | | | |
ASML Holding NV (Information Technology, Semiconductors & Semiconductor Equipment, EUR) | | | 3.38 | | | | 9-19-2023 | | | | 400,000 | | | | 588,408 | |
Bank Nederlandse Gemeenten NV (Financials, Banks, EUR) | | | 2.63 | | | | 9-1-2020 | | | | 5,250,000 | | | | 7,837,777 | |
BMW Finance NV (Financials, Consumer Finance, EUR) | | | 3.25 | | | | 1-14-2019 | | | | 800,000 | | | | 1,215,041 | |
Grupo Isolux Corsan Finance BV (Industrials, Construction & Engineering, EUR) 144A | | | 6.63 | | | | 4-15-2021 | | | | 2,500,000 | | | | 3,485,715 | |
Heineken NV (Consumer Staples, Beverages, EUR) | | | 2.13 | | | | 8-4-2020 | | | | 6,000,000 | | | | 8,514,485 | |
Interxion Holding NV (Information Technology, IT Services, EUR) 144A | | | 6.00 | | | | 7-15-2020 | | | | 2,000,000 | | | | 2,963,378 | |
| | | | |
| | | | | | | | | | | | | | | 24,604,804 | |
| | | | | | | | | | | | | | | | |
| | | | |
| Norway: 0.86% | | | | | | | | | | | | | | | | |
Kommunalbanken AS (Financials, Banks, AUD) | | | 5.25 | | | | 7-15-2024 | | | | 13,000,000 | | | | 12,460,339 | |
| | | | | | | | | | | | | | | | |
| | | | |
| Spain: 0.86% | | | | | | | | | | | | | | | | |
Gas Natural Fenosa (Energy, Oil, Gas & Consumable Fuels, EUR) | | | 3.88 | | | | 4-11-2022 | | | | 2,300,000 | | | | 3,577,341 | |
Portaventura Entertainment Barcelona BV (Consumer Discretionary, Hotels, Restaurants & Leisure, EUR) | | | 7.25 | | | | 12-1-2020 | | | | 2,100,000 | | | | 3,070,031 | |
Portaventura Entertainment Barcelona BV (Consumer Discretionary, Hotels, Restaurants & Leisure, EUR) 144A | | | 7.25 | | | | 12-1-2020 | | | | 750,000 | | | | 1,096,970 | |
Telefonica Emisiones S.A.U. (Telecommunication Services, Diversified Telecommunication Services, EUR) | | | 3.99 | | | | 1-23-2023 | | | | 3,000,000 | | | | 4,637,046 | |
| | | | |
| | | | | | | | | | | | | | | 12,381,388 | |
| | | | | | | | | | | | | | | | |
| | | | |
| Switzerland: 0.35% | | | | | | | | | | | | | | | | |
Eurofima (Financials, Banks, AUD) | | | 6.25 | | | | 12-28-2018 | | | | 5,000,000 | | | | 5,112,451 | |
| | | | | | | | | | | | | | | | |
| | | | |
| United Kingdom: 3.57% | | | | | | | | | | | | | | | | |
Arqiva Broadcast Finance plc (Consumer Discretionary, Media, GBP) 144A | | | 9.50 | | | | 3-31-2020 | | | | 800,000 | | | | 1,546,574 | |
B.A.T. International Finance plc (Financials, Diversified Financial Services, EUR) | | | 2.75 | | | | 3-25-2025 | | | | 4,950,000 | | | | 7,004,067 | |
Bakkavor Finance 2 plc (Consumer Staples, Food & Staples Retailing, GBP) | | | 8.25 | | | | 2-15-2018 | | | | 900,000 | | | | 1,618,331 | |
Bakkavor Finance 2 plc (Consumer Staples, Food & Staples Retailing, GBP) | | | 8.75 | | | | 6-15-2020 | | | | 700,000 | | | | 1,316,023 | |
The accompanying notes are an integral part of these financial statements.
| | | | | | |
| Portfolio of investments—April 30, 2014 (unaudited) | | Wells Fargo Advantage International Bond Fund | | | 11 | |
| | | | | | | | | | | | | | | | |
| Security name | | Interest rate | | | Maturity date | | | Principal | | | Value | |
| | | | | | | | | | | | | | | | |
| | | | |
| United Kingdom (continued) | | | | | | | | | | | | | | | | |
Heathrow Funding Limited (Industrials, Transportation Infrastructure, EUR) | | | 4.60 | % | | | 2-15-2020 | | | | 4,450,000 | | | $ | 6,945,343 | |
Imperial Tobacco Finance Company (Consumer Staples, Tobacco, EUR) | | | 5.00 | | | | 12-2-2019 | | | | 4,100,000 | | | | 6,652,384 | |
Jaguar Land Rover plc (Consumer Discretionary, Automobiles, GBP) | | | 8.25 | | | | 3-15-2020 | | | | 3,355,000 | | | | 6,394,857 | |
National Grid plc (Utilities, Multi-Utilities, EUR) | | | 4.38 | | | | 3-10-2020 | | | | 6,511,000 | | | | 10,405,890 | |
Phones4u Finance plc (Telecommunication Services, Diversified Telecommunication Services, GBP) | | | 9.50 | | | | 4-1-2018 | | | | 2,410,000 | | | | 4,247,673 | |
United Utilities plc (Utilities, Water Utilities, EUR) | | | 4.25 | | | | 1-24-2020 | | | | 1,778,000 | | | | 2,809,545 | |
Virgin Media Finance plc (Consumer Discretionary, Media, GBP) | | | 8.88 | | | | 10-15-2019 | | | | 1,431,000 | | | | 2,585,274 | |
| | | | |
| | | | | | | | | | | | | | | 51,525,961 | |
| | | | | | | | | | | | | | | | |
| | | | |
| United States: 0.29% | | | | | | | | | | | | | | | | |
Iron Mountain Incorporated (Industrials, Commercial Services & Supplies, EUR) | | | 6.75 | | | | 10-15-2018 | | | | 1,920,000 | | | | 2,687,011 | |
Verizon Communications Incorporated (Telecommunication Services, Diversified Telecommunication Services, EUR) | | | 3.25 | | | | 2-17-2026 | | | | 1,000,000 | | | | 1,462,114 | |
| | | | |
| | | | | | | | | | | | | | | 4,149,125 | |
| | | | | | | | | | | | | | | | |
| | | | |
Total Foreign Corporate Bonds and Notes (Cost $263,552,653) | | | | | | | | | | | | | | | 283,940,100 | |
| | | | | | | | | | | | | | | | |
| | | | |
Foreign Government Bonds @: 73.17% | | | | | | | | | | | | | | | | |
Australia (AUD) | | | 3.25 | | | | 4-21-2025 | | | | 58,495,000 | | | | 50,573,803 | |
Australian Government Bond (AUD) | | | 5.50 | | | | 1-21-2018 | | | | 38,950,000 | | | | 39,191,134 | |
Australian Government Bond Series 133 (AUD) | | | 5.50 | | | | 4-21-2023 | | | | 9,000,000 | | | | 9,396,512 | |
Bonos y Obligaciones del Estado 144A (EUR) | | | 5.15 | | | | 10-31-2028 | | | | 30,295,000 | | | | 49,404,287 | |
Bonos y Obligaciones del Estado 144A (EUR) | | | 5.15 | | | | 10-31-2044 | | | | 43,900,000 | | | | 71,689,019 | |
Brazil (BRL) | | | 8.50 | | | | 1-5-2024 | | | | 31,590,000 | | | | 13,671,645 | |
Brazil (BRL) | | | 10.00 | | | | 1-1-2023 | | | | 129,150,000 | | | | 52,512,949 | |
Colombia (COP) | | | 7.75 | | | | 4-14-2021 | | | | 1,675,000,000 | | | | 974,602 | |
Germany (NOK) | | | 4.00 | | | | 3-4-2016 | | | | 40,000,000 | | | | 6,997,601 | |
Hungary (HUF) | | | 5.50 | | | | 6-24-2025 | | | | 404,500,000 | | | | 1,829,539 | |
Hungary (HUF) | | | 6.00 | | | | 11-24-2023 | | | | 3,594,050,000 | | | | 17,159,047 | |
Hungary (HUF) | | | 6.75 | | | | 11-24-2017 | | | | 545,000,000 | | | | 2,701,768 | |
Hungary (HUF) | | | 7.00 | | | | 6-24-2022 | | | | 4,250,000,000 | | | | 21,466,340 | |
Indonesia (IDR) | | | 7.88 | | | | 4-15-2019 | | | | 25,000,000,000 | | | | 2,183,973 | |
Indonesia (IDR) | | | 8.38 | | | | 3-15-2024 | | | | 29,150,000,000 | | | | 2,575,507 | |
Italy Buoni Poliennali del Tesoro 144A (EUR) | | | 4.75 | | | | 9-1-2028 | | | | 31,500,000 | | | | 49,293,985 | |
Italy Buoni Poliennali del Tesoro 144A (EUR) | | | 4.75 | | | | 9-1-2044 | | | | 50,250,000 | | | | 77,410,065 | |
Korea (KRW) | | | 2.75 | | | | 9-10-2017 | | | | 26,840,000,000 | | | | 25,787,959 | |
Korea (KRW) | | | 5.25 | | | | 3-10-2027 | | | | 33,590,000,000 | | | | 37,862,916 | |
Malaysia (MYR) | | | 3.26 | | | | 3-1-2018 | | | | 7,450,000 | | | | 2,257,520 | |
Malaysia (MYR) | | | 3.31 | | | | 10-31-2017 | | | | 211,500,000 | | | | 64,330,133 | |
Malaysia (MYR) | | | 4.26 | | | | 9-15-2016 | | | | 6,725,000 | | | | 2,103,246 | |
Mexico (MXN) | | | 4.75 | | | | 6-14-2018 | | | | 858,160,000 | | | | 65,036,757 | |
Mexico (MXN) | | | 10.00 | | | | 12-5-2024 | | | | 25,500,000 | | | | 2,512,321 | |
New South Wales Treasury (AUD) | | | 6.00 | | | | 2-1-2018 | | | | 15,000,000 | | | | 15,250,370 | |
New Zealand (NZD) | | | 5.50 | | | | 4-15-2023 | | | | 68,825,000 | | | | 64,045,780 | |
Nigeria (NGN) | | | 15.10 | | | | 4-27-2017 | | | | 170,000,000 | | | | 1,110,582 | |
Norway (NOK) | | | 3.75 | | | | 5-25-2021 | | | | 127,300,000 | | | | 23,186,876 | |
Norway (NOK) | | | 4.50 | | | | 5-22-2019 | | | | 71,500,000 | | | | 13,392,126 | |
Poland (PLN) | | | 4.00 | | | | 10-25-2023 | | | | 208,440,000 | | | | 68,680,245 | |
Province of Ontario (AUD) | | | 6.25 | | | | 9-29-2020 | | | | 13,600,000 | | | | 13,850,212 | |
The accompanying notes are an integral part of these financial statements.
| | | | |
| 12 | | Wells Fargo Advantage International Bond Fund | | Portfolio of investments—April 30, 2014 (unaudited) |
| | | | | | | | | | | | | | | | |
| Security name | | Interest rate | | | Maturity date | | | Principal | | | Value | |
| | | | | | | | | | | | | | | | |
| | | | |
Foreign Government Bonds @ (continued) | | | | | | | | | | | | | | | | |
Queensland Treasury (AUD) | | | 5.75 | % | | | 7-22-2024 | | | | 11,000,000 | | | $ | 11,296,893 | |
Queensland Treasury (AUD) | | | 6.00 | | | | 2-21-2018 | | | | 15,000,000 | | | | 15,219,393 | |
Republic of South Africa (ZAR) | | | 6.50 | | | | 2-28-2041 | | | | 22,300,000 | | | | 1,566,691 | |
Republic of South Africa (ZAR) | | | 7.75 | | | | 2-28-2023 | | | | 456,175,000 | | | | 41,782,257 | |
Republic of South Africa (ZAR) | | | 8.00 | | | | 1-31-2030 | | | | 18,500,000 | | | | 1,616,563 | |
Romania (RON) | | | 6.00 | | | | 4-30-2016 | | | | 5,000,000 | | | | 1,631,839 | |
Russia (RUB) | | | 7.00 | | | | 1-25-2023 | | | | 122,900,000 | | | | 2,992,723 | |
Russia (RUB) | | | 7.50 | | | | 3-15-2018 | | | | 100,275,000 | | | | 2,674,000 | |
Sweden Government Bond Series 1052 (SEK) | | | 4.25 | | | | 3-12-2019 | | | | 204,500,000 | | | | 35,846,533 | |
Sweden Government Bond Series 1057 (SEK) | | | 1.50 | | | | 11-13-2023 | | | | 216,400,000 | | | | 31,886,568 | |
Thailand (THB) | | | 3.25 | | | | 6-16-2017 | | | | 105,250,000 | | | | 3,328,291 | |
Turkey (TRY) | | | 6.30 | | | | 2-14-2018 | | | | 77,655,000 | | | | 33,723,869 | |
Turkey (TRY) | | | 9.00 | | | | 3-8-2017 | | | | 8,300,000 | | | | 3,930,369 | |
| | | | |
Total Foreign Government Bonds (Cost $1,053,805,085) | | | | | | | | | | | | | | | 1,055,934,808 | |
| | | | | | | | | | | | | | | | |
| | | | |
Yankee Corporate Bonds and Notes: 2.92% | | | | | | | | | | | | | | | | |
| | | | |
| Bermuda: 0.26% | | | | | | | | | | | | | | | | |
Qtel International Finance Limited (Telecommunication Services, Diversified Telecommunication Services) | | | 4.75 | | | | 2-16-2021 | | | $ | 3,550,000 | | | | 3,802,938 | |
| | | | | | | | | | | | | | | | |
| | | | |
| Brazil: 0.57% | | | | | | | | | | | | | | | | |
ITAU Unibanco Holding SA (Financials, Banks) | | | 5.13 | | | | 5-13-2023 | | | | 1,750,000 | | | | 1,743,000 | |
Petroplus International Finance Company (Energy, Oil, Gas & Consumable Fuels) | | | 5.75 | | | | 1-20-2020 | | | | 6,185,000 | | | | 6,530,457 | |
| | | | |
| | | | | | | | | | | | | | | 8,273,457 | |
| | | | | | | | | | | | | | | | |
| | | | |
| Cayman Islands: 0.50% | | | | | | | | | | | | | | | | |
International Petroleum Investment Company (Energy, Oil, Gas & Consumable Fuels) | | | 5.00 | | | | 11-15-2020 | | | | 5,700,000 | | | | 6,284,250 | |
Petrobras International Finance Company (Energy, Oil, Gas & Consumable Fuels) | | | 5.38 | | | | 1-27-2021 | | | | 860,000 | | | | 880,473 | |
| | | | |
| | | | | | | | | | | | | | | 7,164,723 | |
| | | | | | | | | | | | | | | | |
| | | | |
| Israel: 0.24% | | | | | | | | | | | | | | | | |
B Communications Limited (Telecommunication Services, Diversified Telecommunication Services) 144A | | | 7.38 | | | | 2-15-2021 | | | | 3,250,000 | | | | 3,436,875 | |
| | | | | | | | | | | | | | | | |
| | | | |
| Netherlands: 0.47% | | | | | | | | | | | | | | | | |
Mubadala Development Company (Energy, Oil, Gas & Consumable Fuels) | | | 5.50 | | | | 4-20-2021 | | | | 3,200,000 | | | | 3,648,000 | |
Myriad International Holdings BV (Consumer Discretionary, Media) | | | 6.00 | | | | 7-18-2020 | | | | 2,950,000 | | | | 3,222,875 | |
| | | | |
| | | | | | | | | | | | | | | 6,870,875 | |
| | | | | | | | | | | | | | | | |
| | | | |
| Peru: 0.49% | | | | | | | | | | | | | | | | |
Banco De Credito Del Peru (Financials, Banks) 144A (i) | | | 4.25 | | | | 4-1-2023 | | | | 7,235,000 | | | | 7,026,994 | |
| | | | | | | | | | | | | | | | |
| | | | |
| United Kingdom: 0.39% | | | | | | | | | | | | | | | | |
British Sky Broadcasting Group plc (Consumer Discretionary, Media) 144A | | | 3.13 | | | | 11-26-2022 | | | | 2,900,000 | | | | 2,804,851 | |
Enquest plc (Energy, Oil, Gas & Consumable Fuels) 144A | | | 7.00 | | | | 4-15-2022 | | | | 1,200,000 | | | | 1,227,000 | |
Vedanta Resources plc (Materials, Metals & Mining) 144A | | | 6.00 | | | | 1-31-2019 | | | | 1,600,000 | | | | 1,594,000 | |
| | | | |
| | | | | | | | | | | | | | | 5,625,851 | |
| | | | | | | | | | | | | | | | |
| | | | |
Total Yankee Corporate Bonds and Notes (Cost $40,824,910) | | | | | | | | | | | | | | | 42,201,713 | |
| | | | | | | | | | | | | | | | |
The accompanying notes are an integral part of these financial statements.
| | | | | | |
| Portfolio of investments—April 30, 2014 (unaudited) | | Wells Fargo Advantage International Bond Fund | | | 13 | |
| | | | | | | | | | | | | | |
| Security name | | Yield | | | | | Shares | | | Value | |
| | | | | | | | | | | | | | |
| | | | |
Short-Term Investments: 2.02% | | | | | | | | | | | | | | |
| | | | |
| Investment Companies: 2.02% | | | | | | | | | | | | | | |
Wells Fargo Advantage Cash Investment Money Market Fund, Select Class (l)(u)## | | | 0.07 | % | | | | | 29,113,447 | | | $ | 29,113,447 | |
| | | | | | | | | | | | | | |
| | | | |
Total Short-Term Investments (Cost $29,113,447) | | | | | | | | | | | | | 29,113,447 | |
| | | | | | | | | | | | | | |
| | | | | | | | |
| Total investments in securities | | | | | | | | |
| (Cost $1,389,891,977) * | | | 97.96 | % | | | 1,413,721,834 | |
Other assets and liabilities, net | | | 2.04 | | | | 29,367,679 | |
| | | | | | | | |
| Total net assets | | | 100.00 | % | | $ | 1,443,089,513 | |
| | | | | | | | |
| @ | Foreign bond principal is denominated in local currency. |
| 144A | Security that may be resold to “qualified institutional buyers” under Rule 144A or security offered pursuant to Section 4(2) of the Securities Act of 1933, as amended |
| ± | Variable rate investment. The interest rate shown is the rate in effect at period end. |
| %% | Security issued on a when-issued basis. |
| (l) | Represents an affiliate of the Fund under Sections 2(a)(2) and 2(a)(3) of the Investment Company Act of 1940, as amended |
| (u) | Rate shown is the 7-day annualized yield at period end. |
| ## | All or a portion of this security has been segregated for when-issued securities. |
| * | Cost for federal income tax purposes is $1,390,252,761 and unrealized appreciation (depreciation) consists of: |
| | | | |
Gross unrealized appreciation | | $ | 55,728,857 | |
Gross unrealized depreciation | | | (32,259,784 | ) |
| | | | |
Net unrealized appreciation | | $ | 23,469,073 | |
The accompanying notes are an integral part of these financial statements.
| | | | |
| 14 | | Wells Fargo Advantage International Bond Fund | | Statement of assets and liabilities—April 30, 2014 (unaudited) |
| | | | |
| | | | |
| |
Assets | | | | |
Investments | | | | |
In unaffiliated securities, at value (see cost below) | | $ | 1,384,608,387 | |
In affiliated securities, at value (see cost below) | | | 29,113,447 | |
| | | | |
Total investments, at value (see cost below) | | | 1,413,721,834 | |
Foreign currency, at value (see cost below) | | | 11,829,955 | |
Receivable for investments sold | | | 10,759,981 | |
Receivable for Fund shares sold | | | 2,744,634 | |
Receivable for interest | | | 18,221,040 | |
Unrealized gains on forward foreign currency contracts | | | 2,574,807 | |
Prepaid expenses and other assets | | | 34,515 | |
| | | | |
Total assets | | | 1,459,886,766 | |
| | | | |
| |
Liabilities | | | | |
Payable for investments purchased | | | 1,387,350 | |
Payable for Fund shares redeemed | | | 1,143,016 | |
Unrealized losses on forward foreign currency contracts | | | 13,246,755 | |
Advisory fee payable | | | 566,357 | |
Distribution fees payable | | | 8,853 | |
Due to other related parties | | | 167,057 | |
Accrued expenses and other liabilities | | | 277,865 | |
| | | | |
Total liabilities | | | 16,797,253 | |
| | | | |
Total net assets | | $ | 1,443,089,513 | |
| | | | |
| |
NET ASSETS CONSIST OF | | | | |
Paid-in capital | | $ | 1,432,466,844 | |
Undistributed net investment income | | | 16,724,687 | |
Accumulated net realized losses on investments | | | (19,675,633 | ) |
Net unrealized gains on investments | | | 13,573,615 | |
| | | | |
Total net assets | | $ | 1,443,089,513 | |
| | | | |
| |
COMPUTATION OF NET ASSET VALUE AND OFFERING PRICE PER SHARE1 | | | | |
Net assets – Class A | | $ | 107,993,359 | |
Shares outstanding – Class A | | | 9,652,597 | |
Net asset value per share – Class A | | | $11.19 | |
Maximum offering price per share – Class A2 | | | $11.72 | |
Net assets – Class B | | $ | 1,172,777 | |
Shares outstanding – Class B | | | 105,294 | |
Net asset value per share – Class B | | | $11.14 | |
Net assets – Class C | | $ | 13,242,845 | |
Shares outstanding – Class C | | | 1,200,192 | |
Net asset value per share – Class C | | | $11.03 | |
Net assets – Class R6 | | $ | 2,513,905 | |
Share outstanding – Class R6 | | | 223,675 | |
Net asset value per share – Class R6 | | | $11.24 | |
Net assets – Administrator Class | | $ | 356,526,383 | |
Shares outstanding – Administrator Class | | | 31,863,286 | |
Net asset value per share – Administrator Class | | | $11.19 | |
Net assets – Institutional Class | | $ | 961,640,244 | |
Shares outstanding – Institutional Class | | | 85,678,477 | |
Net asset value per share – Institutional Class | | | $11.22 | |
| |
Investments in unaffiliated securities, at cost | | $ | 1,360,778,530 | |
| | | | |
Investments in affiliated securities, at cost | | $ | 29,113,447 | |
| | | | |
Total investments, at cost | | $ | 1,389,891,977 | |
| | | | |
Foreign currency, at cost | | $ | 11,702,212 | |
| | | | |
| 1. | The Fund has an unlimited number of authorized shares. |
| 2. | Maximum offering price is computed as 100/95.50 of net asset value. On investments of $50,000 or more, the offering price is reduced. |
The accompanying notes are an integral part of these financial statements.
| | | | | | |
| Statement of operations—six months ended April 30, 2014 (unaudited) | | Wells Fargo Advantage International Bond Fund | | | 15 | |
| | | | |
| | | | |
| |
Investment income | | | | |
Interest** | | $ | 32,097,699 | |
Income from affiliated securities | | | 5,775 | |
| | | | |
Total investment income | | | 32,103,474 | |
| | | | |
| |
Expenses | | | | |
Advisory fee | | | 3,780,407 | |
Administration fees | | | | |
Fund level | | | 359,445 | |
Class A | | | 84,965 | |
Class B | | | 1,200 | |
Class C | | | 11,112 | |
Class R6 | | | 360 | |
Administrator Class | | | 165,722 | |
Institutional Class | | | 392,936 | |
Shareholder servicing fees | | | | |
Class A | | | 132,758 | |
Class B | | | 1,875 | |
Class C | | | 17,363 | |
Administrator Class | | | 412,871 | |
Distribution fees | | | | |
Class B | | | 5,625 | |
Class C | | | 52,089 | |
Custody and accounting fees | | | 280,469 | |
Professional fees | | | 27,191 | |
Registration fees | | | 39,695 | |
Shareholder report expenses | | | 71,908 | |
Trustees’ fees and expenses | | | 3,394 | |
Interest expense | | | 5,196 | |
Other fees and expenses | | | 8,105 | |
| | | | |
Total expenses | | | 5,854,686 | |
Less: Fee waivers and/or expense reimbursements | | | (310,934 | ) |
| | | | |
Net expenses | | | 5,543,752 | |
| | | | |
Net investment income | | | 26,559,722 | |
| | | | |
| |
REALIZED AND UNREALIZED GAINS (LOSSES) ON INVESTMENTS | | | | |
| |
Net realized gains (losses) on: | | | | |
Unaffiliated securities | | | (36,246,848 | ) |
Forward foreign currency contract transactions | | | 16,719,235 | |
| | | | |
Net realized losses on investments | | | (19,527,613 | ) |
| | | | |
| |
Net change in unrealized gains (losses) on: | | | | |
Unaffiliated securities | | | 45,333,860 | |
Forward foreign currency contract transactions | | | (11,030,584 | ) |
| | | | |
Net change in unrealized gains (losses) on investments | | | 34,303,276 | |
| | | | |
Net realized and unrealized gains (losses) on investments | | | 14,775,663 | |
| | | | |
Net increase in net assets resulting from operations | | $ | 41,335,385 | |
| | | | |
| |
** Net of foreign interest withholding taxes in the amount of | | | $66,660 | |
The accompanying notes are an integral part of these financial statements.
| | | | |
| 16 | | Wells Fargo Advantage International Bond Fund | | Statement of changes in net assets |
| | | | | | | | | | | | | | | | |
| | | Six months ended April 30, 2014 (unaudited) | | | Year ended October 31, 2013 | |
| | | | |
Operations | | | | | | | | | | | | | | | | |
Net investment income | | | | | | $ | 26,559,722 | | | | | | | $ | 52,650,788 | |
Net realized losses on investments | | | | | | | (19,527,613 | ) | | | | | | | (5,183,740 | ) |
Net change in unrealized gains (losses) on investments | | | | | | | 34,303,276 | | | | | | | | (98,104,311 | ) |
| | | | |
Net increase (decrease) in net assets resulting from operations | | | | | | | 41,335,385 | | | | | | | | (50,637,263 | ) |
| | | | |
| | | | |
Distributions to shareholders from | | | | | | | | | | | | | | | | |
Net investment income | | | | | | | | | | | | | | | | |
Class A | | | | | | | (654,738 | ) | | | | | | | (188,764 | ) |
Class B | | | | | | | (3,281 | ) | | | | | | | 0 | |
Class C | | | | | | | (58,435 | ) | | | | | | | (1,384 | ) |
Class R6 | | | | | | | (16,531 | ) | | | | | | | (104 | )1 |
Administrator Class | | | | | | | (2,119,095 | ) | | | | | | | (503,737 | ) |
Institutional Class | | | | | | | (6,697,832 | ) | | | | | | | (2,422,485 | ) |
Net realized gains | | | | | | | | | | | | | | | | |
Class A | | | | | | | (3,719,413 | ) | | | | | | | (1,427,842 | ) |
Class B | | | | | | | (57,768 | ) | | | | | | | (36,299 | ) |
Class C | | | | | | | (526,829 | ) | | | | | | | (239,783 | ) |
Class R6 | | | | | | | (83,685 | ) | | | | | | | (520 | )1 |
Administrator Class | | | | | | | (11,543,115 | ) | | | | | | | (3,080,974 | ) |
Institutional Class | | | | | | | (36,033,595 | ) | | | | | | | (13,023,314 | ) |
| | | | |
Total distributions to shareholders | | | | | | | (61,514,317 | ) | | | | | | | (20,925,206 | ) |
| | | | |
| | | | |
Capital share transactions | | | Shares | | | | | | | | Shares | | | | | |
Proceeds from shares sold | | | | | | | | | | | | | | | | |
Class A | | | 1,320,256 | | | | 14,396,450 | | | | 3,829,061 | | | | 43,384,112 | |
Class B | | | 891 | | | | 9,492 | | | | 2,136 | | | | 24,742 | |
Class C | | | 37,494 | | | | 409,545 | | | | 113,680 | | | | 1,298,982 | |
Class R6 | | | 33,207 | | | | 364,252 | | | | 215,271 | 1 | | | 2,422,295 | 1 |
Administrator Class | | | 5,815,689 | | | | 63,406,501 | | | | 11,260,991 | | | | 127,839,631 | |
Institutional Class | | | 11,276,936 | | | | 122,573,276 | | | | 29,905,223 | | | | 339,623,997 | |
| | | | |
| | | | | | | 201,159,516 | | | | | | | | 514,593,759 | |
| | | | |
Reinvestment of distributions | | | | | | | | | | | | | | | | |
Class A | | | 395,067 | | | | 4,260,763 | | | | 129,784 | | | | 1,524,180 | |
Class B | | | 5,011 | | | | 53,798 | | | | 2,686 | | | | 31,562 | |
Class C | | | 43,996 | | | | 468,648 | | | | 15,788 | | | | 184,193 | |
Class R6 | | | 9,261 | | | | 100,216 | | | | 53 | 1 | | | 624 | 1 |
Administrator Class | | | 1,241,551 | | | | 13,387,429 | | | | 214,185 | | | | 2,510,250 | |
Institutional Class | | | 2,869,787 | | | | 31,030,895 | | | | 760,210 | | | | 8,920,248 | |
| | | | |
| | | | | | | 49,301,749 | | | | | | | | 13,171,057 | |
| | | | |
Payment for shares redeemed | | | | | | | | | | | | | | | | |
Class A | | | (2,117,084 | ) | | | (23,143,809 | ) | | | (5,704,996 | ) | | | (64,387,685 | ) |
Class B | | | (77,902 | ) | | | (847,976 | ) | | | (165,887 | ) | | | (1,894,295 | ) |
Class C | | | (319,792 | ) | | | (3,438,940 | ) | | | (684,141 | ) | | | (7,721,224 | ) |
Class R6 | | | (33,021 | ) | | | (359,732 | ) | | | (1,096 | )1 | | | (12,525 | )1 |
Administrator Class | | | (4,773,861 | ) | | | (51,888,726 | ) | | | (6,823,998 | ) | | | (76,971,446 | ) |
Institutional Class | | | (26,753,393 | ) | | | (291,829,584 | ) | | | (39,825,696 | ) | | | (452,449,852 | ) |
| | | | |
| | | | | | | (371,508,767 | ) | | | | | | | (603,437,027 | ) |
| | | | |
Net decrease in net assets resulting from capital share transactions | | | | | | | (121,047,502 | ) | | | | | | | (75,672,211 | ) |
| | | | |
Total decrease in net assets | | | | | | | (141,226,434 | ) | | | | | | | (147,234,680 | ) |
| | | | |
| | | | |
Net assets | | | | | | | | | | | | | | | | |
Beginning of period | | | | | | | 1,584,315,947 | | | | | | | | 1,731,550,627 | |
| | | | |
End of period | | | | | | $ | 1,443,089,513 | | | | | | | $ | 1,584,315,947 | |
| | | | |
Undistributed (overdistributed) net investment income | | | | | | $ | 16,724,687 | | | | | | | $ | (285,123 | ) |
| | | | |
| 1. | For the period from November 30, 2012 (commencement of class operations) to October 31, 2013 |
The accompanying notes are an integral part of these financial statements.
| | | | | | |
| Financial highlights | | Wells Fargo Advantage International Bond Fund | | | 17 | |
(For a share outstanding throughout each period)
| | | | | | | | | | | | | | | | | | | | | | | | |
| | | Six months ended April 30, 2014 (unaudited) | | | Year ended October 31 | |
| CLASS A | | | 2013 | | | 2012 | | | 2011 | | | 20101 | | | 20091 | |
Net asset value, beginning of period | | $ | 11.32 | | | $ | 11.83 | | | $ | 11.85 | | | $ | 12.23 | | | $ | 11.59 | | | $ | 10.36 | |
Net investment income | | | 0.19 | 2 | | | 0.36 | 2 | | | 0.33 | 2 | | | 0.39 | 2 | | | 0.40 | | | | 0.39 | 2 |
Net realized and unrealized gains (losses) on investments | | | 0.14 | | | | (0.73 | ) | | | 0.08 | | | | (0.18 | ) | | | 0.65 | | | | 2.20 | |
| | | | | | | | | | | | | | | | | | | | | | | | |
Total from investment operations | | | 0.33 | | | | (0.37 | ) | | | 0.41 | | | | 0.21 | | | | 1.05 | | | | 2.59 | |
Distributions to shareholders from | | | | | | | | | | | | | | | | | | | | | | | | |
Net investment income | | | (0.07 | ) | | | (0.02 | ) | | | (0.29 | ) | | | (0.51 | ) | | | (0.41 | ) | | | (1.36 | ) |
Net realized gains | | | (0.39 | ) | | | (0.12 | ) | | | (0.14 | ) | | | (0.08 | ) | | | 0.00 | | | | 0.00 | |
| | | | | | | | | | | | | | | | | | | | | | | | |
Total distributions to shareholders | | | (0.46 | ) | | | (0.14 | ) | | | (0.43 | ) | | | (0.59 | ) | | | (0.41 | ) | | | (1.36 | ) |
Net asset value, end of period | | $ | 11.19 | | | $ | 11.32 | | | $ | 11.83 | | | $ | 11.85 | | | $ | 12.23 | | | $ | 11.59 | |
Total return3 | | | 3.02 | % | | | (3.18 | )% | | | 3.66 | % | | | 1.93 | % | | | 9.35 | % | | | 26.34 | % |
Ratios to average net assets (annualized) | | | | | | | | | | | | | | | | | | | | | | | | |
Gross expenses | | | 1.05 | % | | | 1.05 | % | | | 1.04 | % | | | 1.02 | % | | | 1.10 | % | | | 1.05 | % |
Net expenses | | | 1.03 | % | | | 1.03 | % | | | 1.03 | % | | | 1.02 | % | | | 1.08 | % | | | 1.05 | % |
Net investment income | | | 3.44 | % | | | 2.93 | % | | | 2.88 | % | | | 3.26 | % | | | 3.53 | % | | | 3.65 | % |
Supplemental data | | | | | | | | | | | | | | | | | | | | | | | | |
Portfolio turnover rate | | | 47 | % | | | 129 | % | | | 79 | % | | | 88 | % | | | 89 | % | | | 118 | % |
Net assets, end of period (000s omitted) | | | $107,993 | | | | $113,846 | | | | $139,600 | | | | $286,577 | | | | $255,134 | | | | $246,719 | |
| 1. | After the close of business on July 9, 2010, the Fund acquired the net assets of Evergreen International Bond Fund which became the accounting and performance survivor in the transaction. The information for the periods prior to July 12, 2010 is that of Class A of Evergreen International Bond Fund. |
| 2. | Calculated based upon average shares outstanding |
| 3. | Total return calculations do not include any sales charges. Returns for periods of less than one year are not annualized. |
The accompanying notes are an integral part of these financial statements.
| | | | |
| 18 | | Wells Fargo Advantage International Bond Fund | | Financial highlights |
(For a share outstanding throughout each period)
| | | | | | | | | | | | | | | | | | | | | | | | |
| | | Six months ended
April 30, 2014 (unaudited) | | | Year ended October 31 | |
| CLASS B | | | 2013 | | | 2012 | | | 2011 | | | 20101 | | | 20091 | |
Net asset value, beginning of period | | $ | 11.27 | | | $ | 11.85 | | | $ | 11.88 | | | $ | 12.25 | | | | $11.54 | | | $ | 10.37 | |
Net investment income | | | 0.15 | 2 | | | 0.27 | 2 | | | 0.24 | 2 | | | 0.31 | | | | 0.29 | | | | 0.30 | 2 |
Net realized and unrealized gains (losses) on investments | | | 0.13 | | | | (0.73 | ) | | | 0.09 | | | | (0.19 | ) | | | 0.67 | | | | 2.21 | |
| | | | | | | | | | | | | | | | | | | | | | | | |
Total from investment operations | | | 0.28 | | | | (0.46 | ) | | | 0.33 | | | | 0.12 | | | | 0.96 | | | | 2.51 | |
Distributions to shareholders from | | | | | | | | | | | | | | | | | | | | | | | | |
Net investment income | | | (0.02 | ) | | | 0.00 | | | | (0.22 | ) | | | (0.41 | ) | | | (0.25 | ) | | | (1.34 | ) |
Net realized gains | | | (0.39 | ) | | | (0.12 | ) | | | (0.14 | ) | | | (0.08 | ) | | | 0.00 | | | | 0.00 | |
| | | | | | | | | | | | | | | | | | | | | | | | |
Total distributions to shareholders | | | (0.41 | ) | | | (0.12 | ) | | | (0.36 | ) | | | (0.49 | ) | | | (0.25 | ) | | | (1.34 | ) |
Net asset value, end of period | | $ | 11.14 | | | $ | 11.27 | | | $ | 11.85 | | | $ | 11.88 | | | | $12.25 | | | $ | 11.54 | |
Total return3 | | | 2.60 | % | | | (3.90 | )% | | | 2.90 | % | | | 1.15 | % | | | 8.55 | % | | | 25.44 | % |
Ratios to average net assets (annualized) | | | | | | | | | | | | | | | | | | | | | | | | |
Gross expenses | | | 1.80 | % | | | 1.80 | % | | | 1.79 | % | | | 1.77 | % | | | 1.85 | % | | | 1.79 | % |
Net expenses | | | 1.78 | % | | | 1.78 | % | | | 1.78 | % | | | 1.77 | % | | | 1.82 | % | | | 1.79 | % |
Net investment income | | | 2.67 | % | | | 2.13 | % | | | 2.12 | % | | | 2.53 | % | | | 2.77 | % | | | 2.86 | % |
Supplemental data | | | | | | | | | | | | | | | | | | | | | | | | |
Portfolio turnover rate | | | 47 | % | | | 129 | % | | | 79 | % | | | 88 | % | | | 89 | % | | | 118 | % |
Net assets, end of period (000s omitted) | | | $1,173 | | | | $1,998 | | | | $4,008 | | | | $6,925 | | | | $10,060 | | | | $11,615 | |
| 1. | After the close of business on July 9, 2010, the Fund acquired the net assets of Evergreen International Bond Fund which became the accounting and performance survivor in the transaction. The information for the periods prior to July 12, 2010 is that of Class B of Evergreen International Bond Fund. |
| 2. | Calculated based upon average shares outstanding |
| 3. | Total return calculations do not include any sales charges. Returns for periods of less than one year are not annualized. |
The accompanying notes are an integral part of these financial statements.
| | | | | | |
| Financial highlights | | Wells Fargo Advantage International Bond Fund | | | 19 | |
(For a share outstanding throughout each period)
| | | | | | | | | | | | | | | | | | | | | | | | |
| | | Six months ended
April 30, 2014 (unaudited) | | | Year ended October 31 | |
| CLASS C | | | 2013 | | | 2012 | | | 2011 | | | 20101 | | | 20091 | |
Net asset value, beginning of period | | $ | 11.19 | | | $ | 11.76 | | | $ | 11.81 | | | $ | 12.20 | | | $ | 11.51 | | | $ | 10.35 | |
Net investment income | | | 0.14 | 2 | | | 0.26 | 2 | | | 0.24 | 2 | | | 0.31 | | | | 0.33 | | | | 0.30 | 2 |
Net realized and unrealized gains (losses) on investments | | | 0.13 | | | | (0.71 | ) | | | 0.08 | | | | (0.19 | ) | | | 0.64 | | | | 2.20 | |
| | | | | | | | | | | | | | | | | | | | | | | | |
Total from investment operations | | | 0.27 | | | | (0.45 | ) | | | 0.32 | | | | 0.12 | | | | 0.97 | | | | 2.50 | |
Distributions to shareholders from | | | | | | | | | | | | | | | | | | | | | | | | |
Net investment income | | | (0.04 | ) | | | (0.00 | )3 | | | (0.23 | ) | | | (0.43 | ) | | | (0.28 | ) | | | (1.34 | ) |
Net realized gains | | | (0.39 | ) | | | (0.12 | ) | | | (0.14 | ) | | | (0.08 | ) | | | 0.00 | | | | 0.00 | |
| | | | | | | | | | | | | | | | | | | | | | | | |
Total distributions to shareholders | | | (0.43 | ) | | | (0.12 | ) | | | (0.37 | ) | | | (0.51 | ) | | | (0.28 | ) | | | (1.34 | ) |
Net asset value, end of period | | $ | 11.03 | | | $ | 11.19 | | | $ | 11.76 | | | $ | 11.81 | | | $ | 12.20 | | | $ | 11.51 | |
Total return4 | | | 2.55 | % | | | (3.84 | )% | | | 2.86 | % | | | 1.11 | % | | | 8.61 | % | | | 25.47 | % |
Ratios to average net assets (annualized) | | | | | | | | | | | | | | | | | | | | | | | | |
Gross expenses | | | 1.80 | % | | | 1.80 | % | | | 1.79 | % | | | 1.77 | % | | | 1.85 | % | | | 1.79 | % |
Net expenses | | | 1.78 | % | | | 1.78 | % | | | 1.78 | % | | | 1.77 | % | | | 1.82 | % | | | 1.79 | % |
Net investment income | | | 2.68 | % | | | 2.15 | % | | | 2.12 | % | | | 2.50 | % | | | 2.77 | % | | | 2.87 | % |
Supplemental data | | | | | | | | | | | | | | | | | | | | | | | | |
Portfolio turnover rate | | | 47 | % | | | 129 | % | | | 79 | % | | | 88 | % | | | 89 | % | | | 118 | % |
Net assets, end of period (000s omitted) | | | $13,243 | | | | $16,097 | | | | $23,448 | | | | $27,861 | | | | $30,974 | | | | $33,330 | |
| 1 | After the close of business on July 9, 2010, the Fund acquired the net assets of Evergreen International Bond Fund which became the accounting and performance survivor in the transaction. The information for the periods prior to July 12, 2010 is that of Class C of Evergreen International Bond Fund. |
| 2. | Calculated based upon average shares outstanding |
| 3. | Amount is less than$0.005 per share. |
| 4. | Total return calculations do not include any sales charges. Returns for periods of less than one year are not annualized. |
The accompanying notes are an integral part of these financial statements.
| | | | |
| 20 | | Wells Fargo Advantage International Bond Fund | | Financial highlights |
(For a share outstanding throughout each period)
| | | | | | | | |
| | | Six months ended
April 30, 2014 (unaudited) | | | Year ended | |
| CLASS R6 | | | October 31, 20131 | |
Net asset value, beginning of period | | $ | 11.36 | | | $ | 11.80 | |
Net investment income | | | 0.21 | | | | 0.39 | 2 |
Net realized and unrealized gains (losses) on investments | | | 0.13 | | | | (0.69 | ) |
| | | | | | | | |
Total from investment operations | | | 0.34 | | | | (0.30 | ) |
Distributions to shareholders from | | | | | | | | |
Net investment income | | | (0.07 | ) | | | (0.02 | ) |
Net realized gains | | | (0.39 | ) | | | (0.12 | ) |
| | | | | | | | |
Total distributions to shareholders | | | (0.46 | ) | | | (0.14 | ) |
Net asset value, end of period | | $ | 11.24 | | | $ | 11.36 | |
Total return3 | | | 3.17 | % | | | (2.52 | )% |
Ratios to average net assets (annualized) | | | | | | | | |
Gross expenses | | | 0.67 | % | | | 0.68 | % |
Net expenses | | | 0.65 | % | | | 0.65 | % |
Net investment income | | | 4.24 | % | | | 3.70 | % |
Supplemental data | | | | | | | | |
Portfolio turnover rate | | | 47 | % | | | 129 | % |
Net assets, end of period (000s omitted) | | | $2,514 | | | | $2,433 | |
| 1. | For the period from November 30, 2012 (commencement of class operations) to October 31, 2013 |
| 2. | Calculated based upon average shares outstanding |
| 3. | Returns for periods of less than one year are not annualized. |
The accompanying notes are an integral part of these financial statements.
| | | | | | |
| Financial highlights | | Wells Fargo Advantage International Bond Fund | | | 21 | |
(For a share outstanding throughout each period)
| | | | | | | | | | | | | | | | | | | | |
| | | Six months ended
April 30, 2014 (unaudited) | | | Year ended October 31 | |
| ADMINISTRATOR CLASS | | | 2013 | | | 2012 | | | 2011 | | | 20101 | |
Net asset value, beginning of period | | $ | 11.32 | | | $ | 11.81 | | | $ | 11.83 | | | $ | 12.23 | | | $ | 11.39 | |
Net investment income | | | 0.20 | | | | 0.36 | 2 | | | 0.35 | 2 | | | 0.38 | 2 | | | 0.11 | 2 |
Net realized and unrealized gains (losses) on investments | | | 0.13 | | | | (0.71 | ) | | | 0.08 | | | | (0.16 | ) | | | 0.82 | |
| | | | | | | | | | | | | | | | | | | | |
Total from investment operations | | | 0.33 | | | | (0.35 | ) | | | 0.43 | | | | 0.22 | | | | 0.93 | |
Distributions to shareholders from | | | | | | | | | | | | | | | | | | | | |
Net investment income | | | (0.07 | ) | | | (0.02 | ) | | | (0.31 | ) | | | (0.54 | ) | | | (0.09 | ) |
Net realized gains | | | (0.39 | ) | | | (0.12 | ) | | | (0.14 | ) | | | (0.08 | ) | | | 0.00 | |
| | | | | | | | | | | | | | | | | | | | |
Total distributions to shareholders | | | (0.46 | ) | | | (0.14 | ) | | | (0.45 | ) | | | (0.62 | ) | | | (0.09 | ) |
Net asset value, end of period | | $ | 11.19 | | | $ | 11.32 | | | $ | 11.81 | | | $ | 11.83 | | | $ | 12.23 | |
Total return3 | | | 3.05 | % | | | (2.98 | )% | | | 3.89 | % | | | 2.03 | % | | | 8.21 | % |
Ratios to average net assets (annualized) | | | | | | | | | | | | | | | | | | | | |
Gross expenses | | | 0.99 | % | | | 0.99 | % | | | 0.97 | % | | | 0.95 | % | | | 1.05 | % |
Net expenses | | | 0.85 | % | | | 0.85 | % | | | 0.85 | % | | | 0.85 | % | | | 0.85 | % |
Net investment income | | | 3.62 | % | | | 3.15 | % | | | 3.04 | % | | | 3.21 | % | | | 3.63 | % |
Supplemental data | | | | | | | | | | | | | | | | | | | | |
Portfolio turnover rate | | | 47 | % | | | 129 | % | | | 79 | % | | | 88 | % | | | 89 | % |
Net assets, end of period (000s omitted) | | | $356,526 | | | | $334,778 | | | | $294,330 | | | | $170,836 | | | | $4,866 | |
| 1. | For the period from July 30, 2010 (commencement of class operations) to October 31, 2010 |
| 2. | Calculated based upon average shares outstanding |
| 3. | Returns for periods of less than one year are not annualized. |
The accompanying notes are an integral part of these financial statements.
| | | | |
| 22 | | Wells Fargo Advantage International Bond Fund | | Financial highlights |
(For a share outstanding throughout each period)
| | | | | | | | | | | | | | | | | | | | | | | | |
| | | Six months ended
April 30, 2014 (unaudited) | | | Year ended October 31 | |
| INSTITUTIONAL CLASS | | | 2013 | | | 2012 | | | 2011 | | | 20101 | | | 20091 | |
Net asset value, beginning of period | | $ | 11.35 | | | $ | 11.82 | | | $ | 11.84 | | | $ | 12.23 | | | $ | 11.59 | | | $ | 10.35 | |
Net investment income | | | 0.21 | | | | 0.37 | | | | 0.36 | | | | 0.44 | | | | 0.44 | | | | 0.43 | |
Net realized and unrealized gains (losses) on investments | | | 0.12 | | | | (0.70 | ) | | | 0.09 | | | | (0.20 | ) | | | 0.65 | | | | 2.18 | |
| | | | | | | | | | | | | | | | | | | | | | | | |
Total from investment operations | | | 0.33 | | | | (0.33 | ) | | | 0.45 | | | | 0.24 | | | | 1.09 | | | | 2.61 | |
Distributions to shareholders from | | | | | | | | | | | | | | | | | | | | | | | | |
Net investment income | | | (0.07 | ) | | | (0.02 | ) | | | (0.33 | ) | | | (0.55 | ) | | | (0.45 | ) | | | (1.37 | ) |
Net realized gains | | | (0.39 | ) | | | (0.12 | ) | | | (0.14 | ) | | | (0.08 | ) | | | 0.00 | | | | 0.00 | |
| | | | | | | | | | | | | | | | | | | | | | | | |
Total distributions to shareholders | | | (0.46 | ) | | | (0.14 | ) | | | (0.47 | ) | | | (0.63 | ) | | | (0.45 | ) | | | (1.37 | ) |
Net asset value, end of period | | $ | 11.22 | | | $ | 11.35 | | | $ | 11.82 | | | $ | 11.84 | | | $ | 12.23 | | | $ | 11.59 | |
Total return2 | | | 3.07 | % | | | (2.78 | )% | | | 3.99 | % | | | 2.19 | % | | | 9.73 | % | | | 26.71 | % |
Ratios to average net assets (annualized) | | | | | | | | | | | | | | | | | | | | | | | | |
Gross expenses | | | 0.72 | % | | | 0.72 | % | | | 0.71 | % | | | 0.69 | % | | | 0.82 | % | | | 0.79 | % |
Net expenses | | | 0.70 | % | | | 0.70 | % | | | 0.71 | % | | | 0.69 | % | | | 0.80 | % | | | 0.79 | % |
Net investment income | | | 3.76 | % | | | 3.26 | % | | | 3.19 | % | | | 3.60 | % | | | 3.79 | % | | | 3.86 | % |
Supplemental data | | | | | | | | | | | | | | | | | | | | | | | | |
Portfolio turnover rate | | | 47 | % | | | 129 | % | | | 79 | % | | | 88 | % | | | 89 | % | | | 118 | % |
Net assets, end of period (000s omitted) | | | $961,640 | | | | $1,115,163 | | | | $1,270,164 | | | | $1,228,793 | | | | $1,276,184 | | | | $997,308 | |
| 1. | After the close of business on July 9, 2010, the Fund acquired the net assets of Evergreen International Bond Fund which became the accounting and performance survivor in the transaction. The information for the periods prior to July 12, 2010 is that of Class I of Evergreen International Bond Fund. |
| 2. | Returns for periods of less than one year are not annualized. |
The accompanying notes are an integral part of these financial statements.
| | | | | | |
| Notes to financial statements (unaudited) | | Wells Fargo Advantage International Bond Fund | | | 23 | |
1. ORGANIZATION
Wells Fargo Funds Trust (the “Trust”), a Delaware statutory trust organized on March 10, 1999, is an open-end management investment company registered under the Investment Company Act of 1940, as amended (the “1940 Act”). These financial statements report on the Wells Fargo Advantage International Bond Fund (the “Fund”) which is a diversified series of the Trust.
2. SIGNIFICANT ACCOUNTING POLICIES
The following significant accounting policies, which are consistently followed in the preparation of the financial statements of the Fund, are in conformity with U.S. generally accepted accounting principles which require management to make estimates and assumptions that affect the reported amounts of assets and liabilities, disclosure of contingent assets and liabilities at the date of the financial statements, and the reported amounts of revenues and expenses during the reporting period. Actual results could differ from those estimates.
Securities valuation
All investments are valued each business day as of the close of regular trading on the New York Stock Exchange (generally 4 p.m. Eastern Time).
The values of securities denominated in foreign currencies are translated into U.S. dollars at rates provided by an independent foreign currency pricing source at a time each business day specified by the Management Valuation Team of Wells Fargo Funds Management, LLC (“Funds Management”).
Fixed income securities acquired with maturities exceeding 60 days are valued based on evaluated bid prices provided by an independent pricing service which may utilize both transaction data and market information such as yield, quality, coupon rate, maturity, type of issue, trading characteristics and other market data. If prices are not available from the independent pricing service or prices received are deemed not representative of market value, prices will be obtained from an independent broker-dealer.
Short-term securities, with maturities of 60 days or less at time of purchase, generally are valued at amortized cost which approximates fair value. The amortized cost method involves valuing a security at its cost, plus accretion of discount or minus amortization of premium over the period until maturity.
Investments in registered open-end investment companies are valued at net asset value. Non-registered investment vehicles are fair valued at net asset value.
Investments which are not valued using any of the methods discussed above are valued at their fair value, as determined in good faith by the Board of Trustees of the Fund. The Board of Trustees has established a Valuation Committee comprised of the Trustees and has delegated to it the authority to take any actions regarding the valuation of portfolio securities that the Valuation Committee deems necessary or appropriate, including determining the fair value of portfolio securities, unless the determination has been delegated to the Management Valuation Team. The Board of Trustees retains the authority to make or ratify any valuation decisions or approve any changes to the Valuation Procedures as it deems appropriate. On a quarterly basis, the Board of Trustees receives reports on any valuation actions taken by the Valuation Committee or the Management Valuation Team which may include items for ratification.
Valuations of fair valued securities are compared to the next actual sales price when available, or other appropriate market values, to assess the continued appropriateness of the fair valuation methodologies used. These securities are fair valued on a day-to-day basis, taking into consideration changes to appropriate market information and any significant changes to the inputs considered in the valuation process until there is a readily available price provided on an exchange or by an independent pricing service. Valuations received from an independent pricing service or independent broker-dealer quotes are periodically validated by comparisons to most recent trades and valuations provided by other independent pricing services in addition to the review of prices by the adviser and/or subadviser. Unobservable inputs used in determining fair valuations are identified based on the type of security, taking into consideration factors utilized by market participants in valuing the investment, knowledge about the issuer and the current market environment.
Foreign currency translation
The accounting records of the Fund are maintained in U.S. dollars. The values of other assets and liabilities denominated in foreign currencies are translated into U.S. dollars at rates provided by an independent foreign currency pricing source at a time each business day specified by the Management Valuation Team. Purchases and sales of securities, and income and expenses are converted at the rate of exchange on the respective dates of such transactions. Net realized foreign exchange gains or losses arise from sales of foreign currencies, currency gains or losses realized between the trade and
| | | | |
| 24 | | Wells Fargo Advantage International Bond Fund | | Notes to financial statements (unaudited) |
settlement dates on securities transactions, and the difference between the amounts of dividends, interest and foreign withholding taxes recorded and the U.S. dollar equivalent of the amounts actually paid or received. Net unrealized foreign exchange gains and losses arise from changes in the fair value of assets and liabilities other than investments in securities resulting from changes in exchange rates. The changes in net assets arising from changes in exchange rates and the changes in net assets resulting from changes in market prices of securities are not separately presented. Such changes are included in net realized and unrealized gains or losses from investments.
Forward foreign currency contracts
The Fund is subject to foreign currency exchange rate risk in the normal course of pursuing its investment objectives. A forward foreign currency contract is an agreement between two parties to purchase or sell a specific currency for an agreed-upon price at a future date. The Fund enters into forward foreign currency contracts to facilitate transactions in foreign-denominated securities and to attempt to minimize the risk to the Fund from adverse changes in the relationship between currencies. Forward foreign currency contracts are recorded at the forward rate and marked-to-market daily. When the contracts are closed, realized gains and losses arising from such transactions are recorded as realized gains or losses on forward foreign currency contract transactions. The Fund could be exposed to risks if the counterparties to the contracts are unable to meet the terms of their contracts or if the value of the foreign currency changes unfavorably. The Fund’s maximum risk of loss from counterparty credit risk is the unrealized gains on the contracts. This risk may be mitigated if there is a master netting arrangement between the Fund and the counterparty.
Security loans
The Fund may lend its securities from time to time in order to earn additional income in the form of fees or interest on securities received as collateral or the investment of any cash received as collateral. The Fund continues to receive interest or dividends on the securities loaned. The Fund receives collateral in the form of cash or securities with a value at least equal to the value of the securities on loan. The value of the loaned securities is determined at the close of each business day and any additional required collateral is delivered to the Fund on the next business day. In a securities lending transaction, the net asset value of the Fund will be affected by an increase or decrease in the value of the securities loaned and by an increase or decrease in the value of the instrument in which collateral is invested. The amount of securities lending activity undertaken by the Fund fluctuates from time to time. In the event of default or bankruptcy by the borrower, the Fund may be prevented from recovering the loaned securities or gaining access to the collateral or may experience delays or costs in doing so. In addition, the investment of any cash collateral received may lose all or part of its value. The Fund has the right under the lending agreement to recover the securities from the borrower on demand.
The Fund lends its securities through an unaffiliated securities lending agent. Cash collateral received in connection with its securities lending transactions is invested in Wells Fargo Securities Lending Cash Investments, LLC (the “Securities Lending Fund”). The Securities Lending Fund is exempt from registration under Section 3(c)(7) of the 1940 Act and is managed by Funds Management and is subadvised by Wells Capital Management Incorporated (“WellsCap”). Funds Management receives an advisory fee starting at 0.05% and declining to 0.01% as the average daily net assets of the Securities Lending Fund increase. All of the fees received by Funds Management are paid to WellsCap for its services as subadviser. The Securities Lending Fund seeks to provide a positive return compared to the daily Fed Funds Open rate by investing in high-quality, U.S. dollar-denominated short-term money market instruments. Securities Lending Fund investments are fair valued based upon the amortized cost valuation technique. Income earned from investment in the Securities Lending Fund is included in securities lending income on the Statement of Operations.
When-issued transactions
The Fund may purchase securities on a forward commitment or when-issued basis. The Fund records a when-issued transaction on the trade date and will segregate assets in an amount at least equal in value to the Fund’s commitment to purchase when-issued securities. Securities purchased on a when-issued basis are marked-to-market daily and the Fund begins earning interest on the settlement date. Losses may arise due to changes in the market value of the underlying securities or if the counterparty does not perform under the contract.
Security transactions and income recognition
Securities transactions are recorded on a trade date basis. Realized gains or losses are recorded on the basis of identified cost.
Interest income is accrued daily and bond discounts are accreted and premiums are amortized daily based on the effective interest method. To the extent debt obligations are placed on non-accrual status, any related interest income may be reduced by writing off interest receivables when the collection of all or a portion of interest has become doubtful based on consistently applied procedures. If the issuer subsequently resumes interest payments or when the collectability of interest is reasonably assured, the debt obligation is removed from non-accrual status.
| | | | | | |
| Notes to financial statements (unaudited) | | Wells Fargo Advantage International Bond Fund | | | 25 | |
Income from foreign securities is recorded net of foreign taxes withheld where recovery of such taxes is not assured.
Distributions to shareholders
Distributions to shareholders from net investment income and net realized gains, if any, are recorded on the ex-dividend date. Such distributions are determined in conformity with federal income tax regulations, which may differ in amount or character from net investment income and realized gains recognized for purposes of U.S. generally accepted accounting principles.
Federal and other taxes
The Fund intends to continue to qualify as a regulated investment company by distributing substantially all of its investment company taxable income and any net realized capital gains (after reduction for capital loss carryforwards) sufficient to relieve it from all, or substantially all, federal income taxes. Accordingly, no provision for federal income taxes was required.
The Fund’s income and federal excise tax returns and all financial records supporting those returns for the prior three fiscal years are subject to examination by the federal and Delaware revenue authorities. Management has analyzed the Fund’s tax positions taken on federal, state, and foreign tax returns for all open tax years and does not believe that there are any uncertain tax positions that require recognition of a tax liability.
Class allocations
The separate classes of shares offered by the Fund differ principally in applicable sales charges, distribution, shareholder servicing, and administration fees. Shareholders of each class bear certain expenses that pertain to that particular class. All shareholders bear the common expenses of the Fund, earn income from the portfolio, and are allocated any unrealized gains and losses pro rata based on the average daily net assets of each class, without distinction between share classes. Dividends are determined separately for each class based on income and expenses allocable to each class. Realized gains and losses are allocated to each class pro rata based upon the net assets of each class on the date realized. Differences in per share dividend rates generally result from the relative weightings of pro rata income and realized gain allocations and from differences in separate class expenses, including distribution, shareholder servicing, and administration fees.
3. FAIR VALUATION MEASUREMENTS
Fair value measurements of investments are determined within a framework that has established a fair value hierarchy based upon the various data inputs utilized in determining the value of the Fund’s investments. The three-level hierarchy gives the highest priority to unadjusted quoted prices in active markets for identical assets or liabilities (Level 1) and the lowest priority to significant unobservable inputs (Level 3). The Fund’s investments are classified within the fair value hierarchy based on the lowest level of input that is significant to the fair value measurement. The inputs are summarized into three broad levels as follows:
| n | | Level 1 – quoted prices in active markets for identical securities |
| n | | Level 2 – other significant observable inputs (including quoted prices for similar securities, interest rates, prepayment speeds, credit risk, use of amortized cost, etc.) |
| n | | Level 3 – significant unobservable inputs (including the Fund’s own assumptions in determining the fair value of investments) |
The inputs or methodologies used for valuing investments in securities are not necessarily an indication of the risk associated with investing in those securities.
| | | | |
| 26 | | Wells Fargo Advantage International Bond Fund | | Notes to financial statements (unaudited) |
As of April 30, 2014, the inputs used in valuing investments in securities were as follows:
| | | | | | | | | | | | | | | | |
| Investments in securities | | Quoted prices (Level 1) | | | Other significant observable inputs (Level 2) | | | Significant unobservable inputs (Level 3) | | | Total | |
Corporate bonds and notes | | $ | 0 | | | $ | 2,531,766 | | | $ | 0 | | | $ | 2,531,766 | |
Foreign corporate bonds and notes | | | 0 | | | | 283,940,100 | | | | 0 | | | | 283,940,100 | |
Foreign government bonds | | | 0 | | | | 1,055,934,808 | | | | 0 | | | | 1,055,934,808 | |
Yankee corporate bonds and notes | | | 0 | | | | 42,201,713 | | | | 0 | | | | 42,201,713 | |
Short-term investments | | | | | | | | | | | | | | | | |
Investment companies | | | 29,113,447 | | | | 0 | | | | 0 | | | | 29,113,447 | |
| | | $ | 29,113,447 | | | $ | 1,384,608,387 | | | $ | 0 | | | $ | 1,413,721,834 | |
As of April 30, 2014, the inputs used in valuing the Fund’s other financial instruments were as follows:
| | | | | | | | | | | | | | | | |
| Other financial instruments | | Quoted prices (Level 1) | | | Other significant observable inputs (Level 2) | | | Significant
unobservable inputs (Level 3) | | | Total | |
Forward foreign currency contracts | | $ | 0 | | | $ | (10,671,948 | )* | | $ | 0 | | | $ | (10,671,948 | ) |
| * | Amount represents the net unrealized losses. |
Transfers in and transfers out are recognized at the end of the reporting period. For the six months ended April 30, 2014, the Fund did not have any transfers into/out of Level 1, Level 2, or Level 3.
4. TRANSACTIONS WITH AFFILIATES AND OTHER EXPENSES
Advisory fee
The Trust has entered into an advisory contract with Funds Management, an indirect wholly owned subsidiary of Wells Fargo & Company (“Wells Fargo”). The adviser is responsible for implementing investment policies and guidelines and for supervising the subadviser, who is responsible for day-to-day portfolio management of the Fund.
Pursuant to the contract, Funds Management is entitled to receive an annual advisory fee starting at 0.55% and declining to 0.45% as the average daily net assets of the Fund increase. For the six months ended April 30, 2014, the advisory fee was equivalent to an annual rate of 0.53% of the Fund’s average daily net assets.
Funds Management has retained the services of a subadviser to provide daily portfolio management to the Fund. The fee for subadvisory services is borne by Funds Management. First International Advisors, LLC, an affiliate of Funds Management and an indirect wholly owned subsidiary of Wells Fargo, is the subadviser to the Fund and is entitled to receive a fee from Funds Management at an annual rate starting at 0.35% and declining to 0.20% as the average daily net assets of the Fund increase.
Administration and transfer agent fees
The Trust has entered into an administration agreement with Funds Management. Under this agreement, for providing administrative services, which includes paying fees and expenses for services provided by the transfer agent, sub-transfer agents, omnibus account servicers and record-keepers, Funds Management is entitled to receive from the Fund an annual fund level administration fee starting at 0.05% and declining to 0.03% as the average daily net assets of the Fund increase and a class level administration fee which is calculated based on the average daily net assets of each class as follows:
| | | | |
| | | Class level
administration fee | |
Class A, Class B, Class C | | | 0.16 | % |
Class R6 | | | 0.03 | |
Administrator Class | | | 0.10 | |
Institutional Class | | | 0.08 | |
| | | | | | |
| Notes to financial statements (unaudited) | | Wells Fargo Advantage International Bond Fund | | | 27 | |
Funds Management has contractually waived and/or reimbursed advisory and administration fees to the extent necessary to maintain certain net operating expense ratios for the Fund. Waiver of fees and/or reimbursement of expenses by Funds Management were made first from fund level expenses on a proportionate basis and then from class specific expenses. Funds Management has committed through Febraury 28, 2015 to waive fees and/or reimburse expenses to the extent necessary to cap the Fund’s expenses at 1.03% for Class A shares, 1.78% for Class B shares, 1.78% for Class C shares, 0.65% for Class R6 shares, 0.85% for Administrator Class shares, and 0.70% for Institutional Class shares.
Distribution fees
The Trust has adopted a Distribution Plan for Class B and Class C shares of the Fund pursuant to Rule 12b-1 under the 1940 Act. Distribution fees are charged to Class B and Class C shares and paid to Wells Fargo Funds Distributor, LLC, the principal underwriter, at an annual rate of 0.75% of the average daily net assets of Class B and Class C shares.
For the six months ended April 30, 2014, Wells Fargo Funds Distributor, LLC received $1,077 from the sale of Class A shares and $11 in contingent deferred sales charges from redemptions of Class B shares.
Shareholder servicing fees
The Trust has entered into contracts with one or more shareholder servicing agents, whereby Class A, Class B, Class C, and Administrator Class of the Fund is charged a fee at an annual rate of 0.25% of the average daily net assets of each respective class.
A portion of these total shareholder servicing fees were paid to affiliates of Wells Fargo.
5. INVESTMENT PORTFOLIO TRANSACTIONS
Purchases and sales of investments, excluding U.S. government obligations (if any) and short-term securities, for the six months ended April 30, 2014 were $658,235,164 and $838,656,331, respectively.
6. DERIVATIVE TRANSACTIONS
During the six months ended April 30, 2014, the Fund entered into forward foreign currency exchange contracts for economic hedging purposes.
At April 30, 2014, the Fund had forward foreign currency contracts outstanding as follows:
Forward foreign currency contracts to buy:
| | | | | | | | | | | | | | | | | | |
| Exchange date | | Counterparty | | Contracts to receive | | | U.S. value at
April 30, 2014 | | | In exchange
for U.S. $ | | | Unrealized
gains
(losses) | |
| 5-7-2014 | | State Street Bank | | | 4,090,000,000 | JPY | | $ | 40,007,084 | | | $ | 40,169,320 | | | $ | (162,236 | ) |
| 5-7-2014 | | State Street Bank | | | 7,830,000,000 | JPY | | | 76,590,579 | | | | 77,496,056 | | | | (905,477 | ) |
| 5-12-2014 | | State Street Bank | | | 221,750,000 | NOK | | | 37,294,275 | | | | 37,168,957 | | | | 125,318 | |
| 5-20-2014 | | State Street Bank | | | 9,300,000 | MYR | | | 2,844,921 | | | | 2,804,161 | | | | 40,760 | |
| 5-27-2014 | | State Street Bank | | | 7,350,000 | MXN | | | 560,808 | | | | 550,383 | | | | 10,425 | |
| 5-27-2014 | | State Street Bank | | | 340,000,000 | HUF | | | 1,535,990 | | | | 1,501,767 | | | | 34,223 | |
| 6-9-2014 | | State Street Bank | | | 6,275,000 | PLN | | | 2,067,946 | | | | 2,045,373 | | | | 22,573 | |
| 6-11-2014 | | State Street Bank | | | 5,950,000 | ZAR | | | 562,254 | | | | 551,347 | | | | 10,907 | |
| 6-11-2014 | | State Street Bank | | | 4,196,191,660 | JPY | | | 41,054,403 | | | | 41,268,604 | | | | (214,201 | ) |
| 6-11-2014 | | State Street Bank | | | 3,750,000 | MYR | | | 1,145,318 | | | | 1,158,122 | | | | (12,804 | ) |
| 6-11-2014 | | State Street Bank | | | 1,115,000 | GBP | | | 1,881,977 | | | | 1,848,770 | | | | 33,207 | |
| 6-16-2014 | | State Street Bank | | | 110,000,000 | EUR | | | 152,592,887 | | | | 152,024,290 | | | | 568,597 | |
| 6-17-2014 | | State Street Bank | | | 3,500,000,000 | JPY | | | 34,244,221 | | | | 34,465,441 | | | | (221,220 | ) |
| 6-30-2014 | | State Street Bank | | | 8,477,500,000 | JPY | | | 82,950,533 | | | | 83,385,383 | | | | (434,850 | ) |
| 6-30-2014 | | State Street Bank | | | 6,565,000,000 | JPY | | | 64,237,128 | | | | 64,188,429 | | | | 48,699 | |
| 7-7-2014 | | State Street Bank | | | 212,500,000 | MYR | | | 64,772,762 | | | | 65,436,965 | | | | (664,203 | ) |
| 7-10-2014 | | State Street Bank | | | 27,650,000 | RUB | | | 762,772 | | | | 754,434 | | | | 8,338 | |
| 7-10-2014 | | State Street Bank | | | 50,250,000 | RUB | | | 1,386,231 | | | | 1,375,958 | | | | 10,273 | |
| 7-10-2014 | | State Street Bank | | | 377,000,000 | RUB | | | 10,400,180 | | | | 10,382,815 | | | | 17,365 | |
| | | | |
| 28 | | Wells Fargo Advantage International Bond Fund | | Notes to financial statements (unaudited) |
| | | | | | | | | | | | | | | | | | |
| Exchange date | | Counterparty | | Contracts to receive | | | U.S. value at
April 30, 2014 | | | In exchange
for U.S. $ | | | Unrealized
gains
(losses) | |
| 7-10-2014 | | State Street Bank | | | 13,750,000 | RUB | | $ | 379,317 | | | $ | 378,892 | | | $ | 425 | |
| 7-10-2014 | | State Street Bank | | | 154,000,000 | RUB | | | 4,248,349 | | | | 4,195,042 | | | | 53,307 | |
| 7-10-2014 | | State Street Bank | | | 153,500,000 | RUB | | | 4,234,556 | | | | 4,191,699 | | | | 42,857 | |
| 7-10-2014 | | State Street Bank | | | 192,500,000 | RUB | | | 5,310,437 | | | | 5,299,235 | | | | 11,202 | |
| 7-10-2014 | | State Street Bank | | | 192,300,000 | RUB | | | 5,304,919 | | | | 5,295,916 | | | | 9,003 | |
| 7-28-2014 | | State Street Bank | | | 38,500,000 | CAD | | | 35,053,068 | | | | 34,827,446 | | | | 225,622 | |
| | | | | | | | | | | | | | | | | | | | | | |
| Exchange date | | Counterparty | | Contracts to
receive | | | U.S. value at
April 30, 2014 | | | In exchange
for | | | U.S. value at
April 30, 2014 | | | Unrealized
gains (losses) | |
| 6-17-2014 | | State Street Bank | | | 44,900,000 | AUD | | $ | 41,580,958 | | | | 4,146,532,960 | JPY | | $ | 40,569,941 | | | $ | 1,011,017 | |
| 5-12-2014 | | State Street Bank | | | 26,258,284 | EUR | | | 36,428,819 | | | | 221,750,000 | NOK | | | 37,294,275 | | | | (865,456 | ) |
| 5-27-2014 | | State Street Bank | | | 16,225,000 | GBP | | | 27,388,912 | | | | 19,553,847 | EUR | | | 27,126,628 | | | | 262,284 | |
| 6-11-2014 | | State Street Bank | | | 24,340,000 | GBP | | | 41,082,808 | | | | 4,196,191,660 | JPY | | | 41,054,403 | | | | 28,405 | |
Forward foreign currency contracts to sell:
| | | | | | | | | | | | | | | | | | |
| Exchange date | | Counterparty | | Contracts to
deliver | | | U.S. value at
April 30, 2014 | | | In exchange
for U.S. $ | | | Unrealized
losses | |
| 5-13-2014 | | State Street Bank | | | 194,000,000 | PLN | | $ | 64,043,346 | | | $ | 63,498,402 | | | $ | (544,944 | ) |
| 5-20-2014 | | State Street Bank | | | 9,300,000 | MYR | | | 2,844,921 | | | | 2,824,430 | | | | (20,491 | ) |
| 5-27-2014 | | State Street Bank | | | 340,000,000 | HUF | | | 1,535,990 | | | | 1,475,573 | | | | (60,417 | ) |
| 5-27-2014 | | State Street Bank | | | 7,350,000 | MXN | | | 560,808 | | | | 550,430 | | | | (10,378 | ) |
| 5-27-2014 | | State Street Bank | | | 14,900,000 | GBP | | | 25,152,221 | | | | 24,843,217 | | | | (309,004 | ) |
| 6-9-2014 | | State Street Bank | | | 2,850,000 | PLN | | | 939,226 | | | | 928,112 | | | | (11,114 | ) |
| 6-11-2014 | | State Street Bank | | | 8,165,000 | GBP | | | 13,781,476 | | | | 13,550,226 | | | | (231,250 | ) |
| 6-11-2014 | | State Street Bank | | | 5,950,000 | ZAR | | | 562,254 | | | | 545,197 | | | | (17,057 | ) |
| 6-13-2014 | | State Street Bank | | | 84,500,000 | NZD | | | 72,608,953 | | | | 71,255,555 | | | | (1,353,398 | ) |
| 6-16-2014 | | State Street Bank | | | 9,988,636 | EUR | | | 13,856,317 | | | | 13,800,000 | | | | (56,317 | ) |
| 6-16-2014 | | State Street Bank | | | 30,700,000 | TRY | | | 14,369,865 | | | | 13,230,728 | | | | (1,139,137 | ) |
| 6-16-2014 | | State Street Bank | | | 24,900,039 | EUR | | | 34,541,535 | | | | 34,500,000 | | | | (41,535 | ) |
| 6-16-2014 | | State Street Bank | | | 33,785,000 | TRY | | | 15,813,873 | | | | 15,593,701 | | | | (220,172 | ) |
| 6-17-2014 | | State Street Bank | | | 143,750,000 | AUD | | | 133,123,893 | | | | 129,007,000 | | | | (4,116,893 | ) |
| 6-30-2014 | | State Street Bank | | | 2,135,000 | TRY | | | 995,783 | | | | 984,007 | | | | (11,776 | ) |
| 6-30-2014 | | State Street Bank | | | 4,250,000 | ZAR | | | 400,365 | | | | 394,989 | | | | (5,376 | ) |
| 6-30-2014 | | State Street Bank | | | 259,100,000 | ZAR | | | 24,408,119 | | | | 23,870,284 | | | | (537,835 | ) |
| 6-30-2014 | | State Street Bank | | | 159,700,000 | ZAR | | | 15,044,294 | | | | 14,991,955 | | | | (52,339 | ) |
| 7-7-2014 | | State Street Bank | | | 212,500,000 | MYR | | | 64,772,762 | | | | 64,366,632 | | | | (406,130 | ) |
| 7-10-2014 | | State Street Bank | | | 41,400,000 | RUB | | | 1,142,089 | | | | 1,134,247 | | | | (7,842 | ) |
| 7-10-2014 | | State Street Bank | | | 1,175,950,000 | RUB | | | 32,440,562 | | | | 32,182,540 | | | | (258,022 | ) |
| 7-31-2014 | | State Street Bank | | | 435,000,000 | SEK | | | 66,805,687 | | | | 66,450,806 | | | | (354,881 | ) |
The Fund had average contract amounts of $933,012,445 and $650,831,062 in forward foreign currency contracts to buy and forward foreign currency contracts to sell, respectively, during the six months ended April 30, 2014.
The fair value, realized gains or losses and change in unrealized gains or losses, if any, on derivative instruments are reflected in the appropriate financial statements.
For certain types of derivative transactions, the Fund has entered into International Swaps and Derivatives Association, Inc. master agreements (“ISDA Master Agreements”) or similar agreements with approved counterparties. The ISDA Master Agreements or similar agreements may have requirements to deliver/deposit securities or cash to/with an
| | | | | | |
| Notes to financial statements (unaudited) | | Wells Fargo Advantage International Bond Fund | | | 29 | |
exchange or broker-dealer as collateral and allows the Fund to offset, with each counterparty, certain derivative financial instrument’s assets and/or liabilities with collateral held or pledged. Collateral requirements differ by type of derivative. Collateral or margin requirements are set by the broker or exchange clearing house for exchange traded derivatives while collateral terms are contract specific for over-the-counter traded derivatives. Cash collateral that has been pledged to cover obligations of the Fund under the ISDA Master Agreements or similar agreements, if any, will be reported separately in the Statement of Assets and Liabilities. Securities pledged as collateral, if any, for the same purpose are noted in the Portfolio of Investments. With respect to balance sheet offsetting, absent an event of default by the counterparty or a termination of the agreement, the reported amounts of financial assets and financial liabilities in the Statement of Assets and Liabilities are not offset across transactions between the Fund and the applicable counterparty. A reconciliation of the gross amounts on the Statement of Assets and Liabilities to the net amounts by derivative type, including any collateral exposure, is as follows:
| | | | | | | | | | | | | | | | |
| Derivative type | | Counterparty | | Gross amounts of
assets in the
Statement of
Assets and
Liabilities | | Amounts
subject to
netting
agreements | | | Collateral
received | | | Netamount
of assets | |
Forward foreign currency contracts | | State Street Bank | | $2,574,807* | | $ | (2,574,807 | ) | | $ | 0 | | | $ | 0 | |
* Amount represents net unrealized gains. | |
| Derivative type | | Counterparty | | Gross amounts
of liabilities in the
Statement of
Assets and
Liabilities | | Amounts
subject to
netting
agreements | | | Collateral
pledged | | | Netamount
of liabilities | |
Forward foreign currency contracts | | State Street Bank | | $13,246,755** | | $ | (2,574,807 | ) | | $ | 0 | | | $ | 10,671,948 | |
** Amount represents net unrealized losses. | |
7. BANK BORROWINGS
The Trust (excluding the money market funds and certain other funds in the Trust) and Wells Fargo Variable Trust are parties to a $150,000,000 revolving credit agreement with State Street Bank and Trust Company, whereby the Fund is permitted to use bank borrowings for temporary or emergency purposes, such as to fund shareholder redemption requests. Interest under the credit agreement is charged to the Fund based on a borrowing rate equal to the higher of the Federal Funds rate in effect on that day plus 1.25% or the overnight LIBOR rate in effect on that day plus 1.25%. In addition, an annual commitment fee equal to 0.10% of the unused balance is allocated to each participating fund. For the six months ended April 30, 2014, the Fund paid $773 in commitment fees.
During the six months ended April 30, 2014, the Fund had average borrowings outstanding of $379,270 (on an annualized basis) at an average rate of 1.37% and paid interest in the amount of $5,196.
8. INDEMNIFICATION
Under the Trust’s organizational documents, the officers and Trustees are indemnified against certain liabilities that may arise out of performance of their duties to the Trust. Additionally, in the normal course of business, the Trust may enter into contracts with service providers that contain a variety of indemnification clauses. The Trust’s maximum exposure under these arrangements is dependent on future claims that may be made against the Fund and, therefore, cannot be estimated.
9. SUBSEQUENT DISTRIBUTIONS
On June 24, 2014, the Fund declared distributions from net investment to shareholders of record on June 23, 2014. The per share amounts payable on June 25, 2014 were as follows:
| | |
| | | Net
investment
income |
Class A | | $0.00723 |
Class B | | 0.00000 |
Class C | | 0.00000 |
Class R6 | | 0.02656 |
Administrator Class | | 0.01673 |
Institutional Class | | 0.02375 |
These distributions are not reflected in the accompanying financial statements. The final determination of the source of all distributions is subject to change and made after the Fund’s tax year-end.
| | | | |
| 30 | | Wells Fargo Advantage International Bond Fund | | Other information (unaudited) |
PROXY VOTING INFORMATION
A description of the policies and procedures that the Fund uses to determine how to vote proxies relating to portfolio securities is available without charge, upon request, by calling 1-800-222-8222, visiting our website at wellsfargoadvantagefunds.com, or visiting the SEC website at sec.gov. Information regarding how the Fund voted proxies relating to portfolio securities during the most recent 12-month period ended June 30 is available without charge on the Fund’s website at wellsfargoadvantagefunds.com or by visiting the SEC website at sec.gov.
PORTFOLIO HOLDINGS INFORMATION
The complete portfolio holdings for the Fund are publicly available on the Fund’s website (wellsfargoadvantagefunds.com) on a monthly, 30-day or more delayed basis. In addition, top ten holdings information for the Fund is publicly available on the Fund’s website on a monthly, seven-day or more delayed basis. The Fund files its complete schedule of portfolio holdings with the SEC for the first and third quarters of each fiscal year on Form N-Q, which is available without charge by visiting the SEC website at sec.gov. In addition, the Fund’s Form N-Q may be reviewed and copied at the SEC’s Public Reference Room in Washington, DC, and at regional offices in New York City, at 233 Broadway, and in Chicago, at 175 West Jackson Boulevard, Suite 900. Information about the Public Reference Room may be obtained by calling 1-800-SEC-0330.
| | | | | | |
| Other information (unaudited) | | Wells Fargo Advantage International Bond Fund | | | 31 | |
BOARD OF TRUSTEES AND OFFICERS
Each of the Trustees and Officers1 listed in the table below acts in identical capacities for each fund in the Wells Fargo Advantage family of funds, which consists of 132 mutual funds comprising the Wells Fargo Funds Trust, Wells Fargo Variable Trust, Wells Fargo Master Trust and four closed-end funds (collectively the “Fund Complex”). This table should be read in conjunction with the Prospectus and the Statement of Additional Information2. All of the Trustees are also Members of the Audit and Governance Committees of each Trust in the Fund Complex. The mailing address of each Trustee and Officer is 525 Market Street, 12th Floor, San Francisco, CA 94105. Each Trustee and Officer serves an indefinite term, however, each Trustee serves such term until reaching the mandatory retirement age established by the Trustees.
Independent Trustees
| | | | | | |
Name and year of birth | | Position held and length of service* | | Principal occupations during past five years | | Other directorships during past five years |
Peter G. Gordon
(Born 1942) | | Trustee, since 1998; Chairman, since 2005 | | Co-Founder, Retired Chairman, President and CEO of Crystal Geyser Water Company. Trustee Emeritus, Colby College. | | Asset Allocation Trust |
Isaiah Harris, Jr.
(Born 1952) | | Trustee, since 2009 | | Retired. Prior thereto, President and CEO of BellSouth Advertising and Publishing Corp. from 2005 to 2007, President and CEO of BellSouth Enterprises from 2004 to 2005 and President of BellSouth Consumer Services from 2000 to 2003. Emeritus member of the Iowa State University Foundation Board of Governors. Emeritus Member of the Advisory Board of Iowa State University School of Business. Advisory Board Member, Palm Harbor Academy (charter school). Mr. Harris is a certified public accountant. | | CIGNA Corporation; Deluxe Corporation; Asset Allocation Trust |
Judith M. Johnson
(Born 1949) | | Trustee, since 2008; Audit Committee Chairman, since 2008 | | Retired. Prior thereto, Chief Executive Officer and Chief Investment Officer of Minneapolis Employees Retirement Fund from 1996 to 2008. Ms. Johnson is an attorney, certified public accountant and a certified managerial accountant. | | Asset Allocation Trust |
Leroy Keith, Jr.
(Born 1939) | | Trustee, since 2010 | | Chairman, Bloc Global Services (development and construction). Trustee of the Evergreen Funds from 1983 to 2010. Former Managing Director, Almanac Capital Management (commodities firm), former Partner, Stonington Partners, Inc. (private equity fund), former Director, Obagi Medical Products Co. and former Director, Lincoln Educational Services. | | Trustee, Virtus Fund Complex (consisting of 50 portfolios as of 12/16/2013); Asset Allocation Trust |
David F. Larcker
(Born 1950) | | Trustee, since 2009 | | James Irvin Miller Professor of Accounting at the Graduate School of Business, Stanford University, Morgan Stanley Director of the Center for Leadership Development and Research and Senior Faculty of The Rock Center for Corporate Governance since 2006. From 2005 to 2008, Professor of Accounting at the Graduate School of Business, Stanford University. Prior thereto, Ernst & Young Professor of Accounting at The Wharton School, University of Pennsylvania from 1985 to 2005. | | Asset Allocation Trust |
Olivia S. Mitchell
(Born 1953) | | Trustee, since 2006 | | International Foundation of Employee Benefit Plans Professor, Wharton School of the University of Pennsylvania since 1993. Director of Wharton’s Pension Research Council and Boettner Center on Pensions & Retirement Research, and Research Associate at the National Bureau of Economic Research. Previously, Cornell University Professor from 1978 to 1993. | | Asset Allocation Trust |
Timothy J. Penny
(Born 1951) | | Trustee, since 1996 | | President and CEO of Southern Minnesota Initiative Foundation, a non-profit organization, since 2007 and Senior Fellow at the Humphrey Institute Policy Forum at the University of Minnesota since 1995. Member of the Board of Trustees of NorthStar Education Finance, Inc., a non-profit organization, since 2007. | | Asset Allocation Trust |
| | | | |
| 32 | | Wells Fargo Advantage International Bond Fund | | Other information (unaudited) |
| | | | | | |
Name and year of birth | | Position held and length of service* | | Principal occupations during past five years | | Other directorships during past five years |
Michael S. Scofield
(Born 1943) | | Trustee, since 2010 | | Served on the Investment Company Institute’s Board of Governors and Executive Committee from 2008-2011 as well the Governing Council of the Independent Directors Council from 2006-2011 and the Independent Directors Council Executive Committee from 2008-2011. Chairman of the IDC from 2008-2010. Institutional Investor (Fund Directions) Trustee of Year in 2007. Trustee of the Evergreen Funds (and its predecessors) from 1984 to 2010. Chairman of the Evergreen Funds from 2000-2010. Former Trustee of the Mentor Funds. Retired Attorney, Law Offices of Michael S. Scofield. | | Asset Allocation Trust |
Donald C. Willeke
(Born 1940) | | Trustee, since 1996 | | Principal of the law firm of Willeke & Daniels. General Counsel of the Minneapolis Employees Retirement Fund from 1984 until its consolidation into the Minnesota Public Employees Retirement Association on June 30, 2010. Director and Vice Chair of The Tree Trust (non-profit corporation). Director of the American Chestnut Foundation (non-profit corporation). | | Asset Allocation Trust |
| * | Length of service dates reflect the Trustee’s commencement of service with the Trust’s predecessor entities, where applicable. |
Officers
| | | | | | |
Name and year of birth | | Position held and length of service | | Principal occupations during past five years | | |
Karla M. Rabusch
(Born 1959) | | President, since 2003 | | Executive Vice President of Wells Fargo Bank, N.A. and President of Wells Fargo Funds Management, LLC since 2003. | | |
Nancy Wiser1 (Born 1967) | | Treasurer, since 2012 | | Executive Vice President of Wells Fargo Funds Management, LLC since 2011. Chief Operating Officer and Chief Compliance Officer at LightBox Capital Management LLC, from 2008 to 2011. Owned and operated a consulting business providing services to various hedge funds including acting as Chief Operating Officer and Chief Compliance Officer for a hedge fund from 2007 to 2008. Chief Operating Officer and Chief Compliance Officer of GMN Capital LLC from 2006 to 2007. | | |
C. David Messman (Born 1960) | | Secretary, since 2000; Chief Legal Officer, since 2003 | | Senior Vice President and Secretary of Wells Fargo Funds Management, LLC since 2001. Vice President and Managing Counsel of Wells Fargo Bank, N.A. since 1996. | | |
Debra Ann Early (Born 1964) | | Chief Compliance Officer, since 2007 | | Chief Compliance Officer of Wells Fargo Funds Management, LLC since 2007. Chief Compliance Officer of Parnassus Investments from 2005 to 2007. Chief Financial Officer of Parnassus Investments from 2004 to 2007. | | |
David Berardi (Born 1975) | | Assistant Treasurer, since 2009 | | Vice President of Wells Fargo Funds Management, LLC since 2009. Vice President of Evergreen Investment Management Company, LLC from 2008 to 2010. Assistant Vice President of Evergreen Investment Services, Inc. from 2004 to 2008. Manager of Fund Reporting and Control for Evergreen Investment Management Company, LLC from 2004 to 2010. | | |
Jeremy DePalma1 (Born 1974) | | Assistant Treasurer, since 2009 | | Senior Vice President of Wells Fargo Funds Management, LLC since 2009. Senior Vice President of Evergreen Investment Management Company, LLC from 2008 to 2010. Vice President, Evergreen Investment Services, Inc. from 2004 to 2007. Head of the Fund Reporting and Control Team within Fund Administration from 2005 to 2010. | | |
| 1. | Nancy Wiser acts as Treasurer of 73 funds in the Fund Complex. Jeremy DePalma acts as Treasurer of 59 funds and Assistant Treasurer of 73 funds in the Fund Complex. |
| 2. | The Statement of Additional Information includes additional information about the Trustees and is available, without charge, upon request, by calling 1-800-222-8222 or by visiting the website at wellsfargoadvantagefunds.com. |
| | | | | | |
| Other information (unaudited) | | Wells Fargo Advantage International Bond Fund | | | 33 | |
BOARD CONSIDERATION OF INVESTMENT ADVISORY AND SUB-ADVISORY AGREEMENTS:
Under Section 15 of the Investment Company Act of 1940 (the “1940 Act”), the Board of Trustees (the “Board”) of Wells Fargo Funds Trust (the “Trust”), all the members of which have no direct or indirect interest in the investment advisory and sub-advisory agreements and are not “interested persons” of the Trust, as defined in the 1940 Act (the “Independent Trustees”), must determine whether to approve the continuation of the Trust’s investment advisory and sub-advisory agreements. In this regard, at an in-person meeting held on March 27-28, 2014 (the “Meeting”), the Board reviewed: (i) an investment advisory agreement with Wells Fargo Funds Management, LLC (“Funds Management”) for Wells Fargo Advantage International Bond Fund (the “Fund”) and (ii) an investment sub-advisory agreement with First International Advisors, LLC (the “Sub-Adviser”), an affiliate of Funds Management, for the Fund. The investment advisory agreement with Funds Management and the investment sub-advisory agreement with the Sub-Adviser are collectively referred to as the “Advisory Agreements.”
At the Meeting, the Board considered the factors and reached the conclusions described below relating to the selection of Funds Management and the Sub-Adviser and the continuation of the Advisory Agreements. Prior to the Meeting, the Trustees conferred extensively among themselves and with representatives of Funds Management about these matters. Also, the Board has adopted a team-based approach, with each team consisting of a sub-set of Trustees, to assist the full Board in the discharge of its duties in reviewing performance and other matters throughout the year. The Independent Trustees were assisted in their evaluation of the Advisory Agreements by independent legal counsel, from whom they received separate legal advice and with whom they met separately.
In providing information to the Board, Funds Management and the Sub-Adviser were guided by a detailed set of requests for information submitted to them by independent legal counsel on behalf of the Independent Trustees at the start of the Board’s annual contract renewal process earlier in 2014. In considering and approving the Advisory Agreements, the Trustees considered the information they believed relevant, including but not limited to the information discussed below. The Board considered not only the specific information presented in connection with the Meeting, but also the knowledge gained over time through interaction with Funds Management and the Sub-Adviser about various topics. In this regard, the Board reviewed reports of Funds Management at each of its quarterly meetings, which included, among other things, portfolio reviews and performance reports. In addition, the Board and the teams mentioned above confer with portfolio managers at various times throughout the year. The Board did not identify any particular information or consideration that was all-important or controlling, and each individual Trustee may have attributed different weights to various factors.
After its deliberations, the Board unanimously approved the continuation of the Advisory Agreements and determined that the compensation payable to Funds Management and the Sub-Adviser is reasonable. The Board considered the continuation of the Advisory Agreements for the Fund as part of its consideration of the continuation of advisory agreements for funds across the complex, but its approvals were made on a fund-by-fund basis. The following summarizes a number of important, but not necessarily all, factors considered by the Board in support of its approvals.
Nature, Extent and Quality of Services
The Board received and considered various information regarding the nature, extent and quality of services provided to the Fund by Funds Management and the Sub-Adviser under the Advisory Agreements. This information included, among other things, a summary of the background and experience of senior management of Funds Management, and the qualifications, background, tenure and responsibilities of each of the portfolio managers primarily responsible for the day-to-day portfolio management of the Fund.
The Board evaluated the ability of Funds Management and the Sub-Adviser to attract and retain qualified investment professionals, including research, advisory and supervisory personnel. The Board further considered the compliance programs and compliance records of Funds Management and the Sub-Adviser. In addition, the Board took into account the full range of services provided to the Fund by Funds Management and its affiliates.
Fund Performance and Expenses
The Board considered the performance results for the Fund over various time periods ended December 31, 2013. The Board also considered these results in comparison to the performance of funds in a universe that was determined by Lipper Inc. (“Lipper”) to be similar to the Fund (the “Universe”), and in comparison to the Fund’s benchmark index and to other comparative data. Lipper is an independent provider of investment company data. The Board received a description of the methodology used by Lipper to select the mutual funds in the performance Universe. The Board noted that the performance of the Fund (Class A) was higher than than the average performance of the Universe for the ten-year period under review, and lower than the average performance of the Universe for the one-, three-, and five-year
| | | | |
| 34 | | Wells Fargo Advantage International Bond Fund | | Other information (unaudited) |
periods under review. The Board also noted that the performance of the Fund higher than or in range of its benchmark, the BofA Merrill Lynch Global Broad Market ex US Index, for the three-, five-, and ten-year periods under review, and lower than its benchmark for the one-year period under review.
The Board received an analysis of, and discussed factors contributing to, the underperformance of the Fund relative to the Universe for the one-, three-, and five-year periods under review and relative to its benchmark for the one-year period under review. Funds Management advised the Board about the market conditions and investment decisions that it believed contributed to the underperformance. The Board was satisfied with the explanation of factors contributing to underperformance and with the steps being taken by Funds Management and the Sub-Adviser to address the Fund’s investment performance.
The Board also received and considered information regarding the Fund’s net operating expense ratios and their various components, including actual management fees (which reflect fee waivers, if any, and include advisory, administration and transfer agent fees), custodian and other non-management fees, Rule 12b-1 and non-Rule 12b-1 service fees and fee waiver and expense reimbursement arrangements. The Board considered these ratios in comparison to the median ratios of funds in class-specific expense groups that were determined by Lipper to be similar to the Fund (the “Groups”). The Board received a description of the methodology used by Lipper to select the mutual funds in the expense Groups and an explanation of year-to-year variations in the funds comprising such expense Groups and their expense ratios. Based on the Lipper reports, the Board noted that the net operating expense ratios of the Fund were lower than or in range of the median net operating expense ratios of the expense Groups.
Based on its consideration of the factors and information it deemed relevant, including those described here, the Board concluded that the overall performance and expense structure of the Fund supported the re-approval of the Advisory Agreements.
Investment Advisory and Sub-Advisory Fee Rates
The Board reviewed and considered the contractual investment advisory fee rates that are payable by the Fund to Funds Management for investment advisory services (the “Advisory Agreement Rates”), both on a stand-alone basis and on a combined basis with the Fund’s fund-level and class-level contractual administration fee rates (the “Management Rates”). The Board noted that the administration fees payable to Funds Management include transfer agency and sub-transfer agency costs. The Board also reviewed and considered the contractual investment sub-advisory fee rates that are payable by Funds Management to the Sub-Adviser for investment sub-advisory services (the “Sub-Advisory Agreement Rates”).
Among other information reviewed by the Board was a comparison of the Management Rates of the Fund with those of other funds in the expense Groups at a common asset level. The Board noted that the Management Rates of the Fund were in range of the average rates for the Fund’s expense Groups for all share classes.
The Board also received and considered information about the portion of the total advisory fee that was retained by Funds Management after payment of the fee to the Sub-Adviser for sub-advisory services. In assessing the reasonableness of this amount, the Board received and evaluated information about the nature and extent of responsibilities retained and risks assumed by Funds Management and not delegated to or assumed by the Sub-Adviser, and about Funds Management’s on-going oversight services. However, given the affiliation between Funds Management and the Sub-Adviser, the Board ascribed limited relevance to the allocation of the advisory fee between them.
The Board also received and considered information about the nature and extent of services offered and fee rates charged by Funds Management and the Sub-Adviser to other types of clients with investment strategies similar to those of the Fund. In this regard, the Board received information about the significantly greater scope of services, and compliance, reporting and other legal burdens and risks of managing mutual funds compared with those associated with managing assets of non-mutual fund clients such as collective funds or institutional separate accounts.
Based on its consideration of the factors and information it deemed relevant, including those described here, the Board determined that the Advisory Agreement Rates and the Sub-Advisory Agreement Rates were reasonable in light of the services covered by the Advisory Agreements.
Profitability
The Board received and considered information concerning the profitability of Funds Management, as well as the profitability of Wells Fargo as a whole, from providing services to the Fund and the fund family as a whole. The Board did not receive or consider to be necessary separate profitability information with respect to the Sub-Adviser, because its profitability information was subsumed in the collective Wells Fargo profitability analysis.
| | | | | | |
| Other information (unaudited) | | Wells Fargo Advantage International Bond Fund | | | 35 | |
Funds Management explained the methodologies and estimates that it used in calculating profitability. Among other things, the Board noted that the levels of profitability reported on a fund-by-fund basis varied widely, depending on factors such as the size and type of fund. Based on its review, the Board did not deem the profits reported by Funds Management to be at a level that would prevent it from approving the continuation of the Advisory Agreements.
Economies of Scale
With respect to possible economies of scale, the Board noted the existence of breakpoints in the Fund’s advisory fee and administration fee structure, which operate generally to reduce the Fund’s expense ratios as the Fund grows in size. It considered that, for a small fund or a fund that shrinks in size, breakpoints conversely can result in higher fee levels. The Board also considered that fee waiver and expense reimbursement arrangements and competitive fee rates at the outset are means of sharing potential economies of scale with shareholders of the Fund and the fund family as a whole. The Board considered Funds Management’s view that any analyses of potential economies of scale in managing a particular fund are inherently limited in light of the joint and common costs and investments that Funds Management incurs across the fund family as a whole.
The Board concluded that the Fund’s fee and expense arrangements, including contractual breakpoints, constituted a reasonable approach to sharing potential economies of scale with the Fund and its shareholders.
Other Benefits to Funds Management and the Sub-Adviser
The Board received and considered information regarding potential “fall-out” or ancillary benefits received by Funds Management and its affiliates, including the Sub-Adviser, as a result of their relationships with the Fund. Ancillary benefits could include, among others, benefits directly attributable to other relationships with the Fund and benefits potentially derived from an increase in Funds Management’s and the Sub-Adviser’s business as a result of their relationships with the Fund. The Board noted that various affiliates of Funds Management may receive distribution-related fees, shareholder servicing payments and sub-transfer agency fees in respect of shares sold or held through them and services provided.
The Board also reviewed information about soft dollar credits earned and utilized by the Sub-Adviser, fees earned by Funds Management and the Sub-Adviser from managing a private investment vehicle for the fund family’s securities lending collateral and commissions earned by an affiliated broker from portfolio transactions.
Based on its consideration of the factors and information it deemed relevant, including those described here, the Board did not find that any ancillary benefits received by Funds Management and its affiliates, including the Sub-Adviser, were unreasonable.
Conclusion
After considering the above-described factors and based on its deliberations and its evaluation of the information described above, the Board unanimously approved the continuation of the Advisory Agreements for an additional one-year period and determined that the compensation payable to Funds Management and the Sub-Adviser is reasonable.
| | | | |
| 36 | | Wells Fargo Advantage International Bond Fund | | List of abbreviations |
The following is a list of common abbreviations for terms and entities that may have appeared in this report.
| ACA | — ACA Financial Guaranty Corporation |
| ADR | — American depositary receipt |
| ADS | — American depositary shares |
| AGC | — Assured Guaranty Corporation |
| AGM | — Assured Guaranty Municipal |
| Ambac | — Ambac Financial Group Incorporated |
| AMT | — Alternative minimum tax |
| BAN | — Bond anticipation notes |
| BHAC | — Berkshire Hathaway Assurance Corporation |
| CAB | — Capital appreciation bond |
| CCAB | — Convertible capital appreciation bond |
| CDA | — Community Development Authority |
| CDO | — Collateralized debt obligation |
| DRIVER | — Derivative inverse tax-exempt receipts |
| DW&P | — Department of Water & Power |
| DWR | — Department of Water Resources |
| ECFA | — Educational & Cultural Facilities Authority |
| EDA | — Economic Development Authority |
| EDFA | — Economic Development Finance Authority |
| ETF | — Exchange-traded fund |
| FDIC | — Federal Deposit Insurance Corporation |
| FFCB | — Federal Farm Credit Banks |
| FGIC | — Financial Guaranty Insurance Corporation |
| FHA | — Federal Housing Administration |
| FHLB | — Federal Home Loan Bank |
| FHLMC | — Federal Home Loan Mortgage Corporation |
| FICO | — The Financing Corporation |
| FNMA | — Federal National Mortgage Association |
| GDR | — Global depositary receipt |
| GNMA | — Government National Mortgage Association |
| HCFR | — Healthcare facilities revenue |
| HEFA | — Health & Educational Facilities Authority |
| HEFAR | — Higher education facilities authority revenue |
| HFA | — Housing Finance Authority |
| HFFA | — Health Facilities Financing Authority |
| HUD | — Department of Housing and Urban Development |
| IDA | — Industrial Development Authority |
| IDAG | — Industrial Development Agency |
| KRW | — Republic of Korea won |
| LIBOR | — London Interbank Offered Rate |
| LLC | — Limited liability company |
| LLLP | — Limited liability limited partnership |
| LLP | — Limited liability partnership |
| MBIA | — Municipal Bond Insurance Association |
| MFHR | — Multifamily housing revenue |
| MSTR | — Municipal securities trust receipts |
| MUD | — Municipal Utility District |
| National | — National Public Finance Guarantee Corporation |
| PCFA | — Pollution Control Financing Authority |
| PCL | — Public Company Limited |
| PCR | — Pollution control revenue |
| PFA | — Public Finance Authority |
| PFFA | — Public Facilities Financing Authority |
| PFOTER | — Puttable floating option tax-exempt receipts |
| plc | — Public limited company |
| PUTTER | — Puttable tax-exempt receipts |
| R&D | — Research & development |
| Radian | — Radian Asset Assurance |
| RAN | — Revenue anticipation notes |
| RDA | �� Redevelopment Authority |
| RDFA | — Redevelopment Finance Authority |
| REIT | — Real estate investment trust |
| ROC | — Reset option certificates |
| SAVRS | — Select auction variable rate securities |
| SBA | — Small Business Authority |
| SFHR | — Single-family housing revenue |
| SFMR | — Single-family mortgage revenue |
| SPA | — Standby purchase agreement |
| SPDR | — Standard & Poor’s Depositary Receipts |
| STRIPS | — Separate trading of registered interest and principal securities |
| TAN | — Tax anticipation notes |
| TIPS | — Treasury inflation-protected securities |
| TRAN | — Tax revenue anticipation notes |
| TTFA | — Transportation Trust Fund Authority |
| TVA | — Tennessee Valley Authority |


For more information
More information about Wells Fargo Advantage Funds is available free upon request. To obtain literature, please write, email, visit the Fund’s website, or call:
Wells Fargo Advantage Funds
P.O. Box 8266
Boston, MA 02266-8266
Email: wfaf@wellsfargo.com
Website: wellsfargoadvantagefunds.com
Individual investors: 1-800-222-8222
Retail investment professionals: 1-888-877-9275
Institutional investment professionals: 1-866-765-0778
This report and the financial statements contained herein are submitted for the general information of the shareholders of Wells Fargo Advantage Funds. If this report is used for promotional purposes, distribution of the report must be accompanied or preceded by a current prospectus. Before investing, please consider the investment objectives, risks, charges, and expenses of the investment. For a current prospectus and, if available, a summary prospectus, containing this information, call 1-800-222-8222 or visit the Fund’s website at wellsfargoadvantagefunds.com. Read the prospectus carefully before you invest or send money.
Wells Fargo Funds Management, LLC, a wholly owned subsidiary of Wells Fargo & Company, provides investment advisory and administrative services for Wells Fargo Advantage Funds. Other affiliates of Wells Fargo & Company provide subadvisory and other services for the Funds. The Funds are distributed by Wells Fargo Funds Distributor, LLC, Member FINRA/SIPC, an affiliate of Wells Fargo & Company.
NOT FDIC INSURED ¡ NO BANK GUARANTEE ¡ MAY LOSE VALUE
© 2014 Wells Fargo Funds Management, LLC. All rights reserved.
| | |
 | | 225163 06-14 SA235/SAR235 04-14 |

Wells Fargo Advantage Strategic Income Fund

Semi-Annual Report
April 30, 2014

Reduce clutter. Save trees.
Sign up for electronic delivery of prospectuses and shareholder reports at wellsfargo.com/advantagedelivery
Contents
The views expressed and any forward-looking statements are as of April 30, 2014, unless otherwise noted, and are those of the Fund managers and/or Wells Fargo Funds Management, LLC. Discussions of individual securities, or the markets generally, or any Wells Fargo Advantage Fund are not intended as individual recommendations. Future events or results may vary significantly from those expressed in any forward-looking statements; the views expressed are subject to change at any time in response to changing circumstances in the market. Wells Fargo Funds Management, LLC and the Fund disclaim any obligation to publicly update or revise any views expressed or forward-looking statements.
NOT FDIC INSURED ¡ NO BANK GUARANTEE ¡ MAY LOSE VALUE
| | | | |
| 2 | | Wells Fargo Advantage Strategic Income Fund | | Letter to shareholders (unaudited) |

Karla M. Rabusch
President
Wells Fargo Advantage Funds
Global bond markets broadly rallied during the period, as low growth and low inflation expectations appeared to drive yields lower and longer-term bond prices higher, particularly in the opening months of 2014. High-yield and emerging markets debt sectors performed best, while currency markets were mixed.
Dear Valued Shareholder:
We are pleased to offer you this semi-annual report for the Wells Fargo Advantage Strategic Income Fund for the six-month period that ended April 30, 2014. Global bond markets broadly rallied during the period, as low growth and low inflation expectations appeared to drive yields lower and longer-term bond prices higher, particularly in the opening months of 2014. High-yield and emerging markets debt sectors performed best, while currency markets were mixed. The U.S. high-yield bond market (measured by the Barclays U.S. Corporate High Yield Index1) provided relatively strong fixed-income returns during the period, outpacing returns from the investment-grade corporate bond markets (measured by the Barclays Corporate Bond Index2) and U.S. Treasuries (measured by the Barclays U.S. Treasury Index3). U.S. mortgage-backed securities (MBS), commercial mortgage-backed securities (CMBS), and corporate bonds generated positive returns. On the whole, fixed-income markets across the globe notably rallied over the first four months of 2014, rebounding nicely from some challenging price corrections during 2013. In general, the corporate bond sector—notably, high-yield corporate bonds—was the best across all global markets, while sovereign debt issuances generally lagged behind.
At the end of 2013, currency markets were volatile while bond markets staged a recovery.
Global currency markets were mixed during the final months of 2013, with strength in eastern European currencies but weakness in Australian and Brazilian currencies. The most significant event during these waning months of 2013 was a continued sharp decline in the value of the Japanese yen. Bond markets of the smaller global economies continued to outperform the bond markets of the largest economies, while the strong demand for income across global bond markets continued to support higher-yield securities, such as corporate bonds and structured products (for example, MBS).
Simultaneously, the U.S. high-yield bond market continued to rally, building on positive gains from the previous months. Yield spreads continued to tighten significantly across the board, while U.S. Treasury yields ratcheted higher, most notably in maturities of five years and longer. Lower-rated credit tiers outperformed each respectively higher-rated credit tier, while the high-yield default rate remained historically low as refinancing levels declined modestly with rate increases but net new issuance remained strong. The rise in U.S. Treasury yields pressured security prices across the U.S. investment-grade bond markets. The corporate bond and CMBS sectors provided positive returns. By contrast, U.S. Treasuries declined in value and residential MBS had negative returns as mortgage rates shifted higher.
International and U.S. fixed-income markets rallied strongly over the first four months of 2014.
Global bond markets broadly rallied during the opening months of 2014, as low growth and low inflation expectations appeared to drive yields lower and longer-term bond prices higher. Global high-yield and emerging markets debt sectors
| 1. | The Barclays U.S. Corporate High Yield Index is an unmanaged, U.S. dollar-denominated, nonconvertible, non-investment-grade debt index. The index consists of domestic and corporate bonds rated Ba and below with a minimum outstanding amount of $150 million. You cannot invest directly in an index. |
| 2. | The Barclays Corporate Bond Index is an unmanaged market-value-weighted index of investment-grade corporate fixed-rate debt issues with maturities of one year or more. You cannot invest directly in an index. |
| 3. | The Barclays U.S. Treasury Index is an unmanaged index of prices of U.S. Treasury bonds with maturities of 1 to 30 years. You cannot invest directly in an index. |
| | | | | | |
| Letter to shareholders (unaudited) | | Wells Fargo Advantage Strategic Income Fund | | | 3 | |
performed best during February and March 2014. After a volatile January 2014, which saw yields and risk move higher in smaller economic regions, markets recovered in February 2014, carrying those trends into March and April 2014, which led some smaller bond markets to outperform the major markets during the period. Brazil, Italy, and Spain notably outperformed other countries, while Russia declined in value with the escalating crisis in the Ukraine in March 2014. Currency markets continued to be mixed during the late winter bond market rallies, as the Brazilian real appreciated while the Russian ruble and Polish zloty depreciated. The Japanese yen halted its precipitous decline from the waning months of 2013 and appreciated over the first four months of 2014.
Favorable conditions for U.S. fixed-income markets were restored in the early months of 2014.
Seemingly much to the surprise of many everyday investors and seasoned investment professionals alike, U.S. fixed-income markets (measured by the Barclays U.S. Aggregate Bond Index4) largely outperformed U.S. equity markets (measured by the S&P 500 Index5) during the opening months of 2014. This helped support global bond markets, particularly global corporate bonds. Reassurances from the U.S. Federal Reserve (Fed) that a highly accommodative monetary policy would continue throughout 2014 inspired bond rallies across the globe.
One positive takeaway for bond investors that helped fuel the global fixed-income rallies was former Fed Chairman Ben Bernanke’s guidance at the end of 2013. He indicated that the tapering of the Fed’s bond-buying program would proceed at a slow pace and that a reduction in quantitative easing should not be equivocated with a tightening of monetary policy. The distinction was important—although the bond-buying program was declining in volume, it was, nonetheless, still continuing. In addition, he indicated that the federal funds target rate would remain unchanged for the foreseeable future, with the implication that it would not increase until the bond-buying program was fully disbanded. These were important statements for investors that helped bolster U.S. fixed-income and global bond valuations in the opening months of 2014.
Don’t let short-term uncertainty derail long-term investment goals.
Periods of investment uncertainty can present challenges, but experience has taught us that maintaining long-term investment goals can be an effective way to plan for the future. To help you create a sound strategy based on your personal goals and risk tolerance, Wells Fargo Advantage Funds offers more than 100 mutual funds spanning a wide range of asset classes and investment styles. Although diversification cannot guarantee an investment profit or prevent losses, we believe it can be an effective way to manage investment risk and potentially smooth out overall portfolio performance. We encourage investors to know their investments and to understand that appropriate levels of risk-taking may unlock opportunities.
Reassurances from the U.S. Federal Reserve that a highly accommodative monetary policy would continue throughout 2014 inspired bond rallies across the globe.
| 4. | The Barclays U.S. Aggregate Bond Index is a broad-based benchmark that measures the investment-grade, U.S. dollar-denominated, fixed-rate taxable bond market, including Treasuries, government-related and corporate securities, MBS (agency fixed-rate and hybrid ARM passthroughs), ABS, and CMBS. You cannot invest directly in an index. |
| 5. | The S&P 500 Index consists of 500 stocks chosen for market size, liquidity, and industry group representation. It is a market-value-weighted index with each stock’s weight in the index proportionate to its market value. You cannot invest directly in an index. |
| | | | |
| 4 | | Wells Fargo Advantage Strategic Income Fund | | Letter to shareholders (unaudited) |
Thank you for choosing to invest with Wells Fargo Advantage Funds. We appreciate your confidence in us and remain committed to helping you meet your financial needs. For current information about your fund investments, contact your investment professional, visit our website at wellsfargoadvantagefunds.com, or call us directly at 1-800-222-8222. We are available 24 hours a day, 7 days a week.
Sincerely,

Karla M. Rabusch
President
Wells Fargo Advantage Funds
Notice to shareholders
The Fund and Wells Fargo Funds Management, LLC (“Funds Management”) have received an exemptive order from the SEC that permits Funds Management, subject to the approval of the Board of Trustees of the Fund, to select or replace certain subadvisers to manage all or a portion of the Fund’s assets and enter into, amend or terminate a sub-advisory agreement with certain subadvisers without obtaining shareholder approval (“Multi-manager Structure”). The Multi-manager Structure applies to subadvisers that are not affiliated with Funds Management or the Fund, except to the extent that affiliation arises solely because such subadvisers provide sub-advisory services to the Fund (“Non-affiliated Subadvisers”), as well as subadvisers that are indirect or direct wholly-owned subsidiaries of Funds Management or of another company that, indirectly or directly, wholly owns Funds Management (“Wholly-owned Subadvisers”).
Pursuant to the SEC order, Funds Management, with the approval of the Board of Trustees, has the discretion to terminate any subadvisers and allocate and reallocate the Fund’s assets among any other Non-affiliated Subadvisers or Wholly-owned Subadvisers. Funds Management, subject to oversight and supervision by the Board of Trustees, has responsibility to continue to oversee any subadvisers to the Fund and to recommend, for approval by the Board of Trustees, the hiring, termination and replacement of subadvisers for the Fund. In the event that a new subadviser is hired pursuant to the Multi-manager Structure, the Fund is required to provide notice to shareholders within 90 days.
Please contact your investment professional or call us directly at 1-800-222-8222 if you have any questions on this Notice to Shareholders.
This page is intentionally left blank.
| | | | |
| 6 | | Wells Fargo Advantage Strategic Income Fund | | Performance highlights (unaudited) |
Investment objective
The Fund seeks total return, consisting of a high level of current income and capital appreciation.
Adviser
Wells Fargo Funds Management, LLC
Subadvisers
First International Advisors, LLC
Wells Capital Management Incorporated
Portfolio managers
Tony Norris
Michael J. Bray, CFA
David Germany, Ph.D
Niklas Nordenfelt, CFA
Margaret D. Patel
Thomas M. Price, CFA
Scott M. Smith, CFA
Average annual total returns (%) as of April 30, 2014
| | | | | | | | | | | | | | | | | | | | | | | | | | | | | | |
| | | | | Including sales charge | | | Excluding sales charge | | | Expense ratios1 (%) | |
| | | Inception date | | 1 year | | | | | Since
inception | | | 1 year | | | | | Since
inception | | | Gross | | | Net2 | |
| Class A (WSIAX) | | 1-31-2013 | | | (3.78 | ) | | | | | (2.31 | ) | | | 0.73 | | | | | | 1.36 | | | | 1.87 | | | | 0.91 | |
| Class C (WSICX) | | 1-31-2013 | | | (1.01 | ) | | | | | 0.61 | | | | (0.04 | ) | | | | | 0.61 | | | | 2.62 | | | | 1.66 | |
| Administrator Class (WSIDX) | | 1-31-2013 | | | – | | | | | | – | | | | 0.98 | | | | | | 1.58 | | | | 1.81 | | | | 0.76 | |
| Institutional Class (WSINX) | | 1-31-2013 | | | – | | | | | | – | | | | 1.13 | | | | | | 1.74 | | | | 1.54 | | | | 0.61 | |
| Barclays U.S. Universal Bond Index3 | | – | | | – | | | | | | – | | | | 0.24 | | | | | | 1.56 | | | | – | | | | – | |
Figures quoted represent past performance, which is no guarantee of future results, and do not reflect taxes that a shareholder may pay on fund distributions or the redemption of fund shares. Investment return and principal value of an investment will fluctuate so that an investor’s shares, when redeemed, may be worth more or less than their original cost. Performance shown without sales charges would be lower if sales charges were reflected. Current performance may be lower or higher than the performance data quoted, which assumes the reinvestment of dividends and capital gains. Current month-end performance is available on the Fund’s website, wellsfargoadvantagefunds.com.
Index returns do not include transaction costs associated with buying and selling securities, any mutual fund fees or expenses, or any taxes. It is not possible to invest directly in an index.
For Class A shares, the maximum front-end sales charge is 4.50%. For Class C shares, the maximum contingent deferred sales charge is 1.00%. Performance including sales charge assumes the sales charge for the corresponding time period. Administrator Class and Institutional Class shares are sold without a front end sales charge or contingent deferred sales charge.
Bond values fluctuate in response to the financial condition of individual issuers, general market and economic conditions, and changes in interest rates. In general, when interest rates rise, bond values fall and investors may lose principal value. High-yield securities have a greater risk of default and tend to be more volatile than higher-rated debt securities. Loans are subject to risks similar to those associated with other below-investment-grade bond investments, such as credit risk (for example, risk of issuer default), below-investment-grade bond risk (for example, risk of greater volatility in value), and risk that the loan may become illiquid or difficult to price. Foreign investments are especially volatile and can rise or fall dramatically due to differences in the political and economic conditions of the host country. These risks are generally intensified in emerging markets. The use of derivatives may reduce returns and/or increase volatility. Certain investment strategies tend to increase the total risk of an investment (relative to the broader market). The Fund is exposed to mortgage- and asset-backed securities risk and regional risk. Consult the Fund’s prospectus for additional information on these and other risks.
Please see footnotes on page 7.
| | | | | | |
| Performance highlights (unaudited) | | Wells Fargo Advantage Strategic Income Fund | | | 7 | |
| | | | |
| Ten largest long-term holdings4 (%) as of April 30, 2014 | |
Republic of South Africa, 7.75%, 2-28-2023 | | | 2.81 | |
Poland, 4.00%, 10-25-2023 | | | 2.40 | |
Brazil, 10.00%, 1-1-2023 | | | 2.11 | |
Brazil, 10.00%, 1-1-2017 | | | 1.51 | |
Mexico, 4.75%, 6-14-2018 | | | 1.37 | |
Romania, 6.00%, 4-30-2016 | | | 1.31 | |
Turkey, 9.00%, 3-8-2017 | | | 1.23 | |
Hungary, 6.75%, 11-24-2017 | | | 1.20 | |
General Motors Financial Company Incorporated, 2.75%, 5-15-2016 | | | 1.17 | |
Texas Competitive Electric Holdings LLC,
3.74%, 10-10-2014 | | | 1.54 | |
|
| Portfolio allocation5 as of April 30, 2014 |
|
 |
| 1. | Reflects the expense ratios as stated in the most recent prospectuses, which include the impact of 0.01% in acquired fund fees and expenses. The expense ratios shown are subject to change and may differ from the annualized expense ratios shown in the financial highlights of this report, which do not include acquired fund fees and expenses. |
| 2. | The Adviser has committed through February 28, 2015, to waive fees and/or reimburse expenses to the extent necessary to cap the Fund’s Total Annual Fund Operating Expenses After Fee Waiver, excluding certain expenses, at 0.90% for Class A, 1.65% for Class C, 0.75% for Administrator Class, and 0.60% for Institutional Class. Brokerage commissions, stamp duty fees, interest, taxes, acquired fund fees and expenses, and extraordinary expenses are excluded from the cap. Without this cap, the Fund’s returns would have been lower. |
| 3. | The Barclays U.S. Universal Bond Index is an unmanaged market value-weighted performance benchmark for the U.S. dollar-denominated bond market, which includes investment-grade, high yield, and emerging market debt securities with maturities of one year or more. You cannot invest directly in an index. |
| 4. | The ten largest long-term holdings are calculated based on the value of the securities divided by total net assets of the Fund. Holdings are subject to change and may have changed since the date specified. |
| 5. | Portfolio allocation is subject to change and is calculated based on the total long-term investments of the Fund. |
| | | | |
| 8 | | Wells Fargo Advantage Strategic Income Fund | | Fund expenses (unaudited) |
As a shareholder of the Fund, you incur two types of costs: (1) transaction costs, including sales charges (loads) on purchase payments and contingent deferred sales charges (if any) on redemptions and (2) ongoing costs, including management fees, distribution (12b-1) and/or shareholder service fees, and other Fund expenses. This example is intended to help you understand your ongoing costs (in dollars) of investing in the Fund and to compare these costs with the ongoing costs of investing in other mutual funds.
The example is based on an investment of $1,000 invested at the beginning of the six-month period and held for the
entire period from November 1, 2013 to April 30, 2014.
Actual expenses
The “Actual” line of the table below provides information about actual account values and actual expenses. You may use the information in this line, together with the amount you invested, to estimate the expenses that you paid over the period. Simply divide your account value by $1,000 (for example, an $8,600 account value divided by $1,000 = 8.6), then multiply the result by the number in the “Actual” line under the heading entitled “Expenses paid during period” for your applicable class of shares to estimate the expenses you paid on your account during this period.
Hypothetical example for comparison purposes
The “Hypothetical” line of the table below provides information about hypothetical account values and hypothetical expenses based on the Fund’s actual expense ratio and an assumed rate of return of 5% per year before expenses, which is not the Fund’s actual return. The hypothetical account values and expenses may not be used to estimate the actual ending account balance or expenses you paid for the period. You may use this information to compare the ongoing costs of investing in the Fund and other funds. To do so, compare this 5% hypothetical example with the 5% hypothetical examples that appear in the shareholder reports of the other funds.
Please note that the expenses shown in the table are meant to highlight your ongoing costs only and do not reflect any transactional costs, such as sales charges (loads) and contingent deferred sales charges. Therefore, the “Hypothetical” line of the table is useful in comparing ongoing costs only and will not help you determine the relative total costs of owning different funds. In addition, if these transactional costs were included, your costs would have been higher.
| | | | | | | | | | | | | | | | |
| | | Beginning
account value
11-1-2013 | | | Ending
account value
4-30-2014 | | | Expenses
paid during
the period1 | | | Net annualized
expense ratio | |
Class A | | | | | | | | | | | | | | | | |
Actual | | $ | 1,000.00 | | | $ | 1,026.10 | | | $ | 4.52 | | | | 0.90 | % |
Hypothetical (5% return before expenses) | | $ | 1,000.00 | | | $ | 1,020.33 | | | $ | 4.51 | | | | 0.90 | % |
Class C | | | | | | | | | | | | | | | | |
Actual | | $ | 1,000.00 | | | $ | 1,023.09 | | | $ | 8.28 | | | | 1.65 | % |
Hypothetical (5% return before expenses) | | $ | 1,000.00 | | | $ | 1,016.61 | | | $ | 8.25 | | | | 1.65 | % |
Administrator Class | | | | | | | | | | | | | | | | |
Actual | | $ | 1,000.00 | | | $ | 1,028.42 | | | $ | 3.77 | | | | 0.75 | % |
Hypothetical (5% return before expenses) | | $ | 1,000.00 | | | $ | 1,021.08 | | | $ | 3.76 | | | | 0.75 | % |
Institutional Class | | | | | | | | | | | | | | | | |
Actual | | $ | 1,000.00 | | | $ | 1,028.54 | | | $ | 3.02 | | | | 0.60 | % |
Hypothetical (5% return before expenses) | | $ | 1,000.00 | | | $ | 1,021.82 | | | $ | 3.01 | | | | 0.60 | % |
| 1. | Expenses paid is equal to the annualized expense ratio of each class multiplied by the average account value over the period, multiplied by the number of days in the most recent fiscal half-year divided by the number of days in the fiscal year (to reflect the one-half-year period). |
| | | | | | |
| Portfolio of investments—April 30, 2014 (unaudited) | | Wells Fargo Advantage Strategic Income Fund | | | 9 | |
| | | | | | | | | | | | | | | | |
| Security name | | Interest rate | | | Maturity date | | | Principal | | | Value | |
| | | | | | | | | | | | | | | | |
| | | | |
Agency Securities: 0.94% | | | | | | | | | | | | | | | | |
FHLMC Series 2013-K713 Class B 144A± | | | 3.27 | % | | | 4-25-2046 | | | $ | 250,000 | | | $ | 244,164 | |
| | | | |
Total Agency Securities (Cost $227,407) | | | | | | | | | | | | | | | 244,164 | |
| | | | | | | | | | | | | | | | |
| | | | |
Asset-Backed Securities: 2.70% | | | | | | | | | | | | | | | | |
AmeriCredit Automobile Receivables Trust Series 2012-4 Class E 144A | | | 3.82 | | | | 2-10-2020 | | | | 250,000 | | | | 262,008 | |
CAL Funding II Limited Series 2012-1A Class A 144A | | | 3.47 | | | | 10-25-2027 | | | | 212,500 | | | | 212,822 | |
Santander Drive Auto Receivables Trust Series 2012-5 Class D | | | 3.30 | | | | 9-17-2018 | | | | 95,000 | | | | 98,931 | |
TAL Advantage LLC Series 2013-1A Class A 144A | | | 2.83 | | | | 2-22-2038 | | | | 132,500 | | | | 130,423 | |
| | | | |
Total Asset-Backed Securities (Cost $710,263) | | | | | | | | | | | | | | | 704,184 | |
| | | | | | | | | | | | | | | | |
| | | | |
Corporate Bonds and Notes: 30.17% | | | | | | | | | | | | | | | | |
| | | | |
Consumer Discretionary: 7.13% | | | | | | | | | | | | | | | | |
| | | | |
| Auto Components: 1.13% | | | | | | | | | | | | | | | | |
United Rentals North America Incorporated | | | 5.75 | | | | 7-15-2018 | | | | 275,000 | | | | 294,250 | |
| | | | | | | | | | | | | | | | |
| | | | |
| Automobiles: 1.00% | | | | | | | | | | | | | | | | |
Ford Motor Company | | | 7.45 | | | | 7-16-2031 | | | | 200,000 | | | | 260,730 | |
| | | | | | | | | | | | | | | | |
| | | | |
| Distributors: 0.06% | | | | | | | | | | | | | | | | |
LKQ Corporation | | | 4.75 | | | | 5-15-2023 | | | | 15,000 | | | | 14,400 | |
| | | | | | | | | | | | | | | | |
| | | | |
| Diversified Consumer Services: 0.55% | | | | | | | | | | | | | | | | |
Service Corporation International | | | 8.00 | | | | 11-15-2021 | | | | 124,000 | | | | 143,691 | |
| | | | | | | | | | | | | | | | |
| | | | |
| Hotels, Restaurants & Leisure: 1.43% | | | | | | | | | | | | | | | | |
CEC Entertainment Incorporated 144A | | | 8.00 | | | | 2-15-2022 | | | | 20,000 | | | | 20,500 | |
Greektown Holdings LLC 144A | | | 8.88 | | | | 3-15-2019 | | | | 120,000 | | | | 123,600 | |
Hilton Worldwide Finance LLC 144A | | | 5.63 | | | | 10-15-2021 | | | | 5,000 | | | | 5,213 | |
International Game Technology | | | 5.35 | | | | 10-15-2023 | | | | 175,000 | | | | 187,695 | |
NAI Entertainment Holdings LLC 144A | | | 5.00 | | | | 8-1-2018 | | | | 25,000 | | | | 26,063 | |
Pinnacle Entertainment Incorporated | | | 7.50 | | | | 4-15-2021 | | | | 10,000 | | | | 10,875 | |
| | | | |
| | | | | | | | | | | | | | | 373,946 | |
| | | | | | | | | | | | | | | | |
| | | | |
| Media: 2.04% | | | | | | | | | | | | | | | | |
CBS Outdoor Americas Capital LLC 144A | | | 5.25 | | | | 2-15-2022 | | | | 5,000 | | | | 5,125 | |
Cinemark USA Incorporated | | | 5.13 | | | | 12-15-2022 | | | | 200,000 | | | | 200,000 | |
DreamWorks Animation SKG Incorporated 144A | | | 6.88 | | | | 8-15-2020 | | | | 30,000 | | | | 32,550 | |
Gray Television Incorporated | | | 7.50 | | | | 10-1-2020 | | | | 85,000 | | | | 91,375 | |
Lamar Media Corporation 144A | | | 5.38 | | | | 1-15-2024 | | | | 5,000 | | | | 5,181 | |
Lamar Media Corporation | | | 5.88 | | | | 2-1-2022 | | | | 150,000 | | | | 160,125 | |
Live Nation Entertainment Incorporated 144A | | | 7.00 | | | | 9-1-2020 | | | | 5,000 | | | | 5,463 | |
Lynx II Corporation 144A | | | 6.38 | | | | 4-15-2023 | | | | 5,000 | | | | 5,250 | |
Nexstar Broadcasting Group Incorporated | | | 6.88 | | | | 11-15-2020 | | | | 25,000 | | | | 26,750 | |
| | | | |
| | | | | | | | | | | | | | | 531,819 | |
| | | | | | | | | | | | | | | | |
| | | | |
| Specialty Retail: 0.90% | | | | | | | | | | | | | | | | |
Advance Auto Parts Incorporated | | | 4.50 | | | | 12-1-2023 | | | | 150,000 | | | | 157,061 | |
Century Intermediate Holding Company (PIK at 9.75%) 144A¥ | | | 9.75 | | | | 2-15-2019 | | | | 5,000 | | | | 5,325 | |
Neiman Marcus Group Limited 144A | | | 8.00 | | | | 10-15-2021 | | | | 5,000 | | | | 5,475 | |
The accompanying notes are an integral part of these financial statements.
| | | | |
| 10 | | Wells Fargo Advantage Strategic Income Fund | | Portfolio of investments—April 30, 2014 (unaudited) |
| | | | | | | | | | | | | | | | |
| Security name | | Interest rate | | | Maturity date | | | Principal | | | Value | |
| | | | | | | | | | | | | | | | |
| | | | |
| Specialty Retail (continued) | | | | | | | | | | | | | | | | |
Penske Auto Group Incorporated | | | 5.75 | % | | | 10-1-2022 | | | $ | 50,000 | | | $ | 52,313 | |
Sonic Automotive Incorporated | | | 5.00 | | | | 5-15-2023 | | | | 15,000 | | | | 14,738 | |
| | | | |
| | | | | | | | | | | | | | | 234,912 | |
| | | | | | | | | | | | | | | | |
| | | | |
| Textiles, Apparel & Luxury Goods: 0.02% | | | | | | | | | | | | | | | | |
William Carter Company 144A | | | 5.25 | | | | 8-15-2021 | | | | 5,000 | | | | 5,175 | |
| | | | | | | | | | | | | | | | |
| | | | |
Consumer Staples: 0.87% | | | | | | | | | | | | | | | | |
| | | | |
| Beverages: 0.76% | | | | | | | | | | | | | | | | |
Constellation Brands Incorporated | | | 7.25 | | | | 9-1-2016 | | | | 175,000 | | | | 196,875 | |
| | | | | | | | | | | | | | | | |
| | | | |
| Food Products: 0.11% | | | | | | | | | | | | | | | | |
B&G Foods Incorporated | | | 4.63 | | | | 6-1-2021 | | | | 25,000 | | | | 24,875 | |
Darling International Incorporated 144A | | | 5.38 | | | | 1-15-2022 | | | | 5,000 | | | | 5,138 | |
| | | | |
| | | | | | | | | | | | | | | 30,013 | |
| | | | | | | | | | | | | | | | |
| | | | |
Energy: 5.20% | | | | | | | | | | | | | | | | |
| | | | |
| Energy Equipment & Services: 2.29% | | | | | | | | | | | | | | | | |
Bristow Group Incorporated | | | 6.25 | | | | 10-15-2022 | | | | 150,000 | | | | 160,875 | |
Era Group Incorporated | | | 7.75 | | | | 12-15-2022 | | | | 90,000 | | | | 94,950 | |
Forum Energy Technologies Incorporated 144A | | | 6.25 | | | | 10-1-2021 | | | | 5,000 | | | | 5,313 | |
NGPL PipeCo LLC 144A | | | 7.12 | | | | 12-15-2017 | | | | 30,000 | | | | 29,700 | |
NGPL PipeCo LLC 144A | | | 7.77 | | | | 12-15-2037 | | | | 245,000 | | | | 229,075 | |
PHI Incorporated 144A | | | 5.25 | | | | 3-15-2019 | | | | 75,000 | | | | 76,125 | |
| | | | |
| | | | | | | | | | | | | | | 596,038 | |
| | | | | | | | | | | | | | | | |
| | | | |
| Oil, Gas & Consumable Fuels: 2.91% | | | | | | | | | | | | | | | | |
Denbury Resources Incorporated | | | 6.38 | | | | 8-15-2021 | | | | 150,000 | | | | 160,875 | |
Energy Transfer Partners LP | | | 5.20 | | | | 2-1-2022 | | | | 175,000 | | | | 191,275 | |
Exterran Partners LP | | | 6.00 | | | | 4-1-2021 | | | | 50,000 | | | | 50,000 | |
Sabine Pass Liquefaction LLC | | | 5.63 | | | | 4-15-2023 | | | | 15,000 | | | | 15,150 | |
Sabine Pass Liquefaction LLC 144A | | | 6.25 | | | | 3-15-2022 | | | | 30,000 | | | | 31,463 | |
Sabine Pass LNG LP | | | 6.50 | | | | 11-1-2020 | | | | 175,000 | | | | 185,063 | |
Sabine Pass LNG LP | | | 7.50 | | | | 11-30-2016 | | | | 50,000 | | | | 55,500 | |
SemGroup Corporation | | | 7.50 | | | | 6-15-2021 | | | | 20,000 | | | | 21,700 | |
Suburban Propane Partners LP | | | 7.38 | | | | 3-15-2020 | | | | 45,000 | | | | 48,038 | |
| | | | |
| | | | | | | | | | | | | | | 759,064 | |
| | | | | | | | | | | | | | | | |
| | | | |
Financials: 9.66% | | | | | | | | | | | | | | | | |
| | | | |
| Banks: 2.24% | | | | | | | | | | | | | | | | |
CIT Group Incorporated | | | 3.88 | | | | 2-19-2019 | | | | 5,000 | | | | 5,056 | |
CIT Group Incorporated | | | 4.25 | | | | 8-15-2017 | | | | 225,000 | | | | 235,688 | |
Citigroup Incorporated | | | 6.68 | | | | 9-13-2043 | | | | 175,000 | | | | 209,430 | |
JPMorgan Chase & Company ± | | | 6.00 | | | | 12-29-2049 | | | | 135,000 | | | | 134,325 | |
| | | | |
| | | | | | | | | | | | | | | 584,499 | |
| | | | | | | | | | | | | | | | |
| | | | |
| Capital Markets: 1.58% | | | | | | | | | | | | | | | | |
Lazard Group LLC | | | 6.85 | | | | 6-15-2017 | | | | 175,000 | | | | 198,749 | |
Level 3 Financing Incorporated 144A | | | 6.13 | | | | 1-15-2021 | | | | 5,000 | | | | 5,250 | |
Morgan Stanley | | | 4.10 | | | | 5-22-2023 | | | | 210,000 | | | | 208,536 | |
| | | | |
| | | | | | | | | | | | | | | 412,535 | |
| | | | | | | | | | | | | | | | |
The accompanying notes are an integral part of these financial statements.
| | | | | | |
| Portfolio of investments—April 30, 2014 (unaudited) | | Wells Fargo Advantage Strategic Income Fund | | | 11 | |
| | | | | | | | | | | | | | | | |
| Security name | | Interest rate | | | Maturity date | | | Principal | | | Value | |
| | | | | | | | | | | | | | | | |
| | | | |
| Consumer Finance: 1.92% | | | | | | | | | | | | | | | | |
Ally Financial Incorporated | | | 7.50 | % | | | 9-15-2020 | | | $ | 15,000 | | | $ | 17,775 | |
Ally Financial Incorporated | | | 8.00 | | | | 3-15-2020 | | | | 15,000 | | | | 18,131 | |
Credit Acceptance Corporation 144A | | | 6.13 | | | | 2-15-2021 | | | | 5,000 | | | | 5,200 | |
General Motors Financial Company Incorporated | | | 2.75 | | | | 5-15-2016 | | | | 300,000 | | | | 304,500 | |
SLM Corporation | | | 6.13 | | | | 3-25-2024 | | | | 20,000 | | | | 19,870 | |
SLM Corporation | | | 7.25 | | | | 1-25-2022 | | | | 10,000 | | | | 11,013 | |
SLM Corporation | | | 8.00 | | | | 3-25-2020 | | | | 30,000 | | | | 34,650 | |
SLM Corporation | | | 8.45 | | | | 6-15-2018 | | | | 75,000 | | | | 88,406 | |
| | | | |
| | | | | | | | | | | | | | | 499,545 | |
| | | | | | | | | | | | | | | | |
| | | | |
| Diversified Financial Services: 1.05% | | | | | | | | | | | | | | | | |
Denali Borrower LLC/Denali Finance Corporation 144A | | | 5.63 | | | | 10-15-2020 | | | | 80,000 | | | | 82,200 | |
Moody’s Corporation | | | 4.88 | | | | 2-15-2024 | | | | 180,000 | | | | 191,385 | |
| | | | |
| | | | | | | | | | | | | | | 273,585 | |
| | | | | | | | | | | | | | | | |
| | | | |
| Insurance: 1.41% | | | | | | | | | | | | | | | | |
Endurance Specialty Holdings Limited | | | 7.00 | | | | 7-15-2034 | | | | 175,000 | | | | 207,716 | |
ProAssurance Corporation | | | 5.30 | | | | 11-15-2023 | | | | 150,000 | | | | 160,978 | |
| | | | |
| | | | | | | | | | | | | | | 368,694 | |
| | | | | | | | | | | | | | | | |
| | | | |
| Real Estate Management & Development: 0.25% | | | | | | | | | | | | | | | | |
Hockey Merger Sub 2 Incorporated 144A | | | 7.88 | | | | 10-1-2021 | | | | 60,000 | | | | 64,050 | |
| | | | | | | | | | | | | | | | |
| | | | |
| REITs: 1.21% | | | | | | | | | | | | | | | | |
American Tower Corporation | | | 3.50 | | | | 1-31-2023 | | | | 200,000 | | | | 192,205 | |
Crown Castle International Corporation | | | 4.88 | | | | 4-15-2022 | | | | 35,000 | | | | 35,525 | |
DuPont Fabros Technology Incorporated LP | | | 5.88 | | | | 9-15-2021 | | | | 85,000 | | | | 88,613 | |
| | | | |
| | | | | | | | | | | | | | | 316,343 | |
| | | | | | | | | | | | | | | | |
| | | | |
Health Care: 0.84% | | | | | | | | | | | | | | | | |
| | | | |
| Health Care Providers & Services: 0.80% | | | | | | | | | | | | | | | | |
Aviv Healthcare Properties LP | | | 6.00 | | | | 10-15-2021 | | | | 10,000 | | | | 10,500 | |
Centene Corporation | | | 4.75 | | | | 5-15-2022 | | �� | | 20,000 | | | | 20,100 | |
Community Health Systems Incorporated 144A | | | 6.88 | | | | 2-1-2022 | | | | 20,000 | | | | 20,725 | |
Lifepoint Hospitals Incorporated 144A | | | 5.50 | | | | 12-1-2021 | | | | 30,000 | | | | 31,200 | |
MPH Acquisition Holdings LLC 144A | | | 6.63 | | | | 4-1-2022 | | | | 10,000 | | | | 10,350 | |
Select Medical Corporation | | | 6.38 | | | | 6-1-2021 | | | | 55,000 | | | | 56,650 | |
Tenet Healthcare Corporation 144A | | | 6.00 | | | | 10-1-2020 | | | | 55,000 | | | | 57,750 | |
| | | | |
| | | | | | | | | | | | | | | 207,275 | |
| | | | | | | | | | | | | | | | |
| | | | |
| Pharmaceuticals: 0.04% | | | | | | | | | | | | | | | | |
Pinnacle Incorporated 144A | | | 9.50 | | | | 10-1-2023 | | | | 10,000 | | | | 11,050 | |
| | | | | | | | | | | | | | | | |
| | | | |
Industrials: 1.56% | | | | | | | | | | | | | | | | |
| | | | |
| Commercial Services & Supplies: 0.78% | | | | | | | | | | | | | | | | |
ADT Corporation | | | 4.13 | | | | 4-15-2019 | | | | 5,000 | | | | 4,988 | |
ADT Corporation | | | 4.13 | | | | 6-15-2023 | | | | 10,000 | | | | 9,000 | |
The accompanying notes are an integral part of these financial statements.
| | | | |
| 12 | | Wells Fargo Advantage Strategic Income Fund | | Portfolio of investments—April 30, 2014 (unaudited) |
| | | | | | | | | | | | | | | | |
| Security name | | Interest rate | | | Maturity date | | | Principal | | | Value | |
| | | | | | | | | | | | | | | | |
| | | | |
| Commercial Services & Supplies (continued) | | | | | | | | | | | | | | | | |
ADT Corporation 144A | | | 6.25 | % | | | 10-15-2021 | | | $ | 25,000 | | | $ | 26,063 | |
Covanta Holding Corporation | | | 5.88 | | | | 3-1-2024 | | | | 20,000 | | | | 20,402 | |
Covanta Holding Corporation | | | 7.25 | | | | 12-1-2020 | | | | 25,000 | | | | 27,406 | |
Iron Mountain Incorporated | | | 5.75 | | | | 8-15-2024 | | | | 36,000 | | | | 35,550 | |
Iron Mountain Incorporated | | | 6.00 | | | | 8-15-2023 | | | | 75,000 | | | | 79,688 | |
| | | | |
| | | | | | | | | | | | | | | 203,097 | |
| | | | | | | | | | | | | | | | |
| | | | |
| Transportation Infrastructure: 0.78% | | | | | | | | | | | | | | | | |
Penske Truck Leasing 144A | | | 4.25 | | | | 1-17-2023 | | | | 200,000 | | | | 203,587 | |
| | | | | | | | | | | | | | | | |
| | | | |
Information Technology: 1.39% | | | | | | | | | | | | | | | | |
| | | | |
| Internet Software & Services: 0.13% | | | | | | | | | | | | | | | | |
Verisign Incorporated | | | 4.63 | | | | 5-1-2023 | | | | 35,000 | | | | 33,513 | |
| | | | | | | | | | | | | | | | |
| | | | |
| IT Services: 0.28% | | | | | | | | | | | | | | | | |
Audatex North America Incorporated 144A | | | 6.00 | | | | 6-15-2021 | | | | 35,000 | | | | 37,538 | |
Audatex North America Incorporated 144A | | | 6.13 | | | | 11-1-2023 | | | | 5,000 | | | | 5,344 | |
First Data Corporation | | | 11.75 | | | | 8-15-2021 | | | | 5,000 | | | | 5,325 | |
First Data Holdings Incorporated (PIK at 14.50%) 144A¥ | | | 14.50 | | | | 9-24-2019 | | | | 15,718 | | | | 15,148 | |
SunGard Data Systems Incorporated | | | 6.63 | | | | 11-1-2019 | | | | 10,000 | | | | 10,475 | |
| | | | |
| | | | | | | | | | | | | | | 73,830 | |
| | | | | | | | | | | | | | | | |
| | | | |
| Software: 0.22% | | | | | | | | | | | | | | | | |
Activision Blizzard Incorporated 144A | | | 5.63 | | | | 9-15-2021 | | | | 15,000 | | | | 15,994 | |
Activision Blizzard Incorporated 144A | | | 6.13 | | | | 9-15-2023 | | | | 5,000 | | | | 5,438 | |
BMC Software Finance Incorporated 144A | | | 8.13 | | | | 7-15-2021 | | | | 15,000 | | | | 15,713 | |
Boxer Parent Compnay Incorporated (PIK at 9.75%) 144A¥ | | | 9.00 | | | | 10-15-2019 | | | | 20,000 | | | | 19,600 | |
| | | | |
| | | | | | | | | | | | | | | 56,745 | |
| | | | | | | | | | | | | | | | |
| | | | |
| Technology Hardware, Storage & Peripherals: 0.76% | | | | | | | | | | | | | | | | |
NCR Corporation | | | 5.00 | | | | 7-15-2022 | | | | 175,000 | | | | 178,063 | |
NCR Corporation 144A | | | 5.88 | | | | 12-15-2021 | | | | 10,000 | | | | 10,600 | |
NCR Corporation 144A | | | 6.38 | | | | 12-15-2023 | | | | 10,000 | | | | 10,700 | |
| | | | |
| | | | | | | | | | | | | | | 199,363 | |
| | | | | | | | | | | | | | | | |
| | | | |
Materials: 0.11% | | | | | | | | | | | | | | | | |
| | | | |
| Containers & Packaging: 0.11% | | | | | | | | | | | | | | | | |
Sealed Air Corporation 144A | | | 8.38 | | | | 9-15-2021 | | | | 25,000 | | | | 28,813 | |
| | | | | | | | | | | | | | | | |
| | | | |
Telecommunication Services: 3.00% | | | | | | | | | | | | | | | | |
| | | | |
| Diversified Telecommunication Services: 1.54% | | | | | | | | | | | | | | | | |
GCI Incorporated | | | 6.75 | | | | 6-1-2021 | | | | 115,000 | | | | 116,294 | |
TW Telecommunications Holdings Incorporated | | | 5.38 | | | | 10-1-2022 | | | | 95,000 | | | | 96,425 | |
Verizon Communications Incorporated | �� | | 5.15 | | | | 9-15-2023 | | | | 170,000 | | | | 187,321 | |
| | | | |
| | | | | | | | | | | | | | | 400,040 | |
| | | | | | | | | | | | | | | | |
| | | | |
| Wireless Telecommunication Services: 1.46% | | | | | | | | | | | | | | | | |
MetroPCS Wireless Incorporated | | | 6.63 | | | | 11-15-2020 | | | | 150,000 | | | | 160,125 | |
Sprint Capital Corporation | | | 6.88 | | | | 11-15-2028 | | | | 25,000 | | | | 24,688 | |
The accompanying notes are an integral part of these financial statements.
| | | | | | |
| Portfolio of investments—April 30, 2014 (unaudited) | | Wells Fargo Advantage Strategic Income Fund | | | 13 | |
| | | | | | | | | | | | | | | | |
| Security name | | Interest rate | | | Maturity date | | | Principal | | | Value | |
| | | | | | | | | | | | | | | | |
| | | | |
| Wireless Telecommunication Services (continued) | | | | | | | | | | | | | | | | |
Sprint Communications Incorporated | | | 7.00 | % | | | 8-15-2020 | | | $ | 10,000 | | | $ | 10,875 | |
Sprint Corporation 144A | | | 7.25 | | | | 9-15-2021 | | | | 10,000 | | | | 10,900 | |
Sprint Corporation 144A | | | 7.88 | | | | 9-15-2023 | | | | 90,000 | | | | 99,225 | |
T-Mobile USA Incorporated | | | 5.25 | | | | 9-1-2018 | | | | 10,000 | | | | 10,538 | |
T-Mobile USA Incorporated | | | 6.46 | | | | 4-28-2019 | | | | 5,000 | | | | 5,300 | |
T-Mobile USA Incorporated | | | 6.50 | | | | 1-15-2024 | | | | 5,000 | | | | 5,244 | |
T-Mobile USA Incorporated | | | 6.54 | | | | 4-28-2020 | | | | 5,000 | | | | 5,375 | |
T-Mobile USA Incorporated | | | 6.63 | | | | 4-1-2023 | | | | 5,000 | | | | 5,350 | |
T-Mobile USA Incorporated | | | 6.63 | | | | 4-28-2021 | | | | 5,000 | | | | 5,400 | |
T-Mobile USA Incorporated | | | 6.73 | | | | 4-28-2022 | | | | 15,000 | | | | 16,181 | |
T-Mobile USA Incorporated | | | 6.84 | | | | 4-28-2023 | | | | 20,000 | | | | 21,525 | |
| | | | |
| | | | | | | | | | | | | | | 380,726 | |
| | | | | | | | | | | | | | | | |
| | | | |
Utilities: 0.41% | | | | | | | | | | | | | | | | |
| | | | |
| Independent Power & Renewable Electricity Producers: 0.41% | | | | | | | | | | | | | | | | |
Calpine Corporation 144A | | | 5.88 | | | | 1-15-2024 | | | | 5,000 | | | | 5,131 | |
Calpine Corporation 144A | | | 6.00 | | | | 1-15-2022 | | | | 5,000 | | | | 5,313 | |
NSG Holdings LLC 144A | | | 7.75 | | | | 12-15-2025 | | | | 90,000 | | | | 96,284 | |
| | | | |
| | | | | | | | | | | | | | | 106,728 | |
| | | | | | | | | | | | | | | | |
| | | | |
Total Corporate Bonds and Notes (Cost $7,717,212) | | | | | | | | | | | | | | | 7,864,931 | |
| | | | | | | | | | | | | | | | |
| | | | |
Foreign Government Bonds @: 22.80% | | | | | | | | | | | | | | | | |
Brazil (BRL) | | | 10.00 | | | | 1-1-2017 | | | | 895,000 | | | | 394,401 | |
Brazil (BRL) | | | 10.00 | | | | 1-1-2023 | | | | 1,350,000 | | | | 548,919 | |
Hungary (HUF) | | | 4.00 | | | | 4-25-2018 | | | | 54,500,000 | | | | 244,273 | |
Hungary (HUF) | | | 6.75 | | | | 8-22-2014 | | | | 62,500,000 | | | | 286,035 | |
Hungary (HUF) | | | 6.75 | | | | 11-24-2017 | | | | 63,000,000 | | | | 312,315 | |
Indonesia (IDR) | | | 5.25 | | | | 5-15-2018 | | | | 2,850,000,000 | | | | 227,157 | |
Indonesia (IDR) | | | 7.38 | | | | 9-15-2016 | | | | 2,000,000,000 | | | | 172,728 | |
Indonesia (IDR) | | | 7.88 | | | | 4-15-2019 | | | | 3,250,000,000 | | | | 283,916 | |
Indonesia (IDR) | | | 8.25 | | | | 6-15-2032 | | | | 1,475,000,000 | | | | 123,879 | |
Malaysia (MYR) | | | 3.26 | | | | 3-1-2018 | | | | 790,000 | | | | 239,388 | |
Malaysia (MYR) | | | 4.26 | | | | 9-15-2016 | | | | 900,000 | | | | 281,475 | |
Mexico (MXN) | | | 4.75 | | | | 6-14-2018 | | | | 4,710,000 | | | | 356,953 | |
Mexico (MXN) | | | 7.25 | | | | 12-15-2016 | | | | 3,600,000 | | | | 295,232 | |
Poland (PLN) | | | 4.00 | | | | 10-25-2023 | | | | 1,900,000 | | | | 626,043 | |
Republic of South Africa (ZAR) | | | 7.75 | | | | 2-28-2023 | | | | 8,000,000 | | | | 732,741 | |
Romania (RON) | | | 6.00 | | | | 4-30-2016 | | | | 1,050,000 | | | | 342,686 | |
Turkey (TRY) | | | 6.30 | | | | 2-14-2018 | | | | 360,000 | | | | 156,340 | |
Turkey (TRY) | | | 9.00 | | | | 3-8-2017 | | | | 675,000 | | | | 319,638 | |
| | | | |
Total Foreign Government Bonds (Cost $6,289,728) | | | | | | | | | | | | | | | 5,944,119 | |
| | | | | | | | | | | | | | | | |
| | | | |
Municipal Obligations: 2.27% | | | | | | | | | | | | | | | | |
| | | | |
| Idaho: 0.49% | | | | | | | | | | | | | | | | |
Idaho Housing & Finance Association Legacy Public Charter School (Education Revenue) | | | 7.00 | | | | 5-1-2017 | | | $ | 130,000 | | | | 128,965 | |
| | | | | | | | | | | | | | | | |
| | | | |
| Illinois: 0.83% | | | | | | | | | | | | | | | | |
Chicago IL Series B (GO, Dexia Credit Local SPA) | | | 6.31 | | | | 1-1-2044 | | | | 200,000 | | | | 215,056 | |
| | | | | | | | | | | | | | | | |
The accompanying notes are an integral part of these financial statements.
| | | | |
| 14 | | Wells Fargo Advantage Strategic Income Fund | | Portfolio of investments—April 30, 2014 (unaudited) |
| | | | | | | | | | | | | | | | |
| Security name | | Interest rate | | | Maturity date | | | Principal | | | Value | |
| | | | | | | | | | | | | | | | |
| | | | |
| Texas: 0.95% | | | | | | | | | | | | | | | | |
North Texas Tollway Authority (Transportation Revenue) | | | 8.91 | % | | | 2-1-2030 | | | $ | 210,000 | | | $ | 246,345 | |
| | | | | | | | | | | | | | | | |
| | | | |
Total Municipal Obligations (Cost $578,223) | | | | | | | | | | | | | | | 590,366 | |
| | | | | | | | | | | | | | | | |
| | | | |
Non-Agency Mortgage Backed Securities: 10.36% | | | | | | | | | | | | | | | | |
Americold LLC Trust Series 2010-ARTA Class B 144A | | | 6.03 | | | | 1-14-2029 | | | | 200,000 | | | | 227,807 | |
BB-UBS Trust Series 2012-TFT Class C 144A± | | | 3.58 | | | | 6-5-2030 | | | | 150,000 | | | | 140,339 | |
Commercial Mortgage Trust Series 2012-LC4 Class B ± | | | 4.93 | | | | 12-10-2044 | | | | 175,000 | | | | 189,929 | |
Dominos Pizza Master Issuer LLC Series 2012-1A Class A2 144A | | | 5.22 | | | | 1-25-2042 | | | | 241,563 | | | | 259,535 | |
FREMF Mortgage Trust Series 2011-K703 Class B 144A± | | | 5.05 | | | | 7-25-2044 | | | | 250,000 | | | | 270,106 | |
FREMF Mortgage Trust Series 2013-K502 Class B 144A± | | | 2.84 | | | | 3-25-2045 | | | | 250,000 | | | | 248,746 | |
GS Mortgage Securities Trust Series 2012 Class B 144A | | | 3.41 | | | | 12-10-2030 | | | | 250,000 | | | | 234,967 | |
JPMBB Commercial Mortgage Securities Trust Series 2014-C19 Series D 144A±%% | | | 4.84 | | | | 4-15-2047 | | | | 250,000 | | | | 228,390 | |
JPMorgan Chase & Company Commercial Mortgage Securities Trust Series 2011-C5
Class B 144A± | | | 5.50 | | | | 8-15-2046 | | | | 250,000 | | | | 282,017 | |
Morgan Stanley Capital I Trust Series 2007-HQ11 Class AM ± | | | 5.48 | | | | 2-12-2044 | | | | 25,000 | | | | 27,389 | |
Morgan Stanley Trust Series 2012-C5 Class B ± | | | 4.44 | | | | 8-15-2045 | | | | 250,000 | | | | 262,742 | |
Morgan Stanley Trust Series 2013-C7 Class C ± | | | 4.33 | | | | 2-15-2046 | | | | 80,000 | | | | 79,713 | |
OneMain Financial 144A(a) | | | 3.24 | | | | 6-18-2024 | | | | 250,000 | | | | 249,957 | |
| | | | |
Total Non-Agency Mortgage Backed Securities (Cost $2,783,128) | | | | | | | | | | | | | | | 2,701,637 | |
| | | | | | | | | | | | | | | | |
| | | | |
Term Loans ±: 22.82% | | | | | | | | | | | | | | | | |
Accellent Incorporated | | | 4.50 | | | | 3-12-2021 | | | | 70,000 | | | | 69,366 | |
Advantage Sales & Marketing | | | 4.25 | | | | 12-18-2017 | | | | 19,950 | | | | 19,956 | |
Albertson’s LLC | | | 4.25 | | | | 3-21-2016 | | | | 17,994 | | | | 17,994 | |
Alliance Laundry Systems LLC | | | 4.25 | | | | 12-10-2018 | | | | 74,872 | | | | 74,778 | |
Allison Transmission Incorporated | | | 3.75 | | | | 8-23-2019 | | | | 153,008 | | | | 152,932 | |
American Beacon Advisors Incorporated | | | 4.75 | | | | 11-22-2019 | | | | 84,788 | | | | 84,999 | |
Applied Systems Incorporated | | | 4.25 | | | | 1-25-2021 | | | | 54,863 | | | | 54,755 | |
Applied Systems Incorporated | | | 7.50 | | | | 1-22-2022 | | | | 5,000 | | | | 5,050 | |
Ardagh Holdings USA Incorporated | | | 4.00 | | | | 12-17-2019 | | | | 25,000 | | | | 24,896 | |
Arris Group Incorporated | | | 3.50 | | | | 4-17-2020 | | | | 46,254 | | | | 45,869 | |
Atlantic Aviation FBO Incorporated <%% | | | 3.25 | | | | 5-31-2020 | | | | 29,813 | | | | 29,688 | |
BMC Software Finance Incorporated | | | 5.00 | | | | 9-10-2020 | | | | 39,900 | | | | 39,734 | |
Capital Automotive LP | | | 4.00 | | | | 4-10-2019 | | | | 128,294 | | | | 128,173 | |
CBAC Borrower LLC | | | 8.25 | | | | 7-2-2020 | | | | 35,000 | | | | 36,313 | |
CBS Outdoor Americas Capital LLC | | | 3.00 | | | | 1-31-2021 | | | | 65,000 | | | | 64,644 | |
CCC Information Services Incorporated | | | 4.00 | | | | 12-20-2019 | | | | 60,043 | | | | 59,743 | |
CDW LLC | | | 3.25 | | | | 4-29-2020 | | | | 59,400 | | | | 58,700 | |
Centaur Acquisition LLC | | | 5.25 | | | | 2-20-2019 | | | | 73,199 | | | | 73,221 | |
CityCenter Holdings LLC | | | 5.00 | | | | 10-16-2020 | | | | 69,825 | | | | 70,131 | |
Community Health Systems Incorporated | | | 4.25 | | | | 1-22-2021 | | | | 108,803 | | | | 109,177 | |
Crown Castle Operating Company | | | 3.25 | | | | 1-31-2021 | | | | 246,881 | | | | 245,878 | |
Darling International Incorporated | | | 3.25 | | | | 1-3-2021 | | | | 5,000 | | | | 4,975 | |
Dell Incorporated | | | 4.50 | | | | 4-29-2020 | | | | 119,400 | | | | 119,042 | |
DineEquity Incorporated | | | 3.75 | | | | 10-19-2017 | | | | 246,186 | | | | 246,905 | |
Dunkin’ Brands Incorporated | | | 3.25 | | | | 2-7-2021 | | | | 122,975 | | | | 121,772 | |
Emdeon Business Services LLC | | | 3.75 | | | | 11-2-2018 | | | | 49,093 | | | | 48,970 | |
EMI Music Publishing | | | 3.75 | | | | 6-29-2018 | | | | 61,666 | | | | 61,425 | |
Equipower Resources Holdings LLC | | | 4.25 | | | | 12-21-2018 | | | | 70,000 | | | | 69,913 | |
The accompanying notes are an integral part of these financial statements.
| | | | | | |
| Portfolio of investments—April 30, 2014 (unaudited) | | Wells Fargo Advantage Strategic Income Fund | | | 15 | |
| | | | | | | | | | | | | | | | |
| Security name | | Interest rate | | | Maturity date | | | Principal | | | Value | |
| | | | | | | | | | | | | | | | |
| | | | |
Term Loans ± (continued) | | | | | | | | | | | | | | | | |
Equipower Resources Holdings LLC | | | 4.25 | % | | | 12-31-2019 | | | $ | 64,562 | | | $ | 64,442 | |
Exgen Renewables I LLC | | | 5.25 | | | | 2-14-2021 | | | | 19,833 | | | | 20,081 | |
Federal Mogul Corporation <%% | | | 0.00 | | | | 3-21-2021 | | | | 185,000 | | | | 183,415 | |
First Data Corporation | | | 4.15 | | | | 3-23-2018 | | | | 55,000 | | | | 54,897 | |
Focus Brands Incorporated | | | 4.25 | | | | 2-21-2018 | | | | 26,905 | | | | 26,888 | |
Geo Group Incorporated | | | 3.25 | | | | 4-3-2020 | | | | 113,152 | | | | 113,082 | |
HGIM Corporation <%% | | | 5.50 | | | | 6-18-2020 | | | | 119,550 | | | | 117,458 | |
Hilton Worldwide Finance LLC | | | 3.50 | | | | 10-26-2020 | | | | 25,133 | | | | 25,025 | |
Hub International Limited <%% | | | 4.25 | | | | 10-2-2020 | | | | 55,000 | | | | 54,882 | |
Hubbard Radio LLC | | | 4.50 | | | | 4-29-2019 | | | | 42,438 | | | | 42,438 | |
IMS Health Incorporated | | | 3.50 | | | | 3-17-2021 | | | | 55,000 | | | | 54,733 | |
Intelsat Jackson Holdings | | | 3.75 | | | | 6-30-2019 | | | | 240,332 | | | | 240,092 | |
International Lease Finance Corporation | | | 3.50 | | | | 3-6-2021 | | | | 20,000 | | | | 19,919 | |
Kar Auction Services Incorporated | | | 3.50 | | | | 3-7-2021 | | | | 137,987 | | | | 137,297 | |
Learfield Communications Incorporated <%% | | | 4.50 | | | | 10-9-2020 | | | | 19,963 | | | | 19,950 | |
Level 3 Financing Incorporated | | | 4.00 | | | | 8-1-2019 | | | | 288,205 | | | | 288,027 | |
Libbey Glass Incorporated | | | 3.75 | | | | 4-9-2021 | | | | 25,000 | | | | 24,852 | |
LTS Buyer LLC | | | 4.00 | | | | 4-11-2020 | | | | 19,950 | | | | 19,875 | |
MedAssets Incorporated | | | 4.00 | | | | 12-12-2019 | | | | 37,760 | | | | 37,702 | |
MGM Resorts International | | | 3.50 | | | | 12-20-2019 | | | | 246,875 | | | | 245,179 | |
Multiplan Incorporated | | | 4.00 | | | | 3-31-2021 | | | | 99,091 | | | | 98,542 | |
Nusil Technology LLC | | | 5.25 | | | | 4-7-2017 | | | | 4,918 | | | | 4,777 | |
Orient Express Hotels Limited <%% | | | 4.00 | | | | 3-21-2021 | | | | 105,000 | | | | 104,606 | |
Pep Boys-Manny, Moe & Jack | | | 4.25 | | | | 10-11-2018 | | | | 197,500 | | | | 197,994 | |
Philadelphia Energy Solutions LLC | | | 6.25 | | | | 4-4-2018 | | | | 39,600 | | | | 35,343 | |
Rent-A-Center Incorporated | | | 3.75 | | | | 3-19-2021 | | | | 75,000 | | | | 74,250 | |
Salem Communications Corporation | | | 4.50 | | | | 3-16-2020 | | | | 28,900 | | | | 28,900 | |
Salix Pharmaceuticals Limited | | | 4.25 | | | | 1-2-2020 | | | | 9,875 | | | | 9,903 | |
Sedgwick Incorporated | | | 6.75 | | | | 2-28-2022 | | | | 10,000 | | | | 9,881 | |
Sedgwick ncorporated | | | 3.75 | | | | 3-1-2021 | | | | 50,000 | | | | 49,304 | |
Sophia LP <%% | | | 4.00 | | | | 7-19-2018 | | | | 84,883 | | | | 84,856 | |
Spin Holdco Incorporated | | | 4.25 | | | | 11-14-2019 | | | | 155,715 | | | | 155,053 | |
SRAM LLC First Lien | | | 4.01 | | | | 4-10-2020 | | | | 4,190 | | | | 4,155 | |
Surgical Care Affiliates LLC | | | 4.00 | | | | 6-30-2018 | | | | 24,813 | | | | 24,709 | |
Syniverse Holdings Incorporated | | | 4.00 | | | | 4-23-2019 | | | | 242,380 | | | | 241,593 | |
Tallgrass Operations LLC | | | 4.25 | | | | 11-13-2018 | | | | 107,071 | | | | 107,696 | |
Texas Competitive Electric Holdings LLC (s) | | | 3.74 | | | | 10-10-2014 | | | | 400,000 | | | | 300,832 | |
United Surgical Partners International Incorporated | | | 4.75 | | | | 4-3-2019 | | | | 9,900 | | | | 9,908 | |
USI Incorporated <%% | | | 4.25 | | | | 12-27-2019 | | | | 39,925 | | | | 39,858 | |
USIC Holdings Incorporated | | | 4.00 | | | | 7-10-2020 | | | | 29,925 | | | | 29,551 | |
Valeant Pharmaceuticals International Incorporated | | | 3.75 | | | | 12-11-2019 | | | | 197,000 | | | | 196,368 | |
Valeant Pharmaceuticals International Incorporated | | | 3.75 | | | | 8-5-2020 | | | | 9,196 | | | | 9,196 | |
Vertafore Incorporated | | | 4.25 | | | | 10-3-2019 | | | | 73,340 | | | | 73,212 | |
Vertafore Incorporated | | | 9.75 | | | | 10-29-2017 | | | | 10,000 | | | | 10,125 | |
WASH Multifamily Laundry Systems LLC | | | 4.50 | | | | 2-21-2019 | | | | 119,700 | | | | 118,802 | |
| | | | |
Total Term Loans (Cost $6,049,932) | | | | | | | | | | | | | | | 5,948,647 | |
| | | | | | | | | | | | | | | | |
| | | | |
Yankee Corporate Bonds and Notes: 4.74% | | | | | | | | | | | | | | | | |
| | | | |
Consumer Discretionary: 0.80% | | | | | | | | | | | | | | | | |
| | | | |
| Oil, Gas & Consumable Fuels: 0.80% | | | | | | | | | | | | | | | | |
Petrobras Global Finance Company | | | 6.25 | | | | 3-17-2024 | | | | 200,000 | | | | 209,997 | |
| | | | | | | | | | | | | | | | |
The accompanying notes are an integral part of these financial statements.
| | | | |
| 16 | | Wells Fargo Advantage Strategic Income Fund | | Portfolio of investments—April 30, 2014 (unaudited) |
| | | | | | | | | | | | | | | | |
| Security name | | Interest rate | | | Maturity date | | | Principal | | | Value | |
| | | | | | | | | | | | | | | | |
| | | | |
Consumer Staples: 0.62% | | | | | | | | | | | | | | | | |
| | | | |
| Food Products: 0.62% | | | | | | | | | | | | | | | | |
BRF SA 144A | | | 3.95 | % | | | 5-22-2023 | | | $ | 175,000 | | | $ | 160,563 | |
| | | | | | | | | | | | | | | | |
| | | | |
Energy: 0.72% | | | | | | | | | | | | | | | | |
| | | | |
| Energy Equipment & Services: 0.72% | | | | | | | | | | | | | | | | |
Transocean Incorporated | | | 3.80 | | | | 10-15-2022 | | | | 195,000 | | | | 187,042 | |
| | | | | | | | | | | | | | | | |
| | | | |
Financials: 0.92% | | | | | | | | | | | | | | | | |
| | | | |
| Banks: 0.90% | | | | | | | | | | | | | | | | |
BPCE SA 144A | | | 5.15 | | | | 7-21-2024 | | | | 230,000 | | | | 233,761 | |
| | | | | | | | | | | | | | | | |
| | | | |
| Diversified Financial Services: 0.02% | | | | | | | | | | | | | | | | |
Nielsen Holding and Finance BV 144A | | | 5.50 | | | | 10-1-2021 | | | | 5,000 | | | | 5,213 | |
| | | | | | | | | | | | | | | | |
| | | | |
Health Care: 0.21% | | | | | | | | | | | | | | | | |
| | | | |
| Biotechnology: 0.06% | | | | | | | | | | | | | | | | |
Grifols Worldwide Operations Limited 144A | | | 5.25 | | | | 4-1-2022 | | | | 15,000 | | | | 15,225 | |
| | | | | | | | | | | | | | | | |
| | | | |
| Pharmaceuticals: 0.15% | | | | | | | | | | | | | | | | |
Valeant Pharmaceuticals International Incorporated 144A | | | 6.75 | | | | 8-15-2018 | | | | 10,000 | | | | 10,825 | |
Valeant Pharmaceuticals International Incorporated 144A | | | 7.50 | | | | 7-15-2021 | | | | 25,000 | | | | 27,875 | |
| | | | |
| | | | | | | | | | | | | | | 38,700 | |
| | | | | | | | | | | | | | | | |
| | | | |
Industrials: 0.98% | | | | | | | | | | | | | | | | |
| | | | |
| Building Products: 0.98% | | | | | | | | | | | | | | | | |
ArcelorMittal | | | 4.25 | | | | 8-5-2015 | | | | 250,000 | | | | 256,875 | |
| | | | | | | | | | | | | | | | |
| | | | |
Telecommunication Services: 0.04% | | | | | | | | | | | | | | | | |
| | | | |
| Diversified Telecommunication Services: 0.04% | | | | | | | | | | | | | | | | |
Intelsat Jackson Holdings SA | | | 6.63 | | | | 12-15-2022 | | | | 5,000 | | | | 5,138 | |
Virgin Media Secured Finance plc 144A | | | 5.38 | | | | 4-15-2021 | | | | 5,000 | | | | 5,125 | |
| | | | |
| | | | | | | | | | | | | | | 10,263 | |
| | | | | | | | | | | | | | | | |
| | | | |
Utilities: 0.45% | | | | | | | | | | | | | | | | |
| | | | |
| Electric Utilities: 0.45% | | | | | | | | | | | | | | | | |
Comision Federal de Electricidad 144A | | | 4.88 | | | | 1-15-2024 | | | | 115,000 | | | | 118,019 | |
| | | | | | | | | | | | | | | | |
| | | | |
Total Yankee Corporate Bonds and Notes (Cost $1,229,958) | | | | | | | | | | | | | | | 1,235,658 | |
| | | | | | | | | | | | | | | | |
| | | | |
| | | Yield | | | | | | Shares | | | | |
| | | | |
Short-Term Investments: 4.52% | | | | | | | | | | | | | | | | |
| | | | |
| Investment Companies: 4.10% | | | | | | | | | | | | | | | | |
Wells Fargo Advantage Cash Investment Money Market Fund, Select Class (l)(u)## | | | 0.07 | | | | | | | | 1,068,095 | | | | 1,068,095 | |
| | | | | | | | | | | | | | | | |
| | | | |
| | | | | | | | | Principal | | | | |
| | | | |
| U.S. Treasury Securities: 0.42% | | | | | | | | | | | | | | | | |
U.S. Treasury Bill #(z) | | | 0.05 | | | | 6-19-2014 | | | $ | 110,000 | | | | 109,998 | |
| | | | | | | | | | | | | | | | |
| | | | |
Total Short-Term Investments (Cost $1,178,087) | | | | | | | | | | | | | | | 1,178,093 | |
| | | | | | | | | | | | | | | | |
The accompanying notes are an integral part of these financial statements.
| | | | | | |
| Portfolio of investments—April 30, 2014 (unaudited) | | Wells Fargo Advantage Strategic Income Fund | | | 17 | |
| | | | | | | | |
| | | | | | Value | |
| Total investments in securities | | | | | | | | |
| (Cost $26,763,938) * | | | 101.32 | % | | $ | 26,411,799 | |
Other assets and liabilities, net | | | (1.32 | ) | | | (343,764 | ) |
| | | | | | | | |
Total net assets | | | 100.00 | % | | $ | 26,068,035 | |
| | | | | | | | |
| ± | Variable rate investment. The rate shown is the rate in effect at period end. |
| 144A | Security that may be resold to “qualified institutional buyers” under Rule 144A or security offered pursuant to Section 4(2) of the Securities Act of 1933, as amended |
| (s) | Security is currently in default with regards to scheduled interest and/or principal payments. The Fund has stopped accruing interest on this security. |
| %% | Security issued on a when-issued basis. |
| ¥ | A payment-in-kind (PIK) security is a security in which the issuer may make interest or dividend payments in cash or additional securities. These additional securities generally have the same terms as the original holdings. |
| @ | Foreign bond principal is denominated in local currency. |
| < | All or a portion of the position represents an unfunded term loan commitment. |
| (l) | Represents an affiliate of the Fund under Sections 2(a)(2) and 2(a)(3) of the Investment Company Act of 1940, as amended |
| ## | All or a portion of this security has been segregated for when-issued securities and unfunded term loans. |
| (u) | Rate shown is the 7-day annualized yield at period end. |
| (z) | Zero coupon security. Rate represents current yield to maturity. |
| # | All or a portion of this security is segregated as collateral for investments in derivative instruments. |
| (a) | Security is fair valued by the Management Valuation Team, and in certain instances by the Board of Trustees, in accordance with procedures approved by the Board of Trustees. |
| * | Cost for federal income tax purposes is $26,783,187 and unrealized appreciation (depreciation) consists of: |
| | | | |
Gross unrealized appreciation | | $ | 629,130 | |
Gross unrealized depreciation | | | (1,000,518 | ) |
| | | | |
Net unrealized depreciation | | $ | (371,388 | ) |
The accompanying notes are an integral part of these financial statements.
| | | | |
| 18 | | Wells Fargo Advantage Strategic Income Fund | | Statement of assets and liabilities—April 30, 2014 (unaudited) |
| | | | |
| | | | |
| |
Assets | | | | |
Investments | | | | |
In unaffiliated securities, at value (see cost below) | | $ | 25,343,704 | |
In affiliated securities, at value (see cost below) | | | 1,068,095 | |
| | | | |
Total investments, at value (see cost below) | | | 26,411,799 | |
Cash | | | 120,323 | |
Foreign currency, at value (see cost below) | | | 19,479 | |
Receivable for investments sold | | | 76,327 | |
Receivable for interest | | | 268,162 | |
Unrealized gains on forward foreign currency contracts | | | 3,318 | |
Receivable from adviser | | | 8,578 | |
Prepaid expenses and other assets | | | 30,191 | |
| | | | |
Total assets | | | 26,938,177 | |
| | | | |
| |
Liabilities | | | | |
Payable for investments purchased | | | 772,437 | |
Unrealized losses on forward foreign currency contracts | | | 28,432 | |
Payable for daily variation margin on open futures contracts | | | 28,828 | |
Distribution fees payable | | | 521 | |
Due to other related parties | | | 2,874 | |
Accrued expenses and other liabilities | | | 37,050 | |
| | | | |
Total liabilities | | | 870,142 | |
| | | | |
Total net assets | | $ | 26,068,035 | |
| | | | |
| |
NET ASSETS CONSIST OF | | | | |
Paid-in capital | | $ | 26,691,608 | |
Undistributed net investment income | | | 224,274 | |
Accumulated net realized losses on investments | | | (452,070 | ) |
Net unrealized losses on investments | | | (395,777 | ) |
| | | | |
Total net assets | | $ | 26,068,035 | |
| | | | |
| |
COMPUTATION OF NET ASSET VALUE AND OFFERING PRICE PER SHARE1 | | | | |
Net assets – Class A | | $ | 650,459 | |
Shares outstanding – Class A | | | 66,770 | |
Net asset value per share – Class A | | | $9.74 | |
Maximum offering price per share – Class A2 | | | $10.20 | |
Net assets – Class C | | $ | 912,996 | |
Shares outstanding – Class C | | | 93,825 | |
Net asset value per share – Class C | | | $9.73 | |
Net assets – Administrator Class | | $ | 509,541 | |
Shares outstanding – Administrator Class | | | 52,237 | |
Net asset value per share – Administrator Class | | | $9.75 | |
Net assets – Institutional Class | | $ | 23,995,039 | |
Shares outstanding – Institutional Class | | | 2,462,610 | |
Net asset value per share – Institutional Class | | | $9.74 | |
| |
Investments in unaffiliated securities, at cost | | $ | 25,695,843 | |
| | | | |
Investments in affiliated securities, at cost | | $ | 1,068,095 | |
| | | | |
Total investments, at cost | | $ | 26,763,938 | |
| | | | |
Foreign currency, at cost | | $ | 19,708 | |
| | | | |
| 1. | The Fund has an unlimited number of authorized shares. |
| 2. | Maximum offering price is computed as 100/95.50 of net asset value. On investments of $50,000 or more, the offering price is reduced. |
The accompanying notes are an integral part of these financial statements.
| | | | | | |
| Statement of operations—six months ended April 30, 2014 (unaudited) | | Wells Fargo Advantage Strategic Income Fund | | | 19 | |
| | | | |
| | | | |
| |
Investment income | | | | |
Interest* | | $ | 648,583 | |
Income from affiliated securities | | | 346 | |
| | | | |
Total investment income | | | 648,929 | |
| | | | |
| |
Expenses | | | | |
Advisory fee | | | 59,498 | |
Administration fees | | | | |
Fund level | | | 6,263 | |
Class A | | | 461 | |
Class C | | | 544 | |
Administrator Class | | | 247 | |
Institutional Class | | | 9,320 | |
Shareholder servicing fees | | | | |
Class A | | | 720 | |
Class C | | | 850 | |
Administrator Class | | | 619 | |
Distribution fees | | | | |
Class C | | | 2,550 | |
Custody and accounting fees | | | 13,717 | |
Professional fees | | | 24,609 | |
Registration fees | | | 45,094 | |
Shareholder report expenses | | | 7,774 | |
Trustees’ fees and expenses | | | 4,605 | |
Other fees and expenses | | | 2,658 | |
| | | | |
Total expenses | | | 179,529 | |
Less: Fee waivers and/or expense reimbursements | | | (99,570 | ) |
| | | | |
Net expenses | | | 79,959 | |
| | | | |
Net investment income | | | 568,970 | |
| | | | |
| |
REALIZED AND UNREALIZED GAINS (LOSSES) ON INVESTMENTS | | | | |
| |
Net realized gains (losses) on: | | | | |
Unaffiliated securities | | | (543,023 | ) |
Futures transactions | | | (225,517 | ) |
Forward foreign currency contract transactions | | | 117,384 | |
| | | | |
Net realized losses on investments | | | (651,156 | ) |
| | | | |
| |
Net change in unrealized gains (losses) on: | | | | |
Unaffiliated securities | | | 596,792 | |
Futures transactions | | | 214,556 | |
Forward foreign currency contract transactions | | | (24,661 | ) |
| | | | |
Net change in unrealized gains (losses) on investments | | | 786,687 | |
| | | | |
Net realized and unrealized gains (losses) on investments | | | 135,531 | |
| | | | |
Net increase in net assets resulting from operations | | $ | 704,501 | |
| | | | |
| |
* Net of foreign interest withholding taxes in the amount of | | | $2,683 | |
The accompanying notes are an integral part of these financial statements.
| | | | |
| 20 | | Wells Fargo Advantage Strategic Income Fund | | Statement of changes in net assets |
| | | | | | | | | | | | | | | | |
| | | Six months ended April 30, 2014 (unaudited) | | | Year ended
October 31, 20131 | |
| | | | |
Operations | | | | | | | | | | | | | | | | |
Net investment income | | | | | | $ | 568,970 | | | | | | | $ | 745,697 | |
Net realized gains (losses) on investments | | | | | | | (651,156 | ) | | | | | | | 259,309 | |
Net change in unrealized gains (losses) on investments | | | | | | | 786,687 | | | | | | | | (1,182,464 | ) |
| | | | |
Net increase (decrease) in net assets resulting from operations | | | | | | | 704,501 | | | | | | | | (177,458 | ) |
| | | | |
| | | | |
Distributions to shareholders from | | | | | | | | | | | | | | | | |
Net investment income | | | | | | | | | | | | | | | | |
Class A | | | | | | | (9,664 | ) | | | | | | | (12,970 | ) |
Class C | | | | | | | (9,069 | ) | | | | | | | (10,110 | ) |
Administrator Class | | | | | | | (8,779 | ) | | | | | | | (12,841 | ) |
Institutional Class | | | | | | | (439,848 | ) | | | | | | | (648,255 | ) |
| | | | |
Total distributions to shareholders | | | | | | | (467,360 | ) | | | | | | | (684,176 | ) |
| | | | |
| | | | |
Capital share transactions | | | Shares | | | | | | | | Shares | | | | | |
Proceeds from shares sold | | | | | | | | | | | | | | | | |
Class A | | | 12,092 | | | | 115,673 | | | | 52,351 | | | | 523,017 | |
Class C | | | 39,267 | | | | 377,669 | | | | 54,146 | | | | 540,590 | |
Administrator Class | | | 0 | | | | 0 | | | | 50,000 | | | | 500,000 | |
Institutional Class | | | 0 | | | | 0 | | | | 2,350,000 | | | | 23,500,000 | |
| | | | |
| | | | | | | 493,342 | | | | | | | | 25,063,607 | |
| | | | |
Reinvestment of distributions | | | | | | | | | | | | | | | | |
Class A | | | 1,005 | | | | 9,602 | | | | 1,333 | | | | 12,970 | |
Class C | | | 949 | | | | 9,069 | | | | 1,040 | | | | 10,110 | |
Administrator Class | | | 918 | | | | 8,779 | | | | 1,319 | | | | 12,841 | |
Institutional Class | | | 46,018 | | | | 439,848 | | | | 66,592 | | | | 648,255 | |
| | | | |
| | | | | | | 467,298 | | | | | | | | 684,176 | |
| | | | |
Payment for shares redeemed | | | | | | | | | | | | | | | | |
Class A | | | (9 | ) | | | (87 | ) | | | (2 | ) | | | (23 | ) |
Class C | | | (1 | ) | | | (12 | ) | | | (1,576 | ) | | | (15,773 | ) |
| | | | |
| | | | | | | (99 | ) | | | | | | | (15,796 | ) |
| | | | |
Net increase in net assets resulting from capital share transactions | | | | | | | 960,541 | | | | | | | | 25,731,987 | |
| | | | |
Total increase in net assets | | | | | | | 1,197,682 | | | | | | | | 24,870,353 | |
| | | | |
| | | | |
Net assets | | | | | | | | | | | | | | | | |
Beginning of period | | | | | | | 24,870,353 | | | | | | | | 0 | |
| | | | |
End of period | | | | | | $ | 26,068,035 | | | | | | | $ | 24,870,353 | |
| | | | |
Undistributed net investment income | | | | | | $ | 224,274 | | | | | | | $ | 122,664 | |
| | | | |
| 1. | For the period from January 31, 2013 (commencement of operations) to October 31, 2013 |
The accompanying notes are an integral part of these financial statements.
| | | | | | |
| Financial highlights | | Wells Fargo Advantage Strategic Income Fund | | | 21 | |
(For a share outstanding throughout each period)
| | | | | | | | |
| | | Six months ended
April 30, 2014
(unaudited) | | | Year ended | |
| CLASS A | | | October 31, 20131 | |
Net asset value, beginning of period | | $ | 9.66 | | | $ | 10.00 | |
Net investment income | | | 0.20 | | | | 0.27 | |
Net realized and unrealized gains (losses) on investments | | | 0.05 | | | | (0.36 | ) |
| | | | | | | | |
Total from investment operations | | | 0.25 | | | | (0.09 | ) |
Distributions to shareholders from | | | | | | | | |
Net investment income | | | (0.17 | ) | | | (0.25 | ) |
Net asset value, end of period | | $ | 9.74 | | | $ | 9.66 | |
Total return2 | | | 2.61 | % | | | (0.89 | )% |
Ratios to average net assets (annualized) | | | | | | | | |
Gross expenses | | | 1.73 | % | | | 1.85 | % |
Net expenses | | | 0.90 | % | | | 0.90 | % |
Net investment income | | | 4.29 | % | | | 3.76 | % |
Supplemental data | | | | | | | | |
Portfolio turnover rate | | | 28 | % | | | 39 | % |
Net assets, end of period (000s omitted) | | | $650 | | | | $518 | |
| 1. | For the period from January 31, 2013 (commencement of class operations) to October 31, 2013 |
| 2. | Total return calculations do not include any sales charges. Returns for periods of less than one year are not annualized. |
The accompanying notes are an integral part of these financial statements.
| | | | |
| 22 | | Wells Fargo Advantage Strategic Income Fund | | Financial highlights |
(For a share outstanding throughout each period)
| | | | | | | | |
| | | Six months ended
April 30, 2014
(unaudited) | | | Year ended | |
| CLASS C | | | October 31, 20131 | |
Net asset value, beginning of period | | $ | 9.65 | | | $ | 10.00 | |
Net investment income | | | 0.15 | | | | 0.21 | |
Net realized and unrealized gains (losses) on investments | | | 0.07 | | | | (0.37 | ) |
| | | | | | | | |
Total from investment operations | | | 0.22 | | | | (0.16 | ) |
Distributions to shareholders from | | | | | | | | |
Net investment income | | | (0.14 | ) | | | (0.19 | ) |
Net asset value, end of period | | $ | 9.73 | | | $ | 9.65 | |
Total return2 | | | 2.31 | % | | | (1.51 | )% |
Ratios to average net assets (annualized) | | | | | | | | |
Gross expenses | | | 2.48 | % | | | 2.60 | % |
Net expenses | | | 1.65 | % | | | 1.65 | % |
Net investment income | | | 3.54 | % | | | 3.01 | % |
Supplemental data | | | | | | | | |
Portfolio turnover rate | | | 28 | % | | | 39 | % |
Net assets, end of period (000s omitted) | | | $913 | | | | $518 | |
| 1. | For the period from January 31, 2013 (commencement of class operations) to October 31, 2013 |
| 2. | Total return calculations do not include any sales charges. Returns for periods of less than one year are not annualized. |
The accompanying notes are an integral part of these financial statements.
| | | | | | |
| Financial highlights | | Wells Fargo Advantage Strategic Income Fund | | | 23 | |
(For a share outstanding throughout each period)
| | | | | | | | |
| | | Six months ended
April 30, 2014 (unaudited) | | | Year ended | |
| ADMINISTRATOR CLASS | | | October 31, 20131 | |
Net asset value, beginning of period | | $ | 9.66 | | | $ | 10.00 | |
Net investment income | | | 0.21 | | | | 0.28 | |
Net realized and unrealized gains (losses) on investments | | | 0.05 | | | | (0.37 | ) |
| | | | | | | | |
Total from investment operations | | | 0.26 | | | | (0.09 | ) |
Distributions to shareholders from | | | | | | | | |
Net investment income | | | (0.17 | ) | | | (0.25 | ) |
Net asset value, end of period | | $ | 9.75 | | | $ | 9.66 | |
Total return2 | | | 2.84 | % | | | (0.85 | )% |
Ratios to average net assets (annualized) | | | | | | | | |
Gross expenses | | | 1.66 | % | | | 1.79 | % |
Net expenses | | | 0.75 | % | | | 0.75 | % |
Net investment income | | | 4.43 | % | | | 3.90 | % |
Supplemental data | | | | | | | | |
Portfolio turnover rate | | | 28 | % | | | 39 | % |
Net assets, end of period (000s omitted) | | | $510 | | | | $496 | |
| 1. | For the period from January 31, 2013 (commencement of class operations) to October 31, 2013 |
| 2. | Returns for periods of less than one year are not annualized. |
The accompanying notes are an integral part of these financial statements.
| | | | |
| 24 | | Wells Fargo Advantage Strategic Income Fund | | Financial highlights |
(For a share outstanding throughout each period)
| | | | | | | | |
| | | Six months ended
April 30, 2014
(unaudited) | | | Year ended | |
| INSTITUTIONAL CLASS | | | October 31, 20131 | |
Net asset value, beginning of period | | $ | 9.66 | | | $ | 10.00 | |
Net investment income | | | 0.22 | | | | 0.29 | |
Net realized and unrealized gains (losses) on investments | | | 0.04 | | | | (0.36 | ) |
| | | | | | | | |
Total from investment operations | | | 0.26 | | | | (0.07 | ) |
Distributions to shareholders from | | | | | | | | |
Net investment income | | | (0.18 | ) | | | (0.27 | ) |
Net asset value, end of period | | $ | 9.74 | | | $ | 9.66 | |
Total return2 | | | 2.85 | % | | | (0.66 | )% |
Ratios to average net assets (annualized) | | | | | | | | |
Gross expenses | | | 1.39 | % | | | 1.52 | % |
Net expenses | | | 0.60 | % | | | 0.60 | % |
Net investment income | | | 4.58 | % | | | 4.05 | % |
Supplemental data | | | | | | | | |
Portfolio turnover rate | | | 28 | % | | | 39 | % |
Net assets, end of period (000s omitted) | | | $23,995 | | | | $23,338 | |
| 1. | For the period from January 31, 2013 (commencement of class operations) to October 31, 2013 |
| 2. | Returns for periods of less than one year are not annualized. |
The accompanying notes are an integral part of these financial statements.
| | | | | | |
| Notes to financial statements (unaudited) | | Wells Fargo Advantage Strategic Income Fund | | | 25 | |
1. ORGANIZATION
Wells Fargo Funds Trust (the “Trust”), a Delaware statutory trust organized on March 10, 1999, is an open-end management investment company registered under the Investment Company Act of 1940, as amended (the “1940 Act”). These financial statements report on the Wells Fargo Advantage Strategic Income Fund (the “Fund”) which is a diversified series of the Trust.
2. SIGNIFICANT ACCOUNTING POLICIES
The following significant accounting policies, which are consistently followed in the preparation of the financial statements of the Fund, are in conformity with U.S. generally accepted accounting principles which require management to make estimates and assumptions that affect the reported amounts of assets and liabilities, disclosure of contingent assets and liabilities at the date of the financial statements, and the reported amounts of revenues and expenses during the reporting period. Actual results could differ from those estimates.
Securities valuation
All investments are valued each business day as of the close of regular trading on the New York Stock Exchange (generally 4 p.m. Eastern Time).
Fixed income securities acquired with maturities exceeding 60 days are valued based on evaluated bid prices provided by an independent pricing service which may utilize both transaction data and market information such as yield, quality, coupon rate, maturity, type of issue, trading characteristics and other market data. If prices are not available from the independent pricing service or prices received are deemed not representative of market value, prices will be obtained from an independent broker-dealer.
Futures that are listed on a foreign or domestic exchange or market are valued at the official closing price or, if none, the last sales price.
Short-term securities, with maturities of 60 days or less at time of purchase, generally are valued at amortized cost which approximates fair value. The amortized cost method involves valuing a security at its cost, plus accretion of discount or minus amortization of premium over the period until maturity.
The values of securities denominated in foreign currencies are translated into U.S. dollars at rates provided by an independent foreign currency pricing source at a time each business day specified by the Management Valuation Team of Wells Fargo Funds Management, LLC (“Funds Management”).
Investments in registered open-end investment companies are valued at net asset value.
Investments which are not valued using any of the methods discussed above are valued at their fair value, as determined in good faith by the Board of Trustees of the Fund. The Board of Trustees has established a Valuation Committee comprised of the Trustees and has delegated to it the authority to take any actions regarding the valuation of portfolio securities that the Valuation Committee deems necessary or appropriate, including determining the fair value of portfolio securities, unless the determination has been delegated to the Management Valuation Team. The Board of Trustees retains the authority to make or ratify any valuation decisions or approve any changes to the Valuation Procedures as it deems appropriate. On a quarterly basis, the Board of Trustees receives reports on any valuation actions taken by the Valuation Committee or the Management Valuation Team which may include items for ratification.
Valuations of fair valued securities are compared to the next actual sales price when available, or other appropriate market values, to assess the continued appropriateness of the fair valuation methodologies used. These securities are fair valued on a day-to-day basis, taking into consideration changes to appropriate market information and any significant changes to the inputs considered in the valuation process until there is a readily available price provided on an exchange or by an independent pricing service. Valuations received from an independent pricing service or independent broker-dealer quotes are periodically validated by comparisons to most recent trades and valuations provided by other independent pricing services in addition to the review of prices by the adviser and/or subadviser. Unobservable inputs used in determining fair valuations are identified based on the type of security, taking into consideration factors utilized by market participants in valuing the investment, knowledge about the issuer and the current market environment.
Foreign currency translation
The accounting records of the Fund are maintained in U.S. dollars. The values of other assets and liabilities denominated in foreign currencies are translated into U.S. dollars at rates provided by an independent foreign currency pricing source at a time each business day specified by the Management Valuation Team. Purchases and sales of securities, and income and expenses are converted at the rate of exchange on the respective dates of such transactions. Net realized foreign
| | | | |
| 26 | | Wells Fargo Advantage Strategic Income Fund | | Notes to financial statements (unaudited) |
exchange gains or losses arise from sales of foreign currencies, currency gains or losses realized between the trade and settlement dates on securities transactions, and the difference between the amounts of dividends, interest and foreign withholding taxes recorded and the U.S. dollar equivalent of the amounts actually paid or received. Net unrealized foreign exchange gains and losses arise from changes in the fair value of assets and liabilities other than investments in securities resulting from changes in exchange rates. The changes in net assets arising from changes in exchange rates and the changes in net assets resulting from changes in market prices of securities are not separately presented. Such changes are included in net realized and unrealized gains or losses from investments.
Forward foreign currency contracts
The Fund is subject to foreign currency exchange rate risk in the normal course of pursuing its investment objectives. A forward foreign currency contract is an agreement between two parties to purchase or sell a specific currency for an agreed-upon price at a future date. The Fund enters into forward foreign currency contracts to facilitate transactions in foreign-denominated securities and to attempt to minimize the risk to the Fund from adverse changes in the relationship between currencies. Forward foreign currency contracts are recorded at the forward rate and marked-to-market daily. When the contracts are closed, realized gains and losses arising from such transactions are recorded as realized gains or losses on forward foreign currency contract transactions. The Fund could be exposed to risks if the counterparties to the contracts are unable to meet the terms of their contracts or if the value of the foreign currency changes unfavorably. The Fund’s maximum risk of loss from counterparty credit risk is the unrealized gains on the contracts. This risk may be mitigated if there is a master netting arrangement between the Fund and the counterparty.
When-issued transactions
The Fund may purchase securities on a forward commitment or when-issued basis. The Fund records a when-issued transaction on the trade date and will segregate assets in an amount at least equal in value to the Fund’s commitment to purchase when-issued securities. Securities purchased on a when-issued basis are marked-to-market daily and the Fund begins earning interest on the settlement date. Losses may arise due to changes in the market value of the underlying securities or if the counterparty does not perform under the contract.
Term loans
The Fund may invest in term loans. The Fund begins earning interest when the loans are funded. The loans pay interest at rates which are periodically reset by reference to a base lending rate plus a spread. The Fund assumes the credit risk of the borrower and there could be potential loss to the Fund in the event of default by the borrower.
Futures contracts
The Fund is subject to interest rate risk in the normal course of pursuing its investment objectives. The Fund may buy and sell futures contracts in order to gain exposure to, or protect against, changes in security values and interest rates. The primary risks associated with the use of futures contracts are the imperfect correlation between changes in market values of securities held by the Fund and the prices of futures contracts, and the possibility of an illiquid market.
The aggregate principal amounts of the contracts are not recorded in the financial statements. Fluctuations in the value of the contracts are recorded in the Statement of Assets and Liabilities as an asset or liability and in the Statement of Operations as unrealized gains or losses until the contracts are closed, at which point they are recorded as net realized gains or losses on futures contracts. With futures contracts, there is minimal counterparty risk to the Fund since futures are exchange traded and the exchange’s clearinghouse, as counterparty to all exchange traded futures, guarantees the futures against default.
Security transactions and income recognition
Securities transactions are recorded on a trade date basis. Realized gains or losses are recorded on the basis of identified cost.
Interest income is accrued daily and bond discounts are accreted and premiums are amortized daily based on the effective interest method. To the extent debt obligations are placed on non-accrual status, any related interest income may be reduced by writing off interest receivables when the collection of all or a portion of interest has become doubtful based on consistently applied procedures. If the issuer subsequently resumes interest payments or when the collectability of interest is reasonably assured, the debt obligation is removed from non-accrual status.
Income from foreign securities is recorded net of foreign taxes withheld where recovery of such taxes is not assured.
| | | | | | |
| Notes to financial statements (unaudited) | | Wells Fargo Advantage Strategic Income Fund | | | 27 | |
Distributions to shareholders
Distributions to shareholders from net investment income and net realized gains, if any, are recorded on the ex-dividend date. Such distributions are determined in conformity with federal income tax regulations, which may differ in amount or character from net investment income and realized gains recognized for purposes of U.S. generally accepted accounting principles.
Federal and other taxes
The Fund intends to continue to qualify as a regulated investment company by distributing substantially all of its investment company taxable and tax-exempt income and any net realized capital gains (after reduction for capital loss carryforwards) sufficient to relieve it from all, or substantially all, federal income taxes. Accordingly, no provision for federal income taxes was required.
The Fund’s income and federal excise tax returns and all financial records supporting those returns since the Fund’s commencement of operations are subject to examination by the federal and Delaware revenue authorities. Management has analyzed the Fund’s tax positions taken on federal, state, and foreign tax returns for all open tax years and does not believe that there are any uncertain tax positions that require recognition of a tax liability.
As of October 31, 2013, the Fund had capital loss carryforwards which consist of $16,349 in short-term capital losses.
Class allocations
The separate classes of shares offered by the Fund differ principally in applicable sales charges, distribution, shareholder servicing, and administration fees. Shareholders of each class bear certain expenses that pertain to that particular class. All shareholders bear the common expenses of the Fund, earn income from the portfolio, and are allocated any unrealized gains and losses pro rata based on the average daily net assets of each class, without distinction between share classes. Dividends are determined separately for each class based on income and expenses allocable to each class. Realized gains and losses are allocated to each class pro rata based upon the net assets of each class on the date realized. Differences in per share dividend rates generally result from the relative weightings of pro rata income and realized gain allocations and from differences in separate class expenses, including distribution, shareholder servicing, and administration fees.
3. FAIR VALUATION MEASUREMENTS
Fair value measurements of investments are determined within a framework that has established a fair value hierarchy based upon the various data inputs utilized in determining the value of the Fund’s investments. The three-level hierarchy gives the highest priority to unadjusted quoted prices in active markets for identical assets or liabilities (Level 1) and the lowest priority to significant unobservable inputs (Level 3). The Fund’s investments are classified within the fair value hierarchy based on the lowest level of input that is significant to the fair value measurement. The inputs are summarized into three broad levels as follows:
| n | | Level 1 – quoted prices in active markets for identical securities |
| n | | Level 2 – other significant observable inputs (including quoted prices for similar securities, interest rates, prepayment speeds, credit risk, use of amortized cost, etc.) |
| n | | Level 3 – significant unobservable inputs (including the Fund’s own assumptions in determining the fair value of investments) |
The inputs or methodologies used for valuing investments in securities are not necessarily an indication of the risk associated with investing in those securities.
| | | | |
| 28 | | Wells Fargo Advantage Strategic Income Fund | | Notes to financial statements (unaudited) |
As of April 30, 2014, the inputs used in valuing investments in securities were as follows:
| | | | | | | | | | | | | | | | |
| Investments in securities | | Quoted prices (Level 1) | | | Other significant
observable inputs (Level 2) | | | Significant unobservable inputs (Level 3) | | | Total | |
Agency securities | | $ | 0 | | | $ | 244,164 | | | $ | 0 | | | $ | 244,164 | |
Asset-backed securities | | | 0 | | | | 704,184 | | | | 0 | | | | 704,184 | |
Corporate bonds and notes | | | 0 | | | | 7,864,931 | | | | 0 | | | | 7,864,931 | |
Foreign government bonds | | | 0 | | | | 5,944,119 | | | | 0 | | | | 5,944,119 | |
Municipal obligations | | | 0 | | | | 590,366 | | | | 0 | | | | 590,366 | |
Non-agency mortgage backed securities | | | 0 | | | | 2,701,637 | | | | 0 | | | | 2,701,637 | |
Term loans | | | 0 | | | | 5,120,678 | | | | 827,969 | | | | 5,948,647 | |
Yankee corporate bonds and notes | | | 0 | | | | 1,235,658 | | | | 0 | | | | 1,235,658 | |
Short-term investments | | | | | | | | | | | | | | | | |
Investment companies | | | 1,068,095 | | | | 0 | | | | 0 | | | | 1,068,095 | |
U.S. Treasury securities | | | 109,998 | | | | 0 | | | | 0 | | | | 109,998 | |
| | | $ | 1,178,093 | | | $ | 24,405,737 | | | $ | 827,969 | | | $ | 26,411,799 | |
As of April 30, 2014, the inputs used in valuing the Fund’s other financial instruments were as follows:
| | | | | | | | | | | | | | | | |
| Other financial instruments | | Quoted prices (Level 1) | | | Other significant
observable inputs (Level 2) | | | Significant unobservable inputs (Level 3) | | | Total | |
Futures contracts | | $ | (20,970 | )* | | $ | 0 | | | $ | 0 | | | $ | (20,970 | ) |
Forward foreign currency contracts | | | 0 | | | | (25,114 | )* | | | 0 | | | | (25,114 | ) |
| | * | Amount represents the net unrealized losses. |
Transfers in and transfers out are recognized at the end of the reporting period. For the six months ended April 30, 2014, the Fund did not have any transfers between Level 1 and Level 2.
The following is a reconciliation of assets in which significant unobservable inputs (Level 3) were used in determining fair value:
| | | | |
| | | Term
loans | |
Balance as of October 31, 2013 | | $ | 510,983 | |
Accrued discounts (premiums) | | | (366 | ) |
Realized gains (losses) | | | 25 | |
Change in unrealized gains (losses) | | | (3,960 | ) |
Purchases | | | 596,897 | |
Sales | | | (131,777 | ) |
Transfers into Level 3 | | | 33,677 | |
Transfers out of Level 3 | | | (177,510 | ) |
Balance as of April 30, 2014 | | $ | 827,969 | |
Change in unrealized gains (losses) relating to securities still held at April 30, 2014 | | $ | (1,902 | ) |
The investment type categorized above was valued using indicative broker quotes. These indicative broker quotes are considered Level 3 inputs. Quantitative unobservable inputs used by the brokers are often proprietary and not provided to the Fund and therefore the disclosure that would address these inputs is not included above.
4. TRANSACTIONS WITH AFFILIATES AND OTHER EXPENSES
Advisory fee
The Trust has entered into an advisory contract with Funds Management, an indirect wholly owned subsidiary of Wells Fargo & Company (“Wells Fargo”). The adviser is responsible for implementing investment policies and guidelines and for supervising the subadvisers, who are responsible for day-to-day portfolio management of the Fund.
| | | | | | |
| Notes to financial statements (unaudited) | | Wells Fargo Advantage Strategic Income Fund | | | 29 | |
Pursuant to the contract, Funds Management is entitled to receive an annual advisory fee starting at 0.475% and declining to 0.375% as the average daily net assets of the Fund increase. For the six months ended April 30, 2014, the advisory fee was equivalent to an annual rate of 0.475% of the Fund’s average daily net assets.
Funds Management has retained the services of certain subadvisers to provide daily portfolio management to the Fund. The fee for subadvisory services is borne by Funds Management. Wells Capital Management Incorporated, an affiliate of Funds Management and an indirect, wholly owned subsidiary of Wells Fargo, is a subadviser to the Fund and is entitled to receive a fee from Funds Management at an annual rate starting at 0.30% and declining to 0.15% as the average daily net assets of the Fund increase. First International Advisors, LLC, an affiliate of Funds Management and an indirect wholly owned subsidiary of Wells Fargo, is also a subadviser to the Fund and is entitled to receive a fee from Funds Management at an annual rate starting at 0.35% and declining to 0.20% as the average daily net assets of the Fund increase.
Administration and transfer agent fees
The Trust has entered into an administration agreement with Funds Management. Under this agreement, for providing administrative services, which includes paying fees and expenses for services provided by the transfer agent, sub-transfer agents, omnibus account servicers and record-keepers, Funds Management is entitled to receive from the Fund an annual fund level administration fee starting at 0.05% and declining to 0.03% as the average daily net assets of the Fund increase and a class level administration fee which is calculated based on the average daily net assets of each class as follows:
| | | | |
| | | Class level
administration fee | |
Class A, Class C | | | 0.16 | % |
Administrator Class | | | 0.10 | |
Institutional Class | | | 0.08 | |
Funds Management has contractually waived and/or reimbursed advisory and administration fees to the extent necessary to maintain certain net operating expense ratios for the Fund. Waiver of fees and/or reimbursement of expenses by Funds Management were made first from fund level expenses on a proportionate basis and then from class specific expenses. Funds Management has committed through February 28, 2015 to waive fees and/or reimburse expenses to the extent necessary to cap the Fund’s expenses at 0.90% for Class A shares, 1.65% for Class C shares, 0.75% for Administrator Class shares, and 0.60% for Institutional Class shares.
Distribution fees
The Trust has adopted a Distribution Plan for Class C shares of the Fund pursuant to Rule 12b-1 under the 1940 Act. Distribution fees are charged to Class C shares and paid to Wells Fargo Funds Distributor, LLC, the principal underwriter, at an annual rate of 0.75% of the average daily net assets of Class C shares.
Shareholder servicing fees
The Trust has entered into contracts with one or more shareholder servicing agents, whereby Class A, Class C, and Administrator Class of the Fund is charged a fee at an annual rate of 0.25% of the average daily net assets of each respective class.
A portion of these total shareholder servicing fees were paid to affiliates of Wells Fargo.
5. INVESTMENT PORTFOLIO TRANSACTIONS
Purchases and sales of investments, excluding U.S. government obligations (if any) and short-term securities, for the six months ended April 30, 2014 were $9,087,399 and $6,687,467, respectively.
As of April 30, 2014, the Fund had unfunded term loan commitments of $877,821.
6. DERIVATIVE TRANSACTIONS
During the six months ended April 30, 2014, the Fund entered into futures contracts to manage duration exposure.
At April 30, 2014, the Fund had short futures contracts outstanding as follows:
| | | | | | | | | | | | | | | | |
| Expiration date | | Counterparty | | Contracts | | Type | | | Contract value at April 30, 2014 | | | Unrealized
gains
(losses) | |
| 6-19-2014 | | JPMorgan | | 56 Short | | | 10-Year U.S. Treasury Notes | | | $ | 6,967,625 | | | $ | (7,778 | ) |
| 6-19-2014 | | JPMorgan | | 6 Short | | | U.S. Treasury Bonds | | | | 809,625 | | | | (14,173 | ) |
| 6-19-2014 | | JPMorgan | | 6 Short | | | 5-Year U.S. Treasury Notes | | | | 716,719 | | | | 981 | |
| | | | |
| 30 | | Wells Fargo Advantage Strategic Income Fund | | Notes to financial statements (unaudited) |
The Fund had an average notional amount of $8,445,126 in short futures contracts during the six months ended April 30, 2014.
During the six months ended April 30, 2014, the Fund entered into forward foreign currency contracts for economic hedging purposes.
At April 30, 2014, the Fund had forward foreign currency contracts outstanding as follows:
Forward foreign currency contracts to buy:
| | | | | | | | | | | | | | | | | | |
| Exchange date | | Counterparty | | Contracts
to receive | | | U.S. value at
April 30, 2014 | | | In exchange
for U.S. $ | | | Unrealized
gains | |
| 6-20-2014 | | State Street Bank | | | 16,500,000 | RUB | | $ | 457,588 | | | $ | 454,270 | | | $ | 3,318 | |
Forward foreign currency contracts to sell:
| | | | | | | | | | | | | | | | | | |
| Exchange date | | Counterparty | | Contracts
to deliver | | | U.S. value at
April 30, 2014 | | | In exchange for U.S. $ | | | Unrealized
losses | |
| 6-16-2014 | | State Street Bank | | | 430,000 | TRY | | $ | 201,272 | | | $ | 191,274 | | | $ | (9,998 | ) |
| 6-20-2014 | | State Street Bank | | | 16,500,000 | RUB | | | 457,588 | | | | 447,094 | | | | (10,494 | ) |
| 6-30-2014 | | State Street Bank | | | 3,825,000 | ZAR | | | 360,328 | | | | 352,388 | | | | (7,940 | ) |
The Fund had average contract amounts of $343,614 and $1,995,051 in forward foreign currency contracts to buy and forward foreign currency contracts to sell, respectively, during the six months ended April 30, 2014.
A summary of derivative instruments by primary risk exposure is outlined in the following tables.
The fair value of derivative instruments as of April 30, 2014 was as follows for the Fund:
| | | | | | | | | | | | |
| | | Asset derivatives | | | Liability derivatives | |
| | | Statement of Assets and
Liabilities location | | Fair value | | | Statement of Assets and
Liabilities location | | Fair value | |
Interest rate contracts | | Net assets – Net unrealized losses on investments | | $ | 981 | * | | Net assets – Net unrealized losses on investments | | $ | 21,951 | * |
Forward foreign currency contracts | | Unrealized gains on forward foreign currency exchange contracts, Net assets – Net unrealized losses on investments | | | 3,318 | | | Unrealized losses on forward foreign currency exchange contracts, Net assets – Net unrealized losses on investments | | | 28,432 | |
| | | | | $ | 4,299 | | | | | $ | 50,383 | |
| * | Amount represents cumulative unrealized gains/losses on futures contracts. Only the payable for variation margin as of April 30, 2014, which represents the current day’s variation margin, is reported separately on the Statement of Assets and Liabilities. |
The effect of derivative instruments on the Statement of Operations for the six months ended April 30, 2014 was as follows for the Fund:
| | | | | | | | | | | | |
| | | Amount of realized gains (losses) on derivatives | | | Change in unrealized gains (losses) on derivatives | |
| | | Futures
contracts | | Forward currency
contracts | | | Futures
contracts | | Forward currency
contracts | |
Interest rate contracts | | $(225,517) | | $ | 0 | | | $214,556 | | $ | 0 | |
Forward foreign currency contracts | | 0 | | | 117,384 | | | 0 | | | (24,661 | ) |
For certain types of derivative transactions, the Fund has entered into International Swaps and Derivatives Association, Inc. master agreements (“ISDA Master Agreements”) or similar agreements with approved counterparties. The ISDA Master Agreements or similar agreements may have requirements to deliver/deposit securities or cash to/with an exchange or broker-dealer as collateral and allows the Fund to offset, with each counterparty, certain derivative financial instrument’s assets and/or liabilities with collateral held or pledged. Collateral requirements differ by type of derivative. Collateral or margin requirements are set by the broker or exchange clearing house for exchange traded derivatives while collateral terms are contract specific for over-the-counter traded derivatives. Cash collateral that has been pledged to
| | | | | | |
| Notes to financial statements (unaudited) | | Wells Fargo Advantage Strategic Income Fund | | | 31 | |
cover obligations of the Fund under the ISDA Master Agreements or similar agreements, if any, will be reported separately in the Statement of Assets and Liabilities. Securities pledged as collateral, if any, for the same purpose are noted in the Portfolio of Investments. With respect to balance sheet offsetting, absent an event of default by the counterparty or a termination of the agreement, the reported amounts of financial assets and financial liabilities in the Statement of Assets and Liabilities are not offset across transactions between the Fund and the applicable counterparty. A reconciliation of the gross amounts on the Statement of Assets and Liabilities to the net amounts by derivative type, including any collateral exposure, is as follows:
| | | | | | | | | | | | | | | | |
| Derivative type | | Counterparty | | Gross amounts
of assets in the
Statement of
Assets and
Liabilities | | Amounts
subject to
netting
agreements | | | Collateral
received | | | Net
amount
of assets | |
Forward foreign currency contracts | | State Street Bank | | $3,318* | | $ | (3,318 | ) | | $ | 0 | | | $ | 0 | |
| | * | Amount represents net unrealized gains. |
| | | | | | | | | | | | | | | | | | |
| Derivative type | | Counterparty | | Gross amounts
of liabilities in the
Statement of
Assets and
Liabilities | | | Amounts
subject to
netting
agreements | | | Collateral
pledged1 | | | Net
amount
of liabilities | |
Futures – variation margin | | JPMorgan | | $ | 28,828 | | | $ | 0 | | | $ | (28,828 | ) | | $ | 0 | |
Forward foreign currency contracts | | State Street Bank | | | 28,432 | ** | | | (3,318 | ) | | | 0 | | | | 25,114 | |
| | 1 | Collateral pledged within this table is limited to the collateral for the net transaction with the counterparty by derivative type. |
| | ** | Amount represents net unrealized losses. |
7. BANK BORROWINGS
The Trust (excluding the money market funds and certain other funds in the Trust) and Wells Fargo Variable Trust are parties to a $150,000,000 revolving credit agreement with State Street Bank and Trust Company, whereby the Fund is permitted to use bank borrowings for temporary or emergency purposes, such as to fund shareholder redemption requests. Interest under the credit agreement is charged to the Fund based on a borrowing rate equal to the higher of the Federal Funds rate in effect on that day plus 1.25% or the overnight LIBOR rate in effect on that day plus 1.25%. In addition, an annual commitment fee equal to 0.10% of the unused balance is allocated to each participating fund. For the six months ended April 30, 2014, the Fund paid $12 in commitment fees.
For the six months ended April 30, 2014, there were no borrowings by the Fund under the agreement.
8. INDEMNIFICATION
Under the Trust’s organizational documents, the officers and Trustees are indemnified against certain liabilities that may arise out of performance of their duties to the Trust. Additionally, in the normal course of business, the Trust may enter into contracts with service providers that contain a variety of indemnification clauses. The Trust’s maximum exposure under these arrangements is dependent on future claims that may be made against the Fund and, therefore, cannot be estimated.
9. SUBSEQUENT DISTRIBUTIONS
On May 23, 2014, the Fund declared distributions from net investment income to shareholders of record on May 22, 2014. The per share amounts payable on May 27, 2014 were as follows:
| | | | |
| | | Net investment income | |
Class A | | $ | 0.01056 | |
Class C | | | 0.00030 | |
Administrator Class | | | 0.01157 | |
Institutional Class | | | 0.01581 | |
| | | | |
| 32 | | Wells Fargo Advantage Strategic Income Fund | | Notes to financial statements (unaudited) |
On June 24, 2014, the Fund declared distributions from net investment income to shareholders of record on June 23, 2014. The per share amounts payable on June 25, 2014 were as follows:
| | | | |
| | | Net investment income | |
Class A | | | $0.02759 | |
Class C | | | 0.02114 | |
Administrator Class | | | 0.02809 | |
Institutional Class | | | 0.03064 | |
These distributions are not reflected in the accompanying financial statements. The final determination of the source of all distributions is subject to change and made after the Fund’s tax year-end.
| | | | | | |
| Other information (unaudited) | | Wells Fargo Advantage Strategic Income Fund | | | 33 | |
PROXY VOTING INFORMATION
A description of the policies and procedures that the Fund uses to determine how to vote proxies relating to portfolio securities is available without charge, upon request, by calling 1-800-222-8222, visiting our website at wellsfargoadvantagefunds.com, or visiting the SEC website at sec.gov. Information regarding how the Fund voted proxies relating to portfolio securities during the most recent 12-month period ended June 30 is available without charge on the Fund’s website at wellsfargoadvantagefunds.com or by visiting the SEC website at sec.gov.
PORTFOLIO HOLDINGS INFORMATION
The complete portfolio holdings for the Fund are publicly available on the Fund’s website (wellsfargoadvantagefunds.com) on a monthly, 30-day or more delayed basis. In addition, top ten holdings information for the Fund is publicly available on the Fund’s website on a monthly, seven-day or more delayed basis. The Fund files its complete schedule of portfolio holdings with the SEC for the first and third quarters of each fiscal year on Form N-Q, which is available without charge by visiting the SEC website at sec.gov. In addition, the Fund’s Form N-Q may be reviewed and copied at the SEC’s Public Reference Room in Washington, DC, and at regional offices in New York City, at 233 Broadway, and in Chicago, at 175 West Jackson Boulevard, Suite 900. Information about the Public Reference Room may be obtained by calling 1-800-SEC-0330.
| | | | |
| 34 | | Wells Fargo Advantage Strategic Income Fund | | Other information (unaudited) |
BOARD OF TRUSTEES AND OFFICERS
Each of the Trustees and Officers1 listed in the table below acts in identical capacities for each fund in the Wells Fargo Advantage family of funds, which consists of 132 mutual funds comprising the Wells Fargo Funds Trust, Wells Fargo Variable Trust, Wells Fargo Master Trust and four closed-end funds (collectively the “Fund Complex”). This table should be read in conjunction with the Prospectus and the Statement of Additional Information2. All of the Trustees are also Members of the Audit and Governance Committees of each Trust in the Fund Complex. The mailing address of each Trustee and Officer is 525 Market Street, 12th Floor, San Francisco, CA 94105. Each Trustee and Officer serves an indefinite term, however, each Trustee serves such term until reaching the mandatory retirement age established by the Trustees.
Independent Trustees
| | | | | | |
Name and
year of birth | | Position held and
length of service* | | Principal occupations during past five years | | Other
directorships during
past five years |
Peter G. Gordon
(Born 1942) | | Trustee, since 1998; Chairman, since 2005 | | Co-Founder, Retired Chairman, President and CEO of Crystal Geyser Water Company. Trustee Emeritus, Colby College. | | Asset Allocation Trust |
| Isaiah Harris, Jr. (Born 1952) | | Trustee, since 2009 | | Retired. Prior thereto, President and CEO of BellSouth Advertising and Publishing Corp. from 2005 to 2007, President and CEO of BellSouth Enterprises from 2004 to 2005 and President of BellSouth Consumer Services from 2000 to 2003. Emeritus member of the Iowa State University Foundation Board of Governors. Emeritus Member of the Advisory Board of Iowa State University School of Business. Advisory Board Member, Palm Harbor Academy (charter school). Mr. Harris is a certified public accountant. | | CIGNA Corporation; Deluxe Corporation; Asset Allocation Trust |
Judith M. Johnson
(Born 1949) | | Trustee, since 2008; Audit Committee Chairman, since 2008 | | Retired. Prior thereto, Chief Executive Officer and Chief Investment Officer of Minneapolis Employees Retirement Fund from 1996 to 2008. Ms. Johnson is an attorney, certified public accountant and a certified managerial accountant. | | Asset Allocation Trust |
Leroy Keith, Jr.
(Born 1939) | | Trustee, since 2010 | | Chairman, Bloc Global Services (development and construction). Trustee of the Evergreen Funds from 1983 to 2010. Former Managing Director, Almanac Capital Management (commodities firm), former Partner, Stonington Partners, Inc. (private equity fund), former Director, Obagi Medical Products Co. and former Director, Lincoln Educational Services. | | Trustee, Virtus Fund Complex (consisting of 50 portfolios as of 12/16/2013); Asset Allocation Trust |
David F. Larcker
(Born 1950) | | Trustee, since 2009 | | James Irvin Miller Professor of Accounting at the Graduate School of Business, Stanford University, Morgan Stanley Director of the Center for Leadership Development and Research and Senior Faculty of The Rock Center for Corporate Governance since 2006. From 2005 to 2008, Professor of Accounting at the Graduate School of Business, Stanford University. Prior thereto, Ernst & Young Professor of Accounting at The Wharton School, University of Pennsylvania from 1985 to 2005. | | Asset Allocation Trust |
Olivia S. Mitchell
(Born 1953) | | Trustee, since 2006 | | International Foundation of Employee Benefit Plans Professor, Wharton School of the University of Pennsylvania since 1993. Director of Wharton’s Pension Research Council and Boettner Center on Pensions & Retirement Research, and Research Associate at the National Bureau of Economic Research. Previously, Cornell University Professor from 1978 to 1993. | | Asset Allocation Trust |
Timothy J. Penny
(Born 1951) | | Trustee, since 1996 | | President and CEO of Southern Minnesota Initiative Foundation, a non-profit organization, since 2007 and Senior Fellow at the Humphrey Institute Policy Forum at the University of Minnesota since 1995. Member of the Board of Trustees of NorthStar Education Finance, Inc., a non-profit organization, since 2007. | | Asset Allocation Trust |
| | | | | | |
| Other information (unaudited) | | Wells Fargo Advantage Strategic Income Fund | | | 35 | |
| | | | | | |
Name and
year of birth | | Position held and
length of service* | | Principal occupations during past five years | | Other
directorships during
past five years |
Michael S. Scofield
(Born 1943) | | Trustee, since 2010 | | Served on the Investment Company Institute’s Board of Governors and Executive Committee from 2008-2011 as well the Governing Council of the Independent Directors Council from 2006-2011 and the Independent Directors Council Executive Committee from 2008-2011. Chairman of the IDC from 2008-2010. Institutional Investor (Fund Directions) Trustee of Year in 2007. Trustee of the Evergreen Funds (and its predecessors) from 1984 to 2010. Chairman of the Evergreen Funds from 2000-2010. Former Trustee of the Mentor Funds. Retired Attorney, Law Offices of Michael S. Scofield. | | Asset Allocation Trust |
Donald C. Willeke
(Born 1940) | | Trustee, since 1996 | | Principal of the law firm of Willeke & Daniels. General Counsel of the Minneapolis Employees Retirement Fund from 1984 until its consolidation into the Minnesota Public Employees Retirement Association on June 30, 2010. Director and Vice Chair of The Tree Trust (non-profit corporation). Director of the American Chestnut Foundation (non-profit corporation). | | Asset Allocation Trust |
| * | Length of service dates reflect the Trustee’s commencement of service with the Trust’s predecessor entities, where applicable. |
Officers
| | | | | | |
Name and
year of birth | | Position held and
length of service | | Principal occupations during past five years | | |
Karla M. Rabusch
(Born 1959) | | President, since 2003 | | Executive Vice President of Wells Fargo Bank, N.A. and President of Wells Fargo Funds Management, LLC since 2003. | | |
Nancy Wiser1
(Born 1967) | | Treasurer, since 2012 | | Executive Vice President of Wells Fargo Funds Management, LLC since 2011. Chief Operating Officer and Chief Compliance Officer at LightBox Capital Management LLC, from 2008 to 2011. Owned and operated a consulting business providing services to various hedge funds including acting as Chief Operating Officer and Chief Compliance Officer for a hedge fund from 2007 to 2008. Chief Operating Officer and Chief Compliance Officer of GMN Capital LLC from 2006 to 2007. | | |
C. David Messman
(Born 1960) | | Secretary, since 2000; Chief Legal Officer, since 2003 | | Senior Vice President and Secretary of Wells Fargo Funds Management, LLC since 2001. Vice President and Managing Counsel of Wells Fargo Bank, N.A. since 1996. | | |
Debra Ann Early
(Born 1964) | | Chief Compliance Officer, since 2007 | | Chief Compliance Officer of Wells Fargo Funds Management, LLC since 2007. Chief Compliance Officer of Parnassus Investments from 2005 to 2007. Chief Financial Officer of Parnassus Investments from 2004 to 2007. | | |
David Berardi
(Born 1975) | | Assistant Treasurer, since 2009 | | Vice President of Wells Fargo Funds Management, LLC since 2009. Vice President of Evergreen Investment Management Company, LLC from 2008 to 2010. Assistant Vice President of Evergreen Investment Services, Inc. from 2004 to 2008. Manager of Fund Reporting and Control for Evergreen Investment Management Company, LLC from 2004 to 2010. | | |
Jeremy DePalma1
(Born 1974) | | Assistant Treasurer, since 2009 | | Senior Vice President of Wells Fargo Funds Management, LLC since 2009. Senior Vice President of Evergreen Investment Management Company, LLC from 2008 to 2010. Vice President, Evergreen Investment Services, Inc. from 2004 to 2007. Head of the Fund Reporting and Control Team within Fund Administration from 2005 to 2010. | | |
| 1. | Nancy Wiser acts as Treasurer of 73 funds in the Fund Complex. Jeremy DePalma acts as Treasurer of 59 funds and Assistant Treasurer of 73 funds in the Fund Complex. |
| 2. | The Statement of Additional Information includes additional information about the Trustees and is available, without charge, upon request, by calling 1-800-222-8222 or by visiting the website at wellsfargoadvantagefunds.com. |
| | | | |
| 36 | | Wells Fargo Advantage Strategic Income Fund | | Other information (unaudited) |
BOARD CONSIDERATION OF INVESTMENT ADVISORY AND SUB-ADVISORY AGREEMENTS:
Under Section 15 of the Investment Company Act of 1940 (the “1940 Act”), the Board of Trustees (the “Board”) of Wells Fargo Funds Trust (the “Trust”), all the members of which have no direct or indirect interest in the investment advisory and sub-advisory agreements and are not “interested persons” of the Trust, as defined in the 1940 Act (the “Independent Trustees”), must determine whether to approve the continuation of the Trust’s investment advisory and sub-advisory agreements. In this regard, at an in-person meeting held on March 27-28, 2014 (the “Meeting”), the Board reviewed: (i) an investment advisory agreement with Wells Fargo Funds Management, LLC (“Funds Management”) for Wells Fargo Advantage Strategic Income Fund (the “Fund”), (ii) an investment sub-advisory agreement with Wells Capital Management Incorporated (“WellsCap”), an affiliate of Funds Management, for the Fund, and (iii) an investment sub-advisory agreement with First International Advisors, LLC (“First International”), an affiliate of Funds Management, for the Fund. The investment advisory agreement with Funds Management and the investment sub-advisory agreements with WellsCap and First International (the “Sub-Advisers”) are collectively referred to as the “Advisory Agreements.”
At the Meeting, the Board considered the factors and reached the conclusions described below relating to the selection of Funds Management and the Sub-Advisers and the continuation of the Advisory Agreements. Prior to the Meeting, the Trustees conferred extensively among themselves and with representatives of Funds Management about these matters. Also, the Board has adopted a team-based approach, with each team consisting of a sub-set of Trustees, to assist the full Board in the discharge of its duties in reviewing performance and other matters throughout the year. The Independent Trustees were assisted in their evaluation of the Advisory Agreements by independent legal counsel, from whom they received separate legal advice and with whom they met separately.
In providing information to the Board, Funds Management and the Sub-Advisers were guided by a detailed set of requests for information submitted to them by independent legal counsel on behalf of the Independent Trustees at the start of the Board’s annual contract renewal process earlier in 2014. In considering and approving the Advisory Agreements, the Trustees considered the information they believed relevant, including but not limited to the information discussed below. The Board considered not only the specific information presented in connection with the Meeting, but also the knowledge gained over time through interaction with Funds Management and the Sub-Advisers about various topics. In this regard, the Board reviewed reports of Funds Management at each of its quarterly meetings, which included, among other things, portfolio reviews and performance reports. In addition, the Board and the teams mentioned above confer with portfolio managers at various times throughout the year. The Board did not identify any particular information or consideration that was all-important or controlling, and each individual Trustee may have attributed different weights to various factors.
After its deliberations, the Board unanimously approved the continuation of the Advisory Agreements and determined that the compensation payable to Funds Management and the Sub-Advisers is reasonable. The Board considered the continuation of the Advisory Agreements for the Fund as part of its consideration of the continuation of advisory agreements for funds across the complex, but its approvals were made on a fund-by-fund basis. The following summarizes a number of important, but not necessarily all, factors considered by the Board in support of its approvals.
Nature, extent and quality of services
The Board received and considered various information regarding the nature, extent and quality of services provided to the Fund by Funds Management and the Sub-Advisers under the Advisory Agreements. This information included, among other things, a summary of the background and experience of senior management of Funds Management, and the qualifications, background, tenure and responsibilities of each of the portfolio managers primarily responsible for the day-to-day portfolio management of the Fund.
The Board evaluated the ability of Funds Management and the Sub-Advisers to attract and retain qualified investment professionals, including research, advisory and supervisory personnel. The Board further considered the compliance programs and compliance records of Funds Management and the Sub-Advisers. In addition, the Board took into account the full range of services provided to the Fund by Funds Management and its affiliates.
Fund performance and expenses
The Board acknowledged that the Fund is newly formed and has no performance record. The Board noted that it considered the performance of other accounts managed by the Sub-Advisers utilizing an investment style and strategy similar to that of the Fund when the Board initially approved the Advisory Agreements for the Fund at an in-person meeting of the Board held on November 6-7, 2012, including how such accounts performed in relation to the Fund’s benchmark index. The Board noted that it would have the opportunity to review performance information relating to the Fund on an on-going basis and in connection with future annual reviews of advisory agreements.
| | | | | | |
| Other information (unaudited) | | Wells Fargo Advantage Strategic Income Fund | | | 37 | |
The Board also received and considered information regarding the Fund’s net operating expense ratios and their various components, including actual management fees (which reflect fee waivers, if any, and include advisory, administration and transfer agent fees), custodian and other non-management fees, Rule 12b-1 and non-Rule 12b-1 service fees and fee waiver and expense reimbursement arrangements. The Board considered these ratios in comparison to the median ratios of funds in class-specific expense groups that were determined by Lipper to be similar to the Fund (the “Groups”). The Board received a description of the methodology used by Lipper to select the mutual funds in the expense Groups and an explanation of year-to-year variations in the funds comprising such expense Groups and their expense ratios. Based on the Lipper reports, the Board noted that the net operating expense ratios of the Fund were lower than or in range of the median net operating expense ratios of the expense Groups.
Based on its consideration of the factors and information it deemed relevant, including those described here, the Board concluded that the overall performance and expense structure of the Fund supported the re-approval of the Advisory Agreements.
Investment advisory and sub-advisory fee rates
The Board reviewed and considered the contractual investment advisory fee rates that are payable by the Fund to Funds Management for investment advisory services (the “Advisory Agreement Rates”), both on a stand-alone basis and on a combined basis with the Fund’s fund-level and class-level contractual administration fee rates (the “Management Rates”). The Board noted that the administration fees payable to Funds Management include transfer agency and sub-transfer agency costs. The Board also reviewed and considered the contractual investment sub-advisory fee rates that are payable by Funds Management to each of the Sub-Advisers for investment sub-advisory services (the “Sub-Advisory Agreement Rates”).
Among other information reviewed by the Board was a comparison of the Management Rates of the Fund with those of other funds in the expense Groups at a common asset level. The Board noted that the Management Rates of the Fund were lower than the average rates for the Fund’s expense Groups for all share classes.
The Board also received and considered information about the portion of the total advisory fee that was retained by Funds Management after payment of the fee to the Sub-Advisers for sub-advisory services. In assessing the reasonableness of this amount, the Board received and evaluated information about the nature and extent of responsibilities retained and risks assumed by Funds Management and not delegated to or assumed by the Sub-Advisers, and about Funds Management’s on-going oversight services. However, given the affiliation between Funds Management and the Sub-Advisers, the Board ascribed limited relevance to the allocation of the advisory fee between them.
The Board also received and considered information about the nature and extent of services offered and fee rates charged by Funds Management and the Sub-Advisers to other types of clients with investment strategies similar to those of the Fund. In this regard, the Board received information about the significantly greater scope of services, and compliance, reporting and other legal burdens and risks of managing mutual funds compared with those associated with managing assets of non-mutual fund clients such as collective funds or institutional separate accounts.
Based on its consideration of the factors and information it deemed relevant, including those described here, the Board determined that the Advisory Agreement Rates and the Sub-Advisory Agreement Rates were reasonable in light of the services covered by the Advisory Agreements.
Profitability
The Board received and considered information concerning the profitability of Funds Management, as well as the profitability of Wells Fargo as a whole, from providing services to the Fund and the fund family as a whole. The Board did not receive or consider to be necessary separate profitability information with respect to the Sub-Advisers, because their profitability information was subsumed in the collective Wells Fargo profitability analysis.
Funds Management explained the methodologies and estimates that it used in calculating profitability. Among other things, the Board noted that the levels of profitability reported on a fund-by-fund basis varied widely, depending on factors such as the size and type of fund. Based on its review, the Board did not deem the profits reported by Funds Management to be at a level that would prevent it from approving the continuation of the Advisory Agreements.
Economies of scale
With respect to possible economies of scale, the Board noted the existence of breakpoints in the Fund’s advisory fee and administration fee structure, which operate generally to reduce the Fund’s expense ratios as the Fund grows in size. It considered that, for a small fund or a fund that shrinks in size, breakpoints conversely can result in higher fee levels. The Board also considered that fee waiver and expense reimbursement arrangements and competitive fee rates at the outset are means of sharing potential economies of scale with shareholders of the Fund and the fund family as a whole. The
| | | | |
| 38 | | Wells Fargo Advantage Strategic Income Fund | | Other information (unaudited) |
Board considered Funds Management’s view that any analyses of potential economies of scale in managing a particular fund are inherently limited in light of the joint and common costs and investments that Funds Management incurs across the fund family as a whole.
The Board concluded that the Fund’s fee and expense arrangements, including contractual breakpoints, constituted a reasonable approach to sharing potential economies of scale with the Fund and its shareholders.
Other benefits to Funds Management and the Sub-Advisers
The Board received and considered information regarding potential “fall-out” or ancillary benefits received by Funds Management and its affiliates, including the Sub-Advisers, as a result of their relationships with the Fund. Ancillary benefits could include, among others, benefits directly attributable to other relationships with the Fund and benefits potentially derived from an increase in Funds Management’s and the Sub-Advisers’ business as a result of their relationships with the Fund. The Board noted that various affiliates of Funds Management may receive distribution-related fees, shareholder servicing payments and sub-transfer agency fees in respect of shares sold or held through them and services provided.
The Board also reviewed information about soft dollar credits earned and utilized by the Sub-Advisers, fees earned by Funds Management and the Sub-Advisers from managing a private investment vehicle for the fund family’s securities lending collateral and commissions earned by an affiliated broker from portfolio transactions.
Based on its consideration of the factors and information it deemed relevant, including those described here, the Board did not find that any ancillary benefits received by Funds Management and its affiliates, including the Sub-Advisers, were unreasonable.
Conclusion
After considering the above-described factors and based on its deliberations and its evaluation of the information described above, the Board unanimously approved the continuation of the Advisory Agreements for an additional one-year period and determined that the compensation payable to Funds Management and the Sub-Advisers is reasonable.
| | | | | | |
| List of abbreviations | | Wells Fargo Advantage Strategic Income Fund | | | 39 | |
The following is a list of common abbreviations for terms and entities that may have appeared in this report.
| ACA | — ACA Financial Guaranty Corporation |
| ADR | — American depositary receipt |
| ADS | — American depositary shares |
| AGC | — Assured Guaranty Corporation |
| AGM | — Assured Guaranty Municipal |
| Ambac | — Ambac Financial Group Incorporated |
| AMT | — Alternative minimum tax |
| BAN | — Bond anticipation notes |
| BHAC | — Berkshire Hathaway Assurance Corporation |
| CAB | — Capital appreciation bond |
| CCAB | — Convertible capital appreciation bond |
| CDA | — Community Development Authority |
| CDO | — Collateralized debt obligation |
| DRIVER | — Derivative inverse tax-exempt receipts |
| DW&P | — Department of Water & Power |
| DWR | — Department of Water Resources |
| ECFA | — Educational & Cultural Facilities Authority |
| EDA | — Economic Development Authority |
| EDFA | — Economic Development Finance Authority |
| ETF | — Exchange-traded fund |
| FDIC | — Federal Deposit Insurance Corporation |
| FFCB | — Federal Farm Credit Banks |
| FGIC | — Financial Guaranty Insurance Corporation |
| FHA | — Federal Housing Administration |
| FHLB | — Federal Home Loan Bank |
| FHLMC | — Federal Home Loan Mortgage Corporation |
| FICO | — The Financing Corporation |
| FNMA | — Federal National Mortgage Association |
| GDR | — Global depositary receipt |
| GNMA | — Government National Mortgage Association |
| HCFR | — Healthcare facilities revenue |
| HEFA | — Health & Educational Facilities Authority |
| HEFAR | — Higher education facilities authority revenue |
| HFA | — Housing Finance Authority |
| HFFA | — Health Facilities Financing Authority |
| HUD | — Department of Housing and Urban Development |
| IDA | — Industrial Development Authority |
| IDAG | — Industrial Development Agency |
| KRW | — Republic of Korea won |
| LIBOR | — London Interbank Offered Rate |
| LLC | — Limited liability company |
| LLLP | — Limited liability limited partnership |
| LLP | — Limited liability partnership |
| MBIA | — Municipal Bond Insurance Association |
| MFHR | — Multifamily housing revenue |
| MSTR | — Municipal securities trust receipts |
| MUD | — Municipal Utility District |
| National | — National Public Finance Guarantee Corporation |
| PCFA | — Pollution Control Financing Authority |
| PCL | — Public Company Limited |
| PCR | — Pollution control revenue |
| PFA | — Public Finance Authority |
| PFFA | — Public Facilities Financing Authority |
| PFOTER | — Puttable floating option tax-exempt receipts |
| plc | — Public limited company |
| PUTTER | — Puttable tax-exempt receipts |
| R&D | — Research & development |
| Radian | — Radian Asset Assurance |
| RAN | — Revenue anticipation notes |
| RDA | — Redevelopment Authority |
| RDFA | — Redevelopment Finance Authority |
| REIT | — Real estate investment trust |
| ROC | — Reset option certificates |
| SAVRS | — Select auction variable rate securities |
| SBA | — Small Business Authority |
| SFHR | — Single-family housing revenue |
| SFMR | — Single-family mortgage revenue |
| SPA | — Standby purchase agreement |
| SPDR | — Standard & Poor’s Depositary Receipts |
| STRIPS | — Separate trading of registered interest and principal securities |
| TAN | — Tax anticipation notes |
| TIPS | — Treasury inflation-protected securities |
| TRAN | — Tax revenue anticipation notes |
| TTFA | — Transportation Trust Fund Authority |
| TVA | — Tennessee Valley Authority |
This page is intentionally left blank.


For more information
More information about Wells Fargo Advantage Funds is available free upon request. To obtain literature, please write, email, visit the Fund’s website, or call:
Wells Fargo Advantage Funds
P.O. Box 8266
Boston, MA 02266-8266
Email: wfaf@wellsfargo.com
Website: wellsfargoadvantagefunds.com
Individual investors: 1-800-222-8222
Retail investment professionals: 1-888-877-9275
Institutional investment professionals: 1-866-765-0778
This report and the financial statements contained herein are submitted for the general information of the shareholders of Wells Fargo Advantage Funds. If this report is used for promotional purposes, distribution of the report must be accompanied or preceded by a current prospectus. Before investing, please consider the investment objectives, risks, charges, and expenses of the investment. For a current prospectus and, if available, a summary prospectus, containing this information, call 1-800-222-8222 or visit the Fund’s website at wellsfargoadvantagefunds.com. Read the prospectus carefully before you invest or send money.
Wells Fargo Funds Management, LLC, a wholly owned subsidiary of Wells Fargo & Company, provides investment advisory and administrative services for Wells Fargo Advantage Funds. Other affiliates of Wells Fargo & Company provide subadvisory and other services for the Funds. The Funds are distributed by Wells Fargo Funds Distributor, LLC, Member FINRA/SIPC, an affiliate of Wells Fargo & Company.
NOT FDIC INSURED ¡ NO BANK GUARANTEE ¡ MAY LOSE VALUE
© 2014 Wells Fargo Funds Management, LLC. All rights reserved.
| | |
 | | 225164 06-14 SA263/SAR263 04-14 |

Wells Fargo Advantage Asia Pacific Fund

Semi-Annual Report
April 30, 2014

Reduce clutter. Save trees.
Sign up for electronic delivery of prospectuses and shareholder reports at wellsfargo.com/advantagedelivery
Contents
The views expressed and any forward-looking statements are as of April 30, 2014, unless otherwise noted, and are those of the Fund managers and/or Wells Fargo Funds Management, LLC. Discussions of individual securities, or the markets generally, or any Wells Fargo Advantage Fund are not intended as individual recommendations. Future events or results may vary significantly from those expressed in any forward-looking statements; the views expressed are subject to change at any time in response to changing circumstances in the market. Wells Fargo Funds Management, LLC and the Fund disclaim any obligation to publicly update or revise any views expressed or forward-looking statements.
NOT FDIC INSURED ¡ NO BANK GUARANTEE ¡ MAY LOSE VALUE
| | | | |
| 2 | | Wells Fargo Advantage Asia Pacific Fund | | Letter to shareholders (unaudited) |

Karla M. Rabusch
President
Wells Fargo Advantage Funds
The Bank of Japan (BoJ) continued the aggressive monetary easing program that it began in early 2013 as part of Prime Minister Shinzo Abe’s plan to help revitalize Japan’s economy by ending its longtime deflation.
Dear Valued Shareholder:
We are pleased to offer you this semi-annual report for the Wells Fargo Advantage Asia Pacific Fund for the six-month period that ended April 30, 2014. The period was marked by growing concern about an economic slowdown in China and heightened geopolitical uncertainty as the U.S. and Europe confronted Russia over Ukraine. The environment created a headwind for many Asian markets, both developed and emerging.
Major central banks continued to provide stimulus.
Major central banks continued to inject liquidity into global banks and markets through various quantitative easing policies. The U.S. Federal Reserve (Fed) remained a major source of liquidity for market participants around the world. Throughout the reporting period, the Federal Open Market Committee (FOMC)—the Fed’s monetary policymaking body—kept its key interest rate near zero in order to support the economy and the financial system. At the beginning of the reporting period, the FOMC was still making open-ended purchases of $40 billion per month in mortgage-backed securities to support the housing market and purchasing $45 billion per month in long-term U.S. Treasuries. However, in mid-December 2013, the FOMC announced that it would reduce (or taper) its bond-buying program by $10 billion per month beginning in January 2014. The removal of liquidity sparked a sell-off in emerging markets stocks and currencies as investors sold higher-risk assets.
The Bank of Japan (BoJ) continued the aggressive monetary easing program that it began in early 2013 as part of Prime Minister Shinzo Abe’s plan to help revitalize Japan’s economy by ending its longtime deflation. The BoJ aims to achieve a 2% annual inflation rate by injecting the equivalent of $583 billion to $680 billion per year into the Japanese economy, primarily through the purchase of long-term Japanese government bonds.
Stock market performance was mixed amid upcoming elections and signs of slowing growth in China.
The MSCI All Country Asia Pacific Index (Net)1 returned -2.55% for the six-month period, with Asian markets posting mixed results. Among the markets with the best performance, one common driver was the prospect of an election that might produce favorable results for investors. In Indonesia, the popular governor of Jakarta is a leading candidate for the presidency. Investors are hoping that if he wins the July election he will push through economic reforms. A similar dynamic was at play in India, in which investors were heartened by polls showing a lead for a business-friendly opposition party in the April to May election for a new government.
By contrast, in Japan, the honeymoon for Prime Minister Shinzo Abe appeared to be ending, with investors worrying that his reforms were not taking effect as quickly as originally hoped. The deceleration of Japan’s growth in gross domestic product (GDP) in 2013—falling from 1.3% GDP growth in the first quarter to 0.1% GDP growth in the fourth—only fed investor fears. (The GDP growth number for the first quarter of 2014 was released after the reporting period ended.) Investors were especially concerned about an April 2014 increase in Japan’s consumption tax to 8% from 5% because the tax increase had the potential to further dampen economic growth.
| 1. | The Morgan Stanley Capital International (MSCI) All Country Asia Pacific Index is a total return, market-capitalization-weighted index that measures the performance of stock markets in the following 15 Pacific-region countries: Australia, China, Hong Kong, India, Indonesia, Japan, Korea, Malaysia, New Zealand, Pakistan, Philippines, Singapore, Sri Lanka, Taiwan, and Thailand. You cannot invest directly in an index. Source: MSCI. MSCI makes no express or implied warranties or representations and shall have no liability whatsoever with respect to any MSCI data contained herein. The MSCI data may not be further redistributed or used as a basis for other indexes or any securities or financial products. This report is not approved, reviewed, or produced by MSCI. |
| | | | | | |
| Letter to shareholders (unaudited) | | Wells Fargo Advantage Asia Pacific Fund | | | 3 | |
Perhaps the most significant story of the period was the continued evidence of an economic slowdown in China. Many of the economic numbers out of China—such as national production, retail sales, fixed investment, and manufacturing activity—came in below analyst expectations, causing investor concern. In addition, China’s government has allowed a growing number of defaults in the country’s financial system as part of a long-term plan to rein in credit growth. Such defaults have the potential to freeze the credit system—as happened in Western economies during the 2007–2008 financial crisis—further putting investors on edge.
Don’t let short-term uncertainty derail long-term investment goals.
Periods of uncertainty can present challenges, but experience has taught us that maintaining long-term investment goals can be an effective way to plan for the future. To help you create a sound strategy based on your personal goals and risk tolerance, Wells Fargo Advantage Funds offers more than 100 mutual funds spanning a wide range of asset classes and investment styles. Although diversification cannot guarantee an investment profit or prevent losses, we believe it can be an effective way to manage investment risk and potentially smooth out overall portfolio performance. We encourage investors to know their investments and to understand that appropriate levels of risk-taking may unlock opportunities.
Thank you for choosing to invest with Wells Fargo Advantage Funds. We appreciate your confidence in us and remain committed to helping you meet your financial needs. For current information about your fund investments, contact your investment professional, visit our website at wellsfargoadvantagefunds.com, or call us directly at 1-800-222-8222. We are available 24 hours a day, 7 days a week.
Sincerely,

Karla M. Rabusch
President
Wells Fargo Advantage Funds
Many of the economic numbers out of China—such as for national production, retail sales, fixed investment, and manufacturing activity—came in below analyst expectations, causing investor concern.
Notice to shareholders
The Fund and Wells Fargo Funds Management, LLC (“Funds Management”) have received an exemptive order from the SEC that permits Funds Management, subject to the approval of the Board of Trustees of the Fund, to select or replace certain subadvisers to manage all or a portion of the Fund’s assets and enter into, amend or terminate a sub-advisory agreement with certain subadvisers without obtaining shareholder approval (“Multi-manager Structure”). The Multi-manager Structure applies to subadvisers that are not affiliated with Funds Management or the Fund, except to the extent that affiliation arises solely because such subadvisers provide sub-advisory services to the Fund (“Non-affiliated Subadvisers”), as well as subadvisers that are indirect or direct wholly-owned subsidiaries of Funds Management or of another company that, indirectly or directly, wholly owns Funds Management (“Wholly-owned Subadvisers”).
Pursuant to the SEC order, Funds Management, with the approval of the Board of Trustees, has the discretion to terminate any subadvisers and allocate and reallocate the Fund’s assets among any other Non-affiliated Subadvisers or Wholly-owned Subadvisers. Funds Management, subject to oversight and supervision by the Board of Trustees, has responsibility to continue to oversee any subadvisers to the Fund and to recommend, for approval by the Board of Trustees, the hiring, termination and replacement of subadvisers for the Fund. In the event that a new subadviser is hired pursuant to the Multi-manager Structure, the Fund is required to provide notice to shareholders within 90 days.
Please contact your investment professional or call us directly at 1-800-222-8222 if you have any questions on this Notice to Shareholders.
| | | | |
| 4 | | Wells Fargo Advantage Asia Pacific Fund | | Performance highlights (unaudited) |
Investment objective
The Fund seeks long-term capital appreciation.
Adviser
Wells Fargo Funds Management, LLC
Subadvisers
Wells Capital Management Incorporated
Wells Capital Management Singapore
Portfolio managers
Alison Shimada
Anthony L.T. Cragg
Average annual total returns1 (%) as of April 30, 2014
| | | | | | | | | | | | | | | | | | | | | | | | | | | | | | | | | | |
| | | | | Including sales charge | | | Excluding sales charge | | | Expense ratios2 (%) | |
| | | Inception date | | 1 year | | | 5 year | | | 10 year | | | 1 year | | | 5 year | | | 10 year | | | Gross | | | Net3 | |
| Class A (WFAAX) | | 7-31-2007 | | | (6.91 | ) | | | 11.56 | | | | 7.04 | | | | (1.27 | ) | | | 12.90 | | | | 7.68 | | | | 1.76 | | | | 1.62 | |
| Class C (WFCAX) | | 7-31-2007 | | | (3.09 | ) | | | 12.04 | | | | 6.88 | | | | (2.09 | ) | | | 12.04 | | | | 6.88 | | | | 2.51 | | | | 2.37 | |
| Administrator Class (WFADX) | | 7-30-2010 | | | – | | | | – | | | | – | | | | (1.17 | ) | | | 13.06 | | | | 7.75 | | | | 1.60 | | | | 1.42 | |
| Institutional Class (WFPIX) | | 7-30-2010 | | | – | | | | – | | | | – | | | | (0.96 | ) | | | 13.19 | | | | 7.82 | | | | 1.33 | | | | 1.27 | |
| Investor Class (SASPX) | | 12-31-1993 | | | – | | | | – | | | | – | | | | (1.33 | ) | | | 12.80 | | | | 7.62 | | | | 1.82 | | | | 1.67 | |
MSCI All Country Asia Pacific
Index (Net)4 | | – | | | – | | | | – | | | | – | | | | (0.95 | ) | | | 11.30 | | | | 6.44 | | | | – | | | | – | |
Figures quoted represent past performance, which is no guarantee of future results, and do not reflect taxes that a shareholder may pay on fund distributions or the redemption of fund shares. Investment return and principal value of an investment will fluctuate so that an investor’s shares, when redeemed, may be worth more or less than their original cost. Performance shown without sales charges would be lower if sales charges were reflected. Current performance may be lower or higher than the performance data quoted, which assumes the reinvestment of dividends and capital gains. Current month-end performance is available on the Fund’s website, wellsfargoadvantagefunds.com.
Index returns do not include transaction costs associated with buying and selling securities, any mutual fund fees or expenses, or any taxes. It is not possible to invest directly in an index.
For Class A shares, the maximum front-end sales charge is 5.75%. For Class C shares, the maximum contingent deferred sales charge is 1.00%. Performance including sales charge assumes the sales charge for the corresponding time period. Administrator Class, Institutional Class, and Investor Class shares are sold without a front-end sales charge or contingent deferred sales charge.
Stock values fluctuate in response to the activities of individual companies and general market and economic conditions. Foreign investments are especially volatile and can rise or fall dramatically due to differences in the political and economic conditions of the host country. These risks are generally intensified in emerging markets. The use of derivatives may reduce returns and/or increase volatility. Certain investment strategies tend to increase the total risk of an investment (relative to the broader market). The Fund is exposed to regional risk, and smaller-company securities risk. Consult the Fund’s prospectus for additional information on these and other risks.
Please see footnotes on page 5.
| | | | | | |
| Performance highlights (unaudited) | | Wells Fargo Advantage Asia Pacific Fund | | | 5 | |
| | | | |
| Ten largest equity holdings5 (%) as of April 30, 2014 | |
Samsung Electronics Company Limited | | | 2.13 | |
Matsushita Electric Industrial Company Limited | | | 1.87 | |
Sumitomo Mitsui Trust Holdings Incorporated | | | 1.84 | |
Taiwan Semiconductor Manufacturing
Company Limited | | | 1.81 | |
GLP J-REIT | | | 1.78 | |
Mitsui Fudosan Company Limited | | | 1.76 | |
Japan Airlines Company Limited | | | 1.75 | |
Mitsubishi Electric Corporation | | | 1.57 | |
Hitachi Limited | | | 1.53 | |
SoftBank Corporation | | | 1.51 | |
|
| Sector distribution6 as of April 30, 2014 |
|
 |
| 1. | Historical performance shown for Class A shares prior to their inception reflects the performance of Investor Class shares, and includes the higher expenses applicable to Investor Class shares. If these expenses had not been included, returns would be higher. Historical performance shown for Class C shares prior to their inception reflects the performance of Investor Class shares, and has been adjusted to reflect the higher expenses applicable to Class C shares. Historical performance shown for Administrator and Institutional Class shares prior to their inception reflects the performance of Class A shares, and includes the higher expenses applicable to Class A shares. If these expenses had not been included, returns would be higher. |
| 2. | Reflects the expense ratios as stated in the most recent prospectuses, which include the impact of 0.02% in acquired fund fees and expenses. The expense ratios shown are subject to change and may differ from the annualized expense ratios shown in the financial highlights of this report, which do not include acquired fund fees and expenses. |
| 3. | The Adviser has committed through February 28, 2015, to waive fees and/or reimburse expenses to the extent necessary to cap the Fund’s Total Annual Fund Operating Expenses After Fee Waiver, excluding certain expenses, at 1.60% for Class A, 2.35% for Class C, 1.40% for Administrator Class, 1.25% for Institutional Class, and 1.65% for Investor Class. Brokerage commissions, stamp duty fees, interest, taxes, acquired fund fees and expenses, and extraordinary expenses are excluded from the cap. Without this cap, the Fund’s returns would have been lower. |
| 4. | The Morgan Stanley Capital International (MSCI) All Country Asia Pacific Index (Net) is a total return, capitalization-weighted index that measures the performance of stock markets in 15 pacific region countries, including Australia, China, Hong Kong, India, Indonesia, Japan, Korea, Malaysia, New Zealand, Pakistan, Philippines, Singapore, Sri Lanka, Taiwan, and Thailand. You cannot invest directly in an index. Source: MSCI. MSCI makes no express or implied warranties or representations and shall have no liability whatsoever with respect to any MSCI data contained herein. The MSCI data may not be further redistributed or used as a basis for other indexes or any securities or financial products. This report is not approved, reviewed, or produced by MSCI. |
| 5. | The ten largest equity holdings are calculated based on the value of the securities divided by total net assets of the Fund. Holdings are subject to change and may have changed since the date specified. Top holdings typically include the underlying ordinary shares combined with any depositary receipts. |
| 6. | Sector distribution is subject to change and is calculated based on the total long-term investments of the Fund. |
| | | | |
| 6 | | Wells Fargo Advantage Asia Pacific Fund | | Fund expenses (unaudited) |
As a shareholder of the Fund, you incur two types of costs: (1) transaction costs, including sales charges (loads) on purchase payments and contingent deferred sales charges (if any) on redemptions and (2) ongoing costs, including management fees, distribution (12b-1) and/or shareholder service fees, and other Fund expenses. This example is intended to help you understand your ongoing costs (in dollars) of investing in the Fund and to compare these costs with the ongoing costs of investing in other mutual funds.
The example is based on an investment of $1,000 invested at the beginning of the six-month period and held for the entire period from November 1, 2013 to April 30, 2014.
Actual expenses
The “Actual” line of the table below provides information about actual account values and actual expenses. You may use the information in this line, together with the amount you invested, to estimate the expenses that you paid over the period. Simply divide your account value by $1,000 (for example, an $8,600 account value divided by $1,000 = 8.6), then multiply the result by the number in the “Actual” line under the heading entitled “Expenses paid during period” for your applicable class of shares to estimate the expenses you paid on your account during this period.
Hypothetical example for comparison purposes
The “Hypothetical” line of the table below provides information about hypothetical account values and hypothetical expenses based on the Fund’s actual expense ratio and an assumed rate of return of 5% per year before expenses, which is not the Fund’s actual return. The hypothetical account values and expenses may not be used to estimate the actual ending account balance or expenses you paid for the period. You may use this information to compare the ongoing costs of investing in the Fund and other funds. To do so, compare this 5% hypothetical example with the 5% hypothetical examples that appear in the shareholder reports of the other funds.
Please note that the expenses shown in the table are meant to highlight your ongoing costs only and do not reflect any transactional costs, such as sales charges (loads) and contingent deferred sales charges. Therefore, the “Hypothetical” line of the table is useful in comparing ongoing costs only and will not help you determine the relative total costs of owning different funds. In addition, if these transactional costs were included, your costs would have been higher.
| | | | | | | | | | | | | | | | |
| | | Beginning
account value
11-1-2013 | | | Ending
account value
4-30-2014 | | | Expenses
paid during
the period1 | | | Net annualized
expense ratio | |
Class A | | | | | | | | | | | | | | | | |
Actual | | $ | 1,000.00 | | | $ | 986.45 | | | $ | 7.88 | | | | 1.60 | % |
Hypothetical (5% return before expenses) | | $ | 1,000.00 | | | $ | 1,016.86 | | | $ | 8.00 | | | | 1.60 | % |
Class C | | | | | | | | | | | | | | | | |
Actual | | $ | 1,000.00 | | | $ | 981.70 | | | $ | 11.55 | | | | 2.35 | % |
Hypothetical (5% return before expenses) | | $ | 1,000.00 | | | $ | 1,013.14 | | | $ | 11.73 | | | | 2.35 | % |
Administrator Class | | | | | | | | | | | | | | | | |
Actual | | $ | 1,000.00 | | | $ | 986.59 | | | $ | 6.90 | | | | 1.40 | % |
Hypothetical (5% return before expenses) | | $ | 1,000.00 | | | $ | 1,017.85 | | | $ | 7.00 | | | | 1.40 | % |
Institutional Class | | | | | | | | | | | | | | | | |
Actual | | $ | 1,000.00 | | | $ | 987.83 | | | $ | 6.16 | | | | 1.25 | % |
Hypothetical (5% return before expenses) | | $ | 1,000.00 | | | $ | 1,018.60 | | | $ | 6.26 | | | | 1.25 | % |
Investor Class | | | | | | | | | | | | | | | | |
Actual | | $ | 1,000.00 | | | $ | 985.82 | | | $ | 8.12 | | | | 1.65 | % |
Hypothetical (5% return before expenses) | | $ | 1,000.00 | | | $ | 1,016.61 | | | $ | 8.25 | | | | 1.65 | % |
| 1. | Expenses paid is equal to the annualized expense ratio of each class multiplied by the average account value over the period, multiplied by the number of days in the most recent fiscal half-year divided by the number of days in the fiscal year (to reflect the one-half-year period). |
| | | | | | |
| Portfolio of investments—April 30, 2014 (unaudited) | | Wells Fargo Advantage Asia Pacific Fund | | | 7 | |
| | | | | | | | | | | | |
| Security name | | | | | | Shares | | | Value | |
| | | |
Common Stocks: 88.21% | | | | | | | | | | |
| | | |
| Australia: 6.48% | | | | | | | | | | |
AMP Limited (Financials, Insurance) | | | | | | | 465,857 | | | $ | 2,185,545 | |
BHP Billiton Limited (Materials, Metals & Mining) | | | | | | | 63,100 | | | | 2,212,902 | |
Boral Limited (Materials, Construction Materials) | | | | | | | 217,900 | | | | 1,151,822 | |
Commonwealth Bank of Australia (Financials, Banks) | | | | | | | 12,700 | | | | 930,886 | |
Insurance Australia Group Limited (Financials, Insurance) | | | | | | | 162,900 | | | | 868,658 | |
Mirvac Group (Financials, REITs) | | | | | | | 1,162,590 | | | | 1,890,081 | |
Ozforex Group Limited (Financials, Diversified Financial Services) † | | | | | | | 445,000 | | | | 1,260,886 | |
Treasury Wine Estates Limited (Consumer Staples, Beverages) | | | | | | | 138,300 | | | | 489,512 | |
| | | | |
| | | | | | | | | | | 10,990,292 | |
| | | | | | | | | | | | |
| | | |
| China: 18.11% | | | | | | | | | | |
Agricultural Bank of China (Financials, Banks) | | | | | | | 5,967,000 | | | | 2,501,338 | |
AviChina Industry & Technology Company Limited (Industrials, Aerospace & Defense) | | | | | | | 3,780,000 | | | | 2,018,483 | |
Bank of China Limited (Financials, Banks) | | | | | | | 2,113,000 | | | | 929,366 | |
Beijing Enterprises Water Group Limited (Utilities, Water Utilities) | | | | | | | 1,806,000 | | | | 1,146,082 | |
China Cinda Asset Management Company Limited (Financials, Capital Markets) † | | | | | | | 1,658,000 | | | | 834,031 | |
China Mobile Limited (Telecommunication Services, Wireless Telecommunication Services) | | | | | | | 200,000 | | | | 1,901,212 | |
China Petroleum & Chemical Corporation (Energy, Oil, Gas & Consumable Fuels) | | | | | | | 2,092,000 | | | | 1,848,355 | |
China Shipping Container Lines Company Limited Class H (Industrials, Marine) † | | | | | | | 3,113,000 | | | | 742,820 | |
China Singyes Solar Technologies Holdings Limited (Industrials, Construction & Engineering) | | | | | | | 862,000 | | | | 1,260,821 | |
Fu Shou Yuan International Group (Consumer Discretionary, Diversified Consumer Services) † | | | | | | | 1,477,891 | | | | 810,148 | |
GCL-Poly Energy Holdings Limited (Information Technology, Semiconductors & Semiconductor Equipment) † | | | | | | | 8,063,000 | | | | 2,412,780 | |
Guodian Technology & Environment Group Corporation Limited (Industrials, Electrical Equipment) | | | | | | | 2,925,000 | | | | 728,142 | |
Huaneng Renewables Corporation Limited (Utilities, Independent Power & Renewable Electricity Producers) | | | | | | | 2,616,000 | | | | 809,808 | |
Industrial & Commercial Bank of China Limited Class H (Financials, Banks) | | | | | | | 4,079,000 | | | | 2,430,685 | |
MicroPort Scientific Corporation (Health Care, Health Care Equipment & Supplies) | | | | | | | 1,239,800 | | | | 839,545 | |
PetroChina Company Limited (Energy, Oil, Gas & Consumable Fuels) | | | | | | | 1,310,000 | | | | 1,517,332 | |
Ping An Insurance Group Company of China Limited (Financials, Insurance) | | | | | | | 216,700 | | | | 1,602,970 | |
Qinhuangdao Port Company Limited (Industrials, Transportation Infrastructure) † | | | | | | | 1,513,000 | | | | 815,733 | |
Shanghai Fosun Pharmaceutical Company Limited (Health Care, Pharmaceuticals) | | | | | | | 233,000 | | | | 787,391 | |
SINA Corporation (Information Technology, Internet Software & Services) † | | | | | | | 15,200 | | | | 726,560 | |
Tencent Holdings Limited (Information Technology, Internet Software & Services) | | | | | | | 12,900 | | | | 803,988 | |
Termbray Petro-King Oilfield Services Limited (Energy, Energy Equipment & Services) †« | | | | | | | 2,630,000 | | | | 851,457 | |
Wasion Group Holdings Limited (Information Technology, Electronic Equipment, Instruments & Components) | | | | | | | 2,232,000 | | | | 1,597,792 | |
Zhaojin Mining Industry Company Limited (Materials, Metals & Mining) | | | | | | | 1,324,500 | | | | 794,398 | |
| | | | |
| | | | | | | | | | | 30,711,237 | |
| | | | | | | | | | | | |
| | | |
| Hong Kong: 5.85% | | | | | | | | | | |
China Everbright International Limited (Industrials, Commercial Services & Supplies) | | | | | | | 1,430,000 | | | | 1,792,814 | |
China Merchants Holdings International Company Limited (Industrials, Transportation Infrastructure) | | | | | | | 254,000 | | | | 794,472 | |
China Overseas Land & Investment Limited (Financials, Real Estate Management & Development) | | | | | | | 296,000 | | | | 726,165 | |
Cosco Pacific Limited (Industrials, Transportation Infrastructure) | | | | | | | 654,861 | | | | 876,758 | |
First Pacific Company Limited (Financials, Diversified Financial Services) | | | | | | | 1,289,000 | | | | 1,428,167 | |
Fosun International (Materials, Metals & Mining) | | | | | | | 673,000 | | | | 814,237 | |
HK Electric Investments Limited (Utilities, Electric Utilities) † | | | | | | | 125 | | | | 86 | |
Honworld Group Limited (Consumer Staples, Food Products) † | | | | | | | 969,000 | | | | 653,670 | |
Pacific Basin Shipping Limited (Industrials, Marine) | | | | | | | 1,457,000 | | | | 847,557 | |
Power Assets Holdings Limited (Utilities, Electric Utilities) | | | | | | | 118,500 | | | | 1,024,062 | |
The accompanying notes are an integral part of these financial statements.
| | | | |
| 8 | | Wells Fargo Advantage Asia Pacific Fund | | Portfolio of investments—April 30, 2014 (unaudited) |
| | | | | | | | | | | | |
| Security name | | | | | | Shares | | | Value | |
| | | |
| Hong Kong (continued) | | | | | | | | | | |
Wharf Holdings Limited (Financials, Real Estate Management & Development) | | | | | | | 137,000 | | | $ | 958,635 | |
| | | | |
| | | | | | | | | | | 9,916,623 | |
| | | | | | | | | | | | |
| | | |
| India: 4.01% | | | | | | | | | | |
HDFC Bank Limited (Financials, Banks) | | | | | | | 69,400 | | | | 862,969 | |
Hindalco Industries Limited (Materials, Metals & Mining) | | | | | | | 759,300 | | | | 1,690,690 | |
ICICI Bank Limited ADR (Financials, Banks) | | | | | | | 43,700 | | | | 1,864,679 | |
Maruti Suzuki India Limited (Consumer Discretionary, Automobiles) | | | | | | | 30,700 | | | | 978,796 | |
Oil & Natural Gas Corporation Limited (Energy, Oil, Gas & Consumable Fuels) | | | | | | | 259,000 | | | | 1,396,019 | |
| | | | |
| | | | | | | | | | | 6,793,153 | |
| | | | | | | | | | | | |
| | | | |
| Indonesia: 3.02% | | | | | | | | | | | | |
PT Astra International Tbk (Consumer Discretionary, Automobiles) | | | | | | | 1,277,400 | | | | 820,369 | |
PT Sawit Sumbermas Sarana Tbk (Consumer Staples, Food Products) † | | | | | | | 10,585,000 | | | | 1,098,646 | |
PT Semen Gresik Persero Tbk (Materials, Construction Materials) | | | | | | | 607,500 | | | | 780,295 | |
PT Telekomunikasi Indonesia Tbk (Telecommunication Services, Diversified Telecommunication Services) | | | | | | | 5,416,000 | | | | 1,061,042 | |
PT Wijaya Karya Beton Tbk (Materials, Construction Materials) † | | | | | | | 21,436,000 | | | | 1,362,752 | |
| | | | |
| | | | | | | | | | | 5,123,104 | |
| | | | | | | | | | | | |
| | | | |
| Japan: 28.98% | | | | | | | | | | | | |
ASICS Corporation (Consumer Discretionary, Textiles, Apparel & Luxury Goods) | | | | | | | 49,100 | | | | 955,249 | |
Avex Group Holdings Incorporated (Consumer Discretionary, Media) | | | | | | | 58,000 | | | | 1,071,101 | |
FANUC Limited (Industrials, Machinery) | | | | | | | 7,300 | | | | 1,313,836 | |
Fuji Heavy Industries Limited (Consumer Discretionary, Automobiles) | | | | | | | 33,700 | | | | 885,064 | |
FUJIFILM Holdings Corporation (Information Technology, Electronic Equipment, Instruments & Components) | | | | | | | 81,800 | | | | 2,112,310 | |
GLP J-REIT (Financials, REITs) | | | | | | | 3,050 | | | | 3,010,173 | |
Hitachi Limited (Information Technology, Electronic Equipment, Instruments & Components) | | | | | | | 364,000 | | | | 2,588,429 | |
Hulic REIT Incorporated (Financials, REITs) †« | | | | | | | 700 | | | | 977,063 | |
Inpex Holdings Incorporated (Energy, Oil, Gas & Consumable Fuels) | | | | | | | 97,000 | | | | 1,411,806 | |
Japan Airlines Company Limited (Industrials, Airlines) | | | | | | | 57,300 | | | | 2,964,904 | |
Komatsu Limited (Industrials, Machinery) | | | | | | | 43,500 | | | | 958,204 | |
M3 Incorporated (Health Care, Health Care Technology) | | | | | | | 140,000 | | | | 1,919,890 | |
Matsushita Electric Industrial Company Limited (Consumer Discretionary, Household Durables) | | | | | | | 290,000 | | | | 3,174,158 | |
Mitsubishi Corporation (Industrials, Trading Companies & Distributors) | | | | | | | 55,700 | | | | 995,937 | |
Mitsubishi Electric Corporation (Industrials, Electrical Equipment) | | | | | | | 234,000 | | | | 2,661,926 | |
Mitsubishi Heavy Industries Limited (Industrials, Machinery) | | | | | | | 424,000 | | | | 2,231,252 | |
Mitsui Fudosan Company Limited (Financials, Real Estate Management & Development) | | | | | | | 101,000 | | | | 2,984,506 | |
Modec Incorporated (Energy, Energy Equipment & Services) « | | | | | | | 44,100 | | | | 974,872 | |
Nagoya Railroad Company Limited (Industrials, Road & Rail) | | | | | | | 635,000 | | | | 2,012,422 | |
Nippon Telegraph & Telephone Corporation (Telecommunication Services, Diversified Telecommunication Services) | | | | | | | 25,300 | | | | 1,400,922 | |
Otsuka Corporation (Information Technology, IT Services) | | | | | | | 7,700 | | | | 910,579 | |
Sanrio Company Limited (Consumer Discretionary, Specialty Retail) « | | | | | | | 21,800 | | | | 689,813 | |
SoftBank Corporation (Telecommunication Services, Wireless Telecommunication Services) | | | | | | | 34,500 | | | | 2,561,305 | |
Sumitomo Mitsui Trust Holdings Incorporated (Financials, Banks) | | | | | | | 759,000 | | | | 3,125,534 | |
Toshiba Corporation (Industrials, Industrial Conglomerates) | | | | | | | 449,000 | | | | 1,756,737 | |
Toyota Motor Corporation (Consumer Discretionary, Automobiles) | | | | | | | 31,500 | | | | 1,699,555 | |
West Holdings Corporation (Consumer Discretionary, Household Durables) « | | | | | | | 70,700 | | | | 948,798 | |
Yahoo Japan Corporation (Information Technology, Internet Software & Services) | | | | | | | 191,600 | | | | 832,106 | |
| | | | |
| | | | | | | | | | | 49,128,451 | |
| | | | | | | | | | | | |
The accompanying notes are an integral part of these financial statements.
| | | | | | |
| Portfolio of investments—April 30, 2014 (unaudited) | | Wells Fargo Advantage Asia Pacific Fund | | | 9 | |
| | | | | | | | | | | | |
| Security name | | | | | | Shares | | | Value | |
| | | | |
| Malaysia: 2.11% | | | | | | | | | | | | |
Barakah Offshore Petroleum Bhd (Energy, Energy Equipment & Services) † | | | | | | | 1,808,800 | | | $ | 936,111 | |
IHH Healthcare Bhd (Health Care, Health Care Providers & Services) † | | | | | | | 700,000 | | | | 863,179 | |
Public Bank Bhd (Financials, Banks) | | | | | | | 143,200 | | | | 883,187 | |
SP Setia Bhd (Financials, Real Estate Management & Development) | | | | | | | 970,700 | | | | 897,723 | |
| | | | |
| | | | | | | | | | | 3,580,200 | |
| | | | | | | | | | | | |
| | | | |
| New Zealand: 0.52% | | | | | | | | | | | | |
Infratil Limited (Utilities, Electric Utilities) | | | | | | | 447,100 | | | | 886,729 | |
| | | | | | | | | | | | |
| | | | |
| Philippines: 2.65% | | | | | | | | | | | | |
ABS-CBN Holdings Corporation (Consumer Discretionary, Media) | | | | | | | 969,200 | | | | 810,928 | |
OceanaGold Corporation (Materials, Metals & Mining) †« | | | | | | | 711,700 | | | | 1,785,158 | |
Pepsi-Cola Products Philippines Incorporated (Consumer Staples, Beverages) | | | | | | | 8,608,000 | | | | 965,455 | |
Philippine Long Distance Telephone Company (Telecommunication Services, Wireless Telecommunication Services) | | | | | | | 14,350 | | | | 927,052 | |
| | | | |
| | | | | | | | | | | 4,488,593 | |
| | | | | | | | | | | | |
| | | | |
| Singapore: 4.68% | | | | | | | | | | | | |
ARA Asset Management Limited (Financials, Capital Markets) | | | | | | | 421,000 | | | | 612,846 | |
CapitaRetail China Trust (Financials, REITs) | | | | | | | 733,000 | | | | 865,311 | |
First Resources Limited (Consumer Staples, Food Products) | | | | | | | 562,000 | | | | 1,152,062 | |
Global Logistic Properties Limited (Financials, Real Estate Management & Development) | | | | | | | 626,000 | | | | 1,423,068 | |
Hutchison Port Holdings Trust (Industrials, Transportation Infrastructure) | | | | | | | 1,455,000 | | | | 989,400 | |
Lippo Malls Indonesia Retail Trust (Financials, REITs) | | | | | | | 3,603,000 | | | | 1,163,927 | |
Midas Holdings Limited (Materials, Metals & Mining) | | | | | | | 2,357,000 | | | | 883,617 | |
Raffles Medical Group Limited (Health Care, Health Care Providers & Services) | | | | | | | 294,000 | | | | 851,256 | |
| | | | |
| | | | | | | | | | | 7,941,487 | |
| | | | | | | | | | | | |
| | | | |
| South Korea: 4.98% | | | | | | | | | | | | |
Hana Financial Group Incorporated (Financials, Banks) | | | | | | | 23,390 | | | | 822,826 | |
Hanssem Company Limited (Consumer Discretionary, Household Durables) | | | | | | | 13,000 | | | | 1,061,841 | |
Korea Electric Power Corporation (Utilities, Electric Utilities) | | | | | | | 24,930 | | | | 953,000 | |
LG Chem Limited (Materials, Chemicals) | | | | | | | 4,700 | | | | 1,196,264 | |
NCsoft Corporation (Information Technology, Software) | | | | | | | 4,300 | | | | 853,092 | |
POSCO (Materials, Metals & Mining) | | | | | | | 8,400 | | | | 2,499,758 | |
Suprema Incorporated (Information Technology, Electronic Equipment, Instruments & Components) † | | | | | | | 42,600 | | | | 1,053,353 | |
| | | | |
| | | | | | | | | | | 8,440,134 | |
| | | | | | | | | | | | |
| | | | |
| Taiwan: 6.19% | | | | | | | | | | | | |
Chicony Electronics Company Limited (Information Technology, Technology Hardware, Storage & Peripherals) | | | | | | | 359,000 | | | | 933,224 | |
Chroma ATE Incorporated (Information Technology, Electronic Equipment, Instruments & Components) | | | | | | | 309,000 | | | | 795,063 | |
Cleanaway Company Limited (Industrials, Commercial Services & Supplies) | | | | | | | 144,000 | | | | 815,418 | |
Everlight Electronics Company Limited (Information Technology, Semiconductors & Semiconductor Equipment) | | | | | | | 342,000 | | | | 799,563 | |
Radiant Opto-Electronics Corporation (Information Technology, Semiconductors & Semiconductor Equipment) | | | | | | | 513,000 | | | | 2,064,027 | |
Siliconware Precision Industries Company (Information Technology, Semiconductors & Semiconductor Equipment) | | | | | | | 722,000 | | | | 1,057,967 | |
Taiwan Semiconductor Manufacturing Company Limited (Information Technology, Semiconductors &
Semiconductor Equipment) | | | | | | | 784,000 | | | | 3,076,495 | |
WPG Holdings Company Limited (Information Technology, Electronic Equipment, Instruments & Components) | | | | | | | 774,000 | | | | 950,904 | |
| | | | |
| | | | | | | | | | | 10,492,661 | |
| | | | | | | | | | | | |
The accompanying notes are an integral part of these financial statements.
| | | | |
| 10 | | Wells Fargo Advantage Asia Pacific Fund | | Portfolio of investments—April 30, 2014 (unaudited) |
| | | | | | | | | | | | | | | | |
| Security name | | | | | | | | Shares | | | Value | |
| | | | |
| Thailand: 0.63% | | | | | | | | | | | | | | | | |
Mega Lifesciences PCL (Health Care, Pharmaceuticals) | | | | | | | | | | | 1,520,000 | | | $ | 1,066,255 | |
| | | | | | | | | | | | | | | | |
| | | | |
Total Common Stocks (Cost $143,829,100) | | | | | | | | | | | | | | | 149,558,919 | |
| | | | | | | | | | | | | | | | |
| | | | |
Investment Companies: 1.26% | | | | | | | | | | | | | | | | |
| | | | |
| United States: 1.26% | | | | | | | | | | | | | | | | |
iShares MSCI Japan Index ETF | | | | | | | | | | | 77,713 | | | | 861,060 | |
Market Vectors India Small Cap Index ETF | | | | | | | | | | | 34,339 | | | | 1,271,230 | |
| | | | |
Total Investment Companies (Cost $2,117,991) | | | | | | | | | | | | | | | 2,132,290 | |
| | | | | | | | | | | | | | | | |
| | | | |
| | | | | | Expiration date | | | | | | | |
| | | | |
Participation Notes: 5.17% | | | | | | | | | | | | | | | | |
| | | | |
| China: 5.17% | | | | | | | | | | | | | | | | |
HSBC Bank plc (China Vanke Company Limited Class A) (Financials, Real Estate Management & Development) † | | | | | | | 2-11-2019 | | | | 635,000 | | | | 801,345 | |
HSBC Bank plc (Guangxi Wuzhou Zhongheng Group Company Limited Class A) (Health Care, Pharmaceuticals) † | | | | | | | 10-31-2014 | | | | 419,700 | | | | 847,432 | |
HSBC Bank plc (Qingdao Haier Company Limited Class A) (Consumer Discretionary, Household Durables) † | | | | | | | 6-8-2020 | | | | 702,500 | | | | 1,722,557 | |
HSBC Bank plc (Shanghai International Airport Company Limited Class A) (Industrials, Transportation Infrastructure) † | | | | | | | 8-20-2020 | | | | 693,500 | | | | 1,465,633 | |
HSBC Bank plc (Shenzhen Fuanna Bedding & Furnishing Company Limited Class A) (Consumer Discretionary, Household Durables) † | | | | | | | 10-31-2023 | | | | 383,901 | | | | 842,075 | |
HSBC Bank plc (Weichai Power Company Limited Class A) (Industrials, Machinery) † | | | | | | | 12-20-2021 | | | | 395,000 | | | | 1,082,131 | |
Standard Chartered Bank (Daqin Railway Company Limited Class A)
(Industrials, Road & Rail) † | | | | | | | 4-3-2015 | | | | 1,192,300 | | | | 1,268,465 | |
Standard Chartered Bank (Henan Shuanghui Investment & Development Company Limited Class A) (Consumer Staples, Food Products) † | | | | | | | 4-10-2015 | | | | 128,300 | | | | 737,201 | |
| | | | |
Total Participation Notes (Cost $8,987,494) | | | | | | | | | | | | | | | 8,766,839 | |
| | | | | | | | | | | | | | | | |
| | | Dividend yield | | | | | | | | | | |
| | | | |
Preferred Stocks: 2.13% | | | | | | | | | | | | | | | | |
| | | | |
| South Korea: 2.13% | | | | | | | | | | | | | | | | |
Samsung Electronics Company Limited (Information Technology, Semiconductors & Semiconductor Equipment) ± | | | 1.28 | % | | | | | | | 3,600 | | | | 3,612,891 | |
| | | | | | | | | | | | | | | | |
| | | | |
Total Preferred Stocks (Cost $2,572,004) | | | | | | | | | | | | | | | 3,612,891 | |
| | | | | | | | | | | | | | | | |
| | | | |
Rights: 0.00% | | | | | | | | | | | | | | | | |
| | | | |
| Hong Kong: 0.00% | | | | | | | | | | | | | | | | |
Fosun International Limited (Materials, Metals & Mining) † | | | | | | | 8-27-2014 | | | | 52,494 | | | | 237 | |
| | | | | | | | | | | | | | | | |
| | | | |
Total Rights (Cost $0) | | | | | | | | | | | | | | | 237 | |
| | | | | | | | | | | | | | | | |
The accompanying notes are an integral part of these financial statements.
| | | | | | |
| Portfolio of investments—April 30, 2014 (unaudited) | | Wells Fargo Advantage Asia Pacific Fund | | | 11 | |
| | | | | | | | | | | | | | |
| Security name | | Yield | | | | | Shares | | | Value | |
| | | | |
Short-Term Investments: 4.09% | | | | | | | | | | | | | | |
| | | | |
| Investment Companies: 4.09% | | | | | | | | | | | | | | |
Wells Fargo Advantage Cash Investment Money Market Fund, Select Class (l)(u) | | | 0.07 | % | | | | | 2,587,678 | | | $ | 2,587,678 | |
Wells Fargo Securities Lending Cash Investments, LLC (l)(r)(u)(v) | | | 0.11 | | | | | | 4,343,942 | | | | 4,343,941 | |
| | | | |
Total Short-Term Investments (Cost $6,931,619) | | | | | | | | | | | | | 6,931,619 | |
| | | | | | | | | | | | | | |
| | | | | | | | |
| Total investments in securities | | | | | | | | |
| (Cost $164,438,208) * | | | 100.86 | % | | | 171,002,795 | |
Other assets and liabilities, net | | | (0.86 | ) | | | (1,454,141 | ) |
| | | | | | | | |
| Total net assets | | | 100.00 | % | | $ | 169,548,654 | |
| | | | | | | | |
| † | Non-income-earning security |
| « | All or a portion of this security is on loan. |
| ± | Variable rate investment. The rate shown is the rate in effect at period end. |
| (l) | Represents an affiliate of the Fund under Sections 2(a)(2) and 2(a)(3) of the Investment Company Act of 1940, as amended |
| (u) | Rate shown is the 7-day annualized yield at period end. |
| (r) | The investment company is exempt from registration under Section 3(c)(7) of the Investment Company Act of 1940, as amended. |
| (v) | Security represents investment of cash collateral received from securities on loan. |
| * | Cost for federal income tax purposes is $167,072,867 and unrealized appreciation (depreciation) consists of: |
| | | | |
Gross unrealized appreciation | | $ | 13,813,583 | |
Gross unrealized depreciation | | | (9,883,655 | ) |
| | | | |
Net unrealized appreciation | | $ | 3,929,928 | |
The accompanying notes are an integral part of these financial statements.
| | | | |
| 12 | | Wells Fargo Advantage Asia Pacific Fund | | Statement of assets and liabilities—April 30, 2014 (unaudited) |
| | | | |
| | | | |
| |
Assets | | | | |
Investments | | | | |
In unaffiliated securities (including securities on loan), at value (see cost below) | | $ | 164,071,176 | |
In affiliated securities, at value (see cost below) | | | 6,931,619 | |
| | | | |
Total investments, at value (see cost below) | | | 171,002,795 | |
Foreign currency, at value (see cost below) | | | 1,646,229 | |
Receivable for investments sold | | | 2,054,033 | |
Receivable for Fund shares sold | | | 49,496 | |
Receivable for dividends | | | 680,015 | |
Receivable for securities lending income | | | 5,355 | |
Prepaid expenses and other assets | | | 33,078 | |
| | | | |
Total assets | | | 175,471,001 | |
| | | | |
| |
Liabilities | | | | |
Payable for investments purchased | | | 1,135,538 | |
Payable for Fund shares redeemed | | | 183,781 | |
Payable upon receipt of securities loaned | | | 4,343,942 | |
Advisory fee payable | | | 119,450 | |
Distribution fees payable | | | 1,191 | |
Due to other related parties | | | 50,093 | |
Accrued expenses and other liabilities | | | 88,352 | |
| | | | |
Total liabilities | | | 5,922,347 | |
| | | | |
Total net assets | | $ | 169,548,654 | |
| | | | |
| |
NET ASSETS CONSIST OF | | | | |
Paid-in capital | | $ | 287,651,933 | |
Accumulated net investment loss | | | (2,360,863 | ) |
Accumulated net realized losses on investments | | | (122,308,791 | ) |
Net unrealized gains on investments | | | 6,566,375 | |
| | | | |
Total net assets | | $ | 169,548,654 | |
| | | | |
| |
COMPUTATION OF NET ASSET VALUE AND OFFERING PRICE PER SHARE1 | | | | |
Net assets – Class A | | $ | 6,391,887 | |
Shares outstanding – Class A | | | 566,590 | |
Net asset value per share – Class A | | | $11.28 | |
Maximum offering price per share – Class A2 | | | $11.97 | |
Net assets – Class C | | $ | 1,891,051 | |
Shares outstanding – Class C | | | 175,818 | |
Net asset value per share – Class C | | | $10.76 | |
Net assets – Administrator Class | | $ | 12,164,686 | |
Shares outstanding – Administrator Class | | | 1,097,189 | |
Net asset value per share – Administrator Class | | | $11.09 | |
Net assets – Institutional Class | | $ | 146,024 | |
Shares outstanding – Institutional Class | | | 13,163 | |
Net asset value per share – Institutional Class | | | $11.09 | |
Net assets – Investor Class | | $ | 148,955,006 | |
Shares outstanding – Investor Class | | | 13,405,917 | |
Net asset value per share – Investor Class | | | $11.11 | |
| |
Investments in unaffiliated securities (including securities on loan), at cost | | $ | 157,506,589 | |
| | | | |
Investments in affiliated securities, at cost | | $ | 6,931,619 | |
| | | | |
Total investments, at cost | | $ | 164,438,208 | |
| | | | |
Securities on loan, at value | | $ | 4,128,416 | |
| | | | |
Foreign currency, at cost | | $ | 1,646,052 | |
| | | | |
| 1. | The Fund has an unlimited number of authorized shares. |
| 2. | Maximum offering price is computed as 100/94.25 of net asset value. On investments of $50,000 or more, the offering price is reduced. |
The accompanying notes are an integral part of these financial statements.
| | | | | | |
| Statement of operations—six months ended April 30, 2014 (unaudited) | | Wells Fargo Advantage Asia Pacific Fund | | | 13 | |
| | | | |
| | | | |
| |
Investment income | | | | |
Dividends* | | $ | 1,395,595 | |
Securities lending income, net | | | 22,813 | |
Income from affiliated securities | | | 1,463 | |
| | | | |
Total investment income | | | 1,419,871 | |
| | | | |
| |
Expenses | | | | |
Advisory fee | | | 850,132 | |
Administration fees | | | | |
Fund level | | | 44,744 | |
Class A | | | 9,038 | |
Class C | | | 2,603 | |
Administrator Class | | | 6,251 | |
Institutional Class | | | 55 | |
Investor Class | | | 251,812 | |
Shareholder servicing fees | | | | |
Class A | | | 8,690 | |
Class C | | | 2,503 | |
Administrator Class | | | 13,307 | |
Investor Class | | | 195,999 | |
Distribution fees | | | | |
Class C | | | 7,510 | |
Custody and accounting fees | | | 83,869 | |
Professional fees | | | 23,791 | |
Registration fees | | | 32,482 | |
Shareholder report expenses | | | 26,131 | |
Trustees’ fees and expenses | | | 4,469 | |
Other fees and expenses | | | 12,001 | |
| | | | |
Total expenses | | | 1,575,387 | |
Less: Fee waivers and/or expense reimbursements | | | (109,488 | ) |
| | | | |
Net expenses | | | 1,465,899 | |
| | | | |
Net investment loss | | | (46,028 | ) |
| | | | |
| |
REALIZED AND UNREALIZED GAINS (LOSSES) ON INVESTMENTS | | | | |
| |
Net realized gains (losses) on: | | | | |
Unaffiliated securities | | | 7,867,517 | |
Forward foreign currency contract transactions | | | (43 | ) |
| | | | |
Net realized gains on investments | | | 7,867,474 | |
| | | | |
Net change in unrealized gains (losses) on investments | | | (10,019,494 | ) |
| | | | |
Net realized and unrealized gains (losses) on investments | | | (2,152,020 | ) |
| | | | |
Net decrease in net assets resulting from operations | | $ | (2,198,048 | ) |
| | | | |
| |
* Net of foreign dividend withholding taxes in the amount of | | | $136,372 | |
The accompanying notes are an integral part of these financial statements.
| | | | |
| 14 | | Wells Fargo Advantage Asia Pacific Fund | | Statement of changes in net assets |
| | | | | | | | | | | | | | | | |
| | | Six months ended April 30, 2014 (unaudited) | | | Year ended October 31, 2013 | |
| | | | |
Operations | | | | | | | | | | | | | | | | |
Net investment income (loss) | | | | | | $ | (46,028 | ) | | | | | | $ | 1,983,142 | |
Net realized gains on investments | | | | | | | 7,867,474 | | | | | | | | 24,425,709 | |
Net change in unrealized gains (losses) on investments | | | | | | | (10,019,494 | ) | | | | | | | 6,462,219 | |
| | | | |
Net increase (decrease) in net assets resulting from operations | | | | | | | (2,198,048 | ) | | | | | | | 32,871,070 | |
| | | | |
| | | | |
Distributions to shareholders from | | | | | | | | | | | | | | | | |
Net investment income | | | | | | | | | | | | | | | | |
Class A | | | | | | | (174,427 | ) | | | | | | | (242,199 | ) |
Class C | | | | | | | (39,188 | ) | | | | | | | (55,133 | ) |
Administrator Class | | | | | | | (357,092 | ) | | | | | | | (517,420 | ) |
Institutional Class | | | | | | | (3,952 | ) | | | | | | | (488 | ) |
Investor Class | | | | | | | (4,117,147 | ) | | | | | | | (5,920,195 | ) |
| | | | |
Total distributions to shareholders | | | | | | | (4,691,806 | ) | | | | | | | (6,735,435 | ) |
| | | | |
| | | | |
Capital share transactions | | | Shares | | | | | | | | Shares | | | | | |
Proceeds from shares sold | | | | | | | | | | | | | | | | |
Class A | | | 74,434 | | | | 857,621 | | | | 524,754 | | | | 5,849,346 | |
Class C | | | 47,187 | | | | 517,730 | | | | 57,655 | | | | 624,516 | |
Administrator Class | | | 194,714 | | | | 2,190,200 | | | | 447,283 | | | | 4,865,999 | |
Institutional Class | | | 1,755 | | | | 19,998 | | | | 9,917 | | | | 109,066 | |
Investor Class | | | 985,443 | | | | 11,156,896 | | | | 3,687,801 | | | | 39,900,338 | |
| | | | |
| | | | | | | 14,742,445 | | | | | | | | 51,349,265 | |
| | | | |
Reinvestment of distributions | | | | | | | | | | | | | | | | |
Class A | | | 14,068 | | | | 162,768 | | | | 19,589 | | | | 201,959 | |
Class C | | | 2,369 | | | | 26,174 | | | | 3,990 | | | | 39,420 | |
Administrator Class | | | 29,465 | | | | 334,721 | | | | 46,860 | | | | 474,690 | |
Institutional Class | | | 348 | | | | 3,952 | | | | 48 | | | | 488 | |
Investor Class | | | 353,802 | | | | 4,029,825 | | | | 551,264 | | | | 5,600,848 | |
| | | | |
| | | | | | | 4,557,440 | | | | | | | | 6,317,405 | |
| | | | |
Payment for shares redeemed | | | | | | | | | | | | | | | | |
Class A | | | (265,910 | ) | | | (3,090,448 | ) | | | (359,560 | ) | | | (3,977,877 | ) |
Class C | | | (51,284 | ) | | | (554,528 | ) | | | (55,976 | ) | | | (604,958 | ) |
Administrator Class | | | (217,080 | ) | | | (2,441,459 | ) | | | (684,345 | ) | | | (7,536,691 | ) |
Institutional Class | | | (66 | ) | | | (760 | ) | | | 0 | | | | 0 | |
Investor Class | | | (2,163,188 | ) | | | (24,478,739 | ) | | | (5,429,628 | ) | | | (59,220,253 | ) |
| | | | |
| | | | | | | (30,565,934 | ) | | | | | | | (71,339,779 | ) |
| | | | |
Net decrease in net assets resulting from capital share transactions | | | | | | | (11,266,049 | ) | | | | | | | (13,673,109 | ) |
| | | | |
Total increase (decrease) in net assets | | | | | | | (18,155,903 | ) | | | | | | | 12,462,526 | |
| | | | |
| | | | |
Net assets | | | | | | | | | | | | | | | | |
Beginning of period | | | | | | | 187,704,557 | | | | | | | | 175,242,031 | |
| | | | |
End of period | | | | | | $ | 169,548,654 | | | | | | | $ | 187,704,557 | |
| | | | |
Undistributed (accumulated) net investment income (loss) | | | | | | $ | (2,360,863 | ) | | | | | | $ | 2,376,971 | |
| | | | |
The accompanying notes are an integral part of these financial statements.
| | | | | | |
| Financial highlights | | Wells Fargo Advantage Asia Pacific Fund | | | 15 | |
(For a share outstanding throughout each period)
| | | | | | | | | | | | | | | | | | | | | | | | | | | | |
| | | Six months ended
April 30, 2014 (unaudited) | | | Year ended October 31 | | | Year ended September 30 | |
| CLASS A | | | 2013 | | | 2012 | | | 2011 | | | 20101 | | | 2010 | | | 2009 | |
Net asset value, beginning of period | | $ | 11.72 | | | $ | 10.19 | | | $ | 9.30 | | | $ | 10.15 | | | $ | 9.77 | | | $ | 8.82 | | | $ | 8.14 | |
Net investment income (loss) | | | (0.00 | )2,3 | | | 0.12 | 2 | | | 0.10 | 2 | | | 0.08 | 2 | | | (0.01 | )2 | | | 0.04 | 2 | | | 0.11 | 2 |
Net realized and unrealized gains (losses) on investments | | | (0.14 | ) | | | 1.79 | | | | 0.79 | | | | (0.89 | ) | | | 0.39 | | | | 1.05 | | | | 0.59 | |
| | | | | | | | | | | | | | | | | | | | | | | | | | | | |
Total from investment operations | | | (0.14 | ) | | | 1.91 | | | | 0.89 | | | | (0.81 | ) | | | 0.38 | | | | 1.09 | | | | 0.70 | |
Distributions to shareholders from | | | | | | | | | | | | | | | | | | | | | | | | | | | | |
Net investment income | | | (0.30 | ) | | | (0.38 | ) | | | 0.00 | | | | (0.04 | ) | | | 0.00 | | | | (0.14 | ) | | | (0.02 | ) |
Net asset value, end of period | | $ | 11.28 | | | $ | 11.72 | | | $ | 10.19 | | | $ | 9.30 | | | $ | 10.15 | | | $ | 9.77 | | | $ | 8.82 | |
Total return4 | | | (1.36 | )% | | | 19.24 | % | | | 9.57 | % | | | (7.97 | )% | | | 3.89 | % | | | 12.58 | % | | | 8.64 | % |
Ratios to average net assets (annualized) | | | | | | | | | | | | | | | | | | | | | | | | | | | | |
Gross expenses | | | 1.71 | % | | | 1.79 | % | | | 1.86 | % | | | 1.73 | % | | | 1.90 | % | | | 1.90 | % | | | 2.03 | % |
Net expenses | | | 1.60 | % | | | 1.60 | % | | | 1.60 | % | | | 1.60 | % | | | 1.60 | % | | | 1.59 | % | | | 1.60 | % |
Net investment income (loss) | | | (0.05 | )% | | | 1.08 | % | | | 1.04 | % | | | 0.83 | % | | | (0.91 | )% | | | 0.49 | % | | | 1.56 | % |
Supplemental data | | | | | | | | | | | | | | | | | | | | | | | | | | | | |
Portfolio turnover rate | | | 63 | % | | | 187 | % | | | 163 | % | | | 196 | % | | | 11 | % | | | 137 | % | | | 185 | % |
Net assets, end of period (000s omitted) | | $ | 6,392 | | | $ | 8,720 | | | $ | 5,699 | | | $ | 31,000 | | | $ | 63,741 | | | $ | 62,700 | | | $ | 85,156 | |
| 1. | For the one month ended October 31, 2010. The Fund changed its fiscal year end from September 30 to October 31, effective October 31, 2010. |
| 2. | Calculated based upon average shares outstanding |
| 3. | Amount is less than $0.005. |
| 4. | Total return calculations do not include any sales charges. Returns for periods of less than one year are not annualized. |
The accompanying notes are an integral part of these financial statements.
| | | | |
| 16 | | Wells Fargo Advantage Asia Pacific Fund | | Financial highlights |
(For a share outstanding throughout each period)
| | | | | | | | | | | | | | | | | | | | | | | | | | | | |
| | | Six months ended
April 30, 2014 (unaudited) | | | Year ended October 31 | | | Year ended September 30 | |
| CLASS C | | | 2013 | | | 2012 | | | 2011 | | | 20101 | | | 2010 | | | 2009 | |
Net asset value, beginning of period | | $ | 11.15 | | | $ | 9.73 | | | $ | 8.98 | | | $ | 9.96 | | | $ | 9.59 | | | $ | 8.67 | | | $ | 8.05 | |
Net investment income (loss) | | | (0.04 | ) | | | 0.05 | | | | 0.09 | 2 | | | 0.01 | | | | (0.01 | )2 | | | (0.01 | )2 | | | 0.05 | 2 |
Net realized and unrealized gains (losses) on investments | | | (0.13 | ) | | | 1.69 | | | | 0.69 | | | | (0.86 | ) | | | 0.38 | | | | 1.03 | | | | 0.57 | |
| | | | | | | | | | | | | | | | | | | | | | | | | | | | |
Total from investment operations | | | (0.17 | ) | | | 1.74 | | | | 0.78 | | | | (0.85 | ) | | | 0.37 | | | | 1.02 | | | | 0.62 | |
Distributions to shareholders from | | | | | | | | | | | | | | | | | | | | | | | | | | | | |
Net investment income | | | (0.22 | ) | | | (0.32 | ) | | | (0.03 | ) | | | (0.13 | ) | | | 0.00 | | | | (0.10 | ) | | | 0.00 | |
Net asset value, end of period | | $ | 10.76 | | | $ | 11.15 | | | $ | 9.73 | | | $ | 8.98 | | | $ | 9.96 | | | $ | 9.59 | | | $ | 8.67 | |
Total return3 | | | (1.83 | )% | | | 18.44 | % | | | 8.78 | % | | | (8.67 | )% | | | 3.86 | % | | | 11.84 | % | | | 7.70 | % |
Ratios to average net assets (annualized) | | | | | | | | | | | | | | | | | | | | | | | | | | | | |
Gross expenses | | | 2.46 | % | | | 2.54 | % | | | 2.62 | % | | | 2.48 | % | | | 2.65 | % | | | 2.65 | % | | | 2.79 | % |
Net expenses | | | 2.35 | % | | | 2.35 | % | | | 2.35 | % | | | 2.35 | % | | | 2.35 | % | | | 2.34 | % | | | 2.35 | % |
Net investment income (loss) | | | (0.70 | )% | | | 0.37 | % | | | 0.92 | % | | | 0.18 | % | | | (1.66 | )% | | | (0.13 | )% | | | 0.73 | % |
Supplemental data | | | | | | | | | | | | | | | | | | | | | | | | | | | | |
Portfolio turnover rate | | | 63 | % | | | 187 | % | | | 163 | % | | | 196 | % | | | 11 | % | | | 137 | % | | | 185 | % |
Net assets, end of period (000s omitted) | | $ | 1,891 | | | $ | 1,980 | | | $ | 1,673 | | | $ | 1,274 | | | $ | 1,507 | | | $ | 1,450 | | | $ | 1,112 | |
| 1. | For the one month ended October 31, 2010. The Fund changed its fiscal year end from September 30 to October 31, effective October 31, 2010. |
| 2. | Calculated based upon average shares outstanding |
| 3. | Total return calculations do not include any sales charges. Returns for periods of less than one year are not annualized. |
The accompanying notes are an integral part of these financial statements.
| | | | | | |
| Financial highlights | | Wells Fargo Advantage Asia Pacific Fund | | | 17 | |
(For a share outstanding throughout each period)
| | | | | | | | | | | | | | | | | | | | | | | | |
| | | Six months ended
April 30, 2014 (unaudited) | | | Year ended October 31 | | | Year ended
September 30, 20102 | |
| ADMINISTRATOR CLASS | | | 2013 | | | 2012 | | | 2011 | | | 20101 | | |
Net asset value, beginning of period | | $ | 11.54 | | | $ | 10.04 | | | $ | 9.29 | | | $ | 10.15 | | | $ | 9.77 | | | $ | 8.84 | |
Net investment income (loss) | | | 0.01 | | | | 0.14 | 3 | | | 0.17 | | | | 0.12 | 3 | | | (0.00 | )3,4 | | | 0.03 | 3 |
Net realized and unrealized gains (losses) on investments | | | (0.14 | ) | | | 1.77 | | | | 0.71 | | | | (0.89 | ) | | | 0.38 | | | | 0.90 | |
| | | | | | | | | | | | | | | | | | | | | | | | |
Total from investment operations | | | (0.13 | ) | | | 1.91 | | | | 0.88 | | | | (0.77 | ) | | | 0.38 | | | | 0.93 | |
Distributions to shareholders from | | | | | | | | | | | | | | | | | | | | | | | | |
Net investment income | | | (0.32 | ) | | | (0.41 | ) | | | (0.13 | ) | | | (0.09 | ) | | | 0.00 | | | | 0.00 | |
Net asset value, end of period | | $ | 11.09 | | | $ | 11.54 | | | $ | 10.04 | | | $ | 9.29 | | | $ | 10.15 | | | $ | 9.77 | |
Total return5 | | | (1.34 | )% | | | 19.57 | % | | | 9.66 | % | | | (7.68 | )% | | | 3.89 | % | | | 10.52 | % |
Ratios to average net assets (annualized) | | | | | | | | | | | | | | | | | | | | | | | | |
Gross expenses | | | 1.52 | % | | | 1.61 | % | | | 1.67 | % | | | 1.52 | % | | | 1.74 | % | | | 1.80 | % |
Net expenses | | | 1.40 | % | | | 1.40 | % | | | 1.40 | % | | | 1.39 | % | | | 1.40 | % | | | 1.40 | % |
Net investment income (loss) | | | 0.19 | % | | | 1.26 | % | | | 1.74 | % | | | 1.14 | % | | | (0.70 | )% | | | 1.98 | % |
Supplemental data | | | | | | | | | | | | | | | | | | | | | | | | |
Portfolio turnover rate | | | 63 | % | | | 187 | % | | | 163 | % | | | 196 | % | | | 11 | % | | | 137 | % |
Net assets, end of period (000s omitted) | | $ | 12,165 | | | $ | 12,577 | | | $ | 12,860 | | | $ | 13,959 | | | $ | 11 | | | $ | 11 | |
| 1. | For the one month ended October 31, 2010. The Fund changed its fiscal year end from September 30 to October 31, effective October 31, 2010. |
| 2. | For the period from July 30, 2010 (commencement of class operations) to September 30, 2010 |
| 3. | Calculated based upon average shares outstanding |
| 4. | Amount is less than $0.005. |
| 5. | Returns for periods of less than one year are not annualized. |
The accompanying notes are an integral part of these financial statements.
| | | | |
| 18 | | Wells Fargo Advantage Asia Pacific Fund | | Financial highlights |
(For a share outstanding throughout each period)
| | | | | | | | | | | | | | | | | | | | | | | | |
| | | Six months ended
April 30, 2014 (unaudited) | | | Year ended October 31 | | | Year ended
September 30, 20102 | |
| INSTITUTIONAL CLASS | | | 2013 | | | 2012 | | | 2011 | | | 20101 | | |
Net asset value, beginning of period | | $ | 11.55 | | | $ | 10.05 | | | $ | 9.30 | | | $ | 10.15 | | | $ | 9.77 | | | $ | 8.84 | |
Net investment income (loss) | | | 0.02 | 3 | | | 0.18 | 3 | | | 0.18 | | | | 0.13 | | | | (0.01 | )3 | | | 0.03 | 3 |
Net realized and unrealized gains (losses) on investments | | | (0.14 | ) | | | 1.74 | | | | 0.71 | | | | (0.89 | ) | | | 0.39 | | | | 0.90 | |
| | | | | | | | | | | | | | | | | | | | | | | | |
Total from investment operations | | | (0.12 | ) | | | 1.92 | | | | 0.89 | | | | (0.76 | ) | | | 0.38 | | | | 0.93 | |
Distributions to shareholders from | | | | | | | | | | | | | | | | | | | | | | | | |
Net investment income | | | (0.34 | ) | | | (0.42 | ) | | | (0.14 | ) | | | (0.09 | ) | | | 0.00 | | | | 0.00 | |
Net asset value, end of period | | $ | 11.09 | | | $ | 11.55 | | | $ | 10.05 | | | $ | 9.30 | | | $ | 10.15 | | | $ | 9.77 | |
Total return4 | | | (1.22 | )% | | | 19.70 | % | | | 9.90 | % | | | (7.55 | )% | | | 3.89 | % | | | 10.52 | % |
Ratios to average net assets (annualized) | | | | | | | | | | | | | | | | | | | | | | | | |
Gross expenses | | | 1.28 | % | | | 1.33 | % | | | 1.42 | % | | | 1.29 | % | | | 1.47 | % | | | 1.47 | % |
Net expenses | | | 1.25 | % | | | 1.25 | % | | | 1.25 | % | | | 1.24 | % | | | 1.25 | % | | | 1.25 | % |
Net investment income (loss) | | | 0.38 | % | | | 1.62 | % | | | 1.86 | % | | | 1.30 | % | | | (0.57 | )% | | | 2.11 | % |
Supplemental data | | | | | | | | | | | | | | | | | | | | | | | | |
Portfolio turnover rate | | | 63 | % | | | 187 | % | | | 163 | % | | | 196 | % | | | 11 | % | | | 137 | % |
Net assets, end of period (000s omitted) | | | $146 | | | | $129 | | | | $12 | | | | $11 | | | | $11 | | | | $11 | |
| 1. | For the one month ended October 31, 2010. The Fund changed its fiscal year end from September 30 to October 31, effective October 31, 2010. |
| 2. | For the period from July 30, 2010 (commencement of class operations) to September 30, 2010 |
| 3. | Calculated based upon average shares outstanding |
| 4. | Returns for periods of less than one year are not annualized. |
The accompanying notes are an integral part of these financial statements.
| | | | | | |
| Financial highlights | | Wells Fargo Advantage Asia Pacific Fund | | | 19 | |
(For a share outstanding throughout each period)
| | | | | | | | | | | | | | | | | | | | | | | | | | | | |
| | | Six months ended
April 30, 2014 (unaudited) | | | Year ended October 31 | | | Year ended September 30 | |
| INVESTOR CLASS | | | 2013 | | | 2012 | | | 2011 | | | 20101 | | | 2010 | | | 2009 | |
Net asset value, beginning of period | | $ | 11.55 | | | $ | 10.05 | | | $ | 9.28 | | | $ | 10.14 | | | $ | 9.76 | | | $ | 8.81 | | | $ | 8.12 | |
Net investment income (loss) | | | (0.01 | ) | | | 0.10 | | | | 0.15 | | | | 0.08 | 2 | | | (0.01 | )2 | | | 0.04 | 2 | | | 0.09 | 2 |
Net realized and unrealized gains (losses) on investments | | | (0.14 | ) | | | 1.78 | | | | 0.72 | | | | (0.88 | ) | | | 0.39 | | | | 1.05 | | | | 0.60 | |
| | | | | | | | | | | | | | | | | | | | | | | | | | | | |
Total from investment operations | | | (0.15 | ) | | | 1.88 | | | | 0.87 | | | | (0.80 | ) | | | 0.38 | | | | 1.09 | | | | 0.69 | |
Distributions to shareholders from | | | | | | | | | | | | | | | | | | | | | | | | | | | | |
Net investment income | | | (0.29 | ) | | | (0.38 | ) | | | (0.10 | ) | | | (0.06 | ) | | | 0.00 | | | | (0.14 | ) | | | (0.00 | )3 |
Net asset value, end of period | | $ | 11.11 | | | $ | 11.55 | | | $ | 10.05 | | | $ | 9.28 | | | $ | 10.14 | | | $ | 9.76 | | | $ | 8.81 | |
Total return4 | | | (1.42 | )% | | | 19.25 | % | | | 9.51 | % | | | (7.97 | )% | | | 3.89 | % | | | 12.51 | % | | | 8.53 | % |
Ratios to average net assets (annualized) | | | | | | | | | | | | | | | | | | | | | | | | | | | | |
Gross expenses | | | 1.77 | % | | | 1.85 | % | | | 1.94 | % | | | 1.80 | % | | | 1.97 | % | | | 1.99 | % | | | 2.14 | % |
Net expenses | | | 1.65 | % | | | 1.65 | % | | | 1.65 | % | | | 1.65 | % | | | 1.65 | % | | | 1.64 | % | | | 1.65 | % |
Net investment income (loss) | | | (0.06 | )% | | | 1.04 | % | | | 1.47 | % | | | 0.82 | % | | | (0.96 | )% | | | 0.41 | % | | | 1.36 | % |
Supplemental data | | | | | | | | | | | | | | | | | | | | | | | | | | | | |
Portfolio turnover rate | | | 63 | % | | | 187 | % | | | 163 | % | | | 196 | % | | | 11 | % | | | 137 | % | | | 185 | % |
Net assets, end of period (000s omitted) | | | $148,955 | | | | $164,299 | | | | $154,999 | | | | $169,895 | | | | $252,214 | | | | $241,892 | | | | $278,741 | |
| 1. | For the one month ended October 31, 2010. The Fund changed its fiscal year end from September 30 to October 31, effective October 31, 2010. |
| 2. | Calculated based upon average shares outstanding |
| 3. | Amount is less than $0.005. |
| 4. | Returns for periods of less than one year are not annualized. |
The accompanying notes are an integral part of these financial statements.
| | | | |
| 20 | | Wells Fargo Advantage Asia Pacific Fund | | Notes to financial statements (unaudited) |
1. ORGANIZATION
Wells Fargo Funds Trust (the “Trust”), a Delaware statutory trust organized on March 10, 1999, is an open-end management investment company registered under the Investment Company Act of 1940, as amended (the “1940 Act”). These financial statements report on the Wells Fargo Advantage Asia Pacific Fund (the “Fund”) which is a diversified series of the Trust.
2. SIGNIFICANT ACCOUNTING POLICIES
The following significant accounting policies, which are consistently followed in the preparation of the financial statements of the Fund, are in conformity with U.S. generally accepted accounting principles which require management to make estimates and assumptions that affect the reported amounts of assets and liabilities, disclosure of contingent assets and liabilities at the date of the financial statements, and the reported amounts of revenues and expenses during the reporting period. Actual results could differ from those estimates.
Securities valuation
All investments are valued each business day as of the close of regular trading on the New York Stock Exchange (generally 4 p.m. Eastern Time).
Equity securities that are listed on a foreign or domestic exchange or market are valued at the official closing price or, if none, the last sales price. If no sale occurs on the primary exchange or market for the security that day, the prior day’s price will be deemed “stale” and fair values will be determined in accordance with the Fund’s Valuation Procedures.
The values of securities denominated in foreign currencies are translated into U.S. dollars at rates provided by an independent foreign currency pricing source at a time each business day specified by the Management Valuation Team of Wells Fargo Funds Management, LLC (“Funds Management”).
Many securities markets and exchanges outside the U.S. close prior to the close of the New York Stock Exchange and therefore may not fully reflect trading or events that occur after the close of the principal exchange in which the foreign securities are traded, but before the close of the New York Stock Exchange. If such trading or events are expected to materially affect the value of such securities, then fair value pricing procedures approved by the Board of Trustees of the Fund are applied. These procedures take into account multiple factors including movements in U.S. securities markets after foreign exchanges close. Foreign securities that are fair valued under these procedures are categorized as Level 2 and the application of these procedures may result in transfers between Level 1 and Level 2. Depending on market activity, such fair valuations may be frequent. Such fair value pricing may result in NAVs that are higher or lower than NAVs based on the last reported sales price or latest quoted bid price. On April 30, 2014, such fair value pricing was not used in pricing foreign securities.
Investments in registered open-end investment companies are valued at net asset value. Non-registered investment vehicles are fair valued at net asset value.
Investments which are not valued using any of the methods discussed above are valued at their fair value, as determined in good faith by the Board of Trustees. The Board of Trustees has established a Valuation Committee comprised of the Trustees and has delegated to it the authority to take any actions regarding the valuation of portfolio securities that the Valuation Committee deems necessary or appropriate, including determining the fair value of portfolio securities, unless the determination has been delegated to the Management Valuation Team. The Board of Trustees retains the authority to make or ratify any valuation decisions or approve any changes to the Valuation Procedures as it deems appropriate. On a quarterly basis, the Board of Trustees receives reports on any valuation actions taken by the Valuation Committee or the Management Valuation Team which may include items for ratification.
Valuations of fair valued securities are compared to the next actual sales price when available, or other appropriate market values, to assess the continued appropriateness of the fair valuation methodologies used. These securities are fair valued on a day-to-day basis, taking into consideration changes to appropriate market information and any significant changes to the inputs considered in the valuation process until there is a readily available price provided on an exchange or by an independent pricing service. Valuations received from an independent pricing service or independent broker-dealer quotes are periodically validated by comparisons to most recent trades and valuations provided by other independent pricing services in addition to the review of prices by the adviser and/or subadviser. Unobservable inputs used in determining fair valuations are identified based on the type of security, taking into consideration factors utilized by market participants in valuing the investment, knowledge about the issuer and the current market environment.
| | | | | | |
| Notes to financial statements (unaudited) | | Wells Fargo Advantage Asia Pacific Fund | | | 21 | |
Foreign currency translation
The accounting records of the Fund are maintained in U.S. dollars. The values of other assets and liabilities denominated in foreign currencies are translated into U.S. dollars at rates provided by an independent foreign currency pricing source at a time each business day specified by the Management Valuation Team. Purchases and sales of securities, and income and expenses are converted at the rate of exchange on the respective dates of such transactions. Net realized foreign exchange gains or losses arise from sales of foreign currencies, currency gains or losses realized between the trade and settlement dates on securities transactions, and the difference between the amounts of dividends, interest and foreign withholding taxes recorded and the U.S. dollar equivalent of the amounts actually paid or received. Net unrealized foreign exchange gains and losses arise from changes in the fair value of assets and liabilities other than investments in securities resulting from changes in exchange rates. The changes in net assets arising from changes in exchange rates and the changes in net assets resulting from changes in market prices of securities are not separately presented. Such changes are included in net realized and unrealized gains or losses from investments.
Forward foreign currency contracts
The Fund is subject to foreign currency exchange rate risk in the normal course of pursuing its investment objectives. A forward foreign currency contract is an agreement between two parties to purchase or sell a specific currency for an agreed-upon price at a future date. The Fund enters into forward foreign currency contracts to facilitate transactions in foreign-denominated securities and to attempt to minimize the risk to the Fund from adverse changes in the relationship between currencies. Forward foreign currency contracts are recorded at the forward rate and marked-to-market daily. When the contracts are closed, realized gains and losses arising from such transactions are recorded as realized gains or losses on forward foreign currency contract transactions. The Fund could be exposed to risks if the counterparties to the contracts are unable to meet the terms of their contracts or if the value of the foreign currency changes unfavorably. The Fund’s maximum risk of loss from counterparty credit risk is the unrealized gains on the contracts. This risk may be mitigated if there is a master netting arrangement between the Fund and the counterparty.
Security loans
The Fund may lend its securities from time to time in order to earn additional income in the form of fees or interest on securities received as collateral or the investment of any cash received as collateral. The Fund continues to receive interest or dividends on the securities loaned. The Fund receives collateral in the form of cash or securities with a value at least equal to the value of the securities on loan. The value of the loaned securities is determined at the close of each business day and any additional required collateral is delivered to the Fund on the next business day. In a securities lending transaction, the net asset value of the Fund will be affected by an increase or decrease in the value of the securities loaned and by an increase or decrease in the value of the instrument in which collateral is invested. The amount of securities lending activity undertaken by the Fund fluctuates from time to time. In the event of default or bankruptcy by the borrower, the Fund may be prevented from recovering the loaned securities or gaining access to the collateral or may experience delays or costs in doing so. In addition, the investment of any cash collateral received may lose all or part of its value. The Fund has the right under the lending agreement to recover the securities from the borrower on demand.
The Fund lends its securities through an unaffiliated securities lending agent. Cash collateral received in connection with its securities lending transactions is invested in Wells Fargo Securities Lending Cash Investments, LLC (the “Securities Lending Fund”). The Securities Lending Fund is exempt from registration under Section 3(c)(7) of the 1940 Act and is managed by Funds Management and is subadvised by Wells Capital Management Incorporated (“WellsCap”). Funds Management receives an advisory fee starting at 0.05% and declining to 0.01% as the average daily net assets of the Securities Lending Fund increase. All of the fees received by Funds Management are paid to WellsCap for its services as subadviser. The Securities Lending Fund seeks to provide a positive return compared to the daily Fed Funds Open rate by investing in high-quality, U.S. dollar-denominated short-term money market instruments. Securities Lending Fund investments are fair valued based upon the amortized cost valuation technique. Income earned from investment in the Securities Lending Fund is included in securities lending income on the Statement of Operations.
Security transactions and income recognition
Securities transactions are recorded on a trade date basis. Realized gains or losses are recorded on the basis of identified cost.
Dividend income is recognized on the ex-dividend date, except for certain dividends from foreign securities, which are recorded as soon as the Fund is informed of the ex-dividend date. Dividend income from foreign securities is recorded net of foreign taxes withheld where recovery of such taxes is not assured.
| | | | |
| 22 | | Wells Fargo Advantage Asia Pacific Fund | | Notes to financial statements (unaudited) |
Distributions to shareholders
Distributions to shareholders from net investment income and net realized gains, if any, are recorded on the ex-dividend date. Such distributions are determined in conformity with federal income tax regulations, which may differ in amount or character from net investment income and realized gains recognized for purposes of U.S. generally accepted accounting principles.
Federal and other taxes
The Fund intends to continue to qualify as a regulated investment company by distributing substantially all of its investment company taxable income and any net realized capital gains (after reduction for capital loss carryforwards) sufficient to relieve it from all, or substantially all, federal income taxes. Accordingly, no provision for federal income taxes was required.
The Fund’s income and federal excise tax returns and all financial records supporting those returns for the prior three fiscal years are subject to examination by the federal and Delaware revenue authorities. Management has analyzed the Fund’s tax positions taken on federal, state, and foreign tax returns for all open tax years and does not believe that there are any uncertain tax positions that require recognition of a tax liability.
As of October 31, 2013, the Fund had capital loss carryforwards available to offset future net realized capital gains in the amount of $129,730,010 with $48,912,806 expiring in 2016 and $80,817,204 expiring in 2017.
Class allocations
The separate classes of shares offered by the Fund differ principally in applicable sales charges, distribution, shareholder servicing, and administration fees. Shareholders of each class bear certain expenses that pertain to that particular class. All shareholders bear the common expenses of the Fund, earn income from the portfolio, and are allocated any unrealized gains and losses pro rata based on the average daily net assets of each class, without distinction between share classes. Dividends are determined separately for each class based on income and expenses allocable to each class. Realized gains and losses are allocated to each class pro rata based upon the net assets of each class on the date realized. Differences in per share dividend rates generally result from the relative weightings of pro rata income and realized gain allocations and from differences in separate class expenses, including distribution, shareholder servicing, and administration fees.
3. FAIR VALUATION MEASUREMENTS
Fair value measurements of investments are determined within a framework that has established a fair value hierarchy based upon the various data inputs utilized in determining the value of the Fund’s investments. The three-level hierarchy gives the highest priority to unadjusted quoted prices in active markets for identical assets or liabilities (Level 1) and the lowest priority to significant unobservable inputs (Level 3). The Fund’s investments are classified within the fair value hierarchy based on the lowest level of input that is significant to the fair value measurement. The inputs are summarized into three broad levels as follows:
| n | | Level 1 – quoted prices in active markets for identical securities |
| n | | Level 2 – other significant observable inputs (including quoted prices for similar securities, interest rates, prepayment speeds, credit risk, use of amortized cost, etc.) |
| n | | Level 3 – significant unobservable inputs (including the Fund’s own assumptions in determining the fair value of investments) |
The inputs or methodologies used for valuing investments in securities are not necessarily an indication of the risk associated with investing in those securities.
| | | | | | |
| Notes to financial statements (unaudited) | | Wells Fargo Advantage Asia Pacific Fund | | | 23 | |
As of April 30, 2014, the inputs used in valuing investments in securities were as follows:
| | | | | | | | | | | | | | | | |
| Investments in securities | | Quoted prices (Level 1) | | | Other significant
observable inputs (Level 2) | | | Significant unobservable inputs (Level 3) | | | Total | |
Equity securities | | | | | | | | | | | | | | | | |
Common stocks | | | | | | | | | | | | | | | | |
Australia | | $ | 10,990,292 | | | $ | 0 | | | $ | 0 | | | $ | 10,990,292 | |
China | | | 30,711,237 | | | | 0 | | | | 0 | | | | 30,711,237 | |
Hong Kong | | | 9,916,623 | | | | 0 | | | | 0 | | | | 9,916,623 | |
India | | | 5,930,184 | | | | 862,969 | | | | 0 | | | | 6,793,153 | |
Indonesia | | | 5,123,104 | | | | 0 | | | | 0 | | | | 5,123,104 | |
Japan | | | 49,128,451 | | | | 0 | | | | 0 | | | | 49,128,451 | |
Malaysia | | | 3,580,200 | | | | 0 | | | | 0 | | | | 3,580,200 | |
New Zealand | | | 886,729 | | | | 0 | | | | 0 | | | | 886,729 | |
Philippines | | | 4,488,593 | | | | 0 | | | | 0 | | | | 4,488,593 | |
Singapore | | | 7,941,487 | | | | 0 | | | | 0 | | | | 7,941,487 | |
South Korea | | | 8,440,134 | | | | 0 | | | | 0 | | | | 8,440,134 | |
Taiwan | | | 10,492,661 | | | | 0 | | | | 0 | | | | 10,492,661 | |
Thailand | | | 1,066,255 | | | | 0 | | | | 0 | | | | 1,066,255 | |
Investment companies | | | | | | | | | | | | | | | | |
United States | | | 2,132,290 | | | | 0 | | | | 0 | | | | 2,132,290 | |
Preferred stocks | | | | | | | | | | | | | | | | |
South Korea | | | 3,612,891 | | | | 0 | | | | 0 | | | | 3,612,891 | |
Rights | | | | | | | | | | | | | | | | |
Hong Kong | | | 0 | | | | 237 | | | | 0 | | | | 237 | |
Participation notes | | | 0 | | | | 8,766,839 | | | | 0 | | | | 8,766,839 | |
Short-term investments | | | | | | | | | | | | | | | | |
Investment companies | | | 2,587,678 | | | | 4,343,941 | | | | 0 | | | | 6,931,619 | |
| | | $ | 157,028,809 | | | $ | 13,973,986 | | | $ | 0 | | | $ | 171,002,795 | |
Transfers in and transfers out are recognized at the end of the reporting period. For the six months ended April 30, 2014, the Fund did not have any transfers into/out of Level 1, Level 2, or Level 3.
4. TRANSACTIONS WITH AFFILIATES AND OTHER EXPENSES
Advisory fee
The Trust has entered into an advisory contract with Funds Management, an indirect wholly owned subsidiary of Wells Fargo & Company (“Wells Fargo”). The adviser is responsible for implementing investment policies and guidelines and for supervising the subadvisers, who are responsible for day-to-day portfolio management of the Fund.
Pursuant to the contract, Funds Management is entitled to receive an annual advisory fee starting at 0.95% and declining to 0.80% as the average daily net assets of the Fund increase. For the six months ended April 30, 2014, the advisory fee was equivalent to an annual rate of 0.95% of the Fund’s average daily net assets.
Funds Management has retained the services of certain subadvisers to provide daily portfolio management to the Fund. The fee for subadvisory services is borne by Funds Management. WellsCap, an affiliate of Funds Management and an indirect wholly owned subsidiary of Wells Fargo, is a subadviser to the Fund and is entitled to receive a fee from Funds Management at an annual rate starting at 0.65% and declining to 0.45% as the average daily net assets of the Fund increase. Wells Capital Management Singapore, a separately identifiable department of Wells Fargo Bank, N.A. and an
| | | | |
| 24 | | Wells Fargo Advantage Asia Pacific Fund | | Notes to financial statements (unaudited) |
indirect, wholly owned subsidiary of Wells Fargo, is also a subadviser to the Fund. Out of its fees, WellsCap pays Wells Capital Management Singapore a fee for its services as subadviser at an annual rate starting at 0.25% and declining to 0.15% as the average daily net assets of the Fund increase.
Administration and transfer agent fees
The Trust has entered into an administration agreement with Funds Management. Under this agreement, for providing administrative services, which includes paying fees and expenses for services provided by the transfer agent, sub-transfer agents, omnibus account servicers and record-keepers, Funds Management is entitled to receive from the Fund an annual fund level administration fee starting at 0.05% and declining to 0.03% as the average daily net assets of the Fund increase and a class level administration fee which is calculated based on the average daily net assets of each class as follows:
| | | | |
| | | Class level
administration fee | |
Class A, Class C | | | 0.26 | % |
Administrator Class | | | 0.10 | |
Institutional Class | | | 0.08 | |
Investor Class | | | 0.32 | |
Funds Management has contractually waived and/or reimbursed advisory and administration fees to the extent necessary to maintain certain net operating expense ratios for the Fund. Waiver of fees and/or reimbursement of expenses by Funds Management were made first from fund level expenses on a proportionate basis and then from class specific expenses. Funds Management has committed through February 28, 2015 to waive fees and/or reimburse expenses to the extent necessary to cap the Fund’s expenses at 1.60% for Class A shares, 2.35% for Class C shares, 1.40% for Administrator Class shares, 1.25% for Institutional Class shares, and 1.65% for Investor Class shares.
Distribution fees
The Trust has adopted a Distribution Plan for Class C shares of the Fund pursuant to Rule 12b-1 under the 1940 Act. Distribution fees are charged to Class C shares and paid to Wells Fargo Funds Distributor, LLC, the principal underwriter, at an annual rate of 0.75% of the average daily net assets of Class C shares.
For the six months ended April 30, 2014, Wells Fargo Funds Distributor, LLC received $2,753 from the sale of Class A shares.
Shareholder servicing fees
The Trust has entered into contracts with one or more shareholder servicing agents, whereby Class A, Class C, Administrator Class, and Investor Class of the Fund is charged a fee at an annual rate of 0.25% of the average daily net assets of each respective class.
A portion of these total shareholder servicing fees were paid to affiliates of Wells Fargo.
5. INVESTMENT PORTFOLIO TRANSACTIONS
Purchases and sales of investments, excluding U.S. government obligations (if any) and short-term securities, for the six months ended April 30, 2014 were $109,237,399 and $123,028,618, respectively.
6. DERIVATIVE TRANSACTIONS
During the six months ended April 30, 2014, the Fund entered into forward foreign currency contracts for economic hedging purposes.
As of April 30, 2014, the Fund did not have any open forward foreign currency contracts. The Fund had average contract amounts of $1,348 and $1,348 in forward foreign currency contracts to buy and forward foreign currency contracts to sell, respectively, during the six months ended April 30, 2014.
The fair value, realized gains or losses and change in unrealized gains or losses, if any, on derivative instruments are reflected in the appropriate financial statements.
7. BANK BORROWINGS
The Trust (excluding the money market funds and certain other funds in the Trust) and Wells Fargo Variable Trust are parties to a $150,000,000 revolving credit agreement with State Street Bank and Trust Company, whereby the Fund is
| | | | | | |
| Notes to financial statements (unaudited) | | Wells Fargo Advantage Asia Pacific Fund | | | 25 | |
permitted to use bank borrowings for temporary or emergency purposes, such as to fund shareholder redemption requests. Interest under the credit agreement is charged to the Fund based on a borrowing rate equal to the higher of the Federal Funds rate in effect on that day plus 1.25% or the overnight LIBOR rate in effect on that day plus 1.25%. In addition, an annual commitment fee equal to 0.10% of the unused balance is allocated to each participating fund. For the six months ended April 30, 2014, the Fund paid $92 in commitment fees.
For the six months ended April 30, 2014, there were no borrowings by the Fund under the agreement.
8. CONCENTRATION RISK
Concentration risks result from exposure to a limited number of sectors or geographic region. Funds that invest a substantial portion of their assets in any sector may be more affected by changes in that sector or geographic region than would be a fund whose investments are not heavily weighted in any sector or geographic region.
9. INDEMNIFICATION
Under the Trust’s organizational documents, the officers and Trustees are indemnified against certain liabilities that may arise out of performance of their duties to the Trust. Additionally, in the normal course of business, the Trust may enter into contracts with service providers that contain a variety of indemnification clauses. The Trust’s maximum exposure under these arrangements is dependent on future claims that may be made against the Fund and, therefore, cannot be estimated.
| | | | |
| 26 | | Wells Fargo Advantage Asia Pacific Fund | | Other information (unaudited) |
TAX INFORMATION
Pursuant to Section 853 of the Internal Revenue Code, the following amounts were designated as foreign taxes paid for the fiscal year ended October 31, 2013. These amounts may be less than the actual foreign taxes paid for financial statement purposes. Foreign taxes paid or withheld should be included in taxable income with an offsetting deduction from gross income or as a credit for taxes paid to foreign governments. None of the income was derived from ineligible foreign sources as defined under Section 901(j) of the Internal Revenue Code.
| | | | |
Creditable foreign taxes paid | | Per share amount | | Foreign income as % of ordinary income distributions |
| $311,635 | | $0.0192 | | 65.83% |
PROXY VOTING INFORMATION
A description of the policies and procedures that the Fund uses to determine how to vote proxies relating to portfolio securities is available without charge, upon request, by calling 1-800-222-8222, visiting our website at wellsfargoadvantagefunds.com, or visiting the SEC website at sec.gov. Information regarding how the Fund voted proxies relating to portfolio securities during the most recent 12-month period ended June 30 is available without charge on the Fund’s website at wellsfargoadvantagefunds.com or by visiting the SEC website at sec.gov.
PORTFOLIO HOLDINGS INFORMATION
The complete portfolio holdings for the Fund are publicly available on the Fund’s website (wellsfargoadvantagefunds.com) on a monthly, 30-day or more delayed basis. In addition, top ten holdings information for the Fund is publicly available on the Fund’s website on a monthly, seven-day or more delayed basis. The Fund files its complete schedule of portfolio holdings with the SEC for the first and third quarters of each fiscal year on Form N-Q, which is available without charge by visiting the SEC website at sec.gov. In addition, the Fund’s Form N-Q may be reviewed and copied at the SEC’s Public Reference Room in Washington, DC, and at regional offices in New York City, at 233 Broadway, and in Chicago, at 175 West Jackson Boulevard, Suite 900. Information about the Public Reference Room may be obtained by calling 1-800-SEC-0330.
| | | | | | |
| Other information (unaudited) | | Wells Fargo Advantage Asia Pacific Fund | | | 27 | |
BOARD OF TRUSTEES AND OFFICERS
Each of the Trustees and Officers1 listed in the table below acts in identical capacities for each fund in the Wells Fargo Advantage family of funds, which consists of 132 mutual funds comprising the Wells Fargo Funds Trust, Wells Fargo Variable Trust, Wells Fargo Master Trust and four closed-end funds (collectively the “Fund Complex”). This table should be read in conjunction with the Prospectus and the Statement of Additional Information2. All of the Trustees are also Members of the Audit and Governance Committees of each Trust in the Fund Complex. The mailing address of each Trustee and Officer is 525 Market Street, 12th Floor, San Francisco, CA 94105. Each Trustee and Officer serves an indefinite term, however, each Trustee serves such term until reaching the mandatory retirement age established by the Trustees.
Independent Trustees
| | | | | | |
Name and year of birth | | Position held and length of service* | | Principal occupations during past five years | | Other directorships during
past five years |
Peter G. Gordon
(Born 1942) | | Trustee, since 1998; Chairman, since 2005 | | Co-Founder, Retired Chairman, President and CEO of Crystal Geyser Water Company. Trustee Emeritus, Colby College. | | Asset Allocation Trust |
Isaiah Harris, Jr.
(Born 1952) | | Trustee, since 2009 | | Retired. Prior thereto, President and CEO of BellSouth Advertising and Publishing Corp. from 2005 to 2007, President and CEO of BellSouth Enterprises from 2004 to 2005 and President of BellSouth Consumer Services from 2000 to 2003. Emeritus member of the Iowa State University Foundation Board of Governors. Emeritus Member of the Advisory Board of Iowa State University School of Business. Advisory Board Member, Palm Harbor Academy (charter school). Mr. Harris is a certified public accountant. | | CIGNA Corporation; Deluxe Corporation; Asset Allocation Trust |
Judith M. Johnson
(Born 1949) | | Trustee, since 2008;
Audit Committee Chairman, since 2008 | | Retired. Prior thereto, Chief Executive Officer and Chief Investment Officer of Minneapolis Employees Retirement Fund from 1996 to 2008. Ms. Johnson is an attorney, certified public accountant and a certified managerial accountant. | | Asset Allocation Trust |
Leroy Keith, Jr.
(Born 1939) | | Trustee, since 2010 | | Chairman, Bloc Global Services (development and construction). Trustee of the Evergreen Funds from 1983 to 2010. Former Managing Director, Almanac Capital Management (commodities firm), former Partner, Stonington Partners, Inc. (private equity fund), former Director, Obagi Medical Products Co. and former Director, Lincoln Educational Services. | | Trustee, Virtus Fund Complex (consisting of 50 portfolios as of 12/16/2013); Asset Allocation Trust |
David F. Larcker
(Born 1950) | | Trustee, since 2009 | | James Irvin Miller Professor of Accounting at the Graduate School of Business, Stanford University, Morgan Stanley Director of the Center for Leadership Development and Research and Senior Faculty of The Rock Center for Corporate Governance since 2006. From 2005 to 2008, Professor of Accounting at the Graduate School of Business, Stanford University. Prior thereto, Ernst & Young Professor of Accounting at The Wharton School, University of Pennsylvania from 1985 to 2005. | | Asset Allocation Trust |
Olivia S. Mitchell
(Born 1953) | | Trustee, since 2006 | | International Foundation of Employee Benefit Plans Professor, Wharton School of the University of Pennsylvania since 1993. Director of Wharton’s Pension Research Council and Boettner Center on Pensions & Retirement Research, and Research Associate at the National Bureau of Economic Research. Previously, Cornell University Professor from 1978 to 1993. | | Asset Allocation Trust |
Timothy J. Penny
(Born 1951) | | Trustee, since 1996 | | President and CEO of Southern Minnesota Initiative Foundation, a non-profit organization, since 2007 and Senior Fellow at the Humphrey Institute Policy Forum at the University of Minnesota since 1995. Member of the Board of Trustees of NorthStar Education Finance, Inc., a non-profit organization, since 2007. | | Asset Allocation Trust |
| | | | |
| 28 | | Wells Fargo Advantage Asia Pacific Fund | | Other information (unaudited) |
| | | | | | |
Name and year of birth | | Position held and length of service* | | Principal occupations during past five years | | Other directorships during
past five years |
Michael S. Scofield
(Born 1943) | | Trustee, since 2010 | | Served on the Investment Company Institute’s Board of Governors and Executive Committee from 2008-2011 as well the Governing Council of the Independent Directors Council from 2006-2011 and the Independent Directors Council Executive Committee from 2008-2011. Chairman of the IDC from 2008-2010. Institutional Investor (Fund Directions) Trustee of Year in 2007. Trustee of the Evergreen Funds (and its predecessors) from 1984 to 2010. Chairman of the Evergreen Funds from 2000-2010. Former Trustee of the Mentor Funds. Retired Attorney, Law Offices of Michael S. Scofield. | | Asset Allocation Trust |
Donald C. Willeke
(Born 1940) | | Trustee, since 1996 | | Principal of the law firm of Willeke & Daniels. General Counsel of the Minneapolis Employees Retirement Fund from 1984 until its consolidation into the Minnesota Public Employees Retirement Association on June 30, 2010. Director and Vice Chair of The Tree Trust (non-profit corporation). Director of the American Chestnut Foundation (non-profit corporation). | | Asset Allocation Trust |
| * | Length of service dates reflect the Trustee’s commencement of service with the Trust’s predecessor entities, where applicable. |
Officers
| | | | | | |
Name and year of birth | | Position held and
length of service | | Principal occupations during past five years | | |
Karla M. Rabusch
(Born 1959) | | President, since 2003 | | Executive Vice President of Wells Fargo Bank, N.A. and President of Wells Fargo Funds Management, LLC since 2003. | | |
Jeremy DePalma1
(Born 1974) | | Treasurer, since 2012 | | Senior Vice President of Wells Fargo Funds Management, LLC since 2009. Senior Vice President of Evergreen Investment Management Company, LLC from 2008 to 2010. Vice President, Evergreen Investment Services, Inc. from 2004 to 2007. Head of the Fund Reporting and Control Team within Fund Administration from 2005 to 2010. | | |
C. David Messman
(Born 1960) | | Secretary, since 2000; Chief Legal Officer, since 2003 | | Senior Vice President and Secretary of Wells Fargo Funds Management, LLC since 2001. Vice President and Managing Counsel of Wells Fargo Bank, N.A. since 1996. | | |
Debra Ann Early
(Born 1964) | | Chief Compliance Officer, since 2007 | | Chief Compliance Officer of Wells Fargo Funds Management, LLC since 2007. Chief Compliance Officer of Parnassus Investments from 2005 to 2007. Chief Financial Officer of Parnassus Investments from 2004 to 2007. | | |
David Berardi
(Born 1975) | | Assistant Treasurer, since 2009 | | Vice President of Wells Fargo Funds Management, LLC since 2009. Vice President of Evergreen Investment Management Company, LLC from 2008 to 2010. Assistant Vice President of Evergreen Investment Services, Inc. from 2004 to 2008. Manager of Fund Reporting and Control for Evergreen Investment Management Company, LLC from 2004 to 2010. | | |
| 1. | Jeremy DePalma acts as Treasurer of 59 funds and Assistant Treasurer of 73 funds in the Fund Complex. |
| 2. | The Statement of Additional Information includes additional information about the Trustees and is available, without charge, upon request, by calling 1-800-222-8222 or by visiting the website at wellsfargoadvantagefunds.com. |
| | | | | | |
| Other information (unaudited) | | Wells Fargo Advantage Asia Pacific Fund | | | 29 | |
BOARD CONSIDERATION OF INVESTMENT ADVISORY AND SUB-ADVISORY AGREEMENTS:
Under Section 15 of the Investment Company Act of 1940 (the “1940 Act”), the Board of Trustees (the “Board”) of Wells Fargo Funds Trust (the “Trust”), all the members of which have no direct or indirect interest in the investment advisory and sub-advisory agreements and are not “interested persons” of the Trust, as defined in the 1940 Act (the “Independent Trustees”), must determine whether to approve the continuation of the Trust’s investment advisory and sub-advisory agreements. In this regard, at an in-person meeting held on March 27-28, 2014 (the “Meeting”), the Board reviewed: (i) an investment advisory agreement with Wells Fargo Funds Management, LLC (“Funds Management”) for Wells Fargo Advantage Asia Pacific Fund (the “Fund”), (ii) an investment sub-advisory agreement with Wells Capital Management Incorporated (“WellsCap”), an affiliate of Funds Management, for the Fund and (iii) an investment sub-advisory agreement with Wells Capital Management Singapore (“WellsCap Singapore”), an affiliate of Funds Management, for the Fund. The investment advisory agreement with Funds Management and the investment sub-advisory agreements with WellsCap and WellsCap Singapore (the “Sub-Advisers”) are collectively referred to as the “Advisory Agreements.”
At the Meeting, the Board considered the factors and reached the conclusions described below relating to the selection of Funds Management and the Sub-Advisers and the continuation of the Advisory Agreements. Prior to the Meeting, the Trustees conferred extensively among themselves and with representatives of Funds Management about these matters. Also, the Board has adopted a team-based approach, with each team consisting of a sub-set of Trustees, to assist the full Board in the discharge of its duties in reviewing performance and other matters throughout the year. The Independent Trustees were assisted in their evaluation of the Advisory Agreements by independent legal counsel, from whom they received separate legal advice and with whom they met separately.
In providing information to the Board, Funds Management and the Sub-Advisers were guided by a detailed set of requests for information submitted to them by independent legal counsel on behalf of the Independent Trustees at the start of the Board’s annual contract renewal process earlier in 2014. In considering and approving the Advisory Agreements, the Trustees considered the information they believed relevant, including but not limited to the information discussed below. The Board considered not only the specific information presented in connection with the Meeting, but also the knowledge gained over time through interaction with Funds Management and the Sub-Advisers about various topics. In this regard, the Board reviewed reports of Funds Management at each of its quarterly meetings, which included, among other things, portfolio reviews and performance reports. In addition, the Board and the teams mentioned above confer with portfolio managers at various times throughout the year. The Board did not identify any particular information or consideration that was all-important or controlling, and each individual Trustee may have attributed different weights to various factors.
After its deliberations, the Board unanimously approved the continuation of the Advisory Agreements and determined that the compensation payable to Funds Management and the Sub-Advisers is reasonable. The Board considered the continuation of the Advisory Agreements for the Fund as part of its consideration of the continuation of advisory agreements for funds across the complex, but its approvals were made on a fund-by-fund basis. The following summarizes a number of important, but not necessarily all, factors considered by the Board in support of its approvals.
Nature, extent and quality of services
The Board received and considered various information regarding the nature, extent and quality of services provided to the Fund by Funds Management and the Sub-Advisers under the Advisory Agreements. This information included, among other things, a summary of the background and experience of senior management of Funds Management, and the qualifications, background, tenure and responsibilities of each of the portfolio managers primarily responsible for the day-to-day portfolio management of the Fund.
The Board evaluated the ability of Funds Management and the Sub-Advisers to attract and retain qualified investment professionals, including research, advisory and supervisory personnel. The Board further considered the compliance programs and compliance records of Funds Management and the Sub-Advisers. In addition, the Board took into account the full range of services provided to the Fund by Funds Management and its affiliates.
Fund performance and expenses
The Board considered the performance results for the Fund over various time periods ended December 31, 2013. The Board also considered these results in comparison to the performance of funds in a universe that was determined by Lipper Inc. (“Lipper”) to be similar to the Fund (the “Universe”), and in comparison to the Fund’s benchmark index and to other comparative data. Lipper is an independent provider of investment company data. The Board received a description of the methodology used by Lipper to select the mutual funds in the performance Universe. The Board noted that the performance of the Fund (Class A) was higher than or in range of the average performance of the Universe for all periods. The Board also noted that the performance of the Fund was higher than its benchmark, the MSCI All Country Asia Pacific Index (Net), for all periods under review.
| | | | |
| 30 | | Wells Fargo Advantage Asia Pacific Fund | | Other information (unaudited) |
The Board also received and considered information regarding the Fund’s net operating expense ratios and their various components, including actual management fees (which reflect fee waivers, if any, and include advisory, administration and transfer agent fees), custodian and other non-management fees, Rule 12b-1 and non-Rule 12b-1 service fees and fee waiver and expense reimbursement arrangements. The Board considered these ratios in comparison to the median ratios of funds in class-specific expense groups that were determined by Lipper to be similar to the Fund (the “Groups”). The Board received a description of the methodology used by Lipper to select the mutual funds in the expense Groups and an explanation of year-to-year variations in the funds comprising such expense Groups and their expense ratios. Based on the Lipper reports, the Board noted that the net operating expense ratios of the Fund were lower than or in range of the median net operating expense ratios of the expense Groups.
Based on its consideration of the factors and information it deemed relevant, including those described here, the Board concluded that the overall performance and expense structure of the Fund supported the re-approval of the Advisory Agreements.
Investment advisory and sub-advisory fee rates
The Board reviewed and considered the contractual investment advisory fee rates that are payable by the Fund to Funds Management for investment advisory services (the “Advisory Agreement Rates”), both on a stand-alone basis and on a combined basis with the Fund’s fund-level and class-level contractual administration fee rates (the “Management Rates”). The Board noted that the administration fees payable to Funds Management include transfer agency and sub-transfer agency costs. The Board also reviewed and considered the contractual investment sub-advisory fee rates that are payable by Funds Management to WellsCap and by WellsCap to WellsCap Singapore for investment sub-advisory services (the “Sub-Advisory Agreement Rates”).
Among other information reviewed by the Board was a comparison of the Management Rates of the Fund with those of other funds in the expense Groups at a common asset level. The Board noted that the Management Rates of the Fund were in range of the average rates for the Fund’s expense Groups for all share classes except Investor Class, the Management Rate of which was higher than the average rate of its expense Groups. The Board noted, however, that the net operating expense ratio of the Fund’s Investor Class was in range of the median net operating expense ratio its expense Group.
The Board also received and considered information about the portion of the total advisory fee that was retained by Funds Management after payment of the fee to the Sub-Advisers for sub-advisory services. In assessing the reasonableness of this amount, the Board received and evaluated information about the nature and extent of responsibilities retained and risks assumed by Funds Management and not delegated to or assumed by the Sub-Advisers, and about Funds Management’s on-going oversight services. However, given the affiliation between Funds Management and the Sub-Advisers, the Board ascribed limited relevance to the allocation of the advisory fee between them.
The Board also received and considered information about the nature and extent of services offered and fee rates charged by Funds Management and the Sub-Advisers to other types of clients with investment strategies similar to those of the Fund. In this regard, the Board received information about the significantly greater scope of services, and compliance, reporting and other legal burdens and risks of managing mutual funds compared with those associated with managing assets of non-mutual fund clients such as collective funds or institutional separate accounts.
Based on its consideration of the factors and information it deemed relevant, including those described here, the Board determined that the Advisory Agreement Rates and the Sub-Advisory Agreement Rates were reasonable in light of the services covered by the Advisory Agreements.
Profitability
The Board received and considered information concerning the profitability of Funds Management, as well as the profitability of Wells Fargo as a whole, from providing services to the Fund and the fund family as a whole. The Board did not receive or consider to be necessary separate profitability information with respect to the Sub-Advisers, because their profitability information was subsumed in the collective Wells Fargo profitability analysis.
Funds Management explained the methodologies and estimates that it used in calculating profitability. Among other things, the Board noted that the levels of profitability reported on a fund-by-fund basis varied widely, depending on factors such as the size and type of fund. Based on its review, the Board did not deem the profits reported by Funds Management to be at a level that would prevent it from approving the continuation of the Advisory Agreements.
| | | | | | |
| Other information (unaudited) | | Wells Fargo Advantage Asia Pacific Fund | | | 31 | |
Economies of scale
With respect to possible economies of scale, the Board noted the existence of breakpoints in the Fund’s advisory fee and administration fee structure, which operate generally to reduce the Fund’s expense ratios as the Fund grows in size. It considered that, for a small fund or a fund that shrinks in size, breakpoints conversely can result in higher fee levels. The Board also considered that fee waiver and expense reimbursement arrangements and competitive fee rates at the outset are means of sharing potential economies of scale with shareholders of the Fund and the fund family as a whole. The Board considered Funds Management’s view that any analyses of potential economies of scale in managing a particular fund are inherently limited in light of the joint and common costs and investments that Funds Management incurs across the fund family as a whole.
The Board concluded that the Fund’s fee and expense arrangements, including contractual breakpoints, constituted a reasonable approach to sharing potential economies of scale with the Fund and its shareholders.
Other benefits to Funds Management and the Sub-Advisers
The Board received and considered information regarding potential “fall-out” or ancillary benefits received by Funds Management and its affiliates, including the Sub-Advisers, as a result of their relationships with the Fund. Ancillary benefits could include, among others, benefits directly attributable to other relationships with the Fund and benefits potentially derived from an increase in Funds Management’s and the Sub-Advisers’ business as a result of their relationships with the Fund. The Board noted that various affiliates of Funds Management may receive distribution-related fees, shareholder servicing payments and sub-transfer agency fees in respect of shares sold or held through them and services provided.
The Board also reviewed information about soft dollar credits earned and utilized by the Sub-Advisers, fees earned by Funds Management and the Sub-Advisers from managing a private investment vehicle for the fund family’s securities lending collateral and commissions earned by an affiliated broker from portfolio transactions.
Based on its consideration of the factors and information it deemed relevant, including those described here, the Board did not find that any ancillary benefits received by Funds Management and its affiliates, including the Sub-Advisers, were unreasonable.
Conclusion
After considering the above-described factors and based on its deliberations and its evaluation of the information described above, the Board unanimously approved the continuation of the Advisory Agreements for an additional one-year period and determined that the compensation payable to Funds Management and the Sub-Advisers is reasonable.
| | | | |
| 32 | | Wells Fargo Advantage Asia Pacific Fund | | List of abbreviations |
The following is a list of common abbreviations for terms and entities that may have appeared in this report.
| ACA | — ACA Financial Guaranty Corporation |
| ADR | — American depositary receipt |
| ADS | — American depositary shares |
| AGC | — Assured Guaranty Corporation |
| AGM | — Assured Guaranty Municipal |
| Ambac | — Ambac Financial Group Incorporated |
| AMT | — Alternative minimum tax |
| BAN | — Bond anticipation notes |
| BHAC | — Berkshire Hathaway Assurance Corporation |
| CAB | — Capital appreciation bond |
| CCAB | — Convertible capital appreciation bond |
| CDA | — Community Development Authority |
| CDO | — Collateralized debt obligation |
| DRIVER | — Derivative inverse tax-exempt receipts |
| DW&P | — Department of Water & Power |
| DWR | — Department of Water Resources |
| ECFA | — Educational & Cultural Facilities Authority |
| EDA | — Economic Development Authority |
| EDFA | — Economic Development Finance Authority |
| ETF | — Exchange-traded fund |
| FDIC | — Federal Deposit Insurance Corporation |
| FFCB | — Federal Farm Credit Banks |
| FGIC | — Financial Guaranty Insurance Corporation |
| FHA | — Federal Housing Administration |
| FHLB | — Federal Home Loan Bank |
| FHLMC | — Federal Home Loan Mortgage Corporation |
| FICO | — The Financing Corporation |
| FNMA | — Federal National Mortgage Association |
| GDR | — Global depositary receipt |
| GNMA | — Government National Mortgage Association |
| HCFR | — Healthcare facilities revenue |
| HEFA | — Health & Educational Facilities Authority |
| HEFAR | — Higher education facilities authority revenue |
| HFA | — Housing Finance Authority |
| HFFA | — Health Facilities Financing Authority |
| HUD | — Department of Housing and Urban Development |
| IDA | — Industrial Development Authority |
| IDAG | — Industrial Development Agency |
| KRW | — Republic of Korea won |
| LIBOR | — London Interbank Offered Rate |
| LLC | — Limited liability company |
| LLLP | — Limited liability limited partnership |
| LLP | — Limited liability partnership |
| MBIA | — Municipal Bond Insurance Association |
| MFHR | — Multifamily housing revenue |
| MSTR | — Municipal securities trust receipts |
| MUD | — Municipal Utility District |
| National | — National Public Finance Guarantee Corporation |
| PCFA | — Pollution Control Financing Authority |
| PCL | — Public Company Limited |
| PCR | — Pollution control revenue |
| PFA | — Public Finance Authority |
| PFFA | — Public Facilities Financing Authority |
| PFOTER | — Puttable floating option tax-exempt receipts |
| plc | — Public limited company |
| PUTTER | — Puttable tax-exempt receipts |
| R&D | — Research & development |
| Radian | — Radian Asset Assurance |
| RAN | — Revenue anticipation notes |
| RDA | — Redevelopment Authority |
| RDFA | — Redevelopment Finance Authority |
| REIT | — Real estate investment trust |
| ROC | — Reset option certificates |
| SAVRS | — Select auction variable rate securities |
| SBA | — Small Business Authority |
| SFHR | — Single-family housing revenue |
| SFMR | — Single-family mortgage revenue |
| SPA | — Standby purchase agreement |
| SPDR | — Standard & Poor’s Depositary Receipts |
| STRIPS | — Separate trading of registered interest and principal securities |
| TAN | — Tax anticipation notes |
| TIPS | — Treasury inflation-protected securities |
| TRAN | — Tax revenue anticipation notes |
| TTFA | — Transportation Trust Fund Authority |
| TVA | — Tennessee Valley Authority |


For more information
More information about Wells Fargo Advantage Funds is available free upon request. To obtain literature, please write, email, visit the Fund’s website, or call:
Wells Fargo Advantage Funds
P.O. Box 8266
Boston, MA 02266-8266
Email: wfaf@wellsfargo.com
Website: wellsfargoadvantagefunds.com
Individual investors: 1-800-222-8222
Retail investment professionals: 1-888-877-9275
Institutional investment professionals: 1-866-765-0778
This report and the financial statements contained herein are submitted for the general information of the shareholders of Wells Fargo Advantage Funds. If this report is used for promotional purposes, distribution of the report must be accompanied or preceded by a current prospectus. Before investing, please consider the investment objectives, risks, charges, and expenses of the investment. For a current prospectus and, if available, a summary prospectus, containing this information, call 1-800-222-8222 or visit the Fund’s website at wellsfargoadvantagefunds.com. Read the prospectus carefully before you invest or send money.
Wells Fargo Funds Management, LLC, a wholly owned subsidiary of Wells Fargo & Company, provides investment advisory and administrative services for Wells Fargo Advantage Funds. Other affiliates of Wells Fargo & Company provide subadvisory and other services for the Funds. The Funds are distributed by Wells Fargo Funds Distributor, LLC, Member FINRA/SIPC, an affiliate of Wells Fargo & Company.
NOT FDIC INSURED ¡ NO BANK GUARANTEE ¡ MAY LOSE VALUE
© 2014 Wells Fargo Funds Management, LLC. All rights reserved.
| | |
 | | 225165 06-14 SA236/SAR236 04-14 |

Wells Fargo Advantage
Diversified International Fund

Semi-Annual Report
April 30, 2014

Reduce clutter. Save trees.
Sign up for electronic delivery of prospectuses and shareholder reports at wellsfargo.com/advantagedelivery
Contents
The views expressed and any forward-looking statements are as of April 30, 2014, unless otherwise noted, and are those of the Fund managers and/or Wells Fargo Funds Management, LLC. Discussions of individual securities, or the markets generally, or any Wells Fargo Advantage Fund are not intended as individual recommendations. Future events or results may vary significantly from those expressed in any forward-looking statements; the views expressed are subject to change at any time in response to changing circumstances in the market. Wells Fargo Funds Management, LLC and the Fund disclaim any obligation to publicly update or revise any views expressed or forward-looking statements.
NOT FDIC INSURED ¡ NO BANK GUARANTEE ¡ MAY LOSE VALUE
| | | | |
| 2 | | Wells Fargo Advantage Diversified International Fund | | Letter to shareholders (unaudited) |

Karla M. Rabusch
President
Wells Fargo Advantage Funds
European markets continued to benefit from the European Central Bank’s (ECB’s) willingness to maintain low interest rates.
Some of the markets that had declined the most during the European debt crisis—such as Italy and Ireland—benefited the most from this stable economic environment, but larger markets such as France and Germany also posted gains.
Dear Valued Shareholder:
We are pleased to offer you this semi-annual report for the Wells Fargo Advantage Diversified International Fund for the six-month period that ended April 30, 2014. The period was marked by growing concern about an economic slowdown in China and heightened geopolitical uncertainty as the U.S. and Europe confronted Russia over Ukraine. The environment created a headwind for many emerging markets, even as continued economic recovery in Europe helped most developed stock markets end the period with gains.
Major central banks continued to provide stimulus.
Major central banks continued to inject liquidity into global banks and markets through various quantitative easing policies. The U.S. Federal Reserve (Fed) remained a major source of liquidity for market participants around the world. Throughout the reporting period, the Federal Open Market Committee (FOMC)—the Fed’s monetary policymaking body—kept its key interest rate near zero in order to support the economy and the financial system. At the beginning of the reporting period, the FOMC was still making open-ended purchases of $40 billion per month in mortgage-backed securities to support the housing market and was purchasing $45 billion per month in long-term U.S. Treasuries. However, in mid-December 2013, the FOMC announced that it would reduce (or taper) its bond-buying program by $10 billion per month beginning in January 2014. Although the tapering was less aggressive than some investors had feared, the removal of liquidity sparked a sell-off in emerging markets stocks and currencies as investors sold higher-risk assets.
European markets continued to benefit from the European Central Bank’s (ECB’s) willingness to maintain low interest rates. In November 2013, the ECB cut its key rate to a historic low of 0.25%. The ECB’s actions helped support moderate year-over-year gross domestic product (GDP) growth in the eurozone.
Most developed regions gained, but emerging and developed Asian markets lagged.
For the six-month period, the MSCI EAFE Index (Net)1, a proxy for developed markets, returned 4.44%, while the MSCI Emerging Markets Index (Net)2 returned -2.98%.
In Europe, economic data continued to show moderate growth, with reported GDP for the 28 countries in the European Union rising by 0.4% in the fourth quarter of 2013 compared with the previous quarter. The unemployment rate remained high but stable at 10.5% in February and March 2014, while inflation remained consistently below a 1% annual rate. Some of the markets that had declined the most during the European debt crisis—such as Italy and Ireland—benefited the most from this stable economic environment, but larger markets such as France and Germany also posted gains. The ongoing turmoil in Ukraine did result in some stock market volatility, but as of the end of the reporting period, most investors believed that it would not result in war.
Asian markets posted mixed results, with political issues accounting for many of those differences. In countries such as India and Indonesia, investors were
| 1. | The Morgan Stanley Capital International Europe, Australasia, and Far East (MSCI EAFE) Index (Net) is an unmanaged group of securities widely regarded by investors to be representations of the stock markets of Europe, Australasia, and the Far East. Calculations for EAFE use net dividends, which reflect the deduction of withholding taxes. You cannot invest directly in an index. Source: MSCI. MSCI makes no express or implied warranties or representations and shall have no liability whatsoever with respect to any MSCI data contained herein. The MSCI data may not be further redistributed or used as a basis for other indexes or any securities or financial products. This report is not approved, reviewed, or produced by MSCI. |
| 2. | The Morgan Stanley Capital International (MSCI) Emerging Markets Index (Net) is a free float-adjusted market-capitalization-weighted index designed to measure the equity market performance in the global emerging markets. The index is currently composed of 21 emerging markets country indexes. You cannot invest directly in an index. |
| | | | | | |
| Letter to shareholders (unaudited) | | Wells Fargo Advantage Diversified International Fund | | | 3 | |
optimistic that upcoming elections might sweep in more reform-minded governments. By contrast, in Japan, the honeymoon for Prime Minister Shinzō Abe appeared to be ending, with investors worrying that his reforms were not taking effect as quickly as originally hoped.
As for China, many of the country’s economic numbers—such as for national production, retail sales, fixed investment, and manufacturing activity—came in below analyst expectations, causing investor concern. In addition, China’s government has allowed a growing number of defaults in the country’s financial system as part of a long-term plan to rein in credit growth.
Don’t let short-term uncertainty derail long-term investment goals.
Periods of uncertainty can present challenges, but experience has taught us that maintaining long-term investment goals can be an effective way to plan for the future. To help you create a sound strategy based on your personal goals and risk tolerance, Wells Fargo Advantage Funds offers more than 100 mutual funds spanning a wide range of asset classes and investment styles. Although diversification cannot guarantee an investment profit or prevent losses, we believe it can be an effective way to manage investment risk and potentially smooth out overall portfolio performance. We encourage investors to know their investments and to understand that appropriate levels of risk-taking may unlock opportunities.
Thank you for choosing to invest with Wells Fargo Advantage Funds. We appreciate your confidence in us and remain committed to helping you meet your financial needs. For current information about your fund investments, contact your investment professional, visit our website at wellsfargoadvantagefunds.com, or call us directly at 1-800-222-8222. We are available 24 hours a day, 7 days a week.
Sincerely,

Karla M. Rabusch
President
Wells Fargo Advantage Funds
Notice to shareholders
The Fund and Wells Fargo Funds Management, LLC (“Funds Management”) have received an exemptive order from the SEC that permits Funds Management, subject to the approval of the Board of Trustees of the Fund, to select or replace certain subadvisers to manage all or a portion of the Fund’s assets and enter into, amend or terminate a sub-advisory agreement with certain subadvisers without obtaining shareholder approval (“Multi-manager Structure”). The Multi-manager Structure applies to subadvisers that are not affiliated with Funds Management or the Fund, except to the extent that affiliation arises solely because such subadvisers provide sub-advisory services to the Fund (“Non-affiliated Subadvisers”), as well as subadvisers that are indirect or direct wholly-owned subsidiaries of Funds Management or of another company that, indirectly or directly, wholly owns Funds Management (“Wholly-owned Subadvisers”).
Pursuant to the SEC order, Funds Management, with the approval of the Board of Trustees, has the discretion to terminate any subadvisers and allocate and reallocate the Fund’s assets among any other Non-affiliated Subadvisers or Wholly-owned Subadvisers. Funds Management, subject to oversight and supervision by the Board of Trustees, has responsibility to continue to oversee any subadvisers to the Fund and to recommend, for approval by the Board of Trustees, the hiring, termination and replacement of subadvisers for the Fund. In the event that a new subadviser is hired pursuant to the Multi-manager Structure, the Fund is required to provide notice to shareholders within 90 days.
Please contact your investment professional or call us directly at 1-800-222-8222 if you have any questions on this Notice to Shareholders.
| | | | |
| 4 | | Wells Fargo Advantage Diversified International Fund | | Performance highlights (unaudited) |
Investment objective
The Fund seeks long-term capital appreciation.
Adviser
Wells Fargo Funds Management, LLC
Subadvisers
Artisan Partners Limited Partnership
LSV Asset Management
Wells Capital Management Incorporated
Portfolio managers
Mark L. Yockey, CFA
Josef Lakonishok
Puneet Mansharamani, CFA
Menno Vermeulen, CFA
Jeffrey Everett, CFA
Dale Winner, CFA
Average annual total returns1 (%) as of April 30, 2014
| | | | | | | | | | | | | | | | | | | | | | | | | | | | | | | | | | |
| | | | | Including sales charge | | | Excluding sales charge | | | Expense ratios2 (%) | |
| | | Inception date | | 1 year | | | 5 year | | | 10 year | | | 1 year | | | 5 year | | | 10 year | | | Gross | | | Net3 | |
| Class A (SILAX) | | 9-24-1997 | | | 5.09 | | | | 12.23 | | | | 4.92 | | | | 11.48 | | | | 13.55 | | | | 5.54 | | | | 1.93 | | | | 1.42 | |
| Class B (SILBX)* | | 9-24-1997 | | | 5.58 | | | | 12.48 | | | | 5.00 | | | | 10.58 | | | | 12.73 | | | | 5.00 | | | | 2.68 | | | | 2.17 | |
| Class C (WFECX) | | 4-1-1998 | | | 9.60 | | | | 12.77 | | | | 4.78 | | | | 10.60 | | | | 12.77 | | | | 4.78 | | | | 2.68 | | | | 2.17 | |
| Administrator Class (WFIEX) | | 11-8-1999 | | | – | | | | – | | | | – | | | | 11.65 | | | | 13.78 | | | | 5.77 | | | | 1.77 | | | | 1.26 | |
| Institutional Class (WFISX) | | 8-31-2006 | | | – | | | | – | | | | – | | | | 11.96 | | | | 13.96 | | | | 5.92 | | | | 1.50 | | | | 1.00 | |
| Investor Class (WIEVX) | | 7-18-2008 | | | – | | | | – | | | | – | | | | 11.38 | | | | 13.52 | | | | 5.52 | | | | 1.99 | | | | 1.47 | |
| MSCI EAFE® Index (Net)4 | | – | | | – | | | | – | | | | – | | | | 13.35 | | | | 13.58 | | | | 6.93 | | | | – | | | | – | |
| * | | Class B shares are closed to investment, except in connection with the reinvestment of any distributions and permitted exchanges. |
Figures quoted represent past performance, which is no guarantee of future results, and do not reflect taxes that a shareholder may pay on fund distributions or the redemption of fund shares. Investment return and principal value of an investment will fluctuate so that an investor’s shares, when redeemed, may be worth more or less than their original cost. Performance shown without sales charges would be lower if sales charges were reflected. Current performance may be lower or higher than the performance data quoted, which assumes the reinvestment of dividends and capital gains. Current month-end performance is available on the Fund’s website, wellsfargoadvantagefunds.com.
Index returns do not include transaction costs associated with buying and selling securities, any mutual fund fees or expenses, or any taxes. It is not possible to invest directly in an index.
For Class A shares, the maximum front-end sales charge is 5.75%. For Class B shares, the maximum contingent deferred sales charge is 5.00%. For Class C shares, the maximum contingent deferred sales charge is 1.00%. Performance including sales charge assumes the sales charge for the corresponding time period. Administrator Class, Institutional Class, and Investor Class shares are sold without a front-end sales charge or contingent deferred sales charge.
Stock values fluctuate in response to the activities of individual companies and general market and economic conditions. Foreign investments are especially volatile and can rise or fall dramatically due to differences in the political and economic conditions of the host country. These risks are generally intensified in emerging markets. The use of derivatives may reduce returns and/or increase volatility. Certain investment strategies tend to increase the total risk of an investment (relative to the broader market). The Fund is exposed to smaller-company securities risk. Consult the Fund’s prospectus for additional information on these and other risks.
Please see footnotes on page 5.
| | | | | | |
| Performance highlights (unaudited) | | Wells Fargo Advantage Diversified International Fund | | | 5 | |
| | | | |
| Ten largest equity holdings5 (%) as of April 30, 2014 | |
Bayer AG | | | 1.95 | |
BP plc | | | 1.41 | |
Roche Holdings AG | | | 1.31 | |
Linde AG | | | 1.30 | |
Baidu Incorporated | | | 1.30 | |
Zurich Financial Services AG | | | 1.26 | |
Toyota Motor Corporation | | | 1.25 | |
ENI SpA | | | 1.17 | |
Nestle SA | | | 1.07 | |
Rolls-Royce Holdings plc | | | 1.06 | |
|
| Sector distribution6 as of April 30, 2014 |
|
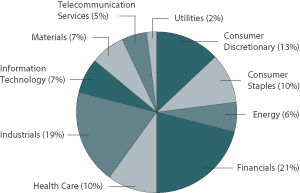 |
| 1. | Historical performance shown for Investor Class shares prior to their inception reflects the performance of Class A shares and has been adjusted to reflect the higher expenses applicable to Investor Class shares. Historical performance shown for Institutional Class shares prior to their inception reflects the performance of Administrator Class shares, and includes the higher expenses applicable to Administrator Class shares. If these expenses had not been included, returns would be higher. |
| 2. | Reflects the expense ratios as stated in the most recent prospectuses, which include the impact of 0.01% in acquired fund fees and expenses. The expense ratios shown are subject to change and may differ from the annualized expense ratios shown in the financial highlights of this report, which do not include acquired fund fees and expenses. |
| 3. | The Adviser has committed through February 28, 2015, to waive fees and/or reimburse expenses to the extent necessary to cap the Fund’s Total Annual Fund Operating Expenses After Fee Waiver, excluding certain expenses, at 1.41% for Class A, 2.16% for Class B, 2.16% for Class C, 1.25% for Administrator Class, 0.99% for Institutional Class, and 1.46% for Investor Class. Brokerage commissions, stamp duty fees, interest, taxes, acquired fund fees and expenses, and extraordinary expenses are excluded from the cap. Without this cap, the Fund’s returns would have been lower. |
| 4. | The Morgan Stanley Capital International Europe, Australasia, and Far East (MSCI EAFE) Index (Net) is an unmanaged group of securities widely regarded by investors to be representations of the stock markets of Europe, Australasia, and the Far East. Calculations for EAFE use net dividends, which reflect the deduction of withholding taxes. You cannot invest directly in an index. Source: MSCI. MSCI makes no express or implied warranties or representations and shall have no liability whatsoever with respect to any MSCI data contained herein. The MSCI data may not be further redistributed or used as a basis for other indexes or any securities or financial products. This report is not approved, reviewed, or produced by MSCI. |
| 5. | The ten largest equity holdings are calculated based on the value of the securities divided by total net assets of the Fund. Holdings are subject to change and may have changed since the date specified. Top holdings typically include the underlying ordinary shares combined with any depositary receipts. |
| 6. | Sector distribution is subject to change and is calculated based on the total long-term investments of the Fund. |
| | | | |
| 6 | | Wells Fargo Advantage Diversified International Fund | | Fund expenses (unaudited) |
As a shareholder of the Fund, you incur two types of costs: (1) transaction costs, including sales charges (loads) on purchase payments and contingent deferred sales charges (if any) on redemptions and (2) ongoing costs, including management fees, distribution (12b-1) and/or shareholder service fees, and other Fund expenses. This example is intended to help you understand your ongoing costs (in dollars) of investing in the Fund and to compare these costs with the ongoing costs of investing in other mutual funds.
The example is based on an investment of $1,000 invested at the beginning of the six-month period and held for the entire period from November 1, 2013 to April 30, 2014.
Actual expenses
The “Actual” line of the table below provides information about actual account values and actual expenses. You may use the information in this line, together with the amount you invested, to estimate the expenses that you paid over the period. Simply divide your account value by $1,000 (for example, an $8,600 account value divided by $1,000 = 8.6), then multiply the result by the number in the “Actual” line under the heading entitled “Expenses paid during period” for your applicable class of shares to estimate the expenses you paid on your account during this period.
Hypothetical example for comparison purposes
The “Hypothetical” line of the table below provides information about hypothetical account values and hypothetical expenses based on the Fund’s actual expense ratio and an assumed rate of return of 5% per year before expenses, which is not the Fund’s actual return. The hypothetical account values and expenses may not be used to estimate the actual ending account balance or expenses you paid for the period. You may use this information to compare the ongoing costs of investing in the Fund and other funds. To do so, compare this 5% hypothetical example with the 5% hypothetical examples that appear in the shareholder reports of the other funds.
Please note that the expenses shown in the table are meant to highlight your ongoing costs only and do not reflect any transactional costs, such as sales charges (loads) and contingent deferred sales charges. Therefore, the “Hypothetical” line of the table is useful in comparing ongoing costs only and will not help you determine the relative total costs of owning different funds. In addition, if these transactional costs were included, your costs would have been higher.
| | | | | | | | | | | | | | | | |
| | | Beginning
account value
11-1-2013 | | | Ending
account value
4-30-2014 | | | Expenses
paid during
the period¹ | | | Net annualized
expense ratio | |
Class A | | | | | | | | | | | | | | | | |
Actual | | $ | 1,000.00 | | | $ | 1,018.30 | | | $ | 7.06 | | | | 1.41 | % |
Hypothetical (5% return before expenses) | | $ | 1,000.00 | | | $ | 1,017.80 | | | $ | 7.05 | | | | 1.41 | % |
Class B | | | | | | | | | | | | | | | | |
Actual | | $ | 1,000.00 | | | $ | 1,014.15 | | | $ | 10.79 | | | | 2.16 | % |
Hypothetical (5% return before expenses) | | $ | 1,000.00 | | | $ | 1,014.08 | | | $ | 10.79 | | | | 2.16 | % |
Class C | | | | | | | | | | | | | | | | |
Actual | | $ | 1,000.00 | | | $ | 1,014.37 | | | $ | 10.79 | | | | 2.16 | % |
Hypothetical (5% return before expenses) | | $ | 1,000.00 | | | $ | 1,014.08 | | | $ | 10.79 | | | | 2.16 | % |
Administrator Class | | | | | | | | | | | | | | | | |
Actual | | $ | 1,000.00 | | | $ | 1,018.88 | | | $ | 6.26 | | | | 1.25 | % |
Hypothetical (5% return before expenses) | | $ | 1,000.00 | | | $ | 1,018.60 | | | $ | 6.26 | | | | 1.25 | % |
Institutional Class | | | | | | | | | | | | | | | | |
Actual | | $ | 1,000.00 | | | $ | 1,019.87 | | | $ | 4.96 | | | | 0.99 | % |
Hypothetical (5% return before expenses) | | $ | 1,000.00 | | | $ | 1,019.89 | | | $ | 4.96 | | | | 0.99 | % |
Investor Class | | | | | | | | | | | | | | | | |
Actual | | $ | 1,000.00 | | | $ | 1,017.91 | | | $ | 7.30 | | | | 1.46 | % |
Hypothetical (5% return before expenses) | | $ | 1,000.00 | | | $ | 1,017.55 | | | $ | 7.30 | | | | 1.46 | % |
| 1. | Expenses paid is equal to the annualized expense ratio of each class multiplied by the average account value over the period, multiplied by the number of days in the most recent fiscal half-year divided by the number of days in the fiscal year (to reflect the one-half-year period). |
| | | | | | |
| Portfolio of investments—April 30, 2014 (unaudited) | | Wells Fargo Advantage Diversified International Fund | | | 7 | |
| | | | | | | | | | | | |
| Security name | | | | | | Shares | | | Value | |
| | | | | | | | | | | | |
| | | | |
Common Stocks: 95.41% | | | | | | | | | | | | |
| | | | |
| Australia: 2.59% | | | | | | | | | | | | |
Arrium Limited (Materials, Metals & Mining) | | | | | | | 198,700 | | | $ | 219,665 | |
Bendigo Bank Limited (Financials, Banks) | | | | | | | 26,100 | | | | 279,082 | |
Challenger Financial Services Group Limited (Financials, Diversified Financial Services) | | | | | | | 46,700 | | | | 305,859 | |
Downer EDI Limited (Industrials, Commercial Services & Supplies) | | | | | | | 42,300 | | | | 196,091 | |
Fortescue Metals Group Limited (Materials, Metals & Mining) | | | | | | | 29,600 | | | | 138,867 | |
GrainCorp Limited (Consumer Staples, Food Products) | | | | | | | 18,900 | | | | 155,565 | |
Leighton Holdings Limited (Industrials, Construction & Engineering) | | | | | | | 7,100 | | | | 125,850 | |
Lend Lease Corporation Limited (Financials, Real Estate Management & Development) | | | | | | | 20,800 | | | | 250,236 | |
Metcash Limited (Consumer Staples, Food & Staples Retailing) | | | | | | | 28,500 | | | | 73,605 | |
Mineral Resources Limited (Materials, Metals & Mining) | | | | | | | 14,900 | | | | 160,845 | |
Primary Health Care Limited (Health Care, Health Care Providers & Services) | | | | | | | 34,700 | | | | 151,188 | |
Seven Network Limited (Industrials, Trading Companies & Distributors) | | | | | | | 15,300 | | | | 116,552 | |
Toll Holdings Limited (Industrials, Air Freight & Logistics) | | | | | | | 26,100 | | | | 128,266 | |
United Construction Group Limited (Industrials, Construction & Engineering) | | | | | | | 14,100 | | | | 88,418 | |
| | | | |
| | | | | | | | | | | 2,390,089 | |
| | | | | | | | | | | | |
| | | | |
| Austria: 0.44% | | | | | | | | | | | | |
OMV AG (Energy, Oil, Gas & Consumable Fuels) | | | | | | | 5,300 | | | | 247,905 | |
Voestalpine AG (Materials, Metals & Mining) | | | | | | | 3,400 | | | | 155,189 | |
| | | | |
| | | | | | | | | | | 403,094 | |
| | | | | | | | | | | | |
| | | | |
| Belgium: 1.79% | | | | | | | | | | | | |
Anheuser-Busch InBev NV (Consumer Staples, Beverages) | | | | | | | 7,220 | | | | 785,707 | |
Delhaize Group SA (Consumer Staples, Food & Staples Retailing) | | | | | | | 3,600 | | | | 267,403 | |
Telenet Group Holding NV (Consumer Discretionary, Media) | | | | | | | 4,435 | | | | 259,929 | |
UCB SA (Health Care, Pharmaceuticals) « | | | | | | | 4,190 | | | | 343,490 | |
| | | | |
| | | | | | | | | | | 1,656,529 | |
| | | | | | | | | | | | |
| | | | |
| Brazil: 0.41% | | | | | | | | | | | | |
Banco do Brasil SA (Financials, Banks) | | | | | | | 12,100 | | | | 127,037 | |
Companhia de Saneamento Basico do Estado de Sao Paulo (Utilities, Water Utilities) | | | | | | | 17,700 | | | | 167,653 | |
Companhia de Saneamento de Minas Gerais SA (Utilities, Water Utilities) | | | | | | | 5,300 | | | | 82,718 | |
| | | | |
| | | | | | | | | | | 377,408 | |
| | | | | | | | | | | | |
| | | | |
| Canada: 2.23% | | | | | | | | | | | | |
Canadian Pacific Railway Limited (Industrials, Road & Rail) | | | | | | | 1,157 | | | | 180,457 | |
Magna International Incorporated Class A (Consumer Discretionary, Auto Components) | | | | | | | 4,500 | | | | 440,865 | |
Metro Incorporated (Consumer Staples, Food & Staples Retailing) | | | | | | | 3,400 | | | | 209,574 | |
Valeant Pharmaceuticals International Incorporated (Health Care, Pharmaceuticals) † | | | | | | | 7,282 | | | | 973,676 | |
WestJet Airlines Limited (Industrials, Airlines) | | | | | | | 11,100 | | | | 252,777 | |
| | | | |
| | | | | | | | | | | 2,057,349 | |
| | | | | | | | | | | | |
| | | | |
| China: 5.15% | | | | | | | | | | | | |
Baidu Incorporated (Information Technology, Internet Software & Services) † | | | | | | | 7,783 | | | | 1,197,415 | |
Biostime International Holdings Limited (Consumer Staples, Food Products) | | | | | | | 27,500 | | | | 182,672 | |
China Communications Services Corporation Limited (Telecommunication Services, Diversified
Telecommunication Services) | | | | | | | 220,000 | | | | 111,519 | |
The accompanying notes are an integral part of these financial statements.
| | | | |
| 8 | | Wells Fargo Advantage Diversified International Fund | | Portfolio of investments—April 30, 2014 (unaudited) |
| | | | | | | | | | | | |
| Security name | | | | | | Shares | | | Value | |
| | | | | | | | | | | | |
| | | | |
| China (continued) | | | | | | | | | | | | |
China Mobile Limited (Telecommunication Services, Wireless Telecommunication Services) | | | | | | | 55,000 | | | $ | 522,833 | |
China Petroleum & Chemical Corporation (Energy, Oil, Gas & Consumable Fuels) | | | | | | | 369,200 | | | | 326,201 | |
China Railway Construction Corporation Limited (Industrials, Construction & Engineering) | | | | | | | 141,500 | | | | 116,990 | |
China Resources Land Limited (Financials, Real Estate Management & Development) | | | | | | | 104,600 | | | | 215,327 | |
Dongfeng Motor Group Company Limited (Consumer Discretionary, Automobiles) | | | | | | | 390,000 | | | | 520,138 | |
Industrial & Commercial Bank of China Limited Class H (Financials, Banks) | | | | | | | 687,000 | | | | 409,385 | |
Kingboard Laminates Holdings Limited (Information Technology, Electronic Equipment, Instruments & Components) | | | | | | | 226,500 | | | | 87,644 | |
Sands China Limited (Consumer Discretionary, Hotels, Restaurants & Leisure) | | | | | | | 68,800 | | | | 502,271 | |
Tencent Holdings Limited (Information Technology, Internet Software & Services) | | | | | | | 5,300 | | | | 330,321 | |
Xtep International Holdings Limited (Consumer Discretionary, Textiles, Apparel & Luxury Goods) | | | | | | | 586,241 | | | | 235,163 | |
| | | | |
| | | | | | | | | | | 4,757,879 | |
| | | | | | | | | | | | |
| | | | |
| Czech Republic: 0.10% | | | | | | | | | | | | |
CEZ AS (Utilities, Electric Utilities) | | | | | | | 3,200 | | | | 96,212 | |
| | | | | | | | | | | | |
| | | | |
| Denmark: 0.31% | | | | | | | | | | | | |
ISS AS (Industrials, Commercial Services & Supplies) † | | | | | | | 3,336 | | | | 116,140 | |
Rockwool International AS B Shares (Industrials, Building Products) | | | | | | | 882 | | | | 170,006 | |
| | | | |
| | | | | | | | | | | 286,146 | |
| | | | | | | | | | | | |
| | | | |
| Finland: 0.17% | | | | | | | | | | | | |
TietoEnator Oyj (Information Technology, IT Services) | | | | | | | 5,800 | | | | 158,438 | |
| | | | | | | | | | | | |
| | | | |
| France: 5.80% | | | | | | | | | | | | |
Alstom SA (Industrials, Machinery) | | | | | | | 6,700 | | | | 274,396 | |
Arkema SA (Materials, Chemicals) | | | | | | | 910 | | | | 101,466 | |
AXA SA (Financials, Insurance) « | | | | | | | 9,900 | | | | 257,870 | |
BNP Paribas SA (Financials, Banks) | | | | | | | 3,600 | | | | 270,250 | |
Compagnie Generale des Etablissements Michelin SCA Class B (Consumer Discretionary, Auto Components) | | | | | | | 1,400 | | | | 170,921 | |
Credit Agricole SA (Financials, Banks) † | | | | | | | 10,900 | | | | 171,712 | |
L’Oreal SA (Consumer Staples, Personal Products) | | | | | | | 1,130 | | | | 194,395 | |
LVMH Moet Hennessy Louis Vuitton SA (Consumer Discretionary, Textiles, Apparel & Luxury Goods) | | | | | | | 1,255 | | | | 246,804 | |
Pernod-Ricard SA (Consumer Staples, Beverages) | | | | | | | 2,769 | | | | 332,334 | |
Renault SA (Consumer Discretionary, Automobiles) | | | | | | | 2,500 | | | | 243,306 | |
Sanofi-Aventis SA (Health Care, Pharmaceuticals) | | | | | | | 3,700 | | | | 400,492 | |
Schneider Electric SA (Industrials, Electrical Equipment) | | | | | | | 7,440 | | | | 697,243 | |
SCOR SE (Financials, Insurance) | | | | | | | 7,700 | | | | 281,006 | |
Societe Generale SA (Financials, Banks) | | | | | | | 3,700 | | | | 229,967 | |
Thales SA (Industrials, Aerospace & Defense) | | | | | | | 4,200 | | | | 267,162 | |
Total SA (Energy, Oil, Gas & Consumable Fuels) | | | | | | | 6,000 | | | | 428,524 | |
Vivendi SA (Telecommunication Services, Diversified Telecommunication Services) | | | | | | | 8,200 | | | | 220,017 | |
Zodiac Aerospace SA (Industrials, Aerospace & Defense) | | | | | | | 17,280 | | | | 574,283 | |
| | | | |
| | | | | | | | | | | 5,362,148 | |
| | | | | | | | | | | | |
| | | | |
| Germany: 11.46% | | | | | | | | | | | | |
Allianz AG (Financials, Insurance) | | | | | | | 2,300 | | | | 398,384 | |
BASF SE (Materials, Chemicals) « | | | | | | | 2,900 | | | | 335,665 | |
Bayer AG (Health Care, Pharmaceuticals) | | | | | | | 12,994 | | | | 1,802,722 | |
Beiersdorf AG (Consumer Staples, Personal Products) | | | | | | | 4,850 | | | | 486,212 | |
Daimler AG (Consumer Discretionary, Automobiles) | | | | | | | 4,800 | | | | 444,374 | |
The accompanying notes are an integral part of these financial statements.
| | | | | | |
| Portfolio of investments—April 30, 2014 (unaudited) | | Wells Fargo Advantage Diversified International Fund | | | 9 | |
| | | | | | | | | | | | |
| Security name | | | | | | Shares | | | Value | |
| | | | | | | | | | | | |
| | | | |
| Germany (continued) | | | | | | | | | | | | |
Deutsche Bank AG (Financials, Capital Markets) | | | | | | | 3,300 | | | $ | 145,405 | |
Deutsche Post AG (Industrials, Air Freight & Logistics) | | | | | | | 24,094 | | | | 907,036 | |
E.ON SE (Utilities, Multi-Utilities) « | | | | | | | 8,100 | | | | 154,909 | |
Hannover Rueckversicherung AG (Financials, Insurance) « | | | | | | | 2,200 | | | | 204,831 | |
Linde AG (Materials, Chemicals) | | | | | | | 5,802 | | | | 1,202,983 | |
Metro AG (Consumer Staples, Food & Staples Retailing) | | | | | | | 22,811 | | | | 911,429 | |
MTU Aero Engines AG (Industrials, Aerospace & Defense) | | | | | | | 4,247 | | | | 399,659 | |
Muenchener Rueckversicherungs-Gesellschaft AG (Financials, Insurance) « | | | | | | | 3,035 | | | | 700,855 | |
Norddeutsche Affinerie AG (Materials, Metals & Mining) | | | | | | | 1,800 | | | | 95,944 | |
Rheinmetall AG (Industrials, Industrial Conglomerates) | | | | | | | 8,394 | | | | 556,942 | |
RWE AG (Utilities, Multi-Utilities) | | | | | | | 2,900 | | | | 110,581 | |
SAP AG (Information Technology, Software) | | | | | | | 6,787 | | | | 546,501 | |
Siemens AG (Industrials, Industrial Conglomerates) | | | | | | | 5,802 | | | | 764,693 | |
Volkswagen AG (Consumer Discretionary, Automobiles) | | | | | | | 1,600 | | | | 427,304 | |
| | | | |
| | | | | | | | | | | 10,596,429 | |
| | | | | | | | | | | | |
| | | | |
| Hong Kong: 3.28% | | | | | | | | | | | | |
AIA Group Limited (Financials, Insurance) | | | | | | | 197,400 | | | | 957,344 | |
Beijing Enterprises Holdings Limited (Industrials, Industrial Conglomerates) | | | | | | | 61,000 | | | | 530,301 | |
China Everbright Limited (Financials, Capital Markets) | | | | | | | 546,000 | | | | 729,601 | |
Hengdeli Holdings Limited (Consumer Discretionary, Specialty Retail) | | | | | | | 1,902,366 | | | | 365,606 | |
Hong Kong Land Holdings Limited (Financials, Real Estate Management & Development) | | | | | | | 24,058 | | | | 168,406 | |
Johnson Electric Holdings Limited (Industrials, Electrical Equipment) | | | | | | | 64,000 | | | | 61,169 | |
Wheelock & Company Limited (Financials, Real Estate Management & Development) | | | | | | | 22,000 | | | | 90,520 | |
Yue Yuen Industrial Holdings Limited (Consumer Discretionary, Textiles, Apparel & Luxury Goods) | | | | | | | 42,000 | | | | 129,744 | |
| | | | |
| | | | | | | | | | | 3,032,691 | |
| | | | | | | | | | | | |
| | | | |
| India: 0.77% | | | | | | | | | | | | |
Coal India Limited (Energy, Oil, Gas & Consumable Fuels) | | | | | | | 16,734 | | | | 80,972 | |
Gail Limited (Utilities, Gas Utilities) | | | | | | | 4,100 | | | | 152,479 | |
Grasim Industries GDR (Industrials, Construction & Engineering) | | | | | | | 1,800 | | | | 78,399 | |
Tata Motors Limited ADR (Consumer Discretionary, Automobiles) | | | | | | | 7,700 | | | | 288,134 | |
Tata Steel Limited GDR (Industrials, Machinery) | | | | | | | 17,100 | | | | 111,578 | |
| | | | |
| | | | | | | | | | | 711,562 | |
| | | | | | | | | | | | |
| | | | |
| Indonesia: 0.22% | | | | | | | | | | | | |
PT Bank Rakyat Indonesia Tbk (Financials, Banks) | | | | | | | 241,500 | | | | 206,794 | |
| | | | | | | | | | | | |
| | | | |
| Ireland: 1.14% | | | | | | | | | | | | |
Covidien plc (Health Care, Health Care Equipment & Supplies) | | | | | | | 9,086 | | | | 647,378 | |
CRH plc (Materials, Construction Materials) | | | | | | | 8,380 | | | | 242,824 | |
Smurfit Kappa Group plc (Materials, Containers & Packaging) | | | | | | | 7,500 | | | | 166,846 | |
| | | | |
| | | | | | | | | | | 1,057,048 | |
| | | | | | | | | | | | |
| | | | |
| Israel: 0.48% | | | | | | | | | | | | |
Bank Hapoalim Limited (Financials, Banks) | | | | | | | 38,000 | | | | 214,460 | |
Teva Pharmaceutical Industries Limited (Health Care, Pharmaceuticals) | | | | | | | 4,600 | | | | 229,302 | |
| | | | |
| | | | | | | | | | | 443,762 | |
| | | | | | | | | | | | |
The accompanying notes are an integral part of these financial statements.
| | | | |
| 10 | | Wells Fargo Advantage Diversified International Fund | | Portfolio of investments—April 30, 2014 (unaudited) |
| | | | | | | | | | | | |
| Security name | | | | | | Shares | | | Value | |
| | | | | | | | | | | | |
| | | | |
| Italy: 2.44% | | | | | | | | | | | | |
Enel SpA (Utilities, Electric Utilities) | | | | | | | 48,100 | | | $ | 271,864 | |
ENI SpA (Energy, Oil, Gas & Consumable Fuels) | | | | | | | 41,743 | | | | 1,083,535 | |
Intesa Sanpaolo SpA (Financials, Banks) | | | | | | | 197,711 | | | | 674,764 | |
Intesa Sanpaolo RSP (Financials, Banks) | | | | | | | 78,713 | | | | 228,670 | |
| | | | |
| | | | | | | | | | | 2,258,833 | |
| | | | | | | | | | | | |
| | | | |
| Japan: 17.31% | | | | | | | | | | | | |
Adeka Corporation (Materials, Chemicals) | | | | | | | 20,600 | | | | 226,482 | |
Aisin Seiki Company Limited (Consumer Discretionary, Auto Components) | | | | | | | 3,300 | | | | 116,526 | |
Alpine Electronics Incorporated (Consumer Discretionary, Household Durables) | | | | | | | 11,600 | | | | 138,540 | |
Aozora Bank Limited (Financials, Banks) | | | | | | | 41,000 | | | | 121,915 | |
Asahi Glass Company Limited (Industrials, Building Products) | | | | | | | 79,000 | | | | 447,410 | |
Capcom Company Limited (Information Technology, Software) | | | | | | | 24,700 | | | | 429,807 | |
Daiichikosho Company Limited (Consumer Discretionary, Media) | | | | | | | 7,300 | | | | 210,499 | |
Daiwa House Industry Company Limited (Financials, Real Estate Management & Development) | | | | | | | 35,000 | | | | 589,866 | |
Daiwa Securities Group Incorporated (Financials, Capital Markets) | | | | | | | 109,000 | | | | 815,621 | |
Denso Corporation (Consumer Discretionary, Auto Components) | | | | | | | 6,700 | | | | 304,870 | |
Eizo Nanao Corporation (Information Technology, Technology Hardware, Storage & Peripherals) | | | | | | | 7,300 | | | | 197,432 | |
Fukuoka Financial Group Incorporated (Financials, Banks) | | | | | | | 23,000 | | | | 93,813 | |
Hitachi Limited (Information Technology, Electronic Equipment, Instruments & Components) | | | | | | | 65,000 | | | | 462,219 | |
Honda Motor Company Limited (Consumer Discretionary, Automobiles) | | | | | | | 17,500 | | | | 578,569 | |
Ishikawajima-Harima Heavy Industries Company Limited (Industrials, Machinery) | | | | | | | 106,000 | | | | 421,989 | |
Itochu Corporation (Industrials, Trading Companies & Distributors) | | | | | | | 26,700 | | | | 298,771 | |
JS Group Corporation (Industrials, Building Products) | | | | | | | 11,400 | | | | 301,406 | |
JX Holdings Incorporated (Energy, Oil, Gas & Consumable Fuels) | | | | | | | 28,500 | | | | 147,748 | |
KDDI Corporation (Telecommunication Services, Wireless Telecommunication Services) | | | | | | | 9,600 | | | | 511,011 | |
Kyorin Company Limited (Health Care, Pharmaceuticals) | | | | | | | 7,900 | | | | 152,382 | |
Maeda Road Construction Company Limited (Industrials, Construction & Engineering) | | | | | | | 11,000 | | | | 170,323 | |
Marubeni Corporation (Industrials, Trading Companies & Distributors) | | | | | | | 30,000 | | | | 200,127 | |
Miraca Holdings Incorporated (Health Care, Health Care Providers & Services) | | | | | | | 1,800 | | | | 77,997 | |
Mitsubishi Corporation (Industrials, Trading Companies & Distributors) | | | | | | | 11,100 | | | | 198,472 | |
Mitsubishi UFJ Financial Group Incorporated (Financials, Banks) | | | | | | | 168,400 | | | | 892,775 | |
Mitsui & Company Limited (Industrials, Trading Companies & Distributors) | | | | | | | 14,400 | | | | 204,094 | |
Mitsui Fudosan Company Limited (Financials, Real Estate Management & Development) | | | | | | | 13,000 | | | | 384,144 | |
Mitsui OSK Lines Limited (Industrials, Marine) | | | | | | | 125,000 | | | | 416,932 | |
Mizuho Financial Group Incorporated (Financials, Banks) | | | | | | | 154,300 | | | | 301,854 | |
NGK Insulators Limited (Industrials, Machinery) | | | | | | | 35,000 | | | | 660,390 | |
Nichirei Corporation (Consumer Staples, Food Products) | | | | | | | 21,000 | | | | 101,883 | |
Nippon Telegraph & Telephone Corporation (Telecommunication Services, Diversified Telecommunication Services) | | | | | | | 7,900 | | | | 437,442 | |
Nissan Motor Company Limited (Consumer Discretionary, Automobiles) | | | | | | | 15,800 | | | | 135,537 | |
Nitto Denko Corporation (Materials, Chemicals) | | | | | | | 12,200 | | | | 526,258 | |
NTT DoCoMo Incorporated (Telecommunication Services, Wireless Telecommunication Services) | | | | | | | 11,700 | | | | 185,625 | |
Olympus Corporation (Health Care, Health Care Equipment & Supplies) † | | | | | | | 21,700 | | | | 662,239 | |
Ono Pharmaceutical Company Limited (Health Care, Pharmaceuticals) | | | | | | | 3,500 | | | | 276,960 | |
ORIX Corporation (Financials, Diversified Financial Services) | | | | | | | 2,900 | | | | 41,897 | |
Otsuka Holdings Company Limited (Health Care, Pharmaceuticals) | | | | | | | 6,000 | | | | 172,720 | |
Rengo Company Limited (Materials, Containers & Packaging) | | | | | | | 23,000 | | | | 102,812 | |
Resona Holdings Incorporated (Financials, Banks) | | | | | | | 43,800 | | | | 223,638 | |
Sankyu Incorporated (Industrials, Road & Rail) | | | | | | | 28,000 | | | | 106,539 | |
SEINO Holdings Company Limited (Industrials, Road & Rail) | | | | | | | 3,000 | | | | 29,579 | |
The accompanying notes are an integral part of these financial statements.
| | | | | | |
| Portfolio of investments—April 30, 2014 (unaudited) | | Wells Fargo Advantage Diversified International Fund | | | 11 | |
| | | | | | | | | | | | |
| Security name | | | | | | Shares | | | Value | |
| | | | | | | | | | | | |
| | | | |
| Japan (continued) | | | | | | | | | | | | |
Sharp Corporation (Consumer Discretionary, Household Durables) †« | | | | | | | 85,000 | | | $ | 212,843 | |
Sojitz Corporation (Industrials, Trading Companies & Distributors) | | | | | | | 77,400 | | | | 121,890 | |
Sumitomo Corporation (Industrials, Trading Companies & Distributors) | | | | | | | 19,900 | | | | 258,300 | |
Sumitomo Metal Mining Company Limited (Materials, Metals & Mining) | | | | | | | 11,000 | | | | 165,804 | |
Sumitomo Mitsui Financial Group Incorporated (Financials, Banks) | | | | | | | 8,000 | | | | 315,587 | |
Toshiba TEC Corporation (Information Technology, Technology Hardware, Storage & Peripherals) | | | | | | | 22,000 | | | | 143,102 | |
Toyo Tire & Rubber Company Limited (Consumer Discretionary, Auto Components) | | | | | | | 19,000 | | | | 141,429 | |
Toyota Motor Corporation (Consumer Discretionary, Automobiles) | | | | | | | 21,400 | | | | 1,154,618 | |
West Japan Railway Company (Industrials, Road & Rail) | | | | | | | 5,400 | | | | 218,831 | |
Yokohama Rubber Company Limited (Consumer Discretionary, Auto Components) | | | | | | | 21,000 | | | | 187,539 | |
| | | | |
| | | | | | | | | | | 15,997,056 | |
| | | | | | | | | | | | |
| | | | |
| Liechtenstein: 0.15% | | | | | | | | | | | | |
Verwaltungs-und Privat-Bank AG (Financials, Capital Markets) | | | | | | | 1,400 | | | | 139,507 | |
| | | | | | | | | | | | |
| | | | |
| Malaysia: 0.08% | | | | | | | | | | | | |
Tenaga Nasional Berhad (Utilities, Electric Utilities) | | | | | | | 21,000 | | | | 76,527 | |
| | | | | | | | | | | | |
| | | | |
| Mexico: 0.72% | | | | | | | | | | | | |
Grupo Televisa SAB ADR (Consumer Discretionary, Media) | | | | | | | 20,349 | | | | 667,651 | |
| | | | | | | | | | | | |
| | | | |
| Netherlands: 3.55% | | | | | | | | | | | | |
Aegon NV (Financials, Insurance) | | | | | | | 17,300 | | | | 156,847 | |
Akzo Nobel NV (Materials, Chemicals) | | | | | | | 10,300 | | | | 792,935 | |
ASML Holdings NV (Information Technology, Semiconductors & Semiconductor Equipment) | | | | | | | 7,284 | | | | 600,567 | |
ING Groep NV (Financials, Diversified Financial Services) † | | | | | | | 16,600 | | | | 235,712 | |
Koninklijke Ahold NV (Consumer Staples, Food & Staples Retailing) « | | | | | | | 15,600 | | | | 300,941 | |
Nielsen Holdings NV (Industrials, Professional Services) | | | | | | | 2,114 | | | | 99,252 | |
Unilever NV (Consumer Staples, Food Products) | | | | | | | 18,133 | | | | 776,968 | |
Ziggo NV (Telecommunication Services, Diversified Telecommunication Services) | | | | | | | 7,280 | | | | 315,925 | |
| | | | |
| | | | | | | | | | | 3,279,147 | |
| | | | | | | | | | | | |
| | | | |
| Nigeria: 0.01% | | | | | | | | | | | | |
Nigerian Breweries plc (Consumer Staples, Beverages) | | | | | | | 7,549 | | | | 7,049 | |
| | | | | | | | | | | | |
| | | | |
| Norway: 1.59% | | | | | | | | | | | | |
DnB Nor ASA (Financials, Banks) | | | | | | | 12,100 | | | | 213,938 | |
Frontline 2012 Limited (Energy, Oil, Gas & Consumable Fuels) 144A | | | | | | | 25,569 | | | | 197,866 | |
Marine Harvest ASA (Consumer Staples, Food Products) | | | | | | | 54,759 | | | | 670,635 | |
Statoil ASA (Energy, Oil, Gas & Consumable Fuels) | | | | | | | 5,700 | | | | 172,986 | |
Yara International ASA (Materials, Chemicals) « | | | | | | | 4,600 | | | | 217,142 | |
| | | | |
| | | | | | | | | | | 1,472,567 | |
| | | | | | | | | | | | |
| | | | |
| Poland: 0.10% | | | | | | | | | | | | |
Asseco Poland SA (Information Technology, Software) | | | | | | | 5,900 | | | | 87,692 | |
| | | | | | | | | | | | |
| | | | |
| Russia: 1.18% | | | | | | | | | | | | |
Gazprom Neft Sponsored ADR (Energy, Oil, Gas & Consumable Fuels) (i) | | | | | | | 10,500 | | | | 208,635 | |
Lukoil ADR (Energy, Oil, Gas & Consumable Fuels) | | | | | | | 4,200 | | | | 222,264 | |
Mobile Telesystems ADR (Telecommunication Services, Wireless Telecommunication Services) | | | | | | | 25,592 | | | | 428,922 | |
The accompanying notes are an integral part of these financial statements.
| | | | |
| 12 | | Wells Fargo Advantage Diversified International Fund | | Portfolio of investments—April 30, 2014 (unaudited) |
| | | | | | | | | | | | |
| Security name | | | | | | Shares | | | Value | |
| | | | | | | | | | | | |
| | | | |
| Russia (continued) | | | | | | | | | | | | |
Sberbank of Russia (Financials, Banks) (a) | | | | | | | 115,453 | | | $ | 235,023 | |
| | | | |
| | | | | | | | | | | 1,094,844 | |
| | | | | | | | | | | | |
| | | | |
| South Africa: 0.26% | | | | | | | | | | | | |
Barclays Africa Group Limited (Financials, Banks) | | | | | | | 9,300 | | | | 136,134 | |
Imperial Holding Limited (Consumer Discretionary, Distributors) | | | | | | | 5,700 | | | | 106,160 | |
| | | | |
| | | | | | | | | | | 242,294 | |
| | | | | | | | | | | | |
| | | | |
| South Korea: 2.69% | | | | | | | | | | | | |
Hana Financial Group Incorporated (Financials, Banks) | | | | | | | 14,830 | | | | 521,698 | |
Industrial Bank of Korea (Financials, Banks) | | | | | | | 13,500 | | | | 165,925 | |
NAVER Corporation (Information Technology, Internet Software & Services) | | | | | | | 85 | | | | 60,708 | |
Orion Corporation (Consumer Staples, Food Products) | | | | | | | 108 | | | | 82,361 | |
Samsung Electronics Company Limited (Information Technology, Semiconductors & Semiconductor Equipment) | | | | | | | 126 | | | | 163,765 | |
Samsung Electronics Company Limited GDR (Information Technology, Semiconductors & Semiconductor Equipment) 144A | | | | | | | 837 | | | | 539,447 | |
SK Telecom Company Limited (Telecommunication Services, Wireless Telecommunication Services) | | | | | | | 3,692 | | | | 762,839 | |
Woori Finance Holdings Company Limited (Financials, Banks) † | | | | | | | 16,400 | | | | 184,903 | |
| | | | |
| | | | | | | | | | | 2,481,646 | |
| | | | | | | | | | | | |
| | | | |
| Spain: 0.59% | | | | | | | | | | | | |
Banco Santander Central Hispano SA (Financials, Banks) | | | | | | | 22,800 | | | | 226,703 | |
Grifols SA (Health Care, Biotechnology) | | | | | | | 4,008 | | | | 214,079 | |
Grifols SA ADR (Health Care, Biotechnology) | | | | | | | 2,561 | | | | 105,103 | |
| | | | |
| | | | | | | | | | | 545,885 | |
| | | | | | | | | | | | |
| | | | |
| Sweden: 1.75% | | | | | | | | | | | | |
Boliden AB (Materials, Metals & Mining) | | | | | | | 12,400 | | | | 188,416 | |
Electrolux AB Class B (Consumer Discretionary, Household Durables) | | | | | | | 6,899 | | | | 191,197 | |
Nordea Bank AB (Financials, Banks) | | | | | | | 15,000 | | | | 216,734 | |
Saab AB (Industrials, Aerospace & Defense) | | | | | | | 9,100 | | | | 278,506 | |
Volvo AB Class B (Consumer Discretionary, Automobiles) | | | | | | | 47,051 | | | | 741,707 | |
| | | | |
| | | | | | | | | | | 1,616,560 | |
| | | | | | | | | | | | |
| | | | |
| Switzerland: 8.37% | | | | | | | | | | | | |
ABB Limited (Industrials, Electrical Equipment) | | | | | | | 27,464 | | | | 659,685 | |
Actelion Limited (Health Care, Biotechnology) | | | | | | | 2,345 | | | | 230,343 | |
Baloise Holding AG (Financials, Insurance) | | | | | | | 2,000 | | | | 243,154 | |
Credit Suisse Group AG (Financials, Capital Markets) | | | | | | | 9,117 | | | | 289,121 | |
Georg Fischer AG (Industrials, Machinery) † | | | | | | | 400 | | | | 316,782 | |
Holcim Limited (Materials, Construction Materials) | | | | | | | 425 | | | | 38,922 | |
Nestle SA (Consumer Staples, Food Products) | | | | | | | 12,848 | | | | 991,957 | |
Novartis AG (Health Care, Pharmaceuticals) | | | | | | | 8,991 | | | | 779,472 | |
Roche Holdings AG (Health Care, Pharmaceuticals) | | | | | | | 4,132 | | | | 1,211,290 | |
Swatch Group AG Class B (Consumer Discretionary, Textiles, Apparel & Luxury Goods) | | | | | | | 1,248 | | | | 800,473 | |
Swiss Life Holding (Financials, Insurance) | | | | | | | 600 | | | | 147,392 | |
Swiss Reinsurance AG (Financials, Insurance) | | | | | | | 4,033 | | | | 352,160 | |
UBS AG (Financials, Capital Markets) | | | | | | | 20,455 | | | | 427,647 | |
Valora Holding AG (Consumer Discretionary, Specialty Retail) | | | | | | | 300 | | | | 84,706 | |
Zurich Financial Services AG (Financials, Insurance) | | | | | | | 4,058 | | | | 1,162,392 | |
| | | | |
| | | | | | | | | | | 7,735,496 | |
| | | | | | | | | | | | |
The accompanying notes are an integral part of these financial statements.
| | | | | | |
| Portfolio of investments—April 30, 2014 (unaudited) | | Wells Fargo Advantage Diversified International Fund | | | 13 | |
| | | | | | | | | | | | |
| Security name | | | | | | Shares | | | Value | |
| | | | | | | | | | | | |
| | | | |
| Taiwan: 0.08% | | | | | | | | | | | | |
Powertech Technology Incorporated (Information Technology, Semiconductors & Semiconductor Equipment) | | | | | | | 46,000 | | | $ | 74,412 | |
| | | | | | | | | | | | |
| | | | |
| Thailand: 0.15% | | | | | | | | | | | | |
Bangchak Petroleum plc (Energy, Oil, Gas & Consumable Fuels) | | | | | | | 135,400 | | | | 133,894 | |
| | | | | | | | | | | | |
| | | | |
| United Kingdom: 16.62% | | | | | | | | | | | | |
Amlin plc (Financials, Insurance) | | | | | | | 19,500 | | | | 147,400 | |
Anglo American plc (Materials, Metals & Mining) | | | | | | | 8,900 | | | | 237,723 | |
AstraZeneca plc (Health Care, Pharmaceuticals) | | | | | | | 9,400 | | | | 740,221 | |
Aviva plc (Financials, Insurance) | | | | | | | 22,000 | | | | 195,196 | |
BAE Systems plc (Industrials, Aerospace & Defense) | | | | | | | 49,700 | | | | 335,654 | |
Barclays plc (Financials, Banks) | | | | | | | 50,000 | | | | 212,907 | |
Bellway plc (Consumer Discretionary, Household Durables) | | | | | | | 4,200 | | | | 102,043 | |
BP plc (Energy, Oil, Gas & Consumable Fuels) | | | | | | | 154,316 | | | | 1,300,651 | |
BT Group plc (Telecommunication Services, Diversified Telecommunication Services) | | | | | | | 45,500 | | | | 283,090 | |
Capita plc (Industrials, Professional Services) | | | | | | | 38,831 | | | | 711,350 | |
Centrica plc (Utilities, Multi-Utilities) | | | | | | | 21,200 | | | | 118,120 | |
Croda International plc (Materials, Chemicals) | | | | | | | 7,195 | | | | 312,933 | |
Debenhams plc (Consumer Discretionary, Multiline Retail) | | | | | | | 420,235 | | | | 569,039 | |
Firstgroup plc (Industrials, Road & Rail) † | | | | | | | 32,500 | | | | 70,896 | |
GlaxoSmithKline plc (Health Care, Pharmaceuticals) | | | | | | | 4,400 | | | | 121,241 | |
HSBC Holdings plc (Financials, Banks) | | | | | | | 34,990 | | | | 356,885 | |
Imperial Tobacco Group plc (Consumer Staples, Tobacco) | | | | | | | 10,504 | | | | 453,483 | |
Intercontinental Hotels Group plc (Consumer Discretionary, Hotels, Restaurants & Leisure) | | | | | | | 9,700 | | | | 330,497 | |
J Sainsbury plc (Consumer Staples, Food & Staples Retailing) | | | | | | | 42,600 | | | | 241,455 | |
Johnson Matthey plc (Materials, Chemicals) | | | | | | | 8,829 | | | | 487,902 | |
Liberty Global plc Class A (Consumer Discretionary, Media) Ǡ | | | | | | | 6,480 | | | | 258,034 | |
Liberty Global plc Class C (Consumer Discretionary, Media) † | | | | | | | 8,851 | | | | 340,144 | |
Man Group plc (Financials, Capital Markets) | | | | | | | 427,130 | | | | 710,709 | |
Old Mutual plc (Financials, Insurance) | | | | | | | 59,600 | | | | 200,955 | |
Pace plc (Consumer Discretionary, Household Durables) | | | | | | | 19,300 | | | | 118,842 | |
Prudential plc (Financials, Insurance) | | | | | | | 11,575 | | | | 265,495 | |
Reckitt Benckiser Group plc (Consumer Staples, Household Products) | | | | | | | 5,780 | | | | 465,990 | |
Rolls-Royce Holdings plc (Industrials, Aerospace & Defense) | | | | | | | 55,274 | | | | 979,908 | |
Rolls-Royce Holdings plc Class C Preference Shares (Industrials, Aerospace & Defense) †(a) | | | | | | | 7,406,716 | | | | 12,506 | |
Royal & Sun Alliance Insurance Group plc (Financials, Insurance) | | | | | | | 53,200 | | | | 88,161 | |
Royal Dutch Shell plc Class B (Energy, Oil, Gas & Consumable Fuels) | | | | | | | 19,000 | | | | 808,406 | |
Royal Mail plc (Industrials, Air Freight & Logistics) † | | | | | | | 25,046 | | | | 223,913 | |
SABMiller plc (Consumer Staples, Beverages) | | | | | | | 14,750 | | | | 802,030 | |
Smiths Group plc (Industrials, Industrial Conglomerates) | | | | | | | 21,258 | | | | 479,158 | |
Tesco plc (Consumer Staples, Food & Staples Retailing) | | | | | | | 39,100 | | | | 193,395 | |
Tullett Prebon plc (Financials, Capital Markets) | | | | | | | 20,600 | | | | 110,569 | |
Vodafone Group plc (Telecommunication Services, Wireless Telecommunication Services) | | | | | | | 10,292 | | | | 390,691 | |
WH Smith plc (Consumer Discretionary, Specialty Retail) | | | | | | | 15,600 | | | | 288,145 | |
William Morrison Supermarkets plc (Consumer Staples, Food & Staples Retailing) | | | | | | | 48,700 | | | | 165,190 | |
Wolseley plc (Industrials, Trading Companies & Distributors) | | | | | | | 11,988 | | | | 692,429 | |
WPP plc (Consumer Discretionary, Media) | | | | | | | 20,333 | | | | 437,367 | |
| | | | |
| | | | | | | | | | | 15,360,723 | |
| | | | | | | | | | | | |
The accompanying notes are an integral part of these financial statements.
| | | | |
| 14 | | Wells Fargo Advantage Diversified International Fund | | Portfolio of investments—April 30, 2014 (unaudited) |
| | | | | | | | | | | | | | | | |
| Security name | | | | | | | | Shares | | | Value | |
| | | | | | | | | | | | | | | | |
| | | | |
| United States: 1.43% | | | | | | | | | | | | | | | | |
Apple Incorporated (Information Technology, Technology Hardware, Storage & Peripherals) | | | | | | | | | | | 719 | | | $ | 424,275 | |
QUALCOMM Incorporated (Information Technology, Communications Equipment) | | | | | | | | | | | 7,896 | | | | 621,494 | |
Schlumberger Limited (Energy, Energy Equipment & Services) | | | | | | | | | | | 2,705 | | | | 274,693 | |
| | | | |
| | | | | | | | | | | | | | | 1,320,462 | |
| | | | | | | | | | | | | | | | |
| | | | |
Total Common Stocks (Cost $73,970,393) | | | | | | | | | | | | | | | 88,185,823 | |
| | | | | | | | | | | | | | | | |
| | | | |
| | | | | | Expiration date | | | | | | | |
| Participation Notes: 0.39% | | | | | | | | | | | | | | | | |
| | | | |
| China: 0.17% | | | | | | | | | | | | | | | | |
Standard Chartered Bank plc (Kweichow Moutai Company Limited) (Consumer Staples, Beverages) † | | | | | | | 2-11-2015 | | | | 2,200 | | | | 57,593 | |
Standard Chartered Bank plc (Kweichow Moutai Company Limited) (Consumer Staples, Beverages) † | | | | | | | 4-24-2015 | | | | 4,000 | | | | 104,714 | |
| | | | |
| | | | | | | | | | | | | | | 162,307 | |
| | | | | | | | | | | | | | | | |
| | | | |
| Ireland: 0.22% | | | | | | | | | | | | | | | | |
HSBC Bank plc (Ryanair Holdings plc) (Industrials, Airlines) † | | | | | | | 11-17-2016 | | | | 21,100 | | | | 199,856 | |
| | | | | | | | | | | | | | | | |
| | | | |
Total Participation Notes (Cost $342,224) | | | | | | | | | | | | | | | 362,163 | |
| | | | | | | | | | | | | | | | |
| | | | |
| | | Dividend yield | | | | | | | | | | |
| Preferred Stocks: 0.73% | | | | | | | | | | | | | | | | |
| | | | |
| Brazil: 0.25% | | | | | | | | | | | | | | | | |
Companhia Energetica de Minas Gerais SA (Utilities, Electric Utilities) ± | | | 8.35 | % | | | | | | | 13,600 | | | | 103,629 | |
Companhia Vale Do Rio Doce Class A (Materials, Metals & Mining) ± | | | 6.08 | | | | | | | | 11,100 | | | | 131,522 | |
| | | | |
| | | | | | | | | | | | | | | 235,151 | |
| | | | | | | | | | | | | | | | |
| | | | |
| Germany: 0.48% | | | | | | | | | | | | | | | | |
Henkel AG & Company KGaA (Consumer Staples, Household Products) «± | | | 1.51 | | | | | | | | 3,959 | | | | 440,884 | |
| | | | | | | | | | | | | | | | |
| | | | |
Total Preferred Stocks (Cost $677,735) | | | | | | | | | | | | | | | 676,035 | |
| | | | | | | | | | | | | | | | |
| | | | |
| | | Yield | | | | | | | | | | |
| Short-Term Investments: 6.00% | | | | | | | | | | | | | | | | |
| | | | |
| Investment Companies: 6.00% | | | | | | | | | | | | | | | | |
Wells Fargo Advantage Cash Investment Money Market Fund, Select Class (l)(u) | | | 0.07 | | | | | | | | 1,962,886 | | | | 1,962,886 | |
Wells Fargo Securities Lending Cash Investments, LLC (l)(r)(u)(v) | | | 0.11 | | | | | | | | 3,582,356 | | | | 3,582,356 | |
| | | | |
Total Short-Term Investments (Cost $5,545,242) | | | | | | | | | | | | | | | 5,545,242 | |
| | | | | | | | | | | | | | | | |
| | | | | | | | |
| Total investments in securities | | | | | | | | |
| (Cost $80,535,594) * | | | 102.53 | % | | | 94,769,263 | |
Other assets and liabilities, net | | | (2.53 | ) | | | (2,339,162 | ) |
| | | | | | | | |
| Total net assets | | | 100.00 | % | | $ | 92,430,101 | |
| | | | | | | | |
The accompanying notes are an integral part of these financial statements.
| | | | | | |
| Portfolio of investments—April 30, 2014 (unaudited) | | Wells Fargo Advantage Diversified International Fund | | | 15 | |
| « | All or a portion of this security is on loan. |
| † | Non-income-earning security |
| 144A | Security that may be resold to “qualified institutional buyers” under Rule 144A or security offered pursuant to Section 4(2) of the Securities Act of 1933, as amended |
| (a) | Security is fair valued by the Management Valuation Team, and in certain instances by the Board of Trustees, in accordance with procedures approved by the Board of Trustees. |
| ± | Variable rate investment. The rate shown is the rate in effect at period end. |
| (l) | Represents an affiliate of the Fund under Sections 2(a)(2) and 2(a)(3) of the Investment Company Act of 1940, as amended |
| (r) | The investment company is exempt from registration under Section 3(c)(7) of the Investment Company Act of 1940, as amended. |
| (u) | Rate shown is the 7-day annualized yield at period end. |
| (v) | Security represents investment of cash collateral received from securities on loan. |
| * | Cost for federal income tax purposes is $82,982,862 and unrealized appreciation (depreciation) consists of: |
| | | | |
Gross unrealized appreciation | | $ | 17,789,947 | |
Gross unrealized depreciation | | | (6,003,546 | ) |
| | | | |
Net unrealized appreciation | | $ | 11,786,401 | |
The accompanying notes are an integral part of these financial statements.
| | | | |
| 16 | | Wells Fargo Advantage Diversified International Fund | | Statement of assets and liabilities—April 30, 2014 (unaudited) |
| | | | |
| | | | |
| |
Assets | | | | |
Investments | | | | |
In unaffiliated securities (including securities on loan), at value (see cost below) | | $ | 89,224,021 | |
In affiliated securities, at value (see cost below) | | | 5,545,242 | |
| | | | |
Total investments, at value (see cost below) | | | 94,769,263 | |
Foreign currency, at value (see cost below) | | | 1,033,128 | |
Receivable for investments sold | | | 44,291 | |
Receivable for Fund shares sold | | | 54,666 | |
Receivable for dividends | | | 500,312 | |
Receivable for securities lending income | | | 7,894 | |
Prepaid expenses and other assets | | | 24,826 | |
| | | | |
Total assets | | | 96,434,380 | |
| | | | |
| |
Liabilities | | | | |
Payable for investments purchased | | | 177,411 | |
Payable for Fund shares redeemed | | | 59,285 | |
Unrealized losses on forward foreign currency contracts | | | 33,251 | |
Payable upon receipt of securities loaned | | | 3,582,356 | |
Advisory fee payable | | | 38,735 | |
Distribution fees payable | | | 1,246 | |
Due to other related parties | | | 24,451 | |
Accrued expenses and other liabilities | | | 87,544 | |
| | | | |
Total liabilities | | | 4,004,279 | |
| | | | |
Total net assets | | $ | 92,430,101 | |
| | | | |
| |
NET ASSETS CONSIST OF | | | | |
Paid-in capital | | $ | 182,808,696 | |
Undistributed net investment income | | | 869,503 | |
Accumulated net realized losses on investments | | | (105,440,823 | ) |
Net unrealized gains on investments | | | 14,192,725 | |
| | | | |
Total net assets | | $ | 92,430,101 | |
| | | | |
| |
COMPUTATION OF NET ASSET VALUE AND OFFERING PRICE PER SHARE1 | | | | |
Net assets – Class A | | $ | 29,948,985 | |
Shares outstanding – Class A | | | 2,436,746 | |
Net asset value per share – Class A | | | $12.29 | |
Maximum offering price per share – Class A2 | | | $13.04 | |
Net assets – Class B | | $ | 84,970 | |
Shares outstanding – Class B | | | 7,193 | |
Net asset value per share – Class B | | | $11.81 | |
Net assets – Class C | | $ | 1,991,742 | |
Shares outstanding – Class C | | | 175,014 | |
Net asset value per share – Class C | | | $11.38 | |
Net assets – Administrator Class | | $ | 8,177,951 | |
Shares outstanding – Administrator Class | | | 653,585 | |
Net asset value per share – Administrator Class | | | $12.51 | |
Net assets – Institutional Class | | $ | 2,068,210 | |
Shares outstanding – Institutional Class | | | 176,041 | |
Net asset value per share – Institutional Class | | | $11.75 | |
Net assets – Investor Class | | $ | 50,158,243 | |
Shares outstanding – Investor Class | | | 4,097,762 | |
Net asset value per share – Investor Class | | | $12.24 | |
Investments in unaffiliated securities (including securities on loan), at cost | | $ | 74,990,352 | |
| | | | |
Investments in affiliated securities, at cost | | $ | 5,545,242 | |
| | | | |
Total investments, at cost | | $ | 80,535,594 | |
| | | | |
Securities on loan, at value | | $ | 3,415,228 | |
| | | | |
Foreign currency, at cost | | $ | 1,045,443 | |
| | | | |
| 1. | The Fund has an unlimited number of authorized shares. |
| 2. | Maximum offering price is computed as 100/94.25 of net asset value. On investments of $50,000 or more, the offering price is reduced. |
The accompanying notes are an integral part of these financial statements.
| | | | | | |
| Statement of operations—six months ended April 30, 2014 (unaudited) | | Wells Fargo Advantage Diversified International Fund | | | 17 | |
| | | | |
| | | | |
| |
Investment income | | | | |
Dividends* | | $ | 1,556,358 | |
Securities lending income, net | | | 16,479 | |
Income from affiliated securities | | | 854 | |
Interest | | | 12 | |
| | | | |
Total investment income | | | 1,573,703 | |
| | | | |
| |
Expenses | | | | |
Advisory fee | | | 381,378 | |
Administration fees | | | | |
Fund level | | | 22,434 | |
Class A | | | 37,321 | |
Class B | | | 181 | |
Class C | | | 2,403 | |
Administrator Class | | | 4,082 | |
Institutional Class | | | 894 | |
Investor Class | | | 77,828 | |
Shareholder servicing fees | | | | |
Class A | | | 35,886 | |
Class B | | | 174 | |
Class C | | | 2,310 | |
Administrator Class | | | 10,204 | |
Investor Class | | | 60,803 | |
Distribution fees | | | | |
Class B | | | 523 | |
Class C | | | 6,931 | |
Custody and accounting fees | | | 71,206 | |
Professional fees | | | 22,443 | |
Registration fees | | | 27,082 | |
Shareholder report expenses | | | 10,496 | |
Trustees’ fees and expenses | | | 4,797 | |
Other fees and expenses | | | 29,588 | |
| | | | |
Total expenses | | | 808,964 | |
Less: Fee waivers and/or expense reimbursements | | | (167,933 | ) |
| | | | |
Net expenses | | | 641,031 | |
| | | | |
Net investment income | | | 932,672 | |
| | | | |
| |
REALIZED AND UNREALIZED GAINS (LOSSES) ON INVESTMENTS | | | | |
| |
Net realized gains on: | | | | |
Unaffiliated securities | | | 431,758 | |
Forward foreign currency contract transactions | | | 108,382 | |
| | | | |
Net realized gains on investment | | | 540,140 | |
| | | | |
| |
Net change in unrealized gains (losses) on: | | | | |
Unaffiliated securities | | | 222,958 | |
Forward foreign currency contract transactions | | | (56,244 | ) |
| | | | |
Net change in unrealized gains (losses) on investments | | | 166,714 | |
| | | | |
Net realized and unrealized gains (losses) on investments | | | 706,854 | |
| | | | |
Net increase in net assets resulting from operations | | $ | 1,639,526 | |
| | | | |
| |
* Net of foreign dividend withholding taxes in the amount of | | | $97,903 | |
The accompanying notes are an integral part of these financial statements.
| | | | |
| 18 | | Wells Fargo Advantage Diversified International Fund | | Statement of changes in net assets |
| | | | | | | | | | | | | | | | |
| | | Six months ended April 30, 2014 (unaudited) | | | Year ended October 31, 2013 | |
| | | | |
Operations | | | | | | | | | | | | | | | | |
Net investment income | | | | | | $ | 932,672 | | | | | | | $ | 1,348,745 | |
Net realized gains on investments | | | | | | | 540,140 | | | | | | | | 3,070,430 | |
Net change in unrealized gains (losses) on investments | | | | | | | 166,714 | | | | | | | | 14,363,441 | |
| | | | |
Net increase in net assets resulting from operations | | | | | | | 1,639,526 | | | | | | | | 18,782,616 | |
| | | | |
| | | | |
Distributions to shareholders from | | | | | | | | | | | | | | | | |
Net investment income | | | | | | | | | | | | | | | | |
Class A | | | | | | | (435,361 | ) | | | | | | | (1,279,375 | ) |
Class B | | | | | | | (908 | ) | | | | | | | (14,233 | ) |
Class C | | | | | | | (22,476 | ) | | | | | | | (34,916 | ) |
Administrator Class | | | | | | | (131,295 | ) | | | | | | | (198,977 | ) |
Institutional Class | | | | | | | (53,962 | ) | | | | | | | (617,382 | ) |
Investor Class | | | | | | | (713,363 | ) | | | | | | | (2,250,592 | ) |
| | | | |
Total distributions to shareholders | | | | | | | (1,357,365 | ) | | | | | | | (4,395,475 | ) |
| | | | |
| | | | |
| | | Shares | | | | | | | | Shares | | | | | |
Capital share transactions | | | | | | | | | | | | | | | | |
Proceeds from shares sold | | | | | | | | | | | | | | | | |
Class A | | | 161,063 | | | | 1,952,248 | | | | 424,946 | | | | 4,748,331 | |
Class B | | | 825 | | | | 9,732 | | | | 4,044 | | | | 45,106 | |
Class C | | | 48,764 | | | | 551,354 | | | | 91,578 | | | | 951,354 | |
Administrator Class | | | 159,879 | | | | 1,980,247 | | | | 411,188 | | | | 4,585,536 | |
Institutional Class | | | 270 | | | | 3,159 | | | | 943 | | | | 10,090 | |
Investor Class | | | 348,624 | | | | 4,238,415 | | | | 545,309 | | | | 5,964,467 | |
| | | | |
| | | | | | | 8,735,155 | | | | | | | | 16,304,884 | |
| | | | |
Reinvestment of distributions | | | | | | | | | | | | | | | | |
Class A | | | 32,439 | | | | 401,923 | | | | 124,397 | | | | 1,251,439 | |
Class B | | | 76 | | | | 908 | | | | 1,470 | | | | 14,233 | |
Class C | | | 1,848 | | | | 21,270 | | | | 3,329 | | | | 31,227 | |
Administrator Class | | | 10,249 | | | | 129,239 | | | | 18,793 | | | | 192,070 | |
Institutional Class | | | 3,024 | | | | 35,774 | | | | 20,974 | | | | 202,192 | |
Investor Class | | | 56,897 | | | | 702,683 | | | | 221,373 | | | | 2,218,158 | |
| | | | |
| | | | | | | 1,291,797 | | | | | | | | 3,909,319 | |
| | | | |
Payment for shares redeemed | | | | | | | | | | | | | | | | |
Class A | | | (117,319 | ) | | | (1,429,058 | ) | | | (378,210 | ) | | | (4,124,839 | ) |
Class B | | | (8,520 | ) | | | (99,749 | ) | | | (21,216 | ) | | | (222,246 | ) |
Class C | | | (29,399 | ) | | | (329,941 | ) | | | (6,926 | ) | | | (71,187 | ) |
Administrator Class | | | (173,531 | ) | | | (2,169,095 | ) | | | (109,209 | ) | | | (1,207,294 | ) |
Institutional Class | | | (31,366 | ) | | | (365,072 | ) | | | (539,856 | ) | | | (5,600,991 | ) |
Investor Class | | | (275,721 | ) | | | (3,355,381 | ) | | | (634,637 | ) | | | (6,889,379 | ) |
| | | | |
| | | | | | | (7,748,296 | ) | | | | | | | (18,115,936 | ) |
| | | | |
Net increase in net assets resulting from capital share transactions | | | | | | | 2,278,656 | | | | | | | | 2,098,267 | |
| | | | |
Total increase in net assets | | | | | | | 2,560,817 | | | | | | | | 16,485,408 | |
| | | | |
| | | | |
Net assets | | | | | | | | | | | | | | | | |
Beginning of period | | | | | | | 89,869,284 | | | | | | | | 73,383,876 | |
| | | | |
End of period | | | | | | $ | 92,430,101 | | | | | | | $ | 89,869,284 | |
| | | | |
Undistributed net investment income | | | | | | $ | 869,503 | | | | | | | $ | 1,294,196 | |
| | | | |
The accompanying notes are an integral part of these financial statements.
| | | | | | |
| Financial highlights | | Wells Fargo Advantage Diversified International Fund | | | 19 | |
(For a share outstanding throughout each period)
| | | | | | | | | | | | | | | | | | | | | | | | | | | | |
| | | Six months ended April 30, 2014 (unaudited) | | | Year ended October 31 | | | Year ended September 30 | |
| CLASS A | | | 2013 | | | 2012 | | | 2011 | | | 20101 | | | 2010 | | | 2009 | |
Net asset value, beginning of period | | $ | 12.25 | | | $ | 10.25 | | | $ | 9.69 | | | $ | 10.29 | | | $ | 9.84 | | | $ | 9.62 | | | $ | 11.68 | |
Net investment income | | | 0.13 | 2 | | | 0.19 | 2 | | | 0.19 | 2 | | | 0.16 | | | | 0.00 | 2,3 | | | 0.09 | 2 | | | 0.14 | 2 |
Net realized and unrealized gains (losses) on investments | | | 0.10 | | | | 2.41 | | | | 0.51 | | | | (0.65 | ) | | | 0.45 | | | | 0.26 | | | | (0.69 | ) |
| | | | | | | | | | | | | | | | | | | | | | | | | | | | |
Total from investment operations | | | 0.23 | | | | 2.60 | | | | 0.70 | | | | (0.49 | ) | | | 0.45 | | | | 0.35 | | | | (0.55 | ) |
Distributions to shareholders from | | | | | | | | | | | | | | | | | | | | | | | | | | | | |
Net investment income | | | (0.19 | ) | | | (0.60 | ) | | | (0.14 | ) | | | (0.11 | ) | | | 0.00 | | | | (0.13 | ) | | | (0.23 | ) |
Net realized gains | | | 0.00 | | | | 0.00 | | | | 0.00 | | | | 0.00 | | | | 0.00 | | | | 0.00 | | | | (1.28 | ) |
| | | | | | | | | | | | | | | | | | | | | | | | | | | | |
Total distributions to shareholders | | | (0.19 | ) | | | (0.60 | ) | | | (0.14 | ) | | | (0.11 | ) | | | 0.00 | | | | (0.13 | ) | | | (1.51 | ) |
Net asset value, end of period | | $ | 12.29 | | | $ | 12.25 | | | $ | 10.25 | | | $ | 9.69 | | | $ | 10.29 | | | $ | 9.84 | | | $ | 9.62 | |
Total return4 | | | 1.83 | % | | | 26.59 | % | | | 7.45 | % | | | (4.83 | )% | | | 4.57 | % | | | 3.64 | % | | | (0.78 | )% |
Ratios to average net assets (annualized) | | | | | | | | | | | | | | | | | | | | | | | | | | | | |
Gross expenses | | | 1.78 | % | | | 1.92 | % | | | 1.68 | % | | | 1.47 | % | | | 1.54 | % | | | 1.64 | % | | | 1.76 | % |
Net expenses | | | 1.41 | % | | | 1.41 | % | | | 1.41 | % | | | 1.41 | % | | | 1.41 | % | | | 1.38 | % | | | 1.41 | % |
Net investment income | | | 2.10 | % | | | 1.75 | % | | | 1.96 | % | | | 1.47 | % | | | 0.59 | % | | | 0.99 | % | | | 1.76 | % |
Supplemental data | | | | | | | | | | | | | | | | | | | | | | | | | | | | |
Portfolio turnover rate | | | 13 | % | | | 40 | % | | | 57 | % | | | 53 | % | | | 5 | % | | | 64 | % | | | 123 | % |
Net assets, end of period (000s omitted) | | | $29,949 | | | | $28,928 | | | | $22,434 | | | | $23,862 | | | | $29,804 | | | | $28,926 | | | | $31,742 | |
| 1. | For the one month ended October 31, 2010. The Fund changed its fiscal year end from September 30 to October 31, effective October 31, 2010. |
| 2. | Calculated based upon average shares outstanding |
| 3. | Amount is less than $0.005. |
| 4. | Total return calculations do not include any sales charges. Returns for periods of less than one year are not annualized. |
The accompanying notes are an integral part of these financial statements.
| | | | |
| 20 | | Wells Fargo Advantage Diversified International Fund | | Financial highlights |
(For a share outstanding throughout each period)
| | | | | | | | | | | | | | | | | | | | | | | | | | | | |
| | | Six months ended
April 30, 2014
(unaudited) | | | Year ended October 31 | | | Year ended September 30 | |
| CLASS B | | | 2013 | | | 2012 | | | 2011 | | | 20101 | | | 2010 | | | 2009 | |
Net asset value, beginning of period | | $ | 11.71 | | | $ | 9.80 | | | $ | 9.19 | | | $ | 9.74 | | | $ | 9.32 | | | $ | 9.12 | | | $ | 11.07 | |
Net investment income (loss) | | | 0.06 | 2 | | | 0.09 | 2 | | | 0.10 | 2 | | | 0.06 | 2 | | | (0.00 | )2,3 | | | (0.05 | )2 | | | 0.07 | 2 |
Net realized and unrealized gains (losses) on investments | | | 0.11 | | | | 2.32 | | | | 0.51 | | | | (0.61 | ) | | | 0.42 | | | | 0.32 | | | | (0.64 | ) |
| | | | | | | | | | | | | | | | | | | | | | | | | | | | |
Total from investment operations | | | 0.17 | | | | 2.41 | | | | 0.61 | | | | (0.55 | ) | | | 0.42 | | | | 0.27 | | | | (0.57 | ) |
Distributions to shareholders from | | | | | | | | | | | | | | | | | | | | | | | | | | | | |
Net investment income | | | (0.07 | ) | | | (0.50 | ) | | | (0.00 | )3 | | | 0.00 | | | | 0.00 | | | | (0.07 | ) | | | (0.10 | ) |
Net realized gains | | | 0.00 | | | | 0.00 | | | | 0.00 | | | | 0.00 | | | | 0.00 | | | | 0.00 | | | | (1.28 | ) |
| | | | | | | | | | | | | | | | | | | | | | | | | | | | |
Total distributions to shareholders | | | (0.07 | ) | | | (0.50 | ) | | | (0.00 | )3 | | | 0.00 | | | | 0.00 | | | | (0.07 | ) | | | (1.38 | ) |
Net asset value, end of period | | $ | 11.81 | | | $ | 11.71 | | | $ | 9.80 | | | $ | 9.19 | | | $ | 9.74 | | | $ | 9.32 | | | $ | 9.12 | |
Total return4 | | | 1.42 | % | | | 25.70 | % | | | 6.69 | % | | | (5.65 | )% | | | 4.51 | % | | | 3.00 | % | | | (1.50 | )% |
Ratios to average net assets (annualized) | | | | | | | | | | | | | | | | | | | | | | | | | | | | |
Gross expenses | | | 2.53 | % | | | 2.68 | % | | | 2.35 | % | | | 2.23 | % | | | 2.28 | % | | | 2.39 | % | | | 2.51 | % |
Net expenses | | | 2.16 | % | | | 2.16 | % | | | 2.12 | % | | | 2.16 | % | | | 2.16 | % | | | 2.13 | % | | | 2.16 | % |
Net investment income (loss) | | | 1.06 | % | | | 0.88 | % | | | 1.11 | % | | | 0.64 | % | | | (0.16 | )% | | | (0.59 | )% | | | 0.93 | % |
Supplemental data | | | | | | | | | | | | | | | | | | | | | | | | | | | | |
Portfolio turnover rate | | | 13 | % | | | 40 | % | | | 57 | % | | | 53 | % | | | 5 | % | | | 64 | % | | | 123 | % |
Net assets, end of period (000s omitted) | | | $85 | | | | $174 | | | | $299 | | | | $482 | | | | $1,084 | | | | $1,046 | | | | $1,739 | |
| 1. | For the one month ended October 31, 2010. The Fund changed its fiscal year end from September 30 to October 31, effective October 31, 2010. |
| 2. | Calculated based upon average shares outstanding |
| 3. | Amount is less than $0.005. |
| 4. | Total return calculations do not include any sales charges. Returns for periods of less than one year are not annualized. |
The accompanying notes are an integral part of these financial statements.
| | | | | | |
| Financial highlights | | Wells Fargo Advantage Diversified International Fund | | | 21 | |
(For a share outstanding throughout each period)
| | | | | | | | | | | | | | | | | | | | | | | | | | | | |
| | | Six months ended
April 30, 2014 (unaudited) | | | Year ended October 31 | | | Year ended September 30 | |
| CLASS C | | | 2013 | | | 2012 | | | 2011 | | | 20101 | | | 2010 | | | 2009 | |
Net asset value, beginning of period | | $ | 11.35 | | | $ | 9.54 | | | $ | 9.01 | | | $ | 9.59 | | | $ | 9.17 | | | $ | 8.98 | | | $ | 10.98 | |
Net investment income (loss) | | | 0.07 | 2 | | | 0.09 | 2 | | | 0.11 | 2 | | | 0.07 | 2 | | | (0.00 | )2,3 | | | 0.02 | 2 | | | 0.07 | 2 |
Net realized and unrealized gains (losses) on investments | | | 0.09 | | | | 2.25 | | | | 0.48 | | | | (0.61 | ) | | | 0.42 | | | | 0.25 | | | | (0.65 | ) |
| | | | | | | | | | | | | | | | | | | | | | | | | | | | |
Total from investment operations | | | 0.16 | | | | 2.34 | | | | 0.59 | | | | (0.54 | ) | | | 0.42 | | | | 0.27 | | | | (0.58 | ) |
Distributions to shareholders from | | | | | | | | | | | | | | | | | | | | | | | | | | | | |
Net investment income | | | (0.13 | ) | | | (0.53 | ) | | | (0.06 | ) | | | (0.04 | ) | | | 0.00 | | | | (0.08 | ) | | | (0.14 | ) |
Net realized gains | | | 0.00 | | | | 0.00 | | | | 0.00 | | | | 0.00 | | | | 0.00 | | | | 0.00 | | | | (1.28 | ) |
| | | | | | | | | | | | | | | | | | | | | | | | | | | | |
Total distributions to shareholders | | | (0.13 | ) | | | (0.53 | ) | | | (0.06 | ) | | | (0.04 | ) | | | 0.00 | | | | (0.08 | ) | | | (1.42 | ) |
Net asset value, end of period | | $ | 11.38 | | | $ | 11.35 | | | $ | 9.54 | | | $ | 9.01 | | | $ | 9.59 | | | $ | 9.17 | | | $ | 8.98 | |
Total return4 | | | 1.44 | % | | | 25.67 | % | | | 6.67 | % | | | (5.65 | )% | | | 4.58 | % | | | 3.07 | % | | | (1.47 | )% |
Ratios to average net assets (annualized) | | | | | | | | | | | | | | | | | | | | | | | | | | | | |
Gross expenses | | | 2.53 | % | | | 2.66 | % | | | 2.43 | % | | | 2.22 | % | | | 2.28 | % | | | 2.39 | % | | | 2.51 | % |
Net expenses | | | 2.16 | % | | | 2.16 | % | | | 2.16 | % | | | 2.16 | % | | | 2.16 | % | | | 2.12 | % | | | 2.16 | % |
Net investment income (loss) | | | 1.34 | % | | | 0.84 | % | | | 1.21 | % | | | 0.72 | % | | | (0.16 | )% | | | 0.20 | % | | | 0.92 | % |
Supplemental data | | | | | | | | | | | | | | | | | | | | | | | | | | | | |
Portfolio turnover rate | | | 13 | % | | | 40 | % | | | 57 | % | | | 53 | % | | | 5 | % | | | 64 | % | | | 123 | % |
Net assets, end of period (000s omitted) | | | $1,992 | | | | $1,746 | | | | $628 | | | | $625 | | | | $744 | | | | $718 | | | | $719 | |
| 1. | For the one month ended October 31, 2010. The Fund changed its fiscal year end from September 30 to October 31, effective October 31, 2010. |
| 2. | Calculated based upon average shares outstanding |
| 3. | Amount is less than $0.005. |
| 4. | Total return calculations do not include any sales charges. Returns for periods of less than one year are not annualized. |
The accompanying notes are an integral part of these financial statements.
| | | | |
| 22 | | Wells Fargo Advantage Diversified International Fund | | Financial highlights |
(For a share outstanding throughout each period)
| | | | | | | | | | | | | | | | | | | | | | | | | | | | |
| | | Six months ended
April 30, 2014 (unaudited) | | | Year ended October 31 | | | Year ended September 30 | |
| ADMINISTRATOR CLASS | | | 2013 | | | 2012 | | | 2011 | | | 20101 | | | 2010 | | | 2009 | |
Net asset value, beginning of period | | $ | 12.47 | | | $ | 10.42 | | | $ | 9.68 | | | $ | 10.28 | | | $ | 9.83 | | | $ | 9.59 | | | $ | 11.67 | |
Net investment income | | | 0.14 | 2 | | | 0.19 | 2 | | | 0.21 | 2 | | | 0.05 | 2 | | | 0.00 | 2,3 | | | 0.12 | 2 | | | 0.16 | 2 |
Net realized and unrealized gains (losses) on investments | | | 0.10 | | | | 2.47 | | | | 0.53 | | | | (0.52 | ) | | | 0.45 | | | | 0.26 | | | | (0.70 | ) |
| | | | | | | | | | | | | | | | | | | | | | | | | | | | |
Total from investment operations | | | 0.24 | | | | 2.66 | | | | 0.74 | | | | (0.47 | ) | | | 0.45 | | | | 0.38 | | | | (0.54 | ) |
Distributions to shareholders from | | | | | | | | | | | | | | | | | | | | | | | | | | | | |
Net investment income | | | (0.20 | ) | | | (0.61 | ) | | | 0.00 | | | | (0.13 | ) | | | 0.00 | | | | (0.14 | ) | | | (0.26 | ) |
Net realized gains | | | 0.00 | | | | 0.00 | | | | 0.00 | | | | 0.00 | | | | 0.00 | | | | 0.00 | | | | (1.28 | ) |
| | | | | | | | | | | | | | | | | | | | | | | | | | | | |
Total distributions to shareholders | | | (0.20 | ) | | | (0.61 | ) | | | 0.00 | | | | (0.13 | ) | | | 0.00 | | | | (0.14 | ) | | | (1.54 | ) |
Net asset value, end of period | | $ | 12.51 | | | $ | 12.47 | | | $ | 10.42 | | | $ | 9.68 | | | $ | 10.28 | | | $ | 9.83 | | | $ | 9.59 | |
Total return4 | | | 1.89 | % | | | 26.85 | % | | | 7.64 | % | | | (4.69 | )% | | | 4.58 | % | | | 3.87 | % | | | (0.66 | )% |
Ratios to average net assets (annualized) | | | | | | | | | | | | | | | | | | | | | | | | | | | | |
Gross expenses | | | 1.62 | % | | | 1.74 | % | | | 1.52 | % | | | 1.35 | % | | | 1.38 | % | | | 1.46 | % | | | 1.58 | % |
Net expenses | | | 1.25 | % | | | 1.25 | % | | | 1.25 | % | | | 1.24 | % | | | 1.25 | % | | | 1.22 | % | | | 1.25 | % |
Net investment income | | | 2.28 | % | | | 1.72 | % | | | 2.11 | % | | | 0.44 | % | | | 0.75 | % | | | 1.31 | % | | | 2.02 | % |
Supplemental data | | | | | | | | | | | | | | | | | | | | | | | | | | | | |
Portfolio turnover rate | | | 13 | % | | | 40 | % | | | 57 | % | | | 53 | % | | | 5 | % | | | 64 | % | | | 123 | % |
Net assets, end of period (000s omitted) | | | $8,178 | | | | $8,195 | | | | $3,504 | | | | $3,421 | | | | $202,247 | | | | $193,626 | | | | $261,004 | |
| 1. | For the one month ended October 31, 2010. The Fund changed its fiscal year end from September 30 to October 31, effective October 31, 2010. |
| 2. | Calculated based upon average shares outstanding |
| 3. | Amount is less than $0.005. |
| 4. | Returns for periods of less than one year are not annualized. |
The accompanying notes are an integral part of these financial statements.
| | | | | | |
| Financial highlights | | Wells Fargo Advantage Diversified International Fund | | | 23 | |
(For a share outstanding throughout each period)
| | | | | | | | | | | | | | | | | | | | | | | | | | | | |
| | | Six months ended
April 30, 2014 (unaudited) | | | Year ended October 31 | | | Year ended September 30 | |
| INSTITUTIONAL CLASS | | | 2013 | | | 2012 | | | 2011 | | | 20101 | | | 2010 | | | 2009 | |
Net asset value, beginning of period | | $ | 11.79 | | | $ | 10.20 | | | $ | 9.69 | | | $ | 10.29 | | | $ | 9.84 | | | $ | 9.60 | | | $ | 11.69 | |
Net investment income | | | 0.14 | 2 | | | 0.20 | 2 | | | 0.19 | 2 | | | 0.23 | | | | 0.00 | 2,3 | | | 0.15 | 2 | | | 0.18 | 2 |
Net realized and unrealized gains (losses) on investments | | | 0.10 | | | | 2.37 | | | | 0.51 | | | | (0.68 | ) | | | 0.45 | | | | 0.24 | | | | (0.70 | ) |
| | | | | | | | | | | | | | | | | | | | | | | | | | | | |
Total from investment operations | | | 0.24 | | | | 2.57 | | | | 0.70 | | | | (0.45 | ) | | | 0.45 | | | | 0.39 | | | | (0.52 | ) |
Distributions to shareholders from | | | | | | | | | | | | | | | | | | | | | | | | | | | | |
Net investment income | | | (0.28 | ) | | | (0.98 | ) | | | (0.19 | ) | | | (0.15 | ) | | | 0.00 | | | | (0.15 | ) | | | (0.29 | ) |
Net realized gains | | | 0.00 | | | | 0.00 | | | | 0.00 | | | | 0.00 | | | | 0.00 | | | | 0.00 | | | | (1.28 | ) |
| | | | | | | | | | | | | | | | | | | | | | | | | | | | |
Total distributions to shareholders | | | (0.28 | ) | | | (0.98 | ) | | | (0.19 | ) | | | (0.15 | ) | | | 0.00 | | | | (0.15 | ) | | | (1.57 | ) |
Net asset value, end of period | | $ | 11.75 | | | $ | 11.79 | | | $ | 10.20 | | | $ | 9.69 | | | $ | 10.29 | | | $ | 9.84 | | | $ | 9.60 | |
Total return4 | | | 1.99 | % | | | 27.28 | % | | | 7.51 | % | | | (4.48 | )% | | | 4.57 | % | | | 4.13 | % | | | (0.41 | )% |
Ratios to average net assets (annualized) | | | | | | | | | | | | | | | | | | | | | | | | | | | | |
Gross expenses | | | 1.35 | % | | | 1.50 | % | | | 1.20 | % | | | 1.03 | % | | | 1.11 | % | | | 1.19 | % | | | 1.31 | % |
Net expenses | | | 0.99 | % | | | 0.99 | % | | | 0.99 | % | | | 0.99 | % | | | 0.99 | % | | | 0.96 | % | | | 0.99 | % |
Net investment income | | | 2.41 | % | | | 1.94 | % | | | 1.96 | % | | | 2.17 | % | | | 1.00 | % | | | 1.63 | % | | | 2.30 | % |
Supplemental data | | | | | | | | | | | | | | | | | | | | | | | | | | | | |
Portfolio turnover rate | | | 13 | % | | | 40 | % | | | 57 | % | | | 53 | % | | | 5 | % | | | 64 | % | | | 123 | % |
Net assets, end of period (000s omitted) | | | $2,068 | | | | $2,406 | | | | $7,367 | | | | $419,925 | | | | $199,081 | | | | $194,651 | | | | $69,698 | |
| 1. | For the one month ended October 31, 2010. The Fund changed its fiscal year end from September 30 to October 31, effective October 31, 2010. |
| 2. | Calculated based upon average shares outstanding |
| 3. | Amount is less than $0.005. |
| 4. | Returns for periods of less than one year are not annualized. |
The accompanying notes are an integral part of these financial statements.
| | | | |
| 24 | | Wells Fargo Advantage Diversified International Fund | | Financial highlights |
(For a share outstanding throughout each period)
| | | | | | | | | | | | | | | | | | | | | | | | | | | | |
| | | Six months ended
April 30, 2014 (unaudited) | | | Year ended October 31 | | | Year ended September 30 | |
| INVESTOR CLASS | | | 2013 | | | 2012 | | | 2011 | | | 20101 | | | 2010 | | | 2009 | |
Net asset value, beginning of period | | $ | 12.20 | | | $ | 10.21 | | | $ | 9.65 | | | $ | 10.26 | | | $ | 9.81 | | | $ | 9.58 | | | $ | 11.68 | |
Net investment income | | | 0.12 | 2 | | | 0.18 | 2 | | | 0.18 | | | | 0.13 | | | | 0.00 | 2,3 | | | 0.11 | 2 | | | 0.14 | 2 |
Net realized and unrealized gains (losses) on investments | | | 0.10 | | | | 2.40 | | | | 0.52 | | | | (0.63 | ) | | | 0.45 | | | | 0.24 | | | | (0.70 | ) |
| | | | | | | | | | | | | | | | | | | | | | | | | | | | |
Total from investment operations | | | 0.22 | | | | 2.58 | | | | 0.70 | | | | (0.50 | ) | | | 0.45 | | | | 0.35 | | | | (0.56 | ) |
Distributions to shareholders from | | | | | | | | | | | | | | | | | | | | | | | | | | | | |
Net investment income | | | (0.18 | ) | | | (0.59 | ) | | | (0.14 | ) | | | (0.11 | ) | | | 0.00 | | | | (0.12 | ) | | | (0.26 | ) |
Net realized gains | | | 0.00 | | | | 0.00 | | | | 0.00 | | | | 0.00 | | | | 0.00 | | | | 0.00 | | | | (1.28 | ) |
| | | | | | | | | | | | | | | | | | | | | | | | | | | | |
Total distributions to shareholders | | | (0.18 | ) | | | (0.59 | ) | | | (0.14 | ) | | | (0.11 | ) | | | 0.00 | | | | (0.12 | ) | | | (1.54 | ) |
Net asset value, end of period | | $ | 12.24 | | | $ | 12.20 | | | $ | 10.21 | | | $ | 9.65 | | | $ | 10.26 | | | $ | 9.81 | | | $ | 9.58 | |
Total return4 | | | 1.79 | % | | | 26.54 | % | | | 7.43 | % | | | 4.97 | % | | | 4.59 | % | | | 3.74 | % | | | (0.82 | )% |
Ratios to average net assets (annualized) | | | | | | | | | | | | | | | | | | | | | | | | | | | | |
Gross expenses | | | 1.84 | % | | | 1.97 | % | | | 1.74 | % | | | 1.54 | % | | | 1.61 | % | | | 1.73 | % | | | 1.87 | % |
Net expenses | | | 1.46 | % | | | 1.46 | % | | | 1.46 | % | | | 1.46 | % | | | 1.46 | % | | | 1.43 | % | | | 1.46 | % |
Net investment income | | | 2.05 | % | | | 1.67 | % | | | 1.91 | % | | | 1.43 | % | | | 0.54 | % | | | 1.18 | % | | | 1.75 | % |
Supplemental data | | | | | | | | | | | | | | | | | | | | | | | | | | | | |
Portfolio turnover rate | | | 13 | % | | | 40 | % | | | 57 | % | | | 53 | % | | | 5 | % | | | 64 | % | | | 123 | % |
Net assets, end of period (000s omitted) | | | $50,158 | | | | $48,421 | | | | $39,152 | | | | $40,456 | | | | $48,070 | | | | $46,282 | | | | $47,569 | |
| 1. | For the one month ended October 31, 2010. The Fund changed its fiscal year end from September 30 to October 31, effective October 31, 2010. |
| 2. | Calculated based upon average shares outstanding |
| 3. | Amount is less than $0.005. |
| 4. | Returns for periods of less than one year are not annualized. |
The accompanying notes are an integral part of these financial statements.
| | | | | | |
| Notes to financial statements (unaudited) | | Wells Fargo Advantage Diversified International Fund | | | 25 | |
1. ORGANIZATION
Wells Fargo Funds Trust (the “Trust”), a Delaware statutory trust organized on March 10, 1999, is an open-end management investment company registered under the Investment Company Act of 1940, as amended (the “1940 Act”). These financial statements report on the Wells Fargo Advantage Diversified International Fund (the “Fund”) which is a diversified series of the Trust.
2. SIGNIFICANT ACCOUNTING POLICIES
The following significant accounting policies, which are consistently followed in the preparation of the financial statements of the Fund, are in conformity with U.S. generally accepted accounting principles which require management to make estimates and assumptions that affect the reported amounts of assets and liabilities, disclosure of contingent assets and liabilities at the date of the financial statements, and the reported amounts of revenues and expenses during the reporting period. Actual results could differ from those estimates.
Securities valuation
All investments are valued each business day as of the close of regular trading on the New York Stock Exchange (generally 4 p.m. Eastern Time).
Equity securities that are listed on a foreign or domestic exchange or market are valued at the official closing price or, if none, the last sales price. If no sale occurs on the primary exchange or market for the security that day, the prior day’s price will be deemed “stale” and fair values will be determined in accordance with the Fund’s Valuation Procedures.
The values of securities denominated in foreign currencies are translated into U.S. dollars at rates provided by an independent foreign currency pricing source at a time each business day specified by the Management Valuation Team of Wells Fargo Funds Management, LLC (“Funds Management”).
Many securities markets and exchanges outside the U.S. close prior to the close of the New York Stock Exchange and therefore may not fully reflect trading or events that occur after the close of the principal exchange in which the foreign securities are traded, but before the close of the New York Stock Exchange. If such trading or events are expected to materially affect the value of such securities, then fair value pricing procedures approved by the Board of Trustees of the Fund are applied. These procedures take into account multiple factors including movements in U.S. securities markets after foreign exchanges close. Foreign securities that are fair valued under these procedures are categorized as Level 2 and the application of these procedures may result in transfers between Level 1 and Level 2. Depending on market activity, such fair valuations may be frequent. Such fair value pricing may result in NAVs that are higher or lower than NAVs based on the last reported sales price or latest quoted bid price. On April 30, 2014, such fair value pricing was not used in pricing foreign securities.
Investments in registered open-end investment companies are valued at net asset value. Non-registered investment vehicles are fair valued at net asset value.
Investments which are not valued using any of the methods discussed above are valued at their fair value, as determined in good faith by the Board of Trustees. The Board of Trustees has established a Valuation Committee comprised of the Trustees and has delegated to it the authority to take any actions regarding the valuation of portfolio securities that the Valuation Committee deems necessary or appropriate, including determining the fair value of portfolio securities, unless the determination has been delegated to the Management Valuation Team. The Board of Trustees retains the authority to make or ratify any valuation decisions or approve any changes to the Valuation Procedures as it deems appropriate. On a quarterly basis, the Board of Trustees receives reports on any valuation actions taken by the Valuation Committee or the Management Valuation Team which may include items for ratification.
Valuations of fair valued securities are compared to the next actual sales price when available, or other appropriate market values, to assess the continued appropriateness of the fair valuation methodologies used. These securities are fair valued on a day-to-day basis, taking into consideration changes to appropriate market information and any significant changes to the inputs considered in the valuation process until there is a readily available price provided on an exchange or by an independent pricing service. Valuations received from an independent pricing service or independent broker-dealer quotes are periodically validated by comparisons to most recent trades and valuations provided by other independent pricing services in addition to the review of prices by the adviser and/or subadviser. Unobservable inputs used in determining fair valuations are identified based on the type of security, taking into consideration factors utilized by market participants in valuing the investment, knowledge about the issuer and the current market environment.
| | | | |
| 26 | | Wells Fargo Advantage Diversified International Fund | | Notes to financial statements (unaudited) |
Foreign currency translation
The accounting records of the Fund are maintained in U.S. dollars. The values of other assets and liabilities denominated in foreign currencies are translated into U.S. dollars at rates provided by an independent foreign currency pricing source at a time each business day specified by the Management Valuation Team. Purchases and sales of securities, and income and expenses are converted at the rate of exchange on the respective dates of such transactions. Net realized foreign exchange gains or losses arise from sales of foreign currencies, currency gains or losses realized between the trade and settlement dates on securities transactions, and the difference between the amounts of dividends, interest and foreign withholding taxes recorded and the U.S. dollar equivalent of the amounts actually paid or received. Net unrealized foreign exchange gains and losses arise from changes in the fair value of assets and liabilities other than investments in securities resulting from changes in exchange rates. The changes in net assets arising from changes in exchange rates and the changes in net assets resulting from changes in market prices of securities are not separately presented. Such changes are included in net realized and unrealized gains or losses from investments.
Forward foreign currency contracts
The Fund is subject to foreign currency exchange rate risk in the normal course of pursuing its investment objectives. A forward foreign currency contract is an agreement between two parties to purchase or sell a specific currency for an agreed-upon price at a future date. The Fund enters into forward foreign currency contracts to facilitate transactions in foreign-denominated securities and to attempt to minimize the risk to the Fund from adverse changes in the relationship between currencies. Forward foreign currency contracts are recorded at the forward rate and marked-to-market daily. When the contracts are closed, realized gains and losses arising from such transactions are recorded as realized gains or losses on forward foreign currency contract transactions. The Fund could be exposed to risks if the counterparties to the contracts are unable to meet the terms of their contracts or if the value of the foreign currency changes unfavorably. The Fund’s maximum risk of loss from counterparty credit risk is the unrealized gains on the contracts. This risk may be mitigated if there is a master netting arrangement between the Fund and the counterparty.
Security loans
The Fund may lend its securities from time to time in order to earn additional income in the form of fees or interest on securities received as collateral or the investment of any cash received as collateral. The Fund continues to receive interest or dividends on the securities loaned. The Fund receives collateral in the form of cash or securities with a value at least equal to the value of the securities on loan. The value of the loaned securities is determined at the close of each business day and any additional required collateral is delivered to the Fund on the next business day. In a securities lending transaction, the net asset value of the Fund will be affected by an increase or decrease in the value of the securities loaned and by an increase or decrease in the value of the instrument in which collateral is invested. The amount of securities lending activity undertaken by the Fund fluctuates from time to time. In the event of default or bankruptcy by the borrower, the Fund may be prevented from recovering the loaned securities or gaining access to the collateral or may experience delays or costs in doing so. In addition, the investment of any cash collateral received may lose all or part of its value. The Fund has the right under the lending agreement to recover the securities from the borrower on demand.
The Fund lends its securities through an unaffiliated securities lending agent. Cash collateral received in connection with its securities lending transactions is invested in Wells Fargo Securities Lending Cash Investments, LLC (the “Securities Lending Fund”). The Securities Lending Fund is exempt from registration under Section 3(c)(7) of the 1940 Act and is managed by Funds Management and is subadvised by Wells Capital Management Incorporated (“WellsCap”). Funds Management receives an advisory fee starting at 0.05% and declining to 0.01% as the average daily net assets of the Securities Lending Fund increase. All of the fees received by Funds Management are paid to WellsCap for its services as subadviser. The Securities Lending Fund seeks to provide a positive return compared to the daily Fed Funds Open rate by investing in high-quality, U.S. dollar-denominated short-term money market instruments. Securities Lending Fund investments are fair valued based upon the amortized cost valuation technique. Income earned from investment in the Securities Lending Fund is included in securities lending income on the Statement of Operations.
Security transactions and income recognition
Securities transactions are recorded on a trade date basis. Realized gains or losses are recorded on the basis of identified cost.
Dividend income is recognized on the ex-dividend date, except for certain dividends from foreign securities, which are recorded as soon as the Fund is informed of the ex-dividend date. Dividend income from foreign securities is recorded net of foreign taxes withheld where recovery of such taxes is not assured.
| | | | | | |
| Notes to financial statements (unaudited) | | Wells Fargo Advantage Diversified International Fund | | | 27 | |
Distributions to shareholders
Distributions to shareholders from net investment income and net realized gains, if any, are recorded on the ex-dividend date. Such distributions are determined in conformity with federal income tax regulations, which may differ in amount or character from net investment income and realized gains recognized for purposes of U.S. generally accepted accounting principles.
Federal and other taxes
The Fund intends to continue to qualify as a regulated investment company by distributing substantially all of its investment company taxable income and any net realized capital gains (after reduction for capital loss carryforwards) sufficient to relieve it from all, or substantially all, federal income taxes. Accordingly, no provision for federal income taxes was required.
The Fund’s income and federal excise tax returns and all financial records supporting those returns for the prior three fiscal years are subject to examination by the federal and Delaware revenue authorities. Management has analyzed the Fund’s tax positions taken on federal, state, and foreign tax returns for all open tax years and does not believe that there are any uncertain tax positions that require recognition of a tax liability.
As of October 31, 2013, capital loss carryforwards available to offset future net realized capital gains were as follows through the indicated expiration dates:
| | | | |
| | | No expiration |
| 2017 | | Short-term | | Long-term |
| $89,306,475 | | $7,627,167 | | $6,498,491 |
Class allocations
The separate classes of shares offered by the Fund differ principally in applicable sales charges, distribution, shareholder servicing, and administration fees. Shareholders of each class bear certain expenses that pertain to that particular class. All shareholders bear the common expenses of the Fund, earn income from the portfolio, and are allocated any unrealized gains and losses pro rata based on the average daily net assets of each class, without distinction between share classes. Dividends are determined separately for each class based on income and expenses allocable to each class. Realized gains and losses are allocated to each class pro rata based upon the net assets of each class on the date realized. Differences in per share dividend rates generally result from the relative weightings of pro rata income and realized gain allocations and from differences in separate class expenses, including distribution, shareholder servicing, and administration fees.
3. FAIR VALUATION MEASUREMENTS
Fair value measurements of investments are determined within a framework that has established a fair value hierarchy based upon the various data inputs utilized in determining the value of the Fund’s investments. The three-level hierarchy gives the highest priority to unadjusted quoted prices in active markets for identical assets or liabilities (Level 1) and the lowest priority to significant unobservable inputs (Level 3). The Fund’s investments are classified within the fair value hierarchy based on the lowest level of input that is significant to the fair value measurement. The inputs are summarized into three broad levels as follows:
| n | | Level 1 – quoted prices in active markets for identical securities |
| n | | Level 2 – other significant observable inputs (including quoted prices for similar securities, interest rates, prepayment speeds, credit risk, use of amortized cost, etc.) |
| n | | Level 3 – significant unobservable inputs (including the Fund’s own assumptions in determining the fair value of investments) |
The inputs or methodologies used for valuing investments in securities are not necessarily an indication of the risk associated with investing in those securities.
| | | | |
| 28 | | Wells Fargo Advantage Diversified International Fund | | Notes to financial statements (unaudited) |
As of April 30, 2014, the inputs used in valuing investments in securities were as follows:
| | | | | | | | | | | | | | | | |
| Investments in securities | | Quoted prices (Level 1) | | | Other significant
observable inputs (Level 2) | | | Significant unobservable inputs (Level 3) | | | Total | |
Equity securities | | | | | | | | | | | | | | | | |
Common stocks | | | | | | | | | | | | | | | | |
Australia | | $ | 2,390,089 | | | $ | 0 | | | $ | 0 | | | $ | 2,390,089 | |
Austria | | | 403,094 | | | | 0 | | | | 0 | | | | 403,094 | |
Belgium | | | 1,656,529 | | | | 0 | | | | 0 | | | | 1,656,529 | |
Brazil | | | 377,408 | | | | 0 | | | | 0 | | | | 377,408 | |
Canada | | | 2,057,349 | | | | 0 | | | | 0 | | | | 2,057,349 | |
China | | | 4,757,879 | | | | 0 | | | | 0 | | | | 4,757,879 | |
Czech Republic | | | 96,212 | | | | 0 | | | | 0 | | | | 96,212 | |
Denmark | | | 286,146 | | | | 0 | | | | 0 | | | | 286,146 | |
Finland | | | 158,438 | | | | 0 | | | | 0 | | | | 158,438 | |
France | | | 5,362,148 | | | | 0 | | | | 0 | | | | 5,362,148 | |
Germany | | | 10,596,429 | | | | 0 | | | | 0 | | | | 10,596,429 | |
Hong Kong | | | 3,032,691 | | | | 0 | | | | 0 | | | | 3,032,691 | |
India | | | 711,562 | | | | 0 | | | | 0 | | | | 711,562 | |
Indonesia | | | 206,794 | | | | 0 | | | | 0 | | | | 206,794 | |
Ireland | | | 1,057,048 | | | | 0 | | | | 0 | | | | 1,057,048 | |
Israel | | | 443,762 | | | | 0 | | | | 0 | | | | 443,762 | |
Italy | | | 2,258,833 | | | | 0 | | | | 0 | | | | 2,258,833 | |
Japan | | | 15,997,056 | | | | 0 | | | | 0 | | | | 15,997,056 | |
Liechtenstein | | | 139,507 | | | | 0 | | | | 0 | | | | 139,507 | |
Malaysia | | | 76,527 | | | | 0 | | | | 0 | | | | 76,527 | |
Mexico | | | 667,651 | | | | 0 | | | | 0 | | | | 667,651 | |
Netherlands | | | 3,279,147 | | | | 0 | | | | 0 | | | | 3,279,147 | |
Nigeria | | | 7,049 | | | | 0 | | | | 0 | | | | 7,049 | |
Norway | | | 1,472,567 | | | | 0 | | | | 0 | | | | 1,472,567 | |
Poland | | | 87,692 | | | | 0 | | | | 0 | | | | 87,692 | |
Russia | | | 859,821 | | | | 235,023 | | | | 0 | | | | 1,094,844 | |
South Africa | | | 242,294 | | | | 0 | | | | 0 | | | | 242,294 | |
South Korea | | | 2,481,646 | | | | 0 | | | | 0 | | | | 2,481,646 | |
Spain | | | 545,885 | | | | 0 | | | | 0 | | | | 545,885 | |
Sweden | | | 1,616,560 | | | | 0 | | | | 0 | | | | 1,616,560 | |
Switzerland | | | 7,735,496 | | | | 0 | | | | 0 | | | | 7,735,496 | |
Taiwan | | | 74,412 | | | | 0 | | | | 0 | | | | 74,412 | |
Thailand | | | 133,894 | | | | 0 | | | | 0 | | | | 133,894 | |
United Kingdom | | | 15,348,217 | | | | 12,506 | | | | 0 | | | | 15,360,723 | |
United States | | | 1,320,462 | | | | 0 | | | | 0 | | | | 1,320,462 | |
Preferred stocks | | | | | | | | | | | | | | | | |
Brazil | | | 235,151 | | | | 0 | | | | 0 | | | | 235,151 | |
Germany | | | 440,884 | | | | 0 | | | | 0 | | | | 440,884 | |
Participation notes | | | 0 | | | | 362,163 | | | | 0 | | | | 362,163 | |
Short-term investments | | | | | | | | | | | | | | | | |
Investment companies | | | 1,962,886 | | | | 3,582,356 | | | | 0 | | | | 5,545,242 | |
| | | $ | 90,577,215 | | | $ | 4,192,048 | | | $ | 0 | | | $ | 94,769,263 | |
| | | | | | |
| Notes to financial statements (unaudited) | | Wells Fargo Advantage Diversified International Fund | | | 29 | |
As of April 30, 2014, the inputs used in valuing the Fund’s other financial instruments were as follows:
| | | | | | | | | | | | | | | | |
| Other financial instruments | | Quoted prices (Level 1) | | | Other significant
observable inputs (Level 2) | | | Significant unobservable inputs (Level 3) | | | Total | |
Forward foreign currency contracts | | $ | 0 | | | $ | (33,251 | )* | | $ | 0 | | | $ | (33,251 | ) |
| * | Amount represents the net unrealized losses. |
Transfers in and transfers out are recognized at the end of the reporting period. For the six months ended April 30, 2014, the Fund did not have any transfers into/out of Level 1, Level 2, or Level 3.
4. TRANSACTIONS WITH AFFILIATES AND OTHER EXPENSES
Advisory fee
The Trust has entered into an advisory contract with Funds Management, an indirect wholly owned subsidiary of Wells Fargo & Company (“Wells Fargo”). The adviser is responsible for implementing investment policies and guidelines and for supervising the subadvisers, who are responsible for day-to-day portfolio management of the Fund.
Pursuant to the contract, Funds Management is entitled to receive an annual advisory fee starting at 0.85% and declining to 0.70% as the average daily net assets of the Fund increase. For the six months ended April 30, 2014, the advisory fee was equivalent to an annual rate of 0.85% of the Fund’s average daily net assets.
Funds Management has retained the services of certain subadvisers to provide daily portfolio management to the Fund. The fee for subadvisory services is borne by Funds Management. Artisan Partners Limited Partnership, LSV Asset Management, and WellsCap (an affiliate of Funds Management and an indirect wholly owned subsidiary of Wells Fargo) are the subadvisers to the Fund and are each entitled to receive a fee from Funds Management which is calculated based on the average daily net assets of the subadviser’s portion of the Fund as follows:
| | | | | | | | |
| | | Annual subadvisory fee | |
| | | starting at | | | declining to | |
Artisan Partners Limited Partnership | | | 0.80 | % | | | 0.50 | % |
LSV Asset Management | | | 0.35 | | | | 0.30 | |
WellsCap | | | 0.45 | | | | 0.40 | |
Administration and transfer agent fees
The Trust has entered into an administration agreement with Funds Management. Under this agreement, for providing administrative services, which includes paying fees and expenses for services provided by the transfer agent, sub-transfer agents, omnibus account servicers and record-keepers, Funds Management is entitled to receive from the Fund an annual fund level administration fee starting at 0.05% and declining to 0.03% as the average daily net assets of the Fund increase and a class level administration fee which is calculated based on the average daily net assets of each class as follows:
| | | | |
| | | Class level
administration fee | |
Class A, Class B, Class C, | | | 0.26 | % |
Administrator Class | | | 0.10 | |
Institutional Class | | | 0.08 | |
Investor Class | | | 0.32 | |
Funds Management has contractually waived and/or reimbursed advisory and administration fees to the extent necessary to maintain certain net operating expense ratios for the Fund. Waiver of fees and/or reimbursement of expenses by Funds Management were made first from fund level expenses on a proportionate basis and then from class specific expenses. Funds Management has committed through February 28, 2015 to waive fees and/or reimburse expenses to the extent necessary to cap the Fund’s expenses at 1.41% for Class A shares, 2.16% for Class B shares, 2.16% for Class C shares, 1.25% for Administrator Class shares, 0.99% for Institutional Class shares, and 1.46% for Investor Class shares.
| | | | |
| 30 | | Wells Fargo Advantage Diversified International Fund | | Notes to financial statements (unaudited) |
Distribution fees
The Trust has adopted a Distribution Plan for Class B and Class C shares of the Fund pursuant to Rule 12b-1 under the 1940 Act. Distribution fees are charged to Class B and Class C shares and paid to Wells Fargo Funds Distributor, LLC, the principal underwriter, at an annual rate of 0.75% of the average daily net assets of Class B and Class C shares.
For the six months ended April 30, 2014, Wells Fargo Funds Distributor, LLC received $2,100 from the sale of Class A shares and $650 in contingent deferred sales charges from redemptions of Class C shares.
Shareholder servicing fees
The Trust has entered into contracts with one or more shareholder servicing agents, whereby Class A, Class B, Class C, Administrator Class, and Investor Class of the Fund is charged a fee at an annual rate of 0.25% of the average daily net assets of each respective class.
A portion of these total shareholder servicing fees were paid to affiliates of Wells Fargo.
5. INVESTMENT PORTFOLIO TRANSACTIONS
Purchases and sales of investments, excluding U.S. government obligations (if any) and short-term securities, for the six months ended April 30, 2014 were $13,561,562 and $11,522,086, respectively.
6. DERIVATIVE TRANSACTIONS
During the six months ended April 30, 2014, the Fund entered into forward foreign currency contracts for economic hedging purposes.
At April 30, 2014, the Fund had forward foreign currency contracts outstanding as follows:
Forward foreign currency contracts to sell:
| | | | | | | | | | | | | | | | | | |
| Exchange date | | Counterparty | | Contracts to
deliver | | | U.S. value at April 30, 2014 | | | In exchange for U.S. $ | | | Unrealized
losses | |
| 7-8-2014 | | Barclays | | | 270,813,800 | JPY | | $ | 2,649,979 | | | $ | 2,616,728 | | | $ | (33,251 | ) |
The Fund had average contract amounts of $72,667 and $2,632,809 in forward foreign currency contracts to buy and forward foreign currency contracts to sell, respectively, during the six months ended April 30, 2014.
The fair value, realized gains or losses and change in unrealized gains or losses, if any, on derivative instruments are reflected in the appropriate financial statements.
For certain types of derivative transactions, the Fund has entered into International Swaps and Derivatives Association, Inc. master agreements (“ISDA Master Agreements”) or similar agreements with approved counterparties. The ISDA Master Agreements or similar agreements may have requirements to deliver/deposit securities or cash to/with an exchange or broker-dealer as collateral and allows the Fund to offset, with each counterparty, certain derivative financial instrument’s assets and/or liabilities with collateral held or pledged. Collateral requirements differ by type of derivative. Collateral or margin requirements are set by the broker or exchange clearing house for exchange traded derivatives while collateral terms are contract specific for over-the-counter traded derivatives. Cash collateral that has been pledged to cover obligations of the Fund under the ISDA Master Agreements or similar agreements, if any, will be reported separately in the Statement of Assets and Liabilities. Securities pledged as collateral, if any, for the same purpose are noted in the Portfolio of Investments. With respect to balance sheet offsetting, absent an event of default by the counterparty or a termination of the agreement, the reported amounts of financial assets and financial liabilities in the Statement of Assets and Liabilities are not offset across transactions between the Fund and the applicable counterparty. A reconciliation of the gross amounts on the Statement of Assets and Liabilities to the net amounts by derivative type, including any collateral exposure, is as follows:
| | | | | | | | | | | | | | | | |
| Derivative type | | Counterparty | | Gross amounts of
liabilities in the
Statement of
Assets and
Liabilities | | Amounts subject to
netting agreements | | | Collateral
pledged | | | Net amount
of liabilities | |
Forward foreign currency contracts | | Barclays | | $33,251* | | $ | 0 | | | $ | 0 | | | $ | 33,251 | |
| * | Amount represents net unrealized losses. |
| | | | | | |
| Notes to financial statements (unaudited) | | Wells Fargo Advantage Diversified International Fund | | | 31 | |
7. BANK BORROWINGS
The Trust (excluding the money market funds and certain other funds in the Trust) and Wells Fargo Variable Trust are parties to a $150,000,000 revolving credit agreement with State Street Bank and Trust Company, whereby the Fund is permitted to use bank borrowings for temporary or emergency purposes, such as to fund shareholder redemption requests. Interest under the credit agreement is charged to the Fund based on a borrowing rate equal to the higher of the Federal Funds rate in effect on that day plus 1.25% or the overnight LIBOR rate in effect on that day plus 1.25%. In addition, an annual commitment fee equal to 0.10% of the unused balance is allocated to each participating fund. For the six months ended April 30, 2014, the Fund paid $44 in commitment fees.
For the six months ended April 30, 2014, there were no borrowings by the Fund under the agreement.
8. INDEMNIFICATION
Under the Trust’s organizational documents, the officers and Trustees are indemnified against certain liabilities that may arise out of performance of their duties to the Trust. Additionally, in the normal course of business, the Trust may enter into contracts with service providers that contain a variety of indemnification clauses. The Trust’s maximum exposure under these arrangements is dependent on future claims that may be made against the Fund and, therefore, cannot be estimated.
| | | | |
| 32 | | Wells Fargo Advantage Diversified International Fund | | Other information (unaudited) |
TAX INFORMATION
Pursuant to Section 853 of the Internal Revenue Code, the following amounts have been designated as foreign taxes paid for the fiscal year ended October 31, 2013. These amounts may be less than the actual foreign taxes paid for financial statement purposes. Foreign taxes paid or withheld should be included in taxable income with an offsetting deduction from gross income or as a credit for taxes paid to foreign governments. None of the income was derived from ineligible foreign sources as defined under Section 901(j) of the Internal Revenue Code.
| | | | |
Creditable foreign taxes paid | | Per share amount | | Foreign income as % of ordinary income distributions |
| $90,738 | | $0.0123 | | 93.48% |
PROXY VOTING INFORMATION
A description of the policies and procedures that the Fund uses to determine how to vote proxies relating to portfolio securities is available without charge, upon request, by calling 1-800-222-8222, visiting our website at wellsfargoadvantagefunds.com, or visiting the SEC website at sec.gov. Information regarding how the Fund voted proxies relating to portfolio securities during the most recent 12-month period ended June 30 is available without charge on the Fund’s website at wellsfargoadvantagefunds.com or by visiting the SEC website at sec.gov.
SPECIAL MEETING OF SHAREHOLDERS
On February 14, 2014, a Special Meeting of Shareholders for the Fund was held to consider the following proposal. The results of the proposal are indicated below.
Proposal 1 – To approve a new subadvisory agreement with Artisan Partners Limited Partnership:
| | | | |
| Net assets voted “For” | | $ | 35,499,093 | |
| Net assets voted “Against” | | $ | 2,154,540 | |
| Net assets voted “Abstain” | | $ | 7,564,803 | |
PORTFOLIO HOLDINGS INFORMATION
The complete portfolio holdings for the Fund are publicly available on the Fund’s website (wellsfargoadvantagefunds.com) on a monthly, 30-day or more delayed basis. In addition, top ten holdings information for the Fund is publicly available on the Fund’s website on a monthly, seven-day or more delayed basis. The Fund files its complete schedule of portfolio holdings with the SEC for the first and third quarters of each fiscal year on Form N-Q, which is available without charge by visiting the SEC website at sec.gov. In addition, the Fund’s Form N-Q may be reviewed and copied at the SEC’s Public Reference Room in Washington, DC, and at regional offices in New York City, at 233 Broadway, and in Chicago, at 175 West Jackson Boulevard, Suite 900. Information about the Public Reference Room may be obtained by calling 1-800-SEC-0330.
| | | | | | |
| Other information (unaudited) | | Wells Fargo Advantage Diversified International Fund | | | 33 | |
BOARD OF TRUSTEES AND OFFICERS
Each of the Trustees and Officers1 listed in the table below acts in identical capacities for each fund in the Wells Fargo Advantage family of funds, which consists of 132 mutual funds comprising the Wells Fargo Funds Trust, Wells Fargo Variable Trust, Wells Fargo Master Trust and four closed-end funds (collectively the “Fund Complex”). This table should be read in conjunction with the Prospectus and the Statement of Additional Information2. All of the Trustees are also Members of the Audit and Governance Committees of each Trust in the Fund Complex. The mailing address of each Trustee and Officer is 525 Market Street, 12th Floor, San Francisco, CA 94105. Each Trustee and Officer serves an indefinite term, however, each Trustee serves such term until reaching the mandatory retirement age established by the Trustees.
Independent Trustees
| | | | | | |
Name and year of birth | | Position held and length of service* | | Principal occupations during past five years | | Other directorships during past five years |
| Peter G. Gordon (Born 1942) | | Trustee, since 1998; Chairman, since 2005 | | Co-Founder, Retired Chairman, President and CEO of Crystal Geyser Water Company. Trustee Emeritus, Colby College. | | Asset Allocation Trust |
| Isaiah Harris, Jr. (Born 1952) | | Trustee, since 2009 | | Retired. Prior thereto, President and CEO of BellSouth Advertising and Publishing Corp. from 2005 to 2007, President and CEO of BellSouth Enterprises from 2004 to 2005 and President of BellSouth Consumer Services from 2000 to 2003. Emeritus member of the Iowa State University Foundation Board of Governors. Emeritus Member of the Advisory Board of Iowa State University School of Business. Advisory Board Member, Palm Harbor Academy (charter school). Mr. Harris is a certified public accountant. | | CIGNA Corporation; Deluxe Corporation; Asset Allocation Trust |
| Judith M. Johnson (Born 1949) | | Trustee, since 2008;
Audit Committee Chairman, since 2008 | | Retired. Prior thereto, Chief Executive Officer and Chief Investment Officer of Minneapolis Employees Retirement Fund from 1996 to 2008. Ms. Johnson is an attorney, certified public accountant and a certified managerial accountant. | | Asset Allocation Trust |
| Leroy Keith, Jr. (Born 1939) | | Trustee, since 2010 | | Chairman, Bloc Global Services (development and construction). Trustee of the Evergreen Funds from 1983 to 2010. Former Managing Director, Almanac Capital Management (commodities firm), former Partner, Stonington Partners, Inc. (private equity fund), former Director, Obagi Medical Products Co. and former Director, Lincoln Educational Services. | | Trustee, Virtus Fund Complex (consisting of 50 portfolios as of 12/16/2013); Asset Allocation Trust |
| David F. Larcker (Born 1950) | | Trustee, since 2009 | | James Irvin Miller Professor of Accounting at the Graduate School of Business, Stanford University, Morgan Stanley Director of the Center for Leadership Development and Research and Senior Faculty of The Rock Center for Corporate Governance since 2006. From 2005 to 2008, Professor of Accounting at the Graduate School of Business, Stanford University. Prior thereto, Ernst & Young Professor of Accounting at The Wharton School, University of Pennsylvania from 1985 to 2005. | | Asset Allocation Trust |
| Olivia S. Mitchell (Born 1953) | | Trustee, since 2006 | | International Foundation of Employee Benefit Plans Professor, Wharton School of the University of Pennsylvania since 1993. Director of Wharton’s Pension Research Council and Boettner Center on Pensions & Retirement Research, and Research Associate at the National Bureau of Economic Research. Previously, Cornell University Professor from 1978 to 1993. | | Asset Allocation Trust |
| Timothy J. Penny (Born 1951) | | Trustee, since 1996 | | President and CEO of Southern Minnesota Initiative Foundation, a non-profit organization, since 2007 and Senior Fellow at the Humphrey Institute Policy Forum at the University of Minnesota since 1995. Member of the Board of Trustees of NorthStar Education Finance, Inc., a non-profit organization, since 2007. | | Asset Allocation Trust |
| | | | |
| 34 | | Wells Fargo Advantage Diversified International Fund | | Other information (unaudited) |
| | | | | | |
Name and year of birth | | Position held and length of service* | | Principal occupations during past five years | | Other directorships during past five years |
| Michael S. Scofield (Born 1943) | | Trustee, since 2010 | | Served on the Investment Company Institute’s Board of Governors and Executive Committee from 2008-2011 as well the Governing Council of the Independent Directors Council from 2006-2011 and the Independent Directors Council Executive Committee from 2008-2011. Chairman of the IDC from 2008-2010. Institutional Investor (Fund Directions) Trustee of Year in 2007. Trustee of the Evergreen Funds (and its predecessors) from 1984 to 2010. Chairman of the Evergreen Funds from 2000-2010. Former Trustee of the Mentor Funds. Retired Attorney, Law Offices of Michael S. Scofield. | | Asset Allocation Trust |
| Donald C. Willeke (Born 1940) | | Trustee, since 1996 | | Principal of the law firm of Willeke & Daniels. General Counsel of the Minneapolis Employees Retirement Fund from 1984 until its consolidation into the Minnesota Public Employees Retirement Association on June 30, 2010. Director and Vice Chair of The Tree Trust (non-profit corporation). Director of the American Chestnut Foundation (non-profit corporation). | | Asset Allocation Trust |
| * | Length of service dates reflect the Trustee’s commencement of service with the Trust’s predecessor entities, where applicable. |
Officers
| | | | | | |
Name and year of birth | | Position held and length of service | | Principal occupations during past five years | | |
| Karla M. Rabusch (Born 1959) | | President, since 2003 | | Executive Vice President of Wells Fargo Bank, N.A. and President of Wells Fargo Funds Management, LLC since 2003. | | |
| Jeremy DePalma1 (Born 1974) | | Treasurer, since 2012 | | Senior Vice President of Wells Fargo Funds Management, LLC since 2009. Senior Vice President of Evergreen Investment Management Company, LLC from 2008 to 2010. Vice President, Evergreen Investment Services, Inc. from 2004 to 2007. Head of the Fund Reporting and Control Team within Fund Administration from 2005 to 2010. | | |
| C. David Messman (Born 1960) | | Secretary, since 2000; Chief Legal Officer, since 2003 | | Senior Vice President and Secretary of Wells Fargo Funds Management, LLC since 2001. Vice President and Managing Counsel of Wells Fargo Bank, N.A. since 1996. | | |
Debra Ann Early
(Born 1964) | | Chief Compliance Officer, since 2007 | | Chief Compliance Officer of Wells Fargo Funds Management, LLC since 2007. Chief Compliance Officer of Parnassus Investments from 2005 to 2007. Chief Financial Officer of Parnassus Investments from 2004 to 2007. | | |
David Berardi
(Born 1975) | | Assistant Treasurer, since 2009 | | Vice President of Wells Fargo Funds Management, LLC since 2009. Vice President of Evergreen Investment Management Company, LLC from 2008 to 2010. Assistant Vice President of Evergreen Investment Services, Inc. from 2004 to 2008. Manager of Fund Reporting and Control for Evergreen Investment Management Company, LLC from 2004 to 2010. | | |
| 1. | Jeremy DePalma acts as Treasurer of 59 funds and Assistant Treasurer of 73 funds in the Fund Complex. |
| 2. | The Statement of Additional Information includes additional information about the Trustees and is available, without charge, upon request, by calling 1-800-222-8222 or by visiting the website at wellsfargoadvantagefunds.com. |
| | | | | | |
| Other information (unaudited) | | Wells Fargo Advantage Diversified International Fund | | | 35 | |
BOARD CONSIDERATION OF INVESTMENT ADVISORY AND SUB-ADVISORY AGREEMENTS:
Under Section 15 of the Investment Company Act of 1940 (the “1940 Act”), the Board of Trustees (the “Board”) of Wells Fargo Funds Trust (the “Trust”), all the members of which have no direct or indirect interest in the investment advisory and sub-advisory agreements and are not “interested persons” of the Trust, as defined in the 1940 Act (the “Independent Trustees”), must determine whether to approve the continuation of the Trust’s investment advisory and sub-advisory agreements. In this regard, at an in-person meeting held on March 27-28, 2014 (the “Meeting”), the Board reviewed: (i) an investment advisory agreement with Wells Fargo Funds Management, LLC (“Funds Management”) for Wells Fargo Advantage Diversified International Fund (the “Fund”), (ii) an investment sub-advisory agreement with Wells Capital Management Incorporated (“WellsCap”), an affiliate of Funds Management, for the Fund, (iii) an investment sub-advisory agreement with Artisan Partners Limited Partnership (“Artisan”) for the Fund, and (iv) an investment sub-advisory agreement with LSV Asset Management (“LSV”) for the Fund. The investment advisory agreement with Funds Management and the investment sub-advisory agreements with WellsCap, Artisan and LSV (collectively, the “Sub-Advisers”) are collectively referred to as the “Advisory Agreements.”
At the Meeting, the Board considered the factors and reached the conclusions described below relating to the selection of Funds Management and the Sub-Advisers and the continuation of the Advisory Agreements. Prior to the Meeting, the Trustees conferred extensively among themselves and with representatives of Funds Management about these matters. Also, the Board has adopted a team-based approach, with each team consisting of a sub-set of Trustees, to assist the full Board in the discharge of its duties in reviewing performance and other matters throughout the year. The Independent Trustees were assisted in their evaluation of the Advisory Agreements by independent legal counsel, from whom they received separate legal advice and with whom they met separately.
In providing information to the Board, Funds Management and the Sub-Advisers were guided by a detailed set of requests for information submitted to them by independent legal counsel on behalf of the Independent Trustees at the start of the Board’s annual contract renewal process earlier in 2014. In considering and approving the Advisory Agreements, the Trustees considered the information they believed relevant, including but not limited to the information discussed below. The Board considered not only the specific information presented in connection with the Meeting, but also the knowledge gained over time through interaction with Funds Management and the Sub-Advisers about various topics. In this regard, the Board reviewed reports of Funds Management at each of its quarterly meetings, which included, among other things, portfolio reviews and performance reports. In addition, the Board and the teams mentioned above confer with portfolio managers at various times throughout the year. The Board did not identify any particular information or consideration that was all-important or controlling, and each individual Trustee may have attributed different weights to various factors.
After its deliberations, the Board unanimously approved the continuation of the Advisory Agreements and determined that the compensation payable to Funds Management and the Sub-Advisers is reasonable. The Board considered the continuation of the Advisory Agreements for the Fund as part of its consideration of the continuation of advisory agreements for funds across the complex, but its approvals were made on a fund-by-fund basis. The following summarizes a number of important, but not necessarily all, factors considered by the Board in support of its approvals.
Nature, Extent and Quality of Services
The Board received and considered various information regarding the nature, extent and quality of services provided to the Fund by Funds Management and the Sub-Advisers under the Advisory Agreements. This information included, among other things, a summary of the background and experience of senior management of Funds Management, and the qualifications, background, tenure and responsibilities of each of the portfolio managers primarily responsible for the day-to-day portfolio management of the Fund.
The Board evaluated the ability of Funds Management and the Sub-Advisers to attract and retain qualified investment professionals, including research, advisory and supervisory personnel. The Board further considered the compliance programs and compliance records of Funds Management and the Sub-Advisers. In addition, the Board took into account the full range of services provided to the Fund by Funds Management and its affiliates.
Fund Performance and Expenses
The Board considered the performance results for the Fund over various time periods ended December 31, 2013. The Board also considered these results in comparison to the performance of funds in a universe that was determined by Lipper Inc. (“Lipper”) to be similar to the Fund (the “Universe”), and in comparison to the Fund’s benchmark index and to other comparative data. Lipper is an independent provider of investment company data. The Board received a description of the methodology used by Lipper to select the mutual funds in the performance Universe. The Board noted
| | | | |
| 36 | | Wells Fargo Advantage Diversified International Fund | | Other information (unaudited) |
that the performance of the Fund (Administrator Class) was higher than or in range of the average performance of the Universe for the one-, three- and five-year periods under review and lower than the average performance of the Universe for the ten-year period under review. The Board also noted that the performance of the Fund was higher than or in range of its benchmark, the MSCI EAFE Index (Net), for the one-, three- and five-year periods and lower than its benchmark for the ten-year period.
The Board received information concerning, and discussed factors contributing to, the underperformance of the Fund relative to the Universe and the benchmark for the ten-year period. Funds Management advised the Board about the market conditions and investment decisions that it believed contributed to the underperformance during that period. The Board was satisfied with the explanation of factors contributing to underperformance and with the steps being taken by Funds Management and the Sub-Advisers to address the Fund’s investment performance.
The Board also received and considered information regarding the Fund’s net operating expense ratios and their various components, including actual management fees (which reflect fee waivers, if any, and include advisory, administration and transfer agent fees), custodian and other non-management fees, Rule 12b-1 and non-Rule 12b-1 service fees and fee waiver and expense reimbursement arrangements. The Board considered these ratios in comparison to the median ratios of funds in class-specific expense groups that were determined by Lipper to be similar to the Fund (the “Groups”). The Board received a description of the methodology used by Lipper to select the mutual funds in the expense Groups and an explanation of year-to-year variations in the funds comprising such expense Groups and their expense ratios. Based on the Lipper reports, the Board noted that the net operating expense ratios of the Fund were in range of the median net operating expense ratios of the expense Groups.
Based on its consideration of the factors and information it deemed relevant, including those described here, the Board concluded that the overall performance and expense structure of the Fund supported the re-approval of the Advisory Agreements.
Investment Advisory and Sub-Advisory Fee Rates
The Board reviewed and considered the contractual investment advisory fee rates that are payable by the Fund to Funds Management for investment advisory services (the “Advisory Agreement Rates”), both on a stand-alone basis and on a combined basis with the Fund’s fund-level and class-level contractual administration fee rates (the “Management Rates”). The Board noted that the administration fees payable to Funds Management include transfer agency and sub-transfer agency costs. The Board also reviewed and considered the contractual investment sub-advisory fee rates that are payable by Funds Management to the Sub-Advisers for investment sub-advisory services (the “Sub-Advisory Agreement Rates”).
Among other information reviewed by the Board was a comparison of the Management Rates of the Fund with those of other funds in the expense Groups at a common asset level. The Board noted that the Management Rates of the Fund were in range of the average rates for the Fund’s expense Groups for all share classes except the Fund’s Investor Class, the Management Rate of which was higher than the average rate of its expense Group. The Board noted, however, that the net operating expense ratio of the Fund’s Investor Class was in range of the median net operating expense ratio its expense Group.
The Board also received and considered information about the portion of the total advisory fee that was retained by Funds Management after payment of the fee to the Sub-Advisers for sub-advisory services. In assessing the reasonableness of this amount, the Board received and evaluated information about the nature and extent of responsibilities retained and risks assumed by Funds Management and not delegated to or assumed by the Sub-Advisers, and about Funds Management’s on-going oversight services. However, given the affiliation between Funds Management and WellsCap, the Board ascribed limited relevance to the allocation of the total advisory fee between them. The Board also considered that the sub-advisory fees paid to Artisan and LSV had been negotiated by Funds Management on an arm’s-length basis.
The Board also received and considered information about the nature and extent of services offered and fee rates charged by Funds Management and the Sub-Advisers to other types of clients with investment strategies similar to those of the Fund. In this regard, the Board received information about the significantly greater scope of services, and compliance, reporting and other legal burdens and risks of managing mutual funds compared with those associated with managing assets of non-mutual fund clients such as collective funds or institutional separate accounts.
Based on its consideration of the factors and information it deemed relevant, including those described here, the Board determined that the Advisory Agreement Rates and the Sub-Advisory Agreement Rates were reasonable in light of the services covered by the Advisory Agreements.
| | | | | | |
| Other information (unaudited) | | Wells Fargo Advantage Diversified International Fund | | | 37 | |
Profitability
The Board received and considered information concerning the profitability of Funds Management, as well as the profitability of Wells Fargo as a whole, from providing services to the Fund and the fund family as a whole. The Board did not receive or consider to be necessary separate profitability information with respect to WellsCap, because its profitability information was subsumed in the collective Wells Fargo profitability analysis. The Board also did not consider profitability with respect to Artisan or LSV, as the sub-advisory fees paid to Artisan and LSV had been negotiated by Funds Management on an arm’s-length basis.
Funds Management explained the methodologies and estimates that it used in calculating profitability. Among other things, the Board noted that the levels of profitability reported on a fund-by-fund basis varied widely, depending on factors such as the size and type of fund. Based on its review, the Board did not deem the profits reported by Funds Management to be at a level that would prevent it from approving the continuation of the Advisory Agreements.
Economies of Scale
With respect to possible economies of scale, the Board noted the existence of breakpoints in the Fund’s advisory fee and administration fee structure, which operate generally to reduce the Fund’s expense ratios as the Fund grows in size. It considered that, for a small fund or a fund that shrinks in size, breakpoints conversely can result in higher fee levels. The Board also considered that fee waiver and expense reimbursement arrangements and competitive fee rates at the outset are means of sharing potential economies of scale with shareholders of the Fund and the fund family as a whole. The Board considered Funds Management’s view that any analyses of potential economies of scale in managing a particular fund are inherently limited in light of the joint and common costs and investments that Funds Management incurs across the fund family as a whole.
The Board concluded that the Fund’s fee and expense arrangements, including contractual breakpoints, constituted a reasonable approach to sharing potential economies of scale with the Fund and its shareholders.
Other Benefits to Funds Management and the Sub-Advisers
The Board received and considered information regarding potential “fall-out” or ancillary benefits received by Funds Management and its affiliates, including WellsCap, and Artisan and LSV as a result of their relationships with the Fund. Ancillary benefits could include, among others, benefits directly attributable to other relationships with the Fund and benefits potentially derived from an increase in Funds Management’s and the Sub-Advisers’ business as a result of their relationships with the Fund. The Board noted that various affiliates of Funds Management may receive distribution-related fees, shareholder servicing payments and sub-transfer agency fees in respect of shares sold or held through them and services provided.
The Board also reviewed information about soft dollar credits earned and utilized by the Sub-Advisers, fees earned by Funds Management and the Sub-Advisers from managing a private investment vehicle for the fund family’s securities lending collateral and commissions earned by an affiliated broker from portfolio transactions.
Based on its consideration of the factors and information it deemed relevant, including those described here, the Board did not find that any ancillary benefits received by Funds Management and its affiliates, including WellsCap, or either Artisan or LSV were unreasonable.
Conclusion
After considering the above-described factors and based on its deliberations and its evaluation of the information described above, the Board unanimously approved the continuation of the Advisory Agreements for an additional one-year period and determined that the compensation payable to Funds Management and the Sub-Advisers is reasonable.
| | | | |
| 38 | | Wells Fargo Advantage Diversified International Fund | | List of abbreviations |
The following is a list of common abbreviations for terms and entities that may have appeared in this report.
| ACA | — ACA Financial Guaranty Corporation |
| ADR | — American depositary receipt |
| ADS | — American depositary shares |
| AGC | — Assured Guaranty Corporation |
| AGM | — Assured Guaranty Municipal |
| Ambac | — Ambac Financial Group Incorporated |
| AMT | — Alternative minimum tax |
| BAN | — Bond anticipation notes |
| BHAC | — Berkshire Hathaway Assurance Corporation |
| CAB | — Capital appreciation bond |
| CCAB | — Convertible capital appreciation bond |
| CDA | — Community Development Authority |
| CDO | — Collateralized debt obligation |
| DRIVER | — Derivative inverse tax-exempt receipts |
| DW&P | — Department of Water & Power |
| DWR | — Department of Water Resources |
| ECFA | — Educational & Cultural Facilities Authority |
| EDA | — Economic Development Authority |
| EDFA | — Economic Development Finance Authority |
| ETF | — Exchange-traded fund |
| FDIC | — Federal Deposit Insurance Corporation |
| FFCB | — Federal Farm Credit Banks |
| FGIC | — Financial Guaranty Insurance Corporation |
| FHA | — Federal Housing Administration |
| FHLB | — Federal Home Loan Bank |
| FHLMC | — Federal Home Loan Mortgage Corporation |
| FICO | — The Financing Corporation |
| FNMA | — Federal National Mortgage Association |
| GDR | — Global depositary receipt |
| GNMA | — Government National Mortgage Association |
| HCFR | — Healthcare facilities revenue |
| HEFA | — Health & Educational Facilities Authority |
| HEFAR | — Higher education facilities authority revenue |
| HFA | — Housing Finance Authority |
| HFFA | — Health Facilities Financing Authority |
| HUD | — Department of Housing and Urban Development |
| IDA | — Industrial Development Authority |
| IDAG | — Industrial Development Agency |
| KRW | — Republic of Korea won |
| LIBOR | — London Interbank Offered Rate |
| LLC | — Limited liability company |
| LLLP | — Limited liability limited partnership |
| LLP | — Limited liability partnership |
| MBIA | — Municipal Bond Insurance Association |
| MFHR | — Multifamily housing revenue |
| MSTR | — Municipal securities trust receipts |
| MUD | — Municipal Utility District |
| National | — National Public Finance Guarantee Corporation |
| PCFA | — Pollution Control Financing Authority |
| PCL | — Public Company Limited |
| PCR | — Pollution control revenue |
| PFA | — Public Finance Authority |
| PFFA | — Public Facilities Financing Authority |
| PFOTER | — Puttable floating option tax-exempt receipts |
| plc | — Public limited company |
| PUTTER | — Puttable tax-exempt receipts |
| R&D | — Research & development |
| Radian | — Radian Asset Assurance |
| RAN | — Revenue anticipation notes |
| RDA | — Redevelopment Authority |
| RDFA | — Redevelopment Finance Authority |
| REIT | — Real estate investment trust |
| ROC | — Reset option certificates |
| SAVRS | — Select auction variable rate securities |
| SBA | — Small Business Authority |
| SFHR | — Single-family housing revenue |
| SFMR | — Single-family mortgage revenue |
| SPA | — Standby purchase agreement |
| SPDR | — Standard & Poor’s Depositary Receipts |
| STRIPS | — Separate trading of registered interest and principal securities |
| TAN | — Tax anticipation notes |
| TIPS | — Treasury inflation-protected securities |
| TRAN | — Tax revenue anticipation notes |
| TTFA | — Transportation Trust Fund Authority |
| TVA | — Tennessee Valley Authority |
This page is intentionally left blank.
This page is intentionally left blank.


For more information
More information about Wells Fargo Advantage Funds is available free upon request. To obtain literature, please write, email, visit the Fund’s website, or call:
Wells Fargo Advantage Funds
P.O. Box 8266
Boston, MA 02266-8266
Email: wfaf@wellsfargo.com
Website: wellsfargoadvantagefunds.com
Individual investors: 1-800-222-8222
Retail investment professionals: 1-888-877-9275
Institutional investment professionals: 1-866-765-0778
This report and the financial statements contained herein are submitted for the general information of the shareholders of Wells Fargo Advantage Funds. If this report is used for promotional purposes, distribution of the report must be accompanied or preceded by a current prospectus. Before investing, please consider the investment objectives, risks, charges, and expenses of the investment. For a current prospectus and, if available, a summary prospectus, containing this information, call 1-800-222-8222 or visit the Fund’s website at wellsfargoadvantagefunds.com. Read the prospectus carefully before you invest or send money.
Wells Fargo Funds Management, LLC, a wholly owned subsidiary of Wells Fargo & Company, provides investment advisory and administrative services for Wells Fargo Advantage Funds. Other affiliates of Wells Fargo & Company provide subadvisory and other services for the Funds. The Funds are distributed by Wells Fargo Funds Distributor, LLC, Member FINRA/SIPC, an affiliate of Wells Fargo & Company.
NOT FDIC INSURED ¡ NO BANK GUARANTEE ¡ MAY LOSE VALUE
© 2014 Wells Fargo Funds Management, LLC. All rights reserved.
| | |
 | | 225166 06-14 SA237/SAR237 04-14 |

Wells Fargo Advantage
Emerging Markets Equity Fund

Semi-Annual Report
April 30, 2014

Reduce clutter. Save trees.
Sign up for electronic delivery of prospectuses and shareholder reports at wellsfargo.com/advantagedelivery
Contents
The views expressed and any forward-looking statements are as of April 30, 2014, unless otherwise noted, and are those of the Fund managers and/or Wells Fargo Funds Management, LLC. Discussions of individual securities, or the markets generally, or any Wells Fargo Advantage Fund are not intended as individual recommendations. Future events or results may vary significantly from those expressed in any forward-looking statements; the views expressed are subject to change at any time in response to changing circumstances in the market. Wells Fargo Funds Management, LLC and the Fund disclaim any obligation to publicly update or revise any views expressed or forward-looking statements.
NOT FDIC INSURED ¡ NO BANK GUARANTEE ¡ MAY LOSE VALUE
| | | | |
| 2 | | Wells Fargo Advantage Emerging Markets Equity Fund | | Letter to shareholders (unaudited) |

Karla M. Rabusch
President
Wells Fargo Advantage Funds
European markets continued to benefit from the European Central Bank’s (ECB’s) willingness to maintain low interest rates.
Some of the markets that had declined the most during the European debt crisis—such as Italy and Ireland—benefited the most from this stable economic environment, but larger markets such as France and Germany also posted gains.
Dear Valued Shareholder:
We are pleased to offer you this semi-annual report for the Wells Fargo Advantage Emerging Markets Equity Fund for the six-month period that ended April 30, 2014. The period was marked by growing concern about an economic slowdown in China and heightened geopolitical uncertainty as the U.S. and Europe confronted Russia over Ukraine. The environment created a headwind for many emerging markets, even as continued economic recovery in Europe helped most developed stock markets end the period with gains.
Major central banks continued to provide stimulus.
Major central banks continued to inject liquidity into global banks and markets through various quantitative easing policies. The U.S. Federal Reserve (Fed) remained a major source of liquidity for market participants around the world. Throughout the reporting period, the Federal Open Market Committee (FOMC)—the Fed’s monetary policymaking body—kept its key interest rate near zero in order to support the economy and the financial system. At the beginning of the reporting period, the FOMC was still making open-ended purchases of $40 billion per month in mortgage-backed securities to support the housing market and was purchasing $45 billion per month in long-term U.S. Treasuries. However, in mid-December 2013, the FOMC announced that it would reduce (or taper) its bond-buying program by $10 billion per month beginning in January 2014. Although the tapering was less aggressive than some investors had feared, the removal of liquidity sparked a sell-off in emerging markets stocks and currencies as investors sold higher-risk assets.
European markets continued to benefit from the European Central Bank’s (ECB’s) willingness to maintain low interest rates. In November 2013, the ECB cut its key rate to a historic low of 0.25%. The ECB’s actions helped support moderate year-over-year gross domestic product (GDP) growth in the eurozone.
Most developed regions gained, but emerging and developed Asian markets lagged.
For the six-month period, the MSCI EAFE Index (Net)1, a proxy for developed markets, returned 4.44%, while the MSCI Emerging Markets Index (Net)2 returned -2.98%.
In Europe, economic data continued to show moderate growth, with reported GDP for the 28 countries in the European Union rising by 0.4% in the fourth quarter of 2013 compared with the previous quarter. The unemployment rate remained high but stable at 10.5% in February and March 2014, while inflation remained consistently below a 1% annual rate. Some of the markets that had declined the most during the European debt crisis—such as Italy and Ireland—benefited the most from this stable economic environment, but larger markets such as France and Germany also posted gains. The ongoing turmoil in Ukraine did result in some stock market volatility, but as of the end of the reporting period, most investors believed that it would not result in war.
| 1. | The Morgan Stanley Capital International Europe, Australasia, and Far East (MSCI EAFE) Index (Net) is an unmanaged group of securities widely regarded by investors to be representations of the stock markets of Europe, Australasia, and the Far East. Calculations for EAFE use net dividends, which reflect the deduction of withholding taxes. You cannot invest directly in an index. Source: MSCI. MSCI makes no express or implied warranties or representations and shall have no liability whatsoever with respect to any MSCI data contained herein. The MSCI data may not be further redistributed or used as a basis for other indexes or any securities or financial products. This report is not approved, reviewed, or produced by MSCI. |
| 2. | The Morgan Stanley Capital International (MSCI) Emerging Markets Index (Net) is a free float-adjusted market-capitalization-weighted index designed to measure the equity market performance in the global emerging markets. The index is currently composed of 21 emerging markets country indexes. You cannot invest directly in an index. |
| | | | | | |
| Letter to shareholders (unaudited) | | Wells Fargo Advantage Emerging Markets Equity Fund | | | 3 | |
Asian markets posted mixed results, with political issues accounting for many of those differences. In countries such as India and Indonesia, investors were optimistic that upcoming elections might sweep in more reform-minded governments. By contrast, in Japan, the honeymoon for Prime Minister Shinzō Abe appeared to be ending, with investors worrying that his reforms were not taking effect as quickly as originally hoped.
As for China, many of the country’s economic numbers—such as national production, retail sales, fixed investment, and manufacturing activity—came in below analyst expectations, causing investor concern. In addition, China’s government has allowed a growing number of defaults in the country’s financial system as part of a long-term plan to rein in credit growth.
Don’t let short-term uncertainty derail long-term investment goals.
Periods of uncertainty can present challenges, but experience has taught us that maintaining long-term investment goals can be an effective way to plan for the future. To help you create a sound strategy based on your personal goals and risk tolerance, Wells Fargo Advantage Funds offers more than 100 mutual funds spanning a wide range of asset classes and investment styles. Although diversification cannot guarantee an investment profit or prevent losses, we believe it can be an effective way to manage investment risk and potentially smooth out overall portfolio performance. We encourage investors to know their investments and to understand that appropriate levels of risk-taking may unlock opportunities.
Thank you for choosing to invest with Wells Fargo Advantage Funds. We appreciate your confidence in us and remain committed to helping you meet your financial needs. For current information about your fund investments, contact your investment professional, visit our website at wellsfargoadvantagefunds.com, or call us directly at 1-800-222-8222. We are available 24 hours a day, 7 days a week.
Sincerely,

Karla M. Rabusch
President
Wells Fargo Advantage Funds
Notice to shareholders
The Fund and Wells Fargo Funds Management, LLC (“Funds Management”) have received an exemptive order from the SEC that permits Funds Management, subject to the approval of the Board of Trustees of the Fund, to select or replace certain subadvisers to manage all or a portion of the Fund’s assets and enter into, amend or terminate a sub-advisory agreement with certain subadvisers without obtaining shareholder approval (“Multi-manager Structure”). The Multi-manager Structure applies to subadvisers that are not affiliated with Funds Management or the Fund, except to the extent that affiliation arises solely because such subadvisers provide sub-advisory services to the Fund (“Non-affiliated Subadvisers”), as well as subadvisers that are indirect or direct wholly-owned subsidiaries of Funds Management or of another company that, indirectly or directly, wholly owns Funds Management (“Wholly-owned Subadvisers”).
Pursuant to the SEC order, Funds Management, with the approval of the Board of Trustees, has the discretion to terminate any subadvisers and allocate and reallocate the Fund’s assets among any other Non-affiliated Subadvisers or Wholly-owned Subadvisers. Funds Management, subject to oversight and supervision by the Board of Trustees, has responsibility to continue to oversee any subadvisers to the Fund and to recommend, for approval by the Board of Trustees, the hiring, termination and replacement of subadvisers for the Fund. In the event that a new subadviser is hired pursuant to the Multi-manager Structure, the Fund is required to provide notice to shareholders within 90 days.
Please contact your investment professional or call us directly at 1-800-222-8222 if you have any questions on this Notice to Shareholders.
| | | | |
| 4 | | Wells Fargo Advantage Emerging Markets Equity Fund | | Performance highlights (unaudited) |
This Fund is closed to new investors1.
Investment objective
The Fund seeks long-term capital appreciation.
Adviser
Wells Fargo Funds Management, LLC
Subadviser
Wells Capital Management Incorporated
Portfolio managers
Derrick Irwin, CFA
Yi (Jerry) Zhang, Ph.D, CFA
Richard Peck, CFA2
Average annual total returns3 (%) as of April 30, 2014
| | | | | | | | | | | | | | | | | | | | | | | | | | | | | | | | | | |
| | | | | Including sales charge | | | Excluding sales charge | | | Expense ratios4 (%) | |
| | | Inception date | | 1 year | | | 5 year | | | 10 year | | | 1 year | | | 5 year | | | 10 year | | | Gross | | | Net5 | |
| Class A (EMGAX) | | 9-6-1994 | | | (8.98 | ) | | | 9.80 | | | | 11.68 | | | | (3.42 | ) | | | 11.11 | | | | 12.35 | | | | 1.67 | | | | 1.67 | |
| Class B (EMGBX) | | 9-6-1994 | | | (8.93 | ) | | | 10.02 | | | | 11.78 | | | | (4.14 | ) | | | 10.29 | | | | 11.78 | | | | 2.42 | | | | 2.42 | |
| Class C (EMGCX) | | 9-6-1994 | | | (5.17 | ) | | | 10.28 | | | | 11.52 | | | | (4.17 | ) | | | 10.28 | | | | 11.52 | | | | 2.42 | | | | 2.42 | |
| Class R6 (EMGDX) | | 6-28-2013 | | | – | | | | – | | | | – | | | | (2.93 | ) | | | 11.57 | | | | 12.74 | | | | 1.19 | | | | 1.19 | |
| Administrator Class (EMGYX) | | 9-6-1994 | | | – | | | | – | | | | – | | | | (3.28 | ) | | | 11.32 | | | | 12.62 | | | | 1.51 | | | | 1.51 | |
| Institutional Class (EMGNX) | | 7-30-2010 | | | – | | | | – | | | | – | | | | (3.01 | ) | | | 11.55 | | | | 12.73 | | | | 1.24 | | | | 1.24 | |
| MSCI Emerging Markets Index (Net)6 | | – | | | – | | | | – | | | | – | | | | (1.84 | ) | | | 11.08 | | | | 11.09 | | | | – | | | | – | |
Figures quoted represent past performance, which is no guarantee of future results, and do not reflect taxes that a shareholder may pay on fund distributions or the redemption of fund shares. Investment return and principal value of an investment will fluctuate so that an investor’s shares, when redeemed, may be worth more or less than their original cost. Performance shown without sales charges would be lower if sales charges were reflected. Current performance may be lower or higher than the performance data quoted, which assumes the reinvestment of dividends and capital gains. Current month-end performance is available on the Fund’s website, wellsfargoadvantagefunds.com.
Index returns do not include transaction costs associated with buying and selling securities, any mutual fund fees or expenses, or any taxes. It is not possible to invest directly in an index.
For Class A shares, the maximum front-end sales charge is 5.75%. For Class B shares, the maximum contingent deferred sales charge is 5.00%. For Class C shares, the maximum contingent deferred sales charge is 1.00%. Performance including sales charge assumes the sales charge for the corresponding time period. Class R6, Administrator Class and Institutional Class shares are sold without a front-end sales charge or contingent deferred sales charge.
Stock values fluctuate in response to the activities of individual companies and general market and economic conditions. Foreign investments are especially volatile and can rise or fall dramatically due to differences in the political and economic conditions of the host country. These risks are generally intensified in emerging markets. The use of derivatives may reduce returns and/or increase volatility. Certain investment strategies tend to increase the total risk of an investment (relative to the broader market). The Fund is exposed to regional risk and smaller-company securities risk. Consult the Fund’s prospectus for additional information on these and other risks.
Please see footnotes on page 5.
| | | | | | |
| Performance highlights (unaudited) | | Wells Fargo Advantage Emerging Markets Equity Fund | | | 5 | |
| | | | |
| Ten largest equity holdings7 (%) as of April 30, 2014 | |
Taiwan Semiconductor Manufacturing Company Limited | | | 4.88 | |
Samsung Electronics Company Limited | | | 4.56 | |
Banco Bradesco SA ADR | | | 2.50 | |
China Mobile Limited | | | 2.31 | |
Fomento Economico Mexicano SAB de CV ADR | | | 2.22 | |
Lojas Americanas SA | | | 1.96 | |
Ambev SA ADR | | | 1.91 | |
China Life Insurance Company Limited | | | 1.78 | |
Reliance Industries Limited | | | 1.75 | |
CNOOC Limited | | | 1.72 | |
|
| Sector distribution8 as of April 30, 2014 |
|
 |
| 1. | Please see the Fund’s current Statement of Additional Information for further details. |
| 2. | Effective May 2, 2014, Richard Peck became a portfolio manager of the Fund. |
| 3. | Historical performance shown for Class R6 shares prior to their inception reflects the performance of Institutional Class shares and includes the higher expenses applicable to Institutional Class shares. Historical performance shown for Institutional Class shares prior to their inception reflects the performance of Administrator Class shares, and includes the higher expenses applicable to Administrator Class shares. If these expenses had not been included, returns would be higher. Historical performance shown for all classes of the Fund prior to July 19, 2010, is based on the performance of the Fund’s predecessor, Evergreen Emerging Markets Growth Fund. |
| 4. | Reflects the expense ratios as stated in the most recent prospectuses, which include the impact of 0.02% in acquired fund fees and expenses. The expense ratios shown are subject to change and may differ from the annualized expense ratios shown in the financial highlights of this report, which do not include acquired fund fees and expenses. |
| 5. | The Adviser has committed through February 28, 2015, to waive fees and/or reimburse expenses to the extent necessary to cap the Fund’s Total Annual Fund Operating Expenses After Fee Waiver, excluding certain expenses, at 1.67% for Class A, 2.42% for Class B, 2.42% for Class C, 1.18% for Class R6, 1.50% for Administrator Class, and 1.23% for Institutional Class. Brokerage commissions, stamp duty fees, interest, taxes, acquired fund fees and expenses, and extraordinary expenses are excluded from the cap. Without this cap, the Fund’s returns would have been lower. |
| 6. | The Morgan Stanley Capital International (MSCI) Emerging Markets Index (Net) is a free float-adjusted market-capitalization-weighted index designed to measure the equity market performance in the global emerging markets. The index is currently composed of 21 emerging markets country indexes. You cannot invest directly in an index. Source: MSCI. MSCI makes no express or implied warranties or representations and shall have no liability whatsoever with respect to any MSCI data contained herein. The MSCI data may not be further redistributed or used as a basis for other indexes or any securities or financial products. This report is not approved, reviewed, or produced by MSCI. |
| 7. | The ten largest long-term holdings are calculated based on the value of the securities divided by total net assets of the Fund. Holdings are subject to change and may have changed since the date specified. |
| 8. | Sector distribution is subject to change and is calculated based on the total long-term investments of the Fund. |
| | | | |
| 6 | | Wells Fargo Advantage Emerging Markets Equity Fund | | Fund expenses (unaudited) |
As a shareholder of the Fund, you incur two types of costs: (1) transaction costs, including sales charges (loads) on purchase payments and contingent deferred sales charges (if any) on redemptions and (2) ongoing costs, including management fees, distribution (12b-1) and/or shareholder service fees, and other Fund expenses. This example is intended to help you understand your ongoing costs (in dollars) of investing in the Fund and to compare these costs with the ongoing costs of investing in other mutual funds.
The example is based on an investment of $1,000 invested at the beginning of the six-month period and held for the entire period from November 1, 2013 to April 30, 2014.
Actual expenses
The “Actual” line of the table below provides information about actual account values and actual expenses. You may use the information in this line, together with the amount you invested, to estimate the expenses that you paid over the period. Simply divide your account value by $1,000 (for example, an $8,600 account value divided by $1,000 = 8.6), then multiply the result by the number in the “Actual” line under the heading entitled “Expenses paid during period” for your applicable class of shares to estimate the expenses you paid on your account during this period.
Hypothetical example for comparison purposes
The “Hypothetical” line of the table below provides information about hypothetical account values and hypothetical expenses based on the Fund’s actual expense ratio and an assumed rate of return of 5% per year before expenses, which is not the Fund’s actual return. The hypothetical account values and expenses may not be used to estimate the actual ending account balance or expenses you paid for the period. You may use this information to compare the ongoing costs of investing in the Fund and other funds. To do so, compare this 5% hypothetical example with the 5% hypothetical examples that appear in the shareholder reports of the other funds.
Please note that the expenses shown in the table are meant to highlight your ongoing costs only and do not reflect any transactional costs, such as sales charges (loads) and contingent deferred sales charges. Therefore, the “Hypothetical” line of the table is useful in comparing ongoing costs only and will not help you determine the relative total costs of owning different funds. In addition, if these transactional costs were included, your costs would have been higher.
| | | | | | | | | | | | | | | | |
| | | Beginning
account value
11-1-2013 | | | Ending
account value
4-30-2014 | | | Expenses
paid during
the period1 | | | Net annualized
expense ratio | |
Class A | | | | | | | | | | | | | | | | |
Actual | | $ | 1,000.00 | | | $ | 959.12 | | | $ | 7.97 | | | | 1.64 | % |
Hypothetical (5% return before expenses) | | $ | 1,000.00 | | | $ | 1,016.66 | | | $ | 8.20 | | | | 1.64 | % |
Class B | | | | | | | | | | | | | | | | |
Actual | | $ | 1,000.00 | | | $ | 956.08 | | | $ | 11.54 | | | | 2.38 | % |
Hypothetical (5% return before expenses) | | $ | 1,000.00 | | | $ | 1,012.99 | | | $ | 11.88 | | | | 2.38 | % |
Class C | | | | | | | | | | | | | | | | |
Actual | | $ | 1,000.00 | | | $ | 955.75 | | | $ | 11.59 | | | | 2.39 | % |
Hypothetical (5% return before expenses) | | $ | 1,000.00 | | | $ | 1,012.94 | | | $ | 11.93 | | | | 2.39 | % |
Class R6 | | | | | | | | | | | | | | | | |
Actual | | $ | 1,000.00 | | | $ | 962.23 | | | $ | 5.64 | | | | 1.16 | % |
Hypothetical (5% return before expenses) | | $ | 1,000.00 | | | $ | 1,019.04 | | | $ | 5.81 | | | | 1.16 | % |
Administrator Class | | | | | | | | | | | | | | | | |
Actual | | $ | 1,000.00 | | | $ | 960.00 | | | $ | 7.19 | | | | 1.48 | % |
Hypothetical (5% return before expenses) | | $ | 1,000.00 | | | $ | 1,017.46 | | | $ | 7.40 | | | | 1.48 | % |
Institutional Class | | | | | | | | | | | | | | | | |
Actual | | $ | 1,000.00 | | | $ | 961.45 | | | $ | 5.88 | | | | 1.21 | % |
Hypothetical (5% return before expenses) | | $ | 1,000.00 | | | $ | 1,018.79 | | | $ | 6.06 | | | | 1.21 | % |
| 1. | Expenses paid is equal to the annualized expense ratio of each class multiplied by the average account value over the period, multiplied by the number of days in the most recent fiscal half-year divided by the number of days in the fiscal year (to reflect the one-half-year period). |
| | | | | | |
| Portfolio of investments—April 30, 2014 (unaudited) | | Wells Fargo Advantage Emerging Markets Equity Fund | | | 7 | |
| | | | | | | | | | | | |
| Security name | | | | | | Shares | | | Value | |
| | | | |
Common Stocks: 90.13% | | | | | | | | | | | | |
| | | | |
| Argentina: 0.31% | | | | | | | | | | | | |
MercadoLibre Incorporated (Information Technology, Internet Software & Services) « | | | | | | | 166,800 | | | $ | 15,557,436 | |
| | | | | | | | | | | | |
| | | | |
| Brazil: 12.50% | | | | | | | | | | | | |
All America Latina Logistica SA (Industrials, Road & Rail) | | | | | | | 12,932,870 | | | | 51,215,267 | |
Ambev SA ADR (Consumer Staples, Beverages) | | | | | | | 13,177,000 | | | | 95,533,250 | |
B2W Companhia Global Do Varejo (Consumer Discretionary, Internet & Catalog Retail) † | | | | | | | 2,135,690 | | | | 23,734,678 | |
Banco Bradesco SA ADR (Financials, Banks) | | | | | | | 8,412,708 | | | | 125,096,968 | |
BM&F Bovespa SA (Financials, Diversified Financial Services) | | | | | | | 10,724,000 | | | | 54,828,389 | |
BRF Brasil Foods SA ADR (Consumer Staples, Food Products) « | | | | | | | 1,106,278 | | | | 25,001,883 | |
Brookfield Incorporacoes SA (Financials, Real Estate Management & Development) † | | | | | | | 4,603,572 | | | | 2,952,397 | |
CCR SA (Industrials, Transportation Infrastructure) | | | | | | | 1,553,200 | | | | 12,155,327 | |
CETIP SA (Financials, Capital Markets) | | | | | | | 4,482,537 | | | | 57,113,522 | |
Lojas Renner SA (Consumer Discretionary, Multiline Retail) | | | | | | | 1,456,600 | | | | 42,853,665 | |
Multiplan Empreendimentos lmobilianios SA (Financials, Real Estate Management & Development) | | | | | | | 1,421,200 | | | | 31,410,129 | |
Petroleo Brasileiro SA ADR (Energy, Oil, Gas & Consumable Fuels) | | | | | | | 2,483,200 | | | | 34,466,816 | |
Petroleo Brasileiro SA ADR Class A (Energy, Oil, Gas & Consumable Fuels) | | | | | | | 2,302,953 | | | | 34,083,704 | |
Raia Drogasil SA (Consumer Staples, Food & Staples Retailing) | | | | | | | 2,322,600 | | | | 19,791,187 | |
Vale SA ADR (Materials, Metals & Mining) | | | | | | | 1,221,636 | | | | 16,150,028 | |
| | | | |
| | | | | | | | | | | 626,387,210 | |
| | | | | | | | | | | | |
| | | | |
| Chile: 1.12% | | | | | | | | | | | | |
Banco Santander Chile SA ADR (Financials, Banks) | | | | | | | 1,207,700 | | | | 29,310,879 | |
Inversiones La Construccion (Financials, Diversified Financial Services) | | | | | | | 100,000 | | | | 1,315,894 | |
SACI Falabella (Consumer Discretionary, Multiline Retail) | | | | | | | 2,992,077 | | | | 25,452,977 | |
| | | | |
| | | | | | | | | | | 56,079,750 | |
| | | | | | | | | | | | |
| | | | |
| China: 15.52% | | | | | | | | | | | | |
51Job Incorporated ADR (Industrials, Professional Services) Ǡ | | | | | | | 611,191 | | | | 41,218,721 | |
Baidu Incorporated ADR (Information Technology, Internet Software & Services) † | | | | | | | 199,700 | | | | 30,723,845 | |
China Life Insurance Company Limited (Financials, Insurance) | | | | | | | 34,505,290 | | | | 88,923,016 | |
China Mobile Limited (Telecommunication Services, Wireless Telecommunication Services) | | | | | | | 12,185,165 | | | | 115,832,897 | |
CNOOC Limited (Energy, Oil, Gas & Consumable Fuels) | | | | | | | 52,180,000 | | | | 86,282,976 | |
Ctrip.com International Limited ADR (Consumer Discretionary, Internet & Catalog Retail) † | | | | | | | 924,016 | | | | 43,188,508 | |
First Tractor Company (Industrials, Machinery) | | | | | | | 7,532,000 | | | | 4,410,615 | |
Hengan International Group Company Limited (Consumer Staples, Personal Products) | | | | | | | 5,070,000 | | | | 53,394,579 | |
New Oriental Education & Technology Group Incorporated (Consumer Discretionary, Diversified Consumer Services) | | | | | | | 1,981,182 | | | | 47,944,604 | |
PetroChina Company Limited (Energy, Oil, Gas & Consumable Fuels) | | | | | | | 28,370,000 | | | | 32,860,086 | |
Shandong Weigao Group Medical Polymer Company Limited Class H (Health Care, Health Care Equipment & Supplies) | | | | | | | 8,600,000 | | | | 8,652,190 | |
Sichuan Expressway Company (Industrials, Transportation Infrastructure) | | | | | | | 22,984,000 | | | | 6,877,754 | |
SINA Corporation (Information Technology, Internet Software & Services) † | | | | | | | 1,691,907 | | | | 80,873,155 | |
Tingyi Holding Corporation (Consumer Staples, Food Products) | | | | | | | 23,128,000 | | | | 64,286,291 | |
Tsingtao Brewery Company Limited (Consumer Staples, Beverages) | | | | | | | 7,652,000 | | | | 55,714,973 | |
Weibo Corporation ADR (Information Technology, Internet Software & Services) Ǡ | | | | | | | 834,900 | | | | 16,330,644 | |
| | | | |
| | | | | | | | | | | 777,514,854 | |
| | | | | | | | | | | | |
| | | | |
| Colombia: 0.73% | | | | | | | | | | | | |
Bancolombia SA ADR (Financials, Banks) « | | | | | | | 642,900 | | | | 36,600,297 | |
| | | | | | | | | | | | |
The accompanying notes are an integral part of these financial statements.
| | | | |
| 8 | | Wells Fargo Advantage Emerging Markets Equity Fund | | Portfolio of investments—April 30, 2014 (unaudited) |
| | | | | | | | | | | | |
| Security name | | | | | | Shares | | | Value | |
| | | | |
| Hong Kong: 4.03% | | | | | | | | | | | | |
AIA Group Limited (Financials, Insurance) | | | | | | | 13,761,400 | | | $ | 66,739,582 | |
Belle International Holdings Limited (Consumer Discretionary, Specialty Retail) | | | | | | | 61,216,000 | | | | 63,403,541 | |
Johnson Electric Holdings Limited (Industrials, Electrical Equipment) | | | | | | | 15,985,000 | | | | 15,277,907 | |
Li Ning Company Limited (Consumer Discretionary, Textiles, Apparel & Luxury Goods) Ǡ | | | | | | | 13,706,500 | | | | 9,546,702 | |
Shangri-La Asia Limited (Consumer Discretionary, Hotels, Restaurants & Leisure) | | | | | | | 3,033,500 | | | | 5,000,436 | |
Sun Art Retail Group Limited (Consumer Staples, Food & Staples Retailing) « | | | | | | | 26,254,500 | | | | 34,202,523 | |
Texwinca Holdings Limited (Consumer Discretionary, Textiles, Apparel & Luxury Goods) | | | | | | | 7,164,000 | | | | 7,697,215 | |
| | | | |
| | | | | | | | | | | 201,867,906 | |
| | | | | | | | | | | | |
| | | | |
| India: 6.85% | | | | | | | | | | | | |
Bharti Airtel Limited (Telecommunication Services, Wireless Telecommunication Services) | | | | | | | 4,838,728 | | | | 26,317,578 | |
Bharti Infratel Limited (Industrials, Construction & Engineering) | | | | | | | 5,218,871 | | | | 18,659,530 | |
Housing Development Finance Corporation Limited (Financials, Thrifts & Mortgage Finance) | | | | | | | 2,250,700 | | | | 33,507,686 | |
ICICI Bank Limited ADR (Financials, Banks) | | | | | | | 1,688,355 | | | | 72,042,108 | |
Infosys Technologies Limited ADR (Information Technology, IT Services) | | | | | | | 738,115 | | | | 39,644,157 | |
ITC Limited (Consumer Staples, Tobacco) | | | | | | | 9,882,640 | | | | 55,832,041 | |
Reliance Industries Limited (Energy, Oil, Gas & Consumable Fuels) | | | | | | | 3,164,200 | | | | 49,093,233 | |
Reliance Industries Limited GDR (Energy, Oil, Gas & Consumable Fuels) 144A | | | | | | | 1,246,587 | | | | 38,644,197 | |
Ultra Tech Cement Limited (Materials, Construction Materials) | | | | | | | 286,000 | | | | 9,612,284 | |
| | | | |
| | | | | | | | | | | 343,352,814 | |
| | | | | | | | | | | | |
| | | | |
| Indonesia: 1.14% | | | | | | | | | | | | |
PT Astra International Tbk (Consumer Discretionary, Automobiles) | | | | | | | 13,851,000 | | | | 8,895,357 | |
PT Bank Central Asia Tbk (Financials, Banks) | | | | | | | 9,299,500 | | | | 8,847,857 | |
PT Matahari Department Store Tbk (Consumer Discretionary, Multiline Retail) † | | | | | | | 6,774,200 | | | | 8,788,911 | |
PT Telekomunik Indonesia Persoro Tbk (Telecommunication Services, Diversified Telecommunication Services) « | | | | | | | 768,877 | | | | 30,524,417 | |
| | | | |
| | | | | | | | | | | 57,056,542 | |
| | | | | | | | | | | | |
| | | | |
| Israel: 0.28% | | | | | | | | | | | | |
Israel Chemicals Limited (Materials, Chemicals) | | | | | | | 1,569,600 | | | | 13,906,642 | |
| | | | | | | | | | | | |
| | | | |
| Malaysia: 1.37% | | | | | | | | | | | | |
Genting Bhd (Consumer Discretionary, Hotels, Restaurants & Leisure) | | | | | | | 7,980,900 | | | | 23,951,254 | |
Genting Malaysia Bhd (Consumer Discretionary, Hotels, Restaurants & Leisure) | | | | | | | 15,996,300 | | | | 20,671,991 | |
KLCC Property Holdings Bhd (Financials, REITs) | | | | | | | 3,437,900 | | | | 7,011,610 | |
Sime Darby Bhd (Industrials, Industrial Conglomerates) | | | | | | | 5,865,937 | | | | 16,957,417 | |
| | | | |
| | | | | | | | | | | 68,592,272 | |
| | | | | | | | | | | | |
| | | | |
| Mexico: 11.72% | | | | | | | | | | | | |
America Movil SAB de CV ADR (Telecommunication Services, Wireless Telecommunication Services) | | | | | | | 3,783,420 | | | | 75,971,074 | |
Cemex SAB de CV ADR (Materials, Construction Materials) † | | | | | | | 5,012,988 | | | | 63,364,165 | |
Fibra Uno Administracion SAB de CV (Financials, REITs) | | | | | | | 19,202,159 | | | | 62,951,642 | |
Fomento Economico Mexicano SAB de CV ADR (Consumer Staples, Beverages) | | | | | | | 1,223,400 | | | | 111,048,018 | |
Grupo Financiero Banorte SAB de CV (Financials, Banks) | | | | | | | 11,714,711 | | | | 77,804,073 | |
Grupo Financiero Santander SAB de CV ADR (Financials, Banks) « | | | | | | | 2,173,641 | | | | 25,866,328 | |
Grupo Sanborns SA de CV (Consumer Discretionary, Multiline Retail) | | | | | | | 4,264,153 | | | | 7,089,131 | |
Grupo Televisa SAB ADR (Consumer Discretionary, Media) | | | | | | | 2,385,000 | | | | 78,251,850 | |
Wal-Mart de Mexico SAB de CV (Consumer Staples, Food & Staples Retailing) | | | | | | | 33,527,100 | | | | 84,825,210 | |
| | | | |
| | | | | | | | | | | 587,171,491 | |
| | | | | | | | | | | | |
The accompanying notes are an integral part of these financial statements.
| | | | | | |
| Portfolio of investments—April 30, 2014 (unaudited) | | Wells Fargo Advantage Emerging Markets Equity Fund | | | 9 | |
| | | | | | | | | | | | |
| Security name | | | | | | Shares | | | Value | |
| | | | |
| Peru: 0.36% | | | | | | | | | | | | |
Compania de Minas Buenaventura SA ADR (Materials, Metals & Mining) | | | | | | | 1,373,600 | | | $ | 17,856,800 | |
| | | | | | | | | | | | |
| | | | |
| Philippines: 0.47% | | | | | | | | | | | | |
Ayala Corporation (Financials, Diversified Financial Services) | | | | | | | 632,624 | | | | 8,855,033 | |
Metropolitan Bank & Trust Company (Financials, Banks) | | | | | | | 3,650,521 | | | | 6,935,826 | |
SM Investments Corporation (Industrials, Industrial Conglomerates) | | | | | | | 476,582 | | | | 7,750,605 | |
| | | | |
| | | | | | | | | | | 23,541,464 | |
| | | | | | | | | | | | |
| | | | |
| Russia: 4.08% | | | | | | | | | | | | |
Lukoil ADR (Energy, Oil, Gas & Consumable Fuels) | | | | | | | 1,011,249 | | | | 53,444,510 | |
Magnit (Consumer Staples, Food & Staples Retailing) (a) | | | | | | | 99,300 | | | | 19,703,306 | |
Mobile Telesystems ADR (Telecommunication Services, Wireless Telecommunication Services) | | | | | | | 3,417,800 | | | | 57,282,328 | |
Sberbank of Russia (Financials, Banks) (a) | | | | | | | 5,517,377 | | | | 11,231,498 | |
Sberbank of Russia ADR (Financials, Banks) | | | | | | | 2,181,195 | | | | 18,282,776 | |
Yandex NV Class A (Information Technology, Internet Software & Services) † | | | | | | | 1,675,106 | | | | 44,390,309 | |
| | | | |
| | | | | | | | | | | 204,334,727 | |
| | | | | | | | | | | | |
| | | | |
| South Africa: 5.52% | | | | | | | | | | | | |
Anglo American Platinum Limited (Materials, Metals & Mining) † | | | | | | | 106,832 | | | | 5,077,325 | |
AngloGold Ashanti Limited ADR (Materials, Metals & Mining) | | | | | | | 1,077,592 | | | | 19,504,415 | |
Clicks Group Limited (Consumer Staples, Food & Staples Retailing) | | | | | | | 1,020,000 | | | | 6,219,571 | |
Gold Fields Limited ADR (Materials, Metals & Mining) | | | | | | | 960,700 | | | | 4,063,761 | |
Impala Platinum Holdings Limited (Materials, Metals & Mining) | | | | | | | 1,290,758 | | | | 14,526,472 | |
MTN Group Limited (Telecommunication Services, Wireless Telecommunication Services) « | | | | | | | 2,112,643 | | | | 42,333,185 | |
Sasol Limited (Energy, Oil, Gas & Consumable Fuels) | | | | | | | 470,000 | | | | 26,371,018 | |
Shoprite Holdings Limited (Consumer Staples, Food & Staples Retailing) | | | | | | | 3,508,100 | | | | 58,584,486 | |
Standard Bank Group Limited (Financials, Banks) | | | | | | | 2,265,190 | | | | 29,730,282 | |
Tiger Brands Limited (Consumer Staples, Food Products) | | | | | | | 2,615,333 | | | | 69,889,712 | |
| | | | |
| | | | | | | | | | | 276,300,227 | |
| | | | | | | | | | | | |
| | | | |
| South Korea: 9.58% | | | | | | | | | | | | |
Amorepacific Corporation (Consumer Staples, Personal Products) | | | | | | | 8,490 | | | | 10,968,886 | |
KB Financial Group Incorporated (Financials, Banks) | | | | | | | 330,000 | | | | 11,241,653 | |
KB Financial Group Incorporated ADR (Financials, Banks) | | | | | | | 93,117 | | | | 3,196,707 | |
KT Corporation ADR (Telecommunication Services, Diversified Telecommunication Services) | | | | | | | 4,054,813 | | | | 64,512,075 | |
KT&G Corporation (Consumer Staples, Tobacco) | | | | | | | 939,891 | | | | 75,314,986 | |
Lotte Chilsung Beverage Company Limited (Consumer Staples, Beverages) | | | | | | | 2,855 | | | | 4,318,557 | |
Lotte Confectionery Company Limited (Consumer Staples, Food Products) | | | | | | | 1,977 | | | | 3,386,519 | |
Samsung Electronics Company Limited (Information Technology, Semiconductors & Semiconductor Equipment) | | | | | | | 175,736 | | | | 228,407,479 | |
Samsung Life Insurance Company Limited (Financials, Insurance) | | | | | | | 672,337 | | | | 62,529,358 | |
Shinhan Financial Group Company Limited (Financials, Banks) | | | | | | | 365,945 | | | | 15,936,829 | |
| | | | |
| | | | | | | | | | | 479,813,049 | |
| | | | | | | | | | | | |
| | | | |
| Taiwan: 8.50% | | | | | | | | | | | | |
104 Corporation (Industrials, Commercial Services & Supplies) | | | | | | | 1,655,000 | | | | 6,275,167 | |
Far Eastern New Century Corporation (Industrials, Industrial Conglomerates) | | | | | | | 27,145,760 | | | | 27,776,806 | |
Fuhwa Financial Holdings Company Limited (Financials, Capital Markets) | | | | | | | 48,050,750 | | | | 23,947,407 | |
Media Tek Incorporated (Information Technology, Semiconductors & Semiconductor Equipment) | | | | | | | 1,998,881 | | | | 31,242,858 | |
President Chain Store Corporation (Consumer Staples, Food & Staples Retailing) | | | | | | | 3,475,000 | | | | 25,834,078 | |
The accompanying notes are an integral part of these financial statements.
| | | | |
| 10 | | Wells Fargo Advantage Emerging Markets Equity Fund | | Portfolio of investments—April 30, 2014 (unaudited) |
| | | | | | | | | | | | | | | | |
| Security name | | | | | | | | Shares | | | Value | |
| | | | |
| Taiwan (continued) | | | | | | | | | | | | | | | | |
Taiwan Semiconductor Manufacturing Company Limited (Information Technology, Semiconductors & Semiconductor Equipment) | | | | | | | | | | | 13,135,224 | | | $ | 51,543,945 | |
Taiwan Semiconductor Manufacturing Company Limited ADR (Information Technology, Semiconductors & Semiconductor Equipment) | | | | | | | | | | | 9,597,852 | | | | 192,916,825 | |
Uni-President Enterprises Corporation (Consumer Staples, Food Products) | | | | | | | | | | | 39,300,480 | | | | 66,502,898 | |
| | | | |
| | | | | | | | | | | | | | | 426,039,984 | |
| | | | | | | | | | | | | | | | |
| | | | |
| Thailand: 3.56% | | | | | | | | | | | | | | | | |
Bangkok Bank PCL (Financials, Banks) | | | | | | | | | | | 3,729,800 | | | | 21,784,061 | |
PTT Exploration & Production PCL ADR (Energy, Oil, Gas & Consumable Fuels) | | | | | | | | | | | 5,903,739 | | | | 29,099,084 | |
PTT PCL (Energy, Oil, Gas & Consumable Fuels) | | | | | | | | | | | 3,290,200 | | | | 31,722,571 | |
Siam Commercial Bank PCL (Financials, Banks) | | | | | | | | | | | 9,505,100 | | | | 47,877,976 | |
Thai Beverage PCL (Consumer Staples, Beverages) | | | | | | | | | | | 101,627,000 | | | | 47,826,378 | |
| | | | |
| | | | | | | | | | | | | | | 178,310,070 | |
| | | | | | | | | | | | | | | | |
| | | | |
| Turkey: 1.03% | | | | | | | | | | | | | | | | |
Anadolu Efes Biracilik Ve Malt Sanayii AS (Consumer Staples, Beverages) | | | | | | | | | | | 2,900,453 | | | | 34,683,734 | |
Turkcell Iletisim Hizmetleri AS ADR (Telecommunication Services, Wireless Telecommunication Services) † | | | | | | | | | | | 1,181,462 | | | | 17,107,570 | |
| | | | |
| | | | | | | | | | | | | | | 51,791,304 | |
| | | | | | | | | | | | | | | | |
| | | | |
| United Kingdom: 1.46% | | | | | | | | | | | | | | | | |
African Barrick Gold Limited (Materials, Metals & Mining) | | | | | | | | | | | 1,428,500 | | | | 5,988,694 | |
Standard Chartered Bank plc (Financials, Banks) | | | | | | | | | | | 3,099,560 | | | | 67,064,672 | |
| | | | |
| | | | | | | | | | | | | | | 73,053,366 | |
| | | | | | | | | | | | | | | | |
| | | | |
Total Common Stocks (Cost $4,264,818,327) | | | | | | | | | | | | | | | 4,515,128,205 | |
| | | | | | | | | | | | | | | | |
| | | | |
| | | Interest rate | | | Maturity date | | | Principal | | | | |
| | | | |
Convertible Debentures: 0.00% | | | | | | | | | | | | | | | | |
| | | | |
| Brazil: 0.00% | | | | | | | | | | | | | | | | |
Lupatech SA (Energy, Energy Equipment & Services) (a)(s)(i) | | | 6.50 | % | | | 4-15-2018 | | | $ | 303,000 | | | | 4,783 | |
| | | | | | | | | | | | | | | | |
| | | | |
Total Convertible Debentures (Cost $160,691) | | | | | | | | | | | | | | | 4,783 | |
| | | | | | | | | | | | | | | | |
| | | | |
| | | Dividend yield | | | | | | Shares | | | | |
| | | | |
Preferred Stocks: 2.25% | | | | | | | | | | | | | | | | |
| | | | |
| Brazil: 2.25% | | | | | | | | | | | | | | | | |
Lojas Americanas SA (Consumer Discretionary, Multiline Retail) ± | | | 0.54 | | | | | | | | 12,980,903 | | | | 98,328,266 | |
Vale SA ADR (Materials, Metals & Mining) ± | | | 6.81 | | | | | | | | 1,203,500 | | | | 14,285,545 | |
| | | | |
Total Preferred Stocks (Cost $109,703,904) | | | | | | | | | | | | | | | 112,613,811 | |
| | | | | | | | | | | | | | | | |
The accompanying notes are an integral part of these financial statements.
| | | | | | |
| Portfolio of investments—April 30, 2014 (unaudited) | | Wells Fargo Advantage Emerging Markets Equity Fund | | | 11 | |
| | | | | | | | | | | | | | | | |
| Security name | | | | | Expiration date | | | Shares | | | Value | |
| | | | |
Warrants: 0.02% | | | | | | | | | | | | | | | | |
| | | | |
| Malaysia: 0.02% | | | | | | | | | | | | | | | | |
Genting Bhd (Consumer Discretionary, Hotels, Restaurants & Leisure) † | | | | | | | 12-18-2018 | | | | 1,070,225 | | | $ | 947,160 | |
| | | | | | | | | | | | | | | | |
| | | | |
Total Warrants (Cost $504,268) | | | | | | | | | | | | | | | 947,160 | |
| | | | | | | | | | | | | | | | |
| | | | |
| | | Yield | | | | | | | | | | |
| | | | |
Short-Term Investments: 8.41% | | | | | | | | | | | | | | | | |
| | | | |
| Investment Companies: 8.41% | | | | | | | | | | | | | | | | |
Wells Fargo Advantage Cash Investment Money Market Fund, Select Class (l)(u) | | | 0.07 | % | | | | | | | 331,469,390 | | | | 331,469,390 | |
Wells Fargo Securities Lending Cash Investments, LLC (l)(u)(r)(v) | | | 0.11 | | | | | | | | 90,015,597 | | | | 90,015,597 | |
| | | | |
Total Short-Term Investments (Cost $421,484,987) | | | | | | | | | | | | | | | 421,484,987 | |
| | | | | | | | | | | | | | | | |
| | | | | | | | |
Total investments in securities
(Cost $4,796,672,177) * | | | 100.81 | % | | | 5,050,178,946 | |
Other assets and liabilities, net | | | (0.81 | ) | | | (40,544,615 | ) |
| | | | | | | | |
| Total net assets | | | 100.00 | % | | $ | 5,009,634,331 | |
| | | | | | | | |
| « | All or a portion of this security is on loan. |
| † | Non-income-earning security |
| 144A | Security that may be resold to “qualified institutional buyers” under Rule 144A or security offered pursuant to Section 4(2) of the Securities Act of 1933, as amended. |
| (a) | Security is fair valued by the Management Valuation Team, and in certain instances by the Board of Trustees, in accordance with procedures approved by the Board of Trustees. |
| (s) | Security is currently in default with regards to scheduled interest and/or principal payments. The Fund has stopped accruing interest on this security. |
| ± | Variable rate investment. The interest rate shown is the rate in effect at period end. |
| (l) | Represents an affiliate of the Fund under Sections 2(a)(2) and 2(a)(3) of the Investment Company Act of 1940, as amended. |
| (u) | Rate shown is the 7-day annualized yield at period end. |
| (r) | The investment company is exempt from registration under Section 3(c)(7) of the Investment Company Act of 1940, as amended |
| (v) | Security represents investment of cash collateral received from securities on loan. |
| * | Cost for federal income tax purposes is $4,805,520,997 and unrealized appreciation (depreciation) consists of: |
| | | | |
Gross unrealized appreciation | | $ | 580,309,925 | |
Gross unrealized depreciation | | | (335,651,976 | ) |
| | | | |
Net unrealized appreciation | | $ | 244,657,949 | |
The accompanying notes are an integral part of these financial statements.
| | | | |
| 12 | | Wells Fargo Advantage Emerging Markets Equity Fund | | Statement of assets and liabilities—April 30, 2014 (unaudited) |
| | | | |
| | | | |
| |
Assets | | | | |
Investments | | | | |
In unaffiliated securities (including securities on loan), at value (see cost below) | | $ | 4,628,693,959 | |
In affiliated securities, at value (see cost below) | | | 421,484,987 | |
| | | | |
Total investments, at value (see cost below) | | | 5,050,178,946 | |
Foreign currency, at value (see cost below) | | | 47,812,974 | |
Receivable for investments sold | | | 1,747,525 | |
Receivable for Fund shares sold | | | 11,024,376 | |
Receivable for dividends | | | 12,381,005 | |
Receivable for securities lending income | | | 145,455 | |
Prepaid expenses and other assets | | | 239,350 | |
| | | | |
Total assets | | | 5,123,529,631 | |
| | | | |
| |
Liabilities | | | | |
Payable for investments purchased | | | 10,347,110 | |
Payable for Fund shares redeemed | | | 8,077,037 | |
Payable upon receipt of securities loaned | | | 90,015,597 | |
Advisory fee payable | | | 4,133,238 | |
Distribution fees payable | | | 98,543 | |
Due to other related parties | | | 806,530 | |
Accrued expenses and other liabilities | | | 417,245 | |
| | | | |
Total liabilities | | | 113,895,300 | |
| | | | |
Total net assets | | $ | 5,009,634,331 | |
| | | | |
| |
NET ASSETS CONSIST OF | | | | |
Paid-in capital | | $ | 4,787,387,375 | |
Overdistributed net investment income | | | (1,530,744 | ) |
Accumulated net realized losses on investments | | | (30,174,246 | ) |
Net unrealized gains on investments | | | 253,951,946 | |
| | | | |
Total net assets | | $ | 5,009,634,331 | |
| | | | |
| |
COMPUTATION OF NET ASSET VALUE AND OFFERING PRICE PER SHARE1 | | | | |
Net assets – Class A | | $ | 1,503,926,490 | |
Shares outstanding – Class A | | | 72,010,994 | |
Net asset value per share – Class A | | | $20.88 | |
Maximum offering price per share – Class A2 | | | $22.15 | |
Net assets – Class B | | $ | 7,405,665 | |
Shares outstanding – Class B | | | 414,960 | |
Net asset value per share – Class B | | | $17.85 | |
Net assets – Class C | | $ | 149,750,215 | |
Shares outstanding – Class C | | | 8,454,911 | |
Net asset value per share – Class C | | | $17.71 | |
Net assets – Class R6 | | $ | 31,404,773 | |
Share outstanding – Class R6 | | | 1,434,326 | |
Net asset value per share – Class R6 | | | $21.90 | |
Net assets – Administrator Class | | $ | 1,009,740,333 | |
Shares outstanding – Administrator Class | | | 46,225,679 | |
Net asset value per share – Administrator Class | | | $21.84 | |
Net assets – Institutional Class | | $ | 2,307,406,855 | |
Shares outstanding – Institutional Class | | | 105,396,570 | |
Net asset value per share – Institutional Class | | | $21.89 | |
| |
Investments in unaffiliated securities (including securities on loan), at cost | | $ | 4,375,187,190 | |
| | | | |
Investments in affiliated securities, at cost | | $ | 421,484,987 | |
| | | | |
Total investments, at cost | | $ | 4,796,672,177 | |
| | | | |
Securities on loan, at value | | $ | 86,624,420 | |
| | | | |
Foreign currency, at cost | | $ | 47,366,075 | |
| | | | |
| 1. | The Fund has an unlimited number of authorized shares. |
| 2. | Maximum offering price is computed as 100/94.25 of net asset value. On investments of $50,000 or more, the offering price is reduced. |
The accompanying notes are an integral part of these financial statements.
| | | | | | |
| Statement of operations—six months ended April 30, 2014 (unaudited) | | Wells Fargo Advantage Emerging Markets Equity Fund | | | 13 | |
| | | | |
| | | | |
| |
Investment income | | | | |
Dividends * | | $ | 38,341,818 | |
Securities lending income, net | | | 293,545 | |
Income from affiliated securities | | | 137,077 | |
| | | | |
Total investment income | | | 38,772,440 | |
| | | | |
| |
Expenses | | | | |
Advisory fee | | | 23,486,612 | |
Administration fees | | | | |
Fund level | | | 1,176,931 | |
Class A | | | 1,780,748 | |
Class B | | | 11,179 | |
Class C | | | 203,148 | |
Class R6 | | | 2,951 | |
Administrator Class | | | 489,030 | |
Institutional Class | | | 870,899 | |
Shareholder servicing fees | | | | |
Class A | | | 1,712,257 | |
Class B | | | 10,749 | |
Class C | | | 195,335 | |
Administrator Class | | | 1,222,576 | |
Distribution fees | | | | |
Class B | | | 32,247 | |
Class C | | | 586,004 | |
Custody and accounting fees | | | 1,385,740 | |
Professional fees | | | 32,455 | |
Registration fees | | | 96,924 | |
Shareholder report expenses | | | 340,924 | |
Trustees’ fees and expenses | | | 7,012 | |
Other fees and expenses | | | 49,491 | |
| | | | |
Total expenses | | | 33,693,212 | |
Less: Fee waivers and/or expense reimbursements | | | (1,183 | ) |
| | | | |
Net expenses | | | 33,692,029 | |
| | | | |
Net investment income | | | 5,080,411 | |
| | | | |
| |
REALIZED AND UNREALIZED GAINS (LOSSES) ON INVESTMENTS | | | | |
| |
Net realized gains on: | | | | |
Unaffiliated securities | | | 3,998,615 | |
Forward foreign currency contract transactions | | | 19,502 | |
| | | | |
Net realized gains on investments | | | 4,018,117 | |
| | | | |
Net change in unrealized gains (losses) on investments | | | (179,253,691 | ) |
| | | | |
Net realized and unrealized gains (losses) on investments | | | (175,235,574 | ) |
| | | | |
Net decrease in net assets resulting from operations | | $ | (170,155,163 | ) |
| | | | |
| |
* Net of foreign dividend withholding taxes in the amount of | | | $4,601,439 | |
The accompanying notes are an integral part of these financial statements.
| | | | |
| 14 | | Wells Fargo Advantage Emerging Markets Equity Fund | | Statement of changes in net assets |
| | | | | | | | | | | | | | | | |
| | | Six months ended April 30, 2014 (unaudited) | | | Year ended October 31, 2013 | |
| | | | |
Operations | | | | | | | | | | | | | | | | |
Net investment income | | | | | | $ | 5,080,411 | | | | | | | $ | 12,209,161 | |
Net realized gains on investments | | | | | | | 4,018,117 | | | | | | | | 1,113,672 | |
Net change in unrealized gains (losses) on investments | | | | | | | (179,253,691 | ) | | | | | | | 244,438,794 | |
| | | | |
Net increase (decrease) in net assets resulting from operations | | | | | | | (170,155,163 | ) | | | | | | | 257,761,627 | |
| | | | |
| | | | |
Distributions to shareholders from | | | | | | | | | | | | | | | | |
Net investment income | | | | | | | | | | | | | | | | |
Class A | | | | | | | 0 | | | | | | | | (3,231,840 | ) |
Class R6 | | | | | | | (45,340 | ) | | | | | | | 0 | 1 |
Administrator Class | | | | | | | (1,783,180 | ) | | | | | | | (2,897,616 | ) |
Institutional Class | | | | | | | (8,965,400 | ) | | | | | | | (8,737,710 | ) |
| | | | |
Total distributions to shareholders | | | | | | | (10,793,920 | ) | | | | | | | (14,867,166 | ) |
| | | | |
| | | | |
Capital share transactions | | | Shares | | | | | | | | Shares | | | | | |
Proceeds from shares sold | | | | | | | | | | | | | | | | |
Class A | | | 25,030,104 | | | | 502,545,004 | | | | 28,971,650 | | | | 605,658,364 | |
Class B | | | 783 | | | | 13,808 | | | | 11,463 | | | | 209,001 | |
Class C | | | 467,031 | | | | 8,256,062 | | | | 2,205,697 | | | | 39,795,022 | |
Class R6 | | | 1,241,969 | | | | 26,697,357 | | | | 210,344 | 1 | | | 4,448,474 | 1 |
Administrator Class | | | 9,116,897 | | | | 195,213,192 | | | | 31,335,752 | | | | 688,002,016 | |
Institutional Class | | | 21,147,265 | | | | 455,727,856 | | | | 63,246,185 | | | | 1,394,231,709 | |
| | | | |
| | | | | | | 1,188,453,279 | | | | | | | | 2,732,344,586 | |
| | | | |
Reinvestment of distributions | | | | | | | | | | | | | | | | |
Class A | | | 0 | | | | 0 | | | | 146,282 | | | | 3,088,018 | |
Class R6 | | | 2,064 | | | | 45,340 | | | | 0 | 1 | | | 0 | 1 |
Administrator Class | | | 75,992 | | | | 1,668,033 | | | | 114,076 | | | | 2,516,527 | |
Institutional Class | | | 367,774 | | | | 8,083,670 | | | | 319,622 | | | | 7,057,247 | |
| | | | |
| | | | | | | 9,797,043 | | | | | | | | 12,661,792 | |
| | | | |
Payment for shares redeemed | | | | | | | | | | | | | | | | |
Class A | | | (13,030,437 | ) | | | (266,421,331 | ) | | | (14,063,418 | ) | | | (296,152,744 | ) |
Class B | | | (178,782 | ) | | | (3,157,259 | ) | | | (291,772 | ) | | | (5,279,461 | ) |
Class C | | | (1,373,821 | ) | | | (23,792,659 | ) | | | (3,321,740 | ) | | | (59,348,476 | ) |
Class R6 | | | (20,051 | ) | | | (420,201 | ) | | | 0 | 1 | | | 0 | 1 |
Administrator Class | | | (9,073,566 | ) | | | (194,446,796 | ) | | | (14,941,011 | ) | | | (328,112,979 | ) |
Institutional Class | | | (11,624,242 | ) | | | (248,971,953 | ) | | | (22,780,680 | ) | | | (500,047,525 | ) |
| | | | |
| | | | | | | (737,210,199 | ) | | | | | | | (1,188,941,185 | ) |
| | | | |
Net increase in net assets resulting from capital share transactions | | | | | | | 461,040,123 | | | | | | | | 1,556,065,193 | |
| | | | |
Total increase in net assets | | | | | | | 280,091,040 | | | | | | | | 1,798,959,654 | |
| | | | |
| | | | |
Net assets | | | | | | | | | | | | | | | | |
Beginning of period | | | | | | | 4,729,543,291 | | | | | | | | 2,930,583,637 | |
| | | | |
End of period | | | | | | $ | 5,009,634,331 | | | | | | | $ | 4,729,543,291 | |
| | | | |
Undistributed (overdistributed) net investment income | | | | | | $ | (1,530,744 | ) | | | | | | $ | 4,182,765 | |
| | | | |
| 1. | For the period from June 28, 2013 (commencement of class operations) to October 31, 2013. |
The accompanying notes are an integral part of these financial statements.
| | | | | | |
| Financial highlights | | Wells Fargo Advantage Emerging Markets Equity Fund | | | 15 | |
(For a share outstanding throughout each period)
| | | | | | | | | | | | | | | | | | | | | | | | |
| | | Six months ended
April 30, 2014 (unaudited) | | | Year ended October 31 | |
| CLASS A | | | 2013 | | | 2012 | | | 2011 | | | 20101 | | | 20091 | |
Net asset value, beginning of period | | $ | 21.77 | | | $ | 20.48 | | | $ | 20.93 | | | $ | 21.65 | | | $ | 16.99 | | | $ | 12.90 | |
Net investment income | | | 0.00 | 3 | | | 0.02 | | | | 0.10 | | | | 0.08 | | | | 0.04 | 2 | | | 0.04 | 2 |
Net realized and unrealized gains (losses) on investments | | | (0.89 | ) | | | 1.33 | | | | (0.19 | ) | | | (0.80 | ) | | | 4.63 | | | | 5.98 | |
| | | | | | | | | | | | | | | | | | | | | | | | |
Total from investment operations | | | (0.89 | ) | | | 1.35 | | | | (0.09 | ) | | | (0.72 | ) | | | 4.67 | | | | 6.02 | |
Distributions to shareholders from | | | | | | | | | | | | | | | | | | | | | | | | |
Net investment income | | | 0.00 | | | | (0.06 | ) | | | (0.14 | ) | | | (0.00 | )3 | | | (0.01 | ) | | | (0.12 | ) |
Net realized gains | | | 0.00 | | | | 0.00 | | | | (0.22 | ) | | | 0.00 | | | | 0.00 | | | | (1.81 | ) |
| | | | | | | | | | | | | | | | | | | | | | | | |
Total distributions to shareholders | | | 0.00 | | | | (0.06 | ) | | | (0.36 | ) | | | (0.00 | )3 | | | (0.01 | ) | | | (1.93 | ) |
Net asset value, end of period | | $ | 20.88 | | | $ | 21.77 | | | $ | 20.48 | | | $ | 20.93 | | | $ | 21.65 | | | $ | 16.99 | |
Total return4 | | | (4.09 | )% | | | 6.62 | % | | | (0.31 | )% | | | (3.32 | )% | | | 27.51 | % | | | 57.88 | % |
Ratios to average net assets (annualized) | | | | | | | | | | | | | | | | | | | | | | | | |
Gross expenses | | | 1.64 | % | | | 1.65 | % | | | 1.67 | % | | | 1.68 | % | | | 1.91 | % | | | 2.04 | % |
Net expenses | | | 1.64 | % | | | 1.65 | % | | | 1.67 | % | | | 1.68 | % | | | 1.89 | % | | | 2.03 | % |
Net investment income | | | 0.00 | % | | | 0.15 | % | | | 0.51 | % | | | 0.44 | % | | | 0.27 | % | | | 0.29 | % |
Supplemental data | | | | | | | | | | | | | | | | | | | | | | | | |
Portfolio turnover rate | | | 3 | % | | | 13 | % | | | 7 | % | | | 5 | % | | | 6 | % | | | 23 | % |
Net assets, end of period (000s omitted) | | | $1,503,926 | | | | $1,306,269 | | | | $920,709 | | | | $917,633 | | | | $820,716 | | | | $357,354 | |
| 1. | After the close of business on July 16, 2010, the Fund acquired the net assets of Evergreen Emerging Markets Growth Fund and Wells Fargo Advantage Emerging Markets Equity Fund. Evergreen Emerging Markets Growth Fund became the accounting and performance survivor in the transaction. The information for the periods prior to July 19, 2010 is that of Class A of Evergreen Emerging Markets Growth Fund. |
| 2. | Calculated based upon average shares outstanding. |
| 3. | Amount is less than $0.005. |
| 4. | Total return calculations do not include any sales charges. Returns for periods of less than one year are not annualized. |
The accompanying notes are an integral part of these financial statements.
| | | | |
| 16 | | Wells Fargo Advantage Emerging Markets Equity Fund | | Financial highlights |
(For a share outstanding throughout each period)
| | | | | | | | | | | | | | | | | | | | | | | | |
| | | Six months ended
April 30, 2014 (unaudited) | | | Year ended October 31 | |
| CLASS B | | | 2013 | | | 2012 | | | 2011 | | | 20101 | | | 20091 | |
Net asset value, beginning of period | | $ | 18.67 | | | $ | 17.64 | | | $ | 18.06 | | | $ | 18.82 | | | $ | 14.87 | | | $ | 11.51 | |
Net investment loss | | | (0.07 | )2 | | | (0.12 | )2 | | | (0.05 | )2 | | | (0.08 | )2 | | | (0.09 | )2 | | | (0.03 | ) |
Net realized and unrealized gains (losses) on investments | | | (0.75 | ) | | | 1.15 | | | | (0.15 | ) | | | (0.68 | ) | | | 4.04 | | | | 5.20 | |
| | | | | | | | | | | | | | | | | | | | | | | | |
Total from investment operations | | | (0.82 | ) | | | 1.03 | | | | (0.20 | ) | | | (0.76 | ) | | | 3.95 | | | | 5.17 | |
Distributions to shareholders from | | | | | | | | | | | | | | | | | | | | | | | | |
Net realized gains | | | 0.00 | | | | 0.00 | | | | (0.22 | ) | | | 0.00 | | | | 0.00 | | | | (1.81 | ) |
Net asset value, end of period | | $ | 17.85 | | | $ | 18.67 | | | $ | 17.64 | | | $ | 18.06 | | | $ | 18.82 | | | $ | 14.87 | |
Total return3 | | | (4.39 | )% | | | 5.84 | % | | | (1.06 | )% | | | (4.04 | )% | | | 26.56 | % | | | 56.75 | % |
Ratios to average net assets (annualized) | | | | | | | | | | | | | | | | | | | | | | | | |
Gross expenses | | | 2.38 | % | | | 2.39 | % | | | 2.41 | % | | | 2.43 | % | | | 2.66 | % | | | 2.80 | % |
Net expenses | | | 2.38 | % | | | 2.39 | % | | | 2.41 | % | | | 2.43 | % | | | 2.64 | % | | | 2.79 | % |
Net investment loss | | | (0.79 | )% | | | (0.64 | )% | | | (0.28 | )% | | | (0.39 | )% | | | (0.54 | )% | | | (0.43 | )% |
Supplemental data | | | | | | | | | | | | | | | | | | | | | | | | |
Portfolio turnover rate | | | 3 | % | | | 13 | % | | | 7 | % | | | 5 | % | | | 6 | % | | | 23 | % |
Net assets, end of period (000s omitted) | | | $7,406 | | | | $11,071 | | | | $15,408 | | | | $21,652 | | | | $30,989 | | | | $25,499 | |
| 1. | After the close of business on July 16, 2010, the Fund acquired the net assets of Evergreen Emerging Markets Growth Fund and Wells Fargo Advantage Emerging Markets Equity Fund. Evergreen Emerging Markets Growth Fund became the accounting and performance survivor in the transaction. The information for the periods prior to July 19, 2010 is that of Class B of Evergreen Emerging Markets Growth Fund. |
| 2. | Calculated based upon average shares outstanding. |
| 3. | Total return calculations do not include any sales charges. Returns for periods of less than one year are not annualized. |
The accompanying notes are an integral part of these financial statements.
| | | | | | |
| Financial highlights | | Wells Fargo Advantage Emerging Markets Equity Fund | | | 17 | |
(For a share outstanding throughout each period)
| | | | | | | | | | | | | | | | | | | | | | | | |
| | | Six months ended
April 30, 2014 (unaudited) | | | Year ended October 31 | |
| CLASS C | | | 2013 | | | 2012 | | | 2011 | | | 20101 | | | 20091 | |
Net asset value, beginning of period | | $ | 18.53 | | | $ | 17.51 | | | $ | 17.92 | | | $ | 18.68 | | | $ | 14.77 | | | $ | 11.44 | |
Net investment loss | | | (0.07 | )2 | | | (0.11 | )2 | | | (0.06 | ) | | | (0.06 | )2 | | | (0.08 | )2 | | | (0.05 | ) |
Net realized and unrealized gains (losses) on investments | | | (0.75 | ) | | | 1.13 | | | | (0.13 | ) | | | (0.70 | ) | | | 3.99 | | | | 5.19 | |
| | | | | | | | | | | | | | | | | | | | | | | | |
Total from investment operations | | | (0.82 | ) | | | 1.02 | | | | (0.19 | ) | | | (0.76 | ) | | | 3.91 | | | | 5.14 | |
Distributions to shareholders from | | | | | | | | | | | | | | | | | | | | | | | | |
Net realized gains | | | 0.00 | | | | 0.00 | | | | (0.22 | ) | | | 0.00 | | | | 0.00 | | | | (1.81 | ) |
Net asset value, end of period | | $ | 17.71 | | | $ | 18.53 | | | $ | 17.51 | | | $ | 17.92 | | | $ | 18.68 | | | $ | 14.77 | |
Total return3 | | | (4.43 | )% | | | 5.83 | % | | | (1.01 | )% | | | (4.07 | )% | | | 26.47 | % | | | 56.84 | % |
Ratios to average net assets (annualized) | | | | | | | | | | | | | | | | | | | | | | | | |
Gross expenses | | | 2.39 | % | | | 2.39 | % | | | 2.42 | % | | | 2.43 | % | | | 2.66 | % | | | 2.79 | % |
Net expenses | | | 2.39 | % | | | 2.39 | % | | | 2.42 | % | | | 2.43 | % | | | 2.64 | % | | | 2.78 | % |
Net investment loss | | | (0.76 | )% | | | (0.62 | )% | | | (0.24 | )% | | | (0.32 | )% | | | (0.50 | )% | | | (0.46 | )% |
Supplemental data | | | | | | | | | | | | | | | | | | | | | | | | |
Portfolio turnover rate | | | 3 | % | | | 13 | % | | | 7 | % | | | 5 | % | | | 6 | % | | | 23 | % |
Net assets, end of period (000s omitted) | | | $149,750 | | | | $173,454 | | | | $183,471 | | | | $200,796 | | | | $193,300 | | | | $121,216 | |
| 1. | After the close of business on July 16, 2010, the Fund acquired the net assets of Evergreen Emerging Markets Growth Fund and Wells Fargo Advantage Emerging Markets Equity Fund. Evergreen Emerging Markets Growth Fund became the accounting and performance survivor in the transaction. The information for the periods prior to July 19, 2010 is that of Class C of Evergreen Emerging Markets Growth Fund. |
| 2. | Calculated based upon average shares outstanding. |
| 3. | Total return calculations do not include any sales charges. Returns for periods of less than one year are not annualized. |
The accompanying notes are an integral part of these financial statements.
| | | | |
| 18 | | Wells Fargo Advantage Emerging Markets Equity Fund | | Financial highlights |
(For a share outstanding throughout each period)
| | | | | | | | |
| CLASS R6 | | Six months ended
April 30, 2014
(unaudited) | | | Year ended
October 31, 20131 | |
Net asset value, beginning of period | | $ | 22.86 | | | $ | 20.89 | |
Net investment income | | | 0.06 | 2 | | | 0.01 | 2 |
Net realized and unrealized gains (losses) on investments | | | (0.92 | ) | | | 1.96 | |
| | | | | | | | |
Total from investment operations | | | (0.86 | ) | | | 1.97 | |
Distributions to shareholders from | | | | | | | | |
Net investment income | | | (0.10 | ) | | | 0.00 | |
Net asset value, end of period | | $ | 21.90 | | | $ | 22.86 | |
Total return3 | | | (3.78 | )% | | | 9.43 | % |
Ratios to average net assets (annualized) | | | | | | | | |
Gross expenses | | | 1.16 | % | | | 1.17 | % |
Net expenses | | | 1.16 | % | | | 1.17 | % |
Net investment income | | | 0.60 | % | | | 0.15 | % |
Supplemental data | | | | | | | | |
Portfolio turnover rate | | | 3 | % | | | 13 | % |
Net assets, end of period (000s omitted) | | | $31,405 | | | | $4,809 | |
| 1. | For the period from June 28, 2013 (commencement of class operations) to October 31, 2013. |
| 2. | Calculated based upon average shares outstanding. |
| 3. | Returns for periods of less than one year are not annualized. |
The accompanying notes are an integral part of these financial statements.
| | | | | | |
| Financial highlights | | Wells Fargo Advantage Emerging Markets Equity Fund | | | 19 | |
(For a share outstanding throughout each period)
| | | | | | | | | | | | | | | | | | | | | | | | |
| | | Six months ended
April 30, 2014 (unaudited) | | | Year ended October 31 | |
| ADMINISTRATOR CLASS | | | 2013 | | | 2012 | | | 2011 | | | 20101 | | | 20091 | |
Net asset value, beginning of period | | $ | 22.79 | | | $ | 21.44 | | | $ | 21.90 | | | $ | 22.63 | | | $ | 17.75 | | | $ | 13.42 | |
Net investment income | | | 0.02 | | | | 0.05 | | | | 0.14 | | | | 0.02 | | | | 0.09 | 2 | | | 0.08 | |
Net realized and unrealized gains (losses) on investments | | | (0.93 | ) | | | 1.40 | | | | (0.18 | ) | | | (0.73 | ) | | | 4.83 | | | | 6.25 | |
| | | | | | | | | | | | | | | | | | | | | | | | |
Total from investment operations | | | (0.91 | ) | | | 1.45 | | | | (0.04 | ) | | | (0.71 | ) | | | 4.92 | | | | 6.33 | |
Distributions to shareholders from | | | | | | | | | | | | | | | | | | | | | | | | |
Net investment income | | | (0.04 | ) | | | (0.10 | ) | | | (0.20 | ) | | | (0.02 | ) | | | (0.04 | ) | | | (0.19 | ) |
Net realized gains | | | 0.00 | | | | 0.00 | | | | (0.22 | ) | | | 0.00 | | | | 0.00 | | | | (1.81 | ) |
| | | | | | | | | | | | | | | | | | | | | | | | |
Total distributions to shareholders | | | (0.04 | ) | | | (0.10 | ) | | | (0.42 | ) | | | (0.02 | ) | | | (0.04 | ) | | | (2.00 | ) |
Net asset value, end of period | | $ | 21.84 | | | $ | 22.79 | | | $ | 21.44 | | | $ | 21.90 | | | $ | 22.63 | | | $ | 17.75 | |
Total return3 | | | (4.00 | )% | | | 6.83 | % | | | (0.13 | )% | | | (3.14 | )% | | | 27.78 | % | | | 58.34 | % |
Ratios to average net assets (annualized) | | | | | | | | | | | | | | | | | | | | | | | | |
Gross expenses | | | 1.48 | % | | | 1.48 | % | | | 1.47 | % | | | 1.47 | % | | | 1.69 | % | | | 1.80 | % |
Net expenses | | | 1.48 | % | | | 1.48 | % | | | 1.47 | % | | | 1.47 | % | | | 1.65 | % | | | 1.79 | % |
Net investment income | | | 0.17 | % | | | 0.35 | % | | | 0.72 | % | | | 0.70 | % | | | 0.50 | % | | | 0.54 | % |
Supplemental data | | | | | | | | | | | | | | | | | | | | | | | | |
Portfolio turnover rate | | | 3 | % | | | 13 | % | | | 7 | % | | | 5 | % | | | 6 | % | | | 23 | % |
Net assets, end of period (000s omitted) | | | $1,009,740 | | | | $1,050,660 | | | | $634,428 | | | | $529,083 | | | | $248,493 | | | | $178,856 | |
| 1. | After the close of business on July 16, 2010, the Fund acquired the net assets of Evergreen Emerging Markets Growth Fund and Wells Fargo Advantage Emerging Markets Equity Fund. Evergreen Emerging Markets Growth Fund became the accounting and performance survivor in the transaction. The information for the periods prior to July 19, 2010 is that of Class I of Evergreen Emerging Markets Growth Fund. |
| 2. | Calculated based upon average shares outstanding. |
| 3. | Returns for periods of less than one year are not annualized. |
The accompanying notes are an integral part of these financial statements.
| | | | |
| 20 | | Wells Fargo Advantage Emerging Markets Equity Fund | | Financial highlights |
(For a share outstanding throughout each period)
| | | | | | | | | | | | | | | | | | | | |
| | | Six months ended
April 30, 2014 (unaudited) | | | Year ended October 31 | |
| INSTITUTIONAL CLASS | | | 2013 | | | 2012 | | | 2011 | | | 20101 | |
Net asset value, beginning of period | | $ | 22.86 | | | $ | 21.50 | | | $ | 21.96 | | | $ | 22.66 | | | $ | 20.11 | |
Net investment income | | | 0.04 | | | | 0.11 | | | | 0.22 | | | | 0.16 | | | | 0.00 | 2,3 |
Net realized and unrealized gains (losses) on investments | | | (0.92 | ) | | | 1.40 | | | | (0.22 | ) | | | (0.81 | ) | | | 2.55 | |
| | | | | | | | | | | | | | | | | | | | |
Total from investment operations | | | (0.88 | ) | | | 1.51 | | | | 0.00 | | | | (0.65 | ) | | | 2.55 | |
Distributions to shareholders from | | | | | | | | | | | | | | | | | | | | |
Net investment income | | | (0.09 | ) | | | (0.15 | ) | | | (0.24 | ) | | | (0.05 | ) | | | 0.00 | |
Net realized gains | | | 0.00 | | | | 0.00 | | | | (0.22 | ) | | | 0.00 | | | | 0.00 | |
| | | | | | | | | | | | | | | | | | | | |
Total distributions to shareholders | | | (0.09 | ) | | | (0.15 | ) | | | (0.46 | ) | | | (0.05 | ) | | | 0.00 | |
Net asset value, end of period | | $ | 21.89 | | | $ | 22.86 | | | $ | 21.50 | | | $ | 21.96 | | | $ | 22.66 | |
Total return4 | | | (3.86 | )% | | | 7.07 | % | | | 0.13 | % | | | (2.89 | )% | | | 12.68 | % |
Ratios to average net assets (annualized) | | | | | | | | | | | | | | | | | | | | |
Gross expenses | | | 1.21 | % | | | 1.22 | % | | | 1.24 | % | | | 1.24 | % | | | 1.48 | % |
Net expenses | | | 1.21 | % | | | 1.22 | % | | | 1.24 | % | | | 1.23 | % | | | 1.30 | % |
Net investment income | | | 0.44 | % | | | 0.57 | % | | | 1.04 | % | | | 0.93 | % | | | 0.02 | % |
Supplemental data | | | | | | | | | | | | | | | | | | | | |
Portfolio turnover rate | | | 3 | % | | | 13 | % | | | 7 | % | | | 5 | % | | | 6 | % |
Net assets, end of period (000s omitted) | | | $2,307,407 | | | | $2,183,281 | | | | $1,176,567 | | | | $541,644 | | | | $197,823 | |
| 1. | For the period from July 30, 2010 (commencement of class operations) to October 31, 2010. |
| 2. | Calculated based upon average shares outstanding. |
| 3. | Amount is less than $0.005. |
| 4. | Returns for periods of less than one year are not annualized. |
The accompanying notes are an integral part of these financial statements.
| | | | | | |
| Notes to financial statements (unaudited) | | Wells Fargo Advantage Emerging Markets Equity Fund | | | 21 | |
1. ORGANIZATION
Wells Fargo Funds Trust (the “Trust”), a Delaware statutory trust organized on March 10, 1999, is an open-end management investment company registered under the Investment Company Act of 1940, as amended (the “1940 Act”). These financial statements report on the Wells Fargo Advantage Emerging Markets Equity Fund (the “Fund”) which is a diversified series of the Trust.
2. SIGNIFICANT ACCOUNTING POLICIES
The following significant accounting policies, which are consistently followed in the preparation of the financial statements of the Fund, are in conformity with U.S. generally accepted accounting principles which require management to make estimates and assumptions that affect the reported amounts of assets and liabilities, disclosure of contingent assets and liabilities at the date of the financial statements, and the reported amounts of revenues and expenses during the reporting period. Actual results could differ from those estimates.
Securities valuation
All investments are valued each business day as of the close of regular trading on the New York Stock Exchange (generally 4 p.m. Eastern Time).
Equity securities that are listed on a foreign or domestic exchange or market are valued at the official closing price or, if none, the last sales price. If no sale occurs on the primary exchange or market for the security that day, the prior day’s price will be deemed “stale” and fair values will be determined in accordance with the Fund’s Valuation Procedures.
The values of securities denominated in foreign currencies are translated into U.S. dollars at rates provided by an independent foreign currency pricing source at a time each business day specified by the Management Valuation Team of Wells Fargo Funds Management, LLC (“Funds Management”).
Many securities markets and exchanges outside the U.S. close prior to the close of the New York Stock Exchange and therefore may not fully reflect trading or events that occur after the close of the principal exchange in which the foreign securities are traded, but before the close of the New York Stock Exchange. If such trading or events are expected to materially affect the value of such securities, then fair value pricing procedures approved by the Board of Trustees of the Fund are applied. These procedures take into account multiple factors including movements in U.S. securities markets after foreign exchanges close. Foreign securities that are fair valued under these procedures are categorized as Level 2 and the application of these procedures may result in transfers between Level 1 and Level 2. Depending on market activity, such fair valuations may be frequent. Such fair value pricing may result in NAVs that are higher or lower than NAVs based on the last reported sales price or latest quoted bid price. On April 30, 2014, such fair value pricing was not used in pricing foreign securities.
Fixed income securities acquired with maturities exceeding 60 days are valued based on evaluated bid prices provided by an independent pricing service which may utilize both transaction data and market information such as yield, quality, coupon rate, maturity, type of issue, trading characteristics and other market data. If prices are not available from the independent pricing service or prices received are deemed not representative of market value, prices will be obtained from an independent broker-dealer.
Investments in registered open-end investment companies are valued at net asset value. Non-registered investment vehicles are fair valued at net asset value.
Investments which are not valued using any of the methods discussed above are valued at their fair value, as determined in good faith by the Board of Trustees. The Board of Trustees has established a Valuation Committee comprised of the Trustees and has delegated to it the authority to take any actions regarding the valuation of portfolio securities that the Valuation Committee deems necessary or appropriate, including determining the fair value of portfolio securities, unless the determination has been delegated to the Management Valuation Team. The Board of Trustees retains the authority to make or ratify any valuation decisions or approve any changes to the Valuation Procedures as it deems appropriate. On a quarterly basis, the Board of Trustees receives reports on any valuation actions taken by the Valuation Committee or the Management Valuation Team which may include items for ratification.
Valuations of fair valued securities are compared to the next actual sales price when available, or other appropriate market values, to assess the continued appropriateness of the fair valuation methodologies used. These securities are fair valued on a day-to-day basis, taking into consideration changes to appropriate market information and any significant changes to the inputs considered in the valuation process until there is a readily available price provided on an exchange or by an independent pricing service. Valuations received from an independent pricing service or independent broker-dealer quotes are periodically validated by comparisons to most recent trades and valuations provided by other
| | | | |
| 22 | | Wells Fargo Advantage Emerging Markets Equity Fund | | Notes to financial statements (unaudited) |
independent pricing services in addition to the review of prices by the adviser and/or subadviser. Unobservable inputs used in determining fair valuations are identified based on the type of security, taking into consideration factors utilized by market participants in valuing the investment, knowledge about the issuer and the current market environment.
Foreign currency translation
The accounting records of the Fund are maintained in U.S. dollars. The values of other assets and liabilities denominated in foreign currencies are translated into U.S. dollars at rates provided by an independent foreign currency pricing source at a time each business day specified by the Management Valuation Team. Purchases and sales of securities, and income and expenses are converted at the rate of exchange on the respective dates of such transactions. Net realized foreign exchange gains or losses arise from sales of foreign currencies, currency gains or losses realized between the trade and settlement dates on securities transactions, and the difference between the amounts of dividends, interest and foreign withholding taxes recorded and the U.S. dollar equivalent of the amounts actually paid or received. Net unrealized foreign exchange gains and losses arise from changes in the fair value of assets and liabilities other than investments in securities resulting from changes in exchange rates. The changes in net assets arising from changes in exchange rates and the changes in net assets resulting from changes in market prices of securities are not separately presented. Such changes are included in net realized and unrealized gains or losses from investments.
Forward foreign currency contracts
The Fund is subject to foreign currency exchange rate risk in the normal course of pursuing its investment objectives. A forward foreign currency contract is an agreement between two parties to purchase or sell a specific currency for an agreed-upon price at a future date. The Fund enters into forward foreign currency contracts to facilitate transactions in foreign-denominated securities and to attempt to minimize the risk to the Fund from adverse changes in the relationship between currencies. Forward foreign currency contracts are recorded at the forward rate and marked-to-market daily. When the contracts are closed, realized gains and losses arising from such transactions are recorded as realized gains or losses on forward foreign currency contract transactions. The Fund could be exposed to risks if the counterparties to the contracts are unable to meet the terms of their contracts or if the value of the foreign currency changes unfavorably. The Fund’s maximum risk of loss from counterparty credit risk is the unrealized gains on the contracts. This risk may be mitigated if there is a master netting arrangement between the Fund and the counterparty.
Security loans
The Fund may lend its securities from time to time in order to earn additional income in the form of fees or interest on securities received as collateral or the investment of any cash received as collateral. The Fund continues to receive interest or dividends on the securities loaned. The Fund receives collateral in the form of cash or securities with a value at least equal to the value of the securities on loan. The value of the loaned securities is determined at the close of each business day and any additional required collateral is delivered to the Fund on the next business day. In a securities lending transaction, the net asset value of the Fund will be affected by an increase or decrease in the value of the securities loaned and by an increase or decrease in the value of the instrument in which collateral is invested. The amount of securities lending activity undertaken by the Fund fluctuates from time to time. In the event of default or bankruptcy by the borrower, the Fund may be prevented from recovering the loaned securities or gaining access to the collateral or may experience delays or costs in doing so. In addition, the investment of any cash collateral received may lose all or part of its value. The Fund has the right under the lending agreement to recover the securities from the borrower on demand.
The Fund lends its securities through an unaffiliated securities lending agent. Cash collateral received in connection with its securities lending transactions is invested in Wells Fargo Securities Lending Cash Investments, LLC (the “Securities Lending Fund”). The Securities Lending Fund is exempt from registration under Section 3(c)(7) of the 1940 Act and is managed by Funds Management and is subadvised by Wells Capital Management Incorporated (“WellsCap”). Funds Management receives an advisory fee starting at 0.05% and declining to 0.01% as the average daily net assets of the Securities Lending Fund increase. All of the fees received by Funds Management are paid to WellsCap for its services as subadviser. The Securities Lending Fund seeks to provide a positive return compared to the daily Fed Funds Open rate by investing in high-quality, U.S. dollar-denominated short-term money market instruments. Securities Lending Fund investments are fair valued based upon the amortized cost valuation technique. Income earned from investment in the Securities Lending Fund is included in securities lending income on the Statement of Operations.
| | | | | | |
| Notes to financial statements (unaudited) | | Wells Fargo Advantage Emerging Markets Equity Fund | | | 23 | |
Security transactions and income recognition
Securities transactions are recorded on a trade date basis. Realized gains or losses are recorded on the basis of identified cost.
Dividend income is recognized on the ex-dividend date, except for certain dividends from foreign securities, which are recorded as soon as the Fund is informed of the ex-dividend date. Dividend income from foreign securities is recorded net of foreign taxes withheld where recovery of such taxes is not assured.
Interest income is accrued daily and bond discounts are accreted and premiums are amortized daily based on the effective interest method. To the extent debt obligations are placed on non-accrual status, any related interest income may be reduced by writing off interest receivables when the collection of all or a portion of interest has become doubtful based on consistently applied procedures. If the issuer subsequently resumes interest payments or when the collectability of interest is reasonably assured, the debt obligation is removed from non-accrual status.
Distributions to shareholders
Distributions to shareholders from net investment income and net realized gains, if any, are recorded on the ex-dividend date. Such distributions are determined in conformity with federal income tax regulations, which may differ in amount or character from net investment income and realized gains recognized for purposes of U.S. generally accepted accounting principles.
Federal and other taxes
The Fund intends to continue to qualify as a regulated investment company by distributing substantially all of its investment company taxable income and any net realized capital gains (after reduction for capital loss carryforwards) sufficient to relieve it from all, or substantially all, federal income taxes. Accordingly, no provision for federal income taxes was required.
The Fund’s income and federal excise tax returns and all financial records supporting those returns for the prior three fiscal years are subject to examination by the federal and Delaware revenue authorities. Management has analyzed the Fund’s tax positions taken on federal, state, and foreign tax returns for all open tax years and does not believe that there are any uncertain tax positions that require recognition of a tax liability.
At October 31, 2013, capital loss carryforwards available to offset future net realized capital gains were as follows through the indicated expiration dates:
| | | | |
| | | | | No Expiration |
| 2016 | | 2017 | | Short-Term |
| $2,830,910 | | $22,695,719 | | $5,858,537 |
Class allocations
The separate classes of shares offered by the Fund differ principally in applicable sales charges, distribution, shareholder servicing, and administration fees. Shareholders of each class bear certain expenses that pertain to that particular class. All shareholders bear the common expenses of the Fund, earn income from the portfolio, and are allocated any unrealized gains and losses pro rata based on the average daily net assets of each class, without distinction between share classes. Dividends are determined separately for each class based on income and expenses allocable to each class. Realized gains and losses are allocated to each class pro rata based upon the net assets of each class on the date realized. Differences in per share dividend rates generally result from the relative weightings of pro rata income and realized gain allocations and from differences in separate class expenses, including distribution, shareholder servicing, and administration fees.
3. FAIR VALUATION MEASUREMENTS
Fair value measurements of investments are determined within a framework that has established a fair value hierarchy based upon the various data inputs utilized in determining the value of the Fund’s investments. The three-level hierarchy gives the highest priority to unadjusted quoted prices in active markets for identical assets or liabilities (Level 1) and the lowest priority to significant unobservable inputs (Level 3). The Fund’s investments are classified within the fair value hierarchy based on the lowest level of input that is significant to the fair value measurement. The inputs are summarized into three broad levels as follows:
| n | | Level 1 – quoted prices in active markets for identical securities |
| n | | Level 2 – other significant observable inputs (including quoted prices for similar securities, interest rates, prepayment speeds, credit risk, use of amortized cost, etc.) |
| n | | Level 3 – significant unobservable inputs (including the Fund’s own assumptions in determining the fair value of investments) |
| | | | |
| 24 | | Wells Fargo Advantage Emerging Markets Equity Fund | | Notes to financial statements (unaudited) |
The inputs or methodologies used for valuing investments in securities are not necessarily an indication of the risk associated with investing in those securities.
As of April 30, 2014, the inputs used in valuing investments in securities were as follows:
| | | | | | | | | | | | | | | | |
| Investments in securities | | Quoted prices (Level 1) | | | Other significant
observable inputs (Level 2) | | | Significant unobservable inputs (Level 3) | | | Total | |
Equity securities | | | | | | | | | | | | | | | | |
Common stocks | | | | | | | | | | | | | | | | |
Argentina | | $ | 15,557,436 | | | $ | 0 | | | $ | 0 | | | $ | 15,557,436 | |
Brazil | | | 626,387,210 | | | | 0 | | | | 0 | | | | 626,387,210 | |
Chile | | | 56,079,750 | | | | 0 | | | | 0 | | | | 56,079,750 | |
China | | | 777,514,854 | | | | 0 | | | | 0 | | | | 777,514,854 | |
Colombia | | | 36,600,297 | | | | 0 | | | | 0 | | | | 36,600,297 | |
Hong Kong | | | 201,867,906 | | | | 0 | | | | 0 | | | | 201,867,906 | |
India | | | 343,352,814 | | | | 0 | | | | 0 | | | | 343,352,814 | |
Indonesia | | | 57,056,542 | | | | 0 | | | | 0 | | | | 57,056,542 | |
Israel | | | 13,906,642 | | | | 0 | | | | 0 | | | | 13,906,642 | |
Malaysia | | | 68,592,272 | | | | 0 | | | | 0 | | | | 68,592,272 | |
Mexico | | | 587,171,491 | | | | 0 | | | | 0 | | | | 587,171,491 | |
Peru | | | 17,856,800 | | | | 0 | | | | 0 | | | | 17,856,800 | |
Philippines | | | 23,541,464 | | | | 0 | | | | 0 | | | | 23,541,464 | |
Russia | | | 173,399,923 | | | | 30,934,804 | | | | 0 | | | | 204,334,727 | |
South Africa | | | 276,300,227 | | | | 0 | | | | 0 | | | | 276,300,227 | |
South Korea | | | 479,813,049 | | | | 0 | | | | 0 | | | | 479,813,049 | |
Taiwan | | | 426,039,984 | | | | 0 | | | | 0 | | | | 426,039,984 | |
Thailand | | | 178,310,070 | | | | 0 | | | | 0 | | | | 178,310,070 | |
Turkey | | | 51,791,304 | | | | 0 | | | | 0 | | | | 51,791,304 | |
United Kingdom | | | 73,053,366 | | | | 0 | | | | 0 | | | | 73,053,366 | |
Preferred stocks | | | | | | | | | | | | | | | | |
Brazil | | | 112,613,811 | | | | 0 | | | | 0 | | | | 112,613,811 | |
Warrants | | | | | | | | | | | | | | | | |
Malaysia | | | 0 | | | | 947,160 | | | | 0 | | | | 947,160 | |
Convertible debentures | | | 0 | | | | 0 | | | | 4,783 | | | | 4,783 | |
Short-term investments | | | | | | | | | | | | | | | | |
Investment companies | | | 331,469,390 | | | | 90,015,597 | | | | 0 | | | | 421,484,987 | |
| | | $ | 4,928,276,602 | | | $ | 121,897,561 | | | $ | 4,783 | | | $ | 5,050,178,946 | |
Transfers in and transfers out are recognized at the end of the reporting period. For the six months ended April 30, 2014, the Fund did not have any transfers into/out of Level 1, Level 2, or Level 3.
4. TRANSACTIONS WITH AFFILIATES AND OTHER EXPENSES
Advisory fee
The Trust has entered into an advisory contract with Funds Management, an indirect wholly owned subsidiary of Wells Fargo & Company (“Wells Fargo”). The adviser is responsible for implementing investment policies and guidelines and for supervising the subadviser, who is responsible for day-to-day portfolio management of the Fund.
Pursuant to the contract, Funds Management is entitled to receive an annual advisory fee starting at 1.10% and declining to 0.95% as the average daily net assets of the Fund increase. For the six months ended April 30, 2014, the advisory fee was equivalent to an annual rate of 1.00% of the Fund’s average daily net assets.
Funds Management has retained the services of a subadviser to provide daily portfolio management to the Fund. The fee for subadvisory services is borne by Funds Management. WellsCap, an affiliate of Funds Management and an indirect wholly owned subsidiary of Wells Fargo, is the subadviser to the Fund and is entitled to receive a fee from Funds Management at an annual rate starting at 0.65% and declining to 0.45% as the average daily net assets of the Fund increase.
| | | | | | |
| Notes to financial statements (unaudited) | | Wells Fargo Advantage Emerging Markets Equity Fund | | | 25 | |
Administration and transfer agent fees
The Trust has entered into an administration agreement with Funds Management. Under this agreement, for providing administrative services, which includes paying fees and expenses for services provided by the transfer agent, sub-transfer agents, omnibus account servicers and record-keepers, Funds Management is entitled to receive from the Fund an annual fund level administration fee starting at 0.05% and declining to 0.03% as the average daily net assets of the Fund increase and a class level administration fee which is calculated based on the average daily net assets of each class as follows:
| | | | |
| | | Class level
administration fee | |
Class A, Class B, Class C | | | 0.26 | % |
Class R6 | | | 0.03 | |
Administrator Class | | | 0.10 | |
Institutional Class | | | 0.08 | |
Funds Management has contractually waived and/or reimbursed advisory and administration fees to the extent necessary to maintain certain net operating expense ratios for the Fund. Waiver of fees and/or reimbursement of expenses by Funds Management were made first from fund level expenses on a proportionate basis and then from class specific expenses. Funds Management has committed through February 28, 2015 to waive fees and/or reimburse expenses to the extent necessary to cap the Fund’s expenses at 1.67% for Class A shares, 2.42% for Class B shares, 2.42% for Class C shares, 1.18% for Class R6 shares, 1.50% for Administrator Class shares and 1.23% for Institutional shares. Prior to March 1, 2014, the Fund’s expenses were capped at 1.70% for Class A shares, 2.45% for Class B shares, 2.45% for Class C shares, and 1.25% for Institutional Class shares.
Distribution fees
The Trust has adopted a Distribution Plan for Class B and Class C shares of the Fund pursuant to Rule 12b-1 under the 1940 Act. Distribution fees are charged to Class B and Class C shares and paid to Wells Fargo Funds Distributor, LLC, the principal underwriter, at an annual rate of 0.75% of the average daily net assets of Class B and Class C shares.
For the six months ended April 30, 2014, Wells Fargo Funds Distributor, LLC received $25,918 from the sale of Class A shares and $169 and $1,345 in contingent deferred sales charges from redemptions of Class B and Class C shares, respectively.
Shareholder servicing fees
The Trust has entered into contracts with one or more shareholder servicing agents, whereby Class A, Class B, Class C and Administrator Class of the Fund is charged a fee at an annual rate of 0.25% of the average daily net assets of each respective class.
A portion of these total shareholder servicing fees were paid to affiliates of Wells Fargo.
5. INVESTMENT PORTFOLIO TRANSACTIONS
Purchases and sales of investments, excluding U.S. government obligations (if any) and short-term securities, for the six months ended April 30, 2014 were $648,654,831 and $139,214,944, respectively.
6. DERIVATIVE TRANSACTIONS
During the six months ended April 30, 2014, the Fund entered into forward foreign currency contracts for economic hedging purposes.
As of April 30, 2014, the Fund did not have any open forward foreign currency contracts. The Fund had average contract amounts of $575,542 and $444,658 in forward foreign currency contracts to buy and forward foreign currency contracts to sell, respectively, during the six months ended April 30, 2014.
The fair value, realized gains or losses and change in unrealized gains or losses, if any, on derivative instruments are reflected in the appropriate financials statements.
7. BANK BORROWINGS
The Trust (excluding the money market funds and certain other funds in the Trust) and Wells Fargo Variable Trust are parties to a $150,000,000 revolving credit agreement with State Street Bank and Trust Company, whereby the Fund is permitted to use bank borrowings for temporary or emergency purposes, such as to fund shareholder redemption
| | | | |
| 26 | | Wells Fargo Advantage Emerging Markets Equity Fund | | Notes to financial statements (unaudited) |
requests. Interest under the credit agreement is charged to the Fund based on a borrowing rate equal to the higher of the Federal Funds rate in effect on that day plus 1.25% or the overnight LIBOR rate in effect on that day plus 1.25%. In addition, an annual commitment fee equal to 0.10% of the unused balance is allocated to each participating fund. For the six months ended April 30, 2014, the Fund paid $2,278 in commitment fees.
For the six months ended April 30, 2014, there were no borrowings by the Fund under the agreement.
8. INDEMNIFICATION
Under the Trust’s organizational documents, the officers and Trustees are indemnified against certain liabilities that may arise out of performance of their duties to the Trust. Additionally, in the normal course of business, the Trust may enter into contracts with service providers that contain a variety of indemnification clauses. The Trust’s maximum exposure under these arrangements is dependent on future claims that may be made against the Fund and, therefore, cannot be estimated.
| | | | | | |
| Other information (unaudited) | | Wells Fargo Advantage Emerging Markets Equity Fund | | | 27 | |
TAX INFORMATION
Pursuant to Section 853 of the Internal Revenue Code, the following amounts were designated as foreign taxes paid for the fiscal year ended October 31, 2013. These amounts may be less than the actual foreign taxes paid for financial statement purposes. Foreign taxes paid or withheld should be included in taxable income with an offsetting deduction from gross income or as a credit for taxes paid to foreign governments. None of the income was derived from ineligible foreign sources as defined under Section 901(j) of the Internal Revenue Code.
| | | | |
Creditable foreign taxes paid | | Per share amount | | Foreign income as % of ordinary income distributions |
| $5,092,737 | | $0.0240 | | 100% |
PROXY VOTING INFORMATION
A description of the policies and procedures that the Fund uses to determine how to vote proxies relating to portfolio securities is available without charge, upon request, by calling 1-800-222-8222, visiting our website at wellsfargoadvantagefunds.com, or visiting the SEC website at sec.gov. Information regarding how the Fund voted proxies relating to portfolio securities during the most recent 12-month period ended June 30 is available without charge on the Fund’s website at wellsfargoadvantagefunds.com or by visiting the SEC website at sec.gov.
PORTFOLIO HOLDINGS INFORMATION
The complete portfolio holdings for the Fund are publicly available on the Fund’s website (wellsfargoadvantagefunds.com) on a monthly, 30-day or more delayed basis. In addition, top ten holdings information for the Fund is publicly available on the Fund’s website on a monthly, seven-day or more delayed basis. The Fund files its complete schedule of portfolio holdings with the SEC for the first and third quarters of each fiscal year on Form N-Q, which is available without charge by visiting the SEC website at sec.gov. In addition, the Fund’s Form N-Q may be reviewed and copied at the SEC’s Public Reference Room in Washington, DC, and at regional offices in New York City, at 233 Broadway, and in Chicago, at 175 West Jackson Boulevard, Suite 900. Information about the Public Reference Room may be obtained by calling 1-800-SEC-0330.
| | | | |
| 28 | | Wells Fargo Advantage Emerging Markets Equity Fund | | Other information (unaudited) |
BOARD OF TRUSTEES AND OFFICERS
Each of the Trustees and Officers1 listed in the table below acts in identical capacities for each fund in the Wells Fargo Advantage family of funds, which consists of 132 mutual funds comprising the Wells Fargo Funds Trust, Wells Fargo Variable Trust, Wells Fargo Master Trust and four closed-end funds (collectively the “Fund Complex”). This table should be read in conjunction with the Prospectus and the Statement of Additional Information2. All of the Trustees are also Members of the Audit and Governance Committees of each Trust in the Fund Complex. The mailing address of each Trustee and Officer is 525 Market Street, 12th Floor, San Francisco, CA 94105. Each Trustee and Officer serves an indefinite term, however, each Trustee serves such term until reaching the mandatory retirement age established by the Trustees.
Independent Trustees
| | | | | | |
Name and
year of birth | | Position held and
length of service* | | Principal occupations during past five years | | Other
directorships during
past five years |
Peter G. Gordon
(Born 1942) | | Trustee, since 1998; Chairman, since 2005 | | Co-Founder, Retired Chairman, President and CEO of Crystal Geyser Water Company. Trustee Emeritus, Colby College. | | Asset Allocation Trust |
Isaiah Harris, Jr.
(Born 1952) | | Trustee, since 2009 | | Retired. Prior thereto, President and CEO of BellSouth Advertising and Publishing Corp. from 2005 to 2007, President and CEO of BellSouth Enterprises from 2004 to 2005 and President of BellSouth Consumer Services from 2000 to 2003. Emeritus member of the Iowa State University Foundation Board of Governors. Emeritus Member of the Advisory Board of Iowa State University School of Business. Advisory Board Member, Palm Harbor Academy (charter school). Mr. Harris is a certified public accountant. | | CIGNA Corporation; Deluxe Corporation; Asset Allocation Trust |
Judith M. Johnson
(Born 1949) | | Trustee, since 2008; Audit Committee Chairman, since 2008 | | Retired. Prior thereto, Chief Executive Officer and Chief Investment Officer of Minneapolis Employees Retirement Fund from 1996 to 2008. Ms. Johnson is an attorney, certified public accountant and a certified managerial accountant. | | Asset Allocation Trust |
Leroy Keith, Jr.
(Born 1939) | | Trustee, since 2010 | | Chairman, Bloc Global Services (development and construction). Trustee of the Evergreen Funds from 1983 to 2010. Former Managing Director, Almanac Capital Management (commodities firm), former Partner, Stonington Partners, Inc. (private equity fund), former Director, Obagi Medical Products Co. and former Director, Lincoln Educational Services. | | Trustee, Virtus Fund Complex (consisting of 50 portfolios as of 12/16/2013); Asset Allocation Trust |
David F. Larcker
(Born 1950) | | Trustee, since 2009 | | James Irvin Miller Professor of Accounting at the Graduate School of Business, Stanford University, Morgan Stanley Director of the Center for Leadership Development and Research and Senior Faculty of The Rock Center for Corporate Governance since 2006. From 2005 to 2008, Professor of Accounting at the Graduate School of Business, Stanford University. Prior thereto, Ernst & Young Professor of Accounting at The Wharton School, University of Pennsylvania from 1985 to 2005. | | Asset Allocation Trust |
Olivia S. Mitchell
(Born 1953) | | Trustee, since 2006 | | International Foundation of Employee Benefit Plans Professor, Wharton School of the University of Pennsylvania since 1993. Director of Wharton’s Pension Research Council and Boettner Center on Pensions & Retirement Research, and Research Associate at the National Bureau of Economic Research. Previously, Cornell University Professor from 1978 to 1993. | | Asset Allocation Trust |
Timothy J. Penny
(Born 1951) | | Trustee, since 1996 | | President and CEO of Southern Minnesota Initiative Foundation, a non-profit organization, since 2007 and Senior Fellow at the Humphrey Institute Policy Forum at the University of Minnesota since 1995. Member of the Board of Trustees of NorthStar Education Finance, Inc., a non-profit organization, since 2007. | | Asset Allocation Trust |
| | | | | | |
| Other information (unaudited) | | Wells Fargo Advantage Emerging Markets Equity Fund | | | 29 | |
| | | | | | |
Name and
year of birth | | Position held and
length of service* | | Principal occupations during past five years | | Other
directorships during
past five years |
Michael S. Scofield
(Born 1943) | | Trustee, since 2010 | | Served on the Investment Company Institute’s Board of Governors and Executive Committee from 2008-2011 as well the Governing Council of the Independent Directors Council from 2006-2011 and the Independent Directors Council Executive Committee from 2008-2011. Chairman of the IDC from 2008-2010. Institutional Investor (Fund Directions) Trustee of Year in 2007. Trustee of the Evergreen Funds (and its predecessors) from 1984 to 2010. Chairman of the Evergreen Funds from 2000-2010. Former Trustee of the Mentor Funds. Retired Attorney, Law Offices of Michael S. Scofield. | | Asset Allocation Trust |
Donald C. Willeke
(Born 1940) | | Trustee, since 1996 | | Principal of the law firm of Willeke & Daniels. General Counsel of the Minneapolis Employees Retirement Fund from 1984 until its consolidation into the Minnesota Public Employees Retirement Association on June 30, 2010. Director and Vice Chair of The Tree Trust (non-profit corporation). Director of the American Chestnut Foundation (non-profit corporation). | | Asset Allocation Trust |
| * | Length of service dates reflect the Trustee’s commencement of service with the Trust’s predecessor entities, where applicable. |
Officers
| | | | | | |
Name and
year of birth | | Position held and
length of service | | Principal occupations during past five years | | |
Karla M. Rabusch
(Born 1959) | | President, since 2003 | | Executive Vice President of Wells Fargo Bank, N.A. and President of Wells Fargo Funds Management, LLC since 2003. | | |
Jeremy DePalma1
(Born 1974) | | Treasurer, since 2012 | | Senior Vice President of Wells Fargo Funds Management, LLC since 2009. Senior Vice President of Evergreen Investment Management Company, LLC from 2008 to 2010. Vice President, Evergreen Investment Services, Inc. from 2004 to 2007. Head of the Fund Reporting and Control Team within Fund Administration from 2005 to 2010. | | |
C. David Messman
(Born 1960) | | Secretary, since 2000; Chief Legal Officer, since 2003 | | Senior Vice President and Secretary of Wells Fargo Funds Management, LLC since 2001. Vice President and Managing Counsel of Wells Fargo Bank, N.A. since 1996. | | |
Debra Ann Early
(Born 1964) | | Chief Compliance Officer, since 2007 | | Chief Compliance Officer of Wells Fargo Funds Management, LLC since 2007. Chief Compliance Officer of Parnassus Investments from 2005 to 2007. Chief Financial Officer of Parnassus Investments from 2004 to 2007. | | |
David Berardi
(Born 1975) | | Assistant Treasurer, since 2009 | | Vice President of Wells Fargo Funds Management, LLC since 2009. Vice President of Evergreen Investment Management Company, LLC from 2008 to 2010. Assistant Vice President of Evergreen Investment Services, Inc. from 2004 to 2008. Manager of Fund Reporting and Control for Evergreen Investment Management Company, LLC from 2004 to 2010. | | |
| 1. | Jeremy DePalma acts as Treasurer of 59 funds and Assistant Treasurer of 73 funds in the Fund Complex. |
| 2. | The Statement of Additional Information includes additional information about the Trustees and is available, without charge, upon request, by calling 1-800-222-8222 or by visiting the website at wellsfargoadvantagefunds.com. |
| | | | |
| 30 | | Wells Fargo Advantage Emerging Markets Equity Fund | | Other information (unaudited) |
BOARD CONSIDERATION OF INVESTMENT ADVISORY AND SUB-ADVISORY AGREEMENTS:
Under Section 15 of the Investment Company Act of 1940 (the “1940 Act”), the Board of Trustees (the “Board”) of Wells Fargo Funds Trust (the “Trust”), all the members of which have no direct or indirect interest in the investment advisory and sub-advisory agreements and are not “interested persons” of the Trust, as defined in the 1940 Act (the “Independent Trustees”), must determine whether to approve the continuation of the Trust’s investment advisory and sub-advisory agreements. In this regard, at an in-person meeting held on March 27-28, 2014 (the “Meeting”), the Board reviewed: (i) an investment advisory agreement with Wells Fargo Funds Management, LLC (“Funds Management”) for Wells Fargo Advantage Emerging Markets Equity Fund (the “Fund”) and (ii) an investment sub-advisory agreement with Wells Capital Management Incorporated (the “Sub-Adviser”), an affiliate of Funds Management, for the Fund. The investment advisory agreement with Funds Management and the investment sub-advisory agreement with the Sub-Adviser are collectively referred to as the “Advisory Agreements.”
At the Meeting, the Board considered the factors and reached the conclusions described below relating to the selection of Funds Management and the Sub-Adviser and the continuation of the Advisory Agreements. Prior to the Meeting, the Trustees conferred extensively among themselves and with representatives of Funds Management about these matters. Also, the Board has adopted a team-based approach, with each team consisting of a sub-set of Trustees, to assist the full Board in the discharge of its duties in reviewing performance and other matters throughout the year. The Independent Trustees were assisted in their evaluation of the Advisory Agreements by independent legal counsel, from whom they received separate legal advice and with whom they met separately.
In providing information to the Board, Funds Management and the Sub-Adviser were guided by a detailed set of requests for information submitted to them by independent legal counsel on behalf of the Independent Trustees at the start of the Board’s annual contract renewal process earlier in 2014. In considering and approving the Advisory Agreements, the Trustees considered the information they believed relevant, including but not limited to the information discussed below. The Board considered not only the specific information presented in connection with the Meeting, but also the knowledge gained over time through interaction with Funds Management and the Sub-Adviser about various topics. In this regard, the Board reviewed reports of Funds Management at each of its quarterly meetings, which included, among other things, portfolio reviews and performance reports. In addition, the Board and the teams mentioned above confer with portfolio managers at various times throughout the year. The Board did not identify any particular information or consideration that was all-important or controlling, and each individual Trustee may have attributed different weights to various factors.
After its deliberations, the Board unanimously approved the continuation of the Advisory Agreements and determined that the compensation payable to Funds Management and the Sub-Adviser is reasonable. The Board considered the continuation of the Advisory Agreements for the Fund as part of its consideration of the continuation of advisory agreements for funds across the complex, but its approvals were made on a fund-by-fund basis. The following summarizes a number of important, but not necessarily all, factors considered by the Board in support of its approvals.
Nature, extent and quality of services
The Board received and considered various information regarding the nature, extent and quality of services provided to the Fund by Funds Management and the Sub-Adviser under the Advisory Agreements. This information included, among other things, a summary of the background and experience of senior management of Funds Management, and the qualifications, background, tenure and responsibilities of each of the portfolio managers primarily responsible for the day-to-day portfolio management of the Fund.
The Board evaluated the ability of Funds Management and the Sub-Adviser to attract and retain qualified investment professionals, including research, advisory and supervisory personnel. The Board further considered the compliance programs and compliance records of Funds Management and the Sub-Adviser. In addition, the Board took into account the full range of services provided to the Fund by Funds Management and its affiliates.
Fund performance and expenses
The Board considered the performance results for the Fund over various time periods ended December 31, 2013. The Board also considered these results in comparison to the performance of funds in a universe that was determined by Lipper Inc. (“Lipper”) to be similar to the Fund (the “Universe”), and in comparison to the Fund’s benchmark index and to other comparative data. Lipper is an independent provider of investment company data. The Board received a description of the methodology used by Lipper to select the mutual funds in the performance Universe. The Board noted that the performance of the Fund (Administrator Class) was higher than or in range of the average performance of the Universe for the three-, five- and ten-year periods under review, but lower than the average performance of the Universe for the one-year period under review. However, the Board also noted that the performance of the Fund was higher than or in range of its benchmark, the MSCI Emerging Markets Index (Net), for all periods under review.
| | | | | | |
| Other information (unaudited) | | Wells Fargo Advantage Emerging Markets Equity Fund | | | 31 | |
The Board also received and considered information regarding the Fund’s net operating expense ratios and their various components, including actual management fees (which reflect fee waivers, if any, and include advisory, administration and transfer agent fees), custodian and other non-management fees, Rule 12b-1 and non-Rule 12b-1 service fees and fee waiver and expense reimbursement arrangements. The Board considered these ratios in comparison to the median ratios of funds in class-specific expense groups that were determined by Lipper to be similar to the Fund (the “Groups”). The Board received a description of the methodology used by Lipper to select the mutual funds in the expense Groups and an explanation of year-to-year variations in the funds comprising such expense Groups and their expense ratios. Based on the Lipper reports, the Board noted that the net operating expense ratios of the Fund were lower than, in range of or equal to the median net operating expense ratios of the expense Groups.
Based on its consideration of the factors and information it deemed relevant, including those described here, the Board concluded that the overall performance and expense structure of the Fund supported the re-approval of the Advisory Agreements.
Investment advisory and sub-advisory fee rates
The Board reviewed and considered the contractual investment advisory fee rates that are payable by the Fund to Funds Management for investment advisory services (the “Advisory Agreement Rates”), both on a stand-alone basis and on a combined basis with the Fund’s fund-level and class-level contractual administration fee rates (the “Management Rates”). The Board noted that the administration fees payable to Funds Management include transfer agency and sub-transfer agency costs. The Board also reviewed and considered the contractual investment sub-advisory fee rates that are payable by Funds Management to the Sub-Adviser for investment sub-advisory services (the “Sub-Advisory Agreement Rates”).
Among other information reviewed by the Board was a comparison of the Management Rates of the Fund with those of other funds in the expense Groups at a common asset level. The Board noted that the Management Rates of the Fund were in range of the average rates for the Fund’s expense Groups for all share classes. The Board also viewed favorable the agreed-upon revision to the advisory fee schedule for the Fund that adds an additional breakpoint.
The Board also received and considered information about the portion of the total advisory fee that was retained by Funds Management after payment of the fee to the Sub-Adviser for sub-advisory services. In assessing the reasonableness of this amount, the Board received and evaluated information about the nature and extent of responsibilities retained and risks assumed by Funds Management and not delegated to or assumed by the Sub-Adviser, and about Funds Management’s on-going oversight services. However, given the affiliation between Funds Management and the Sub-Adviser, the Board ascribed limited relevance to the allocation of the advisory fee between them.
The Board also received and considered information about the nature and extent of services offered and fee rates charged by Funds Management and the Sub-Adviser to other types of clients with investment strategies similar to those of the Fund. In this regard, the Board received information about the significantly greater scope of services, and compliance, reporting and other legal burdens and risks of managing mutual funds compared with those associated with managing assets of non-mutual fund clients such as collective funds or institutional separate accounts.
Based on its consideration of the factors and information it deemed relevant, including those described here, the Board determined that the Advisory Agreement Rates and the Sub-Advisory Agreement Rates were reasonable in light of the services covered by the Advisory Agreements.
Profitability
The Board received and considered information concerning the profitability of Funds Management, as well as the profitability of Wells Fargo as a whole, from providing services to the Fund and the fund family as a whole. The Board did not receive or consider to be necessary separate profitability information with respect to the Sub-Adviser, because its profitability information was subsumed in the collective Wells Fargo profitability analysis.
Funds Management explained the methodologies and estimates that it used in calculating profitability. Among other things, the Board noted that the levels of profitability reported on a fund-by-fund basis varied widely, depending on factors such as the size and type of fund. Based on its review, the Board did not deem the profits reported by Funds Management to be at a level that would prevent it from approving the continuation of the Advisory Agreements.
Economies of scale
With respect to possible economies of scale, the Board noted the existence of breakpoints in the Fund’s advisory fee and administration fee structure, which operate generally to reduce the Fund’s expense ratios as the Fund grows in size. It considered that, for a small fund or a fund that shrinks in size, breakpoints conversely can result in higher fee levels. The Board took into account the agreed-upon revision to the advisory fee schedule for the Fund that adds an additional
| | | | |
| 32 | | Wells Fargo Advantage Emerging Markets Equity Fund | | Other information (unaudited) |
breakpoint. The Board also considered that fee waiver and expense reimbursement arrangements and competitive fee rates at the outset are means of sharing potential economies of scale with shareholders of the Fund and the fund family as a whole. The Board considered Funds Management’s view that any analyses of potential economies of scale in managing a particular fund are inherently limited in light of the joint and common costs and investments that Funds Management incurs across the fund family as a whole.
The Board concluded that the Fund’s fee and expense arrangements, including contractual breakpoints, constituted a reasonable approach to sharing potential economies of scale with the Fund and its shareholders.
Other benefits to Funds Management and the Sub-Adviser
The Board received and considered information regarding potential “fall-out” or ancillary benefits received by Funds Management and its affiliates, including the Sub-Adviser, as a result of their relationships with the Fund. Ancillary benefits could include, among others, benefits directly attributable to other relationships with the Fund and benefits potentially derived from an increase in Funds Management’s and the Sub-Adviser’s business as a result of their relationships with the Fund. The Board noted that various affiliates of Funds Management may receive distribution-related fees, shareholder servicing payments and sub-transfer agency fees in respect of shares sold or held through them and services provided.
The Board also reviewed information about soft dollar credits earned and utilized by the Sub-Adviser, fees earned by Funds Management and the Sub-Adviser from managing a private investment vehicle for the fund family’s securities lending collateral and commissions earned by an affiliated broker from portfolio transactions.
Based on its consideration of the factors and information it deemed relevant, including those described here, the Board did not find that any ancillary benefits received by Funds Management and its affiliates, including the Sub-Adviser, were unreasonable.
Conclusion
After considering the above-described factors and based on its deliberations and its evaluation of the information described above, the Board unanimously approved the continuation of the Advisory Agreements for an additional one-year period and determined that the compensation payable to Funds Management and the Sub-Adviser is reasonable.
| | | | | | |
| List of abbreviations | | Wells Fargo Advantage Emerging Markets Equity Fund | | | 33 | |
The following is a list of common abbreviations for terms and entities that may have appeared in this report.
| ACA | — ACA Financial Guaranty Corporation |
| ADR | — American depositary receipt |
| ADS | — American depositary shares |
| AGC | — Assured Guaranty Corporation |
| AGM | — Assured Guaranty Municipal |
| Ambac | — Ambac Financial Group Incorporated |
| AMT | — Alternative minimum tax |
| BAN | — Bond anticipation notes |
| BHAC | — Berkshire Hathaway Assurance Corporation |
| CAB | — Capital appreciation bond |
| CCAB | — Convertible capital appreciation bond |
| CDA | — Community Development Authority |
| CDO | — Collateralized debt obligation |
| DRIVER | — Derivative inverse tax-exempt receipts |
| DW&P | — Department of Water & Power |
| DWR | — Department of Water Resources |
| ECFA | — Educational & Cultural Facilities Authority |
| EDA | — Economic Development Authority |
| EDFA | — Economic Development Finance Authority |
| ETF | — Exchange-traded fund |
| FDIC | — Federal Deposit Insurance Corporation |
| FFCB | — Federal Farm Credit Banks |
| FGIC | — Financial Guaranty Insurance Corporation |
| FHA | — Federal Housing Administration |
| FHLB | — Federal Home Loan Bank |
| FHLMC | — Federal Home Loan Mortgage Corporation |
| FICO | — The Financing Corporation |
| FNMA | — Federal National Mortgage Association |
| GDR | — Global depositary receipt |
| GNMA | — Government National Mortgage Association |
| HCFR | — Healthcare facilities revenue |
| HEFA | — Health & Educational Facilities Authority |
| HEFAR | — Higher education facilities authority revenue |
| HFA | — Housing Finance Authority |
| HFFA | — Health Facilities Financing Authority |
| HUD | — Department of Housing and Urban Development |
| IDA | — Industrial Development Authority |
| IDAG | — Industrial Development Agency |
| KRW | — Republic of Korea won |
| LIBOR | — London Interbank Offered Rate |
| LLC | — Limited liability company |
| LLLP | — Limited liability limited partnership |
| LLP | — Limited liability partnership |
| MBIA | — Municipal Bond Insurance Association |
| MFHR | — Multifamily housing revenue |
| MSTR | — Municipal securities trust receipts |
| MUD | — Municipal Utility District |
| National | — National Public Finance Guarantee Corporation |
| PCFA | — Pollution Control Financing Authority |
| PCL | — Public Company Limited |
| PCR | — Pollution control revenue |
| PFA | — Public Finance Authority |
| PFFA | — Public Facilities Financing Authority |
| PFOTER | — Puttable floating option tax-exempt receipts |
| plc | — Public limited company |
| PUTTER | — Puttable tax-exempt receipts |
| R&D | — Research & development |
| Radian | — Radian Asset Assurance |
| RAN | — Revenue anticipation notes |
| RDA | — Redevelopment Authority |
| RDFA | — Redevelopment Finance Authority |
| REIT | — Real estate investment trust |
| ROC | — Reset option certificates |
| SAVRS | — Select auction variable rate securities |
| SBA | — Small Business Authority |
| SFHR | — Single-family housing revenue |
| SFMR | — Single-family mortgage revenue |
| SPA | — Standby purchase agreement |
| SPDR | — Standard & Poor’s Depositary Receipts |
| STRIPS | — Separate trading of registered interest and principal securities |
| TAN | — Tax anticipation notes |
| TIPS | — Treasury inflation-protected securities |
| TRAN | — Tax revenue anticipation notes |
| TTFA | — Transportation Trust Fund Authority |
| TVA | — Tennessee Valley Authority |
This page is intentionally left blank.
This page is intentionally left blank.
This page is intentionally left blank.


For more information
More information about Wells Fargo Advantage Funds is available free upon request. To obtain literature, please write, email, visit the Fund’s website, or call:
Wells Fargo Advantage Funds
P.O. Box 8266
Boston, MA 02266-8266
Email: wfaf@wellsfargo.com
Website: wellsfargoadvantagefunds.com
Individual investors: 1-800-222-8222
Retail investment professionals: 1-888-877-9275
Institutional investment professionals: 1-866-765-0778
This report and the financial statements contained herein are submitted for the general information of the shareholders of Wells Fargo Advantage Funds. If this report is used for promotional purposes, distribution of the report must be accompanied or preceded by a current prospectus. Before investing, please consider the investment objectives, risks, charges, and expenses of the investment. For a current prospectus and, if available, a summary prospectus, containing this information, call 1-800-222-8222 or visit the Fund’s website at wellsfargoadvantagefunds.com. Read the prospectus carefully before you invest or send money.
Wells Fargo Funds Management, LLC, a wholly owned subsidiary of Wells Fargo & Company, provides investment advisory and administrative services for Wells Fargo Advantage Funds. Other affiliates of Wells Fargo & Company provide subadvisory and other services for the Funds. The Funds are distributed by Wells Fargo Funds Distributor, LLC, Member FINRA/SIPC, an affiliate of Wells Fargo & Company.
NOT FDIC INSURED ¡ NO BANK GUARANTEE ¡ MAY LOSE VALUE
© 2014 Wells Fargo Funds Management, LLC. All rights reserved.
| | |
 | | 225167 06-14 SA238/SAR238 04-14 |

Wells Fargo Advantage
Emerging Markets Equity Income Fund

Semi-Annual Report
April 30, 2014

Reduce clutter. Save trees.
Sign up for electronic delivery of prospectuses and shareholder reports at wellsfargo.com/advantagedelivery
Contents
The views expressed and any forward-looking statements are as of April 30, 2014, unless otherwise noted, and are those of the Fund managers and/or Wells Fargo Funds Management, LLC. Discussions of individual securities, or the markets generally, or any Wells Fargo Advantage Fund are not intended as individual recommendations. Future events or results may vary significantly from those expressed in any forward-looking statements; the views expressed are subject to change at any time in response to changing circumstances in the market. Wells Fargo Funds Management, LLC and the Fund disclaim any obligation to publicly update or revise any views expressed or forward-looking statements.
NOT FDIC INSURED ¡ NO BANK GUARANTEE ¡ MAY LOSE VALUE
| | | | |
| 2 | | Wells Fargo Advantage Emerging Markets Equity Income Fund | | Letter to shareholders (unaudited) |

Karla M. Rabusch
President
Wells Fargo Advantage Funds
European markets continued to benefit from the European Central Bank’s (ECB’s) willingness to maintain low interest rates.
Some of the markets that had declined the most during the European debt crisis—such as Italy and Ireland—benefited the most from this stable economic environment, but larger markets such as France and Germany also posted gains.
Dear Valued Shareholder:
We are pleased to offer you this semi-annual report for the Wells Fargo Advantage Emerging Markets Equity Income Fund for the six-month period that ended April 30, 2014. The period was marked by growing concern about an economic slowdown in China and heightened geopolitical uncertainty as the U.S. and Europe confronted Russia over Ukraine. The environment created a headwind for many emerging markets, even as continued economic recovery in Europe helped most developed stock markets end the period with gains.
Major central banks continued to provide stimulus.
Major central banks continued to inject liquidity into global banks and markets through various quantitative easing policies. The U.S. Federal Reserve (Fed) remained a major source of liquidity for market participants around the world. Throughout the reporting period, the Federal Open Market Committee (FOMC)—the Fed’s monetary policymaking body—kept its key interest rate near zero in order to support the economy and the financial system. At the beginning of the reporting period, the FOMC was still making open-ended purchases of $40 billion per month in mortgage-backed securities to support the housing market and was purchasing $45 billion per month in long-term U.S. Treasuries. However, in mid-December 2013, the FOMC announced that it would reduce (or taper) its bond-buying program by $10 billion per month beginning in January 2014. Although the tapering was less aggressive than some investors had feared, the removal of liquidity sparked a sell-off in emerging markets stocks and currencies as investors sold higher-risk assets.
European markets continued to benefit from the European Central Bank’s (ECB’s) willingness to maintain low interest rates. In November 2013, the ECB cut its key rate to a historic low of 0.25%. The ECB’s actions helped support moderate year-over-year gross domestic product (GDP) growth in the eurozone.
Most developed regions gained, but emerging and developed Asian markets lagged.
For the six-month period, the MSCI EAFE Index (Net)1, a proxy for developed markets, returned 4.44%, while the MSCI Emerging Markets Index (Net)2 returned -2.98%.
In Europe, economic data continued to show moderate growth, with reported GDP for the 28 countries in the European Union rising by 0.4% in the fourth quarter of 2013 compared with the previous quarter. The unemployment rate remained high but stable at 10.5% in February and March 2014, while inflation remained consistently below a 1% annual rate. Some of the markets that had declined the most during the European debt crisis—such as Italy and Ireland—benefited the most from this stable economic environment, but larger markets such as France and Germany also posted gains. The ongoing turmoil in Ukraine did result in some stock market volatility, but as of the end of the reporting period, most investors believed that it would not result in war.
Asian markets posted mixed results, with political issues accounting for many of those differences. In countries such as India and Indonesia, investors were optimistic that upcoming elections might sweep in more reform-minded governments. By contrast, in Japan, the honeymoon for Prime Minister Shinzō Abe
| 1. | The Morgan Stanley Capital International Europe, Australasia, and Far East (MSCI EAFE) Index (Net) is an unmanaged group of securities widely regarded by investors to be representations of the stock markets of Europe, Australasia, and the Far East. Calculations for EAFE use net dividends, which reflect the deduction of withholding taxes. You cannot invest directly in an index. Source: MSCI. MSCI makes no express or implied warranties or representations and shall have no liability whatsoever with respect to any MSCI data contained herein. The MSCI data may not be further redistributed or used as a basis for other indexes or any securities or financial products. This report is not approved, reviewed, or produced by MSCI. |
| 2. | The Morgan Stanley Capital International (MSCI) Emerging Markets Index (Net) is a free float-adjusted market-capitalization-weighted index designed to measure the equity market performance in the global emerging markets. The index is currently composed of 21 emerging markets country indexes. You cannot invest directly in an index. |
| | | | | | |
| Letter to shareholders (unaudited) | | Wells Fargo Advantage Emerging Markets Equity Income Fund | | | 3 | |
appeared to be ending, with investors worrying that his reforms were not taking effect as quickly as originally hoped.
As for China, many of the country’s economic numbers—such as for national production, retail sales, fixed investment, and manufacturing activity—came in below analyst expectations, causing investor concern. In addition, China’s government has allowed a growing number of defaults in the country’s financial system as part of a long-term plan to rein in credit growth.
Don’t let short-term uncertainty derail long-term investment goals.
Periods of uncertainty can present challenges, but experience has taught us that maintaining long-term investment goals can be an effective way to plan for the future. To help you create a sound strategy based on your personal goals and risk tolerance, Wells Fargo Advantage Funds offers more than 100 mutual funds spanning a wide range of asset classes and investment styles. Although diversification cannot guarantee an investment profit or prevent losses, we believe it can be an effective way to manage investment risk and potentially smooth out overall portfolio performance. We encourage investors to know their investments and to understand that appropriate levels of risk-taking may unlock opportunities.
Thank you for choosing to invest with Wells Fargo Advantage Funds. We appreciate your confidence in us and remain committed to helping you meet your financial needs. For current information about your fund investments, contact your investment professional, visit our website at wellsfargoadvantagefunds.com, or call us directly at 1-800-222-8222. We are available 24 hours a day, 7 days a week.
Sincerely,

Karla M. Rabusch
President
Wells Fargo Advantage Funds
Notice to shareholders
The Fund and Wells Fargo Funds Management, LLC (“Funds Management”) have received an exemptive order from the SEC that permits Funds Management, subject to the approval of the Board of Trustees of the Fund, to select or replace certain subadvisers to manage all or a portion of the Fund’s assets and enter into, amend or terminate a sub-advisory agreement with certain subadvisers without obtaining shareholder approval (“Multi-manager Structure”). The Multi-manager Structure applies to subadvisers that are not affiliated with Funds Management or the Fund, except to the extent that affiliation arises solely because such subadvisers provide sub-advisory services to the Fund (“Non-affiliated Subadvisers”), as well as subadvisers that are indirect or direct wholly-owned subsidiaries of Funds Management or of another company that, indirectly or directly, wholly owns Funds Management (“Wholly-owned Subadvisers”).
Pursuant to the SEC order, Funds Management, with the approval of the Board of Trustees, has the discretion to terminate any subadvisers and allocate and reallocate the Fund’s assets among any other Non-affiliated Subadvisers or Wholly-owned Subadvisers. Funds Management, subject to oversight and supervision by the Board of Trustees, has responsibility to continue to oversee any subadvisers to the Fund and to recommend, for approval by the Board of Trustees, the hiring, termination and replacement of subadvisers for the Fund. In the event that a new subadviser is hired pursuant to the Multi-manager Structure, the Fund is required to provide notice to shareholders within 90 days.
Please contact your investment professional or call us directly at 1-800-222-8222 if you have any questions on this Notice to Shareholders.
| | | | |
| 4 | | Wells Fargo Advantage Emerging Markets Equity Income Fund | | Performance highlights (unaudited) |
Investment objective
The Fund seeks to achieve long-term capital appreciation and current income.
Adviser
Wells Fargo Funds Management, LLC
Subadvisers
Wells Capital Management Incorporated
Wells Capital Management Singapore
Portfolio managers
Alison Shimada
Anthony L.T. Cragg
Average annual total returns (%) as of April 30, 2014
| | | | | | | | | | | | | | | | | | | | | | | | | | |
| | | | | Including sales charge | | | Excluding sales charge | | | Expense ratios1 (%) | |
| | | Inception date | | 1 year | | | Since inception | | | 1 year | | | Since inception | | | Gross | | | Net2 | |
| Class A (EQIAX) | | 5-31-2012 | | | (10.23 | ) | | | 6.97 | | | | (4.78 | ) | | | 10.33 | | | | 3.11 | | | | 1.67 | |
| Class C (EQICX) | | 5-31-2012 | | | (6.37 | ) | | | 9.51 | | | | (5.48 | ) | | | 9.51 | | | | 3.86 | | | | 2.42 | |
| Administrator Class (EQIDX) | | 5-31-2012 | | | – | | | | – | | | | (4.67 | ) | | | 10.52 | | | | 2.95 | | | | 1.47 | |
| Institutional Class (EQIIX) | | 5-31-2012 | | | – | | | | – | | | | (4.35 | ) | | | 10.78 | | | | 2.68 | | | | 1.27 | |
| MSCI Emerging Markets Index (Net)3 | | – | | | – | | | | – | | | | (1.84 | ) | | | 7.55 | | | | – | | | | – | |
Figures quoted represent past performance, which is no guarantee of future results, and do not reflect taxes that a shareholder may pay on fund distributions or the redemption of fund shares. Investment return and principal value of an investment will fluctuate so that an investor’s shares, when redeemed, may be worth more or less than their original cost. Performance shown without sales charges would be lower if sales charges were reflected. Current performance may be lower or higher than the performance data quoted, which assumes the reinvestment of dividends and capital gains. Current month-end performance is available on the Fund’s website, wellsfargoadvantagefunds.com.
Index returns do not include transaction costs associated with buying and selling securities, any mutual fund fees or expenses, or any taxes. It is not possible to invest directly in an index.
For Class A shares, the maximum front-end sales charge is 5.75%. For Class C shares, the maximum contingent deferred sales charge is 1.00%. Performance including sales charge assumes the sales charge for the corresponding time period. Administrator Class and Institutional Class shares are sold without a front-end sales charge or contingent deferred sales charge.
Stock values fluctuate in response to the activities of individual companies and general market and economic conditions. Foreign investments are especially volatile and can rise or fall dramatically due to differences in the political and economic conditions of the host country. These risks are generally intensified in emerging markets. The use of derivatives may reduce returns and/or increase volatility. Certain investment strategies tend to increase the total risk of an investment (relative to the broader market). The Fund is exposed to regional risk and smaller-company securities risk. Consult the Fund’s prospectus for additional information on these and other risks.
Please see footnotes on page 5.
| | | | | | |
| Performance highlights (unaudited) | | Wells Fargo Advantage Emerging Markets Equity Income Fund | | | 5 | |
| | | | |
| Ten largest equity holdings4 (%) as of April 30, 2014 | |
Agricultural Bank of China | | | 2.03 | |
Mining and Metallurgical Company OJSC | | | 1.98 | |
China Petroleum & Chemical Corporation | | | 1.75 | |
Cosco Pacific Limited | | | 1.74 | |
China Mobile Limited | | | 1.71 | |
HSBC Bank plc (NMDC Limited) | | | 1.60 | |
Industrial & Commercial Bank of China Limited Class H | | | 1.56 | |
Itau Unibanco Holding SA ADR | | | 1.52 | |
PetroChina Company Limited | | | 1.47 | |
Alrosa Corporate | | | 1.44 | |
|
| Sector distribution5 as of April 30, 2014 |
|
|
| 1. | Reflects the expense ratios as stated in the most recent prospectuses, which include the impact of 0.02% in acquired fund fees and expenses. The expense ratios shown are subject to change and may differ from the annualized expense ratios shown in the financial highlights of this report, which do not include acquired fund fees and expenses. |
| 2. | The Adviser has committed through February 28, 2015, to waive fees and/or reimburse expenses to the extent necessary to cap the Fund’s Total Annual Fund Operating Expenses After Fee Waiver, excluding certain expenses, at 1.65% for Class A, 2.40% for Class C, 1.45% for Administrator Class, and 1.25% for Institutional Class. Brokerage commissions, stamp duty fees, interest, taxes, acquired fund fees and expenses, and extraordinary expenses are excluded from the cap. Without this cap, the Fund’s returns would have been lower. |
| 3. | The Morgan Stanley Capital International Emerging Markets (MSCI Emerging Markets) Index (Net) is a free float-adjusted market capitalization index designed to measure the equity market performance in the global emerging markets. The index is currently composed of 21 emerging markets country indexes. You cannot invest directly in an index. Source: MSCI. MSCI makes no express or implied warranties or representations and shall have no liability whatsoever with respect to any MSCI data contained herein. The MSCI data may not be further redistributed or used as a basis for other indexes or any securities or financial products. This report is not approved, reviewed, or produced by MSCI. |
| 4. | The ten largest equity holdings are calculated based on the value of the securities divided by total net assets of the Fund. Holdings are subject to change and may have changed since the date specified. Top holdings typically include the underlying ordinary shares combined with any depositary receipts. |
| 5. | Sector distribution is subject to change and is calculated based on the total long-term investments of the Fund. |
| | | | |
| 6 | | Wells Fargo Advantage Emerging Markets Equity Income Fund | | Fund expenses (unaudited) |
As a shareholder of the Fund, you incur two types of costs: (1) transaction costs, including sales charges (loads) on purchase payments and contingent deferred sales charges (if any) on redemptions and (2) ongoing costs, including management fees, distribution (12b-1) and/or shareholder service fees, and other Fund expenses. This example is intended to help you understand your ongoing costs (in dollars) of investing in the Fund and to compare these costs with the ongoing costs of investing in other mutual funds.
The example is based on an investment of $1,000 invested at the beginning of the six-month period and held for the entire period from November 1, 2013 to April 30, 2014.
Actual expenses
The “Actual” line of the table below provides information about actual account values and actual expenses. You may use the information in this line, together with the amount you invested, to estimate the expenses that you paid over the period. Simply divide your account value by $1,000 (for example, an $8,600 account value divided by $1,000 = 8.6), then multiply the result by the number in the “Actual” line under the heading entitled “Expenses paid during period” for your applicable class of shares to estimate the expenses you paid on your account during this period.
Hypothetical example for comparison purposes
The “Hypothetical” line of the table below provides information about hypothetical account values and hypothetical expenses based on the Fund’s actual expense ratio and an assumed rate of return of 5% per year before expenses, which is not the Fund’s actual return. The hypothetical account values and expenses may not be used to estimate the actual ending account balance or expenses you paid for the period. You may use this information to compare the ongoing costs of investing in the Fund and other funds. To do so, compare this 5% hypothetical example with the 5% hypothetical examples that appear in the shareholder reports of the other funds.
Please note that the expenses shown in the table are meant to highlight your ongoing costs only and do not reflect any transactional costs, such as sales charges (loads) and contingent deferred sales charges. Therefore, the “Hypothetical” line of the table is useful in comparing ongoing costs only and will not help you determine the relative total costs of owning different funds. In addition, if these transactional costs were included, your costs would have been higher.
| | | | | | | | | | | | | | | | |
| | | Beginning
account value
11-1-2013 | | | Ending
account value
4-30-2014 | | | Expenses
paid during
the period1 | | | Net annualized
expense ratio | |
Class A | | | | | | | | | | | | | | | | |
Actual | | $ | 1,000.00 | | | $ | 964.58 | | | $ | 8.04 | | | | 1.65 | % |
Hypothetical (5% return before expenses) | | $ | 1,000.00 | | | $ | 1,016.61 | | | $ | 8.25 | | | | 1.65 | % |
Class C | | | | | | | | | | | | | | | | |
Actual | | $ | 1,000.00 | | | $ | 960.80 | | | $ | 11.67 | | | | 2.40 | % |
Hypothetical (5% return before expenses) | | $ | 1,000.00 | | | $ | 1,012.89 | | | $ | 11.98 | | | | 2.40 | % |
Administrator Class | | | | | | | | | | | | | | | | |
Actual | | $ | 1,000.00 | | | $ | 965.27 | | | $ | 7.07 | | | | 1.45 | % |
Hypothetical (5% return before expenses) | | $ | 1,000.00 | | | $ | 1,017.60 | | | $ | 7.25 | | | | 1.45 | % |
Institutional Class | | | | | | | | | | | | | | | | |
Actual | | $ | 1,000.00 | | | $ | 967.36 | | | $ | 6.10 | | | | 1.25 | % |
Hypothetical (5% return before expenses) | | $ | 1,000.00 | | | $ | 1,018.60 | | | $ | 6.26 | | | | 1.25 | % |
| 1. | Expenses paid is equal to the annualized expense ratio of each class multiplied by the average account value over the period, multiplied by the number of days in the most recent fiscal half-year divided by the number of days in the fiscal year (to reflect the one-half-year period). |
| | | | | | |
| Portfolio of investments—April 30, 2014 (unaudited) | | Wells Fargo Advantage Emerging Markets Equity Income Fund | | | 7 | |
| | | | | | | | | | | | |
| Security name | | | | | | Shares | | | Value | |
| | | | |
Common Stocks: 80.00% | | | | | | | | | | | | |
| | | | |
| Australia: 0.96% | | | | | | | | | | | | |
BHP Billiton Limited (Materials, Metals & Mining) | | | | | | | 17,597 | | | $ | 617,123 | |
| | | | | | | | | | | | |
| | | | |
| Bermuda: 0.34% | | | | | | | | | | | | |
Digital China Holdings Limited (Information Technology, Electronic Equipment, Instruments & Components) | | | | | | | 239,000 | | | | 221,029 | |
| | | | | | | | | | | | |
| | | | |
| Brazil: 7.21% | | | | | | | | | | | | |
Alupar Investimento SA (Utilities, Electric Utilities) | | | | | | | 72,360 | | | | 512,743 | |
Grendene SA (Consumer Discretionary, Textiles, Apparel & Luxury Goods) | | | | | | | 71,100 | | | | 449,606 | |
Itau Unibanco Holding SA ADR (Financials, Banks) | | | | | | | 59,717 | | | | 976,970 | |
Natura Cosmeticos SA (Consumer Staples, Personal Products) | | | | | | | 27,400 | | | | 469,293 | |
Telefonica Brasil ADR (Telecommunication Services, Diversified Telecommunication Services) | | | | | | | 19,316 | | | | 409,499 | |
Transmissora Alianca de Energia Eletrica SA Composite Unit (Utilities, Electric Utilities) | | | | | | | 36,600 | | | | 327,467 | |
Tupy SA (Consumer Discretionary, Auto Components) | | | | | | | 96,486 | | | | 772,407 | |
Valid Solucoes SA (Industrials, Commercial Services & Supplies) | | | | | | | 47,000 | | | | 728,266 | |
| | | | |
| | | | | | | | | | | 4,646,251 | |
| | | | | | | | | | | | |
| | | | |
| Chile: 0.82% | | | | | | | | | | | | |
Aguas Andinas SA Class A (Utilities, Water Utilities) | | | | | | | 852,819 | | | | 526,121 | |
| | | | | | | | | | | | |
| | | | |
| China: 15.77% | | | | | | | | | | | | |
Agricultural Bank of China (Financials, Banks) | | | | | | | 3,120,000 | | | | 1,307,889 | |
Bank of China Limited (Financials, Banks) | | | | | | | 874,000 | | | | 384,414 | |
China Construction Bank (Financials, Banks) | | | | | | | 802,000 | | | | 553,428 | |
China Lilang Limited (Consumer Discretionary, Textiles, Apparel & Luxury Goods) | | | | | | | 531,000 | | | | 342,450 | |
China Mobile Limited (Telecommunication Services, Wireless Telecommunication Services) | | | | | | | 116,000 | | | | 1,102,703 | |
China Petroleum & Chemical Corporation (Energy, Oil, Gas & Consumable Fuels) | | | | | | | 1,275,600 | | | | 1,127,037 | |
Datang International Power Generation Company Limited (Utilities, Independent Power & Renewable Electricity Producers) | | | | | | | 1,008,000 | | | | 375,743 | |
Guangshen Railway Company (Industrials, Road & Rail) | | | | | | | 1,114,000 | | | | 421,004 | |
Guangzhou R&F Properties Company Limited (Financials, Real Estate Management & Development) | | | | | | | 424,400 | | | | 553,973 | |
Huaneng Power International Incorporated (Utilities, Independent Power & Renewable Electricity Producers) | | | | | | | 456,000 | | | | 445,240 | |
Industrial & Commercial Bank of China Limited Class H (Financials, Banks) | | | | | | | 1,691,000 | | | | 1,007,671 | |
PetroChina Company Limited (Energy, Oil, Gas & Consumable Fuels) | | | | | | | 816,000 | | | | 945,147 | |
Qinhuangdao Port Company Limited (Industrials, Transportation Infrastructure) † | | | | | | | 440,000 | | | | 237,226 | |
Sands China Limited (Consumer Discretionary, Hotels, Restaurants & Leisure) | | | | | | | 71,600 | | | | 522,712 | |
Shenzhen Expressway Company Limited (Industrials, Transportation Infrastructure) | | | | | | | 1,074,000 | | | | 490,389 | |
Zhejiang Expressway Company Limited (Industrials, Transportation Infrastructure) | | | | | | | 398,000 | | | | 344,460 | |
| | | | |
| | | | | | | | | | | 10,161,486 | |
| | | | | | | | | | | | |
| | | | |
| Cyprus: 0.54% | | | | | | | | | | | | |
Globaltrans Investment plc (Industrials, Road & Rail) | | | | | | | 36,231 | | | | 344,919 | |
| | | | | | | | | | | | |
| | | | |
| Czech Republic: 1.98% | | | | | | | | | | | | |
CEZ AS (Utilities, Electric Utilities) | | | | | | | 29,365 | | | | 882,899 | |
Komercni Banka AS (Financials, Banks) | | | | | | | 1,701 | | | | 391,952 | |
| | | | |
| | | | | | | | | | | 1,274,851 | |
| | | | | | | | | | | | |
The accompanying notes are an integral part of these financial statements.
| | | | |
| 8 | | Wells Fargo Advantage Emerging Markets Equity Income Fund | | Portfolio of investments—April 30, 2014 (unaudited) |
| | | | | | | | | | | | |
| Security name | | | | | | Shares | | | Value | |
| | | | |
| Hong Kong: 4.11% | | | | | | | | | | | | |
ANTA Sports Products Limited (Consumer Discretionary, Textiles, Apparel & Luxury Goods) | | | | | | | 163,000 | | | $ | 238,415 | |
Bosideng International Holdings Limited (Consumer Discretionary, Textiles, Apparel & Luxury Goods) | | | | | | | 1,942,670 | | | | 285,652 | |
Cosco Pacific Limited (Industrials, Transportation Infrastructure) | | | | | | | 837,521 | | | | 1,121,311 | |
Texwinca Holdings Limited (Consumer Discretionary, Textiles, Apparel & Luxury Goods) | | | | | | | 316,000 | | | | 339,520 | |
Yue Yuen Industrial Holdings Limited (Consumer Discretionary, Textiles, Apparel & Luxury Goods) | | | | | | | 122,000 | | | | 376,876 | |
Yuzhou Properties Company (Materials, Construction Materials) † | | | | | | | 1,236,761 | | | | 285,543 | |
| | | | |
| | | | | | | | | | | 2,647,317 | |
| | | | | | | | | | | | |
| | | | |
| Indonesia: 2.33% | | | | | | | | | | | | |
PT Bank Rakyat Indonesia Tbk (Financials, Banks) | | | | | | | 365,800 | | | | 313,231 | |
PT Perusahaan Gas Negara Persero Tbk (Utilities, Gas Utilities) | | | | | | | 605,200 | | | | 278,743 | |
PT Semen Gresik Persero Tbk (Materials, Construction Materials) | | | | | | | 283,900 | | | | 364,651 | |
PT Telekomunikasi Indonesia Tbk (Telecommunication Services, Diversified Telecommunication Services) | | | | | | | 2,780,200 | | | | 544,666 | |
| | | | |
| | | | | | | | | | | 1,501,291 | |
| | | | | | | | | | | | |
| | | | |
| Malaysia: 2.37% | | | | | | | | | | | | |
Berjaya Sports Toto Berhad (Consumer Discretionary, Hotels, Restaurants & Leisure) | | | | | | | 261,574 | | | | 311,598 | |
Sunway Real Estate Investment Trust (Financials, REITs) | | | | | | | 800,700 | | | | 333,472 | |
Telecom Malaysia Berhad (Telecommunication Services, Diversified Telecommunication Services) | | | | | | | 221,600 | | | | 420,738 | |
Westports Holdings (Industrials, Transportation Infrastructure) | | | | | | | 599,182 | | | | 462,391 | |
| | | | |
| | | | | | | | | | | 1,528,199 | |
| | | | | | | | | | | | |
| | | | |
| Mexico: 6.04% | | | | | | | | | | | | |
Bolsa Mexicana de Valores SAB (Financials, Diversified Financial Services) | | | | | | | 228,329 | | | | 468,604 | |
Grupo Aeroportuario del Centro Norte SAB de CV (Industrials, Transportation Infrastructure) | | | | | | | 180,520 | | | | 661,492 | |
Grupo Aeroportuario del Pacifico SAB de CV (Industrials, Transportation Infrastructure) | | | | | | | 151,538 | | | | 912,164 | |
Grupo Financiero Santander SAB de CV (Financials, Banks) | | | | | | | 316,261 | | | | 755,434 | |
Macquarie Mexico Real Estate Management SA de CV (Financials, REITs)144A | | | | | | | 413,857 | | | | 791,161 | |
Wal-Mart de Mexico SAB de CV (Consumer Staples, Food & Staples Retailing) | | | | | | | 120,500 | | | | 304,871 | |
| | | | |
| | | | | | | | | | | 3,893,726 | |
| | | | | | | | | | | | |
| | | | |
| Panama: 1.02% | | | | | | | | | | | | |
Banco Latinoamericano de Comercio Exterior SA (Financials, Banks) | | | | | | | 25,534 | | | | 656,734 | |
| | | | | | | | | | | | |
| | | | |
| Philippines: 3.07% | | | | | | | | | | | | |
Globe Telecom Incorporated (Telecommunication Services, Wireless Telecommunication Services) | | | | | | | 16,340 | | | | 607,344 | |
Philippine Long Distance Telephone Company (Telecommunication Services, Wireless Telecommunication Services) | | | | | | | 13,930 | | | | 899,919 | |
Semirara Mining Corporation (Energy, Oil, Gas & Consumable Fuels) | | | | | | | 50,770 | | | | 468,068 | |
| | | | |
| | | | | | | | | | | 1,975,331 | |
| | | | | | | | | | | | |
| | | | |
| Poland: 2.74% | | | | | | | | | | | | |
Bank Pekao SA (Financials, Banks) | | | | | | | 9,927 | | | | 635,592 | |
Powszechny Zaklad Ubezpieczen SA (Financials, Insurance) | | | | | | | 3,932 | | | | 557,401 | |
Telekomunikacja Polska SA (Telecommunication Services, Diversified Telecommunication Services) | | | | | | | 167,459 | | | | 571,904 | |
| | | | |
| | | | | | | | | | | 1,764,897 | |
| | | | | | | | | | | | |
The accompanying notes are an integral part of these financial statements.
| | | | | | |
| Portfolio of investments—April 30, 2014 (unaudited) | | Wells Fargo Advantage Emerging Markets Equity Income Fund | | | 9 | |
| | | | | | | | | | | | |
| Security name | | | | | | Shares | | | Value | |
| | | | |
| Russia: 5.38% | | | | | | | | | | | | |
Alrosa Corporate (Materials, Metals & Mining)(a) | | | | | | | 899,954 | | | $ | 930,201 | |
Lukoil ADR - London Exchanges (Energy, Oil, Gas & Consumable Fuels) | | | | | | | 10,481 | | | | 553,921 | |
MegaFon OAO (Telecommunication Services, Wireless Telecommunication Services) | | | | | | | 27,293 | | | | 709,618 | |
Mining and Metallurgical Company OJSC (Materials, Metals & Mining)(a) | | | | | | | 7,089 | | | | 1,274,885 | |
| | | | |
| | | | | | | | | | | 3,468,625 | |
| | | | | | | | | | | | |
| | | | |
| Singapore: 3.75% | | | | | | | | | | | | |
Ascendas India Trust (Financials, Real Estate Management & Development) | | | | | | | 407,000 | | | | 248,349 | |
Ascott Residence Trust (Financials, REITs) | | | | | | | 301,800 | | | | 288,873 | |
Asian Pay Television Trust (Consumer Discretionary, Media) | | | | | | | 278,000 | | | | 167,416 | |
CapitaRetail China Trust (Financials, REITs) | | | | | | | 304,000 | | | | 358,874 | |
Hutchison Port Holdings Trust (Industrials, Transportation Infrastructure) | | | | | | | 377,000 | | | | 256,360 | |
Lippo Malls Indonesia Retail Trust (Financials, REITs) | | | | | | | 1,219,000 | | | | 393,790 | |
STX OSV Holdings Limited (Industrials, Machinery) † | | | | | | | 913,000 | | | | 702,756 | |
| | | | |
| | | | | | | | | | | 2,416,418 | |
| | | | | | | | | | | | |
| | | | |
| South Africa: 5.83% | | | | | | | | | | | | |
Barclays Africa Group Limited (Financials, Banks) | | | | | | | 33,627 | | | | 492,235 | |
Kumba Iron Ore Limited (Materials, Metals & Mining) | | | | | | | 17,682 | | | | 628,824 | |
MTN Group Limited (Telecommunication Services, Wireless Telecommunication Services) | | | | | | | 37,365 | | | | 748,721 | |
Sanlam Limited (Financials, Insurance) | | | | | | | 90,745 | | | | 485,187 | |
Sasol Limited (Energy, Oil, Gas & Consumable Fuels) | | | | | | | 12,341 | | | | 692,436 | |
Standard Bank Group Limited (Financials, Banks) | | | | | | | 53,863 | | | | 706,944 | |
| | | | |
| | | | | | | | | | | 3,754,347 | |
| | | | | | | | | | | | |
| | | | |
| South Korea: 4.09% | | | | | | | | | | | | |
Hite Jinro Company Limited (Consumer Staples, Beverages) | | | | | | | 11,830 | | | | 286,219 | |
Kangwon Land Incorporated (Consumer Discretionary, Hotels, Restaurants & Leisure) | | | | | | | 17,380 | | | | 502,074 | |
KT&G Corporation (Consumer Staples, Tobacco) | | | | | | | 6,719 | | | | 538,404 | |
S-Oil Corporation (Energy, Oil, Gas & Consumable Fuels) | | | | | | | 11,120 | | | | 650,003 | |
SK Telecom Company Limited ADR (Telecommunication Services, Wireless Telecommunication Services) | | | | | | | 28,594 | | | | 660,235 | |
| | | | |
| | | | | | | | | | | 2,636,935 | |
| | | | | | | | | | | | |
| | | | |
| Taiwan: 9.22% | | | | | | | | | | | | |
Chicony Electronics Company Limited (Information Technology, Technology Hardware, Storage & Peripherals) | | | | | | | 92,000 | | | | 239,155 | |
Chroma Ate Incorporated (Information Technology, Electronic Equipment, Instruments & Components) | | | | | | | 144,000 | | | | 370,515 | |
Chunghwa Telecom Company Limited (Telecommunication Services, Diversified Telecommunication Services) | | | | | | | 62,000 | | | | 193,404 | |
Cleanaway Company Limited (Industrials, Commercial Services & Supplies) | | | | | | | 66,000 | | | | 373,733 | |
CTCI Corporation (Industrials, Construction & Engineering) | | | | | | | 369,000 | | | | 588,973 | |
Delta Electronics Incorporated (Information Technology, Electronic Equipment, Instruments & Components) | | | | | | | 40,000 | | | | 245,049 | |
Everlight Electronics Company Limited (Information Technology, Semiconductors & Semiconductor Equipment) | | | | | | | 170,000 | | | | 397,444 | |
Huaku Development Company Limited (Financials, Real Estate Management & Development) | | | | | | | 96,680 | | | | 236,594 | |
Mega Financial Holding Company Limited (Financials, Banks) | | | | | | | 352,065 | | | | 269,313 | |
Quanta Computer Incorporated (Information Technology, Technology Hardware, Storage & Peripherals) | | | | | | | 96,000 | | | | 263,223 | |
Radiant Opto-Electronics Corporation (Information Technology, Semiconductors & Semiconductor Equipment) | | | | | | | 208,530 | | | | 839,009 | |
Siliconware Precision Industries Company (Information Technology, Semiconductors & Semiconductor Equipment) | | | | | | | 439,000 | | | | 643,279 | |
Taiwan Cement Corporation (Materials, Construction Materials) | | | | | | | 243,000 | | | | 385,446 | |
United Microelectronics Corporation ADR (Information Technology, Semiconductors & Semiconductor Equipment) | | | | | | | 183,430 | | | | 399,877 | |
WPG Holdings Company Limited (Information Technology, Electronic Equipment, Instruments & Components) | | | | | | | 406,000 | | | | 498,795 | |
| | | | |
| | | | | | | | | | | 5,943,809 | |
| | | | | | | | | | | | |
The accompanying notes are an integral part of these financial statements.
| | | | |
| 10 | | Wells Fargo Advantage Emerging Markets Equity Income Fund | | Portfolio of investments—April 30, 2014 (unaudited) |
| | | | | | | | | | | | | | | | |
| Security name | | | | | | | | Shares | | | Value | |
| | | | |
| Thailand: 0.91% | | | | | | | | | | | | | | | | |
Hemaraj Land & Development Public Company Limited (Financials, Real Estate Management & Development) | | | | 2,839,700 | | | $ | 312,402 | |
PTT Global Chemical pcl (Materials, Chemicals) | | | | | | | | | | | 93,300 | | | | 178,037 | |
Thai Union Frozen Products pcl (Consumer Staples, Food Products) | | | | | | | | | | | 45,900 | | | | 99,289 | |
| | | | |
| | | | | | | | | | | | | | | 589,728 | |
| | | | | | | | | | | | | | | | |
| | | | |
| Turkey: 0.95% | | | | | | | | | | | | | | | | |
Cimsa Cimento Sanayi ve Ticaret AS (Materials, Construction Materials) | | | | | | | | | | | 104,810 | | | | 610,529 | |
| | | | | | | | | | | | | | | | |
| | | | |
| United Kingdom: 0.57% | | | | | | | | | | | | | | | | |
HSBC Holdings plc (Financials, Banks) | | | | | | | | | | | 36,000 | | | | 365,203 | |
| | | | | | | | | | | | | | | | |
| | | | |
Total Common Stocks (Cost $49,428,199) | | | | | | | | | | | | | | | 51,544,869 | |
| | | | | | | | | | | | | | | | |
| | | | |
| | | | | | Expiration date | | | | | | | |
| | | | |
Participation Notes: 5.57% | | | | | | | | | | | | | | | | |
| | | | |
| China: 0.47% | | | | | | | | | | | | | | | | |
Standard Chartered Bank (Daqin Railway Company Limited Class A) (Industrials, Road & Rail) † | | | | 4-3-2015 | | | | 283,000 | | | | 301,078 | |
| | | | | | | | | | | | | | | | |
| | | | |
| India: 4.01% | | | | | | | | | | | | | | | | |
HSBC Bank plc (Coal India Limited) (Materials, Metals & Mining) † | | | | 11-2-2020 | | | | 107,750 | | | | 521,204 | |
HSBC Bank plc (NMDC Limited) (Materials, Metals & Mining) | | | | 8-1-2023 | | | | 19,707 | | | | 1,028,422 | |
HSBC Bank plc (Oil & Natural Gas Corporation Limited) (Energy, Oil, Gas & Consumable Fuels) † | | | | 1-10-2024 | | | | 130,511 | | | | 703,226 | |
HSBC Bank plc (Power Finance Corporation) (Financials, Diversified Financial Services) † | | | | 11-25-2014 | | | | 109,000 | | | | 332,140 | |
| |
| | | | 2,584,992 | |
| | | | | | | | | | | | | | | | |
| | | | |
| Qatar: 1.09% | | | | | | | | | | | | | | | | |
HSBC Bank plc (Qatar National Bank) (Financials, Banks) † | | | | | | | 11-2-2020 | | | | 283,092 | | | | 704,739 | |
| | | | | | | | | | | | | | | | |
| | | | |
Total Participation Notes (Cost $3,342,751) | | | | | | | | | | | | | | | 3,590,809 | |
| | | | | | | | | | | | | | | | |
| | | | |
| | | Dividend yield | | | | | | | | | | |
| Preferred Stocks: 4.12% | | | | | | | | | | | | | | | | |
| | | | |
| Brazil: 4.12% | | | | | | | | | | | | | | | | |
Banco Bradesco SA (Financials, Banks) ± | | | 2.61 | % | | | | | | | 43,200 | | | | 643,035 | |
Companhia Vale Do Rio Doce Class A (Materials, Metals & Mining) ± | | | 6.08 | | | | | | | | 46,700 | | | | 553,342 | |
Petroleo Brasileiro SA (Energy, Oil, Gas & Consumable Fuels) ± | | | 4.99 | | | | | | | | 110,700 | | | | 822,648 | |
Vale SA ADR (Materials, Metals & Mining) ± | | | 5.74 | | | | | | | | 53,605 | | | | 636,289 | |
| | | | |
Total Preferred Stocks (Cost $2,588,418) | | | | | | | | | | | | | | | 2,655,314 | |
| | | | | | | | | | | | | | | | |
| | | Yield | | | | | | | | | | |
| Short-Term Investments: 4.67% | | | | | | | | | | | | | | | | |
| | | | |
| Investment Companies: 4.67% | | | | | | | | | | | | | | | | |
Wells Fargo Advantage Cash Investment Money Market Fund, Select Class (l)(u) | | | 0.07 | | | | | | | | 3,006,255 | | | | 3,006,255 | |
| | | | | | | | | | | | | | | | |
| | | | |
Total Short-Term Investments (Cost $3,006,255) | | | | | | | | | | | | | | | 3,006,255 | |
| | | | | | | | | | | | | | | | |
| | | | | | | | |
| Total investments in securities | | | | | | | | |
| (Cost $58,365,623) * | | | 94.36 | % | | | 60,797,247 | |
Other assets and liabilities, net | | | 5.64 | | | | 3,636,505 | |
| | | | | | | | |
| Total net assets | | | 100.00 | % | | $ | 64,433,752 | |
| | | | | | | | |
The accompanying notes are an integral part of these financial statements.
| | | | | | |
| Portfolio of investments—April 30, 2014 (unaudited) | | Wells Fargo Advantage Emerging Markets Equity Income Fund | | | 11 | |
| † | Non-income-earning security |
| 144A | Security that may be resold to “qualified institutional buyers” under Rule 144A or security offered pursuant to Section 4(2) of the Securities Act of 1933, as amended |
| (a) | Security is fair valued by the Management Valuation Team, and in certain instances by the Board of Trustees, in accordance with procedures approved by the Board of Trustees. |
| ± | Variable rate investment. The rate shown is the rate in effect at period end. |
| (l) | Represents an affiliate of the Fund under Sections 2(a)(2) and 2(a)(3) of the Investment Company Act of 1940, as amended |
| (u) | Rate shown is the 7-day annualized yield at period end. |
| * | Cost for federal income tax purposes is $58,709,131 and unrealized appreciation (depreciation) consists of: |
| | | | |
Gross unrealized appreciation | | $ | 3,666,604 | |
Gross unrealized depreciation | | | (1,578,488 | ) |
| | | | |
Net unrealized appreciation | | $ | 2,088,116 | |
The accompanying notes are an integral part of these financial statements.
| | | | |
| 12 | | Wells Fargo Advantage Emerging Markets Equity Income Fund | | Statement of assets and liabilities—April 30, 2014 (unaudited) |
| | | | |
| | | | |
| |
Assets | | | | |
Investments | | | | |
In unaffiliated securities, at value (see cost below) | | $ | 57,790,992 | |
In affiliated securities, at value (see cost below) | | | 3,006,255 | |
| | | | |
Total investments, at value (see cost below) | | | 60,797,247 | |
Cash | | | 303,546 | |
Foreign currency, at value (see cost below) | | | 532,521 | |
Receivable for investments sold | | | 260,464 | |
Receivable for Fund shares sold | | | 3,245,400 | |
Receivable for dividends | | | 222,779 | |
Prepaid expenses and other assets | | | 17,222 | |
| | | | |
Total assets | | | 65,379,179 | |
| | | | |
| |
Liabilities | | | | |
Payable for investments purchased | | | 479,990 | |
Payable for Fund shares redeemed | | | 392,106 | |
Advisory fee payable | | | 39,772 | |
Distribution fees payable | | | 2,587 | |
Due to other related parties | | | 10,164 | |
Accrued expenses and other liabilities | | | 20,808 | |
| | | | |
Total liabilities | | | 945,427 | |
| | | | |
Total net assets | | $ | 64,433,752 | |
| | | | |
| |
NET ASSETS CONSIST OF | | | | |
Paid-in capital | | $ | 63,062,768 | |
Undistributed net investment income | | | 160,388 | |
Accumulated net realized losses on investments | | | (1,221,545 | ) |
Net unrealized gains on investments | | | 2,432,141 | |
| | | | |
Total net assets | | $ | 64,433,752 | |
| | | | |
| |
COMPUTATION OF NET ASSET VALUE AND OFFERING PRICE PER SHARE1 | | | | |
Net assets – Class A | | $ | 13,744,961 | |
Shares outstanding – Class A | | | 1,261,529 | |
Net asset value per share – Class A | | | $10.90 | |
Maximum offering price per share – Class A2 | | | $11.56 | |
Net assets – Class C | | $ | 4,291,476 | |
Shares outstanding – Class C | | | 394,028 | |
Net asset value per share – Class C | | | $10.89 | |
Net assets – Administrator Class | | $ | 17,926,209 | |
Shares outstanding – Administrator Class | | | 1,642,697 | |
Net asset value per share – Administrator Class | | | $10.91 | |
Net assets – Institutional Class | | $ | 28,471,106 | |
Shares outstanding – Institutional Class | | | 2,610,379 | |
Net asset value per share – Institutional Class | | | $10.91 | |
| |
Investments in unaffiliated securities, at cost | | $ | 55,359,368 | |
| | | | |
Investments in affiliated securities, at cost | | $ | 3,006,255 | |
| | | | |
Total investments, at cost | | $ | 58,365,623 | |
| | | | |
Foreign currency, at cost | | $ | 532,988 | |
| | | | |
| 1. | The Fund has an unlimited number of authorized shares. |
| 2. | Maximum offering price is computed as 100/94.25 of net asset value. On investments of $50,000 or more, the offering price is reduced. |
The accompanying notes are an integral part of these financial statements.
| | | | | | |
| Statement of operations—six months ended April 30, 2014 (unaudited) | | Wells Fargo Advantage Emerging Markets Equity Income Fund | | | 13 | |
| | | | |
| | | | |
| |
Investment income | | | | |
Dividends* | | $ | 897,327 | |
Income from affiliated securities | | | 1,436 | |
| | | | |
Total investment income | | | 898,763 | |
| | | | |
| |
Expenses | | | | |
Advisory fee | | | 256,332 | |
Administration fees | | | | |
Fund level | | | 11,651 | |
Class A | | | 13,312 | |
Class C | | | 4,362 | |
Administrator Class | | | 7,618 | |
Institutional Class | | | 7,110 | |
Shareholder servicing fees | | | | |
Class A | | | 12,799 | |
Class C | | | 4,194 | |
Administrator Class | | | 18,556 | |
Distribution fees | | | | |
Class C | | | 12,583 | |
Custody and accounting fees | | | 36,151 | |
Professional fees | | | 23,000 | |
Registration fees | | | 28,041 | |
Shareholder report expenses | | | 13,180 | |
Trustees’ fees and expenses | | | 4,565 | |
Other fees and expenses | | | 11,282 | |
| | | | |
Total expenses | | | 464,736 | |
Less: Fee waivers and/or expense reimbursements | | | (118,440 | ) |
| | | | |
Net expenses | | | 346,296 | |
| | | | |
Net investment income | | | 552,467 | |
| | | | |
| |
REALIZED AND UNREALIZED GAINS (LOSSES) ON INVESTMENTS | | | | |
Net realized losses on investments | | | (1,218,447 | ) |
Net change in unrealized gains (losses) on investments | | | 1,269,608 | |
| | | | |
Net realized and unrealized gains (losses) on investments | | | 51,161 | |
| | | | |
Net increase in net assets resulting from operations | | $ | 603,628 | |
| | | | |
| |
* Net of foreign dividend withholding taxes in the amount of | | | $89,832 | |
The accompanying notes are an integral part of these financial statements.
| | | | |
| 14 | | Wells Fargo Advantage Emerging Markets Equity Income Fund | | Statement of changes in net assets |
| | | | | | | | | | | | | | | | |
| | | Six months ended April 30, 2014 (unaudited) | | | Year ended October 31, 2013 | |
| | | | |
Operations | | | | | | | | | | | | | | | | |
Net investment income | | | | | | $ | 552,467 | | | | | | | $ | 438,933 | |
Net realized gains (losses) on investments | | | | | | | (1,218,447 | ) | | | | | | | 1,186,615 | |
Net change in unrealized gains (losses) on investments | | | | | | | 1,269,608 | | | | | | | | 232,000 | |
| | | | |
Net increase in net assets resulting from operations | | | | | | | 603,628 | | | | | | | | 1,857,548 | |
| | | | |
| | | | |
Distributions to shareholders from | | | | | | | | | | | | | | | | |
Net investment income | | | | | | | | | | | | | | | | |
Class A | | | | | | | (103,768 | ) | | | | | | | (90,453 | ) |
Class C | | | | | | | (23,103 | ) | | | | | | | (20,531 | ) |
Administrator Class | | | | | | | (161,725 | ) | | | | | | | (219,915 | ) |
Institutional Class | | | | | | | (175,546 | ) | | | | | | | (182,108 | ) |
Net realized gains | | | | | | | | | | | | | | | | |
Class A | | | | | | | (297,936 | ) | | | | | | | (13,303 | ) |
Class C | | | | | | | (99,039 | ) | | | | | | | (11,584 | ) |
Administrator Class | | | | | | | (465,603 | ) | | | | | | | (109,120 | ) |
Institutional Class | | | | | | | (190,076 | ) | | | | | | | (104,953 | ) |
| | | | |
Total distributions to shareholders | | | | | | | (1,516,796 | ) | | | | | | | (751,967 | ) |
| | | | |
| | | | |
Capital share transactions | | | Shares | | | | | | | | Shares | | | | | |
Proceeds from shares sold | | | | | | | | | | | | | | | | |
Class A | | | 575,390 | | | | 6,194,584 | | | | 746,532 | | | | 8,571,764 | |
Class C | | | 231,321 | | | | 2,556,582 | | | | 125,397 | | | | 1,453,061 | |
Administrator Class | | | 755,496 | | | | 8,164,211 | | | | 676,110 | | | | 7,793,914 | |
Institutional Class | | | 3,003,890 | | | | 31,504,392 | | | | 34,989 | | | | 400,626 | |
| | | | |
| | | | | | | 48,419,769 | | | | | | | | 18,219,365 | |
| | | | |
Reinvestment of distributions | | | | | | | | | | | | | | | | |
Class A | | | 36,315 | | | | 401,082 | | | | 9,031 | | | | 103,132 | |
Class C | | | 11,051 | | | | 122,142 | | | | 2,819 | | | | 32,115 | |
Administrator Class | | | 56,504 | | | | 624,711 | | | | 28,736 | | | | 327,844 | |
Institutional Class | | | 29,833 | | | | 327,590 | | | | 25,149 | | | | 287,061 | |
| | | | |
| | | | | | | 1,475,525 | | | | | | | | 750,152 | |
| | | | |
Payment for shares redeemed | | | | | | | | | | | | | | | | |
Class A | | | (84,786 | ) | | | (916,554 | ) | | | (77,227 | ) | | | (893,304 | ) |
Class C | | | (20,374 | ) | | | (218,114 | ) | | | (6,537 | ) | | | (73,965 | ) |
Administrator Class | | | (315,664 | ) | | | (3,360,210 | ) | | | (31,825 | ) | | | (375,694 | ) |
Institutional Class | | | (938,644 | ) | | | (10,343,492 | ) | | | (9 | ) | | | (105 | ) |
| | | | |
| | | | | | | (14,838,370 | ) | | | | | | | (1,343,068 | ) |
| | | | |
Net increase in net assets resulting from capital share transactions | | | | | | | 35,056,924 | | | | | | | | 17,626,449 | |
| | | | |
Total increase in net assets | | | | | | | 34,143,756 | | | | | | | | 18,732,030 | |
| | | | |
| | | | |
Net assets | | | | | | | | | | | | | | | | |
Beginning of period | | | | | | | 30,289,996 | | | | | | | | 11,557,966 | |
| | | | |
End of period | | | | | | $ | 64,433,752 | | | | | | | $ | 30,289,996 | |
| | | | |
Undistributed net investment income | | | | | | $ | 160,388 | | | | | | | $ | 72,063 | |
| | | | |
The accompanying notes are an integral part of these financial statements.
| | | | | | |
| Financial highlights | | Wells Fargo Advantage Emerging Markets Equity Income Fund | | | 15 | |
(For a share outstanding throughout each period)
| | | | | | | | | | | | |
| | | Six months ended
April 30, 2014 (unaudited) | | | Year ended October 31 | |
| CLASS A | | | 2013 | | | 20121 | |
Net asset value, beginning of period | | $ | 11.79 | | | $ | 11.17 | | | $ | 10.00 | |
Net investment income | | | 0.10 | | | | 0.31 | | | | 0.13 | |
Net realized and unrealized gains (losses) on investments | | | (0.51 | ) | | | 0.88 | | | | 1.15 | |
| | | | | | | | | | | | |
Total from investment operations | | | (0.41 | ) | | | 1.19 | | | | 1.28 | |
Distributions to shareholders from | | | | | | | | | | | | |
Net investment income | | | (0.11 | ) | | | (0.34 | ) | | | (0.11 | ) |
Net realized gains | | | (0.37 | ) | | | (0.23 | ) | | | 0.00 | |
| | | | | | | | | | | | |
Total distributions to shareholders | | | (0.48 | ) | | | (0.57 | ) | | | (0.11 | ) |
Net asset value, end of period | | $ | 10.90 | | | $ | 11.79 | | | $ | 11.17 | |
Total return2 | | | (3.54 | )% | | | 10.94 | % | | | 12.80 | % |
Ratios to average net assets (annualized) | | | | | | | | | | | | |
Gross expenses | | | 2.18 | % | | | 2.88 | % | | | 4.29 | % |
Net expenses | | | 1.65 | % | | | 1.65 | % | | | 1.65 | % |
Net investment income | | | 2.03 | % | | | 2.64 | % | | | 2.94 | % |
Supplemental data | | | | | | | | | | | | |
Portfolio turnover rate | | | 42 | % | | | 85 | % | | | 39 | % |
Net assets, end of period (000s omitted) | | | $13,745 | | | | $8,658 | | | | $628 | |
| 1. | For the period from May 31, 2012 (commencement of class operations) to October 31, 2012 |
| 2. | Total return calculations do not include any sales charges. Returns for periods of less than one year are not annualized. |
The accompanying notes are an integral part of these financial statements.
| | | | |
| 16 | | Wells Fargo Advantage Emerging Markets Equity Income Fund | | Financial highlights |
(For a share outstanding throughout each period)
| | | | | | | | | | | | |
| | | Six months ended
April 30, 2014 (unaudited) | | | Year ended October 31 | |
| CLASS C | | | 2013 | | | 20121 | |
Net asset value, beginning of period | | $ | 11.79 | | | $ | 11.16 | | | $ | 10.00 | |
Net investment income | | | 0.06 | | | | 0.22 | | | | 0.10 | |
Net realized and unrealized gains (losses) on investments | | | (0.52 | ) | | | 0.89 | | | | 1.13 | |
| | | | | | | | | | | | |
Total from investment operations | | | (0.46 | ) | | | 1.11 | | | | 1.23 | |
Distributions to shareholders from | | | | | | | | | | | | |
Net investment income | | | (0.07 | ) | | | (0.25 | ) | | | (0.07 | ) |
Net realized gains | | | (0.37 | ) | | | (0.23 | ) | | | 0.00 | |
| | | | | | | | | | | | |
Total distributions to shareholders | | | (0.44 | ) | | | (0.48 | ) | | | (0.07 | ) |
Net asset value, end of period | | $ | 10.89 | | | $ | 11.79 | | | $ | 11.16 | |
Total return2 | | | (3.92 | )% | | | 10.11 | % | | | 12.49 | % |
Ratios to average net assets (annualized) | | | | | | | | | | | | |
Gross expenses | | | 2.94 | % | | | 3.81 | % | | | 5.03 | % |
Net expenses | | | 2.40 | % | | | 2.40 | % | | | 2.41 | % |
Net investment income | | | 1.20 | % | | | 1.80 | % | | | 2.24 | % |
Supplemental data | | | | | | | | | | | | |
Portfolio turnover rate | | | 42 | % | | | 85 | % | | | 39 | % |
Net assets, end of period (000s omitted) | | | $4,291 | | | | $2,028 | | | | $562 | |
| 1. | For the period from May 31, 2012 (commencement of class operations) to October 31, 2012 |
| 2. | Total return calculations do not include any sales charges. Returns for periods of less than one year are not annualized. |
The accompanying notes are an integral part of these financial statements.
| | | | | | |
| Financial highlights | | Wells Fargo Advantage Emerging Markets Equity Income Fund | | | 17 | |
(For a share outstanding throughout each period)
| | | | | | | | | | | | |
| | | Six months ended
April 30, 2014 (unaudited) | | | Year ended October 31 | |
| ADMINISTRATOR CLASS | | | 2013 | | | 20121 | |
Net asset value, beginning of period | | $ | 11.80 | | | $ | 11.17 | | | $ | 10.00 | |
Net investment income | | | 0.11 | 2 | | | 0.32 | | | | 0.14 | |
Net realized and unrealized gains (losses) on investments | | | (0.52 | ) | | | 0.89 | | | | 1.14 | |
| | | | | | | | | | | | |
Total from investment operations | | | (0.41 | ) | | | 1.21 | | | | 1.28 | |
Distributions to shareholders from | | | | | | | | | | | | |
Net investment income | | | (0.11 | ) | | | (0.35 | ) | | | (0.11 | ) |
Net realized gains | | | (0.37 | ) | | | (0.23 | ) | | | 0.00 | |
| | | | | | | | | | | | |
Total distributions to shareholders | | | (0.48 | ) | | | (0.58 | ) | | | (0.11 | ) |
Net asset value, end of period | | $ | 10.91 | | | $ | 11.80 | | | $ | 11.17 | |
Total return3 | | | (3.47 | )% | | | 11.13 | % | | | 12.89 | % |
Ratios to average net assets (annualized) | | | | | | | | | | | | |
Gross expenses | | | 2.02 | % | | | 2.94 | % | | | 4.14 | % |
Net expenses | | | 1.45 | % | | | 1.45 | % | | | 1.45 | % |
Net investment income | | | 2.09 | % | | | 2.70 | % | | | 3.17 | % |
Supplemental data | | | | | | | | | | | | |
Portfolio turnover rate | | | 42 | % | | | 85 | % | | | 39 | % |
Net assets, end of period (000s omitted) | | | $17,926 | | | | $13,527 | | | | $5,285 | |
| 1. | For the period from May 31, 2012 (commencement of class operations) to October 31, 2012. |
| 2. | Calculated based upon average shares outstanding |
| 3. | Returns for periods of less than one year are not annualized. |
The accompanying notes are an integral part of these financial statements.
| | | | |
| 18 | | Wells Fargo Advantage Emerging Markets Equity Income Fund | | Financial highlights |
(For a share outstanding throughout each period)
| | | | | | | | | | | | |
| | | Six months ended
April 30, 2014 (unaudited) | | | Year ended October 31 | |
| INSTITUTIONAL CLASS | | | 2013 | | | 20121 | |
Net asset value, beginning of period | | $ | 11.79 | | | $ | 11.17 | | | $ | 10.00 | |
Net investment income | | | 0.12 | | | | 0.34 | | | | 0.15 | |
Net realized and unrealized gains (losses) on investments | | | (0.50 | ) | | | 0.89 | | | | 1.14 | |
| | | | | | | | | | | | |
Total from investment operations | | | (0.38 | ) | | | 1.23 | | | | 1.29 | |
Distributions to shareholders from | | | | | | | | | | | | |
Net investment income | | | (0.13 | ) | | | (0.38 | ) | | | (0.12 | ) |
Net realized gains | | | (0.37 | ) | | | (0.23 | ) | | | 0.00 | |
| | | | | | | | | | | | |
Total distributions to shareholders | | | (0.50 | ) | | | (0.61 | ) | | | (0.12 | ) |
Net asset value, end of period | | $ | 10.91 | | | $ | 11.79 | | | $ | 11.17 | |
Total return2 | | | (3.26 | )% | | | 11.32 | % | | | 12.98 | % |
Ratios to average net assets (annualized) | | | | | | | | | | | | |
Gross expenses | | | 1.68 | % | | | 2.74 | % | | | 3.92 | % |
Net expenses | | | 1.25 | % | | | 1.25 | % | | | 1.25 | % |
Net investment income | | | 3.03 | % | | | 2.88 | % | | | 3.39 | % |
Supplemental data | | | | | | | | | | | | |
Portfolio turnover rate | | | 42 | % | | | 85 | % | | | 39 | % |
Net assets, end of period (000s omitted) | | | $28,471 | | | | $6,077 | | | | $5,082 | |
| 1. | For the period from May 31, 2012 (commencement of class operations) to October 31, 2012 |
| 2. | Returns for periods of less than one year are not annualized. |
The accompanying notes are an integral part of these financial statements.
| | | | | | |
| Notes to financial statements (unaudited) | | Wells Fargo Advantage Emerging Markets Equity Income Fund | | | 19 | |
1. ORGANIZATION
Wells Fargo Funds Trust (the “Trust”), a Delaware statutory trust organized on March 10, 1999, is an open-end management investment company registered under the Investment Company Act of 1940, as amended (the “1940 Act”). These financial statements report on the Wells Fargo Advantage Emerging Markets Equity Income Fund (the “Fund”) which is a diversified series of the Trust.
2. SIGNIFICANT ACCOUNTING POLICIES
The following significant accounting policies, which are consistently followed in the preparation of the financial statements of the Fund, are in conformity with U.S. generally accepted accounting principles which require management to make estimates and assumptions that affect the reported amounts of assets and liabilities, disclosure of contingent assets and liabilities at the date of the financial statements, and the reported amounts of revenues and expenses during the reporting period. Actual results could differ from those estimates.
Securities valuation
All investments are valued each business day as of the close of regular trading on the New York Stock Exchange (generally 4 p.m. Eastern Time).
Equity securities that are listed on a foreign or domestic exchange or market are valued at the official closing price or, if none, the last sales price. If no sale occurs on the primary exchange or market for the security that day, the prior day’s price will be deemed “stale” and fair values will be determined in accordance with the Fund’s Valuation Procedures.
The values of securities denominated in foreign currencies are translated into U.S. dollars at rates provided by an independent foreign currency pricing source at a time each business day specified by the Management Valuation Team.
Many securities markets and exchanges outside the U.S. close prior to the close of the New York Stock Exchange and therefore may not fully reflect trading or events that occur after the close of the principal exchange in which the foreign securities are traded, but before the close of the New York Stock Exchange. If such trading or events are expected to materially affect the value of such securities, then fair value pricing procedures approved by the Board of Trustees of the Fund are applied. These procedures take into account multiple factors including movements in U.S. securities markets after foreign exchanges close. Foreign securities that are fair valued under these procedures are categorized as Level 2 and the application of these procedures may result in transfers between Level 1 and Level 2. Depending on market activity, such fair valuations may be frequent. Such fair value pricing may result in NAVs that are higher or lower than NAVs based on the last reported sales price or latest quoted bid price. On April 30, 2014, such fair value pricing was not used in pricing foreign securities.
Investments in registered open-end investment companies are valued at net asset value.
Investments which are not valued using any of the methods discussed above are valued at their fair value, as determined in good faith by the Board of Trustees. The Board of Trustees has established a Valuation Committee comprised of the Trustees and has delegated to it the authority to take any actions regarding the valuation of portfolio securities that the Valuation Committee deems necessary or appropriate, including determining the fair value of portfolio securities, unless the determination has been delegated to the Management Valuation Team. The Board of Trustees retains the authority to make or ratify any valuation decisions or approve any changes to the Valuation Procedures as it deems appropriate. On a quarterly basis, the Board of Trustees receives reports on any valuation actions taken by the Valuation Committee or the Management Valuation Team which may include items for ratification.
Valuations of fair valued securities are compared to the next actual sales price when available, or other appropriate market values, to assess the continued appropriateness of the fair valuation methodologies used. These securities are fair valued on a day-to-day basis, taking into consideration changes to appropriate market information and any significant changes to the inputs considered in the valuation process until there is a readily available price provided on an exchange or by an independent pricing service. Valuations received from an independent pricing service or independent broker-dealer quotes are periodically validated by comparisons to most recent trades and valuations provided by other independent pricing services in addition to the review of prices by the adviser and/or subadviser. Unobservable inputs used in determining fair valuations are identified based on the type of security, taking into consideration factors utilized by market participants in valuing the investment, knowledge about the issuer and the current market environment.
Foreign currency translation
The accounting records of the Fund are maintained in U.S. dollars. The values of other assets and liabilities denominated in foreign currencies are translated into U.S. dollars at rates provided by an independent foreign currency pricing source
| | | | |
| 20 | | Wells Fargo Advantage Emerging Markets Equity Income Fund | | Notes to financial statements (unaudited) |
at a time each business day specified by the Management Valuation Team. Purchases and sales of securities, and income and expenses are converted at the rate of exchange on the respective dates of such transactions. Net realized foreign exchange gains or losses arise from sales of foreign currencies, currency gains or losses realized between the trade and settlement dates on securities transactions, and the difference between the amounts of dividends, interest and foreign withholding taxes recorded and the U.S. dollar equivalent of the amounts actually paid or received. Net unrealized foreign exchange gains and losses arise from changes in the fair value of assets and liabilities other than investments in securities resulting from changes in exchange rates. The changes in net assets arising from changes in exchange rates and the changes in net assets resulting from changes in market prices of securities are not separately presented. Such changes are included in net realized and unrealized gains or losses from investments.
Forward foreign currency contracts
The Fund may be subject to foreign currency exchange rate risk in the normal course of pursuing its investment objectives. A forward foreign currency contract is an agreement between two parties to purchase or sell a specific currency for an agreed-upon price at a future date. The Fund enters into forward foreign currency contracts to facilitate transactions in foreign-denominated securities and to attempt to minimize the risk to the Fund from adverse changes in the relationship between currencies. Forward foreign currency contracts are recorded at the forward rate and marked-to-market daily. When the contracts are closed, realized gains and losses arising from such transactions are recorded as realized gains or losses on forward foreign currency contract transactions. The Fund could be exposed to risks if the counterparties to the contracts are unable to meet the terms of their contracts or if the value of the foreign currency changes unfavorably. The Fund’s maximum risk of loss from counterparty credit risk is the unrealized gains on the contracts. This risk may be mitigated if there is a master netting arrangement between the Fund and the counterparty.
Security transactions and income recognition
Securities transactions are recorded on a trade date basis. Realized gains or losses are recorded on the basis of identified cost.
Dividend income is recognized on the ex-dividend date, except for certain dividends from foreign securities, which are recorded as soon as the Fund is informed of the ex-dividend date. Dividend income from foreign securities is recorded net of foreign taxes withheld where recovery of such taxes is not assured.
Distributions to shareholders
Distributions to shareholders from net investment income and net realized gains, if any, are recorded on the ex-dividend date. Such distributions are determined in conformity with federal income tax regulations, which may differ in amount or character from net investment income and realized gains recognized for purposes of U.S. generally accepted accounting principles.
Federal and other taxes
The Fund intends to continue to qualify as a regulated investment company by distributing substantially all of its investment company taxable income and any net realized capital gains (after reduction for capital loss carryforwards) sufficient to relieve it from all, or substantially all, federal income taxes. Accordingly, no provision for federal income taxes was required.
The Fund’s income and federal excise tax returns and all financial records supporting those returns for the prior three fiscal years are subject to examination by the federal and Delaware revenue authorities. Management has analyzed the Fund’s tax positions taken on federal, state, and foreign tax returns for all open tax years and does not believe that there are any uncertain tax positions that require recognition of a tax liability.
Class allocations
The separate classes of shares offered by the Fund differ principally in applicable sales charges, distribution, shareholder servicing, and administration fees. Shareholders of each class bear certain expenses that pertain to that particular class. All shareholders bear the common expenses of the Fund, earn income from the portfolio, and are allocated any unrealized gains and losses pro rata based on the average daily net assets of each class, without distinction between share classes. Dividends are determined separately for each class based on income and expenses allocable to each class. Realized gains and losses are allocated to each class pro rata based upon the net assets of each class on the date realized. Differences in per share dividend rates generally result from the relative weightings of pro rata income and realized gain allocations and from differences in separate class expenses, including distribution, shareholder servicing, and administration fees.
| | | | | | |
| Notes to financial statements (unaudited) | | Wells Fargo Advantage Emerging Markets Equity Income Fund | | | 21 | |
3. FAIR VALUATION MEASUREMENTS
Fair value measurements of investments are determined within a framework that has established a fair value hierarchy based upon the various data inputs utilized in determining the value of the Fund’s investments. The three-level hierarchy gives the highest priority to unadjusted quoted prices in active markets for identical assets or liabilities (Level 1) and the lowest priority to significant unobservable inputs (Level 3). The Fund’s investments are classified within the fair value hierarchy based on the lowest level of input that is significant to the fair value measurement. The inputs are summarized into three broad levels as follows:
| n | | Level 1 – quoted prices in active markets for identical securities |
| n | | Level 2 – other significant observable inputs (including quoted prices for similar securities, interest rates, prepayment speeds, credit risk, use of amortized cost, etc.) |
| n | | Level 3 – significant unobservable inputs (including the Fund’s own assumptions in determining the fair value of investments) |
The inputs or methodologies used for valuing investments in securities are not necessarily an indication of the risk associated with investing in those securities.
As of April 30, 2014, the inputs used in valuing investments in securities were as follows:
| | | | | | | | | | | | | | | | |
| Investments in securities | | Quoted prices (Level 1) | | | Other significant
observable inputs (Level 2) | | | Significant unobservable inputs (Level 3) | | | Total | |
Equity securities | | | | | | | | | | | | | | | | |
Common stocks | | | | | | | | | | | | | | | | |
Australia | | $ | 617,123 | | | $ | 0 | | | $ | 0 | | | $ | 617,123 | |
Bermuda | | | 221,029 | | | | 0 | | | | 0 | | | | 221,029 | |
Brazil | | | 4,646,251 | | | | 0 | | | | 0 | | | | 4,646,251 | |
Chile | | | 526,121 | | | | 0 | | | | 0 | | | | 526,121 | |
China | | | 10,161,486 | | | | | | | | | | | | 10,161,486 | |
Cyprus | | | 344,919 | | | | 0 | | | | 0 | | | | 344,919 | |
Czech Republic | | | 1,274,851 | | | | 0 | | | | 0 | | | | 1,274,851 | |
Hong Kong | | | 2,647,317 | | | | 0 | | | | 0 | | | | 2,647,317 | |
Indonesia | | | 1,501,291 | | | | 0 | | | | 0 | | | | 1,501,291 | |
Malaysia | | | 1,528,199 | | | | 0 | | | | 0 | | | | 1,528,199 | |
Mexico | | | 3,893,726 | | | | 0 | | | | 0 | | | | 3,893,726 | |
Panama | | | 656,734 | | | | 0 | | | | 0 | | | | 656,734 | |
Philippines | | | 1,975,331 | | | | 0 | | | | 0 | | | | 1,975,331 | |
Poland | | | 1,764,897 | | | | 0 | | | | 0 | | | | 1,764,897 | |
Russia | | | 1,263,539 | | | | 2,205,086 | | | | 0 | | | | 3,468,625 | |
Singapore | | | 2,416,418 | | | | 0 | | | | 0 | | | | 2,416,418 | |
South Africa | | | 3,754,347 | | | | 0 | | | | 0 | | | | 3,754,347 | |
South Korea | | | 2,636,935 | | | | 0 | | | | 0 | | | | 2,636,935 | |
Taiwan | | | 5,943,809 | | | | 0 | | | | 0 | | | | 5,943,809 | |
Thailand | | | 589,728 | | | | 0 | | | | 0 | | | | 589,728 | |
Turkey | | | 610,529 | | | | 0 | | | | 0 | | | | 610,529 | |
United Kingdom | | | 365,203 | | | | 0 | | | | 0 | | | | 365,203 | |
Preferred stocks | | | | | | | | | | | | | | | | |
Brazil | | | 2,655,314 | | | | 0 | | | | 0 | | | | 2,655,314 | |
Participation notes | | | 0 | | | | 3,590,809 | | | | 0 | | | | 3,590,809 | |
Short-term investments | | | | | | | | | | | | | | | | |
Investment companies | | | 3,006,255 | | | | 0 | | | | 0 | | | | 3,006,255 | |
| | | $ | 55,001,352 | | | $ | 5,795,895 | | | $ | 0 | | | $ | 60,797,247 | |
Transfers in and transfers out are recognized at the end of the reporting period. For the six months ended April 30, 2014, the Fund did not have any transfers into/out of Level 1, Level 2, or level 3.
| | | | |
| 22 | | Wells Fargo Advantage Emerging Markets Equity Income Fund | | Notes to financial statements (unaudited) |
4. TRANSACTIONS WITH AFFILIATES AND OTHER EXPENSES
Advisory fee
The Trust has entered into an advisory contract with Funds Management, an indirect wholly owned subsidiary of Wells Fargo & Company (“Wells Fargo”). The adviser is responsible for implementing investment policies and guidelines and for supervising the subadviser, who is responsible for day-to-day portfolio management of the Fund.
Pursuant to the contract, Funds Management is entitled to receive an annual advisory fee starting at 1.10% and declining to 0.95% as the average daily net assets of the Fund increase. For the six months ended April 30, 2014, the advisory fee was equivalent to an annual rate of 1.10% of the Fund’s average daily net assets.
Funds Management has retained the services of certain subadvisers to provide daily portfolio management to the Fund. The fee for subadvisory services is borne by Funds Management. Wells Capital Management Incorporated, an affiliate of Funds Management and an indirect wholly owned subsidiary of Wells Fargo, is a subadviser to the Fund and is entitled to receive a fee from Funds Management at an annual rate starting at 0.65% and declining to 0.45% as the average daily net assets of the Fund increase. Wells Capital Management Singapore, a separately identifiable department of Wells Fargo Bank, N.A. and an indirect wholly owned subsidiary of Wells Fargo, is also a subadviser to the Fund. Out of its fees, WellsCap pays Wells Capital Management Singapore a fee for its services as subadviser at an annual rate starting at 0.25% and declining to 0.15% as the average daily net assets of the Fund increase.
Administration and transfer agent fees
The Trust has entered into an administration agreement with Funds Management. Under this agreement, for providing administrative services, which includes paying fees and expenses for services provided by the transfer agent, sub-transfer agents, omnibus account servicers and record-keepers, Funds Management is entitled to receive from the Fund an annual fund level administration fee starting at 0.05% and declining to 0.03% as the average daily net assets of the Fund increase and a class level administration fee which is calculated based on the average daily net assets of each class as follows:
| | | | |
| | | Class level
administration fee | |
Class A, Class C | | | 0.26 | % |
Administrator Class | | | 0.10 | |
Institutional Class | | | 0.08 | |
Funds Management has contractually waived and/or reimbursed advisory and administration fees to the extent necessary to maintain certain net operating expense ratios for the Fund. Waiver of fees and/or reimbursement of expenses by Funds Management were made first from fund level expenses on a proportionate basis and then from class specific expenses. Funds Management has committed through February 28, 2015, to waive fees and/or reimburse expenses to the extent necessary to cap the Fund’s expenses at 1.65% for Class A shares, 2.40% for Class C shares, 1.45% for Administrator Class shares, and 1.25% for Institutional Class shares.
Distribution fees
The Trust has adopted a Distribution Plan for Class C shares of the Fund pursuant to Rule 12b-1 under the 1940 Act. Distribution fees are charged to Class C shares and paid to Wells Fargo Funds Distributor, LLC, the principal underwriter, at an annual rate of 0.75% of the average daily net assets of Class C shares.
For the six months ended April 30, 2014, Wells Fargo Funds Distributor, LLC received $6,720 from the sale of Class A shares.
Shareholder servicing fees
The Trust has entered into contracts with one or more shareholder servicing agents, whereby Class A, Class C, and Administrator Class of the Fund is charged a fee at an annual rate of 0.25% of the average daily net assets of each respective class.
A portion of these total shareholder servicing fees were paid to affiliates of Wells Fargo.
5. INVESTMENT PORTFOLIO TRANSACTIONS
Purchases and sales of investments, excluding U.S. government obligations (if any) and short-term securities, for the six months ended April 30, 2014 were $48,687,084 and $18,047,183, respectively.
| | | | | | |
| Notes to financial statements (unaudited) | | Wells Fargo Advantage Emerging Markets Equity Income Fund | | | 23 | |
6. BANK BORROWINGS
The Trust (excluding the money market funds and certain other funds in the Trust) and Wells Fargo Variable Trust are parties to a $150,000,000 revolving credit agreement with State Street Bank and Trust Company, whereby the Fund is permitted to use bank borrowings for temporary or emergency purposes, such as to fund shareholder redemption requests. Interest under the credit agreement is charged to the Fund based on a borrowing rate equal to the higher of the Federal Funds rate in effect on that day plus 1.25% or the overnight LIBOR rate in effect on that day plus 1.25%. In addition, an annual commitment fee equal to 0.10% of the unused balance is allocated to each participating fund. For the six months ended April 30, 2014, the Fund paid $15 in commitment fees.
For the six months ended April 30, 2014, there were no borrowings by the Fund under the agreement.
7. INDEMNIFICATION
Under the Trust’s organizational documents, the officers and Trustees are indemnified against certain liabilities that may arise out of performance of their duties to the Trust. Additionally, in the normal course of business, the Trust may enter into contracts with service providers that contain a variety of indemnification clauses. The Trust’s maximum exposure under these arrangements is dependent on future claims that may be made against the Fund and, therefore, cannot be estimated.
8. SUBSEQUENT DISTRIBUTIONS
On May 23, 2014, the Fund declared distributions from net investment income to shareholders of record on May 22, 2014. The per share amounts payable on May 27, 2014, were as follows:
| | | | |
| | | Net
investment
income | |
Class A | | | $0.03878 | |
Class C | | | 0.03249 | |
Administrator Class | | | 0.04045 | |
Institutional Class | | | 0.04238 | |
On June 24, 2014, the Fund declared distributions from net investment income to shareholders of record on June 23, 2014. The per share amounts payable on June 25, 2014, were as follows:
| | | | |
| | | Net
investment
income | |
Class A | | | $0.04005 | |
Class C | | | 0.03276 | |
Administrator Class | | | 0.04182 | |
Institutional Class | | | 0.04412 | |
These distributions are not reflected in the accompanying financial statements. The final determination of the source of all distributions is subject to change and made after the Fund’s tax year-end.
| | | | |
| 24 | | Wells Fargo Advantage Emerging Markets Equity Income Fund | | Other information (unaudited) |
TAX INFORMATION
Pursuant to Section 853 of the Internal Revenue Code, the following amounts were designated as foreign taxes paid for the fiscal year ended October 31, 2013. These amounts may be less than the actual foreign taxes paid for financial statement purposes. Foreign taxes paid or withheld should be included in taxable income with an offsetting deduction from gross income or as a credit for taxes paid to foreign governments. None of the income was derived from ineligible foreign sources as defined under Section 901(j) of the Internal Revenue Code.
| | | | |
Creditable foreign taxes paid | | Per share amount | | Foreign income as % of ordinary income distributions |
| $64,002 | | $0.0249 | | 47.62% |
PROXY VOTING INFORMATION
A description of the policies and procedures that the Fund uses to determine how to vote proxies relating to portfolio securities is available without charge, upon request, by calling 1-800-222-8222, visiting our website at wellsfargoadvantagefunds.com, or visiting the SEC website at sec.gov. Information regarding how the Fund voted proxies relating to portfolio securities during the most recent 12-month period ended June 30 is available without charge on the Fund’s website at wellsfargoadvantagefunds.com or by visiting the SEC website at sec.gov.
PORTFOLIO HOLDINGS INFORMATION
The complete portfolio holdings for the Fund are publicly available on the Fund’s website (wellsfargoadvantagefunds.com) on a monthly, 30-day or more delayed basis. In addition, top ten holdings information for the Fund is publicly available on the Fund’s website on a monthly, seven-day or more delayed basis. The Fund files its complete schedule of portfolio holdings with the SEC for the first and third quarters of each fiscal year on Form N-Q, which is available without charge by visiting the SEC website at sec.gov. In addition, the Fund’s Form N-Q may be reviewed and copied at the SEC’s Public Reference Room in Washington, DC, and at regional offices in New York City, at 233 Broadway, and in Chicago, at 175 West Jackson Boulevard, Suite 900. Information about the Public Reference Room may be obtained by calling 1-800-SEC-0330.
| | | | | | |
| Other information (unaudited) | | Wells Fargo Advantage Emerging Markets Equity Income Fund | | | 25 | |
BOARD OF TRUSTEES AND OFFICERS
Each of the Trustees and Officers1 listed in the table below acts in identical capacities for each fund in the Wells Fargo Advantage family of funds, which consists of 132 mutual funds comprising the Wells Fargo Funds Trust, Wells Fargo Variable Trust, Wells Fargo Master Trust and four closed-end funds (collectively the “Fund Complex”). This table should be read in conjunction with the Prospectus and the Statement of Additional Information2. All of the Trustees are also Members of the Audit and Governance Committees of each Trust in the Fund Complex. The mailing address of each Trustee and Officer is 525 Market Street, 12th Floor, San Francisco, CA 94105. Each Trustee and Officer serves an indefinite term, however, each Trustee serves such term until reaching the mandatory retirement age established by the Trustees.
Independent Trustees
| | | | | | |
Name and year of birth | | Position held and length of service* | | Principal occupations during past five years | | Other directorships during past five years |
Peter G. Gordon (Born 1942) | | Trustee, since 1998; Chairman, since 2005 | | Co-Founder, Retired Chairman, President and CEO of Crystal Geyser Water Company. Trustee Emeritus, Colby College. | | Asset Allocation Trust |
Isaiah Harris, Jr. (Born 1952) | | Trustee, since 2009 | | Retired. Prior thereto, President and CEO of BellSouth Advertising and Publishing Corp. from 2005 to 2007, President and CEO of BellSouth Enterprises from 2004 to 2005 and President of BellSouth Consumer Services from 2000 to 2003. Emeritus member of the Iowa State University Foundation Board of Governors. Emeritus Member of the Advisory Board of Iowa State University School of Business. Advisory Board Member, Palm Harbor Academy (charter school). Mr. Harris is a certified public accountant. | | CIGNA Corporation; Deluxe Corporation; Asset Allocation Trust |
Judith M. Johnson (Born 1949) | | Trustee, since 2008; Audit Committee Chairman, since 2008 | | Retired. Prior thereto, Chief Executive Officer and Chief Investment Officer of Minneapolis Employees Retirement Fund from 1996 to 2008. Ms. Johnson is an attorney, certified public accountant and a certified managerial accountant. | | Asset Allocation Trust |
Leroy Keith, Jr. (Born 1939) | | Trustee, since 2010 | | Chairman, Bloc Global Services (development and construction). Trustee of the Evergreen Funds from 1983 to 2010. Former Managing Director, Almanac Capital Management (commodities firm), former Partner, Stonington Partners, Inc. (private equity fund), former Director, Obagi Medical Products Co. and former Director, Lincoln Educational Services. | | Trustee, Virtus Fund Complex (consisting of 50 portfolios as of 12/16/2013); Asset Allocation Trust |
David F. Larcker (Born 1950) | | Trustee, since 2009 | | James Irvin Miller Professor of Accounting at the Graduate School of Business, Stanford University, Morgan Stanley Director of the Center for Leadership Development and Research and Senior Faculty of The Rock Center for Corporate Governance since 2006. From 2005 to 2008, Professor of Accounting at the Graduate School of Business, Stanford University. Prior thereto, Ernst & Young Professor of Accounting at The Wharton School, University of Pennsylvania from 1985 to 2005. | | Asset Allocation Trust |
Olivia S. Mitchell (Born 1953) | | Trustee, since 2006 | | International Foundation of Employee Benefit Plans Professor, Wharton School of the University of Pennsylvania since 1993. Director of Wharton’s Pension Research Council and Boettner Center on Pensions & Retirement Research, and Research Associate at the National Bureau of Economic Research. Previously, Cornell University Professor from 1978 to 1993. | | Asset Allocation Trust |
Timothy J. Penny (Born 1951) | | Trustee, since 1996 | | President and CEO of Southern Minnesota Initiative Foundation, a non-profit organization, since 2007 and Senior Fellow at the Humphrey Institute Policy Forum at the University of Minnesota since 1995. Member of the Board of Trustees of NorthStar Education Finance, Inc., a non-profit organization, since 2007. | | Asset Allocation Trust |
| | | | |
| 26 | | Wells Fargo Advantage Emerging Markets Equity Income Fund | | Other information (unaudited) |
| | | | | | |
Name and year of birth | | Position held and length of service* | | Principal occupations during past five years | | Other directorships during past five years |
Michael S. Scofield (Born 1943) | | Trustee, since 2010 | | Served on the Investment Company Institute’s Board of Governors and Executive Committee from 2008-2011 as well the Governing Council of the Independent Directors Council from 2006-2011 and the Independent Directors Council Executive Committee from 2008-2011. Chairman of the IDC from 2008-2010. Institutional Investor (Fund Directions) Trustee of Year in 2007. Trustee of the Evergreen Funds (and its predecessors) from 1984 to 2010. Chairman of the Evergreen Funds from 2000-2010. Former Trustee of the Mentor Funds. Retired Attorney, Law Offices of Michael S. Scofield. | | Asset Allocation Trust |
Donald C. Willeke (Born 1940) | | Trustee, since 1996 | | Principal of the law firm of Willeke & Daniels. General Counsel of the Minneapolis Employees Retirement Fund from 1984 until its consolidation into the Minnesota Public Employees Retirement Association on June 30, 2010. Director and Vice Chair of The Tree Trust (non-profit corporation). Director of the American Chestnut Foundation (non-profit corporation). | | Asset Allocation Trust |
| * | Length of service dates reflect the Trustee’s commencement of service with the Trust’s predecessor entities, where applicable. |
Officers
| | | | | | |
Name and year of birth | | Position held and length of service | | Principal occupations during past five years | | |
Karla M. Rabusch (Born 1959) | | President, since 2003 | | Executive Vice President of Wells Fargo Bank, N.A. and President of Wells Fargo Funds Management, LLC since 2003. | | |
Jeremy DePalma1 (Born 1974) | | Treasurer, since 2012 | | Senior Vice President of Wells Fargo Funds Management, LLC since 2009. Senior Vice President of Evergreen Investment Management Company, LLC from 2008 to 2010. Vice President, Evergreen Investment Services, Inc. from 2004 to 2007. Head of the Fund Reporting and Control Team within Fund Administration from 2005 to 2010. | | |
C. David Messman (Born 1960) | | Secretary, since 2000; Chief Legal Officer, since 2003 | | Senior Vice President and Secretary of Wells Fargo Funds Management, LLC since 2001. Vice President and Managing Counsel of Wells Fargo Bank, N.A. since 1996. | | |
Debra Ann Early (Born 1964) | | Chief Compliance Officer, since 2007 | | Chief Compliance Officer of Wells Fargo Funds Management, LLC since 2007. Chief Compliance Officer of Parnassus Investments from 2005 to 2007. Chief Financial Officer of Parnassus Investments from 2004 to 2007. | | |
David Berardi (Born 1975) | | Assistant Treasurer, since 2009 | | Vice President of Wells Fargo Funds Management, LLC since 2009. Vice President of Evergreen Investment Management Company, LLC from 2008 to 2010. Assistant Vice President of Evergreen Investment Services, Inc. from 2004 to 2008. Manager of Fund Reporting and Control for Evergreen Investment Management Company, LLC from 2004 to 2010. | | |
| 1. | Jeremy DePalma acts as Treasurer of 59 funds and Assistant Treasurer of 73 funds in the Fund Complex. |
| 2. | The Statement of Additional Information includes additional information about the Trustees and is available, without charge, upon request, by calling 1-800-222-8222 or by visiting the website at wellsfargoadvantagefunds.com. |
| | | | | | |
| Other information (unaudited) | | Wells Fargo Advantage Emerging Markets Equity Income Fund | | | 27 | |
BOARD CONSIDERATION OF INVESTMENT ADVISORY AND SUB-ADVISORY AGREEMENTS:
Under Section 15 of the Investment Company Act of 1940 (the “1940 Act”), the Board of Trustees (the “Board”) of Wells Fargo Funds Trust (the “Trust”), all the members of which have no direct or indirect interest in the investment advisory and sub-advisory agreements and are not “interested persons” of the Trust, as defined in the 1940 Act (the “Independent Trustees”), must determine whether to approve the continuation of the Trust’s investment advisory and sub-advisory agreements. In this regard, at an in-person meeting held on March 27-28, 2014 (the “Meeting”), the Board reviewed: (i) an investment advisory agreement with Wells Fargo Funds Management, LLC (“Funds Management”) for Wells Fargo Advantage Emerging Markets Equity Income Fund (the “Fund”), (ii) an investment sub-advisory agreement with Wells Capital Management Incorporated (“WellsCap”), an affiliate of Funds Management, for the Fund, and (iii) an investment sub-advisory agreement with Wells Capital Management Singapore (“WellsCap Singapore”), an affiliate of Funds Management, for the Fund. The investment advisory agreement with Funds Management and the investment sub-advisory agreements with WellsCap and WellsCap Singapore (the “Sub-Advisers”) are collectively referred to as the “Advisory Agreements.”
At the Meeting, the Board considered the factors and reached the conclusions described below relating to the selection of Funds Management and the Sub-Advisers and the continuation of the Advisory Agreements. Prior to the Meeting, the Trustees conferred extensively among themselves and with representatives of Funds Management about these matters. Also, the Board has adopted a team-based approach, with each team consisting of a sub-set of Trustees, to assist the full Board in the discharge of its duties in reviewing performance and other matters throughout the year. The Independent Trustees were assisted in their evaluation of the Advisory Agreements by independent legal counsel, from whom they received separate legal advice and with whom they met separately.
In providing information to the Board, Funds Management and the Sub-Advisers were guided by a detailed set of requests for information submitted to them by independent legal counsel on behalf of the Independent Trustees at the start of the Board’s annual contract renewal process earlier in 2014. In considering and approving the Advisory Agreements, the Trustees considered the information they believed relevant, including but not limited to the information discussed below. The Board considered not only the specific information presented in connection with the Meeting, but also the knowledge gained over time through interaction with Funds Management and the Sub-Advisers about various topics. In this regard, the Board reviewed reports of Funds Management at each of its quarterly meetings, which included, among other things, portfolio reviews and performance reports. In addition, the Board and the teams mentioned above confer with portfolio managers at various times throughout the year. The Board did not identify any particular information or consideration that was all-important or controlling, and each individual Trustee may have attributed different weights to various factors.
After its deliberations, the Board unanimously approved the continuation of the Advisory Agreements and determined that the compensation payable to Funds Management and the Sub-Advisers is reasonable. The Board considered the continuation of the Advisory Agreements for the Fund as part of its consideration of the continuation of advisory agreements for funds across the complex, but its approvals were made on a fund-by-fund basis. The following summarizes a number of important, but not necessarily all, factors considered by the Board in support of its approvals.
Nature, extent and quality of services
The Board received and considered various information regarding the nature, extent and quality of services provided to the Fund by Funds Management and the Sub-Advisers under the Advisory Agreements. This information included, among other things, a summary of the background and experience of senior management of Funds Management, and the qualifications, background, tenure and responsibilities of each of the portfolio managers primarily responsible for the day-to-day portfolio management of the Fund.
The Board evaluated the ability of Funds Management and the Sub-Advisers to attract and retain qualified investment professionals, including research, advisory and supervisory personnel. The Board further considered the compliance programs and compliance records of Funds Management and the Sub-Advisers. In addition, the Board took into account the full range of services provided to the Fund by Funds Management and its affiliates.
Fund performance and expenses
The Board considered the performance results for the Fund over various time periods ended December 31, 2013. The Board also considered these results in comparison to the performance of funds in a universe that was determined by Lipper Inc. (“Lipper”) to be similar to the Fund (the “Universe”), and in comparison to the Fund’s benchmark index and to other comparative data. Lipper is an independent provider of investment company data. The Board received a description of the methodology used by Lipper to select the mutual funds in the performance Universe. The Board noted
| | | | |
| 28 | | Wells Fargo Advantage Emerging Markets Equity Income Fund | | Other information (unaudited) |
that the performance of the Fund (Administrator Class) was higher than the average performance of the Universe for all periods under review. The Board also noted that the performance of the Fund was higher than its benchmark, the MSCI Emerging Markets Index (Net), for all periods under review.
The Board also received and considered information regarding the Fund’s net operating expense ratios and their various components, including actual management fees (which reflect fee waivers, if any, and include advisory, administration and transfer agent fees), custodian and other non-management fees, Rule 12b-1 and non-Rule 12b-1 service fees and fee waiver and expense reimbursement arrangements. The Board considered these ratios in comparison to the median ratios of funds in class-specific expense groups that were determined by Lipper to be similar to the Fund (the “Groups”). The Board received a description of the methodology used by Lipper to select the mutual funds in the expense Groups and an explanation of year-to-year variations in the funds comprising such expense Groups and their expense ratios. Based on the Lipper reports, the Board noted that the net operating expense ratios of the Fund were lower than the median net operating expense ratios of the expense Groups.
Based on its consideration of the factors and information it deemed relevant, including those described here, the Board concluded that the overall performance and expense structure of the Fund supported the re-approval of the Advisory Agreements.
Investment advisory and sub-advisory fee rates
The Board reviewed and considered the contractual investment advisory fee rates that are payable by the Fund to Funds Management for investment advisory services (the “Advisory Agreement Rates”), both on a stand-alone basis and on a combined basis with the Fund’s fund-level and class-level contractual administration fee rates (the “Management Rates”). The Board noted that the administration fees payable to Funds Management include transfer agency and sub-transfer agency costs. The Board also reviewed and considered the contractual investment sub-advisory fee rates that are payable by Funds Management to WellsCap and by WellsCap to WellsCap Singapore for investment sub-advisory services (the “Sub-Advisory Agreement Rates”).
Among other information reviewed by the Board was a comparison of the Management Rates of the Fund with those of other funds in the expense Groups at a common asset level. The Board noted that the Management Rates of the Fund were in range of the average rates for the Fund’s expense Groups for all share classes except the Administrator Class, the Management Rate of which was higher than the average rate of its expense Group. However, the Board noted that the net operating expense ratio of the Fund’s Administrator Class was lower than the median net operating expense ratio of its expense Groups. The Board also viewed favorable the agreed-upon revision to the advisory fee schedule for the Fund that adds an additional breakpoint.
The Board also received and considered information about the portion of the total advisory fee that was retained by Funds Management after payment of the fee to the Sub-Advisers for sub-advisory services. In assessing the reasonableness of this amount, the Board received and evaluated information about the nature and extent of responsibilities retained and risks assumed by Funds Management and not delegated to or assumed by the Sub-Advisers, and about Funds Management’s on-going oversight services. However, given the affiliation between Funds Management and the Sub-Advisers, the Board ascribed limited relevance to the allocation of the total advisory fee between them.
The Board also received and considered information about the nature and extent of services offered and fee rates charged by Funds Management and the Sub-Advisers to other types of clients with investment strategies similar to those of the Fund. In this regard, the Board received information about the significantly greater scope of services, and compliance, reporting and other legal burdens and risks of managing mutual funds compared with those associated with managing assets of non-mutual fund clients such as collective funds or institutional separate accounts.
Based on its consideration of the factors and information it deemed relevant, including those described here, the Board determined that the Advisory Agreement Rates and the Sub-Advisory Agreement Rates were reasonable in light of the services covered by the Advisory Agreements.
Profitability
The Board received and considered information concerning the profitability of Funds Management, as well as the profitability of Wells Fargo as a whole, from providing services to the Fund and the fund family as a whole. The Board did not receive or consider to be necessary separate profitability information with respect to the Sub-Advisers, because their profitability information was subsumed in the collective Wells Fargo profitability analysis.
Funds Management explained the methodologies and estimates that it used in calculating profitability. Among other things, the Board noted that the levels of profitability reported on a fund-by-fund basis varied widely, depending on
| | | | | | |
| Other information (unaudited) | | Wells Fargo Advantage Emerging Markets Equity Income Fund | | | 29 | |
factors such as the size and type of fund. Based on its review, the Board did not deem the profits reported by Funds Management to be at a level that would prevent it from approving the continuation of the Advisory Agreements.
Economies of scale
With respect to possible economies of scale, the Board noted the existence of breakpoints in the Fund’s advisory fee and administration fee structure, which operate generally to reduce the Fund’s expense ratios as the Fund grows in size. It considered that, for a small fund or a fund that shrinks in size, breakpoints conversely can result in higher fee levels. The Board took into account the agreed-upon revision to the advisory fee schedule for the Fund that adds an additional breakpoint. The Board also considered that fee waiver and expense reimbursement arrangements and competitive fee rates at the outset are means of sharing potential economies of scale with shareholders of the Fund and the fund family as a whole. The Board considered Funds Management’s view that any analyses of potential economies of scale in managing a particular fund are inherently limited in light of the joint and common costs and investments that Funds Management incurs across the fund family as a whole.
The Board concluded that the Fund’s fee and expense arrangements, including contractual breakpoints, constituted a reasonable approach to sharing potential economies of scale with the Fund and its shareholders.
Other benefits to Funds Management and the Sub-Advisers
The Board received and considered information regarding potential “fall-out” or ancillary benefits received by Funds Management and its affiliates, including the Sub-Advisers, as a result of their relationships with the Fund. Ancillary benefits could include, among others, benefits directly attributable to other relationships with the Fund and benefits potentially derived from an increase in Funds Management’s and the Sub-Advisers’ business as a result of their relationships with the Fund. The Board noted that various affiliates of Funds Management may receive distribution-related fees, shareholder servicing payments and sub-transfer agency fees in respect of shares sold or held through them and services provided.
The Board also reviewed information about soft dollar credits earned and utilized by the Sub-Advisers, fees earned by Funds Management and the Sub-Advisers from managing a private investment vehicle for the fund family’s securities lending collateral and commissions earned by an affiliated broker from portfolio transactions.
Based on its consideration of the factors and information it deemed relevant, including those described here, the Board did not find that any ancillary benefits received by Funds Management and its affiliates, including the Sub-Advisers, were unreasonable.
Conclusion
After considering the above-described factors and based on its deliberations and its evaluation of the information described above, the Board unanimously approved the continuation of the Advisory Agreements for an additional one-year period and determined that the compensation payable to Funds Management and the Sub-Advisers is reasonable.
| | | | |
| 30 | | Wells Fargo Advantage Emerging Markets Equity Income Fund | | List of abbreviations |
The following is a list of common abbreviations for terms and entities that may have appeared in this report.
| ACA | — ACA Financial Guaranty Corporation |
| ADR | — American depositary receipt |
| ADS | — American depositary shares |
| AGC | — Assured Guaranty Corporation |
| AGM | — Assured Guaranty Municipal |
| Ambac | — Ambac Financial Group Incorporated |
| AMT | — Alternative minimum tax |
| BAN | — Bond anticipation notes |
| BHAC | — Berkshire Hathaway Assurance Corporation |
| CAB | — Capital appreciation bond |
| CCAB | — Convertible capital appreciation bond |
| CDA | — Community Development Authority |
| CDO | — Collateralized debt obligation |
| DRIVER | — Derivative inverse tax-exempt receipts |
| DW&P | — Department of Water & Power |
| DWR | — Department of Water Resources |
| ECFA | — Educational & Cultural Facilities Authority |
| EDA | — Economic Development Authority |
| EDFA | — Economic Development Finance Authority |
| ETF | — Exchange-traded fund |
| FDIC | — Federal Deposit Insurance Corporation |
| FFCB | — Federal Farm Credit Banks |
| FGIC | — Financial Guaranty Insurance Corporation |
| FHA | — Federal Housing Administration |
| FHLB | — Federal Home Loan Bank |
| FHLMC | — Federal Home Loan Mortgage Corporation |
| FICO | — The Financing Corporation |
| FNMA | — Federal National Mortgage Association |
| GDR | — Global depositary receipt |
| GNMA | — Government National Mortgage Association |
| HCFR | — Healthcare facilities revenue |
| HEFA | — Health & Educational Facilities Authority |
| HEFAR | — Higher education facilities authority revenue |
| HFA | — Housing Finance Authority |
| HFFA | — Health Facilities Financing Authority |
| HUD | — Department of Housing and Urban Development |
| IDA | — Industrial Development Authority |
| IDAG | — Industrial Development Agency |
| KRW | — Republic of Korea won |
| LIBOR | — London Interbank Offered Rate |
| LLC | — Limited liability company |
| LLLP | — Limited liability limited partnership |
| LLP | — Limited liability partnership |
| MBIA | — Municipal Bond Insurance Association |
| MFHR | — Multifamily housing revenue |
| MSTR | — Municipal securities trust receipts |
| MUD | — Municipal Utility District |
| National | — National Public Finance Guarantee Corporation |
| PCFA | — Pollution Control Financing Authority |
| PCL | — Public Company Limited |
| PCR | — Pollution control revenue |
| PFA | — Public Finance Authority |
| PFFA | — Public Facilities Financing Authority |
| PFOTER | — Puttable floating option tax-exempt receipts |
| plc | — Public limited company |
| PUTTER | — Puttable tax-exempt receipts |
| R&D | — Research & development |
| Radian | — Radian Asset Assurance |
| RAN | — Revenue anticipation notes |
| RDA | — Redevelopment Authority |
| RDFA | — Redevelopment Finance Authority |
| REIT | — Real estate investment trust |
| ROC | — Reset option certificates |
| SAVRS | — Select auction variable rate securities |
| SBA | — Small Business Authority |
| SFHR | — Single-family housing revenue |
| SFMR | — Single-family mortgage revenue |
| SPA | — Standby purchase agreement |
| SPDR | — Standard & Poor’s Depositary Receipts |
| STRIPS | — Separate trading of registered interest and principal securities |
| TAN | — Tax anticipation notes |
| TIPS | — Treasury inflation-protected securities |
| TRAN | — Tax revenue anticipation notes |
| TTFA | — Transportation Trust Fund Authority |
| TVA | — Tennessee Valley Authority |
This page is intentionally left blank.
This page is intentionally left blank.


For more information
More information about Wells Fargo Advantage Funds is available free upon request. To obtain literature, please write, email, visit the Fund’s website, or call:
Wells Fargo Advantage Funds
P.O. Box 8266
Boston, MA 02266-8266
Email: wfaf@wellsfargo.com
Website: wellsfargoadvantagefunds.com
Individual investors: 1-800-222-8222
Retail investment professionals: 1-888-877-9275
Institutional investment professionals: 1-866-765-0778
This report and the financial statements contained herein are submitted for the general information of the shareholders of Wells Fargo Advantage Funds. If this report is used for promotional purposes, distribution of the report must be accompanied or preceded by a current prospectus. Before investing, please consider the investment objectives, risks, charges, and expenses of the investment. For a current prospectus and, if available, a summary prospectus, containing this information, call 1-800-222-8222 or visit the Fund’s website at wellsfargoadvantagefunds.com. Read the prospectus carefully before you invest or send money.
Wells Fargo Funds Management, LLC, a wholly owned subsidiary of Wells Fargo & Company, provides investment advisory and administrative services for Wells Fargo Advantage Funds. Other affiliates of Wells Fargo & Company provide subadvisory and other services for the Funds. The Funds are distributed by Wells Fargo Funds Distributor, LLC, Member FINRA/SIPC, an affiliate of Wells Fargo & Company.
NOT FDIC INSURED ¡ NO BANK GUARANTEE ¡ MAY LOSE VALUE
© 2014 Wells Fargo Funds Management, LLC. All rights reserved.
| | |
 | | 225168 06-14 SA262/SAR262 04-14 |

Wells Fargo Advantage
Emerging Markets Equity Select Fund

Semi-Annual Report
April 30, 2014

Reduce clutter. Save trees.
Sign up for electronic delivery of prospectuses and shareholder reports at wellsfargo.com/advantagedelivery
Contents
The views expressed and any forward-looking statements are as of April 30, 2014, unless otherwise noted, and are those of the Fund managers and/or Wells Fargo Funds Management, LLC. Discussions of individual securities, or the markets generally, or any Wells Fargo Advantage Fund are not intended as individual recommendations. Future events or results may vary significantly from those expressed in any forward-looking statements; the views expressed are subject to change at any time in response to changing circumstances in the market. Wells Fargo Funds Management, LLC and the Fund disclaim any obligation to publicly update or revise any views expressed or forward-looking statements.
NOT FDIC INSURED ¡ NO BANK GUARANTEE ¡ MAY LOSE VALUE
| | | | |
| 2 | | Wells Fargo Advantage Emerging Markets Equity Select Fund | | Letter to shareholders (unaudited) |

Karla M. Rabusch
President
Wells Fargo Advantage Funds
European markets continued to benefit from the European Central Bank’s (ECB’s) willingness to maintain low interest rates.
Some of the markets that had declined the most during the European debt crisis—such as Italy and Ireland—benefited the most from this stable economic environment, but larger markets such as France and Germany also posted gains.
Dear Valued Shareholder:
We are pleased to provide you with the first shareholder report for the Wells Fargo Advantage Emerging Markets Equity Select Fund covering the period since commencement of operations on November 29, 2013 through April 30, 2014. The period was marked by growing concern about an economic slowdown in China and heightened geopolitical uncertainty as the U.S. and Europe confronted Russia over Ukraine. The environment created a headwind for many emerging markets, even as continued economic recovery in Europe helped most developed stock markets end the period with gains.
Major central banks continued to provide stimulus.
Major central banks continued to inject liquidity into global banks and markets through various quantitative easing policies. The U.S. Federal Reserve (Fed) remained a major source of liquidity for market participants around the world. Throughout the reporting period, the Federal Open Market Committee (FOMC)—the Fed’s monetary policymaking body—kept its key interest rate near zero in order to support the economy and the financial system. At the beginning of the reporting period, the FOMC was still making open-ended purchases of $40 billion per month in mortgage-backed securities to support the housing market and was purchasing $45 billion per month in long-term U.S. Treasuries. However, in mid-December 2013, the FOMC announced that it would reduce (or taper) its bond-buying program by $10 billion per month beginning in January 2014. Although the tapering was less aggressive than some investors had feared, the removal of liquidity sparked a sell-off in emerging markets stocks and currencies as investors sold higher-risk assets.
European markets continued to benefit from the European Central Bank’s (ECB’s) willingness to maintain low interest rates. In November 2013, the ECB cut its key rate to a historic low of 0.25%. The ECB’s actions helped support moderate year-over-year gross domestic product (GDP) growth in the eurozone.
Most developed regions gained, but emerging and developed Asian markets lagged.
For the five-month period, the MSCI EAFE Index (Net)1, a proxy for developed markets, returned 3.65%, while the MSCI Emerging Markets Index (Net)2 returned -1.54%.
In Europe, economic data continued to show moderate growth, with reported GDP for the 28 countries in the European Union rising by 0.4% in the fourth quarter of 2013 compared with the previous quarter. The unemployment rate remained high but stable at 10.5% in February and March 2014, while inflation remained consistently below a 1% annual rate. Some of the markets that had declined the most during the European debt crisis—such as Italy and Ireland—benefited the most from this stable economic environment, but larger markets such as France and Germany also posted gains. The ongoing turmoil in Ukraine did result in some stock market volatility, but as of the end of the reporting period, most investors believed that it would not result in war.
| 1. | The Morgan Stanley Capital International Europe, Australasia, and Far East (MSCI EAFE) Index (Net) is an unmanaged group of securities widely regarded by investors to be representations of the stock markets of Europe, Australasia, and the Far East. Calculations for EAFE use net dividends, which reflect the deduction of withholding taxes. You cannot invest directly in an index. Source: MSCI. MSCI makes no express or implied warranties or representations and shall have no liability whatsoever with respect to any MSCI data contained herein. The MSCI data may not be further redistributed or used as a basis for other indexes or any securities or financial products. This report is not approved, reviewed, or produced by MSCI. |
| 2. | The Morgan Stanley Capital International (MSCI) Emerging Markets Index (Net) is a free float-adjusted market-capitalization-weighted index designed to measure the equity market performance in the global emerging markets. The index is currently composed of 21 emerging markets country indexes. You cannot invest directly in an index. |
| | | | | | |
| Letter to shareholders (unaudited) | | Wells Fargo Advantage Emerging Markets Equity Select Fund | | | 3 | |
Asian markets posted mixed results, with political issues accounting for many of those differences. In countries such as India and Indonesia, investors were optimistic that upcoming elections might sweep in more reform-minded governments. By contrast, in Japan, the honeymoon for Prime Minister Shinzō Abe appeared to be ending, with investors worrying that his reforms were not taking effect as quickly as originally hoped.
As for China, many of the country’s economic numbers—such as for national production, retail sales, fixed investment, and manufacturing activity—came in below analyst expectations, causing investor concern. In addition, China’s government has allowed a growing number of defaults in the country’s financial system as part of a long-term plan to rein in credit growth.
Don’t let short-term uncertainty derail long-term investment goals.
Periods of uncertainty can present challenges, but experience has taught us that maintaining long-term investment goals can be an effective way to plan for the future. To help you create a sound strategy based on your personal goals and risk tolerance, Wells Fargo Advantage Funds offers more than 100 mutual funds spanning a wide range of asset classes and investment styles. Although diversification cannot guarantee an investment profit or prevent losses, we believe it can be an effective way to manage investment risk and potentially smooth out overall portfolio performance. We encourage investors to know their investments and to understand that appropriate levels of risk-taking may unlock opportunities.
Thank you for choosing to invest with Wells Fargo Advantage Funds. We appreciate your confidence in us and remain committed to helping you meet your financial needs. For current information about your fund investments, contact your investment professional, visit our website at wellsfargoadvantagefunds.com, or call us directly at 1-800-222-8222. We are available 24 hours a day, 7 days a week.
Sincerely,

Karla M. Rabusch
President
Wells Fargo Advantage Funds
Notice to shareholders
The Fund and Wells Fargo Funds Management, LLC (“Funds Management”) have received an exemptive order from the SEC that permits Funds Management, subject to the approval of the Board of Trustees of the Fund, to select or replace certain subadvisers to manage all or a portion of the Fund’s assets and enter into, amend or terminate a sub-advisory agreement with certain subadvisers without obtaining shareholder approval (“Multi-manager Structure”). The Multi-manager Structure applies to subadvisers that are not affiliated with Funds Management or the Fund, except to the extent that affiliation arises solely because such subadvisers provide sub-advisory services to the Fund (“Non-affiliated Subadvisers”), as well as subadvisers that are indirect or direct wholly-owned subsidiaries of Funds Management or of another company that, indirectly or directly, wholly owns Funds Management (“Wholly-owned Subadvisers”).
Pursuant to the SEC order, Funds Management, with the approval of the Board of Trustees, has the discretion to terminate any subadvisers and allocate and reallocate the Fund’s assets among any other Non-affiliated Subadvisers or Wholly-owned Subadvisers. Funds Management, subject to oversight and supervision by the Board of Trustees, has responsibility to continue to oversee any subadvisers to the Fund and to recommend, for approval by the Board of Trustees, the hiring, termination and replacement of subadvisers for the Fund. In the event that a new subadviser is hired pursuant to the Multi-manager Structure, the Fund is required to provide notice to shareholders within 90 days.
Please contact your investment professional or call us directly at 1-800-222-8222 if you have any questions on this Notice to Shareholders.
| | | | |
| 4 | | Wells Fargo Advantage Emerging Markets Equity Select Fund | | Performance highlights (unaudited) |
Investment objective
The Fund seeks long-term capital appreciation.
Adviser
Wells Fargo Funds Management, LLC
Subadviser
Wells Capital Management Incorporated
Portfolio managers
Yi (Jerry) Zhang, PhD, CFA
Derrick Irwin, CFA
Richard Peck, CFA1
Average annual total returns (%) as of April 30, 2014
| | | | | | | | | | | | |
| | | | | Including sales charge | | Excluding sales charge | | Expense ratios2 (%) | |
| | | Inception date | | Since inception | | Since inception | | Gross | | Net3 | |
| Class A (WEMSX) | | 11-29-2013 | | (7.14) | | (1.48) | | 1.97 | | | 1.65 | |
| Class C (WEMQX) | | 11-29-2013 | | (2.72) | | (1.74) | | 2.72 | | | 2.40 | |
| Class R6 (WEMRX) | | 11-29-2013 | | – | | (1.23) | | 1.49 | | | 1.15 | |
| Administrator Class (WEMEX) | | 11-29-2013 | | – | | (1.36) | | 1.81 | | | 1.45 | |
| Institutional Class (WEMTX) | | 11-29-2013 | | – | | (1.34) | | 1.54 | | | 1.20 | |
| MSCI Emerging Markets Index (Net)4 | | – | | – | | (1.54) | | – | | | – | |
Figures quoted represent past performance, which is no guarantee of future results, and do not reflect taxes that a shareholder may pay on fund distributions or the redemption of fund shares. Investment return and principal value of an investment will fluctuate so that an investor’s shares, when redeemed, may be worth more or less than their original cost. Performance shown without sales charges would be lower if sales charges were reflected. Current performance may be lower or higher than the performance data quoted, which assumes the reinvestment of dividends and capital gains. Current month-end performance is available on the Fund’s website, wellsfargoadvantagefunds.com.
Index returns do not include transaction costs associated with buying and selling securities, any mutual fund fees or expenses, or any taxes. It is not possible to invest directly in an index.
For Class A shares, the maximum front-end sales charge is 5.75%. For Class C shares, the maximum contingent deferred sales charge is 1.00%. Performance including sales charge assumes the sales charge for the corresponding time period. Class R6, Administrator Class, and Institutional Class shares are sold without a front-end sales charge or contingent deferred sales charge.
Stock values fluctuate in response to the activities of individual companies and general market and economic conditions. Foreign investments are especially volatile and can rise or fall dramatically due to differences in the political and economic conditions of the host country. These risks are generally intensified in emerging markets. The use of derivatives may reduce returns and/or increase volatility. Certain investment strategies tend to increase the total risk of an investment (relative to the broader market). The Fund is exposed to regional risk. Consult the Fund’s prospectus for additional information on these and other risks.
Please see footnotes on page 5.
| | | | | | |
| Performance highlights (unaudited) | | Wells Fargo Advantage Emerging Markets Equity Select Fund | | | 5 | |
| | | | |
| Ten largest equity holdings5 (%) as of April 30, 2014 | |
Taiwan Semiconductor Manufacturing Company Limited ADR | | | 4.71 | |
Samsung Electronics Company Limited | | | 4.46 | |
Banco Bradesco SA ADR | | | 2.55 | |
China Mobile Limited | | | 2.30 | |
Fomento Economico Mexicano SAB de CV ADR | | | 2.20 | |
Lojas Americanas SA | | | 1.99 | |
Ambev SA ADR | | | 1.90 | |
Reliance Industries Limited GDR | | | 1.88 | |
China Life Insurance Company Limited | | | 1.77 | |
Wal-Mart de Mexico SAB de CV | | | 1.74 | |
| | | | | | |
| Sector distribution6 as of April 30, 2014 |
|
 |
| 1. | Effective May 2, 2014, Richard Peck became a portfolio manager of the Fund. |
| 2. | Reflects the expense ratios as stated in the most recent prospectuses. The expense ratios shown are subject to change and may differ from the annualized expense ratios shown in the financial highlights of this report. |
| 3. | The Adviser has committed through February 28, 2015, to waive fees and/or reimburse expenses to the extent necessary to cap the Fund’s Total Annual Fund Operating Expenses After Fee Waiver, excluding certain expenses, at the amounts shown. Brokerage commissions, stamp duty fees, interest, taxes, acquired fund fees and expenses, and extraordinary expenses are excluded from the cap. Without this cap, the Fund’s returns would have been lower. |
| 4. | The Morgan Stanley Capital International (MSCI) Emerging Markets Index (Net) is a free float-adjusted market-capitalization-weighted index designed to measure the equity market performance in the global emerging markets. The index is currently composed of 21 emerging markets country indexes. You cannot invest directly in an index. Source: MSCI. MSCI makes no express or implied warranties or representations and shall have no liability whatsoever with respect to any MSCI data contained herein. The MSCI data may not be further redistributed or used as a basis for other indexes or any securities or financial products. This report is not approved, reviewed, or produced by MSCI. |
| 5. | The ten largest equity holdings are calculated based on the value of the securities divided by total net assets of the Fund. Holdings are subject to change and may have changed since the date specified. Top holdings typically include the underlying ordinary shares combined with any depositary receipts. |
| 6. | Sector distribution is subject to change and is calculated based on the total long-term investments of the Fund. |
| | | | |
| 6 | | Wells Fargo Advantage Emerging Markets Equity Select Fund | | Fund expenses (unaudited) |
As a shareholder of the Fund, you incur two types of costs: (1) transaction costs, including sales charges (loads) on purchase payments and contingent deferred sales charges (if any) on redemptions and (2) ongoing costs, including management fees, distribution (12b-1) and/or shareholder service fees, and other Fund expenses. This example is intended to help you understand your ongoing costs (in dollars) of investing in the Fund and to compare these costs with the ongoing costs of investing in other mutual funds.
The example is based on an investment of $1,000 invested at the beginning of the six-month period and held for the entire period from November 1, 2013 to April 30, 2014.
Actual expenses
The “Actual” line of the table below provides information about actual account values and actual expenses. You may use the information in this line, together with the amount you invested, to estimate the expenses that you paid over the period. Simply divide your account value by $1,000 (for example, an $8,600 account value divided by $1,000 = 8.6), then multiply the result by the number in the “Actual” line under the heading entitled “Expenses paid during period” for your applicable class of shares to estimate the expenses you paid on your account during this period.
Hypothetical example for comparison purposes
The “Hypothetical” line of the table below provides information about hypothetical account values and hypothetical expenses based on the Fund’s actual expense ratio and an assumed rate of return of 5% per year before expenses, which is not the Fund’s actual return. The hypothetical account values and expenses may not be used to estimate the actual ending account balance or expenses you paid for the period. You may use this information to compare the ongoing costs of investing in the Fund and other funds. To do so, compare this 5% hypothetical example with the 5% hypothetical examples that appear in the shareholder reports of the other funds.
Please note that the expenses shown in the table are meant to highlight your ongoing costs only and do not reflect any transactional costs, such as sales charges (loads) and contingent deferred sales charges. Therefore, the “Hypothetical” line of the table is useful in comparing ongoing costs only and will not help you determine the relative total costs of owning different funds. In addition, if these transactional costs were included, your costs would have been higher.
| | | | | | | | | | | | | | | | |
| | | Beginning
account value
11-1-2013 | | | Ending
account value
4-30-2014 | | | Expenses
paid during
the period1 | | | Net annualized
expense ratio | |
Class A | | | | | | | | | | | | | | | | |
Actual | | $ | 1,000.00 | | | $ | 985.24 | | | $ | 8.12 | | | | 1.65 | % |
Hypothetical (5% return before expenses) | | $ | 1,000.00 | | | $ | 1,016.61 | | | $ | 8.25 | | | | 1.65 | % |
Class C | | | | | | | | | | | | | | | | |
Actual | | $ | 1,000.00 | | | $ | 982.64 | | | $ | 11.80 | | | | 2.40 | % |
Hypothetical (5% return before expenses) | | $ | 1,000.00 | | | $ | 1,012.89 | | | $ | 11.98 | | | | 2.40 | % |
Class R6 | | | | | | | | | | | | | | | | |
Actual | | $ | 1,000.00 | | | $ | 987.69 | | | $ | 5.67 | | | | 1.15 | % |
Hypothetical (5% return before expenses) | | $ | 1,000.00 | | | $ | 1,019.09 | | | $ | 5.76 | | | | 1.15 | % |
Administrator Class | | | | | | | | | | | | | | | | |
Actual | | $ | 1,000.00 | | | $ | 986.44 | | | $ | 7.14 | | | | 1.45 | % |
Hypothetical (5% return before expenses) | | $ | 1,000.00 | | | $ | 1,017.60 | | | $ | 7.25 | | | | 1.45 | % |
Institutional Class | | | | | | | | | | | | | | | | |
Actual | | $ | 1,000.00 | | | $ | 986.65 | | | $ | 5.91 | | | | 1.20 | % |
Hypothetical (5% return before expenses) | | $ | 1,000.00 | | | $ | 1,018.84 | | | $ | 6.01 | | | | 1.20 | % |
| 1. | Expenses paid is equal to the annualized expense ratio of each class multiplied by the average account value over the period, multiplied by the number of days in the most recent fiscal half-year divided by the number of days in the fiscal year (to reflect the one-half-year period). |
| | | | | | |
| Portfolio of investments—April 30, 2014 (unaudited) | | Wells Fargo Advantage Emerging Markets Equity Select Fund | | | 7 | |
| | | | | | | | | | | | |
| Security name | | | | | | Shares | | | Value | |
| | | | | | | | | | | | |
| | | | |
Common Stocks: 87.51% | | | | | | | | | | | | |
| | | | |
| Argentina: 0.32% | | | | | | | | | | | | |
MercadoLibre Incorporated (Information Technology, Internet Software & Services) | | | | | | | 170 | | | $ | 15,856 | |
| | | | | | | | | | | | |
| | | | |
| Brazil: 12.33% | | | | | | | | | | | | |
All America Latina Logistica SA (Industrials, Road & Rail) | | | | | | | 13,500 | | | | 53,461 | |
Ambev SA ADR (Consumer Staples, Beverages) | | | | | | | 13,000 | | | | 94,250 | |
Banco Bradesco SA ADR (Financials, Banks) | | | | | | | 8,500 | | | | 126,395 | |
BM&F Bovespa SA (Financials, Diversified Financial Services) | | | | | | | 11,000 | | | | 56,239 | |
BRF Brasil Foods SA ADR (Consumer Staples, Food Products) | | | | | | | 1,300 | | | | 29,380 | |
CCR SA (Industrials, Transportation Infrastructure) | | | | | | | 2,000 | | | | 15,652 | |
CETIP SA (Financials, Capital Markets) | | | | | | | 4,500 | | | | 57,336 | |
Lojas Renner SA (Consumer Discretionary, Multiline Retail) | | | | | | | 1,500 | | | | 44,131 | |
Multiplan Empreendimentos Imobiliarios SA (Financials, Real Estate Management & Development) | | | | | | | 1,600 | | | | 35,362 | |
Petroleo Brasileiro SA ADR (Energy, Oil, Gas & Consumable Fuels) | | | | | | | 5,000 | | | | 69,400 | |
Vale SA ADR (Materials, Metals & Mining) | | | | | | | 2,200 | | | | 29,084 | |
| | | | |
| | | | | | | | | | | 610,690 | |
| | | | | | | | | | | | |
| | | | |
| Chile: 1.52% | | | | | | | | | | | | |
Banco Santander Chile SA ADR (Financials, Banks) | | | | | | | 1,700 | | | | 41,259 | |
SACI Falabella (Consumer Discretionary, Multiline Retail) | | | | | | | 4,000 | | | | 34,027 | |
| | | | |
| | | | | | | | | | | 75,286 | |
| | | | | | | | | | | | |
| | | | |
| China: 15.05% | | | | | | | | | | | | |
Baidu Incorporated ADR (Information Technology, Internet Software & Services) † | | | | | | | 200 | | | | 30,770 | |
China Life Insurance Company Limited (Financials, Insurance) | | | | | | | 34,000 | | | | 87,621 | |
China Mobile Limited (Telecommunication Services, Wireless Telecommunication Services) | | | | | | | 12,000 | | | | 114,073 | |
CNOOC Limited (Energy, Oil, Gas & Consumable Fuels) | | | | | | | 51,000 | | | | 84,332 | |
Ctrip.com International Limited ADR (Consumer Discretionary, Internet & Catalog Retail) † | | | | | | | 1,000 | | | | 46,740 | |
Hengan International Group Company Limited (Consumer Staples, Personal Products) | | | | | | | 5,000 | | | | 52,657 | |
New Oriental Education & Technology Group Incorporated (Consumer Discretionary, Diversified Consumer Services) | | | | | | | 1,900 | | | | 45,980 | |
PetroChina Company Limited (Energy, Oil, Gas & Consumable Fuels) | | | | | | | 30,000 | | | | 34,748 | |
SINA Corporation (Information Technology, Internet Software & Services) † | | | | | | | 1,660 | | | | 79,348 | |
Sun Art Retail Group Limited (Consumer Staples, Food & Staples Retailing) | | | | | | | 26,000 | | | | 33,871 | |
Tingyi Holding Corporation (Consumer Staples, Food Products) | | | | | | | 22,000 | | | | 61,151 | |
Tsingtao Brewery Company Limited (Consumer Staples, Beverages) | | | | | | | 8,000 | | | | 58,249 | |
Weibo Corporation ADR (Information Technology, Internet Software & Services) † | | | | | | | 800 | | | | 15,648 | |
| | | | |
| | | | | | | | | | | 745,188 | |
| | | | | | | | | | | | |
| | | | |
| Colombia: 0.81% | | | | | | | | | | | | |
Bancolombia SA ADR (Financials, Banks) | | | | | | | 700 | | | | 39,851 | |
| | | | | | | | | | | | |
| | | | |
| Hong Kong: 2.61% | | | | | | | | | | | | |
AIA Group Limited (Financials, Insurance) | | | | | | | 13,600 | | | | 65,957 | |
Belle International Holdings Limited (Consumer Discretionary, Specialty Retail) | | | | | | | 61,000 | | | | 63,180 | |
| | | | |
| | | | | | | | | | | 129,137 | |
| | | | | | | | | | | | |
| | | | |
| India: 5.00% | | | | | | | | | | | | |
HDFC Bank Limited ADR (Financials, Banks) | | | | | | | 1,500 | | | | 60,075 | |
ICICI Bank Limited ADR (Financials, Banks) | | | | | | | 1,400 | | | | 59,738 | |
The accompanying notes are an integral part of these financial statements.
| | | | |
| 8 | | Wells Fargo Advantage Emerging Markets Equity Select Fund | | Portfolio of investments—April 30, 2014 (unaudited) |
| | | | | | | | | | | | |
| Security name | | | | | | Shares | | | Value | |
| | | | | | | | | | | | |
| | | | |
| India (continued) | | | | | | | | | | | | |
Infosys Technologies Limited ADR (Information Technology, IT Services) | | | | | | | 650 | | | $ | 34,912 | |
Reliance Industries Limited GDR (Energy, Oil, Gas & Consumable Fuels)144A | | | | | | | 3,000 | | | | 93,000 | |
| | | | |
| | | | | | | | | | | 247,725 | |
| | | | | | | | | | | | |
| | | | |
| Indonesia: 1.97% | | | | | | | | | | | | |
PT Astra International Tbk (Consumer Discretionary, Automobiles) | | | | | | | 40,000 | | | | 25,689 | |
PT Bank Central Asia Tbk (Financials, Banks) | | | | | | | 25,000 | | | | 23,786 | |
PT Matahari Department Store Tbk (Consumer Discretionary, Multiline Retail) † | | | | | | | 10,000 | | | | 12,974 | |
PT Telekomunikasi Indonesia Tbk (Telecommunication Services, Diversified Telecommunication Services) | | | | | | | 180,000 | | | | 35,264 | |
| | | | |
| | | | | | | | | | | 97,713 | |
| | | | | | | | | | | | |
| | | | |
| Malaysia: 1.63% | | | | | | | | | | | | |
Genting Bhd (Consumer Discretionary, Hotels, Restaurants & Leisure) | | | | | | | 11,000 | | | | 33,012 | |
Genting Malaysia Bhd (Consumer Discretionary, Hotels, Restaurants & Leisure) | | | | | | | 19,000 | | | | 24,554 | |
Sime Darby Bhd (Industrials, Industrial Conglomerates) | | | | | | | 8,000 | | | | 23,127 | |
| | | | |
| | | | | | | | | | | 80,693 | |
| | | | | | | | | | | | |
| | | | |
| Mexico: 11.61% | | | | | | | | | | | | |
America Movil SAB de CV ADR (Telecommunication Services, Wireless Telecommunication Services) | | | | | | | 3,800 | | | | 76,304 | |
Cemex SAB de CV ADR (Materials, Construction Materials) † | | | | | | | 5,200 | | | | 65,728 | |
Fibra Uno Administracion SAB de CV (Financials, REITs) | | | | | | | 17,500 | | | | 57,371 | |
Fomento Economico Mexicano SAB de CV ADR (Consumer Staples, Beverages) | | | | | | | 1,200 | | | | 108,924 | |
Grupo Financiero Banorte SAB de CV (Financials, Banks) | | | | | | | 11,000 | | | | 73,057 | |
Grupo Financiero Santander SAB de CV ADR (Financials, Banks) | | | | | | | 2,000 | | | | 23,800 | |
Grupo Sanborns SA de CV (Consumer Discretionary, Multiline Retail) | | | | | | | 5,000 | | | | 8,312 | |
Grupo Televisa SAB ADR (Consumer Discretionary, Media) | | | | | | | 2,300 | | | | 75,463 | |
Wal-Mart de Mexico SAB de CV (Consumer Staples, Food & Staples Retailing) | | | | | | | 34,000 | | | | 86,022 | |
| | | | |
| | | | | | | | | | | 574,981 | |
| | | | | | | | | | | | |
| | | | |
| Peru: 0.45% | | | | | | | | | | | | |
Compania de Minas Buenaventura SA ADR (Materials, Metals & Mining) | | | | | | | 1,700 | | | | 22,100 | |
| | | | | | | | | | | | |
| | | | |
| Philippines: 1.05% | | | | | | | | | | | | |
Ayala Corporation (Financials, Diversified Financial Services) | | | | | | | 1,500 | | | | 20,996 | |
Metropolitan Bank & Trust Company (Financials, Banks) | | | | | | | 6,000 | | | | 11,400 | |
SM Investments Corporation (Industrials, Industrial Conglomerates) | | | | | | | 1,200 | | | | 19,515 | |
| | | | |
| | | | | | | | | | | 51,911 | |
| | | | | | | | | | | | |
| | | | |
| Russia: 4.83% | | | | | | | | | | | | |
Lukoil ADR (Energy, Oil, Gas & Consumable Fuels) | | | | | | | 1,200 | | | | 63,420 | |
Magnit (Consumer Staples, Food & Staples Retailing) (a) | | | | | | | 200 | | | | 39,684 | |
Mobile Telesystems ADR (Telecommunication Services, Wireless Telecommunication Services) | | | | | | | 3,500 | | | | 58,660 | |
Sberbank of Russia ADR (Financials, Banks) | | | | | | | 4,000 | | | | 33,528 | |
Yandex NV Class A (Information Technology, Internet Software & Services) † | | | | | | | 1,650 | | | | 43,725 | |
| | | | |
| | | | | | | | | | | 239,017 | |
| | | | | | | | | | | | |
| | | | |
| South Africa: 5.43% | | | | | | | | | | | | |
AngloGold Ashanti Limited ADR (Materials, Metals & Mining) | | | | | | | 1,500 | | | | 27,150 | |
The accompanying notes are an integral part of these financial statements.
| | | | | | |
| Portfolio of investments—April 30, 2014 (unaudited) | | Wells Fargo Advantage Emerging Markets Equity Select Fund | | | 9 | |
| | | | | | | | | | | | | | |
| Security name | | | | | | | Shares | | | Value | |
| | | | | | | | | | | | | | |
| | | | |
| South Africa (continued) | | | | | | | | | | | | | | |
Impala Platinum Holdings Limited (Materials, Metals & Mining) | | | | | | | | | 1,300 | | | $ | 14,630 | |
MTN Group Limited (Telecommunication Services, Wireless Telecommunication Services) | | | | | | | | | 2,500 | | | | 50,095 | |
Sasol Limited (Energy, Oil, Gas & Consumable Fuels) | | | | | | | | | 400 | | | | 22,443 | |
Shoprite Holdings Limited (Consumer Staples, Food & Staples Retailing) | | | | | | | | | 3,300 | | | | 55,109 | |
Standard Bank Group Limited (Financials, Banks) | | | | | | | | | 2,500 | | | | 32,812 | |
Tiger Brands Limited (Consumer Staples, Food Products) | | | | | | | | | 2,500 | | | | 66,808 | |
| | | | |
| | | | | | | | | | | | | 269,047 | |
| | | | | | | | | | | | | | |
| | | | |
| South Korea: 8.68% | | | | | | | | | | | | | | |
KT Corporation ADR (Telecommunication Services, Diversified Telecommunication Services) | | | | | | | | | 4,000 | | | | 63,640 | |
KT&G Corporation (Consumer Staples, Tobacco) | | | | | | | | | 1,000 | | | | 80,132 | |
Samsung Electronics Company Limited (Information Technology, Semiconductors & Semiconductor Equipment) | | | | | | | | | 170 | | | | 220,952 | |
Samsung Life Insurance Company Limited (Financials, Insurance) | | | | | | | | | 700 | | | | 65,102 | |
| | | | |
| | | | | | | | | | | | | 429,826 | |
| | | | | | | | | | | | | | |
| | | | |
| Taiwan: 7.67% | | | | | | | | | | | | | | |
Far Eastern New Century Corporation (Industrials, Industrial Conglomerates) | | | | | | | | | 21,000 | | | | 21,488 | |
Media Tek Incorporated (Information Technology, Semiconductors & Semiconductor Equipment) | | | | | | | | | 2,000 | | | | 31,260 | |
President Chain Store Corporation (Consumer Staples, Food & Staples Retailing) | | | | | | | | | 4,000 | | | | 29,737 | |
Taiwan Semiconductor Manufacturing Company Limited ADR (Information Technology, Semiconductors & Semiconductor Equipment) | | | | | | | | | 11,600 | | | | 233,160 | |
Uni-President Enterprises Corporation (Consumer Staples, Food Products) | | | | | | | | | 38,000 | | | | 64,302 | |
| | | | |
| | | | | | | | | | | | | 379,947 | |
| | | | | | | | | | | | | | |
| | | | |
| Thailand: 4.43% | | | | | | | | | | | | | | |
Bangkok Bank PCL (Financials, Banks) | | | | | | | | | 5,000 | | | | 29,203 | |
PTT Exploration & Production PCL ADR (Energy, Oil, Gas & Consumable Fuels) | | | | | | | | | 7,000 | | | | 34,502 | |
PTT PCL (Energy, Oil, Gas & Consumable Fuels) | | | | | | | | | 4,000 | | | | 38,566 | |
Siam Commercial Bank PCL (Financials, Banks) | | | | | | | | | 12,000 | | | | 60,445 | |
Thai Beverage PCL (Consumer Staples, Beverages) | | | | | | | | | 120,000 | | | | 56,473 | |
| | | | |
| | | | | | | | | | | | | 219,189 | |
| | | | | | | | | | | | | | |
| | | | |
| Turkey: 0.72% | | | | | | | | | | | | | | |
Anadolu Efes Biracilik Ve Malt Sanayii AS (Consumer Staples, Beverages) | | | | | | | | | 3,000 | | | | 35,874 | |
| | | | | | | | | | | | | | |
| | | | |
| United Kingdom: 1.40% | | | | | | | | | | | | | | |
Standard Chartered plc (Financials, Banks) | | | | | | | | | 3,200 | | | | 69,238 | |
| | | | | | | | | | | | | | |
| | | | |
Total Common Stocks (Cost $4,433,991) | | | | | | | | | | | | | 4,333,269 | |
| | | | | | | | | | | | | | |
| | | | |
| | | Dividend yield | | | | | | | | | |
| Preferred Stocks: 1.99% | | | | | | | | | | | | | | |
| | | | |
| Brazil: 1.99% | | | | | | | | | | | | | | |
Lojas Americanas SA (Consumer Discretionary, Multiline Retail) ± | | | 0.56 | % | | | | | 13,000 | | | | 98,473 | |
| | | | | | | | | | | | | | |
| | | | |
Total Preferred Stocks (Cost $87,412) | | | | | | | | | | | | | 98,473 | |
| | | | | | | | | | | | | | |
The accompanying notes are an integral part of these financial statements.
| | | | |
| 10 | | Wells Fargo Advantage Emerging Markets Equity Select Fund | | Portfolio of investments—April 30, 2014 (unaudited) |
| | | | | | | | | | | | | | |
| Security name | | | | | | | Shares | | | Value | |
| | | | | | | | | | | | | | |
| | | | |
Investment Companies: 2.87% | | | | | | | | | | | | | | |
| | | | |
| United States: 2.87% | | | | | | | | | | | | | | |
iShares MSCI South Korea Capped ETF | | | | | | | | | 1,100 | | | $ | 68,805 | |
iShares MSCI Taiwan ETF | | | | | | | | | 5,000 | | | | 73,200 | |
| | | | |
Total Investment Companies (Cost $141,015) | | | | | | | | | | | | | 142,005 | |
| | | | | | | | | | | | | | |
| | | | |
| | | Yield | | | | | | | | | |
| Short-Term Investments: 5.72% | | | | | | | | | | | | | | |
| | | | |
| Investment Companies: 5.72% | | | | | | | | | | | | | | |
Wells Fargo Advantage Cash Investment Money Market Fund, Select Class (l)(u) | | | 0.07 | % | | | | | 283,364 | | | | 283,364 | |
| | | | | | | | | | | | | | |
| | | | |
Total Short-Term Investments (Cost $283,364) | | | | | | | | | | | | | 283,364 | |
| | | | | | | | | | | | | | |
| | | | | | | | |
| Total investments in securities | | | | | | | | |
| (Cost $4,945,782) * | | | 98.09 | % | | | 4,857,111 | |
Other assets and liabilities, net | | | 1.91 | | | | 94,672 | |
| | | | | | | | |
| Total net assets | | | 100.00 | % | | $ | 4,951,783 | |
| | | | | | | | |
| † | Non-income-earning security |
| 144A | Security that may be resold to “qualified institutional buyers” under Rule 144A or security offered pursuant to Section 4(2) of the Securities Act of 1933, as amended |
| (a) | Security is fair valued by the Management Valuation Team, and in certain instances by the Board of Trustees, in accordance with procedures approved by the Board of Trustees. |
| ± | Variable rate investment. The interest rate shown is the rate in effect at period end. |
| (l) | Represents an affiliate of the Fund under Sections 2(a)(2) and 2(a)(3) of the Investment Company Act of 1940, as amended |
| (u) | Rate shown is the 7-day annualized yield at period end. |
| * | Cost for federal income tax purposes is $4,945,782 and unrealized appreciation (depreciation) consists of: |
| | | | |
Gross unrealized appreciation | | $ | 213,832 | |
Gross unrealized depreciation | | | (302,503 | ) |
| | | | |
Net unrealized depreciation | | $ | (88,671 | ) |
The accompanying notes are an integral part of these financial statements.
| | | | | | |
| Statement of assets and liabilities—April 30, 2014 (unaudited) | | Wells Fargo Advantage Emerging Markets Equity Select Fund | | | 11 | |
| | | | |
| | | | |
| |
Assets | | | | |
Investments | | | | |
In unaffiliated securities, at value (see cost below) | | $ | 4,573,747 | |
In affiliated securities, at value (see cost below) | | | 283,364 | |
| | | | |
Total investments, at value (see cost below) | | | 4,857,111 | |
Foreign currency, at value (see cost below) | | | 26,521 | |
Receivable for dividends | | | 11,689 | |
Receivable from adviser | | | 15,983 | |
Prepaid expenses and other assets | | | 64,160 | |
| | | | |
Total assets | | | 4,975,464 | |
| | | | |
| |
Liabilities | | | | |
Payable for investments purchased | | | 5,186 | |
Distribution fees payable | | | 152 | |
Due to other related parties | | | 570 | |
Custodian and accounting fees payable | | | 2,226 | |
Professional fees payable | | | 15,547 | |
| | | | |
Total liabilities | | | 23,681 | |
| | | | |
Total net assets | | $ | 4,951,783 | |
| | | | |
| |
NET ASSETS CONSIST OF | | | | |
Paid-in capital | | $ | 5,031,244 | |
Undistributed net investment income | | | 248 | |
Accumulated net realized gains on investments | | | 9,287 | |
Net unrealized losses on investments | | | (88,996 | ) |
| | | | |
Total net assets | | $ | 4,951,783 | |
| | | | |
| |
COMPUTATION OF NET ASSET VALUE AND OFFERING PRICE PER SHARE1 | | | | |
Net assets – Class A | | $ | 265,484 | |
Shares outstanding – Class A | | | 27,007 | |
Net asset value per share – Class A | | | $9.83 | |
Maximum offering price per share – Class A2 | | | $10.43 | |
Net assets – Class C | | $ | 245,561 | |
Shares outstanding – Class C | | | 25,042 | |
Net asset value per share – Class C | | | $9.81 | |
Net assets – Class R6 | | $ | 1,480,956 | |
Share outstanding – Class R6 | | | 150,410 | |
Net asset value per share – Class R6 | | | $9.85 | |
Net assets – Administrator Class | | $ | 1,479,130 | |
Shares outstanding – Administrator Class | | | 150,372 | |
Net asset value per share – Administrator Class | | | $9.84 | |
Net assets – Institutional Class | | $ | 1,480,652 | |
Shares outstanding – Institutional Class | | | 150,403 | |
Net asset value per share – Institutional Class | | | $9.84 | |
| |
Investments in unaffiliated securities, at cost | | $ | 4,662,418 | |
| | | | |
Investments in affiliated securities, at cost | | $ | 283,364 | |
| | | | |
Total investments, at cost | | $ | 4,945,782 | |
| | | | |
Foreign currency, at cost | | $ | 26,836 | |
| | | | |
| 1. | The Fund has an unlimited number of authorized shares. |
| 2. | Maximum offering price is computed as 100/94.25 of net asset value. On investments of $50,000 or more, the offering price is reduced. |
The accompanying notes are an integral part of these financial statements.
| | | | |
| 12 | | Wells Fargo Advantage Emerging Markets Equity Select Fund | | Statement of operations—period ended April 30, 20141 (unaudited) |
| | | | |
| | | | |
| |
Investment income | | | | |
Dividends* | | $ | 39,438 | |
Income from affiliated securities | | | 114 | |
| | | | |
Total investment income | | | 39,552 | |
| | | | |
| |
Expenses | | | | |
Advisory fee | | | 19,801 | |
Administration fees | | | | |
Fund level | | | 990 | |
Class A | | | 267 | |
Class C | | | 256 | |
Class R6 | | | 178 | |
Administrator Class | | | 593 | |
Institutional Class | | | 474 | |
Shareholder servicing fees | | | | |
Class A | | | 257 | |
Class C | | | 247 | |
Administrator Class | | | 1,481 | |
Distribution fees | | | | |
Class C | | | 740 | |
Custody and accounting fees | | | 8,225 | |
Professional fees | | | 21,986 | |
Registration fees | | | 36,911 | |
Shareholder report expenses | | | 14,025 | |
Trustees’ fees and expenses | | | 5,205 | |
Other fees and expenses | | | 6,454 | |
| | | | |
Total expenses | | | 118,090 | |
Less: Fee waivers and/or expense reimbursements | | | (91,498 | ) |
| | | | |
Net expenses | | | 26,592 | |
| | | | |
Net investment income | | | 12,960 | |
| | | | |
| |
REALIZED AND UNREALIZED GAINS (LOSSES) ON INVESTMENTS | | | | |
Net realized gains on investments | | | 9,287 | |
Net change in unrealized gains (losses) on investments | | | (88,996 | ) |
| | | | |
Net realized and unrealized gains (losses) on investments | | | (79,709 | ) |
| | | | |
Net decrease in net assets resulting from operations | | $ | (66,749 | ) |
| | | | |
| |
* Net of foreign dividend withholding taxes in the amount of | | | $4,170 | |
| 1. | For the period from November 29, 2013 (commencement of class operations) to April 30, 2014 |
The accompanying notes are an integral part of these financial statements.
| | | | | | |
| Statement of changes in net assets | | Wells Fargo Advantage Emerging Markets Equity Select Fund | | | 13 | |
| | | | | | | | |
| | | Period ended
April 30, 20141
(unaudited) | |
| | |
Operations | | | | | | | | |
Net investment income | | | | | | $ | 12,960 | |
Net realized gains on investments | | | | | | | 9,287 | |
Net change in unrealized gains (losses) on investments | | | | | | | (88,996 | ) |
| | | | |
Net decrease in net assets resulting from operations | | | | | | | (66,749 | ) |
| | | | |
| | |
Distributions to shareholders from | | | | | | | | |
Net investment income | | | | | | | | |
Class A | | | | | | | (570 | ) |
Class C | | | | | | | (414 | ) |
Class R6 | | | | | | | (4,056 | ) |
Administrator Class | | | | | | | (3,679 | ) |
Institutional Class | | | | | | | (3,993 | ) |
| | | | |
Total distributions to shareholders | | | | | | | (12,712 | ) |
| | | | |
| | |
Capital share transactions | | | Shares | | | | | |
Proceeds from shares sold | | | | | | | | |
Class A | | | 26,949 | | | | 268,532 | |
Class C | | | 25,000 | | | | 250,000 | |
Class R6 | | | 150,000 | | | | 1,500,000 | |
Administrator Class | | | 150,000 | | | | 1,500,000 | |
Institutional Class | | | 150,000 | | | | 1,500,000 | |
| | | | |
| | | | | | | 5,018,532 | |
| | | | |
Reinvestment of distributions | | | | | | | | |
Class A | | | 58 | | | | 570 | |
Class C | | | 42 | | | | 414 | |
Class R6 | | | 410 | | | | 4,056 | |
Administrator Class | | | 372 | | | | 3,679 | |
Institutional Class | | | 403 | | | | 3,993 | |
| | | | |
| | | | | | | 12,712 | |
| | | | |
Net increase in net assets resulting from capital share transactions | | | | | | | 5,031,244 | |
| | | | |
Total increase in net assets | | | | | | | 4,951,783 | |
| | | | |
| | |
Net assets | | | | | | | | |
Beginning of period | | | | | | | 0 | |
| | | | |
End of period | | | | | | $ | 4,951,783 | |
| | | | |
Undistributed net investment income | | | | | | $ | 248 | |
| | | | |
| 1. | For the period from November 29, 2013 (commencement of class operations) to April 30, 2014 |
The accompanying notes are an integral part of these financial statements.
| | | | |
| 14 | | Wells Fargo Advantage Emerging Markets Equity Select Fund | | Financial highlights |
(For a share outstanding throughout the period)
| | | | |
| | | Period ended
April 30, 20141 (unaudited) | |
| CLASS A | |
Net asset value, beginning of period | | $ | 10.00 | |
Net investment income | | | 0.01 | |
Net realized and unrealized gains (losses) on investments | | | (0.16 | ) |
| | | | |
Total from investment operations | | | (0.15 | ) |
Distributions to shareholders from | | | | |
Net investment income | | | (0.02 | ) |
Net asset value, end of period | | $ | 9.83 | |
Total return2 | | | (1.48 | )% |
Ratios to average net assets (annualized) | | | | |
Gross expenses | | | 6.26 | % |
Net expenses | | | 1.65 | % |
Net investment income | | | 0.35 | % |
Supplemental data | | | | |
Portfolio turnover rate | | | 12 | % |
Net assets, end of period (000s omitted) | | | $265 | |
| 1. | For the period from November 29, 2013 (commencement of class operations) to April 30, 2014 |
| 2. | Total return calculations do not include any sales charges. Returns for periods of less than one year are not annualized. |
The accompanying notes are an integral part of these financial statements.
| | | | | | |
| Financial highlights | | Wells Fargo Advantage Emerging Markets Equity Select Fund | | | 15 | |
(For a share outstanding throughout the period)
| | | | |
| | | Period ended
April 30, 20141 (unaudited) | |
| CLASS C | |
Net asset value, beginning of period | | $ | 10.00 | |
Net investment loss | | | (0.02 | ) |
Net realized and unrealized gains (losses) on investments | | | (0.15 | ) |
| | | | |
Total from investment operations | | | (0.17 | ) |
Distributions to shareholders from | | | | |
Net investment income | | | (0.02 | ) |
Net asset value, end of period | | $ | 9.81 | |
Total return2 | | | (1.74 | )% |
Ratios to average net assets (annualized) | | | | |
Gross expenses | | | 7.00 | % |
Net expenses | | | 2.40 | % |
Net investment loss | | | (0.40 | )% |
Supplemental data | | | | |
Portfolio turnover rate | | | 12 | % |
Net assets, end of period (000s omitted) | | | $246 | |
| 1. | For the period from November 29, 2013 (commencement of class operations) to April 30, 2014 |
| 2. | Total return calculations do not include any sales charges. Returns for periods of less than one year are not annualized. |
The accompanying notes are an integral part of these financial statements.
| | | | |
| 16 | | Wells Fargo Advantage Emerging Markets Equity Select Fund | | Financial highlights |
(For a share outstanding throughout the period)
| | | | |
| | | Period ended
April 30, 20141 (unaudited) | |
| CLASS R6 | |
Net asset value, beginning of period | | $ | 10.00 | |
Net investment income | | | 0.03 | |
Net realized and unrealized gains (losses) on investments | | | (0.15 | ) |
| | | | |
Total from investment operations | | | (0.12 | ) |
Distributions to shareholders from | | | | |
Net investment income | | | (0.03 | ) |
Net asset value, end of period | | $ | 9.85 | |
Total return2 | | | (1.23 | )% |
Ratios to average net assets (annualized) | | | | |
Gross expenses | | | 5.77 | % |
Net expenses | | | 1.15 | % |
Net investment income | | | 0.85 | % |
Supplemental data | | | | |
Portfolio turnover rate | | | 12 | % |
Net assets, end of period (000s omitted) | | | $1,481 | |
| 1. | For the period from November 29, 2013 (commencement of class operations) to April 30, 2014 |
| 2. | Returns for periods of less than one year are not annualized. |
The accompanying notes are an integral part of these financial statements.
| | | | | | |
| Financial highlights | | Wells Fargo Advantage Emerging Markets Equity Select Fund | | | 17 | |
(For a share outstanding throughout the period)
| | | | |
| | | Period ended
April 30, 20141 (unaudited) | |
| ADMINISTRATOR CLASS | |
Net asset value, beginning of period | | $ | 10.00 | |
Net investment income | | | 0.02 | |
Net realized and unrealized gains (losses) on investments | | | (0.16 | ) |
| | | | |
Total from investment operations | | | (0.14 | ) |
Distributions to shareholders from | | | | |
Net investment income | | | (0.02 | ) |
Net asset value, end of period | | $ | 9.84 | |
Total return2 | | | (1.36 | )% |
Ratios to average net assets (annualized) | | | | |
Gross expenses | | | 6.09 | % |
Net expenses | | | 1.45 | % |
Net investment income | | | 0.55 | % |
Supplemental data | | | | |
Portfolio turnover rate | | | 12 | % |
Net assets, end of period (000s omitted) | | | $1,479 | |
| 1. | For the period from November 29, 2013 (commencement of class operations) to April 30, 2014 |
| 2. | Returns for periods of less than one year are not annualized. |
The accompanying notes are an integral part of these financial statements.
| | | | |
| 18 | | Wells Fargo Advantage Emerging Markets Equity Select Fund | | Financial highlights |
(For a share outstanding throughout the period)
| | | | |
| | | Period ended
April 30, 20141 (unaudited) | |
| INSTITUTIONAL CLASS | |
Net asset value, beginning of period | | $ | 10.00 | |
Net investment income | | | 0.03 | |
Net realized and unrealized gains (losses) on investments | | | (0.16 | ) |
| | | | |
Total from investment operations | | | (0.13 | ) |
Distributions to shareholders from | | | | |
Net investment income | | | (0.03 | ) |
Net asset value, end of period | | $ | 9.84 | |
Total return2 | | | (1.34 | )% |
Ratios to average net assets (annualized) | | | | |
Gross expenses | | | 5.82 | % |
Net expenses | | | 1.20 | % |
Net investment income | | | 0.80 | % |
Supplemental data | | | | |
Portfolio turnover rate | | | 12 | % |
Net assets, end of period (000s omitted) | | | $1,481 | |
| 1. | For the period from November 29, 2013 (commencement of class operations) to April 30, 2014 |
| 2. | Returns for periods of less than one year are not annualized. |
The accompanying notes are an integral part of these financial statements.
| | | | | | |
| Notes to financial statements (unaudited) | | Wells Fargo Advantage Emerging Markets Equity Select Fund | | | 19 | |
1. ORGANIZATION
Wells Fargo Funds Trust (the “Trust”), a Delaware statutory trust organized on March 10, 1999, is an open-end management investment company registered under the Investment Company Act of 1940, as amended (the “1940 Act”). These financial statements report on the Wells Fargo Advantage Emerging Markets Equity Select Fund (the “Fund”) which is a diversified series of the Trust.
2. SIGNIFICANT ACCOUNTING POLICIES
The following significant accounting policies, which are consistently followed in the preparation of the financial statements of the Fund, are in conformity with U.S. generally accepted accounting principles which require management to make estimates and assumptions that affect the reported amounts of assets and liabilities, disclosure of contingent assets and liabilities at the date of the financial statements, and the reported amounts of revenues and expenses during the reporting period. Actual results could differ from those estimates.
Securities valuation
All investments are valued each business day as of the close of regular trading on the New York Stock Exchange (generally 4 p.m. Eastern Time).
Equity securities that are listed on a foreign or domestic exchange or market are valued at the official closing price or, if none, the last sales price. If no sale occurs on the primary exchange or market for the security that day, the prior day’s price will be deemed “stale” and fair values will be determined in accordance with the Fund’s Valuation Procedures.
The values of securities denominated in foreign currencies are translated into U.S. dollars at rates provided by an independent foreign currency pricing source at a time each business day specified by the Management Valuation Team of Wells Fargo Funds Management, LLC (“Funds Management”).
Many securities markets and exchanges outside the U.S. close prior to the close of the New York Stock Exchange and therefore may not fully reflect trading or events that occur after the close of the principal exchange in which the foreign securities are traded, but before the close of the New York Stock Exchange. If such trading or events are expected to materially affect the value of such securities, then fair value pricing procedures approved by the Board of Trustees of the Fund are applied. These procedures take into account multiple factors including movements in U.S. securities markets after foreign exchanges close. Foreign securities that are fair valued under these procedures are categorized as Level 2 and the application of these procedures may result in transfers between Level 1 and Level 2. Depending on market activity, such fair valuations may be frequent. Such fair value pricing may result in NAVs that are higher or lower than NAVs based on the last reported sales price or latest quoted bid price. On April 30, 2014 such fair value pricing was not used in pricing foreign securities.
Investments in registered open-end investment companies are valued at net asset value.
Investments which are not valued using any of the methods discussed above are valued at their fair value, as determined in good faith by the Board of Trustees. The Board of Trustees has established a Valuation Committee comprised of the Trustees and has delegated to it the authority to take any actions regarding the valuation of portfolio securities that the Valuation Committee deems necessary or appropriate, including determining the fair value of portfolio securities, unless the determination has been delegated to the Management Valuation Team. The Board of Trustees retains the authority to make or ratify any valuation decisions or approve any changes to the Valuation Procedures as it deems appropriate. On a quarterly basis, the Board of Trustees receives reports on any valuation actions taken by the Valuation Committee or the Management Valuation Team which may include items for ratification.
Valuations of fair valued securities are compared to the next actual sales price when available, or other appropriate market values, to assess the continued appropriateness of the fair valuation methodologies used. These securities are fair valued on a day-to-day basis, taking into consideration changes to appropriate market information and any significant changes to the inputs considered in the valuation process until there is a readily available price provided on an exchange or by an independent pricing service. Valuations received from an independent pricing service or independent broker-dealer quotes are periodically validated by comparisons to most recent trades and valuations provided by other independent pricing services in addition to the review of prices by the adviser and/or subadviser. Unobservable inputs used in determining fair valuations are identified based on the type of security, taking into consideration factors utilized by market participants in valuing the investment, knowledge about the issuer and the current market environment.
Foreign currency translation
The accounting records of the Fund are maintained in U.S. dollars. The values of other assets and liabilities denominated in foreign currencies are translated into U.S. dollars at rates provided by an independent foreign currency pricing source
| | | | |
| 20 | | Wells Fargo Advantage Emerging Markets Equity Select Fund | | Notes to financial statements (unaudited) |
at a time each business day specified by the Management Valuation Team. Purchases and sales of securities, and income and expenses are converted at the rate of exchange on the respective dates of such transactions. Net realized foreign exchange gains or losses arise from sales of foreign currencies, currency gains or losses realized between the trade and settlement dates on securities transactions, and the difference between the amounts of dividends, interest and foreign withholding taxes recorded and the U.S. dollar equivalent of the amounts actually paid or received. Net unrealized foreign exchange gains and losses arise from changes in the fair value of assets and liabilities other than investments in securities resulting from changes in exchange rates. The changes in net assets arising from changes in exchange rates and the changes in net assets resulting from changes in market prices of securities are not separately presented. Such changes included in net realized and unrealized gains or losses from investments.
Security transactions and income recognition
Securities transactions are recorded on a trade date basis. Realized gains or losses are recorded on the basis of identified cost.
Dividend income is recognized on the ex-dividend date, except for certain dividends from foreign securities, which are recorded as soon as the Fund is informed of the ex-dividend date. Dividend income from foreign securities is recorded net of foreign taxes withheld where recovery of such taxes is not assured.
Distributions to shareholders
Distributions to shareholders from net investment income and net realized gains, if any, are recorded on the ex-dividend date. Such distributions are determined in conformity with federal income tax regulations, which may differ in amount or character from net investment income and realized gains recognized for purposes of U.S. generally accepted accounting principles.
Federal and other taxes
The Fund intends to qualify as a regulated investment company by distributing substantially all of its investment company taxable income and any net realized capital gains (after reduction for capital loss carryforwards) sufficient to relieve it from all, or substantially all, federal income taxes. Accordingly, no provision for federal income taxes was required.
The Fund’s income and federal excise tax returns and all financial records supporting those returns for the fiscal years since commencement of operations will be subject to examination by the federal and Delaware revenue authorities. The Fund is not subject to examination by federal and state tax authorities for tax years before 2014, the year the Fund commenced operations.
Class allocations
The separate classes of shares offered by the Fund differ principally in applicable sales charges, distribution, shareholder servicing, and administration fees. Shareholders of each class bear certain expenses that pertain to that particular class. All shareholders bear the common expenses of the Fund, earn income from the portfolio, and are allocated any unrealized gains and losses pro rata based on the average daily net assets of each class, without distinction between share classes. Dividends are determined separately for each class based on income and expenses allocable to each class. Realized gains and losses are allocated to each class pro rata based upon the net assets of each class on the date realized. Differences in per share dividend rates generally result from the relative weightings of pro rata income and realized gain allocations and from differences in separate class expenses, including distribution, shareholder servicing, and administration fees.
3. FAIR VALUATION MEASUREMENTS
Fair value measurements of investments are determined within a framework that has established a fair value hierarchy based upon the various data inputs utilized in determining the value of the Fund’s investments. The three-level hierarchy gives the highest priority to unadjusted quoted prices in active markets for identical assets or liabilities (Level 1) and the lowest priority to significant unobservable inputs (Level 3). The Fund’s investments are classified within the fair value hierarchy based on the lowest level of input that is significant to the fair value measurement. The inputs are summarized into three broad levels as follows:
| n | | Level 1 – quoted prices in active markets for identical securities |
| n | | Level 2 – other significant observable inputs (including quoted prices for similar securities, interest rates, prepayment speeds, credit risk, use of amortized cost, etc.) |
| n | | Level 3 – significant unobservable inputs (including the Fund’s own assumptions in determining the fair value of investments) |
| | | | | | |
| Notes to financial statements (unaudited) | | Wells Fargo Advantage Emerging Markets Equity Select Fund | | | 21 | |
The inputs or methodologies used for valuing investments in securities are not necessarily an indication of the risk associated with investing in those securities.
As of April 30, 2014, the inputs used in valuing investments in securities were as follows:
| | | | | | | | | | | | | | | | |
| Investments in securities | | Quoted prices (Level 1) | | | Other significant observable inputs (Level 2) | | | Significant unobservable inputs (Level 3) | | | Total | |
Equity securities | | | | | | | | | | | | | | | | |
Common stocks | | | | | | | | | | | | | | | | |
Argentina | | $ | 15,856 | | | $ | 0 | | | $ | 0 | | | $ | 15,856 | |
Brazil | | | 610,690 | | | | 0 | | | | 0 | | | | 610,690 | |
Chile | | | 75,286 | | | | 0 | | | | 0 | | | | 75,286 | |
China | | | 745,188 | | | | 0 | | | | 0 | | | | 745,188 | |
Colombia | | | 39,851 | | | | 0 | | | | 0 | | | | 39,851 | |
Hong Kong | | | 129,137 | | | | 0 | | | | 0 | | | | 129,137 | |
India | | | 247,725 | | | | 0 | | | | 0 | | | | 247,725 | |
Indonesia | | | 97,713 | | | | 0 | | | | 0 | | | | 97,713 | |
Malaysia | | | 80,693 | | | | 0 | | | | 0 | | | | 80,693 | |
Mexico | | | 574,981 | | | | 0 | | | | 0 | | | | 574,981 | |
Peru | | | 22,100 | | | | 0 | | | | 0 | | | | 22,100 | |
Philippines | | | 51,911 | | | | 0 | | | | 0 | | | | 51,911 | |
Russia | | | 199,333 | | | | 39,684 | | | | 0 | | | | 239,017 | |
South Africa | | | 269,047 | | | | 0 | | | | 0 | | | | 269,047 | |
South Korea | | | 429,826 | | | | 0 | | | | 0 | | | | 429,826 | |
Taiwan | | | 379,947 | | | | 0 | | | | 0 | | | | 379,947 | |
Thailand | | | 219,189 | | | | 0 | | | | 0 | | | | 219,189 | |
Turkey | | | 35,874 | | | | 0 | | | | 0 | | | | 35,874 | |
United Kingdom | | | 69,238 | | | | 0 | | | | 0 | | | | 69,238 | |
Preferred stocks | | | | | | | | | | | | | | | | |
Brazil | | | 98,473 | | | | 0 | | | | 0 | | | | 98,473 | |
Investment companies | | | | | | | | | | | | | | | | |
United States | | | 142,005 | | | | 0 | | | | 0 | | | | 142,005 | |
Short-term investments | | | | | | | | | | | | | | | | |
Investment companies | | | 283,364 | | | | 0 | | | | 0 | | | | 283,364 | |
| | | $ | 4,817,427 | | | $ | 39,684 | | | $ | 0 | | | $ | 4,857,111 | |
Transfers in and transfers out are recognized at the end of the reporting period. For the period ended April 30, 2014, the Fund did not have any transfers into/out of Level 1, Level 2, or Level 3.
4. TRANSACTIONS WITH AFFILIATES AND OTHER EXPENSES
Advisory fee
The Trust has entered into an advisory contract with Funds Management, an indirect wholly owned subsidiary of Wells Fargo & Company (“Wells Fargo”). The adviser is responsible for implementing investment policies and guidelines and for supervising the subadviser, who is responsible for day-to-day portfolio management of the Fund.
Pursuant to the contract, Funds Management is entitled to receive an annual advisory fee starting at 1.00% and declining to 0.90% as the average daily net assets of the Fund increase. For the period from November 29, 2013 to April 30, 2014, the advisory fee was equivalent to an annual rate of 1.00% of the Fund’s average daily net assets.
Funds Management has retained the services of certain subadvisers to provide daily portfolio management to the Fund. The fee for subadvisory services is borne by Funds Management. Wells Capital Management Incorporated, an affiliate of Funds Management and an indirect wholly owned subsidiary of Wells Fargo, is the subadviser to the Fund and is entitled to receive a fee from Funds Management at an annual rate starting at 0.60% and declining to 0.425% as the average daily net assets of the Fund increase.
| | | | |
| 22 | | Wells Fargo Advantage Emerging Markets Equity Select Fund | | Notes to financial statements (unaudited) |
Administration and transfer agent fees
The Trust has entered into an administration agreement with Funds Management. Under this agreement, for providing administrative services, which includes paying fees and expenses for services provided by the transfer agent, sub-transfer agents, omnibus account servicers and record-keepers, Funds Management is entitled to receive from the Fund an annual fund level administration fee starting at 0.05% and declining to 0.03% as the average daily net assets of the Fund increase and a class level administration fee which is calculated based on the average daily net assets of each class as follows:
| | | | |
| | | Class level
administration fee | |
Class A, Class C | | | 0.26 | % |
Class R6 | | | 0.03 | |
Administrator Class | | | 0.10 | |
Institutional Class | | | 0.08 | |
Funds Management has contractually waived and/or reimbursed advisory and administration fees to the extent necessary to maintain certain net operating expense ratios for the Fund. Waiver of fees and/or reimbursement of expenses by Funds Management were made first from fund level expenses on a proportionate basis and then from class specific expenses. Funds Management has committed through February 28, 2015 to waive fees and/or reimburse expenses to the extent necessary to cap the Fund’s expenses at 1.65% for Class A shares, 2.40% for Class C shares, 1.15% for Class R6 shares, 1.45% for Administrator Class shares, and 1.20% for Institutional Class shares.
Distribution fees
The Trust has adopted a Distribution Plan for Class C shares of the Fund pursuant to Rule 12b-1 under the 1940 Act. Distribution fees are charged to Class C shares and paid to Wells Fargo Funds Distributor, LLC, the principal underwriter, at an annual rate of 0.75% of the average daily net assets of Class C shares.
For the period from November 29, 2013 to April 30, 2014, Wells Fargo Funds Distributor, LLC received $73 from the sale of Class A shares.
Shareholder servicing fees
The Trust has entered into contracts with one or more shareholder servicing agents, whereby Class A, Class C, and Administrator Class of the Fund is charged a fee at an annual rate of 0.25% of the average daily net assets of each respective class.
A portion of these total shareholder servicing fees were paid to affiliates of Wells Fargo.
5. INVESTMENT PORTFOLIO TRANSACTIONS
Purchases and sales of investments, excluding U.S. government obligations (if any) and short-term securities, for the period from November 29, 2013 to April 30, 2014 were $5,157,379 and $504,795, respectively.
6. INDEMNIFICATION
Under the Trust’s organizational documents, the officers and Trustees are indemnified against certain liabilities that may arise out of performance of their duties to the Trust. Additionally, in the normal course of business, the Trust may enter into contracts with service providers that contain a variety of indemnification clauses. The Trust’s maximum exposure under these arrangements is dependent on future claims that may be made against the Fund and, therefore, cannot be estimated.
| | | | | | |
| Other information (unaudited) | | Wells Fargo Advantage Emerging Markets Equity Select Fund | | | 23 | |
PROXY VOTING INFORMATION
A description of the policies and procedures that the Fund uses to determine how to vote proxies relating to portfolio securities is available without charge, upon request, by calling 1-800-222-8222, visiting our website at wellsfargoadvantagefunds.com, or visiting the SEC website at sec.gov. Information regarding how the Fund voted proxies relating to portfolio securities during the most recent 12-month period ended June 30 is available without charge on the Fund’s website at wellsfargoadvantagefunds.com or by visiting the SEC website at sec.gov.
PORTFOLIO HOLDINGS INFORMATION
The complete portfolio holdings for the Fund are publicly available on the Fund’s website (wellsfargoadvantagefunds.com) on a monthly, 30-day or more delayed basis. In addition, top ten holdings information for the Fund is publicly available on the Fund’s website on a monthly, seven-day or more delayed basis. The Fund files its complete schedule of portfolio holdings with the SEC for the first and third quarters of each fiscal year on Form N-Q, which is available without charge by visiting the SEC website at sec.gov. In addition, the Fund’s Form N-Q may be reviewed and copied at the SEC’s Public Reference Room in Washington, DC, and at regional offices in New York City, at 233 Broadway, and in Chicago, at 175 West Jackson Boulevard, Suite 900. Information about the Public Reference Room may be obtained by calling 1-800-SEC-0330.
| | | | |
| 24 | | Wells Fargo Advantage Emerging Markets Equity Select Fund | | Other information (unaudited) |
BOARD OF TRUSTEES AND OFFICERS
Each of the Trustees and Officers1 listed in the table below acts in identical capacities for each fund in the Wells Fargo Advantage family of funds, which consists of 132 mutual funds comprising the Wells Fargo Funds Trust, Wells Fargo Variable Trust, Wells Fargo Master Trust and four closed-end funds (collectively the “Fund Complex”). This table should be read in conjunction with the Prospectus and the Statement of Additional Information2. All of the Trustees are also Members of the Audit and Governance Committees of each Trust in the Fund Complex. The mailing address of each Trustee and Officer is 525 Market Street, 12th Floor, San Francisco, CA 94105. Each Trustee and Officer serves an indefinite term, however, each Trustee serves such term until reaching the mandatory retirement age established by the Trustees.
Independent Trustees
| | | | | | |
Name and year of birth | | Position held and length of service* | | Principal occupations during past five years | | Other directorships during past five years |
Peter G. Gordon
(Born 1942) | | Trustee, since 1998; Chairman, since 2005 | | Co-Founder, Retired Chairman, President and CEO of Crystal Geyser Water Company. Trustee Emeritus, Colby College. | | Asset Allocation Trust |
Isaiah Harris, Jr.
(Born 1952) | | Trustee, since 2009 | | Retired. Prior thereto, President and CEO of BellSouth Advertising and Publishing Corp. from 2005 to 2007, President and CEO of BellSouth Enterprises from 2004 to 2005 and President of BellSouth Consumer Services from 2000 to 2003. Emeritus member of the Iowa State University Foundation Board of Governors. Emeritus Member of the Advisory Board of Iowa State University School of Business. Advisory Board Member, Palm Harbor Academy (charter school). Mr. Harris is a certified public accountant. | | CIGNA Corporation; Deluxe Corporation; Asset Allocation Trust |
Judith M. Johnson
(Born 1949) | | Trustee, since 2008; Audit Committee Chairman, since 2008 | | Retired. Prior thereto, Chief Executive Officer and Chief Investment Officer of Minneapolis Employees Retirement Fund from 1996 to 2008. Ms. Johnson is an attorney, certified public accountant and a certified managerial accountant. | | Asset Allocation Trust |
Leroy Keith, Jr.
(Born 1939) | | Trustee, since 2010 | | Chairman, Bloc Global Services (development and construction). Trustee of the Evergreen Funds from 1983 to 2010. Former Managing Director, Almanac Capital Management (commodities firm), former Partner, Stonington Partners, Inc. (private equity fund), former Director, Obagi Medical Products Co. and former Director, Lincoln Educational Services. | | Trustee, Virtus Fund Complex (consisting of 50 portfolios as of 12/16/2013); Asset Allocation Trust |
David F. Larcker
(Born 1950) | | Trustee, since 2009 | | James Irvin Miller Professor of Accounting at the Graduate School of Business, Stanford University, Morgan Stanley Director of the Center for Leadership Development and Research and Senior Faculty of The Rock Center for Corporate Governance since 2006. From 2005 to 2008, Professor of Accounting at the Graduate School of Business, Stanford University. Prior thereto, Ernst & Young Professor of Accounting at The Wharton School, University of Pennsylvania from 1985 to 2005. | | Asset Allocation Trust |
Olivia S. Mitchell
(Born 1953) | | Trustee, since 2006 | | International Foundation of Employee Benefit Plans Professor, Wharton School of the University of Pennsylvania since 1993. Director of Wharton’s Pension Research Council and Boettner Center on Pensions & Retirement Research, and Research Associate at the National Bureau of Economic Research. Previously, Cornell University Professor from 1978 to 1993. | | Asset Allocation Trust |
Timothy J. Penny
(Born 1951) | | Trustee, since 1996 | | President and CEO of Southern Minnesota Initiative Foundation, a non-profit organization, since 2007 and Senior Fellow at the Humphrey Institute Policy Forum at the University of Minnesota since 1995. Member of the Board of Trustees of NorthStar Education Finance, Inc., a non-profit organization, since 2007. | | Asset Allocation Trust |
| | | | | | |
| Other information (unaudited) | | Wells Fargo Advantage Emerging Markets Equity Select Fund | | | 25 | |
| | | | | | |
Name and year of birth | | Position held and length of service* | | Principal occupations during past five years | | Other directorships during past five years |
Michael S. Scofield
(Born 1943) | | Trustee, since 2010 | | Served on the Investment Company Institute’s Board of Governors and Executive Committee from 2008-2011 as well the Governing Council of the Independent Directors Council from 2006-2011 and the Independent Directors Council Executive Committee from 2008-2011. Chairman of the IDC from 2008-2010. Institutional Investor (Fund Directions) Trustee of Year in 2007. Trustee of the Evergreen Funds (and its predecessors) from 1984 to 2010. Chairman of the Evergreen Funds from 2000-2010. Former Trustee of the Mentor Funds. Retired Attorney, Law Offices of Michael S. Scofield. | | Asset Allocation Trust |
Donald C. Willeke
(Born 1940) | | Trustee, since 1996 | | Principal of the law firm of Willeke & Daniels. General Counsel of the Minneapolis Employees Retirement Fund from 1984 until its consolidation into the Minnesota Public Employees Retirement Association on June 30, 2010. Director and Vice Chair of The Tree Trust (non-profit corporation). Director of the American Chestnut Foundation (non-profit corporation). | | Asset Allocation Trust |
| * | Length of service dates reflect the Trustee’s commencement of service with the Trust’s predecessor entities, where applicable. |
Officers
| | | | | | |
Name and year of birth | | Position held and length of service | | Principal occupations during past five years | | |
Karla M. Rabusch
(Born 1959) | | President, since 2003 | | Executive Vice President of Wells Fargo Bank, N.A. and President of Wells Fargo Funds Management, LLC since 2003. | | |
Jeremy DePalma1
(Born 1974) | | Treasurer, since 2012 | | Senior Vice President of Wells Fargo Funds Management, LLC since 2009. Senior Vice President of Evergreen Investment Management Company, LLC from 2008 to 2010. Vice President, Evergreen Investment Services, Inc. from 2004 to 2007. Head of the Fund Reporting and Control Team within Fund Administration from 2005 to 2010. | | |
C. David Messman
(Born 1960) | | Secretary, since 2000; Chief Legal Officer,
since 2003 | | Senior Vice President and Secretary of Wells Fargo Funds Management, LLC since 2001. Vice President and Managing Counsel of Wells Fargo Bank, N.A. since 1996. | | |
Debra Ann Early
(Born 1964) | | Chief Compliance Officer, since 2007 | | Chief Compliance Officer of Wells Fargo Funds Management, LLC since 2007. Chief Compliance Officer of Parnassus Investments from 2005 to 2007. Chief Financial Officer of Parnassus Investments from 2004 to 2007. | | |
David Berardi
(Born 1975) | | Assistant Treasurer,
since 2009 | | Vice President of Wells Fargo Funds Management, LLC since 2009. Vice President of Evergreen Investment Management Company, LLC from 2008 to 2010. Assistant Vice President of Evergreen Investment Services, Inc. from 2004 to 2008. Manager of Fund Reporting and Control for Evergreen Investment Management Company, LLC from 2004 to 2010. | | |
| 1. | Jeremy DePalma acts as Treasurer of 59 funds and Assistant Treasurer of 73 funds in the Fund Complex. |
| 2. | The Statement of Additional Information includes additional information about the Trustees and is available, without charge, upon request, by calling 1-800-222-8222 or by visiting the website at wellsfargoadvantagefunds.com. |
| | | | |
| 26 | | Wells Fargo Advantage Emerging Markets Equity Select Fund | | Other information (unaudited) |
BOARD CONSIDERATION OF INVESTMENT ADVISORY AND SUB-ADVISORY AGREEMENTS:
Under Section 15 of the Investment Company Act of 1940 (the “1940 Act”), the Board of Trustees (the “Board”) of Wells Fargo Funds Trust (the “Trust”), all the members of which have no direct or indirect interest in the investment advisory and sub-advisory agreements and are not “interested persons” of the Trust, as defined in the 1940 Act (the “Independent Trustees”), must determine whether to approve the continuation of the Trust’s investment advisory and sub-advisory agreements. In this regard, at an in-person meeting held on March 27-28, 2014 (the “Meeting”), the Board reviewed: (i) an investment advisory agreement with Wells Fargo Funds Management, LLC (“Funds Management”) for Wells Fargo Advantage Emerging Markets Equity Select Fund (the “Fund”) and (ii) an investment sub-advisory agreement with Wells Capital Management Incorporated (the “Sub-Adviser”), an affiliate of Funds Management, for the Fund. The investment advisory agreement with Funds Management and the investment sub-advisory agreement with the Sub-Adviser are collectively referred to as the “Advisory Agreements.”
At the Meeting, the Board considered the factors and reached the conclusions described below relating to the selection of Funds Management and the Sub-Adviser and the continuation of the Advisory Agreements. Prior to the Meeting, the Trustees conferred extensively among themselves and with representatives of Funds Management about these matters. Also, the Board has adopted a team-based approach, with each team consisting of a sub-set of Trustees, to assist the full Board in the discharge of its duties in reviewing performance and other matters throughout the year. The Independent Trustees were assisted in their evaluation of the Advisory Agreements by independent legal counsel, from whom they received separate legal advice and with whom they met separately.
In providing information to the Board, Funds Management and the Sub-Adviser were guided by a detailed set of requests for information submitted to them by independent legal counsel on behalf of the Independent Trustees at the start of the Board’s annual contract renewal process earlier in 2014. In considering and approving the Advisory Agreements, the Trustees considered the information they believed relevant, including but not limited to the information discussed below. The Board considered not only the specific information presented in connection with the Meeting, but also the knowledge gained over time through interaction with Funds Management and the Sub-Adviser about various topics. In this regard, the Board reviewed reports of Funds Management at each of its quarterly meetings, which included, among other things, portfolio reviews and performance reports. In addition, the Board and the teams mentioned above confer with portfolio managers at various times throughout the year. The Board did not identify any particular information or consideration that was all-important or controlling, and each individual Trustee may have attributed different weights to various factors.
After its deliberations, the Board unanimously approved the continuation of the Advisory Agreements and determined that the compensation payable to Funds Management and the Sub-Adviser is reasonable. The Board considered the continuation of the Advisory Agreements for the Fund as part of its consideration of the continuation of advisory agreements for funds across the complex, but its approvals were made on a fund-by-fund basis. The following summarizes a number of important, but not necessarily all, factors considered by the Board in support of its approvals.
Nature, extent and quality of services
The Board received and considered various information regarding the nature, extent and quality of services provided to the Fund by Funds Management and the Sub-Adviser under the Advisory Agreements. This information included, among other things, a summary of the background and experience of senior management of Funds Management, and the qualifications, background, tenure and responsibilities of each of the portfolio managers primarily responsible for the day-to-day portfolio management of the Fund.
The Board evaluated the ability of Funds Management and the Sub-Adviser to attract and retain qualified investment professionals, including research, advisory and supervisory personnel. The Board further considered the compliance programs and compliance records of Funds Management and the Sub-Adviser. In addition, the Board took into account the full range of services provided to the Fund by Funds Management and its affiliates.
Fund performance and expenses
The Board acknowledged that the Fund is newly formed and has no performance record. The Board noted that it considered the performance of other accounts managed by the Sub-Adviser utilizing an investment style and strategy similar to that of the Fund when the Board initially approved the Advisory Agreements for the Fund at an in-person meeting of the Board held on August 13-14, 2013, including how such accounts performed in relation to the Fund’s benchmark index. The Board noted that it would have the opportunity to review performance information relating to the Fund on an on-going basis and in connection with future annual reviews of advisory agreements.
| | | | | | |
| Other information (unaudited) | | Wells Fargo Advantage Emerging Markets Equity Select Fund | | | 27 | |
The Board received and considered information regarding the Fund’s net operating expense ratios and their various components, including actual management fees (which reflect fee waivers, if any, and include advisory, administration and transfer agent fees), custodian and other non-management fees, Rule 12b-1 and non-Rule 12b-1 service fees and fee waiver and expense reimbursement arrangements. The Board considered these ratios in comparison to the median ratios of funds in class-specific expense groups that were determined by Lipper to be similar to the Fund (the “Groups”). The Board received a description of the methodology used by Lipper to select the mutual funds in the expense Groups and an explanation of year-to-year variations in the funds comprising such expense Groups and their expense ratios. Based on the Lipper reports, the Board noted that the net operating expense ratios of the Fund were equal to, lower than or in range of the median net operating expense ratios of the expense Groups.
Based on its consideration of the factors and information it deemed relevant, including those described here, the Board concluded that the overall performance and expense structure of the Fund supported the re-approval of the Advisory Agreements.
Investment advisory and sub-advisory fee rates
The Board reviewed and considered the contractual investment advisory fee rates that are payable by the Fund to Funds Management for investment advisory services (the “Advisory Agreement Rates”), both on a stand-alone basis and on a combined basis with the Fund’s fund-level and class-level contractual administration fee rates (the “Management Rates”). The Board noted that the administration fees payable to Funds Management include transfer agency and sub-transfer agency costs. The Board also reviewed and considered the contractual investment sub-advisory fee rates that are payable by Funds Management to the Sub-Adviser for investment sub-advisory services (the “Sub-Advisory Agreement Rates”).
Among other information reviewed by the Board was a comparison of the Management Rates of the Fund with those of other funds in the expense Groups at a common asset level. The Board noted that the Management Rates of the Fund were in range of the average rates for the Fund’s expense Groups, except for Class A, the Management Rate of which was higher than its expense Group. However, the Board noted that the net operating expense ratio for Class A was equal to the median net operating expense ratio of its expense Group.
The Board also received and considered information about the portion of the total advisory fee that was retained by Funds Management after payment of the fee to the Sub-Adviser for sub-advisory services. In assessing the reasonableness of this amount, the Board received and evaluated information about the nature and extent of responsibilities retained and risks assumed by Funds Management and not delegated to or assumed by the Sub-Adviser, and about Funds Management’s on-going oversight services. However, given the affiliation between Funds Management and the Sub-Adviser, the Board ascribed limited relevance to the allocation of the advisory fee between them.
The Board also received and considered information about the nature and extent of services offered and fee rates charged by Funds Management and the Sub-Adviser to other types of clients with investment strategies similar to those of the Fund. In this regard, the Board received information about the significantly greater scope of services, and compliance, reporting and other legal burdens and risks of managing mutual funds compared with those associated with managing assets of non-mutual fund clients such as collective funds or institutional separate accounts.
Based on its consideration of the factors and information it deemed relevant, including those described here, the Board determined that the Advisory Agreement Rates and the Sub-Advisory Agreement Rates were reasonable in light of the services covered by the Advisory Agreements.
Profitability
The Board received and considered information concerning the profitability of Funds Management, as well as the profitability of Wells Fargo as a whole, from providing services to the Fund and the fund family as a whole. The Board did not receive or consider to be necessary separate profitability information with respect to the Sub-Adviser, because its profitability information was subsumed in the collective Wells Fargo profitability analysis.
Funds Management explained the methodologies and estimates that it used in calculating profitability. Among other things, the Board noted that the levels of profitability reported on a fund-by-fund basis varied widely, depending on factors such as the size and type of fund. Based on its review, the Board did not deem the profits reported by Funds Management to be at a level that would prevent it from approving the continuation of the Advisory Agreements.
| | | | |
| 28 | | Wells Fargo Advantage Emerging Markets Equity Select Fund | | Other information (unaudited) |
Economies of scale
With respect to possible economies of scale, the Board noted the existence of breakpoints in the Fund’s advisory fee and administration fee structure, which operate generally to reduce the Fund’s expense ratios as the Fund grows in size. It considered that, for a small fund or a fund that shrinks in size, breakpoints conversely can result in higher fee levels. The Board also considered that fee waiver and expense reimbursement arrangements and competitive fee rates at the outset are means of sharing potential economies of scale with shareholders of the Fund and the fund family as a whole. The Board considered Funds Management’s view that any analyses of potential economies of scale in managing a particular fund are inherently limited in light of the joint and common costs and investments that Funds Management incurs across the fund family as a whole.
The Board concluded that the Fund’s fee and expense arrangements, including contractual breakpoints, constituted a reasonable approach to sharing potential economies of scale with the Fund and its shareholders.
Other benefits to Funds Management and the Sub-Adviser
The Board received and considered information regarding potential “fall-out” or ancillary benefits received by Funds Management and its affiliates, including the Sub-Adviser, as a result of their relationships with the Fund. Ancillary benefits could include, among others, benefits directly attributable to other relationships with the Fund and benefits potentially derived from an increase in Funds Management’s and the Sub-Adviser’s business as a result of their relationships with the Fund. The Board noted that various affiliates of Funds Management may receive distribution-related fees, shareholder servicing payments and sub-transfer agency fees in respect of shares sold or held through them and services provided.
The Board also reviewed information about soft dollar credits earned and utilized by the Sub-Adviser, fees earned by Funds Management and the Sub-Adviser from managing a private investment vehicle for the fund family’s securities lending collateral and commissions earned by an affiliated broker from portfolio transactions.
Based on its consideration of the factors and information it deemed relevant, including those described here, the Board did not find that any ancillary benefits received by Funds Management and its affiliates, including the Sub-Adviser, were unreasonable.
Conclusion
After considering the above-described factors and based on its deliberations and its evaluation of the information described above, the Board unanimously approved the continuation of the Advisory Agreements for an additional one-year period and determined that the compensation payable to Funds Management and the Sub-Adviser is reasonable.
| | | | | | |
| List of abbreviations | | Wells Fargo Advantage Emerging Markets Equity Select Fund | | | 29 | |
The following is a list of common abbreviations for terms and entities that may have appeared in this report.
| ACA | — ACA Financial Guaranty Corporation |
| ADR | — American depositary receipt |
| ADS | — American depositary shares |
| AGC | — Assured Guaranty Corporation |
| AGM | — Assured Guaranty Municipal |
| Ambac | — Ambac Financial Group Incorporated |
| AMT | — Alternative minimum tax |
| BAN | — Bond anticipation notes |
| BHAC | — Berkshire Hathaway Assurance Corporation |
| CAB | — Capital appreciation bond |
| CCAB | — Convertible capital appreciation bond |
| CDA | — Community Development Authority |
| CDO | — Collateralized debt obligation |
| DRIVER | — Derivative inverse tax-exempt receipts |
| DW&P | — Department of Water & Power |
| DWR | — Department of Water Resources |
| ECFA | — Educational & Cultural Facilities Authority |
| EDA | — Economic Development Authority |
| EDFA | — Economic Development Finance Authority |
| ETF | — Exchange-traded fund |
| FDIC | — Federal Deposit Insurance Corporation |
| FFCB | — Federal Farm Credit Banks |
| FGIC | — Financial Guaranty Insurance Corporation |
| FHA | — Federal Housing Administration |
| FHLB | — Federal Home Loan Bank |
| FHLMC | — Federal Home Loan Mortgage Corporation |
| FICO | — The Financing Corporation |
| FNMA | — Federal National Mortgage Association |
| GDR | — Global depositary receipt |
| GNMA | — Government National Mortgage Association |
| HCFR | — Healthcare facilities revenue |
| HEFA | — Health & Educational Facilities Authority |
| HEFAR | — Higher education facilities authority revenue |
| HFA | — Housing Finance Authority |
| HFFA | — Health Facilities Financing Authority |
| HUD | — Department of Housing and Urban Development |
| IDA | — Industrial Development Authority |
| IDAG | — Industrial Development Agency |
| KRW | — Republic of Korea won |
| LIBOR | — London Interbank Offered Rate |
| LLC | — Limited liability company |
| LLLP | — Limited liability limited partnership |
| LLP | — Limited liability partnership |
| MBIA | — Municipal Bond Insurance Association |
| MFHR | — Multifamily housing revenue |
| MSTR | — Municipal securities trust receipts |
| MUD | — Municipal Utility District |
| National | — National Public Finance Guarantee Corporation |
| PCFA | — Pollution Control Financing Authority |
| PCL | — Public Company Limited |
| PCR | — Pollution control revenue |
| PFA | — Public Finance Authority |
| PFFA | — Public Facilities Financing Authority |
| PFOTER | — Puttable floating option tax-exempt receipts |
| plc | — Public limited company |
| PUTTER | — Puttable tax-exempt receipts |
| R&D | — Research & development |
| Radian | — Radian Asset Assurance |
| RAN | — Revenue anticipation notes |
| RDA | — Redevelopment Authority |
| RDFA | — Redevelopment Finance Authority |
| REIT | — Real estate investment trust |
| ROC | — Reset option certificates |
| SAVRS | — Select auction variable rate securities |
| SBA | — Small Business Authority |
| SFHR | — Single-family housing revenue |
| SFMR | — Single-family mortgage revenue |
| SPA | — Standby purchase agreement |
| SPDR | — Standard & Poor’s Depositary Receipts |
| STRIPS | — Separate trading of registered interest and |
| TAN | — Tax anticipation notes |
| TIPS | — Treasury inflation-protected securities |
| TRAN | — Tax revenue anticipation notes |
| TTFA | — Transportation Trust Fund Authority |
| TVA | — Tennessee Valley Authority |
This page is intentionally left blank.
This page is intentionally left blank.
This page is intentionally left blank.


For more information
More information about Wells Fargo Advantage Funds is available free upon request. To obtain literature, please write, email, visit the Fund’s website, or call:
Wells Fargo Advantage Funds
P.O. Box 8266
Boston, MA 02266-8266
Email: wfaf@wellsfargo.com
Website: wellsfargoadvantagefunds.com
Individual investors: 1-800-222-8222
Retail investment professionals: 1-888-877-9275
Institutional investment professionals: 1-866-765-0778
This report and the financial statements contained herein are submitted for the general information of the shareholders of Wells Fargo Advantage Funds. If this report is used for promotional purposes, distribution of the report must be accompanied or preceded by a current prospectus. Before investing, please consider the investment objectives, risks, charges, and expenses of the investment. For a current prospectus and, if available, a summary prospectus, containing this information, call 1-800-222-8222 or visit the Fund’s website at wellsfargoadvantagefunds.com. Read the prospectus carefully before you invest or send money.
Wells Fargo Funds Management, LLC, a wholly owned subsidiary of Wells Fargo & Company, provides investment advisory and administrative services for Wells Fargo Advantage Funds. Other affiliates of Wells Fargo & Company provide subadvisory and other services for the Funds. The Funds are distributed by Wells Fargo Funds Distributor, LLC, Member FINRA/SIPC, an affiliate of Wells Fargo & Company.
NOT FDIC INSURED ¡ NO BANK GUARANTEE ¡ MAY LOSE VALUE
© 2014 Wells Fargo Funds Management, LLC. All rights reserved.
| | |
 | | 225169 06-14 SA266/SAR266 04-14 |

Wells Fargo Advantage
Global Opportunities Fund

Semi-Annual Report
April 30, 2014

Reduce clutter. Save trees.
Sign up for electronic delivery of prospectuses and shareholder reports at wellsfargo.com/advantagedelivery
Contents
The views expressed and any forward-looking statements are as of April 30, 2014, unless otherwise noted, and are those of the Fund managers and/or Wells Fargo Funds Management, LLC. Discussions of individual securities, or the markets generally, or any Wells Fargo Advantage Fund are not intended as individual recommendations. Future events or results may vary significantly from those expressed in any forward-looking statements; the views expressed are subject to change at any time in response to changing circumstances in the market. Wells Fargo Funds Management, LLC and the Fund disclaim any obligation to publicly update or revise any views expressed or forward-looking statements.
NOT FDIC INSURED ¡ NO BANK GUARANTEE ¡ MAY LOSE VALUE
| | | | |
| 2 | | Wells Fargo Advantage Global Opportunities Fund | | Letter to shareholders (unaudited) |

Karla M. Rabusch
President
Wells Fargo Advantage Funds
European markets continued to benefit from the European Central Bank’s (ECB’s) willingness to maintain low interest rates.
Some of the markets that had declined the most during the European debt crisis—such as Italy and Ireland—benefited the most from this stable economic environment, but larger markets such as France and Germany also posted gains.
Dear Valued Shareholder:
We are pleased to offer you this semi-annual report for the Wells Fargo Advantage Global Opportunities Fund for the six-month period that ended April 30, 2014. The period was marked by growing concern about an economic slowdown in China and heightened geopolitical uncertainty as the U.S. and Europe confronted Russia over Ukraine. The environment created a headwind for many emerging markets, even as continued economic recovery in Europe helped most developed stock markets end the period with gains.
Major central banks continued to provide stimulus.
Major central banks continued to inject liquidity into global banks and markets through various quantitative easing policies. The U.S. Federal Reserve (Fed) remained a major source of liquidity for market participants around the world. Throughout the reporting period, the Federal Open Market Committee (FOMC)—the Fed’s monetary policymaking body—kept its key interest rate near zero in order to support the economy and the financial system. At the beginning of the reporting period, the FOMC was still making open-ended purchases of $40 billion per month in mortgage-backed securities to support the housing market and was purchasing $45 billion per month in long-term U.S. Treasuries. However, in mid-December 2013, the FOMC announced that it would reduce (or taper) its bond-buying program by $10 billion per month beginning in January 2014. Although the tapering was less aggressive than some investors had feared, the removal of liquidity sparked a sell-off in emerging markets stocks and currencies as investors sold higher-risk assets.
European markets continued to benefit from the European Central Bank’s (ECB’s) willingness to maintain low interest rates. In November 2013, the ECB cut its key rate to a historic low of 0.25%. The ECB’s actions helped support moderate year-over-year gross domestic product (GDP) growth in the eurozone.
Most developed regions gained, but emerging and developed Asian markets lagged.
For the six-month period, the MSCI EAFE Index (Net)1, a proxy for developed markets, returned 4.44%, while the MSCI Emerging Markets Index (Net)2 returned -2.98%.
In Europe, economic data continued to show moderate growth, with reported GDP for the 28 countries in the European Union rising by 0.4% in the fourth quarter of 2013 compared with the previous quarter. The unemployment rate remained high but stable at 10.5% in February and March 2014, while inflation remained consistently below a 1% annual rate. Some of the markets that had declined the most during the European debt crisis—such as Italy and Ireland—benefited the most from this stable economic environment, but larger markets such as France and Germany also posted gains. The ongoing turmoil in Ukraine did result in some stock market volatility, but as of the end of the reporting period, most investors believed that it would not result in war.
Asian markets posted mixed results, with political issues accounting for many of those differences. In countries such as India and Indonesia, investors were optimistic that upcoming elections might sweep in more reform-minded
| 1. | The Morgan Stanley Capital International Europe, Australasia, and Far East (MSCI EAFE) Index (Net) is an unmanaged group of securities widely regarded by investors to be representations of the stock markets of Europe, Australasia, and the Far East. Calculations for EAFE use net dividends, which reflect the deduction of withholding taxes. You cannot invest directly in an index. Source: MSCI. MSCI makes no express or implied warranties or representations and shall have no liability whatsoever with respect to any MSCI data contained herein. The MSCI data may not be further redistributed or used as a basis for other indexes or any securities or financial products. This report is not approved, reviewed, or produced by MSCI. |
| 2. | The Morgan Stanley Capital International (MSCI) Emerging Markets Index (Net) is a free float-adjusted market-capitalization-weighted index designed to measure the equity market performance in the global emerging markets. The index is currently composed of 21 emerging markets country indexes. You cannot invest directly in an index. |
| | | | | | |
| Letter to shareholders (unaudited) | | Wells Fargo Advantage Global Opportunities Fund | | | 3 | |
governments. By contrast, in Japan, the honeymoon for Prime Minister Shinzō Abe appeared to be ending, with investors worrying that his reforms were not taking effect as quickly as originally hoped.
As for China, many of the country’s economic numbers—such as national production, retail sales, fixed investment, and manufacturing activity—came in below analyst expectations, causing investor concern. In addition, China’s government has allowed a growing number of defaults in the country’s financial system as part of a long-term plan to rein in credit growth.
Don’t let short-term uncertainty derail long-term investment goals.
Periods of uncertainty can present challenges, but experience has taught us that maintaining long-term investment goals can be an effective way to plan for the future. To help you create a sound strategy based on your personal goals and risk tolerance, Wells Fargo Advantage Funds offers more than 100 mutual funds spanning a wide range of asset classes and investment styles. Although diversification cannot guarantee an investment profit or prevent losses, we believe it can be an effective way to manage investment risk and potentially smooth out overall portfolio performance. We encourage investors to know their investments and to understand that appropriate levels of risk-taking may unlock opportunities.
Thank you for choosing to invest with Wells Fargo Advantage Funds. We appreciate your confidence in us and remain committed to helping you meet your financial needs. For current information about your fund investments, contact your investment professional, visit our website at wellsfargoadvantagefunds.com, or call us directly at 1-800-222-8222. We are available 24 hours a day, 7 days a week.
Sincerely,

Karla M. Rabusch
President
Wells Fargo Advantage Funds
Notice to shareholders
The Fund and Wells Fargo Funds Management, LLC (“Funds Management”) have received an exemptive order from the SEC that permits Funds Management, subject to the approval of the Board of Trustees of the Fund, to select or replace certain subadvisers to manage all or a portion of the Fund’s assets and enter into, amend or terminate a sub-advisory agreement with certain subadvisers without obtaining shareholder approval (“Multi-manager Structure”). The Multi-manager Structure applies to subadvisers that are not affiliated with Funds Management or the Fund, except to the extent that affiliation arises solely because such subadvisers provide sub-advisory services to the Fund (“Non-affiliated Subadvisers”), as well as subadvisers that are indirect or direct wholly-owned subsidiaries of Funds Management or of another company that, indirectly or directly, wholly owns Funds Management (“Wholly-owned Subadvisers”).
Pursuant to the SEC order, Funds Management, with the approval of the Board of Trustees, has the discretion to terminate any subadvisers and allocate and reallocate the Fund’s assets among any other Non-affiliated Subadvisers or Wholly-owned Subadvisers. Funds Management, subject to oversight and supervision by the Board of Trustees, has responsibility to continue to oversee any subadvisers to the Fund and to recommend, for approval by the Board of Trustees, the hiring, termination and replacement of subadvisers for the Fund. In the event that a new subadviser is hired pursuant to the Multi-manager Structure, the Fund is required to provide notice to shareholders within 90 days.
Please contact your investment professional or call us directly at 1-800-222-8222 if you have any questions on this Notice to Shareholders.
| | | | |
| 4 | | Wells Fargo Advantage Global Opportunities Fund | | Performance highlights (unaudited) |
Investment objective
The Fund seeks long-term capital appreciation.
Adviser
Wells Fargo Funds Management, LLC
Subadviser
Wells Capital Management Incorporated
Portfolio managers
James M. Tringas, CFA
Oleg Makhorine
Bryant VanCronkhite, CFA, CPA
Average annual total returns1 (%) as of April 30, 2014
| | | | | | | | | | | | | | | | | | |
| | | | | Including sales charge | | Excluding sales charge | | Expense ratios2 (%) |
| | | Inception date | | 1 year | | 5 year | | 10 year | | 1 year | | 5 year | | 10 year | | Gross | | Net3 |
| Class A (EKGAX) | | 3-16-1988 | | 14.04 | | 16.26 | | 10.09 | | 20.99 | | 17.65 | | 10.75 | | 1.60 | | 1.56 |
| Class B (EKGBX)* | | 2-1-1993 | | 15.05 | | 16.56 | | 10.19 | | 20.05 | | 16.77 | | 10.19 | | 2.35 | | 2.31 |
| Class C (EKGCX) | | 2-1-1993 | | 19.06 | | 16.77 | | 9.94 | | 20.06 | | 16.77 | | 9.94 | | 2.35 | | 2.31 |
| Administrator Class (EKGYX) | | 1-13-1997 | | – | | – | | – | | 21.17 | | 17.87 | | 11.01 | | 1.44 | | 1.41 |
| Institutional Class (EKGIX) | | 7-30-2010 | | – | | – | | – | | 21.46 | | 18.10 | | 11.11 | | 1.17 | | 1.16 |
| S&P Developed SmallCap Index4 | | – | | – | | – | | – | | 20.47 | | 19.70 | | 9.78 | | – | | – |
| * | | Class B shares are closed to investment, except in connection with the reinvestment of any distributions and permitted exchanges. |
Figures quoted represent past performance, which is no guarantee of future results, and do not reflect taxes that a shareholder may pay on fund distributions or the redemption of fund shares. Investment return and principal value of an investment will fluctuate so that an investor’s shares, when redeemed, may be worth more or less than their original cost. Performance shown without sales charges would be lower if sales charges were reflected. Current performance may be lower or higher than the performance data quoted, which assumes the reinvestment of dividends and capital gains. Current month-end performance is available on the Fund’s website, wellsfargoadvantagefunds.com.
Index returns do not include transaction costs associated with buying and selling securities, any mutual fund fees or expenses, or any taxes. It is not possible to invest directly in an index.
For Class A shares, the maximum front-end sales charge is 5.75%. For Class B shares, the maximum contingent deferred sales charge is 5.00%. For Class C shares, the maximum contingent deferred sales charge is 1.00%. Performance including sales charge assumes the sales charge for the corresponding time period. Administrator Class and Institutional Class shares are sold without a front-end sales charge or contingent deferred sales charge.
Stock values fluctuate in response to the activities of individual companies and general market and economic conditions. Foreign investments are especially volatile and can rise or fall dramatically due to differences in the political and economic conditions of the host country. These risks are generally intensified in emerging markets. The use of derivatives may reduce returns and/or increase volatility. Certain investment strategies tend to increase the total risk of an investment (relative to the broader market). The Fund is exposed to country concentration risk, regional risk and smaller company securities risk. Consult the Fund’s prospectus for additional information on these and other risks.
Please see footnotes on page 5.
| | | | | | |
| Performance highlights (unaudited) | | Wells Fargo Advantage Global Opportunities Fund | | | 5 | |
| | | | |
| Ten largest equity holdings5 (%) as of April 30, 2014 | |
TreeHouse Foods Incorporated | | | 1.52 | |
Clean Harbors Incorporated | | | 1.46 | |
Forward Air Corporation | | | 1.46 | |
ACI Worldwide Incorporated | | | 1.42 | |
Kadant Incorporated | | | 1.40 | |
Denny’s Corporation | | | 1.39 | |
Franklin Electric Company Incorporated | | | 1.38 | |
Brown & Brown Incorporated | | | 1.32 | |
Mueller Industries Incorporated | | | 1.30 | |
Steris Corporation | | | 1.28 | |
|
| Sector distribution6 as of April 30, 2014 |
|
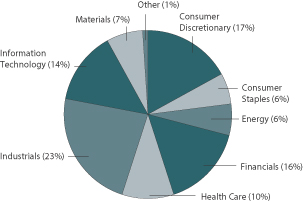 |
| 1. | Historical performance shown for Institutional Class shares prior to their inception reflects the performance of Administrator Class shares, and includes the higher expenses applicable to Administrator Class shares. If these expenses had not been included, returns would be higher. Historical performance shown for all classes of the Fund prior to July 19, 2010, is based on the performance of the Fund’s predecessor, Evergreen Global Opportunities Fund. |
| 2. | Reflects the expense ratios as stated in the most recent prospectuses, which include the impact of 0.01% in acquired fund fees and expenses. The expense ratios shown are subject to change and may differ from the annualized expense ratios shown in the financial highlights of this report, which do not include acquired fund fees and expenses. |
| 3. | The Adviser has committed through February 28, 2015, to waive fees and/or reimburse expenses to the extent necessary to cap the Fund’s Total Annual Fund Operating Expenses After Fee Waiver, excluding certain expenses, at 1.55% for Class A, 2.30% for Class B, 2.30% for Class C, 1.40% for Administrator Class, and 1.15% for Institutional Class. Brokerage commissions, stamp duty fees, interest, taxes, acquired fund fees and expenses, and extraordinary expenses are excluded from the cap. Without this cap, the Fund’s returns would have been lower. |
| 4. | The S&P Developed SmallCap Index is a float-adjusted market capitalization index designed to measure the equity market performance of small capitalization companies located in developed markets. The index is comprised of companies within the bottom 15% of the cumulative market capitalization in developed markets. The index covers all publicly listed equities with float-adjusted market values of U.S. $100 million or more and annual dollar value traded of at least U.S. $50 million in all included countries. You cannot invest directly in an index. |
| 5. | The ten largest equity holdings are calculated based on the value of the securities divided by total net assets of the Fund. Holdings are subject to change and may have changed since the date specified. Top holdings typically include the underlying ordinary shares combined with any depositary receipts. |
| 6. | Sector distribution is subject to change and is calculated based on the total long-term investments of the Fund. |
| | | | |
| 6 | | Wells Fargo Advantage Global Opportunities Fund | | Fund expenses (unaudited) |
As a shareholder of the Fund, you incur two types of costs: (1) transaction costs, including sales charges (loads) on purchase payments and contingent deferred sales charges (if any) on redemptions and (2) ongoing costs, including management fees, distribution (12b-1) and/or shareholder service fees, and other Fund expenses. This example is intended to help you understand your ongoing costs (in dollars) of investing in the Fund and to compare these costs with the ongoing costs of investing in other mutual funds.
The example is based on an investment of $1,000 invested at the beginning of the six-month period and held for the entire period from November 1, 2013 to April 30, 2014.
Actual expenses
The “Actual” line of the table below provides information about actual account values and actual expenses. You may use the information in this line, together with the amount you invested, to estimate the expenses that you paid over the period. Simply divide your account value by $1,000 (for example, an $8,600 account value divided by $1,000 = 8.6), then multiply the result by the number in the “Actual” line under the heading entitled “Expenses paid during period” for your applicable class of shares to estimate the expenses you paid on your account during this period.
Hypothetical example for comparison purposes
The “Hypothetical” line of the table below provides information about hypothetical account values and hypothetical expenses based on the Fund’s actual expense ratio and an assumed rate of return of 5% per year before expenses, which is not the Fund’s actual return. The hypothetical account values and expenses may not be used to estimate the actual ending account balance or expenses you paid for the period. You may use this information to compare the ongoing costs of investing in the Fund and other funds. To do so, compare this 5% hypothetical example with the 5% hypothetical examples that appear in the shareholder reports of the other funds.
Please note that the expenses shown in the table are meant to highlight your ongoing costs only and do not reflect any transactional costs, such as sales charges (loads) and contingent deferred sales charges. Therefore, the “Hypothetical” line of the table is useful in comparing ongoing costs only and will not help you determine the relative total costs of owning different funds. In addition, if these transactional costs were included, your costs would have been higher.
| | | | | | | | | | | | | | | | |
| | | Beginning
account value
11-1-2013 | | | Ending
account value
4-30-2014 | | | Expenses
paid during
the period¹ | | | Net annualized
expense ratio | |
Class A | | | | | | | | | | | | | | | | |
Actual | | $ | 1,000.00 | | | $ | 1,049.76 | | | $ | 7.88 | | | | 1.55 | % |
Hypothetical (5% return before expenses) | | $ | 1,000.00 | | | $ | 1,017.11 | | | $ | 7.75 | | | | 1.55 | % |
Class B | | | | | | | | | | | | | | | | |
Actual | | $ | 1,000.00 | | | $ | 1,045.64 | | | $ | 11.67 | | | | 2.30 | % |
Hypothetical (5% return before expenses) | | $ | 1,000.00 | | | $ | 1,013.39 | | | $ | 11.48 | | | | 2.30 | % |
Class C | | | | | | | | | | | | | | | | |
Actual | | $ | 1,000.00 | | | $ | 1,045.79 | | | $ | 11.67 | | | | 2.30 | % |
Hypothetical (5% return before expenses) | | $ | 1,000.00 | | | $ | 1,013.39 | | | $ | 11.48 | | | | 2.30 | % |
Administrator Class | | | | | | | | | | | | | | | | |
Actual | | $ | 1,000.00 | | | $ | 1,050.35 | | | $ | 7.12 | | | | 1.40 | % |
Hypothetical (5% return before expenses) | | $ | 1,000.00 | | | $ | 1,017.85 | | | $ | 7.00 | | | | 1.40 | % |
Institutional Class | | | | | | | | | | | | | | | | |
Actual | | $ | 1,000.00 | | | $ | 1,051.66 | | | $ | 5.80 | | | | 1.14 | % |
Hypothetical (5% return before expenses) | | $ | 1,000.00 | | | $ | 1,019.14 | | | $ | 5.71 | | | | 1.14 | % |
| 1. | Expenses paid is equal to the annualized expense ratio of each class multiplied by the average account value over the period, multiplied by the number of days in the most recent fiscal half-year divided by the number of days in the fiscal year (to reflect the one-half-year period). |
| | | | | | |
| Portfolio of investments—April 30, 2014 (unaudited) | | Wells Fargo Advantage Global Opportunities Fund | | | 7 | |
| | | | | | | | | | | | |
| Security name | | | | | | Shares | | | Value | |
| | | | | | | | | | | | |
| | | | |
Common Stocks: 94.01% | | | | | | | | | | | | |
| | | | |
| Australia: 1.25% | | | | | | | | | | | | |
SAI Global Limited (Industrials, Professional Services) | | | | | | | 450,208 | | | $ | 1,785,899 | |
Tiger Resources Limited (Materials, Metals & Mining) † | | | | | | | 6,094,901 | | | | 2,010,068 | |
| | | | |
| | | | | | | | | | | 3,795,967 | |
| | | | | | | | | | | | |
| | | | |
| Canada: 2.72% | | | | | | | | | | | | |
Capstone Mining Corporation (Materials, Metals & Mining) † | | | | | | | 453,355 | | | | 1,195,380 | |
Cott Corporation (Consumer Staples, Beverages) | | | | | | | 138,927 | | | | 1,128,097 | |
GSI Group Incorporated (Information Technology, Electronic Equipment, Instruments & Components) † | | | | | | | 225,042 | | | | 2,732,010 | |
MBAC Fertilizer Corporation (Materials, Chemicals) † | | | | | | | 578,864 | | | | 290,475 | |
MBAC Fertilizer Corporation – Legend Shares (Materials, Chemicals) †(i) | | | | | | | 84,000 | | | | 42,151 | |
Surge Energy Incorporated (Energy, Oil, Gas & Consumable Fuels) | | | | | | | 289,981 | | | | 1,833,464 | |
Surge Energy Incorporated – Legend Shares (Energy, Oil, Gas & Consumable Fuels) † | | | | | | | 41,460 | | | | 262,139 | |
Transglobe Energy Corporation (Energy, Oil, Gas & Consumable Fuels) † | | | | | | | 93,862 | | | | 731,337 | |
| | | | |
| | | | | | | | | | | 8,215,053 | |
| | | | | | | | | | | | |
| | | | |
| Denmark: 1.03% | | | | | | | | | | | | |
DSV AS (Industrials, Road & Rail) | | | | | | | 33,619 | | | | 1,121,675 | |
Jyske Bank AS (Financials, Banks) † | | | | | | | 36,220 | | | | 1,989,407 | |
| | | | |
| | | | | | | | | | | 3,111,082 | |
| | | | | | | | | | | | |
| | | | |
| France: 4.15% | | | | | | | | | | | | |
ALTEN (Information Technology, IT Services) | | | | | | | 62,095 | | | | 3,168,934 | |
Eutelsat Communications SA (Consumer Discretionary, Media) | | | | | | | 75,269 | | | | 2,582,415 | |
M6 Metropole Television SA (Consumer Discretionary, Media) | | | | | | | 85,935 | | | | 1,840,786 | |
Mersen (Industrials, Electrical Equipment) | | | | | | | 53,678 | | | | 1,716,537 | |
Teleperformance (Industrials, Professional Services) | | | | | | | 56,808 | | | | 3,254,170 | |
| | | | |
| | | | | | | | | | | 12,562,842 | |
| | | | | | | | | | | | |
| | | | |
| Germany: 4.08% | | | | | | | | | | | | |
Amadeus Fire AG (Industrials, Professional Services) | | | | | | | 12,783 | | | | 1,111,952 | |
Deutsche Wohnen AG (Financials, Real Estate Management & Development) | | | | | | | 78,014 | | | | 1,671,654 | |
Gerresheimer AG (Health Care, Life Sciences Tools & Services) | | | | | | | 40,158 | | | | 2,722,424 | |
Hochtief AG (Industrials, Construction & Engineering) | | | | | | | 25,214 | | | | 2,343,352 | |
Software AG (Information Technology, Software) | | | | | | | 56,803 | | | | 2,135,238 | |
TOM TAILOR Holding AG (Consumer Discretionary, Textiles, Apparel & Luxury Goods) † | | | | | | | 121,449 | | | | 2,358,891 | |
| | | | |
| | | | | | | | | | | 12,343,511 | |
| | | | | | | | | | | | |
| | | | |
| Hong Kong: 0.90% | | | | | | | | | | | | |
Luk Fook Holdings International Limited (Consumer Discretionary, Specialty Retail) | | | | | | | 298,000 | | | | 845,614 | |
Sunlight REIT (Financials, REITs) | | | | | | | 4,734,000 | | | | 1,862,349 | |
| | | | |
| | | | | | | | | | | 2,707,963 | |
| | | | | | | | | | | | |
| | | | |
| Italy: 2.14% | | | | | | | | | | | | |
Beni Stabili SpA (Financials, REITs) | | | | | | | 1,806,875 | | | | 1,613,104 | |
Credito Emiliano SpA (Financials, Banks) | | | | | | | 154,070 | | | | 1,577,467 | |
Davide Campari-Milano SpA (Consumer Staples, Beverages) | | | | | | | 230,223 | | | | 1,999,442 | |
Salvatore Ferragamo SpA (Consumer Discretionary, Textiles, Apparel & Luxury Goods) | | | | | | | 40,818 | | | | 1,291,703 | |
| | | | |
| | | | | | | | | | | 6,481,716 | |
| | | | | | | | | | | | |
The accompanying notes are an integral part of these financial statements.
| | | | |
| 8 | | Wells Fargo Advantage Global Opportunities Fund | | Portfolio of investments—April 30, 2014 (unaudited) |
| | | | | | | | | | | | |
| Security name | | | | | | Shares | | | Value | |
| | | | | | | | | | | | |
| | | | |
| Japan: 7.90% | | | | | | | | | | | | |
Aeon Delight Company Limited (Industrials, Commercial Services & Supplies) | | | | | | | 93,200 | | | $ | 2,052,980 | |
Anritsu Corporation (Information Technology, Electronic Equipment, Instruments & Components) | | | | | | | 195,600 | | | | 2,186,832 | |
Avex Group Holdings Incorporated (Consumer Discretionary, Media) | | | | | | | 88,200 | | | | 1,628,812 | |
Chiba Bank Limited (Financials, Banks) | | | | | | | 216,000 | | | | 1,371,194 | |
FamilyMart Company Limited (Consumer Staples, Food & Staples Retailing) | | | | | | | 39,000 | | | | 1,619,357 | |
Hitachi Chemical Company Limited (Materials, Chemicals) | | | | | | | 136,400 | | | | 2,005,274 | |
Musashi Seimitsu Industry Company Limited (Consumer Discretionary, Auto Components) | | | | | | | 113,600 | | | | 2,503,456 | |
ORIX JREIT Incorporated (Financials, REITs) | | | | | | | 1,832 | | | | 2,329,535 | |
Sumitomo Heavy Industries Limited (Industrials, Machinery) | | | | | | | 250,000 | | | | 1,061,280 | |
Sumitomo Warehouse Company Limited (Industrials, Transportation Infrastructure) | | | | | | | 386,000 | | | | 1,868,929 | |
Taikisha Limited (Industrials, Construction & Engineering) | | | | | | | 63,400 | | | | 1,369,889 | |
Tokyo Ohka Kogyo Company Limited (Materials, Chemicals) | | | | | | | 88,155 | | | | 2,013,419 | |
Toshiba Machine Company Limited (Industrials, Machinery) | | | | | | | 420,263 | | | | 1,882,726 | |
| | | | |
| | | | | | | | | | | 23,893,683 | |
| | | | | | | | | | | | |
| | | | |
| Netherlands: 2.07% | | | | | | | | | | | | |
Arcadis NV (Industrials, Construction & Engineering) | | | | | | | 59,359 | | | | 2,106,556 | |
Nutreco NV (Consumer Staples, Food Products) | | | | | | | 46,293 | | | | 2,148,954 | |
USG People NV (Industrials, Professional Services) | | | | | | | 117,264 | | | | 2,021,375 | |
| | | | |
| | | | | | | | | | | 6,276,885 | |
| | | | | | | | | | | | |
| | | | |
| Norway: 2.33% | | | | | | | | | | | | |
Atea ASA (Information Technology, IT Services) | | | | | | | 194,047 | | | | 2,227,968 | |
Hoegh LNG Holdings Limited (Energy, Oil, Gas & Consumable Fuels) † | | | | | | | 281,371 | | | | 2,745,406 | |
SpareBank 1 SR Bank ASA (Financials, Banks) | | | | | | | 215,103 | | | | 2,080,720 | |
| | | | |
| | | | | | | | | | | 7,054,094 | |
| | | | | | | | | | | | |
| | | | |
| Portugal: 0.28% | | | | | | | | | | | | |
Banco BPI SA (Financials, Banks) † | | | | | | | 332,415 | | | | 852,714 | |
| | | | | | | | | | | | |
| | | | |
| Russia: 0.36% | | | | | | | | | | | | |
Sollers OJSC (Consumer Discretionary, Automobiles) (a) | | | | | | | 74,291 | | | | 1,082,815 | |
| | | | | | | | | | | | |
| | | | |
| South Korea: 2.16% | | | | | | | | | | | | |
BS Financial Group Incorporated (Financials, Banks) | | | | | | | 123,420 | | | | 1,887,192 | |
Handsome Company Limited (Consumer Discretionary, Textiles, Apparel & Luxury Goods) | | | | | | | 38,400 | | | | 969,941 | |
Hy-Lok Corporation (Industrials, Machinery) | | | | | | | 72,062 | | | | 2,095,677 | |
Kiwoom Securities Company (Financials, Capital Markets) | | | | | | | 32,020 | | | | 1,571,096 | |
| | | | |
| | | | | | | | | | | 6,523,906 | |
| | | | | | | | | | | | |
| | | | |
| Spain: 0.98% | | | | | | | | | | | | |
Prosegur Compania de Seguridad SA (Industrials, Commercial Services & Supplies) | | | | | | | 192,298 | | | | 1,288,569 | |
Viscofan SA (Consumer Staples, Food Products) | | | | | | | 31,989 | | | | 1,666,466 | |
| | | | |
| | | | | | | | | | | 2,955,035 | |
| | | | | | | | | | | | |
| | | | |
| Sweden: 1.06% | | | | | | | | | | | | |
Avanza Bank Holding AB (Financials, Capital Markets) | | | | | | | 40,285 | | | | 1,508,627 | |
Meda AB Class A (Health Care, Pharmaceuticals) | | | | | | | 94,956 | | | | 1,699,867 | |
| | | | |
| | | | | | | | | | | 3,208,494 | |
| | | | | | | | | | | | |
The accompanying notes are an integral part of these financial statements.
| | | | | | |
| Portfolio of investments—April 30, 2014 (unaudited) | | Wells Fargo Advantage Global Opportunities Fund | | | 9 | |
| | | | | | | | | | | | |
| Security name | | | | | | Shares | | | Value | |
| | | | | | | | | | | | |
| | | | |
| Switzerland: 1.00% | | | | | | | | | | | | |
Aryzta AG (Consumer Staples, Food Products) | | | | | | | 16,181 | | | $ | 1,493,815 | |
Dufry AG (Consumer Discretionary, Specialty Retail) † | | | | | | | 9,196 | | | | 1,519,257 | |
| | | | |
| | | | | | | | | | | 3,013,072 | |
| | | | | | | | | | | | |
| | | | |
| Taiwan: 0.55% | | | | | | | | | | | | |
Siliconware Precision Industries Company (Information Technology, Semiconductors & Semiconductor Equipment) | | | | | | | 1,142,000 | | | | 1,673,406 | |
| | | | | | | | | | | | |
| | | | |
| United Kingdom: 11.27% | | | | | | | | | | | | |
Ashtead Group plc (Industrials, Trading Companies & Distributors) | | | | | | | 97,910 | | | | 1,445,646 | |
Bovis Homes Group plc (Consumer Discretionary, Household Durables) | | | | | | | 276,319 | | | | 3,687,973 | |
Cambian Group plc (Health Care, Health Care Providers & Services) † | | | | | | | 550,000 | | | | 2,112,609 | |
Catlin Group Limited (Financials, Insurance) | | | | | | | 280,183 | | | | 2,500,126 | |
Consort Medical plc (Health Care, Health Care Equipment & Supplies) | | | | | | | 113,369 | | | | 1,688,255 | |
Debenhams plc (Consumer Discretionary, Multiline Retail) | | | | | | | 2,064,583 | | | | 2,795,644 | |
Devro plc (Consumer Staples, Food Products) | | | | | | | 166,368 | | | | 594,094 | |
Enquest plc (Energy, Oil, Gas & Consumable Fuels) † | | | | | | | 777,190 | | | | 1,801,660 | |
IMI plc (Industrials, Machinery) | | | | | | | 66,800 | | | | 1,691,776 | |
Jupiter Fund Management plc (Financials, Capital Markets) | | | | | | | 448,802 | | | | 2,941,612 | |
Morgan Advanced Materials plc (Industrials, Machinery) | | | | | | | 458,759 | | | | 2,594,804 | |
Oxford Instruments plc (Information Technology, Electronic Equipment, Instruments & Components) | | | | | | | 96,928 | | | | 2,109,489 | |
Perform Group plc (Consumer Discretionary, Media) † | | | | | | | 621,758 | | | | 2,262,267 | |
Savills plc (Financials, Real Estate Management & Development) | | | | | | | 151,232 | | | | 1,532,040 | |
SIG plc (Industrials, Trading Companies & Distributors) | | | | | | | 478,228 | | | | 1,546,247 | |
Taylor Wimpey plc (Consumer Discretionary, Household Durables) | | | | | | | 1,579,049 | | | | 2,802,034 | |
| | | | |
| | | | | | | | | | | 34,106,276 | |
| | | | | | | | | | | | |
| | | | |
| United States: 47.78% | | | | | | | | | | | | |
A. Schulman Incorporated (Materials, Chemicals) | | | | | | | 94,911 | | | | 3,409,203 | |
ACI Worldwide Incorporated (Information Technology, Software) † | | | | | | | 75,000 | | | | 4,286,250 | |
Atwood Oceanics Incorporated (Energy, Energy Equipment & Services) † | | | | | | | 15,600 | | | | 773,136 | |
Bio-Rad Laboratories Incorporated Class A (Health Care, Life Sciences Tools & Services) † | | | | | | | 26,900 | | | | 3,314,349 | |
Brown & Brown Incorporated (Financials, Insurance) | | | | | | | 134,222 | | | | 3,997,131 | |
Cambrex Corporation (Health Care, Life Sciences Tools & Services) † | | | | | | | 80,900 | | | | 1,657,641 | |
CARBO Ceramics Incorporated (Energy, Energy Equipment & Services) « | | | | | | | 13,300 | | | | 1,860,803 | |
Christopher & Banks Corporation (Consumer Discretionary, Specialty Retail) † | | | | | | | 233,928 | | | | 1,459,711 | |
Clean Harbors Incorporated (Industrials, Commercial Services & Supplies) † | | | | | | | 73,600 | | | | 4,416,000 | |
Comstock Resources Incorporated (Energy, Oil, Gas & Consumable Fuels) « | | | | | | | 70,140 | | | | 1,949,892 | |
Delta Apparel Incorporated (Consumer Discretionary, Textiles, Apparel & Luxury Goods) † | | | | | | | 102,600 | | | | 1,562,598 | |
Denny’s Corporation (Consumer Discretionary, Hotels, Restaurants & Leisure) † | | | | | | | 622,860 | | | | 4,198,076 | |
Domino’s Pizza Group plc (Consumer Discretionary, Hotels, Restaurants & Leisure) | | | | | | | 290,956 | | | | 2,525,024 | |
Douglas Dynamics Incorporated (Industrials, Machinery) | | | | | | | 167,902 | | | | 2,832,507 | |
First Citizens BancShares Incorporated (Financials, Banks) | | | | | | | 16,105 | | | | 3,621,853 | |
Forward Air Corporation (Industrials, Air Freight & Logistics) | | | | | | | 99,805 | | | | 4,414,375 | |
Franklin Electric Company Incorporated (Industrials, Electrical Equipment) | | | | | | | 108,162 | | | | 4,182,625 | |
Guess? Incorporated (Consumer Discretionary, Specialty Retail) | | | | | | | 86,200 | | | | 2,319,642 | |
Haemonetics Corporation (Health Care, Health Care Equipment & Supplies) † | | | | | | | 108,100 | | | | 3,281,916 | |
ICU Medical Incorporated (Health Care, Health Care Equipment & Supplies) † | | | | | | | 28,169 | | | | 1,571,267 | |
Imation Corporation (Information Technology, Technology Hardware, Storage & Peripherals) † | | | | | | | 541,188 | | | | 2,337,932 | |
Innospec Incorporated (Materials, Chemicals) | | | | | | | 41,800 | | | | 1,799,908 | |
The accompanying notes are an integral part of these financial statements.
| | | | |
| 10 | | Wells Fargo Advantage Global Opportunities Fund | | Portfolio of investments—April 30, 2014 (unaudited) |
| | | | | | | | | | | | | | |
| Security name | | | | | | | Shares | | | Value | |
| | | | | | | | | | | | | | |
| | | | |
| United States (continued) | | | | | | | | | | | | | | |
Ixia Corporation (Information Technology, Communications Equipment) † | | | | | | | | | 176,000 | | | $ | 2,185,920 | |
JTH Holding Incorporated Class A (Consumer Discretionary, Diversified Consumer Services) Ǡ | | | | | | | | | 78,300 | | | | 2,129,760 | |
Kadant Incorporated (Industrials, Machinery) | | | | | | | | | 121,673 | | | | 4,228,137 | |
Krispy Kreme Doughnuts Incorporated (Consumer Discretionary, Hotels, Restaurants & Leisure) † | | | | | | | | | 179,300 | | | | 3,144,922 | |
Lattice Semiconductor Corporation (Information Technology, Semiconductors & Semiconductor Equipment) † | | | | | | | | | 365,700 | | | | 3,079,194 | |
Macquarie Infrastructure Company LLC (Industrials, Transportation Infrastructure) | | | | | | | | | 51,367 | | | | 2,954,630 | |
Matthews International Corporation Class A (Consumer Discretionary, Diversified Consumer Services) | | | | | | | | | 69,840 | | | | 2,818,044 | |
MRC Global Incorporated (Industrials, Trading Companies & Distributors) † | | | | | | | | | 62,483 | | | | 1,823,879 | |
Mueller Industries Incorporated (Industrials, Machinery) | | | | | | | | | 135,600 | | | | 3,924,264 | |
Neenah Paper Incorporated (Materials, Paper & Forest Products) | | | | | | | | | 63,350 | | | | 3,190,940 | |
NetScout Systems Incorporated (Information Technology, Software) † | | | | | | | | | 80,800 | | | | 3,147,968 | |
Parexel International Corporation (Health Care, Life Sciences Tools & Services) † | | | | | | | | | 54,700 | | | | 2,480,645 | |
Penn Virginia Corporation (Energy, Oil, Gas & Consumable Fuels) Ǡ | | | | | | | | | 164,700 | | | | 2,740,608 | |
Pier 1 Imports Incorporated (Consumer Discretionary, Specialty Retail) | | | | | | | | | 78,100 | | | | 1,426,106 | |
Post Properties Incorporated (Financials, REITs) | | | | | | | | | 62,000 | | | | 3,113,020 | |
ProAssurance Corporation (Financials, Insurance) | | | | | | | | | 50,100 | | | | 2,275,542 | |
Progress Software Corporation (Information Technology, Software) † | | | | | | | | | 70,500 | | | | 1,512,930 | |
Quanex Building Products Corporation (Industrials, Building Products) | | | | | | | | | 75,689 | | | | 1,425,981 | |
Schweitzer Manduit International Incorporated (Materials, Paper & Forest Products) | | | | | | | | | 77,600 | | | | 3,386,464 | |
Simpson Manufacturing Company Incorporated (Industrials, Building Products) | | | | | | | | | 116,916 | | | | 3,833,676 | |
Steel Excel Incorporated (Energy, Energy Equipment & Services) † | | | | | | | | | 59,068 | | | | 1,913,803 | |
Steris Corporation (Health Care, Health Care Equipment & Supplies) | | | | | | | | | 80,400 | | | | 3,863,220 | |
Stone Energy Corporation (Energy, Oil, Gas & Consumable Fuels) † | | | | | | | | | 24,564 | | | | 1,204,864 | |
Thoratec Corporation (Health Care, Health Care Equipment & Supplies) † | | | | | | | | | 22,200 | | | | 727,716 | |
TIBCO Software Incorporated (Information Technology, Software) † | | | | | | | | | 136,900 | | | | 2,687,347 | |
TreeHouse Foods Incorporated (Consumer Staples, Food Products) † | | | | | | | | | 61,500 | | | | 4,602,660 | |
UMB Financial Corporation (Financials, Banks) | | | | | | | | | 43,700 | | | | 2,565,627 | |
Virtus Investment Partners Incorporated (Financials, Capital Markets) † | | | | | | | | | 13,400 | | | | 2,478,866 | |
Vishay Intertechnology Incorporated (Information Technology, Electronic Equipment, Instruments & Components) | | | | | | | | | 251,090 | | | | 3,570,500 | |
WD-40 Company (Consumer Staples, Household Products) | | | | | | | | | 25,400 | | | | 1,850,136 | |
West Pharmaceutical Services Incorporated (Health Care, Health Care Equipment & Supplies) | | | | | | | | | 57,100 | | | | 2,476,999 | |
| | | | |
| | | | | | | | | | | | | 144,536,207 | |
| | | | | | | | | | | | | | |
| | | | |
Total Common Stocks (Cost $238,480,783) | | | | | | | | | | | | | 284,394,721 | |
| | | | | | | | | | | | | | |
| | | | |
| | | Dividend yield | | | | | | | | | |
| Preferred Stocks: 0.25% | | | | | | | | | | | | | | |
| | | | |
| Germany: 0.25% | | | | | | | | | | | | | | |
Draegerwerk AG & Company KGAA (Health Care, Health Care Equipment & Supplies) | | | 0.96 | % | | | | | 6,444 | | | | 761,695 | |
| | | | | | | | | | | | | | |
| | | | |
Total Preferred Stocks (Cost $796,558) | | | | | | | | | | | | | 761,695 | |
| | | | | | | | | | | | | | |
| | | | |
Investment Companies: 0.91% | | | | | | | | | | | | | | |
| | | | |
| United States: 0.91% | | | | | | | | | | | | | | |
iShares MSCI EAFE Small Cap Index Fund | | | | | | | | | 52,681 | | | | 2,740,466 | |
| | | | | | | | | | | | | | |
| | | | |
Total Investment Companies (Cost $2,733,643) | | | | | | | | | | | | | 2,740,466 | |
| | | | | | | | | | | | | | |
The accompanying notes are an integral part of these financial statements.
| | | | | | |
| Portfolio of investments—April 30, 2014 (unaudited) | | Wells Fargo Advantage Global Opportunities Fund | | | 11 | |
| | | | | | | | | | | | | | |
| Security name | | Yield | | | | | Shares | | | Value | |
| | | | | | | | | | | | | | |
| | | | |
Short-Term Investments: 11.39% | | | | | | | | | | | | | | |
| | | | |
| Investment Companies: 11.39% | | | | | | | | | | | | | | |
Wells Fargo Advantage Cash Investment Money Market Fund, Select Class (u)(l) | | | 0.07 | % | | | | | 13,853,546 | | | $ | 13,853,546 | |
Wells Fargo Securities Lending Cash Investments, LLC (u)(l)(v)(r) | | | 0.11 | | | | | | 20,619,022 | | | | 20,619,022 | |
| | | | |
Total Short-Term Investments (Cost $34,472,568) | | | | | | | | | | | | | 34,472,568 | |
| | | | | | | | | | | | | | |
| | | | | | | | |
| Total investments in securities | | | | | | | | |
| (Cost $276,483,552) * | | | 106.56 | % | | | 322,369,450 | |
Other assets and liabilities, net | | | (6.56 | ) | | | (19,845,589 | ) |
| | | | | | | | |
Total net assets | | | 100.00 | % | | $ | 302,523,861 | |
| | | | | | | | |
| † | Non-income-earning security |
| « | All or a portion of this security is on loan. |
| (u) | Rate shown is the 7-day annualized yield at period end. |
| (l) | Represents an affiliate of the Fund under Sections 2(a)(2) and 2(a)(3) of the Investment Company Act of 1940, as amended |
| (a) | Security is fair valued by the Management Valuation Team, and in certain instances by the Board of Trustees, in accordance with procedures approved by the Board of Trustees. |
| (v) | Security represents investment of cash collateral received from securities on loan. |
| (r) | The investment company is exempt from registration under Section 3(c)(7) of the Investment Company Act of 1940, as amended. |
| * | Cost for federal income tax purposes is $277,641,959 and unrealized appreciation (depreciation) consists of: |
| | | | |
Gross unrealized appreciation | | $ | 54,825,003 | |
Gross unrealized depreciation | | | (10,097,512 | ) |
| | | | |
Net unrealized appreciation | | $ | 44,727,491 | |
The accompanying notes are an integral part of these financial statements.
| | | | |
| 12 | | Wells Fargo Advantage Global Opportunities Fund | | Statement of assets and liabilities—April 30, 2014 (unaudited) |
| | | | |
| | | | |
| |
Assets | | | | |
Investments | | | | |
In unaffiliated securities (including securities on loan), at value (see cost below) | | $ | 287,896,882 | |
In affiliated securities, at value (see cost below) | | | 34,472,568 | |
| | | | |
Total investments, at value (see cost below) | | | 322,369,450 | |
Foreign currency, at value (see cost below) | | | 77,763 | |
Receivable for investments sold | | | 2,420,113 | |
Receivable for Fund shares sold | | | 110,287 | |
Receivable for dividends | | | 714,900 | |
Receivable for securities lending income | | | 16,062 | |
Prepaid expenses and other assets | | | 38,868 | |
| | | | |
Total assets | | | 325,747,443 | |
| | | | |
| |
Liabilities | | | | |
Payable for investments purchased | | | 1,759,685 | |
Payable for Fund shares redeemed | | | 380,280 | |
Unrealized losses on forward foreign currency contracts | | | 42,504 | |
Payable upon receipt of securities loaned | | | 20,619,022 | |
Advisory fee payable | | | 222,411 | |
Distribution fees payable | | | 38,158 | |
Due to other related parties | | | 69,923 | |
Accrued expenses and other liabilities | | | 91,599 | |
| | | | |
Total liabilities | | | 23,223,582 | |
| | | | |
Total net assets | | $ | 302,523,861 | |
| | | | |
| |
NET ASSETS CONSIST OF | | | | |
Paid-in capital | | $ | 228,809,244 | |
Accumulated net investment loss | | | (285,735 | ) |
Accumulated net realized gains on investments | | | 28,153,592 | |
Net unrealized gains on investments | | | 45,846,760 | |
| | | | |
Total net assets | | $ | 302,523,861 | |
| | | | |
| |
COMPUTATION OF NET ASSET VALUE AND OFFERING PRICE PER SHARE1 | | | | |
Net assets – Class A | | $ | 182,533,362 | |
Shares outstanding – Class A | | | 4,102,508 | |
Net asset value per share – Class A | | | $44.49 | |
Maximum offering price per share – Class A2 | | | $47.20 | |
Net assets – Class B | | $ | 15,862,456 | |
Shares outstanding – Class B | | | 443,773 | |
Net asset value per share – Class B | | | $35.74 | |
Net assets – Class C | | $ | 45,262,355 | |
Shares outstanding – Class C | | | 1,259,924 | |
Net asset value per share – Class C | | | $35.92 | |
Net assets – Administrator Class | | $ | 56,696,868 | |
Shares outstanding – Administrator Class | | | 1,236,912 | |
Net asset value per share – Administrator Class | | | $45.84 | |
Net assets – Institutional Class | | $ | 2,168,820 | |
Shares outstanding – Institutional Class | | | 47,306 | |
Net asset value per share – Institutional Class | | | $45.85 | |
| |
Investments in unaffiliated securities (including securities on loan), at cost | | $ | 242,010,984 | |
| | | | |
Investments in affiliated securities, at cost | | $ | 34,472,568 | |
| | | | |
Total investments, at cost | | $ | 276,483,552 | |
| | | | |
Securities on loan, at value | | $ | 19,766,459 | |
| | | | |
Foreign currency, at cost | | $ | 77,337 | |
| | | | |
| 1. | The Fund has an unlimited number of authorized shares. |
| 2. | Maximum offering price is computed as 100/94.25 of net asset value. On investments of $50,000 or more, the offering price is reduced. |
The accompanying notes are an integral part of these financial statements.
| | | | | | |
| Statement of operations—six months ended April 30, 2014 (unaudited) | | Wells Fargo Advantage Global Opportunities Fund | | | 13 | |
| | | | |
| | | | |
| |
Investment income | | | | |
Dividends* | | $ | 2,125,399 | |
Securities lending income, net | | | 61,235 | |
Income from affiliated securities | | | 3,455 | |
| | | | |
Total investment income | | | 2,190,089 | |
| | | | |
| |
Expenses | | | | |
Advisory fee | | | 1,352,850 | |
Administration fees | | | | |
Fund level | | | 75,158 | |
Class A | | | 235,333 | |
Class B | | | 23,444 | |
Class C | | | 58,329 | |
Administrator Class | | | 27,272 | |
Institutional Class | | | 865 | |
Shareholder servicing fees | | | | |
Class A | | | 226,281 | |
Class B | | | 22,543 | |
Class C | | | 56,086 | |
Administrator Class | | | 66,608 | |
Distribution fees | | | | |
Class B | | | 67,628 | |
Class C | | | 168,257 | |
Custody and accounting fees | | | 49,871 | |
Professional fees | | | 25,630 | |
Registration fees | | | 36,888 | |
Shareholder report expenses | | | 29,851 | |
Trustees’ fees and expenses | | | 4,494 | |
Other fees and expenses | | | 12,553 | |
| | | | |
Total expenses | | | 2,539,941 | |
Less: Fee waivers and/or expense reimbursements | | | (20,574 | ) |
| | | | |
Net expenses | | | 2,519,367 | |
| | | | |
Net investment loss | | | (329,278 | ) |
| | | | |
| |
REALIZED AND UNREALIZED GAINS (LOSSES) ON INVESTMENTS | | | | |
| |
Net realized gains on: | | | | |
Unaffiliated securities | | | 29,704,759 | |
Forward foreign currency contract transactions | | | 158,592 | |
| | | | |
Net realized gains on investments | | | 29,863,351 | |
| | | | |
| |
Net change in unrealized gains (losses) on: | | | | |
Unaffiliated securities | | | (15,039,453 | ) |
Forward foreign currency contract transactions | | | 20,887 | |
| | | | |
Net change in unrealized gains (losses) on investments | | | (15,018,566 | ) |
| | | | |
Net realized and unrealized gains (losses) on investments | | | 14,844,785 | |
| | | | |
Net increase in net assets resulting from operations | | $ | 14,515,507 | |
| | | | |
| |
* Net of foreign dividend withholding taxes in the amount of | | | $131,680 | |
The accompanying notes are an integral part of these financial statements.
| | | | |
| 14 | | Wells Fargo Advantage Global Opportunities Fund | | Statement of changes in net assets |
| | | | | | | | | | | | | | | | |
| | | Six months ended
April 30, 2014
(unaudited) | | | Year ended
October 31, 2013 | |
| | | |
Operations | | | | | | | | | | | | |
Net investment income (loss) | | | | | | $ | (329,278 | ) | | | | | | $ | 795,129 | |
Net realized gains on investments | | | | | | | 29,863,351 | | | | | | | | 27,401,708 | |
Net change in unrealized gains (losses) on investments | | | | | | | (15,018,566 | ) | | | | | | | 42,631,128 | |
| | | | |
Net increase in net assets resulting from operations | | | | | | | 14,515,507 | | | | | | | | 70,827,965 | |
| | | | |
| | | |
Distributions to shareholders from | | | | | | | | | | | | |
Net investment income | | | | | | | | | | | | | | | | |
Class A | | | | | | | (1,289,730 | ) | | | | | | | (1,067,960 | ) |
Class C | | | | | | | (17,006 | ) | | | | | | | 0 | |
Administrator Class | | | | | | | (475,665 | ) | | | | | | | (373,726 | ) |
Institutional Class | | | | | | | (23,151 | ) | | | | | | | (14,154 | ) |
| | | | |
Total distributions to shareholders | | | | | | | (1,805,552 | ) | | | | | | | (1,455,840 | ) |
| | | | |
Capital share transactions | | | Shares | | | | | | | | Shares | | | | | |
Proceeds from shares sold | | | | | | | | | | | | | | | | |
Class A | | | 210,082 | | | | 9,179,193 | | | | 484,022 | | | | 17,866,296 | |
Class B | | | 3,947 | | | | 137,904 | | | | 4,112 | | | | 121,376 | |
Class C | | | 39,620 | | | | 1,388,278 | | | | 155,555 | | | | 4,623,064 | |
Administrator Class | | | 152,208 | | | | 6,832,887 | | | | 377,643 | | | | 14,366,714 | |
Institutional Class | | | 2,339 | | | | 105,223 | | | | 19,455 | | | | 761,308 | |
| | | | |
| | | | | | | 17,643,485 | | | | | | | | 37,738,758 | |
| | | | |
Reinvestment of distributions | | | | | | | | | | | | | | | | |
Class A | | | 27,164 | | | | 1,188,435 | | | | 28,779 | | | | 974,154 | |
Class C | | | 392 | | | | 13,875 | | | | 0 | | | | 0 | |
Administrator Class | | | 9,728 | | | | 438,256 | | | | 9,897 | | | | 344,916 | |
Institutional Class | | | 514 | | | | 23,151 | | | | 383 | | | | 13,316 | |
| | | | |
| | | | | | | 1,663,717 | | | | | | | | 1,332,386 | |
| | | | |
Payment for shares redeemed | | | | | | | | | | | | | | | | |
Class A | | | (393,499 | ) | | | (17,152,277 | ) | | | (969,493 | ) | | | (35,467,108 | ) |
Class B | | | (129,186 | ) | | | (4,546,000 | ) | | | (231,830 | ) | | | (6,863,585 | ) |
Class C | | | (78,651 | ) | | | (2,776,908 | ) | | | (269,508 | ) | | | (7,957,078 | ) |
Administrator Class | | | (117,198 | ) | | | (5,260,801 | ) | | | (492,106 | ) | | | (18,398,520 | ) |
Institutional Class | | | (4,369 | ) | | | (197,373 | ) | | | (7,895 | ) | | | (306,596 | ) |
| | | | |
| | | | | | | (29,933,359 | ) | | | | | | | (68,992,887 | ) |
| | | | |
Net decrease in net assets resulting from capital share transactions | | | | | | | (10,626,157 | ) | | | | | | | (29,921,743 | ) |
| | | | |
Total increase in net assets | | | | | | | 2,083,798 | | | | | | | | 39,450,382 | |
| | | | |
| | |
Net assets | | | | | | | | |
Beginning of period | | | | | | | 300,440,063 | | | | | | | | 260,989,681 | |
| | | | |
End of period | | | | | | $ | 302,523,861 | | | | | | | $ | 300,440,063 | |
| | | | |
Undistributed (accumulated) net investment income (loss) | | | | | | $ | (285,735 | ) | | | | | | $ | 1,849,095 | |
| | | | |
The accompanying notes are an integral part of these financial statements.
| | | | | | |
| Financial highlights | | Wells Fargo Advantage Global Opportunities Fund | | | 15 | |
(For a share outstanding throughout each period)
| | | | | | | | | | | | | | | | | | | | | | | | |
| | | Six months ended
April 30, 2014
(unaudited) | | | Year ended October 31 | |
| CLASS A | | | 2013 | | | 2012 | | | 2011 | | | 20101 | | | 20091 | |
Net asset value, beginning of period | | $ | 42.68 | | | $ | 33.17 | | | $ | 30.14 | | | $ | 31.91 | | | $ | 24.96 | | | $ | 21.20 | |
Net investment income (loss) | | | (0.02 | )2 | | | 0.16 | 2 | | | 0.20 | 2 | | | 0.12 | 2 | | | 0.07 | 2 | | | 0.10 | 2 |
Net realized and unrealized gains (losses) on investments | | | 2.14 | | | | 9.58 | | | | 2.87 | | | | (1.89 | ) | | | 6.99 | | | | 3.74 | |
| | | | | | | | | | | | | | | | | | | | | | | | |
Total from investment operations | | | 2.12 | | | | 9.74 | | | | 3.07 | | | | (1.77 | ) | | | 7.06 | | | | 3.84 | |
Distributions to shareholders from | | | | | | | | | | | | | | | | | | | | | | | | |
Net investment income | | | (0.31 | ) | | | (0.23 | ) | | | (0.04 | ) | | | 0.00 | | | | (0.11 | ) | | | (0.08 | ) |
Net asset value, end of period | | $ | 44.49 | | | $ | 42.68 | | | $ | 33.17 | | | $ | 30.14 | | | $ | 31.91 | | | $ | 24.96 | |
Total return3 | | | 4.98 | % | | | 29.50 | % | | | 10.24 | % | | | (5.55 | )% | | | 28.41 | % | | | 18.22 | % |
Ratios to average net assets (annualized) | | | | | | | | | | | | | | | | | | | | | | | | |
Gross expenses | | | 1.57 | % | | | 1.59 | % | | | 1.55 | % | | | 1.55 | % | | | 1.66 | % | | | 1.72 | % |
Net expenses | | | 1.55 | % | | | 1.55 | % | | | 1.54 | % | | | 1.53 | % | | | 1.63 | % | | | 1.72 | % |
Net investment income (loss) | | | (0.09 | )% | | | 0.43 | % | | | 0.65 | % | | | 0.34 | % | | | 0.25 | % | | | 0.45 | % |
Supplemental data | | | | | | | | | | | | | | | | | | | | | | | | |
Portfolio turnover rate | | | 40 | % | | | 59 | % | | | 85 | % | | | 76 | % | | | 104 | % | | | 170 | % |
Net assets, end of period (000s omitted) | | | $182,533 | | | | $181,764 | | | | $156,433 | | | | $174,937 | | | | $212,729 | | | | $197,721 | |
| 1. | After the close of business on July 16, 2010, the Fund acquired the net assets of Evergreen Global Opportunities Fund which became the accounting and performance survivor in the transaction. The information for the periods prior to July 19, 2010 is that of Class A of Evergreen Global Opportunities Fund. |
| 2. | Calculated based upon average shares outstanding |
| 3. | Total return calculations do not include any sales charges. Returns for periods of less than one year are not annualized. |
The accompanying notes are an integral part of these financial statements.
| | | | |
| 16 | | Wells Fargo Advantage Global Opportunities Fund | | Financial highlights |
(For a share outstanding throughout each period)
| | | | | | | | | | | | | | | | | | | | | | | | |
| | | Six months ended
April 30, 2014 (unaudited) | | | Year ended October 31 | |
| CLASS B | | | 2013 | | | 2012 | | | 2011 | | | 20101 | | | 20091 | |
Net asset value, beginning of period | | $ | 34.18 | | | $ | 26.58 | | | $ | 24.30 | | | $ | 25.92 | | | $ | 20.33 | | | $ | 17.34 | |
Net investment loss | | | (0.15 | )2 | | | (0.09 | )2 | | | (0.03 | )2 | | | (0.12 | )2 | | | (0.11 | )2 | | | (0.05 | )2 |
Net realized and unrealized gains (losses) on investments | | | 1.71 | | | | 7.69 | | | | 2.31 | | | | (1.50 | ) | | | 5.70 | | | | 3.04 | |
| | | | | | | | | | | | | | | | | | | | | | | | |
Total from investment operations | | | 1.56 | | | | 7.60 | | | | 2.28 | | | | (1.62 | ) | | | 5.59 | | | | 2.99 | |
Net asset value, end of period | | $ | 35.74 | | | $ | 34.18 | | | $ | 26.58 | | | $ | 24.30 | | | $ | 25.92 | | | $ | 20.33 | |
Total return3 | | | 4.56 | % | | | 28.54 | % | | | 9.42 | % | | | (6.25 | )% | | | 27.43 | % | | | 17.30 | % |
Ratios to average net assets (annualized) | | | | | | | | | | | | | | | | | | | | | | | | |
Gross expenses | | | 2.31 | % | | | 2.34 | % | | | 2.30 | % | | | 2.30 | % | | | 2.41 | % | | | 2.47 | % |
Net expenses | | | 2.30 | % | | | 2.30 | % | | | 2.29 | % | | | 2.28 | % | | | 2.38 | % | | | 2.47 | % |
Net investment loss | | | (0.87 | )% | | | (0.32 | )% | | | (0.10 | )% | | | (0.43 | )% | | | (0.49 | )% | | | (0.30 | )% |
Supplemental data | | | | | | | | | | | | | | | | | | | | | | | | |
Portfolio turnover rate | | | 40 | % | | | 59 | % | | | 85 | % | | | 76 | % | | | 104 | % | | | 170 | % |
Net assets, end of period (000s omitted) | | | $15,862 | | | | $19,446 | | | | $21,181 | | | | $26,598 | | | | $37,752 | | | | $34,934 | |
| 1. | After the close of business on July 16, 2010, the Fund acquired the net assets of Evergreen Global Opportunities Fund which became the accounting and performance survivor in the transaction. The information for the periods prior to July 19, 2010 is that of Class B of Evergreen Global Opportunities Fund. |
| 2. | Calculated based upon average shares outstanding |
| 3. | Total return calculations do not include any sales charges. Returns for periods of less than one year are not annualized. |
The accompanying notes are an integral part of these financial statements.
| | | | | | |
| Financial highlights | | Wells Fargo Advantage Global Opportunities Fund | | | 17 | |
(For a share outstanding throughout each period)
| | | | | | | | | | | | | | | | | | | | | | | | |
| | | Six months ended
April 30, 2014 (unaudited) | | | Year ended October 31 | |
| CLASS C | | | 2013 | | | 2012 | | | 2011 | | | 20101 | | | 20091 | |
Net asset value, beginning of period | | $ | 34.36 | | | $ | 26.73 | | | $ | 24.43 | | | $ | 26.05 | | | $ | 20.44 | | | $ | 17.44 | |
Net investment loss | | | (0.15 | )2 | | | (0.09 | )2 | | | (0.03 | )2 | | | (0.11 | )2 | | | (0.11 | )2 | | | (0.05 | )2 |
Net realized and unrealized gains (losses) on investments | | | 1.72 | | | | 7.72 | | | | 2.33 | | | | (1.51 | ) | | | 5.72 | | | | 3.05 | |
| | | | | | | | | | | | | | | | | | | | | | | | |
Total from investment operations | | | 1.57 | | | | 7.63 | | | | 2.30 | | | | (1.62 | ) | | | 5.61 | | | | 3.00 | |
Distributions to shareholders from | | | | | | | | | | | | | | | | | | | | | | | | |
Net investment income | | | (0.01 | ) | | | 0.00 | | | | 0.00 | | | | 0.00 | | | | 0.00 | | | | 0.00 | |
Net asset value, end of period | | $ | 35.92 | | | $ | 34.36 | | | $ | 26.73 | | | $ | 24.43 | | | $ | 26.05 | | | $ | 20.44 | |
Total return3 | | | 4.58 | % | | | 28.54 | % | | | 9.41 | % | | | (6.25 | )% | | | 27.43 | % | | | 17.33 | % |
Ratios to average net assets (annualized) | | | | | | | | | | | | | | | | | | | | | | | | |
Gross expenses | | | 2.32 | % | | | 2.34 | % | | | 2.30 | % | | | 2.30 | % | | | 2.41 | % | | | 2.47 | % |
Net expenses | | | 2.30 | % | | | 2.30 | % | | | 2.29 | % | | | 2.28 | % | | | 2.38 | % | | | 2.47 | % |
Net investment loss | | | (0.84 | )% | | | (0.31 | )% | | | (0.11 | )% | | | (0.41 | )% | | | (0.50 | )% | | | (0.30 | )% |
Supplemental data | | | | | | | | | | | | | | | | | | | | | | | | |
Portfolio turnover rate | | | 40 | % | | | 59 | % | | | 85 | % | | | 76 | % | | | 104 | % | | | 170 | % |
Net assets, end of period (000s omitted) | | | $45,262 | | | | $44,618 | | | | $37,753 | | | | $45,135 | | | | $52,866 | | | | $50,218 | |
| 1. | After the close of business on July 16, 2010, the Fund acquired the net assets of Evergreen Global Opportunities Fund which became the accounting and performance survivor in the transaction. The information for the periods prior to July 19, 2010 is that of Class C of Evergreen Global Opportunities Fund. |
| 2. | Calculated based upon average shares outstanding |
| 3. | Total return calculations do not include any sales charges. Returns for periods of less than one year are not annualized. |
The accompanying notes are an integral part of these financial statements.
| | | | |
| 18 | | Wells Fargo Advantage Global Opportunities Fund | | Financial highlights |
(For a share outstanding throughout each period)
| | | | | | | | | | | | | | | | | | | | | | | | |
| | | Six months ended
April 30, 2014 (unaudited) | | | Year ended October 31 | |
| ADMINISTRATOR CLASS | | | 2013 | | | 2012 | | | 2011 | | | 20101 | | | 20091 | |
Net asset value, beginning of period | | $ | 44.00 | | | $ | 34.21 | | | $ | 31.10 | | | $ | 32.92 | | | $ | 25.73 | | | $ | 21.91 | |
Net investment income | | | 0.02 | 2 | | | 0.22 | 2 | | | 0.26 | 2 | | | 0.15 | | | | 0.14 | 2 | | | 0.16 | |
Net realized and unrealized gains (losses) on investments | | | 2.21 | | | | 9.86 | | | | 2.96 | | | | (1.93 | ) | | | 7.23 | | | | 3.85 | |
| | | | | | | | | | | | | | | | | | | | | | | | |
Total from investment operations | | | 2.23 | | | | 10.08 | | | | 3.22 | | | | (1.78 | ) | | | 7.37 | | | | 4.01 | |
Distributions to shareholders from | | | | | | | | | | | | | | | | | | | | | | | | |
Net investment income | | | (0.39 | ) | | | (0.29 | ) | | | (0.11 | ) | | | (0.04 | ) | | | (0.18 | ) | | | (0.19 | ) |
Net asset value, end of period | | $ | 45.84 | | | $ | 44.00 | | | $ | 34.21 | | | $ | 31.10 | | | $ | 32.92 | | | $ | 25.73 | |
Total return3 | | | 5.03 | % | | | 29.73 | % | | | 10.44 | % | | | (5.39 | )% | | | 28.77 | % | | | 18.45 | % |
Ratios to average net assets (annualized) | | | | | | | | | | | | | | | | | | | | | | | | |
Gross expenses | | | 1.40 | % | | | 1.42 | % | | | 1.38 | % | | | 1.37 | % | | | 1.43 | % | | | 1.47 | % |
Net expenses | | | 1.40 | % | | | 1.40 | % | | | 1.38 | % | | | 1.36 | % | | | 1.40 | % | | | 1.47 | % |
Net investment income | | | 0.07 | % | | | 0.58 | % | | | 0.81 | % | | | 0.53 | % | | | 0.49 | % | | | 0.69 | % |
Supplemental data | | | | | | | | | | | | | | | | | | | | | | | | |
Portfolio turnover rate | | | 40 | % | | | 59 | % | | | 85 | % | | | 76 | % | | | 104 | % | | | 170 | % |
Net assets, end of period (000s omitted) | | | $56,697 | | | | $52,461 | | | | $44,360 | | | | $49,860 | | | | $46,106 | | | | $38,977 | |
| 1. | After the close of business on July 16, 2010, the Fund acquired the net assets of Evergreen Global Opportunities Fund which became the accounting and performance survivor in the transaction. The information for the periods prior to July 19, 2010 is that of Class I of Evergreen Global Opportunities Fund. |
| 2. | Calculated based upon average shares outstanding |
| 3. | Returns for periods of less than one year are not annualized. |
The accompanying notes are an integral part of these financial statements.
| | | | | | |
| Financial highlights | | Wells Fargo Advantage Global Opportunities Fund | | | 19 | |
(For a share outstanding throughout each period)
| | | | | | | | | | | | | | | | | | | | |
| | | Six months ended
April 30, 2014 (unaudited) | | | Year ended October 31 | |
| INSTITUTIONAL CLASS | | | 2013 | | | 2012 | | | 2011 | | | 20101 | |
Net asset value, beginning of period | | $ | 44.05 | | | $ | 34.25 | | | $ | 31.18 | | | $ | 32.94 | | | $ | 28.37 | |
Net investment income | | | 0.09 | | | | 0.32 | 2 | | | 0.36 | 2 | | | 0.25 | | | | 0.04 | 2 |
Net realized and unrealized gains (losses) on investments | | | 2.20 | | | | 9.86 | | | | 2.93 | | | | (1.94 | ) | | | 4.53 | |
| | | | | | | | | | | | | | | | | | | | |
Total from investment operations | | | 2.29 | | | | 10.18 | | | | 3.29 | | | | (1.69 | ) | | | 4.57 | |
Distributions to shareholders from | | | | | | | | | | | | | | | | | | | | |
Net investment income | | | (0.49 | ) | | | (0.38 | ) | | | (0.22 | ) | | | (0.07 | ) | | | 0.00 | |
Net asset value, end of period | | $ | 45.85 | | | $ | 44.05 | | | $ | 34.25 | | | $ | 31.18 | | | $ | 32.94 | |
Total return3 | | | 5.17 | % | | | 30.06 | % | | | 10.70 | % | | | (5.15 | )% | | | 16.11 | % |
Ratios to average net assets (annualized) | | | | | | | | | | | | | | | | | | | | |
Gross expenses | | | 1.14 | % | | | 1.16 | % | | | 1.12 | % | | | 1.08 | % | | | 1.22 | % |
Net expenses | | | 1.14 | % | | | 1.15 | % | | | 1.12 | % | | | 1.08 | % | | | 1.15 | % |
Net investment income | | | 0.32 | % | | | 0.83 | % | | | 1.13 | % | | | 1.18 | % | | | 0.53 | % |
Supplemental data | | | | | | | | | | | | | | | | | | | | |
Portfolio turnover rate | | | 40 | % | | | 59 | % | | | 85 | % | | | 76 | % | | | 104 | % |
Net assets, end of period (000s omitted) | | | $2,169 | | | | $2,151 | | | | $1,263 | | | | $1,486 | | | | $12 | |
| 1. | For the period from July 30, 2010 (commencement of class operations) to October 31, 2010 |
| 2. | Calculated based upon average shares outstanding |
| 3. | Returns for periods of less than one year are not annualized. |
The accompanying notes are an integral part of these financial statements.
| | | | |
| 20 | | Wells Fargo Advantage Global Opportunities Fund | | Notes to financial statements (unaudited) |
1. ORGANIZATION
Wells Fargo Funds Trust (the “Trust”), a Delaware statutory trust organized on March 10, 1999, is an open-end management investment company registered under the Investment Company Act of 1940, as amended (the “1940 Act”). These financial statements report on the Wells Fargo Advantage Global Opportunities Fund (the “Fund”) which is a diversified series of the Trust.
2. SIGNIFICANT ACCOUNTING POLICIES
The following significant accounting policies, which are consistently followed in the preparation of the financial statements of the Fund, are in conformity with U.S. generally accepted accounting principles which require management to make estimates and assumptions that affect the reported amounts of assets and liabilities, disclosure of contingent assets and liabilities at the date of the financial statements, and the reported amounts of revenues and expenses during the reporting period. Actual results could differ from those estimates.
Securities valuation
All investments are valued each business day as of the close of regular trading on the New York Stock Exchange (generally 4 p.m. Eastern Time).
Equity securities that are listed on a foreign or domestic exchange or market are valued at the official closing price or, if none, the last sales price. If no sale occurs on the primary exchange or market for the security that day, the prior day’s price will be deemed “stale” and fair values will be determined in accordance with the Fund’s Valuation Procedures.
The values of securities denominated in foreign currencies are translated into U.S. dollars at rates provided by an independent foreign currency pricing source at a time each business day specified by the Management Valuation Team of Wells Fargo Funds Management, LLC (“Funds Management”).
Many securities markets and exchanges outside the U.S. close prior to the close of the New York Stock Exchange and therefore may not fully reflect trading or events that occur after the close of the principal exchange in which the foreign securities are traded, but before the close of the New York Stock Exchange. If such trading or events are expected to materially affect the value of such securities, then fair value pricing procedures approved by the Board of Trustees of the Fund are applied. These procedures take into account multiple factors including movements in U.S. securities markets after foreign exchanges close. Foreign securities that are fair valued under these procedures are categorized as Level 2 and the application of these procedures may result in transfers between Level 1 and Level 2. Depending on market activity, such fair valuations may be frequent. Such fair value pricing may result in NAVs that are higher or lower than NAVs based on the last reported sales price or latest quoted bid price. On April 30, 2014, such fair value pricing was not used in pricing foreign securities.
Investments in registered open-end investment companies are valued at net asset value. Non-registered investment vehicles are fair valued at net asset value.
Investments which are not valued using any of the methods discussed above are valued at their fair value, as determined in good faith by the Board of Trustees. The Board of Trustees has established a Valuation Committee comprised of the Trustees and has delegated to it the authority to take any actions regarding the valuation of portfolio securities that the Valuation Committee deems necessary or appropriate, including determining the fair value of portfolio securities, unless the determination has been delegated to the Management Valuation Team. The Board of Trustees retains the authority to make or ratify any valuation decisions or approve any changes to the Valuation Procedures as it deems appropriate. On a quarterly basis, the Board of Trustees receives reports on any valuation actions taken by the Valuation Committee or the Management Valuation Team which may include items for ratification.
Valuations of fair valued securities are compared to the next actual sales price when available, or other appropriate market values, to assess the continued appropriateness of the fair valuation methodologies used. These securities are fair valued on a day-to-day basis, taking into consideration changes to appropriate market information and any significant changes to the inputs considered in the valuation process until there is a readily available price provided on an exchange or by an independent pricing service. Valuations received from an independent pricing service or independent broker-dealer quotes are periodically validated by comparisons to most recent trades and valuations provided by other independent pricing services in addition to the review of prices by the adviser and/or subadviser. Unobservable inputs used in determining fair valuations are identified based on the type of security, taking into consideration factors utilized by market participants in valuing the investment, knowledge about the issuer and the current market environment.
| | | | | | |
| Notes to financial statements (unaudited) | | Wells Fargo Advantage Global Opportunities Fund | | | 21 | |
Foreign currency translation
The accounting records of the Fund are maintained in U.S. dollars. The values of other assets and liabilities denominated in foreign currencies are translated into U.S. dollars at rates provided by an independent foreign currency pricing source at a time each business day specified by the Management Valuation Team. Purchases and sales of securities, and income and expenses are converted at the rate of exchange on the respective dates of such transactions. Net realized foreign exchange gains or losses arise from sales of foreign currencies, currency gains or losses realized between the trade and settlement dates on securities transactions, and the difference between the amounts of dividends, interest and foreign withholding taxes recorded and the U.S. dollar equivalent of the amounts actually paid or received. Net unrealized foreign exchange gains and losses arise from changes in the fair value of assets and liabilities other than investments in securities resulting from changes in exchange rates. The changes in net assets arising from changes in exchange rates and the changes in net assets resulting from changes in market prices of securities are not separately presented. Such changes are included in net realized and unrealized gains or losses from investments.
Forward foreign currency contracts
The Fund is subject to foreign currency exchange rate risk in the normal course of pursuing its investment objectives. A forward foreign currency contract is an agreement between two parties to purchase or sell a specific currency for an agreed-upon price at a future date. The Fund enters into forward foreign currency contracts to facilitate transactions in foreign-denominated securities and to attempt to minimize the risk to the Fund from adverse changes in the relationship between currencies. Forward foreign currency contracts are recorded at the forward rate and marked-to-market daily. When the contracts are closed, realized gains and losses arising from such transactions are recorded as realized gains or losses on forward foreign currency contract transactions. The Fund could be exposed to risks if the counterparties to the contracts are unable to meet the terms of their contracts or if the value of the foreign currency changes unfavorably. The Fund’s maximum risk of loss from counterparty credit risk is the unrealized gains on the contracts. This risk may be mitigated if there is a master netting arrangement between the Fund and the counterparty.
Security loans
The Fund may lend its securities from time to time in order to earn additional income in the form of fees or interest on securities received as collateral or the investment of any cash received as collateral. The Fund continues to receive interest or dividends on the securities loaned. The Fund receives collateral in the form of cash or securities with a value at least equal to the value of the securities on loan. The value of the loaned securities is determined at the close of each business day and any additional required collateral is delivered to the Fund on the next business day. In a securities lending transaction, the net asset value of the Fund will be affected by an increase or decrease in the value of the securities loaned and by an increase or decrease in the value of the instrument in which collateral is invested. The amount of securities lending activity undertaken by the Fund fluctuates from time to time. In the event of default or bankruptcy by the borrower, the Fund may be prevented from recovering the loaned securities or gaining access to the collateral or may experience delays or costs in doing so. In addition, the investment of any cash collateral received may lose all or part of its value. The Fund has the right under the lending agreement to recover the securities from the borrower on demand.
The Fund lends its securities through an unaffiliated securities lending agent. Cash collateral received in connection with its securities lending transactions is invested in Wells Fargo Securities Lending Cash Investments, LLC (the “Securities Lending Fund”). The Securities Lending Fund is exempt from registration under Section 3(c)(7) of the 1940 Act and is managed by Funds Management and is subadvised by Wells Capital Management Incorporated (“WellsCap”). Funds Management receives an advisory fee starting at 0.05% and declining to 0.01% as the average daily net assets of the Securities Lending Fund increase. All of the fees received by Funds Management are paid to WellsCap for its services as subadviser. The Securities Lending Fund seeks to provide a positive return compared to the daily Fed Funds Open rate by investing in high-quality, U.S. dollar-denominated short-term money market instruments. Securities Lending Fund investments are fair valued based upon the amortized cost valuation technique. Income earned from investment in the Securities Lending Fund is included in securities lending income on the Statement of Operations.
Security transactions and income recognition
Securities transactions are recorded on a trade date basis. Realized gains or losses are recorded on the basis of identified cost.
Dividend income is recognized on the ex-dividend date, except for certain dividends from foreign securities, which are recorded as soon as the Fund is informed of the ex-dividend date. Dividend income from foreign securities is recorded net of foreign taxes withheld where recovery of such taxes is not assured.
| | | | |
| 22 | | Wells Fargo Advantage Global Opportunities Fund | | Notes to financial statements (unaudited) |
Distributions to shareholders
Distributions to shareholders from net investment income and net realized gains, if any, are recorded on the ex-dividend date. Such distributions are determined in conformity with federal income tax regulations, which may differ in amount or character from net investment income and realized gains recognized for purposes of U.S. generally accepted accounting principles.
Federal and other taxes
The Fund intends to continue to qualify as a regulated investment company by distributing substantially all of its investment company taxable income and any net realized capital gains (after reduction for capital loss carryforwards) sufficient to relieve it from all, or substantially all, federal income taxes. Accordingly, no provision for federal income taxes was required.
The Fund’s income and federal excise tax returns and all financial records supporting those returns for the prior three fiscal years are subject to examination by the federal and Delaware revenue authorities. Management has analyzed the Fund’s tax positions taken on federal, state, and foreign tax returns for all open tax years and does not believe that there are any uncertain tax positions that require recognition of a tax liability.
As of October 31, 2013, the Fund had capital loss carryforwards available to offset future net realized capital gains in the amount of $67,335 expiring in 2017.
Class allocations
The separate classes of shares offered by the Fund differ principally in applicable sales charges, distribution, shareholder servicing, and administration fees. Shareholders of each class bear certain expenses that pertain to that particular class. All shareholders bear the common expenses of the Fund, earn income from the portfolio, and are allocated any unrealized gains and losses pro rata based on the average daily net assets of each class, without distinction between share classes. Dividends are determined separately for each class based on income and expenses allocable to each class. Realized gains and losses are allocated to each class pro rata based upon the net assets of each class on the date realized. Differences in per share dividend rates generally result from the relative weightings of pro rata income and realized gain allocations and from differences in separate class expenses, including distribution, shareholder servicing, and administration fees.
3. FAIR VALUATION MEASUREMENTS
Fair value measurements of investments are determined within a framework that has established a fair value hierarchy based upon the various data inputs utilized in determining the value of the Fund’s investments. The three-level hierarchy gives the highest priority to unadjusted quoted prices in active markets for identical assets or liabilities (Level 1) and the lowest priority to significant unobservable inputs (Level 3). The Fund’s investments are classified within the fair value hierarchy based on the lowest level of input that is significant to the fair value measurement. The inputs are summarized into three broad levels as follows:
| n | | Level 1 – quoted prices in active markets for identical securities |
| n | | Level 2 – other significant observable inputs (including quoted prices for similar securities, interest rates, prepayment speeds, credit risk, use of amortized cost, etc.) |
| n | | Level 3 – significant unobservable inputs (including the Fund’s own assumptions in determining the fair value of investments) |
The inputs or methodologies used for valuing investments in securities are not necessarily an indication of the risk associated with investing in those securities.
| | | | | | |
| Notes to financial statements (unaudited) | | Wells Fargo Advantage Global Opportunities Fund | | | 23 | |
As of April 30, 2014, the inputs used in valuing investments in securities were as follows:
| | | | | | | | | | | | | | | | |
| Investments in securities | | Quoted prices (Level 1) | | | Other significant
observable inputs (Level 2) | | | Significant unobservable inputs (Level 3) | | | Total | |
Equity securities | | | | | | | | | | | | | | | | |
Common stocks | | | | | | | | | | | | | | | | |
Australia | | $ | 3,795,967 | | | $ | 0 | | | $ | 0 | | | $ | 3,795,967 | |
Canada | | | 8,215,053 | | | | 0 | | | | 0 | | | | 8,215,053 | |
Denmark | | | 3,111,082 | | | | 0 | | | | 0 | | | | 3,111,082 | |
France | | | 12,562,842 | | | | 0 | | | | 0 | | | | 12,562,842 | |
Germany | | | 12,343,511 | | | | 0 | | | | 0 | | | | 12,343,511 | |
Hong Kong | | | 2,707,963 | | | | 0 | | | | 0 | | | | 2,707,963 | |
Italy | | | 6,481,716 | | | | 0 | | | | 0 | | | | 6,481,716 | |
Japan | | | 23,893,683 | | | | 0 | | | | 0 | | | | 23,893,683 | |
Netherlands | | | 6,276,885 | | | | 0 | | | | 0 | | | | 6,276,885 | |
Norway | | | 7,054,094 | | | | 0 | | | | 0 | | | | 7,054,094 | |
Portugal | | | 852,714 | | | | 0 | | | | 0 | | | | 852,714 | |
Russia | | | 0 | | | | 1,082,815 | | | | 0 | | | | 1,082,815 | |
South Korea | | | 6,523,906 | | | | 0 | | | | 0 | | | | 6,523,906 | |
Spain | | | 2,955,035 | | | | 0 | | | | 0 | | | | 2,955,035 | |
Sweden | | | 3,208,494 | | | | 0 | | | | 0 | | | | 3,208,494 | |
Switzerland | | | 3,013,072 | | | | 0 | | | | 0 | | | | 3,013,072 | |
Taiwan | | | 1,673,406 | | | | 0 | | | | 0 | | | | 1,673,406 | |
United Kingdom | | | 34,106,276 | | | | 0 | | | | 0 | | | | 34,106,276 | |
United States | | | 144,536,207 | | | | 0 | | | | 0 | | | | 144,536,207 | |
Preferred stock | | | | | | | | | | | | | | | | |
Germany | | | 761,695 | | | | 0 | | | | 0 | | | | 761,695 | |
Investment companies | | | | | | | | | | | | | | | | |
United States | | | 2,740,466 | | | | 0 | | | | 0 | | | | 2,740,466 | |
Short-term investments | | | | | | | | | | | | | | | | |
Investment companies | | | 13,853,546 | | | | 20,619,022 | | | | 0 | | | | 34,472,568 | |
| | | $ | 300,667,613 | | | $ | 21,701,837 | | | $ | 0 | | | $ | 322,369,450 | |
As of April 30, 2014, the inputs used in valuing the Fund’s other financial instruments were as follows:
| | | | | | | | | | | | | | | | |
| Other financial instruments | | Quoted prices (Level 1) | | | Other significant
observable inputs (Level 2) | | | Significant unobservable inputs (Level 3) | | | Total | |
Forward foreign currency contracts | | $ | 0 | | | $ | (42,504 | )* | | $ | 0 | | | $ | (42,504 | ) |
| * | Amount represents the net unrealized losses. |
Transfers in and transfers out are recognized at the end of the reporting period. For the six months ended April 30, 2014, the Fund did not have any transfers into/out of Level 1, Level 2, or Level 3.
4. TRANSACTIONS WITH AFFILIATES AND OTHER EXPENSES
Advisory fee
The Trust has entered into an advisory contract with Funds Management, an indirect wholly owned subsidiary of Wells Fargo & Company (“Wells Fargo”). The adviser is responsible for implementing investment policies and guidelines and for supervising the subadviser, who is responsible for day-to-day portfolio management of the Fund.
Pursuant to the contract, Funds Management is entitled to receive an annual advisory fee starting at 0.90% and declining to 0.80% as the average daily net assets of the Fund increase. For the six months ended April 30, 2014, the advisory fee was equivalent to an annual rate of 0.90% of the Fund’s average daily net assets.
| | | | |
| 24 | | Wells Fargo Advantage Global Opportunities Fund | | Notes to financial statements (unaudited) |
Funds Management has retained the services of a subadviser to provide daily portfolio management to the Fund. The fee for subadvisory services is borne by Funds Management. WellsCap, an affiliate of Funds Management and an indirect wholly owned subsidiary of Wells Fargo, is the subadviser to the Fund and is entitled to receive a fee from Funds Management at an annual rate starting at 0.55% and declining to 0.40% as the average daily net assets of the Fund increase.
Administration and transfer agent fees
The Trust has entered into an administration agreement with Funds Management. Under this agreement, for providing administrative services, which includes paying fees and expenses for services provided by the transfer agent, sub-transfer agents, omnibus account servicers and record-keepers, Funds Management is entitled to receive from the Fund an annual fund level administration fee starting at 0.05% and declining to 0.03% as the average daily net assets of the Fund increase and a class level administration fee which is calculated based on the average daily net assets of each class as follows:
| | | | |
| | | Class level
administration fee | |
Class A, Class B, Class C | | | 0.26 | % |
Administrator Class | | | 0.10 | |
Institutional Class | | | 0.08 | |
Funds Management has contractually waived and/or reimbursed advisory and administration fees to the extent necessary to maintain certain net operating expense ratios for the Fund. Waiver of fees and/or reimbursement of expenses by Funds Management were made first from fund level expenses on a proportionate basis and then from class specific expenses. Funds Management has committed through February 28, 2015 to waive fees and/or reimburse expenses to the extent necessary to cap the Fund’s expenses at 1.55% for Class A shares, 2.30% for Class B shares, 2.30% for Class C shares, 1.40% for Administrator Class shares, and 1.15% for Institutional Class shares.
Distribution fees
The Trust has adopted a Distribution Plan for Class B and Class C shares of the Fund pursuant to Rule 12b-1 under the 1940 Act. Distribution fees are charged to Class B and Class C shares and paid to Wells Fargo Funds Distributor, LLC, the principal underwriter, at an annual rate of 0.75% of the average daily net assets of Class B and Class C shares.
For the six months ended April 30, 2014, Wells Fargo Funds Distributor, LLC received $5,146 from the sale of Class A shares and $247 and $824 in contingent deferred sales charges from redemptions of Class B and Class C shares, respectively.
Shareholder servicing fees
The Trust has entered into contracts with one or more shareholder servicing agents, whereby Class A, Class B, Class C, and Administrator Class of the Fund is charged a fee at an annual rate of 0.25% of the average daily net assets of each respective class.
A portion of these total shareholder servicing fees were paid to affiliates of Wells Fargo.
5. INVESTMENT PORTFOLIO TRANSACTIONS
Purchases and sales of investments, excluding U.S. government obligations (if any) and short-term securities, for the six months ended April 30, 2014 were $116,155,440 and $128,488,125, respectively.
6. DERIVATIVE TRANSACTIONS
During the six months ended April 30, 2014, the Fund entered into forward foreign currency contracts for economic hedging purposes.
At April 30, 2014, the Fund had forward foreign currency contracts outstanding as follows:
Forward foreign currency contracts to sell:
| | | | | | | | | | | | | | | | | | |
| Exchange date | | Counterparty | | Contracts to
deliver | | | U.S. value at
April 30, 2014 | | | In exchange
for U.S. $ | | | Unrealized
losses | |
| 6-11-2014 | | JPMorgan | | | 400,000,000 JPY | | | $ | 3,913,492 | | | $ | 3,870,988 | | | $ | (42,504 | ) |
The Fund had average contract amounts of $70,423 and $4,296,091 in forward foreign currency contracts to buy and forward foreign currency contracts to sell, respectively, during the six months ended April 30, 2014.
| | | | | | |
| Notes to financial statements (unaudited) | | Wells Fargo Advantage Global Opportunities Fund | | | 25 | |
The fair value, realized gains or losses and change in unrealized gains or losses, if any, on derivative instruments are reflected in the appropriate financial statements.
For certain types of derivative transactions, the Fund has entered into International Swaps and Derivatives Association, Inc. master agreements (“ISDA Master Agreements”) or similar agreements with approved counterparties. The ISDA Master Agreements or similar agreements may have requirements to deliver/deposit securities or cash to/with an exchange or broker-dealer as collateral and allows the Fund to offset, with each counterparty, certain derivative financial instrument’s assets and/or liabilities with collateral held or pledged. Collateral requirements differ by type of derivative. Collateral or margin requirements are set by the broker or exchange clearing house for exchange traded derivatives while collateral terms are contract specific for over-the-counter traded derivatives. Cash collateral that has been pledged to cover obligations of the Fund under the ISDA Master Agreements or similar agreements, if any, will be reported separately in the Statement of Assets and Liabilities. Securities pledged as collateral, if any, for the same purpose are noted in the Portfolio of Investments. With respect to balance sheet offsetting, absent an event of default by the counterparty or a termination of the agreement, the reported amounts of financial assets and financial liabilities in the Statement of Assets and Liabilities are not offset across transactions between the Fund and the applicable counterparty. A reconciliation of the gross amounts on the Statement of Assets and Liabilities to the net amounts by derivative type, including any collateral exposure, is as follows:
| | | | | | | | | | | | | | | | | | | | |
| Derivative type | | Counterparty | | | Gross amounts of
liabilities in the
Statement of
Assets and
Liabilities | | | Amounts
subject to
netting
agreements | | | Collateral
pledged | | | Net
amount
of liabilities | |
Forward foreign currency contracts | | | JPMorgan | | | $ | 42,504 | * | | $ | 0 | | | $ | 0 | | | $ | 42,504 | |
| * | Amount represents net unrealized losses. |
7. BANK BORROWINGS
The Trust (excluding the money market funds and certain other funds in the Trust) and Wells Fargo Variable Trust are parties to a $150,000,000 revolving credit agreement with State Street Bank and Trust Company, whereby the Fund is permitted to use bank borrowings for temporary or emergency purposes, such as to fund shareholder redemption requests. Interest under the credit agreement is charged to the Fund based on a borrowing rate equal to the higher of the Federal Funds rate in effect on that day plus 1.25% or the overnight LIBOR rate in effect on that day plus 1.25%. In addition, an annual commitment fee equal to 0.10% of the unused balance is allocated to each participating fund. For the six months ended April 30, 2014, the Fund paid $146 in commitment fees.
For the six months ended April 30, 2014, there were no borrowings by the Fund under the agreement.
8. INDEMNIFICATION
Under the Trust’s organizational documents, the officers and Trustees are indemnified against certain liabilities that may arise out of performance of their duties to the Trust. Additionally, in the normal course of business, the Trust may enter into contracts with service providers that contain a variety of indemnification clauses. The Trust’s maximum exposure under these arrangements is dependent on future claims that may be made against the Fund and, therefore, cannot be estimated.
| | | | |
| 26 | | Wells Fargo Advantage Global Opportunities Fund | | Other information (unaudited) |
TAX INFORMATION
Pursuant to Section 853 of the Internal Revenue Code, the following amounts were designated as foreign taxes paid for the fiscal year ended October 31, 2013. These amounts may be less than the actual foreign taxes paid for financial statement purposes. Foreign taxes paid or withheld should be included in taxable income with an offsetting deduction from gross income or as a credit for taxes paid to foreign governments. None of the income was derived from ineligible foreign sources as defined under Section 901(j) of the Internal Revenue Code.
| | | | |
Creditable
foreign taxes
paid | | Per share
amount | | Foreign
income as % of
ordinary income
distributions |
| $146,158 | | 0.0198 | | 60.26% |
PROXY VOTING INFORMATION
A description of the policies and procedures that the Fund uses to determine how to vote proxies relating to portfolio securities is available without charge, upon request, by calling 1-800-222-8222, visiting our website at wellsfargoadvantagefunds.com, or visiting the SEC website at sec.gov. Information regarding how the Fund voted proxies relating to portfolio securities during the most recent 12-month period ended June 30 is available without charge on the Fund’s website at wellsfargoadvantagefunds.com or by visiting the SEC website at sec.gov.
PORTFOLIO HOLDINGS INFORMATION
The complete portfolio holdings for the Fund are publicly available on the Fund’s website (wellsfargoadvantagefunds.com) on a monthly, 30-day or more delayed basis. In addition, top ten holdings information for the Fund is publicly available on the Fund’s website on a monthly, seven-day or more delayed basis. The Fund files its complete schedule of portfolio holdings with the SEC for the first and third quarters of each fiscal year on Form N-Q, which is available without charge by visiting the SEC website at sec.gov. In addition, the Fund’s Form N-Q may be reviewed and copied at the SEC’s Public Reference Room in Washington, DC, and at regional offices in New York City, at 233 Broadway, and in Chicago, at 175 West Jackson Boulevard, Suite 900. Information about the Public Reference Room may be obtained by calling 1-800-SEC-0330.
| | | | | | |
| Other information (unaudited) | | Wells Fargo Advantage Global Opportunities Fund | | | 27 | |
BOARD OF TRUSTEES AND OFFICERS
Each of the Trustees and Officers1 listed in the table below acts in identical capacities for each fund in the Wells Fargo Advantage family of funds, which consists of 132 mutual funds comprising the Wells Fargo Funds Trust, Wells Fargo Variable Trust, Wells Fargo Master Trust and four closed-end funds (collectively the “Fund Complex”). This table should be read in conjunction with the Prospectus and the Statement of Additional Information2. All of the Trustees are also Members of the Audit and Governance Committees of each Trust in the Fund Complex. The mailing address of each Trustee and Officer is 525 Market Street, 12th Floor, San Francisco, CA 94105. Each Trustee and Officer serves an indefinite term, however, each Trustee serves such term until reaching the mandatory retirement age established by the Trustees.
Independent Trustees
| | | | | | |
Name and year of birth | | Position held and length of service* | | Principal occupations during past five years | | Other directorships during
past five years |
Peter G. Gordon
(Born 1942) | | Trustee, since 1998; Chairman, since 2005 | | Co-Founder, Retired Chairman, President and CEO of Crystal Geyser Water Company. Trustee Emeritus, Colby College. | | Asset Allocation Trust |
Isaiah Harris, Jr.
(Born 1952) | | Trustee, since 2009 | | Retired. Prior thereto, President and CEO of BellSouth Advertising and Publishing Corp. from 2005 to 2007, President and CEO of BellSouth Enterprises from 2004 to 2005 and President of BellSouth Consumer Services from 2000 to 2003. Emeritus member of the Iowa State University Foundation Board of Governors. Emeritus Member of the Advisory Board of Iowa State University School of Business. Advisory Board Member, Palm Harbor Academy (charter school). Mr. Harris is a certified public accountant. | | CIGNA Corporation; Deluxe Corporation; Asset Allocation Trust |
Judith M. Johnson
(Born 1949) | | Trustee, since 2008; Audit Committee Chairman, since 2008 | | Retired. Prior thereto, Chief Executive Officer and Chief Investment Officer of Minneapolis Employees Retirement Fund from 1996 to 2008. Ms. Johnson is an attorney, certified public accountant and a certified managerial accountant. | | Asset Allocation Trust |
Leroy Keith, Jr.
(Born 1939) | | Trustee, since 2010 | | Chairman, Bloc Global Services (development and construction). Trustee of the Evergreen Funds from 1983 to 2010. Former Managing Director, Almanac Capital Management (commodities firm), former Partner, Stonington Partners, Inc. (private equity fund), former Director, Obagi Medical Products Co. and former Director, Lincoln Educational Services. | | Trustee, Virtus Fund Complex (consisting of 50 portfolios as of 12/16/2013); Asset Allocation Trust |
David F. Larcker
(Born 1950) | | Trustee, since 2009 | | James Irvin Miller Professor of Accounting at the Graduate School of Business, Stanford University, Morgan Stanley Director of the Center for Leadership Development and Research and Senior Faculty of The Rock Center for Corporate Governance since 2006. From 2005 to 2008, Professor of Accounting at the Graduate School of Business, Stanford University. Prior thereto, Ernst & Young Professor of Accounting at The Wharton School, University of Pennsylvania from 1985 to 2005. | | Asset Allocation Trust |
Olivia S. Mitchell
(Born 1953) | | Trustee, since 2006 | | International Foundation of Employee Benefit Plans Professor, Wharton School of the University of Pennsylvania since 1993. Director of Wharton’s Pension Research Council and Boettner Center on Pensions & Retirement Research, and Research Associate at the National Bureau of Economic Research. Previously, Cornell University Professor from 1978 to 1993. | | Asset Allocation Trust |
Timothy J. Penny
(Born 1951) | | Trustee, since 1996 | | President and CEO of Southern Minnesota Initiative Foundation, a non-profit organization, since 2007 and Senior Fellow at the Humphrey Institute Policy Forum at the University of Minnesota since 1995. Member of the Board of Trustees of NorthStar Education Finance, Inc., a non-profit organization, since 2007. | | Asset Allocation Trust |
| | | | |
| 28 | | Wells Fargo Advantage Global Opportunities Fund | | Other information (unaudited) |
| | | | | | |
Name and year of birth | | Position held and length of service* | | Principal occupations during past five years | | Other directorships during
past five years |
Michael S. Scofield
(Born 1943) | | Trustee, since 2010 | | Served on the Investment Company Institute’s Board of Governors and Executive Committee from 2008-2011 as well the Governing Council of the Independent Directors Council from 2006-2011 and the Independent Directors Council Executive Committee from 2008-2011. Chairman of the IDC from 2008-2010. Institutional Investor (Fund Directions) Trustee of Year in 2007. Trustee of the Evergreen Funds (and its predecessors) from 1984 to 2010. Chairman of the Evergreen Funds from 2000-2010. Former Trustee of the Mentor Funds. Retired Attorney, Law Offices of Michael S. Scofield. | | Asset Allocation Trust |
Donald C. Willeke
(Born 1940) | | Trustee, since 1996 | | Principal of the law firm of Willeke & Daniels. General Counsel of the Minneapolis Employees Retirement Fund from 1984 until its consolidation into the Minnesota Public Employees Retirement Association on June 30, 2010. Director and Vice Chair of The Tree Trust (non-profit corporation). Director of the American Chestnut Foundation (non-profit corporation). | | Asset Allocation Trust |
| * | Length of service dates reflect the Trustee’s commencement of service with the Trust’s predecessor entities, where applicable. |
Officers
| | | | | | |
Name and year of birth | | Position held and
length of service | | Principal occupations during past five years | | |
Karla M. Rabusch
(Born 1959) | | President, since 2003 | | Executive Vice President of Wells Fargo Bank, N.A. and President of Wells Fargo Funds Management, LLC since 2003. | | |
Jeremy DePalma1
(Born 1974) | | Treasurer, since 2012 | | Senior Vice President of Wells Fargo Funds Management, LLC since 2009. Senior Vice President of Evergreen Investment Management Company, LLC from 2008 to 2010. Vice President, Evergreen Investment Services, Inc. from 2004 to 2007. Head of the Fund Reporting and Control Team within Fund Administration from 2005 to 2010. | | |
C. David Messman
(Born 1960) | | Secretary, since 2000; Chief Legal Officer, since 2003 | | Senior Vice President and Secretary of Wells Fargo Funds Management, LLC since 2001. Vice President and Managing Counsel of Wells Fargo Bank, N.A. since 1996. | | |
Debra Ann Early
(Born 1964) | | Chief Compliance Officer, since 2007 | | Chief Compliance Officer of Wells Fargo Funds Management, LLC since 2007. Chief Compliance Officer of Parnassus Investments from 2005 to 2007. Chief Financial Officer of Parnassus Investments from 2004 to 2007. | | |
David Berardi
(Born 1975) | | Assistant Treasurer, since 2009 | | Vice President of Wells Fargo Funds Management, LLC since 2009. Vice President of Evergreen Investment Management Company, LLC from 2008 to 2010. Assistant Vice President of Evergreen Investment Services, Inc. from 2004 to 2008. Manager of Fund Reporting and Control for Evergreen Investment Management Company, LLC from 2004 to 2010. | | |
| 1. | Jeremy DePalma acts as Treasurer of 59 funds and Assistant Treasurer of 73 funds in the Fund Complex. |
| 2. | The Statement of Additional Information includes additional information about the Trustees and is available, without charge, upon request, by calling 1-800-222-8222 or by visiting the website at wellsfargoadvantagefunds.com. |
| | | | | | |
| Other information (unaudited) | | Wells Fargo Advantage Global Opportunities Fund | | | 29 | |
BOARD CONSIDERATION OF INVESTMENT ADVISORY AND SUB-ADVISORY AGREEMENTS:
Under Section 15 of the Investment Company Act of 1940 (the “1940 Act”), the Board of Trustees (the “Board”) of Wells Fargo Funds Trust (the “Trust”), all the members of which have no direct or indirect interest in the investment advisory and sub-advisory agreements and are not “interested persons” of the Trust, as defined in the 1940 Act (the “Independent Trustees”), must determine whether to approve the continuation of the Trust’s investment advisory and sub-advisory agreements. In this regard, at an in-person meeting held on March 27-28, 2014 (the “Meeting”), the Board reviewed: (i) an investment advisory agreement with Wells Fargo Funds Management, LLC (“Funds Management”) for Wells Fargo Advantage Global Opportunities Fund (the “Fund”) and (ii) an investment sub-advisory agreement with Wells Capital Management Incorporated (the “Sub-Adviser”), an affiliate of Funds Management, for the Fund. The investment advisory agreement with Funds Management and the investment sub-advisory agreement with the Sub-Adviser are collectively referred to as the “Advisory Agreements.”
At the Meeting, the Board considered the factors and reached the conclusions described below relating to the selection of Funds Management and the Sub-Adviser and the continuation of the Advisory Agreements. Prior to the Meeting, the Trustees conferred extensively among themselves and with representatives of Funds Management about these matters. Also, the Board has adopted a team-based approach, with each team consisting of a sub-set of Trustees, to assist the full Board in the discharge of its duties in reviewing performance and other matters throughout the year. The Independent Trustees were assisted in their evaluation of the Advisory Agreements by independent legal counsel, from whom they received separate legal advice and with whom they met separately.
In providing information to the Board, Funds Management and the Sub-Adviser were guided by a detailed set of requests for information submitted to them by independent legal counsel on behalf of the Independent Trustees at the start of the Board’s annual contract renewal process earlier in 2014. In considering and approving the Advisory Agreements, the Trustees considered the information they believed relevant, including but not limited to the information discussed below. The Board considered not only the specific information presented in connection with the Meeting, but also the knowledge gained over time through interaction with Funds Management and the Sub-Adviser about various topics. In this regard, the Board reviewed reports of Funds Management at each of its quarterly meetings, which included, among other things, portfolio reviews and performance reports. In addition, the Board and the teams mentioned above confer with portfolio managers at various times throughout the year. The Board did not identify any particular information or consideration that was all-important or controlling, and each individual Trustee may have attributed different weights to various factors.
After its deliberations, the Board unanimously approved the continuation of the Advisory Agreements and determined that the compensation payable to Funds Management and the Sub-Adviser is reasonable. The Board considered the continuation of the Advisory Agreements for the Fund as part of its consideration of the continuation of advisory agreements for funds across the complex, but its approvals were made on a fund-by-fund basis. The following summarizes a number of important, but not necessarily all, factors considered by the Board in support of its approvals.
Nature, extent and quality of services
The Board received and considered various information regarding the nature, extent and quality of services provided to the Fund by Funds Management and the Sub-Adviser under the Advisory Agreements. This information included, among other things, a summary of the background and experience of senior management of Funds Management, and the qualifications, background, tenure and responsibilities of each of the portfolio managers primarily responsible for the day-to-day portfolio management of the Fund.
The Board evaluated the ability of Funds Management and the Sub-Adviser to attract and retain qualified investment professionals, including research, advisory and supervisory personnel. The Board further considered the compliance programs and compliance records of Funds Management and the Sub-Adviser. In addition, the Board took into account the full range of services provided to the Fund by Funds Management and its affiliates.
Fund performance and expenses
The Board considered the performance results for the Fund over various time periods ended December 31, 2013. The Board also considered these results in comparison to the performance of funds in a universe that was determined by Lipper Inc. (“Lipper”) to be similar to the Fund (the “Universe”), and in comparison to the Fund’s benchmark index and to other comparative data. Lipper is an independent provider of investment company data. The Board received a description of the methodology used by Lipper to select the mutual funds in the performance Universe. The Board noted that the performance of the Fund (Administrator Class) was lower than the average performance of the Universe for all periods under review except for the ten-year period. The Board also noted that the performance of the Fund was lower than its benchmark, the S&P Developed SmallCap Index, for all periods under review except for the ten-year period.
| | | | |
| 30 | | Wells Fargo Advantage Global Opportunities Fund | | Other information (unaudited) |
The Board received information concerning, and discussed factors contributing to, the underperformance of the Fund relative to the Universe and its benchmark for the one-, three- and five-year periods under review. Funds Management advised the Board about the market conditions and investment decisions that it believed contributed to the underperformance during that period noting the recent outperformance of the Fund relative to its benchmark. The Board noted that the Fund underwent a portfolio manager change in 2012. The Board was satisfied with the explanation of factors contributing to underperformance and with the steps being taken by Funds Management and the Sub-Adviser to address the Fund’s investment performance.
The Board also received and considered information regarding the Fund’s net operating expense ratios and their various components, including actual management fees (which reflect fee waivers, if any, and include advisory, administration and transfer agent fees), custodian and other non-management fees, Rule 12b-1 and non-Rule 12b-1 service fees and fee waiver and expense reimbursement arrangements. The Board considered these ratios in comparison to the median ratios of funds in class-specific expense groups that were determined by Lipper to be similar to the Fund (the “Groups”). The Board received a description of the methodology used by Lipper to select the mutual funds in the expense Groups and an explanation of year-to-year variations in the funds comprising such expense Groups and their expense ratios. Based on the Lipper reports, the Board noted that the net operating expense ratios of the Fund were lower than, equal to or in range of the median net operating expense ratios of the expense Groups for all share classes.
Based on its consideration of the factors and information it deemed relevant, including those described here, the Board concluded that the overall performance and expense structure of the Fund supported the re-approval of the Advisory Agreements.
Investment advisory and sub-advisory fee rates
The Board reviewed and considered the contractual investment advisory fee rates that are payable by the Fund to Funds Management for investment advisory services (the “Advisory Agreement Rates”), both on a stand-alone basis and on a combined basis with the Fund’s fund-level and class-level contractual administration fee rates (the “Management Rates”). The Board noted that the administration fees payable to Funds Management include transfer agency and sub-transfer agency costs. The Board also reviewed and considered the contractual investment sub-advisory fee rates that are payable by Funds Management to the Sub-Adviser for investment sub-advisory services (the “Sub-Advisory Agreement Rates”).
Among other information reviewed by the Board was a comparison of the Management Rates of the Fund with those of other funds in the expense Groups at a common asset level. The Board noted that the Management Rates of the Fund were lower than or in range of the average rates for the Fund’s expense Groups for all share classes.
The Board also received and considered information about the portion of the total advisory fee that was retained by Funds Management after payment of the fee to the Sub-Adviser for sub-advisory services. In assessing the reasonableness of this amount, the Board received and evaluated information about the nature and extent of responsibilities retained and risks assumed by Funds Management and not delegated to or assumed by the Sub-Adviser, and about Funds Management’s on-going oversight services. However, given the affiliation between Funds Management and the Sub-Adviser, the Board ascribed limited relevance to the allocation of the advisory fee between them.
The Board also received and considered information about the nature and extent of services offered and fee rates charged by Funds Management and the Sub-Adviser to other types of clients with investment strategies similar to those of the Fund. In this regard, the Board received information about the significantly greater scope of services, and compliance, reporting and other legal burdens and risks of managing mutual funds compared with those associated with managing assets of non-mutual fund clients such as collective funds or institutional separate accounts.
Based on its consideration of the factors and information it deemed relevant, including those described here, the Board determined that the Advisory Agreement Rates and the Sub-Advisory Agreement Rates were reasonable in light of the services covered by the Advisory Agreements.
Profitability
The Board received and considered information concerning the profitability of Funds Management, as well as the profitability of Wells Fargo as a whole, from providing services to the Fund and the fund family as a whole. The Board did not receive or consider to be necessary separate profitability information with respect to the Sub-Adviser, because its profitability information was subsumed in the collective Wells Fargo profitability analysis.
Funds Management explained the methodologies and estimates that it used in calculating profitability. Among other things, the Board noted that the levels of profitability reported on a fund-by-fund basis varied widely, depending on factors such as the size and type of fund. Based on its review, the Board did not deem the profits reported by Funds Management to be at a level that would prevent it from approving the continuation of the Advisory Agreements.
| | | | | | |
| Other information (unaudited) | | Wells Fargo Advantage Global Opportunities Fund | | | 31 | |
Economies of scale
With respect to possible economies of scale, the Board noted the existence of breakpoints in the Fund’s advisory fee and administration fee structure, which operate generally to reduce the Fund’s expense ratios as the Fund grows in size. It considered that, for a small fund or a fund that shrinks in size, breakpoints conversely can result in higher fee levels. The Board also considered that fee waiver and expense reimbursement arrangements and competitive fee rates at the outset are means of sharing potential economies of scale with shareholders of the Fund and the fund family as a whole. The Board considered Funds Management’s view that any analyses of potential economies of scale in managing a particular fund are inherently limited in light of the joint and common costs and investments that Funds Management incurs across the fund family as a whole.
The Board concluded that the Fund’s fee and expense arrangements, including contractual breakpoints, constituted a reasonable approach to sharing potential economies of scale with the Fund and its shareholders.
Other benefits to Funds Management and the Sub-Adviser
The Board received and considered information regarding potential “fall-out” or ancillary benefits received by Funds Management and its affiliates, including the Sub-Adviser, as a result of their relationships with the Fund. Ancillary benefits could include, among others, benefits directly attributable to other relationships with the Fund and benefits potentially derived from an increase in Funds Management’s and the Sub-Adviser’s business as a result of their relationships with the Fund. The Board noted that various affiliates of Funds Management may receive distribution-related fees, shareholder servicing payments and sub-transfer agency fees in respect of shares sold or held through them and services provided.
The Board also reviewed information about soft dollar credits earned and utilized by the Sub-Adviser, fees earned by Funds Management and the Sub-Adviser from managing a private investment vehicle for the fund family’s securities lending collateral and commissions earned by an affiliated broker from portfolio transactions.
Based on its consideration of the factors and information it deemed relevant, including those described here, the Board did not find that any ancillary benefits received by Funds Management and its affiliates, including the Sub-Adviser, were unreasonable.
Conclusion
After considering the above-described factors and based on its deliberations and its evaluation of the information described above, the Board unanimously approved the continuation of the Advisory Agreements for an additional one-year period and determined that the compensation payable to Funds Management and the Sub-Adviser is reasonable.
| | | | |
| 32 | | Wells Fargo Advantage Global Opportunities Fund | | List of abbreviations |
The following is a list of common abbreviations for terms and entities that may have appeared in this report.
| ACA | — ACA Financial Guaranty Corporation |
| ADR | — American depositary receipt |
| ADS | — American depositary shares |
| AGC | — Assured Guaranty Corporation |
| AGM | — Assured Guaranty Municipal |
| Ambac | — Ambac Financial Group Incorporated |
| AMT | — Alternative minimum tax |
| BAN | — Bond anticipation notes |
| BHAC | — Berkshire Hathaway Assurance Corporation |
| CAB | — Capital appreciation bond |
| CCAB | — Convertible capital appreciation bond |
| CDA | — Community Development Authority |
| CDO | — Collateralized debt obligation |
| DRIVER | — Derivative inverse tax-exempt receipts |
| DW&P | — Department of Water & Power |
| DWR | — Department of Water Resources |
| ECFA | — Educational & Cultural Facilities Authority |
| EDA | — Economic Development Authority |
| EDFA | — Economic Development Finance Authority |
| ETF | — Exchange-traded fund |
| FDIC | — Federal Deposit Insurance Corporation |
| FFCB | — Federal Farm Credit Banks |
| FGIC | — Financial Guaranty Insurance Corporation |
| FHA | — Federal Housing Administration |
| FHLB | — Federal Home Loan Bank |
| FHLMC | — Federal Home Loan Mortgage Corporation |
| FICO | — The Financing Corporation |
| FNMA | — Federal National Mortgage Association |
| GDR | — Global depositary receipt |
| GNMA | — Government National Mortgage Association |
| HCFR | — Healthcare facilities revenue |
| HEFA | — Health & Educational Facilities Authority |
| HEFAR | — Higher education facilities authority revenue |
| HFA | — Housing Finance Authority |
| HFFA | — Health Facilities Financing Authority |
| HUD | — Department of Housing and Urban Development |
| IDA | — Industrial Development Authority |
| IDAG | — Industrial Development Agency |
| KRW | — Republic of Korea won |
| LIBOR | — London Interbank Offered Rate |
| LLC | — Limited liability company |
| LLLP | — Limited liability limited partnership |
| LLP | — Limited liability partnership |
| MBIA | — Municipal Bond Insurance Association |
| MFHR | — Multifamily housing revenue |
| MSTR | — Municipal securities trust receipts |
| MUD | — Municipal Utility District |
| National | — National Public Finance Guarantee Corporation |
| PCFA | — Pollution Control Financing Authority |
| PCL | — Public Company Limited |
| PCR | — Pollution control revenue |
| PFA | — Public Finance Authority |
| PFFA | — Public Facilities Financing Authority |
| PFOTER | — Puttable floating option tax-exempt receipts |
| plc | — Public limited company |
| PUTTER | — Puttable tax-exempt receipts |
| R&D | — Research & development |
| Radian | — Radian Asset Assurance |
| RAN | — Revenue anticipation notes |
| RDA | — Redevelopment Authority |
| RDFA | — Redevelopment Finance Authority |
| REIT | — Real estate investment trust |
| ROC | — Reset option certificates |
| SAVRS | — Select auction variable rate securities |
| SBA | — Small Business Authority |
| SFHR | — Single-family housing revenue |
| SFMR | — Single-family mortgage revenue |
| SPA | — Standby purchase agreement |
| SPDR | — Standard & Poor’s Depositary Receipts |
| STRIPS | — Separate trading of registered interest and
principal securities |
| TAN | — Tax anticipation notes |
| TIPS | — Treasury inflation-protected securities |
| TRAN | — Tax revenue anticipation notes |
| TTFA | — Transportation Trust Fund Authority |
| TVA | — Tennessee Valley Authority |


For more information
More information about Wells Fargo Advantage Funds is available free upon request. To obtain literature, please write, email, visit the Fund’s website, or call:
Wells Fargo Advantage Funds
P.O. Box 8266
Boston, MA 02266-8266
Email: wfaf@wellsfargo.com
Website: wellsfargoadvantagefunds.com
Individual investors: 1-800-222-8222
Retail investment professionals: 1-888-877-9275
Institutional investment professionals: 1-866-765-0778
This report and the financial statements contained herein are submitted for the general information of the shareholders of Wells Fargo Advantage Funds. If this report is used for promotional purposes, distribution of the report must be accompanied or preceded by a current prospectus. Before investing, please consider the investment objectives, risks, charges, and expenses of the investment. For a current prospectus and, if available, a summary prospectus, containing this information, call 1-800-222-8222 or visit the Fund’s website at wellsfargoadvantagefunds.com. Read the prospectus carefully before you invest or send money.
Wells Fargo Funds Management, LLC, a wholly owned subsidiary of Wells Fargo & Company, provides investment advisory and administrative services for Wells Fargo Advantage Funds. Other affiliates of Wells Fargo & Company provide subadvisory and other services for the Funds. The Funds are distributed by Wells Fargo Funds Distributor, LLC, Member FINRA/SIPC, an affiliate of Wells Fargo & Company.
NOT FDIC INSURED ¡ NO BANK GUARANTEE ¡ MAY LOSE VALUE
© 2014 Wells Fargo Funds Management, LLC. All rights reserved.
| | |
 | | 225170 06-14 SA239/SAR239 04-14 |

Wells Fargo Advantage
International Equity Fund

Semi-Annual Report
April 30, 2014

Reduce clutter. Save trees.
Sign up for electronic delivery of prospectuses and shareholder reports at wellsfargo.com/advantagedelivery
Contents
The views expressed and any forward-looking statements are as of April 30, 2014, unless otherwise noted, and are those of the Fund managers and/or Wells Fargo Funds Management, LLC. Discussions of individual securities, or the markets generally, or any Wells Fargo Advantage Fund are not intended as individual recommendations. Future events or results may vary significantly from those expressed in any forward-looking statements; the views expressed are subject to change at any time in response to changing circumstances in the market. Wells Fargo Funds Management, LLC and the Fund disclaim any obligation to publicly update or revise any views expressed or forward-looking statements.
NOT FDIC INSURED ¡ NO BANK GUARANTEE ¡ MAY LOSE VALUE
| | | | |
| 2 | | Wells Fargo Advantage International Equity Fund | | Letter to shareholders (unaudited) |

Karla M. Rabusch
President
Wells Fargo Advantage Funds
European markets continued to benefit from the European Central Bank’s (ECB’s) willingness to maintain low interest rates.
Some of the markets that had declined the most during the European debt crisis—such as Italy and Ireland—benefited the most from this stable economic environment, but larger markets such as France and Germany also posted gains.
Dear Valued Shareholder:
We are pleased to offer you this semi-annual report for the Wells Fargo Advantage International Equity Fund for the six-month period that ended April 30, 2014. The period was marked by growing concern about an economic slowdown in China and heightened geopolitical uncertainty as the U.S. and Europe confronted Russia over Ukraine. The environment created a headwind for many emerging markets, even as continued economic recovery in Europe helped most developed stock markets end the period with gains.
Major central banks continued to provide stimulus.
Major central banks continued to inject liquidity into global banks and markets through various quantitative easing policies. The U.S. Federal Reserve (Fed) remained a major source of liquidity for market participants around the world. Throughout the reporting period, the Federal Open Market Committee (FOMC)—the Fed’s monetary policymaking body—kept its key interest rate near zero in order to support the economy and the financial system. At the beginning of the reporting period, the FOMC was still making open-ended purchases of $40 billion per month in mortgage-backed securities to support the housing market and was purchasing $45 billion per month in long-term U.S. Treasuries. However, in mid-December 2013, the FOMC announced that it would reduce (or taper) its bond-buying program by $10 billion per month beginning in January 2014. Although the tapering was less aggressive than some investors had feared, the removal of liquidity sparked a sell-off in emerging markets stocks and currencies as investors sold higher-risk assets.
European markets continued to benefit from the European Central Bank’s (ECB’s) willingness to maintain low interest rates. In November 2013, the ECB cut its key rate to a historic low of 0.25%. The ECB’s actions helped support moderate year-over-year gross domestic product (GDP) growth in the eurozone.
Most developed regions gained, but emerging and developed Asian markets lagged.
For the six-month period, the MSCI EAFE Index (Net)1, a proxy for developed markets, returned 4.44%, while the MSCI Emerging Markets Index (Net)2 returned -2.98%.
In Europe, economic data continued to show moderate growth, with reported GDP for the 28 countries in the European Union rising by 0.4% in the fourth quarter of 2013 compared with the previous quarter. The unemployment rate remained high but stable at 10.5% in February and March 2014, while inflation remained consistently below a 1% annual rate. Some of the markets that had declined the most during the European debt crisis—such as Italy and Ireland—benefited the most from this stable economic environment, but larger markets such as France and Germany also posted gains. The ongoing turmoil in Ukraine did result in some stock market volatility, but as of the end of the reporting period, most investors believed that it would not result in war.
Asian markets posted mixed results, with political issues accounting for many of those differences. In countries such as India and Indonesia, investors were optimistic that
| 1. | The Morgan Stanley Capital International Europe, Australasia, and Far East (MSCI EAFE) Index (Net) is an unmanaged group of securities widely regarded by investors to be representations of the stock markets of Europe, Australasia, and the Far East. Calculations for EAFE use net dividends, which reflect the deduction of withholding taxes. You cannot invest directly in an index. Source: MSCI. MSCI makes no express or implied warranties or representations and shall have no liability whatsoever with respect to any MSCI data contained herein. The MSCI data may not be further redistributed or used as a basis for other indexes or any securities or financial products. This report is not approved, reviewed, or produced by MSCI. |
| 2. | The Morgan Stanley Capital International (MSCI) Emerging Markets Index (Net) is a free float-adjusted market-capitalization-weighted index designed to measure the equity market performance in the global emerging markets. The index is currently composed of 21 emerging markets country indexes. You cannot invest directly in an index. |
| | | | | | |
| Letter to shareholders (unaudited) | | Wells Fargo Advantage International Equity Fund | | | 3 | |
upcoming elections might sweep in more reform-minded governments. By contrast, in Japan, the honeymoon for Prime Minister Shinzō Abe appeared to be ending, with investors worrying that his reforms were not taking effect as quickly as originally hoped.
As for China, many of the country’s economic numbers—such as national production, retail sales, fixed investment, and manufacturing activity—came in below analyst expectations, causing investor concern. In addition, China’s government has allowed a growing number of defaults in the country’s financial system as part of a long-term plan to rein in credit growth.
Don’t let short-term uncertainty derail long-term investment goals.
Periods of uncertainty can present challenges, but experience has taught us that maintaining long-term investment goals can be an effective way to plan for the future. To help you create a sound strategy based on your personal goals and risk tolerance, Wells Fargo Advantage Funds offers more than 100 mutual funds spanning a wide range of asset classes and investment styles. Although diversification cannot guarantee an investment profit or prevent losses, we believe it can be an effective way to manage investment risk and potentially smooth out overall portfolio performance. We encourage investors to know their investments and to understand that appropriate levels of risk-taking may unlock opportunities.
Thank you for choosing to invest with Wells Fargo Advantage Funds. We appreciate your confidence in us and remain committed to helping you meet your financial needs. For current information about your fund investments, contact your investment professional, visit our website at wellsfargoadvantagefunds.com, or call us directly at 1-800-222-8222. We are available 24 hours a day, 7 days a week.
Sincerely,

Karla M. Rabusch
President
Wells Fargo Advantage Funds
Notice to shareholders
The Fund and Wells Fargo Funds Management, LLC (“Funds Management”) have received an exemptive order from the SEC that permits Funds Management, subject to the approval of the Board of Trustees of the Fund, to select or replace certain subadvisers to manage all or a portion of the Fund’s assets and enter into, amend or terminate a sub-advisory agreement with certain subadvisers without obtaining shareholder approval (“Multi-manager Structure”). The Multi-manager Structure applies to subadvisers that are not affiliated with Funds Management or the Fund, except to the extent that affiliation arises solely because such subadvisers provide sub-advisory services to the Fund (“Non-affiliated Subadvisers”), as well as subadvisers that are indirect or direct wholly-owned subsidiaries of Funds Management or of another company that, indirectly or directly, wholly owns Funds Management (“Wholly-owned Subadvisers”).
Pursuant to the SEC order, Funds Management, with the approval of the Board of Trustees, has the discretion to terminate any subadvisers and allocate and reallocate the Fund’s assets among any other Non-affiliated Subadvisers or Wholly-owned Subadvisers. Funds Management, subject to oversight and supervision by the Board of Trustees, has responsibility to continue to oversee any subadvisers to the Fund and to recommend, for approval by the Board of Trustees, the hiring, termination and replacement of subadvisers for the Fund. In the event that a new subadviser is hired pursuant to the Multi-manager Structure, the Fund is required to provide notice to shareholders within 90 days.
Please contact your investment professional or call us directly at 1-800-222-8222 if you have any questions on this Notice to Shareholders.
| | | | |
| 4 | | Wells Fargo Advantage International Equity Fund | | Performance highlights (unaudited) |
Investment objective
The Fund seeks long-term capital appreciation.
Adviser
Wells Fargo Funds Management, LLC
Subadviser
Wells Capital Management Incorporated
Portfolio managers
Jeffrey Everett, CFA
Dale Winner, CFA
Average annual total returns1 (%) as of April 30, 2014
| | | | | | | | | | | | | | | | | | | | | | | | | | | | | | | | | | |
| | | | | Including sales charge | | | Excluding sales charge | | | Expense ratios2 (%) | |
| | | Inception date | | 1 year | | | 5 year | | | 10 year | | | 1 year | | | 5 year | | | 10 year | | | Gross | | | Net3 | |
| Class A (WFEAX) | | 1-20-1998 | | | 1.67 | | | | 9.79 | | | | 4.69 | | | | 7.90 | | | | 11.10 | | | | 5.30 | | | | 1.56 | | | | 1.09 | |
| Class B (WFEBX)* | | 9-6-1979 | | | 2.08 | | | | 9.97 | | | | 4.78 | | | | 7.08 | | | | 10.24 | | | | 4.78 | | | | 2.31 | | | | 1.84 | |
| Class C (WFEFX) | | 3-6-1998 | | | 6.03 | | | | 10.24 | | | | 4.52 | | | | 7.03 | | | | 10.24 | | | | 4.52 | | | | 2.31 | | | | 1.84 | |
| Class R (WFERX) | | 10-10-2003 | | | – | | | | – | | | | – | | | | 7.63 | | | | 10.78 | | | | 5.05 | | | | 1.81 | | | | 1.34 | |
| Administrator Class (WFEDX) | | 7-16-2010 | | | – | | | | – | | | | – | | | | 7.86 | | | | 11.15 | | | | 5.48 | | | | 1.40 | | | | 1.09 | |
| Institutional Class (WFENX) | | 3-9-1998 | | | – | | | | – | | | | – | | | | 8.10 | | | | 11.36 | | | | 5.58 | | | | 1.13 | | | | 0.84 | |
| MSCI ACWI ex USA (Net)4 | | – | | | – | | | | – | | | | – | | | | 9.76 | | | | 12.90 | | | | 7.61 | | | | – | | | | – | |
| * | | Class B shares are closed to investment, except in connection with the reinvestment of any distributions and permitted exchanges. |
Figures quoted represent past performance, which is no guarantee of future results, and do not reflect taxes that a shareholder may pay on fund distributions or the redemption of fund shares. Investment return and principal value of an investment will fluctuate so that an investor’s shares, when redeemed, may be worth more or less than their original cost. Performance shown without sales charges would be lower if sales charges were reflected. Current performance may be lower or higher than the performance data quoted, which assumes the reinvestment of dividends and capital gains. Current month-end performance is available on the Fund’s website, wellsfargoadvantagefunds.com.
Index returns do not include transaction costs associated with buying and selling securities, any mutual fund fees or expenses, or any taxes. It is not possible to invest directly in an index.
For Class A shares, the maximum front-end sales charge is 5.75%. For Class B shares, the maximum contingent deferred sales charge is 5.00%. For Class C shares, the maximum contingent deferred sales charge is 1.00%. Performance including sales charge assumes the sales charge for the corresponding time period. Class R, Administrator Class, and Institutional Class shares are sold without a front-end sales charge or contingent deferred sales charge.
Stock values fluctuate in response to the activities of individual companies and general market and economic conditions. Foreign investments are especially volatile and can rise or fall dramatically due to differences in the political and economic conditions of the host country. These risks are generally intensified in emerging markets. The use of derivatives may reduce returns and/or increase volatility. Certain investment strategies tend to increase the total risk of an investment (relative to the broader market). The Fund is exposed to smaller-company securities risk. Consult the Fund’s prospectus for additional information on these and other risks.
Please see footnotes on page 5.
| | | | | | |
| Performance highlights (unaudited) | | Wells Fargo Advantage International Equity Fund | | | 5 | |
| | | | |
| Ten largest equity holdings5 (%) as of April 30, 2014 | |
Intesa Sanpaolo SpA | | | 3.50 | |
BP plc | | | 3.49 | |
Zurich Financial Services AG | | | 3.12 | |
ENI SpA | | | 2.99 | |
Daiwa Securities Group Incorporated | | | 2.80 | |
Akzo Nobel NV | | | 2.79 | |
Siemens AG | | | 2.64 | |
Mitsubishi UFJ Financial Group Incorporated | | | 2.63 | |
Wolseley plc | | | 2.59 | |
China Everbright Limited | | | 2.51 | |
|
| Sector distribution6 as of April 30, 2014 |
|
 |
| 1. | Historical performance shown for Administrator Class shares prior to their inception reflects the performance of Institutional Class shares and has been adjusted to reflect the higher expenses applicable to Administrator Class shares. Historical performance shown for all classes of the Fund prior to July 19, 2010, is based on the performance of the Fund’s predecessor, Evergreen International Equity Fund. |
| 2. | Reflects the expense ratios as stated in the most recent prospectuses. The expense ratios shown are subject to change and may differ from the annualized expense ratios shown in the financial highlights of this report. |
| 3. | The Adviser has committed through February 28, 2015, to waive fees and/or reimburse expenses to the extent necessary to cap the Fund’s Total Annual Fund Operating Expenses After Fee Waiver, excluding certain expenses, at the amounts shown. Brokerage commissions, stamp duty fees, interest, taxes, acquired fund fees and expenses, and extraordinary expenses are excluded from the cap. Without this cap, the Fund’s returns would have been lower. |
| 4. | The Morgan Stanley Capital International All Country World Index ex USA (Net) (MSCI ACWI ex USA (Net)) is a free float-adjusted market-capitalization-weighted index that is designed to measure the equity market performance of developed and emerging markets. You cannot invest directly in an index. Source: MSCI. MSCI makes no express or implied warranties or representations and shall have no liability whatsoever with respect to any MSCI data contained herein. The MSCI data may not be further redistributed or used as a basis for other indexes or any securities or financial products. This report is not approved, reviewed or produced by MSCI. |
| 5. | The ten largest equity holdings are calculated based on the value of the securities divided by total net assets of the Fund. Holdings are subject to change and may have changed since the date specified. Top holdings typically include the underlying ordinary shares combined with any depositary receipts. |
| 6. | Sector distribution is subject to change and is calculated based on the total long-term investments of the Fund. |
| | | | |
| 6 | | Wells Fargo Advantage International Equity Fund | | Fund expenses (unaudited) |
As a shareholder of the Fund, you incur two types of costs: (1) transaction costs, including sales charges (loads) on
purchase payments and contingent deferred sales charges (if any) on redemptions and (2) ongoing costs, including
management fees, distribution (12b-1) and/or shareholder service fees, and other Fund expenses. This example is intended to help you understand your ongoing costs (in dollars) of investing in the Fund and to compare these costs with the ongoing costs of investing in other mutual funds.
The example is based on an investment of $1,000 invested at the beginning of the six-month period and held for the entire period from November 1, 2013 to April 30, 2014.
Actual expenses
The “Actual” line of the table below provides information about actual account values and actual expenses. You may use
the information in this line, together with the amount you invested, to estimate the expenses that you paid over the period. Simply divide your account value by $1,000 (for example, an $8,600 account value divided by $1,000 = 8.6), then multiply the result by the number in the “Actual” line under the heading entitled “Expenses paid during period” for your applicable class of shares to estimate the expenses you paid on your account during this period.
Hypothetical example for comparison purposes
The “Hypothetical” line of the table below provides information about hypothetical account values and hypothetical
expenses based on the Fund’s actual expense ratio and an assumed rate of return of 5% per year before expenses, which
is not the Fund’s actual return. The hypothetical account values and expenses may not be used to estimate the actual
ending account balance or expenses you paid for the period. You may use this information to compare the ongoing costs
of investing in the Fund and other funds. To do so, compare this 5% hypothetical example with the 5% hypothetical examples that appear in the shareholder reports of the other funds.
Please note that the expenses shown in the table are meant to highlight your ongoing costs only and do not reflect any transactional costs, such as sales charges (loads) and contingent deferred sales charges. Therefore, the “Hypothetical” line of the table is useful in comparing ongoing costs only and will not help you determine the relative total costs of owning different funds. In addition, if these transactional costs were included, your costs would have been higher.
| | | | | | | | | | | | | | | | |
| | | Beginning
account value
11-1-2013 | | | Ending
account value
4-30-2014 | | | Expenses
paid during
the period1 | | | Net annualized
expense ratio | |
Class A | | | | | | | | | | | | | | | | |
Actual | | $ | 1,000.00 | | | $ | 984.46 | | | $ | 5.36 | | | | 1.09 | % |
Hypothetical (5% return before expenses) | | $ | 1,000.00 | | | $ | 1,019.39 | | | $ | 5.46 | | | | 1.09 | % |
Class B | | | | | | | | | | | | | | | | |
Actual | | $ | 1,000.00 | | | $ | 980.47 | | | $ | 9.04 | | | | 1.84 | % |
Hypothetical (5% return before expenses) | | $ | 1,000.00 | | | $ | 1,015.67 | | | $ | 9.20 | | | | 1.84 | % |
Class C | | | | | | | | | | | | | | | | |
Actual | | $ | 1,000.00 | | | $ | 980.15 | | | $ | 9.03 | | | | 1.84 | % |
Hypothetical (5% return before expenses) | | $ | 1,000.00 | | | $ | 1,015.67 | | | $ | 9.20 | | | | 1.84 | % |
Class R | | | | | | | | | | | | | | | | |
Actual | | $ | 1,000.00 | | | $ | 982.73 | | | $ | 6.59 | | | | 1.34 | % |
Hypothetical (5% return before expenses) | | $ | 1,000.00 | | | $ | 1,018.15 | | | $ | 6.71 | | | | 1.34 | % |
Administrator Class | | | | | | | | | | | | | | | | |
Actual | | $ | 1,000.00 | | | $ | 983.44 | | | $ | 5.36 | | | | 1.09 | % |
Hypothetical (5% return before expenses) | | $ | 1,000.00 | | | $ | 1,019.39 | | | $ | 5.46 | | | | 1.09 | % |
Institutional Class | | | | | | | | | | | | | | | | |
Actual | | $ | 1,000.00 | | | $ | 985.23 | | | $ | 4.13 | | | | 0.84 | % |
Hypothetical (5% return before expenses) | | $ | 1,000.00 | | | $ | 1,020.63 | | | $ | 4.21 | | | | 0.84 | % |
| 1. | Expenses paid is equal to the annualized expense ratio of each class multiplied by the average account value over the period, multiplied by the number of days in the most recent fiscal half-year divided by the number of days in the fiscal year (to reflect the one-half-year period). |
| | | | | | |
| Portfolio of investments—April 30, 2014 (unaudited) | | Wells Fargo Advantage International Equity Fund | | | 7 | |
| | | | | | | | | | | | |
| Security name | | | | | | Shares | | | Value | |
| | | | | | | | | | | | |
| | | | |
Common Stocks: 96.04% | | | | | | | | | | | | |
| | | | |
| Canada: 2.37% | | | | | | | | | | | | |
Valeant Pharmaceuticals International Incorporated (Health Care, Pharmaceuticals) † | | | | | | | 36,708 | | | $ | 4,908,227 | |
| | | | | | | | | | | | |
| | | | |
| China: 6.42% | | | | | | | | | | | | |
Biostime International Holdings Limited (Consumer Staples, Food Products) | | | | | | | 180,000 | | | | 1,195,674 | |
China Mobile Limited (Telecommunication Services, Wireless Telecommunication Services) | | | | | | | 386,000 | | | | 3,669,339 | |
Dongfeng Motor Group Company Limited (Consumer Discretionary, Automobiles) | | | | | | | 2,802,000 | | | | 3,736,988 | |
Industrial & Commercial Bank of China Limited Class H (Financials, Banks) | | | | | | | 4,800,000 | | | | 2,860,331 | |
Xtep International Holdings Limited (Consumer Discretionary, Textiles, Apparel & Luxury Goods) | | | | | | | 4,521,715 | | | | 1,813,830 | |
| | | | |
| | | | | | | | | | | 13,276,162 | |
| | | | | | | | | | | | |
| | | | |
| Germany: 10.98% | | | | | | | | | | | | |
Bayer AG (Health Care, Pharmaceuticals) | | | | | | | 30,127 | | | | 4,179,667 | |
Metro AG (Consumer Staples, Food & Staples Retailing) | | | | | | | 125,066 | | | | 4,997,095 | |
Rheinmetall AG (Industrials, Industrial Conglomerates) | | | | | | | 59,439 | | | | 3,943,777 | |
SAP AG (Information Technology, Software) | | | | | | | 51,197 | | | | 4,122,472 | |
Siemens AG (Industrials, Industrial Conglomerates) | | | | | | | 41,361 | | | | 5,451,305 | |
| | | | |
| | | | | | | | | | | 22,694,316 | |
| | | | | | | | | | | | |
| | | | |
| Hong Kong: 3.82% | | | | | | | | | | | | |
China Everbright Limited (Financials, Capital Markets) | | | | | | | 3,878,000 | | | | 5,182,038 | |
Hengdeli Holdings Limited (Consumer Discretionary, Specialty Retail) | | | | | | | 14,138,874 | | | | 2,717,278 | |
| | | | |
| | | | | | | | | | | 7,899,316 | |
| | | | | | | | | | | | |
| | | | |
| Italy: 6.49% | | | | | | | | | | | | |
ENI SpA (Energy, Oil, Gas & Consumable Fuels) | | | | | | | 238,185 | | | | 6,182,641 | |
Intesa Sanpaolo SpA (Financials, Banks) | | | | | | | 2,122,018 | | | | 7,242,191 | |
| | | | |
| | | | | | | | | | | 13,424,832 | |
| | | | | | | | | | | | |
| | | | |
| Japan: 19.75% | | | | | | | | | | | | |
Asahi Glass Company Limited (Industrials, Building Products) | | | | | | | 587,000 | | | | 3,324,429 | |
Capcom Company Limited (Information Technology, Software) | | | | | | | 172,200 | | | | 2,996,467 | |
Daiwa House Industry Company Limited (Financials, Real Estate Management & Development) | | | | | | | 248,000 | | | | 4,179,625 | |
Daiwa Securities Group Incorporated (Financials, Capital Markets) | | | | | | | 773,000 | | | | 5,784,174 | |
Hitachi Limited (Information Technology, Electronic Equipment, Instruments & Components) | | | | | | | 457,000 | | | | 3,249,758 | |
Itochu Corporation (Industrials, Trading Companies & Distributors) | | | | | | | 87,000 | | | | 973,522 | |
Mitsubishi UFJ Financial Group Incorporated (Financials, Banks) | | | | | | | 1,024,300 | | | | 5,430,338 | |
Mitsui Fudosan Company Limited (Financials, Real Estate Management & Development) | | | | | | | 101,000 | | | | 2,984,506 | |
Mitsui OSK Lines Limited (Industrials, Marine) | | | | | | | 979,000 | | | | 3,265,408 | |
Nitto Denko Corporation (Materials, Chemicals) | | | | | | | 94,488 | | | | 4,075,826 | |
Sharp Corporation (Consumer Discretionary, Household Durables) † | | | | | | | 680,000 | | | | 1,702,744 | |
Toyota Motor Corporation (Consumer Discretionary, Automobiles) | | | | | | | 53,400 | | | | 2,881,150 | |
| | | | |
| | | | | | | | | | | 40,847,947 | |
| | | | | | | | | | | | |
| | | | |
| Netherlands: 2.80% | | | | | | | | | | | | |
Akzo Nobel NV (Materials, Chemicals) | | | | | | | 75,081 | | | | 5,780,037 | |
| | | | | | | | | | | | |
The accompanying notes are an integral part of these financial statements.
| | | | |
| 8 | | Wells Fargo Advantage International Equity Fund | | Portfolio of investments—April 30, 2014 (unaudited) |
| | | | | | | | | | | | | | |
| Security name | | | | | | | Shares | | | Value | |
| | | | | | | | | | | | | | |
| | | | |
| Norway: 3.36% | | | | | | | | | | | | | | |
Frontline 2012 Limited (Energy, Oil, Gas & Consumable Fuels) 144A | | | | | | | | | 270,139 | | | $ | 2,090,472 | |
Marine Harvest ASA (Consumer Staples, Food Products) | | | | | | | | | 397,032 | | | | 4,862,461 | |
| | | | |
| | | | | | | | | | | | | 6,952,933 | |
| | | | | | | | | | | | | | |
| | | | |
| Russia: 2.29% | | | | | | | | | | | | | | |
Mobile Telesystems ADR (Telecommunication Services, Wireless Telecommunication Services) | | | | | | | | | 166,531 | | | | 2,791,060 | |
Sberbank of Russia (Financials, Banks) (a) | | | | | | | | | 953,357 | | | | 1,940,710 | |
| | | | |
| | | | | | | | | | | | | 4,731,770 | |
| | | | | | | | | | | | | | |
| | | | |
| South Korea: 5.46% | | | | | | | | | | | | | | |
Hana Financial Group Incorporated (Financials, Banks) | | | | | | | | | 93,790 | | | | 3,299,397 | |
Samsung Electronics Company Limited GDR (Information Technology, Semiconductors & Semiconductor Equipment) 144A | | | | | | | | | 7,232 | | | | 4,661,024 | |
SK Telecom Company Limited (Telecommunication Services, Wireless Telecommunication Services) | | | | | | | | | 16,117 | | | | 3,330,088 | |
| | | | |
| | | | | | | | | | | | | 11,290,509 | |
| | | | | | | | | | | | | | |
| | | | |
| Sweden: 2.10% | | | | | | | | | | | | | | |
Volvo AB Class B (Industrials, Machinery) | | | | | | | | | 275,740 | | | | 4,346,736 | |
| | | | | | | | | | | | | | |
| | | | |
| Switzerland: 8.57% | | | | | | | | | | | | | | |
ABB Limited (Industrials, Electrical Equipment) | | | | | | | | | 208,709 | �� | | | 5,013,190 | |
Novartis AG (Health Care, Pharmaceuticals) | | | | | | | | | 47,737 | | | | 4,138,545 | |
Swatch Group AG Class B (Consumer Discretionary, Textiles, Apparel & Luxury Goods) | | | | | | | | | 3,317 | | | | 2,127,538 | |
Zurich Financial Services AG (Financials, Insurance) | | | | | | | | | 22,516 | | | | 6,449,589 | |
| | | | |
| | | | | | | | | | | | | 17,728,862 | |
| | | | | | | | | | | | | | |
| | | | |
| United Kingdom: 17.70% | | | | | | | | | | | | | | |
BP plc (Energy, Oil, Gas & Consumable Fuels) | | | | | | | | | 856,861 | | | | 7,222,043 | |
Capita plc (Industrials, Professional Services) | | | | | | | | | 279,667 | | | | 5,123,256 | |
Debenhams plc (Consumer Discretionary, Multiline Retail) | | | | | | | | | 3,041,355 | | | | 4,118,287 | |
Man Group plc (Financials, Capital Markets) | | | | | | | | | 3,024,484 | | | | 5,032,492 | |
Reckitt Benckiser Group plc (Consumer Staples, Household Products) | | | | | | | | | 42,649 | | | | 3,438,408 | |
Smiths Group plc (Industrials, Industrial Conglomerates) | | | | | | | | | 150,535 | | | | 3,393,078 | |
Vodafone Group plc ADR (Telecommunication Services, Wireless Telecommunication Services) | | | | | | | | | 77,248 | | | | 2,932,334 | |
Wolseley plc (Industrials, Trading Companies & Distributors) | | | | | | | | | 92,558 | | | | 5,346,162 | |
| | | | |
| | | | | | | | | | | | | 36,606,060 | |
| | | | | | | | | | | | | | |
| | | | |
| United States: 3.93% | | | | | | | | | | | | | | |
Apple Incorporated (Information Technology, Technology Hardware, Storage & Peripherals) | | | | | | | | | 6,261 | | | | 3,694,553 | |
QUALCOMM Incorporated (Information Technology, Communications Equipment) | | | | | | | | | 56,279 | | | | 4,429,720 | |
| | | | |
| | | | | | | | | | | | | 8,124,273 | |
| | | | | | | | | | | | | | |
| | | | |
Total Common Stocks (Cost $161,231,245) | | | | | | | | | | | | | 198,611,980 | |
| | | | | | | | | | | | | | |
| | | | |
| | | | | Expiration date | | | | | | | |
| Participation Notes: 0.56% | | | | | | | | | | | | | | |
| | | | |
| Singapore: 0.56% | | | | | | | | | | | | | | |
Standard Chartered Bank (Financials, Banks) † | | | | | 2-15-2015 | | | | 15,100 | | | | 395,295 | |
Standard Chartered Bank (Financials, Banks) † | | | | | 4-24-2015 | | | | 29,000 | | | | 759,176 | |
| | | | |
Total Participation Notes (Cost $1,198,213) | | | | | | | | | | | | | 1,154,471 | |
| | | | | | | | | | | | | | |
The accompanying notes are an integral part of these financial statements.
| | | | | | |
| Portfolio of investments—April 30, 2014 (unaudited) | | Wells Fargo Advantage International Equity Fund | | | 9 | |
| | | | | | | | | | | | | | |
| Security name | | Yield | | | | | Shares | | | Value | |
| | | | | | | | | | | | | | |
| | | | |
Short-Term Investments: 3.94% | | | | | | | | | | | | | | |
| | | | |
| Investment Companies: 3.94% | | | | | | | | | | | | | | |
Wells Fargo Advantage Cash Investment Money Market Fund, Select Class (l)(u) | | | 0.07 | % | | | | | 6,441,972 | | | $ | 6,441,972 | |
Wells Fargo Securities Lending Cash Investments, LLC (l)(u)(v)(r) | | | 0.11 | | | | | | 1,711,900 | | | | 1,711,900 | |
| | | | |
Total Short-Term Investments (Cost $8,153,872) | | | | | | | | | | | | | 8,153,872 | |
| | | | | | | | | | | | | | |
| | | | | | | | |
| | |
| Total investments in securities | | | | | | | | |
| (Cost $170,583,330) * | | | 100.54 | % | | | 207,920,323 | |
Other assets and liabilities, net | | | (0.54 | ) | | | (1,107,778 | ) |
| | | | | | | | |
| Total net assets | | | 100.00 | % | | $ | 206,812,545 | |
| | | | | | | | |
| † | Non-income-earning security |
| 144A | Security that may be resold to “qualified institutional buyers” under Rule 144A or security offered pursuant to Section 4(2) of the Securities Act of 1933, as amended |
| (a) | Security is fair valued by the Management Valuation Team, and in certain instances by the Board of Trustees, in accordance with procedures approved by the Board of Trustees. |
| (l) | Represents an affiliate of the Fund under Sections 2(a)(2) and 2(a)(3) of the Investment Company Act of 1940, as amended |
| (u) | Rate shown is the 7-day annualized yield at period end. |
| (v) | Security represents investment of cash collateral received from securities on loan. |
| (r) | The investment company is exempt from registration under Section 3(c)(7) of the Investment Company Act of 1940, as amended. |
| * | Cost for federal income tax purposes is $173,096,556 and unrealized appreciation (depreciation) consists of: |
| | | | |
Gross unrealized appreciation | | $ | 46,093,412 | |
Gross unrealized depreciation | | | (11,269,645 | ) |
| | | | |
Net unrealized appreciation | | $ | 34,823,767 | |
The accompanying notes are an integral part of these financial statements.
| | | | |
| 10 | | Wells Fargo Advantage International Equity Fund | | Statement of assets and liabilities—April 30, 2014 (unaudited) |
| | | | |
| | | | |
| |
Assets | | | | |
Investments | | | | |
In unaffiliated securities (including securities on loan), at value (see cost below) | | $ | 199,766,451 | |
In affiliated securities, at value (see cost below) | | | 8,153,872 | |
| | | | |
Total investments, at value (see cost below) | | | 207,920,323 | |
Foreign currency, at value (see cost below) | | | 723,302 | |
Receivable for Fund shares sold | | | 461,788 | |
Receivable for dividends | | | 960,223 | |
Receivable for securities lending income | | | 6,026 | |
Prepaid expenses and other assets | | | 38,800 | |
| | | | |
Total assets | | | 210,110,462 | |
| | | | |
| |
Liabilities | | | | |
Payable for investments purchased | | | 768,239 | |
Payable for Fund shares redeemed | | | 271,462 | |
Unrealized losses on forward foreign currency contracts | | | 239,427 | |
Payable upon receipt of securities loaned | | | 1,711,900 | |
Advisory fee payable | | | 82,850 | |
Distribution fees payable | | | 14,452 | |
Due to other related parties | | | 42,732 | |
Accrued expenses and other liabilities | | | 166,855 | |
| | | | |
Total liabilities | | | 3,297,917 | |
| | | | |
Total net assets | | $ | 206,812,545 | |
| | | | |
| |
NET ASSETS CONSIST OF | | | | |
Paid-in capital | | $ | 215,584,853 | |
Undistributed net investment income | | | 3,810,970 | |
Accumulated net realized losses on investments | | | (49,689,596 | ) |
Net unrealized gains on investments | | | 37,106,318 | |
| | | | |
Total net assets | | $ | 206,812,545 | |
| | | | |
| |
COMPUTATION OF NET ASSET VALUE AND OFFERING PRICE PER SHARE1 | | | | |
Net assets – Class A | | $ | 111,772,199 | |
Shares outstanding – Class A | | | 9,689,508 | |
Net asset value per share – Class A | | | $11.54 | |
Maximum offering price per share – Class A2 | | | $12.24 | |
Net assets – Class B | | $ | 5,330,541 | |
Shares outstanding – Class B | | | 474,298 | |
Net asset value per share – Class B | | | $11.24 | |
Net assets – Class C | | $ | 17,365,308 | |
Shares outstanding – Class C | | | 1,529,658 | |
Net asset value per share – Class C | | | $11.35 | |
Net assets – Class R | | $ | 1,730,258 | |
Shares outstanding – Class R | | | 148,286 | |
Net asset value per share – Class R | | | $11.67 | |
Net assets – Administrator Class | | $ | 11,912,264 | |
Shares outstanding – Administrator Class | | | 1,050,253 | |
Net asset value per share – Administrator Class | | | $11.34 | |
Net assets – Institutional Class | | $ | 58,701,975 | |
Shares outstanding – Institutional Class | | | 5,109,370 | |
Net asset value per share – Institutional Class | | | $11.49 | |
Investments in unaffiliated securities (including securities on loan), at cost | | $ | 162,429,458 | |
| | | | |
Investments in affiliated securities, at cost | | $ | 8,153,872 | |
| | | | |
Total investments, at cost | | $ | 170,583,330 | |
| | | | |
Securities on loan, at value | | $ | 1,612,638 | |
| | | | |
Foreign currency, at cost | | $ | 720,840 | |
| | | | |
| 1. | The Fund has an unlimited number of authorized shares. |
| 2. | Maximum offering price is computed as 100/94.25 of net asset value. On investments of $50,000 or more, the offering price is reduced. |
The accompanying notes are an integral part of these financial statements.
| | | | | | |
| Statement of operations—six months ended April 30, 2014 (unaudited) | | Wells Fargo Advantage International Equity Fund | | | 11 | |
| | | | |
| | | | |
| |
Investment income | | | | |
Dividends* | | $ | 5,128,298 | |
Securities lending income, net | | | 49,250 | |
Income from affiliated securities | | | 1,839 | |
| | | | |
Total investment income | | | 5,179,387 | |
| | | | |
| |
Expenses | | | | |
Advisory fee | | | 901,489 | |
Administration fees | | | | |
Fund level | | | 53,029 | |
Class A | | | 146,287 | |
Class B | | | 7,751 | |
Class C | | | 21,901 | |
Class R | | | 2,428 | |
Administrator Class | | | 3,686 | |
Institutional Class | | | 27,015 | |
Shareholder servicing fees | | | | |
Class A | | | 140,661 | |
Class B | | | 7,453 | |
Class C | | | 21,059 | |
Class R | | | 2,335 | |
Administrator Class | | | 8,877 | |
Distribution fees | | | | |
Class B | | | 22,360 | |
Class C | | | 63,176 | |
Class R | | | 2,335 | |
Custody and accounting fees | | | 42,516 | |
Professional fees | | | 30,350 | |
Registration fees | | | 39,583 | |
Shareholder report expenses | | | 6,646 | |
Trustees’ fees and expenses | | | 3,986 | |
Other fees and expenses | | | 9,530 | |
| | | | |
Total expenses | | | 1,564,453 | |
Less: Fee waivers and/or expense reimbursements | | | (404,977 | ) |
| | | | |
Net expenses | | | 1,159,476 | |
| | | | |
Net investment income | | | 4,019,911 | |
| | | | |
| |
REALIZED AND UNREALIZED GAINS (LOSSES) ON INVESTMENTS | | | | |
| |
Net realized gains on: | | | | |
Unaffiliated securities | | | 2,046,734 | |
Forward foreign currency contract transactions | | | 1,085,009 | |
| | | | |
Net realized gains on investments | | | 3,131,743 | |
| | | | |
| |
Net change in unrealized gains (losses) on: | | | | |
Unaffiliated securities | | | (10,023,766 | ) |
Forward foreign currency contract transactions | | | (414,748 | ) |
| | | | |
Net change in unrealized gains (losses) on investments | | | (10,438,514 | ) |
| | | | |
Net realized and unrealized gains (losses) on investments | | | (7,306,771 | ) |
| | | | |
Net decrease in net assets resulting from operations | | $ | (3,286,860 | ) |
| | | | |
| |
* Net of foreign dividend withholding taxes in the amount of | | | $215,100 | |
The accompanying notes are an integral part of these financial statements.
| | | | |
| 12 | | Wells Fargo Advantage International Equity Fund | | Statement of changes in net assets |
| | | | | | | | | | | | | | | | |
| | | Six months ended
April 30, 2014
(unaudited) | | | Year ended
October 31, 2013 | |
| | | | |
Operations | | | | | | | | | | | | | | | | |
Net investment income | | | | | | $ | 4,019,911 | | | | | | | $ | 5,196,188 | |
Net realized gains on investments | | | | | | | 3,131,743 | | | | | | | | 14,946,140 | |
Net change in unrealized gains (losses) on investments | | | | | | | (10,438,514 | ) | | | | | | | 37,934,015 | |
| | | | | | | | |
Net increase (decrease) in net assets resulting from operations | | | | | | | (3,286,860 | ) | | | | | | | 58,076,343 | |
| | | | | | | | |
| | | | |
Distributions to shareholders from | | | | | | | | | | | | | | | | |
Net investment income | | | | | | | | | | | | | | | | |
Class A | | | | | | | (2,501,559 | ) | | | | | | | (3,098,267 | ) |
Class B | | | | | | | (86,510 | ) | | | | | | | (154,513 | ) |
Class C | | | | | | | (245,790 | ) | | | | | | | (326,365 | ) |
Class R | | | | | | | (13,984 | ) | | | | | | | (50,218 | ) |
Administrator Class | | | | | | | (102,289 | ) | | | | | | | (96,415 | ) |
Institutional Class | | | | | | | (1,898,103 | ) | | | | | | | (3,727,082 | ) |
| | | | | | | | |
Total distributions to shareholders | | | | | | | (4,848,235 | ) | | | | | | | (7,452,860 | ) |
| | | | | | | | |
| | | | |
Capital share transactions | | | Shares | | | | | | | | Shares | | | | | |
Proceeds from shares sold | | | | | | | | | | | | | | | | |
Class A | | | 912,156 | | | | 10,677,913 | | | | 980,044 | | | | 10,332,997 | |
Class B | | | 2,057 | | | | 23,109 | | | | 5,575 | | | | 57,185 | |
Class C | | | 209,160 | | | | 2,398,916 | | | | 44,038 | | | | 450,351 | |
Class R | | | 25,553 | | | | 302,774 | | | | 67,899 | | | | 728,584 | |
Administrator Class | | | 761,505 | | | | 8,763,798 | | | | 139,875 | | | | 1,492,787 | |
Institutional Class | | | 233,593 | | | | 2,724,720 | | | | 1,081,036 | | | | 11,762,888 | |
| | | | | | | | |
| | | | | | | 24,891,230 | | | | | | | | 24,824,792 | |
| | | | | | | | |
Reinvestment of distributions | | | | | | | | | | | | | | | | |
Class A | | | 183,571 | | | | 2,204,689 | | | | 277,238 | | | | 2,736,335 | |
Class B | | | 7,028 | | | | 82,440 | | | | 14,857 | | | | 143,218 | |
Class C | | | 18,292 | | | | 216,764 | | | | 28,843 | | | | 281,219 | |
Class R | | | 467 | | | | 5,680 | | | | 2,608 | | | | 25,768 | |
Administrator Class | | | 6,202 | | | | 73,240 | | | | 6,902 | | | | 67,021 | |
Institutional Class | | | 100,489 | | | | 1,200,840 | | | | 152,962 | | | | 1,503,617 | |
| | | | | | | | |
| | | | | | | 3,783,653 | | | | | | | | 4,757,178 | |
| | | | | | | | |
Payment for shares redeemed | | | | | | | | | | | | | | | | |
Class A | | | (1,072,681 | ) | | | (12,615,535 | ) | | | (3,283,885 | ) | | | (34,749,891 | ) |
Class B | | | (120,784 | ) | | | (1,379,662 | ) | | | (311,172 | ) | | | (3,212,307 | ) |
Class C | | | (144,232 | ) | | | (1,678,028 | ) | | | (376,461 | ) | | | (3,946,106 | ) |
Class R | | | (64,528 | ) | | | (768,195 | ) | | | (108,985 | ) | | | (1,145,015 | ) |
Administrator Class | | | (52,963 | ) | | | (612,530 | ) | | | (175,747 | ) | | | (1,866,621 | ) |
Institutional Class | | | (2,162,784 | ) | | | (25,472,895 | ) | | | (8,463,157 | ) | | | (89,712,701 | ) |
| | | | | | | | |
| | | | | | | (42,526,845 | ) | | | | | | | (134,632,641 | ) |
| | | | | | | | |
Net decrease in net assets resulting from capital share transactions | | | | | | | (13,851,962 | ) | | | | | | | (105,050,671 | ) |
| | | | | | | | |
Total decrease in net assets | | | | | | | (21,987,057 | ) | | | | | | | (54,427,188 | ) |
| | | | | | | | |
| | | | |
Net assets | | | | | | | | | | | | | | | | |
Beginning of period | | | | | | | 228,799,602 | | | | | | | | 283,226,790 | |
| | | �� | | | | | |
End of period | | | | | | $ | 206,812,545 | | | | | | | $ | 228,799,602 | |
| | | | | | | | |
Undistributed net investment income | | | | | | $ | 3,810,970 | | | | | | | $ | 4,639,294 | |
| | | | | | | | |
The accompanying notes are an integral part of these financial statements.
| | | | | | |
| Financial highlights | | Wells Fargo Advantage International Equity Fund | | | 13 | |
(For a share outstanding throughout each period)
| | | | | | | | | | | | | | | | | | | | | | | | |
| | | Six months ended
April 30, 2014
(unaudited) | | | Year ended October 31 | |
| CLASS A | | | 2013 | | | 2012 | | | 2011 | | | 20101 | | | 20091 | |
Net asset value, beginning of period | | $ | 11.98 | | | $ | 9.77 | | | $ | 9.82 | | | $ | 10.41 | | | $ | 9.14 | | | $ | 8.54 | |
Net investment income | | | 0.23 | | | | 0.21 | | | | 0.25 | | | | 0.17 | | | | 0.09 | 2 | | | 0.17 | |
Net realized and unrealized gains (losses) on investments | | | (0.41 | ) | | | 2.27 | | | | (0.09 | ) | | | (0.75 | ) | | | 1.42 | | | | 0.69 | |
| | | | | | | | | | | | | | | | | | | | | | | | |
Total from investment operations | | | (0.18 | ) | | | 2.48 | | | | 0.16 | | | | (0.58 | ) | | | 1.51 | | | | 0.86 | |
Distributions to shareholders from | | | | | | | | | | | | | | | | | | | | | | | | |
Net investment income | | | (0.26 | ) | | | (0.27 | ) | | | (0.21 | ) | | | (0.01 | ) | | | (0.24 | ) | | | (0.26 | ) |
Net asset value, end of period | | $ | 11.54 | | | $ | 11.98 | | | $ | 9.77 | | | $ | 9.82 | | | $ | 10.41 | | | $ | 9.14 | |
Total return3 | | | (1.55 | )% | | | 25.99 | % | | | 1.83 | % | | | (5.62 | )% | | | 16.90 | % | | | 10.55 | % |
Ratios to average net assets (annualized) | | | | | | | | | | | | | | | | | | | | | | | | |
Gross expenses | | | 1.54 | % | | | 1.56 | % | | | 1.53 | % | | | 1.46 | % | | | 1.19 | % | | | 1.08 | % |
Net expenses | | | 1.09 | % | | | 1.09 | % | | | 1.09 | % | | | 1.09 | % | | | 1.07 | % | | | 1.08 | % |
Net investment income | | | 3.87 | % | | | 2.03 | % | | | 2.49 | % | | | 1.55 | % | | | 0.91 | % | | | 2.16 | % |
Supplemental data | | | | | | | | | | | | | | | | | | | | | | | | |
Portfolio turnover rate | | | 10 | % | | | 38 | % | | | 115 | % | | | 44 | % | | | 42 | % | | | 203 | % |
Net assets, end of period (000s omitted) | | | $111,772 | | | | $115,821 | | | | $114,219 | | | | $162,954 | | | | $216,096 | | | | $255,075 | |
| 1. | After the close of business on July 16, 2010, the Fund acquired the net assets of Evergreen International Equity Fund which became the accounting and performance survivor in the transaction. The information for the periods prior to July 19, 2010 is that of Class A of Evergreen International Equity Fund. |
| 2. | Calculated based upon average shares outstanding |
| 3. | Total return calculations do not include any sales charges. Returns for periods of less than one year are not annualized. |
The accompanying notes are an integral part of these financial statements.
| | | | |
| 14 | | Wells Fargo Advantage International Equity Fund | | Financial highlights |
(For a share outstanding throughout each period)
| | | | | | | | | | | | | | | | | | | | | | | | |
| | | Six months ended
April 30, 2014
(unaudited) | | | Year ended October 31 | |
| CLASS B | | | 2013 | | | 2012 | | | 2011 | | | 20101 | | | 20091 | |
Net asset value, beginning of period | | $ | 11.62 | | | $ | 9.47 | | | $ | 9.48 | | | $ | 10.12 | | | $ | 8.81 | | | $ | 8.18 | |
Net investment income | | | 0.17 | 2 | | | 0.13 | 2 | | | 0.16 | 2 | | | 0.08 | 2 | | | 0.01 | 2 | | | 0.11 | 2 |
Net realized and unrealized gains (losses) on investments | | | (0.39 | ) | | | 2.21 | | | | (0.07 | ) | | | (0.72 | ) | | | 1.41 | | | | 0.66 | |
| | | | | | | | | | | | | | | | | | | | | | | | |
Total from investment operations | | | (0.22 | ) | | | 2.34 | | | | 0.09 | | | | (0.64 | ) | | | 1.42 | | | | 0.77 | |
Distributions to shareholders from | | | | | | | | | | | | | | | | | | | | | | | | |
Net investment income | | | (0.16 | ) | | | (0.19 | ) | | | (0.10 | ) | | | 0.00 | | | | (0.11 | ) | | | (0.14 | ) |
Net asset value, end of period | | $ | 11.24 | | | $ | 11.62 | | | $ | 9.47 | | | $ | 9.48 | | | $ | 10.12 | | | $ | 8.81 | |
Total return3 | | | (1.95 | )% | | | 25.07 | % | | | 0.99 | % | | | (6.32 | )% | | | 16.15 | % | | | 9.64 | % |
Ratios to average net assets (annualized) | | | | | | | | | | | | | | | | | | | | | | | | |
Gross expenses | | | 2.28 | % | | | 2.31 | % | | | 2.28 | % | | | 2.21 | % | | | 1.94 | % | | | 1.83 | % |
Net expenses | | | 1.84 | % | | | 1.84 | % | | | 1.84 | % | | | 1.84 | % | | | 1.82 | % | | | 1.83 | % |
Net investment income | | | 2.99 | % | | | 1.27 | % | | | 1.67 | % | | | 0.77 | % | | | 0.15 | % | | | 1.45 | % |
Supplemental data | | | | | | | | | | | | | | | | | | | | | | | | |
Portfolio turnover rate | | | 10 | % | | | 38 | % | | | 115 | % | | | 44 | % | | | 42 | % | | | 203 | % |
Net assets, end of period (000s omitted) | | | $5,331 | | | | $6,810 | | | | $8,303 | | | | $12,873 | | | | $20,450 | | | | $22,300 | |
| 1. | After the close of business on July 16, 2010, the Fund acquired the net assets of Evergreen International Equity Fund which became the accounting and performance survivor in the transaction. The information for the periods prior to July 19, 2010 is that of Class B of Evergreen International Equity Fund. |
| 2. | Calculated based upon average shares outstanding |
| 3. | Total return calculations do not include any sales charges. Returns for periods of less than one year are not annualized. |
The accompanying notes are an integral part of these financial statements.
| | | | | | |
| Financial highlights | | Wells Fargo Advantage International Equity Fund | | | 15 | |
(For a share outstanding throughout each period)
| | | | | | | | | | | | | | | | | | | | | | | | |
| | | Six months ended
April 30, 2014
(unaudited) | | | Year ended October 31 | |
| CLASS C | | | 2013 | | | 2012 | | | 2011 | | | 20101 | | | 20091 | |
Net asset value, beginning of period | | $ | 11.75 | | | $ | 9.58 | | | $ | 9.59 | | | $ | 10.24 | | | $ | 8.93 | | | $ | 8.27 | |
Net investment income | | | 0.18 | 2 | | | 0.14 | 2 | | | 0.16 | 2 | | | 0.06 | | | | 0.01 | 2 | | | 0.07 | 2 |
Net realized and unrealized gains (losses) on investments | | | (0.41 | ) | | | 2.22 | | | | (0.07 | ) | | | (0.71 | ) | | | 1.41 | | | | 0.72 | |
| | | | | | | | | | | | | | | | | | | | | | | | |
Total from investment operations | | | (0.23 | ) | | | 2.36 | | | | 0.09 | | | | (0.65 | ) | | | 1.42 | | | | 0.79 | |
Distributions to shareholders from | | | | | | | | | | | | | | | | | | | | | | | | |
Net investment income | | | (0.17 | ) | | | (0.19 | ) | | | (0.10 | ) | | | 0.00 | | | | (0.11 | ) | | | (0.13 | ) |
Net asset value, end of period | | $ | 11.35 | | | $ | 11.75 | | | $ | 9.58 | | | $ | 9.59 | | | $ | 10.24 | | | $ | 8.93 | |
Total return3 | | | (1.98 | )% | | | 25.05 | % | | | 1.08 | % | | | (6.35 | )% | | | 16.13 | % | | | 9.62 | % |
Ratios to average net assets (annualized) | | | | | | | | | | | | | | | | | | | | | | | | |
Gross expenses | | | 2.29 | % | | | 2.31 | % | | | 2.28 | % | | | 2.21 | % | | | 1.94 | % | | | 1.83 | % |
Net expenses | | | 1.84 | % | | | 1.84 | % | | | 1.84 | % | | | 1.84 | % | | | 1.82 | % | | | 1.83 | % |
Net investment income | | | 3.19 | % | | | 1.30 | % | | | 1.72 | % | | | 0.79 | % | | | 0.16 | % | | | 1.39 | % |
Supplemental data | | | | | | | | | | | | | | | | | | | | | | | | |
Portfolio turnover rate | | | 10 | % | | | 38 | % | | | 115 | % | | | 44 | % | | | 42 | % | | | 203 | % |
Net assets, end of period (000s omitted) | | | $17,365 | | | | $16,997 | | | | $16,760 | | | | $22,578 | | | | $30,439 | | | | $36,718 | |
| 1. | After the close of business on July 16, 2010, the Fund acquired the net assets of Evergreen International Equity Fund which became the accounting and performance survivor in the transaction. The information for the periods prior to July 19, 2010 is that of Class C of Evergreen International Equity Fund. |
| 2. | Calculated based upon average shares outstanding |
| 3. | Total return calculations do not include any sales charges. Returns for periods of less than one year are not annualized. |
The accompanying notes are an integral part of these financial statements.
| | | | |
| 16 | | Wells Fargo Advantage International Equity Fund | | Financial highlights |
(For a share outstanding throughout each period)
| | | | | | | | | | | | | | | | | | | | | | | | |
| | | Six months ended
April 30, 2014
(unaudited) | | | Year ended October 31 | |
| CLASS R | | | 2013 | | | 2012 | | | 2011 | | | 20101 | | | 20091 | |
Net asset value, beginning of period | | $ | 11.96 | | | $ | 9.75 | | | $ | 9.79 | | | $ | 10.40 | | | $ | 9.13 | | | $ | 8.51 | |
Net investment income | | | 0.19 | 2 | | | 0.18 | 2 | | | 0.20 | 1 | | | 0.14 | 2 | | | 0.06 | 2 | | | 0.14 | |
Net realized and unrealized gains (losses) on investments | | | (0.39 | ) | | | 2.27 | | | | (0.06 | ) | | | (0.75 | ) | | | 1.42 | | | | 0.71 | |
| | | | | | | | | | | | | | | | | | | | | | | | |
Total from investment operations | | | (0.20 | ) | | | 2.45 | | | | 0.14 | | | | (0.61 | ) | | | 1.48 | | | | 0.85 | |
Distributions to shareholders from | | | | | | | | | | | | | | | | | | | | | | | | |
Net investment income | | | (0.09 | ) | | | (0.24 | ) | | | (0.18 | ) | | | 0.00 | | | | (0.21 | ) | | | (0.23 | ) |
Net asset value, end of period | | $ | 11.67 | | | $ | 11.96 | | | $ | 9.75 | | | $ | 9.79 | | | $ | 10.40 | | | $ | 9.13 | |
Total return3 | | | (1.73 | )% | | | 25.68 | % | | | 1.58 | % | | | (5.87 | )% | | | 16.58 | % | | | 10.13 | % |
Ratios to average net assets (annualized) | | | | | | | | | | | | | | | | | | | | | | | | |
Gross expenses | | | 1.79 | % | | | 1.81 | % | | | 1.78 | % | | | 1.71 | % | | | 1.45 | % | | | 1.33 | % |
Net expenses | | | 1.34 | % | | | 1.34 | % | | | 1.34 | % | | | 1.34 | % | | | 1.33 | % | | | 1.33 | % |
Net investment income | | | 3.25 | % | | | 1.72 | % | | | 2.11 | % | | | 1.31 | % | | | 0.66 | % | | | 1.79 | % |
Supplemental data | | | | | | | | | | | | | | | | | | | | | | | | |
Portfolio turnover rate | | | 10 | % | | | 38 | % | | | 115 | % | | | 44 | % | | | 42 | % | | | 203 | % |
Net assets, end of period (000s omitted) | | | $1,730 | | | | $2,234 | | | | $2,196 | | | | $3,050 | | | | $4,066 | | | | $3,811 | |
| 1. | After the close of business on July 16, 2010, the Fund acquired the net assets of Evergreen International Equity Fund which became the accounting and performance survivor in the transaction. The information for the periods prior to July 19, 2010 is that of Class R of Evergreen International Equity Fund. |
| 2. | Calculated based upon average shares outstanding |
| 3. | Returns for periods of less than one year are not annualized. |
The accompanying notes are an integral part of these financial statements.
| | | | | | |
| Financial highlights | | Wells Fargo Advantage International Equity Fund | | | 17 | |
(For a share outstanding throughout each period)
| | | | | | | | | | | | | | | | | | | | |
| | | Six months ended
April 30, 2014
(unaudited) | | | Year ended October 31 | |
| ADMINISTRATOR CLASS | | | 2013 | | | 2012 | | | 2011 | | | 20101 | |
Net asset value, beginning of period | | $ | 11.79 | | | $ | 9.62 | | | $ | 9.67 | | | $ | 10.28 | | | $ | 8.82 | |
Net investment income | | | 0.29 | | | | 0.22 | | | | 0.25 | | | | 0.16 | | | | 0.01 | |
Net realized and unrealized gains (losses) on investments | | | (0.47 | ) | | | 2.22 | | | | (0.09 | ) | | | (0.74 | ) | | | 1.45 | |
| | | | | | | | | | | | | | | | | | | | |
Total from investment operations | | | (0.18 | ) | | | 2.44 | | | | 0.16 | | | | (0.58 | ) | | | 1.46 | |
Distributions to shareholders from | | | | | | | | | | | | | | | | | | | | |
Net investment income | | | (0.27 | ) | | | (0.27 | ) | | | (0.21 | ) | | | (0.03 | ) | | | 0.00 | |
Net asset value, end of period | | $ | 11.34 | | | $ | 11.79 | | | $ | 9.62 | | | $ | 9.67 | | | $ | 10.28 | |
Total return2 | | | (1.66 | )% | | | 26.00 | % | | | 1.88 | % | | | (5.68 | )% | | | 16.55 | % |
Ratios to average net assets (annualized) | | | | | | | | | | | | | | | | | | | | |
Gross expenses | | | 1.36 | % | | | 1.37 | % | | | 1.36 | % | | | 1.25 | % | | | 1.36 | % |
Net expenses | | | 1.09 | % | | | 1.09 | % | | | 1.09 | % | | | 1.09 | % | | | 1.09 | % |
Net investment income | | | 4.97 | % | | | 2.08 | % | | | 2.52 | % | | | 1.58 | % | | | 0.32 | % |
Supplemental data | | | | | | | | | | | | | | | | | | | | |
Portfolio turnover rate | | | 10 | % | | | 38 | % | | | 115 | % | | | 44 | % | | | 42 | % |
Net assets, end of period (000s omitted) | | | $11,912 | | | | $3,955 | | | | $3,505 | | | | $3,436 | | | | $89 | |
| 1. | For the period from July 16, 2010 (commencement of class operations) to October 31, 2010 |
| 2. | Returns for periods of less than one year are not annualized. |
The accompanying notes are an integral part of these financial statements.
| | | | |
| 18 | | Wells Fargo Advantage International Equity Fund | | Financial highlights |
(For a share outstanding throughout each period)
| | | | | | | | | | | | | | | | | | | | | | | | |
| | | Six months ended
April 30, 2014
(unaudited) | | | Year ended October 31 | |
| INSTITUTIONAL CLASS | | | 2013 | | | 2012 | | | 2011 | | | 20101 | | | 20091 | |
Net asset value, beginning of period | | $ | 11.96 | | | $ | 9.76 | | | $ | 9.83 | | | $ | 10.42 | | | $ | 9.17 | | | $ | 8.59 | |
Net investment income | | | 0.22 | 2 | | | 0.24 | 2 | | | 0.37 | | | | 0.19 | 2 | | | 0.11 | 2 | | | 0.21 | |
Net realized and unrealized gains (losses) on investments | | | (0.38 | ) | | | 2.26 | | | | (0.19 | ) | | | (0.75 | ) | | | 1.43 | | | | 0.67 | |
| | | | | | | | | | | | | | | | | | | | | | | | |
Total from investment operations | | | (0.16 | ) | | | 2.50 | | | | 0.18 | | | | (0.56 | ) | | | 1.54 | | | | 0.88 | |
Distributions to shareholders from | | | | | | | | | | | | | | | | | | | | | | | | |
Net investment income | | | (0.31 | ) | | | (0.30 | ) | | | (0.25 | ) | | | (0.03 | ) | | | (0.29 | ) | | | (0.30 | ) |
Net asset value, end of period | | $ | 11.49 | | | $ | 11.96 | | | $ | 9.76 | | | $ | 9.83 | | | $ | 10.42 | | | $ | 9.17 | |
Total return3 | | | (1.48 | )% | | | 26.31 | % | | | 2.05 | % | | | (5.38 | )% | | | 17.17 | % | | | 10.73 | % |
Ratios to average net assets (annualized) | | | | | | | | | | | | | | | | | | | | | | | | |
Gross expenses | | | 1.10 | % | | | 1.13 | % | | | 1.10 | % | | | 1.03 | % | | | 0.87 | % | | | 0.83 | % |
Net expenses | | | 0.84 | % | | | 0.84 | % | | | 0.84 | % | | | 0.84 | % | | | 0.82 | % | | | 0.83 | % |
Net investment income | | | 3.76 | % | | | 2.29 | % | | | 2.67 | % | | | 1.78 | % | | | 1.15 | % | | | 2.39 | % |
Supplemental data | | | | | | | | | | | | | | | | | | | | | | | | |
Portfolio turnover rate | | | 10 | % | | | 38 | % | | | 115 | % | | | 44 | % | | | 42 | % | | | 203 | % |
Net assets, end of period (000s omitted) | | | $58,702 | | | | $82,982 | | | | $138,245 | | | | $227,158 | | | | $373,200 | | | | $671,417 | |
| 1. | After the close of business on July 16, 2010, the Fund acquired the net assets of Evergreen International Equity Fund which became the accounting and performance survivor in the transaction. The information for the periods prior to July 19, 2010 is that of Class I of Evergreen International Equity Fund. |
| 2. | Calculated based upon average shares outstanding |
| 3. | Returns for periods of less than one year are not annualized. |
The accompanying notes are an integral part of these financial statements.
| | | | | | |
| Notes to financial statements (unaudited) | | Wells Fargo Advantage International Equity Fund | | | 19 | |
1. ORGANIZATION
Wells Fargo Funds Trust (the “Trust”), a Delaware statutory trust organized on March 10, 1999, is an open-end management investment company registered under the Investment Company Act of 1940, as amended (the “1940 Act”). These financial statements report on the Wells Fargo Advantage International Equity Fund (the “Fund”) which is a diversified series of the Trust.
2. SIGNIFICANT ACCOUNTING POLICIES
The following significant accounting policies, which are consistently followed in the preparation of the financial statements of the Fund, are in conformity with U.S. generally accepted accounting principles which require management to make estimates and assumptions that affect the reported amounts of assets and liabilities, disclosure of contingent assets and liabilities at the date of the financial statements, and the reported amounts of revenues and expenses during the reporting period. Actual results could differ from those estimates.
Securities valuation
All investments are valued each business day as of the close of regular trading on the New York Stock Exchange (generally 4 p.m. Eastern Time).
Equity securities that are listed on a foreign or domestic exchange or market are valued at the official closing price or, if none, the last sales price. If no sale occurs on the primary exchange or market for the security that day, the prior day’s price will be deemed “stale” and fair values will be determined in accordance with the Fund’s Valuation Procedures.
The values of securities denominated in foreign currencies are translated into U.S. dollars at rates provided by an independent foreign currency pricing source at a time each business day specified by the Management Valuation Team of Wells Fargo Funds Management, LLC (“Funds Management”).
Many securities markets and exchanges outside the U.S. close prior to the close of the New York Stock Exchange and therefore may not fully reflect trading or events that occur after the close of the principal exchange in which the foreign securities are traded, but before the close of the New York Stock Exchange. If such trading or events are expected to materially affect the value of such securities, then fair value pricing procedures approved by the Board of Trustees of the Fund are applied. These procedures take into account multiple factors including movements in U.S. securities markets after foreign exchanges close. Foreign securities that are fair valued under these procedures are categorized as Level 2 and the application of these procedures may result in transfers between Level 1 and Level 2. Depending on market activity, such fair valuations may be frequent. Such fair value pricing may result in NAVs that are higher or lower than NAVs based on the last reported sales price or latest quoted bid price. On April 30, 2014, such fair value pricing was not used in pricing foreign securities.
Investments in registered open-end investment companies are valued at net asset value. Non-registered investment vehicles are fair valued at net asset value.
Investments which are not valued using any of the methods discussed above are valued at their fair value, as determined in good faith by the Board of Trustees. The Board of Trustees has established a Valuation Committee comprised of the Trustees and has delegated to it the authority to take any actions regarding the valuation of portfolio securities that the Valuation Committee deems necessary or appropriate, including determining the fair value of portfolio securities, unless the determination has been delegated to the Management Valuation Team. The Board of Trustees retains the authority to make or ratify any valuation decisions or approve any changes to the Valuation Procedures as it deems appropriate. On a quarterly basis, the Board of Trustees receives reports on any valuation actions taken by the Valuation Committee or the Management Valuation Team which may include items for ratification.
Valuations of fair valued securities are compared to the next actual sales price when available, or other appropriate market values, to assess the continued appropriateness of the fair valuation methodologies used. These securities are fair valued on a day-to-day basis, taking into consideration changes to appropriate market information and any significant changes to the inputs considered in the valuation process until there is a readily available price provided on an exchange or by an independent pricing service. Valuations received from an independent pricing service or independent broker-dealer quotes are periodically validated by comparisons to most recent trades and valuations provided by other independent pricing services in addition to the review of prices by the adviser and/or subadviser. Unobservable inputs used in determining fair valuations are identified based on the type of security, taking into consideration factors utilized by market participants in valuing the investment, knowledge about the issuer and the current market environment.
| | | | |
| 20 | | Wells Fargo Advantage International Equity Fund | | Notes to financial statements (unaudited) |
Foreign currency translation
The accounting records of the Fund are maintained in U.S. dollars. The values of other assets and liabilities denominated in foreign currencies are translated into U.S. dollars at rates provided by an independent foreign currency pricing source at a time each business day specified by the Management Valuation Team. Purchases and sales of securities, and income and expenses are converted at the rate of exchange on the respective dates of such transactions. Net realized foreign exchange gains or losses arise from sales of foreign currencies, currency gains or losses realized between the trade and settlement dates on securities transactions, and the difference between the amounts of dividends, interest and foreign withholding taxes recorded and the U.S. dollar equivalent of the amounts actually paid or received. Net unrealized foreign exchange gains and losses arise from changes in the fair value of assets and liabilities other than investments in securities resulting from changes in exchange rates. The changes in net assets arising from changes in exchange rates and the changes in net assets resulting from changes in market prices of securities are not separately presented. Such changes are included in net realized and unrealized gains or losses from investments.
Forward foreign currency contracts
The Fund is subject to foreign currency exchange rate risk in the normal course of pursuing its investment objectives. A forward foreign currency contract is an agreement between two parties to purchase or sell a specific currency for an agreed-upon price at a future date. The Fund enters into forward foreign currency contracts to facilitate transactions in foreign-denominated securities and to attempt to minimize the risk to the Fund from adverse changes in the relationship between currencies. Forward foreign currency contracts are recorded at the forward rate and marked-to-market daily. When the contracts are closed, realized gains and losses arising from such transactions are recorded as realized gains or losses on forward foreign currency contract transactions. The Fund could be exposed to risks if the counterparties to the contracts are unable to meet the terms of their contracts or if the value of the foreign currency changes unfavorably. The Fund’s maximum risk of loss from counterparty credit risk is the unrealized gains on the contracts. This risk may be mitigated if there is a master netting arrangement between the Fund and the counterparty.
Security loans
The Fund may lend its securities from time to time in order to earn additional income in the form of fees or interest on securities received as collateral or the investment of any cash received as collateral. The Fund continues to receive interest or dividends on the securities loaned. The Fund receives collateral in the form of cash or securities with a value at least equal to the value of the securities on loan. The value of the loaned securities is determined at the close of each business day and any additional required collateral is delivered to the Fund on the next business day. In a securities lending transaction, the net asset value of the Fund will be affected by an increase or decrease in the value of the securities loaned and by an increase or decrease in the value of the instrument in which collateral is invested. The amount of securities lending activity undertaken by the Fund fluctuates from time to time. In the event of default or bankruptcy by the borrower, the Fund may be prevented from recovering the loaned securities or gaining access to the collateral or may experience delays or costs in doing so. In addition, the investment of any cash collateral received may lose all or part of its value. The Fund has the right under the lending agreement to recover the securities from the borrower on demand.
The Fund lends its securities through an unaffiliated securities lending agent. Cash collateral received in connection with its securities lending transactions is invested in Wells Fargo Securities Lending Cash Investments, LLC (the “Securities Lending Fund”). The Securities Lending Fund is exempt from registration under Section 3(c)(7) of the 1940 Act and is managed by Funds Management and is subadvised by Wells Capital Management Incorporated (“WellsCap”). Funds Management receives an advisory fee starting at 0.05% and declining to 0.01% as the average daily net assets of the Securities Lending Fund increase. All of the fees received by Funds Management are paid to WellsCap for its services as subadviser. The Securities Lending Fund seeks to provide a positive return compared to the daily Fed Funds Open rate by investing in high-quality, U.S. dollar-denominated short-term money market instruments. Securities Lending Fund investments are fair valued based upon the amortized cost valuation technique. Income earned from investment in the Securities Lending Fund is included in securities lending income on the Statement of Operations.
Security transactions and income recognition
Securities transactions are recorded on a trade date basis. Realized gains or losses are recorded on the basis of identified cost.
Dividend income is recognized on the ex-dividend date, except for certain dividends from foreign securities, which are recorded as soon as the Fund is informed of the ex-dividend date. Dividend income from foreign securities is recorded net of foreign taxes withheld where recovery of such taxes is not assured.
Distributions to shareholders
Distributions to shareholders from net investment income and net realized gains, if any, are recorded on the ex-dividend date. Such distributions are determined in conformity with federal income tax regulations, which may differ in amount or character from net investment income and realized gains recognized for purposes of U.S. generally accepted accounting principles.
| | | | | | |
| Notes to financial statements (unaudited) | | Wells Fargo Advantage International Equity Fund | | | 21 | |
Federal and other taxes
The Fund intends to continue to qualify as a regulated investment company by distributing substantially all of its investment company taxable income and any net realized capital gains (after reduction for capital loss carryforwards) sufficient to relieve it from all, or substantially all, federal income taxes. Accordingly, no provision for federal income taxes was required.
The Fund’s income and federal excise tax returns and all financial records supporting those returns for the prior three fiscal years are subject to examination by the federal and Delaware revenue authorities. Management has analyzed the Fund’s tax positions taken on federal, state, and foreign tax returns for all open tax years and does not believe that there are any uncertain tax positions that require recognition of a tax liability.
As of October 31, 2013, the Fund had capital loss carry forwards available to offset future net realized capital gains in the amount of $50,245,413 expiring in 2016.
Class allocations
The separate classes of shares offered by the Fund differ principally in applicable sales charges, distribution, shareholder servicing, and administration fees. Shareholders of each class bear certain expenses that pertain to that particular class. All shareholders bear the common expenses of the Fund, earn income from the portfolio, and are allocated any unrealized gains and losses pro rata based on the average daily net assets of each class, without distinction between share classes. Dividends are determined separately for each class based on income and expenses allocable to each class. Realized gains and losses are allocated to each class pro rata based upon the net assets of each class on the date realized. Differences in per share dividend rates generally result from the relative weightings of pro rata income and realized gain allocations and from differences in separate class expenses, including distribution, shareholder servicing, and administration fees.
3. FAIR VALUATION MEASUREMENTS
Fair value measurements of investments are determined within a framework that has established a fair value hierarchy based upon the various data inputs utilized in determining the value of the Fund’s investments. The three-level hierarchy gives the highest priority to unadjusted quoted prices in active markets for identical assets or liabilities (Level 1) and the lowest priority to significant unobservable inputs (Level 3). The Fund’s investments are classified within the fair value hierarchy based on the lowest level of input that is significant to the fair value measurement. The inputs are summarized into three broad levels as follows:
| n | | Level 1 – quoted prices in active markets for identical securities |
| n | | Level 2 – other significant observable inputs (including quoted prices for similar securities, interest rates, prepayment speeds, credit risk, use of amortized cost, etc.) |
| n | | Level 3 – significant unobservable inputs (including the Fund’s own assumptions in determining the fair value of investments) |
The inputs or methodologies used for valuing investments in securities are not necessarily an indication of the risk associated with investing in those securities.
As of April 30, 2014, the inputs used in valuing investments in securities were as follows:
| | | | | | | | | | | | | | | | |
| Investments in securities | | Quoted prices (Level 1) | | | Other significant
observable inputs (Level 2) | | | Significant unobservable inputs (Level 3) | | | Total | |
Equity securities | | | | | | | | | | | | | | | | |
Common stocks | | | | | | | | | | | | | | | | |
Canada | | $ | 4,908,227 | | | $ | 0 | | | $ | 0 | | | $ | 4,908,227 | |
China | | | 13,276,162 | | | | 0 | | | | 0 | | | | 13,276,162 | |
Germany | | | 22,694,316 | | | | 0 | | | | 0 | | | | 22,694,316 | |
Hong Kong | | | 7,899,316 | | | | 0 | | | | 0 | | | | 7,899,316 | |
Italy | | | 13,424,832 | | | | 0 | | | | 0 | | | | 13,424,832 | |
Japan | | | 40,847,947 | | | | 0 | | | | 0 | | | | 40,847,947 | |
Netherlands | | | 5,780,037 | | | | 0 | | | | 0 | | | | 5,780,037 | |
Norway | | | 6,952,933 | | | | 0 | | | | 0 | | | | 6,952,933 | |
Russia | | | 2,791,060 | | | | 1,940,710 | | | | 0 | | | | 4,731,770 | |
| | | | |
| 22 | | Wells Fargo Advantage International Equity Fund | | Notes to financial statements (unaudited) |
| | | | | | | | | | | | | | | | |
| Investments in securities | | Quoted prices (Level 1) | | | Other significant
observable inputs (Level 2) | | | Significant unobservable inputs (Level 3) | | | Total | |
Equity securities (continued) | | | | | | | | | | | | | | | | |
South Korea | | $ | 11,290,509 | | | $ | 0 | | | $ | 0 | | | $ | 11,290,509 | |
Sweden | | | 4,346,736 | | | | 0 | | | | 0 | | | | 4,346,736 | |
Switzerland | | | 17,728,862 | | | | 0 | | | | 0 | | | | 17,728,862 | |
United Kingdom | | | 36,606,060 | | | | 0 | | | | 0 | | | | 36,606,060 | |
United States | | | 8,124,273 | | | | 0 | | | | 0 | | | | 8,124,273 | |
Participation notes | | | 0 | | | | 1,154,471 | | | | 0 | | | | 1,154,471 | |
Short-term investments | | | | | | | | | | | | | | | | |
Investment companies | | | 6,441,972 | | | | 1,711,900 | | | | 0 | | | | 8,153,872 | |
| | | $ | 203,113,242 | | | $ | 4,807,081 | | | $ | 0 | | | $ | 207,920,323 | |
As of April 30, 2014, the inputs used in valuing the Fund’s other financial instruments were as follows:
| | | | | | | | | | | | | | | | |
| Other financial instruments | | Quoted prices (Level 1) | | | Other significant
observable inputs
(Level 2) | | | Significant unobservable inputs (Level 3) | | | Total | |
Forward foreign currency contracts | | $ | 0 | | | $ | (239,427 | )* | | $ | 0 | | | $ | (239,427 | ) |
| * | Amount represents the net unrealized losses. |
Transfers in and transfers out are recognized at the end of the reporting period. For the six months ended April 30, 2014, the Fund did not have any transfers into/out of Level 1, Level 2, or Level 3.
4. TRANSACTIONS WITH AFFILIATES AND OTHER EXPENSES
Advisory fee
The Trust has entered into an advisory contract with Funds Management, an indirect wholly owned subsidiary of Wells Fargo & Company (“Wells Fargo”). The adviser is responsible for implementing investment policies and guidelines and for supervising the subadviser, who is responsible for day-to-day portfolio management of the Fund.
Pursuant to the contract, Funds Management is entitled to receive an annual advisory fee starting at 0.85% and declining to 0.70% as the average daily net assets of the Fund increase. For the six months ended April 30, 2014, the advisory fee was equivalent to an annual rate of 0.85% of the Fund’s average daily net assets.
Funds Management has retained the services of a subadviser to provide daily portfolio management to the Fund. The fee for subadvisory services is borne by Funds Management. WellsCap, an affiliate of Funds Management and an indirect wholly owned subsidiary of Wells Fargo, is the subadviser to the Fund and is entitled to receive a fee from Funds Management at an annual rate starting at 0.45% and declining to 0.40% as the average daily net assets of the Fund increase.
Administration and transfer agent fees
The Trust has entered into an administration agreement with Funds Management. Under this agreement, for providing administrative services, which includes paying fees and expenses for services provided by the transfer agent, sub-transfer agents, omnibus account servicers and record-keepers, Funds Management is entitled to receive from the Fund an annual fund level administration fee starting at 0.05% and declining to 0.03% as the average daily net assets of the Fund increase and a class level administration fee which is calculated based on the average daily net assets of each class as follows:
| | | | |
| | | Class level
administration fee | |
Class A, Class B, Class C, Class R | | | 0.26 | % |
Administrator Class | | | 0.10 | |
Institutional Class | | | 0.08 | |
Funds Management has contractually waived and/or reimbursed advisory and administration fees to the extent necessary to maintain certain net operating expense ratios for the Fund. Waiver of fees and/or reimbursement of expenses by Funds Management were made first from fund level expenses on a proportionate basis and then from class specific expenses. Funds Management has committed through February 28, 2015 to waive fees and/or reimburse
| | | | | | |
| Notes to financial statements (unaudited) | | Wells Fargo Advantage International Equity Fund | | | 23 | |
expenses to the extent necessary to cap the Fund’s expenses at 1.09% for Class A shares, 1.84% for Class B shares, 1.84% for Class C shares, 1.34% for Class R shares, 1.09% for Administrator Class shares, and 0.84% for Institutional Class shares.
Distribution fees
The Trust has adopted a Distribution Plan for Class B, Class C, and Class R shares of the Fund pursuant to Rule 12b-1 under the 1940 Act. Distribution fees are charged to Class B, Class C, and Class R shares and paid to Wells Fargo Funds Distributor, LLC, the principal underwriter, at an annual rate of 0.75% of the average daily net assets of Class B and Class C shares and 0.25% of the average daily net assets for Class R shares.
For the six months ended April 30, 2014, Wells Fargo Funds Distributor, LLC received $5,242 from the sale of Class A shares and $100 in contingent deferred sales charges from redemptions of Class B shares.
Shareholder servicing fees
The Trust has entered into contracts with one or more shareholder servicing agents, whereby Class A, Class B, Class C, Class R, and Administrator Class of the Fund is charged a fee at an annual rate of 0.25% of the average daily net assets of each respective class.
A portion of these total shareholder servicing fees were paid to affiliates of Wells Fargo.
5. INVESTMENT PORTFOLIO TRANSACTIONS
Purchases and sales of investments, excluding U.S. government obligations (if any) and short-term securities, for the six months ended April 30, 2014 were $20,235,429 and $34,347,975, respectively.
6. DERIVATIVE TRANSACTIONS
During the six months ended April 30, 2014, the Fund entered into forward foreign currency contracts for economic hedging purposes.
At April 30, 2014, the Fund had forward foreign currency contracts outstanding as follows:
Forward foreign currency contracts to sell:
| | | | | | | | | | | | | | | | |
| Exchange date | | Counterparty | | Contracts to
deliver | | U.S. value at
April 30, 2014 | | | In exchange
for U.S. $ | | | Unrealized
losses | |
7-8-2014 | | Barclays | | 1,950,000,000 JPY | | $ | 19,081,226 | | | $ | 18,841,799 | | | $ | (239,427 | ) |
The Fund had average contract amounts of $542,217 and $19,615,794 in forward foreign currency contracts to buy and forward foreign currency contracts to sell, respectively, during the six months ended April 30, 2014.
The fair value, realized gains or losses and change in unrealized gains or losses, if any, on derivative instruments are reflected in the appropriate financial statements.
For certain types of derivative transactions, the Fund has entered into International Swaps and Derivatives Association, Inc. master agreements (“ISDA Master Agreements”) or similar agreements with approved counterparties. The ISDA Master Agreements or similar agreements may have requirements to deliver/deposit securities or cash to/with an exchange or broker-dealer as collateral and allows the Fund to offset, with each counterparty, certain derivative financial instrument’s assets and/or liabilities with collateral held or pledged. Collateral requirements differ by type of derivative. Collateral or margin requirements are set by the broker or exchange clearing house for exchange traded derivatives while collateral terms are contract specific for over-the-counter traded derivatives. Cash collateral that has been pledged to cover obligations of the Fund under the ISDA Master Agreements or similar agreements, if any, will be reported separately in the Statement of Assets and Liabilities. Securities pledged as collateral, if any, for the same purpose are noted in the Portfolio of Investments. With respect to balance sheet offsetting, absent an event of default by the counterparty or a termination of the agreement, the reported amounts of financial assets and financial liabilities in the Statement of Assets and Liabilities are not offset across transactions between the Fund and the applicable counterparty. A reconciliation of the gross amounts on the Statement of Assets and Liabilities to the net amounts by derivative type, including any collateral exposure, is as follows:
| | | | | | | | | | | | | | | | |
| Derivative type | | Counterparty | | Gross amounts of liabilities in the Statement of Assets and Liabilities | | Amounts subject to
netting agreements | | | Collateral
pledged | | | Net amount
of liabilities | |
Forward foreign currency contracts | | Barclays | | $239,427* | | $ | 0 | | | $ | 0 | | | $ | 239,427 | |
| * | Amount represents net unrealized losses. |
| | | | |
| 24 | | Wells Fargo Advantage International Equity Fund | | Notes to financial statements (unaudited) |
7. BANK BORROWINGS
The Trust (excluding the money market funds and certain other funds in the Trust) and Wells Fargo Variable Trust are parties to a $150,000,000 revolving credit agreement with State Street Bank and Trust Company, whereby the Fund is permitted to use bank borrowings for temporary or emergency purposes, such as to fund shareholder redemption requests. Interest under the credit agreement is charged to the Fund based on a borrowing rate equal to the higher of the Federal Funds rate in effect on that day plus 1.25% or the overnight LIBOR rate in effect on that day plus 1.25%. In addition, an annual commitment fee equal to 0.10% of the unused balance is allocated to each participating fund. For the six months ended April 30, 2014, the Fund paid $112 in commitment fees.
For the six months ended April 30, 2014, there were no borrowings by the Fund under the agreement.
8. INDEMNIFICATION
Under the Trust’s organizational documents, the officers and Trustees are indemnified against certain liabilities that may arise out of performance of their duties to the Trust. Additionally, in the normal course of business, the Trust may enter into contracts with service providers that contain a variety of indemnification clauses. The Trust’s maximum exposure under these arrangements is dependent on future claims that may be made against the Fund and, therefore, cannot be estimated.
| | | | | | |
| Other information (unaudited) | | Wells Fargo Advantage International Equity Fund | | | 25 | |
TAX INFORMATION
Pursuant to Section 853 of the Internal Revenue Code, the following amounts were designated as foreign taxes paid for the fiscal year ended October 31, 2013. These amounts may be less than the actual foreign taxes paid for financial statement purposes. Foreign taxes paid or withheld should be included in taxable income with an offsetting deduction from gross income or as a credit for taxes paid to foreign governments. None of the income was derived from ineligible foreign sources as defined under Section 901(j) of the Internal Revenue Code.
| | | | |
Creditable
foreign taxes
paid | | Per share
amount | | Foreign income as % of
ordinary income
distributions |
| $299,050 | | $0.0156 | | 90.88% |
PROXY VOTING INFORMATION
A description of the policies and procedures that the Fund uses to determine how to vote proxies relating to portfolio securities is available without charge, upon request, by calling 1-800-222-8222, visiting our website at wellsfargoadvantagefunds.com, or visiting the SEC website at sec.gov. Information regarding how the Fund voted proxies relating to portfolio securities during the most recent 12-month period ended June 30 is available without charge on the Fund’s website at wellsfargoadvantagefunds.com or by visiting the SEC website at sec.gov.
PORTFOLIO HOLDINGS INFORMATION
The complete portfolio holdings for the Fund are publicly available on the Fund’s website (wellsfargoadvantagefunds.com) on a monthly, 30-day or more delayed basis. In addition, top ten holdings information for the Fund is publicly available on the Fund’s website on a monthly, seven-day or more delayed basis. The Fund files its complete schedule of portfolio holdings with the SEC for the first and third quarters of each fiscal year on Form N-Q, which is available without charge by visiting the SEC website at sec.gov. In addition, the Fund’s Form N-Q may be reviewed and copied at the SEC’s Public Reference Room in Washington, DC, and at regional offices in New York City, at 233 Broadway, and in Chicago, at 175 West Jackson Boulevard, Suite 900. Information about the Public Reference Room may be obtained by calling 1-800-SEC-0330.
| | | | |
| 26 | | Wells Fargo Advantage International Equity Fund | | Other information (unaudited) |
BOARD OF TRUSTEES AND OFFICERS
Each of the Trustees and Officers1 listed in the table below acts in identical capacities for each fund inthe Wells Fargo Advantage family of funds, which consists of 132 mutual funds comprising the Wells Fargo Funds Trust, Wells Fargo Variable Trust, Wells Fargo Master Trust and four closed-end funds (collectively the “Fund Complex”). This table should be read in conjunction with the Prospectus and the Statement of Additional Information2. All of the Trustees are also Members of the Audit and Governance Committees of each Trust in the Fund Complex. The mailing address of each Trustee and Officer is 525 Market Street, 12th Floor, San Francisco, CA 94105. Each Trustee and Officer serves an indefinite term, however, each Trustee serves such term until reaching the mandatory retirement age established by the Trustees.
Independent Trustees
| | | | | | |
Name and year of birth | | Position held and length of service* | | Principal occupations during past five years | | Other directorships during
past five years |
Peter G. Gordon
(Born 1942) | | Trustee, since 1998; Chairman, since 2005 | | Co-Founder, Retired Chairman, President and CEO of Crystal Geyser Water Company. Trustee Emeritus, Colby College. | | Asset Allocation Trust |
Isaiah Harris, Jr.
(Born 1952) | | Trustee, since 2009 | | Retired. Prior thereto, President and CEO of BellSouth Advertising and Publishing Corp. from 2005 to 2007, President and CEO of BellSouth Enterprises from 2004 to 2005 and President of BellSouth Consumer Services from 2000 to 2003. Emeritus member of the Iowa State University Foundation Board of Governors. Emeritus Member of the Advisory Board of Iowa State University School of Business. Advisory Board Member, Palm Harbor Academy (charter school). Mr. Harris is a certified public accountant. | | CIGNA Corporation; Deluxe Corporation; Asset Allocation Trust |
Judith M. Johnson
(Born 1949) | | Trustee, since 2008; Audit Committee Chairman, since 2008 | | Retired. Prior thereto, Chief Executive Officer and Chief Investment Officer of Minneapolis Employees Retirement Fund from 1996 to 2008. Ms. Johnson is an attorney, certified public accountant and a certified managerial accountant. | | Asset Allocation Trust |
Leroy Keith, Jr.
(Born 1939) | | Trustee, since 2010 | | Chairman, Bloc Global Services (development and construction). Trustee of the Evergreen Funds from 1983 to 2010. Former Managing Director, Almanac Capital Management (commodities firm), former Partner, Stonington Partners, Inc. (private equity fund), former Director, Obagi Medical Products Co. and former Director, Lincoln Educational Services. | | Trustee, Virtus Fund Complex (consisting of 50 portfolios as of 12/16/2013); Asset Allocation Trust |
David F. Larcker
(Born 1950) | | Trustee, since 2009 | | James Irvin Miller Professor of Accounting at the Graduate School of Business, Stanford University, Morgan Stanley Director of the Center for Leadership Development and Research and Senior Faculty of The Rock Center for Corporate Governance since 2006. From 2005 to 2008, Professor of Accounting at the Graduate School of Business, Stanford University. Prior thereto, Ernst & Young Professor of Accounting at The Wharton School, University of Pennsylvania from 1985 to 2005. | | Asset Allocation Trust |
Olivia S. Mitchell
(Born 1953) | | Trustee, since 2006 | | International Foundation of Employee Benefit Plans Professor, Wharton School of the University of Pennsylvania since 1993. Director of Wharton’s Pension Research Council and Boettner Center on Pensions & Retirement Research, and Research Associate at the National Bureau of Economic Research. Previously, Cornell University Professor from 1978 to 1993. | | Asset Allocation Trust |
Timothy J. Penny
(Born 1951) | | Trustee, since 1996 | | President and CEO of Southern Minnesota Initiative Foundation, a non-profit organization, since 2007 and Senior Fellow at the Humphrey Institute Policy Forum at the University of Minnesota since 1995. Member of the Board of Trustees of NorthStar Education Finance, Inc., a non-profit organization, since 2007. | | Asset Allocation Trust |
| | | | | | |
| Other information (unaudited) | | Wells Fargo Advantage International Equity Fund | | | 27 | |
| | | | | | |
Name and year of birth | | Position held and length of service* | | Principal occupations during past five years | | Other directorships during
past five years |
Michael S. Scofield
(Born 1943) | | Trustee, since 2010 | | Served on the Investment Company Institute’s Board of Governors and Executive Committee from 2008-2011 as well the Governing Council of the Independent Directors Council from 2006-2011 and the Independent Directors Council Executive Committee from 2008-2011. Chairman of the IDC from 2008-2010. Institutional Investor (Fund Directions) Trustee of Year in 2007. Trustee of the Evergreen Funds (and its predecessors) from 1984 to 2010. Chairman of the Evergreen Funds from 2000-2010. Former Trustee of the Mentor Funds. Retired Attorney, Law Offices of Michael S. Scofield. | | Asset Allocation Trust |
Donald C. Willeke
(Born 1940) | | Trustee, since 1996 | | Principal of the law firm of Willeke & Daniels. General Counsel of the Minneapolis Employees Retirement Fund from 1984 until its consolidation into the Minnesota Public Employees Retirement Association on June 30, 2010. Director and Vice Chair of The Tree Trust (non-profit corporation). Director of the American Chestnut Foundation (non-profit corporation). | | Asset Allocation Trust |
| * | Length of service dates reflect the Trustee’s commencement of service with the Trust’s predecessor entities, where applicable. |
Officers
| | | | | | |
Name and year of birth | | Position held and
length of service | | Principal occupations during past five years | | |
Karla M. Rabusch
(Born 1959) | | President, since 2003 | | Executive Vice President of Wells Fargo Bank, N.A. and President of Wells Fargo Funds Management, LLC since 2003. | | |
Jeremy DePalma1
(Born 1974) | | Treasurer, since 2012 | | Senior Vice President of Wells Fargo Funds Management, LLC since 2009. Senior Vice President of Evergreen Investment Management Company, LLC from 2008 to 2010. Vice President, Evergreen Investment Services, Inc. from 2004 to 2007. Head of the Fund Reporting and Control Team within Fund Administration from 2005 to 2010. | | |
C. David Messman
(Born 1960) | | Secretary, since 2000; Chief Legal Officer, since 2003 | | Senior Vice President and Secretary of Wells Fargo Funds Management, LLC since 2001. Vice President and Managing Counsel of Wells Fargo Bank, N.A. since 1996. | | |
Debra Ann Early
(Born 1964) | | Chief Compliance Officer, since 2007 | | Chief Compliance Officer of Wells Fargo Funds Management, LLC since 2007. Chief Compliance Officer of Parnassus Investments from 2005 to 2007. Chief Financial Officer of Parnassus Investments from 2004 to 2007. | | |
David Berardi
(Born 1975) | | Assistant Treasurer, since 2009 | | Vice President of Wells Fargo Funds Management, LLC since 2009. Vice President of Evergreen Investment Management Company, LLC from 2008 to 2010. Assistant Vice President of Evergreen Investment Services, Inc. from 2004 to 2008. Manager of Fund Reporting and Control for Evergreen Investment Management Company, LLC from 2004 to 2010. | | |
| 1. | Jeremy DePalma acts as Treasurer of 59 funds and Assistant Treasurer of 73 funds in the Fund Complex. |
| 2. | The Statement of Additional Information includes additional information about the Trustees and is available, without charge, upon request, by calling 1-800-222-8222 or by visiting the website at wellsfargoadvantagefunds.com. |
| | | | |
| 28 | | Wells Fargo Advantage International Equity Fund | | Other information (unaudited) |
BOARD CONSIDERATION OF INVESTMENT ADVISORY AND SUB-ADVISORY AGREEMENTS:
Under Section 15 of the Investment Company Act of 1940 (the “1940 Act”), the Board of Trustees (the “Board”) of Wells Fargo Funds Trust (the “Trust”), all the members of which have no direct or indirect interest in the investment advisory and sub-advisory agreements and are not “interested persons” of the Trust, as defined in the 1940 Act (the “Independent Trustees”), must determine whether to approve the continuation of the Trust’s investment advisory and sub-advisory agreements. In this regard, at an in-person meeting held on March 27-28, 2014 (the “Meeting”), the Board reviewed: (i) an investment advisory agreement with Wells Fargo Funds Management, LLC (“Funds Management”) for Wells Fargo Advantage International Equity Fund (the “Fund”) and (ii) an investment sub-advisory agreement with Wells Capital Management Incorporated (the “Sub-Adviser”), an affiliate of Funds Management, for the Fund. The investment advisory agreement with Funds Management and the investment sub-advisory agreement with the Sub-Adviser are collectively referred to as the “Advisory Agreements.”
At the Meeting, the Board considered the factors and reached the conclusions described below relating to the selection of Funds Management and the Sub-Adviser and the continuation of the Advisory Agreements. Prior to the Meeting, the Trustees conferred extensively among themselves and with representatives of Funds Management about these matters. Also, the Board has adopted a team-based approach, with each team consisting of a sub-set of Trustees, to assist the full Board in the discharge of its duties in reviewing performance and other matters throughout the year. The Independent Trustees were assisted in their evaluation of the Advisory Agreements by independent legal counsel, from whom they received separate legal advice and with whom they met separately.
In providing information to the Board, Funds Management and the Sub-Adviser were guided by a detailed set of requests for information submitted to them by independent legal counsel on behalf of the Independent Trustees at the start of the Board’s annual contract renewal process earlier in 2014. In considering and approving the Advisory Agreements, the Trustees considered the information they believed relevant, including but not limited to the information discussed below. The Board considered not only the specific information presented in connection with the Meeting, but also the knowledge gained over time through interaction with Funds Management and the Sub-Adviser about various topics. In this regard, the Board reviewed reports of Funds Management at each of its quarterly meetings, which included, among other things, portfolio reviews and performance reports. In addition, the Board and the teams mentioned above confer with portfolio managers at various times throughout the year. The Board did not identify any particular information or consideration that was all-important or controlling, and each individual Trustee may have attributed different weights to various factors.
After its deliberations, the Board unanimously approved the continuation of the Advisory Agreements and determined that the compensation payable to Funds Management and the Sub-Adviser is reasonable. The Board considered the continuation of the Advisory Agreements for the Fund as part of its consideration of the continuation of advisory agreements for funds across the complex, but its approvals were made on a fund-by-fund basis. The following summarizes a number of important, but not necessarily all, factors considered by the Board in support of its approvals.
Nature, extent and quality of services
The Board received and considered various information regarding the nature, extent and quality of services provided to the Fund by Funds Management and the Sub-Adviser under the Advisory Agreements. This information included, among other things, a summary of the background and experience of senior management of Funds Management, and the qualifications, background, tenure and responsibilities of each of the portfolio managers primarily responsible for the day-to-day portfolio management of the Fund.
The Board evaluated the ability of Funds Management and the Sub-Adviser to attract and retain qualified investment professionals, including research, advisory and supervisory personnel. The Board further considered the compliance programs and compliance records of Funds Management and the Sub-Adviser. In addition, the Board took into account the full range of services provided to the Fund by Funds Management and its affiliates.
Fund performance and expenses
The Board considered the performance results for the Fund over various time periods ended December 31, 2013. The Board also considered these results in comparison to the performance of funds in a universe that was determined by Lipper Inc. (“Lipper”) to be similar to the Fund (the “Universe”), and in comparison to the Fund’s benchmark index and to other comparative data. Lipper is an independent provider of investment company data. The Board received a description of the methodology used by Lipper to select the mutual funds in the performance Universe. The Board noted that the performance of the Fund (Class A) was higher than the average performance of the Universe for the one-year period under review, but lower than the average performance of the Universe for the three-, five- and ten-year periods reviewed. The Board also noted that the performance of the Fund was higher than its benchmark, the MSCI ACWI Index ex USA (Net), for the one- and three-year periods under review, but lower than its benchmark for the five- and ten-year periods.
| | | | | | |
| Other information (unaudited) | | Wells Fargo Advantage International Equity Fund | | | 29 | |
The Board received information concerning, and discussed factors contributing to, the underperformance of the Fund relative to the Universe for the one-, three- and five-year periods and the benchmark for the five- and ten-year periods. Funds Management advised the Board about the market conditions and investment decisions that it believed contributed to the underperformance during that period. The Board noted that the Fund’s current portfolio management team assumed responsibility of the Fund in 2012 and that the Fund has experienced postive short-term performance. The Board was satisfied with the explanation of factors contributing to underperformance and with the steps being taken by Funds Management and the Sub-Adviser to address the Fund’s investment performance.
The Board also received and considered information regarding the Fund’s net operating expense ratios and their various components, including actual management fees (which reflect fee waivers, if any, and include advisory, administration and transfer agent fees), custodian and other non-management fees, Rule 12b-1 and non-Rule 12b-1 service fees and fee waiver and expense reimbursement arrangements. The Board considered these ratios in comparison to the median ratios of funds in class-specific expense groups that were determined by Lipper to be similar to the Fund (the “Groups”). The Board received a description of the methodology used by Lipper to select the mutual funds in the expense Groups and an explanation of year-to-year variations in the funds comprising such expense Groups and their expense ratios. Based on the Lipper reports, the Board noted that the net operating expense ratios of the Fund were lower than the median net operating expense ratios of the expense Groups.
Based on its consideration of the factors and information it deemed relevant, including those described here, the Board concluded that the overall performance and expense structure of the Fund supported the re-approval of the Advisory Agreements.
Investment advisory and sub-advisory fee rates
The Board reviewed and considered the contractual investment advisory fee rates that are payable by the Fund to Funds Management for investment advisory services (the “Advisory Agreement Rates”), both on a stand-alone basis and on a combined basis with the Fund’s fund-level and class-level contractual administration fee rates (the “Management Rates”). The Board noted that the administration fees payable to Funds Management include transfer agency and sub-transfer agency costs. The Board also reviewed and considered the contractual investment sub-advisory fee rates that are payable by Funds Management to the Sub-Adviser for investment sub-advisory services (the “Sub-Advisory Agreement Rates”).
Among other information reviewed by the Board was a comparison of the Management Rates of the Fund with those of other funds in the expense Groups at a common asset level. The Board noted that the Management Rates of the Fund were in range or equal to the average rates for the Fund’s expense Groups for all classes except the Fund’s Class R shares, the Management Rate of which was higher than the average rate for its expense Group. However, the Board noted that the net operating expense ratios for all share classes of the Fund, including Class R, were lower than the median net operating expense ratios of their respective expense Groups.
The Board also received and considered information about the portion of the total advisory fee that was retained by Funds Management after payment of the fee to the Sub-Adviser for sub-advisory services. In assessing the reasonableness of this amount, the Board received and evaluated information about the nature and extent of responsibilities retained and risks assumed by Funds Management and not delegated to or assumed by the Sub-Adviser, and about Funds Management’s on-going oversight services. However, given the affiliation between Funds Management and the Sub-Adviser, the Board ascribed limited relevance to the allocation of the advisory fee between them.
The Board also received and considered information about the nature and extent of services offered and fee rates charged by Funds Management and the Sub-Adviser to other types of clients with investment strategies similar to those of the Fund. In this regard, the Board received information about the significantly greater scope of services, and compliance, reporting and other legal burdens and risks of managing mutual funds compared with those associated with managing assets of non-mutual fund clients such as collective funds or institutional separate accounts.
Based on its consideration of the factors and information it deemed relevant, including those described here, the Board determined that the Advisory Agreement Rates and the Sub-Advisory Agreement Rates were reasonable in light of the services covered by the Advisory Agreements.
Profitability
The Board received and considered information concerning the profitability of Funds Management, as well as the profitability of Wells Fargo as a whole, from providing services to the Fund and the fund family as a whole. The Board did not receive or consider to be necessary separate profitability information with respect to the Sub-Adviser, because its profitability information was subsumed in the collective Wells Fargo profitability analysis.
| | | | |
| 30 | | Wells Fargo Advantage International Equity Fund | | Other information (unaudited) |
Funds Management explained the methodologies and estimates that it used in calculating profitability. Among other things, the Board noted that the levels of profitability reported on a fund-by-fund basis varied widely, depending on factors such as the size and type of fund. Based on its review, the Board did not deem the profits reported by Funds Management to be at a level that would prevent it from approving the continuation of the Advisory Agreements.
Economies of scale
With respect to possible economies of scale, the Board noted the existence of breakpoints in the Fund’s advisory fee and administration fee structure, which operate generally to reduce the Fund’s expense ratios as the Fund grows in size. It considered that, for a small fund or a fund that shrinks in size, breakpoints conversely can result in higher fee levels. The Board also considered that fee waiver and expense reimbursement arrangements and competitive fee rates at the outset are means of sharing potential economies of scale with shareholders of the Fund and the fund family as a whole. The Board considered Funds Management’s view that any analyses of potential economies of scale in managing a particular fund are inherently limited in light of the joint and common costs and investments that Funds Management incurs across the fund family as a whole.
The Board concluded that the Fund’s fee and expense arrangements, including contractual breakpoints, constituted a reasonable approach to sharing potential economies of scale with the Fund and its shareholders.
Other benefits to Funds Management and the Sub-Adviser
The Board received and considered information regarding potential “fall-out” or ancillary benefits received by Funds Management and its affiliates, including the Sub-Adviser, as a result of their relationships with the Fund. Ancillary benefits could include, among others, benefits directly attributable to other relationships with the Fund and benefits potentially derived from an increase in Funds Management’s and the Sub-Adviser’s business as a result of their relationships with the Fund. The Board noted that various affiliates of Funds Management may receive distribution-related fees, shareholder servicing payments and sub-transfer agency fees in respect of shares sold or held through them and services provided.
The Board also reviewed information about soft dollar credits earned and utilized by the Sub-Adviser, fees earned by Funds Management and the Sub-Adviser from managing a private investment vehicle for the fund family’s securities lending collateral and commissions earned by an affiliated broker from portfolio transactions.
Based on its consideration of the factors and information it deemed relevant, including those described here, the Board did not find that any ancillary benefits received by Funds Management and its affiliates, including the Sub-Adviser, were unreasonable.
Conclusion
After considering the above-described factors and based on its deliberations and its evaluation of the information described above, the Board unanimously approved the continuation of the Advisory Agreements for an additional one-year period and determined that the compensation payable to Funds Management and the Sub-Adviser is reasonable.
| | | | | | |
| List of abbreviations | | Wells Fargo Advantage International Equity Fund | | | 31 | |
The following is a list of common abbreviations for terms and entities that may have appeared in this report.
| ACA | — ACA Financial Guaranty Corporation |
| ADR | — American depositary receipt |
| ADS | — American depositary shares |
| AGC | — Assured Guaranty Corporation |
| AGM | — Assured Guaranty Municipal |
| Ambac | — Ambac Financial Group Incorporated |
| AMT | — Alternative minimum tax |
| BAN | — Bond anticipation notes |
| BHAC | — Berkshire Hathaway Assurance Corporation |
| CAB | — Capital appreciation bond |
| CCAB | — Convertible capital appreciation bond |
| CDA | — Community Development Authority |
| CDO | — Collateralized debt obligation |
| DRIVER | — Derivative inverse tax-exempt receipts |
| DW&P | — Department of Water & Power |
| DWR | — Department of Water Resources |
| ECFA | — Educational & Cultural Facilities Authority |
| EDA | — Economic Development Authority |
| EDFA | — Economic Development Finance Authority |
| ETF | — Exchange-traded fund |
| FDIC | — Federal Deposit Insurance Corporation |
| FFCB | — Federal Farm Credit Banks |
| FGIC | — Financial Guaranty Insurance Corporation |
| FHA | — Federal Housing Administration |
| FHLB | — Federal Home Loan Bank |
| FHLMC | — Federal Home Loan Mortgage Corporation |
| FICO | — The Financing Corporation |
| FNMA | — Federal National Mortgage Association |
| GDR | — Global depositary receipt |
| GNMA | — Government National Mortgage Association |
| HCFR | — Healthcare facilities revenue |
| HEFA | — Health & Educational Facilities Authority |
| HEFAR | — Higher education facilities authority revenue |
| HFA | — Housing Finance Authority |
| HFFA | — Health Facilities Financing Authority |
| HUD | — Department of Housing and Urban Development |
| IDA | — Industrial Development Authority |
| IDAG | — Industrial Development Agency |
| KRW | — Republic of Korea won |
| LIBOR | — London Interbank Offered Rate |
| LLC | — Limited liability company |
| LLLP | — Limited liability limited partnership |
| LLP | — Limited liability partnership |
| MBIA | — Municipal Bond Insurance Association |
| MFHR | — Multifamily housing revenue |
| MSTR | — Municipal securities trust receipts |
| MUD | — Municipal Utility District |
| National | — National Public Finance Guarantee Corporation |
| PCFA | — Pollution Control Financing Authority |
| PCL | — Public Company Limited |
| PCR | — Pollution control revenue |
| PFA | — Public Finance Authority |
| PFFA | — Public Facilities Financing Authority |
| PFOTER | — Puttable floating option tax-exempt receipts |
| plc | — Public limited company |
| PUTTER | — Puttable tax-exempt receipts |
| R&D | — Research & development |
| Radian | — Radian Asset Assurance |
| RAN | — Revenue anticipation notes |
| RDA | — Redevelopment Authority |
| RDFA | — Redevelopment Finance Authority |
| REIT | — Real estate investment trust |
| ROC | — Reset option certificates |
| SAVRS | — Select auction variable rate securities |
| SBA | — Small Business Authority |
| SFHR | — Single-family housing revenue |
| SFMR | — Single-family mortgage revenue |
| SPA | — Standby purchase agreement |
| SPDR | — Standard & Poor’s Depositary Receipts |
| STRIPS | — Separate trading of registered interest and principal securities |
| TAN | — Tax anticipation notes |
| TIPS | — Treasury inflation-protected securities |
| TRAN | — Tax revenue anticipation notes |
| TTFA | — Transportation Trust Fund Authority |
| TVA | — Tennessee Valley Authority |
This page is intentionally left blank.


For more information
More information about Wells Fargo Advantage Funds is available free upon request. To obtain literature, please write, email, visit the Fund’s website, or call:
Wells Fargo Advantage Funds
P.O. Box 8266
Boston, MA 02266-8266
Email: wfaf@wellsfargo.com
Website: wellsfargoadvantagefunds.com
Individual investors: 1-800-222-8222
Retail investment professionals: 1-888-877-9275
Institutional investment professionals: 1-866-765-0778
This report and the financial statements contained herein are submitted for the general information of the shareholders of Wells Fargo Advantage Funds. If this report is used for promotional purposes, distribution of the report must be accompanied or preceded by a current prospectus. Before investing, please consider the investment objectives, risks, charges, and expenses of the investment. For a current prospectus and, if available, a summary prospectus, containing this information, call 1-800-222-8222 or visit the Fund’s website at wellsfargoadvantagefunds.com. Read the prospectus carefully before you invest or send money.
Wells Fargo Funds Management, LLC, a wholly owned subsidiary of Wells Fargo & Company, provides investment advisory and administrative services for Wells Fargo Advantage Funds. Other affiliates of Wells Fargo & Company provide subadvisory and other services for the Funds. The Funds are distributed by Wells Fargo Funds Distributor, LLC, Member FINRA/SIPC, an affiliate of Wells Fargo & Company.
NOT FDIC INSURED ¡ NO BANK GUARANTEE ¡ MAY LOSE VALUE
© 2014 Wells Fargo Funds Management, LLC. All rights reserved.
| | |
 | | 225171 06-14 SA240/SAR240 04-14 |

Wells Fargo Advantage
Intrinsic World Equity Fund

Semi-Annual Report
April 30, 2014

Reduce clutter. Save trees.
Sign up for electronic delivery of prospectuses and shareholder reports at wellsfargo.com/advantagedelivery
Contents
The views expressed and any forward-looking statements are as of April 30, 2014, unless otherwise noted, and are those of the Fund managers and/or Wells Fargo Funds Management, LLC. Discussions of individual securities, or the markets generally, or any Wells Fargo Advantage Fund are not intended as individual recommendations. Future events or results may vary significantly from those expressed in any forward-looking statements; the views expressed are subject to change at any time in response to changing circumstances in the market. Wells Fargo Funds Management, LLC and the Fund disclaim any obligation to publicly update or revise any views expressed or forward-looking statements.
NOT FDIC INSURED ¡ NO BANK GUARANTEE ¡ MAY LOSE VALUE
| | | | |
| 2 | | Wells Fargo Advantage Intrinsic World Equity Fund | | Letter to shareholders (unaudited) |

Karla M. Rabusch
President
Wells Fargo Advantage Funds
European markets continued to benefit from the European Central Bank’s (ECB’s) willingness to maintain low interest rates.
Some of the markets that had declined the most during the European debt crisis—such as Italy and Ireland—benefited the most from this stable economic environment, but larger markets such as France and Germany also posted gains.
Dear Valued Shareholder:
We are pleased to offer you this semi-annual report for the Wells Fargo Advantage Intrinsic World Equity Fund for the six-month period that ended April 30, 2014. The period was marked by growing concern about an economic slowdown in China and heightened geopolitical uncertainty as the U.S. and Europe confronted Russia over Ukraine. The environment created a headwind for many emerging markets, even as continued economic recovery in Europe helped most developed stock markets end the period with gains.
Major central banks continued to provide stimulus.
Major central banks continued to inject liquidity into global banks and markets through various quantitative easing policies. The U.S. Federal Reserve (Fed) remained a major source of liquidity for market participants around the world. Throughout the reporting period, the Federal Open Market Committee (FOMC)—the Fed’s monetary policymaking body—kept its key interest rate near zero in order to support the economy and the financial system. At the beginning of the reporting period, the FOMC was still making open-ended purchases of $40 billion per month in mortgage-backed securities to support the housing market and was purchasing $45 billion per month in long-term U.S. Treasuries. However, in mid-December 2013, the FOMC announced that it would reduce (or taper) its bond-buying program by $10 billion per month beginning in January 2014. Although the tapering was less aggressive than some investors had feared, the removal of liquidity sparked a sell-off in emerging markets stocks and currencies as investors sold higher-risk assets.
European markets continued to benefit from the European Central Bank’s (ECB’s) willingness to maintain low interest rates. In November 2013, the ECB cut its key rate to a historic low of 0.25%. The ECB’s actions helped support moderate year-over-year gross domestic product (GDP) growth in the eurozone.
Most developed regions gained, but emerging and developed Asian markets lagged.
For the six-month period, the MSCI EAFE Index (Net)1, a proxy for developed markets, returned 4.44%, while the MSCI Emerging Markets Index (Net)2 returned -2.98%.
In Europe, economic data continued to show moderate growth, with reported GDP for the 28 countries in the European Union rising by 0.4% in the fourth quarter of 2013 compared with the previous quarter. The unemployment rate remained high but stable at 10.5% in February and March 2014, while inflation remained consistently below a 1% annual rate. Some of the markets that had declined the most during the European debt crisis—such as Italy and Ireland—benefited the most from this stable economic environment, but larger markets such as France and Germany also posted gains. The ongoing turmoil in Ukraine did result in some stock market volatility, but as of the end of the reporting period, most investors believed that it would not result in war.
| 1. | The Morgan Stanley Capital International Europe, Australasia, and Far East (MSCI EAFE) Index (Net) is an unmanaged group of securities widely regarded by investors to be representations of the stock markets of Europe, Australasia, and the Far East. Calculations for EAFE use net dividends, which reflect the deduction of withholding taxes. You cannot invest directly in an index. Source: MSCI. MSCI makes no express or implied warranties or representations and shall have no liability whatsoever with respect to any MSCI data contained herein. The MSCI data may not be further redistributed or used as a basis for other indexes or any securities or financial products. This report is not approved, reviewed, or produced by MSCI. |
| 2. | The Morgan Stanley Capital International (MSCI) Emerging Markets Index (Net) is a free float-adjusted market-capitalization-weighted index designed to measure the equity market performance in the global emerging markets. The index is currently composed of 21 emerging markets country indexes. You cannot invest directly in an index. |
| | | | | | |
| Letter to shareholders (unaudited) | | Wells Fargo Advantage Intrinsic World Equity Fund | | | 3 | |
Asian markets posted mixed results, with political issues accounting for many of those differences. In countries such as India and Indonesia, investors were optimistic that upcoming elections might sweep in more reform-minded governments. By contrast, in Japan, the honeymoon for Prime Minister Shinzō Abe appeared to be ending, with investors worrying that his reforms were not taking effect as quickly as originally hoped.
As for China, many of the country’s economic numbers—such as national production, retail sales, fixed investment, and manufacturing activity—came in below analyst expectations, causing investor concern. In addition, China’s government has allowed a growing number of defaults in the country’s financial system as part of a long-term plan to rein in credit growth.
Don’t let short-term uncertainty derail long-term investment goals.
Periods of uncertainty can present challenges, but experience has taught us that maintaining long-term investment goals can be an effective way to plan for the future. To help you create a sound strategy based on your personal goals and risk tolerance, Wells Fargo Advantage Funds offers more than 100 mutual funds spanning a wide range of asset classes and investment styles. Although diversification cannot guarantee an investment profit or prevent losses, we believe it can be an effective way to manage investment risk and potentially smooth out overall portfolio performance. We encourage investors to know their investments and to understand that appropriate levels of risk-taking may unlock opportunities.
Thank you for choosing to invest with Wells Fargo Advantage Funds. We appreciate your confidence in us and remain committed to helping you meet your financial needs. For current information about your fund investments, contact your investment professional, visit our website at wellsfargoadvantagefunds.com, or call us directly at 1-800-222-8222. We are available 24 hours a day, 7 days a week.
Sincerely,

Karla M. Rabusch
President
Wells Fargo Advantage Funds
Notice to shareholders
The Fund and Wells Fargo Funds Management, LLC (“Funds Management”) have received an exemptive order from the SEC that permits Funds Management, subject to the approval of the Board of Trustees of the Fund, to select or replace certain subadvisers to manage all or a portion of the Fund’s assets and enter into, amend or terminate a sub-advisory agreement with certain subadvisers without obtaining shareholder approval (“Multi-manager Structure”). The Multi-manager Structure applies to subadvisers that are not affiliated with Funds Management or the Fund, except to the extent that affiliation aises solely because such subadvisers provide sub-advisory services to the Fund (“Non-affiliated Subadvisers”), as well as subadvisers that are indirect or direct wholly-owned subsidiaries of Funds Management or of another company that, indirectly or directly, wholly owns Funds Management (“Wholly-owned Subadvisers”).
Pursuant to the SEC order, Funds Management, with the approval of the Board of Trustees, has the discretion to terminate any subadvisers and allocate and reallocate the Fund’s assets among any other Non-affiliated Subadvisers or Wholly-owned Subadvisers. Funds Management, subject to oversight and supervision by the Board of Trustees, has responsibility to continue to oversee any subadvisers to the Fund and to recommend, for approval by the Board of Trustees, the hiring, termination and replacement of subadvisers for the Fund. In the event that a new subadviser is hired pursuant to the Multi-manager Structure, the Fund is required to provide notice to shareholders within 90 days.
Please contact your investment professional or call us directly at 1-800-222-8222 if you have any questions on this Notice to Shareholders.
| | | | |
| 4 | | Wells Fargo Advantage Intrinsic World Equity Fund | | Performance highlights (unaudited) |
Investment objective
The Fund seeks long-term capital appreciation.
Adviser
Wells Fargo Funds Management, LLC
Subadviser
Metropolitan West Capital Management, LLC
Portfolio managers
Jean-Baptiste Nadal, CFA
Jeffrey Peck
Average annual total returns1 (%) as of April 30, 2014
| | | | | | | | | | | | | | | | | | | | | | | | | | | | | | | | | | |
| | | | | Including sales charge | | | Excluding sales charge | | | Expense ratios2 (%) | |
| | | Inception date | | 1 year | | | 5 year | | | 10 year | | | 1 year | | | 5 year | | | 10 year | | | Gross | | | Net3 | |
| Class A (EWEAX) | | 4-30-1996 | | | 7.13 | | | | 16.57 | | | | 7.42 | | | | 13.65 | | | | 17.96 | | | | 8.06 | | | | 1.49 | | | | 1.40 | |
| Class C (EWECX) | | 5-18-2007 | | | 11.85 | | | | 17.08 | | | | 7.26 | | | | 12.85 | | | | 17.08 | | | | 7.26 | | | | 2.24 | | | | 2.15 | |
| Administrator Class (EWEIX) | | 5-18-2007 | | | – | | | | – | | | | – | | | | 13.92 | | | | 18.24 | | | | 8.24 | | | | 1.33 | | | | 1.15 | |
| Institutional Class (EWENX) | | 7-30-2010 | | | – | | | | – | | | | – | | | | 14.17 | | | | 18.42 | | | | 8.32 | | | | 1.06 | | | | 0.95 | |
| MSCI World Index (Net)4 | | – | | | – | | | | – | | | | – | | | | 16.62 | | | | 16.03 | | | | 7.17 | | | | – | | | | – | |
Figures quoted represent past performance, which is no guarantee of future results, and do not reflect taxes that a shareholder may pay on fund distributions or the redemption of fund shares. Investment return and principal value of an investment will fluctuate so that an investor’s shares, when redeemed, may be worth more or less than their original cost. Performance shown without sales charges would be lower if sales charges were reflected. Current performance may be lower or higher than the performance data quoted, which assumes the reinvestment of dividends and capital gains. Current month-end performance is available on the Fund’s website, wellsfargoadvantagefunds.com.
Index returns do not include transaction costs associated with buying and selling securities, any mutual fund fees or expenses, or any taxes. It is not possible to invest directly in an index.
For Class A shares, the maximum front-end sales charge is 5.75%. For Class C shares, the maximum contingent deferred sales charge is 1.00%. Performance including sales charge assumes the sales charge for the corresponding time period. Administrator Class and Institutional Class shares are sold without a front-end sales charge or contingent deferred sales charge.
Stock values fluctuate in response to the activities of individual companies and general market and economic conditions. Foreign investments are especially volatile and can rise or fall dramatically due to differences in the political and economic conditions of the host country. These risks are generally intensified in emerging markets. The use of derivatives may reduce returns and/or increase volatility. Certain investment strategies tend to increase the total risk of an investment (relative to the broader market). The Fund is exposed to country concentration risk and smaller-company securities risk. Consult the Fund’s prospectus for additional information on these and other risks.
Please see footnotes on page 5.
| | | | | | |
| Performance highlights (unaudited) | | Wells Fargo Advantage Intrinsic World Equity Fund | | | 5 | |
| | | | |
| Ten largest equity holdings5 (%) as of April 30, 2014 | |
Oracle Corporation | | | 3.09 | |
QUALCOMM Incorporated | | | 2.51 | |
Samsung Electronics Company Limited | | | 2.50 | |
JPMorgan Chase & Company | | | 2.48 | |
The Walt Disney Company | | | 2.44 | |
Schlumberger Limited | | | 2.41 | |
Unilever NV | | | 2.38 | |
Apple Incorporated | | | 2.35 | |
EMC Corporation | | | 2.35 | |
Texas Instruments Incorporated | | | 2.34 | |
|
| Sector distribution6 as of April 30, 2014 |
|
 |
| 1. | Historical performance shown for Class C shares prior to their inception reflects the performance of Class A shares, and has been adjusted to reflect the higher expenses applicable to Class C shares. Historical performance shown for Institutional Class shares prior to their inception reflects the performance of Administrator Class shares, and includes the higher expenses applicable to Administrator Class shares. If these expenses had not been included, returns would be higher. Historical performance shown for Administrator Class shares prior to their inception reflects the performance of Class A shares, and includes the higher expenses applicable to Class A shares. If these expenses had not been included, returns would be higher. Historical performance shown for all classes of the Fund prior to July 19, 2010, is based on the performance of the Fund’s predecessor, Evergreen Intrinsic World Equity Fund. |
| 2. | Reflects the expense ratios as stated in the most recent prospectuses. The expense ratios shown are subject to change and may differ from the annualized expense ratios shown in the financial highlights of this report. |
| 3. | The Adviser has committed through February 28, 2015, to waive fees and/or reimburse expenses to the extent necessary to cap the Fund’s Total Annual Fund Operating Expenses After Fee Waiver, excluding certain expenses, at the amounts shown. Brokerage commissions, stamp duty fees, interest, taxes, acquired fund fees and expenses, and extraordinary expenses are excluded from the cap. Without this cap, the Fund’s returns would have been lower. |
| 4. | The Morgan Stanley Capital International World Index (Net) (MSCI World Index (Net)) is a free float-adjusted market-capitalization-weighted index that is designed to measure the equity market performance of developed markets. You cannot invest directly in an index. Source: MSCI. MSCI makes no express or implied warranties or representations and shall have no liability whatsoever with respect to any MSCI data contained herein. The MSCI data may not be further redistributed or used as a basis for other indexes or any securities or financial products. This report is not approved, reviewed, or produced by MSCI. |
| 5. | The ten largest equity holdings are calculated based on the value of the securities divided by total net assets of the Fund. Holdings are subject to change and may have changed since the date specified. Top holdings typically include the underlying ordinary shares combined with any depositary receipts. |
| 6. | Sector distribution is subject to change and is calculated based on the total long-term investments of the Fund. |
| | | | |
| 6 | | Wells Fargo Advantage Intrinsic World Equity Fund | | Fund expenses (unaudited) |
As a shareholder of the Fund, you incur two types of costs: (1) transaction costs, including sales charges (loads) on purchase payments and contingent deferred sales charges (if any) on redemptions and (2) ongoing costs, including management fees, distribution (12b-1) and/or shareholder service fees, and other Fund expenses. This example is intended to help you understand your ongoing costs (in dollars) of investing in the Fund and to compare these costs with the ongoing costs of investing in other mutual funds.
The example is based on an investment of $1,000 invested at the beginning of the six-month period and held for the entire period from November 1, 2013 to April 30, 2014.
Actual expenses
The “Actual” line of the table below provides information about actual account values and actual expenses. You may use the information in this line, together with the amount you invested, to estimate the expenses that you paid over the period. Simply divide your account value by $1,000 (for example, an $8,600 account value divided by $1,000 = 8.6), then multiply the result by the number in the “Actual” line under the heading entitled “Expenses paid during period” for your applicable class of shares to estimate the expenses you paid on your account during this period.
Hypothetical example for comparison purposes
The “Hypothetical” line of the table below provides information about hypothetical account values and hypothetical expenses based on the Fund’s actual expense ratio and an assumed rate of return of 5% per year before expenses, which is not the Fund’s actual return. The hypothetical account values and expenses may not be used to estimate the actual ending account balance or expenses you paid for the period. You may use this information to compare the ongoing costs of investing in the Fund and other funds. To do so, compare this 5% hypothetical example with the 5% hypothetical examples that appear in the shareholder reports of the other funds.
Please note that the expenses shown in the table are meant to highlight your ongoing costs only and do not reflect any transactional costs, such as sales charges (loads) and contingent deferred sales charges. Therefore, the “Hypothetical” line of the table is useful in comparing ongoing costs only and will not help you determine the relative total costs of owning different funds. In addition, if these transactional costs were included, your costs would have been higher.
| | | | | | | | | | | | | | | | |
| | | Beginning
account value
11-1-2013 | | | Ending
account value
4-30-2014 | | | Expenses
paid during
the period1 | | | Net annualized
expense ratio | |
Class A | | | | | | | | | | | | | | | | |
Actual | | $ | 1,000.00 | | | $ | 1,049.72 | | | $ | 7.12 | | | | 1.40 | % |
Hypothetical (5% return before expenses) | | $ | 1,000.00 | | | $ | 1,017.85 | | | $ | 7.00 | | | | 1.40 | % |
Class C | | | | | | | | | | | | | | | | |
Actual | | $ | 1,000.00 | | | $ | 1,045.92 | | | $ | 10.91 | | | | 2.15 | % |
Hypothetical (5% return before expenses) | | $ | 1,000.00 | | | $ | 1,014.13 | | | $ | 10.74 | | | | 2.15 | % |
Administrator Class | | | | | | | | | | | | | | | | |
Actual | | $ | 1,000.00 | | | $ | 1,050.91 | | | $ | 5.85 | | | | 1.15 | % |
Hypothetical (5% return before expenses) | | $ | 1,000.00 | | | $ | 1,019.09 | | | $ | 5.76 | | | | 1.15 | % |
Institutional Class | | | | | | | | | | | | | | | | |
Actual | | $ | 1,000.00 | | | $ | 1,052.43 | | | $ | 4.83 | | | | 0.95 | % |
Hypothetical (5% return before expenses) | | $ | 1,000.00 | | | $ | 1,020.08 | | | $ | 4.76 | | | | 0.95 | % |
| 1. | Expenses paid is equal to the annualized expense ratio of each class multiplied by the average account value over the period, multiplied by the number of days in the most recent fiscal half-year divided by the number of days in the fiscal year (to reflect the one-half-year period). |
| | | | | | |
| Portfolio of investments—April 30, 2014 (unaudited) | | Wells Fargo Advantage Intrinsic World Equity Fund | | | 7 | |
| | | | | | | | | | | | |
| Security name | | | | | | Shares | | | Value | |
| | | | | | | | | | | | |
| | | | |
Common Stocks: 99.51% | | | | | | | | | | | | |
| | | | |
| Chile: 1.10% | | | | | | | | | | | | |
Enersis SA ADR (Utilities, Electric Utilities) | | | | | | | 129,476 | | | $ | 2,084,564 | |
| | | | | | | | | | | | |
| | | | |
| France: 10.66% | | | | | | | | | | | | |
Kering (Consumer Discretionary, Textiles, Apparel & Luxury Goods) | | | | | | | 16,115 | | | | 3,563,727 | |
L’Oreal SA (Consumer Staples, Personal Products) « | | | | | | | 19,406 | | | | 3,338,440 | |
Sanofi-Aventis SA (Health Care, Pharmaceuticals) | | | | | | | 31,973 | | | | 3,460,789 | |
Societe Generale SA (Financials, Banks) | | | | | | | 59,127 | | | | 3,674,935 | |
Total SA (Energy, Oil, Gas & Consumable Fuels) | | | | | | | 51,880 | | | | 3,705,308 | |
Total SA ADR (Energy, Oil, Gas & Consumable Fuels) | | | | | | | 9,179 | | | | 653,912 | |
Vivendi SA (Telecommunication Services, Diversified Telecommunication Services) | | | | | | | 64,622 | | | | 1,733,895 | |
| | | | |
| | | | | | | | | | | 20,131,006 | |
| | | | | | | | | | | | |
| | | | |
| Germany: 2.13% | | | | | | | | | | | | |
Adidas-Salomon AG (Consumer Discretionary, Textiles, Apparel & Luxury Goods) | | | | | | | 37,803 | | | | 4,034,668 | |
| | | | | | | | | | | | |
| | | | |
| Hong Kong: 4.35% | | | | | | | | | | | | |
AIA Group Limited (Financials, Insurance) | | | | | | | 791,200 | | | | 3,837,134 | |
Samsonite International SA (Consumer Discretionary, Textiles, Apparel & Luxury Goods) | | | | | | | 1,381,800 | | | | 4,384,432 | |
| | | | |
| | | | | | | | | | | 8,221,566 | |
| | | | | | | | | | | | |
| | | | |
| Japan: 6.77% | | | | | | | | | | | | |
Honda Motor Company Limited (Consumer Discretionary, Automobiles) | | | | | | | 102,500 | | | | 3,388,761 | |
Kao Corporation (Consumer Staples, Personal Products) | | | | | | | 85,800 | | | | 3,228,568 | |
Kao Corporation ADR (Consumer Staples, Personal Products) « | | | | | | | 7,531 | | | | 282,413 | |
ORIX Corporation (Financials, Diversified Financial Services) | | | | | | | 149,000 | | | | 2,152,619 | |
ORIX Corporation ADR (Financials, Diversified Financial Services) † | | | | | | | 13,700 | | | | 993,935 | |
TOTO Limited (Industrials, Building Products) | | | | | | | 193,300 | | | | 2,732,122 | |
| | | | |
| | | | | | | | | | | 12,778,418 | |
| | | | | | | | | | | | |
| | | | |
| Luxembourg: 1.94% | | | | | | | | | | | | |
Millicom International Cellular SA (Telecommunication Services, Wireless Telecommunication Services) | | | | | | | 37,059 | | | | 3,664,750 | |
| | | | | | | | | | | | |
| | | | |
| Netherlands: 7.93% | | | | | | | | | | | | |
Airbus Group NV (Industrials, Aerospace & Defense) | | | | | | | 51,941 | | | | 3,566,265 | |
Heineken NV (Consumer Staples, Beverages) « | | | | | | | 45,522 | | | | 3,157,746 | |
Sensata Technologies Holdings NV (Industrials, Electrical Equipment) † | | | | | | | 88,392 | | | | 3,754,008 | |
Unilever NV (Consumer Staples, Food Products) | | | | | | | 104,881 | | | | 4,491,004 | |
| | | | |
| | | | | | | | | | | 14,969,023 | |
| | | | | | | | | | | | |
| | | | |
| South Korea: 2.50% | | | | | | | | | | | | |
Samsung Electronics Company Limited (Information Technology, Semiconductors & Semiconductor Equipment) | | | | | | | 3,633 | | | | 4,721,880 | |
| | | | | | | | | | | | |
| | | | |
| Spain: 1.77% | | | | | | | | | | | | |
Banco Santander Central Hispano SA ADR (Financials, Banks) « | | | | | | | 335,020 | | | | 3,336,799 | |
| | | | | | | | | | | | |
| | | | |
| Switzerland: 5.41% | | | | | | | | | | | | |
Novartis AG ADR (Health Care, Pharmaceuticals) | | | | | | | 45,661 | | | | 3,969,767 | |
Transocean Limited (Energy, Energy Equipment & Services) « | | | | | | | 53,434 | | | | 2,301,402 | |
UBS AG (Financials, Capital Markets) | | | | | | | 188,897 | | | | 3,949,216 | |
| | | | |
| | | | | | | | | | | 10,220,385 | |
| | | | | | | | | | | | |
The accompanying notes are an integral part of these financial statements.
| | | | |
| 8 | | Wells Fargo Advantage Intrinsic World Equity Fund | | Portfolio of investments—April 30, 2014 (unaudited) |
| | | | | | | | | | | | | | |
| Security name | | | | | | | Shares | | | Value | |
| | | | | | | | | | | | | | |
| | | | |
| United Kingdom: 5.48% | | | | | | | | | | | | | | |
Diageo plc (Consumer Staples, Beverages) | | | | | | | | | 82,306 | | | $ | 2,525,696 | |
HSBC Holdings plc ADR (Financials, Banks) « | | | | | | | | | 36,084 | | | | 1,851,831 | |
Royal Dutch Shell plc Class A (Energy, Oil, Gas & Consumable Fuels) | | | | | | | | | 80,963 | | | | 3,206,288 | |
Standard Chartered plc (Financials, Banks) | | | | | | | | | 127,591 | | | | 2,760,665 | |
| | | | |
| | | | | | | | | | | | | 10,344,480 | |
| | | | | | | | | | | | | | |
| | | | |
| United States: 49.47% | | | | | | | | | | | | | | |
Abbott Laboratories (Health Care, Health Care Equipment & Supplies) | | | | | | | | | 93,228 | | | | 3,611,653 | |
Air Products & Chemicals Incorporated (Materials, Chemicals) | | | | | | | | | 12,042 | | | | 1,415,176 | |
Apple Incorporated (Information Technology, Technology Hardware, Storage & Peripherals) | | | | | | | | | 7,512 | | | | 4,432,756 | |
Autoliv Incorporated GDR (Consumer Discretionary, Auto Components) | | | | | | | | | 37,972 | | | | 3,912,713 | |
Baxter International Incorporated (Health Care, Health Care Equipment & Supplies) | | | | | | | | | 55,472 | | | | 4,037,807 | |
Charles Schwab Corporation (Financials, Capital Markets) | | | | | | | | | 137,635 | | | | 3,654,209 | |
eBay Incorporated (Information Technology, Internet Software & Services) † | | | | | | | | | 60,123 | | | | 3,116,175 | |
EMC Corporation (Information Technology, Technology Hardware, Storage & Peripherals) | | | | | | | | | 172,147 | | | | 4,441,393 | |
Express Scripts Holding Company (Health Care, Health Care Providers & Services) † | | | | | | | | | 61,644 | | | | 4,104,258 | |
Franklin Resources Incorporated (Financials, Capital Markets) | | | | | | | | | 83,389 | | | | 4,365,414 | |
Goldman Sachs Group Incorporated (Financials, Capital Markets) | | | | | | | | | 21,979 | | | | 3,512,684 | |
Home Depot Incorporated (Consumer Discretionary, Specialty Retail) | | | | | | | | | 46,649 | | | | 3,709,062 | |
JPMorgan Chase & Company (Financials, Diversified Financial Services) | | | | | | | | | 83,790 | | | | 4,690,564 | |
Occidental Petroleum Corporation (Energy, Oil, Gas & Consumable Fuels) | | | | | | | | | 38,646 | | | | 3,700,355 | |
Oracle Corporation (Information Technology, Software) | | | | | | | | | 142,657 | | | | 5,831,818 | |
PepsiCo Incorporated (Consumer Staples, Beverages) | | | | | | | | | 43,398 | | | | 3,727,454 | |
QUALCOMM Incorporated (Information Technology, Communications Equipment) | | | | | | | | | 60,271 | | | | 4,743,930 | |
Schlumberger Limited (Energy, Energy Equipment & Services) | | | | | | | | | 44,820 | | | | 4,551,471 | |
SunTrust Banks Incorporated (Financials, Banks) | | | | | | | | | 57,946 | | | | 2,217,014 | |
Texas Instruments Incorporated (Information Technology, Semiconductors & Semiconductor Equipment) | | | | | | | | | 97,310 | | | | 4,422,740 | |
The Walt Disney Company (Consumer Discretionary, Media) | | | | | | | | | 58,076 | | | | 4,607,750 | |
United Parcel Service Incorporated Class B (Industrials, Air Freight & Logistics) | | | | | | | | | 39,614 | | | | 3,901,979 | |
Visa Incorporated Class A (Information Technology, IT Services) | | | | | | | | | 15,963 | | | | 3,234,263 | |
Zions Bancorporation (Financials, Banks) | | | | | | | | | 120,178 | | | | 3,475,548 | |
| | | | |
| | | | | | | | | | | | | 93,418,186 | |
| | | | | | | | | | | | | | |
| | | | |
Total Common Stocks (Cost $133,937,832) | | | | | | | | | | | | | 187,925,725 | |
| | | | | | | | | | | | | | |
| | | | |
| | | Yield | | | | | | | | | |
| Short-Term Investments: 7.45% | | | | | | | | | | | | | | |
| | | | |
| Investment Companies: 7.45% | | | | | | | | | | | | | | |
Wells Fargo Advantage Cash Investment Money Market Fund, Select Class (l)(u) | | | 0.07 | % | | | | | 557,655 | | | | 557,655 | |
Wells Fargo Securities Lending Cash Investments, LLC (r)(v)(l)(u) | | | 0.11 | | | | | | 13,500,312 | | | | 13,500,312 | |
| | | | |
Total Short-Term Investments (Cost $14,057,967) | | | | | | | | | | | | | 14,057,967 | |
| | | | | | | | | | | | | | |
| | | | | | | | |
| Total investments in securities | | | | | | | | |
| (Cost $147,995,799) * | | | 106.96 | % | | | 201,983,692 | |
Other assets and liabilities, net | | | (6.96 | ) | | | (13,137,702 | ) |
| | | | | | | | |
| Total net assets | | | 100.00 | % | | $ | 188,845,990 | |
| | | | | | | | |
The accompanying notes are an integral part of these financial statements.
| | | | | | |
| Portfolio of investments—April 30, 2014 (unaudited) | | Wells Fargo Advantage Intrinsic World Equity Fund | | | 9 | |
| † | Non-income-earning security |
| « | All or a portion of this security is on loan. |
| (l) | Represents an affiliate of the Fund under Sections 2(a)(2) and 2(a)(3) of the Investment Company Act of 1940, as amended |
| (u) | Rate shown is the 7-day annualized yield at period end. |
| (r) | The investment company is exempt from registration under Section 3(c)(7) of the Investment Company Act of 1940, as amended. |
| (v) | Security represents investment of cash collateral received from securities on loan. |
| * | Cost for federal income tax purposes is $148,993,760 and unrealized appreciation (depreciation) consists of: |
| | | | |
Gross unrealized appreciation | | $ | 57,037,368 | |
Gross unrealized depreciation | | | (4,047,436 | ) |
| | | | |
Net unrealized appreciation | | $ | 52,989,932 | |
The accompanying notes are an integral part of these financial statements.
| | | | |
| 10 | | Wells Fargo Advantage Intrinsic World Equity Fund | | Statement of assets and liabilities—April 30, 2014 (unaudited) |
| | | | |
| | | | |
| |
Assets | | | | |
Investments | | | | |
In unaffiliated securities (including securities on loan), at value (see cost below) | | $ | 187,925,725 | |
In affiliated securities, at value (see cost below) | | | 14,057,967 | |
| | | | |
Total investments, at value (see cost below) | | | 201,983,692 | |
Foreign currency, at value (see cost below) | | | 60,518 | |
Receivable for investments sold | | | 2,603,967 | |
Receivable for Fund shares sold | | | 194,169 | |
Receivable for dividends | | | 417,427 | |
Receivable for securities lending income | | | 3,797 | |
Prepaid expenses and other assets | | | 36,105 | |
| | | | |
Total assets | | | 205,299,675 | |
| | | | |
| |
Liabilities | | | | |
Payable for investments purchased | | | 2,504,274 | |
Payable for Fund shares redeemed | | | 191,417 | |
Payable upon receipt of securities loaned | | | 13,500,312 | |
Advisory fee payable | | | 112,452 | |
Distribution fees payable | | | 6,126 | |
Due to other related parties | | | 46,731 | |
Accrued expenses and other liabilities | | | 92,373 | |
| | | | |
Total liabilities | | | 16,453,685 | |
| | | | |
Total net assets | | $ | 188,845,990 | |
| | | | |
| |
NET ASSETS CONSIST OF | | | | |
Paid-in capital | | $ | 140,776,567 | |
Overdistributed net investment income | | | (204,383 | ) |
Accumulated net realized losses on investments | | | (5,714,201 | ) |
Net unrealized gains on investments | | | 53,988,007 | |
| | | | |
Total net assets | | $ | 188,845,990 | |
| | | | |
| |
COMPUTATION OF NET ASSET VALUE AND OFFERING PRICE PER SHARE1 | | | | |
Net assets – Class A | | $ | 168,983,076 | |
Shares outstanding – Class A | | | 7,436,830 | |
Net asset value per share – Class A | | | $22.72 | |
Maximum offering price per share – Class A2 | | | $24.11 | |
Net assets – Class C | | $ | 9,956,725 | |
Shares outstanding – Class C | | | 451,687 | |
Net asset value per share – Class C | | | $22.04 | |
Net assets – Administrator Class | | $ | 7,296,313 | |
Shares outstanding – Administrator Class | | | 322,377 | |
Net asset value per share – Administrator Class | | | $22.63 | |
Net assets – Institutional Class | | $ | 2,609,876 | |
Shares outstanding – Institutional Class | | | 115,041 | |
Net asset value per share – Institutional Class | | | $22.69 | |
| |
Investments in unaffiliated securities (including securities on loan), at cost | | $ | 133,937,832 | |
| | | | |
Investments in affiliated securities, at cost | | $ | 14,057,967 | |
| | | | |
Total investments, at cost | | $ | 147,995,799 | |
| | | | |
Securities on loan, at value | | $ | 12,941,771 | |
| | | | |
Foreign currency, at cost | | $ | 60,687 | |
| | | | |
| 1. | The Fund has an unlimited number of authorized shares. |
| 2. | Maximum offering price is computed as 100/94.25 of net asset value. On investments of $50,000 or more, the offering price is reduced. |
The accompanying notes are an integral part of these financial statements.
| | | | | | |
| Statement of operations—six months ended April 30, 2014 (unaudited) | | Wells Fargo Advantage Intrinsic World Equity Fund | | | 11 | |
| | | | |
| | | | |
| |
Investment income | | | | |
Dividends* | | $ | 1,802,780 | |
Securities lending income, net | | | 25,327 | |
Income from affiliated securities | | | 1,025 | |
| | | | |
Total investment income | | | 1,829,132 | |
| | | | |
| |
Expenses | | | | |
Advisory fee | | | 742,210 | |
Administration fees | | | | |
Fund level | | | 46,388 | |
Class A | | | 217,098 | |
Class C | | | 12,801 | |
Administrator Class | | | 3,107 | |
Institutional Class | | | 998 | |
Shareholder servicing fees | | | | |
Class A | | | 208,748 | |
Class C | | | 12,308 | |
Administrator Class | | | 7,223 | |
Distribution fees | | | | |
Class C | | | 36,925 | |
Custody and accounting fees | | | 12,620 | |
Professional fees | | | 25,923 | |
Registration fees | | | 30,994 | |
Shareholder report expenses | | | 24,732 | |
Trustees’ fees and expenses | | | 5,054 | |
Other fees and expenses | | | 5,992 | |
| | | | |
Total expenses | | | 1,393,121 | |
Less: Fee waivers and/or expense reimbursements | | | (70,707 | ) |
| | | | |
Net expenses | | | 1,322,414 | |
| | | | |
Net investment income | | | 506,718 | |
| | | | |
| |
REALIZED AND UNREALIZED GAINS (LOSSES) ON INVESTMENTS | | | | |
Net realized gains on investments | | | 6,168,193 | |
Net change in unrealized gains (losses) on investments | | | 2,402,532 | |
| | | | |
Net realized and unrealized gains (losses) on investments | | | 8,570,725 | |
| | | | |
Net increase in net assets resulting from operations | | $ | 9,077,443 | |
| | | | |
| |
* Net of foreign dividend withholding taxes in the amount of | | | $89,678 | |
The accompanying notes are an integral part of these financial statements.
| | | | |
| 12 | | Wells Fargo Advantage Intrinsic World Equity Fund | | Statement of changes in net assets |
| | | | | | | | | | | | | | | | |
| | | Six months ended
April 30, 2014
(unaudited) | | | Year ended
October 31, 2013 | |
| | | | |
Operations | | | | | | | | | | | | | | | | |
Net investment income | | | | | | $ | 506,718 | | | | | | | $ | 1,593,402 | |
Net realized gains on investments | | | | | | | 6,168,193 | | | | | | | | 6,100,111 | |
Net change in unrealized gains (losses) on investments | | | | | | | 2,402,532 | | | | | | | | 28,921,892 | |
| | | | |
Net increase in net assets resulting from operations | | | | | | | 9,077,443 | | | | | | | | 36,615,405 | |
| | | | |
| | | | |
Distributions to shareholders from | | | | | | | | | | | | | | | | |
Net investment income | | | | | | | | | | | | | | | | |
Class A | | | | | | | (1,863,591 | ) | | | | | | | (2,139,717 | ) |
Class C | | | | | | | (51,916 | ) | | | | | | | (49,898 | ) |
Administrator Class | | | | | | | (64,491 | ) | | | | | | | (41,171 | ) |
Institutional Class | | | | | | | (34,571 | ) | | | | | | | (18,116 | ) |
| | | | |
Total distributions to shareholders | | | | | | | (2,014,569 | ) | | | | | | | (2,248,902 | ) |
| | | | |
| | | | |
Capital share transactions | | | Shares | | | | | | | | Shares | | | | | |
Proceeds from shares sold | | | | | | | | | | | | | | | | |
Class A | | | 129,086 | | | | 2,864,940 | | | | 488,164 | | | | 9,695,905 | |
Class C | | | 13,733 | | | | 296,308 | | | | 124,686 | | | | 2,366,816 | |
Administrator Class | | | 216,882 | | | | 4,743,149 | | | | 207,320 | | | | 3,983,378 | |
Institutional Class | | | 26,791 | | | | 592,442 | | | | 128,630 | | | | 2,562,388 | |
| | | | |
| | | | | | | 8,496,839 | | | | | | | | 18,608,487 | |
| | | | |
Reinvestment of distributions | | | | | | | | | | | | | | | | |
Class A | | | 80,375 | | | | 1,805,214 | | | | 114,035 | | | | 2,068,598 | |
Class C | | | 2,231 | | | | 48,726 | | | | 2,582 | | | | 45,654 | |
Administrator Class | | | 2,592 | | | | 57,936 | | | | 1,888 | | | | 34,067 | |
Institutional Class | | | 1,542 | | | | 34,536 | | | | 1,003 | | | | 18,116 | |
| | | | |
| | | | | | | 1,946,412 | | | | | | | | 2,166,435 | |
| | | | |
Payment for shares redeemed | | | | | | | | | | | | | | | | |
Class A | | | (478,436 | ) | | | (10,597,722 | ) | | | (1,084,686 | ) | | | (21,543,868 | ) |
Class C | | | (33,891 | ) | | | (731,504 | ) | | | (80,316 | ) | | | (1,555,920 | ) |
Administrator Class | | | (140,393 | ) | | | (3,096,127 | ) | | | (77,769 | ) | | | (1,549,990 | ) |
Institutional Class | | | (20,837 | ) | | | (463,308 | ) | | | (53,354 | ) | | | (1,095,769 | ) |
| | | | |
| | | | | | | (14,888,661 | ) | | | | | | | (25,745,547 | ) |
| | | | |
Net decrease in net assets resulting from capital share transactions | | | | | | | (4,445,410 | ) | | | | | | | (4,970,625 | ) |
| | | | |
Total increase in net assets | | | | | | | 2,617,464 | | | | | | | | 29,395,878 | |
| | | | |
| | | | |
Net assets | | | | | | | | | | | | | | | | |
Beginning of period | | | | | | | 186,228,526 | | | | | | | | 156,832,648 | |
| | | | |
End of period | | | | | | $ | 188,845,990 | | | | | | | $ | 186,228,526 | |
| | | | |
Undistributed (overdistributed) net investment income | | | | | | $ | (204,383 | ) | | | | | | $ | 1,303,468 | |
| | | | |
The accompanying notes are an integral part of these financial statements.
| | | | | | |
| Financial highlights | | Wells Fargo Advantage Intrinsic World Equity Fund | | | 13 | |
(For a share outstanding throughout each period)
| | | | | | | | | | | | | | | | | | | | | | | | |
| | | Six months ended April 30, 2014 (unaudited) | | | Year ended October 31 | |
| CLASS A | | | 2013 | | | 2012 | | | 2011 | | | 20101 | | | 20091 | |
Net asset value, beginning of period | | $ | 21.88 | | | $ | 17.94 | | | $ | 15.55 | | | $ | 15.06 | | | $ | 13.27 | | | $ | 13.76 | |
Net investment income | | | 0.07 | | | | 0.20 | | | | 0.16 | | | | 0.12 | 2 | | | 0.12 | | | | 0.09 | 2 |
Net realized and unrealized gains (losses) on investments | | | 1.02 | | | | 4.00 | | | | 1.87 | | | | 0.48 | | | | 1.78 | | | | 1.89 | |
| | | | | | | | | | | | | | | | | | | | | | | | |
Total from investment operations | | | 1.09 | | | | 4.20 | | | | 2.03 | | | | 0.60 | | | | 1.90 | | | | 1.98 | |
Distributions to shareholders from | | | | | | | | | | | | | | | | | | | | | | | | |
Net investment income | | | (0.25 | ) | | | (0.26 | ) | | | (0.11 | ) | | | (0.11 | ) | | | (0.11 | ) | | | (0.24 | ) |
Net realized gains | | | 0.00 | | | | 0.00 | | | | 0.00 | | | | 0.00 | | | | 0.00 | | | | (2.23 | ) |
| | | | | | | | | | | | | | | | | | | | | | | | |
Total distributions to shareholders | | | (0.25 | ) | | | (0.26 | ) | | | (0.11 | ) | | | (0.11 | ) | | | (0.11 | ) | | | (2.47 | ) |
Regulatory settlement proceeds | | | 0.00 | | | | 0.00 | | | | 0.47 | | | | 0.00 | | | | 0.00 | | | | 0.00 | |
Net asset value, end of period | | $ | 22.72 | | | $ | 21.88 | | | $ | 17.94 | | | $ | 15.55 | | | $ | 15.06 | | | $ | 13.27 | |
Total return3 | | | 4.97 | % | | | 23.74 | % | | | 16.25 | %4 | | | 4.00 | % | | | 14.43 | % | | | 20.29 | % |
Ratios to average net assets (annualized) | | | | | | | | | | | | | | | | | | | | | | | | |
Gross expenses | | | 1.47 | % | | | 1.49 | % | | | 1.51 | % | | | 1.50 | % | | | 1.53 | % | | | 1.57 | % |
Net expenses | | | 1.40 | % | | | 1.40 | % | | | 1.40 | % | | | 1.40 | % | | | 1.46 | % | | | 1.57 | % |
Net investment income | | | 0.57 | % | | | 0.95 | % | | | 0.91 | % | | | 0.79 | % | | | 0.75 | % | | | 0.77 | % |
Supplemental data | | | | | | | | | | | | | | | | | | | | | | | | |
Portfolio turnover rate | | | 11 | % | | | 22 | % | | | 27 | % | | | 12 | % | | | 11 | % | | | 16 | % |
Net assets, end of period (000s omitted) | | | $168,983 | | | | $168,621 | | | | $146,930 | | | | $139,100 | | | | $100,460 | | | | $103,995 | |
| 1. | After the close of business on July 16, 2010, the Fund acquired the net assets of Evergreen Intrinsic World Equity Fund which became the accounting and performance survivor in the transaction. The information for the periods prior to July 19, 2010 is that of Class A of Evergreen Intrinsic World Equity Fund. |
| 2. | Calculated based upon average shares outstanding |
| 3. | Total return calculations do not include any sales charges. Returns for periods of less than one year are not annualized. |
| 4. | During the year ended October 31, 2012, the Fund received a regulatory settlement from an unaffiliated third party which had an impact of 2.92% on the total return. |
The accompanying notes are an integral part of these financial statements.
| | | | |
| 14 | | Wells Fargo Advantage Intrinsic World Equity Fund | | Financial highlights |
(For a share outstanding throughout each period)
| | | | | | | | | | | | | | | | | | | | | | | | |
| | | Six months ended April 30, 2014 (unaudited) | | | Year ended October 31 | |
| CLASS C | | | 2013 | | | 2012 | | | 2011 | | | 20101 | | | 20091 | |
Net asset value, beginning of period | | $ | 21.19 | | | $ | 17.37 | | | $ | 15.15 | | | $ | 14.68 | | | $ | 12.96 | | | $ | 13.58 | |
Net investment income (loss) | | | (0.03 | ) | | | 0.05 | | | | 0.02 | | | | (0.01 | )2 | | | 0.07 | | | | (0.03 | )2 |
Net realized and unrealized gains (losses) on investments | | | 0.99 | | | | 3.89 | | | | 1.82 | | | | 0.49 | | | | 1.69 | | | | 1.87 | |
| | | | | | | | | | | | | | | | | | | | | | | | |
Total from investment operations | | | 0.96 | | | | 3.94 | | | | 1.84 | | | | 0.48 | | | | 1.76 | | | | 1.84 | |
Distributions to shareholders from | | | | | | | | | | | | | | | | | | | | | | | | |
Net investment income | | | (0.11 | ) | | | (0.12 | ) | | | (0.09 | ) | | | (0.01 | ) | | | (0.04 | ) | | | (0.23 | ) |
Net realized gains | | | 0.00 | | | | 0.00 | | | | 0.00 | | | | 0.00 | | | | 0.00 | | | | (2.23 | ) |
| | | | | | | | | | | | | | | | | | | | | | | | |
Total distributions to shareholders | | | (0.11 | ) | | | (0.12 | ) | | | (0.09 | ) | | | (0.01 | ) | | | (0.04 | ) | | | (2.46 | ) |
Regulatory settlement proceeds | | | 0.00 | | | | 0.00 | | | | 0.47 | | | | 0.00 | | | | 0.00 | | | | 0.00 | |
Net asset value, end of period | | $ | 22.04 | | | $ | 21.19 | | | $ | 17.37 | | | $ | 15.15 | | | $ | 14.68 | | | $ | 12.96 | |
Total return3 | | | 4.59 | % | | | 22.82 | % | | | 15.39 | %4 | | | 3.27 | % | | | 13.58 | % | | | 19.35 | % |
Ratios to average net assets (annualized) | | | | | | | | | | | | | | | | | | | | | | | | |
Gross expenses | | | 2.22 | % | | | 2.24 | % | | | 2.26 | % | | | 2.20 | % | | | 2.28 | % | | | 2.33 | % |
Net expenses | | | 2.15 | % | | | 2.15 | % | | | 2.15 | % | | | 2.15 | % | | | 2.21 | % | | | 2.33 | % |
Net investment income (loss) | | | (0.18 | )% | | | 0.20 | % | | | 0.16 | % | | | (0.05 | )% | | | 0.04 | % | | | (0.28 | )% |
Supplemental data | | | | | | | | | | | | | | | | | | | | | | | | |
Portfolio turnover rate | | | 11 | % | | | 22 | % | | | 27 | % | | | 12 | % | | | 11 | % | | | 16 | % |
Net assets, end of period (000s omitted) | | | $9,957 | | | | $9,949 | | | | $7,341 | | | | $6,817 | | | | $588 | | | | $427 | |
| 1. | After the close of business on July 16, 2010, the Fund acquired the net assets of Evergreen Intrinsic World Equity Fund which became the accounting and performance survivor in the transaction. The information for the periods prior to July 19, 2010 is that of Class C of Evergreen Intrinsic World Equity Fund. |
| 2. | Calculated based upon average shares outstanding |
| 3. | Total return calculations do not include any sales charges. Returns for periods of less than one year are not annualized. |
| 4. | During the year ended October 31, 2012, the Fund received a regulatory settlement from an unaffiliated third party which had an impact of 2.92% on the total return. |
The accompanying notes are an integral part of these financial statements.
| | | | | | |
| Financial highlights | | Wells Fargo Advantage Intrinsic World Equity Fund | | | 15 | |
(For a share outstanding throughout each period)
| | | | | | | | | | | | | | | | | | | | | | | | |
| | | Six months ended April 30, 2014 (unaudited) | | | Year ended October 31 | |
| ADMINISTRATOR CLASS | | | 2013 | | | 2012 | | | 2011 | | | 20101 | | | 20091 | |
Net asset value, beginning of period | | $ | 21.81 | | | $ | 17.89 | | | $ | 15.52 | | | $ | 15.02 | | | $ | 13.23 | | | $ | 13.76 | |
Net investment income | | | 0.10 | 2 | | | 0.24 | 2 | | | 0.19 | 2 | | | 0.15 | 2 | | | 0.15 | 2 | | | 0.15 | 2 |
Net realized and unrealized gains (losses) on investments | | | 1.01 | | | | 3.99 | | | | 1.87 | | | | 0.49 | | | | 1.78 | | | | 1.85 | |
| | | | | | | | | | | | | | | | | | | | | | | | |
Total from investment operations | | | 1.11 | | | | 4.23 | | | | 2.06 | | | | 0.64 | | | | 1.93 | | | | 2.00 | |
Distributions to shareholders from | | | | | | | | | | | | | | | | | | | | | | | | |
Net investment income | | | (0.29 | ) | | | (0.31 | ) | | | (0.16 | ) | | | (0.14 | ) | | | (0.14 | ) | | | (0.30 | ) |
Net realized gains | | | 0.00 | | | | 0.00 | | | | 0.00 | | | | 0.00 | | | | 0.00 | | | | (2.23 | ) |
| | | | | | | | | | | | | | | | | | | | | | | | |
Total distributions to shareholders | | | (0.29 | ) | | | (0.31 | ) | | | (0.16 | ) | | | (0.14 | ) | | | (0.14 | ) | | | (2.53 | ) |
Regulatory settlement proceeds | | | 0.00 | | | | 0.00 | | | | 0.47 | | | | 0.00 | | | | 0.00 | | | | 0.00 | |
Net asset value, end of period | | $ | 22.63 | | | $ | 21.81 | | | $ | 17.89 | | | $ | 15.52 | | | $ | 15.02 | | | $ | 13.23 | |
Total return3 | | | 5.09 | % | | | 24.03 | % | | | 16.52 | %4 | | | 4.27 | % | | | 14.72 | % | | | 20.60 | % |
Ratios to average net assets (annualized) | | | | | | | | | | | | | | | | | | | | | | | | |
Gross expenses | | | 1.30 | % | | | 1.31 | % | | | 1.34 | % | | | 1.30 | % | | | 1.29 | % | | | 1.31 | % |
Net expenses | | | 1.15 | % | | | 1.15 | % | | | 1.15 | % | | | 1.15 | % | | | 1.21 | % | | | 1.31 | % |
Net investment income | | | 0.89 | % | | | 1.18 | % | | | 1.14 | % | | | 0.99 | % | | | 1.06 | % | | | 1.33 | % |
Supplemental data | | | | | | | | | | | | | | | | | | | | | | | | |
Portfolio turnover rate | | | 11 | % | | | 22 | % | | | 27 | % | | | 12 | % | | | 11 | % | | | 16 | % |
Net assets, end of period (000s omitted) | | | $7,296 | | | | $5,306 | | | | $2,001 | | | | $1,986 | | | | $144 | | | | $161 | |
| 1. | After the close of business on July 16, 2010, the Fund acquired the net assets of Evergreen Intrinsic World Equity Fund which became the accounting and performance survivor in the transaction. The information for the periods prior to July 19, 2010 is that of Class I of Evergreen Intrinsic World Equity Fund. |
| 2. | Calculated based upon average shares outstanding |
| 3. | Returns for periods of less than one year are not annualized. |
| 4. | During the year ended October 31, 2012, the Fund received a regulatory settlement from an unaffiliated third party which had an impact of 2.93% on the total return. |
The accompanying notes are an integral part of these financial statements.
| | | | |
| 16 | | Wells Fargo Advantage Intrinsic World Equity Fund | | Financial highlights |
(For a share outstanding throughout each period)
| | | | | | | | | | | | | | | | | | | | |
| | | Six months ended April 30, 2014 (unaudited) | | | Year ended October 31 | |
| INSTITUTIONAL CLASS | | | 2013 | | | 2012 | | | 2011 | | | 20101 | |
Net asset value, beginning of period | | $ | 21.87 | | | $ | 17.93 | | | $ | 15.54 | | | $ | 15.02 | | | $ | 13.80 | |
Net investment income | | | 0.13 | | | | 0.26 | 2 | | | 0.17 | 2 | | | 0.16 | | | | 0.03 | 2 |
Net realized and unrealized gains (losses) on investments | | | 1.01 | | | | 4.02 | | | | 1.92 | | | | 0.51 | | | | 1.19 | |
| | | | | | | | | | | | | | | | | | | | |
Total from investment operations | | | 1.14 | | | | 4.28 | | | | 2.09 | | | | 0.67 | | | | 1.22 | |
Distributions to shareholders from | | | | | | | | | | | | | | | | | | | | |
Net investment income | | | (0.32 | ) | | | (0.34 | ) | | | (0.17 | ) | | | (0.15 | ) | | | 0.00 | |
Regulatory settlement proceeds | | | 0.00 | | | | 0.00 | | | | 0.47 | | | | 0.00 | | | | 0.00 | |
Net asset value, end of period | | $ | 22.69 | | | $ | 21.87 | | | $ | 17.93 | | | $ | 15.54 | | | $ | 15.02 | |
Total return3 | | | 5.24 | % | | | 24.28 | % | | | 16.74 | %4 | | | 4.50 | % | | | 8.84 | % |
Ratios to average net assets (annualized) | | | | | | | | | | | | | | | | | | | | |
Gross expenses | | | 1.04 | % | | | 1.06 | % | | | 1.10 | % | | | 1.00 | % | | | 1.23 | % |
Net expenses | | | 0.95 | % | | | 0.95 | % | | | 0.95 | % | | | 0.95 | % | | | 0.95 | % |
Net investment income | | | 1.03 | % | | | 1.32 | % | | | 1.03 | % | | | 1.12 | % | | | 0.91 | % |
Supplemental data | | | | | | | | | | | | | | | | | | | | |
Portfolio turnover rate | | | 11 | % | | | 22 | % | | | 27 | % | | | 12 | % | | | 11 | % |
Net assets, end of period (000s omitted) | | | $2,610 | | | | $2,352 | | | | $561 | | | | $573 | | | | $11 | |
| 1. | For the period from July 30, 2010 (commencement of class operations) to October 31, 2010. |
| 2. | Calculated based upon average shares outstanding |
| 3. | Returns for periods of less than one year are not annualized. |
| 4. | During the year ended October 31, 2012, the Fund received a regulatory settlement from an unaffiliated third party which had an impact of 2.93% on the total return. |
The accompanying notes are an integral part of these financial statements.
| | | | | | |
| Notes to financial statements (unaudited) | | Wells Fargo Advantage Intrinsic World Equity Fund | | | 17 | |
1. ORGANIZATION
Wells Fargo Funds Trust (the “Trust”), a Delaware statutory trust organized on March 10, 1999, is an open-end management investment company registered under the Investment Company Act of 1940, as amended (the “1940 Act”). These financial statements report on the Wells Fargo Advantage Intrinsic World Equity Fund (the “Fund”) which is a diversified series of the Trust.
2. SIGNIFICANT ACCOUNTING POLICIES
The following significant accounting policies, which are consistently followed in the preparation of the financial statements of the Fund, are in conformity with U.S. generally accepted accounting principles which require management to make estimates and assumptions that affect the reported amounts of assets and liabilities, disclosure of contingent assets and liabilities at the date of the financial statements, and the reported amounts of revenues and expenses during the reporting period. Actual results could differ from those estimates.
Securities valuation
All investments are valued each business day as of the close of regular trading on the New York Stock Exchange (generally 4 p.m. Eastern Time).
Equity securities that are listed on a foreign or domestic exchange or market are valued at the official closing price or, if none, the last sales price. If no sale occurs on the primary exchange or market for the security that day, the prior day’s price will be deemed “stale” and fair values will be determined in accordance with the Fund’s Valuation Procedures.
The values of securities denominated in foreign currencies are translated into U.S. dollars at rates provided by an independent foreign currency pricing source at a time each business day specified by the Management Valuation Team of Wells Fargo Funds Management, LLC (“Funds Management”).
Many securities markets and exchanges outside the U.S. close prior to the close of the New York Stock Exchange and therefore may not fully reflect trading or events that occur after the close of the principal exchange in which the foreign securities are traded, but before the close of the New York Stock Exchange. If such trading or events are expected to materially affect the value of such securities, then fair value pricing procedures approved by the Board of Trustees of the Fund are applied. These procedures take into account multiple factors including movements in U.S. securities markets after foreign exchanges close. Foreign securities that are fair valued under these procedures are categorized as Level 2 and the application of these procedures may result in transfers between Level 1 and Level 2. Depending on market activity, such fair valuations may be frequent. Such fair value pricing may result in NAVs that are higher or lower than NAVs based on the last reported sales price or latest quoted bid price. On April 30, 2014, such fair value pricing was not used in pricing foreign securities.
Investments in registered open-end investment companies are valued at net asset value. Non-registered investment vehicles are fair valued at net asset value.
Investments which are not valued using any of the methods discussed above are valued at their fair value, as determined in good faith by the Board of Trustees. The Board of Trustees has established a Valuation Committee comprised of the Trustees and has delegated to it the authority to take any actions regarding the valuation of portfolio securities that the Valuation Committee deems necessary or appropriate, including determining the fair value of portfolio securities, unless the determination has been delegated to the Management Valuation Team. The Board of Trustees retains the authority to make or ratify any valuation decisions or approve any changes to the Valuation Procedures as it deems appropriate. On a quarterly basis, the Board of Trustees receives reports on any valuation actions taken by the Valuation Committee or the Management Valuation Team which may include items for ratification.
Valuations of fair valued securities are compared to the next actual sales price when available, or other appropriate market values, to assess the continued appropriateness of the fair valuation methodologies used. These securities are fair valued on a day-to-day basis, taking into consideration changes to appropriate market information and any significant changes to the inputs considered in the valuation process until there is a readily available price provided on an exchange or by an independent pricing service. Valuations received from an independent pricing service or independent broker-dealer quotes are periodically validated by comparisons to most recent trades and valuations provided by other independent pricing services in addition to the review of prices by the adviser and/or subadviser. Unobservable inputs used in determining fair valuations are identified based on the type of security, taking into consideration factors utilized by market participants in valuing the investment, knowledge about the issuer and the current market environment.
| | | | |
| 18 | | Wells Fargo Advantage Intrinsic World Equity Fund | | Notes to financial statements (unaudited) |
Foreign currency translation
The accounting records of the Fund are maintained in U.S. dollars. The values of other assets and liabilities denominated in foreign currencies are translated into U.S. dollars at rates provided by an independent foreign currency pricing source at a time each business day specified by the Management Valuation Team. Purchases and sales of securities, and income and expenses are converted at the rate of exchange on the respective dates of such transactions. Net realized foreign exchange gains or losses arise from sales of foreign currencies, currency gains or losses realized between the trade and settlement dates on securities transactions, and the difference between the amounts of dividends, interest and foreign withholding taxes recorded and the U.S. dollar equivalent of the amounts actually paid or received. Net unrealized foreign exchange gains and losses arise from changes in the fair value of assets and liabilities other than investments in securities resulting from changes in exchange rates. The changes in net assets arising from changes in exchange rates and the changes in net assets resulting from changes in market prices of securities are not separately presented. Such changes are included in net realized and unrealized gains or losses from investments.
Security loans
The Fund may lend its securities from time to time in order to earn additional income in the form of fees or interest on securities received as collateral or the investment of any cash received as collateral. The Fund continues to receive interest or dividends on the securities loaned. The Fund receives collateral in the form of cash or securities with a value at least equal to the value of the securities on loan. The value of the loaned securities is determined at the close of each business day and any additional required collateral is delivered to the Fund on the next business day. In a securities lending transaction, the net asset value of the Fund will be affected by an increase or decrease in the value of the securities loaned and by an increase or decrease in the value of the instrument in which collateral is invested. The amount of securities lending activity undertaken by the Fund fluctuates from time to time. In the event of default or bankruptcy by the borrower, the Fund may be prevented from recovering the loaned securities or gaining access to the collateral or may experience delays or costs in doing so. In addition, the investment of any cash collateral received may lose all or part of its value. The Fund has the right under the lending agreement to recover the securities from the borrower on demand.
The Fund lends its securities through an unaffiliated securities lending agent. Cash collateral received in connection with its securities lending transactions is invested in Wells Fargo Securities Lending Cash Investments, LLC (the “Securities Lending Fund”). The Securities Lending Fund is exempt from registration under Section 3(c)(7) of the 1940 Act and is managed by Funds Management and is subadvised by Wells Capital Management Incorporated (“WellsCap”). Funds Management receives an advisory fee starting at 0.05% and declining to 0.01% as the average daily net assets of the Securities Lending Fund increase. All of the fees received by Funds Management are paid to WellsCap for its services as subadviser. The Securities Lending Fund seeks to provide a positive return compared to the daily Fed Funds Open rate by investing in high-quality, U.S. dollar-denominated short-term money market instruments. Securities Lending Fund investments are fair valued based upon the amortized cost valuation technique. Income earned from investment in the Securities Lending Fund is included in securities lending income on the Statement of Operations.
Security transactions and income recognition
Securities transactions are recorded on a trade date basis. Realized gains or losses are recorded on the basis of identified cost.
Dividend income is recognized on the ex-dividend date, except for certain dividends from foreign securities, which are recorded as soon as the Fund is informed of the ex-dividend date. Dividend income from foreign securities is recorded net of foreign taxes withheld where recovery of such taxes is not assured.
Distributions to shareholders
Distributions to shareholders from net investment income and net realized gains, if any, are recorded on the ex-dividend date. Such distributions are determined in conformity with federal income tax regulations, which may differ in amount or character from net investment income and realized gains recognized for purposes of U.S. generally accepted accounting principles.
Federal and other taxes
The Fund intends to continue to qualify as a regulated investment company by distributing substantially all of its investment company taxable income and any net realized capital gains (after reduction for capital loss carryforwards) sufficient to relieve it from all, or substantially all, federal income taxes. Accordingly, no provision for federal income taxes was required.
The Fund’s income and federal excise tax returns and all financial records supporting those returns for the prior three fiscal years are subject to examination by the federal and Delaware revenue authorities. Management has analyzed the Fund’s tax positions taken on federal, state, and foreign tax returns for all open tax years and does not believe that there are any uncertain tax positions that require recognition of a tax liability.
| | | | | | |
| Notes to financial statements (unaudited) | | Wells Fargo Advantage Intrinsic World Equity Fund | | | 19 | |
As of October 31, 2013, the Fund had capital loss carryforwards available to offset future net realized capital gains in the amount of $11,568,379 with $1,812,120 expiring in 2016; $8,483,254 expiring in 2017; and $1,273,005 expiring in 2018.
Class allocations
The separate classes of shares offered by the Fund differ principally in applicable sales charges, distribution, shareholder servicing, and administration fees. Shareholders of each class bear certain expenses that pertain to that particular class. All shareholders bear the common expenses of the Fund, earn income from the portfolio, and are allocated any unrealized gains and losses pro rata based on the average daily net assets of each class, without distinction between share classes. Dividends are determined separately for each class based on income and expenses allocable to each class. Realized gains and losses are allocated to each class pro rata based upon the net assets of each class on the date realized. Differences in per share dividend rates generally result from the relative weightings of pro rata income and realized gain allocations and from differences in separate class expenses, including distribution, shareholder servicing, and administration fees.
3. FAIR VALUATION MEASUREMENTS
Fair value measurements of investments are determined within a framework that has established a fair value hierarchy based upon the various data inputs utilized in determining the value of the Fund’s investments. The three-level hierarchy gives the highest priority to unadjusted quoted prices in active markets for identical assets or liabilities (Level 1) and the lowest priority to significant unobservable inputs (Level 3). The Fund’s investments are classified within the fair value hierarchy based on the lowest level of input that is significant to the fair value measurement. The inputs are summarized into three broad levels as follows:
| n | | Level 1 – quoted prices in active markets for identical securities |
| n | | Level 2 – other significant observable inputs (including quoted prices for similar securities, interest rates, prepayment speeds, credit risk, use of amortized cost, etc.) |
| n | | Level 3 – significant unobservable inputs (including the Fund’s own assumptions in determining the fair value of investments) |
The inputs or methodologies used for valuing investments in securities are not necessarily an indication of the risk associated with investing in those securities.
As of April 30, 2014, the inputs used in valuing investments in securities were as follows:
| | | | | | | | | | | | | | | | |
| Investments in securities | | Quoted prices (Level 1) | | | Other significant
observable inputs (Level 2) | | | Significant unobservable inputs (Level 3) | | | Total | |
Equity securities | | | | | | | | | | | | | | | | |
Common stocks | | | | | | | | | | | | | | | | |
Chile | | $ | 2,084,564 | | | $ | 0 | | | $ | 0 | | | $ | 2,084,564 | |
France | | | 20,131,006 | | | | 0 | | | | 0 | | | | 20,131,006 | |
Germany | | | 4,034,668 | | | | 0 | | | | 0 | | | | 4,034,668 | |
Hong Kong | | | 8,221,566 | | | | 0 | | | | 0 | | | | 8,221,566 | |
Japan | | | 12,778,418 | | | | 0 | | | | 0 | | | | 12,778,418 | |
Luxembourg | | | 3,664,750 | | | | 0 | | | | 0 | | | | 3,664,750 | |
Netherlands | | | 14,969,023 | | | | 0 | | | | 0 | | | | 14,969,023 | |
South Korea | | | 4,721,880 | | | | 0 | | | | 0 | | | | 4,721,880 | |
Spain | | | 3,336,799 | | | | 0 | | | | 0 | | | | 3,336,799 | |
Switzerland | | | 10,220,385 | | | | 0 | | | | 0 | | | | 10,220,385 | |
United Kingdom | | | 10,344,480 | | | | 0 | | | | 0 | | | | 10,344,480 | |
United States | | | 93,418,186 | | | | 0 | | | | 0 | | | | 93,418,186 | |
Short-term investments | | | | | | | | | | | | | | | | |
Investment companies | | | 557,655 | | | | 13,500,312 | | | | 0 | | | | 14,057,967 | |
| | | $ | 188,483,380 | | | $ | 13,500,312 | | | $ | 0 | | | $ | 201,983,692 | |
Transfers in and transfers out are recognized at the end of the reporting period. For the six months ended April 30, 2014, the Fund did not have any transfers into/out of Level 1, Level 2, or Level 3.
| | | | |
| 20 | | Wells Fargo Advantage Intrinsic World Equity Fund | | Notes to financial statements (unaudited) |
4. TRANSACTIONS WITH AFFILIATES AND OTHER EXPENSES
Advisory fee
The Trust has entered into an advisory contract with Funds Management, an indirect wholly owned subsidiary of Wells Fargo & Company (“Wells Fargo”). The adviser is responsible for implementing investment policies and guidelines and for supervising the subadviser, who is responsible for day-to-day portfolio management of the Fund.
Pursuant to the contract, Funds Management is entitled to receive an annual advisory fee starting at 0.80% and declining to 0.65% as the average daily net assets of the Fund increase. For the six months ended April 30, 2014, the advisory fee was equivalent to an annual rate of 0.80% of the Fund’s average daily net assets.
Funds Management has retained the services of a subadviser to provide daily portfolio management to the Fund. The fee for subadvisory services is borne by Funds Management. Metropolitan West Capital Management, LLC, an affiliate of Funds Management and an indirect wholly owned subsidiary of Wells Fargo, is the subadviser to the Fund and is entitled to receive a fee from Funds Management at an annual rate starting at 0.35% and declining to 0.20% as the average daily net assets of the Fund increase.
Administration and transfer agent fees
The Trust has entered into an administration agreement with Funds Management. Under this agreement, for providing administrative services, which includes paying fees and expenses for services provided by the transfer agent, sub-transfer agents, omnibus account servicers and record-keepers, Funds Management is entitled to receive from the Fund an annual fund level administration fee starting at 0.05% and declining to 0.03% as the average daily net assets of the Fund increase and a class level administration fee which is calculated based on the average daily net assets of each class as follows:
| | | | |
| | | Class level
administration fee | |
Class A, Class C | | | 0.26 | % |
Administrator Class | | | 0.10 | |
Institutional Class | | | 0.08 | |
Funds Management has contractually waived and/or reimbursed advisory and administration fees to the extent necessary to maintain certain net operating expense ratios for the Fund. Waiver of fees and/or reimbursement of expenses by Funds Management were made first from fund level expenses on a proportionate basis and then from class specific expenses. Funds Management has committed through February 28, 2015 to waive fees and/or reimburse expenses to the extent necessary to cap the Fund’s expenses at 1.40% for Class A shares, 2.15% for Class C shares, 1.15% for Administrator Class shares, and 0.95% for Institutional Class shares.
Distribution fees
The Trust has adopted a Distribution Plan for Class C shares of the Fund pursuant to Rule 12b-1 under the 1940 Act. Distribution fees are charged to Class C shares and paid to Wells Fargo Funds Distributor, LLC, the principal underwriter, at an annual rate of 0.75% of the average daily net assets of Class C shares.
For the six months ended April 30, 2014, Wells Fargo Funds Distributor, LLC received $5,289 from the sale of Class A shares and $50 in contingent deferred sales charges from redemptions of Class C shares.
Shareholder servicing fees
The Trust has entered into contracts with one or more shareholder servicing agents, whereby Class A, Class C, and Administrator Class of the Fund is charged a fee at an annual rate of 0.25% of the average daily net assets of each respective class.
A portion of these total shareholder servicing fees were paid to affiliates of Wells Fargo.
5. INVESTMENT PORTFOLIO TRANSACTIONS
Purchases and sales of investments, excluding U.S. government obligations (if any) and short-term securities, for the six months ended April 30, 2014 were $20,556,522 and $25,490,957, respectively.
| | | | | | |
| Notes to financial statements (unaudited) | | Wells Fargo Advantage Intrinsic World Equity Fund | | | 21 | |
6. BANK BORROWINGS
The Trust (excluding the money market funds and certain other funds in the Trust) and Wells Fargo Variable Trust are parties to a $150,000,000 revolving credit agreement with State Street Bank and Trust Company, whereby the Fund is permitted to use bank borrowings for temporary or emergency purposes, such as to fund shareholder redemption requests. Interest under the credit agreement is charged to the Fund based on a borrowing rate equal to the higher of the Federal Funds rate in effect on that day plus 1.25% or the overnight LIBOR rate in effect on that day plus 1.25%. In addition, an annual commitment fee equal to 0.10% of the unused balance is allocated to each participating fund. For the six months ended April 30, 2014, the Fund paid $91 in commitment fees.
For the six months ended April 30, 2014, there were no borrowings by the Fund under the agreement.
7. INDEMNIFICATION
Under the Trust’s organizational documents, the officers and Trustees are indemnified against certain liabilities that may arise out of performance of their duties to the Trust. Additionally, in the normal course of business, the Trust may enter into contracts with service providers that contain a variety of indemnification clauses. The Trust’s maximum exposure under these arrangements is dependent on future claims that may be made against the Fund and, therefore, cannot be estimated.
| | | | |
| 22 | | Wells Fargo Advantage Intrinsic World Equity Fund | | Other information (unaudited) |
PROXY VOTING INFORMATION
A description of the policies and procedures that the Fund uses to determine how to vote proxies relating to portfolio securities is available without charge, upon request, by calling 1-800-222-8222, visiting our website at wellsfargoadvantagefunds.com, or visiting the SEC website at sec.gov. Information regarding how the Fund voted proxies relating to portfolio securities during the most recent 12-month period ended June 30 is available without charge on the Fund’s website at wellsfargoadvantagefunds.com or by visiting the SEC website at sec.gov.
PORTFOLIO HOLDINGS INFORMATION
The complete portfolio holdings for the Fund are publicly available on the Fund’s website (wellsfargoadvantagefunds.com) on a monthly, 30-day or more delayed basis. In addition, top ten holdings information for the Fund is publicly available on the Fund’s website on a monthly, seven-day or more delayed basis. The Fund files its complete schedule of portfolio holdings with the SEC for the first and third quarters of each fiscal year on Form N-Q, which is available without charge by visiting the SEC website at sec.gov. In addition, the Fund’s Form N-Q may be reviewed and copied at the SEC’s Public Reference Room in Washington, DC, and at regional offices in New York City, at 233 Broadway, and in Chicago, at 175 West Jackson Boulevard, Suite 900. Information about the Public Reference Room may be obtained by calling 1-800-SEC-0330.
| | | | | | |
| Other information (unaudited) | | Wells Fargo Advantage Intrinsic World Equity Fund | | | 23 | |
BOARD OF TRUSTEES AND OFFICERS
Each of the Trustees and Officers1 listed in the table below acts in identical capacities for each fund in the Wells Fargo Advantage family of funds, which consists of 132 mutual funds comprising the Wells Fargo Funds Trust, Wells Fargo Variable Trust, Wells Fargo Master Trust and four closed-end funds (collectively the “Fund Complex”). This table should be read in conjunction with the Prospectus and the Statement of Additional Information2. All of the Trustees are also Members of the Audit and Governance Committees of each Trust in the Fund Complex. The mailing address of each Trustee and Officer is 525 Market Street, 12th Floor, San Francisco, CA 94105. Each Trustee and Officer serves an indefinite term, however, each Trustee serves such term until reaching the mandatory retirement age established by the Trustees.
Independent Trustees
| | | | | | |
Name and year of birth | | Position held and length of service* | | Principal occupations during past five years | | Other directorships during
past five years |
Peter G. Gordon
(Born 1942) | | Trustee, since 1998; Chairman, since 2005 | | Co-Founder, Retired Chairman, President and CEO of Crystal Geyser Water Company. Trustee Emeritus, Colby College. | | Asset Allocation Trust |
Isaiah Harris, Jr.
(Born 1952) | | Trustee, since 2009 | | Retired. Prior thereto, President and CEO of BellSouth Advertising and Publishing Corp. from 2005 to 2007, President and CEO of BellSouth Enterprises from 2004 to 2005 and President of BellSouth Consumer Services from 2000 to 2003. Emeritus member of the Iowa State University Foundation Board of Governors. Emeritus Member of the Advisory Board of Iowa State University School of Business. Advisory Board Member, Palm Harbor Academy (charter school). Mr. Harris is a certified public accountant. | | CIGNA Corporation; Deluxe Corporation; Asset Allocation Trust |
Judith M. Johnson
(Born 1949) | | Trustee, since 2008; Audit Committee Chairman, since 2008 | | Retired. Prior thereto, Chief Executive Officer and Chief Investment Officer of Minneapolis Employees Retirement Fund from 1996 to 2008. Ms. Johnson is an attorney, certified public accountant and a certified managerial accountant. | | Asset Allocation Trust |
Leroy Keith, Jr.
(Born 1939) | | Trustee, since 2010 | | Chairman, Bloc Global Services (development and construction). Trustee of the Evergreen Funds from 1983 to 2010. Former Managing Director, Almanac Capital Management (commodities firm), former Partner, Stonington Partners, Inc. (private equity fund), former Director, Obagi Medical Products Co. and former Director, Lincoln Educational Services. | | Trustee, Virtus Fund Complex (consisting of 50 portfolios as of 12/16/2013); Asset Allocation Trust |
David F. Larcker
(Born 1950) | | Trustee, since 2009 | | James Irvin Miller Professor of Accounting at the Graduate School of Business, Stanford University, Morgan Stanley Director of the Center for Leadership Development and Research and Senior Faculty of The Rock Center for Corporate Governance since 2006. From 2005 to 2008, Professor of Accounting at the Graduate School of Business, Stanford University. Prior thereto, Ernst & Young Professor of Accounting at The Wharton School, University of Pennsylvania from 1985 to 2005. | | Asset Allocation Trust |
Olivia S. Mitchell
(Born 1953) | | Trustee, since 2006 | | International Foundation of Employee Benefit Plans Professor, Wharton School of the University of Pennsylvania since 1993. Director of Wharton’s Pension Research Council and Boettner Center on Pensions & Retirement Research, and Research Associate at the National Bureau of Economic Research. Previously, Cornell University Professor from 1978 to 1993. | | Asset Allocation Trust |
Timothy J. Penny
(Born 1951) | | Trustee, since 1996 | | President and CEO of Southern Minnesota Initiative Foundation, a non-profit organization, since 2007 and Senior Fellow at the Humphrey Institute Policy Forum at the University of Minnesota since 1995. Member of the Board of Trustees of NorthStar Education Finance, Inc., a non-profit organization, since 2007. | | Asset Allocation Trust |
| | | | |
| 24 | | Wells Fargo Advantage Intrinsic World Equity Fund | | Other information (unaudited) |
| | | | | | |
Name and year of birth | | Position held and length of service* | | Principal occupations during past five years | | Other directorships during
past five years |
Michael S. Scofield
(Born 1943) | | Trustee, since 2010 | | Served on the Investment Company Institute’s Board of Governors and Executive Committee from 2008-2011 as well the Governing Council of the Independent Directors Council from 2006-2011 and the Independent Directors Council Executive Committee from 2008-2011. Chairman of the IDC from 2008-2010. Institutional Investor (Fund Directions) Trustee of Year in 2007. Trustee of the Evergreen Funds (and its predecessors) from 1984 to 2010. Chairman of the Evergreen Funds from 2000-2010. Former Trustee of the Mentor Funds. Retired Attorney, Law Offices of Michael S. Scofield. | | Asset Allocation Trust |
Donald C. Willeke
(Born 1940) | | Trustee, since 1996 | | Principal of the law firm of Willeke & Daniels. General Counsel of the Minneapolis Employees Retirement Fund from 1984 until its consolidation into the Minnesota Public Employees Retirement Association on June 30, 2010. Director and Vice Chair of The Tree Trust (non-profit corporation). Director of the American Chestnut Foundation (non-profit corporation). | | Asset Allocation Trust |
| * | Length of service dates reflect the Trustee’s commencement of service with the Trust’s predecessor entities, where applicable. |
Officers
| | | | | | |
Name and year of birth | | Position held and length of service | | Principal occupations during past five years | | |
Karla M. Rabusch
(Born 1959) | | President, since 2003 | | Executive Vice President of Wells Fargo Bank, N.A. and President of Wells Fargo Funds Management, LLC since 2003. | | |
Jeremy DePalma1
(Born 1974) | | Treasurer, since 2012 | | Senior Vice President of Wells Fargo Funds Management, LLC since 2009. Senior Vice President of Evergreen Investment Management Company, LLC from 2008 to 2010. Vice President, Evergreen Investment Services, Inc. from 2004 to 2007. Head of the Fund Reporting and Control Team within Fund Administration from 2005 to 2010. | | |
C. David Messman
(Born 1960) | | Secretary, since 2000; Chief Legal Officer, since 2003 | | Senior Vice President and Secretary of Wells Fargo Funds Management, LLC since 2001. Vice President and Managing Counsel of Wells Fargo Bank, N.A. since 1996. | | |
Debra Ann Early
(Born 1964) | | Chief Compliance Officer, since 2007 | | Chief Compliance Officer of Wells Fargo Funds Management, LLC since 2007. Chief Compliance Officer of Parnassus Investments from 2005 to 2007. Chief Financial Officer of Parnassus Investments from 2004 to 2007. | | |
David Berardi
(Born 1975) | | Assistant Treasurer, since 2009 | | Vice President of Wells Fargo Funds Management, LLC since 2009. Vice President of Evergreen Investment Management Company, LLC from 2008 to 2010. Assistant Vice President of Evergreen Investment Services, Inc. from 2004 to 2008. Manager of Fund Reporting and Control for Evergreen Investment Management Company, LLC from 2004 to 2010. | | |
| 1. | Jeremy DePalma acts as Treasurer of 59 funds and Assistant Treasurer of 73 funds in the Fund Complex. |
| 2. | The Statement of Additional Information includes additional information about the Trustees and is available, without charge, upon request, by calling 1-800-222-8222 or by visiting the website at wellsfargoadvantagefunds.com. |
| | | | | | |
| Other information (unaudited) | | Wells Fargo Advantage Intrinsic World Equity Fund | | | 25 | |
BOARD CONSIDERATION OF INVESTMENT ADVISORY AND SUB-ADVISORY AGREEMENTS:
Under Section 15 of the Investment Company Act of 1940 (the “1940 Act”), the Board of Trustees (the “Board”) of Wells Fargo Funds Trust (the “Trust”), all the members of which have no direct or indirect interest in the investment advisory and sub-advisory agreements and are not “interested persons” of the Trust, as defined in the 1940 Act (the “Independent Trustees”), must determine whether to approve the continuation of the Trust’s investment advisory and sub-advisory agreements. In this regard, at an in-person meeting held on March 27-28, 2014 (the “Meeting”), the Board reviewed: (i) an investment advisory agreement with Wells Fargo Funds Management, LLC (“Funds Management”) for Wells Fargo Advantage Intrinsic World Equity Fund (the “Fund”) and (ii) an investment sub-advisory agreement with Metropolitan West Capital Management, LLC (the “Sub-Adviser”), an affiliate of Funds Management, for the Fund. The investment advisory agreement with Funds Management and the investment sub-advisory agreement with the Sub-Adviser are collectively referred to as the “Advisory Agreements.”
At the Meeting, the Board considered the factors and reached the conclusions described below relating to the selection of Funds Management and the Sub-Adviser and the continuation of the Advisory Agreements. Prior to the Meeting, the Trustees conferred extensively among themselves and with representatives of Funds Management about these matters. Also, the Board has adopted a team-based approach, with each team consisting of a sub-set of Trustees, to assist the full Board in the discharge of its duties in reviewing performance and other matters throughout the year. The Independent Trustees were assisted in their evaluation of the Advisory Agreements by independent legal counsel, from whom they received separate legal advice and with whom they met separately.
In providing information to the Board, Funds Management and the Sub-Adviser were guided by a detailed set of requests for information submitted to them by independent legal counsel on behalf of the Independent Trustees at the start of the Board’s annual contract renewal process earlier in 2014. In considering and approving the Advisory Agreements, the Trustees considered the information they believed relevant, including but not limited to the information discussed below. The Board considered not only the specific information presented in connection with the Meeting, but also the knowledge gained over time through interaction with Funds Management and the Sub-Adviser about various topics. In this regard, the Board reviewed reports of Funds Management at each of its quarterly meetings, which included, among other things, portfolio reviews and performance reports. In addition, the Board and the teams mentioned above confer with portfolio managers at various times throughout the year. The Board did not identify any particular information or consideration that was all-important or controlling, and each individual Trustee may have attributed different weights to various factors.
After its deliberations, the Board unanimously approved the continuation of the Advisory Agreements and determined that the compensation payable to Funds Management and the Sub-Adviser is reasonable. The Board considered the continuation of the Advisory Agreements for the Fund as part of its consideration of the continuation of advisory agreements for funds across the complex, but its approvals were made on a fund-by-fund basis. The following summarizes a number of important, but not necessarily all, factors considered by the Board in support of its approvals.
Nature, extent and quality of services
The Board received and considered various information regarding the nature, extent and quality of services provided to the Fund by Funds Management and the Sub-Adviser under the Advisory Agreements. This information included, among other things, a summary of the background and experience of senior management of Funds Management, and the qualifications, background, tenure and responsibilities of each of the portfolio managers primarily responsible for the day-to-day portfolio management of the Fund.
The Board evaluated the ability of Funds Management and the Sub-Adviser to attract and retain qualified investment professionals, including research, advisory and supervisory personnel. The Board further considered the compliance programs and compliance records of Funds Management and the Sub-Adviser. In addition, the Board took into account the full range of services provided to the Fund by Funds Management and its affiliates.
Fund performance and expenses
The Board considered the performance results for the Fund over various time periods ended December 31, 2013. The Board also considered these results in comparison to the performance of funds in a universe that was determined by Lipper Inc. (“Lipper”) to be similar to the Fund (the “Universe”), and in comparison to the Fund’s benchmark index and to other comparative data. Lipper is an independent provider of investment company data. The Board received a description of the methodology used by Lipper to select the mutual funds in the performance Universe. The Board noted that the performance of the Fund (Administrator Class) was higher than or in range of the average performance of the Universe for all periods under review except for the one-year period. The Board also noted that the performance of the Fund was higher than its benchmark, the MSCI World Index (Net), for all periods under review except for the one-year period.
| | | | |
| 26 | | Wells Fargo Advantage Intrinsic World Equity Fund | | Other information (unaudited) |
The Board received information concerning, and discussed factors contributing to, the underperformance of the Fund relative to the Universe and the benchmark for the one-year period. Funds Management advised the Board about the market conditions and investment decisions that it believed contributed to the underperformance during that period including the Fund’s recent portfolio management changes. The Board was satisfied with the explanation of factors contributing to underperformance and with the steps being taken by Funds Management and the Sub-Adviser to address the Fund’s investment performance.
The Board also received and considered information regarding the Fund’s net operating expense ratios and their various components, including actual management fees (which reflect fee waivers, if any, and include advisory, administration and transfer agent fees), custodian and other non-management fees, Rule 12b-1 and non-Rule 12b-1 service fees and fee waiver and expense reimbursement arrangements. The Board considered these ratios in comparison to the median ratios of funds in class-specific expense groups that were determined by Lipper to be similar to the Fund (the “Groups”). The Board received a description of the methodology used by Lipper to select the mutual funds in the expense Groups and an explanation of year-to-year variations in the funds comprising such expense Groups and their expense ratios. Based on the Lipper reports, the Board noted that the net operating expense ratios of the Fund were lower than or in range of the median net operating expense ratios of the expense Groups.
Based on its consideration of the factors and information it deemed relevant, including those described here, the Board concluded that the overall performance and expense structure of the Fund supported the re-approval of the Advisory Agreements.
Investment advisory and sub-advisory fee rates
The Board reviewed and considered the contractual investment advisory fee rates that are payable by the Fund to Funds Management for investment advisory services (the “Advisory Agreement Rates”), both on a stand-alone basis and on a combined basis with the Fund’s fund-level and class-level contractual administration fee rates (the “Management Rates”). The Board noted that the administration fees payable to Funds Management include transfer agency and sub-transfer agency costs. The Board also reviewed and considered the contractual investment sub-advisory fee rates that are payable by Funds Management to the Sub-Adviser for investment sub-advisory services (the “Sub-Advisory Agreement Rates”).
Among other information reviewed by the Board was a comparison of the Management Rates of the Fund with those of other funds in the expense Groups at a common asset level. The Board noted that the Management Rates of the Fund were either in range or or equal to the average rates for the Fund’s expense Groups.
The Board also received and considered information about the portion of the total advisory fee that was retained by Funds Management after payment of the fee to the Sub-Adviser for sub-advisory services. In assessing the reasonableness of this amount, the Board received and evaluated information about the nature and extent of responsibilities retained and risks assumed by Funds Management and not delegated to or assumed by the Sub-Adviser, and about Funds Management’s on-going oversight services. However, given the affiliation between Funds Management and the Sub-Adviser, the Board ascribed limited relevance to the allocation of the advisory fee between them.
The Board also received and considered information about the nature and extent of services offered and fee rates charged by Funds Management and the Sub-Adviser to other types of clients with investment strategies similar to those of the Fund. In this regard, the Board received information about the significantly greater scope of services, and compliance, reporting and other legal burdens and risks of managing mutual funds compared with those associated with managing assets of non-mutual fund clients such as collective funds or institutional separate accounts.
Based on its consideration of the factors and information it deemed relevant, including those described here, the Board determined that the Advisory Agreement Rates and the Sub-Advisory Agreement Rates were reasonable in light of the services covered by the Advisory Agreements.
| | | | | | |
| Other information (unaudited) | | Wells Fargo Advantage Intrinsic World Equity Fund | | | 27 | |
Profitability
The Board received and considered information concerning the profitability of Funds Management, as well as the profitability of Wells Fargo as a whole, from providing services to the Fund and the fund family as a whole. The Board did not receive or consider to be necessary separate profitability information with respect to the Sub-Adviser, because its profitability information was subsumed in the collective Wells Fargo profitability analysis.
Funds Management explained the methodologies and estimates that it used in calculating profitability. Among other things, the Board noted that the levels of profitability reported on a fund-by-fund basis varied widely, depending on factors such as the size and type of fund. Based on its review, the Board did not deem the profits reported by Funds Management to be at a level that would prevent it from approving the continuation of the Advisory Agreements.
Economies of scale
With respect to possible economies of scale, the Board noted the existence of breakpoints in the Fund’s advisory fee and administration fee structure, which operate generally to reduce the Fund’s expense ratios as the Fund grows in size. It considered that, for a small fund or a fund that shrinks in size, breakpoints conversely can result in higher fee levels. The Board also considered that fee waiver and expense reimbursement arrangements and competitive fee rates at the outset are means of sharing potential economies of scale with shareholders of the Fund and the fund family as a whole. The Board considered Funds Management’s view that any analyses of potential economies of scale in managing a particular fund are inherently limited in light of the joint and common costs and investments that Funds Management incurs across the fund family as a whole.
The Board concluded that the Fund’s fee and expense arrangements, including contractual breakpoints, constituted a reasonable approach to sharing potential economies of scale with the Fund and its shareholders.
Other benefits to Funds Management and the Sub-Adviser
The Board received and considered information regarding potential “fall-out” or ancillary benefits received by Funds Management and its affiliates, including the Sub-Adviser, as a result of their relationships with the Fund. Ancillary benefits could include, among others, benefits directly attributable to other relationships with the Fund and benefits potentially derived from an increase in Funds Management’s and the Sub-Adviser’s business as a result of their relationships with the Fund. The Board noted that various affiliates of Funds Management may receive distribution-related fees, shareholder servicing payments and sub-transfer agency fees in respect of shares sold or held through them and services provided.
The Board also reviewed information about soft dollar credits earned and utilized by the Sub-Adviser, fees earned by Funds Management and the Sub-Adviser from managing a private investment vehicle for the fund family’s securities lending collateral and commissions earned by an affiliated broker from portfolio transactions.
Based on its consideration of the factors and information it deemed relevant, including those described here, the Board did not find that any ancillary benefits received by Funds Management and its affiliates, including the Sub-Adviser, were unreasonable.
Conclusion
After considering the above-described factors and based on its deliberations and its evaluation of the information described above, the Board unanimously approved the continuation of the Advisory Agreements for an additional one-year period and determined that the compensation payable to Funds Management and the Sub-Adviser is reasonable.
| | | | |
| 28 | | Wells Fargo Advantage Intrinsic World Equity Fund | | List of abbreviations |
The following is a list of common abbreviations for terms and entities that may have appeared in this report.
| ACA | — ACA Financial Guaranty Corporation |
| ADR | — American depositary receipt |
| ADS | — American depositary shares |
| AGC | — Assured Guaranty Corporation |
| AGM | — Assured Guaranty Municipal |
| Ambac | — Ambac Financial Group Incorporated |
| AMT | — Alternative minimum tax |
| BAN | — Bond anticipation notes |
| BHAC | — Berkshire Hathaway Assurance Corporation |
| CAB | — Capital appreciation bond |
| CCAB | — Convertible capital appreciation bond |
| CDA | — Community Development Authority |
| CDO | — Collateralized debt obligation |
| DRIVER | — Derivative inverse tax-exempt receipts |
| DW&P | — Department of Water & Power |
| DWR | — Department of Water Resources |
| ECFA | — Educational & Cultural Facilities Authority |
| EDA | — Economic Development Authority |
| EDFA | — Economic Development Finance Authority |
| ETF | — Exchange-traded fund |
| FDIC | — Federal Deposit Insurance Corporation |
| FFCB | — Federal Farm Credit Banks |
| FGIC | — Financial Guaranty Insurance Corporation |
| FHA | — Federal Housing Administration |
| FHLB | — Federal Home Loan Bank |
| FHLMC | — Federal Home Loan Mortgage Corporation |
| FICO | — The Financing Corporation |
| FNMA | — Federal National Mortgage Association |
| GDR | — Global depositary receipt |
| GNMA | — Government National Mortgage Association |
| HCFR | — Healthcare facilities revenue |
| HEFA | — Health & Educational Facilities Authority |
| HEFAR | — Higher education facilities authority revenue |
| HFA | — Housing Finance Authority |
| HFFA | — Health Facilities Financing Authority |
| HUD | — Department of Housing and Urban Development |
| IDA | — Industrial Development Authority |
| IDAG | — Industrial Development Agency |
| KRW | — Republic of Korea won |
| LIBOR | — London Interbank Offered Rate |
| LLC | — Limited liability company |
| LLLP | — Limited liability limited partnership |
| LLP | — Limited liability partnership |
| MBIA | — Municipal Bond Insurance Association |
| MFHR | — Multifamily housing revenue |
| MSTR | — Municipal securities trust receipts |
| MUD | — Municipal Utility District |
| National | — National Public Finance Guarantee Corporation |
| PCFA | — Pollution Control Financing Authority |
| PCL | — Public Company Limited |
| PCR | — Pollution control revenue |
| PFA | — Public Finance Authority |
| PFFA | — Public Facilities Financing Authority |
| PFOTER | — Puttable floating option tax-exempt receipts |
| plc | — Public limited company |
| PUTTER | — Puttable tax-exempt receipts |
| R&D | — Research & development |
| Radian | — Radian Asset Assurance |
| RAN | — Revenue anticipation notes |
| RDA | — Redevelopment Authority |
| RDFA | — Redevelopment Finance Authority |
| REIT | — Real estate investment trust |
| ROC | — Reset option certificates |
| SAVRS | — Select auction variable rate securities |
| SBA | — Small Business Authority |
| SFHR | — Single-family housing revenue |
| SFMR | — Single-family mortgage revenue |
| SPA | — Standby purchase agreement |
| SPDR | — Standard & Poor’s Depositary Receipts |
| STRIPS | — Separate trading of registered interest and |
| TAN | — Tax anticipation notes |
| TIPS | — Treasury inflation-protected securities |
| TRAN | — Tax revenue anticipation notes |
| TTFA | — Transportation Trust Fund Authority |
| TVA | — Tennessee Valley Authority |


For more information
More information about Wells Fargo Advantage Funds is available free upon request. To obtain literature, please write, email, visit the Fund’s website, or call:
Wells Fargo Advantage Funds
P.O. Box 8266
Boston, MA 02266-8266
Email: wfaf@wellsfargo.com
Website: wellsfargoadvantagefunds.com
Individual investors: 1-800-222-8222
Retail investment professionals: 1-888-877-9275
Institutional investment professionals: 1-866-765-0778
This report and the financial statements contained herein are submitted for the general information of the shareholders of Wells Fargo Advantage Funds. If this report is used for promotional purposes, distribution of the report must be accompanied or preceded by a current prospectus. Before investing, please consider the investment objectives, risks, charges, and expenses of the investment. For a current prospectus and, if available, a summary prospectus, containing this information, call 1-800-222-8222 or visit the Fund’s website at wellsfargoadvantagefunds.com. Read the prospectus carefully before you invest or send money.
Wells Fargo Funds Management, LLC, a wholly owned subsidiary of Wells Fargo & Company, provides investment advisory and administrative services for Wells Fargo Advantage Funds. Other affiliates of Wells Fargo & Company provide subadvisory and other services for the Funds. The Funds are distributed by Wells Fargo Funds Distributor, LLC, Member FINRA/SIPC, an affiliate of Wells Fargo & Company.
NOT FDIC INSURED ¡ NO BANK GUARANTEE ¡ MAY LOSE VALUE
© 2014 Wells Fargo Funds Management, LLC. All rights reserved.
| | |
 | | 225172 06-14 SA241/SAR241 04-14 |
Not applicable.
| ITEM 3. | AUDIT COMMITTEE FINANCIAL EXPERT |
Not applicable.
| ITEM 4. | PRINCIPAL ACCOUNTANT FEES AND SERVICES |
Not applicable.
| ITEM 5. | AUDIT COMMITTEE OF LISTED REGISTRANTS |
Not applicable.
The Portfolio of investments is included as part of the report to shareholders filed under Item 1 of this Form.
| ITEM 7. | DISCLOSURE OF PROXY VOTING POLICIES AND PROCEDURES FOR CLOSED-END MANAGEMENT INVESTMENT COMPANIES |
Not applicable.
| ITEM 8. | PORTFOLIO MANAGERS OF CLOSED-END MANAGEMENT INVESTMENT COMPANIES |
Not applicable.
| ITEM 9. | PURCHASES OF EQUITY SECURITIES BY CLOSED-END MANAGEMENT INVESTMENT COMPANY AND AFFILIATED PURCHASERS |
Not applicable.
| ITEM 10. | SUBMISSION OF MATTERS TO A VOTE OF SECURITY HOLDERS |
There have been no material changes to the procedures by which shareholders may recommend nominees to the Registrant’s board of trustees that have been implemented since the Registrant’s last provided disclosure in response to the requirements of this Item.
| ITEM 11. | CONTROLS AND PROCEDURES |
(a) The President and Treasurer have concluded that the Wells Fargo Funds Trust (the “Trust”) disclosure controls and procedures (as defined in Rule 30a-3(c) under the Investment Company Act of 1940) provide reasonable assurances that material information relating to the Trust is made known to them by the appropriate persons, based on their evaluation of these controls and procedures as of a date within 90 days of the filing of this report.
(b) There were no significant changes in the Trust’s internal controls over financial reporting (as defined in Rule 30a-3(d) under the Investment Company Act of 1940) that occurred during the second fiscal quarter of the period covered by this report that materially affected, or is reasonably likely to materially affect, the registrant’s internal control over financial reporting.
(a)(1) Not applicable.
(a)(2) Certification pursuant to Rule 30a-2(a) under the Investment Company Act of 1940 (17 CFR 270.30a-2(a)) is filed and attached hereto as Exhibit 99.CERT.
(a)(3) Not applicable.
(b) Certification pursuant to Rule 30a-2(b) under the Investment Company Act of 1940 (17 CFR 270.30a-2(b)) is filed and attached hereto as Exhibit 99.906CERT.
SIGNATURES
Pursuant to the requirements of the Securities Exchange Act of 1934 and the Investment Company Act of 1940, the registrant has duly caused this report to be signed on its behalf by the undersigned, thereunto duly authorized.
| | |
| Wells Fargo Funds Trust |
| |
| By: | | /s/ Karla M. Rabusch |
| | Karla M. Rabusch |
| | President |
| |
| Date: | | June 26, 2014 |
Pursuant to the requirements of the Securities Exchange Act of 1934 and the Investment Company Act of 1940, this report has been signed below by the following persons on behalf of the registrant and in the capacities and on the date indicated.
| | |
| Wells Fargo Funds Trust |
| |
| By: | | /s/ Karla M. Rabusch |
| | Karla M. Rabusch |
| | President |
| |
| Date: | | June 26, 2014 |
| |
| By: | | /s/ Nancy Wiser |
| | Nancy Wiser |
| | Treasurer |
| |
| Date: | | June 26, 2014 |
| |
| By: | | /s/ Jeremy DePalma |
| | Jeremy DePalma |
| | Treasurer |
| |
| Date: | | June 26, 2014 |