
UNITED STATES
SECURITIES AND EXCHANGE COMMISSION
Washington, D.C. 20549
FORM N-CSRS
CERTIFIED SHAREHOLDER REPORT OF REGISTERED
MANAGEMENT INVESTMENT COMPANIES
Investment Company Act file number: 811-09253
Wells Fargo Funds Trust
(Exact name of registrant as specified in charter)
525 Market St., San Francisco, CA 94105
(Address of principal executive offices) (Zip code)
C. David Messman
Wells Fargo Funds Management, LLC
525 Market St., San Francisco, CA 94105
(Name and address of agent for service)
Registrant’s telephone number, including area code: 800-222-8222
Date of fiscal year end: Registrant is making a filing for 11 of its series, Wells Fargo Advantage Dow Jones Target Today Fund, Wells Fargo Advantage Dow Jones Target 2010 Fund, Wells Fargo Advantage Dow Jones Target 2015 Fund, Wells Fargo Advantage Dow Jones Target 2020 Fund, Wells Fargo Advantage Dow Jones Target 2025 Fund, Wells Fargo Advantage Dow Jones Target 2030 Fund, Wells Fargo Advantage Dow Jones Target 2035 Fund, Wells Fargo Advantage Dow Jones Target 2040 Fund, Wells Fargo Advantage Dow Jones Target 2045 Fund, Wells Fargo Advantage Dow Jones Target 2050 Fund, Wells Fargo Advantage Dow Jones Target 2055 Fund. Each series has a February 28 fiscal year end.
Date of reporting period: August 31, 2014
| ITEM 1. | REPORT TO STOCKHOLDERS |

Wells Fargo Advantage
Dow Jones Target Date FundsSM

Semi-Annual Report
August 31, 2014
| n | | Wells Fargo Advantage Dow Jones Target Today FundSM |
| n | | Wells Fargo Advantage Dow Jones Target 2010 FundSM |
| n | | Wells Fargo Advantage Dow Jones Target 2015 FundSM |
| n | | Wells Fargo Advantage Dow Jones Target 2020 FundSM |
| n | | Wells Fargo Advantage Dow Jones Target 2025 FundSM |
| n | | Wells Fargo Advantage Dow Jones Target 2030 FundSM |
| n | | Wells Fargo Advantage Dow Jones Target 2035 FundSM |
| n | | Wells Fargo Advantage Dow Jones Target 2040 FundSM |
| n | | Wells Fargo Advantage Dow Jones Target 2045 FundSM |
| n | | Wells Fargo Advantage Dow Jones Target 2050 FundSM |
| n | | Wells Fargo Advantage Dow Jones Target 2055 FundSM |

Reduce clutter. Save trees.
Sign up for electronic delivery of prospectuses and shareholder reports at wellsfargo.com/advantagedelivery
Contents
Dow Jones® and Dow Jones Target Date IndexesSM are service marks of Dow Jones Trademark Holdings LLC (Dow Jones); have been licensed to CME Group Index Services LLC (CME Indexes); and have been sublicensed for use for certain purposes by Global Index Advisors, Inc., and Wells Fargo Funds Management, LLC. The Wells Fargo Advantage Dow Jones Target Date FundsSM, based on the Dow Jones Target Date Indexes, are not sponsored, endorsed, sold, or promoted by Dow Jones, CME Indexes, or their respective affiliates, and none of them makes any representation regarding the advisability of investing in such product(s).
The views expressed and any forward-looking statements are as of August 31, 2014, unless otherwise noted, and are those of the Fund managers and/or Wells Fargo Funds Management, LLC. Discussions of individual securities, or the markets generally, or any Wells Fargo Advantage Fund are not intended as individual recommendations. Future events or results may vary significantly from those expressed in any forward-looking statements; the views expressed are subject to change at any time in response to changing circumstances in the market. Wells Fargo Funds Management, LLC and the Fund disclaim any obligation to publicly update or revise any views expressed or forward-looking statements.
NOT FDIC INSURED ¡ NO BANK GUARANTEE ¡ MAY LOSE VALUE
| | | | |
| 2 | | Wells Fargo Advantage Dow Jones Target Date Funds | | Letter to shareholders (unaudited) |

Karla M. Rabusch
President
Wells Fargo Advantage Funds
Improving U.S. economic data contributed to a strong domestic stock market.
Emerging markets rallied on a combination of improved economic data in China and an investor-friendly election in India.
Dear Valued Shareholder:
We are pleased to offer you this semi-annual report for the Wells Fargo Advantage Dow Jones Target Date Funds for the six-month period that ended August 31, 2014. The three main asset classes underlying our target date funds had the following results: Equity performance was strong in the U.S. and in emerging markets, but European stock markets lagged; fixed-income results were solid because interest rates generally declined, which supported bond prices; and short-term investment returns remained low as a result of the ultra-low short-term interest-rate environment.
Major central banks continued to provide stimulus.
Throughout the reporting period, the Federal Open Market Committee (FOMC)—the U.S. Federal Reserve’s monetary policymaking body—kept its key interest rate near zero. Beginning in January 2014, the FOMC began to reduce (or taper) its bond-buying program by $10 billion per month. Although some anticipated this action would lead to higher interest rates, instead interest rates followed a downward trend for the remainder of the period, despite short-term volatility. European markets continued to benefit from the European Central Bank’s (ECB’s) actions. In June 2014, the ECB announced a variety of measures aimed at encouraging lending, including cutting its key rate to a then-historic low of 0.15% and imposing a negative interest rate on bank deposits held at the central bank.
Returns by asset class were generally favorable.
Improving U.S. economic data contributed to a strong domestic stock market. The unemployment rate continued its slow improvement, declining from 6.7% in March 2014 to 6.1% in August 2014. Although investors received a negative surprise when gross domestic product (GDP) growth for the first quarter of 2014 declined by 2.1% on an annualized basis, several commentators suggested that harsh winter weather may have dampened economic activity. Economic growth did accelerate in the second quarter of 2014, with an annualized GDP growth rate of 4.2%. U.S. equities, as measured by the Russell 3000® Index1, gained 7.68% for the reporting period.
The European Union’s economic data continued to show sluggish growth, with GDP rising by 0.3% in the first quarter of 2014 compared with the previous quarter, and by 0.2% in the second quarter. (European growth rates are not annualized.) Partly as a result, European stocks lagged, contributing to a modest 1.24% gain for the MSCI EAFE Index (Net)2, which measures developed international markets excluding the U.S. Emerging markets rallied on a combination of improved economic data in China and an investor-friendly election in India. The MSCI Emerging Markets Index (Net)3, which measures emerging markets equity performance, gained 14.52%.
| 1. | The Russell 3000® Index measures the performance of the 3,000 largest U.S. companies based on total market capitalization, which represents approximately 98% of the investable U.S. equity market. You cannot invest directly in an index. |
| 2. | The Morgan Stanley Capital International Europe, Australasia, and Far East (MSCI EAFE) Index (Net) is an unmanaged group of securities widely regarded by investors to be representations of the stock markets of Europe, Australasia, and the Far East. Calculations for EAFE use net dividends, which reflect the deduction of withholding taxes. You cannot invest directly in an index. Source: MSCI. MSCI makes no express or implied warranties or representations and shall have no liability whatsoever with respect to any MSCI data contained herein. The MSCI data may not be further redistributed or used as a basis for other indexes or any securities or financial products. This report is not approved, reviewed, or produced by MSCI. |
| 3. | The Morgan Stanley Capital International (MSCI) Emerging Markets Index is a free float-adjusted market-capitalization-weighted index designed to measure the equity market performance in the global emerging markets. The index is currently composed of 21 emerging markets country indexes. You cannot invest directly in an index. |
| | | | | | |
| Letter to shareholders (unaudited) | | Wells Fargo Advantage Dow Jones Target Date Funds | | | 3 | |
On the bond front, 10-year U.S. Treasury bond yields declined, ending the period at a yield of 2.35%. Lower interest rates aided bond prices, and the Barclays U.S. Aggregate Bond Index4 returned 2.74% during the period.
Our target date funds provided exposure to the broader market.
Our target date series is passively managed across nine equity and four fixed-income asset allocations. The target date represents the year in which investors may likely begin withdrawing assets. The funds gradually seek to reduce market risk as the target date approaches and after it arrives by decreasing equity exposure and increasing fixed-income exposure. The principal value is not guaranteed at any time, including at the target date.
Don’t let short-term uncertainty derail long-term investment goals.
Periods of uncertainty can present challenges, but experience has taught us that maintaining long-term investment goals can be an effective way to plan for the future. To help you create a sound strategy based on your personal goals and risk tolerance, Wells Fargo Advantage Funds offers more than 100 mutual funds and other investments spanning a wide range of asset classes and investment styles. Although diversification cannot guarantee an investment profit or prevent losses, we believe it can be an effective way to manage investment risk and potentially smooth out overall portfolio performance. We encourage investors to know their investments and to understand that appropriate levels of risk-taking may unlock opportunities.
Thank you for choosing to invest with Wells Fargo Advantage Funds. We appreciate your confidence in us and remain committed to helping you meet your financial needs. For current information about your fund investments, contact your investment professional, visit our website at wellsfargoadvantagefunds.com, or call us directly at 1-800-222-8222. We are available 24 hours a day, 7 days a week.
Sincerely,

Karla M. Rabusch
President
Wells Fargo Advantage Funds
| 4. | The Barclays U.S. Aggregate Bond Index is a broad-based benchmark that measures the investment-grade, U.S. dollar-denominated, fixed-rate taxable bond market, including Treasuries, government-related and corporate securities, mortgage-backed securities (agency fixed-rate and hybrid ARM passthroughs), asset-backed securities, and commercial mortgage-backed securities. You cannot invest directly in an index. |
| | | | |
| 4 | | Wells Fargo Advantage Dow Jones Target Date Funds | | Performance highlights (unaudited) |
Wells Fargo Advantage Dow Jones Target Date Funds1
Investment objective
Each Fund’s objective is to approximate, before fees and expenses, the total return of the appropriate Dow Jones Global Target Date Index as specified in the following table:
| | |
Wells Fargo Advantage Dow
Jones Target Date Funds | | Corresponding Dow Jones
Global Target Date Index |
| Target Today Fund | | Dow Jones Global Target Today Index |
| Target 2010 Fund | | Dow Jones Global Target 2010 Index |
| Target 2015 Fund | | Dow Jones Global Target 2015 Index |
| Target 2020 Fund | | Dow Jones Global Target 2020 Index |
| Target 2025 Fund | | Dow Jones Global Target 2025 Index |
| Target 2030 Fund | | Dow Jones Global Target 2030 Index |
| Target 2035 Fund | | Dow Jones Global Target 2035 Index |
| Target 2040 Fund | | Dow Jones Global Target 2040 Index |
| Target 2045 Fund | | Dow Jones Global Target 2045 Index |
| Target 2050 Fund | | Dow Jones Global Target 2050 Index |
| Target 2055 Fund | | Dow Jones Global Target 2055 Index |
Adviser
Wells Fargo Funds Management, LLC
Subadviser
Global Index Advisors, Inc.
Portfolio managers
Rodney H. Alldredge
James P. Lauder
Paul T. Torregrosa, Ph.D.
The target date represents the year in which investors may likely begin withdrawing assets. The Funds gradually seek to reduce market risk as the target date approaches and after it arrives by decreasing equity exposure and increasing fixed income exposure. The principal value is not guaranteed at any time, including at the target date.
Stock values fluctuate in response to the activities of individual companies and general market and economic conditions. Bond values fluctuate in response to the financial condition of individual issuers, general market and economic conditions, and changes in interest rates. In general, when interest rates rise, bond values fall and investors may lose principal value. The use of derivatives may reduce returns and/or increase volatility. Certain investment strategies tend to increase the total risk of an investment (relative to the broader market). These Funds are exposed to foreign investment risk, mortgage- and asset-backed securities risk, smaller-company investment risk, and allocation methodology risk (risk that the allocation methodology of the Dow Jones Target Date Index, whose total returns the Funds seek to approximate, before fees and expenses, will not meet an investor’s goals). Consult the prospectus for additional information on these and other risks.
Please see footnotes on pages 17-18.
| | | | | | |
| Performance highlights (unaudited) | | Wells Fargo Advantage Dow Jones Target Date Funds | | | 5 | |
Target Today Fund
Average annual total returns2 (%) as of August 31, 2014
| | | | | | | | | | | | | | | | | | | | | | | | | | | | | | | | | | |
| | | | | Including sales charge | | | Excluding sales charge | | | Expense ratios3 (%) | |
| | | Inception date | | 1 year | | | 5 year | | | 10 year | | | 1 year | | | 5 year | | | 10 year | | | Gross | | | Net4 | |
| Class A (STWRX) | | 3-1-1994 | | | 0.57 | | | | 3.40 | | | | 3.71 | | | | 6.73 | | | | 4.62 | | | | 4.33 | | | | 1.01 | | | | 0.81 | |
| Class B (WFOKX)* | | 8-1-1998 | | | 0.97 | | | | 3.50 | | | | 3.79 | | | | 5.97 | | | | 3.84 | | | | 3.79 | | | | 1.76 | | | | 1.56 | |
| Class C (WFODX) | | 12-1-1998 | | | 4.95 | | | | 3.84 | | | | 3.54 | | | | 5.95 | | | | 3.84 | | | | 3.54 | | | | 1.76 | | | | 1.56 | |
| Class R (WFRRX) | | 6-28-2013 | | | – | | | | – | | | | – | | | | 6.48 | | | | 4.51 | | | | 4.27 | | | | 1.26 | | | | 1.06 | |
| Class R4 (WOTRX) | | 11-30-2012 | | | – | | | | – | | | | – | | | | 7.05 | | | | 5.11 | | | | 4.84 | | | | 0.68 | | | | 0.45 | |
| Class R6 (WOTDX) | | 6-30-2004 | | | – | | | | – | | | | – | | | | 7.28 | | | | 5.15 | | | | 4.87 | | | | 0.53 | | | | 0.30 | |
| Administrator Class (WFLOX) | | 11-8-1999 | | | – | | | | – | | | | – | | | | 6.91 | | | | 4.79 | | | | 4.57 | | | | 0.85 | | | | 0.65 | |
| Investor Class (WFBTX) | | 1-31-2007 | | | – | | | | – | | | | – | | | | 6.64 | | | | 4.70 | | | | 4.50 | | | | 1.07 | | | | 0.86 | |
| Dow Jones Global Target Today Index5 | | – | | | – | | | | – | | | | – | | | | 7.59 | | | | 5.62 | | | | 5.31 | | | | – | | | | – | |
| Russell 3000® Index6 | | – | | | – | | | | – | | | | – | | | | 24.74 | | | | 17.22 | | | | 8.83 | | | | – | | | | – | |
| Barclays U.S. Aggregate Bond Index7 | | – | | | – | | | | – | | | | – | | | | 5.66 | | | | 4.48 | | | | 4.72 | | | | – | | | | – | |
| * | | Class B shares are closed to investment, except in connection with the reinvestment of any distributions and permitted exchanges. |
Figures quoted represent past performance, which is no guarantee of future results, and do not reflect taxes that a shareholder may pay on fund distributions or the redemption of fund shares. Investment return and principal value of an investment will fluctuate so that an investor’s shares, when redeemed, may be worth more or less than their original cost. Performance shown without sales charges would be lower if sales charges were reflected. Current performance may be lower or higher than the performance data quoted and assumes the reinvestment of dividends and capital gains. Current month-end performance is available on the Fund’s website, wellsfargoadvantagefunds.com.
Index returns do not include transaction costs associated with buying and selling securities, any mutual fund fees or expenses, or any taxes. It is not possible to invest directly in an index.
For Class A shares, the maximum front-end sales charge is 5.75%. For Class B shares, the maximum contingent deferred sales charge is 5.00%. For Class C shares, the maximum contingent deferred sales charge is 1.00%. Performance including a contingent deferred sales charge assumes the sales charge for the corresponding time period. Class R, Class R4, Class R6, Administrator Class, and Investor Class shares are sold without a front-end sales charge or contingent deferred sales charge.
Please see footnotes on pages 17-18.
| | | | |
| 6 | | Wells Fargo Advantage Dow Jones Target Date Funds | | Performance highlights (unaudited) |
Target 2010 Fund
Average annual total returns8 (%) as of August 31, 2014
| | | | | | | | | | | | | | | | | | | | | | | | | | | | | | | | | | |
| | | | | Including sales charge | | | Excluding sales charge | | | Expense ratios3 (%) | |
| | | Inception date | | 1 year | | | 5 year | | | 10 year | | | 1 year | | | 5 year | | | 10 year | | | Gross | | | Net4 | |
| Class A (STNRX) | | 3-1-1994 | | | 1.53 | | | | 4.22 | | | | 4.00 | | | | 7.70 | | | | 5.47 | | | | 4.61 | | | | 1.01 | | | | 0.83 | |
| Class B (SPTBX)* | | 3-1-1997 | | | 1.91 | | | | 4.35 | | | | 4.07 | | | | 6.91 | | | | 4.68 | | | | 4.07 | | | | 1.76 | | | | 1.58 | |
| Class C (WFOCX) | | 12-1-1998 | | | 5.91 | | | | 4.68 | | | | 3.84 | | | | 6.91 | | | | 4.68 | | | | 3.84 | | | | 1.76 | | | | 1.58 | |
| Class R (WFARX) | | 6-28-2013 | | | – | | | | – | | | | – | | | | 7.48 | | | | 5.34 | | | | 4.55 | | | | 1.26 | | | | 1.08 | |
| Class R4 (WFORX) | | 11-30-2012 | | | – | | | | – | | | | – | | | | 8.13 | | | | 5.95 | | | | 5.12 | | | | 0.68 | | | | 0.47 | |
| Class R6 (WFOAX) | | 6-30-2004 | | | – | | | | – | | | | – | | | | 8.28 | | | | 6.00 | | | | 5.15 | | | | 0.53 | | | | 0.32 | |
| Administrator Class (WFLGX) | | 11-8-1999 | | | – | | | | – | | | | – | | | | 7.92 | | | | 5.64 | | | | 4.86 | | | | 0.85 | | | | 0.67 | |
| Investor Class (WFCTX) | | 1-31-2007 | | | – | | | | – | | | | – | | | | 7.66 | | | | 5.54 | | | | 4.79 | | | | 1.07 | | | | 0.88 | |
| Dow Jones Global Target 2010 Index5 | | – | | | – | | | | – | | | | – | | | | 8.63 | | | | 6.49 | | | | 5.84 | | | | – | | | | – | |
| Russell 3000® Index6 | | – | | | – | | | | – | | | | – | | | | 24.74 | | | | 17.22 | | | | 8.83 | | | | – | | | | – | |
| Barclays U.S. Aggregate Bond Index7 | | – | | | – | | | | – | | | | – | | | | 5.66 | | | | 4.48 | | | | 4.72 | | | | – | | | | – | |
| * | | Class B shares are closed to investment, except in connection with the reinvestment of any distributions and permitted exchanges. |
Figures quoted represent past performance, which is no guarantee of future results, and do not reflect taxes that a shareholder may pay on fund distributions or the redemption of fund shares. Investment return and principal value of an investment will fluctuate so that an investor’s shares, when redeemed, may be worth more or less than their original cost. Performance shown without sales charges would be lower if sales charges were reflected. Current performance may be lower or higher than the performance data quoted and assumes the reinvestment of dividends and capital gains. Current month-end performance is available on the Fund’s website, wellsfargoadvantagefunds.com.
Index returns do not include transaction costs associated with buying and selling securities, any mutual fund fees or expenses, or any taxes. It is not possible to invest directly in an index.
For Class A shares, the maximum front-end sales charge is 5.75%. For Class B shares, the maximum contingent deferred sales charge is 5.00%. For Class C shares, the maximum contingent deferred sales charge is 1.00%. Performance including a contingent deferred sales charge assumes the sales charge for the corresponding time period. Class R, Class R4, Class R6, Administrator Class, and Investor Class shares are sold without a front-end sales charge or contingent deferred sales charge.
Please see footnotes on pages 17-18.
| | | | | | |
| Performance highlights (unaudited) | | Wells Fargo Advantage Dow Jones Target Date Funds | | | 7 | |
Target 2015 Fund
Average annual total returns9 (%) as of August 31, 2014
| | | | | | | | | | | | | | | | | | | | | | | | | | | | | | | | | | |
| | | | | Including sales charge | | | Excluding sales charge | | | Expense ratios3 (%) | |
| | | Inception date | | 1 year | | | 5 year | | | Since inception | | | 1 year | | | 5 year | | | Since inception | | | Gross | | | Net4 | |
| Class A (WFACX) | | 11-30-2012 | | | 2.68 | | | | 5.34 | | | | 3.05 | | | | 8.93 | | | | 6.59 | | | | 3.91 | | | | 1.01 | | | | 0.84 | |
| Class R (WFBRX) | | 6-28-2013 | | | – | | | | – | | | | – | | | | 8.70 | | | | 6.35 | | | | 3.69 | | | | 1.26 | | | | 1.09 | |
| Class R4 (WFSRX) | | 11-30-2012 | | | – | | | | – | | | | – | | | | 9.32 | | | | 6.98 | | | | 4.22 | | | | 0.68 | | | | 0.48 | |
| Class R6 (WFSCX) | | 6-29-2007 | | | – | | | | – | | | | – | | | | 9.50 | | | | 7.00 | | | | 4.24 | | | | 0.53 | | | | 0.33 | |
| Administrator Class (WFFFX) | | 6-29-2007 | | | – | | | | – | | | | – | | | | 9.10 | | | | 6.66 | | | | 3.94 | | | | 0.85 | | | | 0.68 | |
| Investor Class (WFQEX) | | 6-29-2007 | | | – | | | | – | | | | – | | | | 8.93 | | | | 6.55 | | | | 3.87 | | | | 1.07 | | | | 0.89 | |
| Dow Jones Global Target 2015 Index5 | | – | | | – | | | | – | | | | – | | | | 9.92 | | | | 7.52 | | | | 4.74 | * | | | – | | | | – | |
| Russell 3000® Index6 | | – | | | – | | | | – | | | | – | | | | 24.74 | | | | 17.22 | | | | 6.63 | * | | | – | | | | – | |
| Barclays U.S. Aggregate Bond Index7 | | – | | | – | | | | – | | | | – | | | | 5.66 | | | | 4.48 | | | | 5.34 | * | | | – | | | | – | |
| * | | Based on the inception date of the oldest class. |
Figures quoted represent past performance, which is no guarantee of future results, and do not reflect taxes that a shareholder may pay on fund distributions or the redemption of fund shares. Investment return and principal value of an investment will fluctuate so that an investor’s shares, when redeemed, may be worth more or less than their original cost. Performance shown without sales charges would be lower if sales charges were reflected. Current performance may be lower or higher than the performance data quoted and assumes the reinvestment of dividends and capital gains. Current month-end performance is available on the Fund’s website, wellsfargoadvantagefunds.com.
Index returns do not include transaction costs associated with buying and selling securities, any mutual fund fees or expenses, or any taxes. It is not possible to invest directly in an index.
For Class A shares, the maximum front-end sales charge is 5.75%. Class R, Class R4, Class R6, Administrator Class, and Investor Class shares are sold without a front-end sales charge or contingent deferred sales charge.
Please see footnotes on pages 17-18.
| | | | |
| 8 | | Wells Fargo Advantage Dow Jones Target Date Funds | | Performance highlights (unaudited) |
Target 2020 Fund
Average annual total returns2 (%) as of August 31, 2014
| | | | | | | | | | | | | | | | | | | | | | | | | | | | | | | | | | |
| | | | | Including sales charge | | | Excluding sales charge | | | Expense ratios3 (%) | |
| | | Inception date | | 1 year | | | 5 year | | | 10 year | | | 1 year | | | 5 year | | | 10 year | | | Gross | | | Net4 | |
| Class A (STTRX) | | 3-1-1994 | | | 4.67 | | | | 6.56 | | | | 4.90 | | | | 11.04 | | | | 7.82 | | | | 5.53 | | | | 0.98 | | | | 0.86 | |
| Class B (STPBX)* | | 3-1-1997 | | | 5.24 | | | | 6.70 | | | | 4.98 | | | | 10.24 | | | | 7.00 | | | | 4.98 | | | | 1.73 | | | | 1.61 | |
| Class C (WFLAX) | | 12-1-1998 | | | 9.19 | | | | 7.03 | | | | 4.74 | | | | 10.19 | | | | 7.03 | | | | 4.74 | | | | 1.73 | | | | 1.61 | |
| Class R (WFURX) | | 6-28-2013 | | | – | | | | – | | | | – | | | | 10.80 | | | | 7.70 | | | | 5.47 | | | | 1.23 | | | | 1.11 | |
| Class R4 (WFLRX) | | 11-30-2012 | | | – | | | | – | | | | – | | | | 11.39 | | | | 8.34 | | | | 6.06 | | | | 0.65 | | | | 0.50 | |
| Class R6 (WFOBX) | | 6-30-2004 | | | – | | | | – | | �� | | – | | | | 11.61 | | | | 8.38 | | | | 6.09 | | | | 0.50 | | | | 0.35 | |
| Administrator Class (WFLPX) | | 11-8-1999 | | | – | | | | – | | | | – | | | | 11.22 | | | | 8.00 | | | | 5.78 | | | | 0.82 | | | | 0.70 | |
| Investor Class (WFDTX) | | 1-31-2007 | | | – | | | | – | | | | – | | | | 10.98 | | | | 7.91 | | | | 5.72 | | | | 1.04 | | | | 0.91 | |
| Dow Jones Global Target 2020 Index5 | | – | | | – | | | | – | | | | – | | | | 11.99 | | | | 8.85 | | | | 7.03 | | | | – | | | | – | |
| Russell 3000® Index6 | | – | | | – | | | | – | | | | – | | | | 24.74 | | | | 17.22 | | | | 8.83 | | | | – | | | | – | |
| Barclays U.S. Aggregate Bond Index7 | | – | | | – | | | | – | | | | – | | | | 5.66 | | | | 4.48 | | | | 4.72 | | | | – | | | | – | |
| * | | Class B shares are closed to investment, except in connection with the reinvestment of any distributions and permitted exchanges. |
Figures quoted represent past performance, which is no guarantee of future results, and do not reflect taxes that a shareholder may pay on fund distributions or the redemption of fund shares. Investment return and principal value of an investment will fluctuate so that an investor’s shares, when redeemed, may be worth more or less than their original cost. Performance shown without sales charges would be lower if sales charges were reflected. Current performance may be lower or higher than the performance data quoted and assumes the reinvestment of dividends and capital gains. Current month-end performance is available on the Fund’s website, wellsfargoadvantagefunds.com.
Index returns do not include transaction costs associated with buying and selling securities, any mutual fund fees or expenses, or any taxes. It is not possible to invest directly in an index.
For Class A shares, the maximum front-end sales charge is 5.75%. For Class B shares, the maximum contingent deferred sales charge is 5.00%. For Class C shares, the maximum contingent deferred sales charge is 1.00%. Performance including a contingent deferred sales charge assumes the sales charge for the corresponding time period. Class R, Class R4, Class R6, Administrator Class, and Investor Class shares are sold without a front-end sales charge or contingent deferred sales charge.
Please see footnotes on pages 17-18.
| | | | | | |
| Performance highlights (unaudited) | | Wells Fargo Advantage Dow Jones Target Date Funds | | | 9 | |
Target 2025 Fund
Average annual total returns10 (%) as of August 31, 2014
| | | | | | | | | | | | | | | | | | | | | | | | | | | | | | | | | | |
| | | | | Including sales charge | | | Excluding sales charge | | | Expense ratios3 (%) | |
| | | Inception date | | 1 year | | | 5 year | | | Since
inception | | | 1 year | | | 5 year | | | Since
inception | | | Gross | | | Net4 | |
| Class A (WFAYX) | | 11-30-2012 | | | 6.76 | | | | 8.09 | | | | 3.26 | | | | 13.22 | | | | 9.37 | | | | 4.12 | | | | 0.98 | | | | 0.86 | |
| Class R (WFHRX) | | 6-28-2013 | | | – | | | | – | | | | – | | | | 12.90 | | | | 9.11 | | | | 3.90 | | | | 1.23 | | | | 1.11 | |
| Class R4 (WFGRX) | | 11-30-2012 | | | – | | | | – | | | | – | | | | 13.65 | | | | 9.77 | | | | 4.44 | | | | 0.65 | | | | 0.50 | |
| Class R6 (WFTYX) | | 6-29-2007 | | | – | | | | – | | | | – | | | | 13.71 | | | | 9.80 | | | | 4.46 | | | | 0.50 | | | | 0.35 | |
| Administrator Class (WFTRX) | | 6-29-2007 | | | – | | | | – | | | | – | | | | 13.29 | | | | 9.43 | | | | 4.16 | | | | 0.82 | | | | 0.70 | |
| Investor Class (WFGYX) | | 6-29-2007 | | | – | | | | – | | | | – | | | | 13.14 | | | | 9.33 | | | | 4.09 | | | | 1.04 | | | | 0.91 | |
| Dow Jones Global Target 2025 Index5 | | – | | | – | | | | – | | | | – | | | | 14.12 | | | | 10.28 | | | | 4.86 | * | | | – | | | | – | |
| Russell 3000® Index6 | | – | | | – | | | | – | | | | – | | | | 24.74 | | | | 17.22 | | | | 6.63 | * | | | – | | | | – | |
| Barclays U.S. Aggregate Bond Index7 | | – | | | – | | | | – | | | | – | | | | 5.66 | | | | 4.48 | | | | 5.34 | * | | | – | | | | – | |
| * | | Based on the inception date of the oldest class. |
Figures quoted represent past performance, which is no guarantee of future results, and do not reflect taxes that a shareholder may pay on fund distributions or the redemption of fund shares. Investment return and principal value of an investment will fluctuate so that an investor’s shares, when redeemed, may be worth more or less than their original cost. Performance shown without sales charges would be lower if sales charges were reflected. Current performance may be lower or higher than the performance data quoted and assumes the reinvestment of dividends and capital gains. Current month-end performance is available on the Fund’s website, wellsfargoadvantagefunds.com.
Index returns do not include transaction costs associated with buying and selling securities, any mutual fund fees or expenses, or any taxes. It is not possible to invest directly in an index.
For Class A shares, the maximum front-end sales charge is 5.75%. Class R, Class R4, Class R6, Administrator Class, and Investor Class shares are sold without a front-end sales charge or contingent deferred sales charge.
Please see footnotes on pages 17-18.
| | | | |
| 10 | | Wells Fargo Advantage Dow Jones Target Date Funds | | Performance highlights (unaudited) |
Target 2030 Fund
Average annual total returns2(%) as of August 31, 2014
| | | | | | | | | | | | | | | | | | | | | | | | | | | | | | | | | | |
| | | | | Including sales charge | | | Excluding sales charge | | | Expense ratios3 (%) | |
| | | Inception date | | 1 year | | | 5 year | | | 10 year | | | 1 year | | | 5 year | | | 10 year | | | Gross | | | Net4 | |
| Class A (STHRX) | | 3-1-1994 | | | 8.52 | | | | 9.24 | | | | 5.81 | | | | 15.17 | | | | 10.55 | | | | 6.44 | | | | 0.98 | | | | 0.87 | |
| Class B (SGPBX)* | | 3-1-1997 | | | 9.34 | | | | 9.44 | | | | 5.88 | | | | 14.34 | | | | 9.72 | | | | 5.88 | | | | 1.73 | | | | 1.62 | |
| Class C (WFDMX) | | 12-1-1998 | | | 13.32 | | | | 9.72 | | | | 5.65 | | | | 14.32 | | | | 9.72 | | | | 5.65 | | | | 1.73 | | | | 1.62 | |
| Class R (WFJRX) | | 6-28-2013 | | | – | | | | – | | | | – | | | | 14.91 | | | | 10.43 | | | | 6.38 | | | | 1.23 | | | | 1.12 | |
| Class R4 (WTHRX) | | 11-30-2012 | | | – | | | | – | | | | – | | | | 15.59 | | | | 11.08 | | | | 6.98 | | | | 0.65 | | | | 0.51 | |
| Class R6 (WFOOX) | | 6-30-2004 | | | – | | | | – | | | | – | | | | 15.77 | | | | 11.12 | | | | 6.99 | | | | 0.50 | | | | 0.36 | |
| Administrator Class (WFLIX) | | 11-8-1999 | | | – | | | | – | | | | – | | | | 15.37 | | | | 10.73 | | | | 6.70 | | | | 0.82 | | | | 0.71 | |
| Investor Class (WFETX) | | 1-31-2007 | | | – | | | | – | | | | – | | | | 15.12 | | | | 10.62 | | | | 6.62 | | | | 1.04 | | | | 0.92 | |
| Dow Jones Global Target 2030 Index5 | | – | | | – | | | | – | | | | – | | | | 16.18 | | | | 11.57 | | | | 8.27 | | | | – | | | | – | |
| Russell 3000® Index6 | | – | | | – | | | | – | | | | – | | | | 24.74 | | | | 17.22 | | | | 8.83 | | | | – | | | | – | |
| Barclays U.S. Aggregate Bond Index7 | | – | | | – | | | | – | | | | – | | | | 5.66 | | | | 4.48 | | | | 4.72 | | | | – | | | | – | |
| * | | Class B shares are closed to investment, except in connection with the reinvestment of any distributions and permitted exchanges. |
Figures quoted represent past performance, which is no guarantee of future results, and do not reflect taxes that a shareholder may pay on fund distributions or the redemption of fund shares. Investment return and principal value of an investment will fluctuate so that an investor’s shares, when redeemed, may be worth more or less than their original cost. Performance shown without sales charges would be lower if sales charges were reflected. Current performance may be lower or higher than the performance data quoted and assumes the reinvestment of dividends and capital gains. Current month-end performance is available on the Fund’s website, wellsfargoadvantagefunds.com.
Index returns do not include transaction costs associated with buying and selling securities, any mutual fund fees or expenses, or any taxes. It is not possible to invest directly in an index.
For Class A shares, the maximum front-end sales charge is 5.75%. For Class B shares, the maximum contingent deferred sales charge is 5.00%. For Class C shares, the maximum contingent deferred sales charge is 1.00%. Performance including a contingent deferred sales charge assumes the sales charge for the corresponding time period. Class R, Class R4, Class R6, Administrator Class, and Investor Class shares are sold without a front-end sales charge or contingent deferred sales charge.
Please see footnotes on pages 17-18.
| | | | | | |
| Performance highlights (unaudited) | | Wells Fargo Advantage Dow Jones Target Date Funds | | | 11 | |
Target 2035 Fund
Average annual total returns10 (%) as of August 31, 2014
| | | | | | | | | | | | | | | | | | | | | | | | | | | | | | | | | | |
| | | | | Including sales charge | | | Excluding sales charge | | | Expense ratios3 (%) | |
| | | Inception date | | 1 year | | | 5 year | | | Since inception | | | 1 year | | | 5 year | | | Since inception | | | Gross | | | Net4 | |
| Class A (WFQBX) | | 11-30-2012 | | | 10.28 | | | | 10.47 | | | | 3.64 | | | | 17.02 | | | | 11.77 | | | | 4.50 | | | | 1.01 | | | | 0.88 | |
| Class R (WFKRX) | | 6-28-2013 | | | – | | | | – | | | | – | | | | 16.73 | | | | 11.41 | | | | 4.22 | | | | 1.26 | | | | 1.13 | |
| Class R4 (WTTRX) | | 11-30-2012 | | | – | | | | – | | | | – | | | | 17.38 | | | | 12.15 | | | | 4.81 | | | | 0.68 | | | | 0.52 | |
| Class R6 (WFQRX) | | 6-29-2007 | | | – | | | | – | | | | – | | | | 17.55 | | | | 12.20 | | | | 4.84 | | | | 0.53 | | | | 0.37 | |
| Administrator Class (WFQWX) | | 6-29-2007 | | | – | | | | – | | | | – | | | | 17.10 | | | | 11.73 | | | | 4.48 | | | | 0.85 | | | | 0.72 | |
| Investor Class (WFQTX) | | 6-29-2007 | | | – | | | | – | | | | – | | | | 16.84 | | | | 11.62 | | | | 4.40 | | | | 1.07 | | | | 0.93 | |
| Dow Jones Global Target 2035 Index5 | | – | | | – | | | | – | | | | – | | | | 17.99 | | | | 12.63 | | | | 5.12 | * | | | – | | | | – | |
| Russell 3000® Index6 | | – | | | – | | | | – | | | | – | | | | 24.74 | | | | 17.22 | | | | 6.63 | * | | | – | | | | – | |
| Barclays U.S. Aggregate Bond Index7 | | – | | | – | | | | – | | | | – | | | | 5.66 | | | | 4.48 | | | | 5.34 | * | | | – | | | | – | |
| * | | Based on the inception date of the oldest class. |
Figures quoted represent past performance, which is no guarantee of future results, and do not reflect taxes that a shareholder may pay on fund distributions or the redemption of fund shares. Investment return and principal value of an investment will fluctuate so that an investor’s shares, when redeemed, may be worth more or less than their original cost. Performance shown without sales charges would be lower if sales charges were reflected. Current performance may be lower or higher than the performance data quoted and assumes the reinvestment of dividends and capital gains. Current month-end performance is available on the Fund’s website, wellsfargoadvantagefunds.com.
Index returns do not include transaction costs associated with buying and selling securities, any mutual fund fees or expenses, or any taxes. It is not possible to invest directly in an index.
For Class A shares, the maximum front-end sales charge is 5.75%. Class R, Class R4, Class R6, Administrator Class, and Investor Class shares are sold without a front-end sales charge or contingent deferred sales charge.
Please see footnotes on pages 17-18.
| | | | |
| 12 | | Wells Fargo Advantage Dow Jones Target Date Funds | | Performance highlights (unaudited) |
Target 2040 Fund
Average annual total returns2 (%) as of August 31, 2014
| | | | | | | | | | | | | | | | | | | | | | | | |
| | | | | Including sales charge | | Excluding sales charge | | | Expense ratios3 (%) |
| | | Inception date | | 1 year | | 5 year | | 10 year | | 1 year | | | 5 year | | | 10 year | | | Gross | | Net4 |
| Class A (STFRX) | | 3-1-1994 | | 11.53 | | 11.05 | | 6.62 | | | 18.32 | | | | 12.37 | | | | 7.25 | | | 0.99 | | 0.88 |
| Class B (SLPBX)* | | 3-1-1997 | | 12.40 | | 11.23 | | 6.68 | | | 17.40 | | | | 11.49 | | | | 6.68 | | | 1.74 | | 1.63 |
| Class C (WFOFX) | | 7-1-1998 | | 16.49 | | 11.52 | | 6.45 | | | 17.49 | | | | 11.52 | | | | 6.45 | | | 1.74 | | 1.63 |
| Class R (WFMRX) | | 6-28-2013 | | – | | – | | – | | | 18.05 | | | | 12.23 | | | | 7.19 | | | 1.24 | | 1.13 |
| Class R4 (WTFRX) | | 11-30-2012 | | – | | – | | – | | | 18.73 | | | | 12.87 | | | | 7.78 | | | 0.66 | | 0.52 |
| Class R6 (WFOSX) | | 6-30-2004 | | – | | – | | – | | | 18.90 | | | | 12.92 | | | | 7.80 | | | 0.51 | | 0.37 |
| Administrator Class (WFLWX) | | 11-8-1999 | | – | | – | | – | | | 18.54 | | | | 12.55 | | | | 7.50 | | | 0.83 | | 0.72 |
| Investor Class (WFFTX) | | 1-31-2007 | | – | | – | | – | | | 18.28 | | | | 12.44 | | | | 7.43 | | | 1.05 | | 0.93 |
| Dow Jones Global Target 2040 Index5 | | – | | – | | – | | – | | | 19.36 | | | | 13.37 | | | | 8.94 | | | – | | – |
| Russell 3000® Index6 | | – | | – | | – | | – | | | 24.74 | | | | 17.22 | | | | 8.83 | | | – | | – |
| Barclays U.S. Aggregate Bond Index7 | | – | | – | | – | | – | | | 5.66 | | | | 4.48 | | | | 4.72 | | | – | | – |
| * | | Class B shares are closed to investment, except in connection with the reinvestment of any distributions and permitted exchanges. |
Figures quoted represent past performance, which is no guarantee of future results, and do not reflect taxes that a shareholder may pay on fund distributions or the redemption of fund shares. Investment return and principal value of an investment will fluctuate so that an investor’s shares, when redeemed, may be worth more or less than their original cost. Performance shown without sales charges would be lower if sales charges were reflected. Current performance may be lower or higher than the performance data quoted and assumes the reinvestment of dividends and capital gains. Current month-end performance is available on the Fund’s website, wellsfargoadvantagefunds.com.
Index returns do not include transaction costs associated with buying and selling securities, any mutual fund fees or expenses, or any taxes. It is not possible to invest directly in an index.
For Class A shares, the maximum front-end sales charge is 5.75%. For Class B shares, the maximum contingent deferred sales charge is 5.00%. For Class C shares, the maximum contingent deferred sales charge is 1.00%. Performance including a contingent deferred sales charge assumes the sales charge for the corresponding time period. Class R, Class R4, Class R6, Administrator Class, and Investor Class shares are sold without a front-end sales charge or contingent deferred sales charge.
Please see footnotes on pages 17-18.
| | | | | | |
| Performance highlights (unaudited) | | Wells Fargo Advantage Dow Jones Target Date Funds | | | 13 | |
Target 2045 Fund
Average annual total returns10 (%) as of August 31, 2014
| | | | | | | | | | | | | | | | | | | | | | | | |
| | | | | Including sales charge | | Excluding sales charge | | | Expense ratios3 (%) |
| | | Inception date | | 1 year | | 5 year | | Since inception | | 1 year | | | 5 year | | | Since inception | | | Gross | | Net4 |
| Class A (WFQVX) | | 11-30-2012 | | 12.23 | | 11.46 | | 4.08 | | | 19.11 | | | | 12.79 | | | | 4.95 | | | 1.04 | | 0.88 |
| Class R (WFNRX) | | 6-28-2013 | | – | | – | | – | | | 18.76 | | | | 12.50 | | | | 4.68 | | | 1.29 | | 1.13 |
| Class R4 (WFFRX) | | 11-30-2012 | | – | | – | | – | | | 19.54 | | | | 13.21 | | | | 5.28 | | | 0.71 | | 0.52 |
| Class R6 (WFQPX) | | 6-29-2007 | | – | | – | | – | | | 19.75 | | | | 13.22 | | | | 5.29 | | | 0.56 | | 0.37 |
| Administrator Class (WFQYX) | | 6-29-2007 | | – | | – | | – | | | 19.24 | | | | 12.81 | | | | 4.98 | | | 0.88 | | 0.72 |
| Investor Class (WFQSX) | | 6-29-2007 | | – | | – | | – | | | 19.06 | | | | 12.71 | | | | 4.86 | | | 1.10 | | 0.93 |
| Dow Jones Global Target 2045 Index5 | | – | | – | | – | | – | | | 20.12 | | | | 13.72 | | | | 5.52 | * | | – | | – |
| Russell 3000® Index6 | | – | | – | | – | | – | | | 24.74 | | | | 17.22 | | | | 6.63 | * | | – | | – |
| Barclays U.S. Aggregate Bond Index7 | | – | | – | | – | | – | | | 5.66 | | | | 4.48 | | | | 5.34 | * | | – | | – |
| * | | Based on the inception date of the oldest class. |
Figures quoted represent past performance, which is no guarantee of future results, and do not reflect taxes that a shareholder may pay on fund distributions or the redemption of fund shares. Investment return and principal value of an investment will fluctuate so that an investor’s shares, when redeemed, may be worth more or less than their original cost. Performance shown without sales charges would be lower if sales charges were reflected. Current performance may be lower or higher than the performance data quoted and assumes the reinvestment of dividends and capital gains. Current month-end performance is available on the Fund’s website, wellsfargoadvantagefunds.com.
Index returns do not include transaction costs associated with buying and selling securities, any mutual fund fees or expenses, or any taxes. It is not possible to invest directly in an index.
For Class A shares, the maximum front-end sales charge is 5.75%. Class R, Class R4, Class R6, Administrator Class, and Investor Class shares are sold without a front-end sales charge or contingent deferred sales charge.
Please see footnotes on pages 17-18.
| | | | |
| 14 | | Wells Fargo Advantage Dow Jones Target Date Funds | | Performance highlights (unaudited) |
Target 2050 Fund
Average annual total returns11 (%) as of August 31, 2014
| | | | | | | | | | | | | | | | | | | | | | | | | | | | | | | | | | |
| | | | | Including sales charge | | | Excluding sales charge | | | Expense ratios3 (%) | |
| | | Inception date | | 1 year | | | 5 year | | | Since
inception | | | 1 year | | | 5 year | | | Since
inception | | | Gross | | | Net4 | |
| Class A (WFQAX) | | 11-30-2012 | | | 12.35 | | | | 11.54 | | | | 4.08 | | | | 19.23 | | | | 12.86 | | | | 4.95 | | | | 1.01 | | | | 0.88 | |
| Class C (WFQCX) | | 11-30-2012 | | | 17.38 | | | | 12.03 | | | | 4.17 | | | | 18.38 | | | | 12.03 | | | | 4.17 | | | | 1.76 | | | | 1.63 | |
| Class R (WFWRX) | | 6-28-2013 | | | – | | | | – | | | | – | | | | 18.96 | | | | 12.60 | | | | 4.69 | | | | 1.26 | | | | 1.13 | |
| Class R4 (WQFRX) | | 11-30-2012 | | | – | | | | – | | | | – | | | | 19.69 | | | | 13.27 | | | | 5.27 | | | | 0.68 | | | | 0.52 | |
| Class R6 (WFQFX) | | 6-29-2007 | | | – | | | | – | | | | – | | | | 19.87 | | | | 13.32 | | | | 5.31 | | | | 0.53 | | | | 0.37 | |
| Administrator Class (WFQDX) | | 6-29-2007 | | | – | | | | – | | | | – | | | | 19.41 | | | | 12.92 | | | | 4.97 | | | | 0.85 | | | | 0.72 | |
| Investor Class (WFQGX) | | 6-29-2007 | | | – | | | | – | | | | – | | | | 19.22 | | | | 12.82 | | | | 4.88 | | | | 1.07 | | | | 0.93 | |
| Dow Jones Global Target 2050 Index5 | | – | | | – | | | | – | | | | – | | | | 20.26 | | | | 13.77 | | | | 5.55 | * | | | – | | | | – | |
| Russell 3000® Index6 | | – | | | – | | | | – | | | | – | | | | 24.74 | | | | 17.22 | | | | 6.63 | * | | | – | | | | – | |
| Barclays U.S. Aggregate Bond Index7 | | – | | | – | | | | – | | | | – | | | | 5.66 | | | | 4.48 | | | | 5.34 | * | | | – | | | | – | |
| * | | Based on the inception date of the oldest class. |
Figures quoted represent past performance, which is no guarantee of future results, and do not reflect taxes that a shareholder may pay on fund distributions or the redemption of fund shares. Investment return and principal value of an investment will fluctuate so that an investor’s shares, when redeemed, may be worth more or less than their original cost. Performance shown without sales charges would be lower if sales charges were reflected. Current performance may be lower or higher than the performance data quoted and assumes the reinvestment of dividends and capital gains. Current month-end performance is available on the Fund’s website, wellsfargoadvantagefunds.com.
Index returns do not include transaction costs associated with buying and selling securities, any mutual fund fees or expenses, or any taxes. It is not possible to invest directly in an index.
For Class A shares, the maximum front-end sales charge is 5.75%. For Class C shares, the maximum contingent deferred sales charge is 1.00%. Performance including a contingent deferred sales charge assumes the sales charge for the corresponding time period. Class R, Class R4, Class R6, Administrator Class, and Investor Class shares are sold without a front-end sales charge or contingent deferred sales charge.
Please see footnotes on pages 17-18.
| | | | | | |
| Performance highlights (unaudited) | | Wells Fargo Advantage Dow Jones Target Date Funds | | | 15 | |
Target 2055 Fund
Average annual total returns10 (%) as of August 31, 2014
| | | | | | | | | | | | | | | | | | | | | | | | | | |
| | | | | Including sales charge | | | Excluding sales charge | | | Expense ratios3 (%) | |
| | | Inception date | | 1 year | | | Since
inception | | | 1 year | | | Since
inception | | | Gross | | | Net4 | |
| Class A (WFQZX) | | 11-30-2012 | | | 12.42 | | | | 8.56 | | | | 19.24 | | | | 10.61 | | | | 1.21 | | | | 0.88 | |
| Class R (WFYRX) | | 6-28-2013 | | | – | | | | – | | | | 18.94 | | | | 10.14 | | | | 1.46 | | | | 1.13 | |
| Class R4 (WFVRX) | | 11-30-2012 | | | – | | | | – | | | | 19.63 | | | | 11.00 | | | | 0.88 | | | | 0.52 | |
| Class R6 (WFQUX) | | 6-30-2011 | | | – | | | | – | | | | 19.84 | | | | 11.06 | | | | 0.73 | | | | 0.37 | |
| Administrator Class (WFLHX) | | 6-30-2011 | | | – | | | | – | | | | 19.36 | | | | 10.68 | | | | 1.05 | | | | 0.72 | |
| Investor Class (WFQHX) | | 6-30-2011 | | | – | | | | – | | | | 19.23 | | | | 10.58 | | | | 1.27 | | | | 0.93 | |
| Dow Jones Global Target 2055 Index5 | | – | | | – | | | | – | | | | 20.26 | | | | 11.28 | * | | | – | | | | – | |
| Russell 3000® Index6 | | – | | | – | | | | – | | | | 24.74 | | | | 16.28 | * | | | – | | | | – | |
| Barclays U.S. Aggregate Bond Index7 | | – | | | – | | | | – | | | | 5.66 | | | | 3.74 | * | | | – | | | | – | |
| * | | Based on the inception date of the oldest class. |
Figures quoted represent past performance, which is no guarantee of future results, and do not reflect taxes that a shareholder may pay on fund distributions or the redemption of fund shares. Investment return and principal value of an investment will fluctuate so that an investor’s shares, when redeemed, may be worth more or less than their original cost. Performance shown without sales charges would be lower if sales charges were reflected. Current performance may be lower or higher than the performance data quoted, which assumes the reinvestment of dividends and capital gains. Current month-end performance is available on the Fund’s website, wellsfargoadvantagefunds.com.
Index returns do not include transaction costs associated with buying and selling securities, any mutual fund fees or expenses, or any taxes. It is not possible to invest directly in an index.
For Class A shares, the maximum front-end sales charge is 5.75%. Class R, Class R4, Class R6, Administrator Class, and Investor Class shares are sold without a front-end sales charge or contingent deferred sales charge.
Please see footnotes on pages 17-18.
| | | | |
| 16 | | Wells Fargo Advantage Dow Jones Target Date Funds | | Performance highlights (unaudited) |
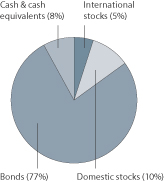
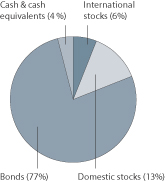
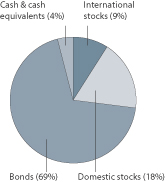
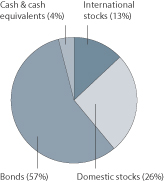
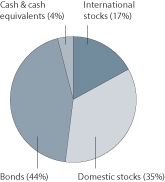
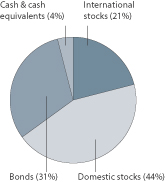
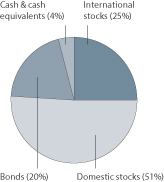
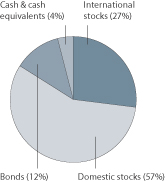
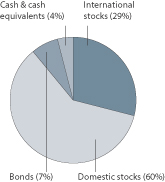
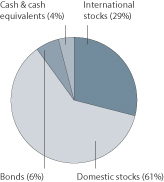
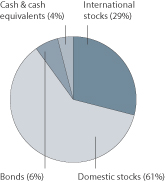
Portfolio allocation12 as of August 31, 2014
| | | | |
| Target Today Fund | | Target 2010 Fund | | Target 2015 Fund |
| | | |
 | |  | |  |
| | | | |
| Target 2020 Fund | | Target 2025 Fund | | Target 2030 Fund |
| | | |
 | |  | |  |
| | | | |
| Target 2035 Fund | | Target 2040 Fund | | Target 2045 Fund |
| | | |
 | |  | |  |
Please see footnotes on pages 17-18.
| | | | | | |
| Performance highlights (unaudited) | | Wells Fargo Advantage Dow Jones Target Date Funds | | | 17 | |
Portfolio allocation12 as of August 31, 2014 (continued)
| | |
| Target 2050 Fund | | Target 2055 Fund |
| | |
 | |  |
| 1. | The Funds are gateway funds that invest in various affiliated master portfolios which in turn invest in a combination of equity, fixed income, and money market securities using an asset allocation strategy designed to replicate, before fees and expenses, the total return of the Dow Jones Global Target Date Indexes that have the same target year as the Funds. References to the investment activities of the Funds are intended to refer to the investment activities of the underlying affiliated master portfolios in which the Funds invest. |
| 2. | Historical performance shown for Class R shares prior to their inception reflects the performance of the Class A shares and has been adjusted to reflect the higher expenses applicable to Class R shares. Historical performance shown for Class R4 shares prior to their inception reflects the performance of Class R6 shares and includes the expenses applicable to Class R6. Effective June 1, 2013, Institutional Class was renamed Class R6 and modified to assume the features and attributes of Class R6. Historical performance shown for Class R6 shares from inception through May 31, 2013, reflects Institutional Class performance and expenses. Historical performance shown for Investor Class shares prior to their inception reflects the performance of Administrator Class shares and has been adjusted to reflect the higher expenses applicable to Investor Class shares (except during those periods in which expenses of the Investor Class would have been lower than those of Administrator Class no such adjustment is reflected). |
| 3. | Reflects the expense ratios as stated in the most recent prospectuses. The expense ratios shown are subject to change and may differ from the annualized expense ratios shown in the financial highlights of this report. |
| 4. | The Adviser has committed through June 30, 2015, to waive fees and/or reimburse expenses to the extent necessary to cap the Fund’s Total Annual Fund Operating Expenses After Fee Waiver, excluding certain expenses, at the amounts shown. After this time, the cap may be increased or the commitment to maintain the cap may be terminated only with the approval of the Board of Trustees. Brokerage commissions, stamp duty fees, interest, taxes, acquired fund fees and expenses, and extraordinary expenses are excluded from the cap. Fees from the underlying affiliated master portfolios are included in the cap. Without this cap, the Fund’s returns would have been lower. |
| 5. | The Dow Jones Global Target Date Indexes (each an “index” or collectively the “indexes”) are a series of indexes designed as benchmarks for multi-asset class portfolios with risk profiles that became more conservative over time. The index weightings among the major asset classes are adjusted monthly based on a published set of index rules. The indexes with longer time horizons have higher allocations to equity securities, while the indexes with shorter time horizons replace some of their stock allocations with allocations to fixed income securities and money market instruments. You cannot invest directly in an index. |
| 6. | The Russell 3000® Index measures the performance of the 3,000 largest U.S. companies based on total market capitalization, which represents approximately 98% of the investable U.S. equity market. You cannot invest directly in an index. |
| 7. | The Barclays U.S. Aggregate Bond Index is a broad-based benchmark that measures the investment-grade, U.S. dollar-denominated, fixed-rate taxable bond market, including Treasuries, government-related and corporate securities, MBS (agency fixed-rate and hybrid ARM pass throughs), ABS, and CMBS. You cannot invest directly in an index. |
| 8. | Historical performance shown for Class R shares prior to their inception reflects the performance of Class A shares and has been adjusted to reflect the higher expenses applicable to Class R shares. Historical performance shown for Class R4 shares prior to their inception reflects the performance of Class R6 shares, and has been adjusted to reflect the higher expenses applicable to Class R6 shares at that time. If these expenses had not been included, returns would be higher. Effective June 1, 2013, Institutional Class was renamed Class R6 and modified to assume the features and attributes of Class R6. Historical performance shown for Class R6 shares from inception through May 31, 2013, reflects Institutional Class performance and expenses. Historical performance shown for Investor Class shares prior to their inception reflects the performance of Administrator Class shares and has been adjusted to reflect the higher expenses applicable to Investor Class shares (except during those periods in which expenses of Investor Class would have been lower than those of Administrator Class no such adjustment is reflected). |
| | | | |
| 18 | | Wells Fargo Advantage Dow Jones Target Date Funds | | Performance highlights (unaudited) |
| 9. | Historical performance shown for Class A shares prior to their inception reflects the performance of Class R6 shares and has been adjusted to reflect the higher expenses applicable to Class A shares. Historical performance shown for Class R shares prior to their inception reflects the performance of Investor Class shares and has been adjusted to reflect the higher expenses applicable to Class R shares. Historical performance shown for Class R4 shares prior to their inception reflects the performance of Class R6 shares, and has been adjusted to reflect the higher expenses applicable to Class R6 shares at that time. If these expenses had not been included, returns would be higher. Effective June 1, 2013, Institutional Class was renamed Class R6 and modified to assume the features and attributes of Class R6. Historical performance shown for Class R6 shares from inception through May 31, 2013, reflects Institutional Class performance and expenses. |
| 10. | Historical performance shown for Class A shares prior to their inception reflects the performance of Class R6 shares and has been adjusted to reflect the higher expenses applicable to Class A shares. Historical performance shown for Class R shares prior to their inception reflects the performance of Investor Class shares and has been adjusted to reflect the higher expenses applicable to Class R shares. Historical performance shown for Class R4 shares prior to their inception reflects the performance of Class R6 shares and includes the expenses applicable to Class R6. Effective June 1, 2013, Institutional Class was renamed Class R6 and modified to assume the features and attributes of Class R6. Historical performance shown for Class R6 shares from inception through May 31, 2013, reflects Institutional Class performance and expenses. |
| 11. | Historical performance shown for Class A and Class C shares prior to their inception reflects the performance of Class R6 shares and has been adjusted to reflect the higher expenses applicable to Class A and Class C shares. Historical performance shown for Class R shares prior to their inception reflects the performance of Investor Class shares and has been adjusted to reflect the higher expenses applicable to Class R shares. Historical performance shown for Class R4 shares prior to their inception reflects the performance of Class R6 shares and includes the expenses applicable to Class R6. Effective June 1, 2013, Institutional Class was renamed Class R6 and modified to assume the features and attributes of Class R6. Historical performance shown for Class R6 shares from inception through May 31, 2013, reflects Institutional Class performance and expenses. |
| 12. | Each chart represents the composite of the portfolio allocations of the affiliated master portfolios in which the Fund invests and is calculated based on the total investments of the affiliated master portfolios. Portfolio holdings are subject to change and may have changed since the date specified. See the Portfolio of investments or Summary portfolio of investments of each affiliated master portfolio which is also included in this report. |
| | | | | | |
| Fund expenses (unaudited) | | Wells Fargo Advantage Dow Jones Target Date Funds | | | 19 | |
As a shareholder of the Fund, you incur two types of costs: (1) transaction costs, including sales charges (loads) on purchase payments and contingent deferred sales charges (if any) on redemptions and (2) ongoing costs, including management fees, distribution (12b-1) and/or shareholder service fees, and other Fund expenses. This example is intended to help you understand your ongoing costs (in dollars) of investing in the Fund and to compare these costs with the ongoing costs of investing in other mutual funds.
The example is based on an investment of $1,000 invested at the beginning of the six-month period and held for the entire period from March 1, 2014 to August 31, 2014.
Actual expenses
The “Actual” line of the table below provides information about actual account values and actual expenses. You may use the information in this line, together with the amount you invested, to estimate the expenses that you paid over the period. Simply divide your account value by $1,000 (for example, an $8,600 account value divided by $1,000 = 8.6), then multiply the result by the number in the “Actual” line under the heading entitled “Expenses paid during period” for your applicable class of shares to estimate the expenses you paid on your account during this period.
Hypothetical example for comparison purposes
The “Hypothetical” line of the table below provides information about hypothetical account values and hypothetical expenses based on the Fund’s actual expense ratio and an assumed rate of return of 5% per year before expenses, which is not the Fund’s actual return. The hypothetical account values and expenses may not be used to estimate the actual ending account balance or expenses you paid for the period. You may use this information to compare the ongoing costs of investing in the Fund and other funds. To do so, compare this 5% hypothetical example with the 5% hypothetical examples that appear in the shareholder reports of the other funds.
Please note that the expenses shown in the table are meant to highlight your ongoing costs only and do not reflect any transactional costs, such as sales charges (loads) and contingent deferred sales charges. Therefore, the “Hypothetical” line of the table is useful in comparing ongoing costs only and will not help you determine the relative total costs of owning different funds. In addition, if these transactional costs were included, your costs would have been higher.
| | | | | | | | | | | | | | | | |
| Target Today Fund | | Beginning
account value
3-1-2014 | | | Ending
account value
8-31-2014 | | | Expenses
paid during
the period¹ | | | Net annualized
expense ratio | |
Class A | | | | | | | | | | | | | | | | |
Actual | | $ | 1,000.00 | | | $ | 1,023.21 | | | $ | 4.13 | | | | 0.81 | % |
Hypothetical (5% return before expenses) | | $ | 1,000.00 | | | $ | 1,021.12 | | | $ | 4.13 | | | | 0.81 | % |
Class B | | | | | | | | | | | | | | | | |
Actual | | $ | 1,000.00 | | | $ | 1,019.43 | | | $ | 7.94 | | | | 1.56 | % |
Hypothetical (5% return before expenses) | | $ | 1,000.00 | | | $ | 1,017.34 | | | $ | 7.93 | | | | 1.56 | % |
Class C | | | | | | | | | | | | | | | | |
Actual | | $ | 1,000.00 | | | $ | 1,019.19 | | | $ | 7.94 | | | | 1.56 | % |
Hypothetical (5% return before expenses) | | $ | 1,000.00 | | | $ | 1,017.34 | | | $ | 7.93 | | | | 1.56 | % |
Class R | | | | | | | | | | | | | | | | |
Actual | | $ | 1,000.00 | | | $ | 1,021.81 | | | $ | 5.40 | | | | 1.06 | % |
Hypothetical (5% return before expenses) | | $ | 1,000.00 | | | $ | 1,019.86 | | | $ | 5.40 | | | | 1.06 | % |
Class R4 | | | | | | | | | | | | | | | | |
Actual | | $ | 1,000.00 | | | $ | 1,024.34 | | | $ | 2.30 | | | | 0.45 | % |
Hypothetical (5% return before expenses) | | $ | 1,000.00 | | | $ | 1,022.94 | | | $ | 2.29 | | | | 0.45 | % |
Class R6 | | | | | | | | | | | | | | | | |
Actual | | $ | 1,000.00 | | | $ | 1,025.61 | | | $ | 1.53 | | | | 0.30 | % |
Hypothetical (5% return before expenses) | | $ | 1,000.00 | | | $ | 1,023.69 | | | $ | 1.53 | | | | 0.30 | % |
Administrator Class | | | | | | | | | | | | | | | | |
Actual | | $ | 1,000.00 | | | $ | 1,023.98 | | | $ | 3.32 | | | | 0.65 | % |
Hypothetical (5% return before expenses) | | $ | 1,000.00 | | | $ | 1,021.93 | | | $ | 3.31 | | | | 0.65 | % |
Investor Class | | | | | | | | | | | | | | | | |
Actual | | $ | 1,000.00 | | | $ | 1,022.67 | | | $ | 4.38 | | | | 0.86 | % |
Hypothetical (5% return before expenses) | | $ | 1,000.00 | | | $ | 1,020.87 | | | $ | 4.38 | | | | 0.86 | % |
| | | | |
| 20 | | Wells Fargo Advantage Dow Jones Target Date Funds | | Fund expenses (unaudited) |
| | | | | | | | | | | | | | | | |
| Target 2010 Fund | | Beginning
account value
3-1-2014 | | | Ending
account value
8-31-2014 | | | Expenses
paid during
the period¹ | | | Net annualized
expense ratio | |
Class A | | | | | | | | | | | | | | | | |
Actual | | $ | 1,000.00 | | | $ | 1,025.23 | | | $ | 4.24 | | | | 0.83 | % |
Hypothetical (5% return before expenses) | | $ | 1,000.00 | | | $ | 1,021.02 | | | $ | 4.23 | | | | 0.83 | % |
Class B | | | | | | | | | | | | | | | | |
Actual | | $ | 1,000.00 | | | $ | 1,021.98 | | | $ | 8.05 | | | | 1.58 | % |
Hypothetical (5% return before expenses) | | $ | 1,000.00 | | | $ | 1,017.24 | | | $ | 8.03 | | | | 1.58 | % |
Class C | | | | | | | | | | | | | | | | |
Actual | | $ | 1,000.00 | | | $ | 1,021.85 | | | $ | 8.05 | | | | 1.58 | % |
Hypothetical (5% return before expenses) | | $ | 1,000.00 | | | $ | 1,017.24 | | | $ | 8.03 | | | | 1.58 | % |
Class R | | | | | | | | | | | | | | | | |
Actual | | $ | 1,000.00 | | | $ | 1,024.86 | | | $ | 5.51 | | | | 1.08 | % |
Hypothetical (5% return before expenses) | | $ | 1,000.00 | | | $ | 1,019.76 | | | $ | 5.50 | | | | 1.08 | % |
Class R4 | | | | | | | | | | | | | | | | |
Actual | | $ | 1,000.00 | | | $ | 1,027.25 | | | $ | 2.40 | | | | 0.47 | % |
Hypothetical (5% return before expenses) | | $ | 1,000.00 | | | $ | 1,022.84 | | | $ | 2.40 | | | | 0.47 | % |
Class R6 | | | | | | | | | | | | | | | | |
Actual | | $ | 1,000.00 | | | $ | 1,028.35 | | | $ | 1.64 | | | | 0.32 | % |
Hypothetical (5% return before expenses) | | $ | 1,000.00 | | | $ | 1,023.59 | | | $ | 1.63 | | | | 0.32 | % |
Administrator Class | | | | | | | | | | | | | | | | |
Actual | | $ | 1,000.00 | | | $ | 1,026.07 | | | $ | 3.42 | | | | 0.67 | % |
Hypothetical (5% return before expenses) | | $ | 1,000.00 | | | $ | 1,021.83 | | | $ | 3.41 | | | | 0.67 | % |
Investor Class | | | | | | | | | | | | | | | | |
Actual | | $ | 1,000.00 | | | $ | 1,025.73 | | | $ | 4.49 | | | | 0.88 | % |
Hypothetical (5% return before expenses) | | $ | 1,000.00 | | | $ | 1,020.77 | | | $ | 4.48 | | | | 0.88 | % |
| Target 2015 Fund | | | | | | | | | | | | |
Class A | | | | | | | | | | | | | | | | |
Actual | | $ | 1,000.00 | | | $ | 1,028.40 | | | $ | 4.29 | | | | 0.84 | % |
Hypothetical (5% return before expenses) | | $ | 1,000.00 | | | $ | 1,020.97 | | | $ | 4.28 | | | | 0.84 | % |
Class R | | | | | | | | | | | | | | | | |
Actual | | $ | 1,000.00 | | | $ | 1,027.70 | | | $ | 5.57 | | | | 1.09 | % |
Hypothetical (5% return before expenses) | | $ | 1,000.00 | | | $ | 1,019.71 | | | $ | 5.55 | | | | 1.09 | % |
Class R4 | | | | | | | | | | | | | | | | |
Actual | | $ | 1,000.00 | | | $ | 1,030.83 | | | $ | 2.46 | | | | 0.48 | % |
Hypothetical (5% return before expenses) | | $ | 1,000.00 | | | $ | 1,022.79 | | | $ | 2.45 | | | | 0.48 | % |
Class R6 | | | | | | | | | | | | | | | | |
Actual | | $ | 1,000.00 | | | $ | 1,031.56 | | | $ | 1.69 | | | | 0.33 | % |
Hypothetical (5% return before expenses) | | $ | 1,000.00 | | | $ | 1,023.54 | | | $ | 1.68 | | | | 0.33 | % |
Administrator Class | | | | | | | | | | | | | | | | |
Actual | | $ | 1,000.00 | | | $ | 1,029.54 | | | $ | 3.48 | | | | 0.68 | % |
Hypothetical (5% return before expenses) | | $ | 1,000.00 | | | $ | 1,021.78 | | | $ | 3.47 | | | | 0.68 | % |
Investor Class | | | | | | | | | | | | | | | | |
Actual | | $ | 1,000.00 | | | $ | 1,028.52 | | | $ | 4.55 | | | | 0.89 | % |
Hypothetical (5% return before expenses) | | $ | 1,000.00 | | | $ | 1,020.72 | | | $ | 4.53 | | | | 0.89 | % |
| | | | | | |
| Fund expenses (unaudited) | | Wells Fargo Advantage Dow Jones Target Date Funds | | | 21 | |
| | | | | | | | | | | | | | | | |
| Target 2020 Fund | | Beginning
account value
3-1-2014 | | | Ending
account value
8-31-2014 | | | Expenses
paid during
the period¹ | | | Net annualized
expense ratio | |
Class A | | | | | | | | | | | | | | | | |
Actual | | $ | 1,000.00 | | | $ | 1,033.73 | | | $ | 4.41 | | | | 0.86 | % |
Hypothetical (5% return before expenses) | | $ | 1,000.00 | | | $ | 1,020.87 | | | $ | 4.38 | | | | 0.86 | % |
Class B | | | | | | | | | | | | | | | | |
Actual | | $ | 1,000.00 | | | $ | 1,029.86 | | | $ | 8.24 | | | | 1.61 | % |
Hypothetical (5% return before expenses) | | $ | 1,000.00 | | | $ | 1,017.09 | | | $ | 8.19 | | | | 1.61 | % |
Class C | | | | | | | | | | | | | | | | |
Actual | | $ | 1,000.00 | | | $ | 1,029.91 | | | $ | 8.24 | | | | 1.61 | % |
Hypothetical (5% return before expenses) | | $ | 1,000.00 | | | $ | 1,017.09 | | | $ | 8.19 | | | | 1.61 | % |
Class R | | | | | | | | | | | | | | | | |
Actual | | $ | 1,000.00 | | | $ | 1,033.00 | | | $ | 5.69 | | | | 1.11 | % |
Hypothetical (5% return before expenses) | | $ | 1,000.00 | | | $ | 1,019.61 | | | $ | 5.65 | | | | 1.11 | % |
Class R4 | | | | | | | | | | | | | | | | |
Actual | | $ | 1,000.00 | | | $ | 1,035.64 | | | $ | 2.57 | | | | 0.50 | % |
Hypothetical (5% return before expenses) | | $ | 1,000.00 | | | $ | 1,022.68 | | | $ | 2.55 | | | | 0.50 | % |
Class R6 | | | | | | | | | | | | | | | | |
Actual | | $ | 1,000.00 | | | $ | 1,036.32 | | | $ | 1.80 | | | | 0.35 | % |
Hypothetical (5% return before expenses) | | $ | 1,000.00 | | | $ | 1,023.44 | | | $ | 1.79 | | | | 0.35 | % |
Administrator Class | | | | | | | | | | | | | | | | |
Actual | | $ | 1,000.00 | | | $ | 1,034.81 | | | $ | 3.59 | | | | 0.70 | % |
Hypothetical (5% return before expenses) | | $ | 1,000.00 | | | $ | 1,021.68 | | | $ | 3.57 | | | | 0.70 | % |
Investor Class | | | | | | | | | | | | | | | | |
Actual | | $ | 1,000.00 | | | $ | 1,033.95 | | | $ | 4.67 | | | | 0.91 | % |
Hypothetical (5% return before expenses) | | $ | 1,000.00 | | | $ | 1,020.62 | | | $ | 4.63 | | | | 0.91 | % |
| Target 2025 Fund | | | | | | | | | | | | |
Class A | | | | | | | | | | | | | | | | |
Actual | | $ | 1,000.00 | | | $ | 1,038.87 | | | $ | 4.42 | | | | 0.86 | % |
Hypothetical (5% return before expenses) | | $ | 1,000.00 | | | $ | 1,020.87 | | | $ | 4.38 | | | | 0.86 | % |
Class R | | | | | | | | | | | | | | | | |
Actual | | $ | 1,000.00 | | | $ | 1,038.24 | | | $ | 5.70 | | | | 1.11 | % |
Hypothetical (5% return before expenses) | | $ | 1,000.00 | | | $ | 1,019.61 | | | $ | 5.65 | | | | 1.11 | % |
Class R4 | | | | | | | | | | | | | | | | |
Actual | | $ | 1,000.00 | | | $ | 1,041.14 | | | $ | 2.57 | | | | 0.50 | % |
Hypothetical (5% return before expenses) | | $ | 1,000.00 | | | $ | 1,022.68 | | | $ | 2.55 | | | | 0.50 | % |
Class R6 | | | | | | | | | | | | | | | | |
Actual | | $ | 1,000.00 | | | $ | 1,041.88 | | | $ | 1.80 | | | | 0.35 | % |
Hypothetical (5% return before expenses) | | $ | 1,000.00 | | | $ | 1,023.44 | | | $ | 1.79 | | | | 0.35 | % |
Administrator Class | | | | | | | | | | | | | | | | |
Actual | | $ | 1,000.00 | | | $ | 1,039.18 | | | $ | 3.60 | | | | 0.70 | % |
Hypothetical (5% return before expenses) | | $ | 1,000.00 | | | $ | 1,021.68 | | | $ | 3.57 | | | | 0.70 | % |
Investor Class | | | | | | | | | | | | | | | | |
Actual | | $ | 1,000.00 | | | $ | 1,038.25 | | | $ | 4.68 | | | | 0.91 | % |
Hypothetical (5% return before expenses) | | $ | 1,000.00 | | | $ | 1,020.62 | | | $ | 4.63 | | | | 0.91 | % |
| | | | |
| 22 | | Wells Fargo Advantage Dow Jones Target Date Funds | | Fund expenses (unaudited) |
| | | | | | | | | | | | | | | | |
| Target 2030 Fund | | Beginning
account value
3-1-2014 | | | Ending
account value
8-31-2014 | | | Expenses
paid during
the period¹ | | | Net annualized
expense ratio | |
Class A | | | | | | | | | | | | | | | | |
Actual | | $ | 1,000.00 | | | $ | 1,043.61 | | | $ | 4.48 | | | | 0.87 | % |
Hypothetical (5% return before expenses) | | $ | 1,000.00 | | | $ | 1,020.82 | | | $ | 4.43 | | | | 0.87 | % |
Class B | | | | | | | | | | | | | | | | |
Actual | | $ | 1,000.00 | | | $ | 1,039.90 | | | $ | 8.33 | | | | 1.62 | % |
Hypothetical (5% return before expenses) | | $ | 1,000.00 | | | $ | 1,017.04 | | | $ | 8.24 | | | | 1.62 | % |
Class C | | | | | | | | | | | | | | | | |
Actual | | $ | 1,000.00 | | | $ | 1,039.75 | | | $ | 8.33 | | | | 1.62 | % |
Hypothetical (5% return before expenses) | | $ | 1,000.00 | | | $ | 1,017.04 | | | $ | 8.24 | | | | 1.62 | % |
Class R | | | | | | | | | | | | | | | | |
Actual | | $ | 1,000.00 | | | $ | 1,042.26 | | | $ | 5.77 | | | | 1.12 | % |
Hypothetical (5% return before expenses) | | $ | 1,000.00 | | | $ | 1,019.56 | | | $ | 5.70 | | | | 1.12 | % |
Class R4 | | | | | | | | | | | | | | | | |
Actual | | $ | 1,000.00 | | | $ | 1,045.42 | | | $ | 2.63 | | | | 0.51 | % |
Hypothetical (5% return before expenses) | | $ | 1,000.00 | | | $ | 1,022.63 | | | $ | 2.60 | | | | 0.51 | % |
Class R6 | | | | | | | | | | | | | | | | |
Actual | | $ | 1,000.00 | | | $ | 1,046.75 | | | $ | 1.86 | | | | 0.36 | % |
Hypothetical (5% return before expenses) | | $ | 1,000.00 | | | $ | 1,023.39 | | | $ | 1.84 | | | | 0.36 | % |
Administrator Class | | | | | | | | | | | | | | | | |
Actual | | $ | 1,000.00 | | | $ | 1,044.52 | | | $ | 3.66 | | | | 0.71 | % |
Hypothetical (5% return before expenses) | | $ | 1,000.00 | | | $ | 1,021.63 | | | $ | 3.62 | | | | 0.71 | % |
Investor Class | | | | | | | | | | | | | | | | |
Actual | | $ | 1,000.00 | | | $ | 1,043.75 | | | $ | 4.74 | | | | 0.92 | % |
Hypothetical (5% return before expenses) | | $ | 1,000.00 | | | $ | 1,020.57 | | | $ | 4.69 | | | | 0.92 | % |
| Target 2035 Fund | | | | | | | | | | | | |
Class A | | | | | | | | | | | | | | | | |
Actual | | $ | 1,000.00 | | | $ | 1,048.06 | | | $ | 4.54 | | | | 0.88 | % |
Hypothetical (5% return before expenses) | | $ | 1,000.00 | | | $ | 1,020.77 | | | $ | 4.48 | | | | 0.88 | % |
Class R | | | | | | | | | | | | | | | | |
Actual | | $ | 1,000.00 | | | $ | 1,046.34 | | | $ | 5.83 | | | | 1.13 | % |
Hypothetical (5% return before expenses) | | $ | 1,000.00 | | | $ | 1,019.51 | | | $ | 5.75 | | | | 1.13 | % |
Class R4 | | | | | | | | | | | | | | | | |
Actual | | $ | 1,000.00 | | | $ | 1,049.48 | | | $ | 2.69 | | | | 0.52 | % |
Hypothetical (5% return before expenses) | | $ | 1,000.00 | | | $ | 1,022.58 | | | $ | 2.65 | | | | 0.52 | % |
Class R6 | | | | | | | | | | | | | | | | |
Actual | | $ | 1,000.00 | | | $ | 1,050.17 | | | $ | 1.91 | | | | 0.37 | % |
Hypothetical (5% return before expenses) | | $ | 1,000.00 | | | $ | 1,023.34 | | | $ | 1.89 | | | | 0.37 | % |
Administrator Class | | | | | | | | | | | | | | | | |
Actual | | $ | 1,000.00 | | | $ | 1,048.39 | | | $ | 3.72 | | | | 0.72 | % |
Hypothetical (5% return before expenses) | | $ | 1,000.00 | | | $ | 1,021.58 | | | $ | 3.67 | | | | 0.72 | % |
Investor Class | | | | | | | | | | | | | | | | |
Actual | | $ | 1,000.00 | | | $ | 1,047.22 | | | $ | 4.80 | | | | 0.93 | % |
Hypothetical (5% return before expenses) | | $ | 1,000.00 | | | $ | 1,020.52 | | | $ | 4.74 | | | | 0.93 | % |
| | | | | | |
| Fund expenses (unaudited) | | Wells Fargo Advantage Dow Jones Target Date Funds | | | 23 | |
| | | | | | | | | | | | | | | | |
| Target 2040 Fund | | Beginning
account value
3-1-2014 | | | Ending
account value
8-31-2014 | | | Expenses
paid during
the period¹ | | | Net annualized
expense ratio | |
Class A | | | | | | | | | | | | | | | | |
Actual | | $ | 1,000.00 | | | $ | 1,051.58 | | | $ | 4.55 | | | | 0.88 | % |
Hypothetical (5% return before expenses) | | $ | 1,000.00 | | | $ | 1,020.77 | | | $ | 4.48 | | | | 0.88 | % |
Class B | | | | | | | | | | | | | | | | |
Actual | | $ | 1,000.00 | | | $ | 1,047.25 | | | $ | 8.41 | | | | 1.63 | % |
Hypothetical (5% return before expenses) | | $ | 1,000.00 | | | $ | 1,016.99 | | | $ | 8.29 | | | | 1.63 | % |
Class C | | | | | | | | | | | | | | | | |
Actual | | $ | 1,000.00 | | | $ | 1,047.24 | | | $ | 8.41 | | | | 1.63 | % |
Hypothetical (5% return before expenses) | | $ | 1,000.00 | | | $ | 1,016.99 | | | $ | 8.29 | | | | 1.63 | % |
Class R | | | | | | | | | | | | | | | | |
Actual | | $ | 1,000.00 | | | $ | 1,049.57 | | | $ | 5.84 | | | | 1.13 | % |
Hypothetical (5% return before expenses) | | $ | 1,000.00 | | | $ | 1,019.51 | | | $ | 5.75 | | | | 1.13 | % |
Class R4 | | | | | | | | | | | | | | | | |
Actual | | $ | 1,000.00 | | | $ | 1,052.79 | | | $ | 2.69 | | | | 0.52 | % |
Hypothetical (5% return before expenses) | | $ | 1,000.00 | | | $ | 1,022.58 | | | $ | 2.65 | | | | 0.52 | % |
Class R6 | | | | | | | | | | | | | | | | |
Actual | | $ | 1,000.00 | | | $ | 1,054.01 | | | $ | 1.92 | | | | 0.37 | % |
Hypothetical (5% return before expenses) | | $ | 1,000.00 | | | $ | 1,023.34 | | | $ | 1.89 | | | | 0.37 | % |
Administrator Class | | | | | | | | | | | | | | | | |
Actual | | $ | 1,000.00 | | | $ | 1,051.95 | | | $ | 3.72 | | | | 0.72 | % |
Hypothetical (5% return before expenses) | | $ | 1,000.00 | | | $ | 1,021.58 | | | $ | 3.67 | | | | 0.72 | % |
Investor Class | | | | | | | | | | | | | | | | |
Actual | | $ | 1,000.00 | | | $ | 1,051.18 | | | $ | 4.81 | | | | 0.93 | % |
Hypothetical (5% return before expenses) | | $ | 1,000.00 | | | $ | 1,020.52 | | | $ | 4.74 | | | | 0.93 | % |
| Target 2045 Fund | | | | | | | | | | | | |
Class A | | | | | | | | | | | | | | | | |
Actual | | $ | 1,000.00 | | | $ | 1,053.59 | | | $ | 4.56 | | | | 0.88 | % |
Hypothetical (5% return before expenses) | | $ | 1,000.00 | | | $ | 1,020.77 | | | $ | 4.48 | | | | 0.88 | % |
Class R | | | | | | | | | | | | | | | | |
Actual | | $ | 1,000.00 | | | $ | 1,051.71 | | | $ | 5.84 | | | | 1.13 | % |
Hypothetical (5% return before expenses) | | $ | 1,000.00 | | | $ | 1,019.51 | | | $ | 5.75 | | | | 1.13 | % |
Class R4 | | | | | | | | | | | | | | | | |
Actual | | $ | 1,000.00 | | | $ | 1,055.65 | | | $ | 2.69 | | | | 0.52 | % |
Hypothetical (5% return before expenses) | | $ | 1,000.00 | | | $ | 1,022.58 | | | $ | 2.65 | | | | 0.52 | % |
Class R6 | | | | | | | | | | | | | | | | |
Actual | | $ | 1,000.00 | | | $ | 1,056.43 | | | $ | 1.92 | | | | 0.37 | % |
Hypothetical (5% return before expenses) | | $ | 1,000.00 | | | $ | 1,023.34 | | | $ | 1.89 | | | | 0.37 | % |
Administrator Class | | | | | | | | | | | | | | | | |
Actual | | $ | 1,000.00 | | | $ | 1,053.59 | | | $ | 3.73 | | | | 0.72 | % |
Hypothetical (5% return before expenses) | | $ | 1,000.00 | | | $ | 1,021.58 | | | $ | 3.67 | | | | 0.72 | % |
Investor Class | | | | | | | | | | | | | | | | |
Actual | | $ | 1,000.00 | | | $ | 1,052.39 | | | $ | 4.81 | | | | 0.93 | % |
Hypothetical (5% return before expenses) | | $ | 1,000.00 | | | $ | 1,020.52 | | | $ | 4.74 | | | | 0.93 | % |
| | | | |
| 24 | | Wells Fargo Advantage Dow Jones Target Date Funds | | Fund expenses (unaudited) |
| | | | | | | | | | | | | | | | |
| Target 2050 Fund | | Beginning
account value
3-1-2014 | | | Ending
account value
8-31-2014 | | | Expenses
paid during
the period¹ | | | Net annualized
expense ratio | |
Class A | | | | | | | | | | | | | | | | |
Actual | | $ | 1,000.00 | | | $ | 1,053.70 | | | $ | 4.56 | | | | 0.88 | % |
Hypothetical (5% return before expenses) | | $ | 1,000.00 | | | $ | 1,020.77 | | | $ | 4.48 | | | | 0.88 | % |
Class C | | | | | | | | | | | | | | | | |
Actual | | $ | 1,000.00 | | | $ | 1,050.34 | | | $ | 8.42 | | | | 1.63 | % |
Hypothetical (5% return before expenses) | | $ | 1,000.00 | | | $ | 1,016.99 | | | $ | 8.29 | | | | 1.63 | % |
Class R | | | | | | | | | | | | | | | | |
Actual | | $ | 1,000.00 | | | $ | 1,052.25 | | | $ | 5.85 | | | | 1.13 | % |
Hypothetical (5% return before expenses) | | $ | 1,000.00 | | | $ | 1,019.51 | | | $ | 5.75 | | | | 1.13 | % |
Class R4 | | | | | | | | | | | | | | | | |
Actual | | $ | 1,000.00 | | | $ | 1,054.93 | | | $ | 2.69 | | | | 0.52 | % |
Hypothetical (5% return before expenses) | | $ | 1,000.00 | | | $ | 1,022.58 | | | $ | 2.65 | | | | 0.52 | % |
Class R6 | | | | | | | | | | | | | | | | |
Actual | | $ | 1,000.00 | | | $ | 1,056.57 | | | $ | 1.92 | | | | 0.37 | % |
Hypothetical (5% return before expenses) | | $ | 1,000.00 | | | $ | 1,023.34 | | | $ | 1.89 | | | | 0.37 | % |
Administrator Class | | | | | | | | | | | | | | | | |
Actual | | $ | 1,000.00 | | | $ | 1,055.17 | | | $ | 3.73 | | | | 0.72 | % |
Hypothetical (5% return before expenses) | | $ | 1,000.00 | | | $ | 1,021.58 | | | $ | 3.67 | | | | 0.72 | % |
Investor Class | | | | | | | | | | | | | | | | |
Actual | | $ | 1,000.00 | | | $ | 1,053.09 | | | $ | 4.81 | | | | 0.93 | % |
Hypothetical (5% return before expenses) | | $ | 1,000.00 | | | $ | 1,020.52 | | | $ | 4.74 | | | | 0.93 | % |
| Target 2055 Fund | | | | | | | | | | | | |
Class A | | | | | | | | | | | | | | | | |
Actual | | $ | 1,000.00 | | | $ | 1,053.61 | | | $ | 4.56 | | | | 0.88 | % |
Hypothetical (5% return before expenses) | | $ | 1,000.00 | | | $ | 1,020.77 | | | $ | 4.48 | | | | 0.88 | % |
Class R | | | | | | | | | | | | | | | | |
Actual | | $ | 1,000.00 | | | $ | 1,052.64 | | | $ | 5.85 | | | | 1.13 | % |
Hypothetical (5% return before expenses) | | $ | 1,000.00 | | | $ | 1,019.51 | | | $ | 5.75 | | | | 1.13 | % |
Class R4 | | | | | | | | | | | | | | | | |
Actual | | $ | 1,000.00 | | | $ | 1,055.52 | | | $ | 2.69 | | | | 0.52 | % |
Hypothetical (5% return before expenses) | | $ | 1,000.00 | | | $ | 1,022.58 | | | $ | 2.65 | | | | 0.52 | % |
Class R6 | | | | | | | | | | | | | | | | |
Actual | | $ | 1,000.00 | | | $ | 1,056.28 | | | $ | 1.92 | | | | 0.37 | % |
Hypothetical (5% return before expenses) | | $ | 1,000.00 | | | $ | 1,023.34 | | | $ | 1.89 | | | | 0.37 | % |
Administrator Class | | | | | | | | | | | | | | | | |
Actual | | $ | 1,000.00 | | | $ | 1,054.75 | | | $ | 3.73 | | | | 0.72 | % |
Hypothetical (5% return before expenses) | | $ | 1,000.00 | | | $ | 1,021.58 | | | $ | 3.67 | | | | 0.72 | % |
Investor Class | | | | | | | | | | | | | | | | |
Actual | | $ | 1,000.00 | | | $ | 1,053.52 | | | $ | 4.81 | | | | 0.93 | % |
Hypothetical (5% return before expenses) | | $ | 1,000.00 | | | $ | 1,020.52 | | | $ | 4.74 | | | | 0.93 | % |
| 1. | Expenses paid is equal to the annualized expense ratio of each class multiplied by the average account value over the period, multiplied by the number of days in the most recent fiscal half-year divided by the number of days in the fiscal year (to reflect the one-half-year period). |
| | | | | | |
| Portfolios of investments—August 31, 2014 (unaudited) | | Wells Fargo Advantage Dow Jones Target Date Funds | | | 25 | |
TARGET TODAY FUND
| | | | | | | | | | |
| Security name | | | | | | | | Value | |
| | | | | | | | | | |
| | | | |
Investment Companies: 100.05% | | | | | | | | | | |
| | | | |
| Affiliated Master Portfolios: 100.05% | | | | | | | | | | |
Wells Fargo Advantage Diversified Fixed Income Portfolio | | | | | | | | $ | 624,018,462 | |
Wells Fargo Advantage Diversified Stock Portfolio | | | | | | | | | 123,775,369 | |
Wells Fargo Advantage Short-Term Investment Portfolio | | | | | | | | | 60,409,584 | |
| | | | |
Total Investment Companies (Cost $743,744,393) | | | | | | | | | 808,203,415 | |
| | | | | | | | | | |
| | | | | | | | |
| Total investments in securities | | | | | | | | |
| (Cost $743,744,393) * | | | 100.05 | % | | | 808,203,415 | |
Other assets and liabilities, net | | | (0.05 | ) | | | (416,923 | ) |
| | | | | | | | |
| Total net assets | | | 100.00 | % | | $ | 807,786,492 | |
| | | | | | | | |
| | | | | | | | |
* | | Cost for federal income tax purposes is $745,145,422 and unrealized gains (losses) consists of: |
| | Gross unrealized gains | | $ | 63,057,993 | | | |
| | Gross unrealized losses | | | 0 | | | |
| | | | | | | | |
| | Net unrealized gains | | $ | 63,057,993 | | | |
TARGET 2010 FUND
| | | | | | | | | | |
| Security name | | | | | | | | Value | |
| | | | | | | | | | |
| | | | |
Investment Companies: 99.87% | | | | | | | | | | |
| | | | |
| Affiliated Master Portfolios: 99.87% | | | | | | | | | | |
Wells Fargo Advantage Diversified Fixed Income Portfolio | | | | | | | | $ | 529,478,247 | |
Wells Fargo Advantage Diversified Stock Portfolio | | | | | | | | | 128,267,990 | |
Wells Fargo Advantage Short-Term Investment Portfolio | | | | | | | | | 27,053,875 | |
| | | | |
Total Investment Companies (Cost $600,258,505) | | | | | | | | | 684,800,112 | |
| | | | | | | | | | |
| | | | | | | | |
| Total investments in securities | | | | | | | | |
| (Cost $600,258,505) * | | | 99.87 | % | | | 684,800,112 | |
Other assets and liabilities, net | | | 0.13 | | | | 861,047 | |
| | | | | | | | |
| Total net assets | | | 100.00 | % | | $ | 685,661,159 | |
| | | | | | | | |
| | | | | | | | |
* | | Cost for federal income tax purposes is $608,139,896 and unrealized gains (losses) consists of: |
| | Gross unrealized gains | | $ | 76,660,216 | | | |
| | Gross unrealized losses | | | 0 | | | |
| | | | | | | | |
| | Net unrealized gains | | $ | 76,660,216 | | | |
The accompanying notes are an integral part of these financial statements.
| | | | |
| 26 | | Wells Fargo Advantage Dow Jones Target Date Funds | | Portfolios of investments—August 31, 2014 (unaudited) |
TARGET 2015 FUND
| | | | | | | | | | |
| Security name | | | | | | | | Value | |
| | | | | | | | | | |
| | | | |
Investment Companies: 99.97% | | | | | | | | | | |
| | | | |
| Affiliated Master Portfolios: 99.97% | | | | | | | | | | |
Wells Fargo Advantage Diversified Fixed Income Portfolio | | | | | | | | $ | 663,131,261 | |
Wells Fargo Advantage Diversified Stock Portfolio | | | | | | | | | 258,132,884 | |
Wells Fargo Advantage Short-Term Investment Portfolio | | | | | | | | | 37,816,583 | |
| | | | |
Total Investment Companies (Cost $847,733,676) | | | | | | | | | 959,080,728 | |
| | | | | | | | | | |
| | | | | | | | |
| Total investments in securities | | | | | | | | |
| (Cost $847,733,676) * | | | 99.97 | % | | | 959,080,728 | |
Other assets and liabilities, net | | | 0.03 | | | | 301,425 | |
| | | | | | | | |
| Total net assets | | | 100.00 | % | | $ | 959,382,153 | |
| | | | | | | | |
| | | | | | | | |
* | | Cost for federal income tax purposes is $849,259,668 and unrealized gains (losses) consists of: |
| | Gross unrealized gains | | $ | 109,821,060 | | | |
| | Gross unrealized losses | | | 0 | | | |
| | | | | | | | |
| | Net unrealized gains | | $ | 109,821,060 | | | |
TARGET 2020 FUND
| | | | | | | | | | |
| Security name | | | | | | | | Value | |
| | | | | | | | | | |
| | | | |
Investment Companies: 99.91% | | | | | | | | | | |
| | | | |
| Affiliated Master Portfolios: 99.91% | | | | | | | | | | |
Wells Fargo Advantage Diversified Fixed Income Portfolio | | | | | | | | $ | 1,690,979,692 | |
Wells Fargo Advantage Diversified Stock Portfolio | | | | | | | | | 1,173,098,935 | |
Wells Fargo Advantage Short-Term Investment Portfolio | | | | | | | | | 117,207,003 | |
| | | | |
Total Investment Companies (Cost $2,553,010,659) | | | | | | | | | 2,981,285,630 | |
| | | | | | | | | | |
| | | | | | | | |
| Total investments in securities | | | | | | | | |
| (Cost $2,553,010,659) * | | | 99.91 | % | | | 2,981,285,630 | |
Other assets and liabilities, net | | | 0.09 | | | | 2,590,149 | |
| | | | | | | | |
| Total net assets | | | 100.00 | % | | $ | 2,983,875,779 | |
| | | | | | | | |
| | | | | | | | |
* | | Cost for federal income tax purposes is $2,572,499,086 and unrealized gains (losses) consists of: |
| | Gross unrealized gains | | $ | 408,786,544 | | | |
| | Gross unrealized losses | | | 0 | | | |
| | | | | | | | |
| | Net unrealized gains | | $ | 408,786,544 | | | |
The accompanying notes are an integral part of these financial statements.
| | | | | | |
| Portfolios of investments—August 31, 2014 (unaudited) | | Wells Fargo Advantage Dow Jones Target Date Funds | | | 27 | |
TARGET 2025 FUND
| | | | | | | | | | |
| Security name | | | | | | | | Value | |
| | | | | | | | | | |
| | | | |
Investment Companies: 99.93% | | | | | | | | | | |
| | | | |
| Affiliated Master Portfolios: 99.93% | | | | | | | | | | |
Wells Fargo Advantage Diversified Fixed Income Portfolio | | | | | | | | $ | 1,074,847,903 | |
Wells Fargo Advantage Diversified Stock Portfolio | | | | | | | | | 1,281,915,994 | |
Wells Fargo Advantage Short-Term Investment Portfolio | | | | | | | | | 96,139,109 | |
| | | | |
Total Investment Companies (Cost $2,014,175,144) | | | | | | | | | 2,452,903,006 | |
| | | | | | | | | | |
| | | | | | | | |
| Total investments in securities | | | | | | | | |
| (Cost $2,014,175,144) * | | | 99.93 | % | | | 2,452,903,006 | |
Other assets and liabilities, net | | | 0.07 | | | | 1,813,269 | |
| | | | | | | | |
| Total net assets | | | 100.00 | % | | $ | 2,454,716,275 | |
| | | | | | | | |
| | | | | | | | |
* | | Cost for federal income tax purposes is $2,019,401,887 and unrealized gains (losses) consists of: |
| | Gross unrealized gains | | $ | 433,501,119 | | | |
| | Gross unrealized losses | | | 0 | | | |
| | | | | | | | |
| | Net unrealized gains | | $ | 433,501,119 | | | |
TARGET 2030 FUND
| | | | | | | | | | |
| Security name | | | | | | | | Value | |
| | | | | | | | | | |
| | | | |
Investment Companies: 99.94% | | | | | | | | | | |
| | | | |
| Affiliated Master Portfolios: 99.94% | | | | | | | | | | |
Wells Fargo Advantage Diversified Fixed Income Portfolio | | | | | | | | $ | 957,177,059 | |
Wells Fargo Advantage Diversified Stock Portfolio | | | | | | | | | 1,980,261,138 | |
Wells Fargo Advantage Short-Term Investment Portfolio | | | | | | | | | 119,455,580 | |
| | | | |
Total Investment Companies (Cost $2,474,339,232) | | | | | | | | | 3,056,893,777 | |
| | | | | | | | | | |
| | | | | | | | |
| Total investments in securities | | | | | | | | |
| (Cost $2,474,339,232) * | | | 99.94 | % | | | 3,056,893,777 | |
Other assets and liabilities, net | | | 0.06 | | | | 1,849,497 | |
| | | | | | | | |
| Total net assets | | | 100.00 | % | | $ | 3,058,743,274 | |
| | | | | | | | |
| | | | | | | | |
* | | Cost for federal income tax purposes is $2,490,361,544 and unrealized gains (losses) consists of: |
| | Gross unrealized gains | | $ | 566,532,233 | | | |
| | Gross unrealized losses | | | 0 | | | |
| | | | | | | | |
| | Net unrealized gains | | $ | 566,532,233 | | | |
The accompanying notes are an integral part of these financial statements.
| | | | |
| 28 | | Wells Fargo Advantage Dow Jones Target Date Funds | | Portfolios of investments—August 31, 2014 (unaudited) |
TARGET 2035 FUND
| | | | | | | | | | |
| Security name | | | | | | | | Value | |
| | | | | | | | | | |
| | | | |
Investment Companies: 99.83% | | | | | | | | | | |
| | | | |
| Affiliated Master Portfolios: 99.83% | | | | | | | | | | |
Wells Fargo Advantage Diversified Fixed Income Portfolio | | | | | | | | $ | 282,055,229 | |
Wells Fargo Advantage Diversified Stock Portfolio | | | | | | | | | 1,053,499,443 | |
Wells Fargo Advantage Short-Term Investment Portfolio | | | | | | | | | 54,163,955 | |
| | | | |
Total Investment Companies (Cost $1,084,343,372) | | | | | | | | | 1,389,718,627 | |
| | | | | | | | | | |
| | | | | | | | |
| Total investments in securities | | | | | | | | |
| (Cost $1,084,343,372) * | | | 99.83 | % | | | 1,389,718,627 | |
Other assets and liabilities, net | | | 0.17 | | | | 2,415,000 | |
| | | | | | | | |
| Total net assets | | | 100.00 | % | | $ | 1,392,133,627 | |
| | | | | | | | |
| | | | | | | | |
* | | Cost for federal income tax purposes is $1,088,041,749 and unrealized gains (losses) consists of: |
| | Gross unrealized gains | | $ | 301,676,878 | | | |
| | Gross unrealized losses | | | 0 | | | |
| | | | | | | | |
| | Net unrealized gains | | $ | 301,676,878 | | | |
TARGET 2040 FUND
| | | | | | | | | | |
| Security name | | | | | | | | Value | |
| | | | | | | | | | |
| | | | |
Investment Companies: 99.89% | | | | | | | | | | |
| | | | |
| Affiliated Master Portfolios: 99.89% | | | | | | | | | | |
Wells Fargo Advantage Diversified Fixed Income Portfolio | | | | | | | | $ | 263,920,089 | |
Wells Fargo Advantage Diversified Stock Portfolio | | | | | | | | | 1,872,399,081 | |
Wells Fargo Advantage Short-Term Investment Portfolio | | | | | | | | | 86,457,717 | |
| | | | |
Total Investment Companies (Cost $1,721,747,792) | | | | | | | | | 2,222,776,887 | |
| | | | | | | | | | |
| | | | | | | | |
| Total investments in securities | | | | | | | | |
| (Cost $1,721,747,792) * | | | 99.89 | % | | | 2,222,776,887 | |
Other assets and liabilities, net | | | 0.11 | | | | 2,546,193 | |
| | | | | | | | |
| Total net assets | | | 100.00 | % | | $ | 2,225,323,080 | |
| | | | | | | | |
| | | | | | | | |
* | | Cost for federal income tax purposes is $1,732,150,765 and unrealized gains (losses) consists of: |
| | Gross unrealized gains | | $ | 490,626,122 | | | |
| | Gross unrealized losses | | | 0 | | | |
| | | | | | | | |
| | Net unrealized gains | | $ | 490,626,122 | | | |
The accompanying notes are an integral part of these financial statements.
| | | | | | |
| Portfolios of investments—August 31, 2014 (unaudited) | | Wells Fargo Advantage Dow Jones Target Date Funds | | | 29 | |
TARGET 2045 FUND
| | | | | | | | | | |
| Security name | | | | | | | | Value | |
| | | | | | | | | | |
| | | | |
Investment Companies: 99.63% | | | | | | | | | | |
| | | | |
| Affiliated Master Portfolios: 99.63% | | | | | | | | | | |
Wells Fargo Advantage Diversified Fixed Income Portfolio | | | | | | | | $ | 53,213,879 | |
Wells Fargo Advantage Diversified Stock Portfolio | | | | | | | | | 685,806,935 | |
Wells Fargo Advantage Short-Term Investment Portfolio | | | | | | | | | 29,871,548 | |
| | | | |
Total Investment Companies (Cost $588,201,148) | | | | | | | | | 768,892,362 | |
| | | | | | | | | | |
| | | | | | | | |
| Total investments in securities | | | | | | | | |
| (Cost $588,201,148) * | | | 99.63 | % | | | 768,892,362 | |
Other assets and liabilities, net | | | 0.37 | | | | 2,849,476 | |
| | | | | | | | |
| Total net assets | | | 100.00 | % | | $ | 771,741,838 | |
| | | | | | | | |
| | | | | | | | |
* | | Cost for federal income tax purposes is $590,130,153 and unrealized gains (losses) consists of: |
| | Gross unrealized gains | | $ | 178,762,209 | | | |
| | Gross unrealized losses | | | 0 | | | |
| | | | | | | | |
| | Net unrealized gains | | $ | 178,762,209 | | | |
TARGET 2050 FUND
| | | | | | | | | | |
| Security name | | | | | | | | Value | |
| | | | | | | | | | |
| | | | |
Investment Companies: 99.69% | | | | | | | | | | |
| | | | |
| Affiliated Master Portfolios: 99.69% | | | | | | | | | | |
Wells Fargo Advantage Diversified Fixed Income Portfolio | | | | | | | | $ | 81,264,946 | |
Wells Fargo Advantage Diversified Stock Portfolio | | | | | | | | | 1,262,725,359 | |
Wells Fargo Advantage Short-Term Investment Portfolio | | | | | | | | | 54,309,643 | |
| | | | |
Total Investment Companies (Cost $1,073,140,501) | | | | | | | | | 1,398,299,948 | |
| | | | | | | | | | |
| | | | | | | | |
| Total investments in securities | | | | | | | | |
| (Cost $1,073,140,501) * | | | 99.69 | % | | | 1,398,299,948 | |
Other assets and liabilities, net | | | 0.31 | | | | 4,315,825 | |
| | | | | | | | |
| Total net assets | | | 100.00 | % | | $ | 1,402,615,773 | |
| | | | | | | | |
| | | | | | | | |
* | | Cost for federal income tax purposes is $1,078,123,359 and unrealized gains (losses) consists of: |
| | Gross unrealized gains | | $ | 320,176,589 | | | |
| | Gross unrealized losses | | | 0 | | | |
| | | | | | | | |
| | Net unrealized gains | | $ | 320,176,589 | | | |
The accompanying notes are an integral part of these financial statements.
| | | | |
| 30 | | Wells Fargo Advantage Dow Jones Target Date Funds | | Portfolios of investments—August 31, 2014 (unaudited) |
TARGET 2055 FUND
| | | | | | | | | | |
| Security name | | | | | | | | Value | |
| | | | | | | | | | |
| | | | |
Investment Companies: 99.03% | | | | | | | | | | |
| | | | |
| Affiliated Master Portfolios: 99.03% | | | | | | | | | | |
Wells Fargo Advantage Diversified Fixed Income Portfolio | | | | | | | | $ | 8,370,409 | |
Wells Fargo Advantage Diversified Stock Portfolio | | | | | | | | | 130,062,572 | |
Wells Fargo Advantage Short-Term Investment Portfolio | | | | | | | | | 5,593,973 | |
| | | | |
Total Investment Companies (Cost $124,064,970) | | | | | | | | | 144,026,954 | |
| | | | | | | | | | |
| | | | | | | | |
| Total investments in securities | | | | | | | | |
| (Cost $124,064,970) * | | | 99.03 | % | | | 144,026,954 | |
Other assets and liabilities, net | | | 0.97 | | | | 1,407,737 | |
| | | | | | | | |
| Total net assets | | | 100.00 | % | | $ | 145,434,691 | |
| | | | | | | | |
| | | | | | | | |
* | | Cost for federal income tax purposes is $123,814,687 and unrealized gains (losses) consists of: |
| | Gross unrealized gains | | $ | 20,212,267 | | | |
| | Gross unrealized losses | | | 0 | | | |
| | | | | | | | |
| | Net unrealized gains | | $ | 20,212,267 | | | |
The accompanying notes are an integral part of these financial statements.
This page is intentionally left blank.
| | | | |
| 32 | | Wells Fargo Advantage Dow Jones Target Date Funds | | Statements of assets and liabilities—August 31, 2014 (unaudited) |
| | | | | | | | | | | | | | | | |
| | | Target Today
Fund | | | Target 2010
Fund | | | Target 2015 Fund | | | Target 2020 Fund | |
| | | | |
Assets | | | | | | | | | | | | | | | | |
Investments in affiliated Master Portfolios, at value (see cost below) | | $ | 808,203,415 | | | $ | 684,800,112 | | | $ | 959,080,728 | | | $ | 2,981,285,630 | |
Receivable for Fund shares sold | | | 1,050,380 | | | | 1,911,086 | | | | 1,571,747 | | | | 6,259,309 | |
Prepaid expenses and other assets | | | 32,887 | | | | 37,914 | | | | 44,689 | | | | 45,492 | |
| | | | |
Total assets | | | 809,286,682 | | | | 686,749,112 | | | | 960,697,164 | | | | 2,987,590,431 | |
| | | | |
| | | | |
Liabilities | | | | | | | | | | | | | | | | |
Payable for Fund shares redeemed | | | 1,269,753 | | | | 858,002 | | | | 1,027,827 | | | | 2,763,477 | |
Advisory fee payable | | | 29,831 | | | | 36,712 | | | | 59,156 | | | | 274,951 | |
Distribution fees payable | | | 2,690 | | | | 1,914 | | | | 6 | | | | 3,733 | |
Administration fees payable | | | 100,650 | | | | 89,090 | | | | 118,517 | | | | 354,193 | |
Shareholder report expenses payable | | | 14,059 | | | | 15,432 | | | | 12,867 | | | | 7,822 | |
Shareholder servicing fees payable | | | 75,428 | | | | 77,099 | | | | 87,901 | | | | 292,796 | |
Professional fees payable | | | 7,227 | | | | 8,192 | | | | 7,335 | | | | 7,344 | |
Accrued expenses and other liabilities | | | 552 | | | | 1,512 | | | | 1,402 | | | | 10,336 | |
| | | | |
Total liabilities | | | 1,500,190 | | | | 1,087,953 | | | | 1,315,011 | | | | 3,714,652 | |
| | | | |
Total net assets | | $ | 807,786,492 | | | $ | 685,661,159 | | | $ | 959,382,153 | | | $ | 2,983,875,779 | |
| | | | |
| | | | |
NET ASSETS CONSIST OF | | | | | | | | | | | | | | | | |
Paid-in capital | | $ | 737,584,825 | | | $ | 598,136,694 | | | $ | 843,435,418 | | | $ | 2,550,163,804 | |
Undistributed net investment income | | | 4,436,122 | | | | 3,809,576 | | | | 3,023,871 | | | | 8,182,335 | |
Accumulated net realized gains (losses) on investments | | | 1,306,523 | | | | (826,718 | ) | | | 1,575,812 | | | | (2,745,331 | ) |
Net unrealized gains on investments | | | 64,459,022 | | | | 84,541,607 | | | | 111,347,052 | | | | 428,274,971 | |
| | | | |
Total net assets | | $ | 807,786,492 | | | $ | 685,661,159 | | | $ | 959,382,153 | | | $ | 2,983,875,779 | |
| | | | |
| | | | |
COMPUTATION OF NET ASSET VALUE AND OFFERING PRICE PER SHARE | | | | | | | | | | | | | | | | |
Net assets – Class A | | $ | 16,493,469 | | | $ | 28,759,880 | | | $ | 666,390 | | | $ | 68,498,874 | |
Shares outstanding – Class A1 | | | 1,490,971 | | | | 2,112,558 | | | | 62,852 | | | | 4,398,506 | |
Net asset value per share – Class A | | | $11.06 | | | | $13.61 | | | | $10.60 | | | | $15.57 | |
Maximum offering price per share – Class A2 | | | $11.73 | | | | $14.44 | | | | $11.25 | | | | $16.52 | |
Net assets – Class B | | $ | 29,326 | | | $ | 30,514 | | | | N/A | | | $ | 169,099 | |
Shares outstanding – Class B1 | | | 2,551 | | | | 2,217 | | | | N/A | | | | 10,859 | |
Net asset value per share – Class B | | | $11.50 | | | | $13.76 | | | | N/A | | | | $15.57 | |
Net assets – Class C | | $ | 3,854,684 | | | $ | 2,829,375 | | | | N/A | | | $ | 5,586,559 | |
Shares outstanding – Class C1 | | | 341,046 | | | | 205,279 | | | | N/A | | | | 360,456 | |
Net asset value per share – Class C | | | $11.30 | | | | $13.78 | | | | N/A | | | | $15.50 | |
Net assets – Class R | | $ | 26,712 | | | $ | 26,991 | | | $ | 27,369 | | | $ | 41,585 | |
Shares outstanding – Class R1 | | | 2,418 | | | | 1,991 | | | | 2,545 | | | | 2,680 | |
Net asset value per share – Class R | | | $11.05 | | | | $13.56 | | | | $10.75 | | | | $15.52 | |
Net assets – Class R4 | | $ | 352,897,314 | | | $ | 163,977,900 | | | $ | 182,750,611 | | | $ | 784,097,878 | |
Share outstanding – Class R41 | | | 31,162,012 | | | | 11,913,438 | | | | 17,185,941 | | | | 49,492,714 | |
Net asset value per share – Class R4 | | | $11.32 | | | | $13.76 | | | | $10.63 | | | | $15.84 | |
Net assets – Class R6 | | $ | 250,581,104 | | | $ | 236,165,517 | | | $ | 446,577,413 | | | $ | 1,165,669,722 | |
Share outstanding – Class R61 | | | 22,147,411 | | | | 17,159,808 | | | | 42,038,333 | | | | 73,604,436 | |
Net asset value per share – Class R6 | | | $11.31 | | | | $13.76 | | | | $10.62 | | | | $15.84 | |
Net assets – Administrator Class | | $ | 113,192,584 | | | $ | 192,549,920 | | | $ | 208,620,741 | | | $ | 750,821,625 | |
Shares outstanding – Administrator Class1 | | | 10,026,970 | | | | 14,001,514 | | | | 19,401,343 | | | | 47,534,798 | |
Net asset value per share – Administrator Class | | | $11.29 | | | | $13.75 | | | | $10.75 | | | | $15.80 | |
Net assets – Investor Class | | $ | 70,711,299 | | | $ | 61,321,062 | | | $ | 120,739,629 | | | $ | 208,990,437 | |
Shares outstanding – Investor Class1 | | | 6,277,712 | | | | 4,472,547 | | | | 11,218,046 | | | | 13,247,517 | |
Net asset value per share – Investor Class | | | $11.26 | | | | $13.71 | | | | $10.76 | | | | $15.78 | |
| | | | |
Investments in affiliated Master Portfolios, at cost | | $ | 743,744,393 | | | $ | 600,258,505 | | | $ | 847,733,676 | | | $ | 2,553,010,659 | |
| | | | |
| 1. | Each Fund has an unlimited number of authorized shares. |
| 2. | Maximum offering price is computed as 100/94.25 of net asset value. On investments of $50,000 or more, the offering price is reduced. |
The accompanying notes are an integral part of these financial statements.
| | | | | | |
| Statements of assets and liabilities—August 31, 2014 (unaudited) | | Wells Fargo Advantage Dow Jones Target Date Funds | | | 33 | |
| | | | | | | | | | | | | | | | | | | | | | | | | | |
Target 2025 Fund | | | Target 2030 Fund | | | Target 2035 Fund | | | Target 2040 Fund | | | Target 2045 Fund | | | Target 2050 Fund | | | Target 2055 Fund | |
| | | | | | |
| | | | | | | | | | | | | | | | | | | | | | | | | | |
| $ | 2,452,903,006 | | | $ | 3,056,893,777 | | | $ | 1,389,718,627 | | | $ | 2,222,776,887 | | | $ | 768,892,362 | | | $ | 1,398,299,948 | | | $ | 144,026,954 | |
| | 4,433,883 | | | | 7,052,130 | | | | 3,350,376 | | | | 7,666,442 | | | | 3,332,099 | | | | 6,389,821 | | | | 1,480,676 | |
| | 45,913 | | | | 67,515 | | | | 36,389 | | | | 70,962 | | | | 47,537 | | | | 77,701 | | | | 50,073 | |
| | |
| | 2,457,382,802 | | | | 3,064,013,422 | | | | 1,393,105,392 | | | | 2,230,514,291 | | | | 772,271,998 | | | | 1,404,767,470 | | | | 145,557,703 | |
| | |
| | | | | | |
| | | | | | | | | | | | | | | | | | | | | | | | | | |
| | 1,992,486 | | | | 4,294,201 | | | | 512,017 | | | | 4,451,827 | | | | 272,136 | | | | 1,759,935 | | | | 81,872 | |
| | 216,889 | | | | 306,849 | | | | 144,888 | | | | 238,590 | | | | 75,122 | | | | 139,836 | | | | 2,112 | |
| | 6 | | | | 3,108 | | | | 6 | | | | 3,784 | | | | 7 | | | | 288 | | | | 7 | |
| | 271,811 | | | | 360,491 | | | | 175,515 | | | | 267,265 | | | | 97,609 | | | | 140,397 | | | | 13,131 | |
| | 4,277 | | | | 0 | | | | 4,134 | | | | 1,932 | | | | 5,108 | | | | 6,123 | | | | 11,720 | |
| | 166,824 | | | | 291,924 | | | | 124,694 | | | | 213,734 | | | | 69,777 | | | | 92,276 | | | | 5,863 | |
| | 7,189 | | | | 7,229 | | | | 7,604 | | | | 7,726 | | | | 7,600 | | | | 7,757 | | | | 7,304 | |
| | 7,045 | | | | 6,346 | | | | 2,907 | | | | 6,353 | | | | 2,801 | | | | 5,085 | | | | 1,003 | |
| | |
| | 2,666,527 | | | | 5,270,148 | | | | 971,765 | | | | 5,191,211 | | | | 530,160 | | | | 2,151,697 | | | | 123,012 | |
| | |
| $ | 2,454,716,275 | | | $ | 3,058,743,274 | | | $ | 1,392,133,627 | | | $ | 2,225,323,080 | | | $ | 771,741,838 | | | $ | 1,402,615,773 | | | $ | 145,434,691 | |
| | |
| | | | | | |
| | | | | | | | | | | | | | | | | | | | | | | | | | |
| $ | 2,000,988,270 | | | $ | 2,466,686,083 | | | $ | 1,078,147,304 | | | $ | 1,715,845,275 | | | $ | 585,980,215 | | | $ | 1,069,756,088 | | | $ | 124,451,154 | |
| | 6,107,842 | | | | 6,941,432 | | | | 3,075,709 | | | | 4,196,989 | | | | 1,639,576 | | | | 2,735,909 | | | | 390,221 | |
| | 8,892,301 | | | | 2,561,214 | | | | 5,535,359 | | | | 4,251,721 | | | | 3,430,833 | | | | 4,964,329 | | | | 631,332 | |
| | 438,727,862 | | | | 582,554,545 | | | | 305,375,255 | | | | 501,029,095 | | | | 180,691,214 | | | | 325,159,447 | | | | 19,961,984 | |
| | |
| $ | 2,454,716,275 | | | $ | 3,058,743,274 | | | $ | 1,392,133,627 | | | $ | 2,225,323,080 | | | $ | 771,741,838 | | | $ | 1,402,615,773 | | | $ | 145,434,691 | |
| | |
| | | | | | |
| | | | | | | | | | | | | | | | | | | | | | | | | | |
| $ | 2,622,021 | | | $ | 61,860,556 | | | $ | 1,085,127 | | | $ | 112,579,712 | | | $ | 506,957 | | | $ | 1,320,162 | | | $ | 396,870 | |
| | 240,410 | | | | 3,585,911 | | | | 94,475 | | | | 5,692,734 | | | | 42,324 | | | | 115,281 | | | | 29,985 | |
| | $10.91 | | | | $17.25 | | | | $11.49 | | | | $19.78 | | | | $11.98 | | | | $11.45 | | | | $13.24 | |
| | $11.58 | | | | $18.30 | | | | $12.19 | | | | $20.99 | | | | $12.71 | | | | $12.15 | | | | $14.05 | |
| | N/A | | | $ | 173,462 | | | | N/A | | | $ | 194,815 | | | | N/A | | | | N/A | | | | N/A | |
| | N/A | | | | 10,200 | | | | N/A | | | | 10,301 | | | | N/A | | | | N/A | | | | N/A | |
| | N/A | | | | $17.01 | | | | N/A | | | | $18.91 | | | | N/A | | | | N/A | | | | N/A | |
| | N/A | | | $ | 4,492,148 | | | | N/A | | | $ | 5,660,185 | | | | N/A | | | $ | 455,535 | | | | N/A | |
| | N/A | | | | 266,404 | | | | N/A | | | | 303,556 | | | | N/A | | | | 39,900 | | | | N/A | |
| | N/A | | | | $16.86 | | | | N/A | | | | $18.65 | | | | N/A | | | | $11.42 | | | | N/A | |
| $ | 28,611 | | | $ | 35,008 | | | $ | 29,755 | | | $ | 30,170 | | | $ | 30,375 | | | $ | 30,425 | | | $ | 30,437 | |
| | 2,618 | | | | 2,031 | | | | 2,574 | | | | 1,527 | | | | 2,512 | | | | 2,651 | | | | 2,320 | |
| | $10.93 | | | | $17.24 | | | | $11.56 | | | | $19.76 | | | | $12.09 | | | | $11.48 | | | | $13.12 | |
| $ | 357,294,329 | | | $ | 887,341,927 | | | $ | 310,895,560 | | | $ | 671,239,255 | | | $ | 184,343,952 | | | $ | 343,599,617 | | | $ | 27,646,870 | |
| | 32,675,331 | | | | 50,756,101 | | | | 27,036,213 | | | | 33,272,397 | | | | 15,343,345 | | | | 29,903,561 | | | | 2,082,980 | |
| | $10.93 | | | | $17.48 | | | | $11.50 | | | | $20.17 | | | | $12.01 | | | | $11.49 | | | | $13.27 | |
| $ | 1,469,138,349 | | | $ | 1,175,364,525 | | | $ | 628,806,848 | | | $ | 831,600,528 | | | $ | 337,105,825 | | | $ | 764,989,491 | | | $ | 101,155,530 | |
| | 134,434,113 | | | | 67,290,080 | | | | 54,681,309 | | | | 41,225,132 | | | | 28,102,521 | | | | 66,605,649 | | | | 7,633,168 | |
| | $10.93 | | | | $17.47 | | | | $11.50 | | | | $20.17 | | | | $12.00 | | | | $11.49 | | | | $13.25 | |
| $ | 376,855,313 | | | $ | 710,720,851 | | | $ | 250,171,233 | | | $ | 469,685,579 | | | $ | 137,255,765 | | | $ | 229,308,295 | | | $ | 10,126,995 | |
| | 34,406,647 | | | | 40,683,645 | | | | 21,694,895 | | | | 23,322,267 | | | | 11,377,128 | | | | 20,016,747 | | | | 764,795 | |
| | $10.95 | | | | $17.47 | | | | $11.53 | | | | $20.14 | | | | $12.06 | | | | $11.46 | | | | $13.24 | |
| $ | 248,777,652 | | | $ | 218,754,797 | | | $ | 201,145,104 | | | $ | 134,332,836 | | | $ | 112,498,964 | | | $ | 62,912,248 | | | $ | 6,077,989 | |
| | 22,738,595 | | | | 12,559,119 | | | | 17,380,777 | | | | 6,685,071 | | | | 9,296,735 | | | | 5,476,344 | | | | 462,988 | |
| | $10.94 | | | | $17.42 | | | | $11.57 | | | | $20.09 | | | | $12.10 | | | | $11.49 | | | | $13.13 | |
| | | | | | |
| $ | 2,014,175,144 | | | $ | 2,474,339,232 | | | $ | 1,084,343,372 | | | $ | 1,721,747,792 | | | $ | 588,201,148 | | | $ | 1,073,140,501 | | | $ | 124,064,970 | |
| | |
The accompanying notes are an integral part of these financial statements.
| | | | |
| 34 | | Wells Fargo Advantage Dow Jones Target Date Funds | | Statements of operations—six months ended August 31, 2014 (unaudited) |
| | | | | | | | | | | | | | | | |
| | | Target Today
Fund | | | Target 2010
Fund | | | Target 2015
Fund | | | Target 2020
Fund | |
| | | | |
Investment income | | | | | | | | | | | | | | | | |
Interest allocated from affiliated Master Portfolios* | | $ | 7,314,038 | | | $ | 6,576,859 | | | $ | 8,010,057 | | | $ | 19,968,506 | |
Dividends allocated from affiliated Master Portfolios** | | | 1,367,863 | | | | 1,475,278 | | | | 2,921,222 | | | | 13,019,668 | |
Affiliated income allocated from affiliated Master Portfolios | | | 54,548 | | | | 47,387 | | | | 63,975 | | | | 187,571 | |
Securities lending income allocated from affiliated Master Portfolios | | | 38,306 | | | | 40,880 | | | | 78,708 | | | | 342,960 | |
Expenses allocated from affiliated Master Portfolios | | | (640,223 | ) | | | (565,039 | ) | | | (770,189 | ) | | | (2,339,972 | ) |
| | | | |
Total investment income | | | 8,134,532 | | | | 7,575,365 | | | | 10,303,773 | | | | 31,178,733 | |
| | | | |
| | | | |
Expenses | | | | | | | | | | | | | | | | |
Advisory fee | | | 981,543 | | | | 859,945 | | | | 1,155,644 | | | | 3,225,204 | |
Administration fees | | | | | | | | | | | | | | | | |
Fund level | | | 202,479 | | | | 176,045 | | | | 240,327 | | | | 732,094 | |
Class A | | | 21,835 | | | | 38,970 | | | | 464 | | | | 91,799 | |
Class B | | | 47 | | | | 105 | | | | N/A | | | | 235 | |
Class C | | | 5,358 | | | | 3,852 | | | | N/A | | | | 6,936 | |
Class R | | | 35 | | | | 35 | | | | 35 | | | | 47 | |
Class R4 | | | 144,182 | | | | 69,950 | | | | 75,131 | | | | 313,421 | |
Class R6 | | | 36,248 | | | | 35,629 | | | | 66,301 | | | | 167,840 | |
Administrator Class | | | 57,554 | | | | 98,837 | | | | 104,500 | | | | 374,023 | |
Investor Class | | | 114,756 | | | | 97,697 | | | | 195,344 | | | | 322,675 | |
Shareholder servicing fees | | | | | | | | | | | | | | | | |
Class A | | | 20,996 | | | | 37,472 | | | | 446 | | | | 88,269 | |
Class B | | | 45 | | | | 101 | | | | N/A | | | | 227 | |
Class C | | | 5,152 | | | | 3,704 | | | | N/A | | | | 6,669 | |
Class R | | | 33 | | | | 33 | | | | 34 | | | | 46 | |
Class R4 | | | 179,846 | | | | 86,620 | | | | 91,886 | | | | 388,505 | |
Administrator Class | | | 143,884 | | | | 247,091 | | | | 261,249 | | | | 934,794 | |
Investor Class | | | 89,653 | | | | 76,326 | | | | 152,612 | | | | 252,088 | |
Distribution fees | | | | | | | | | | | | | | | | |
Class B | | | 135 | | | | 301 | | | | N/A | | | | 680 | |
Class C | | | 15,455 | | | | 11,112 | | | | N/A | | | | 20,008 | |
Class R | | | 33 | | | | 33 | | | | 34 | | | | 46 | |
Custody and accounting fees | | | 16,050 | | | | 13,327 | | | | 18,954 | | | | 55,463 | |
Professional fees | | | 16,016 | | | | 15,031 | | | | 15,905 | | | | 15,901 | |
Registration fees | | | 41,830 | | | | 50,047 | | | | 70,142 | | | | 79,640 | |
Shareholder report expenses | | | 15,639 | | | | 12,975 | | | | 18,373 | | | | 34,602 | |
Trustees’ fees and expenses | | | 4,443 | | | | 6,012 | | | | 4,694 | | | | 4,696 | |
Other fees and expenses | | | 10,355 | | | | 9,405 | | | | 11,292 | | | | 23,094 | |
| | | | |
Total expenses | | | 2,123,602 | | | | 1,950,655 | | | | 2,483,367 | | | | 7,139,002 | |
Less: Fee waivers and/or expense reimbursements | | | (807,221 | ) | | | (645,234 | ) | | | (817,911 | ) | | | (1,677,930 | ) |
| | | | |
Net expenses | | | 1,316,381 | | | | 1,305,421 | | | | 1,665,456 | | | | 5,461,072 | |
| | | | |
Net investment income | | | 6,818,151 | | | | 6,269,944 | | | | 8,638,317 | | | | 25,717,661 | |
| | | | |
| | | | |
REALIZED AND UNREALIZED GAINS (LOSSES) ON INVESTMENTS | | | | | | | | | | | | | | | | |
Net realized gains on securities transaction allocated from affiliated Master Portfolios | | | 1,225,997 | | | | 1,929,446 | | | | 1,422,931 | | | | 5,313,968 | |
Net change in unrealized gains (losses) on securities transactions allocated from affiliated Master Portfolios | | | 11,719,343 | | | | 10,585,017 | | | | 18,948,258 | | | | 71,136,196 | |
| | | | |
Net realized and unrealized gains (losses) on investments | | | 12,945,340 | | | | 12,514,463 | | | | 20,371,189 | | | | 76,450,164 | |
| | | | |
Net increase in net assets resulting from operations | | $ | 19,763,491 | | | $ | 18,784,407 | | | $ | 29,009,506 | | | $ | 102,167,825 | |
| | | | |
| | | | |
* Net of foreign interest withholding taxes allocated from affiliated Master Portfolios in the amount of | | | $108,788 | | | | $101,739 | | | | $181,079 | | | | $806,769 | |
** Net of foreign dividend withholding taxes allocated from affiliated Master Portfolios in the amount of | | | $84,603 | | | | $91,553 | | | | $122,075 | | | | $300,944 | |
The accompanying notes are an integral part of these financial statements.
| | | | | | |
| Statements of operations—six months ended August 31, 2014 (unaudited) | | Wells Fargo Advantage Dow Jones Target Date Funds | | | 35 | |
| | | | | | | | | | | | | | | | | | | | | | | | | | |
Target 2025
Fund | | | Target 2030
Fund | | | Target 2035
Fund | | | Target 2040
Fund | | | Target 2045
Fund | | | Target 2050
Fund | | | Target 2055
Fund | |
| | | | | | |
| | | | | | | | | | | | | | | | | | | | | | | | | | |
| $ | 12,646,335 | | | $ | 11,118,167 | | | $ | 3,313,510 | | | $ | 3,087,690 | | | $ | 640,279 | | | $ | 990,890 | | | $ | 94,770 | |
| | 14,140,429 | | | | 21,468,831 | | | | 11,490,837 | | | | 20,098,762 | | | | 7,359,668 | | | | 13,370,343 | | | | 1,271,374 | |
| | 144,676 | | | | 168,640 | | | | 71,997 | | | | 109,446 | | | | 36,698 | | | | 66,265 | | | | 6,825 | |
| | 367,806 | | | | 554,226 | | | | 295,486 | | | | 514,879 | | | | 188,392 | | | | 341,669 | | | | 32,295 | |
| | (1,913,132 | ) | | | (2,344,332 | ) | | | (1,071,490 | ) | | | (1,686,907 | ) | | | (583,875 | ) | | | (1,049,005 | ) | | | (100,346 | ) |
| | |
| | 25,386,114 | | | | 30,965,532 | | | | 14,100,340 | | | | 22,123,870 | | | | 7,641,162 | | | | 13,720,162 | | | | 1,304,918 | |
| | |
| | | | | | |
| | | | | | | | | | | | | | | | | | | | | | | | | | |
| | 2,671,934 | | | | 3,247,661 | | | | 1,570,028 | | | | 2,389,444 | | | | 899,917 | | | | 1,544,534 | | | | 158,657 | |
| | | | | | | | | | | | | | | | | | | | | | | | | | |
| | 600,363 | | | | 737,627 | | | | 338,004 | | | | 533,103 | | | | 184,735 | | | | 331,934 | | | | 31,731 | |
| | 2,424 | | | | 81,716 | | | | 857 | | | | 146,105 | | | | 364 | | | | 954 | | | | 284 | |
| | N/A | | | | 289 | | | | N/A | | | | 311 | | | | N/A | | | | N/A | | | | N/A | |
| | N/A | | | | 5,781 | | | | N/A | | | | 6,846 | | | | N/A | | | | 416 | | | | N/A | |
| | 36 | | | | 39 | | | | 38 | | | | 38 | | | | 38 | | | | 38 | | | | 38 | |
| | 144,180 | | | | 344,913 | | | | 123,653 | | | | 258,681 | | | | 71,807 | | | | 129,886 | | | | 9,776 | |
| | 214,940 | | | | 167,032 | | | | 90,279 | | | | 117,235 | | | | 47,373 | | | | 108,818 | | | | 13,214 | |
| | 180,734 | | | | 348,352 | | | | 120,343 | | | | 228,961 | | | | 65,269 | | | | 107,838 | | | | 4,433 | |
| | 391,531 | | | | 336,664 | | | | 319,435 | | | | 205,277 | | | | 180,403 | | | | 97,302 | | | | 8,449 | |
| | | | | | | | | | | | | | | | | | | | | | | | | | |
| | 2,331 | | | | 78,573 | | | | 824 | | | | 140,485 | | | | 350 | | | | 917 | | | | 273 | |
| | N/A | | | | 278 | | | | N/A | | | | 300 | | | | N/A | | | | N/A | | | | N/A | |
| | N/A | | | | 5,559 | | | | N/A | | | | 6,583 | | | | N/A | | | | 400 | | | | N/A | |
| | 35 | | | | 37 | | | | 36 | | | | 37 | | | | 37 | | | | 37 | | | | 37 | |
| | 177,651 | | | | 427,428 | | | | 151,812 | | | | 320,864 | | | | 88,372 | | | | 161,707 | | | | 12,220 | |
| | 451,834 | | | | 870,880 | | | | 300,859 | | | | 572,402 | | | | 163,173 | | | | 269,596 | | | | 10,869 | |
| | 305,883 | | | | 263,019 | | | | 249,558 | | | | 160,372 | | | | 140,940 | | | | 76,017 | | | | 6,601 | |
| | | | | | | | | | | | | | | | | | | | | | | | | | |
| | N/A | | | | 834 | | | | N/A | | | | 899 | | | | N/A | | | | N/A | | | | N/A | |
| | N/A | | | | 16,676 | | | | N/A | | | | 19,749 | | | | N/A | | | | 1,201 | | | | N/A | |
| | 35 | | | | 37 | | | | 36 | | | | 37 | | | | 37 | | | | 37 | | | | 37 | |
| | 45,501 | | | | 55,866 | | | | 25,493 | | | | 40,449 | | | | 14,529 | | | | 25,934 | | | | 2,843 | |
| | 16,044 | | | | 16,014 | | | | 15,566 | | | | 15,504 | | | | 15,575 | | | | 16,476 | | | | 15,687 | |
| | 82,465 | | | | 83,657 | | | | 60,661 | | | | 78,478 | | | | 48,608 | | | | 66,855 | | | | 41,453 | |
| | 26,908 | | | | 30,627 | | | | 18,483 | | | | 27,754 | | | | 16,034 | | | | 20,154 | | | | 5,876 | |
| | 4,696 | | | | 4,696 | | | | 6,414 | | | | 4,441 | | | | 4,469 | | | | 6,414 | | | | 5,756 | |
| | 21,357 | | | | 27,621 | | | | 11,315 | | | | 16,013 | | | | 5,982 | | | | 13,230 | | | | 1,901 | |
| | |
| | 5,340,882 | | | | 7,151,876 | | | | 3,403,694 | | | | 5,290,368 | | | | 1,948,012 | | | | 2,980,695 | | | | 330,135 | |
| | (1,458,529 | ) | | | (1,540,365 | ) | | | (760,100 | ) | | | (1,065,299 | ) | | | (485,239 | ) | | | (778,140 | ) | | | (146,566 | ) |
| | |
| | 3,882,353 | | | | 5,611,511 | | | | 2,643,594 | | | | 4,225,069 | | | | 1,462,773 | | | | 2,202,555 | | | | 183,569 | |
| | |
| | 21,503,761 | | | | 25,354,021 | | | | 11,456,746 | | | | 17,898,801 | | | | 6,178,389 | | | | 11,517,607 | | | | 1,121,349 | |
| | |
| | | | | | |
| | | | | | | | | | | | | | | | | | | | | | | | | | |
| | | | | | |
| | 4,472,891 | | | | 5,149,967 | | | | 2,535,480 | | | | 3,837,782 | | | | 1,355,484 | | | | 2,374,130 | | | | 65,873 | |
| | | | | | |
| | 70,185,127 | | | | 101,501,654 | | | | 52,087,643 | | | | 89,409,213 | | | | 32,331,549 | | | | 59,231,983 | | | | 6,098,734 | |
| | |
| | 74,658,018 | | | | 106,651,621 | | | | 54,623,123 | | | | 93,246,995 | | | | 33,687,033 | | | | 61,606,113 | | | | 6,164,607 | |
| | |
| $ | 96,161,779 | | | $ | 132,005,642 | | | $ | 66,079,869 | | | $ | 111,145,796 | | | $ | 39,865,422 | | | $ | 73,123,720 | | | $ | 7,285,956 | |
| | |
| | | | | | |
| | $875,527 | | | | $1,328,679 | | | | $711,324 | | | | $1,243,470 | | | | $455,080 | | | | $14,045 | | | | $1,288 | |
| | | | | | |
| | $188,474 | | | | $164,288 | | | | $48,531 | | | | $44,489 | | | | $9,058 | | | | $826,310 | | | | $78,046 | |
The accompanying notes are an integral part of these financial statements.
| | | | |
| 36 | | Wells Fargo Advantage Dow Jones Target Date Funds | | Statements of changes in net assets |
| | | | | | | | | | | | | | | | |
| | | Target Today Fund | |
| | | Six months ended
August 31, 2014 (unaudited) | | | Year ended
February 28, 2014 | |
| | | | |
Operations | | | | | | | | | | | | | | | | |
Net investment income | | | | | | $ | 6,818,151 | | | | | | | $ | 14,119,597 | |
Net realized gains on investments | | | | | | | 1,225,997 | | | | | | | | 8,682,816 | |
Net change in unrealized gains (losses) on investments | | | | | | | 11,719,343 | | | | | | | | 1,063,802 | |
| | | | |
Net increase in net assets resulting from operations | | | | | | | 19,763,491 | | | | | | | | 23,866,215 | |
| | | | |
| | | | |
Distributions to shareholders from | | | | | | | | | | | | | | | | |
Net investment income | | | | | | | | | | | | | | | | |
Class A | | | | | | | (65,716 | ) | | | | | | | (221,471 | ) |
Class B | | | | | | | (78 | ) | | | | | | | (175 | ) |
Class C | | | | | | | (8,515 | ) | | | | | | | (17,109 | ) |
Class R | | | | | | | (86 | ) | | | | | | | (141 | )1 |
Class R4 | | | | | | | (1,603,294 | ) | | | | | | | (5,817,304 | ) |
Class R62 | | | | | | | (1,100,688 | ) | | | | | | | (4,363,729 | ) |
Administrator Class | | | | | | | (463,087 | ) | | | | | | | (1,652,726 | ) |
Investor Class | | | | | | | (259,626 | ) | | | | | | | (1,019,076 | ) |
Net realized gains | | | | | | | | | | | | | | | | |
Class A | | | | | | | 0 | | | | | | | | (235,169 | ) |
Class B | | | | | | | 0 | | | | | | | | (836 | ) |
Class C | | | | | | | 0 | | | | | | | | (55,391 | ) |
Class R | | | | | | | 0 | | | | | | | | (339 | )1 |
Class R4 | | | | | | | 0 | | | | | | | | (4,756,127 | ) |
Class R62 | | | | | | | 0 | | | | | | | | (3,049,103 | ) |
Administrator Class | | | | | | | 0 | | | | | | | | (1,508,581 | ) |
Investor Class | | | | | | | 0 | | | | | | | | (956,544 | ) |
| | | | |
Total distributions to shareholders | | | | | | | (3,501,090 | ) | | | | | | | (23,653,821 | ) |
| | | | |
| | | | |
Capital share transactions | | | Shares | | | | | | | | Shares | | | | | |
Proceeds from shares sold | | | | | | | | | | | | | | | | |
Class A | | | 57,961 | | | | 635,362 | | | | 65,901 | | | | 708,822 | |
Class B | | | 0 | | | | 0 | | | | 1,199 | | | | 13,415 | |
Class C | | | 10,516 | | | | 117,748 | | | | 42,423 | | | | 469,925 | |
Class R | | | 0 | | | | 0 | | | | 2,365 | 1 | | | 25,000 | 1 |
Class R4 | | | 2,649,897 | | | | 29,610,503 | | | | 40,044,322 | | | | 443,504,825 | |
Class R62 | | | 4,390,089 | | | | 48,934,435 | | | | 9,419,589 | | | | 103,495,757 | |
Administrator Class | | | 961,916 | | | | 10,716,830 | | | | 2,977,611 | | | | 32,656,347 | |
Investor Class | | | 866,290 | | | | 9,599,723 | | | | 1,345,823 | | | | 14,802,612 | |
| | | | |
| | | | | | | 99,614,601 | | | | | | | | 595,676,703 | |
| | | | |
Reinvestment of distributions | | | | | | | | | | | | | | | | |
Class A | | | 5,925 | | | | 63,807 | | | | 41,970 | | | | 445,973 | |
Class B | | | 7 | | | | 78 | | | | 91 | | | | 1,011 | |
Class C | | | 719 | | | | 7,933 | | | | 6,430 | | | | 70,009 | |
Class R | | | 8 | | | | 86 | | | | 45 | 1 | | | 480 | 1 |
Class R4 | | | 145,153 | | | | 1,598,130 | | | | 971,366 | | | | 10,544,661 | |
Class R62 | | | 100,136 | | | | 1,100,495 | | | | 684,137 | | | | 7,411,486 | |
Administrator Class | | | 42,067 | | | | 461,901 | | | | 291,198 | | | | 3,153,750 | |
Investor Class | | | 23,610 | | | | 259,006 | | | | 182,457 | | | | 1,971,286 | |
| | | | |
| | | | | | | 3,491,436 | | | | | | | | 23,598,656 | |
| | | | |
Please see footnotes on page 37.
The accompanying notes are an integral part of these financial statements.
| | | | | | |
| Statements of changes in net assets | | Wells Fargo Advantage Dow Jones Target Date Funds | | | 37 | |
| | | | | | | | | | | | | | | | |
| | | Target Today Fund | |
| | | Six months ended
August 31, 2014
(unaudited) | | | Year ended
February 28, 2014 | |
| | | | |
Capital share transactions (continued) | | | Shares | | | | | | | | Shares | | | | | |
Payment for shares redeemed | | | | | | | | | | | | | | | | |
Class A | | | (182,193 | ) | | $ | (1,984,778 | ) | | | (326,131 | ) | | $ | (3,497,069 | ) |
Class B | | | (1,935 | ) | | | (21,891 | ) | | | (6,375 | ) | | | (71,529 | ) |
Class C | | | (55,932 | ) | | | (626,878 | ) | | | (109,050 | ) | | | (1,198,485 | ) |
Class R4 | | | (4,717,174 | ) | | | (52,743,523 | ) | | | (8,208,872 | ) | | | (89,929,968 | ) |
Class R62 | | | (3,445,577 | ) | | | (38,395,751 | ) | | | (49,652,297 | ) | | | (549,066,240 | ) |
Administrator Class | | | (1,533,027 | ) | | | (17,070,316 | ) | | | (5,359,301 | ) | | | (58,759,727 | ) |
Investor Class | | | (1,202,485 | ) | | | (13,340,886 | ) | | | (4,694,452 | ) | | | (51,323,539 | ) |
| | | | |
| | | | | | | (124,184,023 | ) | | | | | | | (753,846,557 | ) |
| | | | |
Net decrease in net assets resulting from capital share transactions | | | | | | | (21,077,986 | ) | | | | | | | (134,571,198 | ) |
| | | | |
Total decrease in net assets | | | | | | | (4,815,585 | ) | | | | | | | (134,358,804 | ) |
| | | | |
| | | | |
Net assets | | | | | | | | | | | | | | | | |
Beginning of period | | | | | | | 812,602,077 | | | | | | | | 946,960,881 | |
| | | | |
End of period | | | | | | $ | 807,786,492 | | | | | | | $ | 812,602,077 | |
| | | | |
Undistributed net investment income | | | | | | $ | 4,436,122 | | | | | | | $ | 1,119,061 | |
| | | | |
| 1. | For the period from June 28, 2013 (commencement of class operations) to February 28, 2014 |
| 2. | On June 1, 2013, Institutional Class was renamed Class R6. |
The accompanying notes are an integral part of these financial statements.
| | | | |
| 38 | | Wells Fargo Advantage Dow Jones Target Date Funds | | Statements of changes in net assets |
| | | | | | | | | | | | | | | | |
| | | Target 2010 Fund | |
| | | Six months ended
August 31, 2014
(unaudited) | | | Year ended February 28, 2014 | |
| | | | |
Operations | | | | | | | | | | | | | | | | |
Net investment income | | | | | | $ | 6,269,944 | | | | | | | $ | 13,355,509 | |
Net realized gains on investments | | | | | | | 1,929,446 | | | | | | | | 14,076,090 | |
Net change in unrealized gains (losses) on investments | | | | | | | 10,585,017 | | | | | | | | 3,291,595 | |
| | | | |
Net increase in net assets resulting from operations | | | | | | | 18,784,407 | | | | | | | | 30,723,194 | |
| | | | |
| | | | |
Distributions to shareholders from | | | | | | | | | | | | | | | | |
Net investment income | | | | | | | | | | | | | | | | |
Class A | | | | | | | (128,497 | ) | | | | | | | (420,087 | ) |
Class B | | | | | | | (215 | ) | | | | | | | (569 | ) |
Class C | | | | | | | (7,632 | ) | | | | | | | (13,585 | ) |
Class R | | | | | | | (97 | ) | | | | | | | (356 | )1 |
Class R4 | | | | | | | (879,221 | ) | | | | | | | (3,475,371 | ) |
Class R62 | | | | | | | (1,221,365 | ) | | | | | | | (4,452,553 | ) |
Administrator Class | | | | | | | (872,941 | ) | | | | | | | (3,008,539 | ) |
Investor Class | | | | | | | (242,019 | ) | | | | | | | (738,857 | ) |
Net realized gains | | | | | | | | | | | | | | | | |
Class A | | | | | | | 0 | | | | | | | | (743,622 | ) |
Class B | | | | | | | 0 | | | | | | | | (3,992 | ) |
Class C | | | | | | | 0 | | | | | | | | (65,273 | ) |
Class R | | | | | | | 0 | | | | | | | | (586 | )1 |
Class R4 | | | | | | | 0 | | | | | | | | (4,648,601 | ) |
Class R62 | | | | | | | 0 | | | | | | | | (5,398,326 | ) |
Administrator Class | | | | | | | 0 | | | | | | | | (4,635,950 | ) |
Investor Class | | | | | | | 0 | | | | | | | | (1,316,593 | ) |
| | | | |
Total distributions to shareholders | | | | | | | (3,351,987 | ) | | | | | | | (28,922,860 | ) |
| | | | |
| | | | |
Capital share transactions | | | Shares | | | | | | | | Shares | | | | | |
Proceeds from shares sold | | | | | | | | | | | | | | | | |
Class A | | | 56,556 | | | | 756,999 | | | | 186,965 | | | | 2,491,029 | |
Class B | | | 0 | | | | 0 | | | | 3,363 | | | | 44,329 | |
Class C | | | 25,703 | | | | 347,207 | | | | 25,945 | | | | 349,596 | |
Class R | | | 0 | | | | 0 | | | | 1,912 | 1 | | | 25,000 | 1 |
Class R4 | | | 1,261,005 | | | | 17,067,568 | | | | 18,932,424 | | | | 254,451,944 | |
Class R62 | | | 2,273,394 | | | | 30,753,748 | | | | 6,718,727 | | | | 90,118,259 | |
Administrator Class | | | 1,047,593 | | | | 14,156,213 | | | | 3,536,386 | | | | 47,359,770 | |
Investor Class | | | 556,570 | | | | 7,511,625 | | | | 1,096,534 | | | | 14,613,247 | |
| | | | |
| | | | | | | 70,593,360 | | | | | | | | 409,453,174 | |
| | | | |
Reinvestment of distributions | | | | | | | | | | | | | | | | |
Class A | | | 9,499 | | | | 125,480 | | | | 86,893 | | | | 1,139,249 | |
Class B | | | 16 | | | | 215 | | | | 345 | | | | 4,557 | |
Class C | | | 549 | | | | 7,370 | | | | 5,799 | | | | 76,934 | |
Class R | | | 7 | | | | 97 | | | | 72 | 1 | | | 942 | 1 |
Class R4 | | | 65,615 | | | | 875,301 | | | | 611,034 | | | | 8,094,076 | |
Class R62 | | | 91,537 | | | | 1,220,182 | | | | 743,043 | | | | 9,841,864 | |
Administrator Class | | | 65,438 | | | | 872,941 | | | | 577,304 | | | | 7,644,489 | |
Investor Class | | | 18,136 | | | | 241,394 | | | | 155,233 | | | | 2,049,385 | |
| | | | |
| | | | | | | 3,342,980 | | | | | | | | 28,851,496 | |
| | | | |
Please see footnotes on page 39.
The accompanying notes are an integral part of these financial statements.
| | | | | | |
| Statements of changes in net assets | | Wells Fargo Advantage Dow Jones Target Date Funds | | | 39 | |
| | | | | | | | | | | | | | | | |
| | | Target 2010 Fund | |
| | | Six months ended
August 31, 2014
(unaudited) | | | Year ended February 28, 2014 | |
| | | | |
Capital share transactions (continued) | | | Shares | | | | | | | | Shares | | | | | |
Payment for shares redeemed | | | | | | | | | | | | | | | | |
Class A | | | (355,474 | ) | | $ | (4,754,928 | ) | | | (613,342 | ) | | $ | (8,128,647 | ) |
Class B | | | (6,550 | ) | | | (88,803 | ) | | | (20,384 | ) | | | (272,691 | ) |
Class C | | | (39,247 | ) | | | (533,299 | ) | | | (55,929 | ) | | | (751,971 | ) |
Class R4 | | | (4,230,339 | ) | | | (57,218,836 | ) | | | (5,139,968 | ) | | | (68,558,326 | ) |
Class R62 | | | (3,210,416 | ) | | | (43,384,725 | ) | | | (25,658,126 | ) | | | (344,966,121 | ) |
Administrator Class | | | (2,061,129 | ) | | | (27,918,402 | ) | | | (7,120,077 | ) | | | (95,456,027 | ) |
Investor Class | | | (601,238 | ) | | | (8,123,033 | ) | | | (1,541,753 | ) | | | (20,603,446 | ) |
| | | | |
| | | | | | | (142,022,026 | ) | | | | | | | (538,737,229 | ) |
| | | | |
Net decrease in net assets resulting from capital share transactions | | | | | | | (68,085,686 | ) | | | | | | | (100,432,559 | ) |
| | | | |
Total decrease in net assets | | | | | | | (52,653,266 | ) | | | | | | | (98,632,225 | ) |
| | | | |
| | | | |
Net assets | | | | | | | | | | | | | | | | |
Beginning of period | | | | | | | 738,314,425 | | | | | | | | 836,946,650 | |
| | | | |
End of period | | | | | | $ | 685,661,159 | | | | | | | $ | 738,314,425 | |
| | | | |
Undistributed net investment income | | | | | | $ | 3,809,576 | | | | | | | $ | 891,619 | |
| | | | |
| 1. | For the period from June 28, 2013 (commencement of class operations) to February 28, 2014 |
| 2. | On June 1, 2013, Institutional Class was renamed Class R6. |
The accompanying notes are an integral part of these financial statements.
| | | | |
| 40 | | Wells Fargo Advantage Dow Jones Target Date Funds | | Statements of changes in net assets |
| | | | | | | | | | | | | | | | |
| | | Target 2015 Fund | |
| | | Six months ended
August 31, 2014
(unaudited) | | | Year ended
February 28, 2014 | |
| | | | |
Operations | | | | | | | | | | | | | | | | |
Net investment income | | | | | | $ | 8,638,317 | | | | | | | $ | 16,643,519 | |
Net realized gains on investments | | | | | | | 1,422,931 | | | | | | | | 11,759,028 | |
Net change in unrealized gains (losses) on investments | | | | | | | 18,948,258 | | | | | | | | 26,231,734 | |
| | | | |
Net increase in net assets resulting from operations | | | | | | | 29,009,506 | | | | | | | | 54,634,281 | |
| | | | |
| | | | |
Distributions to shareholders from | | | | | | | | | | | | | | | | |
Net investment income | | | | | | | | | | | | | | | | |
Class A | | | | | | | (2,389 | ) | | | | | | | (1,472 | ) |
Class R | | | | | | | (151 | ) | | | | | | | (121 | )1 |
Class R4 | | | | | | | (1,593,745 | ) | | | | | | | (1,872,389 | ) |
Class R62 | | | | | | | (4,011,515 | ) | | | | | | | (8,668,426 | ) |
Administrator Class | | | | | | | (1,558,546 | ) | | | | | | | (2,619,376 | ) |
Investor Class | | | | | | | (795,065 | ) | | | | | | | (1,915,991 | ) |
Net realized gains | | | | | | | | | | | | | | | | |
Class A | | | | | | | 0 | | | | | | | | (3,136 | ) |
Class R | | | | | | | 0 | | | | | | | | (403 | )1 |
Class R4 | | | | | | | 0 | | | | | | | | (2,830,275 | ) |
Class R62 | | | | | | | 0 | | | | | | | | (6,755,256 | ) |
Administrator Class | | | | | | | 0 | | | | | | | | (2,930,526 | ) |
Investor Class | | | | | | | 0 | | | | | | | | (1,886,766 | ) |
| | | | |
Total distributions to shareholders | | | | | | | (7,961,411 | ) | | | | | | | (29,484,137 | ) |
| | | | |
| | | | |
Capital share transactions | | | Shares | | | | | | | | Shares | | | | | |
Proceeds from shares sold | | | | | | | | | | | | | | | | |
Class A | | | 35,949 | | | | 379,967 | | | | 30,534 | | | | 310,034 | |
Class R | | | 0 | | | | 0 | | | | 2,480 | 1 | | | 25,000 | 1 |
Class R4 | | | 2,276,414 | | | | 23,825,453 | | | | 22,186,745 | | | | 226,451,576 | |
Class R62 | | | 5,452,424 | | | | 56,940,033 | | | | 13,146,464 | | | | 133,987,804 | |
Administrator Class | | | 1,640,442 | | | | 17,317,042 | | | | 5,756,165 | | | | 59,448,415 | |
Investor Class | | | 2,517,743 | | | | 26,555,754 | | | | 4,076,014 | | | | 42,086,072 | |
| | | | |
| | | | | | | 125,018,249 | | | | | | | | 462,308,901 | |
| | | | |
Reinvestment of distributions | | | | | | | | | | | | | | | | |
Class A | | | 213 | | | | 2,201 | | | | 455 | | | | 4,608 | |
Class R | | | 14 | | | | 151 | | | | 51 | 1 | | | 523 | 1 |
Class R4 | | | 149,203 | | | | 1,548,045 | | | | 451,357 | | | | 4,565,772 | |
Class R62 | | | 386,732 | | | | 4,007,502 | | | | 1,522,530 | | | | 15,372,352 | |
Administrator Class | | | 148,431 | | | | 1,557,231 | | | | 542,194 | | | | 5,544,864 | |
Investor Class | | | 75,738 | | | | 791,199 | | | | 371,511 | | | | 3,796,948 | |
| | | | |
| | | | | | | 7,906,329 | | | | | | | | 29,285,067 | |
| | | | |
Payment for shares redeemed | | | | | | | | | | | | | | | | |
Class A | | | (5,300 | ) | | | (55,794 | ) | | | (2 | ) | | | (20 | ) |
Class R4 | | | (3,413,236 | ) | | | (35,813,572 | ) | | | (4,722,416 | ) | | | (47,893,656 | ) |
Class R62 | | | (5,908,463 | ) | | | (61,707,899 | ) | | | (33,194,972 | ) | | | (338,474,671 | ) |
Administrator Class | | | (2,531,883 | ) | | | (26,738,505 | ) | | | (5,102,619 | ) | | | (52,590,045 | ) |
Investor Class | | | (2,997,467 | ) | | | (31,661,213 | ) | | | (12,383,089 | ) | | | (127,689,010 | ) |
| | | | |
| | | | | | | (155,976,983 | ) | | | | | | | (566,647,402 | ) |
| | | | |
Net decrease in net assets resulting from capital share transactions | | | | | | | (23,052,405 | ) | | | | | | | (75,053,434 | ) |
| | | | |
Total decrease in net assets | | | | | | | (2,004,310 | ) | | | | | | | (49,903,290 | ) |
| | | | |
| | | | |
Net assets | | | | | | | | | | | | | | | | |
Beginning of period | | | | | | | 961,386,463 | | | | | | | | 1,011,289,753 | |
| | | | |
End of period | | | | | | $ | 959,382,153 | | | | | | | $ | 961,386,463 | |
| | | | |
Undistributed net investment income | | | | | | $ | 3,023,871 | | | | | | | $ | 2,346,965 | |
| | | | |
| 1. | For the period from June 28, 2013 (commencement of class operations) to February 28, 2014 |
| 2. | On June 1, 2013, Institutional Class was renamed Class R6. |
The accompanying notes are an integral part of these financial statements.
| | | | | | |
| Statements of changes in net assets | | Wells Fargo Advantage Dow Jones Target Date Funds | | | 41 | |
| | | | | | | | | | | | | | | | |
| | | Target 2020 Fund | |
| | | Six months ended
August 31, 2014
(unaudited) | | | Year ended
February 28, 2014 | |
| | | | |
Operations | | | | | | | | | | | | | | | | |
Net investment income | | | | | | $ | 25,717,661 | | | | | | | $ | 45,018,203 | |
Net realized gains on investments | | | | | | | 5,313,968 | | | | | | | | 62,921,001 | |
Net change in unrealized gains (losses) on investments | | | | | | | 71,136,196 | | | | | | | | 116,854,570 | |
| | | | |
Net increase in net assets resulting from operations | | | | | | | 102,167,825 | | | | | | | | 224,793,774 | |
| | | | |
| | | | |
Distributions to shareholders from | | | | | | | | | | | | | | | | |
Net investment income | | | | | | | | | | | | | | | | |
Class A | | | | | | | (349,081 | ) | | | | | | | (848,095 | ) |
Class B | | | | | | | (128 | ) | | | | | | | 0 | |
Class C | | | | | | | (10,656 | ) | | | | | | | (26,330 | ) |
Class R | | | | | | | (206 | ) | | | | | | | (328 | )1 |
Class R4 | | | | | | | (5,409,965 | ) | | | | | | | (11,995,972 | ) |
Class R62 | | | | | | | (8,562,426 | ) | | | | | | | (16,490,821 | ) |
Administrator Class | | | | | | | (4,483,650 | ) | | | | | | | (8,943,484 | ) |
Investor Class | | | | | | | (1,045,249 | ) | | | | | | | (2,097,428 | ) |
Net realized gains | | | | | | | | | | | | | | | | |
Class A | | | | | | | 0 | | | | | | | | (1,931,750 | ) |
Class B | | | | | | | 0 | | | | | | | | (7,082 | ) |
Class C | | | | | | | 0 | | | | | | | | (136,823 | ) |
Class R | | | | | | | 0 | | | | | | | | (673 | )1 |
Class R4 | | | | | | | 0 | | | | | | | | (19,990,722 | ) |
Class R62 | | | | | | | 0 | | | | | | | | (25,396,743 | ) |
Administrator Class | | | | | | | 0 | | | | | | | | (17,581,975 | ) |
Investor Class | | | | | | | 0 | | | | | | | | (4,694,484 | ) |
| | | | |
Total distributions to shareholders | | | | | | | (19,861,361 | ) | | | | | | | (110,142,710 | ) |
| | | | |
| | | | |
Capital share transactions | | | Shares | | | | | | | | Shares | | | | | |
Proceeds from shares sold | | | | | | | | | | | | | | | | |
Class A | | | 216,890 | | | | 3,305,174 | | | | 381,332 | | | | 5,665,364 | |
Class B | | | 1,217 | | | | 18,882 | | | | 7,689 | | | | 115,370 | |
Class C | | | 60,865 | | | | 921,933 | | | | 95,488 | | | | 1,408,791 | |
Class R | | | 872 | | | | 13,211 | | | | 1,727 | 1 | | | 25,000 | 1 |
Class R4 | | | 6,846,734 | | | | 106,582,128 | | | | 61,845,368 | | | | 933,243,115 | |
Class R62 | | | 10,812,853 | | | | 168,113,113 | | | | 25,893,661 | | | | 390,548,771 | |
Administrator Class | | | 3,647,861 | | | | 56,490,668 | | | | 11,485,723 | | | | 173,180,938 | |
Investor Class | | | 2,087,499 | | | | 32,311,747 | | | | 3,325,177 | | | | 50,141,197 | |
| | | | |
| | | | | | | 367,756,856 | | | | | | | | 1,554,328,546 | |
| | | | |
Reinvestment of distributions | | | | | | | | | | | | | | | | |
Class A | | | 21,941 | | | | 337,897 | | | | 182,740 | | | | 2,705,853 | |
Class B | | | 8 | | | | 128 | | | | 482 | | | | 7,082 | |
Class C | | | 648 | | | | 9,943 | | | | 10,470 | | | | 153,948 | |
Class R | | | 13 | | | | 206 | | | | 68 | 1 | | | 1,001 | 1 |
Class R4 | | | 340,408 | | | | 5,330,786 | | | | 2,096,194 | | | | 31,585,843 | |
Class R62 | | | 546,647 | | | | 8,555,032 | | | | 2,777,511 | | | | 41,847,708 | |
Administrator Class | | | 287,017 | | | | 4,483,209 | | | | 1,765,757 | | | | 26,520,064 | |
Investor Class | | | 66,877 | | | | 1,043,286 | | | | 452,006 | | | | 6,779,910 | |
| | | | |
| | | | | | | 19,760,487 | | | | | | | | 109,601,409 | |
| | | | |
Please see footnotes on page 42.
The accompanying notes are an integral part of these financial statements.
| | | | |
| 42 | | Wells Fargo Advantage Dow Jones Target Date Funds | | Statements of changes in net assets |
| | | | | | | | | | | | | | | | |
| | | Target 2020 Fund | |
| | | Six months ended
August 31, 2014
(unaudited) | | | Year ended
February 28, 2014 | |
| | | | |
Capital share transactions (continued) | | | Shares | | | | | | | | Shares | | | | | |
Payment for shares redeemed | | | | | | | | | | | | | | | | |
Class A | | | (850,511 | ) | | $ | (12,935,370 | ) | | | (695,637 | ) | | $ | (10,358,666 | ) |
Class B | | | (6,085 | ) | | | (92,470 | ) | | | (33,856 | ) | | | (496,951 | ) |
Class C | | | (46,407 | ) | | | (702,359 | ) | | | (72,151 | ) | | | (1,067,554 | ) |
Class R4 | | | (9,835,371 | ) | | | (152,942,206 | ) | | | (13,361,264 | ) | | | (202,124,932 | ) |
Class R62 | | | (6,954,275 | ) | | | (108,115,861 | ) | | | (68,157,904 | ) | | | (1,028,360,308 | ) |
Administrator Class | | | (5,029,648 | ) | | | (77,950,931 | ) | | | (11,344,715 | ) | | | (171,003,496 | ) |
Investor Class | | | (1,501,927 | ) | | | (23,270,484 | ) | | | (2,988,908 | ) | | | (45,095,889 | ) |
| | | | |
| | | | | | | (376,009,681 | ) | | | | | | | (1,458,507,796 | ) |
| | | | |
Net increase in net assets resulting from capital share transactions | | | | | | | 11,507,662 | | | | | | | | 205,422,159 | |
| | | | |
Total increase in net assets | | | | | | | 93,814,126 | | | | | | | | 320,073,223 | |
| | | | |
| | | | |
Net assets | | | | | | | | | | | | | | | | |
Beginning of period | | | | | | | 2,890,061,653 | | | | | | | | 2,569,988,430 | |
| | | | |
End of period | | | | | | $ | 2,983,875,779 | | | | | | | $ | 2,890,061,653 | |
| | | | |
Undistributed net investment income | | | | | | $ | 8,182,335 | | | | | | | $ | 2,326,035 | |
| | | | |
| 1. | For the period from June 28, 2013 (commencement of class operations) to February 28, 2014 |
| 2. | On June 1, 2013, Institutional Class was renamed Class R6. |
The accompanying notes are an integral part of these financial statements.
| | | | | | |
| Statements of changes in net assets | | Wells Fargo Advantage Dow Jones Target Date Funds | | | 43 | |
| | | | | | | | | | | | | | | | |
| | | Target 2025 Fund | |
| | | Six months ended August 31, 2014 (unaudited) | | | Year ended February 28, 2014 | |
| | | | |
Operations | | | | | | | | | | | | | | | | |
Net investment income | | | | | | $ | 21,503,761 | | | | | | | $ | 37,642,278 | |
Net realized gains on investments | | | | | | | 4,472,891 | | | | | | | | 64,593,224 | |
Net change in unrealized gains (losses) on investments | | | | | | | 70,185,127 | | | | | | | | 141,573,121 | |
| | | | |
Net increase in net assets resulting from operations | | | | | | | 96,161,779 | | | | | | | | 243,808,623 | |
| | | | |
| | | | |
Distributions to shareholders from | | | | | | | | | | | | | | | | |
Net investment income | | | | | | | | | | | | | | | | |
Class A | | | | | | | (9,825 | ) | | | | | | | (7,226 | ) |
Class R | | | | | | | (112 | ) | | | | | | | (151 | )1 |
Class R4 | | | | | | | (2,488,250 | ) | | | | | | | (3,928,874 | ) |
Class R62 | | | | | | | (10,729,559 | ) | | | | | | | (24,006,569 | ) |
Administrator Class | | | | | | | (2,124,499 | ) | | | | | | | (4,044,987 | ) |
Investor Class | | | | | | | (1,224,327 | ) | | | | | | | (3,423,839 | ) |
Net realized gains | | | | | | | | | | | | | | | | |
Class A | | | | | | | 0 | | | | | | | | (25,245 | ) |
Class R | | | | | | | 0 | | | | | | | | (829 | )1 |
Class R4 | | | | | | | 0 | | | | | | | | (10,223,463 | ) |
Class R62 | | | | | | | 0 | | | | | | | | (42,604,116 | ) |
Administrator Class | | | | | | | 0 | | | | | | | | (9,739,683 | ) |
Investor Class | | | | | | | 0 | | | | | | | | (7,057,112 | ) |
| | | | |
Total distributions to shareholders | | | | | | | (16,576,572 | ) | | | | | | | (105,062,094 | ) |
| | | | |
| | | | |
Capital share transactions | | | Shares | | | | | | | | Shares | | | | | |
Proceeds from shares sold | | | | | | | | | | | | | | | | |
Class A | | | 126,414 | | | | 1,350,650 | | | | 113,377 | | | | 1,171,607 | |
Class R | | | 0 | | | | 0 | | | | 2,513 | 1 | | | 25,000 | 1 |
Class R4 | | | 6,003,049 | | | | 64,292,857 | | | | 39,680,782 | | | | 407,782,676 | |
Class R62 | | | 11,717,715 | | | | 125,232,833 | | | | 25,675,029 | | | | 263,320,679 | |
Administrator Class | | | 2,866,359 | | | | 30,687,305 | | | | 9,015,723 | | | | 92,999,031 | |
Investor Class | | | 5,210,971 | | | | 55,451,689 | | | | 9,032,104 | | | | 92,517,461 | |
| | | | |
| | | | | | | 277,015,334 | | | | | | | | 857,816,454 | |
| | | | |
Reinvestment of distributions | | | | | | | | | | | | | | | | |
Class A | | | 816 | | | | 8,679 | | | | 3,181 | | | | 32,471 | |
Class R | | | 10 | | | | 112 | | | | 95 | 1 | | | 980 | 1 |
Class R4 | | | 223,510 | | | | 2,379,351 | | | | 1,324,321 | | | | 13,531,626 | |
Class R62 | | | 1,008,160 | | | | 10,720,068 | | | | 6,525,712 | | | | 66,498,781 | |
Administrator Class | | | 199,167 | | | | 2,124,499 | | | | 1,347,162 | | | | 13,784,670 | |
Investor Class | | | 114,799 | | | | 1,223,068 | | | | 1,028,723 | | | | 10,474,958 | |
| | | | |
| | | | | | | 16,455,777 | | | | | | | | 104,323,486 | |
| | | | |
Payment for shares redeemed | | | | | | | | | | | | | | | | |
Class A | | | (17,432 | ) | | | (185,983 | ) | | | (1,900 | ) | | | (19,969 | ) |
Class R4 | | | (7,024,109 | ) | | | (75,414,945 | ) | | | (7,954,405 | ) | | | (81,226,361 | ) |
Class R62 | | | (11,583,064 | ) | | | (123,561,513 | ) | | | (57,249,274 | ) | | | (588,311,107 | ) |
Administrator Class | | | (2,064,516 | ) | | | (22,041,258 | ) | | | (4,161,001 | ) | | | (42,888,028 | ) |
Investor Class | | | (4,943,860 | ) | | | (52,724,174 | ) | | | (25,548,837 | ) | | | (263,230,570 | ) |
| | | | |
| | | | | | | (273,927,873 | ) | | | | | | | (975,676,035 | ) |
| | | | |
Net increase (decrease) in net assets resulting from capital share transactions | | | | | | | 19,543,238 | | | | | | | | (13,536,095 | ) |
| | | | |
Total increase in net assets | | | | | | | 99,128,445 | | | | | | | | 125,210,434 | |
| | | | |
| | | | |
Net assets | | | | | | | | | | | | | | | | |
Beginning of period | | | | | | | 2,355,587,830 | | | | | | | | 2,230,377,396 | |
| | | | |
End of period | | | | | | $ | 2,454,716,275 | | | | | | | $ | 2,355,587,830 | |
| | | | |
Undistributed net investment income | | | | | | $ | 6,107,842 | | | | | | | $ | 1,180,653 | |
| | | | |
| 1. | For the period from June 28, 2013 (commencement of class operations) to February 28, 2014 |
| 2. | On June 1, 2013, Institutional Class was renamed Class R6. |
The accompanying notes are an integral part of these financial statements.
| | | | |
| 44 | | Wells Fargo Advantage Dow Jones Target Date Funds | | Statements of changes in net assets |
| | | | | | | | | | | | | | | | |
| | | Target 2030 Fund | |
| | | Six months ended August 31, 2014 (unaudited) | | | Year ended February 28, 2014 | |
| | | | |
Operations | | | | | | | | | | | | | | | | |
Net investment income | | | | | | $ | 25,354,021 | | | | | | | $ | 40,255,984 | |
Net realized gains on investments | | | | | | | 5,149,967 | | | | | | | | 83,191,358 | |
Net change in unrealized gains (losses) on investments | | | | | | | 101,501,654 | | | | | | | | 213,867,560 | |
| | | | |
Net increase in net assets resulting from operations | | | | | | | 132,005,642 | | | | | | | | 337,314,902 | |
| | | | |
| | | | |
Distributions to shareholders from | | | | | | | | | | | | | | | | |
Net investment income | | | | | | | | | | | | | | | | |
Class A | | | | | | | (298,099 | ) | | | | | | | (753,808 | ) |
Class B | | | | | | | (33 | ) | | | | | | | (1,322 | ) |
Class C | | | | | | | (9,728 | ) | | | | | | | (18,981 | ) |
Class R | | | | | | | (128 | ) | | | | | | | (145 | )1 |
Class R4 | | | | | | | (5,759,665 | ) | | | | | | | (10,506,452 | ) |
Class R62 | | | | | | | (8,181,982 | ) | | | | | | | (17,254,545 | ) |
Administrator Class | | | | | | | (3,971,208 | ) | | | | | | | (8,239,275 | ) |
Investor Class | | | | | | | (1,025,263 | ) | | | | | | | (2,107,127 | ) |
Net realized gains | | | | | | | | | | | | | | | | |
Class A | | | | | | | 0 | | | | | | | | (2,145,006 | ) |
Class B | | | | | | | 0 | | | | | | | | (9,608 | ) |
Class C | | | | | | | 0 | | | | | | | | (127,152 | ) |
Class R | | | | | | | 0 | | | | | | | | (883 | )1 |
Class R4 | | | | | | | 0 | | | | | | | | (26,616,234 | ) |
Class R62 | | | | | | | 0 | | | | | | | | (31,425,726 | ) |
Administrator Class | | | | | | | 0 | | | | | | | | (20,595,520 | ) |
Investor Class | | | | | | | 0 | | | | | | | | (6,080,463 | ) |
| | | | |
Total distributions to shareholders | | | | | | | (19,246,106 | ) | | | | | | | (125,882,247 | ) |
| | | | |
| | | | |
Capital share transactions | | | Shares | | | | | | | | Shares | | | | | |
Proceeds from shares sold | | | | | | | | | | | | | | | | |
Class A | | | 165,349 | | | | 2,773,480 | | | | 331,644 | | | | 5,341,788 | |
Class B | | | 1,388 | | | | 22,742 | | | | 2,188 | | | | 34,029 | |
Class C | | | 38,028 | | | | 622,768 | | | | 67,915 | | | | 1,062,508 | |
Class R | | | 335 | | | | 5,691 | | | | 1,624 | 1 | | | 25,000 | 1 |
Class R4 | | | 7,752,625 | | | | 132,225,713 | | | | 59,309,204 | | | | 957,805,590 | |
Class R62 | | | 10,279,602 | | | | 174,832,661 | | | | 25,555,483 | | | | 412,411,956 | |
Administrator Class | | | 3,840,364 | | | | 65,307,861 | | | | 10,722,176 | | | | 173,822,315 | |
Investor Class | | | 1,847,978 | | | | 31,337,547 | | | | 3,592,266 | | | | 58,138,567 | |
| | | | |
| | | | | | | 407,128,463 | | | | | | | | 1,608,641,753 | |
| | | | |
Reinvestment of distributions | | | | | | | | | | | | | | | | |
Class A | | | 16,706 | | | | 284,168 | | | | 175,867 | | | | 2,802,729 | |
Class B | | | 2 | | | | 33 | | | | 690 | | | | 10,837 | |
Class C | | | 568 | | | | 9,461 | | | | 9,165 | | | | 143,233 | |
Class R | | | 8 | | | | 128 | | | | 64 | 1 | | | 1,028 | 1 |
Class R4 | | | 327,252 | | | | 5,638,560 | | | | 2,254,868 | | | | 36,426,981 | |
Class R62 | | | 473,826 | | | | 8,154,546 | | | | 3,009,497 | | | | 48,437,168 | |
Administrator Class | | | 230,606 | | | | 3,971,037 | | | | 1,786,991 | | | | 28,833,518 | |
Investor Class | | | 59,614 | | | | 1,024,173 | | | | 507,909 | | | | 8,173,431 | |
| | | | |
| | | | | | | 19,082,106 | | | | | | | | 124,828,925 | |
| | | | |
Please see footnotes on page 45.
The accompanying notes are an integral part of these financial statements.
| | | | | | |
| Statements of changes in net assets | | Wells Fargo Advantage Dow Jones Target Date Funds | | | 45 | |
| | | | | | | | | | | | | | | | |
| | | Target 2030 Fund | |
| | | Six months ended August 31, 2014 (unaudited) | | | Year ended February 28, 2014 | |
| | | | |
Capital share transactions (continued) | | | Shares | | | | | | | | Shares | | | | | |
Payment for shares redeemed | | | | | | | | | | | | | | | | |
Class A | | | (547,400 | ) | | $ | (9,148,073 | ) | | | (531,200 | ) | | $ | (8,566,705 | ) |
Class B | | | (8,930 | ) | | | (147,487 | ) | | | (15,867 | ) | | | (246,816 | ) |
Class C | | | (24,263 | ) | | | (402,628 | ) | | | (56,044 | ) | | | (890,332 | ) |
Class R4 | | | (7,880,152 | ) | | | (134,248,445 | ) | | | (12,270,195 | ) | | | (199,466,650 | ) |
Class R62 | | | (5,857,216 | ) | | | (99,698,838 | ) | | | (61,584,877 | ) | | | (992,955,497 | ) |
Administrator Class | | | (4,136,290 | ) | | | (70,435,089 | ) | | | (8,724,794 | ) | | | (141,601,556 | ) |
Investor Class | | | (1,361,445 | ) | | | (23,157,281 | ) | | | (2,344,121 | ) | | | (37,966,958 | ) |
| | | | |
| | | | | | | (337,237,841 | ) | | | | | | | (1,381,694,514 | ) |
| | | | |
Net increase in net assets resulting from capital share transactions | | | | | | | 88,972,728 | | | | | | | | 351,776,164 | |
| | | | |
Total increase in net assets | | | | | | | 201,732,264 | | | | | | | | 563,208,819 | |
| | | | |
| | | | |
Net assets | | | | | | | | | | | | | | | | |
Beginning of period | | | | | | | 2,857,011,010 | | | | | | | | 2,293,802,191 | |
| | | | |
End of period | | | | | | $ | 3,058,743,274 | | | | | | | $ | 2,857,011,010 | |
| | | | |
Undistributed net investment income | | | | | | $ | 6,941,432 | | | | | | | $ | 833,517 | |
| | | | |
| 1. | For the period from June 28, 2013 (commencement of class operations) to February 28, 2014 |
| 2. | On June 1, 2013, Institutional Class was renamed Class R6. |
The accompanying notes are an integral part of these financial statements.
| | | | |
| 46 | | Wells Fargo Advantage Dow Jones Target Date Funds | | Statements of changes in net assets |
| | | | | | | | | | | | | | | | |
| | | Target 2035 Fund | |
| | | Six months ended
August 31, 2014
(unaudited) | | | Year ended
February 28, 2014 | |
| | | | |
Operations | | | | | | | | | | | | | | | | |
Net investment income | | | | | | $ | 11,456,746 | | | | | | | $ | 18,232,663 | |
Net realized gains on investments | | | | | | | 2,535,480 | | | | | | | | 40,792,425 | |
Net change in unrealized gains (losses) on investments | | | | | | | 52,087,643 | | | | | | | | 123,107,143 | |
| | | | |
Net increase in net assets resulting from operations | | | | | | | 66,079,869 | | | | | | | | 182,132,231 | |
| | | | |
| | | | |
Distributions to shareholders from | | | | | | | | | | | | | | | | |
Net investment income | | | | | | | | | | | | | | | | |
Class A | | | | | | | (3,414 | ) | | | | | | | (1,313 | ) |
Class R | | | | | | | (110 | ) | | | | | | | (146 | )1 |
Class R4 | | | | | | | (2,052,057 | ) | | | | | | | (3,045,599 | ) |
Class R62 | | | | | | | (4,336,265 | ) | | | | | | | (9,292,853 | ) |
Administrator Class | | | | | | | (1,348,942 | ) | | | | | | | (2,618,775 | ) |
Investor Class | | | | | | | (933,329 | ) | | | | | | | (2,752,692 | ) |
Net realized gains | | | | | | | | | | | | | | | | |
Class A | | | | | | | 0 | | | | | | | | (8,537 | ) |
Class R | | | | | | | 0 | | | | | | | | (961 | )1 |
Class R4 | | | | | | | 0 | | | | | | | | (9,598,764 | ) |
Class R62 | | | | | | | 0 | | | | | | | | (18,937,078 | ) |
Administrator Class | | | | | | | 0 | | | | | | | | (7,463,212 | ) |
Investor Class | | | | | | | 0 | | | | | | | | (6,459,798 | ) |
| | | | |
Total distributions to shareholders | | | | | | | (8,674,117 | ) | | | | | | | (60,179,728 | ) |
| | | | |
| | | | |
Capital share transactions | | | Shares | | | | | | | | Shares | | | | | |
Proceeds from shares sold | | | | | | | | | | | | | | | | |
Class A | | | 53,027 | | | | 598,055 | | | | 50,687 | | | | 543,909 | |
Class R | | | 0 | | | | 0 | | | | 2,460 | 1 | | | 25,000 | 1 |
Class R4 | | | 5,063,301 | | | | 56,666,560 | | | | 30,965,261 | | | | 326,263,128 | |
Class R62 | | | 8,608,577 | | | | 96,077,760 | | | | 18,746,064 | | | | 197,025,603 | |
Administrator Class | | | 2,106,695 | | | | 23,529,167 | | | | 6,528,515 | | | | 69,163,434 | |
Investor Class | | | 3,804,909 | | | | 42,476,492 | | | | 6,621,217 | | | | 69,840,903 | |
| | | | |
| | | | | | | 219,348,034 | | | | | | | | 662,861,977 | |
| | | | |
Reinvestment of distributions | | | | | | | | | | | | | | | | |
Class A | | | 305 | | | | 3,414 | | | | 931 | | | | 9,850 | |
Class R | | | 10 | | | | 110 | | | | 104 | 1 | | | 1,107 | 1 |
Class R4 | | | 173,905 | | | | 1,944,221 | | | | 1,134,557 | | | | 11,975,355 | |
Class R62 | | | 384,657 | | | | 4,296,459 | | | | 2,655,958 | | | | 27,917,096 | |
Administrator Class | | | 120,273 | | | | 1,348,942 | | | | 953,950 | | | | 10,081,987 | |
Investor Class | | | 82,508 | | | | 929,784 | | | | 871,772 | | | | 9,194,844 | |
| | | | |
| | | | | | | 8,522,930 | | | | | | | | 59,180,239 | |
| | | | |
Payment for shares redeemed | | | | | | | | | | | | | | | | |
Class A | | | (7,176 | ) | | | (78,398 | ) | | | (7,392 | ) | | | (78,342 | ) |
Class R4 | | | (5,192,354 | ) | | | (58,366,456 | ) | | | (5,302,659 | ) | | | (55,733,386 | ) |
Class R62 | | | (6,054,576 | ) | | | (67,657,236 | ) | | | (34,578,765 | ) | | | (364,266,333 | ) |
Administrator Class | | | (1,894,106 | ) | | | (21,127,390 | ) | | | (3,380,366 | ) | | | (35,699,097 | ) |
Investor Class | | | (3,960,999 | ) | | | (44,503,147 | ) | | | (20,902,940 | ) | | | (222,879,942 | ) |
| | | | |
| | | | | | | (191,732,627 | ) | | | | | | | (678,657,100 | ) |
| | | | |
Net increase in net assets resulting from capital share transactions | | | | | | | 36,138,337 | | | | | | | | 43,385,116 | |
| | | | |
Total increase in net assets | | | | | | | 93,544,089 | | | | | | | | 165,337,619 | |
| | | | |
| | | | |
Net assets | | | | | | | | | | | | | | | | |
Beginning of period | | | | | | | 1,298,589,538 | | | | | | | | 1,133,251,919 | |
| | | | |
End of period | | | | | | $ | 1,392,133,627 | | | | | | | $ | 1,298,589,538 | |
| | | | |
Undistributed net investment income | | | | | | $ | 3,075,709 | | | | | | | $ | 293,080 | |
| | | | |
| 1. | For the period from June 28, 2013 (commencement of class operations) to February 28, 2014 |
| 2. | On June 1, 2013, Institutional Class was renamed Class R6. |
The accompanying notes are an integral part of these financial statements.
| | | | | | |
| Statements of changes in net assets | | Wells Fargo Advantage Dow Jones Target Date Funds | | | 47 | |
| | | | | | | | | | | | | | | | |
| | | Target 2040 Fund | |
| | | Six months ended
August 31, 2014
(unaudited) | | | Year ended
February 28, 2014 | |
| | | | |
Operations | | | | | | | | | | | | | | | | |
Net investment income | | | | | | $ | 17,898,801 | | | | | | | $ | 26,808,352 | |
Net realized gains on investments | | | | | | | 3,837,782 | | | | | | | | 70,738,587 | |
Net change in unrealized gains (losses) on investments | | | | | | | 89,409,213 | | | | | | | | 202,146,445 | |
| | | | |
Net increase in net assets resulting from operations | | | | | | | 111,145,796 | | | | | | | | 299,693,384 | |
| | | | |
| | | | |
Distributions to shareholders from | | | | | | | | | | | | | | | | |
Net investment income | | | | | | | | | | | | | | | | |
Class A | | | | | | | (535,965 | ) | | | | | | | (1,249,141 | ) |
Class B | | | | | | | (41 | ) | | | | | | | (1,369 | ) |
Class C | | | | | | | (12,701 | ) | | | | | | | (22,264 | ) |
Class R | | | | | | | (115 | ) | | | | | | | (145 | )1 |
Class R4 | | | | | | | (4,166,930 | ) | | | | | | | (8,687,334 | ) |
Class R62 | | | | | | | (5,586,703 | ) | | | | | | | (10,187,015 | ) |
Administrator Class | | | | | | | (2,533,318 | ) | | | | | | | (5,232,524 | ) |
Investor Class | | | | | | | (608,444 | ) | | | | | | | (1,165,069 | ) |
Net realized gains | | | | | | | | | | | | | | | | |
Class A | | | | | | | 0 | | | | | | | | (4,314,692 | ) |
Class B | | | | | | | 0 | | | | | | | | (17,629 | ) |
Class C | | | | | | | 0 | | | | | | | | (182,291 | ) |
Class R | | | | | | | 0 | | | | | | | | (1,058 | )1 |
Class R4 | | | | | | | 0 | | | | | | | | (23,015,224 | ) |
Class R62 | | | | | | | 0 | | | | | | | | (25,143,406 | ) |
Administrator Class | | | | | | | 0 | | | | | | | | (16,072,193 | ) |
Investor Class | | | | | | | 0 | | | | | | | | (4,180,142 | ) |
| | | | |
Total distributions to shareholders | | | | | | | (13,444,217 | ) | | | | | | | (99,471,496 | ) |
| | | | |
| | | | |
Capital share transactions | | | Shares | | | | | | | | Shares | | | | | |
Proceeds from shares sold | | | | | | | | | | | | | | | | |
Class A | | | 106,564 | | | | 2,031,505 | | | | 314,725 | | | | 5,707,950 | |
Class B | | | 2,234 | | | | 40,962 | | | | 4,478 | | | | 77,549 | |
Class C | | | 51,856 | | | | 931,786 | | | | 73,135 | | | | 1,251,963 | |
Class R | | | 0 | | | | 0 | | | | 1,454 | 1 | | | 25,000 | 1 |
Class R4 | | | 5,266,556 | | | | 103,021,495 | | | | 37,995,130 | | | | 694,786,592 | |
Class R62 | | | 7,635,611 | | | | 149,163,050 | | | | 17,335,713 | | | | 317,174,208 | |
Administrator Class | | | 2,722,994 | | | | 53,085,694 | | | | 6,918,087 | | | | 126,930,235 | |
Investor Class | | | 1,244,949 | | | | 24,143,864 | | | | 2,255,008 | | | | 41,425,696 | |
| | | | |
| | | | | | | 332,418,356 | | | | | | | | 1,187,379,193 | |
| | | | |
Reinvestment of distributions | | | | | | | | | | | | | | | | |
Class A | | | 26,908 | | | | 523,362 | | | | 303,660 | | | | 5,465,678 | |
Class B | | | 2 | | | | 39 | | | | 1,068 | | | | 18,474 | |
Class C | | | 670 | | | | 12,313 | | | | 11,548 | | | | 196,937 | |
Class R | | | 7 | | | | 115 | | | | 66 | 1 | | | 1,203 | 1 |
Class R4 | | | 202,474 | | | | 4,015,072 | | | | 1,669,778 | | | | 30,608,589 | |
Class R62 | | | 280,788 | | | | 5,565,211 | | | | 1,919,410 | | | | 35,170,537 | |
Administrator Class | | | 127,939 | | | | 2,533,189 | | | | 1,162,659 | | | | 21,303,576 | |
Investor Class | | | 30,713 | | | | 607,178 | | | | 292,062 | | | | 5,342,839 | |
| | | | |
| | | | | | | 13,256,479 | | | | | | | | 98,107,833 | |
| | | | |
Please see footnotes on page 48.
The accompanying notes are an integral part of these financial statements.
| | | | |
| 48 | | Wells Fargo Advantage Dow Jones Target Date Funds | | Statements of changes in net assets |
| | | | | | | | | | | | | | | | |
| | | Target 2040 Fund | |
| | | Six months ended
August 31, 2014
(unaudited) | | | Year ended
February 28, 2014 | |
| | | | |
Capital share transactions (continued) | | | Shares | | | | | | | | Shares | | | | | |
Payment for shares redeemed | | | | | | | | | | | | | | | | |
Class A | | | (483,739 | ) | | $ | (9,213,553 | ) | | | (771,510 | ) | | $ | (13,994,022 | ) |
Class B | | | (10,988 | ) | | | (200,406 | ) | | | (32,641 | ) | | | (554,904 | ) |
Class C | | | (18,637 | ) | | | (338,280 | ) | | | (67,116 | ) | | | (1,130,102 | ) |
Class R4 | | | (5,147,501 | ) | | | (100,605,717 | ) | | | (7,505,844 | ) | | | (139,005,076 | ) |
Class R62 | | | (4,298,137 | ) | | | (84,046,765 | ) | | | (39,273,128 | ) | | | (717,215,596 | ) |
Administrator Class | | | (3,037,462 | ) | | | (59,295,809 | ) | | | (5,520,196 | ) | | | (101,231,819 | ) |
Investor Class | | | (825,771 | ) | | | (16,129,593 | ) | | | (1,359,490 | ) | | | (24,914,511 | ) |
| | | | |
| | | | | | | (269,830,123 | ) | | | | | | | (998,046,030 | ) |
| | | | |
Net increase in net assets resulting from capital share transactions | | | | | | | 75,844,712 | | | | | | | | 287,440,996 | |
| | | | |
Total increase in net assets | | | | | | | 173,546,291 | | | | | | | | 487,662,884 | |
| | | | |
| | | | |
Net assets | | | | | | | | | | | | | | | | |
Beginning of period | | | | | | | 2,051,776,789 | | | | | | | | 1,564,113,905 | |
| | | | |
End of period | | | | | | $ | 2,225,323,080 | | | | | | | $ | 2,051,776,789 | |
| | | | |
Undistributed (overdistributed) net investment income | | | | | | $ | 4,196,989 | | | | | | | $ | (257,595 | ) |
| | | | |
| 1. | For the period from June 28, 2013 (commencement of class operations) to February 28, 2014 |
| 2. | On June 1, 2013, Institutional Class was renamed Class R6. |
The accompanying notes are an integral part of these financial statements.
| | | | | | |
| Statements of changes in net assets | | Wells Fargo Advantage Dow Jones Target Date Funds | | | 49 | |
| | | | | | | | | | | | | | | | |
| | | Target 2045 Fund | |
| | | Six months ended August 31, 2014 (unaudited) | | | Year ended February 28, 2014 | |
| | | | |
Operations | | | | | | | | | | | | | | | | |
Net investment income | | | | | | $ | 6,178,389 | | | | | | | $ | 9,335,908 | |
Net realized gains on investments | | | | | | | 1,355,484 | | | | | | | | 24,679,343 | |
Net change in unrealized gains (losses) on investments | | | | | | | 32,331,549 | | | | | | | | 77,537,929 | |
| | | | |
Net increase in net assets resulting from operations | | | | | | | 39,865,422 | | | | | | | | 111,553,180 | |
| | | | |
| | | | |
Distributions to shareholders from | | | | | | | | | | | | | | | | |
Net investment income | | | | | | | | | | | | | | | | |
Class A | | | | | | | (1,430 | ) | | | | | | | (610 | ) |
Class R | | | | | | | (114 | ) | | | | | | | (145 | )1 |
Class R4 | | | | | | | (1,166,597 | ) | | | | | | | (1,885,715 | ) |
Class R62 | | | | | | | (2,244,047 | ) | | | | | | | (4,464,186 | ) |
Administrator Class | | | | | | | (719,606 | ) | | | | | | | (1,344,736 | ) |
Investor Class | | | | | | | (511,836 | ) | | | | | | | (1,619,215 | ) |
Net realized gains | | | | | | | | | | | | | | | | |
Class A | | | | | | | 0 | | | | | | | | (3,345 | ) |
Class R | | | | | | | 0 | | | | | | | | (1,074 | )1 |
Class R4 | | | | | | | 0 | | | | | | | | (6,285,965 | ) |
Class R62 | | | | | | | 0 | | | | | | | | (10,492,142 | ) |
Administrator Class | | | | | | | 0 | | | | | | | | (4,267,535 | ) |
Investor Class | | | | | | | 0 | | | | | | | | (4,047,659 | ) |
| | | | |
Total distributions to shareholders | | | | | | | (4,643,630 | ) | | | | | | | (34,412,327 | ) |
| | | | |
| | | | |
Capital share transactions | | | Shares | | | | | | | | Shares | | | | | |
Proceeds from shares sold | | | | | | | | | | | | | | | | |
Class A | | | 31,201 | | | | 363,305 | | | | 13,113 | | | | 146,324 | |
Class R | | | 0 | | | | 0 | | | | 2,392 | 1 | | | 25,000 | 1 |
Class R4 | | | 3,179,694 | | | | 37,014,110 | | | | 17,678,020 | | | | 191,966,356 | |
Class R62 | | | 6,300,850 | | | | 73,135,525 | | | | 12,559,086 | | | | 136,282,053 | |
Administrator Class | | | 1,379,838 | | | | 16,085,271 | | | | 3,813,799 | | | | 41,792,561 | |
Investor Class | | | 2,372,360 | | | | 27,633,780 | | | | 5,025,015 | | | | 54,655,093 | |
| | | | |
| | | | | | | 154,231,991 | | | | | | | | 424,867,387 | |
| | | | |
Reinvestment of distributions | | | | | | | | | | | | | | | | |
Class A | | | 122 | | | | 1,430 | | | | 361 | | | | 3,955 | |
Class R | | | 10 | | | | 114 | | | | 110 | 1 | | | 1,219 | 1 |
Class R4 | | | 95,378 | | | | 1,112,956 | | | | 716,178 | | | | 7,822,173 | |
Class R62 | | | 192,585 | | | | 2,242,768 | | | | 1,375,388 | | | | 14,935,305 | |
Administrator Class | | | 61,313 | | | | 719,606 | | | | 512,517 | | | | 5,612,271 | |
Investor Class | | | 43,413 | | | | 511,762 | | | | 519,969 | | | | 5,665,832 | |
| | | | |
| | | | | | | 4,588,636 | | | | | | | | 34,040,755 | |
| | | | |
Payment for shares redeemed | | | | | | | | | | | | | | | | |
Class A | | | (3,607 | ) | | | (41,612 | ) | | | (139 | ) | | | (1,526 | ) |
Class R4 | | | (3,163,209 | ) | | | (36,845,604 | ) | | | (3,285,143 | ) | | | (35,801,148 | ) |
Class R62 | | | (3,848,085 | ) | | | (44,640,049 | ) | | | (20,376,807 | ) | | | (220,646,049 | ) |
Administrator Class | | | (1,057,195 | ) | | | (12,320,432 | ) | | | (1,699,798 | ) | | | (18,525,010 | ) |
Investor Class | | | (2,700,938 | ) | | | (31,690,835 | ) | | | (13,323,334 | ) | | | (147,299,430 | ) |
| | | | |
| | | | | | | (125,538,532 | ) | | | | | | | (422,273,163 | ) |
| | | | |
Net increase in net assets resulting from capital share transactions | | | | | | | 33,282,095 | | | | | | | | 36,634,979 | |
| | | | |
Total increase in net assets | | | | | | | 68,503,887 | | | | | | | | 113,775,832 | |
| | | | |
| | | | |
Net assets | | | | | | | | | | | | | | | | |
Beginning of period | | | | | | | 703,237,951 | | | | | | | | 589,462,119 | |
| | | | |
End of period | | | | | | $ | 771,741,838 | | | | | | | $ | 703,237,951 | |
| | | | |
Undistributed net investment income | | | | | | $ | 1,639,576 | | | | | | | $ | 104,817 | |
| | | | |
| 1. | For the period from June 28, 2013 (commencement of class operations) to February 28, 2014 |
| 2. | On June 1, 2013, Institutional Class was renamed Class R6. |
The accompanying notes are an integral part of these financial statements.
| | | | |
| 50 | | Wells Fargo Advantage Dow Jones Target Date Funds | | Statements of changes in net assets |
| | | | | | | | | | | | | | | | |
| | | Target 2050 Fund | |
| | | Six months ended August 31, 2014 (unaudited) | | | Year ended February 28, 2014 | |
| | | | |
Operations | | | | | | | | | | | | | | | | |
Net investment income | | | | | | $ | 11,517,607 | | | | | | | $ | 16,884,882 | |
Net realized gains on investments | | | | | | | 2,374,130 | | | | | | | | 45,429,823 | |
Net change in unrealized gains (losses) on investments | | | | | | | 59,231,983 | | | | | | | | 130,295,644 | |
| | | | |
Net increase in net assets resulting from operations | | | | | | | 73,123,720 | | | | | | | | 192,610,349 | |
| | | | |
| | | | |
Distributions to shareholders from | | | | | | | | | | | | | | | | |
Net investment income | | | | | | | | | | | | | | | | |
Class A | | | | | | | (6,091 | ) | | | | | | | (645 | ) |
Class C | | | | | | | (1,231 | ) | | | | | | | (182 | ) |
Class R | | | | | | | (109 | ) | | | | | | | (145 | )1 |
Class R4 | | | | | | | (2,076,473 | ) | | | | | | | (3,438,176 | ) |
Class R62 | | | | | | | (5,106,683 | ) | | | | | | | (10,603,275 | ) |
Administrator Class | | | | | | | (1,204,195 | ) | | | | | | | (2,195,687 | ) |
Investor Class | | | | | | | (281,911 | ) | | | | | | | (552,152 | ) |
Net realized gains | | | | | | | | | | | | | | | | |
Class A | | | | | | | 0 | | | | | | | | (3,757 | ) |
Class C | | | | | | | 0 | | | | | | | | (1,770 | ) |
Class R | | | | | | | 0 | | | | | | | | (1,096 | )1 |
Class R4 | | | | | | | 0 | | | | | | | | (11,544,946 | ) |
Class R62 | | | | | | | 0 | | | | | | | | (25,762,292 | ) |
Administrator Class | | | | | | | 0 | | | | | | | | (7,268,750 | ) |
Investor Class | | | | | | | 0 | | | | | | | | (2,117,703 | ) |
| | | | |
Total distributions to shareholders | | | | | | | (8,676,693 | ) | | | | | | | (63,490,576 | ) |
| | | | |
| | | | |
Capital share transactions | | | Shares | | | | | | | | Shares | | | | | |
Proceeds from shares sold | | | | | | | | | | | | | | | | |
Class A | | | 104,925 | | | | 1,167,610 | | | | 17,874 | | | | 191,063 | |
Class C | | | 26,063 | | | | 287,617 | | | | 13,605 | | | | 144,627 | |
Class R | | | 0 | | | | 0 | | | | 2,523 | 1 | | | 25,000 | 1 |
Class R4 | | | 6,328,361 | | | | 70,396,647 | | | | 32,693,178 | | | | 338,904,173 | |
Class R62 | | | 10,001,026 | | | | 111,161,503 | | | | 21,384,126 | | | | 221,409,343 | |
Administrator Class | | | 3,820,486 | | | | 42,347,491 | | | | 7,841,666 | | | | 81,546,121 | |
Investor Class | | | 883,377 | | | | 9,795,320 | | | | 2,115,731 | | | | 22,005,330 | |
| | | | |
| | | | | | | 235,156,188 | | | | | | | | 664,225,657 | |
| | | | |
Reinvestment of distributions | | | | | | | | | | | | | | | | |
Class A | | | 535 | | | | 6,027 | | | | 421 | | | | 4,402 | |
Class C | | | 104 | | | | 1,154 | | | | 187 | | | | 1,952 | |
Class R | | | 10 | | | | 109 | | | | 118 | 1 | | | 1,241 | 1 |
Class R4 | | | 175,850 | | | | 1,985,347 | | | | 1,378,903 | | | | 14,387,975 | |
Class R62 | | | 452,509 | | | | 5,104,300 | | | | 3,497,414 | | | | 36,326,764 | |
Administrator Class | | | 106,944 | | | | 1,204,195 | | | | 910,558 | | | | 9,463,169 | |
Investor Class | | | 24,932 | | | | 281,487 | | | | 255,875 | | | | 2,667,544 | |
| | | | |
| | | | | | | 8,582,619 | | | | | | | | 62,853,047 | |
| | | | |
Please see footnotes on page 51.
The accompanying notes are an integral part of these financial statements.
| | | | | | |
| Statements of changes in net assets | | Wells Fargo Advantage Dow Jones Target Date Funds | | | 51 | |
| | | | | | | | | | | | | | | | |
| | | Target 2050 Fund | |
| | | Six months ended August 31, 2014 (unaudited) | | | Year ended February 28, 2014 | |
| | | | |
Capital share transactions (continued) | | | Shares | | | | | | | | Shares | | | | | |
Payment for shares redeemed | | | | | | | | | | | | | | | | |
Class A | | | (9,387 | ) | | $ | (103,353 | ) | | | (233 | ) | | $ | (2,450 | ) |
Class C | | | (1,212 | ) | | | (13,688 | ) | | | (637 | ) | | | (6,913 | ) |
Class R4 | | | (4,653,091 | ) | | | (51,956,174 | ) | | | (6,691,551 | ) | | | (70,531,191 | ) |
Class R62 | | | (7,199,457 | ) | | | (80,075,174 | ) | | | (39,102,784 | ) | | | (403,743,930 | ) |
Administrator Class | | | (2,426,869 | ) | | | (26,984,000 | ) | | | (4,791,764 | ) | | | (49,741,513 | ) |
Investor Class | | | (779,067 | ) | | | (8,667,539 | ) | | | (1,052,072 | ) | | | (10,997,257 | ) |
| | | | |
| | | | | | | (167,799,928 | ) | | | | | | | (535,023,254 | ) |
| | | | |
Net increase in net assets resulting from capital share transactions | | | | | | | 75,938,879 | | | | | | | | 192,055,450 | |
| | | | |
Total increase in net assets | | | | | | | 140,385,906 | | | | | | | | 321,175,223 | |
| | | | |
| | | | |
Net assets | | | | | | | | | | | | | | | | |
Beginning of period | | | | | | | 1,262,229,867 | | | | | | | | 941,054,644 | |
| | | | |
End of period | | | | | | $ | 1,402,615,773 | | | | | | | $ | 1,262,229,867 | |
| | | | |
Undistributed (overdistributed) net investment income | | | | | | $ | 2,735,909 | | | | | | | $ | (105,005 | ) |
| | | | |
| 1. | For the period from June 28, 2013 (commencement of class operations) to February 28, 2014 |
| 2. | On June 1, 2013, Institutional Class was renamed Class R6. |
The accompanying notes are an integral part of these financial statements.
| | | | |
| 52 | | Wells Fargo Advantage Dow Jones Target Date Funds | | Statements of changes in net assets |
| | | | | | | | | | | | | | | | |
| | | Target 2055 Fund | |
| | | Six months ended August 31, 2014 (unaudited) | | | Year ended February 28, 2014 | |
| | | | |
Operations | | | | | | | | | | | | | | | | |
Net investment income | | | | | | $ | 1,121,349 | | | | | | | $ | 1,176,544 | |
Net realized gains on investments | | | | | | | 65,873 | | | | | | | | 1,588,573 | |
Net change in unrealized gains (losses) on investments | | | | | | | 6,098,734 | | | | | | | | 10,516,963 | |
| | | | |
Net increase in net assets resulting from operations | | | | | | | 7,285,956 | | | | | | | | 13,282,080 | |
| | | | |
| | | | |
Distributions to shareholders from | | | | | | | | | | | | | | | | |
Net investment income | | | | | | | | | | | | | | | | |
Class A | | | | | | | (1,307 | ) | | | | | | | (286 | ) |
Class R | | | | | | | (110 | ) | | | | | | | (138 | )1 |
Class R4 | | | | | | | (153,431 | ) | | | | | | | (186,529 | ) |
Class R62 | | | | | | | (598,166 | ) | | | | | | | (811,744 | ) |
Administrator Class | | | | | | | (47,045 | ) | | | | | | | (77,457 | ) |
Investor Class | | | | | | | (24,195 | ) | | | | | | | (26,900 | ) |
Net realized gains | | | | | | | | | | | | | | | | |
Class A | | | | | | | 0 | | | | | | | | (480 | ) |
Class R | | | | | | | 0 | | | | | | | | (349 | )1 |
Class R4 | | | | | | | 0 | | | | | | | | (235,580 | ) |
Class R62 | | | | | | | 0 | | | | | | | | (766,930 | ) |
Administrator Class | | | | | | | 0 | | | | | | | | (90,033 | ) |
Investor Class | | | | | | | 0 | | | | | | | | (42,050 | ) |
| | | | |
Total distributions to shareholders | | | | | | | (824,254 | ) | | | | | | | (2,238,476 | ) |
| | | | |
| | | | |
Capital share transactions | | | Shares | | | | | | | | Shares | | | | | |
Proceeds from shares sold | | | | | | | | | | | | | | | | |
Class A | | | 26,735 | | | | 342,656 | | | | 4,048 | | | | 49,156 | |
Class R | | | 0 | | | | 0 | | | | 2,270 | 1 | | | 25,000 | 1 |
Class R4 | | | 856,183 | | | | 10,979,126 | | | | 2,171,972 | | | | 25,571,996 | |
Class R62 | | | 3,237,810 | | | | 41,415,852 | | | | 6,059,606 | | | | 70,856,116 | |
Administrator Class | | | 287,620 | | | | 3,687,718 | | | | 487,291 | | | | 5,753,225 | |
Investor Class | | | 248,594 | | | | 3,155,745 | | | | 297,719 | | | | 3,493,119 | |
| | | | |
| | | | | | | 59,581,097 | | | | | | | | 105,748,612 | |
| | | | |
Reinvestment of distributions | | | | | | | | | | | | | | | | |
Class A | | | 100 | | | | 1,295 | | | | 64 | | | | 766 | |
Class R | | | 9 | | | | 110 | | | | 41 | 1 | | | 487 | 1 |
Class R4 | | | 11,010 | | | | 142,060 | | | | 33,678 | | | | 401,965 | |
Class R62 | | | 46,486 | | | | 598,166 | | | | 133,432 | | | | 1,578,247 | |
Administrator Class | | | 3,651 | | | | 47,045 | | | | 14,139 | | | | 167,490 | |
Investor Class | | | 1,888 | | | | 24,167 | | | | 5,830 | | | | 68,854 | |
| | | | |
| | | | | | | 812,843 | | | | | | | | 2,217,809 | |
| | | | |
Payment for shares redeemed | | | | | | | | | | | | | | | | |
Class A | | | (2,057 | ) | | | (26,610 | ) | | | (146 | ) | | | (1,765 | ) |
Class R4 | | | (411,641 | ) | | | (5,316,518 | ) | | | (581,266 | ) | | | (7,002,425 | ) |
Class R62 | | | (1,543,355 | ) | | | (19,752,292 | ) | | | (3,635,426 | ) | | | (42,481,310 | ) |
Administrator Class | | | (196,781 | ) | | | (2,520,476 | ) | | | (266,045 | ) | | | (3,151,208 | ) |
Investor Class | | | (117,334 | ) | | | (1,510,502 | ) | | | (89,744 | ) | | | (1,053,130 | ) |
| | | | |
| | | | | | | (29,126,398 | ) | | | | | | | (53,689,838 | ) |
| | | | |
Net increase in net assets resulting from capital share transactions | | | | | | | 31,267,542 | | | | | | | | 54,276,583 | |
| | | | |
Total increase in net assets | | | | | | | 37,729,244 | | | | | | | | 65,320,187 | |
| | | | |
| | | | |
Net assets | | | | | | | | | | | | | | | | |
Beginning of period | | | | | | | 107,705,447 | | | | | | | | 42,385,260 | |
| | | | |
End of period | | | | | | $ | 145,434,691 | | | | | | | $ | 107,705,447 | |
| | | | |
Undistributed net investment income | | | | | | $ | 390,221 | | | | | | | $ | 93,126 | |
| | | | |
| 1. | For the period from June 28, 2013 (commencement of class operations) to February 28, 2014 |
| 2. | On June 1, 2013, Institutional Class was renamed Class R6. |
The accompanying notes are an integral part of these financial statements.
This page is intentionally left blank.
| | | | |
| 54 | | Wells Fargo Advantage Dow Jones Target Date Funds | | Financial highlights |
| | | | | | | | | | | | | | | | | | | | | | | | |
| Target Today Fund | | Beginning net asset value per share | | | Net investment income1 | | | Net realized and unrealized
gains (losses)
on investments | | | Distributions from net investment income | | | Distributions
from net realized gains | | | Ending net asset
value per
share | |
Class A | | | | | | | | | | | | | | | | | | | | | | | | |
Six months ended August 31, 2014 (unaudited) | | $ | 10.85 | | | | 0.07 | 4 | | | 0.18 | | | | (0.04 | ) | | | 0.00 | | | $ | 11.06 | |
Year ended February 28, 2014 | | $ | 10.84 | | | | 0.15 | | | | 0.13 | | | | (0.13 | ) | | | (0.14 | ) | | $ | 10.85 | |
Year ended February 28, 2013 | | $ | 10.86 | | | | 0.15 | 4 | | | 0.08 | | | | (0.17 | ) | | | (0.08 | ) | | $ | 10.84 | |
Year ended February 29, 2012 | | $ | 10.56 | | | | 0.18 | 4 | | | 0.39 | | | | (0.22 | ) | | | (0.05 | ) | | $ | 10.86 | |
Year ended February 28, 2011 | | $ | 10.04 | | | | 0.18 | 4 | | | 0.57 | | | | (0.23 | ) | | | 0.00 | | | $ | 10.56 | |
Year ended February 28, 2010 | | $ | 8.86 | | | | 0.22 | 4 | | | 1.20 | | | | (0.24 | ) | | | 0.00 | | | $ | 10.04 | |
Class B | | | | | | | | | | | | | | | | | | | | | | | | |
Six months ended August 31, 2014 (unaudited) | | $ | 11.30 | | | | 0.03 | 4 | | | 0.19 | | | | (0.02 | ) | | | 0.00 | | | $ | 11.50 | |
Year ended February 28, 2014 | | $ | 11.26 | | | | 0.07 | 4 | | | 0.14 | | | | (0.03 | ) | | | (0.14 | ) | | $ | 11.30 | |
Year ended February 28, 2013 | | $ | 11.22 | | | | 0.07 | 4 | | | 0.08 | | | | (0.03 | ) | | | (0.08 | ) | | $ | 11.26 | |
Year ended February 29, 2012 | | $ | 10.87 | | | | 0.10 | 4 | | | 0.41 | | | | (0.11 | ) | | | (0.05 | ) | | $ | 11.22 | |
Year ended February 28, 2011 | | $ | 10.31 | | | | 0.11 | 4 | | | 0.58 | | | | (0.13 | ) | | | 0.00 | | | $ | 10.87 | |
Year ended February 28, 2010 | | $ | 9.08 | | | | 0.16 | 4 | | | 1.22 | | | | (0.15 | ) | | | 0.00 | | | $ | 10.31 | |
Class C | | | | | | | | | | | | | | | | | | | | | | | | |
Six months ended August 31, 2014 (unaudited) | | $ | 11.11 | | | | 0.03 | 4 | | | 0.18 | | | | (0.02 | ) | | | 0.00 | | | $ | 11.30 | |
Year ended February 28, 2014 | | $ | 11.09 | | | | 0.06 | 4 | | | 0.14 | | | | (0.04 | ) | | | (0.14 | ) | | $ | 11.11 | |
Year ended February 28, 2013 | | $ | 11.11 | | | | 0.07 | | | | 0.08 | | | | (0.09 | ) | | | (0.08 | ) | | $ | 11.09 | |
Year ended February 29, 2012 | | $ | 10.78 | | | | 0.10 | 4 | | | 0.41 | | | | (0.13 | ) | | | (0.05 | ) | | $ | 11.11 | |
Year ended February 28, 2011 | | $ | 10.25 | | | | 0.11 | 4 | | | 0.57 | | | | (0.15 | ) | | | 0.00 | | | $ | 10.78 | |
Year ended February 28, 2010 | | $ | 9.04 | | | | 0.15 | 4 | | | 1.23 | | | | (0.17 | ) | | | 0.00 | | | $ | 10.25 | |
Class R | | | | | | | | | | | | | | | | | | | | | | | | |
Six months ended August 31, 2014 (unaudited) | | $ | 10.85 | | | | 0.06 | | | | 0.18 | | | | (0.04 | ) | | | 0.00 | | | $ | 11.05 | |
Year ended February 28, 20145 | | $ | 10.57 | | | | 0.07 | | | | 0.41 | | | | (0.06 | ) | | | (0.14 | ) | | $ | 10.85 | |
Class R4 | | | | | | | | | | | | | | | | | | | | | | | | |
Six months ended August 31, 2014 (unaudited) | | $ | 11.10 | | | | 0.09 | | | | 0.18 | | | | (0.05 | ) | | | 0.00 | | | $ | 11.32 | |
Year ended February 28, 2014 | | $ | 11.08 | | | | 0.18 | 4 | | | 0.15 | | | | (0.17 | ) | | | (0.14 | ) | | $ | 11.10 | |
Year ended February 28, 20136 | | $ | 11.24 | | | | 0.05 | 4 | | | (0.06 | ) | | | (0.07 | ) | | | (0.08 | ) | | $ | 11.08 | |
Class R67 | | | | | | | | | | | | | | | | | | | | | | | | |
Six months ended August 31, 2014 (unaudited) | | $ | 11.08 | | | | 0.10 | | | | 0.18 | | | | (0.05 | ) | | | 0.00 | | | $ | 11.31 | |
Year ended February 28, 2014 | | $ | 11.07 | | | | 0.20 | 4 | | | 0.14 | | | | (0.19 | ) | | | (0.14 | ) | | $ | 11.08 | |
Year ended February 28, 2013 | | $ | 11.09 | | | | 0.21 | | | | 0.08 | | | | (0.23 | ) | | | (0.08 | ) | | $ | 11.07 | |
Year ended February 29, 2012 | | $ | 10.77 | | | | 0.24 | | | | 0.40 | | | | (0.27 | ) | | | (0.05 | ) | | $ | 11.09 | |
Year ended February 28, 2011 | | $ | 10.24 | | | | 0.24 | 4 | | | 0.58 | | | | (0.29 | ) | | | 0.00 | | | $ | 10.77 | |
Year ended February 28, 2010 | | $ | 9.03 | | | | 0.27 | 4 | | | 1.22 | | | | (0.28 | ) | | | 0.00 | | | $ | 10.24 | |
Administrator Class | | | | | | | | | �� | | | | | | | | | | | | | | | |
Six months ended August 31, 2014 (unaudited) | | $ | 11.07 | | | | 0.08 | 4 | | | 0.18 | | | | (0.04 | ) | | | 0.00 | | | $ | 11.29 | |
Year ended February 28, 2014 | | $ | 11.05 | | | | 0.16 | | | | 0.14 | | | | (0.14 | ) | | | (0.14 | ) | | $ | 11.07 | |
Year ended February 28, 2013 | | $ | 11.07 | | | | 0.17 | | | | 0.08 | | | | (0.19 | ) | | | (0.08 | ) | | $ | 11.05 | |
Year ended February 29, 2012 | | $ | 10.75 | | | | 0.20 | | | | 0.40 | | | | (0.23 | ) | | | (0.05 | ) | | $ | 11.07 | |
Year ended February 28, 2011 | | $ | 10.19 | | | | 0.20 | 4 | | | 0.58 | | | | (0.22 | ) | | | 0.00 | | | $ | 10.75 | |
Year ended February 28, 2010 | | $ | 9.03 | | | | 0.25 | 4 | | | 1.21 | | | | (0.30 | ) | | | 0.00 | | | $ | 10.19 | |
Investor Class | | | | | | | | | | | | | | | | | | | | | | | | |
Six months ended August 31, 2014 (unaudited) | | $ | 11.05 | | | | 0.07 | | | | 0.18 | | | | (0.04 | ) | | | 0.00 | | | $ | 11.26 | |
Year ended February 28, 2014 | | $ | 11.04 | | | | 0.14 | | | | 0.14 | | | | (0.13 | ) | | | (0.14 | ) | | $ | 11.05 | |
Year ended February 28, 2013 | | $ | 11.05 | | | | 0.16 | | | | 0.09 | | | | (0.18 | ) | | | (0.08 | ) | | $ | 11.04 | |
Year ended February 29, 2012 | | $ | 10.74 | | | | 0.19 | | | | 0.40 | | | | (0.23 | ) | | | (0.05 | ) | | $ | 11.05 | |
Year ended February 28, 2011 | | $ | 10.21 | | | | 0.20 | 4 | | | 0.58 | | | | (0.25 | ) | | | 0.00 | | | $ | 10.74 | |
Year ended February 28, 2010 | | $ | 9.01 | | | | 0.24 | 4 | | | 1.22 | | | | (0.26 | ) | | | 0.00 | | | $ | 10.21 | |
| 1. | Includes net expenses allocated from affiliated Master Portfolios in which the Fund invests. |
| 2. | Total return calculations do not include any sales charges. Returns for periods of less than one year are not annualized. |
| 3. | Portfolio turnover rate is calculated by aggregating the results of multiplying the Fund’s investment percentage in the respective affiliated Master Portfolio by the corresponding affiliated Master Portfolio’s portfolio turnover rate. |
| 4. | Calculated based upon average shares outstanding |
| 5. | For the period from June 28, 2013 (commencement of class operations) to February 28, 2014 |
| 6. | For the period from November 30, 2012 (commencement of class operations) to February 28, 2013 |
| 7. | On June 1, 2013, Institutional Class was renamed Class R6. |
The accompanying notes are an integral part of these financial statements.
| | | | | | |
| Financial highlights | | Wells Fargo Advantage Dow Jones Target Date Funds | | | 55 | |
| | | | | | | | | | | | | | | | | | | | | | |
| Ratio to average net assets (annualized) | | | Total return2 | | | Portfolio turnover rate3 | | | Net assets at
end of period
(000s omitted) | |
Net investment income1 | | | Gross expenses1 | | | Net expenses1 | | | | |
| | | | | | | | | | | | | | | | | | | | | | |
| | 1.36 | % | | | 0.99 | % | | | 0.81 | % | | | 2.32 | % | | | 18 | % | | $ | 16,493 | |
| | 1.29 | % | | | 1.01 | % | | | 0.85 | % | | | 2.67 | % | | | 40 | % | | $ | 17,467 | |
| | 1.39 | % | | | 1.08 | % | | | 0.96 | % | | | 2.15 | % | | | 39 | % | | $ | 19,815 | |
| | 1.69 | % | | | 1.08 | % | | | 0.96 | % | | | 5.47 | % | | | 46 | % | | $ | 21,822 | |
| | 1.82 | % | | | 1.10 | % | | | 0.97 | % | | | 7.56 | % | | | 51 | % | | $ | 22,862 | |
| | 2.29 | % | | | 1.24 | % | | | 1.13 | % | | | 16.13 | % | | | 91 | % | | $ | 22,145 | |
| | | | | | | | | | | | | | | | | | | | | | |
| | 0.60 | % | | | 1.71 | % | | | 1.56 | % | | | 1.94 | % | | | 18 | % | | $ | 29 | |
| | 0.62 | % | | | 1.76 | % | | | 1.61 | % | | | 1.90 | % | | | 40 | % | | $ | 51 | |
| | 0.66 | % | | | 1.82 | % | | | 1.71 | % | | | 1.39 | % | | | 39 | % | | $ | 108 | |
| | 0.97 | % | | | 1.82 | % | | | 1.70 | % | | | 4.73 | % | | | 46 | % | | $ | 242 | |
| | 1.08 | % | | | 1.85 | % | | | 1.72 | % | | | 6.78 | % | | | 51 | % | | $ | 865 | |
| | 1.58 | % | | | 2.00 | % | | | 1.89 | % | | | 15.23 | % | | | 91 | % | | $ | 2,155 | |
| | | | | | | | | | | | | | | | | | | | | | |
| | 0.60 | % | | | 1.74 | % | | | 1.56 | % | | | 1.92 | % | | | 18 | % | | $ | 3,855 | |
| | 0.54 | % | | | 1.76 | % | | | 1.60 | % | | | 1.89 | % | | | 40 | % | | $ | 4,287 | |
| | 0.64 | % | | | 1.83 | % | | | 1.71 | % | | | 1.36 | % | | | 39 | % | | $ | 4,945 | |
| | 0.94 | % | | | 1.83 | % | | | 1.71 | % | | | 4.81 | % | | | 46 | % | | $ | 5,100 | |
| | 1.07 | % | | | 1.85 | % | | | 1.72 | % | | | 6.69 | % | | | 51 | % | | $ | 5,605 | |
| | 1.56 | % | | | 1.93 | % | | | 1.82 | % | | | 15.30 | % | | | 91 | % | | $ | 5,498 | |
| | | | | | | | | | | | | | | | | | | | | | |
| | 1.12 | % | | | 1.28 | % | | | 1.06 | % | | | 2.18 | % | | | 18 | % | | $ | 27 | |
| | 1.02 | % | | | 1.27 | % | | | 1.06 | % | | | 4.61 | % | | | 40 | % | | $ | 26 | |
| | | | | | | | | | | | | | | | | | | | | | |
| | 1.72 | % | | | 0.66 | % | | | 0.45 | % | | | 2.43 | % | | | 18 | % | | $ | 352,897 | |
| | 1.66 | % | | | 0.66 | % | | | 0.45 | % | | | 3.09 | % | | | 40 | % | | $ | 367,184 | |
| | 2.06 | % | | | 0.75 | % | | | 0.45 | % | | | (0.09 | )% | | | 39 | % | | $ | 3,073 | |
| | | | | | | | | | | | | | | | | | | | | | |
| | 1.87 | % | | | 0.51 | % | | | 0.30 | % | | | 2.56 | % | | | 18 | % | | $ | 250,581 | |
| | 1.79 | % | | | 0.57 | % | | | 0.37 | % | | | 3.23 | % | | | 40 | % | | $ | 233,894 | |
| | 1.90 | % | | | 0.65 | % | | | 0.45 | % | | | 2.63 | % | | | 39 | % | | $ | 671,576 | |
| | 2.20 | % | | | 0.65 | % | | | 0.45 | % | | | 6.09 | % | | | 46 | % | | $ | 700,645 | |
| | 2.31 | % | | | 0.66 | % | | | 0.45 | % | | | 8.14 | % | | | 51 | % | | $ | 580,536 | |
| | 2.73 | % | | | 0.72 | % | | | 0.53 | % | | | 16.67 | % | | | 91 | % | | $ | 254,513 | |
| | | | | | | | | | | | | | | | | | | | | | |
| | 1.52 | % | | | 0.83 | % | | | 0.65 | % | | | 2.40 | % | | | 18 | % | | $ | 113,193 | |
| | 1.45 | % | | | 0.85 | % | | | 0.69 | % | | | 2.87 | % | | | 40 | % | | $ | 116,854 | |
| | 1.54 | % | | | 0.92 | % | | | 0.80 | % | | | 2.29 | % | | | 39 | % | | $ | 139,771 | |
| | 1.84 | % | | | 0.92 | % | | | 0.80 | % | | | 5.74 | % | | | 46 | % | | $ | 121,886 | |
| | 1.99 | % | | | 0.93 | % | | | 0.80 | % | | | 7.70 | % | | | 51 | % | | $ | 77,216 | |
| | 2.53 | % | | | 1.00 | % | | | 0.82 | % | | | 16.30 | % | | | 91 | % | | $ | 63,796 | |
| | | | | | | | | | | | | | | | | | | | | | |
| | 1.31 | % | | | 1.05 | % | | | 0.86 | % | | | 2.27 | % | | | 18 | % | | $ | 70,711 | |
| | 1.28 | % | | | 1.08 | % | | | 0.86 | % | | | 2.61 | % | | | 40 | % | | $ | 72,839 | |
| | 1.48 | % | | | 1.14 | % | | | 0.86 | % | | | 2.32 | % | | | 39 | % | | $ | 107,673 | |
| | 1.79 | % | | | 1.15 | % | | | 0.86 | % | | | 5.59 | % | | | 46 | % | | $ | 107,779 | |
| | 1.91 | % | | | 1.18 | % | | | 0.86 | % | | | 7.72 | % | | | 51 | % | | $ | 86,784 | |
| | 2.41 | % | | | 1.28 | % | | | 0.89 | % | | | 16.33 | % | | | 91 | % | | $ | 39,395 | |
The accompanying notes are an integral part of these financial statements.
| | | | |
| 56 | | Wells Fargo Advantage Dow Jones Target Date Funds | | Financial highlights |
| | | | | | | | | | | | | | | | | | | | | | | | |
| Target 2010 Fund | | Beginning
net asset
value per
share | | | Net
investment
income1 | | | Net realized
and unrealized
gains (losses)
on investments | | | Distributions
from net
investment
income | | | Distributions from net
realized gains | | | Ending
net asset
value per
share | |
Class A | | | | | | | | | | | | | | | | | | | | | | | | |
Six months ended August 31, 2014 (unaudited) | | $ | 13.33 | | | | 0.10 | 4 | | | 0.23 | | | | (0.05 | ) | | | 0.00 | | | $ | 13.61 | |
Year ended February 28, 2014 | | $ | 13.30 | | | | 0.19 | 4 | | | 0.31 | | | | (0.17 | ) | | | (0.30 | ) | | $ | 13.33 | |
Year ended February 28, 2013 | | $ | 13.26 | | | | 0.19 | 4 | | | 0.19 | | | | (0.21 | ) | | | (0.13 | ) | | $ | 13.30 | |
Year ended February 29, 2012 | | $ | 12.86 | | | | 0.21 | 4 | | | 0.43 | | | | (0.24 | ) | | | 0.00 | | | $ | 13.26 | |
Year ended February 28, 2011 | | $ | 12.04 | | | | 0.22 | 4 | | | 0.88 | | | | (0.28 | ) | | | 0.00 | | | $ | 12.86 | |
Year ended February 28, 2010 | | $ | 10.15 | | | | 0.25 | 4 | | | 1.93 | | | | (0.29 | ) | | | (0.00 | )5 | | $ | 12.04 | |
Class B | | | | | | | | | | | | | | | | | | | | | | | | |
Six months ended August 31, 2014 (unaudited) | | $ | 13.49 | | | | 0.05 | 4 | | | 0.25 | | | | (0.03 | ) | | | 0.00 | | | $ | 13.76 | |
Year ended February 28, 2014 | | $ | 13.43 | | | | 0.08 | 4 | | | 0.32 | | | | (0.04 | ) | | | (0.30 | ) | | $ | 13.49 | |
Year ended February 28, 2013 | | $ | 13.37 | | | | 0.09 | 4 | | | 0.19 | | | | (0.09 | ) | | | (0.13 | ) | | $ | 13.43 | |
Year ended February 29, 2012 | | $ | 12.93 | | | | 0.12 | 4 | | | 0.44 | | | | (0.12 | ) | | | 0.00 | | | $ | 13.37 | |
Year ended February 28, 2011 | | $ | 12.10 | | | | 0.12 | 4 | | | 0.88 | | | | (0.17 | ) | | | 0.00 | | | $ | 12.93 | |
Year ended February 28, 2010 | | $ | 10.18 | | | | 0.17 | 4 | | | 1.93 | | | | (0.18 | ) | | | (0.00 | )5 | | $ | 12.10 | |
Class C | | | | | | | | | | | | | | | | | | | | | | | | |
Six months ended August 31, 2014 (unaudited) | | $ | 13.52 | | | | 0.05 | 4 | | | 0.24 | | | | (0.03 | ) | | | 0.00 | | | $ | 13.78 | |
Year ended February 28, 2014 | | $ | 13.48 | | | | 0.09 | 4 | | | 0.31 | | | | (0.06 | ) | | | (0.30 | ) | | $ | 13.52 | |
Year ended February 28, 2013 | | $ | 13.44 | | | | 0.09 | | | | 0.19 | | | | (0.11 | ) | | | (0.13 | ) | | $ | 13.48 | |
Year ended February 29, 2012 | | $ | 13.03 | | | | 0.12 | 4 | | | 0.43 | | | | (0.14 | ) | | | 0.00 | | | $ | 13.44 | |
Year ended February 28, 2011 | | $ | 12.19 | | | | 0.12 | 4 | | | 0.91 | | | | (0.19 | ) | | | 0.00 | | | $ | 13.03 | |
Year ended February 28, 2010 | | $ | 10.27 | | | | 0.16 | 4 | | | 1.96 | | | | (0.20 | ) | | | (0.00 | )5 | | $ | 12.19 | |
Class R | | | | | | | | | | | | | | | | | | | | | | | | |
Six months ended August 31, 2014 (unaudited) | | $ | 13.28 | | | | 0.08 | 4 | | | 0.25 | | | | (0.05 | ) | | | 0.00 | | | $ | 13.56 | |
Year ended February 28, 20146 | | $ | 13.08 | | | | 0.10 | 4 | | | 0.58 | | | | (0.18 | ) | | | (0.30 | ) | | $ | 13.28 | |
Class R4 | | | | | | | | | | | | | | | | | | | | | | | | |
Six months ended August 31, 2014 (unaudited) | | $ | 13.46 | | | | 0.13 | 4 | | | 0.23 | | | | (0.06 | ) | | | 0.00 | | | $ | 13.76 | |
Year ended February 28, 2014 | | $ | 13.43 | | | | 0.24 | 4 | | | 0.31 | | | | (0.22 | ) | | | (0.30 | ) | | $ | 13.46 | |
Year ended February 28, 20137 | | $ | 13.56 | | | | 0.08 | | | | 0.00 | 5 | | | (0.08 | ) | | | (0.13 | ) | | $ | 13.43 | |
Class R68 | | | | | | | | | | | | | | | | | | | | | | | | |
Six months ended August 31, 2014 (unaudited) | | $ | 13.45 | | | | 0.14 | | | | 0.24 | | | | (0.07 | ) | | | 0.00 | | | $ | 13.76 | |
Year ended February 28, 2014 | | $ | 13.43 | | | | 0.25 | 4 | | | 0.32 | | | | (0.25 | ) | | | (0.30 | ) | | $ | 13.45 | |
Year ended February 28, 2013 | | $ | 13.39 | | | | 0.26 | | | | 0.19 | | | | (0.28 | ) | | | (0.13 | ) | | $ | 13.43 | |
Year ended February 29, 2012 | | $ | 12.97 | | | | 0.28 | | | | 0.45 | | | | (0.31 | ) | | | 0.00 | | | $ | 13.39 | |
Year ended February 28, 2011 | | $ | 12.15 | | | | 0.28 | | | | 0.88 | | | | (0.34 | ) | | | 0.00 | | | $ | 12.97 | |
Year ended February 28, 2010 | | $ | 10.24 | | | | 0.31 | 4 | | | 1.95 | | | | (0.35 | ) | | | (0.00 | )5 | | $ | 12.15 | |
Administrator Class | | | | | | | | | | | | | | | | | | | | | | | | |
Six months ended August 31, 2014 (unaudited) | | $ | 13.46 | | | | 0.11 | | | | 0.24 | | | | (0.06 | ) | | | 0.00 | | | $ | 13.75 | |
Year ended February 28, 2014 | | $ | 13.42 | | | | 0.21 | 4 | | | 0.32 | | | | (0.19 | ) | | | (0.30 | ) | | $ | 13.46 | |
Year ended February 28, 2013 | | $ | 13.38 | | | | 0.21 | 4 | | | 0.19 | | | | (0.23 | ) | | | (0.13 | ) | | $ | 13.42 | |
Year ended February 29, 2012 | | $ | 12.97 | | | | 0.24 | | | | 0.43 | | | | (0.26 | ) | | | 0.00 | | | $ | 13.38 | |
Year ended February 28, 2011 | | $ | 12.14 | | | | 0.24 | | | | 0.89 | | | | (0.30 | ) | | | 0.00 | | | $ | 12.97 | |
Year ended February 28, 2010 | | $ | 10.24 | | | | 0.27 | 4 | | | 1.95 | | | | (0.32 | ) | | | (0.00 | )5 | | $ | 12.14 | |
Investor Class | | | | | | | | | | | | | | | | | | | | | | | | |
Six months ended August 31, 2014 (unaudited) | | $ | 13.42 | | | | 0.10 | | | | 0.24 | | | | (0.05 | ) | | | 0.00 | | | $ | 13.71 | |
Year ended February 28, 2014 | | $ | 13.40 | | | | 0.19 | 4 | | | 0.30 | | | | (0.17 | ) | | | (0.30 | ) | | $ | 13.42 | |
Year ended February 28, 2013 | | $ | 13.36 | | | | 0.20 | | | | 0.19 | | | | (0.22 | ) | | | (0.13 | ) | | $ | 13.40 | |
Year ended February 29, 2012 | | $ | 12.95 | | | | 0.23 | | | | 0.43 | | | | (0.25 | ) | | | 0.00 | | | $ | 13.36 | |
Year ended February 28, 2011 | | $ | 12.12 | | | | 0.22 | 4 | | | 0.90 | | | | (0.29 | ) | | | 0.00 | | | $ | 12.95 | |
Year ended February 28, 2010 | | $ | 10.22 | | | | 0.27 | 4 | | | 1.94 | | | | (0.31 | ) | | | (0.00 | )5 | | $ | 12.12 | |
| 1. | Includes net expenses allocated from affiliated Master Portfolios in which the Fund invests. |
| 2. | Total return calculations do not include any sales charges. Returns for periods of less than one year are not annualized. |
| 3. | Portfolio turnover rate is calculated by aggregating the results of multiplying the Fund’s investment percentage in the respective affiliated Master Portfolio by the corresponding affiliated Master Portfolio’s portfolio turnover rate. |
| 4. | Calculated based upon average shares outstanding |
| 5. | Amount is less than $0.005. |
| 6. | For the period from June 28, 2013 (commencement of class operations) to February 28, 2014 |
| 7. | For the period from November 30, 2012 (commencement of class operations) to February 28, 2013 |
| 8. | On June 1, 2013, Institutional Class was renamed Class R6. |
The accompanying notes are an integral part of these financial statements.
| | | | | | |
| Financial highlights | | Wells Fargo Advantage Dow Jones Target Date Funds | | | 57 | |
| | | | | | | | | | | | | | | | | | | | | | |
| Ratio to average net assets (annualized) | | | Total
return2 | | | Portfolio
turnover
rate3 | | | Net assets at
end of period
(000s omitted) | |
Net investment
income1 | | | Gross
expenses1 | | | Net
expenses1 | | | | |
| | | | | | | | | | | | | | | | | | | | | | |
| | 1.48 | % | | | 0.99 | % | | | 0.83 | % | | | 2.52 | % | | | 17 | % | | $ | 28,760 | |
| | 1.39 | % | | | 1.02 | % | | | 0.87 | % | | | 3.87 | % | | | 40 | % | | $ | 32,012 | |
| | 1.39 | % | | | 1.08 | % | | | 0.99 | % | | | 2.92 | % | | | 37 | % | | $ | 36,462 | |
| | 1.63 | % | | | 1.08 | % | | | 0.99 | % | | | 5.05 | % | | | 43 | % | | $ | 39,691 | |
| | 1.72 | % | | | 1.10 | % | | | 1.00 | % | | | 9.24 | % | | | 47 | % | | $ | 42,615 | |
| | 2.16 | % | | | 1.16 | % | | | 1.10 | % | | | 21.64 | % | | | 86 | % | | $ | 42,316 | |
| | | | | | | | | | | | | | | | | | | | | | |
| | 0.74 | % | | | 1.74 | % | | | 1.58 | % | | | 2.20 | % | | | 17 | % | | $ | 31 | |
| | 0.62 | % | | | 1.77 | % | | | 1.63 | % | | | 3.05 | % | | | 40 | % | | $ | 118 | |
| | 0.67 | % | | | 1.83 | % | | | 1.74 | % | | | 2.12 | % | | | 37 | % | | $ | 341 | |
| | 0.90 | % | | | 1.83 | % | | | 1.74 | % | | | 4.35 | % | | | 43 | % | | $ | 748 | |
| | 0.98 | % | | | 1.85 | % | | | 1.75 | % | | | 8.45 | % | | | 47 | % | | $ | 1,542 | |
| | 1.45 | % | | | 1.92 | % | | | 1.86 | % | | | 20.69 | % | | | 86 | % | | $ | 2,716 | |
| | | | | | | | | | | | | | | | | | | | | | |
| | 0.73 | % | | | 1.75 | % | | | 1.58 | % | | | 2.18 | % | | | 17 | % | | $ | 2,829 | |
| | 0.64 | % | | | 1.77 | % | | | 1.62 | % | | | 3.07 | % | | | 40 | % | | $ | 2,952 | |
| | 0.64 | % | | | 1.83 | % | | | 1.74 | % | | | 2.10 | % | | | 37 | % | | $ | 3,269 | |
| | 0.88 | % | | | 1.83 | % | | | 1.74 | % | | | 4.28 | % | | | 43 | % | | $ | 3,323 | |
| | 0.96 | % | | | 1.85 | % | | | 1.75 | % | | | 8.48 | % | | | 47 | % | | $ | 3,114 | |
| | 1.42 | % | | | 1.91 | % | | | 1.85 | % | | | 20.76 | % | | | 86 | % | | $ | 2,580 | |
| | | | | | | | | | | | | | | | | | | | | | |
| | 1.23 | % | | | 1.27 | % | | | 1.08 | % | | | 2.49 | % | | | 17 | % | | $ | 27 | |
| | 0.00 | % | | | 1.29 | % | | | 1.08 | % | | | 5.36 | % | | | 40 | % | | $ | 26 | |
| | | | | | | | | | | | | | | | | | | | | | |
| | 1.84 | % | | | 0.66 | % | | | 0.47 | % | | | 2.73 | % | | | 17 | % | | $ | 163,978 | |
| | 1.79 | % | | | 0.67 | % | | | 0.47 | % | | | 4.24 | % | | | 40 | % | | $ | 199,432 | |
| | 2.03 | % | | | 0.75 | % | | | 0.47 | % | | | 0.63 | % | | | 37 | % | | $ | 5,555 | |
| | | | | | | | | | | | | | | | | | | | | | |
| | 1.99 | % | | | 0.52 | % | | | 0.32 | % | | | 2.83 | % | | | 17 | % | | $ | 236,166 | |
| | 1.89 | % | | | 0.57 | % | | | 0.38 | % | | | 4.35 | % | | | 40 | % | | $ | 242,218 | |
| | 1.91 | % | | | 0.65 | % | | | 0.48 | % | | | 3.43 | % | | | 37 | % | | $ | 486,113 | |
| | 2.14 | % | | | 0.65 | % | | | 0.48 | % | | | 5.61 | % | | | 43 | % | | $ | 563,343 | |
| | 2.23 | % | | | 0.66 | % | | | 0.48 | % | | | 9.90 | % | | | 47 | % | | $ | 455,447 | |
| | 2.63 | % | | | 0.71 | % | | | 0.59 | % | | | 22.15 | % | | | 86 | % | | $ | 359,320 | |
| | | | | | | | | | | | | | | | | | | | | | |
| | 1.64 | % | | | 0.84 | % | | | 0.67 | % | | | 2.61 | % | | | 17 | % | | $ | 192,550 | |
| | 1.55 | % | | | 0.86 | % | | | 0.71 | % | | | 4.08 | % | | | 40 | % | | $ | 201,159 | |
| | 1.54 | % | | | 0.92 | % | | | 0.83 | % | | | 3.08 | % | | | 37 | % | | $ | 241,045 | |
| | 1.79 | % | | | 0.92 | % | | | 0.83 | % | | | 5.25 | % | | | 43 | % | | $ | 190,863 | |
| | 1.88 | % | | | 0.93 | % | | | 0.83 | % | | | 9.44 | % | | | 47 | % | | $ | 191,943 | |
| | 2.36 | % | | | 0.98 | % | | | 0.86 | % | | | 21.86 | % | | | 86 | % | | $ | 172,322 | |
| | | | | | | | | | | | | | | | | | | | | | |
| | 1.43 | % | | | 1.06 | % | | | 0.88 | % | | | 2.57 | % | | | 17 | % | | $ | 61,321 | |
| | 1.39 | % | | | 1.08 | % | | | 0.88 | % | | | 3.78 | % | | | 40 | % | | $ | 60,396 | |
| | 1.49 | % | | | 1.14 | % | | | 0.89 | % | | | 3.01 | % | | | 37 | % | | $ | 64,161 | |
| | 1.73 | % | | | 1.15 | % | | | 0.89 | % | | | 5.21 | % | | | 43 | % | | $ | 61,766 | |
| | 1.79 | % | | | 1.18 | % | | | 0.89 | % | | | 9.40 | % | | | 47 | % | | $ | 53,646 | |
| | 2.27 | % | | | 1.26 | % | | | 0.92 | % | | | 21.86 | % | | | 86 | % | | $ | 25,103 | |
The accompanying notes are an integral part of these financial statements.
| | | | |
| 58 | | Wells Fargo Advantage Dow Jones Target Date Funds | | Financial highlights |
| | | | | | | | | | | | | | | | | | | | | | | | |
| Target 2015 Fund | | Beginning
net asset
value per
share | | | Net
investment
income1 | | | Net realized
and unrealized
gains (losses)
on investments | | | Distributions
from net
investment
income | | | Distributions from net
realized gains | | | Ending
net asset
value per
share | |
Class A | | | | | | | | | | | | | | | | | | | | | | | | |
Six months ended August 31, 2014 (unaudited) | | $ | 10.38 | | | | 0.08 | | | | 0.21 | | | | (0.07 | ) | | | 0.00 | | | $ | 10.60 | |
Year ended February 28, 2014 | | $ | 10.13 | | | | 0.15 | 4 | | | 0.40 | | | | (0.14 | ) | | | (0.16 | ) | | $ | 10.38 | |
Year ended February 28, 20135 | | $ | 10.11 | | | | 0.03 | 4 | | | 0.13 | | | | (0.04 | ) | | | (0.10 | ) | | $ | 10.13 | |
Class R | | | | | | | | | | | | | | | | | | | | | | | | |
Six months ended August 31, 2014 (unaudited) | | $ | 10.52 | | | | 0.06 | | | | 0.23 | | | | (0.06 | ) | | | 0.00 | | | $ | 10.75 | |
Year ended February 28, 20146 | | $ | 10.08 | | | | 0.08 | 4 | | | 0.57 | | | | (0.05 | ) | | | (0.16 | ) | | $ | 10.52 | |
Class R4 | | | | | | | | | | | | | | | | | | | | | | | | |
Six months ended August 31, 2014 (unaudited) | | $ | 10.40 | | | | 0.09 | 4 | | | 0.23 | | | | (0.09 | ) | | | 0.00 | | | $ | 10.63 | |
Year ended February 28, 2014 | | $ | 10.14 | | | | 0.20 | | | | 0.38 | | | | (0.16 | ) | | | (0.16 | ) | | $ | 10.40 | |
Year ended February 28, 20135 | | $ | 10.11 | | | | 0.05 | 4 | | | 0.13 | | | | (0.05 | ) | | | (0.10 | ) | | $ | 10.14 | |
Class R67 | | | | | | | | | | | | | | | | | | | | | | | | |
Six months ended August 31, 2014 (unaudited) | | $ | 10.39 | | | | 0.10 | | | | 0.23 | | | | (0.10 | ) | | | 0.00 | | | $ | 10.62 | |
Year ended February 28, 2014 | | $ | 10.13 | | | | 0.21 | | | | 0.39 | | | | (0.18 | ) | | | (0.16 | ) | | $ | 10.39 | |
Year ended February 28, 2013 | | $ | 9.98 | | | | 0.18 | 4 | | | 0.27 | | | | (0.20 | ) | | | (0.10 | ) | | $ | 10.13 | |
Year ended February 29, 2012 | | $ | 9.81 | | | | 0.19 | | | | 0.29 | | | | (0.20 | ) | | | (0.11 | ) | | $ | 9.98 | |
Year ended February 28, 2011 | | $ | 9.05 | | | | 0.19 | | | | 0.85 | | | | (0.23 | ) | | | (0.05 | ) | | $ | 9.81 | |
Year ended February 28, 2010 | | $ | 7.23 | | | | 0.21 | 4 | | | 1.77 | | | | (0.16 | ) | | | 0.00 | | | $ | 9.05 | |
Administrator Class | | | | | | | | | | | | | | | | | | | | | | | | |
Six months ended August 31, 2014 (unaudited) | | $ | 10.52 | | | | 0.09 | | | | 0.22 | | | | (0.08 | ) | | | 0.00 | | | $ | 10.75 | |
Year ended February 28, 2014 | | $ | 10.24 | | | | 0.16 | | | | 0.42 | | | | (0.14 | ) | | | (0.16 | ) | | $ | 10.52 | |
Year ended February 28, 2013 | | $ | 10.10 | | | | 0.15 | 4 | | | 0.26 | | | | (0.17 | ) | | | (0.10 | ) | | $ | 10.24 | |
Year ended February 29, 2012 | | $ | 9.92 | | | | 0.17 | | | | 0.29 | | | | (0.17 | ) | | | (0.11 | ) | | $ | 10.10 | |
Year ended February 28, 2011 | | $ | 9.15 | | | | 0.17 | | | | 0.85 | | | | (0.20 | ) | | | (0.05 | ) | | $ | 9.92 | |
Year ended February 28, 2010 | | $ | 7.31 | | | | 0.17 | 4 | | | 1.82 | | | | (0.15 | ) | | | 0.00 | | | $ | 9.15 | |
Investor Class | | | | | | | | | | | | | | | | | | | | | | | | |
Six months ended August 31, 2014 (unaudited) | | $ | 10.53 | | | | 0.08 | | | | 0.22 | | | | (0.07 | ) | | | 0.00 | | | $ | 10.76 | |
Year ended February 28, 2014 | | $ | 10.26 | | | | 0.14 | 4 | | | 0.41 | | | | (0.12 | ) | | | (0.16 | ) | | $ | 10.53 | |
Year ended February 28, 2013 | | $ | 10.11 | | | | 0.14 | | | | 0.27 | | | | (0.16 | ) | | | (0.10 | ) | | $ | 10.26 | |
Year ended February 29, 2012 | | $ | 9.93 | | | | 0.16 | | | | 0.29 | | | | (0.16 | ) | | | (0.11 | ) | | $ | 10.11 | |
Year ended February 28, 2011 | | $ | 9.16 | | | | 0.16 | 4 | | | 0.85 | | | | (0.19 | ) | | | (0.05 | ) | | $ | 9.93 | |
Year ended February 28, 2010 | | $ | 7.32 | | | | 0.15 | 4 | | | 1.83 | | | | (0.14 | ) | | | 0.00 | | | $ | 9.16 | |
| 1. | Includes net expenses allocated from affiliated Master Portfolios in which the Fund invests. |
| 2. | Total return calculations do not include any sales charges. Returns for periods of less than one year are not annualized. |
| 3. | Portfolio turnover rate is calculated by aggregating the results of multiplying the Fund’s investment percentage in the respective affiliated Master Portfolio by the corresponding affiliated Master Portfolio’s portfolio turnover rate. |
| 4. | Calculated based upon average shares outstanding |
| 5. | For the period from November 30, 2012 (commencement of class operations) to February 28, 2013 |
| 6. | For the period from June 28, 2013 (commencement of class operations) to February 28, 2014 |
| 7. | On June 1, 2013, Institutional Class was renamed Class R6. |
The accompanying notes are an integral part of these financial statements.
| | | | | | |
| Financial highlights | | Wells Fargo Advantage Dow Jones Target Date Funds | | | 59 | |
| | | | | | | | | | | | | | | | | | | | | | |
| Ratio to average net assets (annualized) | | | Total
return2 | | | Portfolio
turnover
rate3 | | | Net assets at
end of period
(000s omitted) | |
Net investment
income1 | | | Gross
expenses1 | | | Net
expenses1 | | | | |
| | | | | | | | | | | | | | | | | | | | | | |
| | 1.46 | % | | | 0.99 | % | | | 0.84 | % | | | 2.84 | % | | | 16 | % | | $ | 666 | |
| | 1.45 | % | | | 0.99 | % | | | 0.84 | % | | | 5.56 | % | | | 38 | % | | $ | 332 | |
| | 1.28 | % | | | 1.05 | % | | | 0.84 | % | | | 1.60 | % | | | 35 | % | | $ | 10 | |
| | | | | | | | | | | | | | | | | | | | | | |
| | 1.22 | % | | | 1.25 | % | | | 1.09 | % | | | 2.77 | % | | | 16 | % | | $ | 27 | |
| | 1.14 | % | | | 1.26 | % | | | 1.09 | % | | | 6.51 | % | | | 38 | % | | $ | 27 | |
| | | | | | | | | | | | | | | | | | | | | | |
| | 1.82 | % | | | 0.66 | % | | | 0.48 | % | | | 3.08 | % | | | 16 | % | | $ | 182,751 | |
| | 1.76 | % | | | 0.66 | % | | | 0.48 | % | | | 5.90 | % | | | 38 | % | | $ | 189,078 | |
| | 1.90 | % | | | 0.75 | % | | | 0.48 | % | | | 1.72 | % | | | 35 | % | | $ | 2,614 | |
| | | | | | | | | | | | | | | | | | | | | | |
| | 1.97 | % | | | 0.51 | % | | | 0.33 | % | | | 3.16 | % | | | 16 | % | | $ | 446,577 | |
| | 1.88 | % | | | 0.55 | % | | | 0.38 | % | | | 6.04 | % | | | 38 | % | | $ | 437,620 | |
| | 1.87 | % | | | 0.65 | % | | | 0.49 | % | | | 4.56 | % | | | 35 | % | | $ | 613,945 | |
| | 2.05 | % | | | 0.65 | % | | | 0.49 | % | | | 5.06 | % | | | 40 | % | | $ | 536,453 | |
| | 2.11 | % | | | 0.66 | % | | | 0.49 | % | | | 11.68 | % | | | 44 | % | | $ | 387,146 | |
| | 2.43 | % | | | 0.72 | % | | | 0.54 | % | | | 27.56 | % | | | 77 | % | | $ | 235,807 | |
| | | | | | | | | | | | | | | | | | | | | | |
| | 1.62 | % | | | 0.83 | % | | | 0.68 | % | | | 2.95 | % | | | 16 | % | | $ | 208,621 | |
| | 1.54 | % | | | 0.85 | % | | | 0.72 | % | | | 5.79 | % | | | 38 | % | | $ | 211,930 | |
| | 1.47 | % | | | 0.92 | % | | | 0.84 | % | | | 4.06 | % | | | 35 | % | | $ | 194,125 | |
| | 1.70 | % | | | 0.92 | % | | | 0.84 | % | | | 4.74 | % | | | 40 | % | | $ | 84,759 | |
| | 1.76 | % | | | 0.93 | % | | | 0.84 | % | | | 11.28 | % | | | 44 | % | | $ | 61,227 | |
| | 1.89 | % | | | 1.03 | % | | | 0.86 | % | | | 27.28 | % | | | 77 | % | | $ | 42,190 | |
| | | | | | | | | | | | | | | | | | | | | | |
| | 1.43 | % | | | 1.05 | % | | | 0.89 | % | | | 2.85 | % | | | 16 | % | | $ | 120,740 | |
| | 1.36 | % | | | 1.08 | % | | | 0.89 | % | | | 5.49 | % | | | 38 | % | | $ | 122,400 | |
| | 1.46 | % | | | 1.14 | % | | | 0.90 | % | | | 4.08 | % | | | 35 | % | | $ | 200,596 | |
| | 1.65 | % | | | 1.15 | % | | | 0.90 | % | | | 4.67 | % | | | 40 | % | | $ | 165,774 | |
| | 1.69 | % | | | 1.18 | % | | | 0.90 | % | | | 11.22 | % | | | 44 | % | | $ | 142,622 | |
| | 1.75 | % | | | 1.31 | % | | | 0.93 | % | | | 27.19 | % | | | 77 | % | | $ | 43,004 | |
The accompanying notes are an integral part of these financial statements.
| | | | |
| 60 | | Wells Fargo Advantage Dow Jones Target Date Funds | | Financial highlights |
| | | | | | | | | | | | | | | | | | | | | | | | |
| Target 2020 Fund | | Beginning
net asset
value per
share | | | Net
investment
income1 | | | Net realized
and unrealized
gains (losses)
on investments | | | Distributions
from net
investment
income | | | Distributions from net
realized gains | | | Ending
net asset
value per
share | |
Class A | | | | | | | | | | | | | | | | | | | | | | | | |
Six months ended August 31, 2014 (unaudited) | | $ | 15.14 | | | | 0.11 | 4 | | | 0.40 | | | | (0.08 | ) | | | 0.00 | | | $ | 15.57 | |
Year ended February 28, 2014 | | $ | 14.53 | | | | 0.20 | | | | 0.97 | | | | (0.17 | ) | | | (0.39 | ) | | $ | 15.14 | |
Year ended February 28, 2013 | | $ | 14.25 | | | | 0.20 | | | | 0.50 | | | | (0.21 | ) | | | (0.21 | ) | | $ | 14.53 | |
Year ended February 29, 2012 | | $ | 13.97 | | | | 0.21 | | | | 0.33 | | | | (0.22 | ) | | | (0.04 | ) | | $ | 14.25 | |
Year ended February 28, 2011 | | $ | 12.54 | | | | 0.20 | | | | 1.46 | | | | (0.23 | ) | | | 0.00 | | | $ | 13.97 | |
Year ended February 28, 2010 | | $ | 9.58 | | | | 0.21 | 4 | | | 2.97 | | | | (0.22 | ) | | | (0.00 | )5 | | $ | 12.54 | |
Class B | | | | | | | | | | | | | | | | | | | | | | | | |
Six months ended August 31, 2014 (unaudited) | | $ | 15.13 | | | | 0.05 | 4 | | | 0.40 | | | | (0.01 | ) | | | 0.00 | | | $ | 15.57 | |
Year ended February 28, 2014 | | $ | 14.47 | | | | 0.08 | 4 | | | 0.97 | | | | 0.00 | | | | (0.39 | ) | | $ | 15.13 | |
Year ended February 28, 2013 | | $ | 14.16 | | | | 0.09 | 4 | | | 0.51 | | | | (0.08 | ) | | | (0.21 | ) | | $ | 14.47 | |
Year ended February 29, 2012 | | $ | 13.85 | | | | 0.10 | 4 | | | 0.33 | | | | (0.08 | ) | | | (0.04 | ) | | $ | 14.16 | |
Year ended February 28, 2011 | | $ | 12.41 | | | | 0.09 | 4 | | | 1.46 | | | | (0.11 | ) | | | 0.00 | | | $ | 13.85 | |
Year ended February 28, 2010 | | $ | 9.50 | | | | 0.12 | 4 | | | 2.95 | | | | (0.16 | ) | | | (0.00 | )5 | | $ | 12.41 | |
Class C | | | | | | | | | | | | | | | | | | | | | | | | |
Six months ended August 31, 2014 (unaudited) | | $ | 15.08 | | | | 0.05 | | | | 0.40 | | | | (0.03 | ) | | | 0.00 | | | $ | 15.50 | |
Year ended February 28, 2014 | | $ | 14.49 | | | | 0.08 | | | | 0.97 | | | | (0.07 | ) | | | (0.39 | ) | | $ | 15.08 | |
Year ended February 28, 2013 | | $ | 14.20 | | | | 0.09 | | | | 0.51 | | | | (0.10 | ) | | | (0.21 | ) | | $ | 14.49 | |
Year ended February 29, 2012 | | $ | 13.93 | | | | 0.08 | | | | 0.35 | | | | (0.12 | ) | | | (0.04 | ) | | $ | 14.20 | |
Year ended February 28, 2011 | | $ | 12.51 | | | | 0.08 | | | | 1.48 | | | | (0.14 | ) | | | 0.00 | | | $ | 13.93 | |
Year ended February 28, 2010 | | $ | 9.58 | | | | 0.12 | 4 | | | 2.98 | | | | (0.17 | ) | | | (0.00 | )5 | | $ | 12.51 | |
Class R | | | | | | | | | | | | | | | | | | | | | | | | |
Six months ended August 31, 2014 (unaudited) | | $ | 15.10 | | | | 0.09 | 4 | | | 0.41 | | | | (0.08 | ) | | | 0.00 | | | $ | 15.52 | |
Year ended February 28, 20146 | | $ | 14.48 | | | | 0.10 | 4 | | | 1.10 | | | | (0.19 | ) | | | (0.39 | ) | | $ | 15.10 | |
Class R4 | | | | | | | | | | | | | | | | | | | | | | | | |
Six months ended August 31, 2014 (unaudited) | | $ | 15.40 | | | | 0.14 | | | | 0.41 | | | | (0.11 | ) | | | 0.00 | | | $ | 15.84 | |
Year ended February 28, 2014 | | $ | 14.77 | | | | 0.19 | | | | 1.06 | | | | (0.23 | ) | | | (0.39 | ) | | $ | 15.40 | |
Year ended February 28, 20137 | | $ | 14.66 | | | | 0.09 | | | | 0.31 | | | | (0.08 | ) | | | (0.21 | ) | | $ | 14.77 | |
Class R68 | | | | | | | | | | | | | | | | | | | | | | | | |
Six months ended August 31, 2014 (unaudited) | | $ | 15.40 | | | | 0.15 | | | | 0.41 | | | | (0.12 | ) | | | 0.00 | | | $ | 15.84 | |
Year ended February 28, 2014 | | $ | 14.77 | | | | 0.27 | 4 | | | 1.00 | | | | (0.25 | ) | | | (0.39 | ) | | $ | 15.40 | |
Year ended February 28, 2013 | | $ | 14.47 | | | | 0.27 | | | | 0.52 | | | | (0.28 | ) | | | (0.21 | ) | | $ | 14.77 | |
Year ended February 29, 2012 | | $ | 14.19 | | | | 0.27 | 4 | | | 0.35 | | | | (0.30 | ) | | | (0.04 | ) | | $ | 14.47 | |
Year ended February 28, 2011 | | $ | 12.73 | | | | 0.26 | | | | 1.50 | | | | (0.30 | ) | | | 0.00 | | | $ | 14.19 | |
Year ended February 28, 2010 | | $ | 9.73 | | | | 0.27 | 4 | | | 3.01 | | | | (0.28 | ) | | | (0.00 | )5 | | $ | 12.73 | |
Administrator Class | | | | | | | | | | | | | | | | | | | | | | | | |
Six months ended August 31, 2014 (unaudited) | | $ | 15.36 | | | | 0.12 | | | | 0.41 | | | | (0.09 | ) | | | 0.00 | | | $ | 15.80 | |
Year ended February 28, 2014 | | $ | 14.73 | | | | 0.22 | | | | 0.99 | | | | (0.19 | ) | | | (0.39 | ) | | $ | 15.36 | |
Year ended February 28, 2013 | | $ | 14.44 | | | | 0.21 | | | | 0.52 | | | | (0.23 | ) | | | (0.21 | ) | | $ | 14.73 | |
Year ended February 29, 2012 | | $ | 14.15 | | | | 0.23 | | | | 0.35 | | | | (0.25 | ) | | | (0.04 | ) | | $ | 14.44 | |
Year ended February 28, 2011 | | $ | 12.70 | | | | 0.21 | | | | 1.50 | | | | (0.26 | ) | | | 0.00 | | | $ | 14.15 | |
Year ended February 28, 2010 | | $ | 9.71 | | | | 0.23 | 4 | | | 3.01 | | | | (0.25 | ) | | | (0.00 | )5 | | $ | 12.70 | |
Investor Class | | | | | | | | | | | | | | | | | | | | | | | | |
Six months ended August 31, 2014 (unaudited) | | $ | 15.34 | | | | 0.11 | | | | 0.41 | | | | (0.08 | ) | | | 0.00 | | | $ | 15.78 | |
Year ended February 28, 2014 | | $ | 14.72 | | | | 0.20 | | | | 0.98 | | | | (0.17 | ) | | | (0.39 | ) | | $ | 15.34 | |
Year ended February 28, 2013 | | $ | 14.43 | | | | 0.21 | | | | 0.51 | | | | (0.22 | ) | | | (0.21 | ) | | $ | 14.72 | |
Year ended February 29, 2012 | | $ | 14.14 | | | | 0.22 | | | | 0.35 | | | | (0.24 | ) | | | (0.04 | ) | | $ | 14.43 | |
Year ended February 28, 2011 | | $ | 12.70 | | | | 0.20 | 4 | | | 1.49 | | | | (0.25 | ) | | | 0.00 | | | $ | 14.14 | |
Year ended February 28, 2010 | | $ | 9.71 | | | | 0.22 | 4 | | | 3.02 | | | | (0.25 | ) | | | (0.00 | )5 | | $ | 12.70 | |
| 1. | Includes net expenses allocated from affiliated Master Portfolios in which the Fund invests. |
| 2. | Total return calculations do not include any sales charges. Returns for periods of less than one year are not annualized. |
| 3. | Portfolio turnover rate is calculated by aggregating the results of multiplying the Fund’s investment percentage in the respective affiliated Master Portfolio by the corresponding affiliated Master Portfolio’s portfolio turnover rate. |
| 4. | Calculated based upon average shares outstanding |
| 5. | Amount is less than $0.005. |
| 6. | For the period from June 28, 2013 (commencement of class operations) to February 28, 2014 |
| 7. | For the period from November 30, 2012 (commencement of class operations) to February 28, 2013 |
| 8. | On June 1, 2013, Institutional Class was renamed Class R6. |
The accompanying notes are an integral part of these financial statements.
| | | | | | |
| Financial highlights | | Wells Fargo Advantage Dow Jones Target Date Funds | | | 61 | |
| | | | | | | | | | | | | | | | | | | | | | |
| Ratio to average net assets (annualized) | | | Total
return2 | | | Portfolio
turnover
rate3 | | | Net assets at
end of period
(000s omitted) | |
Net investment
income1 | | | Gross
expenses1 | | | Net
expenses1 | | | | |
| | | | | | | | | | | | | | | | | | | | | | |
| | 1.43 | % | | | 0.95 | % | | | 0.86 | % | | | 3.37 | % | | | 13 | % | | $ | 68,499 | |
| | 1.32 | % | | | 0.98 | % | | | 0.90 | % | | | 8.16 | % | | | 35 | % | | $ | 75,871 | |
| | 1.36 | % | | | 1.06 | % | | | 1.01 | % | | | 5.00 | % | | | 32 | % | | $ | 74,720 | |
| | 1.45 | % | | | 1.05 | % | | | 1.01 | % | | | 3.97 | % | | | 35 | % | | $ | 74,955 | |
| | 1.46 | % | | | 1.08 | % | | | 1.02 | % | | | 13.41 | % | | | 39 | % | | $ | 77,784 | |
| | 1.77 | % | | | 1.15 | % | | | 1.11 | % | | | 33.45 | % | | | 66 | % | | $ | 72,653 | |
| | | | | | | | | | | | | | | | | | | | | | |
| | 0.68 | % | | | 1.70 | % | | | 1.61 | % | | | 2.99 | % | | | 13 | % | | $ | 169 | |
| | 0.58 | % | | | 1.74 | % | | | 1.66 | % | | | 7.34 | % | | | 35 | % | | $ | 238 | |
| | 0.63 | % | | | 1.81 | % | | | 1.76 | % | | | 4.27 | % | | | 32 | % | | $ | 599 | |
| | 0.78 | % | | | 1.80 | % | | | 1.76 | % | | | 3.11 | % | | | 35 | % | | $ | 1,048 | |
| | 0.73 | % | | | 1.83 | % | | | 1.77 | % | | | 12.57 | % | | | 39 | % | | $ | 2,428 | |
| | 1.04 | % | | | 1.90 | % | | | 1.86 | % | | | 32.44 | % | | | 66 | % | | $ | 5,030 | |
| | | | | | | | | | | | | | | | | | | | | | |
| | 0.68 | % | | | 1.70 | % | | | 1.61 | % | | | 2.99 | % | | | 13 | % | | $ | 5,587 | |
| | 0.57 | % | | | 1.73 | % | | | 1.65 | % | | | 7.36 | % | | | 35 | % | | $ | 5,208 | |
| | 0.61 | % | | | 1.81 | % | | | 1.76 | % | | | 4.28 | % | | | 32 | % | | $ | 4,514 | |
| | 0.68 | % | | | 1.81 | % | | | 1.76 | % | | | 3.14 | % | | | 35 | % | | $ | 4,600 | |
| | 0.70 | % | | | 1.83 | % | | | 1.77 | % | | | 12.65 | % | | | 39 | % | | $ | 3,922 | |
| | 1.00 | % | | | 1.90 | % | | | 1.86 | % | | | 32.35 | % | | | 66 | % | | $ | 2,752 | |
| | | | | | | | | | | | | | | | | | | | | | |
| | 1.16 | % | | | 1.23 | % | | | 1.11 | % | | | 3.30 | % | | | 13 | % | | $ | 42 | |
| | 1.07 | % | | | 1.24 | % | | | 1.11 | % | | | 8.37 | % | | | 35 | % | | $ | 27 | |
| | | | | | | | | | | | | | | | | | | | | | |
| | 1.79 | % | | | 0.62 | % | | | 0.50 | % | | | 3.56 | % | | | 13 | % | | $ | 784,098 | |
| | 1.70 | % | | | 0.63 | % | | | 0.50 | % | | | 8.58 | % | | | 35 | % | | $ | 803,141 | |
| | 1.72 | % | | | 0.73 | % | | | 0.50 | % | | | 2.79 | % | | | 32 | % | | $ | 23,050 | |
| | | | | | | | | | | | | | | | | | | | | | |
| | 1.93 | % | | | 0.47 | % | | | 0.35 | % | | | 3.63 | % | | | 13 | % | | $ | 1,165,670 | |
| | 1.88 | % | | | 0.53 | % | | | 0.40 | % | | | 8.72 | % | | | 35 | % | | $ | 1,065,417 | |
| | 1.85 | % | | | 0.63 | % | | | 0.50 | % | | | 5.60 | % | | | 32 | % | | $ | 1,605,032 | |
| | 1.95 | % | | | 0.63 | % | | | 0.50 | % | | | 4.47 | % | | | 35 | % | | $ | 1,540,045 | |
| | 1.96 | % | | | 0.64 | % | | | 0.50 | % | | | 14.03 | % | | | 39 | % | | $ | 1,250,249 | |
| | 2.22 | % | | | 0.69 | % | | | 0.60 | % | | | 33.98 | % | | | 66 | % | | $ | 822,479 | |
| | | | | | | | | | | | | | | | | | | | | | |
| | 1.60 | % | | | 0.79 | % | | | 0.70 | % | | | 3.48 | % | | | 13 | % | | $ | 750,822 | |
| | 1.52 | % | | | 0.82 | % | | | 0.74 | % | | | 8.35 | % | | | 35 | % | | $ | 746,910 | |
| | 1.47 | % | | | 0.90 | % | | | 0.85 | % | | | 5.19 | % | | | 32 | % | | $ | 688,261 | |
| | 1.63 | % | | | 0.90 | % | | | 0.85 | % | | | 4.17 | % | | | 35 | % | | $ | 468,494 | |
| | 1.62 | % | | | 0.91 | % | | | 0.85 | % | | | 13.60 | % | | | 39 | % | | $ | 439,314 | |
| | 1.96 | % | | | 0.97 | % | | | 0.88 | % | | | 33.64 | % | | | 66 | % | | $ | 342,078 | |
| | | | | | | | | | | | | | | | | | | | | | |
| | 1.37 | % | | | 1.01 | % | | | 0.91 | % | | | 3.40 | % | | | 13 | % | | $ | 208,990 | |
| | 1.35 | % | | | 1.04 | % | | | 0.91 | % | | | 8.14 | % | | | 35 | % | | $ | 193,249 | |
| | 1.43 | % | | | 1.12 | % | | | 0.91 | % | | | 5.12 | % | | | 32 | % | | $ | 173,813 | |
| | 1.54 | % | | | 1.13 | % | | | 0.91 | % | | | 4.12 | % | | | 35 | % | | $ | 144,478 | |
| | 1.53 | % | | | 1.15 | % | | | 0.91 | % | | | 13.56 | % | | | 39 | % | | $ | 119,297 | |
| | 1.84 | % | | | 1.24 | % | | | 0.94 | % | | | 33.51 | % | | | 66 | % | | $ | 53,535 | |
The accompanying notes are an integral part of these financial statements.
| | | | |
| 62 | | Wells Fargo Advantage Dow Jones Target Date Funds | | Financial highlights |
| | | | | | | | | | | | | | | | | | | | | | | | |
| Target 2025 Fund | | Beginning
net asset
value per
share | | | Net
investment
income (loss)1 | | | Net realized
and unrealized
gains (losses)
on investments | | | Distributions
from net
investment
income | | | Distributions from net
realized gains | | | Ending
net asset
value per
share | |
Class A | | | | | | | | | | | | | | | | | | | | | | | | |
Six months ended August 31, 2014 (unaudited) | | $ | 10.56 | | | | 0.07 | | | | 0.34 | | | | (0.06 | ) | | | 0.00 | | | $ | 10.91 | |
Year ended February 28, 2014 | | $ | 9.95 | | | | 0.15 | | | | 0.92 | | | | (0.13 | ) | | | (0.33 | ) | | $ | 10.56 | |
Year ended February 28, 20134 | | $ | 9.83 | | | | 0.04 | | | | 0.33 | | | | (0.05 | ) | | | (0.20 | ) | | $ | 9.95 | |
Class R | | | | | | | | | | | | | | | | | | | | | | | | |
Six months ended August 31, 2014 (unaudited) | | $ | 10.57 | | | | 0.06 | | | | 0.34 | | | | (0.04 | ) | | | 0.00 | | | $ | 10.93 | |
Year ended February 28, 20145 | | $ | 9.95 | | | | 0.07 | | | | 0.94 | | | | (0.06 | ) | | | (0.33 | ) | | $ | 10.57 | |
Class R4 | | | | | | | | | | | | | | | | | | | | | | | | |
Six months ended August 31, 2014 (unaudited) | | $ | 10.58 | | | | 0.09 | | | | 0.33 | | | | (0.07 | ) | | | 0.00 | | | $ | 10.93 | |
Year ended February 28, 2014 | | $ | 9.97 | | | | 0.15 | | | | 0.95 | | | | (0.16 | ) | | | (0.33 | ) | | $ | 10.58 | |
Year ended February 28, 20134 | | $ | 9.83 | | | | 0.06 | | | | 0.33 | | | | (0.05 | ) | | | (0.20 | ) | | $ | 9.97 | |
Class R66 | | | | | | | | | | | | | | | | | | | | | | | | |
Six months ended August 31, 2014 (unaudited) | | $ | 10.57 | | | | 0.10 | | | | 0.34 | | | | (0.08 | ) | | | 0.00 | | | $ | 10.93 | |
Year ended February 28, 2014 | | $ | 9.96 | | | | 0.19 | | | | 0.92 | | | | (0.17 | ) | | | (0.33 | ) | | $ | 10.57 | |
Year ended February 28, 2013 | | $ | 9.71 | | | | 0.18 | | | | 0.45 | | | | (0.18 | ) | | | (0.20 | ) | | $ | 9.96 | |
Year ended February 29, 2012 | | $ | 9.79 | | | | 0.17 | 7 | | | 0.16 | | | | (0.18 | ) | | | (0.23 | ) | | $ | 9.71 | |
Year ended February 28, 2011 | | $ | 8.68 | | | | 0.16 | | | | 1.26 | | | | (0.19 | ) | | | (0.12 | ) | | $ | 9.79 | |
Year ended February 28, 2010 | | $ | 6.24 | | | | 0.18 | 7 | | | 2.39 | | | | (0.13 | ) | | | 0.00 | | | $ | 8.68 | |
Administrator Class | | | | | | | | | | | | | | | | | | | | | | | | |
Six months ended August 31, 2014 (unaudited) | | $ | 10.60 | | | | 0.08 | | | | 0.33 | | | | (0.06 | ) | | | 0.00 | | | $ | 10.95 | |
Year ended February 28, 2014 | | $ | 9.98 | | | | 0.15 | | | | 0.94 | | | | (0.14 | ) | | | (0.33 | ) | | $ | 10.60 | |
Year ended February 28, 2013 | | $ | 9.74 | | | | 0.14 | 7 | | | 0.45 | | | | (0.15 | ) | | | (0.20 | ) | | $ | 9.98 | |
Year ended February 29, 2012 | | $ | 9.81 | | | | 0.14 | 7 | | | 0.17 | | | | (0.15 | ) | | | (0.23 | ) | | $ | 9.74 | |
Year ended February 28, 2011 | | $ | 8.69 | | | | 0.13 | 7 | | | 1.26 | | | | (0.15 | ) | | | (0.12 | ) | | $ | 9.81 | |
Year ended February 28, 2010 | | $ | 6.25 | | | | (0.04 | )7 | | | 2.61 | | | | (0.13 | ) | | | 0.00 | | | $ | 8.69 | |
Investor Class | | | | | | | | | | | | | | | | | | | | | | | | |
Six months ended August 31, 2014 (unaudited) | | $ | 10.59 | | | | 0.07 | | | | 0.33 | | | | (0.05 | ) | | | 0.00 | | | $ | 10.94 | |
Year ended February 28, 2014 | | $ | 9.97 | | | | 0.11 | | | | 0.96 | | | | (0.12 | ) | | | (0.33 | ) | | $ | 10.59 | |
Year ended February 28, 2013 | | $ | 9.72 | | | | 0.14 | | | | 0.46 | | | | (0.15 | ) | | | (0.20 | ) | | $ | 9.97 | |
Year ended February 29, 2012 | | $ | 9.80 | | | | 0.14 | 7 | | | 0.15 | | | | (0.14 | ) | | | (0.23 | ) | | $ | 9.72 | |
Year ended February 28, 2011 | | $ | 8.68 | | | | 0.13 | 7 | | | 1.25 | | | | (0.14 | ) | | | (0.12 | ) | | $ | 9.80 | |
Year ended February 28, 2010 | | $ | 6.25 | | | | (0.08 | )7 | | | 2.64 | | | | (0.13 | ) | | | 0.00 | | | $ | 8.68 | |
| 1. | Includes net expenses allocated from affiliated Master Portfolios in which the Fund invests. |
| 2. | Total return calculations do not include any sales charges. Returns for periods of less than one year are not annualized. |
| 3. | Portfolio turnover rate is calculated by aggregating the results of multiplying the Fund’s investment percentage in the respective affiliated Master Portfolio by the corresponding affiliated Master Portfolio’s portfolio turnover rate. |
| 4. | For the period from November 30, 2012 (commencement of class operations) to February 28, 2013 |
| 5. | For the period from June 28, 2013 (commencement of class operations) to February 28, 2014 |
| 6. | On June 1, 2013, Institutional Class was renamed Class R6. |
| 7. | Calculated based upon average shares outstanding |
The accompanying notes are an integral part of these financial statements.
| | | | | | |
| Financial highlights | | Wells Fargo Advantage Dow Jones Target Date Funds | | | 63 | |
| | | | | | | | | | | | | | | | | | | | | | |
| Ratio to average net assets (annualized) | | | Total
return2 | | | Portfolio
turnover
rate3 | | | Net assets at
end of period
(000s omitted) | |
Net investment
income (loss)1 | | | Gross
expenses1 | | | Net
expenses1 | | | | |
| | | | | | | | | | | | | | | | | | | | | | |
| | 1.41 | % | | | 0.96 | % | | | 0.86 | % | | | 3.89 | % | | | 11 | % | | $ | 2,622 | |
| | 1.28 | % | | | 0.97 | % | | | 0.86 | % | | | 10.99 | % | | | 32 | % | | $ | 1,379 | |
| | 1.01 | % | | | 1.06 | % | | | 0.86 | % | | | 3.92 | % | | | 28 | % | | $ | 159 | |
| | | | | | | | | | | | | | | | | | | | | | |
| | 1.16 | % | | | 1.21 | % | | | 1.11 | % | | | 3.82 | % | | | 11 | % | | $ | 29 | |
| | 0.96 | % | | | 1.22 | % | | | 1.11 | % | | | 10.27 | % | | | 32 | % | | $ | 28 | |
| | | | | | | | | | | | | | | | | | | | | | |
| | 1.77 | % | | | 0.63 | % | | | 0.50 | % | | | 4.11 | % | | | 11 | % | | $ | 357,294 | |
| | 1.60 | % | | | 0.63 | % | | | 0.50 | % | | | 11.29 | % | | | 32 | % | | $ | 354,137 | |
| | 1.51 | % | | | 0.73 | % | | | 0.50 | % | | | 4.13 | % | | | 28 | % | | $ | 4,210 | |
| | | | | | | | | | | | | | | | | | | | | | |
| | 1.92 | % | | | 0.48 | % | | | 0.35 | % | | | 4.19 | % | | | 11 | % | | $ | 1,469,138 | |
| | 1.78 | % | | | 0.52 | % | | | 0.39 | % | | | 11.42 | % | | | 32 | % | | $ | 1,409,281 | |
| | 1.83 | % | | | 0.63 | % | | | 0.50 | % | | | 6.74 | % | | | 28 | % | | $ | 1,577,058 | |
| | 1.83 | % | | | 0.64 | % | | | 0.50 | % | | | 3.77 | % | | | 31 | % | | $ | 1,431,120 | |
| | 1.83 | % | | | 0.64 | % | | | 0.50 | % | | | 16.75 | % | | | 33 | % | | $ | 1,290,513 | |
| | 2.07 | % | | | 0.66 | % | | | 0.53 | % | | | 41.46 | % | | | 54 | % | | $ | 1,057,514 | |
| | | | | | | | | | | | | | | | | | | | | | |
| | 1.57 | % | | | 0.80 | % | | | 0.70 | % | | | 3.92 | % | | | 11 | % | | $ | 376,855 | |
| | 1.43 | % | | | 0.82 | % | | | 0.74 | % | | | 11.11 | % | | | 32 | % | | $ | 354,050 | |
| | 1.42 | % | | | 0.90 | % | | | 0.85 | % | | | 6.27 | % | | | 28 | % | | $ | 271,593 | |
| | 1.47 | % | | | 0.91 | % | | | 0.85 | % | | | 3.49 | % | | | 31 | % | | $ | 111,673 | |
| | 1.46 | % | | | 0.91 | % | | | 0.85 | % | | | 16.32 | % | | | 33 | % | | $ | 69,590 | |
| | (0.51 | )% | | | 1.01 | % | | | 0.89 | % | | | 41.33 | % | | | 54 | % | | $ | 39,111 | |
| | | | | | | | | | | | | | | | | | | | | | |
| | 1.37 | % | | | 1.02 | % | | | 0.91 | % | | | 3.83 | % | | | 11 | % | | $ | 248,778 | |
| | 1.28 | % | | | 1.05 | % | | | 0.91 | % | | | 10.91 | % | | | 32 | % | | $ | 236,714 | |
| | 1.41 | % | | | 1.12 | % | | | 0.91 | % | | | 6.31 | % | | | 28 | % | | $ | 377,357 | |
| | 1.42 | % | | | 1.14 | % | | | 0.91 | % | | | 3.32 | % | | | 31 | % | | $ | 300,434 | |
| | 1.39 | % | | | 1.15 | % | | | 0.91 | % | | | 16.22 | % | | | 33 | % | | $ | 256,544 | |
| | (0.93 | )% | | | 1.29 | % | | | 0.95 | % | | | 41.19 | % | | | 54 | % | | $ | 70,228 | |
The accompanying notes are an integral part of these financial statements.
| | | | |
| 64 | | Wells Fargo Advantage Dow Jones Target Date Funds | | Financial highlights |
| | | | | | | | | | | | | | | | | | | | | | | | |
| Target 2030 Fund | | Beginning
net asset
value per
share | | | Net
investment
income1 | | | Net realized
and unrealized
gains (losses)
on investments | | | Distributions
from net
investment
income | | | Distributions
from net
realized gains | | | Ending
net asset
value per
share | |
Class A | | | | | | | | | | | | | | | | | | | | | | | | |
Six months ended August 31, 2014 (unaudited) | | $ | 16.61 | | | | 0.13 | | | | 0.59 | | | | (0.08 | ) | | | 0.00 | | | $ | 17.25 | |
Year ended February 28, 2014 | | $ | 15.31 | | | | 0.20 | | | | 1.83 | | | | (0.19 | ) | | | (0.54 | ) | | $ | 16.61 | |
Year ended February 28, 2013 | | $ | 14.74 | | | | 0.20 | | | | 0.85 | | | | (0.20 | ) | | | (0.28 | ) | | $ | 15.31 | |
Year ended February 29, 2012 | | $ | 14.81 | | | | 0.17 | 4 | | | 0.13 | | | | (0.18 | ) | | | (0.19 | ) | | $ | 14.74 | |
Year ended February 28, 2011 | | $ | 12.65 | | | | 0.15 | 4 | | | 2.19 | | | | (0.18 | ) | | | 0.00 | | | $ | 14.81 | |
Year ended February 28, 2010 | | $ | 8.65 | | | | 0.15 | 4 | | | 4.00 | | | | (0.15 | ) | | | (0.00 | )5 | | $ | 12.65 | |
Class B | | | | | | | | | | | | | | | | | | | | | | | | |
Six months ended August 31, 2014 (unaudited) | | $ | 16.36 | | | | 0.05 | | | | 0.60 | | | | (0.00 | )8 | | | 0.00 | | | $ | 17.01 | |
Year ended February 28, 2014 | | $ | 15.08 | | | | 0.08 | 4 | | | 1.80 | | | | (0.06 | ) | | | (0.54 | ) | | $ | 16.36 | |
Year ended February 28, 2013 | | $ | 14.49 | | | | 0.08 | 4 | | | 0.86 | | | | (0.07 | ) | | | (0.28 | ) | | $ | 15.08 | |
Year ended February 29, 2012 | | $ | 14.53 | | | | 0.07 | 4 | | | 0.12 | | | | (0.04 | ) | | | (0.19 | ) | | $ | 14.49 | |
Year ended February 28, 2011 | | $ | 12.41 | | | | 0.06 | 4 | | | 2.14 | | | | (0.08 | ) | | | 0.00 | | | $ | 14.53 | |
Year ended February 28, 2010 | | $ | 8.49 | | | | 0.07 | 4 | | | 3.91 | | | | (0.06 | ) | | | (0.00 | )5 | | $ | 12.41 | |
Class C | | | | | | | | | | | | | | | | | | | | | | | | |
Six months ended August 31, 2014 (unaudited) | | $ | 16.25 | | | | 0.06 | | | | 0.59 | | | | (0.04 | ) | | | 0.00 | | | $ | 16.86 | |
Year ended February 28, 2014 | | $ | 15.00 | | | | 0.08 | | | | 1.79 | | | | (0.08 | ) | | | (0.54 | ) | | $ | 16.25 | |
Year ended February 28, 2013 | | $ | 14.45 | | | | 0.08 | | | | 0.85 | | | | (0.10 | ) | | | (0.28 | ) | | $ | 15.00 | |
Year ended February 29, 2012 | | $ | 14.53 | | | | 0.06 | 4 | | | 0.14 | | | | (0.09 | ) | | | (0.19 | ) | | $ | 14.45 | |
Year ended February 28, 2011 | | $ | 12.43 | | | | 0.05 | 4 | | | 2.14 | | | | (0.09 | ) | | | 0.00 | | | $ | 14.53 | |
Year ended February 28, 2010 | | $ | 8.50 | | | | 0.06 | 4 | | | 3.93 | | | | (0.06 | ) | | | (0.00 | )5 | | $ | 12.43 | |
Class R | | | | | | | | | | | | | | | | | | | | | | | | |
Six months ended August 31, 2014 (unaudited) | | $ | 16.61 | | | | 0.09 | | | | 0.61 | | | | (0.07 | ) | | | 0.00 | | | $ | 17.24 | |
Year ended February 28, 20146 | | $ | 15.39 | | | | 0.10 | | | | 1.75 | | | | (0.09 | ) | | | (0.54 | ) | | $ | 16.61 | |
Class R4 | | | | | | | | | | | | | | | | | | | | | | | | |
Six months ended August 31, 2014 (unaudited) | | $ | 16.83 | | | | 0.15 | | | | 0.61 | | | | (0.11 | ) | | | 0.00 | | | $ | 17.48 | |
Year ended February 28, 2014 | | $ | 15.50 | | | | 0.23 | | | | 1.89 | | | | (0.25 | ) | | | (0.54 | ) | | $ | 16.83 | |
Year ended February 28, 20137 | | $ | 15.07 | | | | 0.08 | | | | 0.71 | | | | (0.08 | ) | | | (0.28 | ) | | $ | 15.50 | |
Class R68 | | | | | | | | | | | | | | | | | | | | | | | | |
Six months ended August 31, 2014 (unaudited) | | $ | 16.81 | | | | 0.16 | | | | 0.62 | | | | (0.12 | ) | | | 0.00 | | | $ | 17.47 | |
Year ended February 28, 2014 | | $ | 15.49 | | | | 0.29 | 4 | | | 1.86 | | | | (0.27 | ) | | | (0.54 | ) | | $ | 16.81 | |
Year ended February 28, 2013 | | $ | 14.91 | | | | 0.27 | | | | 0.86 | | | | (0.27 | ) | | | (0.28 | ) | | $ | 15.49 | |
Year ended February 29, 2012 | | $ | 14.98 | | | | 0.25 | 4 | | | 0.12 | | | | (0.25 | ) | | | (0.19 | ) | | $ | 14.91 | |
Year ended February 28, 2011 | | $ | 12.79 | | | | 0.23 | 4 | | | 2.21 | | | | (0.25 | ) | | | 0.00 | | | $ | 14.98 | |
Year ended February 28, 2010 | | $ | 8.75 | | | | 0.21 | 4 | | | 4.03 | | | | (0.20 | ) | | | (0.00 | )5 | | $ | 12.79 | |
Administrator Class | | | | | | | | | | | | | | | | | | | | | | | | |
Six months ended August 31, 2014 (unaudited) | | $ | 16.82 | | | | 0.13 | | | | 0.62 | | | | (0.10 | ) | | | 0.00 | | | $ | 17.47 | |
Year ended February 28, 2014 | | $ | 15.49 | | | | 0.23 | | | | 1.86 | | | | (0.22 | ) | | | (0.54 | ) | | $ | 16.82 | |
Year ended February 28, 2013 | | $ | 14.91 | | | | 0.21 | | | | 0.88 | | | | (0.23 | ) | | | (0.28 | ) | | $ | 15.49 | |
Year ended February 29, 2012 | | $ | 14.98 | | | | 0.20 | 4 | | | 0.13 | | | | (0.21 | ) | | | (0.19 | ) | | $ | 14.91 | |
Year ended February 28, 2011 | | $ | 12.79 | | | | 0.18 | 4 | | | 2.21 | | | | (0.20 | ) | | | 0.00 | | | $ | 14.98 | |
Year ended February 28, 2010 | | $ | 8.74 | | | | 0.17 | 4 | | | 4.06 | | | | (0.18 | ) | | | (0.00 | )5 | | $ | 12.79 | |
Investor Class | | | | | | | | | | | | | | | | | | | | | | | | |
Six months ended August 31, 2014 (unaudited) | | $ | 16.77 | | | | 0.11 | | | | 0.62 | | | | (0.08 | ) | | | 0.00 | | | $ | 17.42 | |
Year ended February 28, 2014 | | $ | 15.46 | | | | 0.20 | | | | 1.84 | | | | (0.19 | ) | | | (0.54 | ) | | $ | 16.77 | |
Year ended February 28, 2013 | | $ | 14.88 | | | | 0.21 | | | | 0.87 | | | | (0.22 | ) | | | (0.28 | ) | | $ | 15.46 | |
Year ended February 29, 2012 | | $ | 14.95 | | | | 0.19 | 4 | | | 0.13 | | | | (0.20 | ) | | | (0.19 | ) | | $ | 14.88 | |
Year ended February 28, 2011 | | $ | 12.77 | | | | 0.17 | 4 | | | 2.21 | | | | (0.20 | ) | | | 0.00 | | | $ | 14.95 | |
Year ended February 28, 2010 | | $ | 8.74 | | | | 0.16 | 4 | | | 4.04 | | | | (0.17 | ) | | | (0.00 | )5 | | $ | 12.77 | |
| 1. | Includes net expenses allocated from affiliated Master Portfolios in which the Fund invests. |
| 2. | Total return calculations do not include any sales charges. Returns for periods of less than one year are not annualized. |
| 3. | Portfolio turnover rate is calculated by aggregating the results of multiplying the Fund’s investment percentage in the respective affiliated Master Portfolio by the corresponding affiliated Master Portfolio’s portfolio turnover rate. |
| 4. | Calculated based upon average shares outstanding |
| 5. | Amount is less than $0.005. |
| 6. | For the period from June 28, 2013 (commencement of class operations) to February 28, 2014 |
| 7. | For the period from November 30, 2012 (commencement of class operations) to February 28, 2013 |
| 8. | On June 1, 2013, Institutional Class was renamed Class R6. |
The accompanying notes are an integral part of these financial statements.
| | | | | | |
| Financial highlights | | Wells Fargo Advantage Dow Jones Target Date Funds | | | 65 | |
| | | | | | | | | | | | | | | | | | | | | | |
| Ratio to average net assets (annualized) | | | Total
return2 | | | Portfolio
turnover
rate3 | | | Net assets at
end of period
(000s omitted) | |
Net investment
income1 | | | Gross
expenses1 | | | Net
expenses1 | | | | |
| | | | | | | | | | | | | | | | | | | | | | |
| | 1.39 | % | | | 0.95 | % | | | 0.87 | % | | | 4.36 | % | | | 8 | % | | $ | 61,861 | |
| | 1.22 | % | | | 0.98 | % | | | 0.91 | % | | | 13.52 | % | | | 29 | % | | $ | 65,634 | |
| | 1.29 | % | | | 1.06 | % | | | 1.02 | % | | | 7.28 | % | | | 25 | % | | $ | 60,857 | |
| | 1.21 | % | | | 1.06 | % | | | 1.02 | % | | | 2.27 | % | | | 26 | % | | $ | 60,087 | |
| | 1.15 | % | | | 1.09 | % | | | 1.03 | % | | | 18.71 | % | | | 28 | % | | $ | 62,209 | |
| | 1.32 | % | | | 1.16 | % | | | 1.12 | % | | | 48.17 | % | | | 43 | % | | $ | 55,735 | |
| | | | | | | | | | | | | | | | | | | | | | |
| | 0.66 | % | | | 1.70 | % | | | 1.62 | % | | | 3.99 | % | | | 8 | % | | $ | 173 | |
| | 0.50 | % | | | 1.74 | % | | | 1.67 | % | | | 12.65 | % | | | 29 | % | | $ | 290 | |
| | 0.57 | % | | | 1.81 | % | | | 1.77 | % | | | 6.54 | % | | | 25 | % | | $ | 463 | |
| | 0.50 | % | | | 1.81 | % | | | 1.77 | % | | | 1.43 | % | | | 26 | % | | $ | 872 | |
| | 0.42 | % | | | 1.84 | % | | | 1.78 | % | | | 17.88 | % | | | 28 | % | | $ | 1,962 | |
| | 0.60 | % | | | 1.92 | % | | | 1.88 | % | | | 46.98 | % | | | 43 | % | | $ | 3,173 | |
| | | | | | | | | | | | | | | | | | | | | | |
| | 0.64 | % | | | 1.70 | % | | | 1.62 | % | | | 3.97 | % | | | 8 | % | | $ | 4,492 | |
| | 0.47 | % | | | 1.73 | % | | | 1.66 | % | | | 12.64 | % | | | 29 | % | | $ | 4,097 | |
| | 0.53 | % | | | 1.82 | % | | | 1.77 | % | | | 6.52 | % | | | 25 | % | | $ | 3,465 | |
| | 0.45 | % | | | 1.82 | % | | | 1.77 | % | | | 1.47 | % | | | 26 | % | | $ | 3,120 | |
| | 0.38 | % | | | 1.84 | % | | | 1.78 | % | | | 17.80 | % | | | 28 | % | | $ | 2,456 | |
| | 0.58 | % | | | 1.91 | % | | | 1.87 | % | | | 47.11 | % | | | 43 | % | | $ | 1,671 | |
| | | | | | | | | | | | | | | | | | | | | | |
| | 1.15 | % | | | 1.23 | % | | | 1.12 | % | | | 4.23 | % | | | 8 | % | | $ | 35 | |
| | 0.87 | % | | | 1.22 | % | | | 1.12 | % | | | 12.19 | % | | | 29 | % | | $ | 28 | |
| | | | | | | | | | | | | | | | | | | | | | |
| | 1.75 | % | | | 0.62 | % | | | 0.51 | % | | | 4.54 | % | | | 8 | % | | $ | 887,342 | |
| | 1.53 | % | | | 0.63 | % | | | 0.51 | % | | | 13.99 | % | | | 29 | % | | $ | 850,913 | |
| | 1.35 | % | | | 0.73 | % | | | 0.51 | % | | | 5.34 | % | | | 25 | % | | $ | 19,568 | |
| | | | | | | | | | | | | | | | | | | | | | |
| | 1.90 | % | | | 0.47 | % | | | 0.36 | % | | | 4.67 | % | | | 8 | % | | $ | 1,175,365 | |
| | 1.76 | % | | | 0.53 | % | | | 0.41 | % | | | 14.08 | % | | | 29 | % | | $ | 1,049,122 | |
| | 1.80 | % | | | 0.64 | % | | | 0.51 | % | | | 7.82 | % | | | 25 | % | | $ | 1,478,163 | |
| | 1.71 | % | | | 0.64 | % | | | 0.51 | % | | | 2.78 | % | | | 26 | % | | $ | 1,335,729 | |
| | 1.65 | % | | | 0.65 | % | | | 0.51 | % | | | 19.35 | % | | | 28 | % | | $ | 1,048,222 | |
| | 1.74 | % | | | 0.71 | % | | | 0.61 | % | | | 48.76 | % | | | 43 | % | | $ | 639,598 | |
| | | | | | | | | | | | | | | | | | | | | | |
| | 1.55 | % | | | 0.79 | % | | | 0.71 | % | | | 4.45 | % | | | 8 | % | | $ | 710,721 | |
| | 1.38 | % | | | 0.82 | % | | | 0.75 | % | | | 13.74 | % | | | 29 | % | | $ | 685,421 | |
| | 1.43 | % | | | 0.91 | % | | | 0.86 | % | | | 7.46 | % | | | 25 | % | | $ | 572,735 | |
| | 1.37 | % | | | 0.91 | % | | | 0.86 | % | | | 2.41 | % | | | 26 | % | | $ | 395,067 | |
| | 1.30 | % | | | 0.92 | % | | | 0.86 | % | | | 18.85 | % | | | 28 | % | | $ | 373,853 | |
| | 1.49 | % | | | 0.98 | % | | | 0.89 | % | | | 48.60 | % | | | 43 | % | | $ | 254,340 | |
| | | | | | | | | | | | | | | | | | | | | | |
| | 1.34 | % | | | 1.01 | % | | | 0.92 | % | | | 4.37 | % | | | 8 | % | | $ | 218,755 | |
| | 1.21 | % | | | 1.04 | % | | | 0.92 | % | | | 13.47 | % | | | 29 | % | | $ | 201,506 | |
| | 1.38 | % | | | 1.13 | % | | | 0.92 | % | | | 7.41 | % | | | 25 | % | | $ | 158,551 | |
| | 1.30 | % | | | 1.14 | % | | | 0.92 | % | | | 2.36 | % | | | 26 | % | | $ | 124,145 | |
| | 1.21 | % | | | 1.17 | % | | | 0.92 | % | | | 18.84 | % | | | 28 | % | | $ | 99,234 | |
| | 1.36 | % | | | 1.25 | % | | | 0.94 | % | | | 48.33 | % | | | 43 | % | | $ | 46,963 | |
The accompanying notes are an integral part of these financial statements.
| | | | |
| 66 | | Wells Fargo Advantage Dow Jones Target Date Funds | | Financial highlights |
| | | | | | | | | | | | | | | | | | | | | | | | |
| Target 2035 Fund | | Beginning
net asset
value per
share | | | Net
investment
income1 | | | Net realized
and unrealized
gains (losses)
on investments | | | Distributions
from net
investment
income | | | Distributions
from net
realized gains | | | Ending
net asset
value per
share | |
Class A | | | | | | | | | | | | | | | | | | | | | | | | |
Six months ended August 31, 2014 (unaudited) | | $ | 11.02 | | | | 0.08 | 4 | | | 0.45 | | | | (0.06 | ) | | | 0.00 | | | $ | 11.49 | |
Year ended February 28, 2014 | | $ | 9.99 | | | | 0.14 | | | | 1.41 | | | | (0.13 | ) | | | (0.39 | ) | | $ | 11.02 | |
Year ended February 28, 20135 | | $ | 9.60 | | | | 0.02 | 4 | | | 0.58 | | | | (0.05 | ) | | | (0.16 | ) | | $ | 9.99 | |
Class R | | | | | | | | | | | | | | | | | | | | | | | | |
Six months ended August 31, 2014 (unaudited) | | $ | 11.09 | | | | 0.06 | | | | 0.45 | | | | (0.04 | ) | | | 0.00 | | | $ | 11.56 | |
Year ended February 28, 20146 | | $ | 10.16 | | | | 0.06 | 4 | | | 1.32 | | | | (0.06 | ) | | | (0.39 | ) | | $ | 11.09 | |
Class R4 | | | | | | | | | | | | | | | | | | | | | | | | |
Six months ended August 31, 2014 (unaudited) | | $ | 11.03 | | | | 0.10 | | | | 0.44 | | | | (0.07 | ) | | | 0.00 | | | $ | 11.50 | |
Year ended February 28, 2014 | | $ | 9.99 | | | | 0.15 | | | | 1.44 | | | | (0.16 | ) | | | (0.39 | ) | | $ | 11.03 | |
Year ended February 28, 20135 | | $ | 9.60 | | | | 0.03 | 4 | | | 0.57 | | | | (0.05 | ) | | | (0.16 | ) | | $ | 9.99 | |
Class R67 | | | | | | | | | | | | | | | | | | | | | | | | |
Six months ended August 31, 2014 (unaudited) | | $ | 11.03 | | | | 0.10 | | | | 0.45 | | | | (0.08 | ) | | | 0.00 | | | $ | 11.50 | |
Year ended February 28, 2014 | | $ | 9.99 | | | | 0.19 | | | | 1.41 | | | | (0.17 | ) | | | (0.39 | ) | | $ | 11.03 | |
Year ended February 28, 2013 | | $ | 9.50 | | | | 0.17 | | | | 0.65 | | | | (0.17 | ) | | | (0.16 | ) | | $ | 9.99 | |
Year ended February 29, 2012 | | $ | 9.61 | | | | 0.15 | 4 | | | 0.02 | | | | (0.14 | ) | | | (0.14 | ) | | $ | 9.50 | |
Year ended February 28, 2011 | | $ | 8.19 | | | | 0.13 | | | | 1.58 | | | | (0.16 | ) | | | (0.13 | ) | | $ | 9.61 | |
Year ended February 28, 2010 | | $ | 5.36 | | | | 0.11 | 4 | | | 2.82 | | | | (0.10 | ) | | | 0.00 | | | $ | 8.19 | |
Administrator Class | | | | | | | | | | | | | | | | | | | | | | | | |
Six months ended August 31, 2014 (unaudited) | | $ | 11.06 | | | | 0.09 | | | | 0.44 | | | | (0.06 | ) | | | 0.00 | | | $ | 11.53 | |
Year ended February 28, 2014 | | $ | 10.02 | | | | 0.14 | | | | 1.43 | | | | (0.14 | ) | | | (0.39 | ) | | $ | 11.06 | |
Year ended February 28, 2013 | | $ | 9.53 | | | | 0.13 | | | | 0.66 | | | | (0.14 | ) | | | (0.16 | ) | | $ | 10.02 | |
Year ended February 29, 2012 | | $ | 9.65 | | | | 0.12 | 4 | | | 0.01 | | | | (0.11 | ) | | | (0.14 | ) | | $ | 9.53 | |
Year ended February 28, 2011 | | $ | 8.22 | | | | 0.10 | | | | 1.59 | | | | (0.13 | ) | | | (0.13 | ) | | $ | 9.65 | |
Year ended February 28, 2010 | | $ | 5.40 | | | | 0.09 | 4 | | | 2.81 | | | | (0.08 | ) | | | 0.00 | | | $ | 8.22 | |
Investor Class | | | | | | | | | | | | | | | | | | | | | | | | |
Six months ended August 31, 2014 (unaudited) | | $ | 11.10 | | | | 0.07 | | | | 0.45 | | | | (0.05 | ) | | | 0.00 | | | $ | 11.57 | |
Year ended February 28, 2014 | | $ | 10.05 | | | | 0.13 | | | | 1.43 | | | | (0.12 | ) | | | (0.39 | ) | | $ | 11.10 | |
Year ended February 28, 2013 | | $ | 9.56 | | | | 0.13 | | | | 0.65 | | | | (0.13 | ) | | | (0.16 | ) | | $ | 10.05 | |
Year ended February 29, 2012 | | $ | 9.67 | | | | 0.11 | 4 | | | 0.02 | | | | (0.10 | ) | | | (0.14 | ) | | $ | 9.56 | |
Year ended February 28, 2011 | | $ | 8.24 | | | | 0.10 | | | | 1.58 | | | | (0.12 | ) | | | (0.13 | ) | | $ | 9.67 | |
Year ended February 28, 2010 | | $ | 5.42 | | | | 0.08 | 4 | | | 2.82 | | | | (0.08 | ) | | | 0.00 | | | $ | 8.24 | |
| 1. | Includes net expenses allocated from affiliated Master Portfolios in which the Fund invests. |
| 2. | Total return calculations do not include any sales charges. Returns for periods of less than one year are not annualized. |
| 3. | Portfolio turnover rate is calculated by aggregating the results of multiplying the Fund’s investment percentage in the respective affiliated Master Portfolio by the corresponding affiliated Master Portfolio’s portfolio turnover rate. |
| 4. | Calculated based upon average shares outstanding |
| 5. | For the period from November 30, 2012 (commencement of class operations) to February 28, 2013 |
| 6. | For the period from June 28, 2013 (commencement of class operations) to February 28, 2014 |
| 7. | On June 1, 2013, Institutional Class was renamed Class R6. |
The accompanying notes are an integral part of these financial statements.
| | | | | | |
| Financial highlights | | Wells Fargo Advantage Dow Jones Target Date Funds | | | 67 | |
| | | | | | | | | | | | | | | | | | | | | | |
| Ratio to average net assets (annualized) | | | Total
return2 | | | Portfolio
turnover
rate3 | | | Net assets at
end of period (000s omitted) | |
Net investment
income1 | | | Gross
expenses1 | | | Net
expenses1 | | | | |
| | | | | | | | | | | | | | | | | | | | | | |
| | 1.36 | % | | | 0.97 | % | | | 0.88 | % | | | 4.81 | % | | | 6 | % | | $ | 1,085 | |
| | 1.11 | % | | | 0.98 | % | | | 0.88 | % | | | 15.82 | % | | | 26 | % | | $ | 532 | |
| | 1.04 | % | | | 1.07 | % | | | 0.88 | % | | | 6.36 | % | | | 22 | % | | $ | 41 | |
| | | | | | | | | | | | | | | | | | | | | | |
| | 1.13 | % | | | 1.22 | % | | | 1.13 | % | | | 4.63 | % | | | 6 | % | | $ | 30 | |
| | 0.79 | % | | | 1.26 | % | | | 1.13 | % | | | 13.76 | % | | | 26 | % | | $ | 28 | |
| | | | | | | | | | | | | | | | | | | | | | |
| | 1.72 | % | | | 0.64 | % | | | 0.52 | % | | | 4.95 | % | | | 6 | % | | $ | 310,896 | |
| | 1.45 | % | | | 0.65 | % | | | 0.52 | % | | | 16.28 | % | | | 26 | % | | $ | 297,612 | |
| | 1.30 | % | | | 0.75 | % | | | 0.52 | % | | | 6.38 | % | | | 22 | % | | $ | 1,940 | |
| | | | | | | | | | | | | | | | | | | | | | |
| | 1.87 | % | | | 0.49 | % | | | 0.37 | % | | | 5.02 | % | | | 6 | % | | $ | 628,807 | |
| | 1.71 | % | | | 0.55 | % | | | 0.41 | % | | | 16.41 | % | | | 26 | % | | $ | 570,482 | |
| | 1.76 | % | | | 0.66 | % | | | 0.52 | % | | | 8.86 | % | | | 22 | % | | $ | 648,345 | |
| | 1.60 | % | | | 0.66 | % | | | 0.52 | % | | | 1.96 | % | | | 22 | % | | $ | 481,784 | |
| | 1.52 | % | | | 0.68 | % | | | 0.52 | % | | | 21.21 | % | | | 24 | % | | $ | 338,577 | |
| | 1.40 | % | | | 0.75 | % | | | 0.57 | % | | | 54.85 | % | | | 34 | % | | $ | 170,172 | |
| | | | | | | | | | | | | | | | | | | | | | |
| | 1.52 | % | | | 0.81 | % | | | 0.72 | % | | | 4.84 | % | | | 6 | % | | $ | 250,171 | |
| | 1.33 | % | | | 0.85 | % | | | 0.75 | % | | | 15.96 | % | | | 26 | % | | $ | 236,217 | |
| | 1.36 | % | | | 0.93 | % | | | 0.87 | % | | | 8.48 | % | | | 22 | % | | $ | 172,860 | |
| | 1.26 | % | | | 0.93 | % | | | 0.87 | % | | | 1.55 | % | | | 22 | % | | $ | 77,039 | |
| | 1.17 | % | | | 0.94 | % | | | 0.87 | % | | | 20.87 | % | | | 24 | % | | $ | 50,226 | |
| | 1.20 | % | | | 1.06 | % | | | 0.89 | % | | | 53.96 | % | | | 34 | % | | $ | 25,950 | |
| | | | | | | | | | | | | | | | | | | | | | |
| | 1.32 | % | | | 1.03 | % | | | 0.93 | % | | | 4.72 | % | | | 6 | % | | $ | 201,145 | |
| | 1.21 | % | | | 1.08 | % | | | 0.93 | % | | | 15.77 | % | | | 26 | % | | $ | 193,717 | |
| | 1.35 | % | | | 1.15 | % | | | 0.93 | % | | | 8.38 | % | | | 22 | % | | $ | 310,066 | |
| | 1.21 | % | | | 1.16 | % | | | 0.93 | % | | | 1.60 | % | | | 22 | % | | $ | 244,138 | |
| | 1.09 | % | | | 1.19 | % | | | 0.93 | % | | | 20.74 | % | | | 24 | % | | $ | 204,364 | |
| | 1.09 | % | | | 1.34 | % | | | 0.95 | % | | | 53.70 | % | | | 34 | % | | $ | 60,611 | |
The accompanying notes are an integral part of these financial statements.
| | | | |
| 68 | | Wells Fargo Advantage Dow Jones Target Date Funds | | Financial highlights |
| | | | | | | | | | | | | | | | | | | | | | | | |
| Target 2040 Fund | | Beginning
net asset
value per
share | | | Net
investment
income1 | | | Net realized
and unrealized
gains (losses)
on investments | | | Distributions
from net
investment
income | | | Distributions
from net
realized gains | | | Ending
net asset
value per
share | |
Class A | | | | | | | | | | | | | | | | | | | | | | | | |
Six months ended August 31, 2014 (unaudited) | | $ | 18.90 | | | | 0.14 | | | | 0.83 | | | | (0.09 | ) | | | 0.00 | | | $ | 19.78 | |
Year ended February 28, 2014 | | $ | 16.92 | | | | 0.21 | | | | 2.71 | | | | (0.21 | ) | | | (0.73 | ) | | $ | 18.90 | |
Year ended February 28, 2013 | | $ | 16.07 | | | | 0.21 | | | | 1.19 | | | | (0.21 | ) | | | (0.34 | ) | | $ | 16.92 | |
Year ended February 29, 2012 | | $ | 16.40 | | | | 0.17 | | | | (0.07 | ) | | | (0.16 | ) | | | (0.27 | ) | | $ | 16.07 | |
Year ended February 28, 2011 | | $ | 13.60 | | | | 0.15 | | | | 2.81 | | | | (0.16 | ) | | | 0.00 | | | $ | 16.40 | |
Year ended February 28, 2010 | | $ | 8.73 | | | | 0.12 | 4 | | | 4.87 | | | | (0.12 | ) | | | (0.00 | )5 | | $ | 13.60 | |
Class B | | | | | | | | | | | | | | | | | | | | | | | | |
Six months ended August 31, 2014 (unaudited) | | $ | 18.06 | | | | 0.06 | 4 | | | 0.79 | | | | (0.00 | )8 | | | 0.00 | | | $ | 18.91 | |
Year ended February 28, 2014 | | $ | 16.18 | | | | 0.07 | 4 | | | 2.59 | | | | (0.05 | ) | | | (0.73 | ) | | $ | 18.06 | |
Year ended February 28, 2013 | | $ | 15.36 | | | | 0.09 | 4 | | | 1.13 | | | | (0.06 | ) | | | (0.34 | ) | | $ | 16.18 | |
Year ended February 29, 2012 | | $ | 15.67 | | | | 0.05 | 4 | | | (0.06 | ) | | | (0.03 | ) | | | (0.27 | ) | | $ | 15.36 | |
Year ended February 28, 2011 | | $ | 12.99 | | | | 0.03 | 4 | | | 2.70 | | | | (0.05 | ) | | | 0.00 | | | $ | 15.67 | |
Year ended February 28, 2010 | | $ | 8.35 | | | | 0.10 | 4 | | | 4.57 | | | | (0.03 | ) | | | (0.00 | )5 | | $ | 12.99 | |
Class C | | | | | | | | | | | | | | | | | | | | | | | | |
Six months ended August 31, 2014 (unaudited) | | $ | 17.85 | | | | 0.05 | 4 | | | 0.79 | | | | (0.04 | ) | | | 0.00 | | | $ | 18.65 | |
Year ended February 28, 2014 | | $ | 16.03 | | | | 0.07 | 4 | | | 2.57 | | | | (0.09 | ) | | | (0.73 | ) | | $ | 17.85 | |
Year ended February 28, 2013 | | $ | 15.26 | | | | 0.09 | 4 | | | 1.12 | | | | (0.10 | ) | | | (0.34 | ) | | $ | 16.03 | |
Year ended February 29, 2012 | | $ | 15.60 | | | | 0.04 | 4 | | | (0.05 | ) | | | (0.06 | ) | | | (0.27 | ) | | $ | 15.26 | |
Year ended February 28, 2011 | | $ | 12.95 | | | | 0.03 | 4 | | | 2.69 | | | | (0.07 | ) | | | 0.00 | | | $ | 15.60 | |
Year ended February 28, 2010 | | $ | 8.33 | | | | 0.05 | 4 | | | 4.61 | | | | (0.04 | ) | | | (0.00 | )5 | | $ | 12.95 | |
Class R | | | | | | | | | | | | | | | | | | | | | | | | |
Six months ended August 31, 2014 (unaudited) | | $ | 18.90 | | | | 0.09 | | | | 0.85 | | | | (0.08 | ) | | | 0.00 | | | $ | 19.76 | |
Year ended February 28, 20146 | | $ | 17.19 | | | | 0.09 | 4 | | | 2.45 | | | | (0.10 | ) | | | (0.73 | ) | | $ | 18.90 | |
Class R4 | | | | | | | | | | | | | | | | | | | | | | | | |
Six months ended August 31, 2014 (unaudited) | | $ | 19.28 | | | | 0.17 | | | | 0.85 | | | | (0.13 | ) | | | 0.00 | | | $ | 20.17 | |
Year ended February 28, 2014 | | $ | 17.24 | | | | 0.27 | 4 | | | 2.78 | | | | (0.28 | ) | | | (0.73 | ) | | $ | 19.28 | |
Year ended February 28, 20137 | | $ | 16.52 | | | | 0.09 | | | | 1.06 | | | | (0.09 | ) | | | (0.34 | ) | | $ | 17.24 | |
Class R68 | | | | | | | | | | | | | | | | | | | | | | | | |
Six months ended August 31, 2014 (unaudited) | | $ | 19.27 | | | | 0.18 | 4 | | | 0.86 | | | | (0.14 | ) | | | 0.00 | | | $ | 20.17 | |
Year ended February 28, 2014 | | $ | 17.24 | | | | 0.31 | 4 | | | 2.75 | | | | (0.30 | ) | | | (0.73 | ) | | $ | 19.27 | |
Year ended February 28, 2013 | | $ | 16.37 | | | | 0.29 | | | | 1.21 | | | | (0.29 | ) | | | (0.34 | ) | | $ | 17.24 | |
Year ended February 29, 2012 | | $ | 16.69 | | | | 0.24 | | | | (0.05 | ) | | | (0.24 | ) | | | (0.27 | ) | | $ | 16.37 | |
Year ended February 28, 2011 | | $ | 13.84 | | | | 0.22 | | | | 2.87 | | | | (0.24 | ) | | | 0.00 | | | $ | 16.69 | |
Year ended February 28, 2010 | | $ | 8.88 | | | | 0.18 | 4 | | | 4.95 | | | | (0.17 | ) | | | (0.00 | )5 | | $ | 13.84 | |
Administrator Class | | | | | | | | | | | | | | | | | | | | | | | | |
Six months ended August 31, 2014 (unaudited) | | $ | 19.25 | | | | 0.15 | | | | 0.85 | | | | (0.11 | ) | | | 0.00 | | | $ | 20.14 | |
Year ended February 28, 2014 | | $ | 17.21 | | | | 0.24 | | | | 2.77 | | | | (0.24 | ) | | | (0.73 | ) | | $ | 19.25 | |
Year ended February 28, 2013 | | $ | 16.34 | | | | 0.22 | | | | 1.22 | | | | (0.23 | ) | | | (0.34 | ) | | $ | 17.21 | |
Year ended February 29, 2012 | | $ | 16.67 | | | | 0.19 | | | | (0.06 | ) | | | (0.19 | ) | | | (0.27 | ) | | $ | 16.34 | |
Year ended February 28, 2011 | | $ | 13.82 | | | | 0.16 | | | | 2.88 | | | | (0.19 | ) | | | 0.00 | | | $ | 16.67 | |
Year ended February 28, 2010 | | $ | 8.88 | | | | 0.16 | 4 | | | 4.93 | | | | (0.15 | ) | | | (0.00 | )5 | | $ | 13.82 | |
Investor Class | | | | | | | | | | | | | | | | | | | | | | | | |
Six months ended August 31, 2014 (unaudited) | | $ | 19.21 | | | | 0.13 | | | | 0.84 | | | | (0.09 | ) | | | 0.00 | | | $ | 20.09 | |
Year ended February 28, 2014 | | $ | 17.19 | | | | 0.21 | | | | 2.75 | | | | (0.21 | ) | | | (0.73 | ) | | $ | 19.21 | |
Year ended February 28, 2013 | | $ | 16.32 | | | | 0.22 | | | | 1.22 | | | | (0.23 | ) | | | (0.34 | ) | | $ | 17.19 | |
Year ended February 29, 2012 | | $ | 16.65 | | | | 0.18 | | | | (0.06 | ) | | | (0.18 | ) | | | (0.27 | ) | | $ | 16.32 | |
Year ended February 28, 2011 | | $ | 13.81 | | | | 0.16 | | | | 2.86 | | | | (0.18 | ) | | | 0.00 | | | $ | 16.65 | |
Year ended February 28, 2010 | | $ | 8.87 | | | | 0.15 | 4 | | | 4.93 | | | | (0.14 | ) | | | (0.00 | )5 | | $ | 13.81 | |
| 1. | Includes net expenses allocated from affiliated Master Portfolios in which the Fund invests. |
| 2. | Total return calculations do not include any sales charges. Returns for periods of less than one year are not annualized. |
| 3. | Portfolio turnover rate is calculated by aggregating the results of multiplying the Fund’s investment percentage in the respective affiliated Master Portfolio by the corresponding affiliated Master Portfolio’s portfolio turnover rate. |
| 4. | Calculated based upon average shares outstanding |
| 5. | Amount is less than $0.005. |
| 6. | For the period from June 28, 2013 (commencement of class operations) to February 28, 2014 |
| 7. | For the period from November 30, 2012 (commencement of class operations) to February 28, 2013 |
| 8. | On June 1, 2013, Institutional Class was renamed Class R6. |
The accompanying notes are an integral part of these financial statements.
| | | | | | |
| Financial highlights | | Wells Fargo Advantage Dow Jones Target Date Funds | | | 69 | |
| | | | | | | | | | | | | | | | | | | | | | |
| Ratio to average net assets (annualized) | | | Total
return2 | | | Portfolio
turnover
rate3 | | | Net assets at
end of period
(000s omitted) | |
Net investment
income1 | | | Gross
expenses1 | | | Net
expenses1 | | | | |
| | | | | | | | | | | | | | | | | | | | | | |
| | 1.36 | % | | | 0.96 | % | | | 0.88 | % | | | 5.16 | % | | | 5 | % | | $ | 112,580 | |
| | 1.15 | % | | | 0.99 | % | | | 0.92 | % | | | 17.54 | % | | | 25 | % | | $ | 114,233 | |
| | 1.25 | % | | | 1.08 | % | | | 1.03 | % | | | 8.99 | % | | | 20 | % | | $ | 104,836 | |
| | 1.06 | % | | | 1.08 | % | | | 1.03 | % | | | 0.85 | % | | | 20 | % | | $ | 103,841 | |
| | 0.95 | % | | | 1.10 | % | | | 1.04 | % | | | 21.98 | % | | | 21 | % | | $ | 113,494 | |
| | 1.03 | % | | | 1.17 | % | | | 1.12 | % | | | 57.33 | % | | | 29 | % | | $ | 100,278 | |
| | | | | | | | | | | | | | | | | | | | | | |
| | 0.64 | % | | | 1.70 | % | | | 1.63 | % | | | 4.72 | % | | | 5 | % | | $ | 195 | |
| | 0.42 | % | | | 1.75 | % | | | 1.68 | % | | | 16.63 | % | | | 25 | % | | $ | 344 | |
| | 0.54 | % | | | 1.83 | % | | | 1.78 | % | | | 8.15 | % | | | 20 | % | | $ | 747 | |
| | 0.34 | % | | | 1.83 | % | | | 1.78 | % | | | 0.12 | % | | | 20 | % | | $ | 1,564 | |
| | 0.23 | % | | | 1.86 | % | | | 1.79 | % | | | 21.08 | % | | | 21 | % | | $ | 2,863 | |
| | 0.86 | % | | | 1.93 | % | | | 1.89 | % | | | 56.01 | % | | | 29 | % | | $ | 3,876 | |
| | | | | | | | | | | | | | | | | | | | | | |
| | 0.60 | % | | | 1.71 | % | | | 1.63 | % | | | 4.72 | % | | | 5 | % | | $ | 5,660 | |
| | 0.40 | % | | | 1.74 | % | | | 1.67 | % | | | 16.68 | % | | | 25 | % | | $ | 4,813 | |
| | 0.50 | % | | | 1.83 | % | | | 1.78 | % | | | 8.18 | % | | | 20 | % | | $ | 4,040 | |
| | 0.30 | % | | | 1.83 | % | | | 1.78 | % | | | 0.14 | % | | | 20 | % | | $ | 3,623 | |
| | 0.19 | % | | | 1.85 | % | | | 1.79 | % | | | 21.08 | % | | | 21 | % | | $ | 3,038 | |
| | 0.41 | % | | | 1.92 | % | | | 1.87 | % | | | 56.02 | % | | | 29 | % | | $ | 2,226 | |
| | | | | | | | | | | | | | | | | | | | | | |
| | 1.11 | % | | | 1.25 | % | | | 1.13 | % | | | 4.96 | % | | | 5 | % | | $ | 30 | |
| | 0.75 | % | | | 1.24 | % | | | 1.13 | % | | | 14.96 | % | | | 25 | % | | $ | 29 | |
| | | | | | | | | | | | | | | | | | | | | | |
| | 1.71 | % | | | 0.63 | % | | | 0.52 | % | | | 5.28 | % | | | 5 | % | | $ | 671,239 | |
| | 1.42 | % | | | 0.64 | % | | | 0.52 | % | | | 18.02 | % | | | 25 | % | | $ | 635,241 | |
| | 1.12 | % | | | 0.75 | % | | | 0.52 | % | | | 7.13 | % | | | 20 | % | | $ | 13,651 | |
| | | | | | | | | | | | | | | | | | | | | | |
| | 1.86 | % | | | 0.48 | % | | | 0.37 | % | | | 5.40 | % | | | 5 | % | | $ | 831,601 | |
| | 1.70 | % | | | 0.54 | % | | | 0.42 | % | | | 18.14 | % | | | 25 | % | | $ | 724,856 | |
| | 1.76 | % | | | 0.65 | % | | | 0.52 | % | | | 9.50 | % | | | 20 | % | | $ | 993,528 | |
| | 1.55 | % | | | 0.65 | % | | | 0.52 | % | | | 1.37 | % | | | 20 | % | | $ | 846,499 | |
| | 1.44 | % | | | 0.67 | % | | | 0.52 | % | | | 22.66 | % | | | 21 | % | | $ | 654,804 | |
| | 1.42 | % | | | 0.72 | % | | | 0.62 | % | | | 58.11 | % | | | 29 | % | | $ | 377,937 | |
| | | | | | | | | | | | | | | | | | | | | | |
| | 1.51 | % | | | 0.80 | % | | | 0.72 | % | | | 5.19 | % | | | 5 | % | | $ | 469,686 | |
| | 1.30 | % | | | 0.83 | % | | | 0.76 | % | | | 17.79 | % | | | 25 | % | | $ | 452,487 | |
| | 1.39 | % | | | 0.92 | % | | | 0.87 | % | | | 9.14 | % | | | 20 | % | | $ | 360,567 | |
| | 1.22 | % | | | 0.92 | % | | | 0.87 | % | | | 1.00 | % | | | 20 | % | | $ | 256,378 | |
| | 1.11 | % | | | 0.94 | % | | | 0.87 | % | | | 22.21 | % | | | 21 | % | | $ | 260,524 | |
| | 1.26 | % | | | 0.99 | % | | | 0.90 | % | | | 57.54 | % | | | 29 | % | | $ | 176,917 | |
| | | | | | | | | | | | | | | | | | | | | | |
| | 1.30 | % | | | 1.02 | % | | | 0.93 | % | | | 5.12 | % | | | 5 | % | | $ | 134,333 | |
| | 1.13 | % | | | 1.05 | % | | | 0.93 | % | | | 17.53 | % | | | 25 | % | | $ | 119,774 | |
| | 1.33 | % | | | 1.14 | % | | | 0.93 | % | | | 9.10 | % | | | 20 | % | | $ | 86,745 | |
| | 1.14 | % | | | 1.15 | % | | | 0.93 | % | | | 0.96 | % | | | 20 | % | | $ | 64,452 | |
| | 1.01 | % | | | 1.18 | % | | | 0.93 | % | | | 22.10 | % | | | 21 | % | | $ | 48,906 | |
| | 1.16 | % | | | 1.27 | % | | | 0.96 | % | | | 57.54 | % | | | 29 | % | | $ | 20,959 | |
The accompanying notes are an integral part of these financial statements.
| | | | |
| 70 | | Wells Fargo Advantage Dow Jones Target Date Funds | | Financial highlights |
| | | | | | | | | | | | | | | | | | | | | | | | |
| Target 2045 Fund | | Beginning
net asset
value per
share | | | Net
investment
income1 | | | Net realized
and unrealized
gains (losses)
on investments | | | Distributions
from net
investment
income | | | Distributions
from net
realized gains | | | Ending
net asset
value per
share | |
Class A | | | | | | | | | | | | | | | | | | | | | | | | |
Six months ended August 31, 2014 (unaudited) | | $ | 11.43 | | | | 0.08 | | | | 0.53 | | | | (0.06 | ) | | | 0.00 | | | $ | 11.98 | |
Year ended February 28, 2014 | | $ | 10.17 | | | | 0.12 | 4 | | | 1.73 | | | | (0.14 | ) | | | (0.45 | ) | | $ | 11.43 | |
Year ended February 28, 20135 | | $ | 9.64 | | | | 0.03 | | | | 0.68 | | | | (0.05 | ) | | | (0.13 | ) | | $ | 10.17 | |
Class R | | | | | | | | | | | | | | | | | | | | | | | | |
Six months ended August 31, 2014 (unaudited) | | $ | 11.54 | | | | 0.06 | | | | 0.54 | | | | (0.05 | ) | | | 0.00 | | | $ | 12.09 | |
Year ended February 28, 20146 | | $ | 10.45 | | | | 0.05 | | | | 1.55 | | | | (0.06 | ) | | | (0.45 | ) | | $ | 11.54 | |
Class R4 | | | | | | | | | | | | | | | | | | | | | | | | |
Six months ended August 31, 2014 (unaudited) | | $ | 11.46 | | | | 0.10 | | | | 0.53 | | | | (0.08 | ) | | | 0.00 | | | $ | 12.01 | |
Year ended February 28, 2014 | | $ | 10.18 | | | | 0.14 | | | | 1.76 | | | | (0.17 | ) | | | (0.45 | ) | | $ | 11.46 | |
Year ended February 28, 20135 | | $ | 9.64 | | | | 0.06 | | | | 0.66 | | | | (0.05 | ) | | | (0.13 | ) | | $ | 10.18 | |
Class R67 | | | | | | | | | | | | | | | | | | | | | | | | |
Six months ended August 31, 2014 (unaudited) | | $ | 11.44 | | | | 0.11 | | | | 0.53 | | | | (0.08 | ) | | | 0.00 | | | $ | 12.00 | |
Year ended February 28, 2014 | | $ | 10.17 | | | | 0.19 | | | | 1.71 | | | | (0.18 | ) | | | (0.45 | ) | | $ | 11.44 | |
Year ended February 28, 2013 | | $ | 9.55 | | | | 0.16 | | | | 0.76 | | | | (0.17 | ) | | | (0.13 | ) | | $ | 10.17 | |
Year ended February 29, 2012 | | $ | 9.62 | | | | 0.14 | | | | (0.05 | ) | | | (0.12 | ) | | | (0.04 | ) | | $ | 9.55 | |
Year ended February 28, 2011 | | $ | 8.08 | | | | 0.13 | | | | 1.70 | | | | (0.18 | ) | | | (0.11 | ) | | $ | 9.62 | |
Year ended February 28, 2010 | | $ | 5.19 | | | | 0.10 | 4 | | | 2.90 | | | | (0.09 | ) | | | (0.02 | ) | | $ | 8.08 | |
Administrator Class | | | | | | | | | | | | | | | | | | | | | | | | |
Six months ended August 31, 2014 (unaudited) | | $ | 11.51 | | | | 0.09 | | | | 0.52 | | | | (0.06 | ) | | | 0.00 | | | $ | 12.06 | |
Year ended February 28, 2014 | | $ | 10.23 | | | | 0.14 | | | | 1.73 | | | | (0.14 | ) | | | (0.45 | ) | | $ | 11.51 | |
Year ended February 28, 2013 | | $ | 9.59 | | | | 0.12 | | | | 0.77 | | | | (0.12 | ) | | | (0.13 | ) | | $ | 10.23 | |
Year ended February 29, 2012 | | $ | 9.66 | | | | 0.11 | | | | (0.05 | ) | | | (0.09 | ) | | | (0.04 | ) | | $ | 9.59 | |
Year ended February 28, 2011 | | $ | 8.12 | | | | 0.09 | | | | 1.72 | | | | (0.16 | ) | | | (0.11 | ) | | $ | 9.66 | |
Year ended February 28, 2010 | | $ | 5.21 | | | | 0.08 | 4 | | | 2.92 | | | | (0.07 | ) | | | (0.02 | ) | | $ | 8.12 | |
Investor Class | | | | | | | | | | | | | | | | | | | | | | | | |
Six months ended August 31, 2014 (unaudited) | | $ | 11.55 | | | | 0.08 | | | | 0.52 | | | | (0.05 | ) | | | 0.00 | | | $ | 12.10 | |
Year ended February 28, 2014 | | $ | 10.26 | | | | 0.13 | | | | 1.73 | | | | (0.12 | ) | | | (0.45 | ) | | $ | 11.55 | |
Year ended February 28, 2013 | | $ | 9.62 | | | | 0.12 | | | | 0.77 | | | | (0.12 | ) | | | (0.13 | ) | | $ | 10.26 | |
Year ended February 29, 2012 | | $ | 9.69 | | | | 0.11 | | | | (0.05 | ) | | | (0.09 | ) | | | (0.04 | ) | | $ | 9.62 | |
Year ended February 28, 2011 | | $ | 8.14 | | | | 0.08 | | | | 1.73 | | | | (0.15 | ) | | | (0.11 | ) | | $ | 9.69 | |
Year ended February 28, 2010 | | $ | 5.23 | | | | 0.09 | 4 | | | 2.91 | | | | (0.07 | ) | | | (0.02 | ) | | $ | 8.14 | |
| 1. | Includes net expenses allocated from affiliated Master Portfolios in which the Fund invests. |
| 2. | Total return calculations do not include any sales charges. Returns for periods of less than one year are not annualized. |
| 3. | Portfolio turnover rate is calculated by aggregating the results of multiplying the Fund’s investment percentage in the respective affiliated Master Portfolio by the corresponding affiliated Master Portfolio’s portfolio turnover rate. |
| 4. | Calculated based upon average shares outstanding |
| 5. | For the period from November 30, 2012 (commencement of class operations) to February 28, 2013 |
| 6. | For the period from June 28, 2013 (commencement of class operations) to February 28, 2014 |
| 7. | On June 1, 2013, Institutional Class was renamed Class R6. |
The accompanying notes are an integral part of these financial statements.
| | | | | | |
| Financial highlights | | Wells Fargo Advantage Dow Jones Target Date Funds | | | 71 | |
| | | | | | | | | | | | | | | | | | | | | | |
| Ratio to average net assets (annualized) | | | Total
return2 | | | Portfolio
turnover
rate3 | | | Net assets at
end of period
(000s omitted) | |
Net investment
income 1 | | | Gross
expenses1 | | | Net
expenses1 | | | | |
| | | | | | | | | | | | | | | | | | | | | | |
| | 1.35 | % | | | 0.99 | % | | | 0.88 | % | | | 5.36 | % | | | 4 | % | | $ | 507 | |
| | 1.09 | % | | | 1.01 | % | | | 0.88 | % | | | 18.54 | % | | | 24 | % | | $ | 167 | |
| | 1.08 | % | | | 1.10 | % | | | 0.88 | % | | | 7.41 | % | | | 19 | % | | $ | 13 | |
| | | | | | | | | | | | | | | | | | | | | | |
| | 1.10 | % | | | 1.26 | % | | | 1.13 | % | | | 5.17 | % | | | 4 | % | | $ | 30 | |
| | 0.68 | % | | | 1.30 | % | | | 1.13 | % | | | 15.52 | % | | | 24 | % | | $ | 29 | |
| | | | | | | | | | | | | | | | | | | | | | |
| | 1.70 | % | | | 0.66 | % | | | 0.52 | % | | | 5.56 | % | | | 4 | % | | $ | 184,344 | |
| | 1.39 | % | | | 0.68 | % | | | 0.52 | % | | | 18.99 | % | | | 24 | % | | $ | 174,582 | |
| | 1.29 | % | | | 0.78 | % | | | 0.52 | % | | | 7.55 | % | | | 19 | % | | $ | 1,246 | |
| | | | | | | | | | | | | | | | | | | | | | |
| | 1.85 | % | | | 0.51 | % | | | 0.37 | % | | | 5.64 | % | | | 4 | % | | $ | 337,106 | |
| | 1.67 | % | | | 0.57 | % | | | 0.42 | % | | | 19.07 | % | | | 24 | % | | $ | 291,293 | |
| | 1.74 | % | | | 0.69 | % | | | 0.52 | % | | | 9.85 | % | | | 19 | % | | $ | 324,476 | |
| | 1.51 | % | | | 0.67 | % | | | 0.52 | % | | | 1.16 | % | | | 19 | % | | $ | 215,067 | |
| | 1.26 | % | | | 0.70 | % | | | 0.52 | % | | | 23.08 | % | | | 20 | % | | $ | 141,871 | |
| | 1.26 | % | | | 0.95 | % | | | 0.59 | % | | | 58.02 | % | | | 27 | % | | $ | 51,776 | |
| | | | | | | | | | | | | | | | | | | | | | |
| | 1.51 | % | | | 0.83 | % | | | 0.72 | % | | | 5.36 | % | | | 4 | % | | $ | 137,256 | |
| | 1.28 | % | | | 0.87 | % | | | 0.75 | % | | | 18.65 | % | | | 24 | % | | $ | 126,533 | |
| | 1.35 | % | | | 0.96 | % | | | 0.87 | % | | | 9.49 | % | | | 19 | % | | $ | 85,590 | |
| | 1.18 | % | | | 0.94 | % | | | 0.87 | % | | | 0.85 | % | | | 19 | % | | $ | 39,964 | |
| | 1.02 | % | | | 0.97 | % | | | 0.87 | % | | | 22.56 | % | | | 20 | % | | $ | 27,698 | |
| | 1.11 | % | | | 1.22 | % | | | 0.89 | % | | | 57.87 | % | | | 27 | % | | $ | 14,948 | |
| | | | | | | | | | | | | | | | | | | | | | |
| | 1.31 | % | | | 1.05 | % | | | 0.93 | % | | | 5.24 | % | | | 4 | % | | $ | 112,499 | |
| | 1.18 | % | | | 1.10 | % | | | 0.93 | % | | | 18.44 | % | | | 24 | % | | $ | 110,633 | |
| | 1.32 | % | | | 1.18 | % | | | 0.93 | % | | | 9.39 | % | | | 19 | % | | $ | 178,137 | |
| | 1.12 | % | | | 1.17 | % | | | 0.93 | % | | | 0.80 | % | | | 19 | % | | $ | 115,546 | |
| | 0.98 | % | | | 1.21 | % | | | 0.93 | % | | | 22.58 | % | | | 20 | % | | $ | 84,881 | |
| | 1.12 | % | | | 1.51 | % | | | 0.95 | % | | | 57.49 | % | | | 27 | % | | $ | 12,352 | |
The accompanying notes are an integral part of these financial statements.
| | | | |
| 72 | | Wells Fargo Advantage Dow Jones Target Date Funds | | Financial highlights |
| | | | | | | | | | | | | | | | | | | | | | | | |
| Target 2050 Fund | | Beginning
net asset
value per
share | | | Net
investment
income1 | | | Net realized
and unrealized
gains (losses)
on investments | | | Distributions
from net
investment
income | | | Distributions
from net
realized gains | | | Ending
net asset
value per
share | |
Class A | | | | | | | | | | | | | | | | | | | | | | | | |
Six months ended August 31, 2014 (unaudited) | | $ | 10.93 | | | | 0.07 | 4 | | | 0.52 | | | | (0.07 | ) | | | 0.00 | | | $ | 11.45 | |
Year ended February 28, 2014 | | $ | 9.72 | | | | 0.15 | | | | 1.62 | | | | (0.13 | ) | | | (0.43 | ) | | $ | 10.93 | |
Year ended February 28, 20135 | | $ | 9.29 | | | | 0.03 | | | | 0.65 | | | | (0.05 | ) | | | (0.20 | ) | | $ | 9.72 | |
Class C | | | | | | | | | | | | | | | | | | | | | | | | |
Six months ended August 31, 2014 (unaudited) | | $ | 10.91 | | | | 0.03 | | | | 0.52 | | | | (0.04 | ) | | | 0.00 | | | $ | 11.42 | |
Year ended February 28, 2014 | | $ | 9.71 | | | | 0.08 | | | | 1.61 | | | | (0.06 | ) | | | (0.43 | ) | | $ | 10.91 | |
Year ended February 28, 20135 | | $ | 9.29 | | | | 0.02 | | | | 0.64 | | | | (0.04 | ) | | | (0.20 | ) | | $ | 9.71 | |
Class R | | | | | | | | | | | | | | | | | | | | | | | | |
Six months ended August 31, 2014 (unaudited) | | $ | 10.95 | | | | 0.06 | | | | 0.51 | | | | (0.04 | ) | | | 0.00 | | | $ | 11.48 | |
Year ended February 28, 20146 | | $ | 9.91 | | | | 0.05 | | | | 1.48 | | | | (0.06 | ) | | | (0.43 | ) | | $ | 10.95 | |
Class R4 | | | | | | | | | | | | | | | | | | | | | | | | |
Six months ended August 31, 2014 (unaudited) | | $ | 10.96 | | | | 0.10 | | | | 0.50 | | | | (0.07 | ) | | | 0.00 | | | $ | 11.49 | |
Year ended February 28, 2014 | | $ | 9.73 | | | | 0.15 | 4 | | | 1.67 | | | | (0.16 | ) | | | (0.43 | ) | | $ | 10.96 | |
Year ended February 28, 20135 | | $ | 9.29 | | | | 0.05 | | | | 0.64 | | | | (0.05 | ) | | | (0.20 | ) | | $ | 9.73 | |
Class R67 | | | | | | | | | | | | | | | | | | | | | | | | |
Six months ended August 31, 2014 (unaudited) | | $ | 10.95 | | | | 0.10 | | | | 0.52 | | | | (0.08 | ) | | | 0.00 | | | $ | 11.49 | |
Year ended February 28, 2014 | | $ | 9.72 | | | | 0.17 | 4 | | | 1.66 | | | | (0.17 | ) | | | (0.43 | ) | | $ | 10.95 | |
Year ended February 28, 2013 | | $ | 9.20 | | | | 0.16 | | | | 0.72 | | | | (0.16 | ) | | | (0.20 | ) | | $ | 9.72 | |
Year ended February 29, 2012 | | $ | 9.50 | | | | 0.14 | | | | (0.07 | ) | | | (0.12 | ) | | | (0.25 | ) | | $ | 9.20 | |
Year ended February 28, 2011 | | $ | 8.10 | | | | 0.12 | 4 | | | 1.72 | | | | (0.17 | ) | | | (0.27 | ) | | $ | 9.50 | |
Year ended February 28, 2010 | | $ | 5.20 | | | | 0.10 | | | | 2.92 | | | | (0.09 | ) | | | (0.03 | ) | | $ | 8.10 | |
Administrator Class | | | | | | | | | | | | | | | | | | | | | | | | |
Six months ended August 31, 2014 (unaudited) | | $ | 10.92 | | | | 0.08 | | | | 0.52 | | | | (0.06 | ) | | | 0.00 | | | $ | 11.46 | |
Year ended February 28, 2014 | | $ | 9.70 | | | | 0.13 | 4 | | | 1.65 | | | | (0.13 | ) | | | (0.43 | ) | | $ | 10.92 | |
Year ended February 28, 2013 | | $ | 9.18 | | | | 0.12 | 4 | | | 0.73 | | | | (0.13 | ) | | | (0.20 | ) | | $ | 9.70 | |
Year ended February 29, 2012 | | $ | 9.48 | | | | 0.11 | | | | (0.07 | ) | | | (0.09 | ) | | | (0.25 | ) | | $ | 9.18 | |
Year ended February 28, 2011 | | $ | 8.10 | | | | 0.09 | 4 | | | 1.71 | | | | (0.15 | ) | | | (0.27 | ) | | $ | 9.48 | |
Year ended February 28, 2010 | | $ | 5.20 | | | | 0.09 | | | | 2.91 | | | | (0.07 | ) | | | (0.03 | ) | | $ | 8.10 | |
Investor Class | | | | | | | | | | | | | | | | | | | | | | | | |
Six months ended August 31, 2014 (unaudited) | | $ | 10.96 | | | | 0.07 | | | | 0.51 | | | | (0.05 | ) | | | 0.00 | | | $ | 11.49 | |
Year ended February 28, 2014 | | $ | 9.73 | | | | 0.11 | | | | 1.67 | | | | (0.12 | ) | | | (0.43 | ) | | $ | 10.96 | |
Year ended February 28, 2013 | | $ | 9.21 | | | | 0.12 | | | | 0.73 | | | | (0.13 | ) | | | (0.20 | ) | | $ | 9.73 | |
Year ended February 29, 2012 | | $ | 9.51 | | | | 0.10 | | | | (0.06 | ) | | | (0.09 | ) | | | (0.25 | ) | | $ | 9.21 | |
Year ended February 28, 2011 | | $ | 8.11 | | | | 0.09 | 4 | | | 1.71 | | | | (0.13 | ) | | | (0.27 | ) | | $ | 9.51 | |
Year ended February 28, 2010 | | $ | 5.21 | | | | 0.07 | | | | 2.93 | | | | (0.07 | ) | | | (0.03 | ) | | $ | 8.11 | |
| 1. | Includes net expenses allocated from affiliated Master Portfolios in which the Fund invests. |
| 2. | Total return calculations do not include any sales charges. Returns for periods of less than one year are not annualized. |
| 3. | Portfolio turnover rate is calculated by aggregating the results of multiplying the Fund’s investment percentage in the respective affiliated Master Portfolio by the corresponding affiliated Master Portfolio’s portfolio turnover rate. |
| 4. | Calculated based upon average shares outstanding |
| 5. | For the period from November 30, 2012 (commencement of class operations) to February 28, 2013 |
| 6. | For the period from June 28, 2013 (commencement of class operations) to February 28, 2014 |
| 7. | On June 1, 2013, Institutional Class was renamed Class R6. |
The accompanying notes are an integral part of these financial statements.
| | | | | | |
| Financial highlights | | Wells Fargo Advantage Dow Jones Target Date Funds | | | 73 | |
| | | | | | | | | | | | | | | | | | | | | | |
| Ratio to average net assets (annualized) | | | Total
return2 | | | Portfolio
turnover
rate3 | | | Net assets at
end of period
(000s omitted) | |
Net investment
income1 | | | Gross
expenses1 | | | Net
expenses1 | | | | |
| | | | | | | | | | | | | | | | | | | | | | |
| | 1.22 | % | | | 0.97 | % | | | 0.88 | % | | | 5.37 | % | | | 4 | % | | $ | 1,320 | |
| | 1.00 | % | | | 0.98 | % | | | 0.88 | % | | | 18.62 | % | | | 23 | % | | $ | 210 | |
| | 1.07 | % | | | 1.05 | % | | | 0.88 | % | | | 7.49 | % | | | 19 | % | | $ | 11 | |
| | | | | | | | | | | | | | | | | | | | | | |
| | 0.54 | % | | | 1.72 | % | | | 1.63 | % | | | 5.03 | % | | | 4 | % | | $ | 456 | |
| | 0.39 | % | | | 1.73 | % | | | 1.63 | % | | | 17.68 | % | | | 23 | % | | $ | 163 | |
| | 0.16 | % | | | 1.81 | % | | | 1.63 | % | | | 7.31 | % | | | 19 | % | | $ | 17 | |
| | | | | | | | | | | | | | | | | | | | | | |
| | 1.09 | % | | | 1.26 | % | | | 1.13 | % | | | 5.23 | % | | | 4 | % | | $ | 30 | |
| | 0.69 | % | | | 1.27 | % | | | 1.13 | % | | | 15.67 | % | | | 23 | % | | $ | 29 | |
| | | | | | | | | | | | | | | | | | | | | | |
| | 1.70 | % | | | 0.64 | % | | | 0.52 | % | | | 5.49 | % | | | 4 | % | | $ | 343,600 | |
| | 1.39 | % | | | 0.65 | % | | | 0.52 | % | | | 19.10 | % | | | 23 | % | | $ | 307,320 | |
| | 1.03 | % | | | 0.76 | % | | | 0.52 | % | | | 7.63 | % | | | 19 | % | | $ | 6,538 | |
| | | | | | | | | | | | | | | | | | | | | | |
| | 1.86 | % | | | 0.49 | % | | | 0.37 | % | | | 5.66 | % | | | 4 | % | | $ | 764,989 | |
| | 1.66 | % | | | 0.55 | % | | | 0.41 | % | | | 19.28 | % | | | 23 | % | | $ | 693,648 | |
| | 1.75 | % | | | 0.67 | % | | | 0.52 | % | | | 9.94 | % | | | 19 | % | | $ | 754,088 | |
| | 1.53 | % | | | 0.66 | % | | | 0.52 | % | | | 1.11 | % | | | 19 | % | | $ | 651,308 | |
| | 1.43 | % | | | 0.67 | % | | | 0.52 | % | | | 23.17 | % | | | 20 | % | | $ | 560,746 | |
| | 1.19 | % | | | 0.71 | % | | | 0.57 | % | | | 58.33 | % | | | 27 | % | | $ | 389,918 | |
| | | | | | | | | | | | | | | | | | | | | | |
| | 1.50 | % | | | 0.81 | % | | | 0.72 | % | | | 5.52 | % | | | 4 | % | | $ | 229,308 | |
| | 1.28 | % | | | 0.85 | % | | | 0.75 | % | | | 18.79 | % | | | 23 | % | | $ | 202,276 | |
| | 1.38 | % | | | 0.94 | % | | | 0.87 | % | | | 9.59 | % | | | 19 | % | | $ | 141,212 | |
| | 1.18 | % | | | 0.93 | % | | | 0.87 | % | | | 0.81 | % | | | 19 | % | | $ | 89,984 | |
| | 1.07 | % | | | 0.94 | % | | | 0.87 | % | | | 22.58 | % | | | 20 | % | | $ | 69,492 | |
| | 1.49 | % | | | 1.04 | % | | | 0.90 | % | | | 57.99 | % | | | 27 | % | | $ | 37,853 | |
| | | | | | | | | | | | | | | | | | | | | | |
| | 1.30 | % | | | 1.03 | % | | | 0.93 | % | | | 5.31 | % | | | 4 | % | | $ | 62,912 | |
| | 1.10 | % | | | 1.07 | % | | | 0.93 | % | | | 18.67 | % | | | 23 | % | | $ | 58,583 | |
| | 1.33 | % | | | 1.16 | % | | | 0.93 | % | | | 9.49 | % | | | 19 | % | | $ | 39,188 | |
| | 1.12 | % | | | 1.16 | % | | | 0.93 | % | | | 0.75 | % | | | 19 | % | | $ | 28,615 | |
| | 1.02 | % | | | 1.19 | % | | | 0.93 | % | | | 22.54 | % | | | 20 | % | | $ | 24,771 | |
| | 1.00 | % | | | 1.28 | % | | | 0.95 | % | | | 57.89 | % | | | 27 | % | | $ | 19,359 | |
The accompanying notes are an integral part of these financial statements.
| | | | |
| 74 | | Wells Fargo Advantage Dow Jones Target Date Funds | | Financial highlights |
| | | | | | | | | | | | | | | | | | | | | | | | |
| Target 2055 Fund | | Beginning
net asset
value per
share | | | Net
investment
income1 | | | Net realized and unrealized
gains (losses)
on investments | | | Distributions
from net
investment
income | | | Distributions from net realized gains | | | Ending net asset value per
share | |
Class A | | | | | | | | | | | | | | | | | | | | | | | | |
Six months ended August 31, 2014 (unaudited) | | $ | 12.63 | | | | 0.07 | | | | 0.61 | | | | (0.07 | ) | | | 0.00 | | | $ | 13.24 | |
Year ended February 28, 2014 | | $ | 10.90 | | | | 0.14 | | | | 1.87 | | | | (0.13 | ) | | | (0.15 | ) | | $ | 12.63 | |
Year ended February 28, 20134 | | $ | 10.19 | | | | 0.03 | 5 | | | 0.72 | | | | (0.04 | ) | | | 0.00 | | | $ | 10.90 | |
Class R | | | | | | | | | | | | | | | | | | | | | | | | |
Six months ended August 31, 2014 (unaudited) | | $ | 12.51 | | | | 0.07 | | | | 0.59 | | | | (0.05 | ) | | | 0.00 | | | $ | 13.12 | |
Year ended February 28, 20146 | | $ | 11.01 | | | | 0.06 | | | | 1.65 | | | | (0.06 | ) | | | (0.15 | ) | | $ | 12.51 | |
Class R4 | | | | | | | | | | | | | | | | | | | | | | | | |
Six months ended August 31, 2014 (unaudited) | | $ | 12.65 | | | | 0.11 | | | | 0.59 | | | | (0.08 | ) | | | 0.00 | | | $ | 13.27 | |
Year ended February 28, 2014 | | $ | 10.91 | | | | 0.15 | | | | 1.90 | | | | (0.16 | ) | | | (0.15 | ) | | $ | 12.65 | |
Year ended February 28, 20134 | | $ | 10.19 | | | | 0.04 | 5 | | | 0.72 | | | | (0.04 | ) | | | 0.00 | | | $ | 10.91 | |
Class R67 | | | | | | | | | | | | | | | | | | | | | | | | |
Six months ended August 31, 2014 (unaudited) | | $ | 12.63 | | | | 0.12 | 5 | | | 0.59 | | | | (0.09 | ) | | | 0.00 | | | $ | 13.25 | |
Year ended February 28, 2014 | | $ | 10.90 | | | | 0.19 | | | | 1.87 | | | | (0.18 | ) | | | (0.15 | ) | | $ | 12.63 | |
Year ended February 28, 2013 | | $ | 10.08 | | | | 0.15 | | | | 0.83 | | | | (0.16 | ) | | | 0.00 | | | $ | 10.90 | |
Year ended February 29, 20128 | | $ | 10.00 | | | | 0.08 | 5 | | | 0.00 | 9 | | | 0.00 | | | | 0.00 | | | $ | 10.08 | |
Administrator Class | | | | | | | | | | | | | | | | | | | | | | | | |
Six months ended August 31, 2014 (unaudited) | | $ | 12.62 | | | | 0.09 | | | | 0.60 | | | | (0.07 | ) | | | 0.00 | | | $ | 13.24 | |
Year ended February 28, 2014 | | $ | 10.90 | | | | 0.14 | | | | 1.87 | | | | (0.14 | ) | | | (0.15 | ) | | $ | 12.62 | |
Year ended February 28, 2013 | | $ | 10.06 | | | | 0.14 | 5 | | | 0.81 | | | | (0.11 | ) | | | 0.00 | | | $ | 10.90 | |
Year ended February 29, 20128 | | $ | 10.00 | | | | 0.06 | 5 | | | 0.00 | 9 | | | 0.00 | | | | 0.00 | | | $ | 10.06 | |
Investor Class | | | | | | | | | | | | | | | | | | | | | | | | |
Six months ended August 31, 2014 (unaudited) | | $ | 12.52 | | | | 0.08 | | | | 0.59 | | | | (0.06 | ) | | | 0.00 | | | $ | 13.13 | |
Year ended February 28, 2014 | | $ | 10.81 | | | | 0.14 | | | | 1.85 | | | | (0.13 | ) | | | (0.15 | ) | | $ | 12.52 | |
Year ended February 28, 2013 | | $ | 10.05 | | | | 0.13 | | | | 0.80 | | | | (0.17 | ) | | | 0.00 | | | $ | 10.81 | |
Year ended February 29, 20128 | | $ | 10.00 | | | | 0.06 | 5 | | | (0.01 | ) | | | 0.00 | | | | 0.00 | | | $ | 10.05 | |
| 1. | Includes net expenses allocated from affiliated Master Portfolios in which the Fund invests. |
| 2. | Total return calculations do not include any sales charges. Returns for periods of less than one year are not annualized. |
| 3. | Portfolio turnover rate is calculated by aggregating the results of multiplying the Fund’s investment percentage in the respective affiliated Master Portfolio by the corresponding affiliated Master Portfolio’s portfolio turnover rate. |
| 4. | For the period from November 30, 2012 (commencement of class operations) to February 28, 2013 |
| 5. | Calculated based upon average shares outstanding |
| 6. | For the period from June 28, 2013 (commencement of class operations) to February 28, 2014 |
| 7. | On June 1, 2013, Institutional Class was renamed Class R6. |
| 8. | For the period from June 30, 2011 (commencement of class operations) to February 29, 2012 |
| 9. | Amount is less than $0.005. |
The accompanying notes are an integral part of these financial statements.
| | | | | | |
| Financial highlights | | Wells Fargo Advantage Dow Jones Target Date Funds | | | 75 | |
| | | | | | | | | | | | | | | | | | | | | | |
| Ratio to average net assets (annualized) | | | Total
return2 | | | Portfolio
turnover
rate3 | | | Net assets at
end of period
(000s omitted) | |
Net investment
income1 | | | Gross
expenses1 | | | Net
expenses1 | | | | |
| | | | | | | | | | | | | | | | | | | | | | |
| | 1.34 | % | | | 1.08 | % | | | 0.88 | % | | | 5.36 | % | | | 4 | % | | $ | 397 | |
| | 1.10 | % | | | 1.19 | % | | | 0.88 | % | | | 18.69 | % | | | 23 | % | | $ | 66 | |
| | 1.05 | % | | | 1.44 | % | | | 0.88 | % | | | 7.39 | % | | | 19 | % | | $ | 14 | |
| | | | | | | | | | | | | | | | | | | | | | |
| | 1.08 | % | | | 1.38 | % | | | 1.13 | % | | | 5.26 | % | | | 4 | % | | $ | 30 | |
| | 0.73 | % | | | 1.48 | % | | | 1.13 | % | | | 15.66 | % | | | 23 | % | | $ | 29 | |
| | | | | | | | | | | | | | | | | | | | | | |
| | 1.70 | % | | | 0.75 | % | | | 0.52 | % | | | 5.55 | % | | | 4 | % | | $ | 27,647 | |
| | 1.40 | % | | | 0.86 | % | | | 0.52 | % | | | 19.06 | % | | | 23 | % | | $ | 20,591 | |
| | 1.51 | % | | | 1.09 | % | | | 0.52 | % | | | 7.51 | % | | | 19 | % | | $ | 33 | |
| | | | | | | | | | | | | | | | | | | | | | |
| | 1.85 | % | | | 0.60 | % | | | 0.37 | % | | | 5.63 | % | | | 4 | % | | $ | 101,156 | |
| | 1.63 | % | | | 0.75 | % | | | 0.40 | % | | | 19.18 | % | | | 23 | % | | $ | 74,427 | |
| | 1.69 | % | | | 1.17 | % | | | 0.52 | % | | | 9.90 | % | | | 19 | % | | $ | 36,345 | |
| | 1.33 | % | | | 4.06 | % | | | 0.52 | % | | | 0.80 | % | | | 19 | % | | $ | 8,963 | |
| | | | | | | | | | | | | | | | | | | | | | |
| | 1.38 | % | | | 0.92 | % | | | 0.72 | % | | | 5.48 | % | | | 4 | % | | $ | 10,127 | |
| | 1.28 | % | | | 1.05 | % | | | 0.75 | % | | | 18.70 | % | | | 23 | % | | $ | 8,462 | |
| | 1.36 | % | | | 1.45 | % | | | 0.87 | % | | | 9.52 | % | | | 19 | % | | $ | 4,739 | |
| | 0.87 | % | | | 2.14 | % | | | 0.87 | % | | | 0.60 | % | | | 19 | % | | $ | 1,794 | |
| | | | | | | | | | | | | | | | | | | | | | |
| | 1.31 | % | | | 1.14 | % | | | 0.93 | % | | | 5.35 | % | | | 4 | % | | $ | 6,078 | |
| | 1.06 | % | | | 1.27 | % | | | 0.93 | % | | | 18.62 | % | | | 23 | % | | $ | 4,130 | |
| | 1.23 | % | | | 1.64 | % | | | 0.93 | % | | | 9.52 | % | | | 19 | % | | $ | 1,254 | |
| | 0.94 | % | | | 6.32 | % | | | 0.93 | % | | | 0.50 | % | | | 19 | % | | $ | 256 | |
The accompanying notes are an integral part of these financial statements.
| | | | |
| 76 | | Wells Fargo Advantage Dow Jones Target Date Funds | | Notes to financial statements (unaudited) |
1. ORGANIZATION
Wells Fargo Funds Trust (the “Trust”), a Delaware statutory trust organized on March 10, 1999, is an open-end management investment company registered under the Investment Company Act of 1940, as amended (the “1940 Act”). These financial statements report on the following funds: Wells Fargo Advantage Dow Jones Target Today Fund (“Target Today Fund”), Wells Fargo Advantage Dow Jones Target 2010 Fund (“Target 2010 Fund”), Wells Fargo Advantage Dow Jones Target 2015 Fund (“Target 2015 Fund” ), Wells Fargo Advantage Dow Jones Target 2020 Fund (“Target 2020 Fund”), Wells Fargo Advantage Dow Jones Target 2025 Fund (“Target 2025 Fund”), Wells Fargo Advantage Dow Jones Target 2030 Fund (“Target 2030 Fund”), Wells Fargo Advantage Dow Jones Target 2035 Fund (“Target 2035 Fund”), Wells Fargo Advantage Dow Jones Target 2040 Fund (“Target 2040 Fund”), Wells Fargo Advantage Dow Jones Target 2045 Fund (“Target 2045 Fund”), Wells Fargo Advantage Dow Jones Target 2050 Fund (“Target 2050 Fund”), and Wells Fargo Advantage Dow Jones Target 2055 Fund (“Target 2055 Fund” ) (each, a “Fund”, collectively, the “Funds”). Each Fund is a diversified series of the Trust.
The Funds each seek to achieve its investment objective by investing all investable assets in one or more separate diversified portfolios (each, an “affiliated Master Portfolio”, collectively, the “affiliated Master Portfolios”) of Wells Fargo Master Trust, a registered open-end management investment company. Each affiliated Master Portfolio directly acquires portfolio securities, and a Fund investing in an affiliated Master Portfolio acquires an indirect interest in those securities. Each Fund accounts for its investment in the affiliated Master Portfolios as partnership investments and records on a daily basis its share of the affiliated Master Portfolio’s income, expense and realized and unrealized gains and losses. The financial statements of the affiliated Master Portfolios for the six months ended August 31, 2014 are included in this report and should be read in conjunction with each Fund’s financial statements. As of August 31, 2014, the Funds own the following percentages of the affiliated Master Portfolios:
| | | | | | | | | | | | | | | | | | | | | | | | | | | | | | | | | | | | | | | | | | | | |
| | | Target Today Fund | | | Target 2010 Fund | | | Target 2015 Fund | | | Target 2020 Fund | | | Target 2025 Fund | | | Target 2030 Fund | | | Target 2035 Fund | | | Target 2040 Fund | | | Target 2045 Fund | | | Target 2050 Fund | | | Target 2055 Fund | |
Wells Fargo Advantage Diversified Fixed Income Portfolio | | | 10 | % | | | 9 | % | | | 11 | % | | | 27 | % | | | 17 | % | | | 15 | % | | | 5 | % | | | 4 | % | | | 1 | % | | | 1 | % | | | 0 | %* |
Wells Fargo Advantage Diversified Stock Portfolio | | | 1 | | | | 1 | | | | 3 | | | | 12 | | | | 13 | | | | 20 | | | | 10 | | | | 19 | | | | 7 | | | | 13 | | | | 1 | |
Wells Fargo Advantage Short-Term Investment Portfolio | | | 9 | | | | 4 | | | | 5 | | | | 17 | | | | 14 | | | | 17 | | | | 8 | | | | 13 | | | | 4 | | | | 8 | | | | 1 | |
| * | The amount owned is less than 1%. |
2. SIGNIFICANT ACCOUNTING POLICIES
The following significant accounting policies, which are consistently followed in the preparation of the financial statements of each Fund, are in conformity with U.S. generally accepted accounting principles which require management to make estimates and assumptions that affect the reported amounts of assets and liabilities, disclosure of contingent assets and liabilities at the date of the financial statements, and the reported amounts of revenues and expenses during the reporting period. Actual results could differ from those estimates.
Securities valuation
All investments are valued each business day as of the close of regular trading on the New York Stock Exchange (generally 4 p.m. Eastern Time).
Investments in the affiliated Master Portfolios are valued daily based on each Fund’s proportionate share of each affiliated Master Portfolio’s net assets, which are also valued daily. Securities held in the affiliated Master Portfolios are valued as discussed in the Notes to Financial Statements of the affiliated Master Portfolios, which are included elsewhere in this report.
Security transactions and income recognition
Securities transactions are recorded on a trade date basis in each affiliated Master Portfolio. Realized gains or losses in each affiliated Master Portfolio are recorded on the basis of identified cost.
Interest income is accrued daily and bond discounts are accreted and premiums are amortized daily based on the effective interest method by each affiliated Master Portfolio. To the extent debt obligations are placed on non-accrual status, any related interest income may be reduced by writing off interest receivables when the collection of all or a portion of interest has become doubtful based on consistently applied procedures. If the issuer subsequently resumes interest payments or when the collectability of interest is reasonably assured, the debt obligation is removed from non-accrual status.
| | | | | | |
| Notes to financial statements (unaudited) | | Wells Fargo Advantage Dow Jones Target Date Funds | | | 77 | |
Dividend income in each affiliated Master Portfolio is recognized on the ex-dividend date, except for certain dividends from foreign securities, which are recorded as soon as the affiliated Master Portfolio is informed of the ex-dividend date.
Income from foreign securities in each affiliated Master Portfolio is recorded net of foreign taxes withheld where recovery of such taxes is not assured.
Each Fund records daily its proportionate share of each affiliated Master Portfolio’s interest and dividend income and realized and unrealized gains or losses.
Distributions to shareholders
Distributions to shareholders from net investment income and net realized gains, if any, are recorded on the ex-dividend date. Such distributions are determined in conformity with federal income tax regulations, which may differ in amount or character from net investment income and realized gains recognized for purposes of U.S. generally accepted accounting principles.
Federal and other taxes
Each Fund is treated as a separate entity for federal income tax purposes. Each Fund intends to continue to qualify as a regulated investment company by distributing substantially all of its investment company taxable income and any net realized capital gains (after reduction for capital loss carryforwards) sufficient to relieve it from all, or substantially all, federal income taxes. Accordingly, no provision for federal income taxes was required.
Each Fund’s income and federal excise tax returns and all financial records supporting those returns for the prior three fiscal years are subject to examination by the federal and Delaware revenue authorities. Management has analyzed each Fund’s tax positions taken on federal, state, and foreign tax returns for all open tax years and does not believe that there are any uncertain tax positions that require recognition of a tax liability.
Class allocations
The separate classes of shares offered by each Fund differ principally in applicable sales charges, distribution, shareholder servicing, and administration fees. Class specific expenses are charged directly to that share class. Investment income, common expenses, and realized and unrealized gains (losses) on investments are allocated daily to each class of shares based on the relative proportion of net assets of each class.
3. FAIR VALUATION MEASUREMENTS
Fair value measurements of investments are determined within a framework that has established a fair value hierarchy based upon the various data inputs utilized in determining the value of each Fund’s investments. The three-level hierarchy gives the highest priority to unadjusted quoted prices in active markets for identical assets or liabilities (Level 1) and the lowest priority to significant unobservable inputs (Level 3). Each Fund’s investments are classified within the fair value hierarchy based on the lowest level of input that is significant to the fair value measurement. The inputs are summarized into three broad levels as follows:
| n | | Level 1 – quoted prices in active markets for identical securities |
| n | | Level 2 – other significant observable inputs (including quoted prices for similar securities, interest rates, prepayment speeds, credit risk, use of amortized cost, etc.) |
| n | | Level 3 – significant unobservable inputs (including the Fund’s own assumptions in determining the fair value of investments) |
The inputs or methodologies used for valuing investments in securities are not necessarily an indication of the risk associated with investing in those securities.
At August 31, 2014, each Fund’s investments in an affiliated Master Portfolio carried at fair value were designated as Level 2 inputs. Further details on the investments of the affiliated Master Portfolios can be found in the Portfolio of Investments or Summary Portfolio of Investments of each affiliated Master Portfolio which is contained elsewhere in this report.
Transfers in and transfers out are recognized at the end of the reporting period. For the six months ended August 31, 2014, the Funds did not have any transfers into/out of Level 1, Level 2, or Level 3.
| | | | |
| 78 | | Wells Fargo Advantage Dow Jones Target Date Funds | | Notes to financial statements (unaudited) |
4. TRANSACTIONS WITH AFFILIATES AND OTHER EXPENSES
Advisory fees
The Trust has entered into an advisory contract with Wells Fargo Funds Management, LLC (“Funds Management”), an indirect wholly owned subsidiary of Wells Fargo & Company (“Wells Fargo”). The adviser is responsible for implementing investment policies and guidelines and for supervising the subadviser, who is responsible for day-to-day portfolio management of the Funds.
Pursuant to the contract, Funds Management is entitled to receive an annual advisory fee starting at 0.25% and declining to 0.17% as the average daily net assets of each Fund increase. Prior to July 1, 2014, Funds Management received an annual advisory fee which started at 0.25% and declined to 0.19% as the average daily net assets of each Fund increased. For the six months ended August 31, 2014, the advisory fee was equivalent to an annual rate for each Fund as follows:
| | | | |
| | | Advisory fee | |
Target Today Fund | | | 0.24 | % |
Target 2010 Fund | | | 0.24 | |
Target 2015 Fund | | | 0.24 | |
Target 2020 Fund | | | 0.22 | |
Target 2025 Fund | | | 0.22 | |
Target 2030 Fund | | | 0.22 | |
Target 2035 Fund | | | 0.23 | |
Target 2040 Fund | | | 0.22 | |
Target 2045 Fund | | | 0.24 | |
Target 2050 Fund | | | 0.23 | |
Target 2055 Fund | | | 0.25 | |
Funds Management also serves as the adviser to each affiliated Master Portfolio and is entitled to receive a fee from each affiliated Master Portfolio for those services.
Funds Management has retained the services of a subadviser to provide daily portfolio management to the Funds. The fees for subadvisory services are borne by Funds Management. Global Index Advisors, Inc. is the subadviser to each Fund and is entitled to receive a fee from Funds Management at an annual rate starting at 0.06% and declining to 0.04% as the average daily net assets of each Fund increase.
Administration fees
The Trust has entered into an administration agreement with Funds Management. Under this agreement, for providing administrative services, which includes paying fees and expenses for services provided by the transfer agent, sub-transfer agents, omnibus account servicers and record-keepers, Funds Management is entitled to receive from each Fund an annual fund level administration fee starting at 0.05% and declining to 0.03% as the average daily net assets of each Fund increase and a class level administration fee which is calculated based on the average daily net assets of each class as follows:
| | | | |
| | | Class level
administration fee | |
Class A, Class B, Class C, Class R | | | 0.26 | % |
Class R4 | | | 0.08 | |
Class R6 | | | 0.03 | |
Administrator Class | | | 0.10 | |
Investor Class | | | 0.32 | |
Funds Management has contractually waived and/or reimbursed advisory and administration fees to the extent necessary to maintain certain net operating expense ratios for the Funds. Waiver of fees and/or reimbursement of expenses by Funds Management were made first from fund level expenses on a proportionate basis and then from class
| | | | | | |
| Notes to financial statements (unaudited) | | Wells Fargo Advantage Dow Jones Target Date Funds | | | 79 | |
specific expenses. Funds Management has committed through June 30, 2015 to waive fees and/or reimburse expenses to the extent necessary to cap each Fund’s expenses as follows:
| | | | | | | | | | | | | | | | | | | | | | | | | | | | | | | | |
| | | Class A | | | Class B | | | Class C | | | Class R | | | Class R4 | | | Class R6 | | | Administrator
Class | | | Investor
Class | |
Target Today Fund | | | 0.81 | % | | | 1.56 | % | | | 1.56 | % | | | 1.06 | % | | | 0.45 | % | | | 0.30 | % | | | 0.65 | % | | | 0.86 | % |
Target 2010 Fund | | | 0.83 | | | | 1.58 | | | | 1.58 | | | | 1.08 | | | | 0.47 | | | | 0.32 | | | | 0.67 | | | | 0.88 | |
Target 2015 Fund | | | 0.84 | | | | N/A | | | | N/A | | | | 1.09 | | | | 0.48 | | | | 0.33 | | | | 0.68 | | | | 0.89 | |
Target 2020 Fund | | | 0.86 | | | | 1.61 | | | | 1.61 | | | | 1.11 | | | | 0.50 | | | | 0.35 | | | | 0.70 | | | | 0.91 | |
Target 2025 Fund | | | 0.86 | | | | N/A | | | | N/A | | | | 1.11 | | | | 0.50 | | | | 0.35 | | | | 0.70 | | | | 0.91 | |
Target 2030 Fund | | | 0.87 | | | | 1.62 | | | | 1.62 | | | | 1.12 | | | | 0.51 | | | | 0.36 | | | | 0.71 | | | | 0.92 | |
Target 2035 Fund | | | 0.88 | | | | N/A | | | | N/A | | | | 1.13 | | | | 0.52 | | | | 0.37 | | | | 0.72 | | | | 0.93 | |
Target 2040 Fund | | | 0.88 | | | | 1.63 | | | | 1.63 | | | | 1.13 | | | | 0.52 | | | | 0.37 | | | | 0.72 | | | | 0.93 | |
Target 2045 Fund | | | 0.88 | | | | N/A | | | | N/A | | | | 1.13 | | | | 0.52 | | | | 0.37 | | | | 0.72 | | | | 0.93 | |
Target 2050 Fund | | | 0.88 | | | | N/A | | | | 1.63 | | | | 1.13 | | | | 0.52 | | | | 0.37 | | | | 0.72 | | | | 0.93 | |
Target 2055 Fund | | | 0.88 | | | | N/A | | | | N/A | | | | 1.13 | | | | 0.52 | | | | 0.37 | | | | 0.72 | | | | 0.93 | |
After June 30, 2015, the cap may be increased or the commitment to maintain the cap may be terminated only with the approval of the Board of Trustees.
Distribution fees
The Trust has adopted a Distribution Plan for Class B, Class C, and Class R shares of the applicable Funds pursuant to Rule 12b-1 under the 1940 Act. Distribution fees are charged to the Class B, Class C, and Class R shares and paid to Wells Fargo Funds Distributor, LLC (“Funds Distributor”), the principal underwriter of each Fund, at an annual rate of 0.75% of the average daily net assets of Class B and Class C shares and 0.25% of the average daily net assets of Class R shares.
In addition, Funds Distributor is entitled to receive the front-end sales charges from purchases of Class A shares and the contingent deferred sales charges from redemptions of Class A, Class B, and Class C shares. For the six months ended August 31, 2014, Funds Distributor received the following amounts in front-end sales charges and contingent deferred sales charges.
| | | | | | | | | | | | |
| | |
| | | Front-end
sales charges Class A | | | Contingent deferred sales charges | |
| | | | Class B | | | Class C | |
Target Today Fund | | $ | 513 | | | $ | 0 | | | $ | 0 | |
Target 2010 Fund | | | 111 | | | | 0 | | | | 0 | |
Target 2015 Fund | | | 612 | | | | N/A | | | | N/A | |
Target 2020 Fund | | | 1,077 | | | | 0 | | | | 0 | |
Target 2025 Fund | | | 1,697 | | | | N/A | | | | N/A | |
Target 2030 Fund | | | 3,075 | | | | 0 | | | | 48 | |
Target 2035 Fund | | | 862 | | | | N/A | | | | N/A | |
Target 2040 Fund | | | 1,761 | | | | 0 | | | | 0 | |
Target 2045 Fund | | | 831 | | | | N/A | | | | N/A | |
Target 2050 Fund | | | 3,117 | | | | N/A | | | | 15 | |
Target 2055 Fund | | | 392 | | | | N/A | | | | N/A | |
Shareholder servicing fees
The Trust has entered into contracts with one or more shareholder servicing agents, whereby Class A, Class B, Class C, Class R, Administrator Class, and Investor Class of each applicable Fund is charged a fee at an annual rate of 0.25% of the average daily net assets of each respective class. Class R4 is charged a fee at an annual rate of 0.10% of its average daily net assets.
| | | | |
| 80 | | Wells Fargo Advantage Dow Jones Target Date Funds | | Notes to financial statements (unaudited) |
A portion of these total shareholder servicing fees were paid to affiliates of Wells Fargo.
5. INVESTMENT PORTFOLIO TRANSACTIONS
Purchases and sales of investments, excluding short-term securities, for the six months ended August 31, 2014 were as follows:
| | | | | | | | | | | | | | | | |
| | | Purchases at cost* | | | Sales proceeds* | |
| | | U.S.
government | | | Non-U.S.
government | | | U.S.
government | | | Non-U.S.
government | |
Target Today Fund | | $ | 148,338,015 | | | $ | 43,350,657 | | | $ | 108,253,040 | | | $ | 19,385,100 | |
Target 2010 Fund | | | 125,864,469 | | | | 37,363,653 | | | | 91,852,459 | | | | 17,123,636 | |
Target 2015 Fund | | | 157,635,680 | | | | 49,230,618 | | | | 115,038,223 | | | | 24,278,717 | |
Target 2020 Fund | | | 401,969,791 | | | | 138,400,319 | | | | 293,346,598 | | | | 76,870,813 | |
Target 2025 Fund | | | 255,506,550 | | | | 101,369,243 | | | | 186,461,717 | | | | 64,443,661 | |
Target 2030 Fund | | | 227,534,526 | | | | 111,224,242 | | | | 166,048,496 | | | | 81,758,128 | |
Target 2035 Fund | | | 67,048,518 | | | | 44,515,938 | | | | 48,930,181 | | | | 37,747,785 | |
Target 2040 Fund | | | 62,737,538 | | | | 63,804,234 | | | | 45,784,146 | | | | 61,083,584 | |
Target 2045 Fund | | | 12,649,692 | | | | 20,566,354 | | | | 9,231,400 | | | | 21,273,778 | |
Target 2050 Fund | | | 19,317,827 | | | | 36,789,012 | | | | 14,097,624 | | | | 38,746,944 | |
Target 2055 Fund | | | 1,989,765 | | | | 3,789,322 | | | | 1,452,076 | | | | 3,990,992 | |
| * | Each Fund seeks to achieve its investment objective by investing all of its investable assets in multiple affiliated Master Portfolios. Purchases and sales have been calculated by aggregating the results of multiplying each Fund’s ownership percentage of the respective affiliated Master Portfolio by the corresponding affiliated Master Portfolio’s purchases and sales. |
6. BANK BORROWINGS
Each Fund and certain funds in the Trust are party to a $25,000,000 revolving credit agreement with the Bank of New York Mellon, whereby the Funds are permitted to use bank borrowings for temporary or emergency purposes, such as to fund shareholder redemption requests. Interest under the credit agreement is charged to each Fund based on a borrowing rate equal to the higher of the Federal Funds rate in effect on that day plus 1.25% or the overnight LIBOR rate in effect on that day plus 1.25%. In addition, an annual commitment fee equal to 0.15% of the unused balance is allocated to each participating fund. For the six months ended August 31, 2014, the Funds paid the following amounts in commitment fees:
| | | | |
| | | Commitment fee | |
Target Today Fund | | $ | 994 | |
Target 2010 Fund | | | 882 | |
Target 2015 Fund | | | 1,172 | |
Target 2020 Fund | | | 3,553 | |
Target 2025 Fund | | | 3,872 | |
Target 2030 Fund | | | 4,729 | |
Target 2035 Fund | | | 2,156 | |
Target 2040 Fund | | | 3,409 | |
Target 2045 Fund | | | 1,172 | |
Target 2050 Fund | | | 2,109 | |
Target 2055 Fund | | | 192 | |
For the six months ended August 31, 2014, there were no borrowings by the Funds under the agreement.
| | | | | | |
| Notes to financial statements (unaudited) | | Wells Fargo Advantage Dow Jones Target Date Funds | | | 81 | |
7. INDEMNIFICATION
Under the Trust’s organizational documents, the officers and Trustees are indemnified against certain liabilities that may arise out of performance of their duties to the Trust. Additionally, in the normal course of business, the Trust may enter into contracts with service providers that contain a variety of indemnification clauses. The Trust’s maximum exposure under these arrangements is dependent on future claims that may be made against the Funds and, therefore, cannot be estimated.
8. SUBSEQUENT DISTRIBUTIONS
On September 24, 2014, the Funds declared distributions from net investment income to shareholders of record on September 23, 2014. The per share amounts payable on September 25, 2014 were as follows:
| | | | | | | | | | | | | | | | | | | | | | | | | | | | | | | | | | | | |
Net investment income | | Target 2015 Fund | | | Target 2020 Fund | | | Target 2025 Fund | | | Target 2030 Fund | | | Target 2035 Fund | | | Target 2040 Fund | | | Target 2045 Fund | | | Target 2050 Fund | | | Target 2055 Fund | |
Class A | | | $0.04143 | | | $ | 0.05154 | | | $ | 0.03582 | | | $ | 0.05050 | | | $ | 0.03548 | | | $ | 0.05321 | | | $ | 0.03431 | | | $ | 0.03126 | | | $ | 0.03400 | |
Class B | | | N/A | | | | 0.02008 | | | | N/A | | | | 0.01235 | | | | N/A | | | | 0.00511 | | | | N/A | | | | N/A | | | | N/A | |
Class C | | | N/A | | | | 0.02397 | | | | N/A | | | | 0.02107 | | | | N/A | | | | 0.02028 | | | | N/A | | | | 0.01152 | | | | N/A | |
Class R | | | 0.03100 | | | | 0.04348 | | | | 0.02736 | | | | 0.04421 | | | | 0.02466 | | | | 0.04362 | | | | 0.02353 | | | | 0.02291 | | | | 0.02514 | |
Class R4 | | | 0.04702 | | | | 0.06557 | | | | 0.04363 | | | | 0.06627 | | | | 0.04203 | | | | 0.07113 | | | | 0.04158 | | | | 0.03944 | | | | 0.04362 | |
Class R6 | | | 0.05105 | | | | 0.07150 | | | | 0.04777 | | | | 0.07278 | | | | 0.04636 | | | | 0.07861 | | | | 0.04604 | | | | 0.04368 | | | | 0.04830 | |
Administrator Class | | | 0.04164 | | | | 0.05762 | | | | 0.03831 | | | | 0.05753 | | | | 0.03639 | | | | 0.06097 | | | | 0.03568 | | | | 0.03389 | | | | 0.03739 | |
Investor Class | | | 0.03568 | | | | 0.04959 | | | | 0.03257 | | | | 0.04861 | | | | 0.03024 | | | | 0.05093 | | | | 0.02933 | | | | 0.02789 | | | | 0.03146 | |
These distributions are not reflected in the accompanying financial statements. The final determination of the source of all distributions is subject to change and made after the tax year-end of each Fund.
| | | | |
| 82 | | Wells Fargo Advantage Dow Jones Target Date Funds | | Summary portfolio of investments—August 31, 2014 (unaudited) |
DIVERSIFIED FIXED INCOME PORTFOLIO
The Summary Portfolio of Investments shows the 50 largest portfolio holdings in unaffiliated issuers and any holdings exceeding 1% of the total net assets as of the report date. The remaining securities held are grouped as “Other securities” in each category. You can request a complete schedule of portfolio holdings as of the report date, free of charge, by accessing the following website:
http://a584.g.akamai.net/f/584/1326/1d/www.wellsfargoadvantagefunds.com/pdf/semi/holdings/diversifiedfixedincome.pdf or by calling Wells Fargo Advantage Funds at 1-800-222-8222. This complete schedule, filed on the Form N-CSRS, is also available on the SEC’s website at sec.gov.
| | | | | | | | | | | | | | | | | | | | |
| Security name | | Interest rate | | | Maturity date | | | Principal | | | Value | | | Percent of
net assets | |
| | | | | | | | | | | | | | | | | | | | |
| | | | | |
Agency Securities: 27.93% | | | | | | | | | | | | | | | | | | | | |
FHLB | | | 0.38-6.00 | % | | | 2-19-2016 to 11-1-2043 | | | $ | 152,596,737 | | | $ | 158,450,780 | | | | 2.57 | % |
FHLMC | | | 0.50-6.75 | | | | 9-10-2015 to 6-1-2044 | | | | 244,518,026 | | | | 259,130,183 | | | | 4.13 | |
FHLMC %% | | | 2.50 | | | | 9-1-2029 | | | | 20,000,000 | | | | 20,247,060 | | | | 0.33 | |
FHLMC | | | 3.50 | | | | 2-1-2042 | | | | 13,546,326 | | | | 13,929,034 | | | | 0.22 | |
FHLMC %% | | | 3.50 | | | | 9-1-2044 | | | | 13,000,000 | | | | 13,353,438 | | | | 0.22 | |
FHLMC %% | | | 4.00 | | | | 9-1-2044 | | | | 20,000,000 | | | | 21,146,484 | | | | 0.34 | |
FNMA | | | 0.00-7.25 | | | | 11-1-2014 to 7-1-2044 | | | | 633,380,348 | | | | 666,564,731 | | | | 10.68 | |
FNMA | | | 3.00 | | | | 8-1-2027 | | | | 14,524,343 | | | | 15,088,524 | | | | 0.24 | |
FNMA %% | | | 3.00 | | | | 9-1-2044 | | | | 15,000,000 | | | | 14,926,466 | | | | 0.24 | |
FNMA %% | | | 3.50 | | | | 9-1-2026 | | | | 12,000,000 | | | | 12,670,597 | | | | 0.20 | |
FNMA | | | 3.50 | | | | 9-1-2042 | | | | 12,551,012 | | | | 12,932,948 | | | | 0.21 | |
FNMA %% | | | 3.50 | | | | 9-1-2044 | | | | 40,000,000 | | | | 41,170,624 | | | | 0.66 | |
FNMA %% | | | 4.00 | | | | 9-1-2044 | | | | 41,750,000 | | | | 44,230,300 | | | | 0.71 | |
FNMA %% | | | 4.50 | | | | 9-1-2041 | | | | 14,000,000 | | | | 15,115,625 | | | | 0.24 | |
GNMA | | | 3.00-7.00 | | | | 11-15-2023 to 9-1-2044 | | | | 343,490,280 | | | | 365,170,546 | | | | 5.89 | |
GNMA | | | 3.50 | | | | 4-20-2043 | | | | 18,602,849 | | | | 19,369,847 | | | | 0.31 | |
GNMA %% | | | 3.50 | | | | 9-1-2044 | | | | 25,000,000 | | | | 25,987,313 | | | | 0.42 | |
GNMA | | | 4.50 | | | | 3-15-2039 | | | | 10,797,003 | | | | 11,744,036 | | | | 0.19 | |
Other securities | | | | | | | | | | | | | | | 8,388,651 | | | | 0.13 | |
| | | | | |
Total Agency Securities (Cost $1,706,740,562) | | | | | | | | | | | | | | | 1,739,617,187 | | | | 27.93 | |
| | | | | | | | | | | | | | | | | | | | |
| | | | | |
Corporate Bonds and Notes: 20.94% | | | | | | | | | | | | | | | | | | | | |
| | | | | |
Consumer Discretionary: 1.93% | | | | | | | | | | | | | | | | | | | | |
| | | | | |
| Auto Components: 0.05% | | | | | | | | | | | | | | | | | | | | |
Other securities | | | | | | | | | | | | | | | 3,327,818 | | | | 0.05 | |
| | | | | | | | | | | | | | | | | | | | |
| | | | | |
| Automobiles: 0.03% | | | | | | | | | | | | | | | | | | | | |
Other securities | | | | | | | | | | | | | | | 1,611,696 | | | | 0.03 | |
| | | | | | | | | | | | | | | | | | | | |
| | | | | |
| Diversified Consumer Services: 0.04% | | | | | | | | | | | | | | | | | | | | |
Other securities | | | | | | | | | | | | | | | 2,573,542 | | | | 0.04 | |
| | | | | | | | | | | | | | | | | | | | |
| | | | | |
| Hotels, Restaurants & Leisure: 0.15% | | | | | | | | | | | | | | | | | | | | |
Other securities | | | | | | | | | | | | | | | 9,310,776 | | | | 0.15 | |
| | | | | | | | | | | | | | | | | | | | |
| | | | | |
| Household Durables: 0.04% | | | | | | | | | | | | | | | | | | | | |
Other securities | | | | | | | | | | | | | | | 2,197,907 | | | | 0.04 | |
| | | | | | | | | | | | | | | | | | | | |
| | | | | |
| Internet & Catalog Retail: 0.06% | | | | | | | | | | | | | | | | | | | | |
Other securities | | | | | | | | | | | | | | | 3,510,869 | | | | 0.06 | |
| | | | | | | | | | | | | | | | | | | | |
| | | | | |
| Leisure Products: 0.01% | | | | | | | | | | | | | | | | | | | | |
Other securities | | | | | | | | | | | | | | | 929,794 | | | | 0.01 | |
| | | | | | | | | | | | | | | | | | | | |
| | | | | |
| Media: 1.12% | | | | | | | | | | | | | | | | | | | | |
Other securities | | | | | | | | | | | | | | | 69,699,804 | | | | 1.12 | |
| | | | | | | | | | | | | | | | | | | | |
The accompanying notes are an integral part of these financial statements.
| | | | | | |
| Summary portfolio of investments—August 31, 2014 (unaudited) | | Wells Fargo Advantage Dow Jones Target Date Funds | | | 83 | |
DIVERSIFIED FIXED INCOME PORTFOLIO
| | | | | | | | | | | | | | | | | | | | |
| Security name | | | | | | | | | | | Value | | | Percent of
net assets | |
| | | | | | | | | | | | | | | | | | | | |
| | | | | |
| Multiline Retail: 0.16% | | | | | | | | | | | | | | | | | | | | |
Other securities | | | | | | | | | | | | | | $ | 10,105,677 | | | | 0.16 | % |
| | | | | | | | | | | | | | | | | | | | |
| | | | | |
| Specialty Retail: 0.26% | | | | | | | | | | | | | | | | | | | | |
Other securities | | | | | | | | | | | | | | | 16,369,002 | | | | 0.26 | |
| | | | | | | | | | | | | | | | | | | | |
| | | | |
| Textiles, Apparel & Luxury Goods: 0.01% | | | | | | | | | | | | | | | | | |
Other securities | | | | | | | | | | | | | | | 817,395 | | | | 0.01 | |
| | | | | | | | | | | | | | | | | | | | |
| | | | | |
Consumer Staples: 1.82% | | | | | | | | | | | | | | | | | | | | |
| | | | | |
| Beverages: 0.50% | | | | | | | | | | | | | | | | | | | | |
Other securities | | | | | | | | | | | | | | | 31,089,862 | | | | 0.50 | |
| | | | | | | | | | | | | | | | | | | | |
| | | | | |
| Food & Staples Retailing: 0.50% | | | | | | | | | | | | | | | | | | | | |
Other securities | | | | | | | | | | | | | | | 31,317,121 | | | | 0.50 | |
| | | | | | | | | | | | | | | | | | | | |
| | | | | |
| Food Products: 0.42% | | | | | | | | | | | | | | | | | | | | |
Other securities | | | | | | | | | | | | | | | 25,768,624 | | | | 0.42 | |
| | | | | | | | | | | | | | | | | | | | |
| | | | | |
| Household Products: 0.12% | | | | | | | | | | | | | | | | | | | | |
Other securities | | | | | | | | | | | | | | | 7,600,050 | | | | 0.12 | |
| | | | | | | | | | | | | | | | | | | | |
| | | | | |
| Personal Products: 0.02% | | | | | | | | | | | | | | | | | | | | |
Other securities | | | | | | | | | | | | | | | 980,449 | | | | 0.02 | |
| | | | | | | | | | | | | | | | | | | | |
| | | | | |
| Tobacco: 0.26% | | | | | | | | | | | | | | | | | | | | |
Other securities | | | | | | | | | | | | | | | 16,298,325 | | | | 0.26 | |
| | | | | | | | | | | | | | | | | | | | |
| | | | | |
Energy: 1.67% | | | | | | | | | | | | | | | | | | | | |
| | | | | |
| Energy Equipment & Services: 0.14% | | | | | | | | | | | | | | | | | | | | |
Other securities | | | | | | | | | | | | | | | 8,475,457 | | | | 0.14 | |
| | | | | | | | | | | | | | | | | | | | |
| | | | | |
| Oil, Gas & Consumable Fuels: 1.53% | | | | | | | | | | | | | | | | | | | | |
Other securities | | | | | | | | | | | | | | | 95,505,074 | | | | 1.53 | |
| | | | | | | | | | | | | | | | | | | | |
| | | | | |
| | | Interest rate | | | Maturity date | | | Principal | | | | | | | |
| | | | | |
Financials: 7.15% | | | | | | | | | | | | | | | | | | | | |
| | | | | |
| Banks: 2.03% | | | | | | | | | | | | | | | | | | | | |
Wachovia Bank NA (l) | | | 5.85 | % | | | 2-1-2037 | | | $ | 1,000,000 | | | | 1,263,090 | | | | 0.02 | |
Wachovia Bank NA (l) | | | 6.60 | | | | 1-15-2038 | | | | 600,000 | | | | 830,614 | | | | 0.01 | |
Wachovia Corporation (l) | | | 5.50 | | | | 8-1-2035 | | | | 700,000 | | | | 808,523 | | | | 0.01 | |
Wachovia Corporation (l) | | | 5.63 | | | | 10-15-2016 | | | | 1,200,000 | | | | 1,312,466 | | | | 0.02 | |
Wachovia Corporation (l) | | | 5.75 | | | | 6-15-2017 | | | | 1,000,000 | | | | 1,120,411 | | | | 0.02 | |
Wachovia Corporation (l) | | | 5.75 | | | | 2-1-2018 | | | | 1,000,000 | | | | 1,136,636 | | | | 0.02 | |
Wells Fargo & Company (l) | | | 1.25 | | | | 7-20-2016 | | | | 1,250,000 | | | | 1,259,985 | | | | 0.02 | |
Wells Fargo & Company (l) | | | 1.50 | | | | 1-16-2018 | | | | 1,000,000 | | | | 998,255 | | | | 0.02 | |
Wells Fargo & Company (l) | | | 2.63 | | | | 12-15-2016 | | | | 1,000,000 | | | | 1,037,110 | | | | 0.02 | |
Wells Fargo & Company (l) | | | 3.45 | | | | 2-13-2023 | | | | 750,000 | | | | 755,295 | | | | 0.01 | |
Wells Fargo & Company (l) | | | 3.50 | | | | 3-8-2022 | | | | 1,000,000 | | | | 1,041,738 | | | | 0.02 | |
Wells Fargo & Company (l) | | | 3.68 | | | | 6-15-2016 | | | | 1,000,000 | | | | 1,051,384 | | | | 0.02 | |
Wells Fargo & Company (l) | | | 4.10 | | | | 6-3-2026 | | | | 1,000,000 | | | | 1,025,008 | | | | 0.02 | |
Wells Fargo & Company (l) | | | 4.13 | | | | 8-15-2023 | | | | 1,000,000 | | | | 1,051,139 | | | | 0.02 | |
The accompanying notes are an integral part of these financial statements.
| | | | |
| 84 | | Wells Fargo Advantage Dow Jones Target Date Funds | | Summary portfolio of investments—August 31, 2014 (unaudited) |
DIVERSIFIED FIXED INCOME PORTFOLIO
| | | | | | | | | | | | | | | | | | | | |
| Security name | | Interest rate | | | Maturity date | | | Principal | | | Value | | | Percent of
net assets | |
| | | | | | | | | | | | | | | | | | | | |
| | | | | |
| Banks (continued) | | | | | | | | | | | | | | | | | | | | |
Wells Fargo & Company (l) | | | 4.60 | % | | | 4-1-2021 | | | $ | 1,250,000 | | | $ | 1,395,925 | | | | 0.02 | % |
Wells Fargo & Company (l) | | | 5.38 | | | | 11-2-2043 | | | | 1,000,000 | | | | 1,139,161 | | | | 0.02 | |
Wells Fargo & Company (l) | | | 5.61 | | | | 1-15-2044 | | | | 1,000,000 | | | | 1,178,845 | | | | 0.02 | |
Wells Fargo & Company (l) | | | 5.63 | | | | 12-11-2017 | | | | 1,500,000 | | | | 1,695,932 | | | | 0.03 | |
Wells Fargo Bank NA (l) | | | 5.95 | | | | 8-26-2036 | | | | 350,000 | | | | 446,033 | | | | 0.01 | |
Wells Fargo Capital X (l) | | | 5.95 | | | | 12-1-2086 | | | | 500,000 | | | | 510,000 | | | | 0.01 | |
Other securities | | | | | | | | | | | | | | | 105,049,750 | | | | 1.67 | |
| | | | | |
| | | | | | | | | | | | | | | 126,107,300 | | | | 2.03 | |
| | | | | | | | | | | | | | | | | | | | |
| | | | | |
| Capital Markets: 1.27% | | | | | | | | | | | | | | | | | | | | |
Other securities | | | | | | | | | | | | | | | 78,776,356 | | | | 1.27 | |
| | | | | | | | | | | | | | | | | | | | |
| | | | | |
| Consumer Finance: 0.92% | | | | | | | | | | | | | | | | | | | | |
Other securities | | | | | | | | | | | | | | | 57,374,106 | | | | 0.92 | |
| | | | | | | | | | | | | | | | | | | | |
| | | | | |
| Diversified Financial Services: 1.32% | | | | | | | | | | | | | | | | | | | | |
Other securities | | | | | | | | | | | | | | | 82,021,687 | | | | 1.32 | |
| | | | | | | | | | | | | | | | | | | | |
| | | | | |
| Insurance: 0.92% | | | | | | | | | | | | | | | | | | | | |
Other securities | | | | | | | | | | | | | | | 57,431,280 | | | | 0.92 | |
| | | | | | | | | | | | | | | | | | | | |
| | | | |
| Real Estate Management & Development: 0.01% | | | | | | | | | | | | | | | | | |
Other securities | | | | | | | | | | | | | | | 695,638 | | | | 0.01 | |
| | | | | | | | | | | | | | | | | | | | |
| | | | | |
| REITs: 0.66% | | | | | | | | | | | | | | | | | | | | |
Other securities | | | | | | | | | | | | | | | 41,262,298 | | | | 0.66 | |
| | | | | | | | | | | | | | | | | | | | |
| | | | | |
| Thrifts & Mortgage Finance: 0.02% | | | | | | | | | | | | | | | | | | | | |
Other securities | | | | | | | | | | | | | | | 1,343,044 | | | | 0.02 | |
| | | | | | | | | | | | | | | | | | | | |
| | | | | |
Health Care: 1.82% | | | | | | | | | | | | | | | | | | | | |
| | | | | |
| Biotechnology: 0.28% | | | | | | | | | | | | | | | | | | | | |
Other securities | | | | | | | | | | | | | | | 17,345,486 | | | | 0.28 | |
| | | | | | | | | | | | | | | | | | | | |
| | | | | |
| Health Care Equipment & Supplies: 0.20% | | | | | | | | | | | | | | | | | | | | |
Other securities | | | | | | | | | | | | | | | 12,568,389 | | | | 0.20 | |
| | | | | | | | | | | | | | | | | | | | |
| | | | | |
| Health Care Providers & Services: 0.50% | | | | | | | | | | | | | | | | | | | | |
Other securities | | | | | | | | | | | | | | | 31,418,383 | | | | 0.50 | |
| | | | | | | | | | | | | | | | | | | | |
| | | | | |
| Life Sciences Tools & Services: 0.07% | | | | | | | | | | | | | | | | | | | | |
Other securities | | | | | | | | | | | | | | | 4,387,459 | | | | 0.07 | |
| | | | | | | | | | | | | | | | | | | | |
| | | | | |
| Pharmaceuticals: 0.77% | | | | | | | | | | | | | | | | | | | | |
Other securities | | | | | | | | | | | | | | | 47,786,576 | | | | 0.77 | |
| | | | | | | | | | | | | | | | | | | | |
| | | | | |
Industrials: 1.56% | | | | | | | | | | | | | | | | | | | | |
| | | | | |
| Aerospace & Defense: 0.37% | | | | | | | | | | | | | | | | | | | | |
Other securities | | | | | | | | | | | | | | | 22,848,377 | | | | 0.37 | |
| | | | | | | | | | | | | | | | | | | | |
The accompanying notes are an integral part of these financial statements.
| | | | | | |
| Summary portfolio of investments—August 31, 2014 (unaudited) | | Wells Fargo Advantage Dow Jones Target Date Funds | | | 85 | |
DIVERSIFIED FIXED INCOME PORTFOLIO
| | | | | | | | | | | | | | |
| Security name | | | | | | | | Value | | | Percent of
net assets | |
| | | | | | | | | | | | | | |
| | | | | |
| Air Freight & Logistics: 0.08% | | | | | | | | | | | | | | |
Other securities | | | | | | | | $ | 5,391,956 | | | | 0.08 | % |
| | | | | | | | | | | | | | |
| | | | | |
| Airlines: 0.07% | | | | | | | | | | | | | | |
Other securities | | | | | | | | | 4,183,046 | | | | 0.07 | |
| | | | | | | | | | | | | | |
| | | | | |
| Building Products: 0.01% | | | | | | | | | | | | | | |
Other securities | | | | | | | | | 332,495 | | | | 0.01 | |
| | | | | | | | | | | | | | |
| | | | | |
| Commercial Services & Supplies: 0.16% | | | | | | | | | | | | | | |
Other securities | | | | | | | | | 9,899,005 | | | | 0.16 | |
| | | | | | | | | | | | | | |
| | | | | |
| Construction & Engineering: 0.01% | | | | | | | | | | | | | | |
Other securities | | | | | | | | | 776,181 | | | | 0.01 | |
| | | | | | | | | | | | | | |
| | | | | |
| Electrical Equipment: 0.09% | | | | | | | | | | | | | | |
Other securities | | | | | | | | | 5,672,240 | | | | 0.09 | |
| | | | | | | | | | | | | | |
| | | | | |
| Industrial Conglomerates: 0.20% | | | | | | | | | | | | | | |
Other securities | | | | | | | | | 12,630,046 | | | | 0.20 | |
| | | | | | | | | | | | | | |
| | | | | |
| Machinery: 0.22% | | | | | | | | | | | | | | |
Other securities | | | | | | | | | 13,629,135 | | | | 0.22 | |
| | | | | | | | | | | | | | |
| | | | | |
| Professional Services: 0.01% | | | | | | | | | | | | | | |
Other securities | | | | | | | | | 635,582 | | | | 0.01 | |
| | | | | | | | | | | | | | |
| | | | | |
| Road & Rail: 0.32% | | | | | | | | | | | | | | |
Other securities | | | | | | | | | 19,875,872 | | | | 0.32 | |
| | | | | | | | | | | | | | |
| | | | | |
| Trading Companies & Distributors: 0.02% | | | | | | | | | | | | | | |
Other securities | | | | | | | | | 1,268,750 | | | | 0.02 | |
| | | | | | | | | | | | | | |
| | | | | |
Information Technology: 1.35% | | | | | | | | | | | | | | |
| | | | | |
| Communications Equipment: 0.17% | | | | | | | | | | | | | | |
Other securities | | | | | | | | | 10,538,278 | | | | 0.17 | |
| | | | | | | | | | | | | | |
| | | |
| Electronic Equipment, Instruments & Components: 0.05% | | | | | | | | | | |
Other securities | | | | | | | | | 2,951,447 | | | | 0.05 | |
| | | | | | | | | | | | | | |
| | | | | |
| Internet Software & Services: 0.06% | | | | | | | | | | | | | | |
Other securities | | | | | | | | | 3,617,255 | | | | 0.06 | |
| | | | | | | | | | | | | | |
| | | | | |
| IT Services: 0.27% | | | | | | | | | | | | | | |
Other securities | | | | | | | | | 17,088,533 | | | | 0.27 | |
| | | | | | | | | | | | | | |
| | | | |
| Semiconductors & Semiconductor Equipment: 0.13% | | | | | | | | | | | | |
Other securities | | | | | | | | | 8,404,691 | | | | 0.13 | |
| | | | | | | | | | | | | | |
| | | | | |
| Software: 0.35% | | | | | | | | | | | | | | |
Other securities | | | | | | | | | 21,550,874 | | | | 0.35 | |
| | | | | | | | | | | | | | |
The accompanying notes are an integral part of these financial statements.
| | | | |
| 86 | | Wells Fargo Advantage Dow Jones Target Date Funds | | Summary portfolio of investments—August 31, 2014 (unaudited) |
DIVERSIFIED FIXED INCOME PORTFOLIO
| | | | | | | | | | | | | | | | | | | | |
| Security name | | | | | | | | | | | Value | | | Percent of
net assets | |
| | | | | | | | | | | | | | | | | | | | |
| | | | |
| Technology Hardware, Storage & Peripherals: 0.32% | | | | | | | | | | | | | | | | | |
Other securities | | | | | | | | | | | | | | $ | 20,127,201 | | | | 0.32 | % |
| | | | | | | | | | | | | | | | | | | | |
| | | | | |
Materials: 0.76% | | | | | | | | | | | | | | | | | | | | |
| | | | | |
| Chemicals: 0.43% | | | | | | | | | | | | | | | | | | | | |
Other securities | | | | | | | | | | | | | | | 26,748,842 | | | | 0.43 | |
| | | | | | | | | | | | | | | | | | | | |
| | | | | |
| Construction Materials: 0.00% | | | | | | | | | | | | | | | | | | | | |
Other securities | | | | | | | | | | | | | | | 142,484 | | | | 0.00 | |
| | | | | | | | | | | | | | | | | | | | |
| | | | | |
| Containers & Packaging: 0.01% | | | | | | | | | | | | | | | | | | | | |
Other securities | | | | | | | | | | | | | | | 379,711 | | | | 0.01 | |
| | | | | | | | | | | | | | | | | | | | |
| | | | | |
| Metals & Mining: 0.21% | | | | | | | | | | | | | | | | | | | | |
Other securities | | | | | | | | | | | | | | | 12,838,504 | | | | 0.21 | |
| | | | | | | | | | | | | | | | | | | | |
| | | | | |
| Paper & Forest Products: 0.11% | | | | | | | | | | | | | | | | | | | | |
Other securities | | | | | | | | | | | | | | | 6,986,755 | | | | 0.11 | |
| | | | | | | | | | | | | | | | | | | | |
| | | | | |
Telecommunication Services: 1.01% | | | | | | | | | | | | | | | | | | | | |
| | | | |
| Diversified Telecommunication Services: 1.00% | | | | | | | | | | | | | | | | | |
Other securities | | | | | | | | | | | | | | | 62,559,153 | | | | 1.00 | |
| | | | | | | | | | | | | | | | | | | | |
| | | | | |
| Wireless Telecommunication Services: 0.01% | | | | | | | | | | | | | | | | | | | | |
Other securities | | | | | | | | | | | | | | | 609,660 | | | | 0.01 | |
| | | | | | | | | | | | | | | | | | | | |
| | | | | |
Utilities: 1.87% | | | | | | | | | | | | | | | | | | | | |
| | | | | |
| Electric Utilities: 1.43% | | | | | | | | | | | | | | | | | | | | |
Other securities | | | | | | | | | | | | | | | 89,341,186 | | | | 1.43 | |
| | | | | | | | | | | | | | | | | | | | |
| | | | | |
| Gas Utilities: 0.10% | | | | | | | | | | | | | | | | | | | | |
Other securities | | | | | | | | | | | | | | | 6,356,441 | | | | 0.10 | |
| | | | | | | | | | | | | | | | | | | | |
| | | |
| Independent Power & Renewable Electricity Producers: 0.01% | | | | | | | | | | | | | |
Other securities | | | | | | | | | | | | | | | 816,984 | | | | 0.01 | |
| | | | | | | | | | | | | | | | | | | | |
| | | | | |
| Multi-Utilities: 0.31% | | | | | | | | | | | | | | | | | | | | |
Other securities | | | | | | | | | | | | | | | 19,104,655 | | | | 0.31 | |
| | | | | | | | | | | | | | | | | | | | |
| | | | | |
| Water Utilities: 0.02% | | | | | | | | | | | | | | | | | | | | |
Other securities | | | | | | | | | | | | | | | 1,148,845 | | | | 0.02 | |
| | | | | | | | | | | | | | | | | | | | |
| | | | |
Total Corporate Bonds and Notes (Cost $1,215,487,401) | | | | | | | | | | | | 1,304,461,428 | | | | 20.94 | |
| | | | | | | | | | | | | | | | | | | | |
| | | | | |
| | | Interest rate | | | Maturity date | | | Principal | | | | | | | |
| Foreign Government Bonds @: 25.60% | | | | | | | | | | | | | | | | | |
Bundesrepublik Deutschland (EUR) | | | 1.50-6.50 | % | | | 1- 4-2016 to 8-15-2046 | | | $ | 62,955,000 | | | | 100,886,209 | | | | 1.62 | |
France Government Bond (EUR) | | | 0.25-8.50 | | | | 10-25-2015 to 4-25-2060 | | | | 94,300,000 | | | | 148,816,384 | | | | 2.38 | |
Italy Buoni Poliennali del Tesoro (EUR) | | | 1.50-9.00 | | | | 11- 1-2015 to 9-1-2044 | | | | 108,105,000 | | | | 165,199,796 | | | | 2.68 | |
Japan Government Five Year Bond Series 066 (JPY) | | | 0.40 | | | | 9-20-2016 | | | | 1,525,000,000 | | | | 14,754,736 | | | | 0.24 | |
Japan Government Five Year Bond (JPY) | | | 0.20-0.60 | | | | 9- 20-2015 to 3-20-2019 | | | | 8,019,000,000 | | | | 77,450,116 | | | | 1.24 | |
Japan Government Ten Year Bond (JPY) | | | 0.60-2.00 | | | | 12-20-2015 to 3-20-2024 | | | | 24,239,000,000 | | | | 242,934,101 | | | | 3.91 | |
Japan Government Ten Year Bond Series 282 (JPY) | | | 1.70 | | | | 9-20-2016 | | | | 1,745,000,000 | | | | 17,329,077 | | | | 0.28 | |
The accompanying notes are an integral part of these financial statements.
| | | | | | |
| Summary portfolio of investments—August 31, 2014 (unaudited) | | Wells Fargo Advantage Dow Jones Target Date Funds | | | 87 | |
DIVERSIFIED FIXED INCOME PORTFOLIO
| | | | | | | | | | | | | | | | | | | | |
| Security name | | Interest rate | | | Maturity date | | | Principal | | | Value | | | Percent of
net assets | |
| | | | | | | | | | | | | | | | | | | | |
| Foreign Government Bonds @ (continued) | | | | | | | | | | | | | | | | | | | | |
Japan Government Ten Year Bond Series 305 (JPY) | | | 1.30 | % | | | 12-20-2019 | | | $ | 1,250,000,000 | | | $ | 12,723,281 | | | | 0.20 | % |
Japan Government Ten Year Bond Series 308 (JPY) | | | 1.30 | | | | 6-20-2020 | | | | 1,158,000,000 | | | | 11,836,297 | | | | 0.19 | |
Japan Government Ten Year Bond Series 312 (JPY) | | | 1.20 | | | | 12-20-2020 | | | | 1,200,000,000 | | | | 12,236,471 | | | | 0.20 | |
Japan Government Thirty Year Bond (JPY) | | | 1.70-2.90 | | | | 5-20-2030 to 3-20-2044 | | | | 6,367,500,000 | | | | 69,892,604 | | | | 1.12 | |
Japan Government Twenty Year Bond (JPY) | | | 0.80-3.10 | | | | 9-20-2017 to 6-20-2034 | | | | 17,943,500,000 | | | | 193,940,463 | | | | 3.14 | |
United Kingdom Gilt (GBP) | | | 1.00-8.75 | | | | 9- 7-2015 to 7-22-2068 | | | | 102,700,000 | | | | 195,312,839 | | | | 3.13 | |
Other securities | | | | | | | | | | | | | | | 330,846,406 | | | | 5.27 | |
| | | | |
Total Foreign Government Bonds (Cost $1,592,576,107) | | | | | | | | | | | | 1,594,158,780 | | | | 25.60 | |
| | | | | | | | | | | | | | | | | | | | |
| | | | | |
U.S. Treasury Securities: 23.38% | | | | | | | | | | | | | | | | | | | | |
U.S. Treasury Bond | | | 2.75-7.50 | | | | 8-15-2023 to 8-15-2044 | | | | 158,850,000 | | | | 181,713,152 | | | | 2.92 | |
U.S. Treasury Note | | | 0.25-9.13 | | | | 9-15-2015 to 8-15-2024 | | | | 650,900,000 | | | | 669,995,783 | | | | 10.76 | |
U.S. Treasury Note | | | 0.25 | | | | 10-15-2015 | | | | 15,000,000 | | | | 15,014,070 | | | | 0.24 | |
U.S. Treasury Note | | | 0.25 | | | | 11-30-2015 | | | | 34,000,000 | | | | 34,021,250 | | | | 0.55 | |
U.S. Treasury Note | | | 0.25 | | | | 2-29-2016 | | | | 15,000,000 | | | | 14,988,870 | | | | 0.24 | |
U.S. Treasury Note | | | 0.38 | | | | 5-31-2016 | | | | 13,000,000 | | | | 12,993,396 | | | | 0.21 | |
U.S. Treasury Note | | | 0.63 | | | | 7-15-2016 | | | | 25,000,000 | | | | 25,080,162 | | | | 0.40 | |
U.S. Treasury Note | | | 0.63 | | | | 9-30-2017 | | | | 24,000,000 | | | | 23,711,256 | | | | 0.38 | |
U.S. Treasury Note | | | 0.75 | | | | 6-30-2017 | | | | 15,000,000 | | | | 14,934,375 | | | | 0.24 | |
U.S. Treasury Note | | | 0.75 | | | | 12-31-2017 | | | | 14,000,000 | | | | 13,822,816 | | | | 0.22 | |
U.S. Treasury Note | | | 1.00 | | | | 3-31-2017 | | | | 12,000,000 | | | | 12,062,808 | | | | 0.19 | |
U.S. Treasury Note | | | 1.00 | | | | 6-30-2019 | | | | 25,000,000 | | | | 24,273,450 | | | | 0.39 | |
U.S. Treasury Note | | | 1.25 | | | | 4-30-2019 | | | | 12,000,000 | | | | 11,827,500 | | | | 0.19 | |
U.S. Treasury Note | | | 1.50 | | | | 7-31-2016 | | | | 15,000,000 | | | | 15,287,700 | | | | 0.25 | |
U.S. Treasury Note | | | 1.50 | | | | 8-31-2018 | | | | 12,000,000 | | | | 12,051,564 | | | | 0.19 | |
U.S. Treasury Note | | | 1.50 | | | | 5-31-2019 | | | | 25,000,000 | | | | 24,888,675 | | | | 0.40 | |
U.S. Treasury Note | | | 1.63 | | | | 3-31-2019 | | | | 20,000,000 | | | | 20,057,820 | | | | 0.32 | |
U.S. Treasury Note | | | 1.63 | | | | 11-15-2022 | | | | 12,500,000 | | | | 11,964,850 | | | | 0.19 | |
U.S. Treasury Note | | | 1.75 | | | | 5-15-2023 | | | | 12,500,000 | | | | 12,002,925 | | | | 0.19 | |
U.S. Treasury Note | | | 2.00 | | | | 11-15-2021 | | | | 16,000,000 | | | | 15,926,256 | | | | 0.26 | |
U.S. Treasury Note | | | 2.13 | | | | 12-31-2015 | | | | 24,000,000 | | | | 24,597,192 | | | | 0.40 | |
U.S. Treasury Note | | | 2.38 | | | | 3-31-2016 | | | | 22,500,000 | | | | 23,213,678 | | | | 0.37 | |
U.S. Treasury Note | | | 2.50 | | | | 8-15-2023 | | | | 14,250,000 | | | | 14,521,634 | | | | 0.23 | |
U.S. Treasury Note | | | 2.50 | | | | 5-15-2024 | | | | 13,000,000 | | | | 13,186,875 | | | | 0.21 | |
U.S. Treasury Note | | | 2.63 | | | | 8-15-2020 | | | | 12,000,000 | | | | 12,514,692 | | | | 0.20 | |
U.S. Treasury Note | | | 2.75 | | | | 11-30-2016 | | | | 24,000,000 | | | | 25,132,512 | | | | 0.40 | |
U.S. Treasury Note | | | 2.75 | | | | 2-15-2019 | | | | 16,950,000 | | | | 17,842,519 | | | | 0.29 | |
U.S. Treasury Note | | | 2.75 | | | | 11-15-2023 | | | | 15,500,000 | | | | 16,094,565 | | | | 0.26 | |
U.S. Treasury Note | | | 2.75 | | | | 2-15-2024 | | | | 25,000,000 | | | | 25,933,600 | | | | 0.42 | |
U.S. Treasury Note | | | 3.63 | | | | 2-15-2020 | | | | 38,000,000 | | | | 41,740,644 | | | | 0.67 | |
U.S. Treasury Note | | | 3.63 | | | | 2-15-2021 | | | | 20,000,000 | | | | 22,056,240 | | | | 0.35 | |
U.S. Treasury Note | | | 4.63 | | | | 11-15-2016 | | | | 25,000,000 | | | | 27,179,700 | | | | 0.44 | |
U.S. Treasury Note | | | 4.75 | | | | 8-15-2017 | | | | 23,000,000 | | | | 25,528,206 | | | | 0.41 | |
| | | | |
Total U.S. Treasury Securities (Cost $1,423,396,502) | | | | | | | | | | | | 1,456,160,735 | | | | 23.38 | |
| | | | | | | | | | | | | | | | | | | | |
| | | | |
Yankee Corporate Bonds and Notes: 3.98% | | | | | | | | | | | | | | | | | |
| | | | | |
Consumer Discretionary: 0.03% | | | | | | | | | | | | | | | | | | | | |
| | | | | |
| Media: 0.03% | | | | | | | | | | | | | | | | | | | | |
Other securities | | | | | | | | | | | | | | | 1,998,816 | | | | 0.03 | |
| | | | | | | | | | | | | | | | | | | | |
The accompanying notes are an integral part of these financial statements.
| | | | |
| 88 | | Wells Fargo Advantage Dow Jones Target Date Funds | | Summary portfolio of investments—August 31, 2014 (unaudited) |
DIVERSIFIED FIXED INCOME PORTFOLIO
| | | | | | | | | | | | | | |
| Security name | | | | | | | | Value | | | Percent of
net assets | |
| | | | | | | | | | | | | | |
| | | | | |
Consumer Staples: 0.08% | | | | | | | | | | | | | | |
| | | | | |
| Beverages: 0.08% | | | | | | | | | | | | | | |
Other securities | | | | | | | | $ | 4,845,876 | | | | 0.08 | % |
| | | | | | | | | | | | | | |
| | | | | |
Energy: 0.69% | | | | | | | | | | | | | | |
| | | | | |
| Energy Equipment & Services: 0.03% | | | | | | | | | | | | | | |
Other securities | | | | | | | | | 1,838,653 | | | | 0.03 | |
| | | | | | | | | | | | | | |
| | | | | |
| Oil, Gas & Consumable Fuels: 0.66% | | | | | | | | | | | | | | |
Other securities | | | | | | | | | 41,074,283 | | | | 0.66 | |
| | | | | | | | | | | | | | |
| | | | | |
Financials: 1.83% | | | | | | | | | | | | | | |
| | | | | |
| Banks: 1.18% | | | | | | | | | | | | | | |
Other securities | | | | | | | | | 73,407,415 | | | | 1.18 | |
| | | | | | | | | | | | | | |
| | | | | |
| Capital Markets: 0.06% | | | | | | | | | | | | | | |
Other securities | | | | | | | | | 3,639,656 | | | | 0.06 | |
| | | | | | | | | | | | | | |
| | | | | |
| Diversified Financial Services: 0.53% | | | | | | | | | | | | | | |
Other securities | | | | | | | | | 33,115,236 | | | | 0.53 | |
| | | | | | | | | | | | | | |
| | | | | |
| Insurance: 0.06% | | | | | | | | | | | | | | |
Other securities | | | | | | | | | 3,730,692 | | | | 0.06 | |
| | | | | | | | | | | | | | |
| | | | | |
| Real Estate Management & Development: 0.00% | | | | | | | | | | | | | | |
Other securities | | | | | | | | | 137,723 | | | | 0.00 | |
| | | | | | | | | | | | | | |
| | | | | |
Health Care: 0.19% | | | | | | | | | | | | | | |
| | | | | |
| Biotechnology: 0.01% | | | | | | | | | | | | | | |
Other securities | | | | | | | | | 505,858 | | | | 0.01 | |
| | | | | | | | | | | | | | |
| | | | | |
| Health Care Equipment & Supplies: 0.03% | | | | | | | | | | | | | | |
Other securities | | | | | | | | | 1,725,092 | | | | 0.03 | |
| | | | | | | | | | | | | | |
| | | | | |
| Pharmaceuticals: 0.15% | | | | | | | | | | | | | | |
Other securities | | | | | | | | | 9,472,475 | | | | 0.15 | |
| | | | | | | | | | | | | | |
| | | | | |
Industrials: 0.11% | | | | | | | | | | | | | | |
| | | | | |
| Aerospace & Defense: 0.00% | | | | | | | | | | | | | | |
Other securities | | | | | | | | | 214,250 | | | | 0.00 | |
| | | | | | | | | | | | | | |
| | | | | |
| Industrial Conglomerates: 0.06% | | | | | | | | | | | | | | |
Other securities | | | | | | | | | 3,402,250 | | | | 0.06 | |
| | | | | | | | | | | | | | |
| | | | | |
| Machinery: 0.01% | | | | | | | | | | | | | | |
Other securities | | | | | | | | | 579,692 | | | | 0.01 | |
| | | | | | | | | | | | | | |
| | | | | |
| Road & Rail: 0.04% | | | | | | | | | | | | | | |
Other securities | | | | | | | | | 2,736,975 | | | | 0.04 | |
| | | | | | | | | | | | | | |
| | | | | |
Information Technology: 0.06% | | | | | | | | | | | | | | |
| | | | | |
| Communications Equipment: 0.01% | | | | | | | | | | | | | | |
Other securities | | | | | | | | | 419,947 | | | | 0.01 | |
| | | | | | | | | | | | | | |
The accompanying notes are an integral part of these financial statements.
| | | | | | |
| Summary portfolio of investments—August 31, 2014 (unaudited) | | Wells Fargo Advantage Dow Jones Target Date Funds | | | 89 | |
DIVERSIFIED FIXED INCOME PORTFOLIO
| | | | | | | | | | | | | | | | | | |
| Security name | | | | | | | | | | Value | | | Percent of
net assets | |
| | | | | | | | | | | | | | | | | | |
| | | | | |
| Internet Software & Services: 0.02% | | | | | | | | | | | | | | | | | | |
Other securities | | | | | | | | | | | | $ | 1,349,039 | | | | 0.02 | % |
| | | | | | | | | | | | | | | | | | |
| | | |
| Technology Hardware, Storage & Peripherals: 0.03% | | | | | | | | | | | | |
Other securities | | | | | | | | | | | | | 2,052,500 | | | | 0.03 | |
| | | | | | | | | | | | | | | | | | |
| | | | | |
Materials: 0.45% | | | | | | | | | | | | | | | | | | |
| | | | | |
| Chemicals: 0.09% | | | | | | | | | | | | | | | | | | |
Other securities | | | | | | | | | | | | | 5,474,265 | | | | 0.09 | |
| | | | | | | | | | | | | | | | | | |
| | | | | |
| Metals & Mining: 0.34% | | | | | | | | | | | | | | | | | | |
Other securities | | | | | | | | | | | | | 21,254,130 | | | | 0.34 | |
| | | | | | | | | | | | | | | | | | |
| | | | | |
| Paper & Forest Products: 0.02% | | | | | | | | | | | | | | | | | | |
Other securities | | | | | | | | | | | | | 929,855 | | | | 0.02 | |
| | | | | | | | | | | | | | | | | | |
| | | | | |
Telecommunication Services: 0.52% | | | | | | | | | | | | | | | | | | |
| | | | |
| Diversified Telecommunication Services: 0.28% | | | | | | | | | | | | | | | |
Other securities | | | | | | | | | | | | | 17,555,621 | | | | 0.28 | |
| | | | | | | | | | | | | | | | | | |
| | | | | |
| Wireless Telecommunication Services: 0.24% | | | | | | | | | | | | | | | | | | |
Other securities | | | | | | | | | | | | | 14,644,221 | | | | 0.24 | |
| | | | | | | | | | | | | | | | | | |
| | | | | |
Utilities: 0.02% | | | | | | | | | | | | | | | | | | |
| | | | | |
| Electric Utilities: 0.00% | | | | | | | | | | | | | | | | | | |
Other securities | | | | | | | | | | | | | 174,762 | | | | 0.00 | |
| | | | | | | | | | | | | | | | | | |
| | | |
| Independent Power & Renewable Electricity Producers: 0.01% | | | | | | | | | | | | |
Other securities | | | | | | | | | | | | | 321,391 | | | | 0.01 | |
| | | | | | | | | | | | | | | | | | |
| | | | | |
| Multi-Utilities: 0.01% | | | | | | | | | | | | | | | | | | |
Other securities | | | | | | | | | | | | | 549,909 | | | | 0.01 | |
| | | | | | | | | | | | | | | | | | |
| | | | | |
| Water Utilities: 0.00% | | | | | | | | | | | | | | | | | | |
Other securities | | | | | | | | | | | | | 275,717 | | | | 0.00 | |
| | | | | | | | | | | | | | | | | | |
| | | |
Total Yankee Corporate Bonds and Notes (Cost $233,165,600) | | | | | | | 247,426,299 | | | | 3.98 | |
| | | | | | | | | | | | | | | | | | |
| | | | | |
| Yankee Government Bonds: 0.03% | | | | | | | | | | | | | | | | | | |
Other securities | | | | | | | | | | | | | 1,999,000 | | | | 0.03 | |
| | | | | | | | | | | | | | | | | | |
| | | |
Total Yankee Government Bonds (Cost $2,001,242) | | | | | | | 1,999,000 | | | | 0.03 | |
| | | | | | | | | | | | | | | | | | |
| | | | | |
| | | Yield | | | | | Shares | | | | | | | |
| Short-Term Investments: 4.22% | | | | | | | | | | | | | | | | | | |
| | | | | |
| Investment Companies: 4.22% | | | | | | | | | | | | | | | | | | |
Wells Fargo Advantage Cash Investment Money Market Fund, Select Class (l)(u)## | | | 0.07 | % | | | | | 261,304,361 | | | | 261,304,361 | | | | 4.19 | |
Wells Fargo Securities Lending Cash Investments, LLC (l)(u)(r) | | | 0.11 | | | | | | 1,719,240 | | | | 1,719,240 | | | | 0.03 | |
| | | | |
Total Short-Term Investments (Cost $263,023,601) | | | | | | | | | | 263,023,601 | | | | 4.22 | |
| | | | | | | | | | | | | | | | | | |
The accompanying notes are an integral part of these financial statements.
| | | | |
| 90 | | Wells Fargo Advantage Dow Jones Target Date Funds | | Summary portfolio of investments—August 31, 2014 (unaudited) |
DIVERSIFIED FIXED INCOME PORTFOLIO
| | | | | | | | | | |
| Security name | | | | Value | | | Percent of
net assets | |
| | | | | | | | | | |
| Total investments in securities | | | | | | | | | | |
| (Cost $6,436,391,015) * | | | | $ | 6,606,847,030 | | | | 106.08 | % |
Other assets and liabilities, net | | | | | (378,389,854 | ) | | | (6.08 | ) |
| | | | | | | | | | |
| Total net assets | | | | $ | 6,228,457,176 | | | | 100.00 | % |
| | | | | | | | | | |
| %% | The security is issued on a when-issued basis. |
| (l) | The security represents an affiliate of the Fund as defined in the Investment Company Act of 1940. |
| @ | Foreign bond principal is denominated in the local currency of the issuer. |
| (u) | The rate represents the 7-day annualized yield at period end. |
| ## | All or a portion of this security has been segregated for when-issued securities. |
| (r) | The investment is a non-registered investment vehicle purchased with cash collateral received from securities on loan. |
| * | Cost for federal income tax purposes is $6,437,953,907 and unrealized gains (losses) consists of: |
| | | | |
Gross unrealized gains | | $ | 266,784,608 | |
Gross unrealized losses | | | (97,891,485 | ) |
| | | | |
Net unrealized gains | | $ | 168,893,123 | |
The following table shows the percent of total long-term investments by geographic location as of August 31, 2014 (unaudited):
| | | | |
United States | | | 70.74 | % |
Japan | | | 10.72 | |
United Kingdom | | | 3.93 | |
France | | | 2.93 | |
Italy | | | 2.68 | |
Germany | | | 2.20 | |
Canada | | | 1.51 | |
Spain | | | 1.48 | |
Netherlands | | | 1.12 | |
Other | | | 2.69 | |
| | | | |
| | | 100.00 | % |
| | | | |
The accompanying notes are an integral part of these financial statements.
| | | | | | |
| Summary portfolio of investments—August 31, 2014 (unaudited) | | Wells Fargo Advantage Dow Jones Target Date Funds | | | 91 | |
DIVERSIFIED STOCK PORTFOLIO
The Summary Portfolio of Investments shows the 50 largest portfolio holdings in unaffiliated issuers and any holdings exceeding 1% of the total net assets as of the report date. The remaining securities held are grouped as “Other securities” in each category. You can request a complete schedule of portfolio holdings as of the report date, free of charge, by accessing the following website:
http://a584.g.akamai.net/f/584/1326/1d/www.wellsfargoadvantagefunds.com/pdf/semi/holdings/diversifiedstock.pdf or by calling Wells Fargo Advantage Funds at 1-800-222-8222. This complete schedule, filed on the Form N-CSRS, is also available on the SEC’s website at sec.gov.
| | | | | | | | | | | | | | | | |
| Security name | | | | | | Shares | | | Value | | | Percent of
net assets | |
| | | | | | | | | | | | | | | | |
| | | | | |
Common Stocks: 95.84% | | | | | | | | | | | | | | | | |
| | | | | |
Consumer Discretionary: 12.45% | | | | | | | | | | | | | | | | |
| | | | | |
| Auto Components: 1.10% | | | | | | | | | | | | | | | | |
Other securities | | | | | | | | | | $ | 109,695,049 | | | | 1.10 | % |
| | | | | | | | | | | | | | | | |
| | | | | |
| Automobiles: 1.34% | | | | | | | | | | | | | | | | |
Toyota Motor Corporation | | | | | | | 537,214 | | | | 30,607,954 | | | | 0.31 | |
Other securities | | | | | | | | | | | 102,646,538 | | | | 1.03 | |
| | | | | |
| | | | | | | | | | | 133,254,492 | | | | 1.34 | |
| | | | | | | | | | | | | | | | |
| | | | | |
| Distributors: 0.13% | | | | | | | | | | | | | | | | |
Other securities | | | | | | | | | | | 13,075,884 | | | | 0.13 | |
| | | | | | | | | | | | | | | | |
| | | | | |
| Diversified Consumer Services: 0.40% | | | | | | | | | | | | | | | | |
Other securities | | | | | | | | | | | 39,288,031 | | | | 0.40 | |
| | | | | | | | | | | | | | | | |
| | | | | |
| Hotels, Restaurants & Leisure: 2.01% | | | | | | | | | | | | | | | | |
McDonald’s Corporation | | | | | | | 214,414 | | | | 20,094,880 | | | | 0.20 | |
Other securities | | | | | | | | | | | 180,023,704 | | | | 1.81 | |
| | | | | |
| | | | | | | | | | | 200,118,584 | | | | 2.01 | |
| | | | | | | | | | | | | | | | |
| | | | | |
| Household Durables: 0.84% | | | | | | | | | | | | | | | | |
Other securities | | | | | | | | | | | 83,491,905 | | | | 0.84 | |
| | | | | | | | | | | | | | | | |
| | | | | |
| Internet & Catalog Retail: 0.95% | | | | | | | | | | | | | | | | |
Amazon.com Incorporated † | | | | | | | 81,027 | | | | 27,471,394 | | | | 0.28 | |
Netflix Incorporated † | | | | | | | 35,726 | | | | 17,064,167 | | | | 0.17 | |
Other securities | | | | | | | | | | | 50,459,315 | | | | 0.50 | |
| | | | | |
| | | | | | | | | | | 94,994,876 | | | | 0.95 | |
| | | | | | | | | | | | | | | | |
| | | | | |
| Leisure Products: 0.32% | | | | | | | | | | | | | | | | |
Other securities | | | | | | | | | | | 32,108,842 | | | | 0.32 | |
| | | | | | | | | | | | | | | | |
| | | | | |
| Media: 1.69% | | | | | | | | | | | | | | | | |
Other securities | | | | | | | | | | | 167,741,959 | | | | 1.69 | |
| | | | | | | | | | | | | | | | |
| | | | | |
| Multiline Retail: 0.44% | | | | | | | | | | | | | | | | |
Other securities | | | | | | | | | | | 44,234,790 | | | | 0.44 | |
| | | | | | | | | | | | | | | | |
| | | | | |
| Specialty Retail: 2.17% | | | | | | | | | | | | | | | | |
The Home Depot Incorporated | | | | | | | 297,430 | | | | 27,809,705 | | | | 0.28 | |
Other securities | | | | | | | | | | | 187,614,457 | | | | 1.89 | |
| | | | | |
| | | | | | | | | | | 215,424,162 | | | | 2.17 | |
| | | | | | | | | | | | | | | | |
| | | | | |
| Textiles, Apparel & Luxury Goods: 1.06% | | | | | | | | | | | | | | | | |
Other securities | | | | | | | | | | | 105,676,638 | | | | 1.06 | |
| | | | | | | | | | | | | | | | |
The accompanying notes are an integral part of these financial statements.
| | | | |
| 92 | | Wells Fargo Advantage Dow Jones Target Date Funds | | Summary portfolio of investments—August 31, 2014 (unaudited) |
DIVERSIFIED STOCK PORTFOLIO
| | | | | | | | | | | | | | | | |
| Security name | | | | | | Shares | | | Value | | | Percent of
net assets | |
| | | | | | | | | | | | | | | | |
| | | | | |
Consumer Staples: 6.53% | | | | | | | | | | | | | | | | |
| | | | | |
| Beverages: 1.41% | | | | | | | | | | | | | | | | |
PepsiCo Incorporated | | | | | | | 198,163 | | | $ | 18,328,096 | | | | 0.19 | % |
The Coca-Cola Company | | | | | | | 481,166 | | | | 20,074,246 | | | | 0.20 | |
Other securities | | | | | | | | | | | 102,299,955 | | | | 1.02 | |
| | | | | |
| | | | | | | | | | | 140,702,297 | | | | 1.41 | |
| | | | | | | | | | | | | | | | |
| | | | | |
| Food & Staples Retailing: 1.41% | | | | | | | | | | | | | | | | |
Other securities | | | | | | | | | | | 139,981,356 | | | | 1.41 | |
| | | | | | | | | | | | | | | | |
| | | | | |
| Food Products: 2.03% | | | | | | | | | | | | | | | | |
Nestle SA | | | | | | | 284,669 | | | | 22,093,204 | | | | 0.22 | |
Other securities | | | | | | | | | | | 180,264,504 | | | | 1.81 | |
| | | | | |
| | | | | | | | | | | 202,357,708 | | | | 2.03 | |
| | | | | | | | | | | | | | | | |
| | | | | |
| Household Products: 0.74% | | | | | | | | | | | | | | | | |
The Procter & Gamble Company | | | | | | | 345,482 | | | | 28,713,009 | | | | 0.29 | |
Other securities | | | | | | | | | | | 44,558,267 | | | | 0.45 | |
| | | | | |
| | | | | | | | | | | 73,271,276 | | | | 0.74 | |
| | | | | | | | | | | | | | | | |
| | | | | |
| Personal Products: 0.28% | | | | | | | | | | | | | | | | |
Other securities | | | | | | | | | | | 27,819,154 | | | | 0.28 | |
| | | | | | | | | | | | | | | | |
| | | | | |
| Tobacco: 0.66% | | | | | | | | | | | | | | | | |
Philip Morris International Incorporated | | | | | | | 205,550 | | | | 17,590,969 | | | | 0.18 | |
Other securities | | | | | | | | | | | 48,373,510 | | | | 0.48 | |
| | | | | |
| | | | | | | | | | | 65,964,479 | | | | 0.66 | |
| | | | | | | | | | | | | | | | |
| | | | | |
Energy: 7.22% | | | | | | | | | | | | | | | | |
| | | | | |
| Energy Equipment & Services: 1.54% | | | | | | | | | | | | | | | | |
Schlumberger Limited | | | | | | | 283,405 | | | | 31,072,524 | | | | 0.31 | |
Other securities | | | | | | | | | | | 122,116,069 | | | | 1.23 | |
| | | | | |
| | | | | | | | | | | 153,188,593 | | | | 1.54 | |
| | | | | | | | | | | | | | | | |
| | | | | |
| Oil, Gas & Consumable Fuels: 5.68% | | | | | | | | | | | | | | | | |
Chevron Corporation | | | | | | | 243,123 | | | | 31,472,272 | | | | 0.32 | |
Exxon Mobil Corporation | | | | | | | 549,931 | | | | 54,696,137 | | | | 0.55 | |
Other securities | | | | | | | | | | | 479,284,727 | | | | 4.81 | |
| | | | | |
| | | | | | | | | | | 565,453,136 | | | | 5.68 | |
| | | | | | | | | | | | | | | | |
| | | | | |
Financials: 20.90% | | | | | | | | | | | | | | | | |
| | | | | |
| Banks: 8.09% | | | | | | | | | | | | | | | | |
Bank of America Corporation | | | | | | | 1,339,566 | | | | 21,553,617 | | | | 0.22 | |
Citigroup Incorporated | | | | | | | 397,069 | | | | 20,508,614 | | | | 0.21 | |
Commonwealth Bank of Australia | | | | | | | 299,797 | | | | 22,769,229 | | | | 0.23 | |
HSBC Holdings plc | | | | | | | 1,676,122 | | | | 18,142,649 | | | | 0.18 | |
JPMorgan Chase & Company | | | | | | | 483,177 | | | | 28,724,873 | | | | 0.29 | |
Wells Fargo & Company (l) | | | | | | | 612,220 | | | | 31,492,597 | | | | 0.32 | |
The accompanying notes are an integral part of these financial statements.
| | | | | | |
| Summary portfolio of investments—August 31, 2014 (unaudited) | | Wells Fargo Advantage Dow Jones Target Date Funds | | | 93 | |
DIVERSIFIED STOCK PORTFOLIO
| | | | | | | | | | | | | | | | |
| Security name | | | | | | Shares | | | Value | | | Percent of
net assets | |
| | | | | | | | | | | | | | | | |
| | | | | |
| Banks (continued) | | | | | | | | | | | | | | | | |
Westpac Banking Corporation | | | | | | | 574,844 | | | $ | 18,812,122 | | | | 0.19 | % |
Other securities | | | | | | | | | | | 642,964,774 | | | | 6.45 | |
| | | | | |
| | | | | | | | | | | 804,968,475 | | | | 8.09 | |
| | | | | | | | | | | | | | | | |
| | | | | |
| Capital Markets: 1.57% | | | | | | | | | | | | | | | | |
Other securities | | | | | | | | | | | 156,340,810 | | | | 1.57 | |
| | | | | | | | | | | | | | | | |
| | | | | |
| Consumer Finance: 0.28% | | | | | | | | | | | | | | | | |
Other securities | | | | | | | | | | | 28,003,833 | | | | 0.28 | |
| | | | | | | | | | | | | | | | |
| | | | | |
| Diversified Financial Services: 1.08% | | | | | | | | | | | | | | | | |
Berkshire Hathaway Incorporated Class B † | | | | | | | 230,000 | | | | 31,567,500 | | | | 0.32 | |
Other securities | | | | | | | | | | | 75,590,305 | | | | 0.76 | |
| | | | | |
| | | | | | | | | | | 107,157,805 | | | | 1.08 | |
| | | | | | | | | | | | | | | | |
| | | | | |
| Insurance: 3.99% | | | | | | | | | | | | | | | | |
Other securities | | | | | | | | | | | 396,792,057 | | | | 3.99 | |
| | | | | | | | | | | | | | | | |
| | | | | |
| Real Estate Management & Development: 0.96% | | | | | | | | | | | | | | | | |
Other securities | | | | | | | | | | | 95,547,545 | | | | 0.96 | |
| | | | | | | | | | | | | | | | |
| | | | | |
| REITs: 4.59% | | | | | | | | | | | | | | | | |
American Realty Capital Properties Incorporated | | | | | | | 1,928,485 | | | | 25,378,863 | | | | 0.26 | |
Other securities | | | | | | | | | | | 430,986,309 | | | | 4.33 | |
| | | | | |
| | | | | | | | | | | 456,365,172 | | | | 4.59 | |
| | | | | | | | | | | | | | | | |
| | | | | |
| Thrifts & Mortgage Finance: 0.34% | | | | | | | | | | | | | | | | |
Other securities | | | | | | | | | | | 34,291,114 | | | | 0.34 | |
| | | | | | | | | | | | | | | | |
| | | | | |
Health Care: 9.46% | | | | | | | | | | | | | | | | |
| | | | | |
| Biotechnology: 1.76% | | | | | | | | | | | | | | | | |
Biogen Idec Incorporated † | | | | | | | 51,407 | | | | 17,634,657 | | | | 0.18 | |
Gilead Sciences Incorporated † | | | | | | | 334,400 | | | | 35,974,752 | | | | 0.36 | |
Incyte Corporation † | | | | | | | 344,900 | | | | 18,693,580 | | | | 0.19 | |
Other securities | | | | | | | | | | | 103,043,015 | | | | 1.03 | |
| | | | | |
| | | | | | | | | | | 175,346,004 | | | | 1.76 | |
| | | | | | | | | | | | | | | | |
| | | | | |
| Health Care Equipment & Supplies: 1.30% | | | | | | | | | | | | | | | | |
Other securities | | | | | | | | | | | 129,729,218 | | | | 1.30 | |
| | | | | | | | | | | | | | | | |
| | | | | |
| Health Care Providers & Services: 1.93% | | | | | | | | | | | | | | | | |
Other securities | | | | | | | | | | | 191,433,002 | | | | 1.93 | |
| | | | | | | | | | | | | | | | |
| | | | | |
| Health Care Technology: 0.22% | | | | | | | | | | | | | | | | |
Other securities | | | | | | | | | | | 22,045,923 | | | | 0.22 | |
| | | | | | | | | | | | | | | | |
| | | | | |
| Life Sciences Tools & Services: 0.70% | | | | | | | | | | | | | | | | |
Other securities | | | | | | | | | | | 69,588,890 | | | | 0.70 | |
| | | | | | | | | | | | | | | | |
The accompanying notes are an integral part of these financial statements.
| | | | |
| 94 | | Wells Fargo Advantage Dow Jones Target Date Funds | | Summary portfolio of investments—August 31, 2014 (unaudited) |
DIVERSIFIED STOCK PORTFOLIO
| | | | | | | | | | | | | | | | |
| Security name | | | | | | Shares | | | Value | | | Percent of
net assets | |
| | | | | | | | | | | | | | | | |
| | | | | |
| Pharmaceuticals: 3.55% | | | | | | | | | | | | | | | | |
Johnson & Johnson | | | | | | | 361,776 | | | $ | 37,527,024 | | | | 0.38 | % |
Mallinckrodt plc † | | | | | | | 245,073 | | | | 19,971,007 | | | | 0.20 | |
Merck & Company Incorporated | | | | | | | 372,358 | | | | 22,382,439 | | | | 0.23 | |
Novartis AG | | | | | | | 238,838 | | | | 21,424,007 | | | | 0.22 | |
Pfizer Incorporated | | | | | | | 813,155 | | | | 23,898,625 | | | | 0.24 | |
Roche Holding AG Genusschein | | | | | | | 61,846 | | | | 18,034,066 | | | | 0.18 | |
Other securities | | | | | | | | | | | 209,717,407 | | | | 2.10 | |
| | | | | |
| | | | | | | | | | | 352,954,575 | | | | 3.55 | |
| | | | | | | | | | | | | | | | |
| | | | | |
Industrials: 12.79% | | | | | | | | | | | | | | | | |
| | | | | |
| Aerospace & Defense: 1.58% | | | | | | | | | | | | | | | | |
United Technologies Corporation | | | | | | | 182,959 | | | | 19,755,913 | | | | 0.20 | |
Other securities | | | | | | | | | | | 137,576,239 | | | | 1.38 | |
| | | | | |
| | | | | | | | | | | 157,332,152 | | | | 1.58 | |
| | | | | | | | | | | | | | | | |
| | | | | |
| Air Freight & Logistics: 0.48% | | | | | | | | | | | | | | | | |
Other securities | | | | | | | | | | | 47,986,718 | | | | 0.48 | |
| | | | | | | | | | | | | | | | |
| | | | | |
| Airlines: 1.08% | | | | | | | | | | | | | | | | |
American Airlines Group Incorporated | | | | | | | 1,517,222 | | | | 59,035,108 | | | | 0.59 | |
Other securities | | | | | | | | | | | 48,034,061 | | | | 0.49 | |
| | | | | |
| | | | | | | | | | | 107,069,169 | | | | 1.08 | |
| | | | | | | | | | | | | | | | |
| | | | | |
| Building Products: 0.55% | | | | | | | | | | | | | | | | |
Other securities | | | | | | | | | | | 55,003,075 | | | | 0.55 | |
| | | | | | | | | | | | | | | | |
| | | | | |
| Commercial Services & Supplies: 1.06% | | | | | | | | | | | | | | | | |
Other securities | | | | | | | | | | | 105,092,518 | | | | 1.06 | |
| | | | | | | | | | | | | | | | |
| | | | | |
| Construction & Engineering: 0.52% | | | | | | | | | | | | | | | | |
Other securities | | | | | | | | | | | 51,960,757 | | | | 0.52 | |
| | | | | | | | | | | | | | | | |
| | | | | |
| Electrical Equipment: 1.08% | | | | | | | | | | | | | | | | |
Other securities | | | | | | | | | | | 107,736,811 | | | | 1.08 | |
| | | | | | | | | | | | | | | | |
| | | | | |
| Industrial Conglomerates: 0.95% | | | | | | | | | | | | | | | | |
General Electric Company | | | | | | | 1,281,407 | | | | 33,290,954 | | | | 0.34 | |
Other securities | | | | | | | | | | | 60,904,182 | | | | 0.61 | |
| | | | | |
| | | | | | | | | | | 94,195,136 | | | | 0.95 | |
| | | | | | | | | | | | | | | | |
| | | | | |
| Machinery: 2.61% | | | | | | | | | | | | | | | | |
Other securities | | | | | | | | | | | 259,961,828 | | | | 2.61 | |
| | | | | | | | | | | | | | | | |
| | | | | |
| Marine: 0.15% | | | | | | | | | | | | | | | | |
Other securities | | | | | | | | | | | 14,379,705 | | | | 0.15 | |
| | | | | | | | | | | | | | | | |
| | | | | |
| Professional Services: 0.46% | | | | | | | | | | | | | | | | |
Other securities | | | | | | | | | | | 45,165,031 | | | | 0.46 | |
| | | | | | | | | | | | | | | | |
The accompanying notes are an integral part of these financial statements.
| | | | | | |
| Summary portfolio of investments—August 31, 2014 (unaudited) | | Wells Fargo Advantage Dow Jones Target Date Funds | | | 95 | |
DIVERSIFIED STOCK PORTFOLIO
| | | | | | | | | | | | | | | | |
| Security name | | | | | | Shares | | | Value | | | Percent of
net assets | |
| | | | | | | | | | | | | | | | |
| | | | | |
| Road & Rail: 1.27% | | | | | | | | | | | | | | | | |
Union Pacific Corporation | | | | | | | 196,500 | | | $ | 20,685,555 | | | | 0.21 | % |
Other securities | | | | | | | | | | | 106,036,062 | | | | 1.06 | |
| | | | | |
| | | | | | | | | | | 126,721,617 | | | | 1.27 | |
| | | | | | | | | | | | | | | | |
| | | | | |
| Trading Companies & Distributors: 0.83% | | | | | | | | | | | | | | | | |
Other securities | | | | | | | | | | | 82,854,547 | | | | 0.83 | |
| | | | | | | | | | | | | | | | |
| | | | | |
| Transportation Infrastructure: 0.17% | | | | | | | | | | | | | | | | |
Other securities | | | | | | | | | | | 17,257,708 | | | | 0.17 | |
| | | | | | | | | | | | | | | | |
| | | | | |
Information Technology: 14.64% | | | | | | | | | | | | | | | | |
| | | | | |
| Communications Equipment: 1.12% | | | | | | | | | | | | | | | | |
QUALCOMM Incorporated | | | | | | | 367,097 | | | | 27,936,082 | | | | 0.28 | |
Other securities | | | | | | | | | | | 83,617,262 | | | | 0.84 | |
| | | | | |
| | | | | | | | | | | 111,553,344 | | | | 1.12 | |
| | | | | | | | | | | | | | | | |
| | | | | |
| Electronic Equipment, Instruments & Components: 1.52% | | | | | | | | | | | | | | | | |
Other securities | | | | | | | | | | | 151,257,517 | | | | 1.52 | |
| | | | | | | | | | | | | | | | |
| | | | | |
| Internet Software & Services: 2.07% | | | | | | | | | | | | | | | | |
Facebook Incorporated Class A † | | | | | | | 373,953 | | | | 27,979,163 | | | | 0.28 | |
Google Incorporated Class A † | | | | | | | 61,742 | | | | 35,956,071 | | | | 0.36 | |
Google Incorporated Class C † | | | | | | | 61,704 | | | | 35,270,006 | | | | 0.35 | |
Tencent Holdings Limited | | | | | | | 1,262,725 | | | | 20,610,798 | | | | 0.21 | |
Other securities | | | | | | | | | | | 85,630,031 | | | | 0.87 | |
| | | | | |
| | | | | | | | | | | 205,446,069 | | | | 2.07 | |
| | | | | | | | | | | | | | | | |
| | | | | |
| IT Services: 2.30% | | | | | | | | | | | | | | | | |
International Business Machines Corporation | | | | | | | 207,346 | | | | 39,872,636 | | | | 0.40 | |
Visa Incorporated | | | | | | | 109,211 | | | | 23,209,522 | | | | 0.23 | |
Other securities | | | | | | | | | | | 165,950,830 | | | | 1.67 | |
| | | | | |
| | | | | | | | | | | 229,032,988 | | | | 2.30 | |
| | | | | | | | | | | | | | | | |
| | | | | |
| Semiconductors & Semiconductor Equipment: 3.06% | | | | | | | | | | | | | | | | |
Intel Corporation | | | | | | | 634,334 | | | | 22,150,943 | | | | 0.22 | |
Samsung Electronics Company Limited | | | | | | | 28,570 | | | | 34,770,334 | | | | 0.35 | |
Taiwan Semiconductor Manufacturing Company Limited | | | | | | | 4,332,298 | | | | 17,972,431 | | | | 0.18 | |
Other securities | | | | | | | | | | | 229,956,504 | | | | 2.31 | |
| | | | | |
| | | | | | | | | | | 304,850,212 | | | | 3.06 | |
| | | | | | | | | | | | | | | | |
| | | | | |
| Software: 2.22% | | | | | | | | | | | | | | | | |
Microsoft Corporation | | | | | | | 961,771 | | | | 43,693,257 | | | | 0.44 | |
Other securities | | | | | | | | | | | 176,858,487 | | | | 1.78 | |
| | | | | |
| | | | | | | | | | | 220,551,744 | | | | 2.22 | |
| | | | | | | | | | | | | | | | |
| | | | | |
| Technology Hardware, Storage & Peripherals: 2.35% | | | | | | | | | | | | | | | | |
Apple Incorporated | | | | | | | 1,318,416 | | | | 135,137,640 | | | | 1.36 | |
Other securities | | | | | | | | | | | 98,547,201 | | | | 0.99 | |
| | | | | |
| | | | | | | | | | | 233,684,841 | | | | 2.35 | |
| | | | | | | | | | | | | | | | |
The accompanying notes are an integral part of these financial statements.
| | | | |
| 96 | | Wells Fargo Advantage Dow Jones Target Date Funds | | Summary portfolio of investments—August 31, 2014 (unaudited) |
DIVERSIFIED STOCK PORTFOLIO
| | | | | | | | | | | | | | | | |
| Security name | | | | | | Shares | | | Value | | | Percent of
net assets | |
| | | | | | | | | | | | | | | | |
| | | | | |
Materials: 5.52% | | | | | | | | | | | | | | | | |
| | | | | |
| Chemicals: 2.61% | | | | | | | | | | | | | | | | |
Other securities | | | | | | | | | | $ | 259,994,750 | | | | 2.61 | % |
| | | | | | | | | | | | | | | | |
| | | | | |
| Construction Materials: 0.45% | | | | | | | | | | | | | | | | |
Other securities | | | | | | | | | | | 44,469,004 | | | | 0.45 | |
| | | | | | | | | | | | | | | | |
| | | | | |
| Containers & Packaging: 0.37% | | | | | | | | | | | | | | | | |
Other securities | | | | | | | | | | | 36,695,102 | | | | 0.37 | |
| | | | | | | | | | | | | | | | |
| | | | | |
| Metals & Mining: 1.91% | | | | | | | | | | | | | | | | |
BHP Billiton Limited | | | | | | | 593,407 | | | | 20,322,974 | | | | 0.21 | |
Other securities | | | | | | | | | | | 170,378,006 | | | | 1.70 | |
| | | | | |
| | | | | | | | | | | 190,700,980 | | | | 1.91 | |
| | | | | | | | | | | | | | | | |
| | | | | |
| Paper & Forest Products: 0.18% | | | | | | | | | | | | | | | | |
Other securities | | | | | | | | | | | 17,614,649 | | | | 0.18 | |
| | | | | | | | | | | | | | | | |
| | | | | |
Telecommunication Services: 2.43% | | | | | | | | | | | | | | | | |
| | | | | |
| Diversified Telecommunication Services: 1.33% | | | | | | | | | | | | | | | | |
AT&T Incorporated | | | | | | | 661,498 | | | | 23,125,970 | | | | 0.23 | |
Verizon Communications Incorporated | | | | | | | 528,237 | | | | 26,316,767 | | | | 0.27 | |
Other securities | | | | | | | | | | | 82,704,940 | | | | 0.83 | |
| | | | | |
| | | | | | | | | | | 132,147,677 | | | | 1.33 | |
| | | | | | | | | | | | | | | | |
| | | | | |
| Wireless Telecommunication Services: 1.10% | | | | | | | | | | | | | | | | |
Other securities | | | | | | | | | | | 109,556,576 | | | | 1.10 | |
| | | | | | | | | | | | | | | | |
| | | | | |
Utilities: 3.90% | | | | | | | | | | | | | | | | |
| | | | | |
| Electric Utilities: 1.60% | | | | | | | | | | | | | | | | |
Other securities | | | | | | | | | | | 159,401,514 | | | | 1.60 | |
| | | | | | | | | | | | | | | | |
| | | | | |
| Gas Utilities: 0.73% | | | | | | | | | | | | | | | | |
Other securities | | | | | | | | | | | 71,999,647 | | | | 0.73 | |
| | | | | | | | | | | | | | | | |
| | | | | |
| Independent Power & Renewable Electricity Producers: 0.24% | | | | | | | | | | | | | | | | |
Other securities | | | | | | | | | | | 23,852,608 | | | | 0.24 | |
| | | | | | | | | | | | | | | | |
| | | | | |
| Multi-Utilities: 1.20% | | | | | | | | | | | | | | | | |
Other securities | | | | | | | | | | | 119,732,264 | | | | 1.20 | |
| | | | | | | | | | | | | | | | |
| | | | | |
| Water Utilities: 0.13% | | | | | | | | | | | | | | | | |
Other securities | | | | | | | | | | | 12,730,149 | | | | 0.13 | |
| | | | | | | | | | | | | | | | |
| | | | | |
Total Common Stocks (Cost $6,669,047,680) | | | | | | | | | | | 9,536,396,041 | | | | 95.84 | |
| | | | | | | | | | | | | | | | |
| | | | | |
Preferred Stocks: 0.65% | | | | | | | | | | | | | | | | |
| | | | | |
Consumer Discretionary: 0.08% | | | | | | | | | | | | | | | | |
| | | | | |
| Automobiles: 0.07% | | | | | | | | | | | | | | | | |
Other securities | | | | | | | | | | | 7,120,266 | | | | 0.07 | |
| | | | | | | | | | | | | | | | |
The accompanying notes are an integral part of these financial statements.
| | | | | | |
| Summary portfolio of investments—August 31, 2014 (unaudited) | | Wells Fargo Advantage Dow Jones Target Date Funds | | | 97 | |
DIVERSIFIED STOCK PORTFOLIO
| | | | | | | | | | | | | | |
| Security name | | | | | | | | Value | | | Percent of
net assets | |
| | | | | | | | | | | | | | |
| | | | | |
| Media: 0.00% | | | | | | | | | | | | | | |
Other securities | | | | | | | | $ | 29,099 | | | | 0.00 | % |
| | | | | | | | | | | | | | |
| | | | | |
| Multiline Retail: 0.01% | | | | | | | | | | | | | | |
Other securities | | | | | | | | | 865,061 | | | | 0.01 | |
| | | | | | | | | | | | | | |
| | | | | |
Consumer Staples: 0.03% | | | | | | | | | | | | | | |
| | | | | |
| Beverages: 0.00% | | | | | | | | | | | | | | |
Other securities | | | | | | | | | 79,625 | | | | 0.00 | |
| | | | | | | | | | | | | | |
| | | | | |
| Food & Staples Retailing: 0.01% | | | | | | | | | | | | | | |
Other securities | | | | | | | | | 1,133,755 | | | | 0.01 | |
| | | | | | | | | | | | | | |
| | | | | |
| Household Products: 0.02% | | | | | | | | | | | | | | |
Other securities | | | | | | | | | 1,785,336 | | | | 0.02 | |
| | | | | | | | | | | | | | |
| | | | | |
Energy: 0.12% | | | | | | | | | | | | | | |
| | | | | |
| Oil, Gas & Consumable Fuels: 0.12% | | | | | | | | | | | | | | |
Other securities | | | | | | | | | 11,864,791 | | | | 0.12 | |
| | | | | | | | | | | | | | |
| | | | | |
Financials: 0.25% | | | | | | | | | | | | | | |
| | | | | |
| Banks: 0.25% | | | | | | | | | | | | | | |
Other securities | | | | | | | | | 25,177,765 | | | | 0.25 | |
| | | | | | | | | | | | | | |
| | | | | |
| Capital Markets: 0.00% | | | | | | | | | | | | | | |
Other securities | | | | | | | | | 46,422 | | | | 0.00 | |
| | | | | | | | | | | | | | |
| | | | | |
| Insurance: 0.00% | | | | | | | | | | | | | | |
Other securities | | | | | | | | | 927 | | | | 0.00 | |
| | | | | | | | | | | | | | |
| | | | | |
Health Care: 0.00% | | | | | | | | | | | | | | |
| | | | | |
| Life Sciences Tools & Services: 0.00% | | | | | | | | | | | | | | |
Other securities | | | | | | | | | 378 | | | | 0.00 | |
| | | | | | | | | | | | | | |
| | | | | |
Information Technology: 0.05% | | | | | | | | | | | | | | |
| | | | | |
| Semiconductors & Semiconductor Equipment: 0.05% | | | | | | | | | | | | | | |
Other securities | | | | | | | | | 5,266,236 | | | | 0.05 | |
| | | | | | | | | | | | | | |
| | | | | |
Materials: 0.09% | | | | | | | | | | | | | | |
| | | | | |
| Chemicals: 0.02% | | | | | | | | | | | | | | |
Other securities | | | | | | | | | 1,463,948 | | | | 0.02 | |
| | | | | | | | | | | | | | |
| | | | | |
| Metals & Mining: 0.07% | | | | | | | | | | | | | | |
Other securities | | | | | | | | | 7,113,610 | | | | 0.07 | |
| | | | | | | | | | | | | | |
| | | | | |
Telecommunication Services: 0.01% | | | | | | | | | | | | | | |
| | | | | |
| Diversified Telecommunication Services: 0.01% | | | | | | | | | | | | | | |
Other securities | | | | | | | | | 1,405,595 | | | | 0.01 | |
| | | | | | | | | | | | | | |
The accompanying notes are an integral part of these financial statements.
| | | | |
| 98 | | Wells Fargo Advantage Dow Jones Target Date Funds | | Summary portfolio of investments—August 31, 2014 (unaudited) |
DIVERSIFIED STOCK PORTFOLIO
| | | | | | | | | | | | | | |
| Security name | | | | | | | | Value | | | Percent of
net assets | |
| | | | | | | | | | | | | | |
| | | | | |
Utilities: 0.02% | | | | | | | | | | | | | | |
| | | | | |
| Electric Utilities: 0.02% | | | | | | | | | | | | | | |
Other securities | | | | | | | | $ | 1,432,391 | | | | 0.02 | % |
| | | | | | | | | | | | | | |
| | | | | |
| Multi-Utilities: 0.00% | | | | | | | | | | | | | | |
Other securities | | | | | | | | | 114,543 | | | | 0.00 | |
| | | | | | | | | | | | | | |
| | | | | |
Total Preferred Stocks (Cost $60,752,699) | | | | | | | | | 64,899,748 | | | | 0.65 | |
| | | | | | | | | | | | | | |
| | | | | |
Rights: 0.00% | | | | | | | | | | | | | | |
| | | | | |
Consumer Staples: 0.00% | | | | | | | | | | | | | | |
| | | | | |
| Food Products: 0.00% | | | | | | | | | | | | | | |
Other securities | | | | | | | | | 449 | | | | 0.00 | |
| | | | | | | | | | | | | | |
| | | | | |
Energy: 0.00% | | | | | | | | | | | | | | |
| | | | | |
| Oil, Gas & Consumable Fuels: 0.00% | | | | | | | | | | | | | | |
Other securities | | | | | | | | | 611 | | | | 0.00 | |
| | | | | | | | | | | | | | |
| | | | | |
Financials: 0.00% | | | | | | | | | | | | | | |
| | | | | |
| Banks: 0.00% | | | | | | | | | | | | | | |
Other securities | | | | | | | | | 113,303 | | | | 0.00 | |
| | | | | | | | | | | | | | |
| | | | | |
Health Care: 0.00% | | | | | | | | | | | | | | |
| | | | | |
| Biotechnology: 0.00% | | | | | | | | | | | | | | |
Other securities | | | | | | | | | 0 | | | | 0.00 | |
| | | | | | | | | | | | | | |
| | | | | |
Information Technology: 0.00% | | | | | | | | | | | | | | |
| | | | | |
| Software: 0.00% | | | | | | | | | | | | | | |
Other securities | | | | | | | | | 812 | | | | 0.00 | |
| | | | | | | | | | | | | | |
| | | | | |
Total Rights (Cost $8,021) | | | | | | | | | 115,175 | | | | 0.00 | |
| | | | | | | | | | | | | | |
| | | | | |
Warrants: 0.00% | | | | | | | | | | | | | | |
| | | | | |
Consumer Discretionary: 0.00% | | | | | | | | | | | | | | |
| | | | | |
| Automobiles: 0.00% | | | | | | | | | | | | | | |
Other securities | | | | | | | | | 68,603 | | | | 0.00 | |
| | | | | | | | | | | | | | |
| | | | | |
| Media: 0.00% | | | | | | | | | | | | | | |
Other securities | | | | | | | | | 453 | | | | 0.00 | |
| | | | | | | | | | | | | | |
| | | | | |
Consumer Staples: 0.00% | | | | | | | | | | | | | | |
| | | | | |
| Food Products: 0.00% | | | | | | | | | | | | | | |
Other securities | | | | | | | | | 2,252 | | | | 0.00 | |
| | | | | | | | | | | | | | |
| | | | | |
Energy: 0.00% | | | | | | | | | | | | | | |
| | | | | |
| Energy Equipment & Services: 0.00% | | | | | | | | | | | | | | |
Other securities | | | | | | | | | 4,744 | | | | 0.00 | |
| | | | | | | | | | | | | | |
The accompanying notes are an integral part of these financial statements.
| | | | | | |
| Summary portfolio of investments—August 31, 2014 (unaudited) | | Wells Fargo Advantage Dow Jones Target Date Funds | | | 99 | |
DIVERSIFIED STOCK PORTFOLIO
| | | | | | | | | | | | | | | | | | |
| Security name | | | | | | | | | | Value | | | Percent of
net assets | |
| | | | | | | | | | | | | | | | | | |
| | | | | |
| Oil, Gas & Consumable Fuels: 0.00% | | | | | | | | | | | | | | | | | | |
Other securities | | | | | | | | | | | | $ | 794 | | | | 0.00 | % |
| | | | | | | | | | | | | | | | | | |
| | | | | |
Financials: 0.00% | | | | | | | | | | | | | | | | | | |
| | | | | |
| Real Estate Management & Development: 0.00% | | | | | | | | | | | | | | | | | | |
Other securities | | | | | | | | | | | | | 74,592 | | | | 0.00 | |
| | | | | | | | | | | | | | | | | | |
| | | | | |
Health Care: 0.00% | | | | | | | | | | | | | | | | | | |
| | | | | |
| Health Care Equipment & Supplies: 0.00% | | | | | | | | | | | | | | | | | | |
Other securities | | | | | | | | | | | | | 137 | | | | 0.00 | |
| | | | | | | | | | | | | | | | | | |
| | | | | |
Industrials: 0.00% | | | | | | | | | | | | | | | | | | |
| | | | | |
| Construction & Engineering: 0.00% | | | | | | | | | | | | | | | | | | |
Other securities | | | | | | | | | | | | | 8,944 | | | | 0.00 | |
| | | | | | | | | | | | | | | | | | |
| | | | | |
Materials: 0.00% | | | | | | | | | | | | | | | | | | |
| | | | | |
| Chemicals: 0.00% | | | | | | | | | | | | | | | | | | |
Other securities | | | | | | | | | | | | | 0 | | | | 0.00 | |
| | | | | | | | | | | | | | | | | | |
| | | | | |
| Metals & Mining: 0.00% | | | | | | | | | | | | | | | | | | |
Other securities | | | | | | | | | | | | | 7 | | | | 0.00 | |
| | | | | | | | | | | | | | | | | | |
| | | | | |
Utilities: 0.00% | | | | | | | | | | | | | | | | | | |
| | | | | |
| Water Utilities: 0.00% | | | | | | | | | | | | | | | | | | |
Other securities | | | | | | | | | | | | | 1,021 | | | | 0.00 | |
| | | | | | | | | | | | | | | | | | |
| | | | | |
Total Warrants (Cost $140,398) | | | | | | | | | | | | | 161,547 | | | | 0.00 | |
| | | | | | | | | | | | | | | | | | |
| | | | | |
| | | Yield | | | | | Shares | | | | | | | |
| Short-Term Investments: 5.17% | | | | | | | | | | | | | | | | | | |
| | | | | |
| Investment Companies: 5.17% | | | | | | | | | | | | | | | | | | |
Wells Fargo Advantage Cash Investment Money Market Fund, Select Class (l)(u) | | | 0.07 | % | | | | | 280,013,775 | | | | 280,013,775 | | | | 2.82 | |
Wells Fargo Securities Lending Cash Investments, LLC (l)(u)(r) | | | 0.11 | | | | | | 233,979,502 | | | | 233,979,502 | | | | 2.35 | |
| | | | | |
Total Short-Term Investments (Cost $513,993,277) | | | | | | | | | | | | | 513,993,277 | | | | 5.17 | |
| | | | | | | | | | | | | | | | | | |
Total investments in securities (Cost $7,243,942,075) * | | | | | | | | | | | | | 10,115,565,788 | | | | 101.66 | |
Other assets and liabilities, net | | | | | | | | | | | | | (165,620,090 | ) | | | (1.66 | ) |
| | | | | | | | | | | | | | | | | | |
| Total net assets | | | | | | | | | | | | $ | 9,949,945,698 | | | | 100.00 | % |
| | | | | | | | | | | | | | | | | | |
The accompanying notes are an integral part of these financial statements.
| | | | |
| 100 | | Wells Fargo Advantage Dow Jones Target Date Funds | | Summary portfolio of investments—August 31, 2014 (unaudited) |
DIVERSIFIED STOCK PORTFOLIO
| † | Non-income-earning security |
| (l) | The security represents an affiliate of the Fund as defined in the Investment Company Act of 1940. |
| (u) | The rate represents the 7-day annualized yield at period end. |
| (r) | The investment is a non-registered investment vehicle purchased with cash collateral received from securities on loan. |
| * | Cost for federal income tax purposes is $7,309,245,558 and unrealized gains (losses) consists of: |
| | | | |
Gross unrealized gains | | $ | 3,138,047,515 | |
Gross unrealized losses | | | (331,727,285 | ) |
| | | | |
Net unrealized gains | | $ | 2,806,320,230 | |
The following table shows percent of total long-term investments by geographic locations as of August 31, 2014 (unaudited):
| | | | |
United States | | | 64.61 | % |
Japan | | | 7.03 | |
United Kingdom | | | 3.14 | |
Australia | | | 2.27 | |
South Korea | | | 1.86 | |
Canada | | | 1.68 | |
China | | | 1.56 | |
Switzerland | | | 1.38 | |
Taiwan | | | 1.35 | |
France | | | 1.31 | |
Germany | | | 1.16 | |
Brazil | | | 1.09 | |
Bermuda | | | 1.08 | |
Ireland | | | 1.04 | |
Other | | | 9.44 | |
| | | | |
| | | 100.00 | % |
| | | | |
The accompanying notes are an integral part of these financial statements.
| | | | | | |
| Portfolio of investments—August 31, 2014 (unaudited) | | Wells Fargo Advantage Dow Jones Target Date Funds | | | 101 | |
SHORT-TERM INVESTMENT PORTFOLIO
| | | | | | | | | | | | | | | | |
| Security name | | Interest rate | | | Maturity date | | | Principal | | | Value | |
| | | | | | | | | | | | | | | | |
| | | | |
Certificates of Deposit: 38.64% | | | | | | | | | | | | | | | | |
Abbey National Treasury Services plc | | | 0.09 | % | | | 9-2-2014 | | | $ | 14,000,000 | | | $ | 14,000,000 | |
Abbey National Treasury Services plc ± | | | 0.31 | | | | 3-4-2015 | | | | 5,000,000 | | | | 4,999,500 | |
Agricultural Bank of China | | | 0.26 | | | | 9-8-2014 | | | | 6,000,000 | | | | 5,999,820 | |
Banco del Estado de Chile | | | 0.23 | | | | 9-5-2014 | | | | 2,000,000 | | | | 2,000,020 | |
Banco del Estado de Chile ± | | | 0.30 | | | | 12-10-2014 | | | | 2,000,000 | | | | 2,000,120 | |
Bank of Montreal | | | 0.17 | | | | 9-5-2014 | | | | 2,000,000 | | | | 2,000,020 | |
Bank of Montreal | | | 0.17 | | | | 10-2-2014 | | | | 2,000,000 | | | | 2,000,080 | |
Bank of Montreal | | | 0.18 | | | | 9-17-2014 | | | | 3,000,000 | | | | 3,000,120 | |
Bank of Montreal | | | 0.18 | | | | 10-14-2014 | | | | 2,000,000 | | | | 2,000,120 | |
Bank of Montreal | | | 0.18 | | | | 10-15-2014 | | | | 1,000,000 | | | | 1,000,070 | |
Bank of Montreal | | | 0.18 | | | | 11-20-2014 | | | | 1,000,000 | | | | 1,000,070 | |
Bank of Montreal ± | | | 0.95 | | | | 12-22-2014 | | | | 2,000,000 | | | | 2,004,780 | |
Bank of Nova Scotia ± | | | 0.24 | | | | 3-4-2015 | | | | 3,000,000 | | | | 3,000,030 | |
Bank of Nova Scotia ± | | | 0.24 | | | | 12-17-2014 | | | | 2,000,000 | | | | 2,000,200 | |
Bank of Nova Scotia ± | | | 0.24 | | | | 6-29-2015 | | | | 3,000,000 | | | | 2,999,490 | |
Bank of Nova Scotia | | | 0.42 | | | | 2-19-2015 | | | | 1,000,000 | | | | 1,000,930 | |
Bank of Tokyo-Mitsubishi LLC | | | 0.11 | | | | 9-3-2014 | | | | 3,000,000 | | | | 2,999,970 | |
Barclays Bank (Grand Cayman) | | | 0.08 | | | | 9-2-2014 | | | | 8,000,000 | | | | 8,000,000 | |
China Construction Bank Corporation | | | 0.22 | | | | 9-3-2014 | | | | 2,000,000 | | | | 1,999,960 | |
China Construction Bank Corporation ± | | | 0.41 | | | | 3-25-2015 | | | | 4,000,000 | | | | 4,000,000 | |
Commonwealth Bank of Australia | | | 0.22 | | | | 12-29-2014 | | | | 2,000,000 | | | | 2,000,280 | |
Cooperatieve Centrale ± | | | 0.28 | | | | 2-3-2015 | | | | 2,000,000 | | | | 2,000,020 | |
Cooperatieve Centrale ± | | | 0.28 | | | | 4-13-2015 | | | | 2,000,000 | | | | 1,999,740 | |
Cooperatieve Centrale ± | | | 0.29 | | | | 2-27-2015 | | | | 2,000,000 | | | | 2,000,480 | |
Credit Agricole | | | 0.09 | | | | 9-2-2014 | | | | 14,000,000 | | | | 14,000,000 | |
Credit Industriel et Commercial (New York) | | | 0.10 | | | | 9-2-2014 | | | | 9,000,000 | | | | 9,000,000 | |
Credit Industriel et Commercial (New York) | | | 0.13 | | | | 9-4-2014 | | | | 10,000,000 | | | | 10,000,000 | |
DG Bank (New York) | | | 0.20 | | | | 11-26-2014 | | | | 2,000,000 | | | | 1,999,860 | |
DNB Nor Bank ASA | | | 0.05 | | | | 9-2-2014 | | | | 5,000,000 | | | | 5,000,000 | |
DNB Nor Bank ASA | | | 0.07 | | | | 9-2-2014 | | | | 13,000,000 | | | | 13,000,000 | |
KBC Bank | | | 0.13 | | | | 9-2-2014 | | | | 8,000,000 | | | | 8,000,000 | |
KBC Bank | | | 0.13 | | | | 9-5-2014 | | | | 3,000,000 | | | | 2,999,983 | |
Mitsubishi UFJ Trust & Banking Corporation | | | 0.20 | | | | 10-1-2014 | | | | 2,000,000 | | | | 2,000,040 | |
Mitsubishi UFJ Trust & Banking Corporation | | | 0.20 | | | | 10-2-2014 | | | | 2,000,000 | | | | 2,000,040 | |
Mitsubishi UFJ Trust & Banking Corporation | | | 0.21 | | | | 11-6-2014 | | | | 3,000,000 | | | | 2,999,940 | |
Mitsubishi UFJ Trust & Banking Corporation | | | 0.21 | | | | 11-13-2014 | | | | 1,000,000 | | | | 999,980 | |
Mitsubishi UFJ Trust & Banking Corporation | | | 0.21 | | | | 11-25-2014 | | | | 1,000,000 | | | | 999,980 | |
Mitsubishi UFJ Trust & Banking Corporation 144A(z) | | | 0.21 | | | | 11-7-2014 | | | | 3,000,000 | | | | 2,998,860 | |
Mizuho Bank Limited | | | 0.15 | | | | 9-25-2014 | | | | 2,000,000 | | | | 1,999,960 | |
Mizuho Bank Limited | | | 0.15 | | | | 9-26-2014 | | | | 1,000,000 | | | | 999,980 | |
Mizuho Bank Limited | | | 0.20 | | | | 9-5-2014 | | | | 4,000,000 | | | | 4,000,000 | |
Mizuho Bank Limited | | | 0.20 | | | | 10-28-2014 | | | | 3,000,000 | | | | 3,000,000 | |
Mizuho Bank Limited | | | 0.21 | | | | 11-26-2014 | | | | 2,000,000 | | | | 1,999,960 | |
National Bank of Kuwait | | | 0.11 | | | | 9-2-2014 | | | | 6,000,000 | | | | 6,000,000 | |
Nordea Bank plc | | | 0.20 | | | | 9-29-2014 | | | | 6,000,000 | | | | 6,000,540 | |
Nordea Bank plc | | | 0.06 | | | | 9-2-2014 | | | | 11,000,000 | | | | 11,000,000 | |
Nordea Bank plc | | | 0.18 | | | | 11-3-2014 | | | | 2,000,000 | | | | 2,000,080 | |
Norinchukin Bank | | | 0.20 | | | | 9-5-2014 | | | | 2,000,000 | | | | 2,000,020 | |
Norinchukin Bank | | | 0.20 | | | | 9-29-2014 | | | | 3,000,000 | | | | 3,000,090 | |
Norinchukin Bank | | | 0.20 | | | | 10-3-2014 | | | | 2,000,000 | | | | 2,000,040 | |
The accompanying notes are an integral part of these financial statements.
| | | | |
| 102 | | Wells Fargo Advantage Dow Jones Target Date Funds | | Portfolio of investments—August 31, 2014 (unaudited) |
SHORT-TERM INVESTMENT PORTFOLIO
| | | | | | | | | | | | | | | | |
| Security name | | Interest rate | | | Maturity date | | | Principal | | | Value | |
| | | | | | | | | | | | | | | | |
| | | | |
Certificates of Deposit (continued) | | | | | | | | | | | | | | | | |
Norinchukin Bank | | | 0.20 | % | | | 10-31-2014 | | | $ | 2,000,000 | | | $ | 2,000,060 | |
Norinchukin Bank | | | 0.20 | | | | 11-13-2014 | | | | 1,000,000 | | | | 999,940 | |
Norinchukin Bank | | | 0.21 | | | | 11-26-2014 | | | | 2,000,000 | | | | 1,999,900 | |
Royal Bank of Canada ± | | | 0.26 | | | | 10-17-2014 | | | | 2,000,000 | | | | 2,000,160 | |
Skandinaviska Enskilda Banken AG | | | 0.05 | | | | 9-2-2014 | | | | 6,000,000 | | | | 6,000,000 | |
Societe Generale ± | | | 0.28 | | | | 10-31-2014 | | | | 2,000,000 | | | | 1,999,940 | |
Societe Generale ± | | | 0.37 | | | | 9-12-2014 | | | | 2,000,000 | | | | 2,000,020 | |
Standard Chartered Bank | | | 0.18 | | | | 10-28-2014 | | | | 3,000,000 | | | | 3,000,090 | |
Standard Chartered Bank | | | 0.22 | | | | 10-16-2014 | | | | 2,000,000 | | | | 2,000,160 | |
Standard Chartered Bank | | | 0.24 | | | | 11-3-2014 | | | | 1,000,000 | | | | 1,000,110 | |
Standard Chartered Bank | | | 0.28 | | | | 12-29-2014 | | | | 2,000,000 | | | | 2,000,400 | |
Sumitomo Mitsui Banking Corporation ± | | | 0.22 | | | | 9-19-2014 | | | | 2,000,000 | | | | 2,000,040 | |
Sumitomo Mitsui Banking Corporation | | | 0.22 | | | | 11-7-2014 | | | | 1,000,000 | | | | 1,000,000 | |
Sumitomo Trust & Banking Company | | | 0.21 | | | | 9-2-2014 | | | | 1,000,000 | | | | 1,000,000 | |
Svenska Handlesbanken | | | 0.05 | | | | 9-2-2014 | | | | 5,000,000 | | | | 5,000,000 | |
Swedbank | | | 0.05 | | | | 9-2-2014 | | | | 6,000,000 | | | | 6,000,000 | |
Swedbank | | | 0.06 | | | | 9-2-2014 | | | | 8,000,000 | | | | 8,000,000 | |
Swedbank | | | 0.18 | | | | 10-9-2014 | | | | 2,000,000 | | | | 2,000,060 | |
Swedbank | | | 0.20 | | | | 11-10-2014 | | | | 2,000,000 | | | | 2,000,120 | |
Swedbank (z) | | | 0.22 | | | | 12-22-2014 | | | | 1,000,000 | | | | 999,400 | |
Toronto-Dominion Bank | | | 0.16 | | | | 9-8-2014 | | | | 2,000,000 | | | | 2,000,020 | |
Toronto-Dominion Bank | | | 0.17 | | | | 11-20-2014 | | | | 1,000,000 | | | | 1,000,020 | |
Toronto-Dominion Bank ± | | | 0.22 | | | | 12-19-2014 | | | | 2,000,000 | | | | 2,000,060 | |
Toronto-Dominion Bank ± | | | 0.23 | | | | 6-16-2015 | | | | 3,000,000 | | | | 2,999,520 | |
Toronto-Dominion Bank ± | | | 0.23 | | | | 4-15-2015 | | | | 3,000,000 | | | | 2,999,610 | |
Toronto-Dominion Bank ± | | | 0.24 | | | | 2-6-2015 | | | | 4,000,000 | | | | 3,999,680 | |
Westpac Banking Corporation ± | | | 0.23 | | | | 2-18-2015 | | | | 2,000,000 | | | | 2,000,020 | |
| | | | |
Total Certificates of Deposit (Cost $266,004,262) | | | | | | | | | | | | | | | 266,004,503 | |
| | | | | | | | | | | | | | | | |
| | | | |
Commercial Paper: 48.79% | | | | | | | | | | | | | | | | |
Anglesea Funding LLC 144A(z)(p) | | | 0.15 | | | | 9-3-2014 | | | | 2,000,000 | | | | 1,999,960 | |
Anglesea Funding LLC 144A±(p) | | | 0.29 | | | | 11-13-2014 | | | | 2,000,000 | | | | 1,999,920 | |
Antalis US Funding Corporation 144A(z)(p) | | | 0.25 | | | | 9-30-2014 | | | | 3,000,000 | | | | 2,999,580 | |
ANZ New Zealand International Limited 144A± | | | 0.23 | | | | 9-16-2014 | | | | 1,000,000 | | | | 1,000,020 | |
ASB Finance Limited 144A± | | | 0.23 | | | | 4-29-2015 | | | | 1,000,000 | | | | 999,937 | |
Aspen Funding Corporation 144A(z) | | | 0.20 | | | | 9-2-2014 | | | | 2,000,000 | | | | 1,999,960 | |
Aspen Funding Corporation 144A(z) | | | 0.22 | | | | 9-3-2014 | | | | 1,000,000 | | | | 999,970 | |
Atlantic Asset Securitization LLC 144A(z) | | | 0.20 | | | | 9-10-2014 | | | | 1,000,000 | | | | 999,960 | |
Australia & New Zealand Banking Group 144A± | | | 0.23 | | | | 11-18-2014 | | | | 1,000,000 | | | | 1,000,080 | |
Banco de Credito e Inversiones 144A(z) | | | 0.42 | | | | 10-27-2014 | | | | 1,000,000 | | | | 999,480 | |
Banco del Estado de Chile 144A(z) | | | 0.27 | | | | 9-3-2014 | | | | 1,000,000 | | | | 999,990 | |
Banco del Estado de Chile 144A(z) | | | 0.27 | | | | 9-10-2014 | | | | 1,000,000 | | | | 999,960 | |
Banco del Estado de Chile 144A(z) | | | 0.27 | | | | 9-15-2014 | | | | 1,000,000 | | | | 999,950 | |
Banco del Estado de Chile 144A(z) | | | 0.28 | | | | 9-26-2014 | | | | 1,000,000 | | | | 999,900 | |
Banco del Estado de Chile 144A(z) | | | 0.30 | | | | 10-8-2014 | | | | 1,000,000 | | | | 999,840 | |
Banco Santander Chile 144A(z) | | | 0.32 | | | | 9-12-2014 | | | | 1,000,000 | | | | 999,960 | |
Bedford Row Funding Corporation 144A± | | | 0.24 | | | | 12-5-2014 | | | | 1,000,000 | | | | 1,000,030 | |
Bedford Row Funding Corporation 144A± | | | 0.25 | | | | 4-24-2015 | | | | 2,000,000 | | | | 1,999,700 | |
Bedford Row Funding Corporation 144A± | | | 0.25 | | | | 1-9-2015 | | | | 1,000,000 | | | | 1,000,040 | |
The accompanying notes are an integral part of these financial statements.
| | | | | | |
| Portfolio of investments—August 31, 2014 (unaudited) | | Wells Fargo Advantage Dow Jones Target Date Funds | | | 103 | |
SHORT-TERM INVESTMENT PORTFOLIO
| | | | | | | | | | | | | | | | |
| Security name | | Interest rate | | | Maturity date | | | Principal | | | Value | |
| | | | | | | | | | | | | | | | |
| | | | |
Commercial Paper (continued) | | | | | | | | | | | | | | | | |
Bennington Sark Capital Company 144A± | | | 0.37 | % | | | 5-6-2015 | | | $ | 2,000,000 | | | $ | 1,999,720 | |
Caisse Centrale Desjardins du Quebec 144A(z) | | | 0.11 | | | | 9-5-2014 | | | | 2,000,000 | | | | 1,999,961 | |
Caisse Centrale Desjardins du Quebec 144A(z) | | | 0.16 | | | | 9-8-2014 | | | | 1,000,000 | | | | 999,970 | |
Caisse Centrale Desjardins du Quebec 144A(z) | | | 0.18 | | | | 9-26-2014 | | | | 3,000,000 | | | | 2,999,700 | |
Caisse Centrale Desjardins du Quebec 144A(z) | | | 0.18 | | | | 9-29-2014 | | | | 2,000,000 | | | | 1,999,780 | |
Caisse Centrale Desjardins du Quebec 144A(z) | | | 0.18 | | | | 9-30-2014 | | | | 1,000,000 | | | | 999,880 | |
Caisse Centrale Desjardins du Quebec 144A(z) | | | 0.18 | | | | 10-6-2014 | | | | 1,000,000 | | | | 999,850 | |
Caisse Centrale Desjardins du Quebec 144A(z) | | | 0.18 | | | | 10-9-2014 | | | | 2,000,000 | | | | 1,999,660 | |
Caisse Centrale Desjardins du Quebec 144A(z) | | | 0.20 | | | | 10-30-2014 | | | | 1,000,000 | | | | 999,710 | |
Caisse Centrale Desjardins du Quebec 144A± | | | 0.25 | | | | 10-23-2014 | | | | 2,000,000 | | | | 2,000,100 | |
Caisse Des Depots et Consignations 144A(z) | | | 0.16 | | | | 9-26-2014 | | | | 2,000,000 | | | | 1,999,820 | |
Caisse Des Depots et Consignations 144A(z) | | | 0.17 | | | | 11-17-2014 | | | | 4,000,000 | | | | 3,998,480 | |
Caisse Des Depots et Consignations 144A(z) | | | 0.17 | | | | 10-6-2014 | | | | 2,000,000 | | | | 1,999,720 | |
Caisse Des Depots et Consignations 144A(z) | | | 0.18 | | | | 10-17-2014 | | | | 3,000,000 | | | | 2,999,400 | |
Caisse Des Depots et Consignations 144A(z) | | | 0.18 | | | | 10-20-2014 | | | | 2,000,000 | | | | 1,999,560 | |
Caisse Des Depots et Consignations 144A(z) | | | 0.20 | | | | 12-19-2014 | | | | 1,000,000 | | | | 999,420 | |
Caisse Des Depots et Consignations 144A(z) | | | 0.20 | | | | 12-22-2014 | | | | 2,000,000 | | | | 1,998,800 | |
CDP Financial Incorporated 144A(z) | | | 0.15 | | | | 9-8-2014 | | | | 2,000,000 | | | | 1,999,940 | |
CDP Financial Incorporated 144A(z) | | | 0.15 | | | | 9-16-2014 | | | | 2,000,000 | | | | 1,999,900 | |
CDP Financial Incorporated 144A(z) | | | 0.15 | | | | 11-19-2014 | | | | 1,000,000 | | | | 999,570 | |
CDP Financial Incorporated 144A(z) | | | 0.19 | | | | 11-3-2014 | | | | 3,000,000 | | | | 2,999,070 | |
China International Marine Containers Group (z) | | | 0.38 | | | | 9-3-2014 | | | | 3,000,000 | | | | 2,999,970 | |
China International Marine Containers Group (z) | | | 0.38 | | | | 9-10-2014 | | | | 2,000,000 | | | | 1,999,920 | |
China International Marine Containers Group (z) | | | 0.38 | | | | 9-12-2014 | | | | 1,000,000 | | | | 999,960 | |
China Shipping Container Lines (z) | | | 0.38 | | | | 9-12-2014 | | | | 1,000,000 | | | | 999,958 | |
CNPC Finance 144A(z) | | | 0.38 | | | | 9-3-2014 | | | | 1,000,000 | | | | 999,990 | |
CNPC Finance 144A(z) | | | 0.38 | | | | 9-9-2014 | | | | 2,000,000 | | | | 1,999,940 | |
CNPC Finance 144A(z) | | | 0.38 | | | | 9-10-2014 | | | | 1,000,000 | | | | 999,960 | |
CNPC Finance 144A(z) | | | 0.38 | | | | 9-15-2014 | | | | 2,000,000 | | | | 1,999,900 | |
CNPC Finance 144A(z) | | | 0.38 | | | | 9-22-2014 | | | | 1,000,000 | | | | 999,920 | |
CNPC Finance 144A(z) | | | 0.38 | | | | 9-26-2014 | | | | 1,000,000 | | | | 999,900 | |
COFCO Capital Corporation (z) | | | 0.16 | | | | 9-2-2014 | | | | 1,000,000 | | | | 999,990 | |
COFCO Capital Corporation (z) | | | 0.16 | | | | 9-9-2014 | | | | 1,000,000 | | | | 999,960 | |
Collateralized Commercial Paper Company LLC 144A(z) | | | 0.41 | | | | 2-27-2015 | | | | 1,000,000 | | | | 998,530 | |
Commonwealth Bank of Australia 144A± | | | 0.24 | | | | 5-22-2015 | | | | 2,000,000 | | | | 1,999,700 | |
Commonwealth Bank of Australia 144A± | | | 0.24 | | | | 5-20-2015 | | | | 2,000,000 | | | | 1,999,720 | |
Commonwealth Bank of Australia 144A± | | | 0.24 | | | | 7-2-2015 | | | | 1,000,000 | | | | 999,830 | |
Commonwealth Bank of Australia 144A± | | | 0.24 | | | | 6-18-2015 | | | | 4,000,000 | | | | 3,999,680 | |
Concord Minutemen Capital Company 144A(z)(p) | | | 0.21 | | | | 9-3-2014 | | | | 1,000,000 | | | | 999,980 | |
Concord Minutemen Capital Company 144A(z)(p) | | | 0.21 | | | | 9-8-2014 | | | | 4,000,000 | | | | 3,999,800 | |
Concord Minutemen Capital Company 144A(z)(p) | | | 0.21 | | | | 9-10-2014 | | | | 2,000,000 | | | | 1,999,880 | |
Concord Minutemen Capital Company 144A(z)(p) | | | 0.21 | | | | 10-3-2014 | | | | 1,000,000 | | | | 999,790 | |
Concord Minutemen Capital Company 144A(z)(p) | | | 0.21 | | | | 10-7-2014 | | | | 2,000,000 | | | | 1,999,520 | |
Concord Minutemen Capital Company 144A(z)(p) | | | 0.21 | | | | 10-9-2014 | | | | 2,000,000 | | | | 1,999,480 | |
Concord Minutemen Capital Company 144A(z)(p) | | | 0.21 | | | | 10-14-2014 | | | | 1,000,000 | | | | 999,710 | |
CPPIB Capital Incorporated 144A(z) | | | 0.14 | | | | 11-12-2014 | | | | 2,000,000 | | | | 1,999,300 | |
CPPIB Capital Incorporated 144A(z) | | | 0.14 | | | | 11-24-2014 | | | | 4,000,000 | | | | 3,998,279 | |
Crown Point Capital Company LLC 144A(z)(p) | | | 0.21 | | | | 9-3-2014 | | | | 1,000,000 | | | | 999,980 | |
Crown Point Capital Company LLC 144A(z)(p) | | | 0.21 | | | | 9-4-2014 | | | | 2,000,000 | | | | 1,999,960 | |
Crown Point Capital Company LLC 144A(z)(p) | | | 0.21 | | | | 9-10-2014 | | | | 2,000,000 | | | | 1,999,900 | |
The accompanying notes are an integral part of these financial statements.
| | | | |
| 104 | | Wells Fargo Advantage Dow Jones Target Date Funds | | Portfolio of investments—August 31, 2014 (unaudited) |
SHORT-TERM INVESTMENT PORTFOLIO
| | | | | | | | | | | | | | | | |
| Security name | | Interest rate | | | Maturity date | | | Principal | | | Value | |
| | | | | | | | | | | | | | | | |
| | | | |
Commercial Paper (continued) | | | | | | | | | | | | | | | | |
Crown Point Capital Company LLC 144A(z)(p) | | | 0.21 | % | | | 9-11-2014 | | | $ | 4,000,000 | | | $ | 3,999,800 | |
Crown Point Capital Company LLC 144A(z)(p) | | | 0.21 | | | | 9-15-2014 | | | | 2,000,000 | | | | 1,999,860 | |
Crown Point Capital Company LLC 144A(z)(p) | | | 0.21 | | | | 10-7-2014 | | | | 1,000,000 | | | | 999,820 | |
Crown Point Capital Company LLC 144A(z)(p) | | | 0.21 | | | | 10-14-2014 | | | | 1,000,000 | | | | 999,780 | |
DBS Bank Limited 144A(z) | | | 0.22 | | | | 12-10-2014 | | | | 1,000,000 | | | | 999,490 | |
DBS Bank Limited 144A(z) | | | 0.22 | | | | 12-9-2014 | | | | 3,000,000 | | | | 2,998,500 | |
Erste Abwicklungsanstalt 144A(z) | | | 0.17 | | | | 10-14-2014 | | | | 1,000,000 | | | | 999,810 | |
Gotham Funding Corporation 144A(z)(p) | | | 0.11 | | | | 9-2-2014 | | | | 1,000,000 | | | | 999,985 | |
Gotham Funding Corporation 144A(z)(p) | | | 0.17 | | | | 9-4-2014 | | | | 1,000,000 | | | | 999,980 | |
Gotham Funding Corporation 144A(z)(p) | | | 0.17 | | | | 9-8-2014 | | | | 1,000,000 | | | | 999,960 | |
Gotham Funding Corporation 144A(z)(p) | | | 0.17 | | | | 9-10-2014 | | | | 2,000,000 | | | | 1,999,900 | |
Gotham Funding Corporation 144A(z)(p) | | | 0.17 | | | | 9-18-2014 | | | | 1,000,000 | | | | 999,920 | |
Gotham Funding Corporation 144A(z)(p) | | | 0.17 | | | | 10-1-2014 | | | | 1,000,000 | | | | 999,850 | |
Gotham Funding Corporation 144A(z)(p) | | | 0.17 | | | | 10-2-2014 | | | | 1,000,000 | | | | 999,846 | |
Hannover Funding Company LLC 144A(z)(p) | | | 0.16 | | | | 9-11-2014 | | | | 1,000,000 | | | | 999,950 | |
Hannover Funding Company LLC 144A(z)(p) | | | 0.16 | | | | 9-18-2014 | | | | 2,000,000 | | | | 1,999,840 | |
Hannover Funding Company LLC 144A(z)(p) | | | 0.16 | | | | 9-19-2014 | | | | 1,000,000 | | | | 999,910 | |
Hannover Funding Company LLC 144A(z)(p) | | | 0.21 | | | | 11-12-2014 | | | | 1,000,000 | | | | 999,580 | |
HSBC Bank plc 144A± | | | 0.25 | | | | 10-2-2014 | | | | 2,000,000 | | | | 2,000,040 | |
Institutional Secured Funding LLC 144A(z)(p) | | | 0.21 | | | | 9-2-2014 | | | | 1,000,000 | | | | 999,989 | |
Institutional Secured Funding LLC 144A(z)(p) | | | 0.38 | | | | 10-3-2014 | | | | 2,000,000 | | | | 1,999,740 | |
Institutional Secured Funding LLC 144A(z)(p) | | | 0.39 | | | | 9-8-2014 | | | | 1,000,000 | | | | 999,970 | |
JPMorgan Securities Incorporated 144A± | | | 0.33 | | | | 9-10-2014 | | | | 2,000,000 | | | | 2,000,040 | |
Kells Funding LLC 144A±(p) | | | 0.23 | | | | 12-11-2014 | | | | 1,000,000 | | | | 1,000,010 | |
Kells Funding LLC 144A±(p) | | | 0.23 | | | | 12-12-2014 | | | | 2,000,000 | | | | 2,000,020 | |
Kells Funding LLC 144A±(p) | | | 0.23 | | | | 10-28-2014 | | | | 2,000,000 | | | | 2,000,100 | |
Kells Funding LLC 144A±(p) | | | 0.23 | | | | 10-8-2014 | | | | 1,000,000 | | | | 1,000,040 | |
Kells Funding LLC 144A±(p) | | | 0.23 | | | | 10-20-2014 | | | | 1,000,000 | | | | 1,000,050 | |
Kells Funding LLC 144A±(p) | | | 0.24 | | | | 10-10-2014 | | | | 1,000,000 | | | | 1,000,040 | |
Kells Funding LLC 144A±(p) | | | 0.24 | | | | 5-15-2015 | | | | 3,000,000 | | | | 2,999,580 | |
Kells Funding LLC 144A±(p) | | | 0.25 | | | | 2-5-2015 | | | | 1,000,000 | | | | 999,970 | |
Lexington Parker Capital Company LLC 144A(z)(p) | | | 0.21 | | | | 9-3-2014 | | | | 3,000,000 | | | | 2,999,940 | |
Lexington Parker Capital Company LLC 144A(z)(p) | | | 0.21 | | | | 9-9-2014 | | | | 2,000,000 | | | | 1,999,920 | |
Lexington Parker Capital Company LLC 144A(z)(p) | | | 0.21 | | | | 9-10-2014 | | | | 1,000,000 | | | | 999,950 | |
Lexington Parker Capital Company LLC 144A(z)(p) | | | 0.21 | | | | 9-11-2014 | | | | 2,000,000 | | | | 1,999,900 | |
Lexington Parker Capital Company LLC 144A(z)(p) | | | 0.21 | | | | 9-15-2014 | | | | 1,000,000 | | | | 999,930 | |
Lexington Parker Capital Company LLC 144A(z)(p) | | | 0.21 | | | | 10-9-2014 | | | | 2,000,000 | | | | 1,999,620 | |
Liberty Street Funding LLC 144A(z)(p) | | | 0.15 | | | | 9-2-2014 | | | | 1,000,000 | | | | 999,990 | |
Liberty Street Funding LLC 144A(z)(p) | | | 0.15 | | | | 9-4-2014 | | | | 1,000,000 | | | | 999,980 | |
Liberty Street Funding LLC 144A(z)(p) | | | 0.15 | | | | 9-8-2014 | | | | 1,000,000 | | | | 999,960 | |
Liberty Street Funding LLC 144A(z)(p) | | | 0.15 | | | | 9-19-2014 | | | | 2,000,000 | | | | 1,999,820 | |
Liberty Street Funding LLC 144A(z)(p) | | | 0.15 | | | | 9-23-2014 | | | | 2,000,000 | | | | 1,999,780 | |
Liberty Street Funding LLC 144A(z)(p) | | | 0.19 | | | | 9-24-2014 | | | | 1,000,000 | | | | 999,890 | |
Liberty Street Funding LLC 144A(z)(p) | | | 0.19 | | | | 10-1-2014 | | | | 2,000,000 | | | | 1,999,700 | |
Liberty Street Funding LLC 144A(z)(p) | | | 0.19 | | | | 10-3-2014 | | | | 1,000,000 | | | | 999,840 | |
Lloyds Bank Plc (z) | | | 0.05 | | | | 9-2-2014 | | | | 18,000,000 | | | | 17,999,840 | |
LMA Americas LLC 144A(z) | | | 0.26 | | | | 10-7-2014 | | | | 3,000,000 | | | | 2,999,460 | |
LMA Americas LLC 144A(z) | | | 0.26 | | | | 10-8-2014 | | | | 1,000,000 | | | | 999,810 | |
Macquarie Bank Limited 144A(z) | | | 0.20 | | | | 9-25-2014 | | | | 2,000,000 | | | | 1,999,800 | |
Macquarie Bank Limited 144A(z) | | | 0.20 | | | | 9-26-2014 | | | | 2,000,000 | | | | 1,999,800 | |
The accompanying notes are an integral part of these financial statements.
| | | | | | |
| Portfolio of investments—August 31, 2014 (unaudited) | | Wells Fargo Advantage Dow Jones Target Date Funds | | | 105 | |
SHORT-TERM INVESTMENT PORTFOLIO
| | | | | | | | | | | | | | | | |
| Security name | | Interest rate | | | Maturity date | | | Principal | | | Value | |
| | | | | | | | | | | | | | | | |
| | | | |
Commercial Paper (continued) | | | | | | | | | | | | | | | | |
Manhattan Asset Funding LLC 144A(z) | | | 0.18 | % | | | 9-4-2014 | | | $ | 1,000,000 | | | $ | 999,980 | |
Manhattan Asset Funding LLC 144A(z) | | | 0.19 | | | | 9-18-2014 | | | | 2,000,000 | | | | 1,999,840 | |
Manhattan Asset Funding LLC 144A(z) | | | 0.20 | | | | 9-23-2014 | | | | 1,000,000 | | | | 999,890 | |
Manhattan Asset Funding LLC 144A(z) | | | 0.22 | | | | 10-6-2014 | | | | 1,000,000 | | | | 999,830 | |
Manhattan Asset Funding LLC 144A(z) | | | 0.22 | | | | 10-10-2014 | | | | 1,000,000 | | | | 999,800 | |
Mountcliff Funding LLC 144A(z)(p) | | | 0.15 | | | | 9-2-2014 | | | | 5,000,000 | | | | 4,999,928 | |
National Australia Funding Incorporated 144A± | | | 0.23 | | | | 3-10-2015 | | | | 2,000,000 | | | | 1,999,800 | |
Nederlandse Waterschapsbank NV 144A± | | | 0.24 | | | | 10-29-2014 | | | | 2,000,000 | | | | 2,000,060 | |
Nederlandse Waterschapsbank NV 144A± | | | 0.25 | | | | 12-23-2014 | | | | 1,000,000 | | | | 999,970 | |
Nederlandse Waterschapsbank NV 144A± | | | 0.29 | | | | 10-27-2014 | | | | 2,000,000 | | | | 2,000,260 | |
Newport Funding Corporation 144A(z)(p) | | | 0.20 | | | | 9-2-2014 | | | | 1,000,000 | | | | 999,990 | |
Nieuw Amsterdam Receivables Corporation 144A(z) | | | 0.20 | | | | 11-6-2014 | | | | 1,000,000 | | | | 999,660 | |
NRW Bank 144A(z) | | | 0.11 | | | | 9-17-2014 | | | | 1,000,000 | | | | 999,954 | |
NRW Bank 144A(z) | | | 0.13 | | | | 9-15-2014 | | | | 3,000,000 | | | | 2,999,880 | |
NRW Bank 144A(z) | | | 0.13 | | | | 9-29-2014 | | | | 1,000,000 | | | | 999,913 | |
NRW Bank 144A(z) | | | 0.14 | | | | 9-5-2014 | | | | 1,000,000 | | | | 999,990 | |
NRW Bank 144A(z) | | | 0.14 | | | | 9-9-2014 | | | | 4,000,000 | | | | 3,999,920 | |
NV Bank Nederlandse Gemeenten 144A(z) | | | 0.20 | | | | 12-10-2014 | | | | 5,000,000 | | | | 4,997,450 | |
Old Line Funding LLC 144A(z)(p) | | | 0.22 | | | | 12-16-2014 | | | | 1,000,000 | | | | 999,610 | |
Oversea-Chinese Banking Corporation Limited (z) | | | 0.20 | | | | 9-9-2014 | | | | 2,000,000 | | | | 1,999,940 | |
Prudential Funding LLC (z) | | | 0.15 | | | | 9-2-2014 | | | | 1,000,000 | | | | 999,990 | |
PSP Capital Incorporated 144A(z) | | | 0.15 | | | | 10-15-2014 | | | | 4,000,000 | | | | 3,999,360 | |
PSP Capital Incorporated 144A(z) | | | 0.15 | | | | 11-18-2014 | | | | 1,000,000 | | | | 999,610 | |
PSP Capital Incorporated 144A(z) | | | 0.16 | | | | 11-4-2014 | | | | 1,000,000 | | | | 999,690 | |
Regency Markets No.1 LLC 144A(z)(p) | | | 0.14 | | | | 9-10-2014 | | | | 3,000,000 | | | | 2,999,850 | |
Regency Markets No.1 LLC 144A(z)(p) | | | 0.14 | | | | 9-16-2014 | | | | 1,000,000 | | | | 999,930 | |
Regency Markets No.1 LLC 144A(z)(p) | | | 0.14 | | | | 9-22-2014 | | | | 3,000,000 | | | | 2,999,700 | |
Rhein-Main Security Limited 144A(z) | | | 0.32 | | | | 9-5-2014 | | | | 1,000,000 | | | | 999,940 | |
Ridgefield Funding Company LLC 144A(z)(p) | | | 0.12 | | | | 9-2-2014 | | | | 1,000,000 | | | | 999,984 | |
Ridgefield Funding Company LLC 144A±(p) | | | 0.21 | | | | 2-17-2015 | | | | 1,000,000 | | | | 999,910 | |
Ridgefield Funding Company LLC 144A(z)(p) | | | 0.21 | | | | 9-15-2014 | | | | 2,000,000 | | | | 1,999,860 | |
Scaldis Capital LLC 144A(z) | | | 0.25 | | | | 9-24-2014 | | | | 1,000,000 | | | | 999,900 | |
Scaldis Capital LLC 144A(z) | | | 0.25 | | | | 11-17-2014 | | | | 1,000,000 | | | | 999,590 | |
Shagang South Asia (z) | | | 0.45 | | | | 9-8-2014 | | | | 1,000,000 | | | | 999,970 | |
Sinochem Company Limited (z) | | | 0.18 | | | | 9-5-2014 | | | | 1,000,000 | | | | 999,990 | |
Sinochem Company Limited (z) | | | 0.20 | | | | 10-8-2014 | | | | 1,000,000 | | | | 999,870 | |
Sinochem Company Limited (z) | | | 0.20 | | | | 11-7-2014 | | | | 1,000,000 | | | | 999,710 | |
Skandinaviska Enskilda Banken AG 144A(z) | | | 0.20 | | | | 12-23-2014 | | | | 2,000,000 | | | | 1,998,620 | |
State Street Bank & Trust Company (z) | | | 0.17 | | | | 9-9-2014 | | | | 3,000,000 | | | | 2,999,940 | |
State Street Bank & Trust Company ± | | | 0.23 | | | | 3-17-2015 | | | | 2,000,000 | | | | 1,997,520 | |
State Street Bank & Trust Company ± | | | 0.23 | | | | 4-10-2015 | | | | 5,000,000 | | | | 4,999,450 | |
Sumitomo Mitsui Banking Corporation 144A(z) | | | 0.21 | | | | 9-2-2014 | | | | 4,000,000 | | | | 3,999,960 | |
Sumitomo Mitsui Banking Corporation 144A(z) | | | 0.21 | | | | 9-3-2014 | | | | 3,000,000 | | | | 2,999,940 | |
Sumitomo Mitsui Banking Corporation 144A(z) | | | 0.21 | | | | 10-2-2014 | | | | 3,000,000 | | | | 2,999,520 | |
Sumitomo Mitsui Banking Corporation 144A(z) | | | 0.21 | | | | 10-3-2014 | | | | 1,000,000 | | | | 999,830 | |
Suncorp Group Limited 144A(z) | | | 0.26 | | | | 9-18-2014 | | | | 3,000,000 | | | | 2,999,790 | |
Suncorp Group Limited 144A(z) | | | 0.28 | | | | 10-15-2014 | | | | 2,000,000 | | | | 1,999,600 | |
Suncorp Group Limited 144A(z) | | | 0.30 | | | | 11-10-2014 | | | | 1,000,000 | | | | 999,640 | |
Sydney Capital Corporation 144A(z)(p) | | | 0.20 | | | | 9-24-2014 | | | | 2,000,000 | | | | 1,999,820 | |
Thunder Bay Funding LLC 144A(z)(p) | | | 0.23 | | | | 9-3-2014 | | | | 1,000,000 | | | | 999,980 | |
The accompanying notes are an integral part of these financial statements.
| | | | |
| 106 | | Wells Fargo Advantage Dow Jones Target Date Funds | | Portfolio of investments—August 31, 2014 (unaudited) |
SHORT-TERM INVESTMENT PORTFOLIO
| | | | | | | | | | | | | | | | |
| Security name | | Interest rate | | | Maturity date | | | Principal | | | Value | |
| | | | | | | | | | | | | | | | |
| | | | |
Commercial Paper (continued) | | | | | | | | | | | | | | | | |
Toyota Motor Credit Corporation ± | | | 0.23 | % | | | 3-6-2015 | | | $ | 3,000,000 | | | $ | 2,999,700 | |
Toyota Motor Credit Corporation ± | | | 0.21 | | | | 9-10-2014 | | | | 5,000,000 | | | | 5,000,000 | |
United Overseas Bank Limited 144A(z) | | | 0.21 | | | | 10-10-2014 | | | | 2,000,000 | | | | 1,999,720 | |
United Overseas Bank Limited 144A(z) | | | 0.23 | | | | 11-19-2014 | | | | 1,000,000 | | | | 999,650 | |
United Overseas Bank Limited 144A(z) | | | 0.23 | | | | 11-21-2014 | | | | 1,000,000 | | | | 999,640 | |
United Overseas Bank Limited 144A(z) | | | 0.28 | | | | 2-9-2015 | | | | 1,000,000 | | | | 998,870 | |
United Overseas Bank Limited 144A(z) | | | 0.28 | | | | 2-11-2015 | | | | 1,000,000 | | | | 998,840 | |
United Overseas Bank Limited 144A(z) | | | 0.28 | | | | 2-25-2015 | | | | 2,000,000 | | | | 1,997,300 | |
United Overseas Bank Limited 144A(z) | | | 0.28 | | | | 3-16-2015 | | | | 4,000,000 | | | | 3,993,600 | |
Victory Receivables Corporation 144A(z)(p) | | | 0.11 | | | | 9-2-2014 | | | | 1,000,000 | | | | 999,986 | |
Victory Receivables Corporation 144A(z)(p) | | | 0.17 | | | | 9-3-2014 | | | | 1,000,000 | | | | 999,980 | |
Victory Receivables Corporation 144A(z)(p) | | | 0.17 | | | | 9-5-2014 | | | | 1,000,000 | | | | 999,970 | |
Victory Receivables Corporation 144A(z)(p) | | | 0.17 | | | | 9-22-2014 | | | | 1,000,000 | | | | 999,900 | |
Victory Receivables Corporation 144A(z)(p) | | | 0.17 | | | | 10-1-2014 | | | | 1,000,000 | | | | 999,850 | |
Victory Receivables Corporation 144A(z)(p) | | | 0.17 | | | | 10-2-2014 | | | | 1,000,000 | | | | 999,846 | |
Victory Receivables Corporation 144A(z)(p) | | | 0.18 | | | | 10-10-2014 | | | | 1,000,000 | | | | 999,800 | |
Westpac Securities NZ Limited 144A± | | | 0.23 | | | | 9-4-2014 | | | | 1,000,000 | | | | 1,000,000 | |
White Plains Capital 144A(z) | | | 0.28 | | | | 9-2-2014 | | | | 1,000,000 | | | | 1,000,000 | |
Working Capital Management Company 144A(z) | | | 0.17 | | | | 9-26-2014 | | | | 1,000,000 | | | | 999,890 | |
| | | | |
Total Commercial Paper (Cost $335,948,649) | | | | | | | | | | | | | | | 335,947,626 | |
| | | | | | | | | | | | | | | | |
| | | | |
Corporate Bonds and Notes: 0.70% | | | | | | | | | | | | | | | | |
| | | | |
Consumer Discretionary: 0.15% | | | | | | | | | | | | | | | | |
| | | | |
| Diversified Consumer Services: 0.15% | | | | | | | | | | | | | | | | |
Smithsonian Institution ±§ | | | 0.10 | | | | 9-1-2018 | | | | 1,000,000 | | | | 1,000,000 | |
| | | | | | | | | | | | | | | | |
| | | | |
Financials: 0.22% | | | | | | | | | | | | | | | | |
| | | | |
| Diversified Financial Services: 0.22% | | | | | | | | | | | | | | | | |
GBG LLC Custody Receipts 144A±§ | | | 0.20 | | | | 9-1-2027 | | | | 179,000 | | | | 179,000 | |
LTF Real Estate LLC 144A±§ | | | 0.22 | | | | 6-1-2033 | | | | 365,000 | | | | 365,000 | |
Overseas Private Investment Corporation ±§ | | | 0.11 | | | | 7-9-2026 | | | | 1,000,000 | | | | 1,000,000 | |
| | | | |
| | | | | | | | | | | | | | | 1,544,000 | |
| | | | | | | | | | | | | | | | |
| | | | |
Health Care: 0.33% | | | | | | | | | | | | | | | | |
| | | | |
| Health Care Providers & Services: 0.33% | | | | | | | | | | | | | | | | |
ACTS Retirement Life Communities Incorporated ±§ | | | 0.11 | | | | 11-15-2029 | | | | 333,000 | | | | 333,000 | |
Keep Memory Alive ±§ | | | 0.11 | | | | 5-1-2037 | | | | 975,000 | | | | 975,000 | |
Providence Health & Services ±§ | | | 0.12 | | | | 10-1-2042 | | | | 990,000 | | | | 990,000 | |
| | | | |
| | | | | | | | | | | | | | | 2,298,000 | |
| | | | | | | | | | | | | | | | |
| | | | |
Total Corporate Bonds and Notes (Cost $4,842,000) | | | | | | | | | | | | | | | 4,842,000 | |
| | | | | | | | | | | | | | | | |
| | | | |
Municipal Obligations: 3.49% | | | | | | | | | | | | | | | | |
| | | | |
| California: 0.51% | | | | | | | | | | | | | | | | |
California Affordable Housing PFOTER Class A Series MT-846 (Housing Revenue, Bank of America NA LIQ) 144Aø | | | 0.55 | | | | 3-31-2016 | | | | 2,500,000 | | | | 2,500,000 | |
Oakland Alameda County CA (Miscellaneous Revenue) ø | | | 0.16 | | | | 9-15-2014 | | | | 1,000,000 | | | | 1,000,000 | |
| | | | |
| | | | | | | | | | | | | | | 3,500,000 | |
| | | | | | | | | | | | | | | | |
The accompanying notes are an integral part of these financial statements.
| | | | | | |
| Portfolio of investments—August 31, 2014 (unaudited) | | Wells Fargo Advantage Dow Jones Target Date Funds | | | 107 | |
SHORT-TERM INVESTMENT PORTFOLIO
| | | | | | | | | | | | | | | | |
| Security name | | Interest rate | | | Maturity date | | | Principal | | | Value | |
| | | | | | | | | | | | | | | | |
| | | | |
| Colorado: 0.17% | | | | | | | | | | | | | | | | |
Colorado HFA Class I Series A-1 (Housing Revenue, FHLB SPA) ø | | | 0.12 | % | | | 10-1-2033 | | | $ | 925,000 | | | $ | 925,000 | |
Colorado HFA MFHR Project B-2 (Housing Revenue, FHLB SPA) ø | | | 0.10 | | | | 5-1-2050 | | | | 240,000 | | | | 240,000 | |
| | | | |
| | | | | | | | | | | | | | | 1,165,000 | |
| | | | | | | | | | | | | | | | |
| | | | |
| Illinois: 0.12% | | | | | | | | | | | | | | | | |
Illinois Regional Transportation Authority Series A1 (Tax Revenue, JPMorgan Chase & Company LIQ) 144Aø | | | 0.11 | | | | 4-1-2016 | | | | 860,000 | | | | 860,000 | |
| | | | | | | | | | | | | | | | |
| | | | |
| Maine: 0.29% | | | | | | | | | | | | | | | | |
Maine Housing Authority Series F (Housing Revenue, Citibank NA LIQ) ø | | | 0.12 | | | | 11-15-2032 | | | | 1,000,000 | | | | 1,000,000 | |
Maine Housing Authority Series G (Housing Revenue, Bank of New York Mellon SPA) ø | | | 0.11 | | | | 11-15-2041 | | | | 1,000,000 | | | | 1,000,000 | |
| |
| | | | 2,000,000 | |
| | | | | | | | | | | | | | | | |
| | | | |
| Maryland: 0.57% | | | | | | | | | | | | | | | | |
Baltimore MD Package Systems Facilities (Transportation Revenue, Bank of America NA LOC) ø | | | 0.10 | | | | 7-1-2032 | | | | 1,940,000 | | | | 1,940,000 | |
Maryland CDA Series E (Housing Revenue, GNMA/FNMA/FHLMC Insured, Royal Bank of Canada SPA) ø | | | 0.10 | | | | 7-1-2045 | | | | 2,000,000 | | | | 2,000,000 | |
| |
| | | | 3,940,000 | |
| | | | | | | | | | | | | | | | |
| | | | |
| Massachusetts: 0.14% | | | | | | | | | | | | | | | | |
Massachusetts Development Finance Agency Wentworth Institute Technology Series A (Education Revenue, JPMorgan Chase & Company LOC) ø | | | 0.20 | | | | 10-1-2033 | | | | 980,000 | | | | 980,000 | |
| | | | | | | | | | | | | | | | |
| | | | |
| Michigan: 0.15% | | | | | | | | | | | | | | | | |
Michigan Finance Authority Series A (Miscellaneous Revenue, JPMorgan Chase & Company LOC) ø | | | 0.09 | | | | 9-1-2053 | | | | 1,000,000 | | | | 1,000,000 | |
| | | | | | | | | | | | | | | | |
| | | | |
| New York: 0.59% | | | | | | | | | | | | | | | | |
New York Mortgage Agency Homeowner ROC RR-II-R-11703 (Housing Revenue, Citibank NA LIQ) 144Aø | | | 0.11 | | | | 10-1-2031 | | | | 600,000 | | | | 600,000 | |
Puttable Floating Option Taxable Notes Series TNP-1006 (Miscellaneous Revenue, Bank of America NA LIQ) 144Aø | | | 0.45 | | | | 11-1-2039 | | | | 2,430,000 | | | | 2,430,000 | |
Westchester County NY Healthcare Corporation Series D (Health Revenue, TD Bank NA LOC) ø | | | 0.08 | | | | 11-1-2034 | | | | 1,000,000 | | | | 1,000,000 | |
| |
| | | | 4,030,000 | |
| | | | | | | | | | | | | | | | |
| | | | |
| Ohio: 0.03% | | | | | | | | | | | | | | | | |
Ohio HFA Residential Management Series I (Housing Revenue, GNMA/FNMA/FHLMC Insured, FHLB SPA) ø | | | 0.12 | | | | 9-1-2039 | | | | 184,000 | | | | 184,000 | |
| | | | | | | | | | | | | | | | |
| | | | |
| Oregon: 0.15% | | | | | | | | | | | | | | | | |
Oregon PFOTER (Miscellaneous Revenue, Bank of America NA LIQ) 144Aø | | | 0.40 | | | | 5-1-2035 | | | | 1,000,000 | | | | 1,000,000 | |
| | | | | | | | | | | | | | | | |
| | | | |
| Pennsylvania: 0.14% | | | | | | | | | | | | | | | | |
Montgomery County PA IDA Series 3238 (Health Revenue, FHA Insured, Credit Suisse LIQ) 144Aø | | | 0.11 | | | | 8-1-2030 | | | | 996,000 | | | | 996,000 | |
| | | | | | | | | | | | | | | | |
| | | | |
| South Carolina: 0.14% | | | | | | | | | | | | | | | | |
York County SC PCR Series 2000-B3 (Utilities Revenue) | | | 0.25 | | | | 9-2-2014 | | | | 1,000,000 | | | | 1,000,010 | |
| | | | | | | | | | | | | | | | |
The accompanying notes are an integral part of these financial statements.
| | | | |
| 108 | | Wells Fargo Advantage Dow Jones Target Date Funds | | Portfolio of investments—August 31, 2014 (unaudited) |
SHORT-TERM INVESTMENT PORTFOLIO
| | | | | | | | | | | | | | | | |
| Security name | | Interest rate | | | Maturity date | | | Principal | | | Value | |
| | | | | | | | | | | | | | | | |
| | | | |
| Texas: 0.34% | | | | | | | | | | | | | | | | |
Pasadena TX Independent School District Series B (GO, AGM Insured, JPMorgan Chase & Company SPA) ø | | | 0.20 | % | | | 2-1-2035 | | | $ | 1,000,000 | | | $ | 1,000,000 | |
Texas Municipal Gas Acquisition & Supply Corporation Series 2848 (Utilities Revenue, Morgan Stanley Bank LIQ) 144Aø | | | 0.35 | | | | 12-15-2026 | | | | 365,803 | | | | 365,803 | |
Texas PFOTER (Transportation Revenue, Bank of America NA LIQ) 144Aø | | | 0.36 | | | | 2-1-2030 | | | | 1,000,000 | | | | 1,000,000 | |
| | | | |
| | | | | | | | | | | | | | | 2,365,803 | |
| | | | | | | | | | | | | | | | |
| | | | |
| Wisconsin: 0.15% | | | | | | | | | | | | | | | | |
Wisconsin PFA Housing Project (Housing Revenue, Bank of America NA LOC) ø | | | 0.12 | | | | 1-1-2042 | | | | 1,000,000 | | | | 1,000,000 | |
| | | | | | | | | | | | | | | | |
| | | | |
Total Municipal Obligations (Cost $24,020,800) | | | | | | | | | | | | | | | 24,020,813 | |
| | | | | | | | | | | | | | | | |
| | | | |
Repurchase Agreements ^^: 7.94% | | | | | | | | | | | | | | | | |
Bank of America Corporation, dated 8-29-2014, maturity value $12,000,080 (1) | | | 0.06 | | | | 9-2-2014 | | | | 12,000,000 | | | | 12,000,000 | |
Credit Agricole, dated 8-29-2014, maturity value $40,642,679 (2) | | | 0.06 | | | | 9-2-2014 | | | | 40,642,408 | | | | 40,642,408 | |
GX Clarke Company, dated 8-29-2014, maturity value $2,000,033 (3) | | | 0.15 | | | | 9-2-2014 | | | | 2,000,000 | | | | 2,000,000 | |
| | | | |
Total Repurchase Agreements (Cost $54,642,408) | | | | | | | | | | | | | | | 54,642,408 | |
| | | | | | | | | | | | | | | | |
| | | | | | | | |
| Total investments in securities | | | | | | | | |
| (Cost $685,458,119) * | | | 99.56 | % | | | 685,457,350 | |
Other assets and liabilities, net | | | 0.44 | | | | 3,021,221 | |
| | | | | | | | |
| Total net assets | | | 100.00 | % | | $ | 688,478,571 | |
| | | | | | | | |
| ± | Variable rate investment. The rate shown is the rate in effect at period end. |
| 144A | The security may be resold in transactions exempt from registration, normally to qualified institutional buyers, pursuant to Rule 144A under the Securities Act of 1933. |
| (z) | Zero coupon security. The rate represents the current yield to maturity. |
| (p) | Asset-backed commercial paper |
| § | The security is subject to a demand feature which reduces the effective maturity. |
| ø | Variable rate demand notes are subject to a demand feature which reduces the effective maturity. The maturity date shown represents the final maturity date of the security. The interest rate is determined and reset by the issuer daily, weekly, or monthly depending upon the terms of the security. The rate shown is the rate in effect at period end. |
| | (1) | U.S. government securities, 3.00% to 4.00%, 2-1-2042 to 10-1-2043, fair value including accrued interest is $12,360,000. |
| | (2) | U.S. government securities, 0.38% to 6.50%, 3-1-2018 to 9-1-2044, fair value including accrued interest is $41,861,615. |
| | (3) | U.S. government securities, 0.00% to 11.25%, 8-31-2014 to 8-15-2044, fair value including accrued interest is $2,040,029. |
| * | Cost for federal income tax purposes is $685,458,119 and unrealized gains (losses) consists of: |
| | | | |
Gross unrealized gains | | $ | 11,324 | |
Gross unrealized losses | | | (12,093 | ) |
| | | | |
Net unrealized losses | | $ | (769 | ) |
The accompanying notes are an integral part of these financial statements.
| | | | | | |
| Statements of assets and liabilities—August 31, 2014 (unaudited) | | Wells Fargo Advantage Dow Jones Target Date Funds | | | 109 | |
| | | | | | | | | | | | |
| | | Diversified Fixed
Income Portfolio | | | Diversified Stock Portfolio | | | Short-Term Investment Portfolio | |
| | | |
Assets | | | | | | | | | | | | |
Investments | | | | | | | | | | | | |
In unaffiliated securities (including securities on loan), at value (see cost below) | | $ | 6,322,765,879 | | | $ | 9,570,079,914 | | | $ | 685,457,350 | |
In affiliated securities, at value (see cost below) | | | 284,081,151 | | | | 545,485,874 | | | | 0 | |
| | | | |
Total investments, at value (see cost below) | | | 6,606,847,030 | | | | 10,115,565,788 | | | | 685,457,350 | |
| | | | |
Cash | | | 0 | | | | 0 | | | | 2,000,000 | |
Segregated cash | | | 0 | | | | 14,338,972 | | | | 0 | |
Foreign currency, at value (see cost below) | | | 8,112,669 | | | | 34,377,805 | | | | 0 | |
Receivable for investments sold | | | 1,430,194 | | | | 4,707,622 | | | | 1,005,003 | |
Principal paydown receivable | | | 529 | | | | 0 | | | | 0 | |
Receivable for dividends and interest | | | 44,130,442 | | | | 16,207,667 | | | | 91,264 | |
Receivable for daily variation margin on open futures contracts | | | 0 | | | | 88,560 | | | | 0 | |
Receivable for securities lending income | | | 2,379 | | | | 216,431 | | | | 0 | |
Prepaid expenses and other assets | | | 0 | | | | 0 | | | | 4,248 | |
| | | | |
Total assets | | | 6,660,523,243 | | | | 10,185,502,845 | | | | 688,557,865 | |
| | | | |
| | | |
Liabilities | | | | | | | | | | | | |
Payable for investments purchased | | | 429,431,704 | | | | 212,830 | | | | 0 | |
Payable upon receipt of securities loaned | | | 1,719,240 | | | | 233,979,502 | | | | 0 | |
Payable for daily variation margin on open futures contracts | | | 0 | | | | 47,800 | | | | 0 | |
Due to custodian bank | | | 0 | | | | 4,607 | | | | 0 | |
Advisory fee payable | | | 820,671 | | | | 1,177,487 | | | | 60,713 | |
Custodian and accounting fees payable | | | 57,046 | | | | 69,404 | | | | 6,766 | |
Professional fees payable | | | 13,392 | | | | 16,417 | | | | 11,815 | |
Accrued expenses and other liabilities | | | 24,014 | | | | 49,100 | | | | 0 | |
| | | | |
Total liabilities | | | 432,066,067 | | | | 235,557,147 | | | | 79,294 | |
| | | | |
Total net assets | | $ | 6,228,457,176 | | | $ | 9,949,945,698 | | | $ | 688,478,571 | |
| | | | |
| | | |
Investments in unaffiliated securities, at cost | | $ | 6,154,008,822 | | | $ | 6,711,579,131 | | | $ | 685,458,119 | |
| | | | |
Investments in affiliated securities, at cost | | $ | 282,382,193 | | | $ | 532,362,944 | | | $ | 0 | |
| | | | |
Total investments, at cost | | $ | 6,436,391,015 | | | $ | 7,243,942,075 | | | $ | 685,458,119 | |
| | | | |
Securities on loan, at value | | $ | 1,683,412 | | | $ | 226,405,007 | | | $ | 0 | |
| | | | |
Foreign currency, at cost | | $ | 8,229,433 | | | $ | 34,466,089 | | | $ | 0 | |
| | | | |
The accompanying notes are an integral part of these financial statements.
| | | | |
| 110 | | Wells Fargo Advantage Dow Jones Target Date Funds | | Statements of operations—six months ended August 31, 2014 (unaudited) |
| | | | | | | | | | | | |
| | | Diversified Fixed
Income Portfolio | | | Diversified
Stock Portfolio | | | Short-Term
Investment Portfolio | |
| | | |
Investment income | | | | | | | | | | | | |
Interest* | | $ | 73,091,188 | | | $ | 9,605 | | | $ | 660,308 | |
Income from affiliated securities | | | 485,827 | | | | 472,201 | | | | 0 | |
Securities lending income, net | | | 33,340 | | | | 2,762,267 | | | | 0 | |
Dividends** | | | 0 | | | | 107,984,275 | | | | 0 | |
| | | | |
Total investment income | | | 73,610,355 | | | | 111,228,348 | | | | 660,308 | |
| | | | |
| | | |
Expenses | | | | | | | | | | | | |
Advisory fee | | | 4,597,261 | | | | 6,662,725 | | | | 355,087 | |
Custody and accounting fees | | | 243,467 | | | | 842,873 | | | | 44,933 | |
Professional fees | | | 44,184 | | | | 32,951 | | | | 26,050 | |
Shareholder report expenses | | | 8,334 | | | | 10,663 | | | | 1,609 | |
Trustees’ fees and expenses | | | 4,694 | | | | 4,694 | | | | 4,460 | |
Other fees and expenses | | | 46,033 | | | | 124,375 | | | | 10,117 | |
| | | | |
Total expenses | | | 4,943,973 | | | | 7,678,281 | | | | 442,256 | |
| | | | |
Net investment income | | | 68,666,382 | | | | 103,550,067 | | | | 218,052 | |
| | | | |
| | | |
REALIZED AND UNREALIZED GAINS (LOSSES) ON INVESTMENTS | | | | | | | | | | | | |
| | | |
Net realized gains (losses) on: | | | | | | | | | | | | |
Unaffiliated securities | | | 6,420,653 | | | | 5,806,769 | | | | 3,510 | |
Affiliated securities | | | 7,465 | | | | 193,189 | | | | 0 | |
Futures transactions | | | 0 | | | | 17,250,820 | | | | 0 | |
| | | | |
Net realized gains on investments | | | 6,428,118 | | | | 23,250,778 | | | | 3,510 | |
| | | | |
| | | |
Net change in unrealized gains (losses) on: | | | | | | | | | | | | |
Unaffiliated securities | | | 60,946,513 | | | | 463,504,887 | | | | (11,258 | ) |
Affiliated securities | | | 326,768 | | | | 3,028,891 | | | | 0 | |
Futures transactions | | | 0 | | | | (4,561,083 | ) | | | 0 | |
| | | | |
Net change in unrealized gains (losses) on investments | | | 61,273,281 | | | | 461,972,695 | | | | (11,258 | ) |
| | | | |
Net realized and unrealized gains (losses) on investments | | | 67,701,399 | | | | 485,223,473 | | | | (7,748 | ) |
| | | | |
Net increase in net assets resulting from operations | | $ | 136,367,781 | | | $ | 588,773,540 | | | $ | 210,304 | |
| | | | |
| | | |
* Net of foreign interest withholding taxes in the amount of | | | $1,103,721 | | | | $0 | | | | $0 | |
** Net of foreign dividend withholding taxes in the amount of | | | $0 | | | | $6,682,440 | | | | $0 | |
The accompanying notes are an integral part of these financial statements.
| | | | | | |
| Statements of changes in net assets | | Wells Fargo Advantage Dow Jones Target Date Funds | | | 111 | |
| | | | | | | | |
| | | Diversified Fixed Income Portfolio | |
| | | Six months ended
August 31, 2014
(unaudited) | | | Year ended
February 28, 2014 | |
| | |
Operations | | | | | | | | |
Net investment income | | $ | 68,666,382 | | | $ | 124,899,679 | |
Net realized gains (losses) on investments | | | 6,428,118 | | | | (10,397,892 | ) |
Net change in unrealized gains (losses) on investments | | | 61,273,281 | | | | (80,376,125 | ) |
| | | | |
Net increase in net assets resulting from operations | | | 136,367,781 | | | | 34,125,662 | |
| | | | |
| |
Capital share transactions | | | | |
Transactions in investors’ beneficial interests | | | | | | | | |
Contributions | | | 607,886,913 | | | | 1,357,068,342 | |
Withdrawals | | | (330,614,664 | ) | | | (898,747,707 | ) |
| | | | |
Net increase in net assets resulting from capital share transactions | | | 277,272,249 | | | | 458,320,635 | |
| | | | |
Total increase in net assets | | | 413,640,030 | | | | 492,446,297 | |
| | | | |
| |
Net assets | | | | |
Beginning of period | | | 5,814,817,146 | | | | 5,322,370,849 | |
| | | | |
End of period | | $ | 6,228,457,176 | | | $ | 5,814,817,146 | |
| | | | |
The accompanying notes are an integral part of these financial statements.
| | | | |
| 112 | | Wells Fargo Advantage Dow Jones Target Date Funds | | Statements of changes in net assets |
| | | | | | | | |
| | | Diversified Stock Portfolio | |
| | | Six months ended
August 31, 2014
(unaudited) | | | Year ended
February 28, 2014 | |
| | |
Operations | | | | | | | | |
Net investment income | | $ | 103,550,067 | | | $ | 169,257,059 | |
Net realized gains on investments | | | 23,250,778 | | | | 438,942,966 | |
Net change in unrealized gains (losses) on investments | | | 461,972,695 | | | | 1,126,909,882 | |
| | | | |
Net increase in net assets resulting from operations | | | 588,773,540 | | | | 1,735,109,907 | |
| | | | |
| | |
Capital share transactions | | | | | | | | |
Transactions in investors’ beneficial interests | | | | | | | | |
Contributions | | | 597,837,941 | | | | 1,354,845,934 | |
Withdrawals | | | (758,798,009 | ) | | | (1,857,847,901 | ) |
| | | | |
Net decrease in net assets resulting from capital share transactions | | | (160,960,068 | ) | | | (503,001,967 | ) |
| | | | |
Total increase in net assets | | | 427,813,472 | | | | 1,232,107,940 | |
| | | | |
| | |
Net assets | | | | | | | | |
Beginning of period | | | 9,522,132,226 | | | | 8,290,024,286 | |
| | | | |
End of period | | $ | 9,949,945,698 | | | $ | 9,522,132,226 | |
| | | | |
The accompanying notes are an integral part of these financial statements.
| | | | | | |
| Statements of changes in net assets | | Wells Fargo Advantage Dow Jones Target Date Funds | | | 113 | |
| | | | | | | | |
| | | Short-Term Investment Portfolio | |
| | | Six months ended
August 31, 2014
(unaudited) | | | Year ended
February 28, 2014 | |
| | |
Operations | | | | | | | | |
Net investment income | | $ | 218,052 | | | $ | 579,262 | |
Net realized gains on investments | | | 3,510 | | | | 17,485 | |
Net change in unrealized gains (losses) on investments | | | (11,258 | ) | | | (47,254 | ) |
| | | | |
Net increase in net assets resulting from operations | | | 210,304 | | | | 549,493 | |
| | | | |
| | |
Capital share transactions | | | | | | | | |
Transactions in investors’ beneficial interests | | | | | | | | |
Contributions | | | 82,583,446 | | | | 283,271,026 | |
Withdrawals | | | (76,566,537 | ) | | | (176,386,431 | ) |
| | | | |
Net increase in net assets resulting from capital share transactions | | | 6,016,909 | | | | 106,884,595 | |
| | | | |
Total increase in net assets | | | 6,227,213 | | | | 107,434,088 | |
| | | | |
| | |
Net assets | | | | | | | | |
Beginning of period | | | 682,251,358 | | | | 574,817,270 | |
| | | | |
End of period | | $ | 688,478,571 | | | $ | 682,251,358 | |
| | | | |
The accompanying notes are an integral part of these financial statements.
| | | | |
| 114 | | Wells Fargo Advantage Dow Jones Target Date Funds | | Financial highlights |
| | | | | | | | | | | | | | | | | | | | |
| | | Ratio to average net assets (annualized) | | | | | | | |
| | | Net investment income | | | Gross expenses | | | Net expenses | | | Total return1 | | | Portfolio turnover rate | |
| | | | | |
Diversified Fixed Income Portfolio | | | | | | | | | | | | | | | | | | | | |
Six months ended August 31, 2014 (unaudited) | | | 2.26 | % | | | 0.16 | % | | | 0.16 | % | | | 2.28 | % | | | 21 | % |
Year ended February 28, 2014 | | | 2.25 | % | | | 0.19 | % | | | 0.19 | % | | | 0.47 | % | | | 44 | % |
Year ended February 28, 2013 | | | 2.24 | % | | | 0.27 | % | | | 0.26 | % | | | 1.50 | % | | | 43 | % |
Year ended February 29, 2012 | | | 2.66 | % | | | 0.27 | % | | | 0.26 | % | | | 7.41 | % | | | 52 | % |
Year ended February 28, 2011 | | | 2.84 | % | | | 0.28 | % | | | 0.26 | % | | | 5.58 | % | | | 57 | % |
Year ended February 28, 2010 | | | 3.47 | % | | | 0.31 | % | | | 0.28 | % | | | 10.44 | % | | | 113 | % |
| | | | | |
Diversified Stock Portfolio | | | | | | | | | | | | | | | | | | | | |
Six months ended August 31, 2014 (unaudited) | | | 2.15 | % | | | 0.16 | % | | | 0.16 | % | | | 6.16 | % | | | 3 | % |
Year ended February 28, 2014 | | | 1.92 | % | | | 0.20 | % | | | 0.19 | % | | | 21.82 | % | | | 22 | % |
Year ended February 28, 2013 | | | 2.06 | % | | | 0.33 | % | | | 0.28 | % | | | 11.12 | % | | | 18 | % |
Year ended February 29, 2012 | | | 1.79 | % | | | 0.33 | % | | | 0.28 | % | | | 0.86 | % | | | 17 | % |
Year ended February 28, 2011 | | | 1.65 | % | | | 0.34 | % | | | 0.28 | % | | | 25.76 | % | | | 18 | % |
Year ended February 28, 2010 | | | 1.66 | % | | | 0.38 | % | | | 0.31 | % | | | 66.83 | % | | | 22 | % |
| | | | | |
Short-Term Investment Portfolio | | | | | | | | | | | | | | | | | | | | |
Six months ended August 31, 2014 (unaudited) | | | 0.09 | % | | | 0.12 | % | | | 0.12 | % | | | 0.00 | % | | | N/A | |
Year ended February 28, 2014 | | | 0.09 | % | | | 0.12 | % | | | 0.12 | % | | | 0.00 | % | | | N/A | |
Year ended February 28, 2013 | | | 0.14 | % | | | 0.12 | % | | | 0.12 | % | | | 0.00 | % | | | N/A | |
Year ended February 29, 2012 | | | 0.13 | % | | | 0.12 | % | | | 0.12 | % | | | 0.00 | % | | | N/A | |
Year ended February 28, 2011 | | | 0.20 | % | | | 0.14 | % | | | 0.14 | % | | | 0.00 | % | | | N/A | |
Year ended February 28, 2010 | | | 0.24 | % | | | 0.17 | % | | | 0.16 | % | | | 0.45 | % | | | N/A | |
| 1. | Returns for periods of less than one year are not annualized. |
The accompanying notes are an integral part of these financial statements.
| | | | | | |
| Notes to financial statements (unaudited) | | Wells Fargo Advantage Dow Jones Target Date Funds | | | 115 | |
1. ORGANIZATION
Wells Fargo Master Trust (the “Trust”), a Delaware statutory trust organized on March 10, 1999, is an open-end management investment company registered under the Investment Company Act of 1940, as amended (the “1940 Act”). These financial statements report on the following funds: the Wells Fargo Advantage Diversified Fixed Income Portfolio (“Diversified Fixed Income Portfolio”), the Wells Fargo Advantage Diversified Stock Portfolio (“Diversified Stock Portfolio”), and the Wells Fargo Advantage Short-Term Investment Portfolio (“Short-Term Investment Portfolio” ) (each, a “Portfolio”, collectively, the “Portfolios”).
The Portfolios, which are master portfolios in a master/feeder structure, offer their shares to multiple feeder funds rather than directly to the public
2. SIGNIFICANT ACCOUNTING POLICIES
The following significant accounting policies, which are consistently followed in the preparation of the financial statements of each Portfolio, are in conformity with U.S. generally accepted accounting principles which require management to make estimates and assumptions that affect the reported amounts of assets and liabilities, disclosure of contingent assets and liabilities at the date of the financial statements, and the reported amounts of revenues and expenses during the reporting period. Actual results could differ from those estimates.
Securities valuation
All investments are valued each business day as of the close of regular trading on the New York Stock Exchange (generally 4 p.m. Eastern Time).
Equity securities and futures that are listed on a foreign or domestic exchange or market are valued at the official closing price or, if none, the last sales price. If no sale occurs on the primary exchange or market for the security that day, the prior day’s price will be deemed “stale” and fair values will be determined in accordance with the Portfolios’ Valuation Procedures.
The values of securities denominated in foreign currencies are translated into U.S. dollars at rates provided by an independent foreign currency pricing source at a time each business day specified by the Management Valuation Team of Wells Fargo Funds Management, LLC (“Funds Management”).
Many securities markets and exchanges outside the U.S. close prior to the close of the New York Stock Exchange and therefore may not fully reflect trading or events that occur after the close of the principal exchange in which the foreign securities are traded, but before the close of the New York Stock Exchange. If such trading or events are expected to materially affect the value of such securities, then fair value pricing procedures approved by the Board of Trustees of the Portfolios are applied. These procedures take into account multiple factors including movements in U.S. securities markets after foreign exchanges close. Foreign securities that are fair valued under these procedures are categorized as Level 2 and the application of these procedures may result in transfers between Level 1 and Level 2. Depending on market activity, such fair valuations may be frequent. Such fair value pricing may result in NAVs that are higher or lower than NAVs based on the last reported sales price or latest quoted bid price. On August 31, 2014 such fair value pricing was not used in pricing foreign securities.
Fixed income securities acquired with maturities exceeding 60 days are valued based on evaluated bid prices provided by an independent pricing service which may utilize both transaction data and market information such as yield, quality, coupon rate, maturity, type of issue, trading characteristics and other market data. If prices are not available from the independent pricing service or prices received are deemed not representative of market value, values will be obtained from an independent broker-dealer.
Short-term securities, with maturities of 60 days or less at time of purchase, generally are valued at amortized cost which approximates fair value. The amortized cost method involves valuing a security at its cost, plus accretion of discount or minus amortization of premium over the period until maturity.
Investments in registered open-end investment companies are valued at net asset value. Non-registered investment vehicles are fair valued at net asset value.
Investments which are not valued using any of the methods discussed above are valued at their fair value, as determined in good faith by the Board of Trustees. The Board of Trustees has established a Valuation Committee comprised of the Trustees and has delegated to it the authority to take any actions regarding the valuation of portfolio securities that the Valuation Committee deems necessary or appropriate, including determining the fair value of portfolio securities, unless the determination has been delegated to the Management Valuation Team. The Board of Trustees retains the authority to
| | | | |
| 116 | | Wells Fargo Advantage Dow Jones Target Date Funds | | Notes to financial statements (unaudited) |
make or ratify any valuation decisions or approve any changes to the Valuation Procedures as it deems appropriate. On a quarterly basis, the Board of Trustees receives reports on any valuation actions taken by the Valuation Committee or the Management Valuation Team which may include items for ratification.
Valuations of fair valued securities are compared to the next actual sales price when available, or other appropriate market values, to assess the continued appropriateness of the fair valuation methodologies used. These securities are fair valued on a day-to-day basis, taking into consideration changes to appropriate market information and any significant changes to the inputs considered in the valuation process until there is a readily available price provided on an exchange or by an independent pricing service. Valuations received from an independent pricing service or independent broker-dealer quotes are periodically validated by comparisons to most recent trades and valuations provided by other independent pricing services in addition to the review of prices by the adviser and/or subadviser. Unobservable inputs used in determining fair valuations are identified based on the type of security, taking into consideration factors utilized by market participants in valuing the investment, knowledge about the issuer and the current market environment.
Foreign currency translation
The accounting records of the Portfolios are maintained in U.S. dollars. The value of other assets and liabilities denominated in foreign currencies are translated into U.S. dollars at rates provided by an independent foreign currency pricing source at a time each business day specified by the Management Valuation Team. Purchases and sales of securities, and income and expenses are converted at the rate of exchange on the respective dates of such transactions. Net realized foreign exchange gains or losses arise from sales of foreign currencies, currency gains or losses realized between the trade and settlement dates on securities transactions, and the difference between the amounts of dividends, interest and foreign withholding taxes recorded and the U.S. dollar equivalent of the amounts actually paid or received. Net unrealized foreign exchange gains and losses arise from changes in the fair value of assets and liabilities other than investments in securities resulting from changes in exchange rates. The changes in net assets arising from changes in exchange rates and the changes in net assets resulting from changes in market prices of securities are not separately presented. Such changes are included in net realized and unrealized gains or losses from investments.
Repurchase agreements
The Portfolios may invest in repurchase agreements and may participate in pooled repurchase agreement transactions with other portfolios advised by Funds Management. The repurchase agreements must be fully collateralized based on values that are marked-to-market daily. The collateral may be held by an agent bank under a tri-party agreement. It is the custodian’s responsibility to value collateral daily and to take action to obtain additional collateral as necessary to maintain market value equal to or greater than the resale price. The repurchase agreements are collateralized by instruments such as U.S. Treasury, federal agency, or high-grade corporate obligations. There could be potential loss to a Portfolio in the event that such Portfolio is delayed or prevented from exercising its rights to dispose of the collateral, including the risk of a possible decline in the value of the underlying obligations during the period in which a Portfolio seeks to assert its rights.
Security loans
The Portfolios may lend their securities from time to time in order to earn additional income in the form of fees or interest on securities received as collateral or the investment of any cash received as collateral. The Portfolios continue to receive interest or dividends on the securities loaned. The Portfolios receive collateral in the form of cash or securities with a value at least equal to the value of the securities on loan. The value of the loaned securities is determined at the close of each business day and any additional required collateral is delivered to the Portfolios on the next business day. In a securities lending transaction, the net asset value of the Portfolios will be affected by an increase or decrease in the value of the securities loaned and by an increase or decrease in the value of the instrument in which collateral is invested. The amount of securities lending activity undertaken by the Portfolios fluctuate from time to time, In the event of default or bankruptcy by the borrower, the Portfolios may be prevented from recovering the loaned securities or gaining access to the collateral or may experience delays or costs in doing so. In addition, the investment of any cash collateral received may lose all or part of its value. The Portfolios have the right under the lending agreement to recover the securities from the borrower on demand.
The Portfolios lend their securities through an unaffiliated securities lending agent. Cash collateral received in connection with its securities lending transactions is invested in Wells Fargo Securities Lending Cash Investments, LLC (the “Securities Lending Fund”). The Securities Lending Fund is exempt from registration under Section 3(c)(7) of the 1940 Act and is managed by Funds Management and is sub-advised by Wells Capital Management Incorporated (“WellsCap”). Funds Management receives an advisory fee starting at 0.05% and declining to 0.01% as the average daily net assets of the Securities Lending Fund increase. All of the fees received by Funds Management are paid to WellsCap for its services as
| | | | | | |
| Notes to financial statements (unaudited) | | Wells Fargo Advantage Dow Jones Target Date Funds | | | 117 | |
subadviser. The Securities Lending Fund seeks to provide a positive return compared to the daily Fed Funds Open rate by investing in high-quality, U.S. dollar-denominated short-term money market instruments. Securities Lending Fund investments are fair valued based upon the amortized cost valuation technique. Income earned from investment in the Securities Lending Fund is included in securities lending income on the Statements of Operations.
When-issued transactions
Each Portfolio may purchase securities on a forward commitment or when-issued basis. A Portfolio records a when-issued transaction on the trade date and will segregate assets in an amount at least equal in value to the Portfolio’s commitment to purchase when-issued securities. Securities purchased on a when-issued basis are marked-to-market daily and the Portfolio begins earning interest on the settlement date. Losses may arise due to changes in the market value of the underlying securities or if the counterparty does not perform under the contract.
Futures contracts
Diversified Stock Portfolio is subject to equity price risk and foreign currency exchange rate risk in the normal course of pursuing its investment objectives. The Portfolio may buy and sell futures contracts in order to gain exposure to, or protect against, changes in security values and interest rates. The primary risks associated with the use of futures contracts are the imperfect correlation between changes in market values of securities held by the Portfolio and the prices of futures contracts, and the possibility of an illiquid market.
The aggregate principal amounts of the contracts are not recorded in the financial statements. Fluctuations in the value of the contracts are recorded in the Statements of Assets and Liabilities as an asset or liability and in the Statements of Operations as unrealized gains or losses until the contracts are closed, at which point they are recorded as net realized gains or losses on futures contracts. With futures contracts, there is minimal counterparty risk to the Portfolio since futures are exchange traded and the exchange’s clearinghouse, as counterparty to all exchange traded futures, guarantees the futures against default.
Mortgage dollar roll transactions
Each Portfolio may engage in mortgage dollar roll transactions through TBA mortgage-backed securities issued by Government National Mortgage Association (GNMA), Federal National Mortgage Association (FNMA) and Federal Home Loan Mortgage Corporation (FHLMC). In a mortgage dollar roll transaction, a Portfolio sells a mortgage-backed security to a financial institution, such as a bank or broker-dealer and simultaneously agrees to repurchase a substantially similar security from the institution at a later date at an agreed upon price. The mortgage-backed securities that are repurchased will bear the same interest rate as those sold, but generally will be collateralized by different pools of mortgages with different pre-payment histories. During the roll period, a Portfolio foregoes principal and interest paid on the securities. A Portfolio is compensated by the difference between the current sales price and the forward price for the future purchase as well as by the earnings on the cash proceeds of the initial sale. Mortgage dollar rolls may be renewed without physical delivery of the securities subject to the contract. The Portfolios account for TBA dollar roll transactions as purchases and sales.
Security transactions and income recognition
Securities transactions are recorded on a trade date basis. Realized gains or losses are recorded on the basis of identified cost.
Interest income is accrued daily and bond discounts are accreted and premiums are amortized daily based on the effective interest method. To the extent debt obligations are placed on non-accrual status, any related interest income may be reduced by writing off interest receivables when the collection of all or a portion of interest has become doubtful based on consistently applied procedures. If the issuer subsequently resumes interest payments or when the collectability of interest is reasonably assured, the debt obligation is removed from non-accrual status.
Dividend income is recognized on the ex-dividend date, except for certain dividends from foreign securities, which are recorded as soon as the Portfolio is informed of the ex-dividend date.
Income from foreign securities is recorded net of foreign taxes withheld where recovery of such taxes is not assured.
Federal and other taxes
Each Portfolio is treated as a separate entity for federal income tax purposes. The Portfolios are not required to pay federal income taxes on their net investment income and net capital gain as they are treated as partnerships for federal income tax purposes. All interest, dividends, gains and losses of a Portfolio are deemed to have been “passed through” to the interestholders in proportion to their holdings of the Portfolio regardless of whether such interest, dividends and gains have been distributed by the Portfolio.
| | | | |
| 118 | | Wells Fargo Advantage Dow Jones Target Date Funds | | Notes to financial statements (unaudited) |
Each Portfolio’s income tax returns and all financial records supporting those returns for the prior three fiscal years are subject to examination by the federal revenue authority. Management has analyzed each Portfolio’s tax positions taken on federal, state, and foreign tax returns for all open tax years and does not believe that there are any uncertain tax positions that require recognition of a tax liability.
3. FAIR VALUATION MEASUREMENTS
Fair value measurements of investments are determined within a framework that has established a fair value hierarchy based upon the various data inputs utilized in determining the value of each Portfolio’s investments. The three-level hierarchy gives the highest priority to unadjusted quoted prices in active markets for identical assets or liabilities (Level 1) and the lowest priority to significant unobservable inputs (Level 3). Each Portfolio’s investments are classified within the fair value hierarchy based on the lowest level of input that is significant to the fair value measurement. The inputs are summarized into three broad levels as follows:
| n | | Level 1 – quoted prices in active markets for identical securities |
| n | | Level 2 – other significant observable inputs (including quoted prices for similar securities, interest rates, prepayment speeds, credit risk, use of amortized cost, etc.) |
| n | | Level 3 – significant unobservable inputs (including the Portfolio’s own assumptions in determining the fair value of investments) |
The inputs or methodologies used for valuing investments in securities are not necessarily an indication of the risk associated with investing in those securities.
The following is a summary of the inputs used in valuing each Portfolio’s assets and liabilities as of August 31, 2014:
| | | | | | | | | | | | | | | | |
| Diversified Fixed Income Portfolio | | Quoted prices
(Level 1) | | | Other significant
observable inputs (Level 2) | | | Significant
unobservable inputs
(Level 3) | | | Total | |
Assets | | | | | | | | | | | | | | | | |
Investments in: | | | | | | | | | | | | | | | | |
| | | | |
Agency securities | | $ | 0 | | | $ | 1,739,617,187 | | | $ | 0 | | | $ | 1,739,617,187 | |
| | | | |
Corporate bonds and notes | | | 0 | | | | 1,304,461,428 | | | | 0 | | | | 1,304,461,428 | |
| | | | |
Foreign government bonds | | | 0 | | | | 1,594,158,780 | | | | 0 | | | | 1,594,158,780 | |
| | | | |
U.S. Treasury securities | | | 1,456,160,735 | | | | 0 | | | | 0 | | | | 1,456,160,735 | |
| | | | |
Yankee corporate bonds and notes | | | 0 | | | | 247,426,299 | | | | 0 | | | | 247,426,299 | |
| | | | |
Yankee government bonds | | | 0 | | | | 1,999,000 | | | | 0 | | | | 1,999,000 | |
| | | | |
Short-term investments | | | | | | | | | | | | | | | | |
Investment companies | | | 261,304,361 | | | | 1,719,240 | | | | 0 | | | | 263,023,601 | |
Total assets | | $ | 1,717,465,096 | | | $ | 4,889,381,934 | | | $ | 0 | | | $ | 6,606,847,030 | |
| | | | | | |
| Notes to financial statements (unaudited) | | Wells Fargo Advantage Dow Jones Target Date Funds | | | 119 | |
| | | | | | | | | | | | | | | | |
| Diversified Stock Portfolio | | Quoted prices
(Level 1) | | | Other significant
observable inputs
(Level 2) | | | Significant
unobservable inputs
(Level 3) | | | Total | |
Assets | | | | | | | | | | | | | | | | |
Investments in: | | | | | | | | | | | | | | | | |
| | | | |
Common stocks | | | | | | | | | | | | | | | | |
Consumer discretionary | | $ | 1,238,755,359 | | | $ | 349,853 | | | $ | 0 | | | $ | 1,239,105,212 | |
Consumer staples | | | 650,096,270 | | | | 0 | | | | 0 | | | | 650,096,270 | |
Energy | | | 716,238,140 | | | | 2,403,589 | | | | 0 | | | | 718,641,729 | |
Financials | | | 2,079,408,777 | | | | 58,034 | | | | 0 | | | | 2,079,466,811 | |
Health care | | | 941,097,612 | | | | 0 | | | | 0 | | | | 941,097,612 | |
Industrials | | | 1,272,677,835 | | | | 38,937 | | | | 0 | | | | 1,272,716,772 | |
Information technology | | | 1,456,327,751 | | | | 48,964 | | | | 0 | | | | 1,456,376,715 | |
Materials | | | 547,651,584 | | | | 1,812,723 | | | | 10,178 | | | | 549,474,485 | |
Telecommunication services | | | 241,470,085 | | | | 234,168 | | | | 0 | | | | 241,704,253 | |
Utilities | | | 387,716,182 | | | | 0 | | | | 0 | | | | 387,716,182 | |
| | | | |
Preferred stocks | | | | | | | | | | | | | | | | |
Consumer discretionary | | | 8,014,426 | | | | 0 | | | | 0 | | | | 8,014,426 | |
Consumer staples | | | 2,998,716 | | | | 0 | | | | 0 | | | | 2,998,716 | |
Energy | | | 11,864,791 | | | | 0 | | | | 0 | | | | 11,864,791 | |
Financials | | | 25,225,114 | | | | 0 | | | | 0 | | | | 25,225,114 | |
Health care | | | 378 | | | | 0 | | | | 0 | | | | 378 | |
Information technology | | | 5,266,236 | | | | 0 | | | | 0 | | | | 5,266,236 | |
Materials | | | 8,577,558 | | | | 0 | | | | 0 | | | | 8,577,558 | |
Telecommunication services | | | 1,405,595 | | | | 0 | | | | 0 | | | | 1,405,595 | |
Utilities | | | 1,546,934 | | | | 0 | | | | 0 | | | | 1,546,934 | |
| | | | |
Rights | | | | | | | | | | | | | | | | |
Consumer staples | | | 0 | | | | 449 | | | | 0 | | | | 449 | |
Energy | | | 0 | | | | 611 | | | | 0 | | | | 611 | |
Financials | | | 0 | | | | 113,303 | | | | 0 | | | | 113,303 | |
Health care | | | 0 | | | | 0 | | | | 0 | | | | 0 | |
Information technology | | | 0 | | | | 812 | | | | 0 | | | | 812 | |
| | | | |
Warrants | | | | | | | | | | | | | | | | |
Consumer discretionary | | | 0 | | | | 69,056 | | | | 0 | | | | 69,056 | |
Consumer staples | | | 0 | | | | 2,252 | | | | 0 | | | | 2,252 | |
Energy | | | 0 | | | | 5,538 | | | | 0 | | | | 5,538 | |
Financials | | | 0 | | | | 74,592 | | | | 0 | | | | 74,592 | |
Health care | | | 0 | | | | 137 | | | | 0 | | | | 137 | |
Industrials | | | 0 | | | | 8,944 | | | | 0 | | | | 8,944 | |
Materials | | | 0 | | | | 7 | | | | 0 | | | | 7 | |
Utilities | | | 0 | | | | 1,021 | | | | 0 | | | | 1,021 | |
| | | | |
Short-term investments | | | | | | | | | | | | | | | | |
Investment companies | | | 280,013,775 | | | | 233,979,502 | | | | 0 | | | | 513,993,277 | |
| | | 9,876,353,118 | | | | 239,202,492 | | | | 10,178 | | | | 10,115,565,788 | |
Futures contracts | | | 88,560 | | | | 0 | | | | 0 | | | | 88,560 | |
Total assets | | $ | 9,876,441,678 | | | $ | 239,202,492 | | | $ | 10,178 | | | $ | 10,115,654,348 | |
Liabilities | | | | | | | | | | | | | | | | |
Futures contracts | | $ | 47,800 | | | $ | 0 | | | $ | 0 | | | $ | 47,800 | |
Total liabilities | | $ | 47,800 | | | $ | 0 | | | $ | 0 | | | $ | 47,800 | |
| | | | |
| 120 | | Wells Fargo Advantage Dow Jones Target Date Funds | | Notes to financial statements (unaudited) |
| | | | | | | | | | | | | | | | |
| Short-Term Investment Portfolio | | Quoted prices
(Level 1) | | | Other significant
observable inputs
(Level 2) | | | Significant
unobservable inputs
(Level 3) | | | Total | |
Assets | | | | | | | | | | | | | | | | |
Investments in: | | | | | | | | | | | | | | | | |
| | | | |
Certificates of deposit | | $ | 0 | | | $ | 266,004,503 | | | $ | 0 | | | $ | 266,004,503 | |
| | | | |
Commercial paper | | | 0 | | | | 335,947,626 | | | | 0 | | | | 335,947,626 | |
| | | | |
Corporate bonds and notes | | | 0 | | | | 4,842,000 | | | | 0 | | | | 4,842,000 | |
| | | | |
Repurchase agreements | | | 0 | | | | 24,020,813 | | | | 0 | | | | 24,020,813 | |
| | | | |
Yankee corporate bonds and notes | | | 0 | | | | 54,642,408 | | | | 0 | | | | 54,642,408 | |
Total assets | | $ | 0 | | | $ | 685,457,350 | | | $ | 0 | | | $ | 685,457,350 | |
Futures contracts are reported at their variation margin at measurement date, which represents the amount due/from the Portfolio at that date. All other assets and liabilities are reported at their market value at measurement date.
Transfers in and transfers out are recognized at the end of the reporting period. For the six months ended August 31, 2014, the Portfolios did not have any transfers into/out of Level 1, Level 2, or Level 3.
4. TRANSACTIONS WITH AFFILIATES AND OTHER EXPENSES
Advisory fees
The Trust has entered into an advisory contract with Funds Management, an indirect wholly owned subsidiary of Wells Fargo & Company (“Wells Fargo”). The adviser is responsible for implementing investment policies and guidelines and for supervising the subadvisers, who are responsible for day-to-day portfolio management of the Portfolios.
Pursuant to the contract, Funds Management is entitled to receive an annual advisory fee from Diversified Fixed Income Portfolio and Diversified Stock Portfolio starting at 0.20% and declining to 0.10% as the average daily net assets of each respective Portfolio increase. Fund Management is entitled to receive an annual advisory fee of 0.10% of the average daily net assets of Short-Term Investment Portfolio. For the six months ended August 31, 2014, the advisory fee was equivalent to an annual rate for each Portfolio as follows:
| | | | |
| | | Advisory fee | |
Diversified Fixed Income Portfolio | | | 0.15 | % |
Diversified Stock Portfolio | | | 0.14 | |
Short-Term Investment Portfolio | | | 0.10 | |
Funds Management has retained the services of certain subadvisers to provide daily portfolio management to the Portfolios. The fees for subadvisory services are borne by Funds Management. WellsCap, an affiliate of Funds Management and an indirect wholly owned subsidiary of Wells Fargo, is the subadviser to Short-Term Investment Portfolio and is entitled to receive a fee from Funds Management at an annual rate starting at 0.05% and declining to 0.01% as the average daily net assets of Short-Term Investment Portfolio increase. SSgA Funds Management Incorporated is the subadviser to both Diversified Fixed Income Portfolio and Diversified Stock Portfolio and is entitled to receive an annual subadvisory fee starting at 0.07% and declining to 0.025% as the average daily net assets of each Portfolio increase.
5. INVESTMENT PORTFOLIO TRANSACTIONS
Purchases and sales of investments, excluding short-term securities, for the six months ended August 31, 2014 were as follows:
| | | | | | | | | | | | | | | | |
| | | Purchases at cost | | | Sales proceeds | |
| | | U.S.
government | | | Non-U.S.
government | | | U.S.
government | | | Non-U.S.
government | |
Diversified Fixed Income Portfolio | | $ | 1,480,592,370 | | | $ | 401,827,618 | | | $ | 1,080,495,960 | | | $ | 157,589,051 | |
Diversified Stock Portfolio | | | 0 | | | | 248,575,975 | | | | 0 | | | | 289,114,086 | |
| | | | | | |
| Notes to financial statements (unaudited) | | Wells Fargo Advantage Dow Jones Target Date Funds | | | 121 | |
6. DERIVATIVE TRANSACTIONS
During the six months ended August 31, 2014, Diversified Stock Portfolio used uninvested cash to enter into futures contracts to gain market exposure.
At August 31, 2014, Diversified Stock Portfolio had long futures contracts outstanding as follows:
| | | | | | | | | | | | | | |
| Expiration date | | Counterparty | | Contracts | | Type | | Contract
value at
August 31, 2014 | | | Unrealized
gains
(losses) | |
| 9-19-2014 | | UBS | | 292 Long | | MSCI EAFE Index | | $ | 28,043,680 | | | $ | (534,731 | ) |
| 9-19-2014 | | UBS | | 450 Long | | MSCI Emerging Markets Index | | | 24,430,500 | | | | 1,098,152 | |
| 9-19-2014 | | UBS | | 60 Long | | Russell 2000 Index | | | 7,040,400 | | | | 5,961 | |
| 9-19-2014 | | UBS | | 84 Long | | S&P 500 E-Mini Index | | | 8,405,880 | | | | 14,580 | |
| 9-19-2014 | | UBS | | 46 Long | | S&P Midcap 400 Index | | | 6,610,660 | | | | 21,652 | |
Diversified Stock Portfolio had an average notional amount of $182,525,343 in long futures contracts during the six months ended August 31, 2014. As of August 31, 2014, Diversified Stock Portfolio had segregated $14,338,972 as cash collateral for open futures contracts.
The receivable and payable for daily variation margin on open futures contracts reflected in the Statements of Assets and Liabilities only represents the current day’s variation margin. The realized gains and change in unrealized gains (losses) on futures contracts are reflected in the Statements of Operations.
For certain types of derivative transactions, Diversified Stock Portfolio has entered into International Swaps and Derivatives Association, Inc. master agreements (“ISDA Master Agreements”) or similar agreements with approved counterparties. The ISDA Master Agreements or similar agreements may have requirements to deliver/deposit securities or cash to/with an exchange or broker-dealer as collateral and allows the Diversified Stock Portfolio to offset, with each counterparty, certain derivative financial instrument’s assets and/or liabilities with collateral held or pledged. Collateral requirements differ by type of derivative. Collateral or margin requirements are set by the broker or exchange clearing house for exchange traded derivatives while collateral terms are contract specific for over-the-counter traded derivatives. Cash collateral that has been pledged to cover obligations of the Diversified Stock Portfolio under ISDA Master Agreements or similar agreements, if any, will be reported separately in the Statements of Assets and Liabilities. Securities pledged as collateral, if any, for the same purpose are noted in the Summary Portfolio of Investments. With respect to balance sheet offsetting, absent an event of default by the counterparty or a termination of the agreement, the reported amounts of financial assets and financial liabilities in the Statements of Assets and Liabilities are not offset across transactions between the Diversified Stock Portfolio and the applicable counterparty. A reconciliation of the gross amounts on the Statements of Assets and Liabilities to the net amounts by derivative type, including any collateral exposure, is as follows:
| | | | | | | | | | | | | | | | |
| Derivative type | | Counterparty | | Gross amounts
of assets in the
Statement of
Assets and
Liabilities | | Amounts
subject to
netting
agreements | | | Collateral
received | | | Net amount | |
Futures – variation margin | | UBS | | $88,560 | | $ | (47,800 | ) | | $ | 0 | | | $ | 40,760 | |
| | | | | | | | | | | | | | | | |
| Derivative type | | Counterparty | | Gross amounts
of liabilities in the
Statement of
Assets and
Liabilities | | Amounts
subject to
netting
agreements | | | Collateral
pledged | | | Net amount | |
Futures – variation margin | | UBS | | $47,800 | | $ | (47,800 | ) | | $ | 0 | | | $ | 0 | |
7. INDEMNIFICATION
Under the Trust’s organizational documents, the officers and Trustees are indemnified against certain liabilities that may arise out of performance of their duties to the Trust. Additionally, in the normal course of business, the Trust may enter into contracts with service providers that contain a variety of indemnification clauses. The Trust’s maximum exposure under these arrangements is dependent on future claims that may be made against the Portfolios and, therefore, cannot be estimated.
| | | | |
| 122 | | Wells Fargo Advantage Dow Jones Target Date Funds | | Other information (unaudited) |
PROXY VOTING INFORMATION
A description of the policies and procedures used to determine how to vote proxies relating to portfolio securities is available without charge, upon request, by calling 1-800-222-8222, visiting our website at wellsfargoadvantagefunds.com, or visiting the SEC website at sec.gov. Information regarding how the proxies related to portfolio securities were voted during the most recent 12-month period ended June 30 is available without charge on the website at wellsfargoadvantagefunds.com or by visiting the SEC website at sec.gov.
SPECIAL MEETING OF SHAREHOLDERS
On May 5, 2014, a Special Meeting of Shareholders for each Fund was held to consider the following proposal. The results of the proposal are indicated below.
Proposal – To approve a new investment sub-advisory agreement with Global Index Advisors, Inc.:
| | | | | | | | | | | | |
| | | Net assets voted
“For” | | | Net assets voted
“Against” | | | Net assets voted
“Abstain” | |
| Dow Jones Target Today Fund | | $ | 497,986,944 | | | $ | 1,083,040 | | | $ | 33,615,798 | |
| Dow Jones Target 2010 Fund | | | 335,948,810 | | | | 2,184,546 | | | | 53,200,850 | |
| Dow Jones Target 2015 Fund | | | 485,190,864 | | | | 8,440,350 | | | | 80,468,245 | |
| Dow Jones Target 2020 Fund | | | 1,310,578,751 | | | | 8,586,121 | | | | 181,494,401 | |
| Dow Jones Target 2025 Fund | | | 1,466,359,100 | | | | 3,296,299 | | | | 108,098,506 | |
| Dow Jones Target 2030 Fund | | | 1,316,435,791 | | | | 4,406,421 | | | | 177,784,709 | |
| Dow Jones Target 2035 Fund | | | 668,368,913 | | | | 2,937,014 | | | | 81,013,788 | |
| Dow Jones Target 2040 Fund | | | 895,817,212 | | | | 17,117,749 | | | | 136,784,027 | |
| Dow Jones Target 2045 Fund | | | 374,348,109 | | | | 1,858,290 | | | | 41,590,080 | |
| Dow Jones Target 2050 Fund | | | 758,370,644 | | | | 1,921,244 | | | | 63,128,430 | |
| Dow Jones Target 2055 Fund | | | 64,287,169 | | | | 112,420 | | | | 14,790,814 | |
PORTFOLIO HOLDINGS INFORMATION
The complete portfolio holdings are publicly available on the website (wellsfargoadvantagefunds.com) on a monthly, 30-day or more delayed basis. In addition, top ten holdings information is publicly available on the website on a monthly, seven-day or more delayed basis. Each Fund and Portfolio files its complete schedule of portfolio holdings with the SEC for the first and third quarters of each fiscal year on Form N-Q, which is available without charge by visiting the SEC website at sec.gov. In addition, each Form N-Q may be reviewed and copied at the SEC’s Public Reference Room in Washington, DC, and at regional offices in New York City, at 233 Broadway, and in Chicago, at 175 West Jackson Boulevard, Suite 900. Information about the Public Reference Room may be obtained by calling 1-800-SEC-0330.
| | | | | | |
| Other information (unaudited) | | Wells Fargo Advantage Dow Jones Target Date Funds | | | 123 | |
BOARD OF TRUSTEES AND OFFICERS
Each of the Trustees and Officers1 listed in the table below acts in identical capacities for each fund in the Wells Fargo Advantage family of funds, which consists of 133 mutual funds comprising the Wells Fargo Funds Trust, Wells Fargo Variable Trust, Wells Fargo Master Trust and four closed-end funds (collectively the “Fund Complex”). This table should be read in conjunction with the Prospectus and the Statement of Additional Information2. The mailing address of each Trustee and Officer is 525 Market Street, 12th Floor, San Francisco, CA 94105. Each Trustee and Officer serves an indefinite term, however, each Trustee serves such term until reaching the mandatory retirement age established by the Trustees.
Independent Trustees
| | | | | | |
Name and year of birth | | Position held and length of service* | | Principal occupations during past five years or longer | | Other directorships during past five years |
| Peter G. Gordon (Born 1942) | | Trustee, since 1998; Chairman, since 2005 | | Co-Founder, Retired Chairman, President and CEO of Crystal Geyser Water Company. Trustee Emeritus, Colby College. | | Asset Allocation Trust |
| Isaiah Harris, Jr. (Born 1952) | | Trustee, since 2009 | | Retired. Prior thereto, President and CEO of BellSouth Advertising and Publishing Corp. from 2005 to 2007, President and CEO of BellSouth Enterprises from 2004 to 2005 and President of BellSouth Consumer Services from 2000 to 2003. Emeritus member of the Iowa State University Foundation Board of Governors. Emeritus Member of the Advisory Board of Iowa State University School of Business. Advisory Board Member, Palm Harbor Academy. Mr. Harris is a certified public accountant. | | CIGNA Corporation; Asset Allocation Trust |
| Judith M. Johnson (Born 1949) | | Trustee, since 2008; Audit Committee Chairman, since 2008 | | Retired. Prior thereto, Chief Executive Officer and Chief Investment Officer of Minneapolis Employees Retirement Fund from 1996 to 2008. Ms. Johnson is an attorney, certified public accountant and a certified managerial accountant. | | Asset Allocation Trust |
| Leroy Keith, Jr. (Born 1939) | | Trustee, since 2010 | | Chairman, Bloc Global Services (development and construction). Trustee of the Evergreen Funds complex (and its predecessors) from 1983 to 2010. Former Managing Director, Almanac Capital Management (commodities firm), former Partner, Stonington Partners, Inc. (private equity fund), former Director, Obagi Medical Products Co. and former Director, Lincoln Educational Services. | | Trustee, Virtus Fund Complex (consisting of 50 portfolios as of 12/16/2013); Asset Allocation Trust |
| David F. Larcker (Born 1950) | | Trustee, since 2009 | | James Irvin Miller Professor of Accounting at the Graduate School of Business, Stanford University, Morgan Stanley Director of the Center for Leadership Development and Research and Senior Faculty of The Rock Center for Corporate Governance since 2006. From 2005 to 2008, Professor of Accounting at the Graduate School of Business, Stanford University. Prior thereto, Ernst & Young Professor of Accounting at The Wharton School, University of Pennsylvania from 1985 to 2005. | | Asset Allocation Trust |
| Olivia S. Mitchell (Born 1953) | | Trustee, since 2006 | | International Foundation of Employee Benefit Plans Professor, Wharton School of the University of Pennsylvania since 1993. Director of Wharton’s Pension Research Council and Boettner Center on Pensions & Retirement Research, and Research Associate at the National Bureau of Economic Research. Previously, Cornell University Professor from 1978 to 1993. | | Asset Allocation Trust |
| Timothy J. Penny (Born 1951) | | Trustee, since 1996 | | President and CEO of Southern Minnesota Initiative Foundation, a non-profit organization, since 2007 and Senior Fellow at the Humphrey Institute Policy Forum at the University of Minnesota since 1995. Member of the Board of Trustees of NorthStar Education Finance, Inc., a non-profit organization, since 2007. | | Asset Allocation Trust |
| | | | |
| 124 | | Wells Fargo Advantage Dow Jones Target Date Funds | | Other information (unaudited) |
| | | | | | |
Name and year of birth | | Position held and length of service* | | Principal occupations during past five years or longer | | Other directorships during past five years |
| Michael S. Scofield (Born 1943) | | Trustee, since 2010 | | Served on the Investment Company Institute’s Board of Governors and Executive Committee from 2008-2011 as well the Governing Council of the Independent Directors Council from 2006-2011 and the Independent Directors Council Executive Committee from 2008-2011. Chairman of the IDC from 2008-2010. Institutional Investor (Fund Directions) Trustee of Year in 2007. Trustee of the Evergreen Funds complex (and its predecessors) from 1984 to 2010. Chairman of the Evergreen Funds from 2000-2010. Former Trustee of the Mentor Funds. Retired Attorney, Law Offices of Michael S. Scofield. | | Asset Allocation Trust |
| Donald C. Willeke (Born 1940) | | Trustee, since 1996 | | Principal of the law firm of Willeke & Daniels. General Counsel of the Minneapolis Employees Retirement Fund from 1984 until its consolidation into the Minnesota Public Employees Retirement Association on June 30, 2010. Director and Vice Chair of The Tree Trust (non-profit corporation). Director of the American Chestnut Foundation (non-profit corporation). | | Asset Allocation Trust |
| * | Length of service dates reflect the Trustee’s commencement of service with the Trust’s predecessor entities, where applicable. |
Officers
| | | | | | |
Name and year of birth | | Position held and length of service | | Principal occupations during past five years or longer | | |
| Karla M. Rabusch (Born 1959) | | President, since 2003 | | Executive Vice President of Wells Fargo Bank, N.A. and President of Wells Fargo Funds Management, LLC since 2003. | | |
| Jeremy DePalma1 (Born 1974) | | Treasurer, since 2012 | | Senior Vice President of Wells Fargo Funds Management, LLC since 2009. Senior Vice President of Evergreen Investment Management Company, LLC from 2008 to 2010. Vice President, Evergreen Investment Services, Inc. from 2004 to 2007. Head of the Fund Reporting and Control Team within Fund Administration from 2005 to 2010. | | |
| C. David Messman (Born 1960) | | Secretary, since 2000; Chief Legal Officer, since 2003 | | Assistant General Counsel of Wells Fargo Bank, N.A. since 2013 and Vice President and Managing Counsel of Wells Fargo Bank N.A. from 1996 to 2013. Senior Vice President and Secretary of Wells Fargo Funds Management , LLC since 2001. | | |
Debra Ann Early
(Born 1964) | | Chief Compliance Officer, since 2007 | | Senior Vice President and Chief Compliance Officer of Wells Fargo Funds Management, LLC since 2007. Chief Compliance Officer of Parnassus Investments from 2005 to 2007. Chief Financial Officer of Parnassus Investments from 2004 to 2007. | | |
David Berardi
(Born 1975) | | Assistant Treasurer, since 2009 | | Vice President of Wells Fargo Funds Management, LLC since 2009. Vice President of Evergreen Investment Management Company, LLC from 2008 to 2010. Assistant Vice President of Evergreen Investment Services, Inc. from 2004 to 2008. Manager of Fund Reporting and Control for Evergreen Investment Management Company, LLC from 2004 to 2010. | | |
| 1. | Jeremy DePalma acts as Treasurer of 60 funds and Assistant Treasurer of 73 funds in the Fund Complex. |
| 2. | The Statement of Additional Information includes additional information about the Trustees and is available, without charge, upon request, by calling 1-800-222-8222 or by visiting the website at wellsfargoadvantagefunds.com. |
| | | | | | |
| Other information (unaudited) | | Wells Fargo Advantage Dow Jones Target Date Funds | | | 125 | |
BOARD CONSIDERATION OF INVESTMENT ADVISORY AND SUB-ADVISORY AGREEMENTS:
Wells Fargo Advantage Dow Jones Target Today Fund, Wells Fargo Advantage Dow Jones Target 2010 Fund, Wells Fargo Advantage Dow Jones Target 2015 Fund, Wells Fargo Advantage Dow Jones Target 2020 Fund, Wells Fargo Advantage Dow Jones Target 2025 Fund, Wells Fargo Advantage Dow Jones Target 2030 Fund, Wells Fargo Advantage Dow Jones Target 2035 Fund, Wells Fargo Advantage Dow Jones Target 2040 Fund, Wells Fargo Advantage Dow Jones Target 2045 Fund, Wells Fargo Advantage Dow Jones Target 2050 Fund, Wells Fargo Advantage Dow Jones Target 2055 Fund, Wells Fargo Advantage Diversified Fixed Income Portfolio, Wells Fargo Advantage Diversified Stock Portfolio, Wells Fargo Advantage Short-Term
Investment Portfolio
Under Section 15 of the Investment Company Act of 1940 (the “1940 Act”), the Board of Trustees (each, a “Board” and collectively, the “Boards”) of each of Wells Fargo Funds Trust (“Funds Trust”) and Wells Fargo Master Trust (“Master Trust”) (collectively, the “Trusts”), all the members of which have no direct or indirect interest in the investment advisory and sub-advisory agreements and are not “interested persons” of the Trusts, as defined in the 1940 Act (the “Independent Trustees”), must determine whether to approve the continuation of the Trusts’ investment advisory and sub-advisory agreements. In this regard, at in-persons meetings held on March 27-28, 2014 (the “March Meeting”) and May 15-16, 2014 (the “May Meeting”, and together with the March Meeting, the “Meetings”), the Funds Trust Board reviewed an investment advisory agreement with Wells Fargo Funds Management, LLC (“Funds Management”) for each of the Wells Fargo Advantage Dow Jones Target Today Fund, Wells Fargo Advantage Dow Jones Target 2010 Fund, Wells Fargo Advantage Dow Jones Target 2015 Fund, Wells Fargo Advantage Dow Jones Target 2020 Fund, Wells Fargo Advantage Dow Jones Target 2025 Fund, Wells Fargo Advantage Dow Jones Target 2030 Fund, Wells Fargo Advantage Dow Jones Target 2035 Fund, Wells Fargo Advantage Dow Jones Target 2040 Fund, Wells Fargo Advantage Dow Jones Target 2045 Fund, Wells Fargo Advantage Dow Jones Target 2050 Fund and Wells Fargo Advantage Dow Jones Target 2055 Fund (individually, the “Target Date Fund” and collectively, the “Target Date Funds”). The Master Trust Board reviewed an investment advisory agreement with Funds Management for each of Wells Fargo Advantage Diversified Fixed Income Portfolio, Wells Fargo Advantage Diversified Stock Portfolio and Wells Fargo Advantage Short-Term Investment Portfolio (the “Master Portfolios”). The Target Date Funds and the Master Portfolios are collectively referred to as the “Funds.”
The Funds Trust Board also reviewed an investment sub-advisory agreement with Global Index Advisors, Inc. (“GIA”) for the Target Date Funds. The Master Trust Board also reviewed: an investment sub-advisory agreement with (i) SSgA Funds Management, Inc. (“SSgA”) for Wells Fargo Advantage Diversified Fixed Income Portfolio and Wells Fargo Advantage Diversified Stock Portfolio; and (ii) Wells Capital Management Incorporated (“WellsCap”) for the Wells Fargo Advantage Short-Term Investment Portfolio. The investment advisory agreements with Funds Management and the investment sub-advisory agreements with WellsCap, GIA and SSgA (collectively, the “Sub-Advisers”) are collectively referred to as the “Advisory Agreements.” The Target Date Funds are gateway blended funds that each invests all of their assets in the Master Portfolios.
At each of the March Meeting and the May Meeting, the Boards received the information, considered the factors and reached the conclusions discussed below, and unanimously approved the renewal of the Advisory Agreements.
At the Meetings, the Boards considered the factors and reached the conclusions described below relating to the selection of Funds Management and the Sub-Advisers and the continuation of the Advisory Agreements. Prior to the Meetings, the Trustees conferred extensively among themselves and with representatives of Funds Management about these matters. Also, the Boards have adopted a team-based approach, with each team consisting of a sub-set of Trustees, to assist the Boards in the discharge of their duties in reviewing performance and other matters throughout the year. The Independent Trustees were assisted in their evaluation of the Advisory Agreements by independent legal counsel, from whom they received separate legal advice and with whom they met separately.
In providing information to the Boards, Funds Management and the Sub-Advisers were guided by a detailed set of requests for information submitted to them by independent legal counsel on behalf of the Independent Trustees at the start of the Boards’ annual contract renewal process earlier in 2014. In considering and approving the Advisory Agreements, the Trustees considered the information they believed relevant, including but not limited to the information discussed below. The Boards considered not only the specific information presented in connection with the Meetings, but also the knowledge gained over time through interaction with Funds Management and the Sub-Advisers about various topics. In this regard, the Boards reviewed reports of Funds Management at each of their quarterly meetings, which included, among other things, portfolio reviews and performance reports. In addition, the Boards and the teams mentioned above confer with portfolio managers at various times throughout the year. The Boards did not identify any particular information or consideration that was all-important or controlling, and each individual Trustee may have attributed different weights to various factors.
| | | | |
| 126 | | Wells Fargo Advantage Dow Jones Target Date Funds | | Other information (unaudited) |
After their deliberations, the Boards unanimously approved the continuation of the Advisory Agreements and determined that the compensation payable to Funds Management and the Sub-Advisers is reasonable. The Boards considered the continuation of the Advisory Agreements for the Funds as part of their consideration of the continuation of advisory agreements for funds across the complex, but their approvals were made on a fund-by-fund basis. The following summarizes a number of important, but not necessarily all, factors considered by the Boards in support of their approvals.
Nature, extent and quality of services
The Boards received and considered various information regarding the nature, extent and quality of services provided to the Funds by Funds Management and the Sub-Advisers under the Advisory Agreements. This information included, among other things, a summary of the background and experience of senior management of Funds Management, and the qualifications, background, tenure and responsibilities of each of the portfolio managers primarily responsible for the day-to-day portfolio management of the Funds.
The Boards evaluated the ability of Funds Management and the Sub-Advisers to attract and retain qualified investment professionals, including research, advisory and supervisory personnel. The Boards further considered the compliance programs and compliance records of Funds Management and the Sub-Advisers. In addition, the Boards took into account the full range of services provided to the Funds by Funds Management and its affiliates.
Fund performance and expenses
The Boards considered the performance results for each of the Funds over various time periods ended December 31, 2013. The Boards also considered these results in comparison to the performance of funds in a universe that was determined by Lipper Inc. (“Lipper”) to be similar to the respective Funds (each, a “Universe”), and in comparison to each Fund’s benchmark index and to other comparative data. Lipper is an independent provider of investment company data. The Boards received a description of the methodology used by Lipper to select the mutual funds in each performance Universe.
The Funds Trust Board noted that the performance of each Target Date Fund (Administrator Class) relative to its respective Universe was as follows: (i) the performance of each of the Target 2015 Fund, the Target 2020 Fund and the Target 2025 Fund was lower than the average performance of its respective Universe for all periods under review; (ii) the performance of each of the Target 2010 Fund, the Target 2030 Fund and the Target Today Fund was higher than or in range of the average performance of its respective Universe for the ten-year period under review, but lower than the average performance of its respective universe for all other periods under review; (iii) the performance of the Target 2035 Fund was in range of the average performance of its respective Universe for the five-year period under review, but lower than the average performance of its respective universe for all other periods under review; (iv) and the performance of each of the Target 2040 Fund, the Target 2045 Fund, the Target 20500 Fund and the Target 2055 Fund was higher than or in range of the average performance of its respective Universe for all periods under review.
The Funds Trust Board also noted that the performance of each Target Date Fund (Administrator Class) was lower than the performance of its respective benchmark index for all periods under review.
The Funds Trust Board noted that the underperformance of the Target Date Funds relative to the respective Universe and benchmark for the periods noted above warranted further discussion. As part of its further review, the Funds Trust Board received information concerning, and discussed factors contributing to, the underperformance for those periods. Funds Management advised the Funds Trust Board that the nearer-dated Target Date Funds have some of the more conservative glidepaths in the industry, and as a result had a lower allocation to equities compared to funds in each respective Target Date Fund’s Universe. Thus, the Funds Trust Board was advised that underperformance of the nearer-dated Target Date Funds relative to their respective Universes was to be expected during periods in which the equity markets posted strong gains. The Funds Trust Board noted that the Target Date Funds’ underperformance relative to their benchmarks was largely attributable to fees charged to the Target Date Funds (which are not charged to a benchmark index).
The Master Trust Board took note of the performance of the Master Portfolios. The Master Trust Board noted that the performance of the Diversified Stock Portfolio was in range of the average performance of its Universe for the five-year period under review and lower than the average performance of its Universe for the one- and three-year periods under review. The Master Trust Board also noted that the performance of the Diversified Stock Portfolio was in range of the performance of its benchmark, the Dow Jones Stock CMAC, for all periods under review. The Master Trust Board was apprised that the underperformance of the Diversified Fixed Stock Portfolio relative to its Universe for the periods noted was largely attributable to sector allocation.
The Master Trust Board noted that the performance of the Diversified Fixed Income Portfolio was lower than the average performance of its Universe and its benchmark, the Dow Jones Bond CMAC Index, for all periods under review. The
| | | | | | |
| Other information (unaudited) | | Wells Fargo Advantage Dow Jones Target Date Funds | | | 127 | |
Master Trust Board was apprised that the underperformance of the Diversified Fixed Income Portfolio relative to its Universe and benchmark for all periods under review was largely attributable to sector allocation and the narrow performance range of the Universe.
The Master Trust Board also noted that the performance of the Short-Term Investment Portfolio was lower than the average performance of its Universe for all periods under review and in range of the performance of its benchmark, the Barclays U.S. T-Bill 1-3 Month Index, for all periods under review. The Master Trust Board was apprised that the underperformance of the Short-Term Investment Portfolio relative to its Universe for all periods under review was largely attributable to the fact that the Fund is managed using a money market strategy which is different than the ultra-short bond funds in its Universe.
The Funds Trust Board also received and considered information regarding each Target Date Fund’s net operating expense ratios, which include fees and expenses of the corresponding Master Portfolio, and their various components, including actual management fees assessed at both the Target Date Fund level and the Master Portfolio level (which reflect fee waivers, if any, and include advisory, administration and transfer agent fees), custodian and other non-management fees, Rule 12b-1 and non-Rule 12b-1 service fees and fee waiver and expense reimbursement arrangements. The Funds Trust Board considered these ratios in comparison to the median ratios of funds in class-specific expense groups that were determined by Lipper to be similar to each Target Date Fund (the “Groups”). The Funds Trust Board received a description of the methodology used by Lipper to select the mutual funds in the expense Groups and an explanation of year-to-year variations in the funds comprising such expense Groups and their expense ratios. Based on the Lipper reports, the Funds Trust Board noted that the net operating expense ratios of each Target Date Fund were lower than or in range of the median net operating expense ratios of its respective expense Groups for all share classes.
With respect to the Master Portfolios, the Master Trust Board reviewed the fee rates that are payable to Funds Management for investment advisory services (as discussed below), which are the only fees charged at the Master Portfolio level, relative to a corresponding expense Group.
Based on their consideration of the factors and information they deemed relevant, including those described here, the Boards concluded that the overall performance and expense structure of the Funds supported the re-approval of the Advisory Agreements.
Investment advisory and sub-advisory fee rates
The Boards reviewed and considered the contractual investment advisory fee rates that are payable by the Funds to Funds Management for investment advisory services (the “Advisory Agreement Rates”), both on a stand-alone basis and, with respect to the Target Date Funds, on a combined basis with each Target Date Fund’s fund-level and class-level contractual administration fee rates (the “Management Rates”). The Funds Trust Board noted that the administration fees payable to Funds Management include transfer agency and sub-transfer agency costs. The Boards also reviewed and considered the contractual investment sub-advisory fee rates that are payable by Funds Management to the Sub-Advisers for investment sub-advisory services (the “Sub-Advisory Agreement Rates”).
Among other information reviewed by the Funds Trust Board was a comparison of the Management Rates of each Target Date Fund, which do not include the advisory fees paid at the Master Portfolio level, with those of other funds in the expense Groups at a common asset level. The Funds Trust Board noted that the Management Rates of each Target Date Fund were lower than or in range of the average rates for its respective expense Groups for all share classes.
The Master Trust Board reviewed a comparison of the Advisory Agreement Rates of each Master Portfolio with those of other funds in each Master Portfolio’s respective expense Group at a common asset level. The Master Trust Board noted that the Advisory Agreement Rates of each Master Portfolio were lower than the median rate for the Master Portfolio’s respective expense Group.
The Boards also received and considered information about the portions of the total advisory fees that were retained by Funds Management after payment of the fees to the Sub-Advisers for sub-advisory services. With respect to the Target Date Funds, the Diversified Fixed Income Portfolio and the Diversified Stock Portfolio, the Boards considered this amount in comparison to the median amount retained by advisers to funds in a sub-advised expense universe that was determined by Lipper to be similar to the respective Fund. In assessing the reasonableness of these amounts, the Boards received and evaluated information about the nature and extent of responsibilities retained and risks assumed by Funds Management and not delegated to or assumed by the Sub-Advisers, and about Funds Management’s on-going oversight services. With respect to the Short-Term Investment Portfolio, given the affiliation between Funds Management and WellsCap, the Master Trust Board ascribed limited relevance to the allocation of the advisory fee between them. With respect to GIA and SSgA, the Boards considered that the Sub-Advisory Agreement Rates paid to each of these Sub-Advisers had been negotiated by Funds Management on an arm’s-length basis.
| | | | |
| 128 | | Wells Fargo Advantage Dow Jones Target Date Funds | | Other information (unaudited) |
The Boards also received and considered information about the nature and extent of services offered and fee rates charged by Funds Management and the Sub-Advisers to other types of clients with investment strategies similar to those of the Funds. In this regard, the Boards received information about the significantly greater scope of services, and compliance, reporting and other legal burdens and risks of managing mutual funds compared with those associated with managing assets of non-mutual fund clients such as collective funds or institutional separate accounts.
Based on their consideration of the factors and information they deemed relevant, including those described here, in light of the services covered by the Advisory Agreements, the Boards determined that the Advisory Agreement Rates and the Sub-Advisory Agreement Rates were reasonable.
Profitability
The Boards received and considered information concerning the profitability of Funds Management, as well as the profitability of Wells Fargo as a whole, from providing services to the Funds and the fund family as a whole. The Boards did not receive or consider to be necessary separate profitability information with respect to WellsCap because, as an affiliate of Funds Management, its profitability information was subsumed in the collective Wells Fargo profitability analysis. The Boards did not receive or consider profitability information with respect to GIA or SSgA, as the sub-advisory fees paid to them had been negotiated by Funds Management on an arm’s-length basis.
Funds Management explained the methodologies and estimates that it used in calculating profitability. Among other things, the Boards noted that the levels of profitability reported on a fund-by-fund basis varied widely, depending on factors such as the size and type of fund. Based on their review, the Boards did not deem the profits reported by Funds Management to be at a level that would prevent them from approving the continuation of the Advisory Agreements.
Economies of scale
With respect to possible economies of scale, the Boards noted the existence of breakpoints in each Fund’s advisory fee and administration fee structure (except Short-Term Investment Portfolio), which operate generally to reduce the Funds’ expense ratios as the Funds grow in size. They considered that, for a small fund or a fund that shrinks in size, breakpoints conversely can result in higher fee levels. The Funds Trust Board also took into account an agreed-upon revision to the advisory fee schedule for each Target Date Fund that adds an additional break point. The Boards also considered that fee waiver and expense reimbursement arrangements and competitive fee rates at the outset are means of sharing potential economies of scale with shareholders of the Funds and the fund family as a whole. The Boards considered Funds Management’s view that any analyses of potential economies of scale in managing a particular fund are inherently limited in light of the joint and common costs and investments that Funds Management incurs across the fund family as a whole.
The Boards concluded that the Funds’ fee and expense arrangements, including contractual breakpoints, constituted a reasonable approach to sharing potential economies of scale with the Funds and their shareholders.
Other benefits to Funds Management and the Sub-Advisers
The Boards received and considered information regarding potential “fall-out” or ancillary benefits received by Funds Management and its affiliates, including WellsCap, or GIA or SSgA as a result of their relationships with the Funds. Ancillary benefits could include, among others, benefits directly attributable to other relationships with the Funds and benefits potentially derived from an increase in Funds Management’s and the Sub-Advisers’ business as a result of their relationships with the Funds. The Boards noted that various affiliates of Funds Management may receive distribution-related fees, shareholder servicing payments and sub-transfer agency fees in respect of shares sold or held through them and services provided.
The Boards also reviewed information about soft dollar credits earned and utilized by the Sub-Advisers, fees earned by Funds Management and WellsCap from managing a private investment vehicle for the fund family’s securities lending collateral and commissions earned by an affiliated broker from portfolio transactions.
Based on their consideration of the factors and information they deemed relevant, including those described here, the Boards did not find that any ancillary benefits received by Funds Management and its affiliates, including WellsCap, or GIA or SSgA or were unreasonable.
Conclusion
After considering the above-described factors and based on their deliberations and their evaluation of the information described above, the Boards unanimously approved the continuation of the Advisory Agreements for an additional one-year period and determined that the compensation payable to Funds Management and the Sub-Advisers is reasonable.
| | | | | | |
| List of abbreviations | | Wells Fargo Advantage Dow Jones Target Date Funds | | | 129 | |
The following is a list of common abbreviations for terms and entities that may have appeared in this report.
| ACA | — ACA Financial Guaranty Corporation |
| ADR | — American depositary receipt |
| ADS | — American depositary shares |
| AGC | — Assured Guaranty Corporation |
| AGM | — Assured Guaranty Municipal |
| Ambac | — Ambac Financial Group Incorporated |
| AMT | — Alternative minimum tax |
| BAN | — Bond anticipation notes |
| BHAC | — Berkshire Hathaway Assurance Corporation |
| CAB | — Capital appreciation bond |
| CCAB | — Convertible capital appreciation bond |
| CDA | — Community Development Authority |
| CDO | — Collateralized debt obligation |
| DRIVER | — Derivative inverse tax-exempt receipts |
| DW&P | — Department of Water & Power |
| DWR | — Department of Water Resources |
| ECFA | — Educational & Cultural Facilities Authority |
| EDA | — Economic Development Authority |
| EDFA | — Economic Development Finance Authority |
| ETF | — Exchange-traded fund |
| FDIC | — Federal Deposit Insurance Corporation |
| FFCB | — Federal Farm Credit Banks |
| FGIC | — Financial Guaranty Insurance Corporation |
| FHA | — Federal Housing Administration |
| FHLB | — Federal Home Loan Bank |
| FHLMC | — Federal Home Loan Mortgage Corporation |
| FICO | — The Financing Corporation |
| FNMA | — Federal National Mortgage Association |
| GDR | — Global depositary receipt |
| GNMA | — Government National Mortgage Association |
| HCFR | — Healthcare facilities revenue |
| HEFA | — Health & Educational Facilities Authority |
| HEFAR | — Higher education facilities authority revenue |
| HFA | — Housing Finance Authority |
| HFFA | — Health Facilities Financing Authority |
| HUD | — Department of Housing and Urban Development |
| IDA | — Industrial Development Authority |
| IDAG | — Industrial Development Agency |
| KRW | — Republic of Korea won |
| LIBOR | — London Interbank Offered Rate |
| LLC | — Limited liability company |
| LLLP | — Limited liability limited partnership |
| LLP | — Limited liability partnership |
| MBIA | — Municipal Bond Insurance Association |
| MFHR | — Multifamily housing revenue |
| MSTR | — Municipal securities trust receipts |
| MUD | — Municipal Utility District |
| National | — National Public Finance Guarantee Corporation |
| PCFA | — Pollution Control Financing Authority |
| PCL | — Public Company Limited |
| PCR | — Pollution control revenue |
| PFA | — Public Finance Authority |
| PFFA | — Public Facilities Financing Authority |
| PFOTER | — Puttable floating option tax-exempt receipts |
| plc | — Public limited company |
| PUTTER | — Puttable tax-exempt receipts |
| R&D | — Research & development |
| Radian | — Radian Asset Assurance |
| RAN | — Revenue anticipation notes |
| RDA | — Redevelopment Authority |
| RDFA | — Redevelopment Finance Authority |
| REIT | — Real estate investment trust |
| ROC | — Reset option certificates |
| SAVRS | — Select auction variable rate securities |
| SBA | — Small Business Authority |
| SFHR | — Single-family housing revenue |
| SFMR | — Single-family mortgage revenue |
| SPA | — Standby purchase agreement |
| SPDR | — Standard & Poor’s Depositary Receipts |
| STRIPS | — Separate trading of registered interest and principal securities |
| TAN | — Tax anticipation notes |
| TIPS | — Treasury inflation-protected securities |
| TRAN | — Tax revenue anticipation notes |
| TTFA | — Transportation Trust Fund Authority |
| TVA | — Tennessee Valley Authority |
This page is intentionally left blank.
This page is intentionally left blank.
This page is intentionally left blank.


For more information
More information about Wells Fargo Advantage Funds is available free upon request. To obtain literature, please write, email, visit the Fund’s website, or call:
Wells Fargo Advantage Funds
P.O. Box 8266
Boston, MA 02266-8266
Email: wfaf@wellsfargo.com
Website: wellsfargoadvantagefunds.com
Individual investors: 1-800-222-8222
Retail investment professionals: 1-888-877-9275
Institutional investment professionals: 1-866-765-0778
This report and the financial statements contained herein are submitted for the general information of the shareholders of Wells Fargo Advantage Funds. If this report is used for promotional purposes, distribution of the report must be accompanied or preceded by a current prospectus. Before investing, please consider the investment objectives, risks, charges, and expenses of the investment. For a current prospectus and, if available, a summary prospectus, containing this information, call 1-800-222-8222 or visit the Fund’s website at wellsfargoadvantagefunds.com. Read the prospectus carefully before you invest or send money.
Wells Fargo Funds Management, LLC, a wholly owned subsidiary of Wells Fargo & Company, provides investment advisory and administrative services for Wells Fargo Advantage Funds. Other affiliates of Wells Fargo & Company provide subadvisory and other services for the Funds. The Funds are distributed by Wells Fargo Funds Distributor, LLC, Member FINRA/SIPC, an affiliate of Wells Fargo & Company.
NOT FDIC INSURED ¡ NO BANK GUARANTEE ¡ MAY LOSE VALUE
© 2014 Wells Fargo Funds Management, LLC. All rights reserved.
| | |
 | | 227666 10-14 SOFLD/SAR101 08-14 |
Not applicable.
| ITEM 3. | AUDIT COMMITTEE FINANCIAL EXPERT |
Not applicable.
| ITEM 4. | PRINCIPAL ACCOUNTANT FEES AND SERVICES |
Not applicable.
| ITEM 5. | AUDIT COMMITTEE OF LISTED REGISTRANTS |
Not applicable.
The Portfolio of investments is included as part of the report to shareholders filed under Item 1 of this Form.
| ITEM 7. | DISCLOSURE OF PROXY VOTING POLICIES AND PROCEDURES FOR CLOSED-END MANAGEMENT INVESTMENT COMPANIES |
Not applicable.
| ITEM 8. | PORTFOLIO MANAGERS OF CLOSED-END MANAGEMENT INVESTMENT COMPANIES |
Not applicable.
| ITEM 9. | PURCHASES OF EQUITY SECURITIES BY CLOSED-END MANAGEMEENT INVESTMENT COMPANY AND AFFILIATED PURCHASERS |
Not applicable.
| ITEM 10. | SUBMISSION OF MATTERS TO A VOTE OF SECURITY HOLDERS |
There have been no material changes to the procedures by which shareholders may recommend nominees to the Registrant’s board of trustees that have been implemented since the Registrant’s last provided disclosure in response to the requirements of this Item.
| ITEM 11. | CONTROLS AND PROCEDURES |
(a) The President and Treasurer have concluded that the Wells Fargo Funds Trust (the “Trust”) disclosure controls and procedures (as defined in Rule 30a-3(c) under the Investment Company Act of 1940) provide reasonable assurances that material information relating to the Trust is made known to them by the appropriate persons, based on their evaluation of these controls and procedures as of a date within 90 days of the filing of this report.
(b) There were no significant changes in the Trust’s internal controls over financial reporting (as defined in Rule 30a-3(d) under the Investment Company Act of 1940) that occurred during the second fiscal quarter of the period covered by this report that materially affected, or is reasonably likely to materially affect, the registrant’s internal control over financial reporting.
(a)(1) Not applicable.
(a)(2) Certification pursuant to Rule 30a-2(a) under the Investment Company Act of 1940 (17 CFR 270.30a-2(a)) is filed and attached hereto as Exhibit 99.CERT.
(a)(3) Not applicable.
(b) Certification pursuant to Rule 30a-2(b) under the Investment Company Act of 1940 (17 CFR 270.30a-2(b)) is filed and attached hereto as Exhibit 99.906CERT.
SIGNATURES
Pursuant to the requirements of the Securities Exchange Act of 1934 and the Investment Company Act of 1940, the registrant has duly caused this report to be signed on its behalf by the undersigned, thereunto duly authorized.
| | |
Wells Fargo Funds Trust |
| |
| By: | | |
| |
| | /s/ Karla M. Rabusch |
| |
| | Karla M. Rabusch |
| | President |
|
| Date: October 27, 2014 |
Pursuant to the requirements of the Securities Exchange Act of 1934 and the Investment Company Act of 1940, this report has been signed below by the following persons on behalf of the registrant and in the capacities and on the date indicated.
| | |
| Wells Fargo Funds Trust |
| |
| By: | | |
| |
| | /s/ Karla M. Rabusch |
| |
| | Karla M. Rabusch |
| | President |
|
| Date: October 27, 2014 |
| |
| By: | | |
| |
| | /s/ Jeremy DePalma |
| |
| | Jeremy DePalma |
| | Treasurer |
|
| Date: October 27, 2014 |