
UNITED STATES
SECURITIES AND EXCHANGE COMMISSION
Washington, D.C. 20549
FORM N-CSRS
CERTIFIED SHAREHOLDER REPORT OF REGISTERED
MANAGEMENT INVESTMENT COMPANIES
Investment Company Act file number: 811-09253
Wells Fargo Funds Trust
(Exact name of registrant as specified in charter)
525 Market St., San Francisco, CA 94105
(Address of principal executive offices) (Zip code)
C. David Messman
Wells Fargo Funds Management, LLC
525 Market St., San Francisco, CA 94105
(Name and address of agent for service)
Registrant’s telephone number, including area code: 800-222-8222
Date of fiscal year end: March 31 Registrant is making a filing for 9 of its series:
Wells Fargo Advantage Intrinsic Small Cap Value Fund, Wells Fargo Advantage Small Cap Opportunities Fund, Wells Fargo Advantage Small Cap Value Fund, Wells Fargo Advantage Small/Mid Cap Value Fund, Wells Fargo Advantage Special Small Cap Value Fund, Wells Fargo Advantage Traditional Small Cap Growth Fund, Wells Fargo Advantage Precious Metals Fund, Wells Fargo Advantage Specialized Technology Fund, and Wells Fargo Advantage Utility and Telecommunications Fund.
Date of reporting period: September 30, 2014
| ITEM 1. | REPORT TO STOCKHOLDERS |

Wells Fargo Advantage
Intrinsic Small Cap Value Fund

Semi-Annual Report
September 30, 2014

Reduce clutter. Save trees.
Sign up for electronic delivery of prospectuses and shareholder reports at wellsfargo.com/advantagedelivery
Contents
The views expressed and any forward-looking statements are as of September 30, 2014, unless otherwise noted, and are those of the Fund managers and/or Wells Fargo Funds Management, LLC. Discussions of individual securities, or the markets generally, or any Wells Fargo Advantage Fund are not intended as individual recommendations. Future events or results may vary significantly from those expressed in any forward-looking statements; the views expressed are subject to change at any time in response to changing circumstances in the market. Wells Fargo Funds Management, LLC and the Fund disclaim any obligation to publicly update or revise any views expressed or forward-looking statements.
NOT FDIC INSURED ¡ NO BANK GUARANTEE ¡ MAY LOSE VALUE
| | | | |
| 2 | | Wells Fargo Advantage Intrinsic Small Cap Value Fund | | Letter to shareholders (unaudited) |

Karla M. Rabusch
President
Wells Fargo Advantage Funds
Despite geopolitical challenges, U.S. economic numbers showed improvement.
Dear Valued Shareholder:
We are pleased to offer you this semi-annual report for the Wells Fargo Advantage Intrinsic Small Cap Value Fund for the six-month period that ended September 30, 2014. The period was marked by heightened geopolitical uncertainty as the U.S. and Europe continued to confront Russia over Ukraine and as Islamic militants (formerly known as ISIS) gained territory in Iraq and Syria. Toward the end of the reporting period, market volatility increased as renewed fears of slowing global growth took hold, and investors began to price in expectations that the U.S. Federal Reserve (Fed) was finally looking to raise short-term interest rates. Although mid-cap stocks (measured by the Russell Midcap® Index1) ended the period with a single-digit gain, small-cap stocks (measured by the Russell 2000® Index2) ended with a loss.
Major central banks continued to provide stimulus.
Throughout the reporting period, the Federal Open Market Committee (FOMC)—the U.S. Federal Reserve’s monetary policymaking body—kept its key interest rate near zero. Prior to the reporting period, in January 2014, the FOMC began to reduce (or taper) its bond-buying program by $10 billion per month and continued the taper throughout the reporting period. Some anticipated this action would lead to higher interest rates, however, interest rates followed a downward trend, despite short-term volatility. European markets continued to benefit from the European Central Bank’s (ECB’s) actions. In June 2014, the ECB announced a variety of measures aimed at encouraging lending, including cutting its key rate and imposing for the first time a negative interest rate on bank deposits held at the central bank. In September 2014, the ECB cut its key rate again—to 0.05%—and pushed the deposit rate for banks to -0.20%.
Although the geopolitical situation presented challenges, U.S. stock markets gained on positive economic data.
Geopolitical events were major obstacles throughout the reporting period. The ongoing standoff between the West (the U.S., Europe, and their allies) and Russia over Ukraine began in late 2013 and fed into stock market volatility early in 2014. The situation’s effect on the stock market faded as investors began to believe that the situation would not result in war, but as of September 2014, the situation had resulted in economic sanctions from the West against Russia. However, even as the market began to focus less on that situation, the advance of Islamic militants in Iraq and Syria led to airstrikes by the U.S. and its allies and fears of a regional war in the Middle East.
Despite geopolitical challenges, U.S. economic numbers showed improvement. The unemployment rate continued its slow improvement, declining from 6.3% in April 2014 to 5.9% in September 2014. Although investors received an unpleasant surprise when gross domestic product (GDP) growth for the first quarter of 2014 declined by 2.1% on an annualized basis, several commentators suggested that harsh winter weather may have dampened economic activity. Economic growth did accelerate in the second quarter of 2014, with an annualized GDP growth rate of 4.6%.
| 1. | The Russell Midcap® Index measures the performance of the 800 smallest companies in the Russell 1000® Index, which represent approximately 25% of the total market capitalization of the Russell 1000 Index. You cannot invest directly in an index. |
| 2. | The Russell 2000® Index measures the performance of the 2,000 smallest companies in the Russell 3000® Index, which represents approximately 8% of the total market capitalization of the Russell 3000 Index. You cannot invest directly in an index. |
| | | | | | |
| Letter to shareholders (unaudited) | | Wells Fargo Advantage Intrinsic Small Cap Value Fund | | | 3 | |
Investors’ positive outlook for the U.S. economy contributed to a solid domestic stock market for most of the period. However, slowing global economic growth, combined with renewed geopolitical concerns (including protests in Hong Kong), caused stock market weakness in September 2014. The Russell Midcap Index ended the period with a 3.2% gain. Small-cap stocks, however, were hit harder by the late-period uncertainty and the Russell 2000 Index ended with a -5.5% return. Growth stocks outperformed value stocks in both the small-cap and the mid-cap space.
Don’t let short-term uncertainty derail long-term investment goals.
Periods of uncertainty can present challenges, but experience has taught us that maintaining long-term investment goals can be an effective way to plan for the future. To help you create a sound strategy based on your personal goals and risk tolerance, Wells Fargo Advantage Funds offers more than 100 mutual funds and other investments spanning a wide range of asset classes and investment styles. Although diversification cannot guarantee an investment profit or prevent losses, we believe it can be an effective way to manage investment risk and potentially smooth out overall portfolio performance. We encourage investors to know their investments and to understand that appropriate levels of risk-taking may unlock opportunities.
Thank you for choosing to invest with Wells Fargo Advantage Funds. We appreciate your confidence in us and remain committed to helping you meet your financial needs. For current information about your fund investments, contact your investment professional, visit our website at wellsfargoadvantagefunds.com, or call us directly at 1-800-222-8222. We are available 24 hours a day, 7 days a week.
Sincerely,

Karla M. Rabusch
President
Wells Fargo Advantage Funds
Investors’ positive outlook for the U.S. economy contributed to a solid domestic stock market for most of the period.
| | | | |
| 4 | | Wells Fargo Advantage Intrinsic Small Cap Value Fund | | Performance highlights (unaudited) |
Investment objective
The Fund seeks long-term capital appreciation.
Adviser
Wells Fargo Funds Management, LLC
Subadviser
Metropolitan West Capital Management, LLC
Portfolio managers
Samir Sikka
Alex Alvarez, CFA
Average annual total returns1 (%) as of September 30, 2014
| | | | | | | | | | | | | | | | | | | | | | | | | | | | | | | | | | |
| | | | | Including sales charge | | | Excluding sales charge | | | Expense ratios2 (%) | |
| | | Inception date | | 1 year | | | 5 year | | | 10 year | | | 1 year | | | 5 year | | | 10 year | | | Gross | | | Net3 | |
| Class A (WFSMX) | | 3-31-2008 | | | 0.92 | | | | 12.39 | | | | 5.86 | | | | 7.06 | | | | 13.73 | | | | 6.49 | | | | 1.59 | | | | 1.41 | |
| Class C (WSCDX) | | 3-31-2008 | | | 5.28 | | | | 12.88 | | | | 5.75 | | | | 6.28 | | | | 12.88 | | | | 5.75 | | | | 2.34 | | | | 2.16 | |
| Administrator Class (WFSDX) | | 4-8-2005 | | | – | | | | – | | | | – | | | | 7.29 | | | | 14.00 | | | | 6.77 | | | | 1.43 | | | | 1.21 | |
| Institutional Class (WFSSX) | | 4-8-2005 | | | – | | | | – | | | | – | | | | 7.53 | | | | 14.25 | | | | 6.98 | | | | 1.16 | | | | 1.01 | |
| Investor Class (SCOVX) | | 3-28-2002 | | | – | | | | – | | | | – | | | | 6.98 | | | | 13.67 | | | | 6.46 | | | | 1.65 | | | | 1.47 | |
| Russell 2000® Value Index4 | | – | | | – | | | | – | | | | – | | | | 4.13 | | | | 13.02 | | | | 7.25 | | | | – | | | | – | |
Figures quoted represent past performance, which is no guarantee of future results, and do not reflect taxes that a shareholder may pay on fund distributions or the redemption of fund shares. Investment return and principal value of an investment will fluctuate so that an investor’s shares, when redeemed, may be worth more or less than their original cost. Performance shown without sales charges would be lower if sales charges were reflected. Current performance may be lower or higher than the performance data quoted, which assumes the reinvestment of dividends and capital gains. Current month-end performance is available on the Fund’s website, wellsfargoadvantagefunds.com.
Index returns do not include transaction costs associated with buying and selling securities, any mutual fund fees or expenses, or any taxes. It is not possible to invest directly in an index.
For Class A shares, the maximum front-end sales charge is 5.75%. For Class C shares, the maximum contingent deferred sales charge is 1.00%. Performance including a contingent deferred sales charge assumes the sales charge for the corresponding time period. Administrator Class, Institutional Class, and Investor Class shares are sold without a front-end sales charge or contingent deferred sales charge.
Stock values fluctuate in response to the activities of individual companies and general market and economic conditions. Smaller-company stocks tend to be more volatile and less liquid than those of larger companies. Certain investment strategies tend to increase the total risk of an investment (relative to the broader market). Consult the Fund’s prospectus for additional information on these and other risks.
Please see footnotes on page 5.
| | | | | | |
| Performance highlights (unaudited) | | Wells Fargo Advantage Intrinsic Small Cap Value Fund | | | 5 | |
| | | | |
| Ten largest equity holdings5 (%) as of September 30, 2014 | |
Kar Auction Services Incorporated | | | 3.85 | |
Office Depot Incorporated | | | 3.66 | |
AMN Healthcare Services Incorporated | | | 2.53 | |
Landstar System Incorporated | | | 2.45 | |
Pike Electric Corporation | | | 2.38 | |
DSW Incorporated Class A | | | 2.29 | |
Silgan Holdings Incorporated | | | 2.11 | |
Zions Bancorporation | | | 2.10 | |
FirstMerit Corporation | | | 2.04 | |
EVERTEC Incorporated | | | 2.02 | |
|
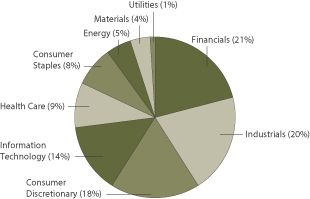
| Sector distribution6 as of September 30, 2014 |
|
 |
| 1. | Prior to June 1, 2010, the Fund was named Wells Fargo Advantage Small Cap Disciplined Fund. Metropolitan West Capital Management, LLC replaced Wells Capital Management as a subadviser for the Fund effective June 1, 2010. Accordingly, performance figures shown prior to June 1, 2010, do not reflect the principal investment strategies or performance of Metropolitan West Capital Management, LLC. Historical performance shown for Class A, Administrator Class, and Institutional Class shares prior to their inception reflects the performance of Investor Class shares, and includes the higher expenses applicable to Investor Class shares. If these expenses had not been included, returns would be higher. Historical performance shown for Class C shares prior to their inception reflects the performance of Investor Class shares and has been adjusted to reflect the higher expenses applicable to Class C shares. |
| 2. | Reflects the expense ratios as stated in the most recent prospectuses, which include the impact of 0.01% in acquired fund fees and expenses. The expense ratios shown are subject to change and may differ from the annualized expense ratios shown in the financial highlights of this report, which do not include acquired fund fees and expenses. |
| 3. | The Adviser has committed through July 31, 2015, to waive fees and/or reimburse expenses to the extent necessary to cap the Fund’s Total Annual Fund Operating Expenses After Fee Waiver, excluding certain expenses, at 1.40% for Class A, 2.15% for Class C, 1.20% for Administrator Class, 1.00% for Institutional Class, and 1.46% for Investor Class. After this time, the cap may be increased or the commitment to maintain the cap may be terminated only with the approval of the Board of Trustees. Brokerage commissions, stamp duty fees, interest, taxes, acquired fund fees and expenses, and extraordinary expenses are excluded from the cap. Without this cap, the Fund’s returns would have been lower. |
| 4. | The Russell 2000® Value Index measures the performance of those Russell 2000 companies with lower price-to-book ratios and lower forecasted growth values. You cannot invest directly in an index. |
| 5. | The ten largest equity holdings are calculated based on the value of the securities divided by total net assets of the Fund. Holdings are subject to change and may have changed since the date specified. |
| 6. | Sector distribution is subject to change and is calculated based on the total long-term investments of the Fund. |
| | | | |
| 6 | | Wells Fargo Advantage Intrinsic Small Cap Value Fund | | Fund expenses (unaudited) |
As a shareholder of the Fund, you incur two types of costs: (1) transaction costs, including sales charges (loads) on purchase payments and contingent deferred sales charges (if any) on redemptions and (2) ongoing costs, including management fees, distribution (12b-1) and/or shareholder service fees, and other Fund expenses. This example is intended to help you understand your ongoing costs (in dollars) of investing in the Fund and to compare these costs with the ongoing costs of investing in other mutual funds.
The example is based on an investment of $1,000 invested at the beginning of the six-month period and held for the entire period from April 1, 2014 to September 30, 2014.
Actual expenses
The “Actual” line of the table below provides information about actual account values and actual expenses. You may use the information in this line, together with the amount you invested, to estimate the expenses that you paid over the period. Simply divide your account value by $1,000 (for example, an $8,600 account value divided by $1,000 = 8.6), then multiply the result by the number in the “Actual” line under the heading entitled “Expenses paid during period” for your applicable class of shares to estimate the expenses you paid on your account during this period.
Hypothetical example for comparison purposes
The “Hypothetical” line of the table below provides information about hypothetical account values and hypothetical expenses based on the Fund’s actual expense ratio and an assumed rate of return of 5% per year before expenses, which is not the Fund’s actual return. The hypothetical account values and expenses may not be used to estimate the actual ending account balance or expenses you paid for the period. You may use this information to compare the ongoing costs of investing in the Fund and other funds. To do so, compare this 5% hypothetical example with the 5% hypothetical examples that appear in the shareholder reports of the other funds.
Please note that the expenses shown in the table are meant to highlight your ongoing costs only and do not reflect any transactional costs, such as sales charges (loads) and contingent deferred sales charges. Therefore, the “Hypothetical” line of the table is useful in comparing ongoing costs only and will not help you determine the relative total costs of owning different funds. In addition, if these transactional costs were included, your costs would have been higher.
| | | | | | | | | | | | | | | | |
| | | Beginning
account value
4-1-2014 | | | Ending
account value
9-30-2014 | | | Expenses
paid during
the period¹ | | | Net annualized
expense ratio | |
Class A | | | | | | | | | | | | | | | | |
Actual | | $ | 1,000.00 | | | $ | 980.02 | | | $ | 6.95 | | | | 1.40 | % |
Hypothetical (5% return before expenses) | | $ | 1,000.00 | | | $ | 1,018.05 | | | $ | 7.08 | | | | 1.40 | % |
Class C | | | | | | | | | | | | | | | | |
Actual | | $ | 1,000.00 | | | $ | 976.73 | | | $ | 10.65 | | | | 2.15 | % |
Hypothetical (5% return before expenses) | | $ | 1,000.00 | | | $ | 1,014.29 | | | $ | 10.86 | | | | 2.15 | % |
Administrator Class | | | | | | | | | | | | | | | | |
Actual | | $ | 1,000.00 | | | $ | 981.17 | | | $ | 5.96 | | | | 1.20 | % |
Hypothetical (5% return before expenses) | | $ | 1,000.00 | | | $ | 1,019.05 | | | $ | 6.07 | | | | 1.20 | % |
Institutional Class | | | | | | | | | | | | | | | | |
Actual | | $ | 1,000.00 | | | $ | 982.64 | | | $ | 4.97 | | | | 1.00 | % |
Hypothetical (5% return before expenses) | | $ | 1,000.00 | | | $ | 1,020.05 | | | $ | 5.06 | | | | 1.00 | % |
Investor Class | | | | | | | | | | | | | | | | |
Actual | | $ | 1,000.00 | | | $ | 979.83 | | | $ | 7.25 | | | | 1.46 | % |
Hypothetical (5% return before expenses) | | $ | 1,000.00 | | | $ | 1,017.75 | | | $ | 7.38 | | | | 1.46 | % |
| 1. | Expenses paid is equal to the annualized expense ratio of each class multiplied by the average account value over the period, multiplied by the number of days in the most recent fiscal half-year divided by the number of days in the fiscal year (to reflect the one-half-year period). |
| | | | | | |
| Portfolio of investments—September 30, 2014 (unaudited) | | Wells Fargo Advantage Intrinsic Small Cap Value Fund | | | 7 | |
| | | | | | | | | | | | |
| Security name | | | | | | Shares | | | Value | |
| | | | | | | | | | | | |
| | | | |
Common Stocks: 98.64% | | | | | | | | | | | | |
| | | | |
Consumer Discretionary: 17.51% | | | | | | | | | | | | |
| | | | |
| Hotels, Restaurants & Leisure: 4.84% | | | | | | | | | | | | |
Interval Leisure Group Incorporated | | | | | | | 141,650 | | | $ | 2,698,433 | |
Seaworld Entertainment Incorporated | | | | | | | 147,590 | | | | 2,838,156 | |
Six Flags Entertainment Corporation | | | | | | | 43,350 | | | | 1,490,807 | |
| | | | |
| | | | | | | | | | | 7,027,396 | |
| | | | | | | | | | | | |
| | | | |
| Household Durables: 1.17% | | | | | | | | | | | | |
Taylor Morrison Home Corporation Class A † | | | | | | | 104,826 | | | | 1,700,278 | |
| | | | | | | | | | | | |
| | | | |
| Multiline Retail: 1.02% | | | | | | | | | | | | |
Big Lots Incorporated | | | | | | | 34,550 | | | | 1,487,378 | |
| | | | | | | | | | | | |
| | | | |
| Specialty Retail: 10.48% | | | | | | | | | | | | |
Abercrombie & Fitch Company Class A | | | | | | | 50,900 | | | | 1,849,706 | |
Ann Incorporated † | | | | | | | 36,157 | | | | 1,487,137 | |
Ascena Retail Group Incorporated † | | | | | | | 138,000 | | | | 1,835,400 | |
Chico’s FAS Incorporated | | | | | | | 95,230 | | | | 1,406,547 | |
DSW Incorporated Class A | | | | | | | 110,590 | | | | 3,329,865 | |
Office Depot Incorporated † | | | | | | | 1,035,500 | | | | 5,322,470 | |
| | | | |
| | | | | | | | | | | 15,231,125 | |
| | | | | | | | | | | | |
| | | | |
Consumer Staples: 7.71% | | | | | | | | | | | | |
| | | | |
| Beverages: 1.75% | | | | | | | | | | | | |
Treasury Wine Estates ADR | | | | | | | 676,700 | | | | 2,537,625 | |
| | | | | | | | | | | | |
| | | | |
| Food Products: 5.96% | | | | | | | | | | | | |
Dean Foods Company « | | | | | | | 176,045 | | | | 2,332,596 | |
Flowers Foods Incorporated | | | | | | | 117,593 | | | | 2,159,007 | |
J & J Snack Foods Corporation | | | | | | | 16,200 | | | | 1,515,672 | |
Post Holdings Incorporated † | | | | | | | 80,100 | | | | 2,657,718 | |
| | | | |
| | | | | | | | | | | 8,664,993 | |
| | | | | | | | | | | | |
| | | | |
Energy: 5.35% | | | | | | | | | | | | |
| | | | |
| Energy Equipment & Services: 2.47% | | | | | | | | | | | | |
Forum Energy Technologies Incorporated † | | | | | | | 64,900 | | | | 1,986,589 | |
Helix Energy Solutions Group Incorporated † | | | | | | | 72,415 | | | | 1,597,475 | |
| | | | |
| | | | | | | | | | | 3,584,064 | |
| | | | | | | | | | | | |
| | | | |
| Oil, Gas & Consumable Fuels: 2.88% | | | | | | | | | | | | |
Energy XXI (Bermuda) Limited « | | | | | | | 113,750 | | | | 1,291,063 | |
Oasis Petroleum Incorporated † | | | | | | | 69,400 | | | | 2,901,614 | |
| | | | |
| | | | | | | | | | | 4,192,677 | |
| | | | | | | | | | | | |
| | | | |
Financials: 20.45% | | | | | | | | | | | | |
| | | | |
| Banks: 8.36% | | | | | | | | | | | | |
Associated Banc-Corp | | | | | | | 12,054 | | | | 209,981 | |
The accompanying notes are an integral part of these financial statements.
| | | | |
| 8 | | Wells Fargo Advantage Intrinsic Small Cap Value Fund | | Portfolio of investments—September 30, 2014 (unaudited) |
| | | | | | | | | | | | |
| Security name | | | | | | Shares | | | Value | |
| | | | | | | | | | | | |
| | | | |
| Banks (continued) | | | | | | | | | | | | |
Cathay General Bancorp | | | | | | | 61,730 | | | $ | 1,532,756 | |
FirstMerit Corporation | | | | | | | 168,450 | | | | 2,964,720 | |
Hancock Holding Company | | | | | | | 49,270 | | | | 1,579,104 | |
Umpqua Holdings Corporation | | | | | | | 170,640 | | | | 2,810,441 | |
Zions Bancorporation | | | | | | | 104,995 | | | | 3,051,155 | |
| | | | |
| | | | | | | | | | | 12,148,157 | |
| | | | | | | | | | | | |
| | | | |
| Consumer Finance: 1.33% | | | | | | | | | | | | |
Encore Capital Group Incorporated †« | | | | | | | 43,737 | | | | 1,937,986 | |
| | | | | | | | | | | | |
| | | | |
| Real Estate Management & Development: 1.52% | | | | | | | | | | | | |
Jones Lang LaSalle Incorporated | | | | | | | 17,450 | | | | 2,204,633 | |
| | | | | | | | | | | | |
| | | | |
| REITs: 5.83% | | | | | | | | | | | | |
Equity Commonwealth | | | | | | | 68,539 | | | | 1,762,138 | |
Parkway Properties Incorporated | | | | | | | 117,584 | | | | 2,208,228 | |
Pennymac Mortgage Investment Trust | | | | | | | 120,000 | | | | 2,571,600 | |
Redwood Trust Incorporated « | | | | | | | 116,330 | | | | 1,928,751 | |
| | | | |
| | | | | | | | | | | 8,470,717 | |
| | | | | | | | | | | | |
| | | | |
| Thrifts & Mortgage Finance: 3.41% | | | | | | | | | | | | |
Essent Group Limited † | | | | | | | 125,250 | | | | 2,681,603 | |
Ladder Capital Corporation Class A † | | | | | | | 120,550 | | | | 2,278,395 | |
| | | | |
| | | | | | | | | | | 4,959,998 | |
| | | | | | | | | | | | |
| | | | |
Health Care: 8.73% | | | | | | | | | | | | |
| | | | |
| Health Care Equipment & Supplies: 3.69% | | | | | | | | | | | | |
Integra LifeSciences Holdings † | | | | | | | 49,100 | | | | 2,437,324 | |
Steris Corporation | | | | | | | 54,250 | | | | 2,927,330 | |
| | | | |
| | | | | | | | | | | 5,364,654 | |
| | | | | | | | | | | | |
| | | | |
| Health Care Providers & Services: 2.53% | | | | | | | | | | | | |
AMN Healthcare Services Incorporated † | | | | | | | 233,915 | | | | 3,672,466 | |
| | | | | | | | | | | | |
| | | | |
| Life Sciences Tools & Services: 2.51% | | | | | | | | | | | | |
Bio-Rad Laboratories Incorporated Class A † | | | | | | | 19,300 | | | | 2,188,620 | |
Charles River Laboratories International Incorporated † | | | | | | | 24,500 | | | | 1,463,630 | |
| | | | |
| | | | | | | | | | | 3,652,250 | |
| | | | | | | | | | | | |
| | | | |
Industrials: 20.17% | | | | | | | | | | | | |
| | | | |
| Commercial Services & Supplies: 7.88% | | | | | | | | | | | | |
Herman Miller Incorporated | | | | | | | 62,895 | | | | 1,877,416 | |
Kar Auction Services Incorporated | | | | | | | 195,550 | | | | 5,598,597 | |
Tetra Tech Incorporated | | | | | | | 64,997 | | | | 1,623,625 | |
United Stationers Incorporated | | | | | | | 62,800 | | | | 2,359,396 | |
| | | | |
| | | | | | | | | | | 11,459,034 | |
| | | | | | | | | | | | |
The accompanying notes are an integral part of these financial statements.
| | | | | | |
| Portfolio of investments—September 30, 2014 (unaudited) | | Wells Fargo Advantage Intrinsic Small Cap Value Fund | | | 9 | |
| | | | | | | | | | | | |
| Security name | | | | | | Shares | | | Value | |
| | | | | | | | | | | | |
| | | | |
| Construction & Engineering: 3.23% | | | | | | | | | | | | |
EMCOR Group Incorporated | | | | | | | 30,970 | | | $ | 1,237,561 | |
Pike Electric Corporation † | | | | | | | 290,500 | | | | 3,454,045 | |
| | | | |
| | | | | | | | | | | 4,691,606 | |
| | | | | | | | | | | | |
| | | | |
| Electrical Equipment: 0.89% | | | | | | | | | | | | |
Babcock & Wilcox Company | | | | | | | 46,792 | | | | 1,295,670 | |
| | | | | | | | | | | | |
| | | | |
| Machinery: 2.11% | | | | | | | | | | | | |
Harsco Corporation | | | | | | | 79,550 | | | | 1,703,166 | |
IDEX Corporation | | | | | | | 18,800 | | | | 1,360,556 | |
| | | | |
| | | | | | | | | | | 3,063,722 | |
| | | | | | | | | | | | |
| | | | |
| Professional Services: 2.49% | | | | | | | | | | | | |
Korn/Ferry International † | | | | | | | 51,440 | | | | 1,280,856 | |
Resources Connection Incorporated | | | | | | | 168,000 | | | | 2,341,920 | |
| | | | |
| | | | | | | | | | | 3,622,776 | |
| | | | | | | | | | | | |
| | | | |
| Road & Rail: 2.45% | | | | | | | | | | | | |
Landstar System Incorporated | | | | | | | 49,300 | | | | 3,558,967 | |
| | | | | | | | | | | | |
| | | | |
| Trading Companies & Distributors: 1.12% | | | | | | | | | | | | |
Beacon Roofing Supply Incorporated † | | | | | | | 63,900 | | | | 1,628,172 | |
| | | | | | | | | | | | |
| | | | |
Information Technology: 13.64% | | | | | | | | | | | | |
| | | | |
| Communications Equipment: 1.03% | | | | | | | | | | | | |
Plantronics Incorporated | | | | | | | 31,248 | | | | 1,493,029 | |
| | | | | | | | | | | | |
| | | | |
| Electronic Equipment, Instruments & Components: 1.62% | | | | | | | | | | | | |
Jabil Circuit Incorporated | | | | | | | 116,850 | | | | 2,356,865 | |
| | | | | | | | | | | | |
| | | | |
| IT Services: 5.96% | | | | | | | | | | | | |
CoreLogic Incorporated † | | | | | | | 108,510 | | | | 2,937,366 | |
EVERTEC Incorporated | | | | | | | 131,513 | | | | 2,938,000 | |
VeriFone Systems Incorporated † | | | | | | | 81,250 | | | | 2,793,375 | |
| | | | |
| | | | | | | | | | | 8,668,741 | |
| | | | | | | | | | | | |
| | | | |
| Software: 3.62% | | | | | | | | | | | | |
Fair Isaac Corporation | | | | | | | 42,100 | | | | 2,319,710 | |
Informatica Corporation † | | | | | | | 85,800 | | | | 2,937,792 | |
| | | | |
| | | | | | | | | | | 5,257,502 | |
| | | | | | | | | | | | |
| | | | |
| Technology Hardware, Storage & Peripherals: 1.41% | | | | | | | | | | | | |
Avid Technology Incorporated † | | | | | | | 203,000 | | | | 2,050,300 | |
| | | | | | | | | | | | |
| | | | |
Materials: 3.83% | | | | | | | | | | | | |
| | | | |
| Containers & Packaging: 3.83% | | | | | | | | | | | | |
Berry Plastics Group Incorporated † | | | | | | | 99,300 | | | | 2,506,332 | |
Silgan Holdings Incorporated | | | | | | | 65,300 | | | | 3,069,100 | |
| | | | |
| | | | | | | | | | | 5,575,432 | |
| | | | | | | | | | | | |
The accompanying notes are an integral part of these financial statements.
| | | | |
| 10 | | Wells Fargo Advantage Intrinsic Small Cap Value Fund | | Portfolio of investments—September 30, 2014 (unaudited) |
| | | | | | | | | | | | | | |
| Security name | | | | | | | Shares | | | Value | |
| | | | | | | | | | | | | | |
| | | | |
Utilities: 1.25% | | | | | | | | | | | | | | |
| | | | |
| Electric Utilities: 1.25% | | | | | | | | | | | | | | |
Westar Energy Incorporated | | | | | | | | | 53,250 | | | $ | 1,816,886 | |
| | | | | | | | | | | | | | |
| | | | |
Total Common Stocks (Cost $131,722,822) | | | | | | | | | | | | | 143,375,099 | |
| | | | | | | | | | | | | | |
| | | Yield | | | | | | | | | |
| | | | |
Short-Term Investments: 3.81% | | | | | | | | | | | | | | |
| | | | |
| Investment Companies: 3.81% | | | | | | | | | | | | | | |
Wells Fargo Advantage Cash Investment Money Market Fund, Select Class (l)(u) | | | 0.07 | % | | | | | 1,872,065 | | | | 1,872,065 | |
Wells Fargo Securities Lending Cash Investments, LLC (l)(r)(u) | | | 0.11 | | | | | | 3,665,075 | | | | 3,665,075 | |
| | | | |
Total Short-Term Investments (Cost $5,537,140) | | | | | | | | | | | | | 5,537,140 | |
| | | | | | | | | | | | | | |
| | | | | | | | |
| Total investments in securities | | | | | | | | |
| (Cost $137,259,962) * | | | 102.45 | % | | | 148,912,239 | |
Other assets and liabilities, net | | | (2.45 | ) | | | (3,567,809 | ) |
| | | | | | | | |
| Total net assets | | | 100.00 | % | | $ | 145,344,430 | |
| | | | | | | | |
| † | Non-income-earning security |
| « | All or a portion of this security is on loan. |
| (l) | The security represents an affiliate of the Fund as defined in the Investment Company Act of 1940. |
| (u) | The rate represents the 7-day annualized yield at period end. |
| (r) | The investment is a non-registered investment vehicle purchased with cash collateral received from securities on loan. |
| * | Cost for federal income tax purposes is $137,526,780 and unrealized gains (losses) consists of: |
| | | | |
Gross unrealized gains | | $ | 18,563,981 | |
Gross unrealized losses | | | (7,178,522 | ) |
| | | | |
Net unrealized gains | | $ | 11,385,459 | |
The accompanying notes are an integral part of these financial statements.
| | | | | | |
| Statement of assets and liabilities—September 30, 2014 (unaudited) | | Wells Fargo Advantage Intrinsic Small Cap Value Fund | | | 11 | |
| | | | |
| | | | |
| |
Assets | | | | |
Investments | | | | |
In unaffiliated securities (including $3,580,866 of securities loaned), at value (cost $131,722,822) | | $ | 143,375,099 | |
In affiliated securities, at value (cost $5,537,140) | | | 5,537,140 | |
| | | | |
Total investments, at value (cost $137,259,962) | | | 148,912,239 | |
Receivable for investments sold | | | 1,697,305 | |
Receivable for Fund shares sold | | | 6,844 | |
Receivable for dividends | | | 171,371 | |
Receivable for securities lending income | | | 897 | |
Prepaid expenses and other assets | | | 15,366 | |
| | | | |
Total assets | | | 150,804,022 | |
| | | | |
| |
Liabilities | | | | |
Payable for investments purchased | | | 1,552,703 | |
Payable for Fund shares redeemed | | | 74,585 | |
Payable upon receipt of securities loaned | | | 3,665,075 | |
Advisory fee payable | | | 95,527 | |
Distribution fees payable | | | 232 | |
Administration fees payable | | | 28,537 | |
Accrued expenses and other liabilities | | | 42,933 | |
| | | | |
Total liabilities | | | 5,459,592 | |
| | | | |
Total net assets | | $ | 145,344,430 | |
| | | | |
| |
NET ASSETS CONSIST OF | | | | |
Paid-in capital | | $ | 194,387,809 | |
Undistributed net investment income | | | 371,194 | |
Accumulated net realized losses on investments | | | (61,066,850 | ) |
Net unrealized gains on investments | | | 11,652,277 | |
| | | | |
Total net assets | | $ | 145,344,430 | |
| | | | |
| |
COMPUTATION OF NET ASSET VALUE AND OFFERING PRICE PER SHARE | | | | |
Net assets – Class A | | $ | 709,274 | |
Shares outstanding – Class A1 | | | 30,754 | |
Net asset value per share – Class A | | | $23.06 | |
Maximum offering price per share – Class A2 | | | $24.47 | |
Net assets – Class C | | $ | 262,372 | |
Shares outstanding – Class C1 | | | 12,021 | |
Net asset value per share – Class C | | | $21.83 | |
Net assets – Administrator Class | | $ | 9,751,482 | |
Shares outstanding – Administrator Class1 | | | 415,852 | |
Net asset value per share – Administrator Class | | | $23.45 | |
Net assets – Institutional Class | | $ | 77,069,069 | |
Shares outstanding – Institutional Class1 | | | 3,242,972 | |
Net asset value per share – Institutional Class | | | $23.76 | |
Net assets – Investor Class | | $ | 57,552,233 | |
Shares outstanding – Investor Class1 | | | 2,520,702 | |
Net asset value per share – Investor Class | | | $22.83 | |
| 1. | The Fund has an unlimited number of authorized shares. |
| 2. | Maximum offering price is computed as 100/94.25 of net asset value. On investments of $50,000 or more, the offering price is reduced. |
The accompanying notes are an integral part of these financial statements.
| | | | |
| 12 | | Wells Fargo Advantage Intrinsic Small Cap Value Fund | | Statement of operations—six months ended September 30, 2014 (unaudited) |
| | | | |
| | | | |
| |
Investment income | | | | |
Dividends (net of foreign withholding taxes of $3,942) | | $ | 1,108,852 | |
Securities lending income, net | | | 6,028 | |
Income from affiliated securities | | | 1,602 | |
| | | | |
Total investment income | | | 1,116,482 | |
| | | | |
| |
Expenses | | | | |
Advisory fee | | | 610,943 | |
Administration fees | | | | |
Fund level | | | 38,184 | |
Class A | | | 1,112 | |
Class C | | | 519 | |
Administrator Class | | | 5,178 | |
Institutional Class | | | 31,970 | |
Investor Class | | | 97,919 | |
Shareholder servicing fees | | | | |
Class A | | | 1,069 | |
Class C | | | 499 | |
Administrator Class | | | 12,946 | |
Investor Class | | | 76,498 | |
Distribution fees | | | | |
Class C | | | 1,498 | |
Custody and accounting fees | | | 8,782 | |
Professional fees | | | 21,233 | |
Registration fees | | | 11,826 | |
Shareholder report expenses | | | 20,452 | |
Trustees’ fees and expenses | | | 5,885 | |
Other fees and expenses | | | 3,422 | |
| | | | |
Total expenses | | | 949,935 | |
Less: Fee waivers and/or expense reimbursements | | | (31,134 | ) |
| | | | |
Net expenses | | | 918,801 | |
| | | | |
Net investment income | | | 197,681 | |
| | | | |
| |
REALIZED AND UNREALIZED GAINS (LOSSES) ON INVESTMENTS | | | | |
Net realized gains on investments | | | 10,114,803 | |
Net change in unrealized gains (losses) on investments | | | (13,087,278 | ) |
| | | | |
Net realized and unrealized gains (losses) on investments | | | (2,972,475 | ) |
| | | | |
Net decrease in net assets resulting from operations | | $ | (2,774,794 | ) |
| | | | |
The accompanying notes are an integral part of these financial statements.
| | | | | | |
| Statement of changes in net assets | | Wells Fargo Advantage Intrinsic Small Cap Value Fund | | | 13 | |
| | | | | | | | | | | | | | | | | | | | | | | | |
| | | Six months ended September 30, 2014
(unaudited) | | | Year ended
March 31, 20141 | | | Year ended
October 31, 2013 | |
| | | | | | |
Operations | | | | | | | | | | | | | | | | | | | | | | | | |
Net investment income | | | | | | $ | 197,681 | | | | | | | $ | 261,684 | | | | | | | $ | 271,746 | |
Net realized gains on investments | | | | | | | 10,114,803 | | | | | | | | 3,201,803 | | | | | | | | 15,318,277 | |
Net change in unrealized gains (losses) on investments | | | | | | | (13,087,278 | ) | | | | | | | 5,627,885 | | | | | | | | 10,493,223 | |
| | | | |
Net increase (decrease) in net assets resulting from operations | | | | | | | (2,774,794 | ) | | | | | | | 9,091,372 | | | | | | | | 26,083,246 | |
| | | | |
| | | | | | |
Distributions to shareholders from | | | | | | | | | | | | | | | | | | | | | | | | |
Net investment income | | | | | | | | | | | | | | | | | | | | | | | | |
Administrator Class | | | | | | | 0 | | | | | | | | (2,091 | ) | | | | | | | 0 | |
Institutional Class | | | | | | | 0 | | | | | | | | (115,243 | ) | | | | | | | 0 | |
| | | | |
Total distributions to shareholders | | | | | | | 0 | | | | | | | | (117,334 | ) | | | | | | | 0 | |
| | | | |
| | | | | | |
Capital share transactions | | | Shares | | | | | | | | Shares | | | | | | | | Shares | | | | | |
Proceeds from shares sold | | | | | | | | | | | | | | | | | | | | | | | | |
Class A | | | 3,719 | | | | 88,121 | | | | 3,664 | | | | 82,865 | | | | 32,482 | | | | 619,008 | |
Class C | | | 1,479 | | | | 33,536 | | | | 1,360 | | | | 29,564 | | | | 15,685 | | | | 299,291 | |
Administrator Class | | | 11,221 | | | | 270,398 | | | | 22,226 | | | | 511,210 | | | | 309,532 | | | | 5,936,505 | |
Institutional Class | | | 57,865 | | | | 1,424,246 | | | | 211,621 | | | | 4,945,124 | | | | 3,394,484 | | | | 72,965,758 | |
Investor Class | | | 58,460 | | | | 1,379,662 | | | | 82,795 | | | | 1,865,197 | | | | 788,890 | | | | 14,982,958 | |
| | | | |
| | | | | | | 3,195,963 | | | | | | | | 7,433,960 | | | | | | | | 94,803,520 | |
| | | | |
Reinvestment of distributions | | | | | | | | | | | | | | | | | | | | | | | | |
Administrator Class | | | 0 | | | | 0 | | | | 36 | | | | 802 | | | | 0 | | | | 0 | |
Institutional Class | | | 0 | | | | 0 | | | | 4,460 | | | | 102,144 | | | | 0 | | | | 0 | |
| | | | |
| | | | | | | 0 | | | | | | | | 102,946 | | | | | | | | 0 | |
| | | | |
Payment for shares redeemed | | | | | | | | | | | | | | | | | | | | | | | | |
Class A | | | (11,574 | ) | | | (277,257 | ) | | | (8,673 | ) | | | (191,642 | ) | | | (11,243 | ) | | | (231,447 | ) |
Class C | | | (8,639 | ) | | | (192,330 | ) | | | (1,957 | ) | | | (41,683 | ) | | | (1,737 | ) | | | (33,644 | ) |
Administrator Class | | | (34,654 | ) | | | (835,916 | ) | | | (80,157 | ) | | | (1,860,405 | ) | | | (233,269 | ) | | | (4,566,109 | ) |
Institutional Class | | | (92,953 | ) | | | (2,270,012 | ) | | | (95,359 | ) | | | (2,220,641 | ) | | | (2,692,015 | ) | | | (45,602,942 | ) |
Investor Class | | | (220,561 | ) | | | (5,153,943 | ) | | | (192,968 | ) | | | (4,346,409 | ) | | | (966,481 | ) | | | (18,948,279 | ) |
| | | | |
| | | | | | | (8,729,458 | ) | | | | | | | (8,660,780 | ) | | | | | | | (69,382,421 | ) |
| | | | |
Net increase (decrease) in net assets resulting from capital share transactions | | | | | | | (5,533,495 | ) | | | | | | | (1,123,874 | ) | | | | | | | 25,421,099 | |
| | | | |
Total increase (decrease) in net assets | | | | | | | (8,308,289 | ) | | | | | | | 7,850,164 | | | | | | | | 51,504,345 | |
| | | | |
| | | | | | |
Net assets | | | | | | | | | | | | | | | | | | | | | | | | |
Beginning of period | | | | | | | 153,652,719 | | | | | | | | 145,802,555 | | | | | | | | 94,298,210 | |
| | | | |
End of period | | | | | | $ | 145,344,430 | | | | | | | $ | 153,652,719 | | | | | | | $ | 145,802,555 | |
| | | | |
Undistributed net investment income | | | | | | $ | 371,194 | | | | | | | $ | 173,513 | | | | | | | $ | 117,292 | |
| | | | |
| 1. | For the five months ended March 31, 2014. The Fund changed its fiscal year end from October 31 to March 31, effective March 31, 2014. |
The accompanying notes are an integral part of these financial statements.
| | | | |
| 14 | | Wells Fargo Advantage Intrinsic Small Cap Value Fund | | Financial highlights |
(For a share outstanding throughout each period)
| | | | | | | | | | | | | | | | | | | | | | | | | | | | |
| | | Six months ended September 30, 2014 (unaudited) | | | Year ended March 31, 20141 | | | Year ended October 31 | |
| CLASS A | | | | 2013 | | | 2012 | | | 2011 | | | 2010 | | | 2009 | |
Net asset value, beginning of period | | $ | 23.53 | | | $ | 22.16 | | | $ | 15.96 | | | $ | 14.06 | | | $ | 13.81 | | | $ | 11.52 | | | $ | 11.08 | |
Net investment income (loss) | | | 0.01 | | | | 0.02 | | | | 0.03 | | | | (0.06 | )2 | | | (0.06 | )2 | | | (0.06 | ) | | | (0.02 | )2 |
Net realized and unrealized gains (losses) on investments | | | (0.48 | ) | | | 1.35 | | | | 6.17 | | | | 1.96 | | | | 0.31 | | | | 2.35 | | | | 0.47 | |
| | | | | | | | | | | | | | | | | | | | | | | | | | | | |
Total from investment operations | | | (0.47 | ) | | | 1.37 | | | | 6.20 | | | | 1.90 | | | | 0.25 | | | | 2.29 | | | | 0.45 | |
Distributions to shareholders from | | | | | | | | | | | | | | | | | | | | | | | | | | | | |
Tax basis return of capital | | | 0.00 | | | | 0.00 | | | | 0.00 | | | | 0.00 | | | | 0.00 | | | | 0.00 | | | | (0.01 | ) |
Net asset value, end of period | | $ | 23.06 | | | $ | 23.53 | | | $ | 22.16 | | | $ | 15.96 | | | $ | 14.06 | | | $ | 13.81 | | | $ | 11.52 | |
Total return3 | | | (2.00 | )% | | | 6.33 | % | | | 38.66 | % | | | 13.51 | % | | | 1.81 | % | | | 19.88 | % | | | 4.09 | % |
Ratios to average net assets (annualized) | | | | | | | | | | | | | | | | | | | | | | | | | | | | |
Gross expenses | | | 1.45 | % | | | 1.57 | % | | | 1.56 | % | | | 1.48 | % | | | 1.44 | % | | | 1.54 | % | | | 1.57 | % |
Net expenses | | | 1.40 | % | | | 1.44 | % | | | 1.45 | % | | | 1.45 | % | | | 1.42 | % | | | 1.45 | % | | | 1.45 | % |
Net investment income (loss) | | | 0.04 | % | | | 0.19 | % | | | 0.11 | % | | | (0.38 | )% | | | (0.41 | )% | | | (0.49 | )% | | | (0.17 | )% |
Supplemental data | | | | | | | | | | | | | | | | | | | | | | | | | | | | |
Portfolio turnover rate | | | 26 | % | | | 22 | % | | | 75 | % | | | 33 | % | | | 54 | % | | | 147 | % | | | 64 | % |
Net assets, end of period (000s omitted) | | | $709 | | | | $908 | | | | $967 | | | | $357 | | | | $189 | | | | $354 | | | | $290 | |
| 1. | For the five months ended March 31, 2014. The Fund changed its fiscal year end from October 31 to March 31, effective March 31, 2014. |
| 2. | Calculated based upon average shares outstanding |
| 3. | Total return calculations do not include any sales charges. Returns for periods of less than one year are not annualized. |
The accompanying notes are an integral part of these financial statements.
| | | | | | |
| Financial highlights | | Wells Fargo Advantage Intrinsic Small Cap Value Fund | | | 15 | |
(For a share outstanding throughout each period)
| | | | | | | | | | | | | | | | | | | | | | | | | | | | |
| | | Six months ended September 30, 2014 (unaudited) | | | Year ended March 31, 20141 | | | Year ended October 31 | |
| CLASS C | | | | 2013 | | | 2012 | | | 2011 | | | 2010 | | | 2009 | |
Net asset value, beginning of period | | $ | 22.35 | | | $ | 21.12 | | | $ | 15.32 | | | $ | 13.60 | | | $ | 13.45 | | | $ | 11.31 | | | $ | 10.95 | |
Net investment loss | | | (0.08 | )2 | | | (0.05 | ) | | | (0.13 | )2 | | | (0.16 | )2 | | | (0.17 | )2 | | | (0.18 | ) | | | (0.09 | )2 |
Net realized and unrealized gains (losses) on investments | | | (0.44 | ) | | | 1.28 | | | | 5.93 | | | | 1.88 | | | | 0.32 | | | | 2.32 | | | | 0.45 | |
| | | | | | | | | | | | | | | | | | | | | | | | | | | | |
Total from investment operations | | | (0.52 | ) | | | 1.23 | | | | 5.80 | | | | 1.72 | | | | 0.15 | | | | 2.14 | | | | 0.36 | |
Net asset value, end of period | | $ | 21.83 | | | $ | 22.35 | | | $ | 21.12 | | | $ | 15.32 | | | $ | 13.60 | | | $ | 13.45 | | | $ | 11.31 | |
Total return3 | | | (2.33 | )% | | | 6.02 | % | | | 37.60 | % | | | 12.65 | % | | | 1.12 | % | | | 18.92 | % | | | 3.29 | % |
Ratios to average net assets (annualized) | | | | | | | | | | | | | | | | | | | | | | | | | | | | |
Gross expenses | | | 2.20 | % | | | 2.33 | % | | | 2.30 | % | | | 2.22 | % | | | 2.19 | % | | | 2.30 | % | | | 2.31 | % |
Net expenses | | | 2.15 | % | | | 2.19 | % | | | 2.20 | % | | | 2.20 | % | | | 2.17 | % | | | 2.20 | % | | | 2.20 | % |
Net investment loss | | | (0.70 | )% | | | (0.54 | )% | | | (0.66 | )% | | | (1.12 | )% | | | (1.19 | )% | | | (1.24 | )% | | | (0.90 | )% |
Supplemental data | | | | | | | | | | | | | | | | | | | | | | | | | | | | |
Portfolio turnover rate | | | 26 | % | | | 22 | % | | | 75 | % | | | 33 | % | | | 54 | % | | | 147 | % | | | 64 | % |
Net assets, end of period (000s omitted) | | | $262 | | | | $429 | | | | $418 | | | | $89 | | | | $108 | | | | $142 | | | | $132 | |
| 1. | For the five months ended March 31, 2014. The Fund changed its fiscal year end from October 31 to March 31, effective March 31, 2014. |
| 2. | Calculated based upon average shares outstanding |
| 3. | Total return calculations do not include any sales charges. Returns for periods of less than one year are not annualized. |
The accompanying notes are an integral part of these financial statements.
| | | | |
| 16 | | Wells Fargo Advantage Intrinsic Small Cap Value Fund | | Financial highlights |
(For a share outstanding throughout each period)
| | | | | | | | | | | | | | | | | | | | | | | | | | | | |
| | | Six months ended September 30, 2014 (unaudited) | | | Year ended March 31, 20141 | | | Year ended October 31 | |
| ADMINISTRATOR CLASS | | | | 2013 | | | 2012 | | | 2011 | | | 2010 | | | 2009 | |
Net asset value, beginning of period | | $ | 23.90 | | | $ | 22.49 | | | $ | 16.16 | | | $ | 14.20 | | | $ | 13.91 | | | $ | 11.58 | | | $ | 11.10 | |
Net investment income (loss) | | | 0.03 | 2 | | | 0.04 | 2 | | | 0.09 | | | | (0.02 | )2 | | | (0.05 | )2 | | | (0.02 | ) | | | 0.02 | 2 |
Net realized and unrealized gains (losses) on investments | | | (0.48 | ) | | | 1.37 | | | | 6.24 | | | | 1.98 | | | | 0.34 | | | | 2.35 | | | | 0.46 | |
| | | | | | | | | | | | | | | | | | | | | | | | | | | | |
Total from investment operations | | | (0.45 | ) | | | 1.41 | | | | 6.33 | | | | 1.96 | | | | 0.29 | | | | 2.33 | | | | 0.48 | |
Distributions to shareholders from | | | | | | | | | | | | | | | | | | | | | | | | | | | | |
Net investment income | | | 0.00 | | | | (0.00 | )3 | | | 0.00 | | | | 0.00 | | | | 0.00 | | | | 0.00 | | | | 0.00 | |
Net asset value, end of period | | $ | 23.45 | | | $ | 23.90 | | | $ | 22.49 | | | $ | 16.16 | | | $ | 14.20 | | | $ | 13.91 | | | $ | 11.58 | |
Total return4 | | | (1.88 | )% | | | 6.43 | % | | | 38.99 | % | | | 13.80 | % | | | 2.08 | % | | | 20.12 | % | | | 4.32 | % |
Ratios to average net assets (annualized) | | | | | | | | | | | | | | | | | | | | | | | | | | | | |
Gross expenses | | | 1.29 | % | | | 1.42 | % | | | 1.40 | % | | | 1.30 | % | | | 1.22 | % | | | 1.37 | % | | | 1.38 | % |
Net expenses | | | 1.20 | % | | | 1.20 | % | | | 1.20 | % | | | 1.20 | % | | | 1.19 | % | | | 1.20 | % | | | 1.20 | % |
Net investment income (loss) | | | 0.26 | % | | | 0.45 | % | | | 0.52 | % | | | (0.12 | )% | | | (0.30 | )% | | | (0.23 | )% | | | 0.18 | % |
Supplemental data | | | | | | | | | | | | | | | | | | | | | | | | | | | | |
Portfolio turnover rate | | | 26 | % | | | 22 | % | | | 75 | % | | | 33 | % | | | 54 | % | | | 147 | % | | | 64 | % |
Net assets, end of period (000s omitted) | | | $9,751 | | | | $10,498 | | | | $11,182 | | | | $6,801 | | | | $9,722 | | | | $5,774 | | | | $5,730 | |
| 1. | For the five months ended March 31, 2014. The Fund changed its fiscal year end from October 31 to March 31, effective March 31, 2014. |
| 2. | Calculated based upon average shares outstanding |
| 3. | Amount is less than $0.005. |
| 4. | Returns for periods of less than one year are not annualized. |
The accompanying notes are an integral part of these financial statements.
| | | | | | |
| Financial highlights | | Wells Fargo Advantage Intrinsic Small Cap Value Fund | | | 17 | |
(For a share outstanding throughout each period)
| | | | | | | | | | | | | | | | | | | | | | | | | | | | |
| | | Six months ended September 30, 2014 (unaudited) | | | Year ended March 31, 20141 | | | Year ended October 31 | |
| INSTITUTIONAL CLASS | | | | 2013 | | | 2012 | | | 2011 | | | 2010 | | | 2009 | |
Net asset value, beginning of period | | $ | 24.19 | | | $ | 22.78 | | | $ | 16.32 | | | $ | 14.32 | | | $ | 14.00 | | | $ | 11.63 | | | $ | 11.15 | |
Net investment income (loss) | | | 0.06 | 2 | | | 0.06 | 2 | | | 0.12 | 2 | | | 0.01 | 2 | | | 0.00 | 2,3 | | | (0.00 | )2,3 | | | 0.04 | 2 |
Net realized and unrealized gains (losses) on investments | | | (0.49 | ) | | | 1.39 | | | | 6.34 | | | | 1.99 | | | | 0.32 | | | | 2.37 | | | | 0.47 | |
| | | | | | | | | | | | | | | | | | | | | | | | | | | | |
Total from investment operations | | | (0.43 | ) | | | 1.45 | | | | 6.46 | | | | 2.00 | | | | 0.32 | | | | 2.37 | | | | 0.51 | |
Distributions to shareholders from | | | | | | | | | | | | | | | | | | | | | | | | | | | | |
Net investment income | | | 0.00 | | | | (0.04 | ) | | | 0.00 | | | | 0.00 | | | | 0.00 | | | | 0.00 | | | | 0.00 | |
Tax basis return of capital | | | 0.00 | | | | 0.00 | | | | 0.00 | | | | 0.00 | | | | 0.00 | | | | 0.00 | | | | (0.03 | ) |
| | | | | | | | | | | | | | | | | | | | | | | | | | | | |
Total distributions to shareholders | | | 0.00 | | | | (0.04 | ) | | | 0.00 | | | | 0.00 | | | | 0.00 | | | | 0.00 | | | | (0.03 | ) |
Net asset value, end of period | | $ | 23.76 | | | $ | 24.19 | | | $ | 22.78 | | | $ | 16.32 | | | $ | 14.32 | | | $ | 14.00 | | | $ | 11.63 | |
Total return4 | | | (1.74 | )% | | | 6.50 | % | | | 39.40 | % | | | 13.97 | % | | | 2.29 | % | | | 20.38 | % | | | 4.61 | % |
Ratios to average net assets (annualized) | | | | | | | | | | | | | | | | | | | | | | | | | | | | |
Gross expenses | | | 1.02 | % | | | 1.15 | % | | | 1.10 | % | | | 1.05 | % | | | 1.01 | % | | | 1.10 | % | | | 1.11 | % |
Net expenses | | | 1.00 | % | | | 1.00 | % | | | 1.00 | % | | | 1.00 | % | | | 0.98 | % | | | 1.00 | % | | | 1.00 | % |
Net investment income (loss) | | | 0.47 | % | | | 0.64 | % | | | 0.58 | % | | | 0.07 | % | | | 0.02 | % | | | (0.03 | )% | | | 0.36 | % |
Supplemental data | | | | | | | | | | | | | | | | | | | | | | | | | | | | |
Portfolio turnover rate | | | 26 | % | | | 22 | % | | | 75 | % | | | 33 | % | | | 54 | % | | | 147 | % | | | 64 | % |
Net assets, end of period (000s omitted) | | | $77,069 | | | | $79,312 | | | | $71,934 | | | | $40,073 | | | | $41,861 | | | | $72,200 | | | | $65,014 | |
| 1. | For the five months ended March 31, 2014. The Fund changed its fiscal year end from October 31 to March 31, effective March 31, 2014. |
| 2. | Calculated based upon average shares outstanding |
| 3. | Amount is less than $0.005. |
| 4. | Returns for periods of less than one year are not annualized. |
The accompanying notes are an integral part of these financial statements.
| | | | |
| 18 | | Wells Fargo Advantage Intrinsic Small Cap Value Fund | | Financial highlights |
(For a share outstanding throughout each period)
| | | | | | | | | | | | | | | | | | | | | | | | | | | | |
| | | Six months ended September 30, 2014 (unaudited) | | | Year ended
March 31, 20141 | | | Year ended October 31 | |
| INVESTOR CLASS | | | | 2013 | | | 2012 | | | 2011 | | | 2010 | | | 2009 | |
Net asset value, beginning of period | | $ | 23.30 | | | $ | 21.95 | | | $ | 15.81 | | | $ | 13.94 | | | $ | 13.70 | | | $ | 11.43 | | | $ | 10.99 | |
Net investment income (loss) | | | (0.00 | )2,3 | | | 0.01 | 2 | | | 0.04 | 2 | | | (0.06 | )2 | | | (0.07 | )2 | | | (0.06 | )2 | | | (0.01 | )2 |
Net realized and unrealized gains (losses) on investments | | | (0.47 | ) | | | 1.34 | | | | 6.10 | | | | 1.93 | | | | 0.31 | | | | 2.33 | | | | 0.45 | |
| | | | | | | | | | | | | | | | | | | | | | | | | | | | |
Total from investment operations | | | (0.47 | ) | | | 1.35 | | | | 6.14 | | | | 1.87 | | | | 0.24 | | | | 2.27 | | | | 0.44 | |
Net asset value, end of period | | $ | 22.83 | | | $ | 23.30 | | | $ | 21.95 | | | $ | 15.81 | | | $ | 13.94 | | | $ | 13.70 | | | $ | 11.43 | |
Total return4 | | | (2.02 | )% | | | 6.30 | % | | | 38.56 | % | | | 13.49 | % | | | 1.75 | % | | | 19.86 | % | | | 4.00 | % |
Ratios to average net assets (annualized) | | | | | | | | | | | | | | | | | | | | | | | | | | | | |
Gross expenses | | | 1.51 | % | | | 1.64 | % | | | 1.62 | % | | | 1.54 | % | | | 1.50 | % | | | 1.63 | % | | | 1.67 | % |
Net expenses | | | 1.46 | % | | | 1.48 | % | | | 1.49 | % | | | 1.49 | % | | | 1.48 | % | | | 1.49 | % | | | 1.49 | % |
Net investment income (loss) | | | (0.00 | )% | | | 0.16 | % | | | 0.19 | % | | | (0.42 | )% | | | (0.48 | )% | | | (0.47 | )% | | | (0.12 | )% |
Supplemental data | | | | | | | | | | | | | | | | | | | | | | | | | | | | |
Portfolio turnover rate | | | 26 | % | | | 22 | % | | | 75 | % | | | 33 | % | | | 54 | % | | | 147 | % | | | 64 | % |
Net assets, end of period (000s omitted) | | | $57,552 | | | | $62,505 | | | | $61,302 | | | | $46,977 | | | | $51,927 | | | | $79,132 | | | | $180,060 | |
| 1. | For the five months ended March 31, 2014. The Fund changed its fiscal year end from October 31 to March 31, effective March 31, 2014. |
| 2. | Calculated based upon average shares outstanding |
| 3. | Amount is less than $0.005. |
| 4. | Returns for periods of less than one year are not annualized. |
The accompanying notes are an integral part of these financial statements.
| | | | | | |
| Notes to financial statements (unaudited) | | Wells Fargo Advantage Intrinsic Small Cap Value Fund | | | 19 | |
1. ORGANIZATION
Wells Fargo Funds Trust (the “Trust”), a Delaware statutory trust organized on March 10, 1999, is an open-end management investment company registered under the Investment Company Act of 1940, as amended (the “1940 Act”). These financial statements report on the Wells Fargo Advantage Intrinsic Small Cap Value Fund (the “Fund”) which is a diversified series of the Trust.
2. SIGNIFICANT ACCOUNTING POLICIES
The following significant accounting policies, which are consistently followed in the preparation of the financial statements of the Fund, are in conformity with U.S. generally accepted accounting principles which require management to make estimates and assumptions that affect the reported amounts of assets and liabilities, disclosure of contingent assets and liabilities at the date of the financial statements, and the reported amounts of revenues and expenses during the reporting period. Actual results could differ from those estimates.
Securities valuation
All investments are valued each business day as of the close of regular trading on the New York Stock Exchange (generally 4 p.m. Eastern Time).
Equity securities that are listed on a foreign or domestic exchange or market are valued at the official closing price or, if none, the last sales price. If no sale occurs on the primary exchange or market for the security that day, the prior day’s price will be deemed “stale” and fair values will be determined in accordance with the Fund’s Valuation Procedures.
Investments in registered open-end investment companies are valued at net asset value. Non-registered investment vehicles are fair valued at net asset value.
Investments which are not valued using any of the methods discussed above are valued at their fair value, as determined in good faith by the Board of Trustees of the Fund. The Board of Trustees has established a Valuation Committee comprised of the Trustees and has delegated to it the authority to take any actions regarding the valuation of portfolio securities that the Valuation Committee deems necessary or appropriate, including determining the fair value of portfolio securities, unless the determination has been delegated to the Management Valuation Team of Wells Fargo Funds Management, LLC (“Funds Management”). The Board of Trustees retains the authority to make or ratify any valuation decisions or approve any changes to the Valuation Procedures as it deems appropriate. On a quarterly basis, the Board of Trustees receives reports on any valuation actions taken by the Valuation Committee or the Management Valuation Team which may include items for ratification.
Valuations of fair valued securities are compared to the next actual sales price when available, or other appropriate market values, to assess the continued appropriateness of the fair valuation methodologies used. These securities are fair valued on a day-to-day basis, taking into consideration changes to appropriate market information and any significant changes to the inputs considered in the valuation process until there is a readily available price provided on an exchange or by an independent pricing service. Valuations received from an independent pricing service or independent broker-dealer quotes are periodically validated by comparisons to most recent trades and valuations provided by other independent pricing services in addition to the review of prices by the adviser and/or subadviser. Unobservable inputs used in determining fair valuations are identified based on the type of security, taking into consideration factors utilized by market participants in valuing the investment, knowledge about the issuer and the current market environment.
Security loans
The Fund may lend its securities from time to time in order to earn additional income in the form of fees or interest on securities received as collateral or the investment of any cash received as collateral. The Fund continues to receive interest or dividends on the securities loaned. The Fund receives collateral in the form of cash or securities with a value at least equal to the value of the securities on loan. The value of the loaned securities is determined at the close of each business day and any additional required collateral is delivered to the Fund on the next business day. In a securities lending transaction, the net asset value of the Fund will be affected by an increase or decrease in the value of the securities loaned and by an increase or decrease in the value of the instrument in which collateral is invested. The amount of securities lending activity undertaken by the Fund fluctuates from time to time. In the event of default or bankruptcy by the borrower, the Fund may be prevented from recovering the loaned securities or gaining access to the collateral or may experience delays or costs in doing so. In addition, the investment of any cash collateral received may lose all or part of its value. The Fund has the right under the lending agreement to recover the securities from the borrower on demand.
| | | | |
| 20 | | Wells Fargo Advantage Intrinsic Small Cap Value Fund | | Notes to financial statements (unaudited) |
The Fund lends its securities through an unaffiliated securities lending agent. Cash collateral received in connection with its securities lending transactions is invested in Wells Fargo Securities Lending Cash Investments, LLC (the “Securities Lending Fund”). The Securities Lending Fund is exempt from registration under Section 3(c)(7) of the 1940 Act and is managed by Funds Management and is subadvised by Wells Capital Management Incorporated (“WellsCap”). Funds Management receives an advisory fee starting at 0.05% and declining to 0.01% as the average daily net assets of the Securities Lending Fund increase. All of the fees received by Funds Management are paid to WellsCap for its services as subadviser. The Securities Lending Fund seeks to provide a positive return compared to the daily Fed Funds Open rate by investing in high-quality, U.S. dollar-denominated short-term money market instruments. Securities Lending Fund investments are fair valued based upon the amortized cost valuation technique. Income earned from investment in the Securities Lending Fund is included in securities lending income on the Statement of Operations.
Security transactions and income recognition
Securities transactions are recorded on a trade date basis. Realized gains or losses are recorded on the basis of identified cost.
Dividend income is recognized on the ex-dividend date. Dividend income from foreign securities is recorded net of foreign taxes withheld where recovery of such taxes is not assured.
Distributions to shareholders
Distributions to shareholders from net investment income and net realized gains, if any, are recorded on the ex-dividend date. Such distributions are determined in conformity with federal income tax regulations, which may differ in amount or character from net investment income and realized gains recognized for purposes of U.S. generally accepted accounting principles.
Federal and other taxes
The Fund intends to continue to qualify as a regulated investment company by distributing substantially all of its investment company taxable income and any net realized capital gains (after reduction for capital loss carryforwards) sufficient to relieve it from all, or substantially all, federal income taxes. Accordingly, no provision for federal income taxes was required.
The Fund’s income and federal excise tax returns and all financial records supporting those returns for the prior three fiscal years are subject to examination by the federal and Delaware revenue authorities. Management has analyzed the Fund’s tax positions taken on federal, state, and foreign tax returns for all open tax years and does not believe that there are any uncertain tax positions that require recognition of a tax liability.
As of March 31, 2014, the Fund had capital loss carryforwards available to offset future net realized capital gains in the amount of $70,869,788 with $63,180,078 expiring in 2017 and $7,689,710 expiring in 2018.
Class allocations
The separate classes of shares offered by the Fund differ principally in applicable sales charges, distribution, shareholder servicing, and administration fees. Class specific expenses are charged directly to that share class. Investment income, common expenses, and realized and unrealized gains (losses) on investments are allocated daily to each class of shares based on the relative proportion of net assets of each class.
3. FAIR VALUATION MEASUREMENTS
Fair value measurements of investments are determined within a framework that has established a fair value hierarchy based upon the various data inputs utilized in determining the value of the Fund’s investments. The three-level hierarchy gives the highest priority to unadjusted quoted prices in active markets for identical assets or liabilities (Level 1) and the lowest priority to significant unobservable inputs (Level 3). The Fund’s investments are classified within the fair value hierarchy based on the lowest level of input that is significant to the fair value measurement. The inputs are summarized into three broad levels as follows:
| n | | Level 1 – quoted prices in active markets for identical securities |
| n | | Level 2 – other significant observable inputs (including quoted prices for similar securities, interest rates, prepayment speeds, credit risk, use of amortized cost, etc.) |
| n | | Level 3 – significant unobservable inputs (including the Fund’s own assumptions in determining the fair value of investments) |
The inputs or methodologies used for valuing investments in securities are not necessarily an indication of the risk associated with investing in those securities.
| | | | | | |
| Notes to financial statements (unaudited) | | Wells Fargo Advantage Intrinsic Small Cap Value Fund | | | 21 | |
The following is a summary of the inputs used in valuing the Fund’s assets and liabilities as of September 30, 2014:
| | | | | | | | | | | | | | | | |
| | | Quoted prices
(Level 1) | | | Other significant
observable inputs
(Level 2) | | | Significant
unobservable inputs
(Level 3) | | | Total | |
Assets | | | | | | | | | | | | | | | | |
Investments in : | | | | | | | | | | | | | | | | |
| | | | |
Common stocks | | | | | | | | | | | | | | | | |
Consumer discretionary | | $ | 25,446,177 | | | $ | 0 | | | $ | 0 | | | $ | 25,446,177 | |
Consumer staples | | | 11,202,618 | | | | 0 | | | | 0 | | | | 11,202,618 | |
Energy | | | 7,776,741 | | | | 0 | | | | 0 | | | | 7,776,741 | |
Financials | | | 29,721,491 | | | | 0 | | | | 0 | | | | 29,721,491 | |
Health care | | | 12,689,370 | | | | 0 | | | | 0 | | | | 12,689,370 | |
Industrials | | | 29,319,947 | | | | 0 | | | | 0 | | | | 29,319,947 | |
Information technology | | | 19,826,437 | | | | 0 | | | | 0 | | | | 19,826,437 | |
Materials | | | 5,575,432 | | | | 0 | | | | 0 | | | | 5,575,432 | |
Utilities | | | 1,816,886 | | | | 0 | | | | 0 | | | | 1,816,886 | |
| | | | |
Short-term investments | | | | | | | | | | | | | | | | |
Investment companies | | | 1,872,065 | | | | 3,665,075 | | | | 0 | | | | 5,537,140 | |
Total assets | | $ | 145,247,164 | | | $ | 3,665,075 | | | $ | 0 | | | $ | 148,912,239 | |
Transfers in and transfers out are recognized at the end of the reporting period. At September 31, 2014, the Fund did not have any transfers into/out of Level 1, Level 2, or Level 3.
4. TRANSACTIONS WITH AFFILIATES
Advisory fee
The Trust has entered into an advisory contract with Funds Management, an indirect wholly owned subsidiary of Wells Fargo & Company (“Wells Fargo”). The adviser is responsible for implementing investment policies and guidelines and for supervising the subadviser, who is responsible for day-to-day portfolio management of the Fund.
Pursuant to the contract, Funds Management is entitled to receive an annual advisory fee starting at 0.80% and declining to 0.68% as the average daily net assets of the Fund increase. For the six months ended September 30, 2014, the advisory fee was equivalent to an annual rate of 0.80% of the Fund’s average daily net assets.
Funds Management has retained the services of a subadviser to provide daily portfolio management to the Fund. The fee for subadvisory services is borne by Funds Management. Metropolitan West Capital Management, LLC, an affiliate of Funds Management and an indirect wholly owned subsidiary of Wells Fargo, is the subadviser to the Fund and is entitled to receive a fee from Funds Management at an annual rate starting at 0.55% and declining to 0.40% as the average daily net assets of the Fund increase.
Administration fees
The Trust has entered into an administration agreement with Funds Management. Under this agreement, for providing administrative services, which includes paying fees and expenses for services provided by the transfer agent, sub-transfer agents, omnibus account servicers and record-keepers, Funds Management is entitled to receive from the Fund an annual fund level administration fee starting at 0.05% and declining to 0.03% as the average daily net assets of the Fund increase and a class level administration fee which is calculated based on the average daily net assets of each class as follows:
| | | | |
| | | Class level
administration fee | |
Class A, Class C | | | 0.26 | % |
Administrator Class | | | 0.10 | |
Institutional Class | | | 0.08 | |
Investor Class | | | 0.32 | |
| | | | |
| 22 | | Wells Fargo Advantage Intrinsic Small Cap Value Fund | | Notes to financial statements (unaudited) |
Funds Management has contractually waived and/or reimbursed advisory and administration fees to the extent necessary to maintain certain net operating expense ratios for the Fund. Waiver of fees and/or reimbursement of expenses by Funds Management were made first from fund level expenses on a proportionate basis and then from class specific expenses. Funds Management has committed through July 31, 2015 to waive fees and/or reimburse expenses to the extent necessary to cap the Fund’s expenses at 1.40% for Class A shares, 2.15% for Class C shares, 1.20% for Administrator Class shares, 1.00% for Institutional Class shares, and 1.46% for Investor Class shares. After this time, the cap may be increased or the commitment to maintain the cap may be terminated only with the approval of the Board of Trustees.
Distribution fees
The Trust has adopted a Distribution Plan for Class C shares of the Fund pursuant to Rule 12b-1 under the 1940 Act. Distribution fees are charged to Class C shares and paid to Wells Fargo Funds Distributor, LLC (“Funds Distributor”), the principal underwriter, at an annual rate of 0.75% of the average daily net assets of Class C shares.
In addition, Funds Distributor is entitled to receive the front-end sales charge from the purchase of Class A shares and a contingent deferred sales charge on the redemption of certain shares. Funds Distributor is also entitled to receive the contingent deferred sales charges from redemptions of Class B and Class C shares. For the six months ended September 30, 2014, Funds Distributor received $379 from the sale of Class A shares.
Shareholder servicing fees
The Trust has entered into contracts with one or more shareholder servicing agents, whereby Class A, Class C, Administrator Class, and Investor Class of the Fund is charged a fee at an annual rate of 0.25% of the average daily net assets of each respective class.
A portion of these total shareholder servicing fees were paid to affiliates of Wells Fargo.
5. INVESTMENT PORTFOLIO TRANSACTIONS
Purchases and sales of investments, excluding U.S. government obligations (if any) and short-term securities, for the six months ended September 30, 2014 were $40,661,849 and $38,374,688, respectively.
6. BANK BORROWINGS
The Trust (excluding the money market funds and certain other funds in the Trust) and Wells Fargo Variable Trust are parties to a $150,000,000 revolving credit agreement whereby the Fund is permitted to use bank borrowings for temporary or emergency purposes, such as to fund shareholder redemption requests. Interest under the credit agreement is charged to the Fund based on a borrowing rate equal to the higher of the Federal Funds rate in effect on that day plus 1.25% or the overnight LIBOR rate in effect on that day plus 1.25%. In addition, an annual commitment fee equal to 0.10% of the unused balance is allocated to each participating fund. For the six months ended September 30, 2014, the Fund paid $141 in commitment fees.
For the six months ended September 30, 2014, there were no borrowings by the Fund under the agreement.
7. INDEMNIFICATION
Under the Trust’s organizational documents, the officers and Trustees are indemnified against certain liabilities that may arise out of performance of their duties to the Trust. Additionally, in the normal course of business, the Trust may enter into contracts with service providers that contain a variety of indemnification clauses. The Trust’s maximum exposure under these arrangements is dependent on future claims that may be made against the Fund and, therefore, cannot be estimated.
| | | | | | |
| Other information (unaudited) | | Wells Fargo Advantage Intrinsic Small Cap Value Fund | | | 23 | |
PROXY VOTING INFORMATION
A description of the policies and procedures that the Fund uses to determine how to vote proxies relating to portfolio securities is available without charge, upon request, by calling 1-800-222-8222, visiting our website at wellsfargoadvantagefunds.com, or visiting the SEC website at sec.gov. Information regarding how the Fund voted proxies relating to portfolio securities during the most recent 12-month period ended June 30 is available without charge on the Fund’s website at wellsfargoadvantagefunds.com or by visiting the SEC website at sec.gov.
PORTFOLIO HOLDINGS INFORMATION
The complete portfolio holdings for the Fund are publicly available monthly on the Fund’s website (wellsfargoadvantagefunds.com), on a one-month delayed basis. In addition, top ten holdings information (excluding derivative positions) for the Fund is publicly available on the Fund’s website on a monthly, seven-day or more delayed basis. The Fund files its complete schedule of portfolio holdings with the SEC for the first and third quarters of each fiscal year on Form N-Q, which is available without charge by visiting the SEC website at sec.gov. In addition, the Fund’s Form N-Q may be reviewed and copied at the SEC’s Public Reference Room in Washington, DC, and at regional offices in New York City, at 233 Broadway, and in Chicago, at 175 West Jackson Boulevard, Suite 900. Information about the Public Reference Room may be obtained by calling 1-800-SEC-0330.
| | | | |
| 24 | | Wells Fargo Advantage Intrinsic Small Cap Value Fund | | Other information (unaudited) |
BOARD OF TRUSTEES AND OFFICERS
Each of the Trustees and Officers1 listed in the table below acts in identical capacities for each fund in the Wells Fargo Advantage family of funds, which consists of 133 mutual funds comprising the Wells Fargo Funds Trust, Wells Fargo Variable Trust, Wells Fargo Master Trust and four closed-end funds (collectively the “Fund Complex”). This table should be read in conjunction with the Prospectus and the Statement of Additional Information2. The mailing address of each Trustee and Officer is 525 Market Street, 12th Floor, San Francisco, CA 94105. Each Trustee and Officer serves an indefinite term, however, each Trustee serves such term until reaching the mandatory retirement age established by the Trustees.
Independent Trustees
| | | | | | |
Name and year of birth | | Position held and length of service* | | Principal occupations during past five years or longer | | Other directorships during
past five years |
| Peter G. Gordon (Born 1942) | | Trustee, since 1998; Chairman, since 2005 | | Co-Founder, Retired Chairman, President and CEO of Crystal Geyser Water Company. Trustee Emeritus, Colby College. | | Asset Allocation Trust |
Isaiah Harris, Jr.
(Born 1952) | | Trustee, since 2009 | | Retired. Prior thereto, President and CEO of BellSouth Advertising and Publishing Corp. from 2005 to 2007, President and CEO of BellSouth Enterprises from 2004 to 2005 and President of BellSouth Consumer Services from 2000 to 2003. Emeritus member of the Iowa State University Foundation Board of Governors. Emeritus Member of the Advisory Board of Iowa State University School of Business. Advisory Board Member, Palm Harbor Academy. Mr. Harris is a certified public accountant. | | CIGNA Corporation; Asset Allocation Trust |
Judith M. Johnson
(Born 1949) | | Trustee, since 2008; Audit Committee Chairman, since 2008 | | Retired. Prior thereto, Chief Executive Officer and Chief Investment Officer of Minneapolis Employees Retirement Fund from 1996 to 2008. Ms. Johnson is an attorney, certified public accountant and a certified managerial accountant. | | Asset Allocation Trust |
Leroy Keith, Jr.
(Born 1939) | | Trustee, since 2010 | | Chairman, Bloc Global Services (development and construction). Trustee of the Evergreen Funds complex (and its predecessors) from 1983 to 2010. Former Managing Director, Almanac Capital Management (commodities firm), former Partner, Stonington Partners, Inc. (private equity fund), former Director, Obagi Medical Products Co. and former Director, Lincoln Educational Services. | | Trustee, Virtus Fund Complex (consisting of 50 portfolios as of 12/16/2013); Asset Allocation Trust |
David F. Larcker
(Born 1950) | | Trustee, since 2009 | | James Irvin Miller Professor of Accounting at the Graduate School of Business, Stanford University, Morgan Stanley Director of the Center for Leadership Development and Research and Senior Faculty of The Rock Center for Corporate Governance since 2006. From 2005 to 2008, Professor of Accounting at the Graduate School of Business, Stanford University. Prior thereto, Ernst & Young Professor of Accounting at The Wharton School, University of Pennsylvania from 1985 to 2005. | | Asset Allocation Trust |
Olivia S. Mitchell
(Born 1953) | | Trustee, since 2006 | | International Foundation of Employee Benefit Plans Professor, Wharton School of the University of Pennsylvania since 1993. Director of Wharton’s Pension Research Council and Boettner Center on Pensions & Retirement Research, and Research Associate at the National Bureau of Economic Research. Previously, Cornell University Professor from 1978 to 1993. | | Asset Allocation Trust |
Timothy J. Penny
(Born 1951) | | Trustee, since 1996 | | President and CEO of Southern Minnesota Initiative Foundation, a non-profit organization, since 2007 and Senior Fellow at the Humphrey Institute Policy Forum at the University of Minnesota since 1995. Member of the Board of Trustees of NorthStar Education Finance, Inc., a non-profit organization, since 2007. | | Asset Allocation Trust |
| | | | | | |
| Other information (unaudited) | | Wells Fargo Advantage Intrinsic Small Cap Value Fund | | | 25 | |
| | | | | | |
Name and year of birth | | Position held and length of service* | | Principal occupations during past five years or longer | | Other directorships during
past five years |
Michael S. Scofield
(Born 1943) | | Trustee, since 2010 | | Served on the Investment Company Institute’s Board of Governors and Executive Committee from 2008-2011 as well the Governing Council of the Independent Directors Council from 2006-2011 and the Independent Directors Council Executive Committee from 2008-2011. Chairman of the IDC from 2008-2010. Institutional Investor (Fund Directions) Trustee of Year in 2007. Trustee of the Evergreen Funds complex (and its predecessors) from 1984 to 2010. Chairman of the Evergreen Funds from 2000-2010. Former Trustee of the Mentor Funds. Retired Attorney, Law Offices of Michael S. Scofield. | | Asset Allocation Trust |
Donald C. Willeke
(Born 1940) | | Trustee, since 1996 | | Principal of the law firm of Willeke & Daniels. General Counsel of the Minneapolis Employees Retirement Fund from 1984 until its consolidation into the Minnesota Public Employees Retirement Association on June 30, 2010. Director and Vice Chair of The Tree Trust (non-profit corporation). Director of the American Chestnut Foundation (non-profit corporation). | | Asset Allocation Trust |
| * | Length of service dates reflect the Trustee’s commencement of service with the Trust’s predecessor entities, where applicable. |
Officers
| | | | | | |
Name and year of birth | | Position held and
length of service | | Principal occupations during past five years or longer | | |
Karla M. Rabusch
(Born 1959) | | President, since 2003 | | Executive Vice President of Wells Fargo Bank, N.A. and President of Wells Fargo Funds Management, LLC since 2003. | | |
Nancy Wiser1
(Born 1967) | | Treasurer, since 2012 | | Executive Vice President of Wells Fargo Funds Management, LLC since 2011. Chief Operating Officer and Chief Compliance Officer at LightBox Capital Management LLC, from 2008 to 2011. Owned and operated a consulting business providing services to various hedge funds including acting as Chief Operating Officer and Chief Compliance Officer for a hedge fund from 2007 to 2008. Chief Operating Officer and Chief Compliance Officer of GMN Capital LLC from 2006 to 2007. | | |
C. David Messman
(Born 1960) | | Secretary, since 2000; Chief Legal Officer, since 2003 | | Assistant General Counsel of Wells Fargo Bank, N.A. since 2013 and Vice President and Managing Counsel of Wells Fargo Bank N.A. from 1996 to 2013. Senior Vice President and Secretary of Wells Fargo Funds Management , LLC since 2001. | | |
Debra Ann Early
(Born 1964) | | Chief Compliance Officer, since 2007 | | Senior Vice President and Chief Compliance Officer of Wells Fargo Funds Management, LLC since 2007. Chief Compliance Officer of Parnassus Investments from 2005 to 2007. Chief Financial Officer of Parnassus Investments from 2004 to 2007. | | |
David Berardi
(Born 1975) | | Assistant Treasurer, since 2009 | | Vice President of Wells Fargo Funds Management, LLC since 2009. Vice President of Evergreen Investment Management Company, LLC from 2008 to 2010. Assistant Vice President of Evergreen Investment Services, Inc. from 2004 to 2008. Manager of Fund Reporting and Control for Evergreen Investment Management Company, LLC from 2004 to 2010. | | |
Jeremy DePalma1
(Born 1974) | | Assistant Treasurer, since 2009 | | Senior Vice President of Wells Fargo Funds Management, LLC since 2009. Senior Vice President of Evergreen Investment Management Company, LLC from 2008 to 2010. Vice President, Evergreen Investment Services, Inc. from 2004 to 2007. Head of the Fund Reporting and Control Team within Fund Administration from 2005 to 2010. | | |
| 1. | Nancy Wiser acts as Treasurer of 73 funds in the Fund Complex. Jeremy DePalma acts as Treasurer of 60 funds and Assistant Treasurer of 73 funds in the Fund Complex. |
| 2. | The Statement of Additional Information includes additional information about the Trustees and is available, without charge, upon request, by calling 1-800-222-8222 or by visiting the website at wellsfargoadvantagefunds.com. |
| | | | |
| 26 | | Wells Fargo Advantage Intrinsic Small Cap Value Fund | | Other information (unaudited) |
BOARD CONSIDERATION OF INVESTMENT ADVISORY AND SUB-ADVISORY AGREEMENTS:
Under Section 15 of the Investment Company Act of 1940 (the “1940 Act”), the Board of Trustees (the “Board”) of Wells Fargo Funds Trust (the “Trust”), all the members of which have no direct or indirect interest in the investment advisory and sub-advisory agreements and are not “interested persons” of the Trust, as defined in the 1940 Act (the “Independent Trustees”), must determine whether to approve the continuation of the Trust’s investment advisory and sub-advisory agreements. In this regard, at in-person meetings held on March 27-28, 2014 (the “March Meeting”) and May 15-16, 2014 (the “May Meeting”, and together with the March Meeting, the “Meetings”), the Board reviewed: (i) an investment advisory agreement with Wells Fargo Funds Management, LLC (“Funds Management”) for Wells Fargo Advantage Intrinsic Small Cap Value Fund (the “Fund”) and (ii) an investment sub-advisory agreement with Metropolitan West Capital Management, LLC (the “Sub-Adviser”), an affiliate of Funds Management, for the Fund. The investment advisory agreement with Funds Management and the investment sub-advisory agreement with the Sub-Adviser are collectively referred to as the “Advisory Agreements.”
At the May Meeting, the Board received the information, considered the factors and reached the conclusions discussed below, and unanimously approved the renewal of the Advisory Agreements, as it had done at the March Meeting.
At the Meetings, the Board considered the factors and reached the conclusions described below relating to the selection of Funds Management and the Sub-Adviser and the continuation of the Advisory Agreements. Prior to the Meetings, the Trustees conferred extensively among themselves and with representatives of Funds Management about these matters. Also, the Board has adopted a team-based approach, with each team consisting of a sub-set of Trustees, to assist the full Board in the discharge of its duties in reviewing performance and other matters throughout the year. The Independent Trustees were assisted in their evaluation of the Advisory Agreements by independent legal counsel, from whom they received separate legal advice and with whom they met separately.
In providing information to the Board, Funds Management and the Sub-Adviser were guided by a detailed set of requests for information submitted to them by independent legal counsel on behalf of the Independent Trustees at the start of the Board’s annual contract renewal process earlier in 2014. In considering and approving the Advisory Agreements, the Trustees considered the information they believed relevant, including but not limited to the information discussed below. The Board considered not only the specific information presented in connection with the Meetings, but also the knowledge gained over time through interaction with Funds Management and the Sub-Adviser about various topics. In this regard, the Board reviewed reports of Funds Management at each of its quarterly meetings, which included, among other things, portfolio reviews and performance reports. In addition, the Board and the teams mentioned above confer with portfolio managers at various times throughout the year. The Board did not identify any particular information or consideration that was all-important or controlling, and each individual Trustee may have attributed different weights to various factors.
After its deliberations, the Board unanimously approved the continuation of the Advisory Agreements and determined that the compensation payable to Funds Management and the Sub-Adviser is reasonable. The Board considered the continuation of the Advisory Agreements for the Fund as part of its consideration of the continuation of advisory agreements for funds across the complex, but its approvals were made on a fund-by-fund basis. The following summarizes a number of important, but not necessarily all, factors considered by the Board in support of its approvals.
Nature, extent and quality of services
The Board received and considered various information regarding the nature, extent and quality of services provided to the Fund by Funds Management and the Sub-Adviser under the Advisory Agreements. This information included, among other things, a summary of the background and experience of senior management of Funds Management, and the qualifications, background, tenure and responsibilities of each of the portfolio managers primarily responsible for the day-to-day portfolio management of the Fund.
The Board evaluated the ability of Funds Management and the Sub-Adviser to attract and retain qualified investment professionals, including research, advisory and supervisory personnel. The Board further considered the compliance programs and compliance records of Funds Management and the Sub-Adviser. In addition, the Board took into account the full range of services provided to the Fund by Funds Management and its affiliates.
Fund performance and expenses
The Board considered the performance results for the Fund over various time periods ended December 31, 2013. The Board also considered these results in comparison to the performance of funds in a universe that was determined by
| | | | | | |
| Other information (unaudited) | | Wells Fargo Advantage Intrinsic Small Cap Value Fund | | | 27 | |
Lipper Inc. (“Lipper”) to be similar to the Fund (the “Universe”), and in comparison to the Fund’s benchmark index and to other comparative data. Lipper is an independent provider of investment company data. The Board received a description of the methodology used by Lipper to select the mutual funds in the performance Universe. The Board noted that the performance of the Fund (Administrator Class) was lower than the average performance of the Universe for the one-, five- and ten-year periods under review and in range of the average performance of the Universe for the three year period. The Board also noted that the performance of the Fund was in range of its benchmark, the Russell 2000® Value Index, for all periods under review except for the ten-year period.
The Board received information concerning, and discussed factors contributing to, the underperformance of the Fund relative to the Universe for the three-year period and the benchmark for the ten-year period. Funds Management advised the Board about the market conditions and investment decisions that it believed contributed to the underperformance during that period. The Board noted that the Sub-Adviser assumed investment management responsibilities for the Fund in June 2010 and noted the Fund’s recent improved performance. The Board was satisfied with the explanation of factors contributing to underperformance and with the steps being taken by Funds Management and the Sub-Adviser to address the Fund’s investment performance.
The Board also received and considered information regarding the Fund’s net operating expense ratios and their various components, including actual management fees (which reflect fee waivers, if any, and include advisory, administration and transfer agent fees), custodian and other non-management fees, Rule 12b-1 and non-Rule 12b-1 service fees and fee waiver and expense reimbursement arrangements. The Board considered these ratios in comparison to the median ratios of funds in class-specific expense groups that were determined by Lipper to be similar to the Fund (the “Groups”). The Board received a description of the methodology used by Lipper to select the mutual funds in the expense Groups and an explanation of year-to-year variations in the funds comprising such expense Groups and their expense ratios. Based on the Lipper reports, the Board noted that the net operating expense ratios of the Fund were lower than or in range of the median net operating expense ratios of the expense Groups for all classes of shares.
Based on its consideration of the factors and information it deemed relevant, including those described here, the Board concluded that the overall performance and expense structure of the Fund supported the re-approval of the Advisory Agreements.
Investment advisory and sub-advisory fee rates
The Board reviewed and considered the contractual investment advisory fee rates that are payable by the Fund to Funds Management for investment advisory services (the “Advisory Agreement Rates”), both on a stand-alone basis and on a combined basis with the Fund’s fund-level and class-level contractual administration fee rates (the “Management Rates”). The Board noted that the administration fees payable to Funds Management include transfer agency and sub-transfer agency costs. The Board also reviewed and considered the contractual investment sub-advisory fee rates that are payable by Funds Management to the Sub-Adviser for investment sub-advisory services (the “Sub-Advisory Agreement Rates”).
Among other information reviewed by the Board was a comparison of the Management Rates of the Fund with those of other funds in the expense Groups at a common asset level. The Board noted that the Management Rates of the Fund were in range of the average rates of the expense Groups for all classes of shares.
The Board also received and considered information about the portion of the total advisory fee that was retained by Funds Management after payment of the fee to the Sub-Adviser for sub-advisory services. In assessing the reasonableness of this amount, the Board received and evaluated information about the nature and extent of responsibilities retained and risks assumed by Funds Management and not delegated to or assumed by the Sub-Adviser, and about Funds Management’s on-going oversight services. However, given the affiliation between Funds Management and the Sub-Adviser, the Board ascribed limited relevance to the allocation of the advisory fee between them.
The Board also received and considered information about the nature and extent of services offered and fee rates charged by Funds Management and the Sub-Adviser to other types of clients with investment strategies similar to those of the Fund. In this regard, the Board received information about the significantly greater scope of services, and compliance, reporting and other legal burdens and risks of managing mutual funds compared with those associated with managing assets of non-mutual fund clients such as collective funds or institutional separate accounts.
Based on its consideration of the factors and information it deemed relevant, including those described here, the Board determined that the Advisory Agreement Rates and the Sub-Advisory Agreement Rates were reasonable in light of the services covered by the Advisory Agreements.
| | | | |
| 28 | | Wells Fargo Advantage Intrinsic Small Cap Value Fund | | Other information (unaudited) |
Profitability
The Board received and considered information concerning the profitability of Funds Management, as well as the profitability of Wells Fargo as a whole, from providing services to the Fund and the fund family as a whole. The Board did not receive or consider to be necessary separate profitability information with respect to the Sub-Adviser, because its profitability information was subsumed in the collective Wells Fargo profitability analysis.
Funds Management explained the methodologies and estimates that it used in calculating profitability. Among other things, the Board noted that the levels of profitability reported on a fund-by-fund basis varied widely, depending on factors such as the size and type of fund. Based on its review, the Board did not deem the profits reported by Funds Management to be at a level that would prevent it from approving the continuation of the Advisory Agreements.
Economies of scale
With respect to possible economies of scale, the Board noted the existence of breakpoints in the Fund’s advisory fee and administration fee structure, which operate generally to reduce the Fund’s expense ratios as the Fund grows in size. It considered that, for a small fund or a fund that shrinks in size, breakpoints conversely can result in higher fee levels. The Board also considered that fee waiver and expense reimbursement arrangements and competitive fee rates at the outset are means of sharing potential economies of scale with shareholders of the Fund and the fund family as a whole. The Board considered Funds Management’s view that any analyses of potential economies of scale in managing a particular fund are inherently limited in light of the joint and common costs and investments that Funds Management incurs across the fund family as a whole.
The Board concluded that the Fund’s fee and expense arrangements, including contractual breakpoints, constituted a reasonable approach to sharing potential economies of scale with the Fund and its shareholders.
Other benefits to Funds Management and the Sub-Adviser
The Board received and considered information regarding potential “fall-out” or ancillary benefits received by Funds Management and its affiliates, including the Sub-Adviser, as a result of their relationships with the Fund. Ancillary benefits could include, among others, benefits directly attributable to other relationships with the Fund and benefits potentially derived from an increase in Funds Management’s and the Sub-Adviser’s business as a result of their relationships with the Fund. The Board noted that various affiliates of Funds Management may receive distribution-related fees, shareholder servicing payments and sub-transfer agency fees in respect of shares sold or held through them and services provided.
The Board also reviewed information about soft dollar credits earned and utilized by the Sub-Adviser, fees earned by Funds Management and the Sub-Adviser from managing a private investment vehicle for the fund family’s securities lending collateral and commissions earned by an affiliated broker from portfolio transactions.
Based on its consideration of the factors and information it deemed relevant, including those described here, the Board did not find that any ancillary benefits received by Funds Management and its affiliates, including the Sub-Adviser, were unreasonable.
Conclusion
After considering the above-described factors and based on its deliberations and its evaluation of the information described above, the Board unanimously approved the continuation of the Advisory Agreements for an additional one-year period and determined that the compensation payable to Funds Management and the Sub-Adviser is reasonable.
| | | | | | |
| List of abbreviations | | Wells Fargo Advantage Intrinsic Small Cap Value Fund | | | 29 | |
The following is a list of common abbreviations for terms and entities that may have appeared in this report.
| ACA | — ACA Financial Guaranty Corporation |
| ADR | — American depositary receipt |
| ADS | — American depositary shares |
| AGC | — Assured Guaranty Corporation |
| AGM | — Assured Guaranty Municipal |
| Ambac | — Ambac Financial Group Incorporated |
| AMT | — Alternative minimum tax |
| BAN | — Bond anticipation notes |
| BHAC | — Berkshire Hathaway Assurance Corporation |
| CAB | — Capital appreciation bond |
| CCAB | — Convertible capital appreciation bond |
| CDA | — Community Development Authority |
| CDO | — Collateralized debt obligation |
| DRIVER | — Derivative inverse tax-exempt receipts |
| DW&P | — Department of Water & Power |
| DWR | — Department of Water Resources |
| ECFA | — Educational & Cultural Facilities Authority |
| EDA | — Economic Development Authority |
| EDFA | — Economic Development Finance Authority |
| ETF | — Exchange-traded fund |
| FDIC | — Federal Deposit Insurance Corporation |
| FFCB | — Federal Farm Credit Banks |
| FGIC | — Financial Guaranty Insurance Corporation |
| FHA | — Federal Housing Administration |
| FHLB | — Federal Home Loan Bank |
| FHLMC | — Federal Home Loan Mortgage Corporation |
| FICO | — The Financing Corporation |
| FNMA | — Federal National Mortgage Association |
| GDR | — Global depositary receipt |
| GNMA | — Government National Mortgage Association |
| HCFR | — Healthcare facilities revenue |
| HEFA | — Health & Educational Facilities Authority |
| HEFAR | — Higher education facilities authority revenue |
| HFA | — Housing Finance Authority |
| HFFA | — Health Facilities Financing Authority |
| HUD | — Department of Housing and Urban Development |
| IDA | — Industrial Development Authority |
| IDAG | — Industrial Development Agency |
| KRW | — Republic of Korea won |
| LIBOR | — London Interbank Offered Rate |
| LLC | — Limited liability company |
| LLLP | — Limited liability limited partnership |
| LLP | — Limited liability partnership |
| MBIA | — Municipal Bond Insurance Association |
| MFHR | — Multifamily housing revenue |
| MSTR | — Municipal securities trust receipts |
| MUD | — Municipal Utility District |
| National | — National Public Finance Guarantee Corporation |
| PCFA | — Pollution Control Financing Authority |
| PCL | — Public Company Limited |
| PCR | — Pollution control revenue |
| PFA | — Public Finance Authority |
| PFFA | — Public Facilities Financing Authority |
| PFOTER | — Puttable floating option tax-exempt receipts |
| plc | — Public limited company |
| PUTTER | — Puttable tax-exempt receipts |
| R&D | — Research & development |
| Radian | — Radian Asset Assurance |
| RAN | — Revenue anticipation notes |
| RDA | — Redevelopment Authority |
| RDFA | — Redevelopment Finance Authority |
| REIT | — Real estate investment trust |
| ROC | — Reset option certificates |
| SAVRS | — Select auction variable rate securities |
| SBA | — Small Business Authority |
| SFHR | — Single-family housing revenue |
| SFMR | — Single-family mortgage revenue |
| SPA | — Standby purchase agreement |
| SPDR | — Standard & Poor’s Depositary Receipts |
| STRIPS | — Separate trading of registered interest and principal securities |
| TAN | — Tax anticipation notes |
| TIPS | — Treasury inflation-protected securities |
| TRAN | — Tax revenue anticipation notes |
| TTFA | — Transportation Trust Fund Authority |
| TVA | — Tennessee Valley Authority |
This page is intentionally left blank.
This page is intentionally left blank.
This page is intentionally left blank.


For more information
More information about Wells Fargo Advantage Funds is available free upon request. To obtain literature, please write, email, visit the Fund’s website, or call:
Wells Fargo Advantage Funds
P.O. Box 8266
Boston, MA 02266-8266
Email: wfaf@wellsfargo.com
Website: wellsfargoadvantagefunds.com
Individual investors: 1-800-222-8222
Retail investment professionals: 1-888-877-9275
Institutional investment professionals: 1-866-765-0778
This report and the financial statements contained herein are submitted for the general information of the shareholders of Wells Fargo Advantage Funds. If this report is used for promotional purposes, distribution of the report must be accompanied or preceded by a current prospectus. Before investing, please consider the investment objectives, risks, charges, and expenses of the investment. For a current prospectus and, if available, a summary prospectus, containing this information, call 1-800-222-8222 or visit the Fund’s website at wellsfargoadvantagefunds.com. Read the prospectus carefully before you invest or send money.
Wells Fargo Funds Management, LLC, a wholly owned subsidiary of Wells Fargo & Company, provides investment advisory and administrative services for Wells Fargo Advantage Funds. Other affiliates of Wells Fargo & Company provide subadvisory and other services for the Funds. The Funds are distributed by Wells Fargo Funds Distributor, LLC, Member FINRA/SIPC, an affiliate of Wells Fargo & Company.
NOT FDIC INSURED ¡ NO BANK GUARANTEE ¡ MAY LOSE VALUE
© 2014 Wells Fargo Funds Management, LLC. All rights reserved.
| | |
 | | 228298 11-14 SA242/SAR242 09-14 |

Wells Fargo Advantage
Small Cap Opportunities Fund

Semi-Annual Report
September 30, 2014

Reduce clutter. Save trees.
Sign up for electronic delivery of prospectuses and shareholder reports at wellsfargo.com/advantagedelivery
Contents
The views expressed and any forward-looking statements are as of September 30, 2014, unless otherwise noted, and are those of the Fund managers and/or Wells Fargo Funds Management, LLC. Discussions of individual securities, or the markets generally, or any Wells Fargo Advantage Fund are not intended as individual recommendations. Future events or results may vary significantly from those expressed in any forward-looking statements; the views expressed are subject to change at any time in response to changing circumstances in the market. Wells Fargo Funds Management, LLC and the Fund disclaim any obligation to publicly update or revise any views expressed or forward-looking statements.
NOT FDIC INSURED ¡ NO BANK GUARANTEE ¡ MAY LOSE VALUE
| | | | |
| 2 | | Wells Fargo Advantage Small Cap Opportunities Fund | | Letter to shareholders (unaudited) |

Karla M. Rabusch
President
Wells Fargo Advantage Funds
Despite geopolitical challenges, U.S. economic numbers showed improvement.
Dear Valued Shareholder:
We are pleased to offer you this semi-annual report for the Wells Fargo Advantage Small Cap Opportunities Fund for the six-month period that ended September 30, 2014. The period was marked by heightened geopolitical uncertainty as the U.S. and Europe continued to confront Russia over Ukraine and as Islamic militants (formerly known as ISIS) gained territory in Iraq and Syria. Toward the end of the reporting period, market volatility increased as renewed fears of slowing global growth took hold, and investors began to price in expectations that the U.S. Federal Reserve (Fed) was finally looking to raise short-term interest rates. Although mid-cap stocks (measured by the Russell Midcap® Index1) ended the period with a single-digit gain, small-cap stocks (measured by the Russell 2000® Index2) ended with a loss.
Major central banks continued to provide stimulus.
Throughout the reporting period, the Federal Open Market Committee (FOMC)—the U.S. Federal Reserve’s monetary policymaking body—kept its key interest rate near zero. Prior to the reporting period, in January 2014, the FOMC began to reduce (or taper) its bond-buying program by $10 billion per month and continued the taper throughout the reporting period. Some anticipated this action would lead to higher interest rates, however, interest rates followed a downward trend, despite short-term volatility. European markets continued to benefit from the European Central Bank’s (ECB’s) actions. In June 2014, the ECB announced a variety of measures aimed at encouraging lending, including cutting its key rate and imposing for the first time a negative interest rate on bank deposits held at the central bank. In September 2014, the ECB cut its key rate again—to 0.05%—and pushed the deposit rate for banks to -0.20%.
Although the geopolitical situation presented challenges, U.S. stock markets gained on positive economic data.
Geopolitical events were major obstacles throughout the reporting period. The ongoing standoff between the West (the U.S., Europe, and their allies) and Russia over Ukraine began in late 2013 and fed into stock market volatility early in 2014. The situation’s effect on the stock market faded as investors began to believe that the situation would not result in war, but as of September 2014, the situation had resulted in economic sanctions from the West against Russia. However, even as the market began to focus less on that situation, the advance of Islamic militants in Iraq and Syria led to airstrikes by the U.S. and its allies and fears of a regional war in the Middle East.
Despite geopolitical challenges, U.S. economic numbers showed improvement. The unemployment rate continued its slow improvement, declining from 6.3% in April 2014 to 5.9% in September 2014. Although investors received an unpleasant surprise when gross domestic product (GDP) growth for the first quarter of 2014 declined by 2.1% on an annualized basis, several commentators suggested that harsh winter weather may have dampened economic activity. Economic growth did accelerate in the second quarter of 2014, with an annualized GDP growth rate of 4.6%.
| 1. | The Russell Midcap® Index measures the performance of the 800 smallest companies in the Russell 1000® Index, which represent approximately 25% of the total market capitalization of the Russell 1000 Index. You cannot invest directly in an index. |
| 2. | The Russell 2000® Index measures the performance of the 2,000 smallest companies in the Russell 3000® Index, which represents approximately 8% of the total market capitalization of the Russell 3000 Index. You cannot invest directly in an index. |
| | | | | | |
| Letter to shareholders (unaudited) | | Wells Fargo Advantage Small Cap Opportunities Fund | | | 3 | |
Investors’ positive outlook for the U.S. economy contributed to a solid domestic stock market for most of the period. However, slowing global economic growth, combined with renewed geopolitical concerns (including protests in Hong Kong), caused stock market weakness in September 2014. The Russell Midcap Index ended the period with a 3.2% gain. Small-cap stocks, however, were hit harder by the late-period uncertainty and the Russell 2000 Index ended with a -5.5% return. Growth stocks outperformed value stocks in both the small-cap and the mid-cap space.
Don’t let short-term uncertainty derail long-term investment goals.
Periods of uncertainty can present challenges, but experience has taught us that maintaining long-term investment goals can be an effective way to plan for the future. To help you create a sound strategy based on your personal goals and risk tolerance, Wells Fargo Advantage Funds offers more than 100 mutual funds and other investments spanning a wide range of asset classes and investment styles. Although diversification cannot guarantee an investment profit or prevent losses, we believe it can be an effective way to manage investment risk and potentially smooth out overall portfolio performance. We encourage investors to know their investments and to understand that appropriate levels of risk-taking may unlock opportunities.
Thank you for choosing to invest with Wells Fargo Advantage Funds. We appreciate your confidence in us and remain committed to helping you meet your financial needs. For current information about your fund investments, contact your investment professional, visit our website at wellsfargoadvantagefunds.com, or call us directly at 1-800-222-8222. We are available 24 hours a day, 7 days a week.
Sincerely,

Karla M. Rabusch
President
Wells Fargo Advantage Funds
Investors’ positive outlook for the U.S. economy contributed to a solid domestic stock market for most of the period.
| | | | |
| 4 | | Wells Fargo Advantage Small Cap Opportunities Fund | | Performance highlights (unaudited) |
Investment objective
The Fund seeks long-term capital appreciation.
Adviser
Wells Fargo Funds Management, LLC
Subadviser
Schroder Investment Management North America Inc.
Portfolio manager
Jenny B. Jones
Average annual total returns (%) as of September 30, 2014
| | | | | | | | | | | | | | | | | | | | | | |
| | | | | | | | | | | | | | Expense ratios1 (%) | |
| | | Inception date | | 1 year | | | 5 year | | | 10 year | | | Gross | | | Net2 | |
| Administrator Class (NVSOX) | | 8-1-1993 | | | 6.38 | | | | 13.04 | | | | 9.96 | | | | 1.27 | | | | 1.22 | |
| Russell 2000® Index3 | | – | | | 3.93 | | | | 14.29 | | | | 8.19 | | | | – | | | | – | |
Figures quoted represent past performance, which is no guarantee of future results, and do not reflect taxes that a shareholder may pay on fund distributions or the redemption of fund shares. Investment return and principal value of an investment will fluctuate so that an investor’s shares, when redeemed, may be worth more or less than their original cost. Current performance may be lower or higher than the performance data quoted, which assumes the reinvestment of dividends and capital gains. Current month-end performance is available on the Fund’s website, wellsfargoadvantagefunds.com.
Index returns do not include transaction costs associated with buying and selling securities, any mutual fund fees or expenses, or any taxes. It is not possible to invest directly in an index.
Administrator Class shares are sold without a front-end sales charge or contingent deferred sales charge.
Stock values fluctuate in response to the activities of individual companies and general market and economic conditions. Smaller-company stocks tend to be more volatile and less liquid than those of larger companies. The use of derivatives may reduce returns and/or increase volatility. Consult the Fund’s prospectus for additional information on these and other risks.
Please see footnotes on page 5.
| | | | | | |
| Performance highlights (unaudited) | | Wells Fargo Advantage Small Cap Opportunities Fund | | | 5 | |
| | | | |
| Ten largest equity holdings4 (%) as of September 30, 2014 | |
Berry Plastics Group Incorporated | | | 2.24 | |
Brown & Brown Incorporated | | | 2.22 | |
Parexel International Corporation | | | 1.62 | |
Northwestern Corporation | | | 1.43 | |
Hexcel Corporation | | | 1.38 | |
Applied Industrial Technologies Incorporated | | | 1.36 | |
Kennedy Wilson Holdings Incorporated | | | 1.36 | |
LifePoint Hospitals Incorporated | | | 1.36 | |
Steven Madden Limited | | | 1.36 | |
Minerals Technologies Incorporated | | | 1.28 | |
| | |
| Sector distribution5 as of September 30, 2014 |
|
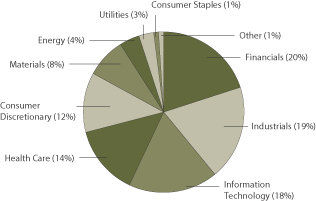 |
| 1. | Reflects the expense ratios as stated in the most recent prospectus, which include the impact of 0.02% in acquired fund fees and expenses. The expense ratios shown are subject to change and may differ from the annualized expense ratios shown in the financial highlights of this report, which do not include acquired fund fees and expenses. |
| 2. | The Adviser has committed through July 31, 2015, to waive fees and/or reimburse expenses to the extent necessary to cap the Fund’s Total Annual Fund Operating Expenses After Fee Waiver, excluding certain expenses, at 1.20% for Administrator Class. After this time, the cap may be increased or the commitment to maintain the cap may be terminated only with the approval of the Board of Trustees. Brokerage commissions, stamp duty fees, interest, taxes, acquired fund fees and expenses, and extraordinary expenses are excluded from the cap. Without this cap, the Fund’s returns would have been lower. |
| 3. | The Russell 2000® Index measures the performance of the 2,000 smallest companies in the Russell 3000® Index, which represents approximately 8% of the total market capitalization of the Russell 3000 Index. You cannot invest directly in an index. |
| 4. | The ten largest equity holdings are calculated based on the value of the securities divided by total net assets of the Fund. Holdings are subject to change and may have changed since the date specified. |
| 5. | Sector distribution is subject to change and is calculated based on the total long-term investments of the Fund. |
| | | | |
| 6 | | Wells Fargo Advantage Small Cap Opportunities Fund | | Fund expenses (unaudited) |
As a shareholder of the Fund, you incur ongoing costs and other Fund expenses. This example is intended to help you understand your ongoing costs (in dollars) of investing in the Fund and to compare these costs with the ongoing costs of investing in other mutual funds.
The example is based on an investment of $1,000 invested at the beginning of the six-month period and held for the entire period from April 1, 2014 to September 30, 2014.
Actual expenses
The “Actual” line of the table below provides information about actual account values and actual expenses. You may use the information in this line, together with the amount you invested, to estimate the expenses that you paid over the period. Simply divide your account value by $1,000 (for example, an $8,600 account value divided by $1,000 = 8.6), then multiply the result by the number in the “Actual” line under the heading entitled “Expenses paid during period” for your applicable class of shares to estimate the expenses you paid on your account during this period.
Hypothetical example for comparison purposes
The “Hypothetical” line of the table below provides information about hypothetical account values and hypothetical expenses based on the Fund’s actual expense ratio and an assumed rate of return of 5% per year before expenses, which is not the Fund’s actual return. The hypothetical account values and expenses may not be used to estimate the actual ending account balance or expenses you paid for the period. You may use this information to compare the ongoing costs of investing in the Fund and other funds. To do so, compare this 5% hypothetical example with the 5% hypothetical examples that appear in the shareholder reports of the other funds.
Please note that the expenses shown in the table are meant to highlight your ongoing costs. Therefore, the “Hypothetical” line of the table is useful in comparing ongoing costs only and will not help you determine the relative total costs of owning different funds.
| | | | | | | | | | | | | | | | |
| | | Beginning
account value
4-1-2014 | | | Ending
account value
9-30-2014 | | | Expenses
paid during
the period¹ | | | Net annualized
expense ratio | |
Administrator Class | | | | | | | | | | | | | | | | |
Actual | | $ | 1,000.00 | | | $ | 977.06 | | | $ | 5.95 | | | | 1.20 | % |
Hypothetical (5% return before expenses) | | $ | 1,000.00 | | | $ | 1,019.05 | | | $ | 6.07 | | | | 1.20 | % |
| 1. | Expenses paid is equal to the annualized expense ratio multiplied by the average account value over the period, multiplied by the number of days in the most recent fiscal half-year divided by the number of days in the fiscal year (to reflect the one-half-year period). |
| | | | | | |
| Portfolio of investments—September 30, 2014 (unaudited) | | Wells Fargo Advantage Small Cap Opportunities Fund | | | 7 | |
| | | | | | | | | | | | |
| Security name | | | | | | Shares | | | Value | |
| | | | | | | | | | | | |
| | | | |
Common Stocks: 92.72% | | | | | | | | | | | | |
| | | | |
Consumer Discretionary: 11.03% | | | | | | | | | | | | |
| | | | |
| Auto Components: 0.90% | | | | | | | | | | | | |
Fox Factory Holding Corporation † | | | | | | | 85,553 | | | $ | 1,326,072 | |
Motorcar Parts of America Incorporated † | | | | | | | 61,083 | | | | 1,662,068 | |
| | | | |
| | | | | | | | | | | 2,988,140 | |
| | | | | | | | | | | | |
| | | | |
| Diversified Consumer Services: 1.03% | | | | | | | | | | | | |
Chegg Incorporated †« | | | | | | | 198,200 | | | | 1,236,768 | |
Servicemaster Global Holdings Incorporated † | | | | | | | 89,713 | | | | 2,171,055 | |
| | | | |
| | | | | | | | | | | 3,407,823 | |
| | | | | | | | | | | | |
| | | | |
| Hotels, Restaurants & Leisure: 3.01% | | | | | | | | | | | | |
ClubCorp Holdings Incorporated | | | | | | | 137,300 | | | | 2,722,659 | |
Domino’s Pizza Incorporated | | | | | | | 19,400 | | | | 1,493,024 | |
Home Inns & Hotels Management ADR †« | | | | | | | 40,900 | | | | 1,185,691 | |
Red Robin Gourmet Burgers Incorporated † | | | | | | | 50,100 | | | | 2,850,690 | |
Six Flags Entertainment Corporation | | | | | | | 49,000 | | | | 1,685,110 | |
| | | | |
| | | | | | | | | | | 9,937,174 | |
| | | | | | | | | | | | |
| | | | |
| Household Durables: 0.18% | | | | | | | | | | | | |
Harman International Industries Incorporated | | | | | | | 5,900 | | | | 578,436 | |
| | | | | | | | | | | | |
| | | | |
| Leisure Products: 0.93% | | | | | | | | | | | | |
Brunswick Corporation | | | | | | | 56,800 | | | | 2,393,552 | |
Callaway Golf Company | | | | | | | 93,900 | | | | 679,836 | |
| | | | |
| | | | | | | | | | | 3,073,388 | |
| | | | | | | | | | | | |
| | | | |
| Media: 2.42% | | | | | | | | | | | | |
AMC Entertainment Holdings Class A | | | | | | | 138,400 | | | | 3,181,816 | |
Cinedigm Corporation † | | | | | | | 576,900 | | | | 894,195 | |
John Wiley & Sons Incorporated Class A | | | | | | | 29,600 | | | | 1,660,856 | |
National CineMedia Incorporated | | | | | | | 156,300 | | | | 2,267,913 | |
| | | | |
| | | | | | | | | | | 8,004,780 | |
| | | | | | | | | | | | |
| | | | |
| Specialty Retail: 1.20% | | | | | | | | | | | | |
American Eagle Outfitters Incorporated « | | | | | | | 274,300 | | | | 3,982,836 | |
| | | | | | | | | | | | |
| | | | |
| Textiles, Apparel & Luxury Goods: 1.36% | | | | | | | | | | | | |
Steven Madden Limited † | | | | | | | 139,800 | | | | 4,505,754 | |
| | | | | | | | | | | | |
| | | | |
Consumer Staples: 0.94% | | | | | | | | | | | | |
| | | | |
| Food Products: 0.94% | | | | | | | | | | | | |
Dean Foods Company | | | | | | | 233,950 | | | | 3,099,838 | |
| | | | | | | | | | | | |
| | | | |
Energy: 3.86% | | | | | | | | | | | | |
| | | | |
| Energy Equipment & Services: 0.56% | | | | | | | | | | | | |
Bristow Group Incorporated | | | | | | | 27,400 | | | | 1,841,280 | |
| | | | | | | | | | | | |
The accompanying notes are an integral part of these financial statements.
| | | | |
| 8 | | Wells Fargo Advantage Small Cap Opportunities Fund | | Portfolio of investments—September 30, 2014 (unaudited) |
| | | | | | | | | | | | |
| Security name | | | | | | Shares | | | Value | |
| | | | | | | | | | | | |
| | | | |
| Oil, Gas & Consumable Fuels: 3.30% | | | | | | | | | | | | |
Carrizo Oil & Gas Incorporated † | | | | | | | 61,500 | | | $ | 3,309,930 | |
Jones Energy Incorporated † | | | | | | | 95,500 | | | | 1,793,490 | |
Laredo Petroleum Holdings Incorporated † | | | | | | | 104,800 | | | | 2,348,568 | |
Synergy Resources Corporation † | | | | | | | 150,800 | | | | 1,838,252 | |
Teekay Corporation | | | | | | | 24,634 | | | | 1,634,712 | |
| | | | |
| | | | | | | | | | | 10,924,952 | |
| | | | | | | | | | | | |
| | | | |
Financials: 18.42% | | | | | | | | | | | | |
| | | | |
| Banks: 4.95% | | | | | | | | | | | | |
First Citizens BancShares Corporation Class A | | | | | | | 8,212 | | | | 1,778,966 | |
First Horizon National Corporation | | | | | | | 111,900 | | | | 1,374,132 | |
FirstMerit Corporation | | | | | | | 56,300 | | | | 990,880 | |
Heartland Financial USA Incorporated | | | | | | | 33,600 | | | | 802,368 | |
Heritage Financial Corporation | | | | | | | 73,900 | | | | 1,170,576 | |
Lakeland Financial Corporation | | | | | | | 30,500 | | | | 1,143,750 | |
Old National Bancorp | | | | | | | 269,772 | | | | 3,498,943 | |
Simmons First National Corporation | | | | | | | 37,500 | | | | 1,444,500 | |
South State Corporation | | | | | | | 38,800 | | | | 2,169,696 | |
Wintrust Financial Corporation | | | | | | | 44,600 | | | | 1,992,282 | |
| | | | |
| | | | | | | | | | | 16,366,093 | |
| | | | | | | | | | | | |
| | | | |
| Capital Markets: 3.18% | | | | | | | | | | | | |
FXCM Incorporated Class A « | | | | | | | 186,000 | | | | 2,948,100 | |
Golub Capital BDC Incorporated « | | | | | | | 153,857 | | | | 2,454,019 | |
HFF Incorporated Class A | | | | | | | 82,900 | | | | 2,399,955 | |
Stifel Financial Corporation † | | | | | | | 57,731 | | | | 2,707,007 | |
| | | | |
| | | | | | | | | | | 10,509,081 | |
| | | | | | | | | | | | |
| | | | |
| Diversified Financial Services: 0.60% | | | | | | | | | | | | |
Compass Diversified Holdings | | | | | | | 113,200 | | | | 1,982,132 | |
| | | | | | | | | | | | |
| | | | |
| Insurance: 4.41% | | | | | | | | | | | | |
Amerisafe Incorporated | | | | | | | 47,900 | | | | 1,873,369 | |
Brown & Brown Incorporated | | | | | | | 228,600 | | | | 7,349,490 | |
ProAssurance Corporation | | | | | | | 63,500 | | | | 2,798,445 | |
Reinsurance Group of America Incorporated | | | | | | | 32,200 | | | | 2,580,186 | |
| | | | |
| | | | | | | | | | | 14,601,490 | |
| | | | | | | | | | | | |
| | | | |
| Real Estate Management & Development: 1.36% | | | | | | | | | | | | |
Kennedy Wilson Holdings Incorporated | | | | | | | 188,300 | | | | 4,511,668 | |
| | | | | | | | | | | | |
| | | | |
| REITs: 3.92% | | | | | | | | | | | | |
Blackstone Mortgage Trust Incorporated Class A | | | | | | | 54,439 | | | | 1,475,297 | |
Equity Lifestyle Properties Incorporated | | | | | | | 51,832 | | | | 2,195,604 | |
Mid-America Apartment Communities Incorporated | | | | | | | 39,403 | | | | 2,586,807 | |
Parkway Properties Incorporated | | | | | | | 141,462 | | | | 2,656,656 | |
Redwood Trust Incorporated « | | | | | | | 85,994 | | | | 1,425,781 | |
Terreno Realty Corporation | | | | | | | 139,395 | | | | 2,624,808 | |
| | | | |
| | | | | | | | | | | 12,964,953 | |
| | | | | | | | | | | | |
The accompanying notes are an integral part of these financial statements.
| | | | | | |
| Portfolio of investments—September 30, 2014 (unaudited) | | Wells Fargo Advantage Small Cap Opportunities Fund | | | 9 | |
| | | | | | | | | | | | |
| Security name | | | | | | Shares | | | Value | |
| | | | | | | | | | | | |
| | | | |
Health Care: 13.42% | | | | | | | | | | | | |
| | | | |
| Biotechnology: 1.07% | | | | | | | | | | | | |
Cepheid Incorporated † | | | | | | | 64,200 | | | $ | 2,826,726 | |
Lexicon Genetics Incorporated †« | | | | | | | 506,500 | | | | 714,165 | |
| | | | |
| | | | | | | | | | | 3,540,891 | |
| | | | | | | | | | | | |
| | | | |
| Health Care Equipment & Supplies: 4.10% | | | | | | | | | | | | |
Cooper Companies Incorporated | | | | | | | 16,800 | | | | 2,616,600 | |
K2M Group Holdings Incorporated †« | | | | | | | 63,545 | | | | 916,954 | |
Masimo Corporation † | | | | | | | 48,700 | | | | 1,036,336 | |
Sirona Dental Systems Incorporated † | | | | | | | 33,100 | | | | 2,538,108 | |
Spectranetics Corporation † | | | | | | | 70,400 | | | | 1,870,528 | |
Trinity Biotech plc | | | | | | | 83,900 | | | | 1,532,853 | |
Unilife Corporation †« | | | | | | | 348,069 | | | | 798,818 | |
West Pharmaceutical Services Incorporated | | | | | | | 50,700 | | | | 2,269,332 | |
| | | | |
| | | | | | | | | | | 13,579,529 | |
| | | | | | | | | | | | |
| | | | |
| Health Care Providers & Services: 4.17% | | | | | | | | | | | | |
Centene Corporation † | | | | | | | 39,600 | | | | 3,275,316 | |
HealthSouth Rehabilitation Corporation | | | | | | | 70,682 | | | | 2,608,166 | |
LifePoint Hospitals Incorporated † | | | | | | | 64,800 | | | | 4,483,512 | |
Premier Incorporated Class A † | | | | | | | 62,893 | | | | 2,066,664 | |
Surgical Care Affiliates Incorporated † | | | | | | | 50,400 | | | | 1,347,192 | |
| | | | |
| | | | | | | | | | | 13,780,850 | |
| | | | | | | | | | | | |
| | | | |
| Life Sciences Tools & Services: 2.00% | | | | | | | | | | | | |
Fluidigm Corporation † | | | | | | | 51,300 | | | | 1,256,850 | |
Parexel International Corporation † | | | | | | | 84,700 | | | | 5,343,723 | |
| | | | |
| | | | | | | | | | | 6,600,573 | |
| | | | | | | | | | | | |
| | | | |
| Pharmaceuticals: 2.08% | | | | | | | | | | | | |
Aerie Pharmaceuticals Incorporated † | | | | | | | 78,900 | | | | 1,632,441 | |
Catalent Incorporated † | | | | | | | 83,190 | | | | 2,082,246 | |
Salix Pharmaceuticals Limited † | | | | | | | 14,800 | | | | 2,312,352 | |
The Medicines Company † | | | | | | | 38,600 | | | | 861,552 | |
| | | | |
| | | | | | | | | | | 6,888,591 | |
| | | | | | | | | | | | |
| | | | |
Industrials: 18.94% | | | | | | | | | | | | |
| | | | |
| Aerospace & Defense: 1.38% | | | | | | | | | | | | |
Hexcel Corporation † | | | | | | | 115,100 | | | | 4,569,470 | |
| | | | | | | | | | | | |
| | | | |
| Airlines: 1.66% | | | | | | | | | | | | |
Allegiant Travel Company | | | | | | | 25,492 | | | | 3,152,341 | |
Spirit Airlines Incorporated † | | | | | | | 33,800 | | | | 2,336,932 | |
| | | | |
| | | | | | | | | | | 5,489,273 | |
| | | | | | | | | | | | |
| | | | |
| Building Products: 1.96% | | | | | | | | | | | | |
Fortune Brands Home & Security Incorporated | | | | | | | 51,300 | | | | 2,108,943 | |
Simpson Manufacturing Company Incorporated | | | | | | | 94,000 | | | | 2,740,100 | |
The accompanying notes are an integral part of these financial statements.
| | | | |
| 10 | | Wells Fargo Advantage Small Cap Opportunities Fund | | Portfolio of investments—September 30, 2014 (unaudited) |
| | | | | | | | | | | | |
| Security name | | | | | | Shares | | | Value | |
| | | | | | | | | | | | |
| | | | |
| Building Products (continued) | | | | | | | | | | | | |
Universal Forest Products Incorporated | | | | | | | 38,200 | | | $ | 1,631,522 | |
| | | | |
| | | | | | | | | | | 6,480,565 | |
| | | | | | | | | | | | |
| | | | |
| Commercial Services & Supplies: 4.72% | | | | | | | | | | | | |
ABM Industries Incorporated | | | | | | | 32,600 | | | | 837,494 | |
Herman Miller Incorporated | | | | | | | 107,200 | | | | 3,199,920 | |
Matthews International Corporation Class A | | | | | | | 76,400 | | | | 3,353,196 | |
Tetra Tech Incorporated | | | | | | | 149,700 | | | | 3,739,506 | |
US Ecology Incorporated | | | | | | | 46,000 | | | | 2,150,960 | |
Waste Connections Incorporated | | | | | | | 47,990 | | | | 2,328,475 | |
| | | | |
| | | | | | | | | | | 15,609,551 | |
| | | | | | | | | | | | |
| | | | |
| Construction & Engineering: 1.78% | | | | | | | | | | | | |
Dycom Industries Incorporated † | | | | | | | 64,300 | | | | 1,974,653 | |
MYR Group Incorporated † | | | | | | | 29,800 | | | | 717,584 | |
Primoris Services Corporation | | | | | | | 119,576 | | | | 3,209,420 | |
| | | | |
| | | | | | | | | | | 5,901,657 | |
| | | | | | | | | | | | |
| | | | |
| Electrical Equipment: 2.41% | | | | | | | | | | | | |
EnerSys | | | | | | | 25,200 | | | | 1,477,728 | |
Powell Industries Incorporated | | | | | | | 59,100 | | | | 2,414,826 | |
Regal-Beloit Corporation | | | | | | | 63,400 | | | | 4,073,450 | |
| | | | |
| | | | | | | | | | | 7,966,004 | |
| | | | | | | | | | | | |
| | | | |
| Machinery: 1.34% | | | | | | | | | | | | |
Clarcor Incorporated | | | | | | | 13,800 | | | | 870,504 | |
IDEX Corporation | | | | | | | 48,973 | | | | 3,544,176 | |
| | | | |
| | | | | | | | | | | 4,414,680 | |
| | | | | | | | | | | | |
| | | | |
| Professional Services: 0.82% | | | | | | | | | | | | |
On Assignment Incorporated † | | | | | | | 43,600 | | | | 1,170,660 | |
Towers Watson & Company Class A | | | | | | | 15,500 | | | | 1,542,250 | |
| | | | |
| | | | | | | | | | | 2,712,910 | |
| | | | | | | | | | | | |
| | | | |
| Road & Rail: 0.72% | | | | | | | | | | | | |
Genesee & Wyoming Incorporated Class A † | | | | | | | 25,000 | | | | 2,382,750 | |
| | | | | | | | | | | | |
| | | | |
| Trading Companies & Distributors: 2.15% | | | | | | | | | | | | |
Applied Industrial Technologies Incorporated | | | | | | | 98,400 | | | | 4,491,960 | |
Beacon Roofing Supply Incorporated † | | | | | | | 71,400 | | | | 1,819,272 | |
NOW Incorporated †« | | | | | | | 26,600 | | | | 808,906 | |
| | | | |
| | | | | | | | | | | 7,120,138 | |
| | | | | | | | | | | | |
| | | | |
Information Technology: 16.43% | | | | | | | | | | | | |
| | | | |
| Communications Equipment: 1.71% | | | | | | | | | | | | |
Ciena Corporation † | | | | | | | 252,600 | | | | 4,223,472 | |
JDS Uniphase Corporation † | | | | | | | 112,000 | | | | 1,433,600 | |
| | | | |
| | | | | | | | | | | 5,657,072 | |
| | | | | | | | | | | | |
The accompanying notes are an integral part of these financial statements.
| | | | | | |
| Portfolio of investments—September 30, 2014 (unaudited) | | Wells Fargo Advantage Small Cap Opportunities Fund | | | 11 | |
| | | | | | | | | | | | |
| Security name | | | | | | Shares | | | Value | |
| | | | | | | | | | | | |
| | | | |
| Electronic Equipment, Instruments & Components: 2.07% | | | | | | | | | | | | |
Belden Incorporated | | | | | | | 37,000 | | | $ | 2,368,740 | |
Fabrinet † | | | | | | | 37,400 | | | | 546,040 | |
MTS Systems Corporation | | | | | | | 41,400 | | | | 2,825,964 | |
OSI Systems Incorporated † | | | | | | | 17,600 | | | | 1,117,248 | |
| | | | |
| | | | | | | | | | | 6,857,992 | |
| | | | | | | | | | | | |
| | | | |
| Internet Software & Services: 1.54% | | | | | | | | | | | | |
AOL Incorporated † | | | | | | | 77,700 | | | | 3,492,615 | |
Global Eagle Entertainment Incorporated †« | | | | | | | 142,600 | | | | 1,599,972 | |
| | | | |
| | | | | | | | | | | 5,092,587 | |
| | | | | | | | | | | | |
| | | | |
| IT Services: 2.57% | | | | | | | | | | | | |
CoreLogic Incorporated † | | | | | | | 131,900 | | | | 3,570,533 | |
EPAM Systems Incorporated † | | | | | | | 45,000 | | | | 1,970,550 | |
Sapient Corporation † | | | | | | | 211,800 | | | | 2,965,200 | |
| | | | |
| | | | | | | | | | | 8,506,283 | |
| | | | | | | | | | | | |
| | | | |
| Semiconductors & Semiconductor Equipment: 4.50% | | | | | | | | | | | | |
Atmel Corporation † | | | | | | | 334,400 | | | | 2,701,952 | |
Entegris Incorporated † | | | | | | | 170,100 | | | | 1,956,150 | |
Fairchild Semiconductor International Incorporated † | | | | | | | 167,800 | | | | 2,605,934 | |
Integrated Device Technology Incorporated † | | | | | | | 138,400 | | | | 2,207,480 | |
International Rectifier Corporation † | | | | | | | 22,000 | | | | 863,280 | |
MA-COM Technology Solutions Holdings Incorporated † | | | | | | | 107,800 | | | | 2,354,352 | |
Monolithic Power Systems Incorporated | | | | | | | 23,500 | | | | 1,035,175 | |
Nanometrics Incorporated † | | | | | | | 76,800 | | | | 1,159,680 | |
| | | | |
| | | | | | | | | | | 14,884,003 | |
| | | | | | | | | | | | |
| | | | |
| Software: 4.04% | | | | | | | | | | | | |
Cadence Design Systems Incorporated † | | | | | | | 175,400 | | | | 3,018,634 | |
Fortinet Incorporated † | | | | | | | 127,700 | | | | 3,226,341 | |
NetScout Systems Incorporated † | | | | | | | 19,100 | | | | 874,780 | |
PTC Incorporated † | | | | | | | 86,300 | | | | 3,184,470 | |
Verint Systems Incorporated † | | | | | | | 54,825 | | | | 3,048,818 | |
| | | | |
| | | | | | | | | | | 13,353,043 | |
| | | | | | | | | | | | |
| | | | |
Materials: 7.14% | | | | | | | | | | | | |
| | | | |
| Chemicals: 1.28% | | | | | | | | | | | | |
Minerals Technologies Incorporated | | | | | | | 68,600 | | | | 4,233,306 | |
| | | | | | | | | | | | |
| | | | |
| Containers & Packaging: 3.12% | | | | | | | | | | | | |
Berry Plastics Group Incorporated † | | | | | | | 294,000 | | | | 7,420,560 | |
Packaging Corporation of America | | | | | | | 45,400 | | | | 2,897,428 | |
| | | | |
| | | | | | | | | | | 10,317,988 | |
| | | | | | | | | | | | |
| | | | |
| Metals & Mining: 2.43% | | | | | | | | | | | | |
Compass Minerals International Incorporated | | | | | | | 33,000 | | | | 2,781,240 | |
Pretium Resources Incorporated †« | | | | | | | 121,316 | | | | 630,843 | |
The accompanying notes are an integral part of these financial statements.
| | | | |
| 12 | | Wells Fargo Advantage Small Cap Opportunities Fund | | Portfolio of investments—September 30, 2014 (unaudited) |
| | | | | | | | | | | | | | |
| Security name | | | | | | | Shares | | | Value | |
| | | | | | | | | | | | | | |
| | | | |
| Metals & Mining (continued) | | | | | | | | | | | | | | |
Ryerson Holding Corporation † | | | | | | | | | 166,364 | | | $ | 2,129,459 | |
Steel Dynamics Incorporated | | | | | | | | | 110,400 | | | | 2,496,144 | |
| | | | |
| | | | | | | | | | | | | 8,037,686 | |
| | | | | | | | | | | | | | |
| | | | |
| Paper & Forest Products: 0.31% | | | | | | | | | | | | | | |
Louisiana-Pacific Corporation † | | | | | | | | | 76,400 | | | | 1,038,276 | |
| | | | | | | | | | | | | | |
| | | | |
Utilities: 2.54% | | | | | | | | | | | | | | |
| | | | |
| Electric Utilities: 0.67% | | | | | | | | | | | | | | |
IDACORP Incorporated | | | | | | | | | 41,200 | | | | 2,208,732 | |
| | | | | | | | | | | | | | |
| | | | |
| Multi-Utilities: 1.43% | | | | | | | | | | | | | | |
Northwestern Corporation | | | | | | | | | 104,381 | | | | 4,734,720 | |
| | | | | | | | | | | | | | |
| | | | |
| Water Utilities: 0.44% | | | | | | | | | | | | | | |
SJW Corporation | | | | | | | | | 55,000 | | | | 1,477,850 | |
| | | | | | | | | | | | | | |
| | | | |
Total Common Stocks (Cost $250,273,109) | | | | | | | | | | | | | 306,716,788 | |
| | | | | | | | | | | | | | |
| | | | |
Exchange-Traded Funds: 0.75% | | | | | | | | | | | | | | |
iShares Russell 2000 Index ETF | | | | | | | | | 22,600 | | | | 2,471,310 | |
| | | | | | | | | | | | | | |
| | | | |
Total Exchange-Traded Funds (Cost $2,529,329) | | | | | | | | | | | | | 2,471,310 | |
| | | | | | | | | | | | | | |
| | | | |
| | | Yield | | | | | | | | | |
| Short-Term Investments: 10.34% | | | | | | | | | | | | | | |
| | | | |
| Investment Companies: 10.34% | | | | | | | | | | | | | | |
Wells Fargo Advantage Cash Investment Money Market Fund, Select Class (l)(u) | | | 0.07 | % | | | | | 23,003,048 | | | | 23,003,048 | |
Wells Fargo Securities Lending Cash Investments, LLC (l)(r)(u) | | | 0.11 | | | | | | 11,193,199 | | | | 11,193,199 | |
| | | | |
Total Short-Term Investments (Cost $34,196,247) | | | | | | | | | | | | | 34,196,247 | |
| | | | | | | | | | | | | | |
| | | | | | | | |
| Total investments in securities | | | | | | | | |
| (Cost $286,998,685) * | | | 103.81 | % | | | 343,384,345 | |
Other assets and liabilities, net | | | (3.81 | ) | | | (12,596,255 | ) |
| | | | | | | | |
| Total net assets | | | 100.00 | % | | $ | 330,788,090 | |
| | | | | | | | |
| † | Non-income-earning security |
| « | All or a portion of this security is on loan. |
| (l) | The security represents an affiliate of the Fund as defined in the Investment Company Act of 1940. |
| (u) | The rate represents the 7-day annualized yield at period end. |
| (r) | The investment is a non-registered investment vehicle purchased with cash collateral received from securities on loan. |
| * | Cost for federal income tax purposes is $288,184,061 and unrealized gains (losses) consists of: |
| | | | |
Gross unrealized gains | | $ | 64,402,613 | |
Gross unrealized losses | | | (9,202,329 | ) |
| | | | |
Net unrealized gains | | $ | 55,200,284 | |
The accompanying notes are an integral part of these financial statements.
| | | | | | |
| Statement of assets and liabilities—September 30, 2014 (unaudited) | | Wells Fargo Advantage Small Cap Opportunities Fund | | | 13 | |
| | | | |
| | | | |
| |
Assets | | | | |
Investments | | | | |
In unaffiliated securities (including $10,877,532 of securities loaned), at value (cost $252,802,438) | | $ | 309,188,098 | |
In affiliated securities, at value (cost $34,196,247) | | | 34,196,247 | |
| | | | |
Total investments, at value (cost $286,998,685) | | | 343,384,345 | |
Receivable for investments sold | | | 479,682 | |
Receivable for Fund shares sold | | | 151,111 | |
Receivable for dividends | | | 259,643 | |
Receivable for securities lending income | | | 11,722 | |
Prepaid expenses and other assets | | | 4,350 | |
| | | | |
Total assets | | | 344,290,853 | |
| | | | |
| |
Liabilities | | | | |
Payable for investments purchased | | | 822,372 | |
Payable for Fund shares redeemed | | | 1,130,227 | |
Payable upon receipt of securities loaned | | | 11,193,199 | |
Advisory fee payable | | | 215,198 | |
Administration fees payable | | | 42,323 | |
Accrued expenses and other liabilities | | | 99,444 | |
| | | | |
Total liabilities | | | 13,502,763 | |
| | | | |
Total net assets | | $ | 330,788,090 | |
| | | | |
| |
NET ASSETS CONSIST OF | | | | |
Paid-in capital | | $ | 146,304,976 | |
Accumulated net investment loss | | | (102,638 | ) |
Accumulated net realized gains on investments | | | 128,200,092 | |
Net unrealized gains on investments | | | 56,385,660 | |
| | | | |
Total net assets | | $ | 330,788,090 | |
| | | | |
| |
COMPUTATION OF NET ASSET VALUE PER SHARE | | | | |
Net assets – Administrator Class | | $ | 330,788,090 | |
Shares outstanding – Administrator Class1 | | | 8,924,583 | |
Net asset value per share – Administrator Class | | | $37.06 | |
| 1. | The Fund has an unlimited number of authorized shares. |
The accompanying notes are an integral part of these financial statements.
| | | | |
| 14 | | Wells Fargo Advantage Small Cap Opportunities Fund | | Statement of operations—six months ended September 30, 2014 (unaudited) |
| | | | |
| | | | |
| |
Investment income | | | | |
Dividends | | $ | 2,241,277 | |
Securities lending income, net | | | 106,609 | |
Income from affiliated securities | | | 9,281 | |
| | | | |
Total investment income | | | 2,357,167 | |
| | | | |
| |
Expenses | | | | |
Advisory fee | | | 1,623,705 | |
Administration fees | | | | |
Fund level | | | 101,482 | |
Administrator Class | | | 202,963 | |
Shareholder servicing fees | | | | |
Administrator Class | | | 506,246 | |
Custody and accounting fees | | | 20,436 | |
Professional fees | | | 20,264 | |
Registration fees | | | 8,325 | |
Shareholder report expenses | | | 7,627 | |
Trustees’ fees and expenses | | | 6,484 | |
Other fees and expenses | | | 4,175 | |
| | | | |
Total expenses | | | 2,501,707 | |
Less: Fee waivers and/or expense reimbursements | | | (66,150 | ) |
| | | | |
Net expenses | | | 2,435,557 | |
| | | | |
Net investment loss | | | (78,390 | ) |
| | | | |
| |
REALIZED AND UNREALIZED GAINS (LOSSES) ON INVESTMENTS | | | | |
| |
Net realized gains (losses) on: | | | | |
Unaffiliated securities | | | 46,661,355 | |
Futures transactions | | | (238,018 | ) |
| | | | |
Net realized gains on investments | | | 46,423,337 | |
| | | | |
| |
Net change in unrealized gains (losses) on: | | | | |
Unaffiliated securities | | | (53,765,663 | ) |
Futures transactions | | | 24,493 | |
| | | | |
Net change in unrealized gains (losses) on investments | | | (53,741,170 | ) |
| | | | |
Net realized and unrealized gains (losses) on investments | | | (7,317,833 | ) |
| | | | |
Net decrease in net assets resulting from operations | | $ | (7,396,223 | ) |
| | | | |
The accompanying notes are an integral part of these financial statements.
| | | | | | |
| Statement of changes in net assets | | Wells Fargo Advantage Small Cap Opportunities Fund | | | 15 | |
| | | | | | | | | | | | | | | | | | | | | | | | |
| | | Six months ended September 30, 2014 (unaudited) | | | Year ended
March 31, 20141 | | | Year ended
October 31, 2013 | |
| | | | | | |
Operations | | | | | | | | | | | | | | | | | | | | | | | | |
Net investment income (loss) | | | | | | $ | (78,390 | ) | | | | | | $ | 232,585 | | | | | | | $ | 1,996,879 | |
Net realized gains on investments | | | | | | | 46,423,337 | | | | | | | | 82,223,074 | | | | | | | | 111,122,075 | |
Net change in unrealized gains (losses) on investments | | | | | | | (53,741,170 | ) | | | | | | | (54,537,496 | ) | | | | | | | 74,192,106 | |
| | | | |
Net increase (decrease) in net assets resulting from operations | | | | | | | (7,396,223 | ) | | | | | | | 27,918,163 | | | | | | | | 187,311,060 | |
| | | | |
| | | | | | |
Distributions to shareholders from | | | | | | | | | | | | | | | | | | | | | | | | |
Net investment income | | | | | | | | | | | | | | | | | | | | | | | | |
Administrator Class | | | | | | | 0 | | | | | | | | (340,685 | ) | | | | | | | (1,493,441 | ) |
Net realized gains | | | | | | | | | | | | | | | | | | | | | | | | |
Administrator Class | | | | | | | 0 | | | | | | | | (107,195,250 | ) | | | | | | | (44,504,059 | ) |
| | | | |
Total distributions to shareholders | | | | | | | 0 | | | | | | | | (107,535,935 | ) | | | | | | | (45,997,500 | ) |
| | | | |
| | | | | | |
Capital share transactions | | | Shares | | | | | | | | Shares | | | | | | | | Shares | | | | | |
Proceeds from shares sold | | | | | | | | | | | | | | | | | | | | | | | | |
Administrator Class | | | 495,408 | | | | 18,654,054 | | | | 1,018,378 | | | | 38,298,973 | | | | 2,155,903 | | | | 80,223,634 | |
Reinvestment of distributions | | | | | | | | | | | | | | | | | | | | | | | | |
Administrator Class | | | 0 | | | | 0 | | | | 2,933,436 | | | | 106,539,476 | | | | 1,419,026 | | | | 45,545,649 | |
Payment for shares redeemed | | | | | | | | | | | | | | | | | | | | | | | | |
Administrator Class | | | (3,997,560 | ) | | | (151,800,087 | ) | | | (8,157,085 | ) | | | (299,561,650 | ) | | | (5,080,384 | ) | | | (186,255,523 | ) |
| | | | | | | | | | | | | | | | | | | | | | | | |
Net decrease in net assets resulting from capital share transactions | | | | | | | (133,146,033 | ) | | | | | | | (154,723,201 | ) | | | | | | | (60,486,240 | ) |
| | | | |
Total increase (decrease) in net assets | | | | | | | (140,542,256 | ) | | | | | | | (234,340,973 | ) | | | | | | | 80,827,320 | |
| | | | |
| | | | | | |
Net assets | | | | | | | | | | | | | | | | | | | | | | | | |
Beginning of period | | | | | | | 471,330,346 | | | | | | | | 705,671,319 | | | | | | | | 624,843,999 | |
| | | | |
End of period | | | | | | $ | 330,788,090 | | | | | | | $ | 471,330,346 | | | | | | | $ | 705,671,319 | |
| | | | |
Undistributed/accumulated/overdistributed net investment income (loss) | | | | | | $ | (102,638 | ) | | | | | | $ | (24,248 | ) | | | | | | $ | 340,616 | |
| | | | |
| 1. | For the five months ended March 31, 2014. The Fund changed its fiscal year end from October 31 to March 31, effective March 31, 2014. |
The accompanying notes are an integral part of these financial statements.
| | | | |
| 16 | | Wells Fargo Advantage Small Cap Opportunities Fund | | Financial highlights |
(For a share outstanding throughout each period)
| | | | | | | | | | | | | | | | | | | | | | | | | | | | |
| | | Six months ended
September 30, 2014
(unaudited) | | | Year ended
March 31, 20141 | | | Year ended October 31 | |
| ADMINISTRATOR CLASS | | | | 2013 | | | 2012 | | | 2011 | | | 2010 | | | 2009 | |
Net asset value, beginning of period | | $ | 37.93 | | | $ | 42.43 | | | $ | 34.45 | | | $ | 32.50 | | | $ | 31.33 | | | $ | 25.88 | | | $ | 23.47 | |
Net investment income (loss) | | | (0.01 | ) | | | 0.02 | | | | 0.11 | | | | 0.05 | | | | 0.00 | 2 | | | (0.06 | ) | | | (0.02 | ) |
Net realized and unrealized gains (losses) on investments | | | (0.86 | ) | | | 2.33 | | | | 10.48 | | | | 3.13 | | | | 1.17 | | | | 5.51 | | | | 3.38 | |
| | | | | | | | | | | | | | | | | | | | | | | | | | | | |
Total from investment operations | | | (0.87 | ) | | | 2.35 | | | | 10.59 | | | | 3.18 | | | | 1.17 | | | | 5.45 | | | | 3.36 | |
Distributions to shareholders from | | | | | | | | | | | | | | | | | | | | | | | | | | | | |
Net investment income | | | 0.00 | | | | (0.02 | ) | | | (0.08 | ) | | | 0.00 | | | | 0.00 | | | | 0.00 | | | | 0.00 | |
Net realized gains | | | 0.00 | | | | (6.83 | ) | | | (2.53 | ) | | | (1.23 | ) | | | 0.00 | | | | 0.00 | | | | (0.93 | ) |
Tax basis return of capital | | | 0.00 | | | | 0.00 | | | | 0.00 | | | | 0.00 | | | | 0.00 | | | | 0.00 | | | | (0.02 | ) |
| | | | | | | | | | | | | | | | | | | | | | | | | | | | |
Total distributions to shareholders | | | 0.00 | | | | (6.85 | ) | | | (2.61 | ) | | | (1.23 | ) | | | 0.00 | | | | 0.00 | | | | (0.95 | ) |
Net asset value, end of period | | $ | 37.06 | | | $ | 37.93 | | | $ | 42.43 | | | $ | 34.45 | | | $ | 32.50 | | | $ | 31.33 | | | $ | 25.88 | |
Total return3 | | | (2.29 | )% | | | 6.26 | % | | | 33.19 | % | | | 10.12 | % | | | 3.73 | % | | | 21.06 | % | | | 15.44 | % |
Ratios to average net assets (annualized) | | | | | | | | | | | | | | | | | | | | | | | | | | | | |
Gross expenses | | | 1.23 | % | | | 1.24 | % | | | 1.22 | % | | | 1.22 | % | | | 1.22 | % | | | 1.25 | % | | | 1.31 | % |
Net expenses | | | 1.20 | % | | | 1.20 | % | | | 1.20 | % | | | 1.20 | % | | | 1.20 | % | | | 1.20 | % | | | 1.20 | % |
Net investment income (loss) | | | (0.04 | )% | | | 0.11 | % | | | 0.31 | % | | | 0.13 | % | | | 0.00 | % | | | (0.20 | )% | | | (0.07 | )% |
Supplemental data | | | | | | | | | | | | | | | | | | | | | | | | | | | | |
Portfolio turnover rate | | | 29 | % | | | 26 | % | | | 76 | % | | | 78 | % | | | 100 | % | | | 66 | % | | | 68 | % |
Net assets, end of period (000s omitted) | | | $330,788 | | | | $471,330 | | | | $705,671 | | | | $624,844 | | | | $656,720 | | | | $707,958 | | | | $612,110 | |
| 1. | For the five months ended March 31, 2014. The Fund changed its fiscal year end from October 31 to March 31, effective March 31, 2014. |
| 2. | Amount is less than $0.005. |
| 3. | Returns for periods of less than one year are not annualized. |
The accompanying notes are an integral part of these financial statements.
| | | | | | |
| Notes to financial statements (unaudited) | | Wells Fargo Advantage Small Cap Opportunities Fund | | | 17 | |
1. ORGANIZATION
Wells Fargo Funds Trust (the “Trust”), a Delaware statutory trust organized on March 10, 1999, is an open-end management investment company registered under the Investment Company Act of 1940, as amended (the “1940 Act”). These financial statements report on the Wells Fargo Advantage Small Cap Opportunities Fund (the “Fund”) which is a diversified series of the Trust.
2. SIGNIFICANT ACCOUNTING POLICIES
The following significant accounting policies, which are consistently followed in the preparation of the financial statements of the Fund, are in conformity with U.S. generally accepted accounting principles which require management to make estimates and assumptions that affect the reported amounts of assets and liabilities, disclosure of contingent assets and liabilities at the date of the financial statements, and the reported amounts of revenues and expenses during the reporting period. Actual results could differ from those estimates.
Securities valuation
All investments are valued each business day as of the close of regular trading on the New York Stock Exchange (generally 4 p.m. Eastern Time).
Equity securities and futures that are listed on a foreign or domestic exchange or market are valued at the official closing price or, if none, the last sales price. If no sale occurs on the primary exchange or market for the security that day, the prior day’s price will be deemed “stale” and fair values will be determined in accordance with the Fund’s Valuation Procedures.
The values of securities denominated in foreign currencies are translated into U.S. dollars at rates provided by an independent foreign currency pricing source at a time each business day specified by the Management Valuation Team of Wells Fargo Funds Management, LLC (“Funds Management”).
Many securities markets and exchanges outside the U.S. close prior to the close of the New York Stock Exchange and therefore may not fully reflect trading or events that occur after the close of the principal exchange in which the foreign securities are traded, but before the close of the New York Stock Exchange. If such trading or events are expected to materially affect the value of such securities, then fair value pricing procedures approved by the Board of Trustees of the Fund are applied. These procedures take into account multiple factors including movements in U.S. securities markets after foreign exchanges close. Foreign securities that are fair valued under these procedures are categorized as Level 2 and the application of these procedures may result in transfers between Level 1 and Level 2. Depending on market activity, such fair valuations may be frequent. Such fair value pricing may result in net asset values that are higher or lower than net asset values based on the last reported sales price or latest quoted bid price. On September 30, 2014, such fair value pricing was not used in pricing foreign securities.
Investments in registered open-end investment companies are valued at net asset value. Non-registered investment vehicles are fair valued at net asset value.
Investments which are not valued using any of the methods discussed above are valued at their fair value, as determined in good faith by the Board of Trustees. The Board of Trustees has established a Valuation Committee comprised of the Trustees and has delegated to it the authority to take any actions regarding the valuation of portfolio securities that the Valuation Committee deems necessary or appropriate, including determining the fair value of portfolio securities, unless the determination has been delegated to the Management Valuation Team. The Board of Trustees retains the authority to make or ratify any valuation decisions or approve any changes to the Valuation Procedures as it deems appropriate. On a quarterly basis, the Board of Trustees receives reports on any valuation actions taken by the Valuation Committee or the Management Valuation Team which may include items for ratification.
Valuations of fair valued securities are compared to the next actual sales price when available, or other appropriate market values, to assess the continued appropriateness of the fair valuation methodologies used. These securities are fair valued on a day-to-day basis, taking into consideration changes to appropriate market information and any significant changes to the inputs considered in the valuation process until there is a readily available price provided on an exchange or by an independent pricing service. Valuations received from an independent pricing service or independent broker-dealer quotes are periodically validated by comparisons to most recent trades and valuations provided by other independent pricing services in addition to the review of prices by the adviser and/or subadviser. Unobservable inputs used in determining fair valuations are identified based on the type of security, taking into consideration factors utilized by market participants in valuing the investment, knowledge about the issuer and the current market environment.
| | | | |
| 18 | | Wells Fargo Advantage Small Cap Opportunities Fund | | Notes to financial statements (unaudited) |
Foreign currency translation
The accounting records of the Fund are maintained in U.S. dollars. The values of other assets and liabilities denominated in foreign currencies are translated into U.S. dollars at rates provided by an independent foreign currency pricing source at a time each business day specified by the Management Valuation Team. Purchases and sales of securities, and income and expenses are converted at the rate of exchange on the respective dates of such transactions. Net realized foreign exchange gains or losses arise from sales of foreign currencies, currency gains or losses realized between the trade and settlement dates on securities transactions, and the difference between the amounts of dividends, interest and foreign withholding taxes recorded and the U.S. dollar equivalent of the amounts actually paid or received. Net unrealized foreign exchange gains and losses arise from changes in the fair value of assets and liabilities other than investments in securities resulting from changes in exchange rates. The changes in net assets arising from changes in exchange rates and the changes in net assets resulting from changes in market prices of securities are not separately presented. Such changes are included in net realized and unrealized gains or losses from investments.
Security loans
The Fund may lend its securities from time to time in order to earn additional income in the form of fees or interest on securities received as collateral or the investment of any cash received as collateral. The Fund continues to receive interest or dividends on the securities loaned. The Fund receives collateral in the form of cash or securities with a value at least equal to the value of the securities on loan. The value of the loaned securities is determined at the close of each business day and any additional required collateral is delivered to the Fund on the next business day. In a securities lending transaction, the net asset value of the Fund will be affected by an increase or decrease in the value of the securities loaned and by an increase or decrease in the value of the instrument in which collateral is invested. The amount of securities lending activity undertaken by the Fund fluctuates from time to time. In the event of default or bankruptcy by the borrower, the Fund may be prevented from recovering the loaned securities or gaining access to the collateral or may experience delays or costs in doing so. In addition, the investment of any cash collateral received may lose all or part of its value. The Fund has the right under the lending agreement to recover the securities from the borrower on demand.
The Fund lends its securities through an unaffiliated securities lending agent. Cash collateral received in connection with its securities lending transactions is invested in Wells Fargo Securities Lending Cash Investments, LLC (the “Securities Lending Fund”). The Securities Lending Fund is exempt from registration under Section 3(c)(7) of the 1940 Act and is managed by Funds Management and is subadvised by Wells Capital Management Incorporated (“WellsCap”). Funds Management receives an advisory fee starting at 0.05% and declining to 0.01% as the average daily net assets of the Securities Lending Fund increase. All of the fees received by Funds Management are paid to WellsCap for its services as subadviser. The Securities Lending Fund seeks to provide a positive return compared to the daily Fed Funds Open rate by investing in high-quality, U.S. dollar-denominated short-term money market instruments. Securities Lending Fund investments are fair valued based upon the amortized cost valuation technique. Income earned from investment in the Securities Lending Fund is included in securities lending income on the Statement of Operations.
Futures contracts
The Fund is subject to equity price risk in the normal course of pursuing its investment objectives. The Fund may buy and sell futures contracts in order to gain exposure to, or protect against, changes in security values and interest rates. The primary risks associated with the use of futures contracts are the imperfect correlation between changes in market values of securities held by the Fund and the prices of futures contracts, and the possibility of an illiquid market.
The aggregate principal amounts of the contracts are not recorded in the financial statements. Fluctuations in the value of the contracts are recorded in the Statement of Assets and Liabilities as an asset or liability and in the Statement of Operations as unrealized gains or losses until the contracts are closed, at which point they are recorded as net realized gains or losses on futures contracts. With futures contracts, there is minimal counterparty risk to the Fund since futures are exchange traded and the exchange’s clearinghouse, as counterparty to all exchange traded futures, guarantees the futures against default.
Security transactions and income recognition
Securities transactions are recorded on a trade date basis. Realized gains or losses are recorded on the basis of identified cost.
Dividend income is recognized on the ex-dividend date.
| | | | | | |
| Notes to financial statements (unaudited) | | Wells Fargo Advantage Small Cap Opportunities Fund | | | 19 | |
Distributions to shareholders
Distributions to shareholders from net investment income and net realized gains, if any, are recorded on the ex-dividend date. Such distributions are determined in conformity with federal income tax regulations, which may differ in amount or character from net investment income and realized gains recognized for purposes of U.S. generally accepted accounting principles.
Federal and other taxes
The Fund intends to continue to qualify as a regulated investment company by distributing substantially all of its investment company taxable income and any net realized capital gains (after reduction for capital loss carryforwards) sufficient to relieve it from all, or substantially all, federal income taxes. Accordingly, no provision for federal income taxes was required.
The Fund’s income and federal excise tax returns and all financial records supporting those returns for the prior three fiscal years are subject to examination by the federal and Delaware revenue authorities. Management has analyzed the Fund’s tax positions taken on federal, state, and foreign tax returns for all open tax years and does not believe that there are any uncertain tax positions that require recognition of a tax liability.
3. FAIR VALUATION MEASUREMENTS
Fair value measurements of investments are determined within a framework that has established a fair value hierarchy based upon the various data inputs utilized in determining the value of the Fund’s investments. The three-level hierarchy gives the highest priority to unadjusted quoted prices in active markets for identical assets or liabilities (Level 1) and the lowest priority to significant unobservable inputs (Level 3). The Fund’s investments are classified within the fair value hierarchy based on the lowest level of input that is significant to the fair value measurement. The inputs are summarized into three broad levels as follows:
| n | | Level 1 – quoted prices in active markets for identical securities |
| n | | Level 2 – other significant observable inputs (including quoted prices for similar securities, interest rates, prepayment speeds, credit risk, use of amortized cost, etc.) |
| n | | Level 3 – significant unobservable inputs (including the Fund’s own assumptions in determining the fair value of investments) |
The inputs or methodologies used for valuing investments in securities are not necessarily an indication of the risk associated with investing in those securities.
The following is a summary of the inputs used in valuing the Fund’s assets and liabilities as of September 30, 2014:
| | | | | | | | | | | | | | | | |
| | | Quoted prices (Level 1) | | | Other significant observable inputs (Level 2) | | | Significant unobservable inputs (Level 3) | | | Total | |
Assets | | | | | | | | | | | | | | | | |
Investments in: | | | | | | | | | | | | | | | | |
| | | | |
Common stocks | | | | | | | | | | | | | | | | |
Consumer discretionary | | $ | 36,478,331 | | | $ | 0 | | | $ | 0 | | | $ | 36,478,331 | |
Consumer staples | | | 3,099,838 | | | | 0 | | | | 0 | | | | 3,099,838 | |
Energy | | | 12,766,232 | | | | 0 | | | | 0 | | | | 12,766,232 | |
Financials | | | 60,935,417 | | | | 0 | | | | 0 | | | | 60,935,417 | |
Health care | | | 44,390,434 | | | | 0 | | | | 0 | | | | 44,390,434 | |
Industrials | | | 62,646,998 | | | | 0 | | | | 0 | | | | 62,646,998 | |
Information technology | | | 54,350,980 | | | | 0 | | | | 0 | | | | 54,350,980 | |
Materials | | | 23,627,256 | | | | 0 | | | | 0 | | | | 23,627,256 | |
Utilities | | | 8,421,302 | | | | 0 | | | | 0 | | | | 8,421,302 | |
| | | | |
Exchange-traded funds | | | 2,471,310 | | | | 0 | | | | 0 | | | | 2,471,310 | |
| | | | |
Short-term investments | | | | | | | | | | | | | | | | |
Investment companies | | | 23,003,048 | | | | 11,193,199 | | | | 0 | | | | 34,196,247 | |
Total assets | | $ | 332,191,146 | | | $ | 11,193,199 | | | $ | 0 | | | $ | 343,384,345 | |
| | | | |
| 20 | | Wells Fargo Advantage Small Cap Opportunities Fund | | Notes to financial statements (unaudited) |
Transfers in and transfers out are recognized at the end of the reporting period. At September 30, 2014, the Fund did not have any transfers into/out of Level 1, Level 2, or Level 3.
4. TRANSACTIONS WITH AFFILIATES AND OTHER EXPENSES
Advisory fee
The Trust has entered into an advisory contract with Funds Management, an indirect wholly owned subsidiary of Wells Fargo & Company (“Wells Fargo”). The adviser is responsible for implementing investment policies and guidelines and for supervising the subadviser, who is responsible for day-to-day portfolio management of the Fund.
Pursuant to the contract, Funds Management is entitled to receive an annual advisory fee starting at 0.80% and declining to 0.68% as the average daily net assets of the Fund increase. For the six months ended September 30, 2014, the advisory fee was equivalent to an annual rate of 0.80% of the Fund’s average daily net assets.
Funds Management has retained the services of a subadviser to provide daily portfolio management to the Fund. The fee for subadvisory services is borne by Funds Management. Schroder Investment Management North America Inc. is the subadviser to the Fund and is entitled to receive a fee from Funds Management at an annual rate starting at 0.50% and declining to 0.45% as the average daily net assets of the Fund increase.
Administration fees
The Trust has entered into an administration agreement with Funds Management. Under this agreement, for providing administrative services, which includes paying fees and expenses for services provided by the transfer agent, sub-transfer agents, omnibus account servicers and record-keepers, Funds Management is entitled to receive from the Fund an annual fund level administration fee starting at 0.05% and declining to 0.03% as the average daily net assets of the Fund increase and a class level administration fee of 0.10% of the average daily net assets of Administrator Class.
Funds Management has contractually waived and/or reimbursed advisory and administration fees to the extent necessary to maintain certain net operating expense ratios for the Fund. Waiver of fees and/or reimbursement of expenses by Funds Management were made first from fund level expenses on a proportionate basis and then from class specific expenses. Funds Management has committed through July 31, 2015 to waive fees and/or reimburse expenses to the extent necessary to cap the Fund’s expenses at 1.20% for Administrator Class shares. After this time, the cap may be increased or the commitment to maintain the cap may be terminated only with the approval of the Board of Trustees.
Shareholder servicing fees
The Trust has entered into contracts with one or more shareholder servicing agents, whereby Administrator Class of the Fund is charged a fee at an annual rate of 0.25% of its average daily net assets.
A portion of these total shareholder servicing fees were paid to affiliates of Wells Fargo.
5. INVESTMENT PORTFOLIO TRANSACTIONS
Purchases and sales of investments, excluding U.S. government obligations (if any) and short-term securities, for the six months ended September 30, 2014 were $109,631,240 and $219,303,740, respectively.
6. DERIVATIVE TRANSACTIONS
During the six months ended September 30, 2014, the Fund used uninvested cash to enter into futures contracts to gain market exposure.
As of September 30, 2014, the Fund did not have any open futures contracts. The Fund had an average notional amount of $835,853 in long futures contracts during the six months ended September 30, 2014.
The fair value, realized gains or losses and change in unrealized gains or losses, if any, on derivative instruments are reflected in the appropriate financial statements.
7. BANK BORROWINGS
The Trust (excluding the money market funds and certain other funds in the Trust) and Wells Fargo Variable Trust are parties to a $150,000,000 revolving credit agreement whereby the Fund is permitted to use bank borrowings for temporary or emergency purposes, such as to fund shareholder redemption requests. Interest under the credit agreement is charged to the Fund based on a borrowing rate equal to the higher of the Federal Funds rate in effect on that day plus 1.25% or the overnight LIBOR rate in effect on that day plus 1.25%. In addition, an annual commitment fee equal to 0.10% of the unused balance is allocated to each participating fund. For the six months ended September 30, 2014, the Fund paid $435 in commitment fees.
| | | | | | |
| Notes to financial statements (unaudited) | | Wells Fargo Advantage Small Cap Opportunities Fund | | | 21 | |
For the six months ended September 30, 2014, there were no borrowings by the Fund under the agreement.
8. INDEMNIFICATION
Under the Trust’s organizational documents, the officers and Trustees are indemnified against certain liabilities that may arise out of performance of their duties to the Trust. Additionally, in the normal course of business, the Trust may enter into contracts with service providers that contain a variety of indemnification clauses. The Trust’s maximum exposure under these arrangements is dependent on future claims that may be made against the Fund and, therefore, cannot be estimated.
| | | | |
| 22 | | Wells Fargo Advantage Small Cap Opportunities Fund | | Other information (unaudited) |
PROXY VOTING INFORMATION
A description of the policies and procedures that the Fund uses to determine how to vote proxies relating to portfolio securities is available without charge, upon request, by calling 1-800-222-8222, visiting our website at wellsfargoadvantagefunds.com, or visiting the SEC website at sec.gov. Information regarding how the Fund voted proxies relating to portfolio securities during the most recent 12-month period ended June 30 is available without charge on the Fund’s website at wellsfargoadvantagefunds.com or by visiting the SEC website at sec.gov.
PORTFOLIO HOLDINGS INFORMATION
The complete portfolio holdings for the Fund are publicly available monthly on the Fund’s website (wellsfargoadvantagefunds.com), on a one-month delayed basis. In addition, top ten holdings information (excluding derivative positions) for the Fund is publicly available on the Fund’s website on a monthly, seven-day or more delayed basis. The Fund files its complete schedule of portfolio holdings with the SEC for the first and third quarters of each fiscal year on Form N-Q, which is available without charge by visiting the SEC website at sec.gov. In addition, the Fund’s Form N-Q may be reviewed and copied at the SEC’s Public Reference Room in Washington, DC, and at regional offices in New York City, at 233 Broadway, and in Chicago, at 175 West Jackson Boulevard, Suite 900. Information about the Public Reference Room may be obtained by calling 1-800-SEC-0330.
| | | | | | |
| Other information (unaudited) | | Wells Fargo Advantage Small Cap Opportunities Fund | | | 23 | |
BOARD OF TRUSTEES AND OFFICERS
Each of the Trustees and Officers1 listed in the table below acts in identical capacities for each fund in the Wells Fargo Advantage family of funds, which consists of 133 mutual funds comprising the Wells Fargo Funds Trust, Wells Fargo Variable Trust, Wells Fargo Master Trust and four closed-end funds (collectively the “Fund Complex”). This table should be read in conjunction with the Prospectus and the Statement of Additional Information2. The mailing address of each Trustee and Officer is 525 Market Street, 12th Floor, San Francisco, CA 94105. Each Trustee and Officer serves an indefinite term, however, each Trustee serves such term until reaching the mandatory retirement age established by the Trustees.
Independent Trustees
| | | | | | |
Name and year of birth | | Position held and length of service* | | Principal occupations during past five years or longer | | Other directorships during past five years |
Peter G. Gordon
(Born 1942) | | Trustee, since 1998; Chairman, since 2005 | | Co-Founder, Retired Chairman, President and CEO of Crystal Geyser Water Company. Trustee Emeritus, Colby College. | | Asset Allocation Trust |
Isaiah Harris, Jr.
(Born 1952) | | Trustee, since 2009 | | Retired. Prior thereto, President and CEO of BellSouth Advertising and Publishing Corp. from 2005 to 2007, President and CEO of BellSouth Enterprises from 2004 to 2005 and President of BellSouth Consumer Services from 2000 to 2003. Emeritus member of the Iowa State University Foundation Board of Governors. Emeritus Member of the Advisory Board of Iowa State University School of Business. Advisory Board Member, Palm Harbor Academy. Mr. Harris is a certified public accountant. | | CIGNA Corporation; Asset Allocation Trust |
Judith M. Johnson
(Born 1949) | | Trustee, since 2008;
Audit Committee Chairman, since 2008 | | Retired. Prior thereto, Chief Executive Officer and Chief Investment Officer of Minneapolis Employees Retirement Fund from 1996 to 2008. Ms. Johnson is an attorney, certified public accountant and a certified managerial accountant. | | Asset Allocation Trust |
Leroy Keith, Jr.
(Born 1939) | | Trustee, since 2010 | | Chairman, Bloc Global Services (development and construction). Trustee of the Evergreen Funds complex (and its predecessors) from 1983 to 2010. Former Managing Director, Almanac Capital Management (commodities firm), former Partner, Stonington Partners, Inc. (private equity fund), former Director, Obagi Medical Products Co. and former Director, Lincoln Educational Services. | | Trustee, Virtus Fund Complex (consisting of 50 portfolios as of 12/16/2013); Asset Allocation Trust |
David F. Larcker
(Born 1950) | | Trustee, since 2009 | | James Irvin Miller Professor of Accounting at the Graduate School of Business, Stanford University, Morgan Stanley Director of the Center for Leadership Development and Research and Senior Faculty of The Rock Center for Corporate Governance since 2006. From 2005 to 2008, Professor of Accounting at the Graduate School of Business, Stanford University. Prior thereto, Ernst & Young Professor of Accounting at The Wharton School, University of Pennsylvania from 1985 to 2005. | | Asset Allocation Trust |
Olivia S. Mitchell
(Born 1953) | | Trustee, since 2006 | | International Foundation of Employee Benefit Plans Professor, Wharton School of the University of Pennsylvania since 1993. Director of Wharton’s Pension Research Council and Boettner Center on Pensions & Retirement Research, and Research Associate at the National Bureau of Economic Research. Previously, Cornell University Professor from 1978 to 1993. | | Asset Allocation Trust |
Timothy J. Penny
(Born 1951) | | Trustee, since 1996 | | President and CEO of Southern Minnesota Initiative Foundation, a non-profit organization, since 2007 and Senior Fellow at the Humphrey Institute Policy Forum at the University of Minnesota since 1995. Member of the Board of Trustees of NorthStar Education Finance, Inc., a non-profit organization, since 2007. | | Asset Allocation Trust |
| | | | |
| 24 | | Wells Fargo Advantage Small Cap Opportunities Fund | | Other information (unaudited) |
| | | | | | |
Name and year of birth | | Position held and length of service* | | Principal occupations during past five years or longer | | Other directorships during past five years |
Michael S. Scofield
(Born 1943) | | Trustee, since 2010 | | Served on the Investment Company Institute’s Board of Governors and Executive Committee from 2008-2011 as well the Governing Council of the Independent Directors Council from 2006-2011 and the Independent Directors Council Executive Committee from 2008-2011. Chairman of the IDC from 2008-2010. Institutional Investor (Fund Directions) Trustee of Year in 2007. Trustee of the Evergreen Funds complex (and its predecessors) from 1984 to 2010. Chairman of the Evergreen Funds from 2000-2010. Former Trustee of the Mentor Funds. Retired Attorney, Law Offices of Michael S. Scofield. | | Asset Allocation Trust |
Donald C. Willeke
(Born 1940) | | Trustee, since 1996 | | Principal of the law firm of Willeke & Daniels. General Counsel of the Minneapolis Employees Retirement Fund from 1984 until its consolidation into the Minnesota Public Employees Retirement Association on June 30, 2010. Director and Vice Chair of The Tree Trust (non-profit corporation). Director of the American Chestnut Foundation (non-profit corporation). | | Asset Allocation Trust |
| * | Length of service dates reflect the Trustee’s commencement of service with the Trust’s predecessor entities, where applicable. |
Officers
| | | | | | |
Name and year of birth | | Position held and length of service | | Principal occupations during past five years or longer | | |
Karla M. Rabusch
(Born 1959) | | President, since 2003 | | Executive Vice President of Wells Fargo Bank, N.A. and President of Wells Fargo Funds Management, LLC since 2003. | | |
Nancy Wiser1
(Born 1967) | | Treasurer, since 2012 | | Executive Vice President of Wells Fargo Funds Management, LLC since 2011. Chief Operating Officer and Chief Compliance Officer at LightBox Capital Management LLC, from 2008 to 2011. Owned and operated a consulting business providing services to various hedge funds including acting as Chief Operating Officer and Chief Compliance Officer for a hedge fund from 2007 to 2008. Chief Operating Officer and Chief Compliance Officer of GMN Capital LLC from 2006 to 2007. | | |
C. David Messman
(Born 1960) | | Secretary, since 2000; Chief Legal Officer, since 2003 | | Assistant General Counsel of Wells Fargo Bank, N.A. since 2013 and Vice President and Managing Counsel of Wells Fargo Bank N.A. from 1996 to 2013. Senior Vice President and Secretary of Wells Fargo Funds Management, LLC since 2001. | | |
Debra Ann Early
(Born 1964) | | Chief Compliance Officer, since 2007 | | Senior Vice President and Chief Compliance Officer of Wells Fargo Funds Management, LLC since 2007. Chief Compliance Officer of Parnassus Investments from 2005 to 2007. Chief Financial Officer of Parnassus Investments from 2004 to 2007. | | |
David Berardi
(Born 1975) | | Assistant Treasurer, since 2009 | | Vice President of Wells Fargo Funds Management, LLC since 2009. Vice President of Evergreen Investment Management Company, LLC from 2008 to 2010. Assistant Vice President of Evergreen Investment Services, Inc. from 2004 to 2008. Manager of Fund Reporting and Control for Evergreen Investment Management Company, LLC from 2004 to 2010. | | |
Jeremy DePalma1
(Born 1974) | | Assistant Treasurer, since 2009 | | Senior Vice President of Wells Fargo Funds Management, LLC since 2009. Senior Vice President of Evergreen Investment Management Company, LLC from 2008 to 2010. Vice President, Evergreen Investment Services, Inc. from 2004 to 2007. Head of the Fund Reporting and Control Team within Fund Administration from 2005 to 2010. | | |
| 1. | Nancy Wiser acts as Treasurer of 73 funds in the Fund Complex. Jeremy DePalma acts as Treasurer of 60 funds and Assistant Treasurer of 73 funds in the Fund Complex. |
| 2. | The Statement of Additional Information includes additional information about the Trustees and is available, without charge, upon request, by calling 1-800-222-8222 or by visiting the website at wellsfargoadvantagefunds.com. |
| | | | | | |
| Other information (unaudited) | | Wells Fargo Advantage Small Cap Opportunities Fund | | | 25 | |
BOARD CONSIDERATION OF INVESTMENT ADVISORY AND SUB-ADVISORY AGREEMENTS:
Under Section 15 of the Investment Company Act of 1940 (the “1940 Act”), the Board of Trustees (the “Board”) of Wells Fargo Funds Trust (the “Trust”), all the members of which have no direct or indirect interest in the investment advisory and sub-advisory agreements and are not “interested persons” of the Trust, as defined in the 1940 Act (the “Independent Trustees”), must determine whether to approve the continuation of the Trust’s investment advisory and sub-advisory agreements. In this regard, at in-person meetings held on March 27-28, 2014 (the “March Meeting”) and May 15-16, 2014 (the “May Meeting”, and together with the March Meeting, the “Meetings”), the Board reviewed: (i) an investment advisory agreement with Wells Fargo Funds Management, LLC (“Funds Management”) for Wells Fargo Advantage Small Cap Opportunities Fund (the “Fund”) and (ii) an investment sub-advisory agreement with Schroder Investment Management North America Inc. (the “Sub-Adviser”) for the Fund. The investment advisory agreement with Funds Management and the investment sub-advisory agreement with the Sub-Adviser are collectively referred to as the “Advisory Agreements.”
At the May Meeting, the Board received the information, considered the factors and reached the conclusions discussed below, and unanimously approved the renewal of the Advisory Agreements, as it had done at the March Meeting.
At the Meetings, the Board considered the factors and reached the conclusions described below relating to the selection of Funds Management and the Sub-Adviser and the continuation of the Advisory Agreements. Prior to the Meetings, the Trustees conferred extensively among themselves and with representatives of Funds Management about these matters. Also, the Board has adopted a team-based approach, with each team consisting of a sub-set of Trustees, to assist the full Board in the discharge of its duties in reviewing performance and other matters throughout the year. The Independent Trustees were assisted in their evaluation of the Advisory Agreements by independent legal counsel, from whom they received separate legal advice and with whom they met separately.
In providing information to the Board, Funds Management and the Sub-Adviser were guided by a detailed set of requests for information submitted to them by independent legal counsel on behalf of the Independent Trustees at the start of the Board’s annual contract renewal process earlier in 2014. In considering and approving the Advisory Agreements, the Trustees considered the information they believed relevant, including but not limited to the information discussed below. The Board considered not only the specific information presented in connection with the Meetings, but also the knowledge gained over time through interaction with Funds Management and the Sub-Adviser about various topics. In this regard, the Board reviewed reports of Funds Management at each of its quarterly meetings, which included, among other things, portfolio reviews and performance reports. In addition, the Board and the teams mentioned above confer with portfolio managers at various times throughout the year. The Board did not identify any particular information or consideration that was all-important or controlling, and each individual Trustee may have attributed different weights to various factors.
After its deliberations, the Board unanimously approved the continuation of the Advisory Agreements and determined that the compensation payable to Funds Management and the Sub-Adviser is reasonable. The Board considered the continuation of the Advisory Agreements for the Fund as part of its consideration of the continuation of advisory agreements for funds across the complex, but its approvals were made on a fund-by-fund basis. The following summarizes a number of important, but not necessarily all, factors considered by the Board in support of its approvals.
Nature, extent and quality of services
The Board received and considered various information regarding the nature, extent and quality of services provided to the Fund by Funds Management and the Sub-Adviser under the Advisory Agreements. This information included, among other things, a summary of the background and experience of senior management of Funds Management, and the qualifications, background, tenure and responsibilities of each of the portfolio managers primarily responsible for the day-to-day portfolio management of the Fund.
The Board evaluated the ability of Funds Management and the Sub-Adviser to attract and retain qualified investment professionals, including research, advisory and supervisory personnel. The Board further considered the compliance programs and compliance records of Funds Management and the Sub-Adviser. In addition, the Board took into account the full range of services provided to the Fund by Funds Management and its affiliates.
Fund performance and expenses
The Board considered the performance results for the Fund over various time periods ended December 31, 2013. The Board also considered these results in comparison to the performance of funds in a universe that was determined by Lipper Inc. (“Lipper”) to be similar to the Fund (the “Universe”), and in comparison to the Fund’s benchmark index and to other comparative data. Lipper is an independent provider of investment company data. The Board received a
| | | | |
| 26 | | Wells Fargo Advantage Small Cap Opportunities Fund | | Other information (unaudited) |
description of the methodology used by Lipper to select the mutual funds in the performance Universe. The Board noted that the performance of the Fund (Administrator Class) was higher than the average performance of the Universe for the ten-year period under review and lower than the average performance of the Universe for the one-, three- and five-year periods under review. The Board also noted that the performance of the Fund was higher than its benchmark, the Russell 2000® Index, for the ten-year period under review and lower than the average performance of its benchmark for the one-, three- and five-year periods under review.
The Board received information concerning, and discussed factors contributing to, the underperformance of the Fund relative to the Universe and benchmark for the one-, three- and five year periods. Funds Management advised the Board about the market conditions and investment decisions that it believed contributed to the underperformance during that period. Funds Management advised the Board that the Fund’s performance was affected by elevated cash levels and unfavorable stock selection in the technology sector. The Board noted the Fund’s long-term risk adjusted results and was satisfied with the explanation of factors contributing to underperformance and with the steps being taken by Funds Management and the Sub-Adviser to address the Fund’s investment performance.
The Board also received and considered information regarding the Fund’s net operating expense ratios and their various components, including actual management fees (which reflect fee waivers, if any, and include advisory, administration and transfer agent fees), custodian and other non-management fees, Rule 12b-1 and non-Rule 12b-1 service fees and fee waiver and expense reimbursement arrangements. The Board considered these ratios in comparison to the median ratios of funds in class-specific expense groups that were determined by Lipper to be similar to the Fund (the “Groups”). The Board received a description of the methodology used by Lipper to select the mutual funds in the expense Groups and an explanation of year-to-year variations in the funds comprising such expense Groups and their expense ratios. Based on the Lipper reports, the Board noted that the net operating expense ratios of the Fund were lower than the median net operating expense ratios of the expense Groups.
Based on its consideration of the factors and information it deemed relevant, including those described here, the Board concluded that the overall performance and expense structure of the Fund supported the re-approval of the Advisory Agreements.
Investment advisory and sub-advisory fee rates
The Board reviewed and considered the contractual investment advisory fee rates that are payable by the Fund to Funds Management for investment advisory services (the “Advisory Agreement Rates”), both on a stand-alone basis and on a combined basis with the Fund’s fund-level and class-level contractual administration fee rates (the “Management Rates”). The Board noted that the administration fees payable to Funds Management include transfer agency and sub-transfer agency costs. The Board also reviewed and considered the contractual investment sub-advisory fee rates that are payable by Funds Management to the Sub-Adviser for investment sub-advisory services (the “Sub-Advisory Agreement Rates”).
Among other information reviewed by the Board was a comparison of the Management Rates of the Fund with those of other funds in the expense Groups at a common asset level. The Board noted that the Management Rates of the Fund were in range of the average rates for the Fund’s expense Groups.
The Board also received and considered information about the portion of the total advisory fee that was retained by Funds Management after payment of the fee to the Sub-Adviser for sub-advisory services. The Board considered this amount in comparison to the median amount retained by advisers to funds in a sub-advised expense universe that was determined by Lipper to be similar to the Fund. In assessing the reasonableness of this amount, the Board received and evaluated information about the nature and extent of responsibilities retained and risks assumed by Funds Management and not delegated to or assumed by the Sub-Adviser, and about Funds Management’s on-going oversight services. The Board also considered that the sub-advisory fees paid to the Sub-Adviser had been negotiated by Funds Management on an arm’s length basis.
The Board also received and considered information about the nature and extent of services offered and fee rates charged by Funds Management and the Sub-Adviser to other types of clients with investment strategies similar to those of the Fund. In this regard, the Board received information about the significantly greater scope of services, and compliance, reporting and other legal burdens and risks of managing mutual funds compared with those associated with managing assets of non-mutual fund clients such as collective funds or institutional separate accounts.
Based on its consideration of the factors and information it deemed relevant, including those described here, the Board determined that the Advisory Agreement Rates and the Sub-Advisory Agreement Rates were reasonable in light of the services covered by the Advisory Agreements.
| | | | | | |
| Other information (unaudited) | | Wells Fargo Advantage Small Cap Opportunities Fund | | | 27 | |
Profitability
The Board received and considered information concerning the profitability of Funds Management, as well as the profitability of Wells Fargo as a whole, from providing services to the Fund and the fund family as a whole. Funds Management explained the methodologies and estimates that it used in calculating profitability. Among other things, the Board noted that the levels of profitability reported on a fund-by-fund basis varied widely, depending on factors such as the size and type of fund. The Board did not consider profitability with respect to the Sub-Adviser, as the sub-advisory fees paid to the Sub-Adviser had been negotiated by Funds Management on an arm’s-length basis.
Based on its review, the Board did not deem the profits reported by Funds Management to be at a level that would prevent it from approving the continuation of the Advisory Agreements.
Economies of scale
With respect to possible economies of scale, the Board noted the existence of breakpoints in the Fund’s advisory fee and administration fee structure, which operate generally to reduce the Fund’s expense ratios as the Fund grows in size. It considered that, for a small fund or a fund that shrinks in size, breakpoints conversely can result in higher fee levels. The Board also considered that fee waiver and expense reimbursement arrangements and competitive fee rates at the outset are means of sharing potential economies of scale with shareholders of the Fund and the fund family as a whole. The Board considered Funds Management’s view that any analyses of potential economies of scale in managing a particular fund are inherently limited in light of the joint and common costs and investments that Funds Management incurs across the fund family as a whole.
The Board concluded that the Fund’s fee and expense arrangements, including contractual breakpoints, constituted a reasonable approach to sharing potential economies of scale with the Fund and its shareholders.
Other benefits to Funds Management and the Sub-Adviser
The Board received and considered information regarding potential “fall-out” or ancillary benefits received by Funds Management, the Sub-Adviser, and their affiliates as a result of their relationships with the Fund. Ancillary benefits could include, among others, benefits directly attributable to other relationships with the Fund and benefits potentially derived from an increase in Funds Management’s and the Sub-Adviser’s business as a result of their relationships with the Fund. The Board noted that various affiliates of Funds Management may receive distribution-related fees, shareholder servicing payments and sub-transfer agency fees in respect of shares sold or held through them and services provided.
The Board also reviewed information about soft dollar credits earned and utilized by the Sub-Adviser, fees earned by Funds Management and the Sub-Adviser from managing a private investment vehicle for the fund family’s securities lending collateral and commissions earned by an affiliated broker from portfolio transactions.
Based on its consideration of the factors and information it deemed relevant, including those described here, the Board did not find that any ancillary benefits received by Funds Management, the Sub-Adviser, and their affiliates were unreasonable.
Conclusion
After considering the above-described factors and based on its deliberations and its evaluation of the information described above, the Board unanimously approved the continuation of the Advisory Agreements for an additional one-year period and determined that the compensation payable to Funds Management and the Sub-Adviser is reasonable.
| | | | |
| 28 | | Wells Fargo Advantage Small Cap Opportunities Fund | | List of abbreviations |
The following is a list of common abbreviations for terms and entities that may have appeared in this report.
| ACA | — ACA Financial Guaranty Corporation |
| ADR | — American depositary receipt |
| ADS | — American depositary shares |
| AGC | — Assured Guaranty Corporation |
| AGM | — Assured Guaranty Municipal |
| Ambac | — Ambac Financial Group Incorporated |
| AMT | — Alternative minimum tax |
| BAN | — Bond anticipation notes |
| BHAC | — Berkshire Hathaway Assurance Corporation |
| CAB | — Capital appreciation bond |
| CCAB | — Convertible capital appreciation bond |
| CDA | — Community Development Authority |
| CDO | — Collateralized debt obligation |
| DRIVER | — Derivative inverse tax-exempt receipts |
| DW&P | — Department of Water & Power |
| DWR | — Department of Water Resources |
| ECFA | — Educational & Cultural Facilities Authority |
| EDA | — Economic Development Authority |
| EDFA | — Economic Development Finance Authority |
| ETF | — Exchange-traded fund |
| FDIC | — Federal Deposit Insurance Corporation |
| FFCB | — Federal Farm Credit Banks |
| FGIC | — Financial Guaranty Insurance Corporation |
| FHA | — Federal Housing Administration |
| FHLB | — Federal Home Loan Bank |
| FHLMC | — Federal Home Loan Mortgage Corporation |
| FICO | — The Financing Corporation |
| FNMA | — Federal National Mortgage Association |
| GDR | — Global depositary receipt |
| GNMA | — Government National Mortgage Association |
| HCFR | — Healthcare facilities revenue |
| HEFA | — Health & Educational Facilities Authority |
| HEFAR | — Higher education facilities authority revenue |
| HFA | — Housing Finance Authority |
| HFFA | — Health Facilities Financing Authority |
| HUD | — Department of Housing and Urban Development |
| IDA | — Industrial Development Authority |
| IDAG | — Industrial Development Agency |
| KRW | — Republic of Korea won |
| LIBOR | — London Interbank Offered Rate |
| LLC | — Limited liability company |
| LLLP | — Limited liability limited partnership |
| LLP | — Limited liability partnership |
| MBIA | — Municipal Bond Insurance Association |
| MFHR | — Multifamily housing revenue |
| MSTR | — Municipal securities trust receipts |
| MUD | — Municipal Utility District |
| National | — National Public Finance Guarantee Corporation |
| PCFA | — Pollution Control Financing Authority |
| PCL | — Public Company Limited |
| PCR | — Pollution control revenue |
| PFA | — Public Finance Authority |
| PFFA | — Public Facilities Financing Authority |
| PFOTER | — Puttable floating option tax-exempt receipts |
| plc | — Public limited company |
| PUTTER | — Puttable tax-exempt receipts |
| R&D | — Research & development |
| Radian | — Radian Asset Assurance |
| RAN | — Revenue anticipation notes |
| RDA | — Redevelopment Authority |
| RDFA | — Redevelopment Finance Authority |
| REIT | — Real estate investment trust |
| ROC | — Reset option certificates |
| SAVRS | — Select auction variable rate securities |
| SBA | — Small Business Authority |
| SFHR | — Single-family housing revenue |
| SFMR | — Single-family mortgage revenue |
| SPA | — Standby purchase agreement |
| SPDR | — Standard & Poor’s Depositary Receipts |
| STRIPS | — Separate trading of registered interest and principal securities |
| TAN | — Tax anticipation notes |
| TIPS | — Treasury inflation-protected securities |
| TRAN | — Tax revenue anticipation notes |
| TTFA | — Transportation Trust Fund Authority |
| TVA | — Tennessee Valley Authority |


For more information
More information about Wells Fargo Advantage Funds is available free upon request. To obtain literature, please write, email, visit the Fund’s website, or call:
Wells Fargo Advantage Funds
P.O. Box 8266
Boston, MA 02266-8266
Email: wfaf@wellsfargo.com
Website: wellsfargoadvantagefunds.com
Individual investors: 1-800-222-8222
Retail investment professionals: 1-888-877-9275
Institutional investment professionals: 1-866-765-0778
This report and the financial statements contained herein are submitted for the general information of the shareholders of Wells Fargo Advantage Funds. If this report is used for promotional purposes, distribution of the report must be accompanied or preceded by a current prospectus. Before investing, please consider the investment objectives, risks, charges, and expenses of the investment. For a current prospectus and, if available, a summary prospectus, containing this information, call 1-800-222-8222 or visit the Fund’s website at wellsfargoadvantagefunds.com. Read the prospectus carefully before you invest or send money.
Wells Fargo Funds Management, LLC, a wholly owned subsidiary of Wells Fargo & Company, provides investment advisory and administrative services for Wells Fargo Advantage Funds. Other affiliates of Wells Fargo & Company provide subadvisory and other services for the Funds. The Funds are distributed by Wells Fargo Funds Distributor, LLC, Member FINRA/SIPC, an affiliate of Wells Fargo & Company.
NOT FDIC INSURED ¡ NO BANK GUARANTEE ¡ MAY LOSE VALUE
© 2014 Wells Fargo Funds Management, LLC. All rights reserved.
| | |
 | | 228299 11-14 SA243/SAR243 09-14 |

Wells Fargo Advantage Small Cap Value Fund

Semi-Annual Report
September 30, 2014

Reduce clutter. Save trees.
Sign up for electronic delivery of prospectuses and shareholder reports at wellsfargo.com/advantagedelivery
Contents
The views expressed and any forward-looking statements are as of September 30, 2014, unless otherwise noted, and are those of the Fund managers and/or Wells Fargo Funds Management, LLC. Discussions of individual securities, or the markets generally, or any Wells Fargo Advantage Fund are not intended as individual recommendations. Future events or results may vary significantly from those expressed in any forward-looking statements; the views expressed are subject to change at any time in response to changing circumstances in the market. Wells Fargo Funds Management, LLC and the Fund disclaim any obligation to publicly update or revise any views expressed or forward-looking statements.
NOT FDIC INSURED ¡ NO BANK GUARANTEE ¡ MAY LOSE VALUE
| | | | |
| 2 | | Wells Fargo Advantage Small Cap Value Fund | | Letter to shareholders (unaudited) |

Karla M. Rabusch
President
Wells Fargo Advantage Funds
Despite geopolitical challenges, U.S. economic numbers showed improvement.
Dear Valued Shareholder:
We are pleased to offer you this semi-annual report for the Wells Fargo Advantage Small Cap Value Fund for the six-month period that ended September 30, 2014. The period was marked by heightened geopolitical uncertainty as the U.S. and Europe continued to confront Russia over Ukraine and as Islamic militants (formerly known as ISIS) gained territory in Iraq and Syria. Toward the end of the reporting period, market volatility increased as renewed fears of slowing global growth took hold, and investors began to price in expectations that the U.S. Federal Reserve (Fed) was finally looking to raise short-term interest rates. Although mid-cap stocks (measured by the Russell Midcap® Index1) ended the period with a single-digit gain, small-cap stocks (measured by the Russell 2000® Index2) ended with a loss.
Major central banks continued to provide stimulus.
Throughout the reporting period, the Federal Open Market Committee (FOMC)—the U.S. Federal Reserve’s monetary policymaking body—kept its key interest rate near zero. Prior to the reporting period, in January 2014, the FOMC began to reduce (or taper) its bond-buying program by $10 billion per month and continued the taper throughout the reporting period. Some anticipated this action would lead to higher interest rates, however, interest rates followed a downward trend, despite short-term volatility. European markets continued to benefit from the European Central Bank’s (ECB’s) actions. In June 2014, the ECB announced a variety of measures aimed at encouraging lending, including cutting its key rate and imposing for the first time a negative interest rate on bank deposits held at the central bank. In September 2014, the ECB cut its key rate again—to 0.05%—and pushed the deposit rate for banks to -0.20%.
Although the geopolitical situation presented challenges, U.S. stock markets gained on positive economic data.
Geopolitical events were major obstacles throughout the reporting period. The ongoing standoff between the West (the U.S., Europe, and their allies) and Russia over Ukraine began in late 2013 and fed into stock market volatility early in 2014. The situation’s effect on the stock market faded as investors began to believe that the situation would not result in war, but as of September 2014, the situation had resulted in economic sanctions from the West against Russia. However, even as the market began to focus less on that situation, the advance of Islamic militants in Iraq and Syria led to airstrikes by the U.S. and its allies and fears of a regional war in the Middle East.
Despite geopolitical challenges, U.S. economic numbers showed improvement. The unemployment rate continued its slow improvement, declining from 6.3% in April 2014 to 5.9% in September 2014. Although investors received an unpleasant surprise when gross domestic product (GDP) growth for the first quarter of 2014 declined by 2.1% on an annualized basis, several commentators suggested that harsh winter weather may have dampened economic activity. Economic growth did accelerate in the second quarter of 2014, with an annualized GDP growth rate of 4.6%.
| 1. | The Russell Midcap® Index measures the performance of the 800 smallest companies in the Russell 1000® Index, which represent approximately 25% of the total market capitalization of the Russell 1000 Index. You cannot invest directly in an index. |
| 2. | The Russell 2000® Index measures the performance of the 2,000 smallest companies in the Russell 3000® Index, which represents approximately 8% of the total market capitalization of the Russell 3000 Index. You cannot invest directly in an index. |
| | | | | | |
| Letter to shareholders (unaudited) | | Wells Fargo Advantage Small Cap Value Fund | | | 3 | |
Investors’ positive outlook for the U.S. economy contributed to a solid domestic stock market for most of the period. However, slowing global economic growth, combined with renewed geopolitical concerns (including protests in Hong Kong), caused stock market weakness in September 2014. The Russell Midcap Index ended the period with a 3.2% gain. Small-cap stocks, however, were hit harder by the late-period uncertainty and the Russell 2000 Index ended with a -5.5% return. Growth stocks outperformed value stocks in both the small-cap and the mid-cap space.
Don’t let short-term uncertainty derail long-term investment goals.
Periods of uncertainty can present challenges, but experience has taught us that maintaining long-term investment goals can be an effective way to plan for the future. To help you create a sound strategy based on your personal goals and risk tolerance, Wells Fargo Advantage Funds offers more than 100 mutual funds and other investments spanning a wide range of asset classes and investment styles. Although diversification cannot guarantee an investment profit or prevent losses, we believe it can be an effective way to manage investment risk and potentially smooth out overall portfolio performance. We encourage investors to know their investments and to understand that appropriate levels of risk-taking may unlock opportunities.
Thank you for choosing to invest with Wells Fargo Advantage Funds. We appreciate your confidence in us and remain committed to helping you meet your financial needs. For current information about your fund investments, contact your investment professional, visit our website at wellsfargoadvantagefunds.com, or call us directly at 1-800-222-8222. We are available 24 hours a day, 7 days a week.
Sincerely,

Karla M. Rabusch
President
Wells Fargo Advantage Funds
Investors’ positive outlook for the U.S. economy contributed to a solid domestic stock market for most of the period.
| | | | |
| 4 | | Wells Fargo Advantage Small Cap Value Fund | | Performance highlights (unaudited) |
Investment objective
The Fund seeks long-term capital appreciation.
Adviser
Wells Fargo Funds Management, LLC
Subadviser
Wells Capital Management Incorporated
Portfolio managers
I. Charles Rinaldi
Erik C. Astheimer
Michael Schneider, CFA
Average annual total returns1 (%) as of September 30, 2014
| | | | | | | | | | | | | | | | | | | | | | | | | | | | | | | | | | |
| | | | | Including sales charge | | | Excluding sales charge | | | Expense ratios2 (%) | |
| | | Inception date | | 1 year | | | 5 year | | | 10 year | | | 1 year | | | 5 year | | | 10 year | | | Gross | | | Net3 | |
| Class A (SMVAX) | | 11-30-2000 | | | (3.24 | ) | | | 8.65 | | | | 7.38 | | | | 2.67 | | | | 9.94 | | | | 8.02 | | | | 1.35 | | | | 1.30 | |
| Class B (SMVBX)* | | 11-30-2000 | | | (3.09 | ) | | | 8.84 | | | | 7.46 | | | | 1.91 | | | | 9.12 | | | | 7.46 | | | | 2.10 | | | | 2.05 | |
| Class C (SMVCX) | | 11-30-2000 | | | 0.94 | | | | 9.13 | | | | 7.22 | | | | 1.94 | | | | 9.13 | | | | 7.22 | | | | 2.10 | | | | 2.05 | |
| Class R6 (SMVRX) | | 6-28-2013 | | | – | | | | – | | | | – | | | | 3.17 | | | | 10.41 | | | | 8.41 | | | | 0.87 | | | | 0.85 | |
| Administrator Class (SMVDX) | | 7-30-2010 | | | – | | | | – | | | | – | | | | 2.91 | | | | 10.18 | | | | 8.20 | | | | 1.19 | | | | 1.10 | |
| Institutional Class (WFSVX) | | 7-31-2007 | | | – | | | | – | | | | – | | | | 3.10 | | | | 10.39 | | | | 8.40 | | | | 0.92 | | | | 0.90 | |
| Investor Class (SSMVX) | | 12-31-1997 | | | – | | | | – | | | | – | | | | 2.66 | | | | 9.93 | | | | 8.07 | | | | 1.41 | | | | 1.31 | |
| Russell 2000® Value Index4 | | – | | | – | | | | – | | | | – | | | | 4.13 | | | | 13.02 | | | | 7.25 | | | | – | | | | – | |
| * | | Class B shares are closed to investment, except in connection with the reinvestment of any distributions and permitted exchanges. |
Figures quoted represent past performance, which is no guarantee of future results, and do not reflect taxes that a shareholder may pay on fund distributions or the redemption of fund shares. Investment return and principal value of an investment will fluctuate so that an investor’s shares, when redeemed, may be worth more or less than their original cost. Performance shown without sales charges would be lower if sales charges were reflected. Current performance may be lower or higher than the performance data quoted, which assumes the reinvestment of dividends and capital gains. Current month-end performance is available on the Fund’s website, wellsfargoadvantagefunds.com.
Index returns do not include transaction costs associated with buying and selling securities, any mutual fund fees or expenses, or any taxes. It is not possible to invest directly in an index.
For Class A shares, the maximum front-end sales charge is 5.75%. For Class B shares, the maximum contingent deferred sales charge is 5.00%. For Class C shares, the maximum contingent deferred sales charge is 1.00%. Performance including a contingent deferred sales charge assumes the sales charge for the corresponding time period. Class R6, Administrator Class, Institutional Class, and Investor Class shares are sold without a front-end sales charge or contingent deferred sales charge.
Stock values fluctuate in response to the activities of individual companies and general market and economic conditions. Smaller-company stocks tend to be more volatile and less liquid than those of larger companies. The use of derivatives may reduce returns and/or increase volatility. Certain investment strategies tend to increase the total risk of an investment (relative to the broader market). The Fund is exposed to foreign investment risk. Consult the Fund’s prospectus for additional information on these and other risks.
Please see footnotes on page 5.
| | | | | | |
| Performance highlights (unaudited) | | Wells Fargo Advantage Small Cap Value Fund | | | 5 | |
| | | | |
| Ten largest equity holdings5 (%) as of September 30, 2014 | |
InterOil Corporation | | | 8.79 | |
Randgold Resources Limited ADR | | | 6.87 | |
Chimera Investment Corporation | | | 5.03 | |
Delta Air Lines Incorporated | | | 2.76 | |
United Continental Holdings Incorporated | | | 2.63 | |
Newpark Resources Incorporated | | | 2.59 | |
OSI Systems Incorporated | | | 2.49 | |
Cray Incorporated | | | 2.21 | |
Trilogy Energy Corporation | | | 2.15 | |
Argo Group International Holdings Limited | | | 2.02 | |
| | |
| Sector distribution6 as of September 30, 2014 |
|
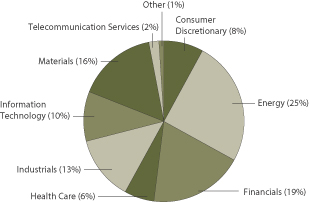 |
| 1. | Historical performance shown for Administrator Class shares prior to their inception reflects the performance of Institutional Class shares and has been adjusted to reflect the higher expenses applicable to Administrator Class shares. Historical performance shown for Institutional Class shares prior to their inception reflects the performance of Investor Class shares, and includes the higher expenses applicable to Investor Class shares. Historical performance shown for Class R6 shares prior to their inception reflects the performance of Institutional Class shares and includes the higher expenses applicable to Institutional Class shares. If these expenses had not been included, returns would be higher. |
| 2. | Reflects the expense ratios as stated in the most recent prospectuses, which include the impact of 0.02% in acquired fund fees and expenses. The expense ratios shown are subject to change and may differ from the annualized expense ratios shown in the financial highlights of this report, which do not include acquired fund fees and expenses. |
| 3. | The Adviser has committed through July 31, 2015, to waive fees and/or reimburse expenses to the extent necessary to cap the Fund’s Total Annual Fund Operating Expenses After Fee Waiver, excluding certain expenses, at 1.28% for Class A, 2.03% for Class B, 2.03% for Class C, 0.83% for Class R6, 1.08% for Administrator Class, 0.88% for Institutional Class, and 1.29% for Investor Class. After this time, the cap may be increased or the commitment to maintain the cap may be terminated only with the approval of the Board of Trustees. Brokerage commissions, stamp duty fees, interest, taxes, acquired fund fees and expenses, and extraordinary expenses are excluded from the cap. Without this cap, the Fund’s returns would have been lower. |
| 4. | The Russell 2000® Value Index measures the performance of those Russell 2000 companies with lower price-to-book ratios and lower forecasted growth values. You cannot invest directly in an index. |
| 5. | The ten largest equity holdings are calculated based on the value of the securities divided by total net assets of the Fund. Holdings are subject to change and may have changed since the date specified. |
| 6. | Sector distribution is subject to change and is calculated based on the total long-term investments of the Fund. |
| | | | |
| 6 | | Wells Fargo Advantage Small Cap Value Fund | | Fund expenses (unaudited) |
As a shareholder of the Fund, you incur two types of costs: (1) transaction costs, including sales charges (loads) on purchase payments and contingent deferred sales charges (if any) on redemptions and (2) ongoing costs, including management fees, distribution (12b-1) and/or shareholder service fees, and other Fund expenses. This example is intended to help you understand your ongoing costs (in dollars) of investing in the Fund and to compare these costs with the ongoing costs of investing in other mutual funds.
The example is based on an investment of $1,000 invested at the beginning of the six-month period and held for the entire period from April 1, 2014 to September 30, 2014.
Actual expenses
The “Actual” line of the table below provides information about actual account values and actual expenses. You may use the information in this line, together with the amount you invested, to estimate the expenses that you paid over the period. Simply divide your account value by $1,000 (for example, an $8,600 account value divided by $1,000 = 8.6), then multiply the result by the number in the “Actual” line under the heading entitled “Expenses paid during period” for your applicable class of shares to estimate the expenses you paid on your account during this period.
Hypothetical example for comparison purposes
The “Hypothetical” line of the table below provides information about hypothetical account values and hypothetical expenses based on the Fund’s actual expense ratio and an assumed rate of return of 5% per year before expenses, which is not the Fund’s actual return. The hypothetical account values and expenses may not be used to estimate the actual ending account balance or expenses you paid for the period. You may use this information to compare the ongoing costs of investing in the Fund and other funds. To do so, compare this 5% hypothetical example with the 5% hypothetical examples that appear in the shareholder reports of the other funds.
Please note that the expenses shown in the table are meant to highlight your ongoing costs only and do not reflect any transactional costs, such as sales charges (loads) and contingent deferred sales charges. Therefore, the “Hypothetical” line of the table is useful in comparing ongoing costs only and will not help you determine the relative total costs of owning different funds. In addition, if these transactional costs were included, your costs would have been higher.
| | | | | | | | | | | | | | | | |
| | | Beginning
account value
4-1-2014 | | | Ending
account value
9-30-2014 | | | Expenses
paid during
the period¹ | | | Net annualized
expense ratio | |
Class A | | | | | | | | | | | | | | | | |
Actual | | $ | 1,000.00 | | | $ | 931.17 | | | $ | 6.25 | | | | 1.29 | % |
Hypothetical (5% return before expenses) | | $ | 1,000.00 | | | $ | 1,018.60 | | | $ | 6.53 | | | | 1.29 | % |
Class B | | | | | | | | | | | | | | | | |
Actual | | $ | 1,000.00 | | | $ | 927.52 | | | $ | 9.86 | | | | 2.04 | % |
Hypothetical (5% return before expenses) | | $ | 1,000.00 | | | $ | 1,014.84 | | | $ | 10.30 | | | | 2.04 | % |
Class C | | | | | | | | | | | | | | | | |
Actual | | $ | 1,000.00 | | | $ | 927.88 | | | $ | 9.86 | | | | 2.04 | % |
Hypothetical (5% return before expenses) | | $ | 1,000.00 | | | $ | 1,014.84 | | | $ | 10.30 | | | | 2.04 | % |
Class R6 | | | | | | | | | | | | | | | | |
Actual | | $ | 1,000.00 | | | $ | 933.19 | | | $ | 4.07 | | | | 0.84 | % |
Hypothetical (5% return before expenses) | | $ | 1,000.00 | | | $ | 1,020.86 | | | $ | 4.26 | | | | 0.84 | % |
Administrator Class | | | | | | | | | | | | | | | | |
Actual | | $ | 1,000.00 | | | $ | 932.14 | | | $ | 5.28 | | | | 1.09 | % |
Hypothetical (5% return before expenses) | | $ | 1,000.00 | | | $ | 1,019.60 | | | $ | 5.52 | | | | 1.09 | % |
Institutional Class | | | | | | | | | | | | | | | | |
Actual | | $ | 1,000.00 | | | $ | 932.93 | | | $ | 4.31 | | | | 0.89 | % |
Hypothetical (5% return before expenses) | | $ | 1,000.00 | | | $ | 1,020.61 | | | $ | 4.51 | | | | 0.89 | % |
Investor Class | | | | | | | | | | | | | | | | |
Actual | | $ | 1,000.00 | | | $ | 931.20 | | | $ | 6.29 | | | | 1.30 | % |
Hypothetical (5% return before expenses) | | $ | 1,000.00 | | | $ | 1,018.55 | | | $ | 6.58 | | | | 1.30 | % |
| 1. | Expenses paid is equal to the annualized expense ratio of each class multiplied by the average account value over the period, multiplied by the number of days in the most recent fiscal half-year divided by the number of days in the fiscal year (to reflect the one-half-year period). |
| | | | | | |
| Portfolio of investments—September 30, 2014 (unaudited) | | Wells Fargo Advantage Small Cap Value Fund | | | 7 | |
| | | | | | | | | | | | |
| Security name | | | | | | Shares | | | Value | |
| | | | | | | | | | | | |
| | | | |
Common Stocks: 85.28% | | | | | | | | | | | | |
| | | | |
Consumer Discretionary: 6.71% | | | | | | | | | | | | |
| | | | |
| Auto Components: 0.60% | | | | | | | | | | | | |
Fox Factory Holding Corporation † | | | | | | | 509,700 | | | $ | 7,900,350 | |
Gentex Corporation | | | | | | | 245,900 | | | | 6,582,743 | |
| | | | |
| | | | | | | | | | | 14,483,093 | |
| | | | | | | | | | | | |
| | | | |
| Hotels, Restaurants & Leisure: 2.32% | | | | | | | | | | | | |
Century Casinos Incorporated † | | | | | | | 1,092,300 | | | | 5,603,499 | |
Denny’s Corporation † | | | | | | | 2,487,300 | | | | 17,485,719 | |
Scientific Games Corporation Class A † | | | | | | | 1,073,200 | | | | 11,558,364 | |
The Wendy’s Company | | | | | | | 2,644,400 | | | | 21,842,744 | |
| | | | |
| | | | | | | | | | | 56,490,326 | |
| | | | | | | | | | | | |
| | | | |
| Household Durables: 3.25% | | | | | | | | | | | | |
Cavco Industries Incorporated †(l) | | | | | | | 711,200 | | | | 48,361,600 | |
Harman International Industries Incorporated | | | | | | | 48,600 | | | | 4,764,744 | |
KB Home Incorporated | | | | | | | 619,200 | | | | 9,250,848 | |
Skyline Corporation †(l) | | | | | | | 526,100 | | | | 2,172,793 | |
Taylor Morrison Home Corporation Class A † | | | | | | | 377,000 | | | | 6,114,940 | |
The New Home Company Incorporated † | | | | | | | 631,500 | | | | 8,525,250 | |
| | | | |
| | | | | | | | | | | 79,190,175 | |
| | | | | | | | | | | | |
| | | | |
| Media: 0.17% | | | | | | | | | | | | |
Journal Communications Incorporated Class A † | | | | | | | 485,900 | | | | 4,096,137 | |
| | | | | | | | | | | | |
| | | | |
| Specialty Retail: 0.37% | | | | | | | | | | | | |
Vitamin Shoppe Incorporated † | | | | | | | 202,200 | | | | 8,975,658 | |
| | | | | | | | | | | | |
| | | | |
Energy: 21.47% | | | | | | | | | | | | |
| | | | |
| Energy Equipment & Services: 8.07% | | | | | | | | | | | | |
Glori Energy Incorporated † | | | | | | | 693,000 | | | | 5,474,700 | |
Helix Energy Solutions Group Incorporated † | | | | | | | 970,400 | | | | 21,407,024 | |
Helmerich & Payne Incorporated | | | | | | | 133,800 | | | | 13,095,006 | |
ION Geophysical Corporation † | | | | | | | 4,757,100 | | | | 13,272,309 | |
Key Energy Services Incorporated † | | | | | | | 2,390,600 | | | | 11,570,504 | |
Newpark Resources Incorporated †(l) | | | | | | | 5,071,600 | | | | 63,090,704 | |
Oceaneering International Incorporated | | | | | | | 209,900 | | | | 13,679,183 | |
Parker Drilling Company † | | | | | | | 2,616,000 | | | | 12,923,040 | |
PHI Incorporated (non-voting) † | | | | | | | 487,900 | | | | 20,077,085 | |
PHI Incorporated (voting) † | | | | | | | 25,000 | | | | 1,030,750 | |
Vantage Drilling Company † | | | | | | | 1,692,000 | | | | 2,148,840 | |
Willbros Group Incorporated † | | | | | | | 2,248,200 | | | | 18,727,506 | |
| | | | |
| | | | | | | | | | | 196,496,651 | |
| | | | | | | | | | | | |
| | | | |
| Oil, Gas & Consumable Fuels: 13.40% | | | | | | | | | | | | |
Clean Energy Fuels Corporation † | | | | | | | 670,400 | | | | 5,229,120 | |
InterOil Corporation †(l) | | | | | | | 3,946,400 | | | | 214,131,664 | |
Range Resources Corporation | | | | | | | 489,700 | | | | 33,206,557 | |
The accompanying notes are an integral part of these financial statements.
| | | | |
| 8 | | Wells Fargo Advantage Small Cap Value Fund | | Portfolio of investments—September 30, 2014 (unaudited) |
| | | | | | | | | | | | |
| Security name | | | | | | Shares | | | Value | |
| | | | | | | | | | | | |
| | | | |
| Oil, Gas & Consumable Fuels (continued) | | | | | | | | | | | | |
Sanchez Energy Corporation † | | | | | | | 245,100 | | | $ | 6,436,326 | |
Stone Energy Corporation † | | | | | | | 479,600 | | | | 15,040,256 | |
Trilogy Energy Corporation (a) | | | | | | | 2,310,300 | | | | 52,316,464 | |
| | | | |
| | | | | | | | | | | 326,360,387 | |
| | | | | | | | | | | | |
| | | | |
Financials: 16.78% | | | | | | | | | | | | |
| | | | |
| Banks: 4.25% | | | | | | | | | | | | |
Ameris Bancorp | | | | | | | 397,400 | | | | 8,722,930 | |
BBCN Bancorp Incorporated | | | | | | | 611,200 | | | | 8,917,408 | |
CenterState Banks Incorporated | | | | | | | 1,104,900 | | | | 11,435,715 | |
City National Corporation | | | | | | | 119,700 | | | | 9,057,699 | |
First Horizon National Corporation | | | | | | | 1,365,700 | | | | 16,770,796 | |
First Niagara Financial Group Incorporated | | | | | | | 1,791,400 | | | | 14,922,362 | |
IBERIABANK Corporation | | | | | | | 141,250 | | | | 8,829,538 | |
Park Sterling Corporation | | | | | | | 899,900 | | | | 5,966,337 | |
The Bancorp Incorporated † | | | | | | | 1,342,900 | | | | 11,535,511 | |
Wilshire Bancorp Incorporated | | | | | | | 798,700 | | | | 7,372,001 | |
| | | | |
| | | | | | | | | | | 103,530,297 | |
| | | | | | | | | | | | |
| | | | |
| Capital Markets: 0.49% | | | | | | | | | | | | |
Medley Management Incorporated Class A †(l) | | | | | | | 712,500 | | | | 12,019,875 | |
| | | | | | | | | | | | |
| | | | |
| Consumer Finance: 0.45% | | | | | | | | | | | | |
Cash America International Incorporated | | | | | | | 251,100 | | | | 10,998,180 | |
| | | | | | | | | | | | |
| | | | |
| Insurance: 3.03% | | | | | | | | | | | | |
Argo Group International Holdings Limited | | | | | | | 979,500 | | | | 49,278,645 | |
Hilltop Holdings Incorporated † | | | | | | | 292,500 | | | | 5,864,625 | |
National General Holdings | | | | | | | 221,000 | | | | 3,732,690 | |
OneBeacon Insurance Group Limited | | | | | | | 960,900 | | | | 14,807,469 | |
| | | | |
| | | | | | | | | | | 73,683,429 | |
| | | | | | | | | | | | |
| | | | |
| REITs: 8.36% | | | | | | | | | | | | |
Capstead Mortgage Corporation | | | | | | | 200,300 | | | | 2,451,672 | |
Chimera Investment Corporation | | | | | | | 40,299,200 | | | | 122,509,568 | |
Invesco Mortgage Capital Incorporated | | | | | | | 798,900 | | | | 12,558,708 | |
MFA Mortgage Investments Incorporated | | | | | | | 2,812,800 | | | | 21,883,584 | |
Redwood Trust Incorporated | | | | | | | 1,489,300 | | | | 24,692,594 | |
Sun Communities Incorporated | | | | | | | 268,600 | | | | 13,564,300 | |
UMH Properties Incorporated | | | | | | | 616,100 | | | | 5,852,950 | |
| | | | |
| | | | | | | | | | | 203,513,376 | |
| | | | | | | | | | | | |
| | | | |
| Thrifts & Mortgage Finance: 0.20% | | | | | | | | | | | | |
Northwest Bancshares Incorporated | | | | | | | 405,100 | | | | 4,901,710 | |
| | | | | | | | | | | | |
| | | | |
Health Care: 5.21% | | | | | | | | | | | | |
| | | | |
| Health Care Equipment & Supplies: 1.86% | | | | | | | | | | | | |
Allied Healthcare Products Incorporated †(l) | | | | | | | 781,200 | | | | 1,562,400 | |
The accompanying notes are an integral part of these financial statements.
| | | | | | |
| Portfolio of investments—September 30, 2014 (unaudited) | | Wells Fargo Advantage Small Cap Value Fund | | | 9 | |
| | | | | | | | | | | | |
| Security name | | | | | | Shares | | | Value | |
| | | | | | | | | | | | |
| | | | |
| Health Care Equipment & Supplies (continued) | | | | | | | | | | | | |
Hologic Incorporated † | | | | | | | 366,400 | | | $ | 8,914,512 | |
OraSure Technologies Incorporated †(l) | | | | | | | 4,822,600 | | | | 34,819,172 | |
| | | | |
| | | | | | | | | | | 45,296,084 | |
| | | | | | | | | | | | |
| | | | |
| Health Care Providers & Services: 2.16% | | | | | | | | | | | | |
Air Methods Corporation † | | | | | | | 28,200 | | | | 1,566,510 | |
Cross Country Healthcare Incorporated †(l) | | | | | | | 1,961,600 | | | | 18,223,264 | |
Gentiva Health Services Incorporated † | | | | | | | 1,315,400 | | | | 22,072,412 | |
Healthways Incorporated † | | | | | | | 667,500 | | | | 10,693,350 | |
| | | | |
| | | | | | | | | | | 52,555,536 | |
| | | | | | | | | | | | |
| | | | |
| Health Care Technology: 0.39% | | | | | | | | | | | | |
Allscripts Healthcare Solutions Incorporated † | | | | | | | 703,900 | | | | 9,442,819 | |
| | | | | | | | | | | | |
| | | | |
| Life Sciences Tools & Services: 0.28% | | | | | | | | | | | | |
Parexel International Corporation † | | | | | | | 110,400 | | | | 6,965,136 | |
| | | | | | | | | | | | |
| | | | |
| Pharmaceuticals: 0.52% | | | | | | | | | | | | |
Prestige Brands Holdings Incorporated † | | | | | | | 390,800 | | | | 12,650,196 | |
| | | | | | | | | | | | |
| | | | |
Industrials: 11.19% | | | | | | | | | | | | |
| | | | |
| Airlines: 6.46% | | | | | | | | | | | | |
American Airlines Group Incorporated | | | | | | | 486,600 | | | | 17,264,568 | |
Delta Air Lines Incorporated | | | | | | | 1,860,700 | | | | 67,264,305 | |
Latam Airlines Group SP ADR † | | | | | | | 770,000 | | | | 8,754,900 | |
United Continental Holdings Incorporated † | | | | | | | 1,369,100 | | | | 64,060,189 | |
| | | | |
| | | | | | | | | | | 157,343,962 | |
| | | | | | | | | | | | |
| | | | |
| Commercial Services & Supplies: 2.25% | | | | | | | | | | | | |
ABM Industries Incorporated | | | | | | | 932,400 | | | | 23,953,356 | |
ACCO Brands Corporation † | | | | | | | 3,428,700 | | | | 23,658,030 | |
Healthcare Services Group Incorporated | | | | | | | 252,900 | | | | 7,235,469 | |
| | | | |
| | | | | | | | | | | 54,846,855 | |
| | | | | | | | | | | | |
| | | | |
| Construction & Engineering: 0.05% | | | | | | | | | | | | |
Primoris Services Corporation | | | | | | | 47,600 | | | | 1,277,584 | |
| | | | | | | | | | | | |
| | | | |
| Electrical Equipment: 0.39% | | | | | | | | | | | | |
GrafTech International Limited † | | | | | | | 2,099,500 | | | | 9,615,710 | |
| | | | | | | | | | | | |
| | | | |
| Machinery: 0.39% | | | | | | | | | | | | |
Actuant Corporation Class A | | | | | | | 307,200 | | | | 9,375,744 | |
| | | | | | | | | | | | |
| | | | |
| Professional Services: 0.50% | | | | | | | | | | | | |
Hill International Incorporated † | | | | | | | 2,409,900 | | | | 9,639,600 | |
Kforce Incorporated | | | | | | | 134,500 | | | | 2,632,165 | |
| | | | |
| | | | | | | | | | | 12,271,765 | |
| | | | | | | | | | | | |
The accompanying notes are an integral part of these financial statements.
| | | | |
| 10 | | Wells Fargo Advantage Small Cap Value Fund | | Portfolio of investments—September 30, 2014 (unaudited) |
| | | | | | | | | | | | |
| Security name | | | | | | Shares | | | Value | |
| | | | | | | | | | | | |
| | | | |
| Road & Rail: 0.67% | | | | | | | | | | | | |
Covenant Transport Incorporated Class A †(l) | | | | | | | 873,300 | | | $ | 16,234,647 | |
| | | | | | | | | | | | |
| | | | |
| Trading Companies & Distributors: 0.48% | | | | | | | | | | | | |
Applied Industrial Technologies Incorporated | | | | | | | 253,400 | | | | 11,567,710 | |
| | | | | | | | | | | | |
| | | | |
Information Technology: 8.91% | | | | | | | | | | | | |
| | | | |
| Communications Equipment: 0.67% | | | | | | | | | | | | |
Brocade Communications Systems Incorporated | | | | | | | 714,900 | | | | 7,770,963 | |
Harmonic Incorporated † | | | | | | | 1,357,900 | | | | 8,609,086 | |
| | | | |
| | | | | | | | | | | 16,380,049 | |
| | | | | | | | | | | | |
| | | | |
| Electronic Equipment, Instruments & Components: 4.96% | | | | | | | | | | | | |
Checkpoint Systems Incorporated † | | | | | | | 1,198,000 | | | | 14,651,540 | |
Cognex Corporation † | | | | | | | 437,500 | | | | 17,618,125 | |
Coherent Incorporated † | | | | | | | 455,300 | | | | 27,941,761 | |
OSI Systems Incorporated † | | | | | | | 954,200 | | | | 60,572,616 | |
| | | | |
| | | | | | | | | | | 120,784,042 | |
| | | | | | | | | | | | |
| | | | |
| Internet Software & Services: 0.24% | | | | | | | | | | | | |
Gogo Incorporated † | | | | | | | 340,800 | | | | 5,745,888 | |
| | | | | | | | | | | | |
| | | | |
| Semiconductors & Semiconductor Equipment: 0.43% | | | | | | | | | | | | |
Kulicke & Soffa Industries Incorporated † | | | | | | | 741,200 | | | | 10,547,276 | |
| | | | | | | | | | | | |
| | | | |
| Technology Hardware, Storage & Peripherals: 2.61% | | | | | | | | | | | | |
Cray Incorporated †(l) | | | | | | | 2,053,200 | | | | 53,875,968 | |
Diebold Incorporated | | | | | | | 67,600 | | | | 2,387,632 | |
Quantum Corporation † | | | | | | | 6,242,500 | | | | 7,241,300 | |
| | | | |
| | | | | | | | | | | 63,504,900 | |
| | | | | | | | | | | | |
| | | | |
Materials: 13.76% | | | | | | | | | | | | |
| | | | |
| Chemicals: 0.53% | | | | | | | | | | | | |
Calgon Carbon Corporation † | | | | | | | 326,300 | | | | 6,323,694 | |
Zep Incorporated | | | | | | | 463,900 | | | | 6,503,878 | |
| | | | |
| | | | | | | | | | | 12,827,572 | |
| | | | | | | | | | | | |
| | | | |
| Containers & Packaging: 0.33% | | | | | | | | | | | | |
Intertape Polymer Group Incorporated | | | | | | | 557,400 | | | | 8,082,300 | |
| | | | | | | | | | | | |
| | | | |
| Metals & Mining: 12.28% | | | | | | | | | | | | |
Agnico-Eagle Mines Limited | | | | | | | 425,000 | | | | 12,337,750 | |
Carpenter Technology Corporation | | | | | | | 316,000 | | | | 14,267,400 | |
Dominion Diamond Corporation † | | | | | | | 597,100 | | | | 8,502,704 | |
NovaGold Resources Incorporated † | | | | | | | 1,773,600 | | | | 5,374,008 | |
Randgold Resources Limited ADR | | | | | | | 2,475,866 | | | | 167,343,783 | |
Royal Gold Incorporated | | | | | | | 355,000 | | | | 23,053,700 | |
Sandstorm Gold Limited † | | | | | | | 2,218,700 | | | | 9,540,410 | |
Silver Standard Resources Incorporated † | | | | | | | 1,815,200 | | | | 11,072,720 | |
The accompanying notes are an integral part of these financial statements.
| | | | | | |
| Portfolio of investments—September 30, 2014 (unaudited) | | Wells Fargo Advantage Small Cap Value Fund | | | 11 | |
| | | | | | | | | | | | | | | | |
| Security name | | | | | | | | Shares | | | Value | |
| | | | | | | | | | | | | | | | |
| | | | |
| Metals & Mining (continued) | | | | | | | | | | | | | | | | |
Steel Dynamics Incorporated | | | | | | | | | | | 1,481,400 | | | $ | 33,494,454 | |
United States Steel Corporation | | | | | | | | | | | 160,900 | | | | 6,302,453 | |
Webco Industries Incorporated †(a)(i)(l) | | | | | | | | | | | 85,000 | | | | 7,650,000 | |
| | | | |
| | | | | | | | | | | | | | | 298,939,382 | |
| | | | | | | | | | | | | | | | |
| | | | |
| Paper & Forest Products: 0.62% | | | | | | | | | | | | | | | | |
Deltic Timber Corporation | | | | | | | | | | | 110,000 | | | | 6,855,200 | |
Wausau Paper Corporation | | | | | | | | | | | 1,039,400 | | | | 8,242,442 | |
| | | | |
| | | | | | | | | | | | | | | 15,097,642 | |
| | | | | | | | | | | | | | | | |
| | | | |
Telecommunication Services: 1.25% | | | | | | | | | | | | | | | | |
| | | | |
| Diversified Telecommunication Services: 1.25% | | | | | | | | | | | | | | | | |
Cincinnati Bell Incorporated † | | | | | | | | | | | 9,005,500 | | | | 30,348,534 | |
| | | | | | | | | | | | | | | | |
| | | | |
Total Common Stocks (Cost $1,377,640,410) | | | | | | | | | | | | | | | 2,076,440,627 | |
| | | | | | | | | | | | | | | | |
| | | | |
Exchange-Traded Funds: 1.20% | | | | | | | | | | | | | | | | |
KBW Regional Banking ETF | | | | | | | | | | | | | | | 5,428,178 | |
Market Vectors Gold Miners ETF | | | | | | | | | | | | | | | 15,582,319 | |
Market Vectors Junior Gold Miners ETF † | | | | | | | | | | | | | | | 8,087,021 | |
| | | | |
Exchange-Traded Funds (Cost $34,824,226) | | | | | | | | | | | | | | | 29,097,518 | |
| | | | | | | | | | | | | | | | |
| | | | | | Expiration date | | | | | | | |
| | | | |
Warrants: 0.00% | | | | | | | | | | | | | | | | |
| | | | |
Materials: 0.00% | | | | | | | | | | | | | | | | |
| | | | |
| Metals & Mining : 0.00% | | | | | | | | | | | | | | | | |
Sandstorm Gold Limited †(i) | | | | | | | 10/19/2015 | | | | 470,263 | | | | 88,178 | |
| | | | | | | | | | | | | | | | |
| | | | |
Total Warrants (Cost $0) | | | | | | | | | | | | | | | 88,178 | |
| | | | | | | | | | | | | | | | |
| | �� | Yield | | | | | | | | | | |
| | | | |
Short-Term Investments: 13.64% | | | | | | | | | | | | | | | | |
| | | | |
| Investment Companies: 13.64% | | | | | | | | | | | | | | | | |
Wells Fargo Advantage Cash Investment Money Market Fund, Select
Class (l)(u) | | | 0.07 | % | | | | | | | 332,023,220 | | | | 332,023,220 | |
| | | | | | | | | | | | | | | | |
| | | | |
Total Short-Term Investments (Cost $332,023,220) | | | | | | | | | | | | | | | 332,023,220 | |
| | | | | | | | | | | | | | | | |
| | | | | | | | |
Total investments in securities (Cost $1,744,487,856) * | | | 100.12 | % | | | 2,437,649,543 | |
Other assets and liabilities, net | | | (0.12 | ) | | | (2,805,491 | ) |
| | | | | | | | |
| Total net assets | | | 100.00 | % | | $ | 2,434,844,052 | |
| | | | | | | | |
| † | Non-income-earning security |
| (l) | The security represents an affiliate of the Fund as defined in the Investment Company Act of 1940. |
| (a) | The security is fair valued by the Management Valuation Team, and in certain instances by the Board of Trustees, in accordance with procedures approved by the Board of Trustees. |
| (u) | The rate represents the 7-day annualized yield at period end. |
| * | Cost for federal income tax purposes is $1,749,983,422 and unrealized gains (losses) consists of: |
| | | | |
Gross unrealized gains | | $ | 814,250,774 | |
Gross unrealized losses | | | (126,584,653 | ) |
| | | | |
Net unrealized gains | | $ | 687,666,121 | |
The accompanying notes are an integral part of these financial statements.
| | | | |
| 12 | | Wells Fargo Advantage Small Cap Value Fund | | Statement of assets and liabilities—September 30, 2014 (unaudited) |
| | | | |
| | | | |
| |
Assets | | | | |
Investments | | | | |
In unaffiliated securities, at value (cost $1,130,752,630) | | $ | 1,633,484,236 | |
In affiliated securities, at value (cost $613,735,226) | | | 804,165,307 | |
| | | | |
Total investments, at value (cost $1,744,487,856) | | | 2,437,649,543 | |
Receivable for investments sold | | | 13,839,365 | |
Receivable for Fund shares sold | | | 3,108,565 | |
Receivable for dividends | | | 5,508,227 | |
| | | | |
Total assets | | | 2,460,105,700 | |
| | | | |
| |
Liabilities | | | | |
Payable for investments purchased | | | 5,368,764 | |
Payable for Fund shares redeemed | | | 17,307,899 | |
Advisory fee payable | | | 1,448,731 | |
Distribution fees payable | | | 60,086 | |
Administration fees payable | | | 483,993 | |
Accrued expenses and other liabilities | | | 592,175 | |
| | | | |
Total liabilities | | | 25,261,648 | |
| | | | |
Total net assets | | $ | 2,434,844,052 | |
| | | | |
| |
NET ASSETS CONSIST OF | | | | |
Paid-in capital | | $ | 1,382,502,173 | |
Undistributed net investment income | | | 11,080,760 | |
Accumulated net realized gains on investments | | | 348,099,630 | |
Net unrealized gains on investments | | | 693,161,489 | |
| | | | |
Total net assets | | $ | 2,434,844,052 | |
| | | | |
| |
COMPUTATION OF NET ASSET VALUE AND OFFERING PRICE PER SHARE | | | | |
Net assets – Class A | | $ | 356,325,378 | |
Shares outstanding – Class A1 | | | 10,705,507 | |
Net asset value per share – Class A | | | $33.28 | |
Maximum offering price per share – Class A2 | | | $35.31 | |
Net assets – Class B | | $ | 284,254 | |
Shares outstanding – Class B1 | | | 9,615 | |
Net asset value per share – Class B | | | $29.56 | |
Net assets – Class C | | $ | 91,839,494 | |
Shares outstanding – Class C1 | | | 3,104,110 | |
Net asset value per share – Class C | | | $29.59 | |
Net assets – Class R6 | | $ | 47,919,450 | |
Shares outstanding – Class R61 | | | 1,406,032 | |
Net asset value per share – Class R6 | | | $34.08 | |
Net assets – Administrator Class | | $ | 643,347,672 | |
Shares outstanding – Administrator Class1 | | | 18,963,069 | |
Net asset value per share – Administrator Class | | | $33.93 | |
Net assets – Institutional Class | | $ | 706,363,193 | |
Shares outstanding – Institutional Class1 | | | 20,724,199 | |
Net asset value per share – Institutional Class | | | $34.08 | |
Net assets – Investor Class | | $ | 588,764,611 | |
Shares outstanding – Investor Class1 | | | 17,330,848 | |
Net asset value per share – Investor Class | | | $33.97 | |
| 1. | The Fund has an unlimited number of authorized shares. |
| 2. | Maximum offering price is computed as 100/94.25 of net asset value. On investments of $50,000 or more, the offering price is reduced. |
The accompanying notes are an integral part of these financial statements.
| | | | | | |
| Statement of operations—six months ended September 30, 2014 (unaudited) | | Wells Fargo Advantage Small Cap Value Fund | | | 13 | |
| | | | |
| | | | |
| |
Investment income | | | | |
Dividends (net of foreign withholding taxes of $99,051) | | $ | 16,538,584 | |
Income from affiliated securities | | | 524,593 | |
Interest | | | 969 | |
| | | | |
Total investment income | | | 17,064,146 | |
| | | | |
| |
Expenses | | | | |
Advisory fee | | | 10,640,365 | |
Administration fees | | | | |
Fund level | | | 703,580 | |
Class A | | | 535,069 | |
Class B | | | 521 | |
Class C | | | 131,822 | |
Class R6 | | | 3,913 | |
Administrator Class | | | 350,665 | |
Institutional Class | | | 346,282 | |
Investor Class | | | 1,132,482 | |
Shareholder servicing fees | | | | |
Class A | | | 514,489 | |
Class B | | | 501 | |
Class C | | | 126,752 | |
Administrator Class | | | 876,272 | |
Investor Class | | | 878,846 | |
Distribution fees | | | | |
Class B | | | 1,503 | |
Class C | | | 380,256 | |
Custody and accounting fees | | | 94,762 | |
Professional fees | | | 23,883 | |
Registration fees | | | 32,658 | |
Shareholder report expenses | | | 212,939 | |
Trustees’ fees and expenses | | | 4,705 | |
Other fees and expenses | | | 55,294 | |
| | | | |
Total expenses | | | 17,047,559 | |
Less: Fee waivers and/or expense reimbursements | | | (917,891 | ) |
| | | | |
Net expenses | | | 16,129,668 | |
| | | | |
Net investment income | | | 934,478 | |
| | | | |
| |
REALIZED AND UNREALIZED GAINS (LOSSES) ON INVESTMENTS | | | | |
| |
Net realized gains on: | | | | |
Unaffiliated securities | | | 85,632,584 | |
Affiliated securities | | | 16,649,122 | |
Written options | | | 468,379 | |
| | | | |
Net realized gains on investments | | | 102,750,085 | |
| | | | |
| |
Net change in unrealized gains (losses) on: | | | | |
Unaffiliated securities | | | (450,738,647 | ) |
Affiliated securities | | | 167,939,375 | |
Written options | | | (441,338 | ) |
| | | | |
Net change in unrealized gains (losses) on investments | | | (283,240,610 | ) |
| | | | |
Net realized and unrealized gains (losses) on investments | | | (180,490,525 | ) |
| | | | |
Net decrease in net assets resulting from operations | | $ | (179,556,047 | ) |
| | | | |
The accompanying notes are an integral part of these financial statements.
| | | | |
| 14 | | Wells Fargo Advantage Small Cap Value Fund | | Statement of changes in net assets |
| | | | | | | | | | | | | | | | | | | | | | | | |
| | | Six months ended
September 30, 2014 (unaudited) | | | Year ended
March 31, 20141 | | | Year ended
October 31, 2013 | |
| | | | | | |
Operations | | | | | | | | | | | | | | | | | | | | | | | | |
Net investment income | | | | | | $ | 934,478 | | | | | | | $ | 18,201,981 | | | | | | | $ | 29,762,669 | |
Net realized gains on investments | | | | | | | 102,750,085 | | | | | | | | 268,628,149 | | | | | | | | 300,714,353 | |
Net change in unrealized gains (losses) on investments | | | | | | | (283,240,610 | ) | | | | | | | (21,597,831 | ) | | | | | | | 195,897,104 | |
| | | | |
Net increase (decrease) in net assets resulting from operations | | | | | | | (179,556,047 | ) | | | | | | | 265,232,299 | | | | | | | | 526,374,126 | |
| | | | |
| | | | | | |
Distributions to shareholders from | | | | | | | | | | | | | | | | | | | | | | | | |
Net investment income | | | | | | | | | | | | | | | | | | | | | | | | |
Class A | | | | | | | 0 | | | | | | | | (1,509,695 | ) | | | | | | | (4,536,414 | ) |
Class C | | | | | | | 0 | | | | | | | | 0 | | | | | | | | (171,443 | ) |
Class R6 | | | | | | | 0 | | | | | | | | (212 | ) | | | | | | | 0 | 2 |
Administrator Class | | | | | | | 0 | | | | | | | | (3,799,419 | ) | | | | | | | (5,359,165 | ) |
Institutional Class | | | | | | | 0 | | | | | | | | (7,342,486 | ) | | | | | | | (13,128,793 | ) |
Investor Class | | | | | | | 0 | | | | | | | | (2,145,115 | ) | | | | | | | (8,580,979 | ) |
Net realized gains | | | | | | | | | | | | | | | | | | | | | | | | |
Class A | | | | | | | 0 | | | | | | | | (43,796,014 | ) | | | | | | | (21,797,929 | ) |
Class B | | | | | | | 0 | | | | | | | | (62,444 | ) | | | | | | | (46,937 | ) |
Class C | | | | | | | 0 | | | | | | | | (10,742,480 | ) | | | | | | | (4,121,715 | ) |
Class R6 | | | | | | | 0 | | | | | | | | (2,501 | ) | | | | | | | 0 | 2 |
Administrator Class | | | | | | | 0 | | | | | | | | (60,602,123 | ) | | | | | | | (19,576,380 | ) |
Institutional Class | | | | | | | 0 | | | | | | | | (94,384,653 | ) | | | | | | | (41,054,563 | ) |
Investor Class | | | | | | | 0 | | | | | | | | (82,220,872 | ) | | | | | | | (44,728,095 | ) |
| | | | |
Total distributions to shareholders | | | | | | | 0 | | | | | | | | (306,608,014 | ) | | | | | | | (163,102,413 | ) |
| | | | |
| | | | | | |
Capital share transactions | | | Shares | | | | | | | | Shares | | | | | | | | Shares | | | | | |
Proceeds from shares sold | | | | | | | | | | | | | | | | | | | | | | | | |
Class A | | | 516,168 | | | | 18,351,030 | | | | 601,094 | | | | 20,837,679 | | | | 2,268,017 | | | | 76,033,585 | |
Class B | | | 0 | | | | 0 | | | | 122 | | | | 3,779 | | | | 1,437 | | | | 44,640 | |
Class C | | | 51,278 | | | | 1,623,052 | | | | 101,771 | | | | 3,087,542 | | | | 346,085 | | | | 10,500,684 | |
Class R6 | | | 1,438,410 | | | | 51,869,059 | | | | 12,934 | | | | 466,848 | | | | 742 | 2 | | | 25,000 | 2 |
Administrator Class | | | 1,939,308 | | | | 70,213,802 | | | | 3,613,820 | | | | 124,358,091 | | | | 5,954,868 | | | | 204,390,566 | |
Institutional Class | | | 1,208,457 | | | | 43,876,087 | | | | 1,943,947 | | | | 69,997,238 | | | | 6,194,930 | | | | 215,795,560 | |
Investor Class | | | 624,923 | | | | 22,691,670 | | | | 811,524 | | | | 28,539,103 | | | | 3,866,218 | | | | 131,620,775 | |
| | | | |
| | | | | | | 208,624,700 | | | | | | | | 247,290,280 | | | | | | | | 638,410,810 | |
| | | | |
Reinvestment of distributions | | | | | | | | | | | | | | | | | | | | | | | | |
Class A | | | 0 | | | | 0 | | | | 1,333,514 | | | | 43,742,944 | | | | 761,279 | | | | 23,762,380 | |
Class B | | | 0 | | | | 0 | | | | 1,942 | | | | 56,766 | | | | 1,521 | | | | 42,714 | |
Class C | | | 0 | | | | 0 | | | | 320,308 | | | | 9,369,017 | | | | 133,666 | | | | 3,766,646 | |
Class R6 | | | 0 | | | | 0 | | | | 81 | | | | 2,713 | | | | 0 | 2 | | | 0 | 2 |
Administrator Class | | | 0 | | | | 0 | | | | 351,743 | | | | 11,763,208 | | | | 117,215 | | | | 3,725,339 | |
Institutional Class | | | 0 | | | | 0 | | | | 2,977,872 | | | | 100,005,716 | | | | 1,663,325 | | | | 53,039,903 | |
Investor Class | | | 0 | | | | 0 | | | | 2,486,110 | | | | 83,178,719 | | | | 1,659,987 | | | | 52,731,227 | |
| | | | |
| | | | | | | 0 | | | | | | | | 248,119,083 | | | | | | | | 137,068,209 | |
| | | | |
| 1. | For the five months ended March 31, 2014. The Fund changed its fiscal year end from October 31 to March 31, effective March 31, 2014. |
| 2. | For the period from June 28, 2013 (commencement of class operations) to October 31, 2013 |
The accompanying notes are an integral part of these financial statements.
| | | | | | |
| Statement of changes in net assets | | Wells Fargo Advantage Small Cap Value Fund | | | 15 | |
| | | | | | | | | | | | | | | | | | | | | | | | |
| | | Six months ended
September 30, 2014 (unaudited) | | | Year ended
March 31, 20141 | | | Year ended
October 31, 2013 | |
| | | | | | |
| | | Shares | | | | | | Shares | | | | | | Shares | | | | |
| | | | | | |
Capital share transactions (continued) | | | | | | | | | | | | | | | | | | | | | | | | |
Payment for shares redeemed | | | | | | | | | | | | | | | | | | | | | | | | |
Class A | | | (2,223,596 | ) | | $ | (79,120,908 | ) | | | (2,808,964 | ) | | $ | (95,768,784 | ) | | | (8,105,798 | ) | | $ | (275,974,386 | ) |
Class B | | | (7,044 | ) | | | (222,508 | ) | | | (5,169 | ) | | | (159,543 | ) | | | (27,240 | ) | | | (830,263 | ) |
Class C | | | (249,264 | ) | | | (7,892,982 | ) | | | (338,817 | ) | | | (10,437,208 | ) | | | (703,964 | ) | | | (21,547,819 | ) |
Class R6 | | | (43,270 | ) | | | (1,573,511 | ) | | | (2,865 | ) | | | (104,369 | ) | | | 0 | 2 | | | 0 | 2 |
Administrator Class | | | (2,535,417 | ) | | | (91,663,653 | ) | | | (2,436,742 | ) | | | (85,982,579 | ) | | | (4,295,088 | ) | | | (149,146,809 | ) |
Institutional Class | | | (7,446,578 | ) | | | (270,964,829 | ) | | | (7,101,708 | ) | | | (252,338,496 | ) | | | (12,794,773 | ) | | | (450,400,513 | ) |
Investor Class | | | (4,839,321 | ) | | | (175,471,047 | ) | | | (8,403,434 | ) | | | (299,720,372 | ) | | | (17,241,492 | ) | | | (595,206,493 | ) |
| | | | |
| | | | | | | (626,909,438 | ) | | | | | | | (744,511,351 | ) | | | | | | | (1,493,106,283 | ) |
| | | | |
Net decrease in net assets resulting from capital share transactions | | | | | | | (418,284,738 | ) | | | | | | | (249,101,988 | ) | | | | | | | (717,627,264 | ) |
| | | | |
Total decrease in net assets | | | | | | | (597,840,785 | ) | | | | | | | (290,477,703 | ) | | | | | | | (354,355,551 | ) |
| | | | |
| | | | | | |
Net assets | | | | | | | | | | | | | | | | | | | | | | | | |
Beginning of period | | | | | | | 3,032,684,837 | | | | | | | | 3,323,162,540 | | | | | | | | 3,677,518,091 | |
| | | | |
End of period | | | | | | $ | 2,434,844,052 | | | | | | | $ | 3,032,684,837 | | | | | | | $ | 3,323,162,540 | |
| | | | |
Undistributed net investment income | | | | | | $ | 11,080,760 | | | | | | | $ | 10,146,282 | | | | | | | $ | 14,745,936 | |
| | | | |
Please see footnotes on page 14.
The accompanying notes are an integral part of these financial statements.
| | | | |
| 16 | | Wells Fargo Advantage Small Cap Value Fund | | Financial highlights |
(For a share outstanding throughout each period)
| | | | | | | | | | | | | | | | | | | | | | | | | | | | |
| | | Six months ended
September 30, 2014
(unaudited) | | | Year ended
March 31, 20141 | | | Year ended October 31 | |
| CLASS A | | | | 2013 | | | 2012 | | | 2011 | | | 2010 | | | 2009 | |
Net asset value, beginning of period | | $ | 35.74 | | | $ | 36.33 | | | $ | 32.87 | | | $ | 29.56 | | | $ | 29.71 | | | $ | 23.32 | | | $ | 18.22 | |
Net investment income (loss) | | | (0.01 | )2 | | | 0.18 | | | | 0.23 | | | | 0.19 | | | | 0.16 | | | | 0.22 | 2 | | | 0.15 | 2 |
Net realized and unrealized gains (losses) on investments | | | (2.45 | ) | | | 2.71 | | | | 4.68 | | | | 3.39 | | | | (0.11 | ) | | | 6.29 | | | | 4.95 | |
| | | | | | | | | | | | | | | | | | | | | | | | | | | | |
Total from investment operations | | | (2.46 | ) | | | 2.89 | | | | 4.91 | | | | 3.58 | | | | 0.05 | | | | 6.51 | | | | 5.10 | |
Distributions to shareholders from | | | | | | | | | | | | | | | | | | | | | | | | | | | | |
Net investment income | | | 0.00 | | | | (0.11 | ) | | | (0.24 | ) | | | (0.12 | ) | | | (0.20 | ) | | | (0.12 | ) | | | 0.00 | |
Net realized gains | | | 0.00 | | | | (3.37 | ) | | | (1.21 | ) | | | (0.15 | ) | | | 0.00 | | | | 0.00 | | | | 0.00 | |
| | | | | | | | | | | | | | | | | | | | | | | | | | | | |
Total distributions to shareholders | | | 0.00 | | | | (3.48 | ) | | | (1.45 | ) | | | (0.27 | ) | | | (0.20 | ) | | | (0.12 | ) | | | 0.00 | |
Net asset value, end of period | | $ | 33.28 | | | $ | 35.74 | | | $ | 36.33 | | | $ | 32.87 | | | $ | 29.56 | | | $ | 29.71 | | | $ | 23.32 | |
Total return3 | | | (6.88 | )% | | | 8.87 | % | | | 15.67 | % | | | 12.22 | % | | | 0.11 | % | | | 28.01 | % | | | 27.99 | % |
Ratios to average net assets (annualized) | | | | | | | | | | | | | | | | | | | | | | | | | | | | |
Gross expenses | | | 1.35 | % | | | 1.33 | % | | | 1.33 | % | | | 1.34 | % | | | 1.32 | % | | | 1.38 | % | | | 1.44 | % |
Net expenses | | | 1.29 | % | | | 1.30 | % | | | 1.30 | % | | | 1.30 | % | | | 1.30 | % | | | 1.37 | % | | | 1.44 | % |
Net investment income (loss) | | | (0.08 | )% | | | 1.26 | % | | | 0.72 | % | | | 0.61 | % | | | 0.50 | % | | | 0.79 | % | | | 0.79 | % |
Supplemental data | | | | | | | | | | | | | | | | | | | | | | | | | | | | |
Portfolio turnover rate | | | 6 | % | | | 7 | % | | | 18 | % | | | 16 | % | | | 17 | % | | | 21 | % | | | 27 | % |
Net assets, end of period (000s omitted) | | | $356,325 | | | | $443,671 | | | | $482,677 | | | | $603,622 | | | | $596,741 | | | | $645,371 | | | | $438,744 | |
| 1. | For the five months ended March 31, 2014. The Fund changed its fiscal year end from October 31 to March 31, effective March 31, 2014. |
| 2. | Calculated based upon average shares outstanding |
| 3. | Total return calculations do not include any sales charges. Returns for periods of less than one year are not annualized. |
The accompanying notes are an integral part of these financial statements.
| | | | | | |
| Financial highlights | | Wells Fargo Advantage Small Cap Value Fund | | | 17 | |
(For a share outstanding throughout each period)
| | | | | | | | | | | | | | | | | | | | | | | | | | | | |
| | | Six months ended
September 30, 2014 (unaudited) | | | Year ended March 31, 20141 | | | Year ended October 31 | |
| CLASS B | | | | 2013 | | | 2012 | | | 2011 | | | 2010 | | | 2009 | |
Net asset value, beginning of period | | | $31.87 | | | | $32.75 | | | | $29.74 | | | | $26.85 | | | | $27.02 | | | | $21.28 | | | | $16.75 | |
Net investment income (loss) | | | (0.14 | )2 | | | 0.06 | 2 | | | 0.01 | 2 | | | (0.03 | )2 | | | (0.16 | )2 | | | 0.00 | 2,3 | | | 0.01 | 2 |
Net realized and unrealized gains (losses) on investments | | | (2.17 | ) | | | 2.43 | | | | 4.21 | | | | 3.07 | | | | (0.01 | ) | | | 5.74 | | | | 4.52 | |
| | | | | | | | | | | | | | | | | | | | | | | | | | | | |
Total from investment operations | | | (2.31 | ) | | | 2.49 | | | | 4.22 | | | | 3.04 | | | | (0.17 | ) | | | 5.74 | | | | 4.53 | |
Distributions to shareholders from | | | | | | | | | | | | | | | | | | | | | | | | | | | | |
Net realized gains | | | 0.00 | | | | (3.37 | ) | | | (1.21 | ) | | | (0.15 | ) | | | 0.00 | | | | 0.00 | | | | 0.00 | |
Net asset value, end of period | | $ | 29.56 | | | $ | 31.87 | | | $ | 32.75 | | | $ | 29.74 | | | $ | 26.85 | | | $ | 27.02 | | | $ | 21.28 | |
Total return4 | | | (7.25 | )% | | | 8.53 | % | | | 14.86 | % | | | 11.37 | % | | | (0.63 | )% | | | 26.97 | % | | | 27.04 | % |
Ratios to average net assets (annualized) | | | | | | | | | | | | | | | | | | | | | | | | | | | | |
Gross expenses | | | 2.09 | % | | | 2.08 | % | | | 2.06 | % | | | 2.08 | % | | | 2.06 | % | | | 2.13 | % | | | 2.19 | % |
Net expenses | | | 2.04 | % | | | 2.05 | % | | | 2.03 | % | | | 2.05 | % | | | 2.04 | % | | | 2.13 | % | | | 2.19 | % |
Net investment income (loss) | | | (0.89 | )% | | | 0.50 | % | | | 0.02 | % | | | (0.12 | )% | | | (0.57 | )% | | | 0.00 | % | | | 0.03 | % |
Supplemental data | | | | | | | | | | | | | | | | | | | | | | | | | | | | |
Portfolio turnover rate | | | 6 | % | | | 7 | % | | | 18 | % | | | 16 | % | | | 17 | % | | | 21 | % | | | 27 | % |
Net assets, end of period (000s omitted) | | | $284 | | | | $531 | | | | $647 | | | | $1,310 | | | | $3,928 | | | | $36,436 | | | | $46,175 | |
| 1. | For the five months ended March 31, 2014. The Fund changed its fiscal year end from October 31 to March 31, effective March 31, 2014. |
| 2. | Calculated based upon average shares outstanding. |
| 3. | Amount is less than $0.005. |
| 4. | Total return calculations do not include any sales charges. Returns for periods of less than one year are not annualized. |
The accompanying notes are an integral part of these financial statements.
| | | | |
| 18 | | Wells Fargo Advantage Small Cap Value Fund | | Financial highlights |
(For a share outstanding throughout each period)
| | | | | | | | | | | | | | | | | | | | | | | | | | | | |
| | | Six months ended
September 30, 2014
(unaudited) | | | Year ended
March 31, 20141 | | | Year ended October 31 | |
| CLASS C | | | | 2013 | | | 2012 | | | 2011 | | | 2010 | | | 2009 | |
Net asset value, beginning of period | | $ | 31.89 | | | $ | 32.77 | | | $ | 29.82 | | | $ | 26.92 | | | $ | 27.11 | | | $ | 21.34 | | | $ | 16.80 | |
Net investment income (loss) | | | (0.13 | )2 | | | 0.07 | 2 | | | (0.02 | )2 | | | (0.04 | )2 | | | (0.07 | )2 | | | 0.01 | 2 | | | 0.01 | 2 |
Net realized and unrealized gains (losses) on investments | | | (2.17 | ) | | | 2.42 | | | | 4.23 | | | | 3.09 | | | | (0.10 | ) | | | 5.76 | | | | 4.53 | |
| | | | | | | | | | | | | | | | | | | | | | | | | | | | |
Total from investment operations | | | (2.30 | ) | | | 2.49 | | | | 4.21 | | | | 3.05 | | | | (0.17 | ) | | | 5.77 | | | | 4.54 | |
Distributions to shareholders from | | | | | | | | | | | | | | | | | | | | | | | | | | | | |
Net investment income | | | 0.00 | | | | 0.00 | | | | (0.05 | ) | | | 0.00 | | | | (0.02 | ) | | | 0.00 | | | | 0.00 | |
Net realized gains | | | 0.00 | | | | (3.37 | ) | | | (1.21 | ) | | | (0.15 | ) | | | 0.00 | | | | 0.00 | | | | 0.00 | |
| �� | | | | | | | | | | | | | | | | | | | | | | | | | | | |
Total distributions to shareholders | | | 0.00 | | | | (3.37 | ) | | | (1.26 | ) | | | (0.15 | ) | | | (0.02 | ) | | | 0.00 | | | | 0.00 | |
Net asset value, end of period | | $ | 29.59 | | | $ | 31.89 | | | $ | 32.77 | | | $ | 29.82 | | | $ | 26.92 | | | $ | 27.11 | | | $ | 21.34 | |
Total return3 | | | (7.21 | )% | | | 8.53 | % | | | 14.80 | % | | | 11.38 | % | | | (0.62 | )% | | | 27.04 | % | | | 27.02 | % |
Ratios to average net assets (annualized) | | | | | | | | | | | | | | | | | | | | | | | | | | | | |
Gross expenses | | | 2.10 | % | | | 2.08 | % | | | 2.08 | % | | | 2.09 | % | | | 2.07 | % | | | 2.13 | % | | | 2.19 | % |
Net expenses | | | 2.04 | % | | | 2.05 | % | | | 2.05 | % | | | 2.05 | % | | | 2.05 | % | | | 2.12 | % | | | 2.19 | % |
Net investment income (loss) | | | (0.82 | )% | | | 0.52 | % | | | (0.06 | )% | | | (0.14 | )% | | | (0.24 | )% | | | 0.04 | % | | | 0.03 | % |
Supplemental data | | | | | | | | | | | | | | | | | | | | | | | | | | | | |
Portfolio turnover rate | | | 6 | % | | | 7 | % | | | 18 | % | | | 16 | % | | | 17 | % | | | 21 | % | | | 27 | % |
Net assets, end of period (000s omitted) | | | $91,839 | | | | $105,309 | | | | $105,491 | | | | $102,663 | | | | $100,032 | | | | $97,675 | | | | $70,558 | |
| 1. | For the five months ended March 31, 2014. The Fund changed its fiscal year end from October 31 to March 31, effective March 31, 2014. |
| 2. | Calculated based upon average shares outstanding |
| 3. | Total return calculations do not include any sales charges. Returns for periods of less than one year are not annualized. |
The accompanying notes are an integral part of these financial statements.
| | | | | | |
| Financial highlights | | Wells Fargo Advantage Small Cap Value Fund | | | 19 | |
(For a share outstanding throughout each period)
| | | | | | | | | | | | |
| CLASS R6 | | Six months ended
September 30, 2014 (unaudited) | | | Year ended
March 31, 20141 | | | Year ended
October 31, 20132 | |
Net asset value, beginning of period | | $ | 36.52 | | | $ | 37.13 | | | $ | 33.69 | |
Net investment income | | | 0.13 | 3 | | | 0.35 | | | | 0.07 | 3 |
Net realized and unrealized gains (losses) on investments | | | (2.57 | ) | | | 2.67 | | | | 3.37 | |
| | | | | | | | | | | | |
Total from investment operations | | | (2.44 | ) | | | 3.02 | | | | 3.44 | |
Distributions to shareholders from | | | | | | | | | | | | |
Net investment income | | | 0.00 | | | | (0.26 | ) | | | 0.00 | |
Net realized gains | | | 0.00 | | | | (3.37 | ) | | | 0.00 | |
| | | | | | | | | | | | |
Total distributions to shareholders | | | 0.00 | | | | (3.63 | ) | | | 0.00 | |
Net asset value, end of period | | $ | 34.08 | | | $ | 36.52 | | | $ | 37.13 | |
Total return4 | | | (6.68 | )% | | | 9.07 | % | | | 10.21 | % |
Ratios to average net assets (annualized) | | | | | | | | | | | | |
Gross expenses | | | 0.87 | % | | | 0.85 | % | | | 0.85 | % |
Net expenses | | | 0.84 | % | | | 0.85 | % | | | 0.85 | % |
Net investment income | | | 0.74 | % | | | 2.82 | % | | | 0.60 | % |
Supplemental data | | | | | | | | | | | | |
Portfolio turnover rate | | | 6 | % | | | 7 | % | | | 18 | % |
Net assets, end of period (000s omitted) | | | $47,919 | | | | $398 | | | | $28 | |
| 1. | For the five months ended March 31, 2014. The Fund changed its fiscal year end from October 31 to March 31, effective March 31, 2014. |
| 2. | For the period from June 28, 2013 (commencement of class operations) to October 31, 2013 |
| 3. | Calculated based upon average shares outstanding |
| 4. | Returns for periods of less than one year are not annualized. |
The accompanying notes are an integral part of these financial statements.
| | | | |
| 20 | | Wells Fargo Advantage Small Cap Value Fund | | Financial highlights |
(For a share outstanding throughout each period)
| | | | | | | | | | | | | | | | | | | | | | | | |
| | | Six months ended
September 30, 2014
(unaudited) | | | Year ended
March 31, 20141 | | | Year ended October 31 | |
| ADMINISTRATOR CLASS | | | | 2013 | | | 2012 | | | 2011 | | | 20102 | |
Net asset value, beginning of period | | $ | 36.40 | | | $ | 36.98 | | | $ | 33.45 | | | $ | 30.12 | | | $ | 30.32 | | | $ | 28.12 | |
Net investment income | | | 0.02 | | | | 0.21 | | | | 0.31 | | | | 0.25 | 3 | | | 0.29 | 3 | | | 0.05 | 3 |
Net realized and unrealized gains (losses) on investments | | | (2.49 | ) | | | 2.77 | | | | 4.75 | | | | 3.44 | | | | (0.17 | ) | | | 2.15 | |
| | | | | | | | | | | | | | | | | | | | | | | | |
Total from investment operations | | | (2.47 | ) | | | 2.98 | | | | 5.06 | | | | 3.69 | | | | 0.12 | | | | 2.20 | |
Distributions to shareholders from | | | | | | | | | | | | | | | | | | | | | | | | |
Net investment income | | | 0.00 | | | | (0.19 | ) | | | (0.32 | ) | | | (0.21 | ) | | | (0.32 | ) | | | 0.00 | |
Net realized gains | | | 0.00 | | | | (3.37 | ) | | | (1.21 | ) | | | (0.15 | ) | | | 0.00 | | | | 0.00 | |
| | | | | | | | | | | | | | | | | | | | | | | | |
Total distributions to shareholders | | | 0.00 | | | | (3.56 | ) | | | (1.53 | ) | | | (0.36 | ) | | | (0.32 | ) | | | 0.00 | |
Net asset value, end of period | | $ | 33.93 | | | $ | 36.40 | | | $ | 36.98 | | | $ | 33.45 | | | $ | 30.12 | | | $ | 30.32 | |
Total return4 | | | (6.79 | )% | | | 8.97 | % | | | 15.92 | % | | | 12.42 | % | | | 0.32 | % | | | 7.82 | % |
Ratios to average net assets (annualized) | | | | | | | | | | | | | | | | | | | | | | | | |
Gross expenses | | | 1.19 | % | | | 1.17 | % | | | 1.17 | % | | | 1.17 | % | | | 1.15 | % | | | 1.28 | % |
Net expenses | | | 1.09 | % | | | 1.10 | % | | | 1.10 | % | | | 1.10 | % | | | 1.10 | % | | | 1.10 | % |
Net investment income | | | 0.14 | % | | | 1.48 | % | | | 0.87 | % | | | 0.80 | % | | | 0.91 | % | | | 0.79 | % |
Supplemental data | | | | | | | | | | | | | | | | | | | | | | | | |
Portfolio turnover rate | | | 6 | % | | | 7 | % | | | 18 | % | | | 16 | % | | | 17 | % | | | 21 | % |
Net assets, end of period (000s omitted) | | | $643,348 | | | | $711,869 | | | | $666,812 | | | | $543,683 | | | | $390,266 | | | | $8,841 | |
| 1. | For the five months ended March 31, 2014. The Fund changed its fiscal year end from October 31 to March 31, effective March 31, 2014. |
| 2. | For the period from July 30, 2010 (commencement of class operations) to October 31, 2010 |
| 3. | Calculated based upon average shares outstanding |
| 4. | Returns for periods of less than one year are not annualized. |
The accompanying notes are an integral part of these financial statements.
| | | | | | |
| Financial highlights | | Wells Fargo Advantage Small Cap Value Fund | | | 21 | |
(For a share outstanding throughout each period)
| | | | | | | | | | | | | | | | | | | | | | | | | | | | |
| | | Six months ended
September 30, 2014
(unaudited) | | | Year ended
March 31, 20141 | | | Year ended October 31 | |
| INSTITUTIONAL CLASS | | | | 2013 | | | 2012 | | | 2011 | | | 2010 | | | 2009 | |
Net asset value, beginning of period | | | $36.53 | | | | $37.12 | | | | $33.56 | | | | $30.21 | | | | $30.33 | | | | $23.80 | | | | $18.50 | |
Net investment income | | | 0.06 | 2 | | | 0.26 | | | | 0.38 | 2 | | | 0.34 | | | | 0.31 | | | | 0.34 | 2 | | | 0.25 | 2 |
Net realized and unrealized gains (losses) on investments | | | (2.51 | ) | | | 2.76 | | | | 4.76 | | | | 3.42 | | | | (0.12 | ) | | | 6.42 | | | | 5.05 | |
| | | | | | | | | | | | | | | | | | | | | | | | | | | | |
Total from investment operations | | | (2.45 | ) | | | 3.02 | | | | 5.14 | | | | 3.76 | | | | 0.19 | | | | 6.76 | | | | 5.30 | |
Distributions to shareholders from | | | | | | | | | | | | | | | | | | | | | | | | | | | | |
Net investment income | | | 0.00 | | | | (0.24 | ) | | | (0.37 | ) | | | (0.26 | ) | | | (0.31 | )�� | | | (0.23 | ) | | | 0.00 | |
Net realized gains | | | 0.00 | | | | (3.37 | ) | | | (1.21 | ) | | | (0.15 | ) | | | 0.00 | | | | 0.00 | | | | 0.00 | |
| | | | | | | | | | | | | | | | | | | | | | | | | | | | |
Total distributions to shareholders | | | 0.00 | | | | (3.61 | ) | | | (1.58 | ) | | | (0.41 | ) | | | (0.31 | ) | | | (0.23 | ) | | | 0.00 | |
Net asset value, end of period | | | $34.08 | | | | $36.53 | | | | $37.12 | | | | $33.56 | | | | $30.21 | | | | $30.33 | | | | $23.80 | |
Total return3 | | | (6.71 | )% | | | 9.05 | % | | | 16.15 | % | | | 12.68 | % | | | 0.52 | % | | | 28.53 | % | | | 28.65 | % |
Ratios to average net assets (annualized) | | | | | | | | | | | | | | | | | | | | | | | | | | | | |
Gross expenses | | | 0.92 | % | | | 0.90 | % | | | 0.90 | % | | | 0.91 | % | | | 0.89 | % | | | 0.94 | % | | | 1.00 | % |
Net expenses | | | 0.89 | % | | | 0.90 | % | | | 0.90 | % | | | 0.90 | % | | | 0.89 | % | | | 0.93 | % | | | 0.95 | % |
Net investment income | | | 0.31 | % | | | 1.66 | % | | | 1.08 | % | | | 1.01 | % | | | 0.97 | % | | | 1.23 | % | | | 1.24 | % |
Supplemental data | | | | | | | | | | | | | | | | | | | | | | | | | | | | |
Portfolio turnover rate | | | 6 | % | | | 7 | % | | | 18 | % | | | 16 | % | | | 17 | % | | | 21 | % | | | 27 | % |
Net assets, end of period (000s omitted) | | $ | 706,363 | | | $ | 984,881 | | | $ | 1,081,869 | | | $ | 1,143,730 | | | $ | 1,073,943 | | | $ | 1,279,201 | | | $ | 843,753 | |
| 1. | For the five months ended March 31, 2014. The Fund changed its fiscal year end from October 31 to March 31, effective March 31, 2014. |
| 2. | Calculated based upon average shares outstanding |
| 3. | Returns for periods of less than one year are not annualized. |
The accompanying notes are an integral part of these financial statements.
| | | | |
| 22 | | Wells Fargo Advantage Small Cap Value Fund | | Financial highlights |
(For a share outstanding throughout each period)
| | | | | | | | | | | | | | | | | | | | | | | | | | | | |
| | | Six months ended
September 30, 2014
(unaudited) | | | Year ended
March 31, 20141 | | | Year ended October 31 | |
| INVESTOR CLASS | | | | 2013 | | | 2012 | | | 2011 | | | 2010 | | | 2009 | |
Net asset value, beginning of period | | $ | 36.48 | | | $ | 36.98 | | | $ | 33.43 | | | $ | 30.04 | | | $ | 30.18 | | | $ | 23.70 | | | $ | 18.50 | |
Net investment income (loss) | | | (0.02 | )2 | | | 0.18 | 2 | | | 0.23 | 2 | | | 0.19 | 2 | | | 0.14 | 2 | | | 0.22 | 2 | | | 0.17 | 2 |
Net realized and unrealized gains (losses) on investments | | | (2.49 | ) | | | 2.77 | | | | 4.75 | | | | 3.44 | | | | (0.10 | ) | | | 6.39 | | | | 5.03 | |
| | | | | | | | | | | | | | | | | | | | | | | | | | | | |
Total from investment operations | | | (2.51 | ) | | | 2.95 | | | | 4.98 | | | | 3.63 | | | | 0.04 | | | | 6.61 | | | | 5.20 | |
Distributions to shareholders from | | | | | | | | | | | | | | | | | | | | | | | | | | | | |
Net investment income | | | 0.00 | | | | (0.08 | ) | | | (0.22 | ) | | | (0.09 | ) | | | (0.18 | ) | | | (0.13 | ) | | | 0.00 | |
Net realized gains | | | 0.00 | | | | (3.37 | ) | | | (1.21 | ) | | | (0.15 | ) | | | 0.00 | | | | 0.00 | | | | 0.00 | |
| | | | | | | | | | | | | | | | | | | | | | | | | | | | |
Total distributions to shareholders | | | 0.00 | | | | (3.45 | ) | | | (1.43 | ) | | | (0.24 | ) | | | (0.18 | ) | | | (0.13 | ) | | | 0.00 | |
Net asset value, end of period | | $ | 33.97 | | | $ | 36.48 | | | $ | 36.98 | | | $ | 33.43 | | | $ | 30.04 | | | $ | 30.18 | | | $ | 23.70 | |
Total return3 | | | (6.88 | )% | | | 8.85 | % | | | 15.64 | % | | | 12.18 | % | | | 0.09 | % | | | 27.99 | % | | | 28.11 | % |
Ratios to average net assets (annualized) | | | | | | | | | | | | | | | | | | | | | | | | | | | | |
Gross expenses | | | 1.40 | % | | | 1.39 | % | | | 1.39 | % | | | 1.40 | % | | | 1.39 | % | | | 1.47 | % | | | 1.55 | % |
Net expenses | | | 1.30 | % | | | 1.33 | % | | | 1.33 | % | | | 1.33 | % | | | 1.33 | % | | | 1.35 | % | | | 1.36 | % |
Net investment income (loss) | | | (0.11 | )% | | | 1.21 | % | | | 0.68 | % | | | 0.58 | % | | | 0.45 | % | | | 0.80 | % | | | 0.88 | % |
Supplemental data | | | | | | | | | | | | | | | | | | | | | | | | | | | | |
Portfolio turnover rate | | | 6 | % | | | 7 | % | | | 18 | % | | | 16 | % | | | 17 | % | | | 21 | % | | | 27 | % |
Net assets, end of period (000s omitted) | | | $588,765 | | | | $786,027 | | | | $985,639 | | | | $1,282,510 | | | | $1,448,429 | | | | $1,968,601 | | | | $1,523,637 | |
| 1. | For the five months ended March 31, 2014. The Fund changed its fiscal year end from October 31 to March 31, effective March 31, 2014. |
| 2. | Calculated based upon average shares outstanding |
| 3. | Returns for periods of less than one year are not annualized. |
The accompanying notes are an integral part of these financial statements.
| | | | | | |
| Notes to financial statements (unaudited) | | Wells Fargo Advantage Small Cap Value Fund | | | 23 | |
1. ORGANIZATION
Wells Fargo Funds Trust (the “Trust”), a Delaware statutory trust organized on March 10, 1999, is an open-end management investment company registered under the Investment Company Act of 1940, as amended (the “1940 Act”). These financial statements report on the Wells Fargo Advantage Small Cap Value Fund (the “Fund”) which is a diversified series of the Trust.
2. SIGNIFICANT ACCOUNTING POLICIES
The following significant accounting policies, which are consistently followed in the preparation of the financial statements of the Fund, are in conformity with U.S. generally accepted accounting principles which require management to make estimates and assumptions that affect the reported amounts of assets and liabilities, disclosure of contingent assets and liabilities at the date of the financial statements, and the reported amounts of revenues and expenses during the reporting period. Actual results could differ from those estimates.
Securities valuation
All investments are valued each business day as of the close of regular trading on the New York Stock Exchange (generally 4 p.m. Eastern Time).
Equity securities and options that are listed on a foreign or domestic exchange or market are valued at the official closing price or, if none, the last sales price. If no sale occurs on the primary exchange or market for the security that day, the prior day’s price will be deemed “stale” and fair values will be determined in accordance with the Fund’s Valuation Procedures. Non-listed OTC options are valued at the evaluated price provided by an independent pricing service or an independent broker-dealer that the Management Valuation Team of Wells Fargo Funds Management, LLC (“Funds Management”) has determined is an acceptable source.
The values of securities denominated in foreign currencies are translated into U.S. dollars at rates provided by an independent foreign currency pricing source at a time each business day specified by the Management Valuation Team.
Many securities markets and exchanges outside the U.S. close prior to the close of the New York Stock Exchange and therefore may not fully reflect trading or events that occur after the close of the principal exchange in which the foreign securities are traded, but before the close of the New York Stock Exchange. If such trading or events are expected to materially affect the value of such securities, then fair value pricing procedures approved by the Board of Trustees of the Fund are applied. These procedures take into account multiple factors including movements in U.S. securities markets after foreign exchanges close. Foreign securities that are fair valued under these procedures are categorized as Level 2 and the application of these procedures may result in transfers between Level 1 and Level 2. Depending on market activity, such fair valuations may be frequent. Such fair value pricing may result in net asset values that are higher or lower than net asset values based on the last reported sales price or latest quoted bid price. On September 30, 2014, such fair value pricing was not used in pricing foreign securities.
Investments in registered open-end investment companies are valued at net asset value.
Investments which are not valued using any of the methods discussed above are valued at their fair value, as determined in good faith by the Board of Trustees. The Board of Trustees has established a Valuation Committee comprised of the Trustees and has delegated to it the authority to take any actions regarding the valuation of portfolio securities that the Valuation Committee deems necessary or appropriate, including determining the fair value of portfolio securities, unless the determination has been delegated to the Management Valuation Team. The Board of Trustees retains the authority to make or ratify any valuation decisions or approve any changes to the Valuation Procedures as it deems appropriate. On a quarterly basis, the Board of Trustees receives reports on any valuation actions taken by the Valuation Committee or the Management Valuation Team which may include items for ratification.
Valuations of fair valued securities are compared to the next actual sales price when available, or other appropriate market values, to assess the continued appropriateness of the fair valuation methodologies used. These securities are fair valued on a day-to-day basis, taking into consideration changes to appropriate market information and any significant changes to the inputs considered in the valuation process until there is a readily available price provided on an exchange or by an independent pricing service. Valuations received from an independent pricing service or independent broker-dealer quotes are periodically validated by comparisons to most recent trades and valuations provided by other independent pricing services in addition to the review of prices by the adviser and/or subadviser. Unobservable inputs used in determining fair valuations are identified based on the type of security, taking into consideration factors utilized by market participants in valuing the investment, knowledge about the issuer and the current market environment.
| | | | |
| 24 | | Wells Fargo Advantage Small Cap Value Fund | | Notes to financial statements (unaudited) |
Foreign currency translation
The accounting records of the Fund are maintained in U.S. dollars. The values of other assets and liabilities denominated in foreign currencies are translated into U.S. dollars at rates provided by an independent foreign currency pricing source at a time each business day specified by the Management Valuation Team. Purchases and sales of securities, and income and expenses are converted at the rate of exchange on the respective dates of such transactions. Net realized foreign exchange gains or losses arise from sales of foreign currencies, currency gains or losses realized between the trade and settlement dates on securities transactions, and the difference between the amounts of dividends, interest and foreign withholding taxes recorded and the U.S. dollar equivalent of the amounts actually paid or received. Net unrealized foreign exchange gains and losses arise from changes in the fair value of assets and liabilities other than investments in securities resulting from changes in exchange rates. The changes in net assets arising from changes in exchange rates and the changes in net assets resulting from changes in market prices of securities are not separately presented. Such changes are included in net realized and unrealized gains or losses from investments.
Options
The Fund is subject to equity price risk in the normal course of pursuing its investment objectives. The Fund may write covered call options or secured put options on individual securities and/or indexes. When the Fund writes an option, an amount equal to the premium received is recorded as a liability and is subsequently adjusted to the current market value of the written option. Premiums received from written options that expire unexercised are recognized as realized gains on the expiration date. For exercised options, the difference between the premium received and the amount paid on effecting a closing purchase transaction, including brokerage commissions, is treated as a realized gain or loss. If a call option is exercised, the premium is added to the proceeds from the sale of the underlying security in calculating the realized gain or loss on the sale. If a put option is exercised, the premium reduces the cost of the security purchased. The Fund, as a writer of an option, bears the market risk of an unfavorable change in the price of the security and/or index underlying the written option.
The Fund may also purchase call or put options. The premium is included in the Statement of Assets and Liabilities as an investment, the value of which is subsequently adjusted based on the current market value of the option. Premiums paid for purchased options that expire are recognized as realized losses on the expiration date. Premiums paid for purchased options that are exercised or closed are added to the amount paid or offset against the proceeds received for the underlying security to determine the realized gain or loss. The risk of loss associated with purchased options is limited to the premium paid.
Options traded on an exchange are regulated and terms of the options are standardized. Purchased options traded over-the-counter expose the Fund to counterparty risk in the event the counterparty does not perform. This risk can be mitigated by having a master netting arrangement between the Fund and the counterparty and by having the counterparty post collateral to cover the Fund’s exposure to the counterparty.
Security transactions and income recognition
Securities transactions are recorded on a trade date basis. Realized gains or losses are recorded on the basis of identified cost.
Dividend income is recognized on the ex-dividend date, except for certain dividends from foreign securities, which are recorded as soon as the Fund is informed of the ex-dividend date. Dividend income from foreign securities is recorded net of foreign taxes withheld where recovery of such taxes is not assured.
Distributions to shareholders
Distributions to shareholders from net investment income and net realized gains, if any, are recorded on the ex-dividend date. Such distributions are determined in conformity with federal income tax regulations, which may differ in amount or character from net investment income and realized gains recognized for purposes of U.S. generally accepted accounting principles.
Federal and other taxes
The Fund intends to continue to qualify as a regulated investment company by distributing substantially all of its investment company taxable income and any net realized capital gains (after reduction for capital loss carryforwards) sufficient to relieve it from all, or substantially all, federal income taxes. Accordingly, no provision for federal income taxes was required.
The Fund’s income and federal excise tax returns and all financial records supporting those returns for the prior three fiscal years are subject to examination by the federal and Delaware revenue authorities. Management has analyzed the Fund’s tax positions taken on federal, state, and foreign tax returns for all open tax years and does not believe that there are any uncertain tax positions that require recognition of a tax liability.
| | | | | | |
| Notes to financial statements (unaudited) | | Wells Fargo Advantage Small Cap Value Fund | | | 25 | |
Class allocations
The separate classes of shares offered by the Fund differ principally in applicable sales charges, distribution, shareholder servicing, and administration fees. Class specific expenses are charged directly to that share class. Investment income, common expenses, and realized and unrealized gains (losses) on investments are allocated daily to each class of shares based on the relative proportion of net assets of each class.
3. FAIR VALUATION MEASUREMENTS
Fair value measurements of investments are determined within a framework that has established a fair value hierarchy based upon the various data inputs utilized in determining the value of the Fund’s investments. The three-level hierarchy gives the highest priority to unadjusted quoted prices in active markets for identical assets or liabilities (Level 1) and the lowest priority to significant unobservable inputs (Level 3). The Fund’s investments are classified within the fair value hierarchy based on the lowest level of input that is significant to the fair value measurement. The inputs are summarized into three broad levels as follows:
| n | | Level 1 – quoted prices in active markets for identical securities |
| n | | Level 2 – other significant observable inputs (including quoted prices for similar securities, interest rates, prepayment speeds, credit risk, use of amortized cost, etc.) |
| n | | Level 3 – significant unobservable inputs (including the Fund’s own assumptions in determining the fair value of investments) |
The inputs or methodologies used for valuing investments in securities are not necessarily an indication of the risk associated with investing in those securities.
The following is a summary of the inputs used in valuing the Fund’s assets and liabilities as of September 30, 2014:
| | | | | | | | | | | | | | | | |
| | | Quoted prices
(Level 1) | | | Other significant
observable inputs
(Level 2) | | | Significant
unobservable inputs
(Level 3) | | | Total | |
Assets | | | | | | | | | | | | | | | | |
Investments in: | | | | | | | | | | | | | | | | |
| | | | |
Common stocks | | | | | | | | | | | | | | | | |
Consumer discretionary | | $ | 163,235,389 | | | $ | 0 | | | $ | 0 | | | $ | 163,235,389 | |
Energy | | | 470,540,574 | | | | 52,316,464 | | | | 0 | | | | 522,857,038 | |
Financials | | | 408,646,867 | | | | 0 | | | | 0 | | | | 408,646,867 | |
Health care | | | 126,909,771 | | | | 0 | | | | 0 | | | | 126,909,771 | |
Industrials | | | 272,533,977 | | | | 0 | | | | 0 | | | | 272,533,977 | |
Information technology | | | 216,962,155 | | | | 0 | | | | 0 | | | | 216,962,155 | |
Materials | | | 319,214,596 | | | | 15,732,300 | | | | 0 | | | | 334,946,896 | |
Telecommunication services | | | 30,348,534 | | | | 0 | | | | 0 | | | | 30,348,534 | |
| | | | |
Exchange-traded funds | | | 29,097,518 | | | | 0 | | | | 0 | | | | 29,097,518 | |
| | | | |
Warrants | | | | | | | | | | | | | | | | |
Materials | | | 0 | | | | 88,178 | | | | 0 | | | | 88,178 | |
| | | | |
Short-term investments | | | | | | | | | | | | | | | | |
Investment companies | | | 332,023,220 | | | | 0 | | | | 0 | | | | 332,023,220 | |
Total assets | | $ | 2,369,512,601 | | | $ | 68,136,942 | | | $ | 0 | | | $ | 2,437,649,543 | |
Transfers in and transfers out are recognized at the end of the reporting period. At September 30, 2014, the Fund did not have any transfers into/out of Level 1, Level 2, or Level 3.
4. TRANSACTIONS WITH AFFILIATES
Advisory fee
The Trust has entered into an advisory contract with Funds Management, an indirect wholly owned subsidiary of Wells Fargo & Company (“Wells Fargo”). The adviser is responsible for implementing investment policies and guidelines and for supervising the subadviser, who is responsible for day-to-day portfolio management of the Fund.
| | | | |
| 26 | | Wells Fargo Advantage Small Cap Value Fund | | Notes to financial statements (unaudited) |
Pursuant to the contract, Funds Management is entitled to receive an annual advisory fee starting at 0.80% and declining to 0.68% as the average daily net assets of the Fund increase. For the six months ended September 30, 2014, the advisory fee was equivalent to an annual rate of 0.76% of the Fund’s average daily net assets.
Funds Management has retained the services of a subadviser to provide daily portfolio management to the Fund. The fee for subadvisory services is borne by Funds Management. Wells Capital Management Incorporated, an affiliate of Funds Management and an indirect wholly owned subsidiary of Wells Fargo, is the subadviser to the Fund and is entitled to receive a fee from Funds Management at an annual rate starting at 0.55% and declining to 0.40% as the average daily net assets of the Fund increase.
Administration fees
The Trust has entered into an administration agreement with Funds Management. Under this agreement, for providing administrative services, which includes paying fees and expenses for services provided by the transfer agent, sub-transfer agents, omnibus account servicers and record-keepers, Funds Management is entitled to receive from the Fund an annual fund level administration fee starting at 0.05% and declining to 0.03% as the average daily net assets of the Fund increase and a class level administration fee which is calculated based on the average daily net assets of each class as follows:
| | | | |
| | | Class level
administration fee | |
Class A, Class B, Class C | | | 0.26 | % |
Class R6 | | | 0.03 | |
Administrator Class | | | 0.10 | |
Institutional Class | | | 0.08 | |
Investor Class | | | 0.32 | |
Funds Management has contractually waived and/or reimbursed advisory and administration fees to the extent necessary to maintain certain net operating expense ratios for the Fund. Waiver of fees and/or reimbursement of expenses by Funds Management were made first from fund level expenses on a proportionate basis and then from class specific expenses. Funds Management has committed through July 31, 2015 to waive fees and/or reimburse expenses to the extent necessary to cap the Fund’s expenses at 1.28% for Class A shares, 2.03% for Class B shares, 2.03% for Class C shares, 0.83% for Class R6 shares, 1.08% for Administrator Class shares, 0.88% for Institutional Class shares, and 1.29% for Investor Class shares. After this time, the cap may be increased or the commitment to maintain the cap may be terminated only with the approval of the Board of Trustees. Prior to April 1, 2014, the Fund’s expenses were capped at 1.30% for Class A shares, 2.05% for Class B shares, 2.05% for Class C shares, 0.85% for Class R6 shares, 1.10% for Administrator Class shares, 0.90% for Institutional Class shares, and 1.31% for Investor Class shares.
Distribution fees
The Trust has adopted a Distribution Plan for Class B and Class C shares of the Fund pursuant to Rule 12b-1 under the 1940 Act. Distribution fees are charged to Class B and Class C shares and paid to Wells Fargo Funds Distributor, LLC (“Funds Distributor”), the principal underwriter, at an annual rate of 0.75% of the average daily net assets of Class B and Class C shares.
In addition, Funds Distributor is entitled to receive the front-end sales charge from the purchase of Class A shares and a contingent deferred sales charge on the redemption of certain shares. Funds Distributor is also entitled to receive the contingent deferred sales charges from redemptions of Class B and Class C shares. For the six months ended September 30, 2014, Funds Distributor received $5,823 from the sale of Class A shares and $23 in contingent deferred sales charges from redemptions of Class C shares.
Shareholder servicing fees
The Trust has entered into contracts with one or more shareholder servicing agents, whereby Class A, Class B, Class C, Administrator Class, and Investor Class of the Fund is charged a fee at an annual rate of 0.25% of the average daily net assets of each respective class.
A portion of these total shareholder servicing fees were paid to affiliates of Wells Fargo.
5. INVESTMENT PORTFOLIO TRANSACTIONS
Purchases and sales of investments, excluding U.S. government obligations (if any) and short-term securities, for the six months ended September 30, 2014 were $152,212,484 and $593,373,310, respectively.
| | | | | | |
| Notes to financial statements (unaudited) | | Wells Fargo Advantage Small Cap Value Fund | | | 27 | |
6. INVESTMENTS IN AFFILIATES
An affiliated investment is a company in which the Fund has ownership of at least 5% of the outstanding voting shares. The following is a summary of transactions in issuers that were either affiliates of the Fund at the beginning of the period or the end of the period.
| | | | | | | | | | | | | | | | | | | | | | | | | | | | |
| | | Shares, beginning
of period | | | Shares
purchased | | | Shares
sold | | | Shares, end of
period | | | Value, end of
period | | | Income from affiliated
securities | | | Realized gains (losses) | |
Argo Group International Holdings Limited* | | | 1,420,300 | | | | 0 | | | | 440,800 | | | | 979,500 | | | $ | 49,278,645 | | | $ | 398,664 | | | $ | 6,713,544 | |
Allied Healthcare Products Incorporated | | | 563,145 | | | | 218,055 | | | | 0 | | | | 781,200 | | | | 1,562,400 | | | | 0 | | | | 0 | |
Cavco Industries Incorporated | | | 742,600 | | | | 0 | | | | 31,400 | | | | 711,200 | | | | 48,361,600 | | | | 0 | | | | 884,942 | |
Covenant Transport Incorporated Class A | | | 1,113,700 | | | | 0 | | | | 240,400 | | | | 873,300 | | | | 16,234,647 | | | | 0 | | | | (824,184 | ) |
Cray Incorporated | | | 2,279,300 | | | | 0 | | | | 226,100 | | | | 2,053,200 | | | | 53,875,968 | | | | 0 | | | | 5,210,509 | |
Cross Country Healthcare Incorporated | | | 2,050,500 | | | | 15,800 | | | | 104,700 | | | | 1,961,600 | | | | 18,223,264 | | | | 0 | | | | (952,540 | ) |
InterOil Corporation | | | 4,293,600 | | | | 0 | | | | 347,200 | | | | 3,946,400 | | | | 214,131,664 | | | | 0 | | | | 1,641,917 | |
Medley Management Incorporated Class A | | | 0 | | | | 712,500 | | | | 0 | | | | 712,500 | | | | 12,019,875 | | | | 0 | | | | 0 | |
Newpark Resources Incorporated | | | 6,037,900 | | | | 0 | | | | 966,300 | | | | 5,071,600 | | | | 63,090,704 | | | | 0 | | | | 5,325,428 | |
OraSure Technologies Incorporated | | | 5,621,700 | | | | 0 | | | | 799,100 | | | | 4,822,600 | | | | 34,819,172 | | | | 0 | | | | (1,332,444 | ) |
Skyline Corporation | | | 337,500 | | | | 190,900 | | | | 2,300 | | | | 526,100 | | | | 2,172,793 | | | | 0 | | | | (1,824 | ) |
Webco Industries Incorporated | | | 85,650 | | | | 650 | | | | 1,300 | | | | 85,000 | | | | 7,650,000 | | | | 0 | | | | (16,226 | ) |
| | | | | | | | | | | | | | | | | | | | | | | $ | 398,664 | | | $ | 16,649,122 | |
| * | No longer an affiliate of the Fund at the end of the period. |
7. DERIVATIVE TRANSACTIONS
During the six months ended September 30, 2014, the Fund entered into written options for economic hedging purposes.
During the six months ended September 30, 2014, the Fund had written call option activities as follows:
| | | | | | | | |
| | | Number of contracts | | | Premiums received | |
Options outstanding at March 31, 2014 | | | 3,320 | | | $ | 751,558 | |
Options written | | | 770 | | | | 176,780 | |
Options expired | | | 0 | | | | 0 | |
Options closed | | | (4,090 | ) | | | (928,338 | ) |
Options exercised | | | 0 | | | | 0 | |
Options outstanding at September 30, 2014 | | | 0 | | | $ | 0 | |
As of September 30, 2014, the Fund did not have any open written options. The Fund had an average of 464 written option contracts during the six months ended September 30, 2014.
The fair value, realized gains or losses and change in unrealized gains or losses, if any, on derivative instruments are reflected in the appropriate financial statements.
8. BANK BORROWINGS
The Trust (excluding the money market funds and certain other funds in the Trust) and Wells Fargo Variable Trust are parties to a $150,000,000 revolving credit agreement whereby the Fund is permitted to use bank borrowings for temporary or emergency purposes, such as to fund shareholder redemption requests. Interest under the credit agreement is charged to the Fund based on a borrowing rate equal to the higher of the Federal Funds rate in effect on that day plus 1.25% or the overnight LIBOR rate in effect on that day plus 1.25%. In addition, an annual commitment fee equal to 0.10% of the unused balance is allocated to each participating fund. For the six months ended September 30, 2014, the Fund paid $2,830 in commitment fees.
| | | | |
| 28 | | Wells Fargo Advantage Small Cap Value Fund | | Notes to financial statements (unaudited) |
For the six months ended September 30, 2014, there were no borrowings by the Fund under the agreement.
9. INDEMNIFICATION
Under the Trust’s organizational documents, the officers and Trustees are indemnified against certain liabilities that may arise out of performance of their duties to the Trust. Additionally, in the normal course of business, the Trust may enter into contracts with service providers that contain a variety of indemnification clauses. The Trust’s maximum exposure under these arrangements is dependent on future claims that may be made against the Fund and, therefore, cannot be estimated.
| | | | | | |
| Other information (unaudited) | | Wells Fargo Advantage Small Cap Value Fund | | | 29 | |
PROXY VOTING INFORMATION
A description of the policies and procedures that the Fund uses to determine how to vote proxies relating to portfolio securities is available without charge, upon request, by calling 1-800-222-8222, visiting our website at wellsfargoadvantagefunds.com, or visiting the SEC website at sec.gov. Information regarding how the Fund voted proxies relating to portfolio securities during the most recent 12-month period ended June 30 is available without charge on the Fund’s website at wellsfargoadvantagefunds.com or by visiting the SEC website at sec.gov.
PORTFOLIO HOLDINGS INFORMATION
The complete portfolio holdings for the Fund are publicly available monthly on the Fund’s website (wellsfargoadvantagefunds.com), on a one-month delayed basis. In addition, top ten holdings information (excluding derivative positions) for the Fund is publicly available on the Fund’s website on a monthly, seven-day or more delayed basis. The Fund files its complete schedule of portfolio holdings with the SEC for the first and third quarters of each fiscal year on Form N-Q, which is available without charge by visiting the SEC website at sec.gov. In addition, the Fund’s Form N-Q may be reviewed and copied at the SEC’s Public Reference Room in Washington, DC, and at regional offices in New York City, at 233 Broadway, and in Chicago, at 175 West Jackson Boulevard, Suite 900. Information about the Public Reference Room may be obtained by calling 1-800-SEC-0330.
| | | | |
| 30 | | Wells Fargo Advantage Small Cap Value Fund | | Other information (unaudited) |
BOARD OF TRUSTEES AND OFFICERS
Each of the Trustees and Officers1 listed in the table below acts in identical capacities for each fund in the Wells Fargo Advantage family of funds, which consists of 133 mutual funds comprising the Wells Fargo Funds Trust, Wells Fargo Variable Trust, Wells Fargo Master Trust and four closed-end funds (collectively the “Fund Complex”). This table should be read in conjunction with the Prospectus and the Statement of Additional Information2. The mailing address of each Trustee and Officer is 525 Market Street, 12th Floor, San Francisco, CA 94105. Each Trustee and Officer serves an indefinite term, however, each Trustee serves such term until reaching the mandatory retirement age established by the Trustees.
Independent Trustees
| | | | | | |
Name and year of birth | | Position held and length of service* | | Principal occupations during past five years or longer | | Other
directorships during
past five years |
Peter G. Gordon
(Born 1942) | | Trustee, since 1998; Chairman, since 2005 | | Co-Founder, Retired Chairman, President and CEO of Crystal Geyser Water Company. Trustee Emeritus, Colby College. | | Asset Allocation Trust |
Isaiah Harris, Jr.
(Born 1952) | | Trustee, since 2009 | | Retired. Prior thereto, President and CEO of BellSouth Advertising and Publishing Corp. from 2005 to 2007, President and CEO of BellSouth Enterprises from 2004 to 2005 and President of BellSouth Consumer Services from 2000 to 2003. Emeritus member of the Iowa State University Foundation Board of Governors. Emeritus Member of the Advisory Board of Iowa State University School of Business. Advisory Board Member, Palm Harbor Academy. Mr. Harris is a certified public accountant. | | CIGNA Corporation; Asset Allocation Trust |
Judith M. Johnson
(Born 1949) | | Trustee, since 2008; Audit Committee Chairman, since 2008 | | Retired. Prior thereto, Chief Executive Officer and Chief Investment Officer of Minneapolis Employees Retirement Fund from 1996 to 2008. Ms. Johnson is an attorney, certified public accountant and a certified managerial accountant. | | Asset Allocation Trust |
Leroy Keith, Jr.
(Born 1939) | | Trustee, since 2010 | | Chairman, Bloc Global Services (development and construction). Trustee of the Evergreen Funds complex (and its predecessors) from 1983 to 2010. Former Managing Director, Almanac Capital Management (commodities firm), former Partner, Stonington Partners, Inc. (private equity fund), former Director, Obagi Medical Products Co. and former Director, Lincoln Educational Services. | | Trustee, Virtus Fund Complex (consisting of 50 portfolios as of 12/16/2013); Asset Allocation Trust |
David F. Larcker
(Born 1950) | | Trustee, since 2009 | | James Irvin Miller Professor of Accounting at the Graduate School of Business, Stanford University, Morgan Stanley Director of the Center for Leadership Development and Research and Senior Faculty of The Rock Center for Corporate Governance since 2006. From 2005 to 2008, Professor of Accounting at the Graduate School of Business, Stanford University. Prior thereto, Ernst & Young Professor of Accounting at The Wharton School, University of Pennsylvania from 1985 to 2005. | | Asset Allocation Trust |
Olivia S. Mitchell
(Born 1953) | | Trustee, since 2006 | | International Foundation of Employee Benefit Plans Professor, Wharton School of the University of Pennsylvania since 1993. Director of Wharton’s Pension Research Council and Boettner Center on Pensions & Retirement Research, and Research Associate at the National Bureau of Economic Research. Previously, Cornell University Professor from 1978 to 1993. | | Asset Allocation Trust |
Timothy J. Penny
(Born 1951) | | Trustee, since 1996 | | President and CEO of Southern Minnesota Initiative Foundation, a non-profit organization, since 2007 and Senior Fellow at the Humphrey Institute Policy Forum at the University of Minnesota since 1995. Member of the Board of Trustees of NorthStar Education Finance, Inc., a non-profit organization, since 2007. | | Asset Allocation Trust |
Michael S. Scofield
(Born 1943) | | Trustee, since 2010 | | Served on the Investment Company Institute’s Board of Governors and Executive Committee from 2008-2011 as well the Governing Council of the Independent Directors Council from 2006-2011 and the Independent Directors Council Executive Committee from 2008-2011. Chairman of the IDC from 2008-2010. Institutional Investor (Fund Directions) Trustee of Year in 2007. Trustee of the Evergreen Funds complex (and its predecessors) from 1984 to 2010. Chairman of the Evergreen Funds from 2000-2010. Former Trustee of the Mentor Funds. Retired Attorney, Law Offices of Michael S. Scofield. | | Asset Allocation Trust |
| | | | | | |
| Other information (unaudited) | | Wells Fargo Advantage Small Cap Value Fund | | | 31 | |
| | | | | | |
Name and year of birth | | Position held and length of service* | | Principal occupations during past five years or longer | | Other
directorships during
past five years |
Donald C. Willeke
(Born 1940) | | Trustee, since 1996 | | Principal of the law firm of Willeke & Daniels. General Counsel of the Minneapolis Employees Retirement Fund from 1984 until its consolidation into the Minnesota Public Employees Retirement Association on June 30, 2010. Director and Vice Chair of The Tree Trust (non-profit corporation). Director of the American Chestnut Foundation (non-profit corporation). | | Asset Allocation Trust |
| * | Length of service dates reflect the Trustee’s commencement of service with the Trust’s predecessor entities, where applicable. |
Officers
| | | | | | |
Name and year of birth | | Position held and length of service | | Principal occupations during past five years or longer | | |
Karla M. Rabusch
(Born 1959) | | President, since 2003 | | Executive Vice President of Wells Fargo Bank, N.A. and President of Wells Fargo Funds Management, LLC since 2003. | | |
Nancy Wiser1
(Born 1967) | | Treasurer, since 2012 | | Executive Vice President of Wells Fargo Funds Management, LLC since 2011. Chief Operating Officer and Chief Compliance Officer at LightBox Capital Management LLC, from 2008 to 2011. Owned and operated a consulting business providing services to various hedge funds including acting as Chief Operating Officer and Chief Compliance Officer for a hedge fund from 2007 to 2008. Chief Operating Officer and Chief Compliance Officer of GMN Capital LLC from 2006 to 2007. | | |
C. David Messman
(Born 1960) | | Secretary, since 2000; Chief Legal Officer, since 2003 | | Assistant General Counsel of Wells Fargo Bank, N.A. since 2013 and Vice President and Managing Counsel of Wells Fargo Bank N.A. from 1996 to 2013. Senior Vice President and Secretary of Wells Fargo Funds Management , LLC since 2001. | | |
Debra Ann Early
(Born 1964) | | Chief Compliance Officer, since 2007 | | Senior Vice President and Chief Compliance Officer of Wells Fargo Funds Management, LLC since 2007. Chief Compliance Officer of Parnassus Investments from 2005 to 2007. Chief Financial Officer of Parnassus Investments from 2004 to 2007. | | |
David Berardi
(Born 1975) | | Assistant Treasurer, since 2009 | | Vice President of Wells Fargo Funds Management, LLC since 2009. Vice President of Evergreen Investment Management Company, LLC from 2008 to 2010. Assistant Vice President of Evergreen Investment Services, Inc. from 2004 to 2008. Manager of Fund Reporting and Control for Evergreen Investment Management Company, LLC from 2004 to 2010. | | |
Jeremy DePalma1
(Born 1974) | | Assistant Treasurer, since 2009 | | Senior Vice President of Wells Fargo Funds Management, LLC since 2009. Senior Vice President of Evergreen Investment Management Company, LLC from 2008 to 2010. Vice President, Evergreen Investment Services, Inc. from 2004 to 2007. Head of the Fund Reporting and Control Team within Fund Administration from 2005 to 2010. | | |
| 1. | Nancy Wiser acts as Treasurer of 73 funds in the Fund Complex. Jeremy DePalma acts as Treasurer of 60 funds and Assistant Treasurer of 73 funds in the Fund Complex. |
| 2. | The Statement of Additional Information includes additional information about the Trustees and is available, without charge, upon request, by calling 1-800-222-8222 or by visiting the website at wellsfargoadvantagefunds.com. |
| | | | |
| 32 | | Wells Fargo Advantage Small Cap Value Fund | | Other information (unaudited) |
BOARD CONSIDERATION OF INVESTMENT ADVISORY AND SUB-ADVISORY AGREEMENTS:
Under Section 15 of the Investment Company Act of 1940 (the “1940 Act”), the Board of Trustees (the “Board”) of Wells Fargo Funds Trust (the “Trust”), all the members of which have no direct or indirect interest in the investment advisory and sub-advisory agreements and are not “interested persons” of the Trust, as defined in the 1940 Act (the “Independent Trustees”), must determine whether to approve the continuation of the Trust’s investment advisory and sub-advisory agreements. In this regard, at in-person meetings held on March 27-28, 2014 (the “March Meeting”) and May 15-16, 2014 (the “May Meeting”, and together with the March Meeting, the “Meetings”), the Board reviewed: (i) an investment advisory agreement with Wells Fargo Funds Management, LLC (“Funds Management”) for Wells Fargo Advantage Small Cap Value Fund (the “Fund”) and (ii) an investment sub-advisory agreement with Wells Capital Management Incorporated (the “Sub-Adviser”), an affiliate of Funds Management, for the Fund. The investment advisory agreement with Funds Management and the investment sub-advisory agreement with the Sub-Adviser are collectively referred to as the “Advisory Agreements.”
At the May Meeting, the Board received the information, considered the factors and reached the conclusions discussed below, and unanimously approved the renewal of the Advisory Agreements, as it had done at the March Meeting.
At the Meetings, the Board considered the factors and reached the conclusions described below relating to the selection of Funds Management and the Sub-Adviser and the continuation of the Advisory Agreements. Prior to the Meetings, the Trustees conferred extensively among themselves and with representatives of Funds Management about these matters. Also, the Board has adopted a team-based approach, with each team consisting of a sub-set of Trustees, to assist the full Board in the discharge of its duties in reviewing performance and other matters throughout the year. The Independent Trustees were assisted in their evaluation of the Advisory Agreements by independent legal counsel, from whom they received separate legal advice and with whom they met separately.
In providing information to the Board, Funds Management and the Sub-Adviser were guided by a detailed set of requests for information submitted to them by independent legal counsel on behalf of the Independent Trustees at the start of the Board’s annual contract renewal process earlier in 2014. In considering and approving the Advisory Agreements, the Trustees considered the information they believed relevant, including but not limited to the information discussed below. The Board considered not only the specific information presented in connection with the Meetings, but also the knowledge gained over time through interaction with Funds Management and the Sub-Adviser about various topics. In this regard, the Board reviewed reports of Funds Management at each of its quarterly meetings, which included, among other things, portfolio reviews and performance reports. In addition, the Board and the teams mentioned above confer with portfolio managers at various times throughout the year. The Board did not identify any particular information or consideration that was all-important or controlling, and each individual Trustee may have attributed different weights to various factors.
After its deliberations, the Board unanimously approved the continuation of the Advisory Agreements and determined that the compensation payable to Funds Management and the Sub-Adviser is reasonable. The Board considered the continuation of the Advisory Agreements for the Fund as part of its consideration of the continuation of advisory agreements for funds across the complex, but its approvals were made on a fund-by-fund basis. The following summarizes a number of important, but not necessarily all, factors considered by the Board in support of its approvals.
Nature, extent and quality of services
The Board received and considered various information regarding the nature, extent and quality of services provided to the Fund by Funds Management and the Sub-Adviser under the Advisory Agreements. This information included, among other things, a summary of the background and experience of senior management of Funds Management, and the qualifications, background, tenure and responsibilities of each of the portfolio managers primarily responsible for the day-to-day portfolio management of the Fund.
The Board evaluated the ability of Funds Management and the Sub-Adviser to attract and retain qualified investment professionals, including research, advisory and supervisory personnel. The Board further considered the compliance programs and compliance records of Funds Management and the Sub-Adviser. In addition, the Board took into account the full range of services provided to the Fund by Funds Management and its affiliates.
Fund performance and expenses
The Board considered the performance results for the Fund over various time periods ended December 31, 2013. The Board also considered these results in comparison to the performance of funds in a universe that was determined by Lipper Inc. (“Lipper”) to be similar to the Fund (the “Universe”), and in comparison to the Fund’s benchmark index and to
| | | | | | |
| Other information (unaudited) | | Wells Fargo Advantage Small Cap Value Fund | | | 33 | |
other comparative data. Lipper is an independent provider of investment company data. The Board received a description of the methodology used by Lipper to select the mutual funds in the performance Universe. The Board noted that the performance of the Fund (Class A) was lower than the average performance of the Universe for the one-, three- and five-year periods under review, and in range of the average performance of the Universe for the ten-year period. The Board also noted that the performance of the Fund was lower than its benchmark, the Russell 2000® Value Index, for the one-, three- and five-year periods, and in range of the performance of its benchmark for the ten-year period.
The Board received information concerning, and discussed factors contributing to, the underperformance of the Fund relative to the Universe and the benchmark for the one-, three- and five-year periods under review. Funds Management advised the Board about the market conditions and investment decisions that it believed contributed to the underperformance during that period. Funds Management advised the Board that the Fund’s performance was affected by underperformance in the consumer discretionary and materials sectors, and market and performance volatility. The Board noted the Fund’s long-term risk adjusted results and was satisfied with the explanation of factors contributing to underperformance and with the steps being taken by Funds Management and the Sub-Adviser to address the Fund’s investment performance.
The Board also received and considered information regarding the Fund’s net operating expense ratios and their various components, including actual management fees (which reflect fee waivers, if any, and include advisory, administration and transfer agent fees), custodian and other non-management fees, Rule 12b-1 and non-Rule 12b-1 service fees and fee waiver and expense reimbursement arrangements. The Board considered these ratios in comparison to the median ratios of funds in class-specific expense groups that were determined by Lipper to be similar to the Fund (the “Groups”). The Board received a description of the methodology used by Lipper to select the mutual funds in the expense Groups and an explanation of year-to-year variations in the funds comprising such expense Groups and their expense ratios. Based on the Lipper reports, the Board noted that the net operating expense ratios of the Fund were lower than or in range of the median net operating expense ratios of the expense Groups.
Based on its consideration of the factors and information it deemed relevant, including those described here, the Board concluded that the overall performance and expense structure of the Fund supported the re-approval of the Advisory Agreements.
Investment advisory and sub-advisory fee rates
The Board reviewed and considered the contractual investment advisory fee rates that are payable by the Fund to Funds Management for investment advisory services (the “Advisory Agreement Rates”), both on a stand-alone basis and on a combined basis with the Fund’s fund-level and class-level contractual administration fee rates (the “Management Rates”). The Board noted that the administration fees payable to Funds Management include transfer agency and sub-transfer agency costs. The Board also reviewed and considered the contractual investment sub-advisory fee rates that are payable by Funds Management to the Sub-Adviser for investment sub-advisory services (the “Sub-Advisory Agreement Rates”).
Among other information reviewed by the Board was a comparison of the Management Rates of the Fund with those of other funds in the expense Groups at a common asset level. The Board noted that the Management Rates of the Fund were in range of the average rates for the Fund’s expense Groups for all share classes except Class A and Investor Class. However, the Board viewed favorably the agreed-upon reduction in the net operating expense ratio cap for all share classes, including Class A and Investor Class.
The Board also received and considered information about the portion of the total advisory fee that was retained by Funds Management after payment of the fee to the Sub-Adviser for sub-advisory services. In assessing the reasonableness of this amount, the Board received and evaluated information about the nature and extent of responsibilities retained and risks assumed by Funds Management and not delegated to or assumed by the Sub-Adviser, and about Funds Management’s on-going oversight services. However, given the affiliation between Funds Management and the Sub-Adviser, the Board ascribed limited relevance to the allocation of the advisory fee between them.
The Board also received and considered information about the nature and extent of services offered and fee rates charged by Funds Management and the Sub-Adviser to other types of clients with investment strategies similar to those of the Fund. In this regard, the Board received information about the significantly greater scope of services, and compliance, reporting and other legal burdens and risks of managing mutual funds compared with those associated with managing assets of non-mutual fund clients such as collective funds or institutional separate accounts.
| | | | |
| 34 | | Wells Fargo Advantage Small Cap Value Fund | | Other information (unaudited) |
Based on its consideration of the factors and information it deemed relevant, including those described here, the Board determined that the Advisory Agreement Rates and the Sub-Advisory Agreement Rates were reasonable in light of the services covered by the Advisory Agreements.
Profitability
The Board received and considered information concerning the profitability of Funds Management, as well as the profitability of Wells Fargo as a whole, from providing services to the Fund and the fund family as a whole. The Board did not receive or consider to be necessary separate profitability information with respect to the Sub-Adviser, because its profitability information was subsumed in the collective Wells Fargo profitability analysis.
Funds Management explained the methodologies and estimates that it used in calculating profitability. Among other things, the Board noted that the levels of profitability reported on a fund-by-fund basis varied widely, depending on factors such as the size and type of fund. Based on its review, the Board did not deem the profits reported by Funds Management to be at a level that would prevent it from approving the continuation of the Advisory Agreements.
Economies of scale
With respect to possible economies of scale, the Board noted the existence of breakpoints in the Fund’s advisory fee and administration fee structure, which operate generally to reduce the Fund’s expense ratios as the Fund grows in size. It considered that, for a small fund or a fund that shrinks in size, breakpoints conversely can result in higher fee levels. The Board also considered that fee waiver and expense reimbursement arrangements and competitive fee rates at the outset are means of sharing potential economies of scale with shareholders of the Fund and the fund family as a whole. The Board considered Funds Management’s view that any analyses of potential economies of scale in managing a particular fund are inherently limited in light of the joint and common costs and investments that Funds Management incurs across the fund family as a whole.
The Board concluded that the Fund’s fee and expense arrangements, including contractual breakpoints, constituted a reasonable approach to sharing potential economies of scale with the Fund and its shareholders.
Other benefits to Funds Management and the Sub-Adviser
The Board received and considered information regarding potential “fall-out” or ancillary benefits received by Funds Management and its affiliates, including the Sub-Adviser, as a result of their relationships with the Fund. Ancillary benefits could include, among others, benefits directly attributable to other relationships with the Fund and benefits potentially derived from an increase in Funds Management’s and the Sub-Adviser’s business as a result of their relationships with the Fund. The Board noted that various affiliates of Funds Management may receive distribution-related fees, shareholder servicing payments and sub-transfer agency fees in respect of shares sold or held through them and services provided.
The Board also reviewed information about soft dollar credits earned and utilized by the Sub-Adviser, fees earned by Funds Management and the Sub-Adviser from managing a private investment vehicle for the fund family’s securities lending collateral and commissions earned by an affiliated broker from portfolio transactions.
Based on its consideration of the factors and information it deemed relevant, including those described here, the Board did not find that any ancillary benefits received by Funds Management and its affiliates, including the Sub-Adviser, were unreasonable.
Conclusion
After considering the above-described factors and based on its deliberations and its evaluation of the information described above, the Board unanimously approved the continuation of the Advisory Agreements for an additional one-year period and determined that the compensation payable to Funds Management and the Sub-Adviser is reasonable.
| | | | | | |
| List of abbreviations | | Wells Fargo Advantage Small Cap Value Fund | | | 35 | |
The following is a list of common abbreviations for terms and entities that may have appeared in this report.
| ACA | — ACA Financial Guaranty Corporation |
| ADR | — American depositary receipt |
| ADS | — American depositary shares |
| AGC | — Assured Guaranty Corporation |
| AGM | — Assured Guaranty Municipal |
| Ambac | — Ambac Financial Group Incorporated |
| AMT | — Alternative minimum tax |
| BAN | — Bond anticipation notes |
| BHAC | — Berkshire Hathaway Assurance Corporation |
| CAB | — Capital appreciation bond |
| CCAB | — Convertible capital appreciation bond |
| CDA | — Community Development Authority |
| CDO | — Collateralized debt obligation |
| DRIVER | — Derivative inverse tax-exempt receipts |
| DW&P | — Department of Water & Power |
| DWR | — Department of Water Resources |
| ECFA | — Educational & Cultural Facilities Authority |
| EDA | — Economic Development Authority |
| EDFA | — Economic Development Finance Authority |
| ETF | — Exchange-traded fund |
| FDIC | — Federal Deposit Insurance Corporation |
| FFCB | — Federal Farm Credit Banks |
| FGIC | — Financial Guaranty Insurance Corporation |
| FHA | — Federal Housing Administration |
| FHLB | — Federal Home Loan Bank |
| FHLMC | — Federal Home Loan Mortgage Corporation |
| FICO | — The Financing Corporation |
| FNMA | — Federal National Mortgage Association |
| GDR | — Global depositary receipt |
| GNMA | — Government National Mortgage Association |
| HCFR | — Healthcare facilities revenue |
| HEFA | — Health & Educational Facilities Authority |
| HEFAR | — Higher education facilities authority revenue |
| HFA | — Housing Finance Authority |
| HFFA | — Health Facilities Financing Authority |
| HUD | — Department of Housing and Urban Development |
| IDA | — Industrial Development Authority |
| IDAG | — Industrial Development Agency |
| KRW | — Republic of Korea won |
| LIBOR | — London Interbank Offered Rate |
| LLC | — Limited liability company |
| LLLP | — Limited liability limited partnership |
| LLP | — Limited liability partnership |
| MBIA | — Municipal Bond Insurance Association |
| MFHR | — Multifamily housing revenue |
| MSTR | — Municipal securities trust receipts |
| MUD | — Municipal Utility District |
| National | — National Public Finance Guarantee Corporation |
| PCFA | — Pollution Control Financing Authority |
| PCL | — Public Company Limited |
| PCR | — Pollution control revenue |
| PFA | — Public Finance Authority |
| PFFA | — Public Facilities Financing Authority |
| PFOTER | — Puttable floating option tax-exempt receipts |
| plc | — Public limited company |
| PUTTER | — Puttable tax-exempt receipts |
| R&D | — Research & development |
| Radian | — Radian Asset Assurance |
| RAN | — Revenue anticipation notes |
| RDA | — Redevelopment Authority |
| RDFA | — Redevelopment Finance Authority |
| REIT | — Real estate investment trust |
| ROC | — Reset option certificates |
| SAVRS | — Select auction variable rate securities |
| SBA | — Small Business Authority |
| SFHR | — Single-family housing revenue |
| SFMR | — Single-family mortgage revenue |
| SPA | — Standby purchase agreement |
| SPDR | — Standard & Poor’s Depositary Receipts |
| STRIPS | — Separate trading of registered interest and principal securities |
| TAN | — Tax anticipation notes |
| TIPS | — Treasury inflation-protected securities |
| TRAN | — Tax revenue anticipation notes |
| TTFA | — Transportation Trust Fund Authority |
| TVA | — Tennessee Valley Authority |
This page is intentionally left blank.


For more information
More information about Wells Fargo Advantage Funds is available free upon request. To obtain literature, please write, email, visit the Fund’s website, or call:
Wells Fargo Advantage Funds
P.O. Box 8266
Boston, MA 02266-8266
Email: wfaf@wellsfargo.com
Website: wellsfargoadvantagefunds.com
Individual investors: 1-800-222-8222
Retail investment professionals: 1-888-877-9275
Institutional investment professionals: 1-866-765-0778
This report and the financial statements contained herein are submitted for the general information of the shareholders of Wells Fargo Advantage Funds. If this report is used for promotional purposes, distribution of the report must be accompanied or preceded by a current prospectus. Before investing, please consider the investment objectives, risks, charges, and expenses of the investment. For a current prospectus and, if available, a summary prospectus, containing this information, call 1-800-222-8222 or visit the Fund’s website at wellsfargoadvantagefunds.com. Read the prospectus carefully before you invest or send money.
Wells Fargo Funds Management, LLC, a wholly owned subsidiary of Wells Fargo & Company, provides investment advisory and administrative services for Wells Fargo Advantage Funds. Other affiliates of Wells Fargo & Company provide subadvisory and other services for the Funds. The Funds are distributed by Wells Fargo Funds Distributor, LLC, Member FINRA/SIPC, an affiliate of Wells Fargo & Company.
NOT FDIC INSURED ¡ NO BANK GUARANTEE ¡ MAY LOSE VALUE
© 2014 Wells Fargo Funds Management, LLC. All rights reserved.
| | |
 | | 228300 11-14 SA244/SAR244 09-14 |

Wells Fargo Advantage
Small/Mid Cap Value Fund

Semi-Annual Report
September 30, 2014

Reduce clutter. Save trees.
Sign up for electronic delivery of prospectuses and shareholder reports at wellsfargo.com/advantagedelivery
Contents
The views expressed and any forward-looking statements are as of September 30, 2014, unless otherwise noted, and are those of the Fund managers and/or Wells Fargo Funds Management, LLC. Discussions of individual securities, or the markets generally, or any Wells Fargo Advantage Fund are not intended as individual recommendations. Future events or results may vary significantly from those expressed in any forward-looking statements; the views expressed are subject to change at any time in response to changing circumstances in the market. Wells Fargo Funds Management, LLC and the Fund disclaim any obligation to publicly update or revise any views expressed or forward-looking statements.
NOT FDIC INSURED ¡ NO BANK GUARANTEE ¡ MAY LOSE VALUE
| | | | |
| 2 | | Wells Fargo Advantage Small/Mid Cap Value Fund | | Letter to shareholders (unaudited) |

Karla M. Rabusch
President
Wells Fargo Advantage Funds
Despite geopolitical challenges, U.S. economic numbers showed improvement.
Dear Valued Shareholder:
We are pleased to offer you this semi-annual report for the Wells Fargo Advantage Small/Mid Cap Value Fund for the six-month period that ended September 30, 2014. The period was marked by heightened geopolitical uncertainty as the U.S. and Europe continued to confront Russia over Ukraine and as Islamic militants (formerly known as ISIS) gained territory in Iraq and Syria. Toward the end of the reporting period, market volatility increased as renewed fears of slowing global growth took hold, and investors began to price in expectations that the U.S. Federal Reserve (Fed) was finally looking to raise short-term interest rates. Although mid-cap stocks (measured by the Russell Midcap® Index1) ended the period with a single-digit gain, small-cap stocks (measured by the Russell 2000® Index2) ended with a loss.
Major central banks continued to provide stimulus.
Throughout the reporting period, the Federal Open Market Committee (FOMC)—the U.S. Federal Reserve’s monetary policymaking body—kept its key interest rate near zero. Prior to the reporting period, in January 2014, the FOMC began to reduce (or taper) its bond-buying program by $10 billion per month and continued the taper throughout the reporting period. Some anticipated this action would lead to higher interest rates, however, interest rates followed a downward trend, despite short-term volatility. European markets continued to benefit from the European Central Bank’s (ECB’s) actions. In June 2014, the ECB announced a variety of measures aimed at encouraging lending, including cutting its key rate and imposing for the first time a negative interest rate on bank deposits held at the central bank. In September 2014, the ECB cut its key rate again—to 0.05%—and pushed the deposit rate for banks to -0.20%.
Although the geopolitical situation presented challenges, U.S. stock markets gained on positive economic data.
Geopolitical events were major obstacles throughout the reporting period. The ongoing standoff between the West (the U.S., Europe, and their allies) and Russia over Ukraine began in late 2013 and fed into stock market volatility early in 2014. The situation’s effect on the stock market faded as investors began to believe that the situation would not result in war, but as of September 2014, the situation had resulted in economic sanctions from the West against Russia. However, even as the market began to focus less on that situation, the advance of Islamic militants in Iraq and Syria led to airstrikes by the U.S. and its allies and fears of a regional war in the Middle East.
Despite geopolitical challenges, U.S. economic numbers showed improvement. The unemployment rate continued its slow improvement, declining from 6.3% in April 2014 to 5.9% in September 2014. Although investors received an unpleasant surprise when gross domestic product (GDP) growth for the first quarter of 2014 declined by 2.1% on an annualized basis, several commentators suggested that harsh winter weather may have dampened economic activity. Economic growth did accelerate in the second quarter of 2014, with an annualized GDP growth rate of 4.6%.
| 1. | The Russell Midcap® Index measures the performance of the 800 smallest companies in the Russell 1000® Index, which represent approximately 25% of the total market capitalization of the Russell 1000 Index. You cannot invest directly in an index. |
| 2. | The Russell 2000® Index measures the performance of the 2,000 smallest companies in the Russell 3000® Index, which represents approximately 8% of the total market capitalization of the Russell 3000 Index. You cannot invest directly in an index. |
| | | | | | |
| Letter to shareholders (unaudited) | | Wells Fargo Advantage Small/Mid Cap Value Fund | | | 3 | |
Investors’ positive outlook for the U.S. economy contributed to a solid domestic stock market for most of the period. However, slowing global economic growth, combined with renewed geopolitical concerns (including protests in Hong Kong), caused stock market weakness in September 2014. The Russell Midcap Index ended the period with a 3.2% gain. Small-cap stocks, however, were hit harder by the late-period uncertainty and the Russell 2000 Index ended with a -5.5% return. Growth stocks outperformed value stocks in both the small-cap and the mid-cap space.
Don’t let short-term uncertainty derail long-term investment goals.
Periods of uncertainty can present challenges, but experience has taught us that maintaining long-term investment goals can be an effective way to plan for the future. To help you create a sound strategy based on your personal goals and risk tolerance, Wells Fargo Advantage Funds offers more than 100 mutual funds and other investments spanning a wide range of asset classes and investment styles. Although diversification cannot guarantee an investment profit or prevent losses, we believe it can be an effective way to manage investment risk and potentially smooth out overall portfolio performance. We encourage investors to know their investments and to understand that appropriate levels of risk-taking may unlock opportunities.
Thank you for choosing to invest with Wells Fargo Advantage Funds. We appreciate your confidence in us and remain committed to helping you meet your financial needs. For current information about your fund investments, contact your investment professional, visit our website at wellsfargoadvantagefunds.com, or call us directly at 1-800-222-8222. We are available 24 hours a day, 7 days a week.
Sincerely,

Karla M. Rabusch
President
Wells Fargo Advantage Funds
Investors’ positive outlook for the U.S. economy contributed to a solid domestic stock market for most of the period.
| | | | |
| 4 | | Wells Fargo Advantage Small/Mid Cap Value Fund | | Performance highlights (unaudited) |
Investment objective
The Fund seeks long-term capital appreciation.
Adviser
Wells Fargo Funds Management, LLC
Subadviser
Wells Capital Management Incorporated
Portfolio managers
I. Charles Rinaldi
Erik C. Astheimer
Michael Schneider, CFA
Average annual total returns1 (%) as of September 30, 2014
| | | | | | | | | | | | | | | | | | | | | | | | | | | | | | | | | | |
| | | | | Including sales charge | | | Excluding sales charge | | | Expense ratios2 (%) | |
| | | Inception date | | 1 year | | | 5 year | | | 10 year | | | 1 year | | | 5 year | | | 10 year | | | Gross | | | Net3 | |
| Class A (WFVAX) | | 7-31-2007 | | | (3.72 | ) | | | 6.65 | | | | 5.17 | | | | 2.13 | | | | 7.91 | | | | 5.79 | | | | 1.58 | | | | 1.36 | |
| Class C (WFCVX) | | 7-31-2007 | | | 0.31 | | | | 7.11 | | | | 5.08 | | | | 1.31 | | | | 7.11 | | | | 5.08 | | | | 2.33 | | | | 2.11 | |
| Administrator Class (WWMDX) | | 4-8-2005 | | | – | | | | – | | | | – | | | | 2.33 | | | | 8.19 | | | | 6.08 | | | | 1.42 | | | | 1.16 | |
| Institutional Class (WWMSX) | | 8-31-2006 | | | – | | | | – | | | | – | | | | 2.53 | | | | 8.41 | | | | 6.25 | | | | 1.15 | | | | 0.96 | |
| Investor Class (SMMVX) | | 3-28-2002 | | | – | | | | – | | | | – | | | | 2.06 | | | | 7.85 | | | | 5.73 | | | | 1.64 | | | | 1.42 | |
| Russell 2500TM Value Index4 | | – | | | – | | | | – | | | | – | | | | 9.88 | | | | 15.16 | | | | 8.65 | | | | – | | | | – | |
Figures quoted represent past performance, which is no guarantee of future results, and do not reflect taxes that a shareholder may pay on fund distributions or the redemption of fund shares. Investment return and principal value of an investment will fluctuate so that an investor’s shares, when redeemed, may be worth more or less than their original cost. Performance shown without sales charges would be lower if sales charges were reflected. Current performance may be lower or higher than the performance data quoted, which assumes the reinvestment of dividends and capital gains. Current month-end performance is available on the Fund’s website, wellsfargoadvantagefunds.com.
Index returns do not include transaction costs associated with buying and selling securities, any mutual fund fees or expenses, or any taxes. It is not possible to invest directly in an index.
For Class A shares, the maximum front-end sales charge is 5.75%. For Class C shares, the maximum contingent deferred sales charge is 1.00%. Performance including a contingent deferred sales charge assumes the sales charge for the corresponding time period. Administrator Class, Institutional Class, and Investor Class shares are sold without a front-end sales charge or contingent deferred sales charge.
Stock values fluctuate in response to the activities of individual companies and general market and economic conditions. Smaller-company stocks tend to be more volatile and less liquid than those of larger companies. The use of derivatives may reduce returns and/or increase volatility. Certain investment strategies tend to increase the total risk of an investment (relative to the broader market). The Fund is exposed to foreign investment risk. Consult the Fund’s prospectus for additional information on these and other risks.
Please see footnotes on page 5.
| | | | | | |
| Performance highlights (unaudited) | | Wells Advantage Small/Mid Cap Value Fund | | | 5 | |
| | | | |
| Ten largest equity holdings5 (%) as of September 30, 2014 | |
InterOil Corporation | | | 5.70 | |
Randgold Resources Limited ADR | | | 3.82 | |
Chimera Investment Corporation | | | 3.10 | |
UMH Properties Incorporated | | | 3.03 | |
Integrated Electrical Services Incorporated | | | 2.62 | |
Cavco Industries Incorporated | | | 2.59 | |
Century Casinos Incorporated | | | 2.45 | |
Cray Incorporated | | | 1.92 | |
News Corporation Class A | | | 1.76 | |
Sandvine Corporation | | | 1.74 | |
|
| Sector distribution6 as of September 30, 2014 |
|
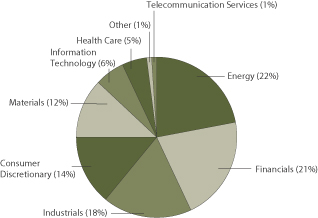 |
| 1. | Historical performance shown for Class A and Administrator Class shares prior to their inception reflects the performance of Investor Class shares, and includes the higher expenses applicable to Investor Class shares. If these expenses had not been included, returns would be higher. Historical performance shown for Class C shares prior to their inception reflects the performance of Investor Class shares, and has been adjusted to reflect the higher expenses applicable to Class C shares. Historical performance shown for Institutional Class shares prior to their inception reflects the performance of Administrator Class shares, and includes the higher expenses applicable to Administrator Class shares. If these expenses had not been included, returns would be higher. |
| 2. | Reflects the expense ratios as stated in the most recent prospectuses, which include the impact of 0.01% in acquired fund fees and expenses. The expense ratios shown are subject to change and may differ from the annualized expense ratios shown in the financial highlights of this report, which do not include acquired fund fees and expenses. |
| 3. | The Adviser has committed through July 31, 2015, to waive fees and/or reimburse expenses to the extent necessary to cap the Fund’s Total Annual Fund Operating Expenses After Fee Waiver, excluding certain expenses, at 1.35% for Class A, 2.10% for Class C, 1.15% for Administrator Class, 0.95% for Institutional Class, and 1.41% for Investor Class. After this time, the cap may be increased or the commitment to maintain the cap may be terminated only with the approval of the Board of Trustees. Brokerage commissions, stamp duty fees, interest, taxes, acquired fund fees and expenses, and extraordinary expenses are excluded from the cap. Without this cap, the Fund’s returns would have been lower. |
| 4. | The Russell 2500TM Value Index measures the performance of those Russell 2500TM companies with lower price-to-book ratios and lower forecasted growth values. You cannot invest directly in an index. |
| 5. | The ten largest equity holdings are calculated based on the value of the securities divided by total net assets of the Fund. Holdings are subject to change and may have changed since the date specified. |
| 6. | Sector distribution is subject to change and is calculated based on the total long-term investments of the Fund. |
| | | | |
| 6 | | Wells Fargo Advantage Small/Mid Cap Value Fund | | Fund expenses (unaudited) |
As a shareholder of the Fund, you incur two types of costs: (1) transaction costs, including sales charges (loads) on purchase payments and contingent deferred sales charges (if any) on redemptions and (2) ongoing costs, including management fees, distribution (12b-1) and/or shareholder service fees, and other Fund expenses. This example is intended to help you understand your ongoing costs (in dollars) of investing in the Fund and to compare these costs with the ongoing costs of investing in other mutual funds.
The example is based on an investment of $1,000 invested at the beginning of the six-month period and held for the entire period from April 1, 2014 to September 30, 2014.
Actual expenses
The “Actual” line of the table below provides information about actual account values and actual expenses. You may use the information in this line, together with the amount you invested, to estimate the expenses that you paid over the period. Simply divide your account value by $1,000 (for example, an $8,600 account value divided by $1,000 = 8.6), then multiply the result by the number in the “Actual” line under the heading entitled “Expenses paid during period” for your applicable class of shares to estimate the expenses you paid on your account during this period.
Hypothetical example for comparison purposes
The “Hypothetical” line of the table below provides information about hypothetical account values and hypothetical expenses based on the Fund’s actual expense ratio and an assumed rate of return of 5% per year before expenses, which is not the Fund’s actual return. The hypothetical account values and expenses may not be used to estimate the actual ending account balance or expenses you paid for the period. You may use this information to compare the ongoing costs of investing in the Fund and other funds. To do so, compare this 5% hypothetical example with the 5% hypothetical examples that appear in the shareholder reports of the other funds.
Please note that the expenses shown in the table are meant to highlight your ongoing costs only and do not reflect any transactional costs, such as sales charges (loads) and contingent deferred sales charges. Therefore, the “Hypothetical” line of the table is useful in comparing ongoing costs only and will not help you determine the relative total costs of owning different funds. In addition, if these transactional costs were included, your costs would have been higher.
| | | | | | | | | | | | | | | | |
| | | Beginning
account value
4-1-2014 | | | Ending
account value
9-30-2014 | | | Expenses
paid during
the period1 | | | Net annualized
expense ratio | |
Class A | | | | | | | | | | | | | | | | |
Actual | | $ | 1,000.00 | | | $ | 890.50 | | | $ | 6.40 | | | | 1.35 | % |
Hypothetical (5% return before expenses) | | $ | 1,000.00 | | | $ | 1,018.30 | | | $ | 6.83 | | | | 1.35 | % |
Class C | | | | | | | | | | | | | | | | |
Actual | | $ | 1,000.00 | | | $ | 887.11 | | | $ | 9.93 | | | | 2.10 | % |
Hypothetical (5% return before expenses) | | $ | 1,000.00 | | | $ | 1,014.54 | | | $ | 10.61 | | | | 2.10 | % |
Administrator Class | | | | | | | | | | | | | | | | |
Actual | | $ | 1,000.00 | | | $ | 891.58 | | | $ | 5.41 | | | | 1.14 | % |
Hypothetical (5% return before expenses) | | $ | 1,000.00 | | | $ | 1,019.35 | | | $ | 5.77 | | | | 1.14 | % |
Institutional Class | | | | | | | | | | | | | | | | |
Actual | | $ | 1,000.00 | | | $ | 892.56 | | | $ | 4.51 | | | | 0.95 | % |
Hypothetical (5% return before expenses) | | $ | 1,000.00 | | | $ | 1,020.31 | | | $ | 4.81 | | | | 0.95 | % |
Investor Class | | | | | | | | | | | | | | | | |
Actual | | $ | 1,000.00 | | | $ | 890.85 | | | $ | 6.68 | | | | 1.41 | % |
Hypothetical (5% return before expenses) | | $ | 1,000.00 | | | $ | 1,018.00 | | | $ | 7.13 | | | | 1.41 | % |
| 1. | Expenses paid is equal to the annualized expense ratio of each class multiplied by the average account value over the period, multiplied by the number of days in the most recent fiscal half-year divided by the number of days in the fiscal year (to reflect the one-half-year period). |
| | | | | | |
| Portfolio of investments—September 30, 2014 (unaudited) | | Wells Fargo Advantage Small/Mid Cap Value Fund | | | 7 | |
| | | | | | | | | | | | |
| Security name | | | | | | Shares | | | Value | |
| | | | | | | | | | | | |
| | | | |
Common Stocks: 97.06% | | | | | | | | | | | | |
| | | | |
Consumer Discretionary: 13.42% | | | | | | | | | | | | |
| | | | |
| Auto Components: 0.76% | | | | | | | | | | | | |
Fox Factory Holding Corporation † | | | | | | | 50,669 | | | $ | 785,370 | |
| | | | | | | | | | | | |
| | | | |
| Hotels, Restaurants & Leisure: 2.45% | | | | | | | | | | | | |
Century Casinos Incorporated † | | | | | | | 492,600 | | | | 2,527,038 | |
| | | | | | | | | | | | |
| | | | |
| Household Durables: 5.77% | | | | | | | | | | | | |
Cavco Industries Incorporated † | | | | | | | 39,300 | | | | 2,672,400 | |
D.R. Horton Incorporated | | | | | | | 36,100 | | | | 740,772 | |
Skyline Corporation † | | | | | | | 183,000 | | | | 755,790 | |
Taylor Morrison Home Corporation Class A † | | | | | | | 47,800 | | | | 775,316 | |
WCI Communities Incorporated † | | | | | | | 54,700 | | | | 1,008,668 | |
| | | | |
| | | | | | | | | | | 5,952,946 | |
| | | | | | | | | | | | |
| | | | |
| Internet & Catalog Retail: 0.24% | | | | | | | | | | | | |
dELiA*s Incorporated † | | | | | | | 884,300 | | | | 244,067 | |
| | | | | | | | | | | | |
| | | | |
| Leisure Products: 0.06% | | | | | | | | | | | | |
Black Diamond Incorporated † | | | | | | | 8,200 | | | | 61,992 | |
| | | | | | | | | | | | |
| | | | |
| Media: 4.14% | | | | | | | | | | | | |
Cinemark Holdings Incorporated | | | | | | | 18,500 | | | | 629,740 | |
Entravision Communications Corporation Class A | | | | | | | 188,600 | | | | 746,856 | |
Interpublic Group of Companies Incorporated | | | | | | | 45,800 | | | | 839,056 | |
Journal Communications Incorporated Class A † | | | | | | | 29,500 | | | | 248,685 | |
News Corporation Class A † | | | | | | | 110,900 | | | | 1,813,215 | |
| | | | |
| | | | | | | | | | | 4,277,552 | |
| | | | | | | | | | | | |
| | | | |
Energy: 21.97% | | | | | | | | | | | | |
| | | | |
| Energy Equipment & Services: 6.72% | | | | | | | | | | | | |
Glori Energy Incorporated † | | | | | | | 50,600 | | | | 399,740 | |
Helix Energy Solutions Group Incorporated † | | | | | | | 54,250 | | | | 1,196,755 | |
Helmerich & Payne Incorporated | | | | | | | 6,100 | | | | 597,007 | |
Key Energy Services Incorporated † | | | | | | | 205,500 | | | | 994,620 | |
Newpark Resources Incorporated † | | | | | | | 72,100 | | | | 896,924 | |
Parker Drilling Company † | | | | | | | 249,200 | | | | 1,231,048 | |
Willbros Group Incorporated † | | | | | | | 195,000 | | | | 1,624,350 | |
| | | | |
| | | | | | | | | | | 6,940,444 | |
| | | | | | | | | | | | |
| | | | |
| Oil, Gas & Consumable Fuels: 15.25% | | | | | | | | | | | | |
Bellatrix Exploration Limited - Canadian Exchange Traded Shares † | | | | | | | 51,300 | | | | 315,143 | |
Bellatrix Exploration Limited - Legend Shares †(i) | | | | | | | 20,000 | | | | 122,863 | |
Bellatrix Exploration Limited † | | | | | | | 58,500 | | | | 359,775 | |
Canadian Natural Resources Limited | | | | | | | 35,000 | | | | 1,359,400 | |
Clean Energy Fuels Corporation † | | | | | | | 96,700 | | | | 754,260 | |
InterOil Corporation † | | | | | | | 108,400 | | | | 5,881,784 | |
Penn West Petroleum Limited | | | | | | | 52,035 | | | | 351,236 | |
The accompanying notes are an integral part of these financial statements.
| | | | |
| 8 | | Wells Fargo Advantage Small/Mid Cap Value Fund | | Portfolio of investments—September 30, 2014 (unaudited) |
| | | | | | | | | | | | |
| Security name | | | | | | Shares | | | Value | |
| | | | | | | | | | | | |
| | | | |
| Oil, Gas & Consumable Fuels (continued) | | | | | | | | | | | | |
PostRock Energy Corporation † | | | | | | | 476,200 | | | $ | 552,392 | |
Raging River Exploration Incorporated † | | | | | | | 49,800 | | | | 407,756 | |
Range Resources Corporation | | | | | | | 20,800 | | | | 1,410,448 | |
Sanchez Energy Corporation † | | | | | | | 20,167 | | | | 529,585 | |
Stone Energy Corporation † | | | | | | | 34,400 | | | | 1,078,784 | |
Triangle Petroleum Corporation † | | | | | | | 76,600 | | | | 843,366 | |
Trilogy Energy Corporation (a) | | | | | | | 78,300 | | | | 1,773,094 | |
| | | | |
| | | | | | | | | | | 15,739,886 | |
| | | | | | | | | | | | |
| | | | |
Financials: 20.13% | | | | | | | | | | | | |
| | | | |
| Banks: 7.90% | | | | | | | | | | | | |
1st United Bancorp Incorporated | | | | | | | 89,100 | | | | 759,132 | |
American River Bankshares † | | | | | | | 73,300 | | | | 670,695 | |
Bancorp Incorporated † | | | | | | | 111,100 | | | | 954,349 | |
BBCN Bancorp Incorporated | | | | | | | 57,806 | | | | 843,390 | |
First Niagara Financial Group Incorporated | | | | | | | 49,100 | | | | 409,003 | |
IBERIABANK Corporation | | | | | | | 6,398 | | | | 399,939 | |
Midsouth Bancorp Incorporated | | | | | | | 34,400 | | | | 643,280 | |
Pacific Premier Bancorp Incorporated † | | | | | | | 100,700 | | | | 1,414,835 | |
Sierra Bancorp | | | | | | | 80,700 | | | | 1,352,532 | |
Wilshire Bancorp Incorporated | | | | | | | 76,300 | | | | 704,249 | |
| | | | |
| | | | | | | | | | | 8,151,404 | |
| | | | | | | | | | | | |
| | | | |
| Capital Markets: 0.48% | | | | | | | | | | | | |
Safeguard Scientifics Incorporated † | | | | | | | 27,100 | | | | 498,640 | |
| | | | | | | | | | | | |
| | | | |
| Consumer Finance: 0.51% | | | | | | | | | | | | |
Cash America International Incorporated | | | | | | | 12,000 | | | | 525,600 | |
| | | | | | | | | | | | |
| | | | |
| Insurance: 1.79% | | | | | | | | | | | | |
Argo Group International Holdings Limited | | | | | | | 7,400 | | | | 372,294 | |
First Acceptance Corporation † | | | | | | | 157,000 | | | | 390,930 | |
Health Insurance Innovations Incorporated Class A † | | | | | | | 63,300 | | | | 683,007 | |
Hilltop Holdings Incorporated † | | | | | | | 19,900 | | | | 398,995 | |
| | | | |
| | | | | | | | | | | 1,845,226 | |
| | | | | | | | | | | | |
| | | | |
| REITs: 8.93% | | | | | | | | | | | | |
Chimera Investment Corporation | | | | | | | 1,052,200 | | | | 3,198,688 | |
MFA Mortgage Investments Incorporated | | | | | | | 52,700 | | | | 410,006 | |
Origen Financial Incorporated | | | | | | | 485,600 | | | | 815,808 | |
Redwood Trust Incorporated | | | | | | | 76,700 | | | | 1,271,686 | |
Sun Communities Incorporated | | | | | | | 7,800 | | | | 393,900 | |
UMH Properties Incorporated | | | | | | | 329,000 | | | | 3,125,500 | |
| | | | |
| | | | | | | | | | | 9,215,588 | |
| | | | | | | | | | | | |
| | | | |
| Thrifts & Mortgage Finance: 0.52% | | | | | | | | | | | | |
Northwest Bancshares Incorporated | | | | | | | 44,200 | | | | 534,820 | |
| | | | | | | | | | | | |
The accompanying notes are an integral part of these financial statements.
| | | | | | |
| Portfolio of investments—September 30, 2014 (unaudited) | | Wells Fargo Advantage Small/Mid Cap Value Fund | | | 9 | |
| | | | | | | | | | | | |
| Security name | | | | | | Shares | | | Value | |
| | | | | | | | | | | | |
| | | | |
Health Care: 4.87% | | | | | | | | | | | | |
| | | | |
| Health Care Equipment & Supplies: 1.80% | | | | | | | | | | | | |
Allied Healthcare Products Incorporated † | | | | | | | 174,000 | | | $ | 348,000 | |
EnteroMedics Incorporated † | | | | | | | 780,600 | | | | 960,138 | |
OraSure Technologies Incorporated † | | | | | | | 28,190 | | | | 203,532 | |
Stryker Corporation | | | | | | | 4,290 | | | | 346,418 | |
| | | | |
| | | | | | | | | | | 1,858,088 | |
| | | | | | | | | | | | |
| | | | |
| Health Care Providers & Services: 0.96% | | | | | | | | | | | | |
Cross Country Healthcare Incorporated † | | | | | | | 107,200 | | | | 995,888 | |
| | | | | | | | | | | | |
| | | | |
| Health Care Technology: 2.11% | | | | | | | | | | | | |
Allscripts Healthcare Solutions Incorporated † | | | | | | | 42,200 | | | | 566,113 | |
Merge Healthcare Incorporated † | | | | | | | 337,100 | | | | 741,620 | |
Omnicell Incorporated † | | | | | | | 31,800 | | | | 869,094 | |
| | | | |
| | | | | | | | | | | 2,176,827 | |
| | | | | | | | | | | | |
| | | | |
Industrials: 17.69% | | | | | | | | | | | | |
| | | | |
| Aerospace & Defense: 1.01% | | | | | | | | | | | | |
Orbital Sciences Corporation † | | | | | | | 37,500 | | | | 1,042,500 | |
| | | | | | | | | | | | |
| | | | |
| Airlines: 3.81% | | | | | | | | | | | | |
American Airlines Group Incorporated | | | | | | | 33,900 | | | | 1,202,772 | |
JetBlue Airways Corporation † | | | | | | | 103,500 | | | | 1,099,170 | |
LATAM Airlines Group SP ADR | | | | | | | 78,492 | | | | 892,454 | |
United Continental Holdings Incorporated † | | | | | | | 15,800 | | | | 739,282 | |
| | | | |
| | | | | | | | | | | 3,933,678 | |
| | | | | | | | | | | | |
| | | | |
| Building Products: 1.06% | | | | | | | | | | | | |
Patrick Industries Incorporated † | | | | | | | 25,850 | | | | 1,095,006 | |
| | | | | | | | | | | | |
| | | | |
| Commercial Services & Supplies: 2.46% | | | | | | | | | | | | |
ABM Industries Incorporated | | | | | | | 43,000 | | | | 1,104,670 | |
ACCO Brands Corporation † | | | | | | | 85,200 | | | | 587,880 | |
Cintas Corporation | | | | | | | 5,600 | | | | 395,304 | |
Healthcare Services Group Incorporated | | | | | | | 15,700 | | | | 449,177 | |
| | | | |
| | | | | | | | | | | 2,537,031 | |
| | | | | | | | | | | | |
| | | | |
| Construction & Engineering: 4.13% | | | | | | | | | | | | |
Integrated Electrical Services Incorporated † | | | | | | | 327,800 | | | | 2,704,350 | |
MYR Group Incorporated † | | | | | | | 23,900 | | | | 575,512 | |
Sterling Construction Company Incorporated † | | | | | | | 128,000 | | | | 981,760 | |
| | | | |
| | | | | | | | | | | 4,261,622 | |
| | | | | | | | | | | | |
| | | | |
| Electrical Equipment: 0.43% | | | | | | | | | | | | |
GrafTech International Limited † | | | | | | | 97,200 | | | | 445,176 | |
| | | | | | | | | | | | |
The accompanying notes are an integral part of these financial statements.
| | | | |
| 10 | | Wells Fargo Advantage Small/Mid Cap Value Fund | | Portfolio of investments—September 30, 2014 (unaudited) |
| | | | | | | | | | | | |
| Security name | | | | | | Shares | | | Value | |
| | | | | | | | | | | | |
| | | | |
| Machinery: 3.29% | | | | | | | | | | | | |
Actuant Corporation Class A | | | | | | | 38,800 | | | $ | 1,184,176 | |
Kennametal Incorporated | | | | | | | 33,100 | | | | 1,367,361 | |
Xylem Incorporated | | | | | | | 23,655 | | | | 839,516 | |
| | | | |
| | | | | | | | | | | 3,391,053 | |
| | | | | | | | | | | | |
| | | | |
| Professional Services: 0.54% | | | | | | | | | | | | |
Hill International Incorporated † | | | | | | | 139,800 | | | | 559,200 | |
| | | | | | | | | | | | |
| | | | |
| Trading Companies & Distributors: 0.96% | | | | | | | | | | | | |
Applied Industrial Technologies Incorporated | | | | | | | 21,700 | | | | 990,605 | |
| | | | | | | | | | | | |
| | | | |
Information Technology: 6.17% | | | | | | | | | | | | |
| | | | |
| Communications Equipment: 2.83% | | | | | | | | | | | | |
Applied Optoelectronics Incorporated † | | | | | | | 56,900 | | | | 916,090 | |
Brocade Communications Systems Incorporated | | | | | | | 18,900 | | | | 205,443 | |
Sandvine Corporation † | | | | | | | 734,600 | | | | 1,796,832 | |
| | | | |
| | | | | | | | | | | 2,918,365 | |
| | | | | | | | | | | | |
| | | | |
| Electronic Equipment, Instruments & Components: 0.83% | | | | | | | | | | | | |
Knowles Corporation † | | | | | | | 32,300 | | | | 855,950 | |
| | | | | | | | | | | | |
| | | | |
| Semiconductors & Semiconductor Equipment: 0.59% | | | | | | | | | | | | |
FormFactor Incorporated † | | | | | | | 85,600 | | | | 613,752 | |
| | | | | | | | | | | | |
| | | | |
| Technology Hardware, Storage & Peripherals: 1.92% | | | | | | | | | | | | |
Cray Incorporated † | | | | | | | 75,600 | | | | 1,983,744 | |
| | | | | | | | | | | | |
| | | | |
Materials: 11.90% | | | | | | | | | | | | |
| | | | |
| Containers & Packaging: 0.20% | | | | | | | | | | | | |
Intertape Polymer Group Incorporated | | | | | | | 14,400 | | | | 208,800 | |
| | | | | | | | | | | | |
| | | | |
| Metals & Mining: 11.70% | | | | | | | | | | | | |
Agnico-Eagle Mines Limited | | | | | | | 17,600 | | | | 510,928 | |
Endeavour Mining Corporation † | | | | | | | 1,534,600 | | | | 918,061 | |
Goldcorp Incorporated | | | | | | | 20,100 | | | | 462,903 | |
Goldgroup Mining Incorporated † | | | | | | | 379,600 | | | | 61,010 | |
Goldgroup Mining Incorporated - Legend Shares † | | | | | | | 1,041,000 | | | | 167,311 | |
Lucara Diamond Corporation | | | | | | | 466,900 | | | | 915,124 | |
McEwen Mining Incorporated † | | | | | | | 396,000 | | | | 776,160 | |
Newmont Mining Corporation | | | | | | | 14,100 | | | | 325,005 | |
Randgold Resources Limited ADR | | | | | | | 58,400 | | | | 3,947,256 | |
Rockwell Diamonds Incorporated †(a) | | | | | | | 728,200 | | | | 221,081 | |
Rockwell Diamonds Incorporated - Legend Shares †(i) | | | | | | | 1,172,000 | | | | 355,801 | |
Royal Gold Incorporated | | | | | | | 14,500 | | | | 941,630 | |
Sandstorm Gold Limited † | | | | | | | 398,700 | | | | 1,714,410 | |
Silver Wheaton Corporation-U.S. Exchange Traded Shares | | | | | | | 37,900 | | | | 755,343 | |
| | | | |
| | | | | | | | | | | 12,072,023 | |
| | | | | | | | | | | | |
The accompanying notes are an integral part of these financial statements.
| | | | | | |
| Portfolio of investments—September 30, 2014 (unaudited) | | Wells Fargo Advantage Small/Mid Cap Value Fund | | | 11 | |
| | | | | | | | | | | | | | | | |
| Security name | | | | | | | | Shares | | | Value | |
| | | | | | | | | | | | | | | | |
| | | | |
Telecommunication Services: 0.91% | | | | | | | | | | | | | | | | |
| | | | |
| Diversified Telecommunication Services: 0.91% | | | | | | | | | | | | | | | | |
Cincinnati Bell Incorporated † | | | | | | | | | | | 279,400 | | | $ | 941,578 | |
| | | | | | | | | | | | | | | | |
| | | | |
Total Common Stocks (Cost $75,321,015) | | | | | | | | | | | | | | | 100,181,459 | |
| | | | | | | | | | | | | | | | |
| | | | |
Exchange-Traded Funds: 0.99% | | | | | | | | | | | | | | | | |
Market Vectors Junior Gold Miners ETF | | | | | | | | | | | | | | | 1,022,351 | |
| | | | | | | | | | | | | | | | |
| | | | |
Total Exchange-Traded Funds (Cost $1,548,055) | | | | | | | | | | | | | | | 1,022,351 | |
| | | | | | | | | | | | | | | | |
| | | | |
| | | | | | Expiration date | | | | | | | |
| | | | |
Warrants: 0.21% | | | | | | | | | | | | | | | | |
| | | | |
Health Care: 0.21% | | | | | | | | | | | | | | | | |
| | | | |
| Health Care Equipment & Supplies: 0.21% | | | | | | | | | | | | | | | | |
EnteroMedics Incorporated †(a)(i) | | | | | | | 5-14-2016 | | | | 270,908 | | | | 183,964 | |
EnteroMedics Incorporated †(a)(i) | | | | | | | 9-28-2016 | | | | 13,680 | | | | 10,727 | |
EnteroMedics Incorporated †(a)(i) | | | | | | | 2-27-2018 | | | | 48,280 | | | | 19,244 | |
| | | | |
Total Warrants (Cost $0) | | | | | | | | | | | | | | | 213,935 | |
| | | | | | | | | | | | | | | | |
| | | | |
| | | Yield | | | | | | | | | | |
| Short-Term Investments: 1.74% | | | | | | | | | | | | | | | | |
| | | | |
| Investment Companies: 1.74% | | | | | | | | | | | | | | | | |
Wells Fargo Advantage Cash Investment Money Market Fund, Select
Class (l)(u) | | | 0.07 | % | | | | | | | 1,796,614 | | | | 1,796,614 | |
| | | | | | | | | | | | | | | | |
| | | | |
Total Short-Term Investments (Cost $1,796,614) | | | | | | | | | | | | | | | 1,796,614 | |
| | | | | | | | | | | | | | | | |
| | | | | | | | |
| Total investments in securities | | | | | | | | |
| (Cost $78,665,684) * | | | 100.00 | % | | | 103,214,359 | |
Other assets and liabilities, net | | | 0.00 | | | | (1,267 | ) |
| | | | | | | | |
| Total net assets | | | 100.00 | % | | $ | 103,213,092 | |
| | | | | | | | |
| † | Non-income-earning security |
| (a) | The security is fair valued by the Management Valuation Team, and in certain instances by the Board of Trustees, in accordance with procedures approved by the Board of Trustees. |
| (l) | The security represents an affiliate of the Fund as defined in the Investment Company Act of 1940. |
| (u) | The rate represents the 7-day annualized yield at period end. |
| * | Cost for federal income tax purposes is $82,914,312 and unrealized gains (losses) consists of: |
| | | | |
Gross unrealized gains | | $ | 33,759,907 | |
Gross unrealized losses | | | (13,459,860 | ) |
| | | | |
Net unrealized gains | | $ | 20,300,047 | |
The accompanying notes are an integral part of these financial statements.
| | | | |
| 12 | | Wells Fargo Advantage Small/Mid Cap Value Fund | | Statement of assets and liabilities—September 30, 2014 (unaudited) |
| | | | |
| | | | |
| |
Assets | | | | |
Investments | | | | |
In unaffiliated securities, at value (cost $76,869,070) | | $ | 101,417,745 | |
In affiliated securities, at value (cost $1,796,614) | | | 1,796,614 | |
| | | | |
Total investments, at value (cost $78,665,684) | | | 103,214,359 | |
Receivable for Fund shares sold | | | 69,499 | |
Receivable for dividends | | | 182,571 | |
Prepaid expenses and other assets | | | 18,518 | |
| | | | |
Total assets | | | 103,484,947 | |
| | | | |
| |
Liabilities | | | | |
Payable for Fund shares redeemed | | | 125,580 | |
Advisory fee payable | | | 59,244 | |
Distribution fees payable | | | 5,353 | |
Administration fees payable | | | 27,700 | |
Shareholder report expenses payable | | | 19,571 | |
Shareholder servicing fees payable | | | 19,971 | |
Professional fees payable | | | 14,436 | |
| | | | |
Total liabilities | | | 271,855 | |
| | | | |
Total net assets | | $ | 103,213,092 | |
| | | | |
| |
NET ASSETS CONSIST OF | | | | |
Paid-in capital | | $ | 63,266,762 | |
Accumulated net investment loss | | | (205,804 | ) |
Accumulated net realized gains on investments | | | 15,603,621 | |
Net unrealized gains on investments | | | 24,548,513 | |
| | | | |
Total net assets | | $ | 103,213,092 | |
| | | | |
| |
COMPUTATION OF NET ASSET VALUE AND OFFERING PRICE PER SHARE | | | | |
Net assets – Class A | | $ | 18,878,162 | |
Shares outstanding – Class A1 | | | 1,137,708 | |
Net asset value per share – Class A | | | $16.59 | |
Maximum offering price per share – Class A2 | | | $17.60 | |
Net assets – Class C | | $ | 8,071,637 | |
Shares outstanding – Class C1 | | | 503,417 | |
Net asset value per share – Class C | | | $16.03 | |
Net assets – Administrator Class | | $ | 10,313,182 | |
Shares outstanding – Administrator Class1 | | | 608,629 | |
Net asset value per share – Administrator Class | | | $16.94 | |
Net assets – Institutional Class | | $ | 13,366,048 | |
Shares outstanding – Institutional Class1 | | | 784,891 | |
Net asset value per share – Institutional Class | | | $17.03 | |
Net assets – Investor Class | | $ | 52,584,063 | |
Shares outstanding – Investor Class1 | | | 3,158,970 | |
Net asset value per share – Investor Class | | | $16.65 | |
| 1. | The Fund has an unlimited number of authorized shares. |
| 2. | Maximum offering price is computed as 100/94.25 of net asset value. On investments of $50,000 or more, the offering price is reduced. |
The accompanying notes are an integral part of these financial statements.
| | | | | | |
| Statement of operations—six months ended September 30, 2014 (unaudited) | | Wells Fargo Advantage Small/Mid Cap Value Fund | | | 13 | |
| | | | |
| | | | |
| |
Investment income | | | | |
Dividends (net of foreign withholding taxes of $12,506) | | $ | 713,305 | |
Income from affiliated securities | | | 1,662 | |
| | | | |
Total investment income | | | 714,967 | |
| | | | |
| |
Expenses | | | | |
Advisory fee | | | 465,128 | |
Administration fees | | | | |
Fund level | | | 31,009 | |
Class A | | | 27,000 | |
Class C | | | 12,413 | |
Administrator Class | | | 7,864 | |
Institutional Class | | | 6,462 | |
Investor Class | | | 98,934 | |
Shareholder servicing fees | | | | |
Class A | | | 25,961 | |
Class C | | | 11,936 | |
Administrator Class | | | 17,390 | |
Investor Class | | | 77,292 | |
Distribution fees | | | | |
Class C | | | 35,808 | |
Custody and accounting fees | | | 11,862 | |
Professional fees | | | 20,961 | |
Registration fees | | | 19,107 | |
Shareholder report expenses | | | 19,134 | |
Trustees’ fees and expenses | | | 6,136 | |
Other fees and expenses | | | 4,792 | |
| | | | |
Total expenses | | | 899,189 | |
Less: Fee waivers and/or expense reimbursements | | | (56,309 | ) |
| | | | |
Net expenses | | | 842,880 | |
| | | | |
Net investment loss | | | (127,913 | ) |
| | | | |
| |
REALIZED AND UNREALIZED GAINS (LOSSES) ON INVESTMENTS | | | | |
Net realized gains on investments | | | 7,494,864 | |
Net change in unrealized gains (losses) on investments | | | (20,643,818 | ) |
| | | | |
Net realized and unrealized gains (losses) on investments | | | (13,148,954 | ) |
| | | | |
Net decrease in net assets resulting from operations | | $ | (13,276,867 | ) |
| | | | |
The accompanying notes are an integral part of these financial statements.
| | | | |
| 14 | | Wells Fargo Advantage Small/Mid Cap Value Fund | | Statement of changes in net assets |
| | | | | | | | | | | | | | | | | | | | | | | | |
| | | Six months ended
September 30, 2014
(unaudited) | | | Year ended
March 31, 20141 | | | Year ended
October 31, 2013 | |
| | | | | | |
Operations | | | | | | | | | | | | | | | | | | | | | | | | |
Net investment income (loss) | | | | | | $ | (127,913 | ) | | | | | | $ | 695,353 | | | | | | | $ | 1,561,781 | |
Net realized gains on investments | | | | | | | 7,494,864 | | | | | | | | 14,263,056 | | | | | | | | 16,068,123 | |
Net change in unrealized gains (losses) on investments | | | | | | | (20,643,818 | ) | | | | | | | 467,931 | | | | | | | | (856,695 | ) |
| | | | |
Net increase (decrease) in net assets resulting from operations | | | | | | | (13,276,867 | ) | | | | | | | 15,426,340 | | | | | | | | 16,773,209 | |
| | | | |
| | | | | | |
Distributions to shareholders from | | | | | | | | | | | | | | | | | | | | | | | | |
Net investment income | | | | | | | | | | | | | | | | | | | | | | | | |
Class A | | | | | | | 0 | | | | | | | | 0 | | | | | | | | (56,717 | ) |
Administrator Class | | | | | | | 0 | | | | | | | | 0 | | | | | | | | (348,871 | ) |
Institutional Class | | | | | | | 0 | | | | | | | | (39,045 | ) | | | | | | | (341,385 | ) |
Investor Class | | | | | | | 0 | | | | | | | | 0 | | | | | | | | (118,474 | ) |
Net realized gains | | | | | | | | | | | | | | | | | | | | | | | | |
Class A | | | | | | | 0 | | | | | | | | (1,137,403 | ) | | | | | | | 0 | |
Class C | | | | | | | 0 | | | | | | | | (558,614 | ) | | | | | | | 0 | |
Administrator Class | | | | | | | 0 | | | | | | | | (1,405,284 | ) | | | | | | | 0 | |
Institutional Class | | | | | | | 0 | | | | | | | | (1,503,812 | ) | | | | | | | 0 | |
Investor Class | | | | | | | 0 | | | | | | | | (3,359,903 | ) | | | | | | | 0 | |
| | | | |
Total distributions to shareholders | | | | | | | 0 | | | | | | | | (8,004,061 | ) | | | | | | | (865,447 | ) |
| | | | |
| | | | | | |
Capital share transactions | | | Shares | | | | | | | | Shares | | | | | | | | Shares | | | | | |
Proceeds from shares sold | | | | | | | | | | | | | | | | | | | | | | | | |
Class A | | | 204,214 | | | | 3,813,533 | | | | 78,895 | | | | 1,426,324 | | | | 165,268 | | | | 2,670,801 | |
Class C | | | 37,179 | | | | 665,920 | | | | 32,724 | | | | 555,678 | | | | 25,320 | | | | 393,121 | |
Administrator Class | | | 79,973 | | | | 1,509,522 | | | | 130,377 | | | | 2,382,443 | | | | 231,414 | | | | 3,811,984 | |
Institutional Class | | | 205,680 | | | | 3,878,219 | | | | 81,213 | | | | 1,482,194 | | | | 500,832 | | | | 8,390,532 | |
Investor Class | | | 452,165 | | | | 8,433,842 | | | | 320,885 | | | | 5,817,381 | | | | 256,603 | | | | 4,200,775 | |
| | | | |
| | | | | | | 18,301,036 | | | | | | | | 11,664,020 | | | | | | | | 19,467,213 | |
| | | | |
Reinvestment of distributions | | | | | | | | | | | | | | | | | | | | | | | | |
Class A | | | 0 | | | | 0 | | | | 68,382 | | | | 1,125,557 | | | | 3,589 | | | | 56,210 | |
Class C | | | 0 | | | | 0 | | | | 17,528 | | | | 280,448 | | | | 0 | | | | 0 | |
Administrator Class | | | 0 | | | | 0 | | | | 71,418 | | | | 1,198,402 | | | | 18,851 | | | | 299,730 | |
Institutional Class | | | 0 | | | | 0 | | | | 70,094 | | | | 1,181,411 | | | | 15,067 | | | | 240,314 | |
Investor Class | | | 0 | | | | 0 | | | | 201,849 | | | | 3,334,617 | | | | 7,332 | | | | 115,265 | |
| | | | |
| | | | | | | 0 | | | | | | | | 7,120,435 | | | | | | | | 711,519 | |
| | | | |
Payment for shares redeemed | | | | | | | | | | | | | | | | | | | | | | | | |
Class A | | | (172,274 | ) | | | (3,155,645 | ) | | | (154,882 | ) | | | (2,713,866 | ) | | | (639,750 | ) | | | (10,474,973 | ) |
Class C | | | (87,168 | ) | | | (1,551,600 | ) | | | (39,964 | ) | | | (683,596 | ) | | | (161,773 | ) | | | (2,575,500 | ) |
Administrator Class | | | (705,126 | ) | | | (13,115,888 | ) | | | (310,378 | ) | | | (5,731,909 | ) | | | (3,091,439 | ) | | | (53,413,442 | ) |
Institutional Class | | | (198,680 | ) | | | (3,724,256 | ) | | | (1,459,755 | ) | | | (26,478,454 | ) | | | (1,315,581 | ) | | | (22,432,272 | ) |
Investor Class | | | (686,424 | ) | | | (12,580,860 | ) | | | (381,503 | ) | | | (6,710,559 | ) | | | (1,519,804 | ) | | | (24,868,259 | ) |
| | | | |
| | | | | | | (34,128,249 | ) | | | | | | | (42,318,384 | ) | | | | | | | (113,764,446 | ) |
| | | | |
Net decrease in net assets resulting from capital share transactions | | | | | | | (15,827,213 | ) | | | | | | | (23,533,929 | ) | | | | | | | (93,585,714 | ) |
| | | | |
Total decrease in net assets | | | | | | | (29,104,080 | ) | | | | | | | (16,111,650 | ) | | | | | | | (77,677,952 | ) |
| | | | |
| | | | | | |
Net assets | | | | | | | | | | | | | | | | | | | | | | | | |
Beginning of period | | | | | | | 132,317,172 | | | | | | | | 148,428,822 | | | | | | | | 226,106,774 | |
| | | | |
End of period | | | | | | $ | 103,213,092 | | | | | | | $ | 132,317,172 | | | | | | | $ | 148,428,822 | |
| | | | |
Undistributed/(overdistributed)/(accumulated) net investment income (loss) | | | | | | $ | (205,804 | ) | | | | | | $ | (77,891 | ) | | | | | | $ | 41,791 | |
| | | | |
| 1. | For the five months ended March 31, 2014. The Fund changed its fiscal year end from October 31 to March 31, effective March 31, 2014. |
The accompanying notes are an integral part of these financial statements.
| | | | | | |
| Financial highlights | | Wells Fargo Advantage Small/Mid Cap Value Fund | | | 15 | |
(For a share outstanding throughout each period)
| | | | | | | | | | | | | | | | | | | | | | | | | | | | |
| | | Six months ended
September 30, 2014
(unaudited) | | | Year ended
March 31, 20141 | | | Year ended October 31 | |
| CLASS A | | | | 2013 | | | 2012 | | | 2011 | | | 2010 | | | 2009 | |
Net asset value, beginning of period | | $ | 18.63 | | | $ | 17.66 | | | $ | 16.17 | | | $ | 14.61 | | | $ | 14.33 | | | $ | 11.78 | | | $ | 8.78 | |
Net investment income (loss) | | | (0.02 | ) | | | 0.09 | 2 | | | 0.11 | 2 | | | 0.07 | | | | 0.06 | | | | 0.08 | | | | 0.11 | 2 |
Net realized and unrealized gains (losses) on investments | | | (2.02 | ) | | | 1.93 | | | | 1.42 | | | | 1.55 | | | | 0.35 | | | | 2.56 | | | | 2.89 | |
| | | | | | | | | | | | | | | | | | | | | | | | | | | | |
Total from investment operations | | | (2.04 | ) | | | 2.02 | | | | 1.53 | | | | 1.62 | | | | 0.41 | | | | 2.64 | | | | 3.00 | |
Distributions to shareholders from | | | | | | | | | | | | | | | | | | | | | | | | | | | | |
Net investment income | | | 0.00 | | | | 0.00 | | | | (0.04 | ) | | | (0.06 | ) | | | (0.13 | ) | | | (0.09 | ) | | | 0.00 | |
Net realized gains | | | 0.00 | | | | (1.05 | ) | | | 0.00 | | | | 0.00 | | | | 0.00 | | | | 0.00 | | | | 0.00 | |
| | | | | | | | | | | | | | | | | | | | | | | | | | | | |
Total distributions to shareholders | | | 0.00 | | | | (1.05 | ) | | | (0.04 | ) | | | (0.06 | ) | | | (0.13 | ) | | | (0.09 | ) | | | 0.00 | |
Net asset value, end of period | | $ | 16.59 | | | $ | 18.63 | | | $ | 17.66 | | | $ | 16.17 | | | $ | 14.61 | | | $ | 14.33 | | | $ | 11.78 | |
Total return3 | | | (10.95 | )% | | | 12.22 | % | | | 9.47 | % | | | 11.13 | % | | | 2.76 | % | | | 22.63 | % | | | 34.17 | % |
Ratios to average net assets (annualized) | | | | | | | | | | | | | | | | | | | | | | | | | | | | |
Gross expenses | | | 1.44 | % | | | 1.57 | % | | | 1.41 | % | | | 1.41 | % | | | 1.40 | % | | | 1.47 | % | | | 1.57 | % |
Net expenses | | | 1.35 | % | | | 1.39 | % | | | 1.40 | % | | | 1.40 | % | | | 1.40 | % | | | 1.40 | % | | | 1.40 | % |
Net investment income (loss) | | | (0.17 | )% | | | 1.20 | % | | | 0.68 | % | | | 0.37 | % | | | 0.37 | % | | | 0.77 | % | | | 1.12 | % |
Supplemental data | | | | | | | | | | | | | | | | | | | | | | | | | | | | |
Portfolio turnover rate | | | 25 | % | | | 24 | % | | | 29 | % | | | 32 | % | | | 34 | % | | | 41 | % | | | 35 | % |
Net assets, end of period (000s omitted) | | | $18,878 | | | | $20,599 | | | | $19,659 | | | | $25,612 | | | | $34,642 | | | | $41,491 | | | | $27,370 | |
| 1. | For the five months ended March 31, 2014. The Fund changed its fiscal year end from October 31 to March 31, effective March 31, 2014. |
| 2. | Calculated based upon average shares outstanding |
| 3. | Total return calculations do not include any sales charges. Returns for periods of less than one year are not annualized. |
The accompanying notes are an integral part of these financial statements.
| | | | |
| 16 | | Wells Fargo Advantage Small/Mid Cap Value Fund | | Financial highlights |
(For a share outstanding throughout each period)
| | | | | | | | | | | | | | | | | | | | | | | | | | | | |
| | | Six months ended
September 30, 2014
(unaudited) | | | Year ended
March 31, 20141 | | | Year ended October 31 | |
| CLASS C | | | | 2013 | | | 2012 | | | 2011 | | | 2010 | | | 2009 | |
Net asset value, beginning of period | | $ | 18.07 | | | $ | 17.21 | | | $ | 15.84 | | | $ | 14.36 | | | $ | 14.10 | | | $ | 11.62 | | | $ | 8.72 | |
Net investment income (loss) | | | (0.08 | )2 | | | 0.03 | 2 | | | (0.01 | )2 | | | (0.08 | ) | | | (0.06 | ) | | | 0.00 | 3 | | | 0.04 | 2 |
Net realized and unrealized gains (losses) on investments | | | (1.96 | ) | | | 1.88 | | | | 1.38 | | | | 1.56 | | | | 0.35 | | | | 2.51 | | | | 2.86 | |
| | | | | | | | | | | | | | | | | | | | | | | | | | | | |
Total from investment operations | | | (2.04 | ) | | | 1.91 | | | | 1.37 | | | | 1.48 | | | | 0.29 | | | | 2.51 | | | | 2.90 | |
Distributions to shareholders from | | | | | | | | | | | | | | | | | | | | | | | | | | | | |
Net investment income | | | 0.00 | | | | 0.00 | | | | 0.00 | | | | 0.00 | | | | (0.03 | ) | | | (0.03 | ) | | | 0.00 | |
Net realized gains | | | 0.00 | | | | (1.05 | ) | | | 0.00 | | | | 0.00 | | | | 0.00 | | | | 0.00 | | | | 0.00 | |
| | | | | | | | | | | | | | | | | | | | | | | | | | | | |
Total distributions to shareholders | | | 0.00 | | | | (1.05 | ) | | | 0.00 | | | | 0.00 | | | | (0.03 | ) | | | (0.03 | ) | | | 0.00 | |
Net asset value, end of period | | $ | 16.03 | | | $ | 18.07 | | | $ | 17.21 | | | $ | 15.84 | | | $ | 14.36 | | | $ | 14.10 | | | $ | 11.62 | |
Total return4 | | | (11.29 | )% | | | 11.88 | % | | | 8.65 | % | | | 10.31 | % | | | 2.05 | % | | | 21.62 | % | | | 33.26 | % |
Ratios to average net assets (annualized) | | | | | | | | | | | | | | | | | | | | | | | | | | | | |
Gross expenses | | | 2.19 | % | | | 2.32 | % | | | 2.17 | % | | | 2.16 | % | | | 2.15 | % | | | 2.22 | % | | | 2.26 | % |
Net expenses | | | 2.10 | % | | | 2.14 | % | | | 2.15 | % | | | 2.15 | % | | | 2.15 | % | | | 2.15 | % | | | 2.11 | % |
Net investment income (loss) | | | (0.94 | )% | | | 0.46 | % | | | (0.07 | )% | | | (0.40 | )% | | | (0.38 | )% | | | 0.00 | % | | | 0.40 | % |
Supplemental data | | | | | | | | | | | | | | | | | | | | | | | | | | | | |
Portfolio turnover rate | | | 25 | % | | | 24 | % | | | 29 | % | | | 32 | % | | | 34 | % | | | 41 | % | | | 35 | % |
Net assets, end of period (000s omitted) | | | $8,072 | | | | $9,999 | | | | $9,347 | | | | $10,763 | | | | $12,204 | | | | $12,379 | | | | $9,052 | |
| 1. | For the five months ended March 31, 2014. The Fund changed its fiscal year end from October 31 to March 31, effective March 31, 2014. |
| 2. | Calculated based upon average shares outstanding |
| 3. | Amount is less than $0.005. |
| 4. | Total return calculations do not include any sales charges. Returns for periods of less than one year are not annualized. |
The accompanying notes are an integral part of these financial statements.
| | | | | | |
| Financial highlights | | Wells Fargo Advantage Small/Mid Cap Value Fund | | | 17 | |
(For a share outstanding throughout each period)
| | | | | | | | | | | | | | | | | | | | | | | | | | | | |
| | | Six months ended
September 30, 2014
(unaudited) | | | Year ended
March 31, 20141 | | | Year ended October 31 | |
| ADMINISTRATOR CLASS | | | | 2013 | | | 2012 | | | 2011 | | | 2010 | | | 2009 | |
Net asset value, beginning of period | | $ | 19.00 | | | $ | 17.97 | | | $ | 16.46 | | | $ | 14.89 | | | $ | 14.60 | | | $ | 11.99 | | | $ | 8.92 | |
Net investment income (loss) | | | (0.01 | )2 | | | 0.11 | 2 | | | 0.15 | 2 | | | 0.10 | | | | 0.09 | | | | 0.13 | | | | 0.13 | 2 |
Net realized and unrealized gains (losses) on investments | | | (2.05 | ) | | | 1.97 | | | | 1.44 | | | | 1.58 | | | | 0.36 | | | | 2.59 | | | | 2.94 | |
| | | | | | | | | | | | | | | | | | | | | | | | | | | | |
Total from investment operations | | | (2.06 | ) | | | 2.08 | | | | 1.59 | | | | 1.68 | | | | 0.45 | | | | 2.72 | | | | 3.07 | |
Distributions to shareholders from | | | | | | | | | | | | | | | | | | | | | | | | | | | | |
Net investment income | | | 0.00 | | | | 0.00 | | | | (0.08 | ) | | | (0.11 | ) | | | (0.16 | ) | | | (0.11 | ) | | | 0.00 | |
Net realized gains | | | 0.00 | | | | (1.05 | ) | | | 0.00 | | | | 0.00 | | | | 0.00 | | | | 0.00 | | | | 0.00 | |
| | | | | | | | | | | | | | | | | | | | | | | | | | | | |
Total distributions to shareholders | | | 0.00 | | | | (1.05 | ) | | | (0.08 | ) | | | (0.11 | ) | | | (0.16 | ) | | | (0.11 | ) | | | 0.00 | |
Net asset value, end of period | | $ | 16.94 | | | $ | 19.00 | | | $ | 17.97 | | | $ | 16.46 | | | $ | 14.89 | | | $ | 14.60 | | | $ | 11.99 | |
Total return3 | | | (10.84 | )% | | | 12.34 | % | | | 9.75 | % | | | 11.33 | % | | | 3.13 | % | | | 22.82 | % | | | 34.42 | % |
Ratios to average net assets (annualized) | | | | | | | | | | | | | | | | | | | | | | | | | | | | |
Gross expenses | | | 1.25 | % | | | 1.39 | % | | | 1.24 | % | | | 1.24 | % | | | 1.24 | % | | | 1.29 | % | | | 1.39 | % |
Net expenses | | | 1.14 | % | | | 1.15 | % | | | 1.15 | % | | | 1.15 | % | | | 1.15 | % | | | 1.15 | % | | | 1.15 | % |
Net investment income (loss) | | | (0.08 | )% | | | 1.44 | % | | | 0.91 | % | | | 0.59 | % | | | 0.61 | % | | | 1.00 | % | | | 1.34 | % |
Supplemental data | | | | | | | | | | | | | | | | | | | | | | | | | | | | |
Portfolio turnover rate | | | 25 | % | | | 24 | % | | | 29 | % | | | 32 | % | | | 34 | % | | | 41 | % | | | 35 | % |
Net assets, end of period (000s omitted) | | | $10,313 | | | | $23,445 | | | | $24,127 | | | | $68,857 | | | | $76,668 | | | | $71,246 | | | | $55,463 | |
| 1. | For the five months ended March 31, 2014. The Fund changed its fiscal year end from October 31 to March 31, effective March 31, 2014. |
| 2. | Calculated based upon average shares outstanding |
| 3. | Returns for periods of less than one year are not annualized. |
The accompanying notes are an integral part of these financial statements.
| | | | |
| 18 | | Wells Fargo Advantage Small/Mid Cap Value Fund | | Financial highlights |
(For a share outstanding throughout each period)
| | | | | | | | | | | | | | | | | | | | | | | | | | | | |
| | | Six months ended
September 30, 2014
(unaudited) | | | Year ended
March 31, 20141 | | | Year ended October 31 | |
| INSTITUTIONAL CLASS | | | | 2013 | | | 2012 | | | 2011 | | | 2010 | | | 2009 | |
Net asset value, beginning of period | | $ | 19.08 | | | $ | 18.06 | | | $ | 16.54 | | | $ | 14.97 | | | $ | 14.67 | | | $ | 12.04 | | | $ | 8.93 | |
Net investment income | | | 0.02 | | | | 0.12 | 2 | | | 0.18 | 2 | | | 0.11 | | | | 0.11 | | | | 0.17 | 2 | | | 0.15 | 2 |
Net realized and unrealized gains (losses) on investments | | | (2.07 | ) | | | 1.98 | | | | 1.46 | | | | 1.60 | | | | 0.38 | | | | 2.59 | | | | 2.96 | |
| | | | | | | | | | | | | | | | | | | | | | | | | | | | |
Total from investment operations | | | (2.05 | ) | | | 2.10 | | | | 1.64 | | | | 1.71 | | | | 0.49 | | | | 2.76 | | | | 3.11 | |
Distributions to shareholders from | | | | | | | | | | | | | | | | | | | | | | | | | | | | |
Net investment income | | | 0.00 | | | | (0.03 | ) | | | (0.12 | ) | | | (0.14 | ) | | | (0.19 | ) | | | (0.13 | ) | | | 0.00 | |
Net realized gains | | | 0.00 | | | | (1.05 | ) | | | 0.00 | | | | 0.00 | | | | 0.00 | | | | 0.00 | | | | 0.00 | |
| | | | | | | | | | | | | | | | | | | | | | | | | | | | |
Total distributions to shareholders | | | 0.00 | | | | (1.08 | ) | | | (0.12 | ) | | | (0.14 | ) | | | (0.19 | ) | | | (0.13 | ) | | | 0.00 | |
Net asset value, end of period | | $ | 17.03 | | | $ | 19.08 | | | $ | 18.06 | | | $ | 16.54 | | | $ | 14.97 | | | $ | 14.67 | | | $ | 12.04 | |
Total return3 | | | (10.74 | )% | | | 12.46 | % | | | 9.94 | % | | | 11.61 | % | | | 3.28 | % | | | 23.08 | % | | | 34.83 | % |
Ratios to average net assets (annualized) | | | | | | | | | | | | | | | | | | | | | | | | | | | | |
Gross expenses | | | 1.01 | % | | | 1.12 | % | | | 0.99 | % | | | 0.98 | % | | | 0.97 | % | | | 1.02 | % | | | 1.12 | % |
Net expenses | | | 0.95 | % | | | 0.95 | % | | | 0.95 | % | | | 0.95 | % | | | 0.95 | % | | | 0.95 | % | | | 0.95 | % |
Net investment income | | | 0.22 | % | | | 1.65 | % | | | 1.10 | % | | | 0.74 | % | | | 0.79 | % | | | 1.22 | % | | | 1.58 | % |
Supplemental data | | | | | | | | | | | | | | | | | | | | | | | | | | | | |
Portfolio turnover rate | | | 25 | % | | | 24 | % | | | 29 | % | | | 32 | % | | | 34 | % | | | 41 | % | | | 35 | % |
Net assets, end of period (000s omitted) | | | $13,366 | | | | $14,842 | | | | $37,671 | | | | $47,737 | | | | $29,881 | | | | $19,005 | | | | $9,895 | |
| 1. | For the five months ended March 31, 2014. The Fund changed its fiscal year end from October 31 to March 31, effective March 31, 2014. |
| 2. | Calculated based upon average shares outstanding |
| 3. | Returns for periods of less than one year are not annualized. |
The accompanying notes are an integral part of these financial statements.
| | | | | | |
| Financial highlights | | Wells Fargo Advantage Small/Mid Cap Value Fund | | | 19 | |
(For a share outstanding throughout each period)
| | | | | | | | | | | | | | | | | | | | | | | | | | | | |
| | | Six months ended
September 30, 2014
(unaudited) | | | Year ended
March 31, 20141 | | | Year ended October 31 | |
| INVESTOR CLASS | | | | 2013 | | | 2012 | | | 2011 | | | 2010 | | | 2009 | |
Net asset value, beginning of period | | $ | 18.69 | | | $ | 17.72 | | | $ | 16.22 | | | $ | 14.67 | | | $ | 14.38 | | | $ | 11.81 | | | $ | 8.81 | |
Net investment income (loss) | | | (0.03 | ) | | | 0.08 | 2 | | | 0.10 | 2 | | | 0.03 | | | | 0.05 | 2 | | | 0.09 | | | | 0.10 | 2 |
Net realized and unrealized gains (losses) on investments | | | (2.01 | ) | | | 1.94 | | | | 1.43 | | | | 1.57 | | | | 0.35 | | | | 2.56 | | | | 2.90 | |
| | | | | | | | | | | | | | | | | | | | | | | | | | | | |
Total from investment operations | | | (2.04 | ) | | | 2.02 | | | | 1.53 | | | | 1.60 | | | | 0.40 | | | | 2.65 | | | | 3.00 | |
Distributions to shareholders from | | | | | | | | | | | | | | | | | | | | | | | | | | | | |
Net investment income | | | 0.00 | | | | 0.00 | | | | (0.03 | ) | | | (0.05 | ) | | | (0.11 | ) | | | (0.08 | ) | | | 0.00 | |
Net realized gains | | | 0.00 | | | | (1.05 | ) | | | 0.00 | | | | 0.00 | | | | 0.00 | | | | 0.00 | | | | 0.00 | |
| | | | | | | | | | | | | | | | | | | | | | | | | | | | |
Total distributions to shareholders | | | 0.00 | | | | (1.05 | ) | | | (0.03 | ) | | | (0.05 | ) | | | (0.11 | ) | | | (0.08 | ) | | | 0.00 | |
Net asset value, end of period | | $ | 16.65 | | | $ | 18.69 | | | $ | 17.72 | | | $ | 16.22 | | | $ | 14.67 | | | $ | 14.38 | | | $ | 11.81 | |
Total return3 | | | (10.92 | )% | | | 12.17 | % | | | 9.44 | % | | | 10.97 | % | | | 2.73 | % | | | 22.49 | % | | | 34.05 | % |
Ratios to average net assets (annualized) | | | | | | | | | | | | | | | | | | | | | | | | | | | | |
Gross expenses | | | 1.50 | % | | | 1.63 | % | | | 1.47 | % | | | 1.47 | % | | | 1.47 | % | | | 1.56 | % | | | 1.67 | % |
Net expenses | | | 1.41 | % | | | 1.45 | % | | | 1.46 | % | | | 1.47 | % | | | 1.47 | % | | | 1.48 | % | | | 1.49 | % |
Net investment income (loss) | | | (0.25 | )% | | | 1.15 | % | | | 0.62 | % | | | 0.27 | % | | | 0.30 | % | | | 0.67 | % | | | 1.02 | % |
Supplemental data | | | | | | | | | | | | | | | | | | | | | | | | | | | | |
Portfolio turnover rate | | | 25 | % | | | 24 | % | | | 29 | % | | | 32 | % | | | 34 | % | | | 41 | % | | | 35 | % |
Net assets, end of period (000s omitted) | | | $52,584 | | | | $63,432 | | | | $57,625 | | | | $73,138 | | | | $79,099 | | | | $99,424 | | | | $94,728 | |
| 1. | For the five months ended March 31, 2014. The Fund changed its fiscal year end from October 31 to March 31, effective March 31, 2014. |
| 2. | Calculated based upon average shares outstanding |
| 3. | Returns for periods of less than one year are not annualized. |
The accompanying notes are an integral part of these financial statements.
| | | | |
| 20 | | Wells Fargo Advantage Small/Mid Cap Value Fund | | Notes to financial statements (unaudited) |
1. ORGANIZATION
Wells Fargo Funds Trust (the “Trust”), a Delaware statutory trust organized on March 10, 1999, is an open-end management investment company registered under the Investment Company Act of 1940, as amended (the “1940 Act”). These financial statements report on the Wells Fargo Advantage Small/Mid Cap Value Fund (the “Fund”) which is a diversified series of the Trust.
2. SIGNIFICANT ACCOUNTING POLICIES
The following significant accounting policies, which are consistently followed in the preparation of the financial statements of the Fund, are in conformity with U.S. generally accepted accounting principles which require management to make estimates and assumptions that affect the reported amounts of assets and liabilities, disclosure of contingent assets and liabilities at the date of the financial statements, and the reported amounts of revenues and expenses during the reporting period. Actual results could differ from those estimates.
Securities valuation
All investments are valued each business day as of the close of regular trading on the New York Stock Exchange (generally 4 p.m. Eastern Time).
Equity securities that are listed on a foreign or domestic exchange or market are valued at the official closing price or, if none, the last sales price. If no sale occurs on the primary exchange or market for the security that day, the prior day’s price will be deemed “stale” and fair values will be determined in accordance with the Fund’s Valuation Procedures.
The values of securities denominated in foreign currencies are translated into U.S. dollars at rates provided by an independent foreign currency pricing source at a time each business day specified by the Management Valuation Team of Wells Fargo Funds Management, LLC (“Funds Management”).
Many securities markets and exchanges outside the U.S. close prior to the close of the New York Stock Exchange and therefore may not fully reflect trading or events that occur after the close of the principal exchange in which the foreign securities are traded, but before the close of the New York Stock Exchange. If such trading or events are expected to materially affect the value of such securities, then fair value pricing procedures approved by the Board of Trustees of the Fund are applied. These procedures take into account multiple factors including movements in U.S. securities markets after foreign exchanges close. Foreign securities that are fair valued under these procedures are categorized as Level 2 and the application of these procedures may result in transfers between Level 1 and Level 2. Depending on market activity, such fair valuations may be frequent. Such fair value pricing may result in net asset values that are higher or lower than net asset values based on the last reported sales price or latest quoted bid price. On September 30, 2014, such fair value pricing was not used in pricing foreign securities.
Investments in registered open-end investment companies are valued at net asset value.
Investments which are not valued using any of the methods discussed above are valued at their fair value, as determined in good faith by the Board of Trustees. The Board of Trustees has established a Valuation Committee comprised of the Trustees and has delegated to it the authority to take any actions regarding the valuation of portfolio securities that the Valuation Committee deems necessary or appropriate, including determining the fair value of portfolio securities, unless the determination has been delegated to the Management Valuation Team. The Board of Trustees retains the authority to make or ratify any valuation decisions or approve any changes to the Valuation Procedures as it deems appropriate. On a quarterly basis, the Board of Trustees receives reports on any valuation actions taken by the Valuation Committee or the Management Valuation Team which may include items for ratification.
Valuations of fair valued securities are compared to the next actual sales price when available, or other appropriate market values, to assess the continued appropriateness of the fair valuation methodologies used. These securities are fair valued on a day-to-day basis, taking into consideration changes to appropriate market information and any significant changes to the inputs considered in the valuation process until there is a readily available price provided on an exchange or by an independent pricing service. Valuations received from an independent pricing service or independent broker-dealer quotes are periodically validated by comparisons to most recent trades and valuations provided by other independent pricing services in addition to the review of prices by the adviser and/or subadviser. Unobservable inputs used in determining fair valuations are identified based on the type of security, taking into consideration factors utilized by market participants in valuing the investment, knowledge about the issuer and the current market environment.
| | | | | | |
| Notes to financial statements (unaudited) | | Wells Fargo Advantage Small/Mid Cap Value Fund | | | 21 | |
Foreign currency translation
The accounting records of the Fund are maintained in U.S. dollars. The values of other assets and liabilities denominated in foreign currencies are translated into U.S. dollars at rates provided by an independent foreign currency pricing source at a time each business day specified by the Management Valuation Team. Purchases and sales of securities, and income and expenses are converted at the rate of exchange on the respective dates of such transactions. Net realized foreign exchange gains or losses arise from sales of foreign currencies, currency gains or losses realized between the trade and settlement dates on securities transactions, and the difference between the amounts of dividends, interest and foreign withholding taxes recorded and the U.S. dollar equivalent of the amounts actually paid or received. Net unrealized foreign exchange gains and losses arise from changes in the fair value of assets and liabilities other than investments in securities resulting from changes in exchange rates. The changes in net assets arising from changes in exchange rates and the changes in net assets resulting from changes in market prices of securities are not separately presented. Such changes are included in net realized and unrealized gains or losses from investments.
Forward foreign currency contracts
The Fund is subject to foreign currency exchange rate risk in the normal course of pursuing its investment objectives. A forward foreign currency contract is an agreement between two parties to purchase or sell a specific currency for an agreed-upon price at a future date. The Fund enters into forward foreign currency contracts to facilitate transactions in foreign-denominated securities and to attempt to minimize the risk to the Fund from adverse changes in the relationship between currencies. Forward foreign currency contracts are recorded at the forward rate and marked-to-market daily. When the contracts are closed, realized gains and losses arising from such transactions are recorded as realized gains or losses on forward foreign currency contract transactions. The Fund could be exposed to risks if the counterparties to the contracts are unable to meet the terms of their contracts or if the value of the foreign currency changes unfavorably. The Fund’s maximum risk of loss from counterparty credit risk is the unrealized gains on the contracts. This risk may be mitigated if there is a master netting arrangement between the Fund and the counterparty.
Security transactions and income recognition
Securities transactions are recorded on a trade date basis. Realized gains or losses are recorded on the basis of identified cost.
Dividend income is recognized on the ex-dividend date, except for certain dividends from foreign securities, which are recorded as soon as the Fund is informed of the ex-dividend date. Dividend income from foreign securities is recorded net of foreign taxes withheld where recovery of such taxes is not assured.
Distributions to shareholders
Distributions to shareholders from net investment income and net realized gains, if any, are recorded on the ex-dividend date. Such distributions are determined in conformity with federal income tax regulations, which may differ in amount or character from net investment income and realized gains recognized for purposes of U.S. generally accepted accounting principles.
Federal and other taxes
The Fund intends to continue to qualify as a regulated investment company by distributing substantially all of its investment company taxable income and any net realized capital gains (after reduction for capital loss carryforwards) sufficient to relieve it from all, or substantially all, federal income taxes. Accordingly, no provision for federal income taxes was required.
The Fund’s income and federal excise tax returns and all financial records supporting those returns for the prior three fiscal years are subject to examination by the federal and Delaware revenue authorities. Management has analyzed the Fund’s tax positions taken on federal, state, and foreign tax returns for all open tax years and does not believe that there are any uncertain tax positions that require recognition of a tax liability.
Class allocations
The separate classes of shares offered by the Fund differ principally in applicable sales charges, distribution, shareholder servicing, and administration fees. Class specific expenses are charged directly to that share class. Investment income, common expenses, and realized and unrealized gains (losses) on investments are allocated daily to each class of shares based on the relative proportion of net assets of each class.
| | | | |
| 22 | | Wells Fargo Advantage Small/Mid Cap Value Fund | | Notes to financial statements (unaudited) |
3. FAIR VALUATION MEASUREMENTS
Fair value measurements of investments are determined within a framework that has established a fair value hierarchy based upon the various data inputs utilized in determining the value of the Fund’s investments. The three-level hierarchy gives the highest priority to unadjusted quoted prices in active markets for identical assets or liabilities (Level 1) and the lowest priority to significant unobservable inputs (Level 3). The Fund’s investments are classified within the fair value hierarchy based on the lowest level of input that is significant to the fair value measurement. The inputs are summarized into three broad levels as follows:
| n | | Level 1 – quoted prices in active markets for identical securities |
| n | | Level 2 – other significant observable inputs (including quoted prices for similar securities, interest rates, prepayment speeds, credit risk, use of amortized cost, etc.) |
| n | | Level 3 – significant unobservable inputs (including the Fund’s own assumptions in determining the fair value of investments) |
The inputs or methodologies used for valuing investments in securities are not necessarily an indication of the risk associated with investing in those securities.
The following is a summary of the inputs used in valuing the Fund’s assets and liabilities as of September 30, 2014:
| | | | | | | | | | | | | | | | |
| | | Quoted prices
(Level 1) | | | Other significant
observable inputs
(Level 2) | | | Significant
unobservable inputs
(Level 3) | | | Total | |
Assets | | | | | | | | | | | | | | | | |
Investments in : | | | | | | | | | | | | | | | | |
| | | | |
Common stocks | | | | | | | | | | | | | | | | |
Consumer discretionary | | $ | 13,848,965 | | | $ | 0 | | | $ | 0 | | | $ | 13,848,965 | |
Energy | | | 20,907,236 | | | | 1,773,094 | | | | 0 | | | | 22,680,330 | |
Financials | | | 20,771,278 | | | | 0 | | | | 0 | | | | 20,771,278 | |
Health care | | | 5,030,803 | | | | 0 | | | | 0 | | | | 5,030,803 | |
Industrials | | | 18,255,871 | | | | 0 | | | | 0 | | | | 18,255,871 | |
Information technology | | | 4,574,979 | | | | 1,796,832 | | | | 0 | | | | 6,371,811 | |
Materials | | | 10,935,818 | | | | 1,345,005 | | | | 0 | | | | 12,280,823 | |
Telecommunication | | | 941,578 | | | | 0 | | | | 0 | | | | 941,578 | |
| | | | |
Exchange-traded funds | | | 1,022,351 | | | | 0 | | | | 0 | | | | 1,022,351 | |
| | | | |
Warrants | | | | | | | | | | | | | | | | |
Health care | | | 0 | | | | 213,935 | | | | 0 | | | | 213,935 | |
| | | | |
Short-term investments | | | | | | | | | | | | | | | | |
Investment companies | | | 1,796,614 | | | | 0 | | | | 0 | | | | 1,796,614 | |
Total assets | | $ | 98,085,493 | | | $ | 5,128,866 | | | $ | 0 | | | $ | 103,214,359 | |
Transfers in and transfers out are recognized at the end of the reporting period. At September 30, 2014, common stocks with a market value of $1,123,924 were transferred from Level 1 to Level 2 because of a decrease in the market activity of these securities. The Level 2 valuation is based on reference to similar securities from the same issuers which were trading on active markets at the end of the period. At September 30, 2014, there were no transfers into/out of Level 3.
4. TRANSACTIONS WITH AFFILIATES
Advisory fee
The Trust has entered into an advisory contract with Funds Management, an indirect wholly owned subsidiary of Wells Fargo & Company (“Wells Fargo”). The adviser is responsible for implementing investment policies and guidelines and for supervising the subadviser, who is responsible for day-to-day portfolio management of the Fund.
Pursuant to the contract, Funds Management is entitled to receive an annual advisory fee starting at 0.75% and declining to 0.60% as the average daily net assets of the Fund increase. For the six months ended September 30, 2014, the advisory fee was equivalent to an annual rate of 0.75% of the Fund’s average daily net assets.
| | | | | | |
| Notes to financial statements (unaudited) | | Wells Fargo Advantage Small/Mid Cap Value Fund | | | 23 | |
Funds Management has retained the services of a subadviser to provide daily portfolio management to the Fund. The fee for subadvisory services is borne by Funds Management. Wells Capital Management Incorporated, an affiliate of Funds Management and an indirect wholly owned subsidiary of Wells Fargo, is the/a subadviser to the Fund and is entitled to receive a fee from Funds Management at an annual rate starting at 0.45% and declining to 0.35% as the average daily net assets of the Fund increase.
Administration fees
The Trust has entered into an administration agreement with Funds Management. Under this agreement, for providing administrative services, which includes paying fees and expenses for services provided by the transfer agent, sub-transfer agents, omnibus account servicers and record-keepers, Funds Management is entitled to receive from the Fund an annual fund level administration fee starting at 0.05% and declining to 0.03% as the average daily net assets of the Fund increase and a class level administration fee which is calculated based on the average daily net assets of each class as follows:
| | | | |
| | | Class level
administration fee | |
Class A, Class C | | | 0.26 | % |
Administrator Class | | | 0.10 | |
Institutional Class | | | 0.08 | |
Investor Class | | | 0.32 | |
Funds Management has contractually waived and/or reimbursed advisory and administration fees to the extent necessary to maintain certain net operating expense ratios for the Fund. Waiver of fees and/or reimbursement of expenses by Funds Management were made first from fund level expenses on a proportionate basis and then from class specific expenses. Funds Management has committed through July 31, 2015 to waive fees and/or reimburse expenses to the extent necessary to cap the Fund’s expenses at 1.35% for Class A shares, 2.10% for Class C shares, 1.15% for Administrator Class shares, 0.95% for Institutional Class shares and 1.41% for Investor Class shares.
Distribution fees
The Trust has adopted a Distribution Plan for Class C shares of the Fund pursuant to Rule 12b-1 under the 1940 Act. Distribution fees are charged to Class C shares and paid to Wells Fargo Funds Distributor, LLC (“Funds Distributor”), the principal underwriter, at an annual rate of 0.75% of the average daily net assets of Class C shares.
In addition, Funds Distributor is entitled to receive the front-end sales charge from the purchase of Class A shares and a contingent deferred sales charge on the redemption of certain shares. Funds Distributor is also entitled to receive the contingent deferred sales charges from redemptions of Class C shares. For the six months ended September 30, 2014, Funds Distributor received $679 from the sale of Class A shares.
Shareholder servicing fees
The Trust has entered into contracts with one or more shareholder servicing agents, whereby Class A, Class C, Administrator Class, and Investor Class of the Fund is charged a fee at an annual rate of 0.25% of the average daily net assets of each respective class.
A portion of these total shareholder servicing fees were paid to affiliates of Wells Fargo.
5. INVESTMENT PORTFOLIO TRANSACTIONS
Purchases and sales of investments, excluding U.S. government obligations (if any) and short-term securities, for the six months ended September 30, 2014 were $28,904,819 and $44,932,429, respectively.
6. BANK BORROWINGS
The Trust (excluding the money market funds and certain other funds in the Trust) and Wells Fargo Variable Trust are parties to a $150,000,000 revolving credit agreement whereby the Fund is permitted to use bank borrowings for temporary or emergency purposes, such as to fund shareholder redemption requests. Interest under the credit agreement is charged to the Fund based on a borrowing rate equal to the higher of the Federal Funds rate in effect on that day plus 1.25% or the overnight LIBOR rate in effect on that day plus 1.25%. In addition, an annual commitment fee equal to 0.10% of the unused balance is allocated to each participating fund. For the six months ended September 30, 2014, the Fund paid $99 in commitment fees.
For the six months ended September 30, 2014, there were no borrowings by the Fund under the agreement.
| | | | |
| 24 | | Wells Fargo Advantage Small/Mid Cap Value Fund | | Notes to financial statements (unaudited) |
7. INDEMNIFICATION
Under the Trust’s organizational documents, the officers and Trustees are indemnified against certain liabilities that may arise out of performance of their duties to the Trust. Additionally, in the normal course of business, the Trust may enter into contracts with service providers that contain a variety of indemnification clauses. The Trust’s maximum exposure under these arrangements is dependent on future claims that may be made against the Fund and, therefore, cannot be estimated.
| | | | | | |
| Other information (unaudited) | | Wells Fargo Advantage Small/Mid Cap Value Fund | | | 25 | |
PROXY VOTING INFORMATION
A description of the policies and procedures that the Fund uses to determine how to vote proxies relating to portfolio securities is available without charge, upon request, by calling 1-800-222-8222, visiting our website at wellsfargoadvantagefunds.com, or visiting the SEC website at sec.gov. Information regarding how the Fund voted proxies relating to portfolio securities during the most recent 12-month period ended June 30 is available without charge on the Fund’s website at wellsfargoadvantagefunds.com or by visiting the SEC website at sec.gov.
PORTFOLIO HOLDINGS INFORMATION
The complete portfolio holdings for the Fund are publicly available monthly on the Fund’s website (wellsfargoadvantagefunds.com), on a one-month delayed basis. In addition, top ten holdings information (excluding derivative positions) for the Fund is publicly available on the Fund’s website on a monthly, seven-day or more delayed basis. The Fund files its complete schedule of portfolio holdings with the SEC for the first and third quarters of each fiscal year on Form N-Q, which is available without charge by visiting the SEC website at sec.gov. In addition, the Fund’s Form N-Q may be reviewed and copied at the SEC’s Public Reference Room in Washington, DC, and at regional offices in New York City, at 233 Broadway, and in Chicago, at 175 West Jackson Boulevard, Suite 900. Information about the Public Reference Room may be obtained by calling 1-800-SEC-0330.
| | | | |
| 26 | | Wells Fargo Advantage Small/Mid Cap Value Fund | | Other information (unaudited) |
BOARD OF TRUSTEES AND OFFICERS
Each of the Trustees and Officers1 listed in the table below acts in identical capacities for each fund in the Wells Fargo Advantage family of funds, which consists of 133 mutual funds comprising the Wells Fargo Funds Trust, Wells Fargo Variable Trust, Wells Fargo Master Trust and four closed-end funds (collectively the “Fund Complex”). This table should be read in conjunction with the Prospectus and the Statement of Additional Information2. The mailing address of each Trustee and Officer is 525 Market Street, 12th Floor, San Francisco, CA 94105. Each Trustee and Officer serves an indefinite term, however, each Trustee serves such term until reaching the mandatory retirement age established by the Trustees.
Independent Trustees
| | | | | | |
Name and year of birth | | Position held and length of service* | | Principal occupations during past five years or longer | | Other directorships during
past five years |
| Peter G. Gordon (Born 1942) | | Trustee, since 1998; Chairman, since 2005 | | Co-Founder, Retired Chairman, President and CEO of Crystal Geyser Water Company. Trustee Emeritus, Colby College. | | Asset Allocation Trust |
| Isaiah Harris, Jr. (Born 1952) | | Trustee, since 2009 | | Retired. Prior thereto, President and CEO of BellSouth Advertising and Publishing Corp. from 2005 to 2007, President and CEO of BellSouth Enterprises from 2004 to 2005 and President of BellSouth Consumer Services from 2000 to 2003. Emeritus member of the Iowa State University Foundation Board of Governors. Emeritus Member of the Advisory Board of Iowa State University School of Business. Advisory Board Member, Palm Harbor Academy. Mr. Harris is a certified public accountant. | | CIGNA Corporation; Asset Allocation Trust |
| Judith M. Johnson (Born 1949) | | Trustee, since 2008;
Audit Committee Chairman, since 2008 | | Retired. Prior thereto, Chief Executive Officer and Chief Investment Officer of Minneapolis Employees Retirement Fund from 1996 to 2008. Ms. Johnson is an attorney, certified public accountant and a certified managerial accountant. | | Asset Allocation Trust |
| Leroy Keith, Jr. (Born 1939) | | Trustee, since 2010 | | Chairman, Bloc Global Services (development and construction). Trustee of the Evergreen Funds complex (and its predecessors) from 1983 to 2010. Former Managing Director, Almanac Capital Management (commodities firm), former Partner, Stonington Partners, Inc. (private equity fund), former Director, Obagi Medical Products Co. and former Director, Lincoln Educational Services. | | Trustee, Virtus Fund Complex (consisting of 50 portfolios as of 12/16/2013); Asset Allocation Trust |
| David F. Larcker (Born 1950) | | Trustee, since 2009 | | James Irvin Miller Professor of Accounting at the Graduate School of Business, Stanford University, Morgan Stanley Director of the Center for Leadership Development and Research and Senior Faculty of The Rock Center for Corporate Governance since 2006. From 2005 to 2008, Professor of Accounting at the Graduate School of Business, Stanford University. Prior thereto, Ernst & Young Professor of Accounting at The Wharton School, University of Pennsylvania from 1985 to 2005. | | Asset Allocation Trust |
| Olivia S. Mitchell (Born 1953) | | Trustee, since 2006 | | International Foundation of Employee Benefit Plans Professor, Wharton School of the University of Pennsylvania since 1993. Director of Wharton’s Pension Research Council and Boettner Center on Pensions & Retirement Research, and Research Associate at the National Bureau of Economic Research. Previously, Cornell University Professor from 1978 to 1993. | | Asset Allocation Trust |
| Timothy J. Penny (Born 1951) | | Trustee, since 1996 | | President and CEO of Southern Minnesota Initiative Foundation, a non-profit organization, since 2007 and Senior Fellow at the Humphrey Institute Policy Forum at the University of Minnesota since 1995. Member of the Board of Trustees of NorthStar Education Finance, Inc., a non-profit organization, since 2007. | | Asset Allocation Trust |
| | | | | | |
| Other information (unaudited) | | Wells Fargo Advantage Small/Mid Cap Value Fund | | | 27 | |
| | | | | | |
Name and year of birth | | Position held and length of service* | | Principal occupations during past five years or longer | | Other directorships during
past five years |
| Michael S. Scofield (Born 1943) | | Trustee, since 2010 | | Served on the Investment Company Institute’s Board of Governors and Executive Committee from 2008-2011 as well the Governing Council of the Independent Directors Council from 2006-2011 and the Independent Directors Council Executive Committee from 2008-2011. Chairman of the IDC from 2008-2010. Institutional Investor (Fund Directions) Trustee of Year in 2007. Trustee of the Evergreen Funds complex (and its predecessors) from 1984 to 2010. Chairman of the Evergreen Funds from 2000-2010. Former Trustee of the Mentor Funds. Retired Attorney, Law Offices of Michael S. Scofield. | | Asset Allocation Trust |
| Donald C. Willeke (Born 1940) | | Trustee, since 1996 | | Principal of the law firm of Willeke & Daniels. General Counsel of the Minneapolis Employees Retirement Fund from 1984 until its consolidation into the Minnesota Public Employees Retirement Association on June 30, 2010. Director and Vice Chair of The Tree Trust (non-profit corporation). Director of the American Chestnut Foundation (non-profit corporation). | | Asset Allocation Trust |
| * | Length of service dates reflect the Trustee’s commencement of service with the Trust’s predecessor entities, where applicable. |
Officers
| | | | | | |
Name and
year of birth | | Position held and
length of service | | Principal occupations during past five years or longer | | |
Karla M. Rabusch
(Born 1959) | | President, since 2003 | | Executive Vice President of Wells Fargo Bank, N.A. and President of Wells Fargo Funds Management, LLC since 2003. | | |
Nancy Wiser1
(Born 1967) | | Treasurer, since 2012 | | Executive Vice President of Wells Fargo Funds Management, LLC since 2011. Chief Operating Officer and Chief Compliance Officer at LightBox Capital Management LLC, from 2008 to 2011. Owned and operated a consulting business providing services to various hedge funds including acting as Chief Operating Officer and Chief Compliance Officer for a hedge fund from 2007 to 2008. Chief Operating Officer and Chief Compliance Officer of GMN Capital LLC from 2006 to 2007. | | |
C. David Messman
(Born 1960) | | Secretary, since 2000; Chief Legal Officer, since 2003 | | Assistant General Counsel of Wells Fargo Bank, N.A. since 2013 and Vice President and Managing Counsel of Wells Fargo Bank N.A. from 1996 to 2013. Senior Vice President and Secretary of Wells Fargo Funds Management , LLC since 2001. | | |
Debra Ann Early
(Born 1964) | | Chief Compliance Officer, since 2007 | | Senior Vice President and Chief Compliance Officer of Wells Fargo Funds Management, LLC since 2007. Chief Compliance Officer of Parnassus Investments from 2005 to 2007. Chief Financial Officer of Parnassus Investments from 2004 to 2007. | | |
David Berardi
(Born 1975) | | Assistant Treasurer, since 2009 | | Vice President of Wells Fargo Funds Management, LLC since 2009. Vice President of Evergreen Investment Management Company, LLC from 2008 to 2010. Assistant Vice President of Evergreen Investment Services, Inc. from 2004 to 2008. Manager of Fund Reporting and Control for Evergreen Investment Management Company, LLC from 2004 to 2010. | | |
Jeremy DePalma1
(Born 1974) | | Assistant Treasurer, since 2009 | | Senior Vice President of Wells Fargo Funds Management, LLC since 2009. Senior Vice President of Evergreen Investment Management Company, LLC from 2008 to 2010. Vice President, Evergreen Investment Services, Inc. from 2004 to 2007. Head of the Fund Reporting and Control Team within Fund Administration from 2005 to 2010. | | |
| 1. | Nancy Wiser acts as Treasurer of 73 funds in the Fund Complex. Jeremy DePalma acts as Treasurer of 60 funds and Assistant Treasurer of 73 funds in the Fund Complex. |
| 2. | The Statement of Additional Information includes additional information about the Trustees and is available, without charge, upon request, by calling 1-800-222-8222 or by visiting the website at wellsfargoadvantagefunds.com. |
| | | | |
| 28 | | Wells Fargo Advantage Small/Mid Cap Value Fund | | Other information (unaudited) |
BOARD CONSIDERATION OF INVESTMENT ADVISORY AND SUB-ADVISORY AGREEMENTS:
Under Section 15 of the Investment Company Act of 1940 (the “1940 Act”), the Board of Trustees (the “Board”) of Wells Fargo Funds Trust (the “Trust”), all the members of which have no direct or indirect interest in the investment advisory and sub-advisory agreements and are not “interested persons” of the Trust, as defined in the 1940 Act (the “Independent Trustees”), must determine whether to approve the continuation of the Trust’s investment advisory and sub-advisory agreements. In this regard, at in-person meetings held on March 27-28, 2014 (the “March Meeting”) and May 15-16, 2014 (the “May Meeting”, and together with the March Meeting, the “Meetings”), the Board reviewed: (i) an investment advisory agreement with Wells Fargo Funds Management, LLC (“Funds Management”) for Wells Fargo Advantage Small/Mid Cap Value Fund (the “Fund”) and (ii) an investment sub-advisory agreement with Wells Capital Management Incorporated (the “Sub-Adviser”), an affiliate of Funds Management, for the Fund. The investment advisory agreement with Funds Management and the investment sub-advisory agreement with the Sub-Adviser are collectively referred to as the “Advisory Agreements.”
At the May Meeting, the Board received the information, considered the factors and reached the conclusions discussed below, and unanimously approved the renewal of the Advisory Agreements, as it had done at the March Meeting.
At the Meetings, the Board considered the factors and reached the conclusions described below relating to the selection of Funds Management and the Sub-Adviser and the continuation of the Advisory Agreements. Prior to the Meetings, the Trustees conferred extensively among themselves and with representatives of Funds Management about these matters. Also, the Board has adopted a team-based approach, with each team consisting of a sub-set of Trustees, to assist the full Board in the discharge of its duties in reviewing performance and other matters throughout the year. The Independent Trustees were assisted in their evaluation of the Advisory Agreements by independent legal counsel, from whom they received separate legal advice and with whom they met separately.
In providing information to the Board, Funds Management and the Sub-Adviser were guided by a detailed set of requests for information submitted to them by independent legal counsel on behalf of the Independent Trustees at the start of the Board’s annual contract renewal process earlier in 2014. In considering and approving the Advisory Agreements, the Trustees considered the information they believed relevant, including but not limited to the information discussed below. The Board considered not only the specific information presented in connection with the Meetings, but also the knowledge gained over time through interaction with Funds Management and the Sub-Adviser about various topics. In this regard, the Board reviewed reports of Funds Management at each of its quarterly meetings, which included, among other things, portfolio reviews and performance reports. In addition, the Board and the teams mentioned above confer with portfolio managers at various times throughout the year. The Board did not identify any particular information or consideration that was all-important or controlling, and each individual Trustee may have attributed different weights to various factors.
After its deliberations, the Board unanimously approved the continuation of the Advisory Agreements and determined that the compensation payable to Funds Management and the Sub-Adviser is reasonable. The Board considered the continuation of the Advisory Agreements for the Fund as part of its consideration of the continuation of advisory agreements for funds across the complex, but its approvals were made on a fund-by-fund basis. The following summarizes a number of important, but not necessarily all, factors considered by the Board in support of its approvals.
Nature, extent and quality of services
The Board received and considered various information regarding the nature, extent and quality of services provided to the Fund by Funds Management and the Sub-Adviser under the Advisory Agreements. This information included, among other things, a summary of the background and experience of senior management of Funds Management, and the qualifications, background, tenure and responsibilities of each of the portfolio managers primarily responsible for the day-to-day portfolio management of the Fund.
The Board evaluated the ability of Funds Management and the Sub-Adviser to attract and retain qualified investment professionals, including research, advisory and supervisory personnel. The Board further considered the compliance programs and compliance records of Funds Management and the Sub-Adviser. In addition, the Board took into account the full range of services provided to the Fund by Funds Management and its affiliates.
Fund performance and expenses
The Board considered the performance results for the Fund over various time periods ended December 31, 2013. The Board also considered these results in comparison to the performance of funds in a universe that was determined by Lipper Inc. (“Lipper”) to be similar to the Fund (the “Universe”), and in comparison to the Fund’s benchmark index and to
| | | | | | |
| Other information (unaudited) | | Wells Fargo Advantage Small/Mid Cap Value Fund | | | 29 | |
other comparative data. Lipper is an independent provider of investment company data. The Board received a description of the methodology used by Lipper to select the mutual funds in the performance Universe. The Board noted that the performance of the Fund (Administrator Class) was lower than the average performance of the Universe for all periods under review. The Board also noted that the performance of the Fund was lower than its benchmark, the Russell 2500 ™ Value Index, for all periods under review.
The Board received information concerning, and discussed factors contributing to, the underperformance of the Fund relative to the Universe and the benchmark for all periods under review. Funds Management advised the Board about the market conditions and investment decisions that it believed contributed to the underperformance during that period. Funds Management advised the Board that the Fund’s performance was affected by underperformance in the health care and materials sectors, and market and performance volatility. The Board was satisfied with the explanation of factors contributing to underperformance and with the steps being taken by Funds Management and the Sub-Adviser to address the Fund’s investment performance.
The Board also received and considered information regarding the Fund’s net operating expense ratios and their various components, including actual management fees (which reflect fee waivers, if any, and include advisory, administration and transfer agent fees), custodian and other non-management fees, Rule 12b-1 and non-Rule 12b-1 service fees and fee waiver and expense reimbursement arrangements. The Board considered these ratios in comparison to the median ratios of funds in class-specific expense groups that were determined by Lipper to be similar to the Fund (the “Groups”). The Board received a description of the methodology used by Lipper to select the mutual funds in the expense Groups and an explanation of year-to-year variations in the funds comprising such expense Groups and their expense ratios. Based on the Lipper reports, the Board noted that the net operating expense ratios of the Fund were in range of the median net operating expense ratios of the expense Groups.
Based on its consideration of the factors and information it deemed relevant, including those described here, the Board concluded that the overall performance and expense structure of the Fund supported the re-approval of the Advisory Agreements.
Investment advisory and sub-advisory fee rates
The Board reviewed and considered the contractual investment advisory fee rates that are payable by the Fund to Funds Management for investment advisory services (the “Advisory Agreement Rates”), both on a stand-alone basis and on a combined basis with the Fund’s fund-level and class-level contractual administration fee rates (the “Management Rates”). The Board noted that the administration fees payable to Funds Management include transfer agency and sub-transfer agency costs. The Board also reviewed and considered the contractual investment sub-advisory fee rates that are payable by Funds Management to the Sub-Adviser for investment sub-advisory services (the “Sub-Advisory Agreement Rates”).
Among other information reviewed by the Board was a comparison of the Management Rates of the Fund with those of other funds in the expense Groups at a common asset level. The Board noted that the Management Rates of the Fund were in range of the average rates for the Fund’s expense Groups for all share classes.
The Board also received and considered information about the portion of the total advisory fee that was retained by Funds Management after payment of the fee to the Sub-Adviser for sub-advisory services. In assessing the reasonableness of this amount, the Board received and evaluated information about the nature and extent of responsibilities retained and risks assumed by Funds Management and not delegated to or assumed by the Sub-Adviser, and about Funds Management’s on-going oversight services. However, given the affiliation between Funds Management and the Sub-Adviser, the Board ascribed limited relevance to the allocation of the advisory fee between them.
The Board also received and considered information about the nature and extent of services offered and fee rates charged by Funds Management and the Sub-Adviser to other types of clients with investment strategies similar to those of the Fund. In this regard, the Board received information about the significantly greater scope of services, and compliance, reporting and other legal burdens and risks of managing mutual funds compared with those associated with managing assets of non-mutual fund clients such as collective funds or institutional separate accounts.
Based on its consideration of the factors and information it deemed relevant, including those described here, the Board determined that the Advisory Agreement Rates and the Sub-Advisory Agreement Rates were reasonable in light of the services covered by the Advisory Agreements.
| | | | |
| 30 | | Wells Fargo Advantage Small/Mid Cap Value Fund | | Other information (unaudited) |
Profitability
The Board received and considered information concerning the profitability of Funds Management, as well as the profitability of Wells Fargo as a whole, from providing services to the Fund and the fund family as a whole. The Board did not receive or consider to be necessary separate profitability information with respect to the Sub-Adviser, because its profitability information was subsumed in the collective Wells Fargo profitability analysis.
Funds Management explained the methodologies and estimates that it used in calculating profitability. Among other things, the Board noted that the levels of profitability reported on a fund-by-fund basis varied widely, depending on factors such as the size and type of fund. Based on its review, the Board did not deem the profits reported by Funds Management to be at a level that would prevent it from approving the continuation of the Advisory Agreements.
Economies of scale
With respect to possible economies of scale, the Board noted the existence of breakpoints in the Fund’s advisory fee and administration fee structure, which operate generally to reduce the Fund’s expense ratios as the Fund grows in size. It considered that, for a small fund or a fund that shrinks in size, breakpoints conversely can result in higher fee levels. The Board also considered that fee waiver and expense reimbursement arrangements and competitive fee rates at the outset are means of sharing potential economies of scale with shareholders of the Fund and the fund family as a whole. The Board considered Funds Management’s view that any analyses of potential economies of scale in managing a particular fund are inherently limited in light of the joint and common costs and investments that Funds Management incurs across the fund family as a whole.
The Board concluded that the Fund’s fee and expense arrangements, including contractual breakpoints, constituted a reasonable approach to sharing potential economies of scale with the Fund and its shareholders.
Other benefits to Funds Management and the Sub-Adviser
The Board received and considered information regarding potential “fall-out” or ancillary benefits received by Funds Management and its affiliates, including the Sub-Adviser, as a result of their relationships with the Fund. Ancillary benefits could include, among others, benefits directly attributable to other relationships with the Fund and benefits potentially derived from an increase in Funds Management’s and the Sub-Adviser’s business as a result of their relationships with the Fund. The Board noted that various affiliates of Funds Management may receive distribution-related fees, shareholder servicing payments and sub-transfer agency fees in respect of shares sold or held through them and services provided.
The Board also reviewed information about soft dollar credits earned and utilized by the Sub-Adviser, fees earned by Funds Management and the Sub-Adviser from managing a private investment vehicle for the fund family’s securities lending collateral and commissions earned by an affiliated broker from portfolio transactions.
Based on its consideration of the factors and information it deemed relevant, including those described here, the Board did not find that any ancillary benefits received by Funds Management and its affiliates, including the Sub-Adviser, were unreasonable.
Conclusion
After considering the above-described factors and based on its deliberations and its evaluation of the information described above, the Board unanimously approved the continuation of the Advisory Agreements for an additional one-year period and determined that the compensation payable to Funds Management and the Sub-Adviser is reasonable.
| | | | | | |
| List of abbreviations | | Wells Fargo Advantage Small/Mid Cap Value Fund | | | 31 | |
The following is a list of common abbreviations for terms and entities that may have appeared in this report.
| ACA | — ACA Financial Guaranty Corporation |
| ADR | — American depositary receipt |
| ADS | — American depositary shares |
| AGC | — Assured Guaranty Corporation |
| AGM | — Assured Guaranty Municipal |
| Ambac | — Ambac Financial Group Incorporated |
| AMT | — Alternative minimum tax |
| BAN | — Bond anticipation notes |
| BHAC | — Berkshire Hathaway Assurance Corporation |
| CAB | — Capital appreciation bond |
| CCAB | — Convertible capital appreciation bond |
| CDA | — Community Development Authority |
| CDO | — Collateralized debt obligation |
| DRIVER | — Derivative inverse tax-exempt receipts |
| DW&P | — Department of Water & Power |
| DWR | — Department of Water Resources |
| ECFA | — Educational & Cultural Facilities Authority |
| EDA | — Economic Development Authority |
| EDFA | — Economic Development Finance Authority |
| ETF | — Exchange-traded fund |
| FDIC | — Federal Deposit Insurance Corporation |
| FFCB | — Federal Farm Credit Banks |
| FGIC | — Financial Guaranty Insurance Corporation |
| FHA | — Federal Housing Administration |
| FHLB | — Federal Home Loan Bank |
| FHLMC | — Federal Home Loan Mortgage Corporation |
| FICO | — The Financing Corporation |
| FNMA | — Federal National Mortgage Association |
| GDR | — Global depositary receipt |
| GNMA | — Government National Mortgage Association |
| HCFR | — Healthcare facilities revenue |
| HEFA | — Health & Educational Facilities Authority |
| HEFAR | — Higher education facilities authority revenue |
| HFA | — Housing Finance Authority |
| HFFA | — Health Facilities Financing Authority |
| HUD | — Department of Housing and Urban Development |
| IDA | — Industrial Development Authority |
| IDAG | — Industrial Development Agency |
| KRW | — Republic of Korea won |
| LIBOR | — London Interbank Offered Rate |
| LLC | — Limited liability company |
| LLLP | — Limited liability limited partnership |
| LLP | — Limited liability partnership |
| MBIA | — Municipal Bond Insurance Association |
| MFHR | — Multifamily housing revenue |
| MSTR | — Municipal securities trust receipts |
| MUD | — Municipal Utility District |
| National | — National Public Finance Guarantee Corporation |
| PCFA | — Pollution Control Financing Authority |
| PCL | — Public Company Limited |
| PCR | — Pollution control revenue |
| PFA | — Public Finance Authority |
| PFFA | — Public Facilities Financing Authority |
| PFOTER | — Puttable floating option tax-exempt receipts |
| plc | — Public limited company |
| PUTTER | — Puttable tax-exempt receipts |
| R&D | — Research & development |
| Radian | — Radian Asset Assurance |
| RAN | — Revenue anticipation notes |
| RDA | — Redevelopment Authority |
| RDFA | — Redevelopment Finance Authority |
| REIT | — Real estate investment trust |
| ROC | — Reset option certificates |
| SAVRS | — Select auction variable rate securities |
| SBA | — Small Business Authority |
| SFHR | — Single-family housing revenue |
| SFMR | — Single-family mortgage revenue |
| SPA | — Standby purchase agreement |
| SPDR | — Standard & Poor’s Depositary Receipts |
| STRIPS | — Separate trading of registered interest and |
| TAN | — Tax anticipation notes |
| TIPS | — Treasury inflation-protected securities |
| TRAN | — Tax revenue anticipation notes |
| TTFA | — Transportation Trust Fund Authority |
| TVA | — Tennessee Valley Authority |
This page is intentionally left blank.


For more information
More information about Wells Fargo Advantage Funds is available free upon request. To obtain literature, please write, email, visit the Fund’s website, or call:
Wells Fargo Advantage Funds
P.O. Box 8266
Boston, MA 02266-8266
Email: wfaf@wellsfargo.com
Website: wellsfargoadvantagefunds.com
Individual investors: 1-800-222-8222
Retail investment professionals: 1-888-877-9275
Institutional investment professionals: 1-866-765-0778
This report and the financial statements contained herein are submitted for the general information of the shareholders of Wells Fargo Advantage Funds. If this report is used for promotional purposes, distribution of the report must be accompanied or preceded by a current prospectus. Before investing, please consider the investment objectives, risks, charges, and expenses of the investment. For a current prospectus and, if available, a summary prospectus, containing this information, call 1-800-222-8222 or visit the Fund’s website at wellsfargoadvantagefunds.com. Read the prospectus carefully before you invest or send money.
Wells Fargo Funds Management, LLC, a wholly owned subsidiary of Wells Fargo & Company, provides investment advisory and administrative services for Wells Fargo Advantage Funds. Other affiliates of Wells Fargo & Company provide subadvisory and other services for the Funds. The Funds are distributed by Wells Fargo Funds Distributor, LLC, Member FINRA/SIPC, an affiliate of Wells Fargo & Company.
NOT FDIC INSURED ¡ NO BANK GUARANTEE ¡ MAY LOSE VALUE
© 2014 Wells Fargo Funds Management, LLC. All rights reserved.
| | |
 | | 228301 11-14 SA245/SAR245 09-14 |

Wells Fargo Advantage
Special Small Cap Value Fund

Semi-Annual Report
September 30, 2014

Reduce clutter. Save trees.
Sign up for electronic delivery of prospectuses and shareholder reports at wellsfargo.com/advantagedelivery
Contents
The views expressed and any forward-looking statements are as of September 30, 2014, unless otherwise noted, and are those of the Fund managers and/or Wells Fargo Funds Management, LLC. Discussions of individual securities, or the markets generally, or any Wells Fargo Advantage Fund are not intended as individual recommendations. Future events or results may vary significantly from those expressed in any forward-looking statements; the views expressed are subject to change at any time in response to changing circumstances in the market. Wells Fargo Funds Management, LLC and the Fund disclaim any obligation to publicly update or revise any views expressed or forward-looking statements.
NOT FDIC INSURED ¡ NO BANK GUARANTEE ¡ MAY LOSE VALUE
| | | | |
| 2 | | Wells Fargo Advantage Special Small Cap Value Fund | | Letter to shareholders (unaudited) |

Karla M. Rabusch
President
Wells Fargo Advantage Funds
Despite geopolitical challenges, U.S. economic numbers showed improvement.
Dear Valued Shareholder:
We are pleased to offer you this semi-annual report for the Wells Fargo Advantage Special Small Cap Value Fund for the six-month period that ended September 30, 2014. The period was marked by heightened geopolitical uncertainty as the U.S. and Europe continued to confront Russia over Ukraine and as Islamic militants (formerly known as ISIS) gained territory in Iraq and Syria. Toward the end of the reporting period, market volatility increased as renewed fears of slowing global growth took hold, and investors began to price in expectations that the U.S. Federal Reserve (Fed) was finally looking to raise short-term interest rates. Although mid-cap stocks (measured by the Russell Midcap® Index1) ended the period with a single-digit gain, small-cap stocks (measured by the Russell 2000® Index2) ended with a loss.
Major central banks continued to provide stimulus.
Throughout the reporting period, the Federal Open Market Committee (FOMC)—the U.S. Federal Reserve’s monetary policymaking body—kept its key interest rate near zero. Prior to the reporting period, in January 2014, the FOMC began to reduce (or taper) its bond-buying program by $10 billion per month and continued the taper throughout the reporting period. Some anticipated this action would lead to higher interest rates, however, interest rates followed a downward trend, despite short-term volatility. European markets continued to benefit from the European Central Bank’s (ECB’s) actions. In June 2014, the ECB announced a variety of measures aimed at encouraging lending, including cutting its key rate and imposing for the first time a negative interest rate on bank deposits held at the central bank. In September 2014, the ECB cut its key rate again—to 0.05%—and pushed the deposit rate for banks to -0.20%.
Although the geopolitical situation presented challenges, U.S. stock markets gained on positive economic data.
Geopolitical events were major obstacles throughout the reporting period. The ongoing standoff between the West (the U.S., Europe, and their allies) and Russia over Ukraine began in late 2013 and fed into stock market volatility early in 2014. The situation’s effect on the stock market faded as investors began to believe that the situation would not result in war, but as of September 2014, the situation had resulted in economic sanctions from the West against Russia. However, even as the market began to focus less on that situation, the advance of Islamic militants in Iraq and Syria led to airstrikes by the U.S. and its allies and fears of a regional war in the Middle East.
Despite geopolitical challenges, U.S. economic numbers showed improvement. The unemployment rate continued its slow improvement, declining from 6.3% in April 2014 to 5.9% in September 2014. Although investors received an unpleasant surprise when gross domestic product (GDP) growth for the first quarter of 2014 declined by 2.1% on an annualized basis, several commentators suggested that harsh winter weather may have dampened economic activity. Economic growth did accelerate in the second quarter of 2014, with an annualized GDP growth rate of 4.6%.
| 1. | The Russell Midcap® Index measures the performance of the 800 smallest companies in the Russell 1000® Index, which represent approximately 25% of the total market capitalization of the Russell 1000 Index. You cannot invest directly in an index. |
| 2. | The Russell 2000® Index measures the performance of the 2,000 smallest companies in the Russell 3000® Index, which represents approximately 8% of the total market capitalization of the Russell 3000 Index. You cannot invest directly in an index. |
| | | | | | |
| Letter to shareholders (unaudited) | | Wells Fargo Advantage Special Small Cap Value Fund | | | 3 | |
Investors’ positive outlook for the U.S. economy contributed to a solid domestic stock market for most of the period. However, slowing global economic growth, combined with renewed geopolitical concerns (including protests in Hong Kong), caused stock market weakness in September 2014. The Russell Midcap Index ended the period with a 3.2% gain. Small-cap stocks, however, were hit harder by the late-period uncertainty and the Russell 2000 Index ended with a -5.5% return. Growth stocks outperformed value stocks in both the small-cap and the mid-cap space.
Don’t let short-term uncertainty derail long-term investment goals.
Periods of uncertainty can present challenges, but experience has taught us that maintaining long-term investment goals can be an effective way to plan for the future. To help you create a sound strategy based on your personal goals and risk tolerance, Wells Fargo Advantage Funds offers more than 100 mutual funds and other investments spanning a wide range of asset classes and investment styles. Although diversification cannot guarantee an investment profit or prevent losses, we believe it can be an effective way to manage investment risk and potentially smooth out overall portfolio performance. We encourage investors to know their investments and to understand that appropriate levels of risk-taking may unlock opportunities.
Thank you for choosing to invest with Wells Fargo Advantage Funds. We appreciate your confidence in us and remain committed to helping you meet your financial needs. For current information about your fund investments, contact your investment professional, visit our website at wellsfargoadvantagefunds.com, or call us directly at 1-800-222-8222. We are available 24 hours a day, 7 days a week.
Sincerely,

Karla M. Rabusch
President
Wells Fargo Advantage Funds
Investors’ positive outlook for the U.S. economy contributed to a solid domestic stock market for most of the period.
| | | | |
| 4 | | Wells Fargo Advantage Special Small Cap Value Fund | | Performance highlights (unaudited) |
Investment objective
The Fund seeks long-term capital appreciation.
Adviser
Wells Fargo Funds Management, LLC
Subadviser
Wells Capital Management Incorporated
Portfolio managers
James M. Tringas, CFA, CPA
Robert Rifkin, CFA
Bryant VanCronkhite, CFA, CPA
Average annual total returns1 (%) as of September 30, 2014
| | | | | | | | | | | | | | | | | | | | | | | | | | | | | | | | | | |
| | | | | Including sales charge | | | Excluding sales charge | | | Expense ratios2 (%) | |
| | | Inception date | | 1 year | | | 5 year | | | 10 year | | | 1 year | | | 5 year | | | 10 year | | | Gross | | | Net3 | |
| Class A (ESPAX) | | 5-7-1993 | | | 4.18 | | | | 12.77 | | | | 7.91 | | | | 10.54 | | | | 14.11 | | | | 8.55 | | | | 1.41 | | | | 1.34 | |
| Class B (ESPBX)* | | 3-26-1999 | | | 4.70 | | | | 13.01 | | | | 7.99 | | | | 9.70 | | | | 13.26 | | | | 7.99 | | | | 2.16 | | | | 2.09 | |
| Class C (ESPCX) | | 12-12-2000 | | | 8.70 | | | | 13.27 | | | | 7.75 | | | | 9.70 | | | | 13.27 | | | | 7.75 | | | | 2.16 | | | | 2.09 | |
| Administrator Class (ESPIX) | | 7-23-1996 | | | – | | | | – | | | | – | | | | 10.84 | | | | 14.40 | | | | 8.83 | | | | 1.25 | | | | 1.09 | |
| Institutional Class (ESPNX) | | 7-30-2010 | | | – | | | | – | | | | – | | | | 11.00 | | | | 14.54 | | | | 8.90 | | | | 0.98 | | | | 0.94 | |
| Russell 2000® Value Index4 | | – | | | – | | | | – | | | | – | | | | 4.13 | | | | 13.02 | | | | 7.25 | | | | – | | | | – | |
| * | | Class B shares are closed to investment, except in connection with the reinvestment of any distributions and permitted exchanges. |
Figures quoted represent past performance, which is no guarantee of future results, and do not reflect taxes that a shareholder may pay on fund distributions or the redemption of fund shares. Investment return and principal value of an investment will fluctuate so that an investor’s shares, when redeemed, may be worth more or less than their original cost. Performance shown without sales charges would be lower if sales charges were reflected. Current performance may be lower or higher than the performance data quoted, which assumes the reinvestment of dividends and capital gains. Current month-end performance is available on the Fund’s website, wellsfargoadvantagefunds.com.
Index returns do not include transaction costs associated with buying and selling securities, any mutual fund fees or expenses, or any taxes. It is not possible to invest directly in an index.
For Class A shares, the maximum front-end sales charge is 5.75%. For Class B shares, the maximum contingent deferred sales charge is 5.00%. For Class C shares, the maximum contingent deferred sales charge is 1.00%. Performance including a contingent deferred sales charge assumes the sales charge for the corresponding time period. Administrator Class and Institutional Class shares are sold without a front-end sales charge or contingent deferred sales charge.
Stock values fluctuate in response to the activities of individual companies and general market and economic conditions. Smaller-company stocks tend to be more volatile and less liquid than those of larger companies. Consult the Fund’s prospectus for additional information on these and other risks.
Please see footnotes on page 5.
| | | | | | |
| Performance highlights (unaudited) | | Wells Fargo Advantage Special Small Cap Value Fund | | | 5 | |
| | | | |
| Ten largest equity holdings5 (%) as of September 30, 2014 | |
First Citizens BancShares Corporation Class A | | | 3.84 | |
Kadant Incorporated | | | 2.55 | |
TreeHouse Foods Incorporated | | | 2.31 | |
Mueller Industries Incorporated | | | 1.87 | |
DineEquity Incorporated | | | 1.79 | |
Franklin Electric Company Incorporated | | | 1.63 | |
Simpson Manufacturing Company Incorporated | | | 1.59 | |
UMB Financial Corporation | | | 1.56 | |
Brown & Brown Incorporated | | | 1.51 | |
Viad Corporation | | | 1.48 | |
|
| Sector distribution6 as of September 30, 2014 |
|
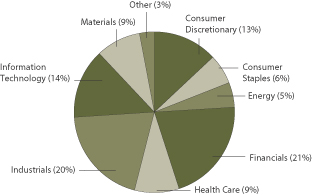 |
| 1. | Historical performance shown for Institutional Class shares prior to their inception reflects the performance of Administrator Class shares, and includes the higher expenses applicable to Administrator Class shares. If these expenses had not been included, returns would be higher. Historical performance shown for all classes of the Fund prior to July 19, 2010, is based on the performance of the Fund’s predecessor, Evergreen Special Values Fund. |
| 2. | Reflects the expense ratios as stated in the most recent prospectuses. The expense ratios shown are subject to change and may differ from the annualized expense ratio shown in the financial highlights of this report. |
| 3. | The Adviser has committed through July 31, 2015, to waive fees and/or reimburse expenses to the extent necessary to cap the Fund’s Total Annual Fund Operating Expenses After Fee Waiver, excluding certain expenses, at the amounts shown. After this time, the cap may be increased or the commitment to maintain the cap may be terminated only with the approval of the Board of Trustees. Brokerage commissions, stamp duty fees, interest, taxes, acquired fund fees and expenses, and extraordinary expenses are excluded from the cap. Without this cap, the Fund’s returns would have been lower. |
| 4. | The Russell 2000® Value Index measures the performance of those Russell 2000 companies with lower price-to-book ratios and lower forecasted growth values. You cannot invest directly in an index. |
| 5. | The ten largest equity holdings are calculated based on the value of the securities divided by total net assets of the Fund. Holdings are subject to change and may have changed since the date specified. |
| 6. | Sector distribution is subject to change and is calculated based on the total long-term investments of the Fund. |
| | | | |
| 6 | | Wells Fargo Advantage Special Small Cap Value Fund | | Fund expenses (unaudited) |
As a shareholder of the Fund, you incur two types of costs: (1) transaction costs, including sales charges (loads) on purchase payments and contingent deferred sales charges (if any) on redemptions and (2) ongoing costs, including management fees, distribution (12b-1) and/or shareholder service fees, and other Fund expenses. This example is intended to help you understand your ongoing costs (in dollars) of investing in the Fund and to compare these costs with the ongoing costs of investing in other mutual funds.
The example is based on an investment of $1,000 invested at the beginning of the six-month period and held for the entire period from April 1, 2014 to September 30, 2014.
Actual expenses
The “Actual” line of the table below provides information about actual account values and actual expenses. You may use the information in this line, together with the amount you invested, to estimate the expenses that you paid over the period. Simply divide your account value by $1,000 (for example, an $8,600 account value divided by $1,000 = 8.6), then multiply the result by the number in the “Actual” line under the heading entitled “Expenses paid during period” for your applicable class of shares to estimate the expenses you paid on your account during this period.
Hypothetical example for comparison purposes
The “Hypothetical” line of the table below provides information about hypothetical account values and hypothetical expenses based on the Fund’s actual expense ratio and an assumed rate of return of 5% per year before expenses, which is not the Fund’s actual return. The hypothetical account values and expenses may not be used to estimate the actual ending account balance or expenses you paid for the period. You may use this information to compare the ongoing costs of investing in the Fund and other funds. To do so, compare this 5% hypothetical example with the 5% hypothetical examples that appear in the shareholder reports of the other funds.
Please note that the expenses shown in the table are meant to highlight your ongoing costs only and do not reflect any transactional costs, such as sales charges (loads) and contingent deferred sales charges. Therefore, the “Hypothetical” line of the table is useful in comparing ongoing costs only and will not help you determine the relative total costs of owning different funds. In addition, if these transactional costs were included, your costs would have been higher.
| | | | | | | | | | | | | | | | |
| | | Beginning
account value 4-1-2014 | | | Ending
account value 9-30-2014 | | | Expenses paid during the period¹ | | | Net annualized expense ratio | |
Class A | | | | | | | | | | | | | | | | |
Actual | | $ | 1,000.00 | | | $ | 953.97 | | | $ | 6.56 | | | | 1.34 | % |
Hypothetical (5% return before expenses) | | $ | 1,000.00 | | | $ | 1,018.35 | | | $ | 6.78 | | | | 1.34 | % |
Class B | | | | | | | | | | | | | | | | |
Actual | | $ | 1,000.00 | | | $ | 950.31 | | | $ | 10.22 | | | | 2.09 | % |
Hypothetical (5% return before expenses) | | $ | 1,000.00 | | | $ | 1,014.59 | | | $ | 10.56 | | | | 2.09 | % |
Class C | | | | | | | | | | | | | | | | |
Actual | | $ | 1,000.00 | | | $ | 950.18 | | | $ | 10.22 | | | | 2.09 | % |
Hypothetical (5% return before expenses) | | $ | 1,000.00 | | | $ | 1,014.59 | | | $ | 10.56 | | | | 2.09 | % |
Administrator Class | | | | | | | | | | | | | | | | |
Actual | | $ | 1,000.00 | | | $ | 955.13 | | | $ | 5.34 | | | | 1.09 | % |
Hypothetical (5% return before expenses) | | $ | 1,000.00 | | | $ | 1,019.60 | | | $ | 5.52 | | | | 1.09 | % |
Institutional Class | | | | | | | | | | | | | | | | |
Actual | | $ | 1,000.00 | | | $ | 955.74 | | | $ | 4.61 | | | | 0.94 | % |
Hypothetical (5% return before expenses) | | $ | 1,000.00 | | | $ | 1,020.36 | | | $ | 4.76 | | | | 0.94 | % |
| 1. | Expenses paid is equal to the annualized expense ratio of each class multiplied by the average account value over the period, multiplied by the number of days in the most recent fiscal half-year divided by the number of days in the fiscal year (to reflect the one-half-year period). |
| | | | | | |
| Portfolio of investments—September 30, 2014 (unaudited) | | Wells Fargo Advantage Special Small Cap Value Fund | | | 7 | |
| | | | | | | | | | | | |
| Security name | | | | | | Shares | | | Value | |
| | | | |
Common Stocks: 92.74% | | | | | | | | | | | | |
| | | | |
Consumer Discretionary: 12.07% | | | | | | | | | | | | |
| | | | |
| Diversified Consumer Services: 1.67% | | | | | | | | | | | | |
Hillenbrand Incorporated | | | | | | | 198,102 | | | $ | 6,119,372 | |
Liberty Tax Incorporated † | | | | | | | 152,147 | | | | 4,914,348 | |
| | | | |
| | | | | | | | | | | 11,033,720 | |
| | | | | | | | | | | | |
| | | | |
| Hotels, Restaurants & Leisure: 3.92% | | | | | | | | | | | | |
Denny’s Corporation † | | | | | | | 1,291,496 | | | | 9,079,217 | |
DineEquity Incorporated | | | | | | | 145,000 | | | | 11,830,550 | |
Krispy Kreme Doughnuts Incorporated † | | | | | | | 291,000 | | | | 4,993,560 | |
| | | | |
| | | | | | | | | | | 25,903,327 | |
| | | | | | | | | | | | |
| | | | |
| Household Durables: 1.72% | | | | | | | | | | | | |
Blyth Incorporated | | | | | | | 185,800 | | | | 1,508,696 | |
Dixie Group Incorporated † | | | | | | | 489,246 | | | | 4,241,763 | |
Helen of Troy Limited † | | | | | | | 69,200 | | | | 3,634,384 | |
Tupperware Corporation | | | | | | | 28,800 | | | | 1,988,352 | |
| | | | |
| | | | | | | | | | | 11,373,195 | |
| | | | | | | | | | | | |
| | | | |
| Media: 1.42% | | | | | | | | | | | | |
AH Belo Corporation | | | | | | | 879,600 | | | | 9,385,332 | |
| | | | | | | | | | | | |
| | | | |
| Specialty Retail: 2.64% | | | | | | | | | | | | |
Ascena Retail Group Incorporated † | | | | | | | 264,900 | | | | 3,523,170 | |
Christopher & Banks Corporation † | | | | | | | 363,420 | | | | 3,594,224 | |
Guess? Incorporated | | | | | | | 269,000 | | | | 5,909,930 | |
Pier 1 Imports Incorporated | | | | | | | 367,000 | | | | 4,363,630 | |
| | | | |
| | | | | | | | | | | 17,390,954 | |
| | | | | | | | | | | | |
| | | | |
| Textiles, Apparel & Luxury Goods: 0.70% | | | | | | | | | | | | |
Delta Apparel Incorporated † | | | | | | | 312,839 | | | | 2,843,707 | |
Steven Madden Limited † | | | | | | | 54,200 | | | | 1,746,866 | |
| | | | |
| | | | | | | | | | | 4,590,573 | |
| | | | | | | | | | | | |
| | | | |
Consumer Staples: 6.04% | | | | | | | | | | | | |
| | | | |
| Beverages: 1.04% | | | | | | | | | | | | |
Cott Corporation | | | | | | | 998,300 | | | | 6,858,321 | |
| | | | | | | | | | | | |
| | | | |
| Food & Staples Retailing: 0.40% | | | | | | | | | | | | |
SUPERVALU Incorporated † | | | | | | | 294,100 | | | | 2,629,254 | |
| | | | | | | | | | | | |
| | | | |
| Food Products: 2.30% | | | | | | | | | | | | |
TreeHouse Foods Incorporated † | | | | | | | 189,000 | | | | 15,214,500 | |
| | | | | | | | | | | | |
| | | | |
| Household Products: 2.30% | | | | | | | | | | | | |
Central Garden & Pet Company † | | | | | | | 260,892 | | | | 2,021,913 | |
Central Garden & Pet Company Class A † | | | | | | | 116,002 | | | | 932,656 | |
Spectrum Brands Holdings Incorporated | | | | | | | 32,100 | | | | 2,906,013 | |
WD-40 Company | | | | | | | 136,822 | | | | 9,298,423 | |
| | | | |
| | | | | | | | | | | 15,159,005 | |
| | | | | | | | | | | | |
The accompanying notes are an integral part of these financial statements.
| | | | |
| 8 | | Wells Fargo Advantage Special Small Cap Value Fund | | Portfolio of investments—September 30, 2014 (unaudited) |
| | | | | | | | | | | | |
| Security name | | | | | | Shares | | | Value | |
| | | | |
Energy: 4.53% | | | | | | | | | | | | |
| | | | |
| Energy Equipment & Services: 2.75% | | | | | | | | | | | | |
Atwood Oceanics Incorporated † | | | | | | | 119,800 | | | $ | 5,234,062 | |
Cal Dive International Incorporated Ǡ | | | | | | | 382,400 | | | | 370,928 | |
CARBO Ceramics Incorporated « | | | | | | | 51,800 | | | | 3,068,114 | |
Frank’s International NV « | | | | | | | 145,500 | | | | 2,720,850 | |
Steel Excel Incorporated †(a) | | | | | | | 207,210 | | | | 6,734,325 | |
| | | | |
| | | | | | | | | | | 18,128,279 | |
| | | | | | | | | | | | |
| | | | |
| Oil, Gas & Consumable Fuels: 1.78% | | | | | | | | | | | | |
Comstock Resources Incorporated | | | | | | | 253,963 | | | | 4,728,791 | |
Energy XXI (Bermuda) Limited | | | | | | | 143,300 | | | | 1,626,455 | |
Stone Energy Corporation † | | | | | | | 172,100 | | | | 5,397,056 | |
| | | | |
| | | | | | | | | | | 11,752,302 | |
| | | | | | | | | | | | |
| | | | |
Financials: 20.53% | | | | | | | | | | | | |
| | | | |
| Banks: 10.05% | | | | | | | | | | | | |
Associated Banc-Corp | | | | | | | 225,800 | | | | 3,933,436 | |
BBCN Bancorp Incorporated | | | | | | | 222,600 | | | | 3,247,734 | |
First Citizens BancShares Corporation Class A | | | | | | | 117,031 | | | | 25,352,426 | |
First Niagara Financial Group Incorporated | | | | | | | 469,100 | | | | 3,907,603 | |
Hancock Holding Company | | | | | | | 122,700 | | | | 3,932,535 | |
Sterling BanCorp | | | | | | | 255,616 | | | | 3,269,329 | |
Synovus Financial Corporation | | | | | | | 179,999 | | | | 4,255,176 | |
TCF Financial Corporation | | | | | | | 520,636 | | | | 8,085,477 | |
UMB Financial Corporation | | | | | | | 189,161 | | | | 10,318,733 | |
| | | | |
| | | | | | | | | | | 66,302,449 | |
| | | | | | | | | | | | |
| | | | |
| Capital Markets: 2.01% | | | | | | | | | | | | |
Apollo Investment Corporation | | | | | | | 251,933 | | | | 2,058,293 | |
CIFC Corporation « | | | | | | | 254,285 | | | | 2,301,279 | |
Westwood Holdings Group Incorporated | | | | | | | 156,812 | | | | 8,889,672 | |
| | | | |
| | | | | | | | | | | 13,249,244 | |
| | | | | | | | | | | | |
| | | | |
| Consumer Finance: 0.23% | | | | | | | | | | | | |
JG Wentworth Company † | | | | | | | 123,300 | | | | 1,527,687 | |
| | | | | | | | | | | | |
| | | | |
| Insurance: 6.10% | | | | | | | | | | | | |
Brown & Brown Incorporated | | | | | | | 309,200 | | | | 9,940,780 | |
Endurance Specialty Holdings Limited | | | | | | | 78,200 | | | | 4,315,076 | |
Fidelity & Guaranty Life | | | | | | | 135,344 | | | | 2,889,594 | |
ProAssurance Corporation | | | | | | | 208,500 | | | | 9,188,595 | |
Stewart Information Services Corporation | | | | | | | 162,800 | | | | 4,778,180 | |
Validus Holdings Limited | | | | | | | 234,400 | | | | 9,174,416 | |
| | | | |
| | | | | | | | | | | 40,286,641 | |
| | | | | | | | | | | | |
| | | | |
| REITs: 1.43% | | | | | | | | | | | | |
Hatteras Financial Corporation | | | | | | | 421,208 | | | | 7,564,896 | |
MFA Mortgage Investments Incorporated | | | | | | | 237,100 | | | | 1,844,638 | |
| | | | |
| | | | | | | | | | | 9,409,534 | |
| | | | | | | | | | | | |
The accompanying notes are an integral part of these financial statements.
| | | | | | |
| Portfolio of investments—September 30, 2014 (unaudited) | | Wells Fargo Advantage Special Small Cap Value Fund | | | 9 | |
| | | | | | | | | | | | |
| Security name | | | | | | Shares | | | Value | |
| | | | |
| Thrifts & Mortgage Finance: 0.71% | | | | | | | | | | | | |
People’s United Financial Incorporated | | | | | | | 324,700 | | | $ | 4,698,409 | |
| | | | | | | | | | | | |
| | | | |
Health Care: 9.01% | | | | | | | | | | | | |
| | | | |
| Biotechnology: 0.11% | | | | | | | | | | | | |
Theravance Incorporated | | | | | | | 43,000 | | | | 734,870 | |
| | | | | | | | | | | | |
| | | | |
| Health Care Equipment & Supplies: 4.77% | | | | | | | | | | | | |
Analogic Corporation | | | | | | | 82,919 | | | | 5,303,499 | |
Haemonetics Corporation † | | | | | | | 249,500 | | | | 8,712,540 | |
ICU Medical Incorporated † | | | | | | | 87,063 | | | | 5,587,703 | |
Steris Corporation | | | | | | | 96,800 | | | | 5,223,328 | |
West Pharmaceutical Services Incorporated | | | | | | | 148,182 | | | | 6,632,626 | |
| | | | |
| | | | | | | | | | | 31,459,696 | |
| | | | | | | | | | | | |
| | | | |
| Health Care Providers & Services: 2.30% | | | | | | | | | | | | |
AMN Healthcare Services Incorporated † | | | | | | | 158,200 | | | | 2,483,740 | |
Hanger Incorporated † | | | | | | | 117,600 | | | | 2,413,152 | |
Owens & Minor Incorporated | | | | | | | 110,900 | | | | 3,630,866 | |
Patterson Companies Incorporated | | | | | | | 160,500 | | | | 6,649,515 | |
| | | | |
| | | | | | | | | | | 15,177,273 | |
| | | | | | | | | | | | |
| | | | |
| Life Sciences Tools & Services: 1.52% | | | | | | | | | | | | |
Bio-Rad Laboratories Incorporated Class A † | | | | | | | 47,800 | | | | 5,420,520 | |
Covance Incorporated † | | | | | | | 58,500 | | | | 4,603,950 | |
| | | | |
| | | | | | | | | | | 10,024,470 | |
| | | | | | | | | | | | |
| | | | |
| Pharmaceuticals: 0.31% | | | | | | | | | | | | |
Prestige Brands Holdings Incorporated † | | | | | | | 64,000 | | | | 2,071,680 | |
| | | | | | | | | | | | |
| | | | |
Industrials: 19.84% | | | | | | | | | | | | |
| | | | |
| Air Freight & Logistics: 1.21% | | | | | | | | | | | | |
Forward Air Corporation | | | | | | | 177,877 | | | | 7,974,226 | |
| | | | | | | | | | | | |
| | | | |
| Building Products: 2.28% | | | | | | | | | | | | |
Quanex Building Products Corporation | | | | | | | 250,699 | | | | 4,535,145 | |
Simpson Manufacturing Company Incorporated | | | | | | | 359,918 | | | | 10,491,610 | |
| | | | |
| | | | | | | | | | | 15,026,755 | |
| | | | | | | | | | | | |
| | | | |
| Commercial Services & Supplies: 5.52% | | | | | | | | | | | | |
ACCO Brands Corporation † | | | | | | | 806,769 | | | | 5,566,706 | |
Brady Corporation Class A | | | | | | | 150,000 | | | | 3,366,000 | |
Clean Harbors Incorporated † | | | | | | | 113,000 | | | | 6,092,960 | |
Courier Corporation | | | | | | | 328,245 | | | | 4,043,978 | |
Matthews International Corporation Class A | | | | | | | 172,798 | | | | 7,584,104 | |
Viad Corporation | | | | | | | 473,553 | | | | 9,778,869 | |
| | | | |
| | | | | | | | | | | 36,432,617 | |
| | | | | | | | | | | | |
| | | | |
| Construction & Engineering: 1.06% | | | | | | | | | | | | |
EMCOR Group Incorporated | | | | | | | 174,900 | | | | 6,989,004 | |
| | | | | | | | | | | | |
The accompanying notes are an integral part of these financial statements.
| | | | |
| 10 | | Wells Fargo Advantage Special Small Cap Value Fund | | Portfolio of investments—September 30, 2014 (unaudited) |
| | | | | | | | | | | | |
| Security name | | | | | | Shares | | | Value | |
| | | | |
| Electrical Equipment: 2.98% | | | | | | | | | | | | |
EnerSys | | | | | | | 60,300 | | | $ | 3,535,992 | |
Franklin Electric Company Incorporated | | | | | | | 309,800 | | | | 10,762,452 | |
Regal-Beloit Corporation | | | | | | | 83,400 | | | | 5,358,450 | |
| | | | |
| | | | | | | | | | | 19,656,894 | |
| | | | | | | | | | | | |
| | | | |
| Machinery: 6.07% | | | | | | | | | | | | |
Commercial Vehicle Group Incorporated † | | | | | | | 72,834 | | | | 450,114 | |
Douglas Dynamics Incorporated | | | | | | | 339,900 | | | | 6,628,050 | |
ESCO Technologies Incorporated | | | | | | | 109,600 | | | | 3,811,888 | |
Kadant Incorporated | | | | | | | 431,480 | | | | 16,849,294 | |
Mueller Industries Incorporated | | | | | | | 432,240 | | | | 12,336,130 | |
| | | | |
| | | | | | | | | | | 40,075,476 | |
| | | | | | | | | | | | |
| | | | |
| Professional Services: 0.72% | | | | | | | | | | | | |
Korn/Ferry International † | | | | | | | 191,746 | | | | 4,774,475 | |
| | | | | | | | | | | | |
| | | | |
Information Technology: 13.05% | | | | | | | | | | | | |
| | | | |
| Communications Equipment: 1.22% | | | | | | | | | | | | |
Aviat Networks Incorporated † | | | | | | | 834,247 | | | | 1,501,645 | |
Ixia Corporation † | | | | | | | 361,200 | | | | 3,301,368 | |
NETGEAR Incorporated † | | | | | | | 104,500 | | | | 3,265,625 | |
| | | | |
| | | | | | | | | | | 8,068,638 | |
| | | | | | | | | | | | �� |
| | | | |
| Electronic Equipment, Instruments & Components: 5.07% | | | | | | | | | | | | |
AVX Corporation | | | | | | | 368,698 | | | | 4,896,309 | |
GSI Group Incorporated † | | | | | | | 749,935 | | | | 8,616,753 | |
Knowles Corporation † | | | | | | | 218,800 | | | | 5,798,200 | |
Orbotech Limited † | | | | | | | 395,415 | | | | 6,160,566 | |
Vishay Intertechnology Incorporated | | | | | | | 561,521 | | | | 8,024,135 | |
| | | | |
| | | | | | | | | | | 33,495,963 | |
| | | | | | | | | | | | |
| | | | |
| IT Services: 2.17% | | | | | | | | | | | | |
Acxiom Corporation † | | | | | | | 221,500 | | | | 3,665,825 | |
DST Systems Incorporated | | | | | | | 43,884 | | | | 3,682,745 | |
Sykes Enterprises Incorporated † | | | | | | | 350,300 | | | | 6,998,994 | |
| | | | |
| | | | | | | | | | | 14,347,564 | |
| | | | | | | | | | | | |
| | | | |
| Semiconductors & Semiconductor Equipment: 1.29% | | | | | | | | | | | | |
DSP Group Incorporated † | | | | | | | 534,715 | | | | 4,742,922 | |
Exar Corporation † | | | | | | | 419,752 | | | | 3,756,780 | |
| | | | |
| | | | | | | | | | | 8,499,702 | |
| | | | | | | | | | | | |
| | | | |
| Software: 2.03% | | | | | | | | | | | | |
ACI Worldwide Incorporated † | | | | | | | 395,352 | | | | 7,416,804 | |
Progress Software Corporation † | | | | | | | 249,751 | | | | 5,971,546 | |
| | | | |
| | | | | | | | | | | 13,388,350 | |
| | | | | | | | | | | | |
The accompanying notes are an integral part of these financial statements.
| | | | | | |
| Portfolio of investments—September 30, 2014 (unaudited) | | Wells Fargo Advantage Special Small Cap Value Fund | | | 11 | |
| | | | | | | | | | | | | | | | |
| Security name | | | | | | | | Shares | | | Value | |
| | | | |
| Technology Hardware, Storage & Peripherals: 1.27% | | | | | | | | | | | | | | | | |
Imation Corporation †(l) | | | | | | | | | | | 2,336,402 | | | $ | 6,892,386 | |
Quantum Corporation Ǡ | | | | | | | | | | | 1,259,300 | | | | 1,460,788 | |
| | | | |
| | | | | | | | | | | | | | | 8,353,174 | |
| | | | | | | | | | | | | | | | |
| | | | |
Materials: 7.67% | | | | | | | | | | | | | | | | |
| | | | |
| Chemicals: 5.03% | | | | | | | | | | | | | | | | |
A. Schulman Incorporated | | | | | | | | | | | 242,158 | | | | 8,756,433 | |
Chemtura Corporation † | | | | | | | | | | | 150,200 | | | | 3,504,166 | |
Innospec Incorporated | | | | | | | | | | | 237,300 | | | | 8,519,070 | |
LSB Industries Incorporated † | | | | | | | | | | | 81,892 | | | | 2,924,363 | |
Plastec Technologies Limited (a) | | | | | | | | | | | 152,938 | | | | 994,097 | |
Scotts Miracle-Gro Company | | | | | | | | | | | 63,200 | | | | 3,476,000 | |
Sensient Technologies Corporation | | | | | | | | | | | 95,300 | | | | 4,988,955 | |
| | | | |
| | | | | | | | | | | | | | | 33,163,084 | |
| | | | | | | | | | | | | | | | |
| | | | |
| Paper & Forest Products: 2.64% | | | | | | | | | | | | | | | | |
Neenah Paper Incorporated | | | | | | | | | | | 172,914 | | | | 9,247,441 | |
Schweitzer Manduit International Incorporated | | | | | | | | | | | 198,500 | | | | 8,200,035 | |
| | | | |
| | | | | | | | | | | | | | | 17,447,476 | |
| | | | | | | | | | | | | | | | |
| | | | |
Total Common Stocks (Cost $563,454,527) | | | | | | | | | | | | | | | 612,054,113 | |
| | | | | | | | | | | | | | | | |
| | | | |
| Exchange-Traded Funds: 2.43% | | | | | | | | | | | | | | | | |
iShares Russell 2000 Index ETF | | | | | | | | | | | | | | | 3,279,188 | |
iShares Russell 2000 Value Index ETF « | | | | | | | | | | | | | | | 9,372,934 | |
iShares Micro-Cap ETF « | | | | | | | | | | | | | | | 3,408,562 | |
| | | | |
Total Exchange-Traded Funds (Cost $16,721,333) | | | | | | | | | | | | | | | 16,060,684 | |
| | | | | | | | | | | | | | | | |
| | | | |
Warrants: 0.00% | | | | | | | | | | | | | | | | |
| | | | |
| Industrials: 0.00% | | | | | | | | | | | | | | | | |
| | | | |
| | | | | | Expiration date | | | | | | | |
| Aerospace & Defense: 0.00% | | | | | | | | | | | | | | | | |
Plastec Technologies Limited †(a)(i) | | | | | | | 11-18-2014 | | | | 145,800 | | | | 0 | |
| | | | | | | | | | | | | | | | |
| | | | |
Total Warrants (Cost $0) | | | | | | | | | | | | | | | 0 | |
| | | | | | | | | | | | | | | | |
| | | | |
| | | Yield | | | | | | | | | | |
| Short-Term Investments: 7.57% | | | | | | | | | | | | | | | | |
| | | | |
| Investment Companies: 7.57% | | | | | | | | | | | | | | | | |
Wells Fargo Advantage Cash Investment Money Market Fund, Select Class (l)(u) | | | 0.07 | % | | | | | | | 32,849,404 | | | | 32,849,404 | |
Wells Fargo Securities Lending Cash Investments, LLC (r)(l)(u) | | | 0.11 | | | | | | | | 17,091,225 | | | | 17,091,225 | |
| | | | |
Total Short-Term Investments (Cost $49,940,629) | | | | | | | | | | | | | | | 49,940,629 | |
| | | | | | | | | | | | | | | | |
| | | | | | | | |
| Total investments in securities | | | | | | | | |
| (Cost $630,116,489) * | | | 102.74 | % | | | 678,055,426 | |
Other assets and liabilities, net | | | (2.74 | ) | | | (18,059,082 | ) |
| | | | | | | | |
| Total net assets | | | 100.00 | % | | $ | 659,996,344 | |
| | | | | | | | |
The accompanying notes are an integral part of these financial statements.
| | | | |
| 12 | | Wells Fargo Advantage Special Small Cap Value Fund | | Portfolio of investments—September 30, 2014 (unaudited) |
| † | Non-income-earning security |
| « | All or a portion of this security is on loan. |
| (a) | The security is fair valued by the Management Valuation Team, and in certain instances by the Board of Trustees, in accordance with procedures approved by the Board of Trustees. |
| (l) | The security represents an affiliate of the Fund as defined in the Investment Company Act of 1940. |
| (u) | The rate represents the 7-day annualized yield at period end. |
| (r) | The investment is a non-registered investment vehicle purchased with cash collateral received from securities on loan. |
| * | Cost for federal income tax purposes is $636,954,667 and unrealized gains (losses) consists of: |
| | | | |
Gross unrealized gains | | $ | 124,149,400 | |
Gross unrealized losses | | | (83,048,641 | ) |
| | | | |
Net unrealized gains | | $ | 41,100,759 | |
The accompanying notes are an integral part of these financial statements.
| | | | | | |
| Statement of assets and liabilities—September 30, 2014 (unaudited) | | Wells Fargo Advantage Special Small Cap Value Fund | | | 13 | |
| | | | |
| | | | |
| |
Assets | | | | |
Investments | | | | |
In unaffiliated securities (including $16,671,220 of securities loaned), at value (cost $535,608,707) | | $ | 621,222,411 | |
In affiliated securities, at value (cost $94,507,782) | | | 56,833,015 | |
| | | | |
Total investments, at value (cost $630,116,489) | | | 678,055,426 | |
Receivable for investments sold | | | 4,991,568 | |
Receivable for Fund shares sold | | | 941,976 | |
Receivable for dividends | | | 678,572 | |
Receivable for securities lending income | | | 11,050 | |
Prepaid expenses and other assets | | | 16,813 | |
| | | | |
Total assets | | | 684,695,405 | |
| | | | |
| |
Liabilities | | | | |
Payable for investments purchased | | | 6,172,559 | |
Payable for Fund shares redeemed | | | 620,782 | |
Payable upon receipt of securities loaned | | | 17,091,225 | |
Advisory fee payable | | | 415,280 | |
Distribution fees payable | | | 27,895 | |
Administration fees payable | | | 143,253 | |
Accrued expenses and other liabilities | | | 228,067 | |
| | | | |
Total liabilities | | | 24,699,061 | |
| | | | |
Total net assets | | $ | 659,996,344 | |
| | | | |
| |
NET ASSETS CONSIST OF | | | | |
Paid-in capital | | $ | 518,141,147 | |
Undistributed net investment income | | | 3,176,519 | |
Accumulated net realized gains on investments | | | 90,739,741 | |
Net unrealized gains on investments | | | 47,938,937 | |
| | | | |
Total net assets | | $ | 659,996,344 | |
| | | | |
| |
COMPUTATION OF NET ASSET VALUE AND OFFERING PRICE PER SHARE | | | | |
Net assets – Class A | | $ | 403,296,654 | |
Shares outstanding – Class A1 | | | 12,970,975 | |
Net asset value per share – Class A | | | $31.09 | |
Maximum offering price per share – Class A2 | | | $32.99 | |
Net assets – Class B | | $ | 3,088,283 | |
Shares outstanding – Class B1 | | | 107,637 | |
Net asset value per share – Class B | | | $28.69 | |
Net assets – Class C | | $ | 40,510,590 | |
Shares outstanding – Class C1 | | | 1,406,457 | |
Net asset value per share – Class C | | | $28.80 | |
Net assets – Administrator Class | | $ | 70,532,111 | |
Shares outstanding – Administrator Class1 | | | 2,223,872 | |
Net asset value per share – Administrator Class | | | $31.72 | |
Net assets – Institutional Class | | $ | 142,568,706 | |
Shares outstanding – Institutional Class1 | | | 4,491,943 | |
Net asset value per share – Institutional Class | | | $31.74 | |
| 1. | The Fund has an unlimited number of authorized shares. |
| 2. | Maximum offering price is computed as 100/94.25 of net asset value. On investments of $50,000 or more, the offering price is reduced. |
The accompanying notes are an integral part of these financial statements.
| | | | |
| 14 | | Wells Fargo Advantage Special Small Cap Value Fund | | Statement of operations—six months ended September 30, 2014 (unaudited) |
| | | | |
| | | | |
| |
Investment income | | | | |
Dividends (net of foreign withholding taxes of $17,200) | | $ | 6,094,583 | |
Securities lending income, net | | | 45,382 | |
Income from affiliated securities | | | 175,314 | |
| | | | |
Total investment income | | | 6,315,279 | |
| | | | |
| |
Expenses | | | | |
Advisory fee | | | 2,740,604 | |
Administration fees | | | | |
Fund level | | | 172,770 | |
Class A | | | 549,962 | |
Class B | | | 4,567 | |
Class C | | | 54,685 | |
Administrator Class | | | 38,617 | |
Institutional Class | | | 58,088 | |
Shareholder servicing fees | | | | |
Class A | | | 528,810 | |
Class B | | | 4,191 | |
Class C | | | 52,581 | |
Administrator Class | | | 94,274 | |
Distribution fees | | | | |
Class B | | | 13,174 | |
Class C | | | 157,744 | |
Custody and accounting fees | | | 31,314 | |
Professional fees | | | 25,726 | |
Registration fees | | | 19,427 | |
Shareholder report expenses | | | 44,830 | |
Trustees’ fees and expenses | | | 5,968 | |
Other fees and expenses | | | 13,897 | |
| | | | |
Total expenses | | | 4,611,229 | |
Less: Fee waivers and/or expense reimbursements | | | (197,144 | ) |
| | | | |
Net expenses | | | 4,414,085 | |
| | | | |
Net investment income | | | 1,901,194 | |
| | | | |
| |
REALIZED AND UNREALIZED GAINS (LOSSES) ON INVESTMENTS | | | | |
| |
Net realized gains on: | | | | |
Unaffiliated securities | | | 41,096,898 | |
Affiliated securities | | | 2,661,143 | |
| | | | |
Net realized gains on investments | | | 43,758,041 | |
| | | | |
| |
Net change in unrealized gains (losses) on: | | | | |
Unaffiliated securities | | | (69,451,426 | ) |
Affiliated securities | | | (7,736,179 | ) |
| | | | |
Net change in unrealized gains (losses) on investments | | | (77,187,605 | ) |
| | | | |
Net realized and unrealized gains (losses) on investments | | | (33,429,564 | ) |
| | | | |
Net decrease in net assets resulting from operations | | $ | (31,528,370 | ) |
| | | | |
The accompanying notes are an integral part of these financial statements.
| | | | | | |
| Statement of changes in net assets | | Wells Fargo Advantage Special Small Cap Value Fund | | | 15 | |
| | | | | | | | | | | | | | | | | | | | | | | | |
| | | Six months ended
September 30, 2014
(unaudited) | | | Year ended
March 31, 20141 | | | Year ended
October 31, 2013 | |
| | | | | | |
Operations | | | | | | | | | | | | | | | | | | | | | | | | |
Net investment income | | | | | | $ | 1,901,194 | | | | | | | $ | 2,345,450 | | | | | | | $ | 1,073,383 | |
Net realized gains on investments | | | | | | | 43,758,041 | | | | | | | | 58,414,250 | | | | | | | | 91,998,618 | |
Net change in unrealized gains (losses) on investments | | | | | | | (77,187,605 | ) | | | | | | | 10,826,295 | | | | | | | | 150,789,420 | |
| | | | |
Net increase (decrease) in net assets resulting from operations | | | | | | | (31,528,370 | ) | | | | | | | 71,585,995 | | | | | | | | 243,861,421 | |
| | | | |
| | | | | | |
Distributions to shareholders from | | | | | | | | | | | | | | | | | | | | | | | | |
Net investment income | | | | | | | | | | | | | | | | | | | | | | | | |
Class A | | | | | | | 0 | | | | | | | | (454,117 | ) | | | | | | | 0 | |
Administrator Class | | | | | | | 0 | | | | | | | | (64,798 | ) | | | | | | | (8,070 | ) |
Institutional Class | | | | | | | 0 | | | | | | | | (599,088 | ) | | | | | | | (231,386 | ) |
Net realized gains | | | | | | | | | | | | | | | | | | | | | | | | |
Class A | | | | | | | 0 | | | | | | | | (25,446,683 | ) | | | | | | | 0 | |
Class B | | | | | | | 0 | | | | | | | | (300,248 | ) | | | | | | | 0 | |
Class C | | | | | | | 0 | | | | | | | | (2,623,004 | ) | | | | | | | 0 | |
Administrator Class | | | | | | | 0 | | | | | | | | (6,075,524 | ) | | | | | | | 0 | |
Institutional Class | | | | | | | 0 | | | | | | | | (8,571,085 | ) | | | | | | | 0 | |
| | | | |
Total distributions to shareholders | | | | | | | 0 | | | | | | | | (44,134,547 | ) | | | | | | | (239,456 | ) |
| | | | |
| | | | | | |
Capital share transactions | | | Shares | | | | | | | | Shares | | | | | | | | Shares | | | | | |
Proceeds from shares sold | | | | | | | | | | | | | | | | | | | | | | | | |
Class A | | | 904,748 | | | | 29,106,421 | | | | 431,181 | | | | 13,546,405 | | | | 1,128,057 | | | | 29,699,929 | |
Class B | | | 314 | | | | 9,236 | | | | 1,164 | | | | 33,563 | | | | 2,195 | | | | 62,029 | |
Class C | | | 73,172 | | | | 2,199,727 | | | | 56,398 | | | | 1,647,900 | | | | 104,015 | | | | 2,607,737 | |
Administrator Class | | | 413,957 | | | | 13,571,225 | | | | 362,497 | | | | 11,672,912 | | | | 735,655 | | | | 19,822,818 | |
Institutional Class | | | 594,794 | | | | 19,392,962 | | | | 254,834 | | | | 8,168,966 | | | | 1,995,969 | | | | 53,030,396 | |
| | | | |
| | | | | | | 64,279,571 | | | | | | | | 35,069,746 | | | | | | | | 105,222,909 | |
| | | | |
Reinvestment of distributions | | | | | | | | | | | | | | | | | | | | | | | | |
Class A | | | 0 | | | | 0 | | | | 817,138 | | | | 25,138,694 | | | | 0 | | | | 0 | |
Class B | | | 0 | | | | 0 | | | | 10,074 | | | | 285,065 | | | | 0 | | | | 0 | |
Class C | | | 0 | | | | 0 | | | | 81,065 | | | | 2,322,508 | | | | 0 | | | | 0 | |
Administrator Class | | | 0 | | | | 0 | | | | 187,740 | | | | 5,877,515 | | | | 332 | | | | 7,912 | |
Institutional Class | | | 0 | | | | 0 | | | | 208,721 | | | | 6,550,312 | | | | 5,226 | | | | 124,733 | |
| | | | |
| | | | | | | 0 | | | | | | | | 40,174,094 | | | | | | | | 132,645 | |
| | | | |
Payment for shares redeemed | | | | | | | | | | | | | | | | | | | | | | | | |
Class A | | | (1,098,246 | ) | | | (35,330,375 | ) | | | (1,149,622 | ) | | | (36,108,005 | ) | | | (4,012,182 | ) | | | (106,617,151 | ) |
Class B | | | (32,581 | ) | | | (968,788 | ) | | | (34,517 | ) | | | (1,006,977 | ) | | | (264,006 | ) | | | (6,265,511 | ) |
Class C | | | (79,391 | ) | | | (2,368,033 | ) | | | (75,354 | ) | | | (2,211,159 | ) | | | (299,312 | ) | | | (7,290,904 | ) |
Administrator Class | | | (555,972 | ) | | | (18,428,703 | ) | | | (1,227,685 | ) | | | (39,026,744 | ) | | | (7,669,377 | ) | | | (229,787,904 | ) |
Institutional Class | | | (504,596 | ) | | | (16,513,225 | ) | | | (402,134 | ) | | | (13,013,457 | ) | | | (1,431,015 | ) | | | (38,809,000 | ) |
| | | | |
| | | | | | | (73,609,124 | ) | | | | | | | (91,366,342 | ) | | | | | | | (388,770,470 | ) |
| | | | |
Net decrease in net assets resulting from capital share transactions | | | | | | | (9,329,553 | ) | | | | | | | (16,122,502 | ) | | | | | | | (283,414,916 | ) |
| | | | |
Total increase (decrease) in net assets | | | | | | | (40,857,923 | ) | | | | | | | 11,328,946 | | | | | | | | (39,792,951 | ) |
| | | | |
| | |
Net assets | | | | | | | | |
Beginning of period | | | | | | | 700,854,267 | | | | | | | | 689,525,321 | | | | | | | | 729,318,272 | |
| | | | |
End of period | | | | | | $ | 659,996,344 | | | | | | | $ | 700,854,267 | | | | | | | $ | 689,525,321 | |
| | | | |
Undistributed net investment income | | | | | | $ | 3,176,519 | | | | | | | $ | 1,275,325 | | | | | | | $ | 178,497 | |
| | | | |
| 1. | For the five months ended March 31, 2014. The Fund changed its fiscal year end from October 31 to March 31, effective March 31, 2014. |
The accompanying notes are an integral part of these financial statements.
| | | | |
| 16 | | Wells Fargo Advantage Special Small Cap Value Fund | | Financial highlights |
(For a share outstanding throughout each period)
| | | | | | | | | | | | | | | | | | | | | | | | | | | | | | | | |
| | | Six months ended
September 30, 2014 (unaudited) | | | Year ended
March 31, 20141 | | | Year ended October 31 | | | Year ended July 31 | |
| CLASS A | | | | 2013 | | | 2012 | | | 2011 | | | 20102 | | | 20103 | | | 20093 | |
Net asset value, beginning of period | | $ | 32.59 | | | $ | 31.35 | | | $ | 22.97 | | | $ | 20.97 | | | $ | 19.78 | | | $ | 18.50 | | | $ | 15.51 | | | $ | 18.78 | |
Net investment income (loss) | | | 0.08 | | | | 0.10 | | | | (0.01 | )4 | | | (0.05 | ) | | | (0.05 | ) | | | (0.01 | ) | | | (0.02 | ) | | | 0.11 | |
Net realized and unrealized gains (losses) on investments | | | (1.58 | ) | | | 3.14 | | | | 8.37 | | | | 2.05 | | | | 1.24 | | | | 1.29 | | | | 3.07 | | | | (3.19 | ) |
| | | | | | | | | | | | | | | | | | | | | | | | | | | | | | | | |
Total from investment operations | | | (1.50 | ) | | | 3.24 | | | | 8.38 | | | | 2.00 | | | | 1.19 | | | | 1.28 | | | | 3.05 | | | | (3.08 | ) |
Distributions to shareholders from | | | | | | | | | | | | | | | | | | | | | | | | | | | | | | | | |
Net investment income | | | 0.00 | | | | (0.03 | ) | | | 0.00 | | | | 0.00 | | | | 0.00 | | | | 0.00 | | | | (0.01 | ) | | | (0.19 | ) |
Net realized gains | | | 0.00 | | | | (1.97 | ) | | | 0.00 | | | | 0.00 | | | | 0.00 | | | | 0.00 | | | | 0.00 | | | | (0.00 | )5 |
Tax basis return of capital | | | 0.00 | | | | 0.00 | | | | 0.00 | | | | 0.00 | | | | 0.00 | | | | 0.00 | | | | (0.05 | )4 | | | 0.00 | |
| | | | | | | | | | | | | | | | | | | | | | | | | | | | | | | | |
Total distributions to shareholders | | | 0.00 | | | | (2.00 | ) | | | 0.00 | | | | 0.00 | | | | 0.00 | | | | 0.00 | | | | (0.06 | ) | | | (0.19 | ) |
Net asset value, end of period | | $ | 31.09 | | | $ | 32.59 | | | $ | 31.35 | | | $ | 22.97 | | | $ | 20.97 | | | $ | 19.78 | | | $ | 18.50 | | | $ | 15.51 | |
Total return6 | | | (4.60 | )% | | | 10.74 | % | | | 36.48 | % | | | 9.54 | % | | | 6.02 | % | | | 6.92 | % | | | 19.72 | % | | | (16.17 | )% |
Ratios to average net assets (annualized) | | | | | | | | | | | | | | | | | | | | | | | | | | | | | | | | |
Gross expenses | | | 1.39 | % | | | 1.41 | % | | | 1.40 | % | | | 1.38 | % | | | 1.37 | % | | | 1.46 | % | | | 1.43 | % | | | 1.43 | % |
Net expenses | | | 1.34 | % | | | 1.34 | % | | | 1.34 | % | | | 1.34 | % | | | 1.34 | % | | | 1.34 | % | | | 1.39 | % | | | 1.33 | % |
Net investment income (loss) | | | 0.49 | % | | | 0.75 | % | | | 0.04 | % | | | (0.16 | )% | | | (0.14 | )% | | | (0.19 | )% | | | (0.07 | )% | | | 0.69 | % |
Supplemental data | | | | | | | | | | | | | | | | | | | | | | | | | | | | | | | | |
Portfolio turnover rate | | | 40 | % | | | 37 | % | | | 65 | % | | | 69 | % | | | 54 | % | | | 7 | % | | | 45 | % | | | 43 | % |
Net assets, end of period (000s omitted) | | | $403,297 | | | | $429,089 | | | | $409,557 | | | | $366,320 | | | | $387,767 | | | | $477,079 | | | | $472,903 | | | | $442,973 | |
| 1. | For the five months ended March 31, 2014. The Fund changed its fiscal year end from October 31 to March 31, effective March 31, 2014. |
| 2. | For the three months ended October 31, 2010. The Fund changed its fiscal year end from July 31 to October 31, effective October 31, 2010. |
| 3. | After the close of business on July 16, 2010, the Fund acquired the net assets of Evergreen Special Values Fund and Evergreen Small Cap Value Fund. Evergreen Special Values Fund became the accounting and performance survivor in the transaction. The information for the periods prior to July 19, 2010 is that of Class A of Evergreen Special Values Fund. |
| 4. | Calculated based upon average shares outstanding |
| 5. | Amount is less than $0.005. |
| 6. | Total return calculations do not include any sales charges. Returns for periods of less than one year are not annualized. |
The accompanying notes are an integral part of these financial statements.
| | | | | | |
| Financial highlights | | Wells Fargo Advantage Special Small Cap Value Fund | | | 17 | |
(For a share outstanding throughout each period)
| | | | | | | | | | | | | | | | | | | | | | | | | | | | | | | | |
| | | Six months ended September 30, 2014 (unaudited) | | | Year ended March 31, 20141 | | | Year ended October 31 | | | Year ended
July 31 | |
| CLASS B | | | | 2013 | | | 2012 | | | 2011 | | | 20102 | | | 20103 | | | 20093 | |
Net asset value, beginning of period | | $ | 30.19 | | | $ | 29.23 | | | $ | 21.58 | | | $ | 19.85 | | | $ | 18.87 | | | $ | 17.68 | | | $ | 14.88 | | | $ | 17.92 | |
Net investment income (loss) | | | (0.04 | )4 | | | 0.00 | 4,5 | | | (0.16 | )4 | | | (0.19 | )4 | | | (0.18 | )4 | | | (0.08 | ) | | | (0.14 | )4 | | | 0.00 | 4,5 |
Net realized and unrealized gains (losses) on investments | | | (1.46 | ) | | | 2.93 | | | | 7.81 | | | | 1.92 | | | | 1.16 | | | | 1.27 | | | | 2.94 | | | | (3.02 | ) |
| | | | | | | | | | | | | | | | | | | | | | | | | | | | | | | | |
Total from investment operations | | | (1.50 | ) | | | 2.93 | | | | 7.65 | | | | 1.73 | | | | 0.98 | | | | 1.19 | | | | 2.80 | | | | (3.02 | ) |
Distributions to shareholders from | | | | | | | | | | | | | | | | | | | | | | | | | | | | | | | | |
Net investment income | | | 0.00 | | | | 0.00 | | | | 0.00 | | | | 0.00 | | | | 0.00 | | | | 0.00 | | | | 0.00 | | | | (0.02 | ) |
Net realized gains | | | 0.00 | | | | (1.97 | ) | | | 0.00 | | | | 0.00 | | | | 0.00 | | | | 0.00 | | | | 0.00 | | | | (0.00 | )5 |
| | | | | | | | | | | | | | | | | | | | | | | | | | | | | | | | |
Total distributions to shareholders | | | 0.00 | | | | (1.97 | ) | | | 0.00 | | | | 0.00 | | | | 0.00 | | | | 0.00 | | | | 0.00 | | | | (0.02 | ) |
Net asset value, end of period | | $ | 28.69 | | | $ | 30.19 | | | $ | 29.23 | | | $ | 21.58 | | | $ | 19.85 | | | $ | 18.87 | | | $ | 17.68 | | | $ | 14.88 | |
Total return6 | | | (4.97 | )% | | | 10.42 | % | | | 35.45 | % | | | 8.72 | % | | | 5.19 | % | | | 6.73 | % | | | 18.82 | % | | | (16.83 | )% |
Ratios to average net assets (annualized) | | | | | | | | | | | | | | | | | | | | | | | | | | | | | | | | |
Gross expenses | | | 2.13 | % | | | 2.16 | % | | | 2.14 | % | | | 2.12 | % | | | 2.13 | % | | | 2.21 | % | | | 2.18 | % | | | 2.17 | % |
Net expenses | | | 2.09 | % | | | 2.09 | % | | | 2.09 | % | | | 2.09 | % | | | 2.09 | % | | | 2.09 | % | | | 2.15 | % | | | 2.07 | % |
Net investment income (loss) | | | (0.27 | )% | | | 0.02 | % | | | (0.64 | )% | | | (0.89 | )% | | | (0.88 | )% | | | (0.93 | )% | | | (0.82 | )% | | | 0.01 | % |
Supplemental data | | | | | | | | | | | | | | | | | | | | | | | | | | | | | | | | |
Portfolio turnover rate | | | 40 | % | | | 37 | % | | | 65 | % | | | 69 | % | | | 54 | % | | | 7 | % | | | 45 | % | | | 43 | % |
Net assets, end of period (000s omitted) | | | $3,088 | | | | $4,224 | | | | $4,770 | | | | $9,171 | | | | $22,053 | | | | $36,922 | | | | $36,654 | | | | $41,008 | |
| 1. | For the five months ended March 31, 2014. The Fund changed its fiscal year end from October 31 to March 31, effective March 31, 2014. |
| 2. | For the three months ended October 31, 2010. The Fund changed its fiscal year end from July 31 to October 31, effective October 31, 2010. |
| 3. | After the close of business on July 16, 2010, the Fund acquired the net assets of Evergreen Special Values Fund and Evergreen Small Cap Value Fund. Evergreen Special Values Fund became the accounting and performance survivor in the transaction. The information for the periods prior to July 19, 2010 is that of Class B of Evergreen Special Values Fund. |
| 4. | Calculated based upon average shares outstanding |
| 5. | Amount is less than $0.005. |
| 6. | Total return calculations do not include any sales charges. Returns for periods of less than one year are not annualized. |
The accompanying notes are an integral part of these financial statements.
| | | | |
| 18 | | Wells Fargo Advantage Special Small Cap Value Fund | | Financial highlights |
(For a share outstanding throughout each period)
| | | | | | | | | | | | | | | | | | | | | | | | | | | | | | | | |
| | | Six months ended
September 30, 2014 (unaudited) | | | Year ended March 31, 20141 | | | Year ended October 31 | | | Year ended
July 31 | |
| CLASS C | | | | 2013 | | | 2012 | | | 2011 | | | 20102 | | | 20103 | | | 20093 | |
Net asset value, beginning of period | | $ | 30.31 | | | $ | 29.34 | | | $ | 21.66 | | | $ | 19.92 | | | $ | 18.94 | | | $ | 17.74 | | | $ | 14.93 | | | $ | 17.98 | |
Net investment income (loss) | | | (0.04 | )4 | | | 0.00 | 4,5 | | | (0.18 | )4 | | | (0.19 | )4 | | | (0.18 | )4 | | | (0.07 | ) | | | (0.18 | ) | | | (0.00 | )4,5 |
Net realized and unrealized gains (losses) on investments | | | (1.47 | ) | | | 2.94 | | | | 7.86 | | | | 1.93 | | | | 1.16 | | | | 1.27 | | | | 2.99 | | | | (3.03 | ) |
| | | | | | | | | | | | | | | | | | | | | | | | | | | | | | | | |
Total from investment operations | | | (1.51 | ) | | | 2.94 | | | | 7.68 | | | | 1.74 | | | | 0.98 | | | | 1.20 | | | | 2.81 | | | | (3.03 | ) |
Distributions to shareholders from | | | | | | | | | | | | | | | | | | | | | | | | | | | | | | | | |
Net investment income | | | 0.00 | | | | 0.00 | | | | 0.00 | | | | 0.00 | | | | 0.00 | | | | 0.00 | | | | 0.00 | | | | (0.02 | ) |
Net realized gains | | | 0.00 | | | | (1.97 | ) | | | 0.00 | | | | 0.00 | | | | 0.00 | | | | 0.00 | | | | 0.00 | | | | (0.00 | )5 |
| | | | | | | | | | | | | | | | | | | | | | | | | | | | | | | | |
Total distributions to shareholders | | | 0.00 | | | | (1.97 | ) | | | 0.00 | | | | 0.00 | | | | 0.00 | | | | 0.00 | | | | 0.00 | | | | (0.02 | ) |
Net asset value, end of period | | $ | 28.80 | | | $ | 30.31 | | | $ | 29.34 | | | $ | 21.66 | | | $ | 19.92 | | | $ | 18.94 | | | $ | 17.74 | | | $ | 14.93 | |
Total return6 | | | (4.98 | )% | | | 10.42 | % | | | 35.46 | % | | | 8.73 | % | | | 5.17 | % | | | 6.76 | % | | | 18.82 | % | | | (16.79 | )% |
Ratios to average net assets (annualized) | | | | | | | | | | | | | | | | | | | | | | | | | | | | | | | | |
Gross expenses | | | 2.14 | % | | | 2.16 | % | | | 2.15 | % | | | 2.13 | % | | | 2.13 | % | | | 2.21 | % | | | 2.18 | % | | | 2.17 | % |
Net expenses | | | 2.09 | % | | | 2.09 | % | | | 2.09 | % | | | 2.09 | % | | | 2.09 | % | | | 2.09 | % | | | 2.12 | % | | | 2.07 | % |
Net investment income (loss) | | | (0.26 | )% | | | 0.00 | % | | | (0.71 | )% | | | (0.91 | )% | | | (0.89 | )% | | | (0.93 | )% | | | (0.80 | )% | | | (0.03 | )% |
Supplemental data | | | | | | | | | | | | | | | | | | | | | | | | | | | | | | | | |
Portfolio turnover rate | | | 40 | % | | | 37 | % | | | 65 | % | | | 69 | % | | | 54 | % | | | 7 | % | | | 45 | % | | | 43 | % |
Net assets, end of period (000s omitted) | | | $40,511 | | | | $42,816 | | | | $39,620 | | | | $33,478 | | | | $34,270 | | | | $40,850 | | | | $40,968 | | | | $38,744 | |
| 1. | For the five months ended March 31, 2014. The Fund changed its fiscal year end from October 31 to March 31, effective March 31, 2014. |
| 2. | For the three months ended October 31, 2010. The Fund changed its fiscal year end from July 31 to October 31, effective October 31, 2010. |
| 3. | After the close of business on July 16, 2010, the Fund acquired the net assets of Evergreen Special Values Fund and Evergreen Small Cap Value Fund. Evergreen Special Values Fund became the accounting and performance survivor in the transaction. The information for the periods prior to July 19, 2010 is that of Class C of Evergreen Special Values Fund. |
| 4. | Calculated based upon average shares outstanding |
| 5. | Amount is less than $0.005. |
| 6. | Total return calculations do not include any sales charges. Returns for periods of less than one year are not annualized. |
The accompanying notes are an integral part of these financial statements.
| | | | | | |
| Financial highlights | | Wells Fargo Advantage Special Small Cap Value Fund | | | 19 | |
(For a share outstanding throughout each period)
| | | | | | | | | | | | | | | | | | | | | | | | | | | | | | | | |
| | | Six months ended September 30, 2014
(unaudited) | | | Year ended March 31, 20141 | | | Year ended October 31 | | | Year ended July 31 | |
| ADMINISTRATOR CLASS | | | | 2013 | | | 2012 | | | 2011 | | | 20102 | | | 20103 | | | 20093 | |
Net asset value, beginning of period | | $ | 33.21 | | | $ | 31.85 | | | $ | 23.28 | | | $ | 21.21 | | | $ | 19.96 | | | $ | 18.65 | | | $ | 15.63 | | | $ | 18.95 | |
Net investment income | | | 0.12 | 4 | | | 0.14 | 4 | | | 0.08 | 4 | | | 0.02 | 4 | | | 0.02 | 4 | | | 0.01 | | | | 0.04 | 4 | | | 0.16 | |
Net realized and unrealized gains (losses) on investments | | | (1.61 | ) | | | 3.21 | | | | 8.49 | | | | 2.05 | | | | 1.23 | | | | 1.30 | | | | 3.04 | | | | (3.23 | ) |
| | | | | | | | | | | | | | | | | | | | | | | | | | | | | | | | |
Total from investment operations | | | (1.49 | ) | | | 3.35 | | | | 8.57 | | | | 2.07 | | | | 1.25 | | | | 1.31 | | | | 3.08 | | | | (3.07 | ) |
Distributions to shareholders from | | | | | | | | | | | | | | | | | | | | | | | | | | | | | | | | |
Net investment income | | | 0.00 | | | | (0.02 | ) | | | (0.00 | )5 | | | 0.00 | | | | 0.00 | | | | 0.00 | | | | (0.01 | ) | | | (0.25 | ) |
Net realized gains | | | 0.00 | | | | (1.97 | ) | | | 0.00 | | | | 0.00 | | | | 0.00 | | | | 0.00 | | | | 0.00 | | | | (0.00 | )5 |
Tax basis return of capital | | | 0.00 | | | | 0.00 | | | | 0.00 | | | | 0.00 | | | | 0.00 | | | | 0.00 | | | | (0.05 | )4 | | | 0.00 | |
| | | | | | | | | | | | | | | | | | | | | | | | | | | | | | | | |
Total distributions to shareholders | | | 0.00 | | | | (1.99 | ) | | | (0.00 | )5 | | | 0.00 | | | | 0.00 | | | | 0.00 | | | | (0.06 | ) | | | (0.25 | ) |
Net asset value, end of period | | $ | 31.72 | | | $ | 33.21 | | | $ | 31.85 | | | $ | 23.28 | | | $ | 21.21 | | | $ | 19.96 | | | $ | 18.65 | | | $ | 15.63 | |
Total return6 | | | (4.49 | )% | | | 10.91 | % | | | 36.82 | % | | | 9.76 | % | | | 6.26 | % | | | 7.02 | % | | | 20.02 | % | | | (15.96 | )% |
Ratios to average net assets (annualized) | | | | | | | | | | | | | | | | | | | | | | | | | | | | | | | | |
Gross expenses | | | 1.23 | % | | | 1.24 | % | | | 1.23 | % | | | 1.22 | % | | | 1.22 | % | | | 1.30 | % | | | 1.17 | % | | | 1.18 | % |
Net expenses | | | 1.09 | % | | | 1.09 | % | | | 1.09 | % | | | 1.09 | % | | | 1.09 | % | | | 1.09 | % | | | 1.13 | % | | | 1.08 | % |
Net investment income | | | 0.75 | % | | | 1.04 | % | | | 0.30 | % | | | 0.10 | % | | | 0.12 | % | | | 0.05 | % | | | 0.21 | % | | | 0.95 | % |
Supplemental data | | | | | | | | | | | | | | | | | | | | | | | | | | | | | | | | |
Portfolio turnover rate | | | 40 | % | | | 37 | % | | | 65 | % | | | 69 | % | | | 54 | % | | | 7 | % | | | 45 | % | | | 43 | % |
Net assets, end of period (000s omitted) | | | $70,532 | | | | $78,563 | | | | $96,940 | | | | $232,283 | | | | $273,510 | | | | $335,766 | | | | $320,814 | | | | $525,865 | |
| 1. | For the five months ended March 31, 2014. The Fund changed its fiscal year end from October 31 to March 31, effective March 31, 2014. |
| 2. | For the three months ended October 31, 2010. The Fund changed its fiscal year end from July 31 to October 31, effective October 31, 2010. |
| 3. | After the close of business on July 16, 2010, the Fund acquired the net assets of Evergreen Special Values Fund and Evergreen Small Cap Value Fund. Evergreen Special Values Fund became the accounting and performance survivor in the transaction. The information for the periods prior to July 19, 2010 is that of Class I of Evergreen Special Values Fund. |
| 4. | Calculated based upon average shares outstanding |
| 5. | Amount is less than $0.005. |
| 6. | Returns for periods of less than one year are not annualized. |
The accompanying notes are an integral part of these financial statements.
| | | | |
| 20 | | Wells Fargo Advantage Special Small Cap Value Fund | | Financial highlights |
(For a share outstanding throughout each period)
| | | | | | | | | | | | | | | | | | | | | | | | | | | | |
| | | Six months ended
September 30, 2014 (unaudited) | | | Year ended March 31, 20141 | | | Year ended October 31 | | | Year ended July 31, 20103 | |
| INSTITUTIONAL CLASS | | | | 2013 | | | 2012 | | | 2011 | | | 20102 | | |
Net asset value, beginning of period | | $ | 33.21 | | | $ | 31.94 | | | $ | 23.36 | | | $ | 21.24 | | | $ | 19.96 | | | $ | 18.66 | | | $ | 18.66 | |
Net investment income (loss) | | | 0.14 | | | | 0.15 | | | | 0.10 | | | | 0.05 | 4 | | | 0.04 | | | | (0.02 | )4 | | | 0.00 | 4,5 |
Net realized and unrealized gains
(losses) on investments | | | (1.61 | ) | | | 3.22 | | | | 8.53 | | | | 2.07 | | | | 1.24 | | | | 1.32 | | | | 0.00 | 4 |
| | | | | | | | | | | | | | | | | | | | | | | | | | | | |
Total from investment operations | | | (1.47 | ) | | | 3.37 | | | | 8.63 | | | | 2.12 | | | | 1.28 | | | | 1.30 | | | | 0.00 | 4 |
Distributions to shareholders from | | | | | | | | | | | | | | | | | | | | | | | | | | | | |
Net investment income | | | 0.00 | | | | (0.13 | ) | | | (0.05 | ) | | | 0.00 | | | | 0.00 | | | | 0.00 | | | | 0.00 | |
Net realized gains | | | 0.00 | | | | (1.97 | ) | | | 0.00 | | | | 0.00 | | | | 0.00 | | | | 0.00 | | | | 0.00 | |
| | | | | | | | | | | | | | | | | | | | | | | | | | | | |
Total distributions to shareholders | | | 0.00 | | | | (2.10 | ) | | | (0.05 | ) | | | 0.00 | | | | 0.00 | | | | 0.00 | | | | 0.00 | |
Net asset value, end of period | | $ | 31.74 | | | $ | 33.21 | | | $ | 31.94 | | | $ | 23.36 | | | $ | 21.24 | | | $ | 19.96 | | | $ | 18.66 | |
Total return6 | | | (4.43 | )% | | | 10.97 | % | | | 37.02 | % | | | 9.98 | % | | | 6.41 | % | | | 7.02 | % | | | 0.00 | % |
Ratios to average net assets (annualized) | | | | | | | | | | | | | | | | | | | | | | | | | | | | |
Gross expenses | | | 0.96 | % | | | 0.98 | % | | | 0.97 | % | | | 0.95 | % | | | 0.94 | % | | | 1.10 | % | | | 0.00 | % |
Net expenses | | | 0.94 | % | | | 0.94 | % | | | 0.94 | % | | | 0.94 | % | | | 0.93 | % | | | 0.94 | % | | | 0.00 | % |
Net investment income (loss) | | | 0.89 | % | | | 1.15 | % | | | 0.42 | % | | | 0.21 | % | | | 0.19 | % | | | (0.38 | )% | | | 0.00 | % |
Supplemental data | | | | | | | | | | | | | | | | | | | | | | | | | | | | |
Portfolio turnover rate | | | 40 | % | | | 37 | % | | | 65 | % | | | 69 | % | | | 54 | % | | | 7 | % | | | 45 | % |
Net assets, end of period (000s omitted) | | | $142,569 | | | | $146,162 | | | | $138,638 | | | | $88,067 | | | | $27,217 | | | | $3,106 | | | | $10 | |
| 1. | For the five months ended March 31, 2014. The Fund changed its fiscal year end from October 31 to March 31, effective March 31, 2014. |
| 2. | For the three months ended October 31, 2010. The Fund changed its fiscal year end from July 31 to October 31, effective October 31, 2010. |
| 3. | For the period July 30, 2010 (commencement of class operation) to July 31, 2010 |
| 4. | Calculated based upon average shares outstanding |
| 5. | Amount is less than $0.005. |
| 6. | Returns for periods of less than one year are not annualized. |
The accompanying notes are an integral part of these financial statements.
| | | | | | |
| Notes to financial statements (unaudited) | | Wells Fargo Advantage Special Small Cap Value Fund | | | 21 | |
1. ORGANIZATION
Wells Fargo Funds Trust (the “Trust”), a Delaware statutory trust organized on March 10, 1999, is an open-end management investment company registered under the Investment Company Act of 1940, as amended (the “1940 Act”). These financial statements report on the Wells Fargo Advantage Special Small Cap Value Fund (the “Fund”) which is a diversified series of the Trust.
2. SIGNIFICANT ACCOUNTING POLICIES
The following significant accounting policies, which are consistently followed in the preparation of the financial statements of the Fund, are in conformity with U.S. generally accepted accounting principles which require management to make estimates and assumptions that affect the reported amounts of assets and liabilities, disclosure of contingent assets and liabilities at the date of the financial statements, and the reported amounts of revenues and expenses during the reporting period. Actual results could differ from those estimates.
Securities valuation
All investments are valued each business day as of the close of regular trading on the New York Stock Exchange (generally 4 p.m. Eastern Time).
Equity securities and futures that are listed on a foreign or domestic exchange or market are valued at the official closing price or, if none, the last sales price. If no sale occurs on the primary exchange or market for the security that day, the prior day’s price will be deemed “stale” and fair values will be determined in accordance with the Fund’s Valuation Procedures.
Investments in registered open-end investment companies are valued at net asset value. Non-registered investment vehicles are fair valued at net asset value.
Investments which are not valued using any of the methods discussed above are valued at their fair value, as determined in good faith by the Board of Trustees of the Fund. The Board of Trustees has established a Valuation Committee comprised of the Trustees and has delegated to it the authority to take any actions regarding the valuation of portfolio securities that the Valuation Committee deems necessary or appropriate, including determining the fair value of portfolio securities, unless the determination has been delegated to the Management Valuation Team of Wells Fargo Funds Management, LLC (“Funds Management”). The Board of Trustees retains the authority to make or ratify any valuation decisions or approve any changes to the Valuation Procedures as it deems appropriate. On a quarterly basis, the Board of Trustees receives reports on any valuation actions taken by the Valuation Committee or the Management Valuation Team which may include items for ratification.
Valuations of fair valued securities are compared to the next actual sales price when available, or other appropriate market values, to assess the continued appropriateness of the fair valuation methodologies used. These securities are fair valued on a day-to-day basis, taking into consideration changes to appropriate market information and any significant changes to the inputs considered in the valuation process until there is a readily available price provided on an exchange or by an independent pricing service. Valuations received from an independent pricing service or independent broker-dealer quotes are periodically validated by comparisons to most recent trades and valuations provided by other independent pricing services in addition to the review of prices by the adviser and/or subadviser. Unobservable inputs used in determining fair valuations are identified based on the type of security, taking into consideration factors utilized by market participants in valuing the investment, knowledge about the issuer and the current market environment.
Security loans
The Fund may lend its securities from time to time in order to earn additional income in the form of fees or interest on securities received as collateral or the investment of any cash received as collateral. The Fund continues to receive interest or dividends on the securities loaned. The Fund receives collateral in the form of cash or securities with a value at least equal to the value of the securities on loan. The value of the loaned securities is determined at the close of each business day and any additional required collateral is delivered to the Fund on the next business day. In a securities lending transaction, the net asset value of the Fund will be affected by an increase or decrease in the value of the securities loaned and by an increase or decrease in the value of the instrument in which collateral is invested. The amount of securities lending activity undertaken by the Fund fluctuates from time to time. In the event of default or bankruptcy by the borrower, the Fund may be prevented from recovering the loaned securities or gaining access to the collateral or may experience delays or costs in doing so. In addition, the investment of any cash collateral received may lose all or part of its value. The Fund has the right under the lending agreement to recover the securities from the borrower on demand.
The Fund lends its securities through an unaffiliated securities lending agent. Cash collateral received in connection with its securities lending transactions is invested in Wells Fargo Securities Lending Cash Investments, LLC (the “Securities
| | | | |
| 22 | | Wells Fargo Advantage Special Small Cap Value Fund | | Notes to financial statements (unaudited) |
Lending Fund”). The Securities Lending Fund is exempt from registration under Section 3(c)(7) of the 1940 Act and is managed by Funds Management and is subadvised by Wells Capital Management Incorporated (“WellsCap”). Funds Management receives an advisory fee starting at 0.05% and declining to 0.01% as the average daily net assets of the Securities Lending Fund increase. All of the fees received by Funds Management are paid to WellsCap for its services as subadviser. The Securities Lending Fund seeks to provide a positive return compared to the daily Fed Funds Open rate by investing in high-quality, U.S. dollar-denominated short-term money market instruments. Securities Lending Fund investments are fair valued based upon the amortized cost valuation technique. Income earned from investment in the Securities Lending Fund is included in securities lending income on the Statement of Operations.
Futures contracts
The Fund is subject to equity price risk in the normal course of pursuing its investment objectives. The Fund may buy and sell futures contracts in order to gain exposure to, or protect against, changes in security values and interest rates. The primary risks associated with the use of futures contracts are the imperfect correlation between changes in market values of securities held by the Fund and the prices of futures contracts, and the possibility of an illiquid market.
The aggregate principal amounts of the contracts are not recorded in the financial statements. Fluctuations in the value of the contracts are recorded in the Statement of Assets and Liabilities as an asset or liability and in the Statement of Operations as unrealized gains or losses until the contracts are closed, at which point they are recorded as net realized gains or losses on futures contracts. With futures contracts, there is minimal counterparty risk to the Fund since futures are exchange traded and the exchange’s clearinghouse, as counterparty to all exchange traded futures, guarantees the futures against default.
Security transactions and income recognition
Securities transactions are recorded on a trade date basis. Realized gains or losses are recorded on the basis of identified cost.
Dividend income is recognized on the ex-dividend date. Dividend income is recorded net of foreign taxes withheld where recovery of such taxes is not assured.
Distributions to shareholders
Distributions to shareholders from net investment income and net realized gains, if any, are recorded on the ex-dividend date. Such distributions are determined in conformity with federal income tax regulations, which may differ in amount or character from net investment income and realized gains recognized for purposes of U.S. generally accepted accounting principles.
Federal and other taxes
The Fund intends to continue to qualify as a regulated investment company by distributing substantially all of its investment company taxable income and any net realized capital gains (after reduction for capital loss carryforwards) sufficient to relieve it from all, or substantially all, federal income taxes. Accordingly, no provision for federal income taxes was required.
The Fund’s income and federal excise tax returns and all financial records supporting those returns for the prior three fiscal years are subject to examination by the federal and Delaware revenue authorities. Management has analyzed the Fund’s tax positions taken on federal, state, and foreign tax returns for all open tax years and does not believe that there are any uncertain tax positions that require recognition of a tax liability.
As of March 31, 2014, the Fund had capital loss carryforwards available to offset future net realized capital gains in the amount of $4,256,886 expiring in 2017.
Class allocations
The separate classes of shares offered by the Fund differ principally in applicable sales charges, distribution, shareholder servicing, and administration fees. Class specific expenses are charged directly to that share class. Investment income, common expenses, and realized and unrealized gains (losses) on investments are allocated daily to each class of shares based on the relative proportion of net assets of each class.
3. FAIR VALUATION MEASUREMENTS
Fair value measurements of investments are determined within a framework that has established a fair value hierarchy based upon the various data inputs utilized in determining the value of the Fund’s investments. The three-level hierarchy gives the highest priority to unadjusted quoted prices in active markets for identical assets or liabilities (Level 1) and the
| | | | | | |
| Notes to financial statements (unaudited) | | Wells Fargo Advantage Special Small Cap Value Fund | | | 23 | |
lowest priority to significant unobservable inputs (Level 3). The Fund’s investments are classified within the fair value hierarchy based on the lowest level of input that is significant to the fair value measurement. The inputs are summarized into three broad levels as follows:
| n | | Level 1 – quoted prices in active markets for identical securities |
| n | | Level 2 – other significant observable inputs (including quoted prices for similar securities, interest rates, prepayment speeds, credit risk, use of amortized cost, etc.) |
| n | | Level 3 – significant unobservable inputs (including the Fund’s own assumptions in determining the fair value of investments) |
The inputs or methodologies used for valuing investments in securities are not necessarily an indication of the risk associated with investing in those securities.
The following is a summary of the inputs used in valuing the Fund’s assets and liabilities as of September 30, 2014:
| | | | | | | | | | | | | | | | |
| | | Quoted prices (Level 1) | | | Other significant observable inputs (Level 2) | | | Significant unobservable inputs (Level 3) | | | Total | |
Assets | | | | | | | | | | | | | | | | |
Investments in : | | | | | | | | | | | | | | | | |
| | | | |
Common stocks | | | | | | | | | | | | | | | | |
Consumer Discretionary | | $ | 87,261,205 | | | $ | 0 | | | $ | 0 | | | $ | 87,261,205 | |
Consumer Staples | | | 39,861,080 | | | | 0 | | | | 0 | | | | 39,861,080 | |
Energy | | | 23,146,256 | | | | 6,734,325 | | | | 0 | | | | 29,880,581 | |
Financials | | | 135,473,964 | | | | 0 | | | | 0 | | | | 135,473,964 | |
Health Care | | | 59,467,989 | | | | 0 | | | | 0 | | | | 59,467,989 | |
Industrials | | | 123,345,343 | | | | 0 | | | | 0 | | | | 123,345,343 | |
Information Technology | | | 86,153,391 | | | | 0 | | | | 0 | | | | 86,153,391 | |
Materials | | | 49,616,463 | | | | 0 | | | | 994,097 | | | | 50,610,560 | |
| | | | |
Exchange-traded funds | | | 16,060,684 | | | | 0 | | | | 0 | | | | 16,060,684 | |
| | | | |
Short-term investments | | | | | | | | | | | | | | | | |
Investment companies | | | 32,849,404 | | | | 17,091,225 | | | | 0 | | | | 49,940,629 | |
Total assets | | $ | 653,235,779 | | | $ | 23,825,550 | | | $ | 994,097 | | | $ | 678,055,426 | |
Transfers in and transfers out are recognized at the end of the reporting period. At September 30, 2014, the Fund did not have any transfers into/out of Level 1, Level 2, or Level 3.
4. TRANSACTIONS WITH AFFILIATES
Advisory fee
The Trust has entered into an advisory contract with Funds Management, an indirect wholly owned subsidiary of Wells Fargo & Company (“Wells Fargo”). The adviser is responsible for implementing investment policies and guidelines and for supervising the subadviser, who is responsible for day-to-day portfolio management of the Fund.
Pursuant to the contract, Funds Management is entitled to receive an annual advisory fee starting at 0.80% and declining to 0.68% as the average daily net assets of the Fund increase. For the six months ended September 30, 2014, the advisory fee was equivalent to an annual rate of 0.79% of the Fund’s average daily net assets.
Funds Management has retained the services of a subadviser to provide daily portfolio management to the Fund. The fee for subadvisory services is borne by Funds Management. WellsCap, an affiliate of Funds Management and an indirect wholly owned subsidiary of Wells Fargo, is the subadviser to the Fund and is entitled to receive a fee from Funds Management at an annual rate starting at 0.55% and declining to 0.40% as the average daily net assets of the Fund increase.
Administration fees
The Trust has entered into an administration agreement with Funds Management. Under this agreement, for providing administrative services, which includes paying fees and expenses for services provided by the transfer agent, sub-transfer agents, omnibus account servicers and record-keepers, Funds Management is entitled to receive from the Fund an
| | | | |
| 24 | | Wells Fargo Advantage Special Small Cap Value Fund | | Notes to financial statements (unaudited) |
annual fund level administration fee starting at 0.05% and declining to 0.03% as the average daily net assets of the Fund increase and a class level administration fee which is calculated based on the average daily net assets of each class as follows:
| | | | |
| | | Class level administration fee | |
Class A, Class B, Class C | | | 0.26 | % |
Administrator Class | | | 0.10 | |
Institutional Class | | | 0.08 | |
Funds Management has contractually waived and/or reimbursed advisory and administration fees to the extent necessary to maintain certain net operating expense ratios for the Fund. Waiver of fees and/or reimbursement of expenses by Funds Management were made first from fund level expenses on a proportionate basis and then from class specific expenses. Funds Management has committed through July 31, 2015 to waive fees and/or reimburse expenses to the extent necessary to cap the Fund’s expenses at 1.34% for Class A shares, 2.09% for Class B shares, 2.09% for Class C shares, 1.09 % for Administrator Class and 0.94% for Institutional Class shares. After this time, the cap may be increased or the commitment to maintain the cap may be terminated only with the approval of the Board of Trustees.
Distribution fees
The Trust has adopted a Distribution Plan for Class B and Class C shares of the Fund pursuant to Rule 12b-1 under the 1940 Act. Distribution fees are charged to Class B and Class C shares and paid to Wells Fargo Funds Distributor, LLC (“Funds Distributor”), the principal underwriter, at an annual rate of 0.75% of the average daily net assets of Class B and Class C shares.
In addition, Funds Distributor is entitled to receive the front-end sales charge from the purchase of Class A shares and a contingent deferred sales charge on the redemption of certain shares. Funds Distributor is also entitled to receive the contingent deferred sales charges from redemptions of Class B and Class C shares. For the six months ended September 30, 2014, Funds Distributor received $6,094 from the sale of Class A shares and $19 and $115 in contingent deferred sales charges from redemptions of Class B and Class C shares, respectively
Shareholder servicing fees
The Trust has entered into contracts with one or more shareholder servicing agents, whereby Class A, Class B, Class C, and Administrator Class of the Fund is charged a fee at an annual rate of 0.25% of the average daily net assets of each respective class.
A portion of these total shareholder servicing fees were paid to affiliates of Wells Fargo.
5. INVESTMENT PORTFOLIO TRANSACTIONS
Purchases and sales of investments, excluding U.S. government obligations (if any) and short-term securities, for six months ended September 30, 2014 were $264,325,147 and $274,504,357, respectively.
6. INVESTMENTS IN AFFILIATES
An affiliated investment is a company in which the Fund has ownership of at least 5% of the outstanding voting shares. The following is a summary of transactions in issuers that were either affiliates of the Fund at the beginning of the period or the end of the period.
| | | | | | | | | | | | | | | | | | | | | | | | | | | | |
| | | Shares, beginning
of period | | | Shares
purchased | | | Shares
sold | | | Shares, end of
period | | | Value, end of period | | | Income from
affiliated securities | | | Realized gains (losses) | |
Imation Corporation | | | 2,245,600 | | | | 120,302 | | | | 29,500 | | | | 2,336,402 | | | $ | 6,892,386 | | | $ | 0 | | | $ | (56,656 | ) |
Kadant Incorporation* | | | 572,066 | | | | 38,700 | | | | 179,286 | | | | 431,480 | | | | 16,849,294 | | | | 163,250 | | | | 2,717,799 | |
| | | | $ | 163,250 | | | $ | 2,661,143 | |
| * | No longer an affiliate of the Fund at the end of the period. |
| | | | | | |
| Notes to financial statements (unaudited) | | Wells Fargo Advantage Special Small Cap Value Fund | | | 25 | |
7. BANK BORROWINGS
The Trust (excluding the money market funds and certain other funds in the Trust) and Wells Fargo Variable Trust are parties to a $150,000,000 revolving credit agreement whereby the Fund is permitted to use bank borrowings for temporary or emergency purposes, such as to fund shareholder redemption requests. Interest under the credit agreement is charged to the Fund based on a borrowing rate equal to the higher of the Federal Funds rate in effect on that day plus 1.25% or the overnight LIBOR rate in effect on that day plus 1.25%. In addition, an annual commitment fee equal to 0.10% of the unused balance is allocated to each participating fund. For the six months ended September 30, 2014, the Fund paid $649 in commitment fees.
For the six months ended September 30, 2014, there were no borrowings by the Fund under the agreement.
9. INDEMNIFICATION
Under the Trust’s organizational documents, the officers and Trustees are indemnified against certain liabilities that may arise out of performance of their duties to the Trust. Additionally, in the normal course of business, the Trust may enter into contracts with service providers that contain a variety of indemnification clauses. The Trust’s maximum exposure under these arrangements is dependent on future claims that may be made against the Fund and, therefore, cannot be estimated.
| | | | |
| 26 | | Wells Fargo Advantage Special Small Cap Value Fund | | Other information (unaudited) |
PROXY VOTING INFORMATION
A description of the policies and procedures that the Fund uses to determine how to vote proxies relating to portfolio securities is available without charge, upon request, by calling 1-800-222-8222, visiting our website at wellsfargoadvantagefunds.com, or visiting the SEC website at sec.gov. Information regarding how the Fund voted proxies relating to portfolio securities during the most recent 12-month period ended June 30 is available without charge on the Fund’s website at wellsfargoadvantagefunds.com or by visiting the SEC website at sec.gov.
PORTFOLIO HOLDINGS INFORMATION
The complete portfolio holdings for the Fund are publicly available monthly on the Fund’s website (wellsfargoadvantagefunds.com), on a one-month delayed basis. In addition, top ten holdings information (excluding derivative positions) for the Fund is publicly available on the Fund’s website on a monthly, seven-day or more delayed basis. The Fund files its complete schedule of portfolio holdings with the SEC for the first and third quarters of each fiscal year on Form N-Q, which is available without charge by visiting the SEC website at sec.gov. In addition, the Fund’s Form N-Q may be reviewed and copied at the SEC’s Public Reference Room in Washington, DC, and at regional offices in New York City, at 233 Broadway, and in Chicago, at 175 West Jackson Boulevard, Suite 900. Information about the Public Reference Room may be obtained by calling 1-800-SEC-0330.
| | | | | | |
| Other information (unaudited) | | Wells Fargo Advantage Special Small Cap Value Fund | | | 27 | |
BOARD OF TRUSTEES AND OFFICERS
Each of the Trustees and Officers1 listed in the table below acts in identical capacities for each fund in the Wells Fargo Advantage family of funds, which consists of 133 mutual funds comprising the Wells Fargo Funds Trust, Wells Fargo Variable Trust, Wells Fargo Master Trust and four closed-end funds (collectively the “Fund Complex”). This table should be read in conjunction with the Prospectus and the Statement of Additional Information2. The mailing address of each Trustee and Officer is 525 Market Street, 12th Floor, San Francisco, CA 94105. Each Trustee and Officer serves an indefinite term, however, each Trustee serves such term until reaching the mandatory retirement age established by the Trustees.
Independent Trustees
| | | | | | |
Name and year of birth | | Position held and length of service* | | Principal occupations during past five years or longer | | Other directorships during past five years |
Peter G. Gordon (Born 1942) | | Trustee, since 1998; Chairman, since 2005 | | Co-Founder, Retired Chairman, President and CEO of Crystal Geyser Water Company. Trustee Emeritus, Colby College. | | Asset Allocation Trust |
Isaiah Harris, Jr. (Born 1952) | | Trustee, since 2009 | | Retired. Prior thereto, President and CEO of BellSouth Advertising and Publishing Corp. from 2005 to 2007, President and CEO of BellSouth Enterprises from 2004 to 2005 and President of BellSouth Consumer Services from 2000 to 2003. Emeritus member of the Iowa State University Foundation Board of Governors. Emeritus Member of the Advisory Board of Iowa State University School of Business. Advisory Board Member, Palm Harbor Academy. Mr. Harris is a certified public accountant. | | CIGNA Corporation; Asset Allocation Trust |
Judith M. Johnson (Born 1949) | | Trustee, since 2008; Audit Committee Chairman, since 2008 | | Retired. Prior thereto, Chief Executive Officer and Chief Investment Officer of Minneapolis Employees Retirement Fund from 1996 to 2008. Ms. Johnson is an attorney, certified public accountant and a certified managerial accountant. | | Asset Allocation Trust |
Leroy Keith, Jr. (Born 1939) | | Trustee, since 2010 | | Chairman, Bloc Global Services (development and construction). Trustee of the Evergreen Funds complex (and its predecessors) from 1983 to 2010. Former Managing Director, Almanac Capital Management (commodities firm), former Partner, Stonington Partners, Inc. (private equity fund), former Director, Obagi Medical Products Co. and former Director, Lincoln Educational Services. | | Trustee, Virtus Fund Complex (consisting of 50 portfolios as of 12/16/2013); Asset Allocation Trust |
David F. Larcker (Born 1950) | | Trustee, since 2009 | | James Irvin Miller Professor of Accounting at the Graduate School of Business, Stanford University, Morgan Stanley Director of the Center for Leadership Development and Research and Senior Faculty of The Rock Center for Corporate Governance since 2006. From 2005 to 2008, Professor of Accounting at the Graduate School of Business, Stanford University. Prior thereto, Ernst & Young Professor of Accounting at The Wharton School, University of Pennsylvania from 1985 to 2005. | | Asset Allocation Trust |
Olivia S. Mitchell (Born 1953) | | Trustee, since 2006 | | International Foundation of Employee Benefit Plans Professor, Wharton School of the University of Pennsylvania since 1993. Director of Wharton’s Pension Research Council and Boettner Center on Pensions & Retirement Research, and Research Associate at the National Bureau of Economic Research. Previously, Cornell University Professor from 1978 to 1993. | | Asset Allocation Trust |
Timothy J. Penny (Born 1951) | | Trustee, since 1996 | | President and CEO of Southern Minnesota Initiative Foundation, a non-profit organization, since 2007 and Senior Fellow at the Humphrey Institute Policy Forum at the University of Minnesota since 1995. Member of the Board of Trustees of NorthStar Education Finance, Inc., a non-profit organization, since 2007. | | Asset Allocation Trust |
Michael S. Scofield (Born 1943) | | Trustee, since 2010 | | Served on the Investment Company Institute’s Board of Governors and Executive Committee from 2008-2011 as well the Governing Council of the Independent Directors Council from 2006-2011 and the Independent Directors Council Executive Committee from 2008-2011. Chairman of the IDC from 2008-2010. Institutional Investor (Fund Directions) Trustee of Year in 2007. Trustee of the Evergreen Funds complex (and its predecessors) from 1984 to 2010. Chairman of the Evergreen Funds from 2000-2010. Former Trustee of the Mentor Funds. Retired Attorney, Law Offices of Michael S. Scofield. | | Asset Allocation Trust |
| | | | |
| 28 | | Wells Fargo Advantage Special Small Cap Value Fund | | Other information (unaudited) |
| | | | | | |
Name and year of birth | | Position held and length of service* | | Principal occupations during past five years or longer | | Other directorships during past five years |
Donald C. Willeke (Born 1940) | | Trustee, since 1996 | | Principal of the law firm of Willeke & Daniels. General Counsel of the Minneapolis Employees Retirement Fund from 1984 until its consolidation into the Minnesota Public Employees Retirement Association on June 30, 2010. Director and Vice Chair of The Tree Trust (non-profit corporation). Director of the American Chestnut Foundation (non-profit corporation). | | Asset Allocation Trust |
| * | Length of service dates reflect the Trustee’s commencement of service with the Trust’s predecessor entities, where applicable. |
Officers
| | | | | | |
Name and year of birth | | Position held and length of service | | Principal occupations during past five years or longer | | |
Karla M. Rabusch (Born 1959) | | President, since 2003 | | Executive Vice President of Wells Fargo Bank, N.A. and President of Wells Fargo Funds Management, LLC since 2003. | | |
Nancy Wiser1 (Born 1967) | | Treasurer, since 2012 | | Executive Vice President of Wells Fargo Funds Management, LLC since 2011. Chief Operating Officer and Chief Compliance Officer at LightBox Capital Management LLC, from 2008 to 2011. Owned and operated a consulting business providing services to various hedge funds including acting as Chief Operating Officer and Chief Compliance Officer for a hedge fund from 2007 to 2008. Chief Operating Officer and Chief Compliance Officer of GMN Capital LLC from 2006 to 2007. | | |
C. David Messman (Born 1960) | | Secretary, since 2000; Chief Legal Officer, since 2003 | | Assistant General Counsel of Wells Fargo Bank, N.A. since 2013 and Vice President and Managing Counsel of Wells Fargo Bank N.A. from 1996 to 2013. Senior Vice President and Secretary of Wells Fargo Funds Management , LLC since 2001. | | |
Debra Ann Early (Born 1964) | | Chief Compliance Officer, since 2007 | | Senior Vice President and Chief Compliance Officer of Wells Fargo Funds Management, LLC since 2007. Chief Compliance Officer of Parnassus Investments from 2005 to 2007. Chief Financial Officer of Parnassus Investments from 2004 to 2007. | | |
David Berardi (Born 1975) | | Assistant Treasurer, since 2009 | | Vice President of Wells Fargo Funds Management, LLC since 2009. Vice President of Evergreen Investment Management Company, LLC from 2008 to 2010. Assistant Vice President of Evergreen Investment Services, Inc. from 2004 to 2008. Manager of Fund Reporting and Control for Evergreen Investment Management Company, LLC from 2004 to 2010. | | |
Jeremy DePalma1 (Born 1974) | | Assistant Treasurer, since 2009 | | Senior Vice President of Wells Fargo Funds Management, LLC since 2009. Senior Vice President of Evergreen Investment Management Company, LLC from 2008 to 2010. Vice President, Evergreen Investment Services, Inc. from 2004 to 2007. Head of the Fund Reporting and Control Team within Fund Administration from 2005 to 2010. | | |
| 1. | Nancy Wiser acts as Treasurer of 73 funds in the Fund Complex. Jeremy DePalma acts as Treasurer of 60 funds and Assistant Treasurer of 73 funds in the Fund Complex. |
| 2. | The Statement of Additional Information includes additional information about the Trustees and is available, without charge, upon request, by calling 1-800-222-8222 or by visiting the website at wellsfargoadvantagefunds.com. |
| | | | | | |
| Other information (unaudited) | | Wells Fargo Advantage Special Small Cap Value Fund | | | 29 | |
BOARD CONSIDERATION OF INVESTMENT ADVISORY AND SUB-ADVISORY AGREEMENTS:
Under Section 15 of the Investment Company Act of 1940 (the “1940 Act”), the Board of Trustees (the “Board”) of Wells Fargo Funds Trust (the “Trust”), all the members of which have no direct or indirect interest in the investment advisory and sub-advisory agreements and are not “interested persons” of the Trust, as defined in the 1940 Act (the “Independent Trustees”), must determine whether to approve the continuation of the Trust’s investment advisory and sub-advisory agreements. In this regard, at in-person meetings held on March 27-28, 2014 (the “March Meeting”) and May 15-16, 2014 (the “May Meeting”, and together with the March Meeting, the “Meetings”), the Board reviewed: (i) an investment advisory agreement with Wells Fargo Funds Management, LLC (“Funds Management”) for Wells Fargo Advantage Special Small Cap Value Fund (the “Fund”) and (ii) an investment sub-advisory agreement with Wells Capital Management Incorporated (the “Sub-Adviser”), an affiliate of Funds Management, for the Fund. The investment advisory agreement with Funds Management and the investment sub-advisory agreement with the Sub-Adviser are collectively referred to as the “Advisory Agreements.”
At the May Meeting, the Board received the information, considered the factors and reached the conclusions discussed below, and unanimously approved the renewal of the Advisory Agreements, as it had done at the March Meeting.
At the Meetings, the Board considered the factors and reached the conclusions described below relating to the selection of Funds Management and the Sub-Adviser and the continuation of the Advisory Agreements. Prior to the Meetings, the Trustees conferred extensively among themselves and with representatives of Funds Management about these matters. Also, the Board has adopted a team-based approach, with each team consisting of a sub-set of Trustees, to assist the full Board in the discharge of its duties in reviewing performance and other matters throughout the year. The Independent Trustees were assisted in their evaluation of the Advisory Agreements by independent legal counsel, from whom they received separate legal advice and with whom they met separately.
In providing information to the Board, Funds Management and the Sub-Adviser were guided by a detailed set of requests for information submitted to them by independent legal counsel on behalf of the Independent Trustees at the start of the Board’s annual contract renewal process earlier in 2014. In considering and approving the Advisory Agreements, the Trustees considered the information they believed relevant, including but not limited to the information discussed below. The Board considered not only the specific information presented in connection with the Meetings, but also the knowledge gained over time through interaction with Funds Management and the Sub-Adviser about various topics. In this regard, the Board reviewed reports of Funds Management at each of its quarterly meetings, which included, among other things, portfolio reviews and performance reports. In addition, the Board and the teams mentioned above confer with portfolio managers at various times throughout the year. The Board did not identify any particular information or consideration that was all-important or controlling, and each individual Trustee may have attributed different weights to various factors.
After its deliberations, the Board unanimously approved the continuation of the Advisory Agreements and determined that the compensation payable to Funds Management and the Sub-Adviser is reasonable. The Board considered the continuation of the Advisory Agreements for the Fund as part of its consideration of the continuation of advisory agreements for funds across the complex, but its approvals were made on a fund-by-fund basis. The following summarizes a number of important, but not necessarily all, factors considered by the Board in support of its approvals.
Nature, extent and quality of services
The Board received and considered various information regarding the nature, extent and quality of services provided to the Fund by Funds Management and the Sub-Adviser under the Advisory Agreements. This information included, among other things, a summary of the background and experience of senior management of Funds Management, and the qualifications, background, tenure and responsibilities of each of the portfolio managers primarily responsible for the day-to-day portfolio management of the Fund.
The Board evaluated the ability of Funds Management and the Sub-Adviser to attract and retain qualified investment professionals, including research, advisory and supervisory personnel. The Board further considered the compliance programs and compliance records of Funds Management and the Sub-Adviser. In addition, the Board took into account the full range of services provided to the Fund by Funds Management and its affiliates.
Fund performance and expenses
The Board considered the performance results for the Fund over various time periods ended December 31, 2013. The Board also considered these results in comparison to the performance of funds in a universe that was determined by Lipper Inc. (“Lipper”) to be similar to the Fund (the “Universe”), and in comparison to the Fund’s benchmark index and to
| | | | |
| 30 | | Wells Fargo Advantage Special Small Cap Value Fund | | Other information (unaudited) |
other comparative data. Lipper is an independent provider of investment company data. The Board received a description of the methodology used by Lipper to select the mutual funds in the performance Universe. The Board noted that the performance of the Fund (Administrator Class) was higher than or in range of the average performance of the Universe for all periods under review. The Board also noted that the performance of the Fund was higher than its benchmark, the Russell 2000® Value Index, for all periods under review.
The Board also received and considered information regarding the Fund’s net operating expense ratios and their various components, including actual management fees (which reflect fee waivers, if any, and include advisory, administration and transfer agent fees), custodian and other non-management fees, Rule 12b-1 and non-Rule 12b-1 service fees and fee waiver and expense reimbursement arrangements. The Board considered these ratios in comparison to the median ratios of funds in class-specific expense groups that were determined by Lipper to be similar to the Fund (the “Groups”). The Board received a description of the methodology used by Lipper to select the mutual funds in the expense Groups and an explanation of year-to-year variations in the funds comprising such expense Groups and their expense ratios. Based on the Lipper reports, the Board noted that the net operating expense ratios of the Fund were lower than or in range of the median net operating expense ratios of the expense Groups.
Based on its consideration of the factors and information it deemed relevant, including those described here, the Board concluded that the overall performance and expense structure of the Fund supported the re-approval of the Advisory Agreements.
Investment advisory and sub-advisory fee rates
The Board reviewed and considered the contractual investment advisory fee rates that are payable by the Fund to Funds Management for investment advisory services (the “Advisory Agreement Rates”), both on a stand-alone basis and on a combined basis with the Fund’s fund-level and class-level contractual administration fee rates (the “Management Rates”). The Board noted that the administration fees payable to Funds Management include transfer agency and sub-transfer agency costs. The Board also reviewed and considered the contractual investment sub-advisory fee rates that are payable by Funds Management to the Sub-Adviser for investment sub-advisory services (the “Sub-Advisory Agreement Rates”).
Among other information reviewed by the Board was a comparison of the Management Rates of the Fund with those of other funds in the expense Groups at a common asset level. The Board noted that the Management Rates of the Fund were in range of the average rates for the Fund’s expense Groups for all share classes.
The Board also received and considered information about the portion of the total advisory fee that was retained by Funds Management after payment of the fee to the Sub-Adviser for sub-advisory services. In assessing the reasonableness of this amount, the Board received and evaluated information about the nature and extent of responsibilities retained and risks assumed by Funds Management and not delegated to or assumed by the Sub-Adviser, and about Funds Management’s on-going oversight services. However, given the affiliation between Funds Management and the Sub-Adviser, the Board ascribed limited relevance to the allocation of the advisory fee between them.
The Board also received and considered information about the nature and extent of services offered and fee rates charged by Funds Management and the Sub-Adviser to other types of clients with investment strategies similar to those of the Fund. In this regard, the Board received information about the significantly greater scope of services, and compliance, reporting and other legal burdens and risks of managing mutual funds compared with those associated with managing assets of non-mutual fund clients such as collective funds or institutional separate accounts.
Based on its consideration of the factors and information it deemed relevant, including those described here, the Board determined that the Advisory Agreement Rates and the Sub-Advisory Agreement Rates were reasonable in light of the services covered by the Advisory Agreements.
Profitability
The Board received and considered information concerning the profitability of Funds Management, as well as the profitability of Wells Fargo as a whole, from providing services to the Fund and the fund family as a whole. The Board did not receive or consider to be necessary separate profitability information with respect to the Sub-Adviser, because its profitability information was subsumed in the collective Wells Fargo profitability analysis.
Funds Management explained the methodologies and estimates that it used in calculating profitability. Among other things, the Board noted that the levels of profitability reported on a fund-by-fund basis varied widely, depending on factors such as the size and type of fund. Based on its review, the Board did not deem the profits reported by Funds Management to be at a level that would prevent it from approving the continuation of the Advisory Agreements.
| | | | | | |
| Other information (unaudited) | | Wells Fargo Advantage Special Small Cap Value Fund | | | 31 | |
Economies of scale
With respect to possible economies of scale, the Board noted the existence of breakpoints in the Fund’s advisory fee and administration fee structure, which operate generally to reduce the Fund’s expense ratios as the Fund grows in size. It considered that, for a small fund or a fund that shrinks in size, breakpoints conversely can result in higher fee levels. The Board also considered that fee waiver and expense reimbursement arrangements and competitive fee rates at the outset are means of sharing potential economies of scale with shareholders of the Fund and the fund family as a whole. The Board considered Funds Management’s view that any analyses of potential economies of scale in managing a particular fund are inherently limited in light of the joint and common costs and investments that Funds Management incurs across the fund family as a whole.
The Board concluded that the Fund’s fee and expense arrangements, including contractual breakpoints, constituted a reasonable approach to sharing potential economies of scale with the Fund and its shareholders.
Other benefits to Funds Management and the Sub-Adviser
The Board received and considered information regarding potential “fall-out” or ancillary benefits received by Funds Management and its affiliates, including the Sub-Adviser, as a result of their relationships with the Fund. Ancillary benefits could include, among others, benefits directly attributable to other relationships with the Fund and benefits potentially derived from an increase in Funds Management’s and the Sub-Adviser’s business as a result of their relationships with the Fund. The Board noted that various affiliates of Funds Management may receive distribution-related fees, shareholder servicing payments and sub-transfer agency fees in respect of shares sold or held through them and services provided.
The Board also reviewed information about soft dollar credits earned and utilized by the Sub-Adviser, fees earned by Funds Management and the Sub-Adviser from managing a private investment vehicle for the fund family’s securities lending collateral and commissions earned by an affiliated broker from portfolio transactions.
Based on its consideration of the factors and information it deemed relevant, including those described here, the Board did not find that any ancillary benefits received by Funds Management and its affiliates, including the Sub-Adviser, were unreasonable.
Conclusion
After considering the above-described factors and based on its deliberations and its evaluation of the information described above, the Board unanimously approved the continuation of the Advisory Agreements for an additional one-year period and determined that the compensation payable to Funds Management and the Sub-Adviser is reasonable.
| | | | |
| 32 | | Wells Fargo Advantage Special Small Cap Value Fund | | List of abbreviations |
The following is a list of common abbreviations for terms and entities that may have appeared in this report.
| ACA | — ACA Financial Guaranty Corporation |
| ADR | — American depositary receipt |
| ADS | — American depositary shares |
| AGC | — Assured Guaranty Corporation |
| AGM | — Assured Guaranty Municipal |
| Ambac | — Ambac Financial Group Incorporated |
| AMT | — Alternative minimum tax |
| BAN | — Bond anticipation notes |
| BHAC | — Berkshire Hathaway Assurance Corporation |
| CAB | — Capital appreciation bond |
| CCAB | — Convertible capital appreciation bond |
| CDA | — Community Development Authority |
| CDO | — Collateralized debt obligation |
| DRIVER | — Derivative inverse tax-exempt receipts |
| DW&P | — Department of Water & Power |
| DWR | — Department of Water Resources |
| ECFA | — Educational & Cultural Facilities Authority |
| EDA | — Economic Development Authority |
| EDFA | — Economic Development Finance Authority |
| ETF | — Exchange-traded fund |
| FDIC | — Federal Deposit Insurance Corporation |
| FFCB | — Federal Farm Credit Banks |
| FGIC | — Financial Guaranty Insurance Corporation |
| FHA | — Federal Housing Administration |
| FHLB | — Federal Home Loan Bank |
| FHLMC | — Federal Home Loan Mortgage Corporation |
| FICO | — The Financing Corporation |
| FNMA | — Federal National Mortgage Association |
| GDR | — Global depositary receipt |
| GNMA | — Government National Mortgage Association |
| HCFR | — Healthcare facilities revenue |
| HEFA | — Health & Educational Facilities Authority |
| HEFAR | — Higher education facilities authority revenue |
| HFA | — Housing Finance Authority |
| HFFA | — Health Facilities Financing Authority |
| HUD | — Department of Housing and Urban Development |
| IDA | — Industrial Development Authority |
| IDAG | — Industrial Development Agency |
| KRW | — Republic of Korea won |
| LIBOR | — London Interbank Offered Rate |
| LLC | — Limited liability company |
| LLLP | — Limited liability limited partnership |
| LLP | — Limited liability partnership |
| MBIA | — Municipal Bond Insurance Association |
| MFHR | — Multifamily housing revenue |
| MSTR | — Municipal securities trust receipts |
| MUD | — Municipal Utility District |
| National | — National Public Finance Guarantee Corporation |
| PCFA | — Pollution Control Financing Authority |
| PCL | — Public Company Limited |
| PCR | — Pollution control revenue |
| PFA | — Public Finance Authority |
| PFFA | — Public Facilities Financing Authority |
| PFOTER | — Puttable floating option tax-exempt receipts |
| plc | — Public limited company |
| PUTTER | — Puttable tax-exempt receipts |
| R&D | — Research & development |
| Radian | — Radian Asset Assurance |
| RAN | — Revenue anticipation notes |
| RDA | — Redevelopment Authority |
| RDFA | — Redevelopment Finance Authority |
| REIT | — Real estate investment trust |
| ROC | — Reset option certificates |
| SAVRS | — Select auction variable rate securities |
| SBA | — Small Business Authority |
| SFHR | — Single-family housing revenue |
| SFMR | — Single-family mortgage revenue |
| SPA | — Standby purchase agreement |
| SPDR | — Standard & Poor’s Depositary Receipts |
| STRIPS | — Separate trading of registered interest and |
| TAN | — Tax anticipation notes |
| TIPS | — Treasury inflation-protected securities |
| TRAN | — Tax revenue anticipation notes |
| TTFA | — Transportation Trust Fund Authority |
| TVA | — Tennessee Valley Authority |


For more information
More information about Wells Fargo Advantage Funds is available free upon request. To obtain literature, please write, email, visit the Fund’s website, or call:
Wells Fargo Advantage Funds
P.O. Box 8266
Boston, MA 02266-8266
Email: wfaf@wellsfargo.com
Website: wellsfargoadvantagefunds.com
Individual investors: 1-800-222-8222
Retail investment professionals: 1-888-877-9275
Institutional investment professionals: 1-866-765-0778
This report and the financial statements contained herein are submitted for the general information of the shareholders of Wells Fargo Advantage Funds. If this report is used for promotional purposes, distribution of the report must be accompanied or preceded by a current prospectus. Before investing, please consider the investment objectives, risks, charges, and expenses of the investment. For a current prospectus and, if available, a summary prospectus, containing this information, call 1-800-222-8222 or visit the Fund’s website at wellsfargoadvantagefunds.com. Read the prospectus carefully before you invest or send money.
Wells Fargo Funds Management, LLC, a wholly owned subsidiary of Wells Fargo & Company, provides investment advisory and administrative services for Wells Fargo Advantage Funds. Other affiliates of Wells Fargo & Company provide subadvisory and other services for the Funds. The Funds are distributed by Wells Fargo Funds Distributor, LLC, Member FINRA/SIPC, an affiliate of Wells Fargo & Company.
NOT FDIC INSURED ¡ NO BANK GUARANTEE ¡ MAY LOSE VALUE
© 2014 Wells Fargo Funds Management, LLC. All rights reserved.
| | |
 | | 228302 11-14 SA246/SAR246 09-14 |

Wells Fargo Advantage
Traditional Small Cap Growth Fund

Semi-Annual Report
September 30, 2014

Reduce clutter. Save trees.
Sign up for electronic delivery of prospectuses and shareholder reports at wellsfargo.com/advantagedelivery
Contents
The views expressed and any forward-looking statements are as of September 30, 2014, unless otherwise noted, and are those of the Fund managers and/or Wells Fargo Funds Management, LLC. Discussions of individual securities, or the markets generally, or any Wells Fargo Advantage Fund are not intended as individual recommendations. Future events or results may vary significantly from those expressed in any forward-looking statements; the views expressed are subject to change at any time in response to changing circumstances in the market. Wells Fargo Funds Management, LLC and the Fund disclaim any obligation to publicly update or revise any views expressed or forward-looking statements.
NOT FDIC INSURED ¡ NO BANK GUARANTEE ¡ MAY LOSE VALUE
| | | | |
| 2 | | Wells Fargo Advantage Traditional Small Cap Growth Fund | | Letter to shareholders (unaudited) |

Karla M. Rabusch
President
Wells Fargo Advantage Funds
Despite geopolitical challenges, U.S. economic numbers showed improvement.
Dear Valued Shareholder:
We are pleased to offer you this semi-annual report for the Wells Fargo Advantage Traditional Small Cap Growth Fund for the six-month period that ended September 30, 2014. The period was marked by heightened geopolitical uncertainty as the U.S. and Europe continued to confront Russia over Ukraine and as Islamic militants (formerly known as ISIS) gained territory in Iraq and Syria. Toward the end of the reporting period, market volatility increased as renewed fears of slowing global growth took hold, and investors began to price in expectations that the U.S. Federal Reserve (Fed) was finally looking to raise short-term interest rates. Although mid-cap stocks (measured by the Russell Midcap® Index1) ended the period with a single-digit gain, small-cap stocks (measured by the Russell 2000® Index2) ended with a loss.
Major central banks continued to provide stimulus.
Throughout the reporting period, the Federal Open Market Committee (FOMC)—the U.S. Federal Reserve’s monetary policymaking body—kept its key interest rate near zero. Prior to the reporting period, in January 2014, the FOMC began to reduce (or taper) its bond-buying program by $10 billion per month and continued the taper throughout the reporting period. Some anticipated this action would lead to higher interest rates, however, interest rates followed a downward trend, despite short-term volatility. European markets continued to benefit from the European Central Bank’s (ECB’s) actions. In June 2014, the ECB announced a variety of measures aimed at encouraging lending, including cutting its key rate and imposing for the first time a negative interest rate on bank deposits held at the central bank. In September 2014, the ECB cut its key rate again—to 0.05%—and pushed the deposit rate for banks to -0.20%.
Although the geopolitical situation presented challenges, U.S. stock markets gained on positive economic data.
Geopolitical events were major obstacles throughout the reporting period. The ongoing standoff between the West (the U.S., Europe, and their allies) and Russia over Ukraine began in late 2013 and fed into stock market volatility early in 2014. The situation’s effect on the stock market faded as investors began to believe that the situation would not result in war, but as of September 2014, the situation had resulted in economic sanctions from the West against Russia. However, even as the market began to focus less on that situation, the advance of Islamic militants in Iraq and Syria led to airstrikes by the U.S. and its allies and fears of a regional war in the Middle East.
Despite geopolitical challenges, U.S. economic numbers showed improvement. The unemployment rate continued its slow improvement, declining from 6.3% in April 2014 to 5.9% in September 2014. Although investors received an unpleasant surprise when gross domestic product (GDP) growth for the first quarter of 2014 declined by 2.1% on an annualized basis, several commentators suggested that harsh winter weather may have dampened economic activity. Economic growth did accelerate in the second quarter of 2014, with an annualized GDP growth rate of 4.6%.
| 1. | The Russell Midcap® Index measures the performance of the 800 smallest companies in the Russell 1000® Index, which represent approximately 25% of the total market capitalization of the Russell 1000 Index. You cannot invest directly in an index. |
| 2. | The Russell 2000® Index measures the performance of the 2,000 smallest companies in the Russell 3000® Index, which represents approximately 8% of the total market capitalization of the Russell 3000 Index. You cannot invest directly in an index. |
| | | | | | |
| Letter to shareholders (unaudited) | | Wells Fargo Advantage Traditional Small Cap Growth Fund | | | 3 | |
Investors’ positive outlook for the U.S. economy contributed to a solid domestic stock market for most of the period. However, slowing global economic growth, combined with renewed geopolitical concerns (including protests in Hong Kong), caused stock market weakness in September 2014. The Russell Midcap Index ended the period with a 3.2% gain. Small-cap stocks, however, were hit harder by the late-period uncertainty and the Russell 2000 Index ended with a -5.5% return. Growth stocks outperformed value stocks in both the small-cap and the mid-cap space.
Don’t let short-term uncertainty derail long-term investment goals.
Periods of uncertainty can present challenges, but experience has taught us that maintaining long-term investment goals can be an effective way to plan for the future. To help you create a sound strategy based on your personal goals and risk tolerance, Wells Fargo Advantage Funds offers more than 100 mutual funds and other investments spanning a wide range of asset classes and investment styles. Although diversification cannot guarantee an investment profit or prevent losses, we believe it can be an effective way to manage investment risk and potentially smooth out overall portfolio performance. We encourage investors to know their investments and to understand that appropriate levels of risk-taking may unlock opportunities.
Thank you for choosing to invest with Wells Fargo Advantage Funds. We appreciate your confidence in us and remain committed to helping you meet your financial needs. For current information about your fund investments, contact your investment professional, visit our website at wellsfargoadvantagefunds.com, or call us directly at 1-800-222-8222. We are available 24 hours a day, 7 days a week.
Sincerely,

Karla M. Rabusch
President
Wells Fargo Advantage Funds
Investors’ positive outlook for the U.S. economy contributed to a solid domestic stock market for most of the period.
| | | | |
| 4 | | Wells Fargo Advantage Traditional Small Cap Growth Fund | | Performance highlights (unaudited) |
Investment objective
The Fund seeks long-term capital appreciation.
Adviser
Wells Fargo Funds Management, LLC
Subadviser
Wells Capital Management Incorporated
Portfolio managers
Jeffrey S. Drummond, CFA
Linda Freeman, CFA
Paul Carder, CFA
Jeffrey Harrison, CFA
Average annual total returns1 (%) as of September 30, 2014
| | | | | | | | | | | | | | | | | | | | | | | | | | | | | | | | | | |
| | | | | Including sales charge | | | Excluding sales charge | | | Expense ratios2 (%) | |
| | | Inception date | | 1 year | | | 5 year | | | 10 year | | | 1 year | | | 5 year | | | 10 year | | | Gross | | | Net3 | |
| Class A (EGWAX) | | 6-5-1995 | | | (7.26 | ) | | | 12.15 | | | | 7.85 | | | | (1.61 | ) | | | 13.49 | | | | 8.49 | | | | 1.55 | | | | 1.34 | |
| Class C (EGWCX) | | 7-30-2010 | | | (3.36 | ) | | | 12.65 | | | | 7.69 | | | | (2.36 | ) | | | 12.65 | | | | 7.69 | | | | 2.30 | | | | 2.09 | |
| Administrator Class (EGWDX) | | 7-30-2010 | | | – | | | | – | | | | – | | | | (1.47 | ) | | | 13.65 | | | | 8.59 | | | | 1.39 | | | | 1.21 | |
| Institutional Class (EGRYX) | | 11-19-1997 | | | – | | | | – | | | | – | | | | (1.27 | ) | | | 13.88 | | | | 8.82 | | | | 1.12 | | | | 0.99 | |
| Russell 2000® Growth Index4 | | – | | | – | | | | – | | | | – | | | | 3.79 | | | | 15.51 | | | | 9.03 | | | | – | | | | – | |
Figures quoted represent past performance, which is no guarantee of future results, and do not reflect taxes that a shareholder may pay on fund distributions or the redemption of fund shares. Investment return and principal value of an investment will fluctuate so that an investor’s shares, when redeemed, may be worth more or less than their original cost. Performance shown without sales charges would be lower if sales charges were reflected. Current performance may be lower or higher than the performance data quoted, which assumes the reinvestment of dividends and capital gains. Current month-end performance is available on the Fund’s website, wellsfargoadvantagefunds.com.
Index returns do not include transaction costs associated with buying and selling securities, any mutual fund fees or expenses, or any taxes. It is not possible to invest directly in an index.
For Class A shares, the maximum front-end sales charge is 5.75%. For Class C shares, the maximum contingent deferred sales charge is 1.00%. Performance including a contingent deferred sales charge assumes the sales charge for the corresponding time period. Administrator Class and Institutional Class shares are sold without a front-end sales charge or contingent deferred sales charge.
Stock values fluctuate in response to the activities of individual companies and general market and economic conditions. Smaller-company stocks tend to be more volatile and less liquid than those of larger companies. Consult the Fund’s prospectus for additional information on these and other risks.
Please see footnotes on page 5.
| | | | | | |
| Performance highlights (unaudited) | | Wells Fargo Advantage Traditional Small Cap Growth Fund | | | 5 | |
| | | | |
| Ten largest equity holdings5 (%) as of September 30, 2014 | |
Proofpoint Incorporated | | | 2.49 | |
Ultimate Software Group Incorporated | | | 2.26 | |
Cavium Incorporated | | | 2.13 | |
ExamWorks Group Incorporated | | | 2.01 | |
Portfolio Recovery Associates Incorporated | | | 2.00 | |
DexCom Incorporated | | | 1.99 | |
Wageworks Incorporated | | | 1.97 | |
SVB Financial Group | | | 1.92 | |
Pacira Pharmaceuticals Incorporated | | | 1.84 | |
TASER International Incorporated | | | 1.84 | |
|
| Sector distribution6 as of September 30, 2014 |
|
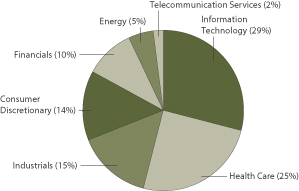 |
| 1. | Historical performance shown for Class C shares prior to their inception reflects the performance of Class A shares and has been adjusted to reflect the higher expenses applicable to Class C shares. Historical performance shown for Administrator Class shares prior to their inception reflects the performance of Institutional Class shares and has been adjusted to reflect the higher expenses applicable to Administrator Class shares. Historical performance shown for all classes of the Fund prior to July 19, 2010, is based on the performance of the Fund’s predecessor, Evergreen Growth Fund. |
| 2. | Reflects the expense ratios as stated in the most recent prospectuses, which include the impact of 0.01% in acquired fund fees and expenses. The expense ratios shown are subject to change and may differ from the annualized expense ratios shown in the financial highlights of this report, which do not include acquired fund fees and expenses. |
| 3. | The Adviser has committed through July 31, 2015, to waive fees and/or reimburse expenses to the extent necessary to cap the Fund’s Total Annual Fund Operating Expenses After Fee Waiver, excluding certain expenses, at 1.33% for Class A, 2.08% for Class C, 1.20% for Administrator Class, and 0.98% for Institutional Class. After this time, the cap may be increased or the commitment to maintain the cap may be terminated only with the approval of the Board of Trustees. Brokerage commissions, stamp duty fees, interest, taxes, acquired fund fees and expenses, and extraordinary expenses are excluded from the cap. Without this cap, the Fund’s returns would have been lower. |
| 4. | The Russell 2000® Growth Index measures the performance of those Russell 2000 companies with higher price-to-book ratios and higher forecasted growth values. You cannot invest directly in an index. |
| 5. | The ten largest equity holdings are calculated based on the value of the securities divided by total net assets of the Fund. Holdings are subject to change and may have changed since the date specified. |
| 6. | Sector distribution is subject to change and is calculated based on the total long-term investments of the Fund. |
| | | | |
| 6 | | Wells Fargo Advantage Traditional Small Cap Growth Fund | | Fund expenses (unaudited) |
As a shareholder of the Fund, you incur two types of costs: (1) transaction costs, including sales charges (loads) on purchase payments and contingent deferred sales charges (if any) on redemptions and (2) ongoing costs, including management fees, distribution (12b-1) and/or shareholder service fees, and other Fund expenses. This example is intended to help you understand your ongoing costs (in dollars) of investing in the Fund and to compare these costs with the ongoing costs of investing in other mutual funds.
The example is based on an investment of $1,000 invested at the beginning of the six-month period and held for the entire period from April 1, 2014 to September 30, 2014.
Actual expenses
The “Actual” line of the table below provides information about actual account values and actual expenses. You may use the information in this line, together with the amount you invested, to estimate the expenses that you paid over the period. Simply divide your account value by $1,000 (for example, an $8,600 account value divided by $1,000 = 8.6), then multiply the result by the number in the “Actual” line under the heading entitled “Expenses paid during period” for your applicable class of shares to estimate the expenses you paid on your account during this period.
Hypothetical example for comparison purposes
The “Hypothetical” line of the table below provides information about hypothetical account values and hypothetical expenses based on the Fund’s actual expense ratio and an assumed rate of return of 5% per year before expenses, which is not the Fund’s actual return. The hypothetical account values and expenses may not be used to estimate the actual ending account balance or expenses you paid for the period. You may use this information to compare the ongoing costs
of investing in the Fund and other funds. To do so, compare this 5% hypothetical example with the 5% hypothetical examples that appear in the shareholder reports of the other funds.
Please note that the expenses shown in the table are meant to highlight your ongoing costs only and do not reflect any transactional costs, such as sales charges (loads) and contingent deferred sales charges. Therefore, the “Hypothetical” line of the table is useful in comparing ongoing costs only and will not help you determine the relative total costs of owning different funds. In addition, if these transactional costs were included, your costs would have been higher.
| | | | | | | | | | | | | | | | |
| | | Beginning
account value
4-1-2014 | | | Ending
account value
9-30-2014 | | | Expenses
paid during
the period¹ | | | Net annualized
expense ratio | |
Class A | | | | | | | | | | | | | | | | |
Actual | | $ | 1,000.00 | | | $ | 946.00 | | | $ | 6.49 | | | | 1.33 | % |
Hypothetical (5% return before expenses) | | $ | 1,000.00 | | | $ | 1,018.40 | | | $ | 6.73 | | | | 1.33 | % |
Class C | | | | | | | | | | | | | | | | |
Actual | | $ | 1,000.00 | | | $ | 942.22 | | | $ | 10.13 | | | | 2.08 | % |
Hypothetical (5% return before expenses) | | $ | 1,000.00 | | | $ | 1,014.64 | | | $ | 10.50 | | | | 2.08 | % |
Administrator Class | | | | | | | | | | | | | | | | |
Actual | | $ | 1,000.00 | | | $ | 946.88 | | | $ | 5.76 | | | | 1.18 | % |
Hypothetical (5% return before expenses) | | $ | 1,000.00 | | | $ | 1,019.15 | | | $ | 5.97 | | | | 1.18 | % |
Institutional Class | | | | | | | | | | | | | | | | |
Actual | | $ | 1,000.00 | | | $ | 947.80 | | | $ | 4.79 | | | | 0.98 | % |
Hypothetical (5% return before expenses) | | $ | 1,000.00 | | | $ | 1,020.16 | | | $ | 4.96 | | | | 0.98 | % |
| 1. | Expenses paid is equal to the annualized expense ratio of each class multiplied by the average account value over the period, multiplied by the number of days in the most recent fiscal half-year divided by the number of days in the fiscal year (to reflect the one-half-year period). |
| | | | | | |
| Portfolio of investments—September 30, 2014 (unaudited) | | Wells Fargo Advantage Traditional Small Cap Growth Fund | | | 7 | |
| | | | | | | | | | | | |
| Security name | | | | | | Shares | | | Value | |
| | | | |
Common Stocks: 97.72% | | | | | | | | | | | | |
| | | | |
Consumer Discretionary: 13.31% | | | | | | | | | | | | |
| | | | |
| Diversified Consumer Services: 3.91% | | | | | | | | | | | | |
Bright Horizons Family Solutions Incorporated † | | | | | | | 47,200 | | | $ | 1,985,232 | |
Grand Canyon Education Incorporated † | | | | | | | 44,700 | | | | 1,822,419 | |
LifeLock Incorporated † | | | | | | | 114,200 | | | | 1,631,918 | |
| | | | |
| | | | | | | | | | | 5,439,569 | |
| | | | | | | | | | | | |
| | | | |
| Hotels, Restaurants & Leisure: 3.97% | | | | | | | | | | | | |
ClubCorp Holdings Incorporated | | | | | | | 46,300 | | | | 918,129 | |
Fiesta Restaurant Group Incorporated † | | | | | | | 42,300 | | | | 2,101,464 | |
Krispy Kreme Doughnuts Incorporated † | | | | | | | 90,500 | | | | 1,552,980 | |
Red Robin Gourmet Burgers Incorporated † | | | | | | | 16,700 | | | | 950,230 | |
| | | | |
| | | | | | | | | | | 5,522,803 | |
| | | | | | | | | | | | |
| | | | |
| Internet & Catalog Retail: 3.12% | | | | | | | | | | | | |
HomeAway Incorporated † | | | | | | | 53,100 | | | | 1,885,050 | |
RetailMeNot Incorporated † | | | | | | | 14,448 | | | | 233,480 | |
Shutterfly Incorporated † | | | | | | | 45,700 | | | | 2,227,418 | |
| | | | |
| | | | | | | | | | | 4,345,948 | |
| | | | | | | | | | | | |
| | | | |
| Media: 0.88% | | | | | | | | | | | | |
Rentrak Corporation † | | | | | | | 20,100 | | | | 1,224,894 | |
| | | | | | | | | | | | |
| | | | |
| Specialty Retail: 1.43% | | | | | | | | | | | | |
Lumber Liquidators Holdings Incorporated Ǡ | | | | | | | 10,900 | | | | 625,442 | |
Vitamin Shoppe Incorporated † | | | | | | | 30,838 | | | | 1,368,899 | |
| | | | |
| | | | | | | | | | | 1,994,341 | |
| | | | | | | | | | | | |
| | | | |
Consumer Staples: 0.31% | | | | | | | | | | | | |
| | | | |
| Food Products: 0.31% | | | | | | | | | | | | |
Annie’s Incorporated † | | | | | | | 9,400 | | | | 431,460 | |
| | | | | | | | | | | | |
| | | | |
Energy: 4.88% | | | | | | | | | | | | |
| | | | |
| Oil, Gas & Consumable Fuels: 4.88% | | | | | | | | | | | | |
Athlon Energy Incorporated † | | | | | | | 29,800 | | | | 1,735,254 | |
Comstock Resources Incorporated | | | | | | | 73,500 | | | | 1,368,570 | |
Oasis Petroleum Incorporated † | | | | | | | 45,700 | | | | 1,910,717 | |
Rosetta Resources Incorporated † | | | | | | | 40,100 | | | | 1,786,856 | |
| | | | |
| | | | | | | | | | | 6,801,397 | |
| | | | | | | | | | | | |
| | | | |
Financials: 9.64% | | | | | | | | | | | | |
| | | | |
| Banks: 3.03% | | | | | | | | | | | | |
SVB Financial Group † | | | | | | | 23,800 | | | | 2,667,742 | |
Texas Capital Bancshares Incorporated † | | | | | | | 26,900 | | | | 1,551,592 | |
| | | | |
| | | | | | | | | | | 4,219,334 | |
| | | | | | | | | | | | |
The accompanying notes are an integral part of these financial statements.
| | | | |
| 8 | | Wells Fargo Advantage Traditional Small Cap Growth Fund | | Portfolio of investments—September 30, 2014 (unaudited) |
| | | | | | | | | | | | |
| Security name | | | | | | Shares | | | Value | |
| | | | |
| Capital Markets: 2.27% | | | | | | | | | | | | |
Evercore Partners Incorporated Class A | | | | | | | 40,100 | | | $ | 1,884,700 | |
Financial Engines Incorporated « | | | | | | | 37,100 | | | | 1,269,377 | |
| | | | |
| | | | | | | | | | | 3,154,077 | |
| | | | | | | | | | | | |
| | | | |
| Consumer Finance: 2.94% | | | | | | | | | | | | |
Encore Capital Group Incorporated Ǡ | | | | | | | 29,600 | | | | 1,311,576 | |
Portfolio Recovery Associates Incorporated † | | | | | | | 53,400 | | | | 2,789,082 | |
| | | | |
| | | | | | | | | | | 4,100,658 | |
| | | | | | | | | | | | |
| | | | |
| Diversified Financial Services: 1.40% | | | | | | | | | | | | |
MarketAxess Holdings Incorporated | | | | | | | 31,500 | | | | 1,948,590 | |
| | | | | | | | | | | | |
| | | | |
Health Care: 24.20% | | | | | | | | | | | | |
| | | | |
| Biotechnology: 4.75% | | | | | | | | | | | | |
Alnylam Pharmaceuticals Incorporated † | | | | | | | 16,500 | | | | 1,288,650 | |
Cepheid Incorporated † | | | | | | | 34,200 | | | | 1,505,826 | |
Exact Sciences Corporation Ǡ | | | | | | | 72,100 | | | | 1,397,298 | |
ISIS Pharmaceuticals Incorporated Ǡ | | | | | | | 22,800 | | | | 885,324 | |
Keryx Biopharmaceuticals Incorporated Ǡ | | | | | | | 46,100 | | | | 633,875 | |
Puma Biotechnology Incorporated † | | | | | | | 3,800 | | | | 906,566 | |
| | | | |
| | | | | | | | | | | 6,617,539 | |
| | | | | | | | | | | | |
| | | | |
| Health Care Equipment & Supplies: 7.54% | | | | | | | | | | | | |
Cardiovascular Systems Incorporated † | | | | | | | 83,484 | | | | 1,972,727 | |
DexCom Incorporated † | | | | | | | 69,237 | | | | 2,768,788 | |
Endologix Incorporated † | | | | | | | 132,600 | | | | 1,405,560 | |
Globus Medical Incorporated † | | | | | | | 47,700 | | | | 938,259 | |
Insulet Corporation † | | | | | | | 42,000 | | | | 1,547,700 | |
LDR Holding Corporation † | | | | | | | 59,900 | | | | 1,864,687 | |
| | | | |
| | | | | | | | | | | 10,497,721 | |
| | | | | | | | | | | | |
| | | | |
| Health Care Providers & Services: 4.35% | | | | | | | | | | | | |
Capital Senior Living Corporation † | | | | | | | 87,000 | | | | 1,847,010 | |
ExamWorks Group Incorporated † | | | | | | | 85,300 | | | | 2,793,575 | |
Healthways Incorporated † | | | | | | | 88,091 | | | | 1,411,218 | |
| | | | |
| | | | | | | | | | | 6,051,803 | |
| | | | | | | | | | | | |
| | | | |
| Health Care Technology: 3.93% | | | | | | | | | | | | |
HealthStream Incorporated † | | | | | | | 39,156 | | | | 940,136 | |
HMS Holdings Corporation Ǡ | | | | | | | 112,000 | | | | 2,111,200 | |
Medidata Solutions Incorporated † | | | | | | | 54,500 | | | | 2,413,805 | |
| | | | |
| | | | | | | | | | | 5,465,141 | |
| | | | | | | | | | | | |
| | | | |
| Pharmaceuticals: 3.63% | | | | | | | | | | | | |
Akorn Incorporated Ǡ | | | | | | | 68,900 | | | | 2,499,003 | |
Pacira Pharmaceuticals Incorporated † | | | | | | | 26,400 | | | | 2,558,688 | |
| | | | |
| | | | | | | | | | | 5,057,691 | |
| | | | | | | | | | | | |
The accompanying notes are an integral part of these financial statements.
| | | | | | |
| Portfolio of investments—September 30, 2014 (unaudited) | | Wells Fargo Advantage Traditional Small Cap Growth Fund | | | 9 | |
| | | | | | | | | | | | |
| Security name | | | | | | Shares | | | Value | |
| | | | |
Industrials: 14.75% | | | | | | | | | | | | |
| | | | |
| Aerospace & Defense: 3.54% | | | | | | | | | | | | |
Hexcel Corporation † | | | | | | | 59,743 | | | $ | 2,371,797 | |
TASER International Incorporated Ǡ | | | | | | | 165,500 | | | | 2,555,320 | |
| | | | |
| | | | | | | | | | | 4,927,117 | |
| | | | | | | | | | | | |
| | | | |
| Building Products: 0.59% | | | | | | | | | | | | |
Gibraltar Industries Incorporated † | | | | | | | 60,158 | | | | 823,563 | |
| | | | | | | | | | | | |
| | | | |
| Commercial Services & Supplies: 1.62% | | | | | | | | | | | | |
InnerWorkings Incorporated † | | | | | | | 279,249 | | | | 2,259,124 | |
| | | | | | | | | | | | |
| | | | |
| Machinery: 3.70% | | | | | | | | | | | | |
Barnes Group Incorporated | | | | | | | 51,200 | | | | 1,553,920 | |
RBC Bearings Incorporated | | | | | | | 30,447 | | | | 1,726,345 | |
The Middleby Corporation † | | | | | | | 21,300 | | | | 1,877,169 | |
| | | | |
| | | | | | | | | | | 5,157,434 | |
| | | | | | | | | | | | |
| | | | |
| Professional Services: 2.90% | | | | | | | | | | | | |
The Advisory Board Company † | | | | | | | 14,600 | | | | 680,214 | |
TriNet Group Incorporated † | | | | | | | 23,500 | | | | 605,125 | |
Wageworks Incorporated † | | | | | | | 60,320 | | | | 2,746,370 | |
| | | | |
| | | | | | | | | | | 4,031,709 | |
| | | | | | | | | | | | |
| | | | |
| Road & Rail: 1.01% | | | | | | | | | | | | |
Genesee & Wyoming Incorporated Class A † | | | | | | | 14,800 | | | | 1,410,588 | |
| | | | | | | | | | | | |
| | | | |
| Trading Companies & Distributors : 1.39% | | | | | | | | | | | | |
Beacon Roofing Supply Incorporated † | | | | | | | 25,600 | | | | 652,288 | |
Watsco Incorporated | | | | | | | 14,800 | | | | 1,275,464 | |
| | | | |
| | | | | | | | | | | 1,927,752 | |
| | | | | | | | | | | | |
| | | | |
Information Technology: 28.83% | | | | | | | | | | | | |
| | | | |
| Communications Equipment : 2.11% | | | | | | | | | | | | |
Aruba Networks Incorporated † | | | | | | | 86,800 | | | | 1,873,144 | |
Sonus Networks Incorporated † | | | | | | | 310,100 | | | | 1,060,542 | |
| | | | |
| | | | | | | | | | | 2,933,686 | |
| | | | | | | | | | | | |
| | | | |
| Internet Software & Services: 9.90% | | | | | | | | | | | | |
Bankrate Incorporated † | | | | | | | 36,903 | | | | 419,218 | |
Cornerstone OnDemand Incorporated † | | | | | | | 62,500 | | | | 2,150,625 | |
Demandware Incorporated † | | | | | | | 24,500 | | | | 1,247,540 | |
E2open Incorporated † | | | | | | | 53,500 | | | | 498,085 | |
LivePerson Incorporated † | | | | | | | 188,442 | | | | 2,372,485 | |
Marketo Ǡ | | | | | | | 62,200 | | | | 2,009,060 | |
Pandora Media Incorporated † | | | | | | | 83,200 | | | | 2,010,112 | |
Shutterstock Incorporated Ǡ | | | | | | | 23,906 | | | | 1,706,410 | |
Textura Corporation Ǡ | | | | | | | 51,900 | | | | 1,370,160 | |
| | | | |
| | | | | | | | | | | 13,783,695 | |
| | | | | | | | | | | | |
The accompanying notes are an integral part of these financial statements.
| | | | |
| 10 | | Wells Fargo Advantage Traditional Small Cap Growth Fund | | Portfolio of investments—September 30, 2014 (unaudited) |
| | | | | | | | | | | | | | |
| Security name | | | | | | | Shares | | | Value | |
| | | | |
| Semiconductors & Semiconductor Equipment: 5.14% | | | | | | | | | | | | | | |
Cavium Incorporated † | | | | | | | | | 59,700 | | | $ | 2,968,881 | |
Inphi Corporation † | | | | | | | | | 49,100 | | | | 706,058 | |
Mellanox Technologies Limited † | | | | | | | | | 54,900 | | | | 2,463,363 | |
Power Integrations Incorporated | | | | | | | | | 18,900 | | | | 1,018,899 | |
| | | | |
| | | | | | | | | | | | | 7,157,201 | |
| | | | | | | | | | | | | | |
| | | | |
| Software: 11.68% | | | | | | | | | | | | | | |
Concur Technologies Incorporated Ǡ | | | | | | | | | 18,078 | | | | 2,292,652 | |
Fleetmatics Group plc Ǡ | | | | | | | | | 50,212 | | | | 1,531,466 | |
Guidewire Software Incorporated † | | | | | | | | | 41,000 | | | | 1,817,940 | |
Infoblox Incorporated † | | | | | | | | | 153,444 | | | | 2,263,299 | |
Proofpoint Incorporated † | | | | | | | | | 93,300 | | | | 3,465,162 | |
Qlik Technologies Incorporated † | | | | | | | | | 64,400 | | | | 1,741,376 | |
Ultimate Software Group Incorporated † | | | | | | | | | 22,274 | | | | 3,151,994 | |
| | | | |
| | | | | | | | | | | | | 16,263,889 | |
| | | | | | | | | | | | | | |
| | | | |
Materials: 0.24% | | | | | | | | | | | | | | |
| | | | |
| Metals & Mining: 0.24% | | | | | | | | | | | | | | |
Materion Corporation | | | | | | | | | 10,966 | | | | 336,327 | |
| | | | | | | | | | | | | | |
| | | | |
| Telecommunication Services: 1.56% | | | | | | | | | | | | | | |
| | | | |
| Diversified Telecommunication Services: 1.56% | | | | | | | | | | | | | | |
Cogent Communications Group Incorporated | | | | | | | | | 64,462 | | | | 2,166,566 | |
| | | | | | | | | | | | | | |
| | | | |
Total Common Stocks (Cost $106,791,703) | | | | | | | | | | | | | 136,051,617 | |
| | | | | | | | | | | | | | |
| | | Yield | | | | | | | | | |
| | | | |
Short-Term Investments: 17.17% | | | | | | | | | | | | | | |
| | | | |
| Investment Companies: 17.17% | | | | | | | | | | | | | | |
Wells Fargo Advantage Cash Investment Money Market Fund, Select Class (l)(u) | | | 0.07 | % | | | | | 3,951,017 | | | | 3,951,017 | |
Wells Fargo Securities Lending Cash Investments, LLC (l)(u)(r) | | | 0.11 | | | | | | 19,955,398 | | | | 19,955,398 | |
| | | | |
Total Short-Term Investments (Cost $23,906,415) | | | | | | | | | | | | | 23,906,415 | |
| | | | | | | | | | | | | | |
| | | | | | | | |
| Total investments in securities | | | | | | | | |
| (Cost $130,698,118) * | | | 114.89 | % | | | 159,958,032 | |
Other assets and liabilities, net | | | (14.89 | ) | | | (20,729,047 | ) |
| | | | | | | | |
| Total net assets | | | 100.00 | % | | $ | 139,228,985 | |
| | | | | | | | |
| † | Non-income-earning security |
| « | All or a portion of this security is on loan. |
| (l) | The security represents an affiliate of the Fund as defined in the Investment Company Act of 1940. |
| (u) | The rate represents the 7-day annualized yield at period end. |
| (r) | The investment is a non-registered investment vehicle purchased with cash collateral received from securities on loan. |
| * | Cost for federal income tax purposes is $131,841,582 and unrealized gains (losses) consists of: |
| | | | |
Gross unrealized gains | | $ | 33,259,212 | |
Gross unrealized losses | | | (5,142,762 | ) |
| | | | |
Net unrealized gains | | $ | 28,116,450 | |
The accompanying notes are an integral part of these financial statements.
| | | | | | |
| Statement of assets and liabilities—September 30, 2014 (unaudited) | | Wells Fargo Advantage Traditional Small Cap Growth Fund | | | 11 | |
| | | | |
| | | | |
| |
Assets | | | | |
Investments | | | | |
In unaffiliated securities (including $19,490,812 of securities loaned), at value (cost $106,791,703) | | $ | 136,051,617 | |
In affiliated securities, at value (cost $23,906,415) | | | 23,906,415 | |
| | | | |
Total investments, at value (cost $130,698,118) | | | 159,958,032 | |
Receivable for Fund shares sold | | | 10,523 | |
Receivable for dividends | | | 2,472 | |
Receivable for securities lending income | | | 42,388 | |
Prepaid expenses and other assets | | | 16,444 | |
| | | | |
Total assets | | | 160,029,859 | |
| | | | |
| |
Liabilities | | | | |
Payable for investments purchased | | | 246,502 | |
Payable for Fund shares redeemed | | | 407,290 | |
Payable upon receipt of securities loaned | | | 19,955,398 | |
Advisory fee payable | | | 80,259 | |
Distribution fees payable | | | 233 | |
Administration fees payable | | | 34,052 | |
Accrued expenses and other liabilities | | | 77,140 | |
| | | | |
Total liabilities | | | 20,800,874 | |
| | | | |
Total net assets | | $ | 139,228,985 | |
| | | | |
| |
NET ASSETS CONSIST OF | | | | |
Paid-in capital | | $ | 91,018,494 | |
Accumulated net investment loss | | | (600,872 | ) |
Accumulated net realized gains on investments | | | 19,551,449 | |
Net unrealized gains on investments | | | 29,259,914 | |
| | | | |
Total net assets | | $ | 139,228,985 | |
| | | | |
| |
COMPUTATION OF NET ASSET VALUE AND OFFERING PRICE PER SHARE | | | | |
Net assets – Class A | | $ | 120,851,246 | |
Shares outstanding – Class A1 | | | 6,272,531 | |
Net asset value per share – Class A | | | $19.27 | |
Maximum offering price per share – Class A2 | | | $20.45 | |
Net assets – Class C | | $ | 378,568 | |
Shares outstanding – Class C1 | | | 20,362 | |
Net asset value per share – Class C | | | $18.59 | |
Net assets – Administrator Class | | $ | 3,103,217 | |
Shares outstanding – Administrator Class1 | | | 151,394 | |
Net asset value per share – Administrator Class | | | $20.50 | |
Net assets – Institutional Class | | $ | 14,895,954 | |
Shares outstanding – Institutional Class1 | | | 719,688 | |
Net asset value per share – Institutional Class | | | $20.70 | |
| 1. | The Fund has an unlimited number of authorized shares. |
| 2. | Maximum offering price is computed as 100/94.25 of net asset value. On investments of $50,000 or more, the offering price is reduced. |
The accompanying notes are an integral part of these financial statements.
| | | | |
| 12 | | Wells Fargo Advantage Traditional Small Cap Growth Fund | | Statement of operations—six months ended September 30, 2014 (unaudited) |
| | | | |
| | | | |
| |
Investment income | | | | |
Dividends | | $ | 218,608 | |
Securities lending income, net | | | 144,400 | |
Income from affiliated securities | | | 1,137 | |
| | | | |
Total investment income | | | 364,145 | |
| | | | |
| |
Expenses | | | | |
Advisory fee | | | 587,716 | |
Administration fees | | | | |
Fund level | | | 36,732 | |
Class A | | | 165,304 | |
Class C | | | 454 | |
Administrator Class | | | 1,719 | |
Institutional Class | | | 6,394 | |
Shareholder servicing fees | | | | |
Class A | | | 158,945 | |
Class C | | | 436 | |
Administrator Class | | | 3,640 | |
Distribution fees | | | | |
Class C | | | 1,308 | |
Custody and accounting fees | | | 9,319 | |
Professional fees | | | 24,786 | |
Registration fees | | | 13,759 | |
Shareholder report expenses | | | 18,088 | |
Trustees’ fees and expenses | | | 6,185 | |
Other fees and expenses | | | 5,930 | |
| | | | |
Total expenses | | | 1,040,715 | |
Less: Fee waivers and/or expense reimbursements | | | (92,935 | ) |
| | | | |
Net expenses | | | 947,780 | |
| | | | |
Net investment loss | | | (583,635 | ) |
| | | | |
| |
REALIZED AND UNREALIZED GAINS (LOSSES) ON INVESTMENTS | | | | |
Net realized gains on investments | | | 5,789,550 | |
Net change in unrealized gains (losses) on investments | | | (14,046,261 | ) |
| | | | |
Net realized and unrealized gains (losses) on investments | | | (8,256,711 | ) |
| | | | |
Net decrease in net assets resulting from operations | | $ | (8,840,346 | ) |
| | | | |
The accompanying notes are an integral part of these financial statements.
| | | | | | |
| Statement of changes in net assets | | Wells Fargo Advantage Traditional Small Cap Growth Fund | | | 13 | |
| | | | | | | | | | | | | | | | | | | | | | | | |
| | | Six months ended September 30, 2014 (unaudited) | | | Year ended March 31, 20141 | | | Year ended October 31, 2013 | |
| | | | | | |
Operations | | | | | | | | | | | | | | | | | | | | | | | | |
Net investment loss | | | | | | $ | (583,635 | ) | | | | | | $ | (692,785 | ) | | | | | | $ | (738,153 | ) |
Net realized gains on investments | | | | | | | 5,789,550 | | | | | | | | 15,540,384 | | | | | | | | 27,621,445 | |
Net change in unrealized gains (losses) on investments | | | | | | | (14,046,261 | ) | | | | | | | (8,062,439 | ) | | | | | | | 21,890,657 | |
| | | | |
Net increase (decrease) in net assets resulting from operations | | | | | | | (8,840,346 | ) | | | | | | | 6,785,160 | | | | | | | | 48,773,949 | |
| | | | |
| | | | | | |
Distributions to shareholders from | | | | | | | | | | | | | | | | | | | | | | | | |
Net realized gains | | | | | | | | | | | | | | | | | | | | | | | | |
Class A | | | | | | | 0 | | | | | | | | (22,060,121 | ) | | | | | | | (1,390,342 | ) |
Class C | | | | | | | 0 | | | | | | | | (41,916 | ) | | | | | | | (1,120 | ) |
Administrator Class | | | | | | | 0 | | | | | | | | (597,696 | ) | | | | | | | (34,634 | ) |
Institutional Class | | | | | | | 0 | | | | | | | | (2,630,071 | ) | | | | | | | (435,430 | ) |
| | | | |
Total distributions to shareholders | | | | | | | 0 | | | | | | | | (25,329,804 | ) | | | | | | | (1,861,526 | ) |
| | | | |
| | | | | | |
Capital share transactions | | | Shares | | | | | | | | Shares | | | | | | | | Shares | | | | | |
Proceeds from shares sold | | | | | | | | | | | | | | | | | | | | | | | | |
Class A | | | 54,693 | | | | 1,055,054 | | | | 179,277 | | | | 3,799,773 | | | | 212,146 | | | | 4,256,236 | |
Class C | | | 3,126 | | | | 59,811 | | | | 15,406 | | | | 316,138 | | | | 2,706 | | | | 54,235 | |
Administrator Class | | | 5,411 | | | | 111,397 | | | | 20,187 | | | | 469,558 | | | | 17,959 | | | | 374,198 | |
Institutional Class | | | 82,387 | | | | 1,668,189 | | | | 98,294 | | | | 2,239,704 | | | | 181,046 | | | | 3,768,222 | |
| | | | |
| | | | | | | 2,894,451 | | | | | | | | 6,825,173 | | | | | | | | 8,452,891 | |
| | | | |
Reinvestment of distributions | | | | | | | | | | | | | | | | | | | | | | | | |
Class A | | | 0 | | | | 0 | | | | 1,066,470 | | | | 21,233,416 | | | | 80,585 | | | | 1,329,468 | |
Class C | | | 0 | | | | 0 | | | | 2,034 | | | | 39,322 | | | | 51 | | | | 831 | |
Administrator Class | | | 0 | | | | 0 | | | | 26,417 | | | | 558,986 | | | | 1,839 | | | | 31,884 | |
Institutional Class | | | 0 | | | | 0 | | | | 94,380 | | | | 2,013,119 | | | | 12,276 | | | | 213,954 | |
| | | | |
| | | | | | | 0 | | | | | | | | 23,844,843 | | | | | | | | 1,576,137 | |
| | | | |
Payment for shares redeemed | | | | | | | | | | | | | | | | | | | | | | | | |
Class A | | | (726,415 | ) | | | (13,888,990 | ) | | | (442,518 | ) | | | (9,329,186 | ) | | | (1,147,470 | ) | | | (21,785,023 | ) |
Class C | | | (3,207 | ) | | | (58,994 | ) | | | (3,642 | ) | | | (70,591 | ) | | | (2,996 | ) | | | (57,441 | ) |
Administrator Class | | | (33,937 | ) | | | (696,657 | ) | | | (26,211 | ) | | | (571,222 | ) | | | (30,963 | ) | | | (644,291 | ) |
Institutional Class | | | (144,839 | ) | | | (3,011,160 | ) | | | (145,152 | ) | | | (3,285,564 | ) | | | (1,852,489 | ) | | | (36,320,886 | ) |
| | | | |
| | | | | | | (17,655,801 | ) | | | | | | | (13,256,563 | ) | | | | | | | (58,807,641 | ) |
| | | | | | | | | | | | | | | | | | | | | | | | |
Net increase (decrease) in net assets resulting from capital share transactions | | | | | | | (14,761,350 | ) | | | | | | | 17,413,453 | | | | | | | | (48,778,613 | ) |
| | | | | | | | | | | | | | | | | | | | | | | | |
Total decrease in net assets | | | | | | | (23,601,696 | ) | | | | | | | (1,131,191 | ) | | | | | | | (1,866,190 | ) |
| | | | | | | | | | | | | | | | | | | | | | | | |
| | | | | | |
Net assets | | | | | | | | | | | | | | | | | | | | | | | | |
Beginning of period | | | | | | | 162,830,681 | | | | | | | | 163,961,872 | | | | | | | | 165,828,062 | |
| | | | |
End of period | | | | | | $ | 139,228,985 | | | | | | | $ | 162,830,681 | | | | | | | $ | 163,961,872 | |
| | | | |
Accumulated net investment loss | | | | | | $ | (600,872 | ) | | | | | | $ | (17,237 | ) | | | | | | $ | (240,348 | ) |
| | | | |
| 1. | For the five months ended March 31, 2014. The Fund changed its fiscal year end from October 31 to March 31, effective March 31, 2014. |
The accompanying notes are an integral part of these financial statements.
| | | | |
| 14 | | Wells Fargo Advantage Traditional Small Cap Growth Fund | | Financial highlights |
(For a share outstanding throughout each period)
| | | | | | | | | | | | | | | | | | | | | | | | | | | | | | | | |
| | | Six months ended September 30, 2014 (unaudited) | | | Year ended March 31, 20141 | | | Year ended October 31 | | | Year ended
September 30 | |
| CLASS A | | | | 2013 | | | 2012 | | | 2011 | | | 20102 | | | 20103 | | | 20093 | |
Net asset value, beginning of period | | $ | 20.37 | | | $ | 23.11 | | | $ | 17.08 | | | $ | 15.31 | | | $ | 14.31 | | | $ | 13.77 | | | $ | 12.24 | | | $ | 12.20 | |
Net investment loss | | | (0.08 | )4 | | | (0.09 | )4 | | | (0.11 | )4 | | | (0.11 | )4 | | | (0.16 | )4 | | | (0.02 | )4 | | | (0.12 | )4 | | | (0.04 | )4 |
Net realized and unrealized gains (losses) on investments | | | (1.02 | ) | | | 0.96 | | | | 6.34 | | | | 1.88 | | | | 1.16 | | | | 0.56 | | | | 1.65 | | | | 0.10 | |
| | | | | | | | | | | | | | | | | | | | | | | | | | | | | | | | |
Total from investment operations | | | (1.10 | ) | | | 0.87 | | | | 6.23 | | | | 1.77 | | | | 1.00 | | | | 0.54 | | | | 1.53 | | | | 0.06 | |
Distributions to shareholders from | | | | | | | | | | | | | | | | | | | | | | | | | | | | | | | | |
Net realized gains | | | 0.00 | | | | (3.61 | ) | | | (0.20 | ) | | | 0.00 | | | | 0.00 | | | | 0.00 | | | | 0.00 | | | | (0.02 | ) |
Net asset value, end of period | | $ | 19.27 | | | $ | 20.37 | | | $ | 23.11 | | | $ | 17.08 | | | $ | 15.31 | | | $ | 14.31 | | | $ | 13.77 | | | $ | 12.24 | |
Total return5 | | | (5.40 | )% | | | 4.14 | % | | | 36.98 | % | | | 11.56 | % | | | 6.99 | % | | | 3.92 | % | | | 12.50 | % | | | 0.53 | % |
Ratios to average net assets (annualized) | | | | | | | | | | | | | | | | | | | | | | | | | | | | | | | | |
Gross expenses | | | 1.47 | % | | | 1.54 | % | | | 1.48 | % | | | 1.48 | % | | | 1.43 | % | | | 1.47 | % | | | 1.39 | % | | | 1.33 | % |
Net expenses | | | 1.33 | % | | | 1.33 | % | | | 1.33 | % | | | 1.33 | % | | | 1.33 | % | | | 1.33 | % | | | 1.33 | % | | | 1.33 | % |
Net investment loss | | | (0.83 | )% | | | (1.04 | )% | | | (0.58 | )% | | | (0.69 | )% | | | (0.96 | )% | | | (0.64 | )% | | | (0.92 | )% | | | (0.45 | )% |
Supplemental data | | | | | | | | | | | | | | | | | | | | | | | | | | | | | | | | |
Portfolio turnover rate | | | 37 | % | | | 36 | % | | | 77 | % | | | 57 | % | | | 123 | % | | | 9 | % | | | 80 | % | | | 118 | % |
Net assets, end of period (000s omitted) | | | $120,851 | | | | $141,446 | | | | $141,933 | | | | $119,490 | | | | $123,063 | | | | $136,332 | | | | $133,166 | | | | $48,067 | |
| 1. | For the five months ended March 31, 2014. The Fund changed its fiscal year end from October 31 to March 31, effective March 31, 2014. |
| 2. | For the one month ended October 31, 2010. The Fund changed its fiscal year end from September 30 to October 31, effective October 31, 2010. |
| 3. | After the close of business on July 16, 2010, the Fund acquired the net assets of Evergreen Growth Fund which became the accounting and performance survivor in the transaction. The information for the periods prior to July 19, 2010 is that of Class A of Evergreen Growth Fund. |
| 4. | Calculated based upon average shares outstanding |
| 5. | Total return calculations do not include any sales charges. Returns for periods of less than one year are not annualized. |
The accompanying notes are an integral part of these financial statements.
| | | | | | |
| Financial highlights | | Wells Fargo Advantage Traditional Small Cap Growth Fund | | | 15 | |
(For a share outstanding throughout each period)
| | | | | | | | | | | | | | | | | | | | | | | | | | | | |
| | | Six months ended
September 30, 2014
(unaudited) | | | Year ended
March 31, 20141 | | | Year ended October 31 | | | Year ended
September 30, 20103 | |
| CLASS C | | | | 2013 | | | 2012 | | | 2011 | | | 20102 | | |
Net asset value, beginning of period | | $ | 19.73 | | | $ | 22.56 | | | $ | 16.80 | | | $ | 15.18 | | | $ | 14.29 | | | $ | 13.66 | | | $ | 13.18 | |
Net investment loss | | | (0.14 | ) | | | (0.15 | )4 | | | (0.26 | ) | | | (0.25 | ) | | | (0.27 | )4 | | | (0.02 | )4 | | | (0.04 | )4 |
Net realized and unrealized gains (losses) on investments | | | (1.00 | ) | | | 0.93 | | | | 6.22 | | | | 1.87 | | | | 1.16 | | | | 0.65 | | | | 0.52 | |
| | | | | | | | | | | | | | | | | | | | | | | | | | | | |
Total from investment operations | | | (1.14 | ) | | | 0.78 | | | | 5.96 | | | | 1.62 | | | | 0.89 | | | | 0.63 | | | | 0.48 | |
Distributions to shareholders from | | | | | | | | | | | | | | | | | | | | | | | | | | | | |
Net realized gains | | | 0.00 | | | | (3.61 | ) | | | (0.20 | ) | | | 0.00 | | | | 0.00 | | | | 0.00 | | | | 0.00 | |
Net asset value, end of period | | $ | 18.59 | | | $ | 19.73 | | | $ | 22.56 | | | $ | 16.80 | | | $ | 15.18 | | | $ | 14.29 | | | $ | 13.66 | |
Total return5 | | | (5.78 | )% | | | 3.85 | % | | | 35.92 | % | | | 10.74 | % | | | 6.16 | % | | | 3.93 | % | | | 4.32 | % |
Ratios to average net assets (annualized) | | | | | | | | | | | | | | | | | | | | | | | | | | | | |
Gross expenses | | | 2.22 | % | | | 2.30 | % | | | 2.23 | % | | | 2.23 | % | | | 2.18 | % | | | 2.25 | % | | | 2.19 | % |
Net expenses | | | 2.08 | % | | | 2.08 | % | | | 2.08 | % | | | 2.08 | % | | | 2.08 | % | | | 2.08 | % | | | 2.08 | % |
Net investment loss | | | (1.58 | )% | | | (1.81 | )% | | | (1.36 | )% | | | (1.44 | )% | | | (1.72 | )% | | | (1.31 | )% | | | (1.67 | )% |
Supplemental data | | | | | | | | | | | | | | | | | | | | | | | | | | | | |
Portfolio turnover rate | | | 37 | % | | | 36 | % | | | 77 | % | | | 57 | % | | | 123 | % | | | 9 | % | | | 80 | % |
Net assets, end of period (000s omitted) | | | $379 | | | | $403 | | | | $150 | | | | $116 | | | | $115 | | | | $99 | | | | $10 | |
| 1. | For the five months ended March 31, 2014. The Fund changed its fiscal year end from October 31 to March 31, effective March 31, 2014. |
| 2. | For the one month ended October 31, 2010. The Fund changed its fiscal year end from September 30 to October 31, effective October 31, 2010. |
| 3. | For the period from July 30, 2010 (commencement of class operations) to September 30, 2010 |
| 4. | Calculated based upon average shares outstanding |
| 5. | Total return calculations do not include any sales charges. Returns for periods of less than one year are not annualized. |
The accompanying notes are an integral part of these financial statements.
| | | | |
| 16 | | Wells Fargo Advantage Traditional Small Cap Growth Fund | | Financial highlights |
(For a share outstanding throughout each period)
| | | | | | | | | | | | | | | | | | | | | | | | | | | | |
| | | Six months ended
September 30, 2014
(unaudited) | | | Year ended
March 31, 20141 | | | Year ended October 31 | | | Year ended
September 30, 20103 | |
| ADMINISTRATOR CLASS | | | | 2013 | | | 2012 | | | 2011 | | | 20102 | | |
Net asset value, beginning of period | | $ | 21.65 | | | $ | 24.33 | | | $ | 17.94 | | | $ | 16.06 | | | $ | 14.99 | | | $ | 14.43 | | | $ | 13.80 | |
Net investment loss | | | (0.07 | )4 | | | (0.08 | )4 | | | (0.09 | )4 | | | (0.09 | )4 | | | (0.14 | )4 | | | (0.01 | )4 | | | (0.02 | )4 |
Net realized and unrealized gains
(losses) on investments | | | (1.08 | ) | | | 1.01 | | | | 6.68 | | | | 1.97 | | | | 1.21 | | | | 0.57 | | | | 0.65 | |
| | | | | | | | | | | | | | | | | | | | | | | | | | | | |
Total from investment operations | | | (1.15 | ) | | | 0.93 | | | | 6.59 | | | | 1.88 | | | | 1.07 | | | | 0.56 | | | | 0.63 | |
Distributions to shareholders from | | | | | | | | | | | | | | | | | | | | | | | | | | | | |
Net realized gains | | | 0.00 | | | | (3.61 | ) | | | (0.20 | ) | | | 0.00 | | | | 0.00 | | | | 0.00 | | | | 0.00 | |
Net asset value, end of period | | $ | 20.50 | | | $ | 21.65 | | | $ | 24.33 | | | $ | 17.94 | | | $ | 16.06 | | | $ | 14.99 | | | $ | 14.43 | |
Total return5 | | | (5.31 | )% | | | 4.18 | % | | | 37.21 | % | | | 11.71 | % | | | 7.14 | % | | | 3.95 | % | | | 4.49 | % |
Ratios to average net assets (annualized) | | | | | | | | | | | | | | | | | | | | | | | | | | | | |
Gross expenses | | | 1.27 | % | | | 1.32 | % | | | 1.26 | % | | | 1.26 | % | | | 1.23 | % | | | 1.31 | % | | | 1.37 | % |
Net expenses | | | 1.18 | % | | | 1.19 | % | | | 1.17 | % | | | 1.17 | % | | | 1.19 | % | | | 1.20 | % | | | 1.20 | % |
Net investment loss | | | (0.68 | )% | | | (0.90 | )% | | | (0.43 | )% | | | (0.54 | )% | | | (0.83 | )% | | | (0.55 | )% | | | (0.77 | )% |
Supplemental data | | | | | | | | | | | | | | | | | | | | | | | | | | | | |
Portfolio turnover rate | | | 37 | % | | | 36 | % | | | 77 | % | | | 57 | % | | | 123 | % | | | 9 | % | | | 80 | % |
Net assets, end of period (000s omitted) | | | $3,103 | | | | $3,896 | | | | $3,882 | | | | $3,063 | | | | $3,413 | | | | $11 | | | | $10 | |
| 1. | For the five months ended March 31, 2014. The Fund changed its fiscal year end from October 31 to March 31, effective March 31, 2014. |
| 2. | For the one month ended October 31, 2010. The Fund changed its fiscal year end from September 30 to October 31, effective October 31, 2010. |
| 3. | For the period from July 30, 2010 (commencement of class operations) to September 30, 2010 |
| 4. | Calculated based upon average shares outstanding |
| 5. | Returns for periods of less than one year are not annualized. |
The accompanying notes are an integral part of these financial statements.
| | | | | | |
| Financial highlights | | Wells Fargo Advantage Traditional Small Cap Growth Fund | | | 17 | |
(For a share outstanding throughout each period)
| | | | | | | | | | | | | | | | | | | | | | | | | | | | | | | | |
| | | Six months ended September 30, 2014 (unaudited) | | | Year ended March 31, 20141 | | | Year ended October 31 | | | Year ended
September 30 | |
| INSTITUTIONAL CLASS | | | | 2013 | | | 2012 | | | 2011 | | | 20102 | | | 20103 | | | 20093 | |
Net asset value, beginning of period | | $ | 21.84 | | | $ | 24.50 | | | $ | 18.03 | | | $ | 16.11 | | | $ | 15.01 | | | $ | 14.43 | | | $ | 12.79 | | | $ | 12.75 | |
Net investment income (loss) | | | (0.05 | )4 | | | (0.07 | )4 | | | 0.00 | 4,5 | | | (0.06 | )4 | | | (0.10 | ) | | | (0.00 | )4,5 | | | (0.10 | )4 | | | (0.02 | )4 |
Net realized and unrealized gains (losses) on investments | | | (1.09 | ) | | | 1.02 | | | | 6.67 | | | | 1.98 | | | | 1.20 | | | | 0.58 | | | | 1.74 | | | | 0.10 | |
| | | | | | | | | | | | | | | | | | | | | | | | | | | | | | | | |
Total from investment operations | | | (1.14 | ) | | | 0.95 | | | | 6.67 | | | | 1.92 | | | | 1.10 | | | | 0.58 | | | | 1.64 | | | | 0.08 | |
Distributions to shareholders from | | | | | | | | | | | | | | | | | | | | |
Net investment income | | | 0.00 | | | | 0.00 | | | | 0.00 | | | | 0.00 | | | | 0.00 | | | | 0.00 | | | | (0.00 | )5 | | | (0.02 | ) |
Net realized gains | | | 0.00 | | | | (3.61 | ) | | | (0.20 | ) | | | 0.00 | | | | 0.00 | | | | 0.00 | | | | 0.00 | | | | (0.02 | ) |
| | | | | | | | | | | | | | | | | | | | | | | | | | | | | | | | |
Total distributions to shareholders | | | 0.00 | | | | (3.61 | ) | | | (0.20 | ) | | | 0.00 | | | | 0.00 | | | | 0.00 | | | | (0.00 | )5 | | | (0.04 | ) |
Net asset value, end of period | | $ | 20.70 | | | $ | 21.84 | | | $ | 24.50 | | | $ | 18.03 | | | $ | 16.11 | | | $ | 15.01 | | | $ | 14.43 | | | $ | 12.79 | |
Total return6 | | | (5.22 | )% | | | 4.29 | % | | | 37.42 | % | | | 11.92 | % | | | 7.33 | % | | | 4.02 | % | | | 12.87 | % | | | 0.74 | % |
Ratios to average net assets (annualized) | | | | | | | | | | | | | | | | | | | | |
Gross expenses | | | 1.04 | % | | | 1.10 | % | | | 1.04 | % | | | 1.05 | % | | | 1.00 | % | | | 1.04 | % | | | 1.06 | % | | | 1.08 | % |
Net expenses | | | 0.98 | % | | | 0.98 | % | | | 0.98 | % | | | 0.98 | % | | | 0.98 | % | | | 0.98 | % | | | 1.05 | % | | | 1.08 | % |
Net investment income (loss) | | | (0.49 | )% | | | (0.69 | )% | | | 0.01 | % | | | (0.35 | )% | | | (0.61 | )% | | | (0.29 | )% | | | (0.78 | )% | | | (0.20 | )% |
Supplemental data | | | | | | | | | | | | | | | | | | | | |
Portfolio turnover rate | | | 37 | % | | | 36 | % | | | 77 | % | | | 57 | % | | | 123 | % | | | 9 | % | | | 80 | % | | | 118 | % |
Net assets, end of period (000s omitted) | | | $14,896 | | | | $17,086 | | | | $17,997 | | | | $43,160 | | | | $71,493 | | | | $105,475 | | | | $102,499 | | | | $344,313 | |
| 1. | For the five months ended March 31, 2014. The Fund changed its fiscal year end from October 31 to March 31, effective March 31, 2014. |
| 2. | For the one month ended October 31, 2010. The Fund changed its fiscal year end from September 30 to October 31, effective October 31, 2010. |
| 3. | After the close of business on July 16, 2010, the Fund acquired the net assets of Evergreen Growth Fund which became the accounting and performance survivor in the transaction. The information for the periods prior to July 19, 2010 is that of Class I of Evergreen Growth Fund. |
| 4. | Calculated based upon average shares outstanding |
| 5. | Amount is less than $0.005. |
| 6. | Returns for periods of less than one year are not annualized. |
The accompanying notes are an integral part of these financial statements.
| | | | |
| 18 | | Wells Fargo Advantage Traditional Small Cap Growth Fund | | Notes to financial statements (unaudited) |
1. ORGANIZATION
Wells Fargo Funds Trust (the “Trust”), a Delaware statutory trust organized on March 10, 1999, is an open-end management investment company registered under the Investment Company Act of 1940, as amended (the “1940 Act”). These financial statements report on the Wells Fargo Advantage Traditional Small Cap Growth Fund (the “Fund”) which is a diversified series of the Trust.
2. SIGNIFICANT ACCOUNTING POLICIES
The following significant accounting policies, which are consistently followed in the preparation of the financial statements of the Fund, are in conformity with U.S. generally accepted accounting principles which require management to make estimates and assumptions that affect the reported amounts of assets and liabilities, disclosure of contingent assets and liabilities at the date of the financial statements, and the reported amounts of revenues and expenses during the reporting period. Actual results could differ from those estimates.
Securities valuation
All investments are valued each business day as of the close of regular trading on the New York Stock Exchange (generally 4 p.m. Eastern Time).
Equity securities that are listed on a foreign or domestic exchange or market are valued at the official closing price or, if none, the last sales price. If no sale occurs on the primary exchange or market for the security that day, the prior day’s price will be deemed “stale” and fair values will be determined in accordance with the Fund’s Valuation Procedures.
Investments in registered open-end investment companies are valued at net asset value. Non-registered investment vehicles are fair valued at net asset value.
Investments which are not valued using any of the methods discussed above are valued at their fair value, as determined in good faith by the Board of Trustees of the Fund. The Board of Trustees has established a Valuation Committee comprised of the Trustees and has delegated to it the authority to take any actions regarding the valuation of portfolio securities that the Valuation Committee deems necessary or appropriate, including determining the fair value of portfolio securities, unless the determination has been delegated to the Management Valuation Team of Wells Fargo Funds Management, LLC (“Funds Management”). The Board of Trustees retains the authority to make or ratify any valuation decisions or approve any changes to the Valuation Procedures as it deems appropriate. On a quarterly basis, the Board of Trustees receives reports on any valuation actions taken by the Valuation Committee or the Management Valuation Team which may include items for ratification.
Valuations of fair valued securities are compared to the next actual sales price when available, or other appropriate market values, to assess the continued appropriateness of the fair valuation methodologies used. These securities are fair valued on a day-to-day basis, taking into consideration changes to appropriate market information and any significant changes to the inputs considered in the valuation process until there is a readily available price provided on an exchange or by an independent pricing service. Valuations received from an independent pricing service or independent broker-dealer quotes are periodically validated by comparisons to most recent trades and valuations provided by other independent pricing services in addition to the review of prices by the adviser and/or subadviser. Unobservable inputs used in determining fair valuations are identified based on the type of security, taking into consideration factors utilized by market participants in valuing the investment, knowledge about the issuer and the current market environment.
Security loans
The Fund may lend its securities from time to time in order to earn additional income in the form of fees or interest on securities received as collateral or the investment of any cash received as collateral. The Fund continues to receive interest or dividends on the securities loaned. The Fund receives collateral in the form of cash or securities with a value at least equal to the value of the securities on loan. The value of the loaned securities is determined at the close of each business day and any additional required collateral is delivered to the Fund on the next business day. In a securities lending transaction, the net asset value of the Fund will be affected by an increase or decrease in the value of the securities loaned and by an increase or decrease in the value of the instrument in which collateral is invested. The amount of securities lending activity undertaken by the Fund fluctuates from time to time. In the event of default or bankruptcy by the borrower, the Fund may be prevented from recovering the loaned securities or gaining access to the collateral or may experience delays or costs in doing so. In addition, the investment of any cash collateral received may lose all or part of its value. The Fund has the right under the lending agreement to recover the securities from the borrower on demand.
The Fund lends its securities through an unaffiliated securities lending agent. Cash collateral received in connection with its securities lending transactions is invested in Wells Fargo Securities Lending Cash Investments, LLC (the “Securities
| | | | | | |
| Notes to financial statements (unaudited) | | Wells Fargo Advantage Traditional Small Cap Growth Fund | | | 19 | |
Lending Fund”). The Securities Lending Fund is exempt from registration under Section 3(c)(7) of the 1940 Act and is managed by Funds Management and is subadvised by Wells Capital Management Incorporated (“WellsCap”). Funds Management receives an advisory fee starting at 0.05% and declining to 0.01% as the average daily net assets of the Securities Lending Fund increase. All of the fees received by Funds Management are paid to WellsCap for its services as subadviser. The Securities Lending Fund seeks to provide a positive return compared to the daily Fed Funds Open rate by investing in high-quality, U.S. dollar-denominated short-term money market instruments. Securities Lending Fund investments are fair valued based upon the amortized cost valuation technique. Income earned from investment in the Securities Lending Fund is included in securities lending income on the Statement of Operations.
Security transactions and income recognition
Securities transactions are recorded on a trade date basis. Realized gains or losses are recorded on the basis of identified cost.
Dividend income is recognized on the ex-dividend date.
Distributions to shareholders
Distributions to shareholders from net investment income and net realized gains, if any, are recorded on the ex-dividend date. Such distributions are determined in conformity with federal income tax regulations, which may differ in amount or character from net investment income and realized gains recognized for purposes of U.S. generally accepted accounting principles.
Federal and other taxes
The Fund intends to continue to qualify as a regulated investment company by distributing substantially all of its investment company taxable income and any net realized capital gains (after reduction for capital loss carryforwards) sufficient to relieve it from all, or substantially all, federal income taxes. Accordingly, no provision for federal income taxes was required.
The Fund’s income and federal excise tax returns and all financial records supporting those returns for the prior three fiscal years are subject to examination by the federal and Delaware revenue authorities. Management has analyzed the Fund’s tax positions taken on federal, state, and foreign tax returns for all open tax years and does not believe that there are any uncertain tax positions that require recognition of a tax liability.
Class allocations
The separate classes of shares offered by the Fund differ principally in applicable sales charges, distribution, shareholder servicing, and administration fees. Class specific expenses are charged directly to that share class. Investment income, common expenses, and realized and unrealized gains (losses) on investments are allocated daily to each class of shares based on the relative proportion of net assets of each class.
3. FAIR VALUATION MEASUREMENTS
Fair value measurements of investments are determined within a framework that has established a fair value hierarchy based upon the various data inputs utilized in determining the value of the Fund’s investments. The three-level hierarchy gives the highest priority to unadjusted quoted prices in active markets for identical assets or liabilities (Level 1) and the lowest priority to significant unobservable inputs (Level 3). The Fund’s investments are classified within the fair value hierarchy based on the lowest level of input that is significant to the fair value measurement. The inputs are summarized into three broad levels as follows:
| n | | Level 1 – quoted prices in active markets for identical securities |
| n | | Level 2 – other significant observable inputs (including quoted prices for similar securities, interest rates, prepayment speeds, credit risk, use of amortized cost, etc.) |
| n | | Level 3 – significant unobservable inputs (including the Fund’s own assumptions in determining the fair value of investments) |
The inputs or methodologies used for valuing investments in securities are not necessarily an indication of the risk associated with investing in those securities.
| | | | |
| 20 | | Wells Fargo Advantage Traditional Small Cap Growth Fund | | Notes to financial statements (unaudited) |
The following is a summary of the inputs used in valuing the Fund’s assets and liabilities as of September 30, 2014:
| | | | | | | | | | | | | | | | |
| | | Quoted prices
(Level 1) | | | Other significant
observable inputs
(Level 2) | | | Significant
unobservable inputs
(Level 3) | | | Total | |
Assets | | | | | | | | | | | | | | | | |
Investments in : | | | | | | | | | | | | | | | | |
| | | | |
Common stocks | | | | | | | | | | | | | | | | |
Consumer discretionary | | $ | 18,527,555 | | | $ | 0 | | | $ | 0 | | | $ | 18,527,555 | |
Consumer staples | | | 431,460 | | | | 0 | | | | 0 | | | | 431,460 | |
Energy | | | 6,801,397 | | | | 0 | | | | 0 | | | | 6,801,397 | |
Financials | | | 13,422,659 | | | | 0 | | | | 0 | | | | 13,422,659 | |
Health care | | | 33,689,895 | | | | 0 | | | | 0 | | | | 33,689,895 | |
Industrials | | | 20,537,287 | | | | 0 | | | | 0 | | | | 20,537,287 | |
Information technology | | | 40,138,471 | | | | 0 | | | | 0 | | | | 40,138,471 | |
Materials | | | 336,327 | | | | 0 | | | | 0 | | | | 336,327 | |
Telecommunication services | | | 2,166,566 | | | | 0 | | | | 0 | | | | 2,166,566 | |
| | | | |
Short-term investments | | | | | | | | | | | | | | | | |
Investment companies | | | 3,951,017 | | | | 19,955,398 | | | | 0 | | | | 23,906,415 | |
Total assets | | $ | 140,002,634 | | | $ | 19,955,398 | | | $ | 0 | | | $ | 159,958,032 | |
Transfers in and transfers out are recognized at the end of the reporting period. At September 30, 2014, the Fund did not have any transfers into/out of Level 1, Level 2, or Level 3.
4. TRANSACTIONS WITH AFFILIATES
Advisory fee
The Trust has entered into an advisory contract with Funds Management, an indirect wholly owned subsidiary of Wells Fargo & Company (“Wells Fargo”). The adviser is responsible for implementing investment policies and guidelines and for supervising the subadviser, who is responsible for day-to-day portfolio management of the Fund.
Pursuant to the contract, Funds Management is entitled to receive an annual advisory fee starting at 0.80% and declining to 0.68% as the average daily net assets of the Fund increase. For the six months ended September 30, 2014, the advisory fee was equivalent to an annual rate of 0.80% of the Fund’s average daily net assets.
Funds Management has retained the services of a subadviser to provide daily portfolio management to the Fund. The fee for subadvisory services is borne by Funds Management. WellsCap, an affiliate of Funds Management and an indirect wholly owned subsidiary of Wells Fargo, is the subadviser to the Fund and is entitled to receive a fee from Funds Management at an annual rate starting at 0.55% and declining to 0.40% as the average daily net assets of the Fund increase.
Administration fees
The Trust has entered into an administration agreement with Funds Management. Under this agreement, for providing administrative services, which includes paying fees and expenses for services provided by the transfer agent, sub-transfer agents, omnibus account servicers and record-keepers, Funds Management is entitled to receive from the Fund an annual fund level administration fee starting at 0.05% and declining to 0.03% as the average daily net assets of the Fund increase and a class level administration fee which is calculated based on the average daily net assets of each class as follows:
| | | | |
| | | Class level
administration fee | |
Class A, Class C | | | 0.26 | % |
Administrator Class | | | 0.10 | |
Institutional Class | | | 0.08 | |
| | | | | | |
| Notes to financial statements (unaudited) | | Wells Fargo Advantage Traditional Small Cap Growth Fund | | | 21 | |
Funds Management has contractually waived and/or reimbursed advisory and administration fees to the extent necessary to maintain certain net operating expense ratios for the Fund. Waiver of fees and/or reimbursement of expenses by Funds Management were made first from fund level expenses on a proportionate basis and then from class specific expenses. Funds Management has committed through July 31, 2015 to waive fees and/or reimburse expenses to the extent necessary to cap the Fund’s expenses at 1.33% for Class A shares, 2.08% for Class C shares,1.20% for Administrator Class shares, and 0.98% for Institutional Class shares. After this time, the cap may be increased or the commitment to maintain the cap may be terminated only with the approval of the Board of Trustees.
Distribution fees
The Trust has adopted a Distribution Plan for Class C shares of the Fund pursuant to Rule 12b-1 under the 1940 Act. Distribution fees are charged to Class C shares and paid to Wells Fargo Funds Distributor, LLC (“Funds Distributor”), the principal underwriter, at an annual rate of 0.75% of the average daily net assets of Class C shares.
In addition, Funds Distributor is entitled to receive the front-end sales charge from the purchase of Class A shares and a contingent deferred sales charge on the redemption of certain shares. Funds Distributor is also entitled to receive the contingent deferred sales charges from redemptions of Class C shares. For the six months ended September 30, 2014, Funds Distributor received $510 from the sale of Class A shares.
Shareholder servicing fees
The Trust has entered into contracts with one or more shareholder servicing agents, whereby Class A, Class C, and Administrator Class of the Fund is charged a fee at an annual rate of 0.25% of the average daily net assets of each respective class.
A portion of these total shareholder servicing fees were paid to affiliates of Wells Fargo.
5. INVESTMENT PORTFOLIO TRANSACTIONS
Purchases and sales of investments, excluding U.S. government obligations (if any) and short-term securities, for the six months ended September 30, 2014 were $53,161,152 and $68,659,539, respectively.
6. BANK BORROWINGS
The Trust (excluding the money market funds and certain other funds in the Trust) and Wells Fargo Variable Trust are parties to a $150,000,000 revolving credit agreement whereby the Fund is permitted to use bank borrowings for temporary or emergency purposes, such as to fund shareholder redemption requests. Interest under the credit agreement is charged to the Fund based on a borrowing rate equal to the higher of the Federal Funds rate in effect on that day plus 1.25% or the overnight LIBOR rate in effect on that day plus 1.25%. In addition, an annual commitment fee equal to 0.10% of the unused balance is allocated to each participating fund. For the six months ended September 30, 2014, the Fund paid $121 in commitment fees.
For the six months ended September 30, 2014, there were no borrowings by the Fund under the agreement.
7. CONCENTRATION RISK
Concentration risks result from exposure to a limited number of sectors. A fund that invests a substantial portion of its assets in any sector may be more affected by changes in that sector than would be a fund whose investments are not heavily weighted in any sector.
8. INDEMNIFICATION
Under the Trust’s organizational documents, the officers and Trustees are indemnified against certain liabilities that may arise out of performance of their duties to the Trust. Additionally, in the normal course of business, the Trust may enter into contracts with service providers that contain a variety of indemnification clauses. The Trust’s maximum exposure under these arrangements is dependent on future claims that may be made against the Fund and, therefore, cannot be estimated.
| | | | |
| 22 | | Wells Fargo Advantage Traditional Small Cap Growth Fund | | Other information (unaudited) |
PROXY VOTING INFORMATION
A description of the policies and procedures that the Fund uses to determine how to vote proxies relating to portfolio securities is available without charge, upon request, by calling 1-800-222-8222, visiting our website at wellsfargoadvantagefunds.com, or visiting the SEC website at sec.gov. Information regarding how the Fund voted proxies relating to portfolio securities during the most recent 12-month period ended June 30 is available without charge on the Fund’s website at wellsfargoadvantagefunds.com or by visiting the SEC website at sec.gov.
PORTFOLIO HOLDINGS INFORMATION
The complete portfolio holdings for the Fund are publicly available monthly on the Fund’s website (wellsfargoadvantagefunds.com), on a one-month delayed basis. In addition, top ten holdings information (excluding derivative positions) for the Fund is publicly available on the Fund’s website on a monthly, seven-day or more delayed basis. The Fund files its complete schedule of portfolio holdings with the SEC for the first and third quarters of each fiscal year on Form N-Q, which is available without charge by visiting the SEC website at sec.gov. In addition, the Fund’s Form N-Q may be reviewed and copied at the SEC’s Public Reference Room in Washington, DC, and at regional offices in New York City, at 233 Broadway, and in Chicago, at 175 West Jackson Boulevard, Suite 900. Information about the Public Reference Room may be obtained by calling 1-800-SEC-0330.
| | | | | | |
| Other information (unaudited) | | Wells Fargo Advantage Traditional Small Cap Growth Fund | | | 23 | |
BOARD OF TRUSTEES AND OFFICERS
Each of the Trustees and Officers1 listed in the table below acts in identical capacities for each fund in the Wells Fargo Advantage family of funds, which consists of 133 mutual funds comprising the Wells Fargo Funds Trust, Wells Fargo Variable Trust, Wells Fargo Master Trust and four closed-end funds (collectively the “Fund Complex”). This table should be read in conjunction with the Prospectus and the Statement of Additional Information2. The mailing address of each Trustee and Officer is 525 Market Street, 12th Floor, San Francisco, CA 94105. Each Trustee and Officer serves an indefinite term, however, each Trustee serves such term until reaching the mandatory retirement age established by the Trustees.
Independent Trustees
| | | | | | |
Name and year of birth | | Position held and length of service* | | Principal occupations during past five years or longer | | Other directorships during past five years |
Peter G. Gordon (Born 1942) | | Trustee, since 1998; Chairman, since 2005 | | Co-Founder, Retired Chairman, President and CEO of Crystal Geyser Water Company. Trustee Emeritus, Colby College. | | Asset Allocation Trust |
Isaiah Harris, Jr. (Born 1952) | | Trustee, since 2009 | | Retired. Prior thereto, President and CEO of BellSouth Advertising and Publishing Corp. from 2005 to 2007, President and CEO of BellSouth Enterprises from 2004 to 2005 and President of BellSouth Consumer Services from 2000 to 2003. Emeritus member of the Iowa State University Foundation Board of Governors. Emeritus Member of the Advisory Board of Iowa State University School of Business. Advisory Board Member, Palm Harbor Academy. Mr. Harris is a certified public accountant. | | CIGNA Corporation; Asset Allocation Trust |
Judith M. Johnson (Born 1949) | | Trustee, since 2008; Audit Committee Chairman, since 2008 | | Retired. Prior thereto, Chief Executive Officer and Chief Investment Officer of Minneapolis Employees Retirement Fund from 1996 to 2008. Ms. Johnson is an attorney, certified public accountant and a certified managerial accountant. | | Asset Allocation Trust |
Leroy Keith, Jr. (Born 1939) | | Trustee, since 2010 | | Chairman, Bloc Global Services (development and construction). Trustee of the Evergreen Funds complex (and its predecessors) from 1983 to 2010. Former Managing Director, Almanac Capital Management (commodities firm), former Partner, Stonington Partners, Inc. (private equity fund), former Director, Obagi Medical Products Co. and former Director, Lincoln Educational Services. | | Trustee, Virtus Fund Complex (consisting of 50 portfolios as of 12/16/2013); Asset Allocation Trust |
David F. Larcker (Born 1950) | | Trustee, since 2009 | | James Irvin Miller Professor of Accounting at the Graduate School of Business, Stanford University, Morgan Stanley Director of the Center for Leadership Development and Research and Senior Faculty of The Rock Center for Corporate Governance since 2006. From 2005 to 2008, Professor of Accounting at the Graduate School of Business, Stanford University. Prior thereto, Ernst & Young Professor of Accounting at The Wharton School, University of Pennsylvania from 1985 to 2005. | | Asset Allocation Trust |
Olivia S. Mitchell (Born 1953) | | Trustee, since 2006 | | International Foundation of Employee Benefit Plans Professor, Wharton School of the University of Pennsylvania since 1993. Director of Wharton’s Pension Research Council and Boettner Center on Pensions & Retirement Research, and Research Associate at the National Bureau of Economic Research. Previously, Cornell University Professor from 1978 to 1993. | | Asset Allocation Trust |
Timothy J. Penny (Born 1951) | | Trustee, since 1996 | | President and CEO of Southern Minnesota Initiative Foundation, a non-profit organization, since 2007 and Senior Fellow at the Humphrey Institute Policy Forum at the University of Minnesota since 1995. Member of the Board of Trustees of NorthStar Education Finance, Inc., a non-profit organization, since 2007. | | Asset Allocation Trust |
Michael S. Scofield (Born 1943) | | Trustee, since 2010 | | Served on the Investment Company Institute’s Board of Governors and Executive Committee from 2008-2011 as well the Governing Council of the Independent Directors Council from 2006-2011 and the Independent Directors Council Executive Committee from 2008-2011. Chairman of the IDC from 2008-2010. Institutional Investor (Fund Directions) Trustee of Year in 2007. Trustee of the Evergreen Funds complex (and its predecessors) from 1984 to 2010. Chairman of the Evergreen Funds from 2000-2010. Former Trustee of the Mentor Funds. Retired Attorney, Law Offices of Michael S. Scofield. | | Asset Allocation Trust |
| | | | |
| 24 | | Wells Fargo Advantage Traditional Small Cap Growth Fund | | Other information (unaudited) |
| | | | | | |
Name and year of birth | | Position held and length of service* | | Principal occupations during past five years or longer | | Other directorships during past five years |
Donald C. Willeke (Born 1940) | | Trustee, since 1996 | | Principal of the law firm of Willeke & Daniels. General Counsel of the Minneapolis Employees Retirement Fund from 1984 until its consolidation into the Minnesota Public Employees Retirement Association on June 30, 2010. Director and Vice Chair of The Tree Trust (non-profit corporation). Director of the American Chestnut Foundation (non-profit corporation). | | Asset Allocation Trust |
| * | Length of service dates reflect the Trustee’s commencement of service with the Trust’s predecessor entities, where applicable. |
Officers
| | | | | | |
Name and year of birth | | Position held and length of service | | Principal occupations during past five years or longer | | |
Karla M. Rabusch (Born 1959) | | President, since 2003 | | Executive Vice President of Wells Fargo Bank, N.A. and President of Wells Fargo Funds Management, LLC since 2003. | | |
Nancy Wiser1
(Born 1967) | | Treasurer, since 2012 | | Executive Vice President of Wells Fargo Funds Management, LLC since 2011. Chief Operating Officer and Chief Compliance Officer at LightBox Capital Management LLC, from 2008 to 2011. Owned and operated a consulting business providing services to various hedge funds including acting as Chief Operating Officer and Chief Compliance Officer for a hedge fund from 2007 to 2008. Chief Operating Officer and Chief Compliance Officer of GMN Capital LLC from 2006 to 2007. | | |
C. David Messman (Born 1960) | | Secretary, since 2000; Chief Legal Officer, since 2003 | | Assistant General Counsel of Wells Fargo Bank, N.A. since 2013 and Vice President and Managing Counsel of Wells Fargo Bank N.A. from 1996 to 2013. Senior Vice President and Secretary of Wells Fargo Funds Management , LLC since 2001. | | |
Debra Ann Early (Born 1964) | | Chief Compliance Officer, since 2007 | | Senior Vice President and Chief Compliance Officer of Wells Fargo Funds Management, LLC since 2007. Chief Compliance Officer of Parnassus Investments from 2005 to 2007. Chief Financial Officer of Parnassus Investments from 2004 to 2007. | | |
David Berardi (Born 1975) | | Assistant Treasurer, since 2009 | | Vice President of Wells Fargo Funds Management, LLC since 2009. Vice President of Evergreen Investment Management Company, LLC from 2008 to 2010. Assistant Vice President of Evergreen Investment Services, Inc. from 2004 to 2008. Manager of Fund Reporting and Control for Evergreen Investment Management Company, LLC from 2004 to 2010. | | |
Jeremy DePalma1 (Born 1974) | | Assistant Treasurer, since 2009 | | Senior Vice President of Wells Fargo Funds Management, LLC since 2009. Senior Vice President of Evergreen Investment Management Company, LLC from 2008 to 2010. Vice President, Evergreen Investment Services, Inc. from 2004 to 2007. Head of the Fund Reporting and Control Team within Fund Administration from 2005 to 2010. | | |
| 1. | Nancy Wiser acts as Treasurer of 73 funds in the Fund Complex. Jeremy DePalma acts as Treasurer of 60 funds and Assistant Treasurer of 73 funds in the Fund Complex. |
| 2. | The Statement of Additional Information includes additional information about the Trustees and is available, without charge, upon request, by calling 1-800-222-8222 or by visiting the website at wellsfargoadvantagefunds.com. |
| | | | | | |
| Other information (unaudited) | | Wells Fargo Advantage Traditional Small Cap Growth Fund | | | 25 | |
BOARD CONSIDERATION OF INVESTMENT ADVISORY AND SUB-ADVISORY AGREEMENTS:
Under Section 15 of the Investment Company Act of 1940 (the “1940 Act”), the Board of Trustees (the “Board”) of Wells Fargo Funds Trust (the “Trust”), all the members of which have no direct or indirect interest in the investment advisory and sub-advisory agreements and are not “interested persons” of the Trust, as defined in the 1940 Act (the “Independent Trustees”), must determine whether to approve the continuation of the Trust’s investment advisory and sub-advisory agreements. In this regard, at in-person meetings held on March 27-28, 2014 (the “March Meeting”) and May 15-16, 2014 (the “May Meeting”, and together with the March Meeting, the “Meetings”), the Board reviewed: (i) an investment advisory agreement with Wells Fargo Funds Management, LLC (“Funds Management”) for Wells Fargo Advantage Traditional Small Cap Growth Fund (the “Fund”) and (ii) an investment sub-advisory agreement with Wells Capital Management Incorporated (the “Sub-Adviser”), an affiliate of Funds Management, for the Fund. The investment advisory agreement with Funds Management and the investment sub-advisory agreement with the Sub-Adviser are collectively referred to as the “Advisory Agreements.”
At the May Meeting, the Board received the information, considered the factors and reached the conclusions discussed below, and unanimously approved the renewal of the Advisory Agreements, as it had done at the March Meeting.
At the Meetings, the Board considered the factors and reached the conclusions described below relating to the selection of Funds Management and the Sub-Adviser and the continuation of the Advisory Agreements. Prior to the Meetings, the Trustees conferred extensively among themselves and with representatives of Funds Management about these matters. Also, the Board has adopted a team-based approach, with each team consisting of a sub-set of Trustees, to assist the full Board in the discharge of its duties in reviewing performance and other matters throughout the year. The Independent Trustees were assisted in their evaluation of the Advisory Agreements by independent legal counsel, from whom they received separate legal advice and with whom they met separately.
In providing information to the Board, Funds Management and the Sub-Adviser were guided by a detailed set of requests for information submitted to them by independent legal counsel on behalf of the Independent Trustees at the start of the Board’s annual contract renewal process earlier in 2014. In considering and approving the Advisory Agreements, the Trustees considered the information they believed relevant, including but not limited to the information discussed below. The Board considered not only the specific information presented in connection with the Meetings, but also the knowledge gained over time through interaction with Funds Management and the Sub-Adviser about various topics. In this regard, the Board reviewed reports of Funds Management at each of its quarterly meetings, which included, among other things, portfolio reviews and performance reports. In addition, the Board and the teams mentioned above confer with portfolio managers at various times throughout the year. The Board did not identify any particular information or consideration that was all-important or controlling, and each individual Trustee may have attributed different weights to various factors.
After its deliberations, the Board unanimously approved the continuation of the Advisory Agreements and determined that the compensation payable to Funds Management and the Sub-Adviser is reasonable. The Board considered the continuation of the Advisory Agreements for the Fund as part of its consideration of the continuation of advisory agreements for funds across the complex, but its approvals were made on a fund-by-fund basis. The following summarizes a number of important, but not necessarily all, factors considered by the Board in support of its approvals.
Nature, extent and quality of services
The Board received and considered various information regarding the nature, extent and quality of services provided to the Fund by Funds Management and the Sub-Adviser under the Advisory Agreements. This information included, among other things, a summary of the background and experience of senior management of Funds Management, and the qualifications, background, tenure and responsibilities of each of the portfolio managers primarily responsible for the day-to-day portfolio management of the Fund.
The Board evaluated the ability of Funds Management and the Sub-Adviser to attract and retain qualified investment professionals, including research, advisory and supervisory personnel. The Board further considered the compliance programs and compliance records of Funds Management and the Sub-Adviser. In addition, the Board took into account the full range of services provided to the Fund by Funds Management and its affiliates.
Fund performance and expenses
The Board considered the performance results for the Fund over various time periods ended December 31, 2013. The Board also considered these results in comparison to the performance of funds in a universe that was determined by Lipper Inc. (“Lipper”) to be similar to the Fund (the “Universe”), and in comparison to the Fund’s benchmark index and to
| | | | |
| 26 | | Wells Fargo Advantage Traditional Small Cap Growth Fund | | Other information (unaudited) |
other comparative data. Lipper is an independent provider of investment company data. The Board received a description of the methodology used by Lipper to select the mutual funds in the performance Universe. The Board noted that the performance of the Fund (Class A) was higher than or in range of the average performance of the Universe for all periods under review. The Board also noted that the performance of the Fund was in range of its benchmark, the Russell 2000® Growth Index, for the one-, five- and ten-year periods under review, and lower than its benchmark for the three-year period under review.
The Board received information concerning, and discussed factors contributing to, the underperformance of the Fund relative to its benchmark for the three-year period under review. Funds Management advised the Board about the market conditions and investment decisions that it believed contributed to the underperformance during that period. The Board noted the performance of the Fund compared to the Universe for all periods under review and was satisfied with the explanation of factors contributing to the underperformance and with the steps being taken by Funds Management and the Sub-Adviser to address the Fund’s investment performance.
The Board also received and considered information regarding the Fund’s net operating expense ratios and their various components, including actual management fees (which reflect fee waivers, if any, and include advisory, administration and transfer agent fees), custodian and other non-management fees, Rule 12b-1 and non-Rule 12b-1 service fees and fee waiver and expense reimbursement arrangements. The Board considered these ratios in comparison to the median ratios of funds in class-specific expense groups that were determined by Lipper to be similar to the Fund (the “Groups”). The Board received a description of the methodology used by Lipper to select the mutual funds in the expense Groups and an explanation of year-to-year variations in the funds comprising such expense Groups and their expense ratios. Based on the Lipper reports, the Board noted that the net operating expense ratios of the Fund were lower than or in range of the median net operating expense ratios of the expense Groups for all classes of shares.
Based on its consideration of the factors and information it deemed relevant, including those described here, the Board concluded that the overall performance and expense structure of the Fund supported the re-approval of the Advisory Agreements.
Investment advisory and sub-advisory fee rates
The Board reviewed and considered the contractual investment advisory fee rates that are payable by the Fund to Funds Management for investment advisory services (the “Advisory Agreement Rates”), both on a stand-alone basis and on a combined basis with the Fund’s fund-level and class-level contractual administration fee rates (the “Management Rates”). The Board noted that the administration fees payable to Funds Management include transfer agency and sub-transfer agency costs. The Board also reviewed and considered the contractual investment sub-advisory fee rates that are payable by Funds Management to the Sub-Adviser for investment sub-advisory services (the “Sub-Advisory Agreement Rates”).
Among other information reviewed by the Board was a comparison of the Management Rates of the Fund with those of other funds in the expense Groups at a common asset level. The Board noted that the Management Rates of the Fund were lower than or in range of the average rates for the Fund’s expense Groups for all share classes.
The Board also received and considered information about the portion of the total advisory fee that was retained by Funds Management after payment of the fee to the Sub-Adviser for sub-advisory services. In assessing the reasonableness of this amount, the Board received and evaluated information about the nature and extent of responsibilities retained and risks assumed by Funds Management and not delegated to or assumed by the Sub-Adviser, and about Funds Management’s on-going oversight services. However, given the affiliation between Funds Management and the Sub-Adviser, the Board ascribed limited relevance to the allocation of the advisory fee between them.
The Board also received and considered information about the nature and extent of services offered and fee rates charged by Funds Management and the Sub-Adviser to other types of clients with investment strategies similar to those of the Fund. In this regard, the Board received information about the significantly greater scope of services, and compliance, reporting and other legal burdens and risks of managing mutual funds compared with those associated with managing assets of non-mutual fund clients such as collective funds or institutional separate accounts.
Based on its consideration of the factors and information it deemed relevant, including those described here, the Board determined that the Advisory Agreement Rates and the Sub-Advisory Agreement Rates were reasonable in light of the services covered by the Advisory Agreements.
Profitability
The Board received and considered information concerning the profitability of Funds Management, as well as the profitability of Wells Fargo as a whole, from providing services to the Fund and the fund family as a whole. The Board did
| | | | | | |
| Other information (unaudited) | | Wells Fargo Advantage Traditional Small Cap Growth Fund | | | 27 | |
not receive or consider to be necessary separate profitability information with respect to the Sub-Adviser, because its profitability information was subsumed in the collective Wells Fargo profitability analysis.
Funds Management explained the methodologies and estimates that it used in calculating profitability. Among other things, the Board noted that the levels of profitability reported on a fund-by-fund basis varied widely, depending on factors such as the size and type of fund. Based on its review, the Board did not deem the profits reported by Funds Management to be at a level that would prevent it from approving the continuation of the Advisory Agreements.
Economies of scale
With respect to possible economies of scale, the Board noted the existence of breakpoints in the Fund’s advisory fee and administration fee structure, which operate generally to reduce the Fund’s expense ratios as the Fund grows in size. It considered that, for a small fund or a fund that shrinks in size, breakpoints conversely can result in higher fee levels. The Board also considered that fee waiver and expense reimbursement arrangements and competitive fee rates at the outset are means of sharing potential economies of scale with shareholders of the Fund and the fund family as a whole. The Board considered Funds Management’s view that any analyses of potential economies of scale in managing a particular fund are inherently limited in light of the joint and common costs and investments that Funds Management incurs across the fund family as a whole.
The Board concluded that the Fund’s fee and expense arrangements, including contractual breakpoints, constituted a reasonable approach to sharing potential economies of scale with the Fund and its shareholders.
Other benefits to Funds Management and the Sub-Adviser
The Board received and considered information regarding potential “fall-out” or ancillary benefits received by Funds Management and its affiliates, including the Sub-Adviser, as a result of their relationships with the Fund. Ancillary benefits could include, among others, benefits directly attributable to other relationships with the Fund and benefits potentially derived from an increase in Funds Management’s and the Sub-Adviser’s business as a result of their relationships with the Fund. The Board noted that various affiliates of Funds Management may receive distribution-related fees, shareholder servicing payments and sub-transfer agency fees in respect of shares sold or held through them and services provided.
The Board also reviewed information about soft dollar credits earned and utilized by the Sub-Adviser, fees earned by Funds Management and the Sub-Adviser from managing a private investment vehicle for the fund family’s securities lending collateral and commissions earned by an affiliated broker from portfolio transactions.
Based on its consideration of the factors and information it deemed relevant, including those described here, the Board did not find that any ancillary benefits received by Funds Management and its affiliates, including the Sub-Adviser, were unreasonable.
Conclusion
After considering the above-described factors and based on its deliberations and its evaluation of the information described above, the Board unanimously approved the continuation of the Advisory Agreements for an additional one-year period and determined that the compensation payable to Funds Management and the Sub-Adviser is reasonable.
| | | | |
| 28 | | Wells Fargo Advantage Traditional Small Cap Growth Fund | | List of abbreviations |
The following is a list of common abbreviations for terms and entities that may have appeared in this report.
| ACA | — ACA Financial Guaranty Corporation |
| ADR | — American depositary receipt |
| ADS | — American depositary shares |
| AGC | — Assured Guaranty Corporation |
| AGM | — Assured Guaranty Municipal |
| Ambac | — Ambac Financial Group Incorporated |
| AMT | — Alternative minimum tax |
| BAN | — Bond anticipation notes |
| BHAC | — Berkshire Hathaway Assurance Corporation |
| CAB | — Capital appreciation bond |
| CCAB | — Convertible capital appreciation bond |
| CDA | — Community Development Authority |
| CDO | — Collateralized debt obligation |
| DRIVER | — Derivative inverse tax-exempt receipts |
| DW&P | — Department of Water & Power |
| DWR | — Department of Water Resources |
| ECFA | — Educational & Cultural Facilities Authority |
| EDA | — Economic Development Authority |
| EDFA | — Economic Development Finance Authority |
| ETF | — Exchange-traded fund |
| FDIC | — Federal Deposit Insurance Corporation |
| FFCB | — Federal Farm Credit Banks |
| FGIC | — Financial Guaranty Insurance Corporation |
| FHA | — Federal Housing Administration |
| FHLB | — Federal Home Loan Bank |
| FHLMC | — Federal Home Loan Mortgage Corporation |
| FICO | — The Financing Corporation |
| FNMA | — Federal National Mortgage Association |
| GDR | — Global depositary receipt |
| GNMA | — Government National Mortgage Association |
| HCFR | — Healthcare facilities revenue |
| HEFA | — Health & Educational Facilities Authority |
| HEFAR | — Higher education facilities authority revenue |
| HFA | — Housing Finance Authority |
| HFFA | — Health Facilities Financing Authority |
| HUD | — Department of Housing and Urban Development |
| IDA | — Industrial Development Authority |
| IDAG | — Industrial Development Agency |
| KRW | — Republic of Korea won |
| LIBOR | — London Interbank Offered Rate |
| LLC | — Limited liability company |
| LLLP | — Limited liability limited partnership |
| LLP | — Limited liability partnership |
| MBIA | — Municipal Bond Insurance Association |
| MFHR | — Multifamily housing revenue |
| MSTR | — Municipal securities trust receipts |
| MUD | — Municipal Utility District |
| National | — National Public Finance Guarantee Corporation |
| PCFA | — Pollution Control Financing Authority |
| PCL | — Public Company Limited |
| PCR | — Pollution control revenue |
| PFA | — Public Finance Authority |
| PFFA | — Public Facilities Financing Authority |
| PFOTER | — Puttable floating option tax-exempt receipts |
| plc | — Public limited company |
| PUTTER | — Puttable tax-exempt receipts |
| R&D | — Research & development |
| Radian | — Radian Asset Assurance |
| RAN | — Revenue anticipation notes |
| RDA | — Redevelopment Authority |
| RDFA | — Redevelopment Finance Authority |
| REIT | — Real estate investment trust |
| ROC | — Reset option certificates |
| SAVRS | — Select auction variable rate securities |
| SBA | — Small Business Authority |
| SFHR | — Single-family housing revenue |
| SFMR | — Single-family mortgage revenue |
| SPA | — Standby purchase agreement |
| SPDR | — Standard & Poor’s Depositary Receipts |
| STRIPS | — Separate trading of registered interest and principal securities |
| TAN | — Tax anticipation notes |
| TIPS | — Treasury inflation-protected securities |
| TRAN | — Tax revenue anticipation notes |
| TTFA | — Transportation Trust Fund Authority |
| TVA | — Tennessee Valley Authority |


For more information
More information about Wells Fargo Advantage Funds is available free upon request. To obtain literature, please write, email, visit the Fund’s website, or call:
Wells Fargo Advantage Funds
P.O. Box 8266
Boston, MA 02266-8266
Email: wfaf@wellsfargo.com
Website: wellsfargoadvantagefunds.com
Individual investors: 1-800-222-8222
Retail investment professionals: 1-888-877-9275
Institutional investment professionals: 1-866-765-0778
This report and the financial statements contained herein are submitted for the general information of the shareholders of Wells Fargo Advantage Funds. If this report is used for promotional purposes, distribution of the report must be accompanied or preceded by a current prospectus. Before investing, please consider the investment objectives, risks, charges, and expenses of the investment. For a current prospectus and, if available, a summary prospectus, containing this information, call 1-800-222-8222 or visit the Fund’s website at wellsfargoadvantagefunds.com. Read the prospectus carefully before you invest or send money.
Wells Fargo Funds Management, LLC, a wholly owned subsidiary of Wells Fargo & Company, provides investment advisory and administrative services for Wells Fargo Advantage Funds. Other affiliates of Wells Fargo & Company provide subadvisory and other services for the Funds. The Funds are distributed by Wells Fargo Funds Distributor, LLC, Member FINRA/SIPC, an affiliate of Wells Fargo & Company.
NOT FDIC INSURED ¡ NO BANK GUARANTEE ¡ MAY LOSE VALUE
© 2014 Wells Fargo Funds Management, LLC. All rights reserved.
| | |
 | | 228303 11-14 SA247/SAR247 09-14 |

Wells Fargo Advantage Precious Metals Fund

Semi-Annual Report
September 30, 2014

Reduce clutter. Save trees.
Sign up for electronic delivery of prospectuses and shareholder reports at wellsfargo.com/advantagedelivery
Contents
The views expressed and any forward-looking statements are as of September 30, 2014, unless otherwise noted, and are those of the Fund managers and/or Wells Fargo Funds Management, LLC. Discussions of individual securities, or the markets generally, or any Wells Fargo Advantage Fund are not intended as individual recommendations. Future events or results may vary significantly from those expressed in any forward-looking statements; the views expressed are subject to change at any time in response to changing circumstances in the market. Wells Fargo Funds Management, LLC and the Fund disclaim any obligation to publicly update or revise any views expressed or forward-looking statements.
NOT FDIC INSURED ¡ NO BANK GUARANTEE ¡ MAY LOSE VALUE
| | | | |
| 2 | | Wells Fargo Advantage Precious Metals Fund | | Letter to shareholders (unaudited) |

Karla M. Rabusch
President
Wells Fargo Advantage Funds
Dear Valued Shareholder:
We are pleased to offer you this semi-annual report for the Wells Fargo Advantage Precious Metals Fund for the six-month period that ended September 30, 2014. The broad U.S. stock market delivered positive results overall for this period.
2014’s fitful start gave way to a rally that carried through the second quarter of 2014.
Following a difficult first quarter for the U.S. economy—when unusually harsh weather kept consumers at home and disrupted business activities—the second quarter of 2014 brought warmer temperatures, and the U.S. economy picked up steam. Investors were heartened by encouraging economic data, driving stocks higher. In Europe, signs of economic improvement faded when gross domestic product (GDP) stagnated during the second quarter. Although select peripheral countries, such as Spain and Portugal, provided bright spots, some of Europe’s larger economies were pressured by weak economic growth and potential deflation. European stock returns generally were positive, but lackluster.
U.S. Federal Reserve (Fed) officials continued winding down their bond-buying program during the second quarter, leaving it on pace to likely end this year. They also revisited the question of when to begin raising short-term interest rates from near zero and released new projections showing rates rising more than previously expected in 2015 and 2016, but—on a positive note—they slightly reduced their outlook for rates over the longer term. The markets took this information in stride, with both U.S. stocks and bonds rallying.
Positive U.S. economic data—but increased tensions abroad—led to heightened volatility in the third quarter of 2014.
The third quarter brought a series of stock market surges that were interrupted by bouts of volatility as interest-rate concerns in the U.S. and increased tensions abroad triggered heightened investor uncertainty. In July, an escalating Russia/Ukraine situation and a growing perception that the Fed would raise short-term interest rates sooner than expected caused investors to pull back toward month-end; as a result, the S&P 500 Index1 dropped into negative territory for its overall monthly return. However, August brought a bounce-back—the S&P 500 Index delivered its largest monthly gain since February 2014 on a string of positive economic news, led by an upwardly revised 4.2% estimate of second-quarter 2014 GDP growth. Then, in September, the stock market tended to rise, then swoon, then rise as positive economic data became overshadowed at times by growing discomfort over escalating tensions in Ukraine and the Middle East. Signs of slowing growth in Europe and China also concerned investors. Ultimately, U.S. stocks ended the third quarter up slightly overall, buoyed largely by another upward revision of second-quarter GDP growth (to 4.6%). Strong corporate earnings also contributed to market gains, with a large number of U.S. companies exceeding consensus estimates for both revenues and earnings per share.
In contrast to the U.S., the third quarter brought news that the eurozone economy stalled in the second quarter. The weak economy has caused European consumers and businesses to continue to lose confidence. Despite new stimulus measures announced by the European Central Bank in early September, businesses and consumers across the 18 countries that share the euro appeared gloomier about their prospects in September 2014 than at any time since the end of 2013.
| 1. | The S&P 500 Index consists of 500 stocks chosen for market size, liquidity, and industry group representation. It is a market-value-weighted index with each stock’s weight in the index proportionate to its market value. You cannot invest directly in an index. |
| | | | | | |
| Letter to shareholders (unaudited) | | Wells Fargo Advantage Precious Metals Fund | | | 3 | |
Gold and silver prices showed strength but ultimately declined over the reporting period.
Following a temporary dip in gold prices in late May 2014, the price of gold ended the second quarter of 2014 valued nearly 3% higher than when that quarter began. Gold’s second-quarter strength was partly due to increasing instability in the Middle East and partly in response to indications from the Fed that inflation did not appear to be a near-term concern. The Fed’s mild perspective on inflation pleased gold investors because it could be interpreted to mean that inflation may be allowed to rise above the Fed’s stated 2% inflation target without interference. Because gold historically has risen during inflationary periods, investors’ optimism for the metal was renewed. However, in the third quarter, interest in gold waned. Continued strength in the U.S. economy fueled investor concern that the Fed may raise interest rates earlier than expected. Overseas, the eurozone economy had stalled, and the European Central Bank had announced a quantitative easing program to stimulate the economy and combat low inflation. These circumstances led the U.S. dollar to strengthen nearly 8% and the price of gold to fall nearly 8% during the third quarter. This sharp price drop for the third quarter brought the price of gold below where it had been at the start of the 6-month reporting period. The price of silver also declined for the six-month reporting period. After appreciating strongly during the second quarter of 2014 on encouraging economic data out of the U.S. and China, the price of silver fell even more than the price of gold in the third quarter due to its greater industrial use.
We employ a diverse array of investment strategies even as many variables are at work in the market.
Periods of uncertainty can present challenges, but experience has taught us that maintaining long-term investment goals can be an effective way to plan for the future. To help you create a sound strategy based on your personal goals and risk tolerance, Wells Fargo Advantage Funds offers more than 100 mutual funds and
other investments spanning a wide range of asset classes and investment styles. Although diversification cannot guarantee an investment profit or prevent losses, we believe it can be an effective way to manage investment risk and potentially smooth out overall portfolio performance. We encourage investors to know their investments and to understand that appropriate levels of risk-taking may unlock opportunities.
Thank you for choosing to invest with Wells Fargo Advantage Funds. We appreciate your confidence in us and remain committed to helping you meet your financial needs. For current information about your fund investments, contact your investment professional, visit our website at wellsfargoadvantagefunds.com, or call us directly at 1-800-222-8222. We are available 24 hours a day, 7 days a week.
Sincerely,

Karla M. Rabusch
President
Wells Fargo Advantage Funds
Gold and silver prices showed strength but ultimately declined over the reporting period.
Periods of uncertainty can present challenges, but experience has taught us that maintaining long-term investment goals can be an effective way to plan for the future.
| | | | |
| 4 | | Wells Fargo Advantage Precious Metals Fund | | Performance highlights (unaudited) |
Investment objective
The Fund seeks long-term capital appreciation.
Adviser
Wells Fargo Funds Management, LLC
Subadviser
Wells Capital Management Incorporated
Portfolio managers
Michael Bradshaw, CFA
Oleg Makhorine
Average annual total returns1 (%) as of September 30, 2014
| | | | | | | | | | | | | | | | | | | | | | | | | | | | | | | | | | |
| | | | | Including sales charge | | | Excluding sales charge | | | Expense ratios2 (%) | |
| | | Inception date | | 1 year | | | 5 year | | | 10 year | | | 1 year | | | 5 year | | | 10 year | | | Gross | | | Net3 | |
| Class A (EKWAX) | | 1-20-1998 | | | (16.28 | ) | | | (10.44 | ) | | | 3.56 | | | | (11.17 | ) | | | (9.37 | ) | | | 4.18 | | | | 1.23 | | | | 1.10 | |
| Class B (EKWBX)* | | 1-30-1978 | | | (16.20 | ) | | | (10.35 | ) | | | 3.65 | | | | (11.82 | ) | | | (10.05 | ) | | | 3.65 | | | | 1.98 | | | | 1.85 | |
| Class C (EKWCX) | | 1-29-1998 | | | (12.84 | ) | | | (10.05 | ) | | | 3.42 | | | | (11.84 | ) | | | (10.05 | ) | | | 3.42 | | | | 1.98 | | | | 1.85 | |
| Administrator Class (EKWDX) | | 7-30-2010 | | | – | | | | – | | | | – | | | | (11.05 | ) | | | (9.25 | ) | | | 4.32 | | | | 1.07 | | | | 0.96 | |
| Institutional Class (EKWYX) | | 2-29-2000 | | | – | | | | – | | | | – | | | | (10.89 | ) | | | (9.07 | ) | | | 4.50 | | | | 0.80 | | | | 0.80 | |
| FTSE Gold Mines Index4 | | – | | | – | | | | – | | | | – | | | | (13.96 | ) | | | (14.07 | ) | | | (1.60 | ) | | | – | | | | – | |
| S&P 500 Index5 | | – | | | – | | | | – | | | | – | | | | 19.73 | | | | 15.70 | | | | 8.11 | | | | – | | | | – | |
| * | | Class B shares are closed to investment, except in connection with the reinvestment of any distributions and permitted exchanges. |
Figures quoted represent past performance, which is no guarantee of future results, and do not reflect taxes that a shareholder may pay on fund distributions or the redemption of fund shares. Investment return and principal value of an investment will fluctuate so that an investor’s shares, when redeemed, may be worth more or less than their original cost. Performance shown without sales charges would be lower if sales charges were reflected. Current performance may be lower or higher than the performance data quoted, which assumes the reinvestment of dividends and capital gains. Current month-end performance is available on the Fund’s website, wellsfargoadvantagefunds.com.
Index returns do not include transaction costs associated with buying and selling securities, any mutual fund fees or expenses, or any taxes. It is not possible to invest directly in an index.
For Class A shares, the maximum front-end sales charge is 5.75%. For Class B shares, the maximum contingent deferred sales charge is 5.00%. For Class C shares, the maximum contingent deferred sales charge is 1.00%. Performance including a contingent deferred sales charge assumes the sales charge for the corresponding time period. Administrator Class and Institutional Class shares are sold without a front-end sales charge or contingent deferred sales charge.
Stock values fluctuate in response to the activities of individual companies and general market and economic conditions. Bond values fluctuate in response to the financial condition of individual issuers, general market and economic conditions, and changes in interest rates. In general, when interest rates rise, bond values fall and investors may lose principal value. Funds that concentrate their investments in limited sectors, such as gold related investments may be susceptible to financial, economic, or market events affecting those sectors. Certain investment strategies tend to increase the total risk of an investment (relative to the broader market). The Fund is exposed to foreign investment risk, non-diversification risk, smaller-company securities risk, and subsidiary risk. Consult the Fund’s prospectus for additional information on these and other risks.
Please see footnotes on page 5.
| | | | | | |
| Performance highlights (unaudited) | | Wells Fargo Advantage Precious Metals Fund | | | 5 | |
| | | | |
| Ten largest equity holdings6 (%) as of September 30, 2014 | |
Randgold Resources Limited ADR | | | 9.69 | |
Gold Bullion | | | 7.30 | |
Eldorado Gold Corporation | | | 6.42 | |
Royal Gold Incorporated | | | 6.02 | |
Goldcorp Incorporated | | | 6.00 | |
Agnico-Eagle Mines Limited | | | 4.27 | |
Goldcorp Incorporated | | | 3.91 | |
Kinross Gold Corporation | | | 3.87 | |
Fresnillo plc | | | 3.62 | |
Silver Wheaton Corporation-U.S. Exchange Traded Shares | | | 3.28 | |
| | |
| Country allocation7 as of September 30, 2014 |
|
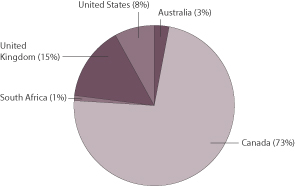 |
| 1. | Historical performance shown for Administrator Class shares prior to their inception reflects the performance of Institutional Class shares and has been adjusted to reflect the higher expenses applicable to Administrator Class shares. Historical performance shown for all classes of the Fund prior July 19, 2010, is based on the performance of the Fund’s predecessor, Evergreen Precious Metals Fund. |
| 2. | Reflects the expense ratios as stated in the most recent prospectuses, which include the impact of 0.01% in acquired fund fees and expenses. The expense ratios shown are subject to change and may differ from the annualized expense ratios shown in the financial highlights of this report, which do not include acquired fund fees and expenses. |
| 3. | The Adviser has committed through July 31, 2015, to waive fees and/or reimburse expenses to the extent necessary to cap the Fund’s Total Annual Fund Operating Expenses After Fee Waiver, excluding certain expenses, at 1.09% for Class A, 1.84% for Class B, 1.84% for Class C, 0.95% for Administrator Class, and 0.79% for Institutional Class. After this time, the cap may be increased or the commitment to maintain the cap may be terminated only with the approval of the Board of Trustees. Brokerage commissions, stamp duty fees, interest, taxes, acquired fund fees and expenses, fees and expenses of wholly owned subsidiary, and extraordinary expenses are excluded from the cap. Without this cap, the Fund’s returns would have been lower. |
| 4. | FTSE Gold Mines Index is an unmanaged, open-ended index designed to reflect the performance of the worldwide market in the shares of companies whose principal activity is the mining of gold. You cannot invest directly in an index. |
| 5. | The S&P 500 Index consists of 500 stocks chosen for market size, liquidity, and industry group representation. It is a market-value weighted index with each stock’s weight in the index proportionate to its market value. You cannot invest directly in an index. |
| 6. | The ten largest equity holdings are calculated based on the value of the investments divided by total net assets of the Fund. Holdings are subject to change and may have changed since the date specified. |
| 7. | Country allocation is subject to change and is calculated based on the total long-term investments of the Fund, excluding commodities. |
| | | | |
| 6 | | Wells Fargo Advantage Precious Metals Fund | | Fund expenses (unaudited) |
As a shareholder of the Fund, you incur two types of costs: (1) transaction costs, including sales charges (loads) on
purchase payments and contingent deferred sales charges (if any) on redemptions and (2) ongoing costs, including
management fees, distribution (12b-1) and/or shareholder service fees, and other Fund expenses. This example is intended to help you understand your ongoing costs (in dollars) of investing in the Fund and to compare these costs with the ongoing costs of investing in other mutual funds.
The example is based on an investment of $1,000 invested at the beginning of the six-month period and held for the entire period from April 1, 2014 to September 30, 2014.
Actual expenses
The “Actual” line of the table below provides information about actual account values and actual expenses. You may use
the information in this line, together with the amount you invested, to estimate the expenses that you paid over the period. Simply divide your account value by $1,000 (for example, an $8,600 account value divided by $1,000 = 8.6), then multiply the result by the number in the “Actual” line under the heading entitled “Expenses paid during period” for your applicable class of shares to estimate the expenses you paid on your account during this period.
Hypothetical example for comparison purposes
The “Hypothetical” line of the table below provides information about hypothetical account values and hypothetical expenses based on the Fund’s actual expense ratio and an assumed rate of return of 5% per year before expenses, which is not the Fund’s actual return. The hypothetical account values and expenses may not be used to estimate the actual ending account balance or expenses you paid for the period. You may use this information to compare the ongoing costs of investing in the Fund and other funds. To do so, compare this 5% hypothetical example with the 5% hypothetical examples that appear in the shareholder reports of the other funds.
Please note that the expenses shown in the table are meant to highlight your ongoing costs only and do not reflect any transactional costs, such as sales charges (loads) and contingent deferred sales charges. Therefore, the “Hypothetical” line of the table is useful in comparing ongoing costs only and will not help you determine the relative total costs of owning different funds. In addition, if these transactional costs were included, your costs would have been higher.
| | | | | | | | | | | | | | | | |
| | | Beginning
account value
4-1-2014 | | | Ending
account value
9-30-2014 | | | Expenses
paid during
the period1 | | | Net annualized
expense ratio | |
Class A | | | | | | | | | | | | | | | | |
Actual | | $ | 1,000.00 | | | $ | 935.61 | | | $ | 5.34 | | | | 1.10 | % |
Hypothetical (5% return before expenses) | | $ | 1,000.00 | | | $ | 1,019.55 | | | $ | 5.57 | | | | 1.10 | % |
Class B | | | | | | | | | | | | | | | | |
Actual | | $ | 1,000.00 | | | $ | 932.32 | | | $ | 8.96 | | | | 1.85 | % |
Hypothetical (5% return before expenses) | | $ | 1,000.00 | | | $ | 1,015.79 | | | $ | 9.35 | | | | 1.85 | % |
Class C | | | | | | | | | | | | | | | | |
Actual | | $ | 1,000.00 | | | $ | 931.98 | | | $ | 8.96 | | | | 1.85 | % |
Hypothetical (5% return before expenses) | | $ | 1,000.00 | | | $ | 1,015.79 | | | $ | 9.35 | | | | 1.85 | % |
Administrator Class | | | | | | | | | | | | | | | | |
Actual | | $ | 1,000.00 | | | $ | 936.18 | | | $ | 4.66 | | | | 0.96 | % |
Hypothetical (5% return before expenses) | | $ | 1,000.00 | | | $ | 1,020.26 | | | $ | 4.86 | | | | 0.96 | % |
Institutional Class | | | | | | | | | | | | | | | | |
Actual | | $ | 1,000.00 | | | $ | 937.23 | | | $ | 3.84 | | | | 0.79 | % |
Hypothetical (5% return before expenses) | | $ | 1,000.00 | | | $ | 1,021.11 | | | $ | 4.00 | | | | 0.79 | % |
| 1. | Expenses paid is equal to the annualized expense ratio of each class multiplied by the average account value over the period, multiplied by the number of days in the most recent fiscal half-year divided by the number of days in the fiscal year (to reflect the one-half-year period). |
| | | | | | |
| Consolidated portfolio of investments—September 30, 2014 (unaudited) | | Wells Fargo Advantage Precious Metals Fund | | | 7 | |
| | | | | | | | | | | | |
| Security name | | | | | | Shares | | | Value | |
| | | | | | | | | | | | |
| | | | |
Common Stocks: 88.24% | | | | | | | | | | | | |
| | | | |
| Australia: 2.82% | | | | | | | | | | | | |
Newcrest Mining Limited (Materials, Metals & Mining) † | | | | | | | 928,440 | | | $ | 8,576,051 | |
Regis Resources Limited (Materials, Metals & Mining) | | | | | | | 2,500,000 | | | | 3,403,701 | |
| | | | |
| | | | | | | | | | | 11,979,752 | |
| | | | | | | | | | | | |
| | | | |
| Canada: 63.72% | | | | | | | | | | | | |
Agnico-Eagle Mines Limited (Materials, Metals & Mining) | | | | | | | 266,370 | | | | 7,703,669 | |
Agnico-Eagle Mines Limited-U.S. Exchange Traded Shares (Materials, Metals & Mining) | | | | | | | 625,164 | | | | 18,148,511 | |
Agnico-Eagle Mines Limited-Legend Shares (Materials, Metals & Mining) | | | | | | | 35,000 | | | | 1,016,050 | |
Alamos Gold Incorporated (Materials, Metals & Mining) | | | | | | | 1,417,600 | | | | 11,303,333 | |
Aureus Mining Incorporated (Materials, Metals & Mining) † | | | | | | | 3,353,000 | | | | 1,182,268 | |
AuRico Gold Incorporated (Materials, Metals & Mining) | | | | | | | 800,000 | | | | 2,792,982 | |
B2Gold Corporation (Materials, Metals & Mining) † | | | | | | | 4,640,000 | | | | 9,446,136 | |
Barrick Gold Corporation (Materials, Metals & Mining) | | | | | | | 664,083 | | | | 9,735,457 | |
Centerra Gold Incorporated (Materials, Metals & Mining) | | | | | | | 800,000 | | | | 3,585,874 | |
Centerra Gold Incorporated (Materials, Metals & Mining) 144A | | | | | | | 350,000 | | | | 1,568,820 | |
Continental Gold Limited (Materials, Metals & Mining) † | | | | | | | 1,000,000 | | | | 2,589,401 | |
Detour Gold Corporation (Materials, Metals & Mining) † | | | | | | | 121,057 | | | | 949,043 | |
Detour Gold Corporation (Materials, Metals & Mining) | | | | | | | 525,000 | | | | 4,115,809 | |
Detour Gold Corporation-Legend Shares (Materials, Metals & Mining) | | | | | | | 90,000 | | | | 705,567 | |
Eldorado Gold Corporation (Materials, Metals & Mining) | | | | | | | 4,051,044 | | | | 27,309,596 | |
Entree Gold Incorporated-Legend Shares (Materials, Metals & Mining) (i) | | | | | | | 1,275,000 | | | | 335,841 | |
Exeter Resource Corporation-Legend Shares (Materials, Metals & Mining) | | | | | | | 585,000 | | | | 349,971 | |
First Quantum Minerals Limited-Legend Shares (Materials, Metals & Mining) | | | | | | | 96,000 | | | | 1,853,226 | |
Franco-Nevada Corporation (Materials, Metals & Mining) 144A | | | | | | | 142,500 | | | | 6,994,263 | |
Franco-Nevada Corporation (Materials, Metals & Mining) | | | | | | | 260,000 | | | | 12,761,463 | |
Goldcorp Incorporated (Materials, Metals & Mining) | | | | | | | 1,107,254 | | | | 25,527,299 | |
Goldcorp Incorporated-U.S. Exchange Traded Shares (Materials, Metals & Mining) | | | | | | | 721,694 | | | | 16,620,613 | |
Kinross Gold Corporation (Materials, Metals & Mining) † | | | | | | | 4,950,553 | | | | 16,443,642 | |
Mag Silver Corporation (Materials, Metals & Mining) † | | | | | | | 510,000 | | | | 3,793,294 | |
Mag Silver Corporation-Legend Shares (Materials, Metals & Mining) | | | | | | | 100,000 | | | | 743,783 | |
New Gold Incorporated (Materials, Metals & Mining) † | | | | | | | 1,600,000 | | | | 8,100,362 | |
Osisko Gold Royalties Limited (Materials, Metals & Mining) † | | | | | | | 366,700 | | | | 4,642,891 | |
Platinum Group Metals Limited (Materials, Metals & Mining) † | | | �� | | | | 3,450,000 | | | | 3,049,690 | |
Platinum Group Metals Limited-Legend Shares (Materials, Metals & Mining) | | | | | | | 800,000 | | | | 707,174 | |
Primero Mining Corporation (Materials, Metals & Mining) † | | | | | | | 485,100 | | | | 2,360,637 | |
Rio Alto Mining Limited (Materials, Metals & Mining) † | | | | | | | 500,000 | | | | 1,192,018 | |
Semafo Incorporated (Materials, Metals & Mining) † | | | | | | | 2,060,400 | | | | 7,248,516 | |
Silver Wheaton Corporation (Materials, Metals & Mining) | | | | | | | 12,950 | | | | 258,318 | |
Silver Wheaton Corporation-U.S. Exchange Traded Shares (Materials, Metals & Mining) | | | | | | | 700,000 | | | | 13,951,000 | |
Tahoe Resources Incorporated (Materials, Metals & Mining) † | | | | | | | 600,000 | | | | 12,209,474 | |
Tahoe Resources Incorporated-Legend Shares (Materials, Metals & Mining) | | | | | | | 280,000 | | | | 5,697,754 | |
Torex Gold Resources Incorporated (Materials, Metals & Mining) † | | | | | | | 900,000 | | | | 1,181,303 | |
Torex Gold Resources Incorporated (Materials, Metals & Mining) (i) | | | | | | | 1,850,000 | | | | 2,428,233 | |
Torex Gold Resources Incorporated-Legend Shares (Materials, Metals & Mining) (i) | | | | | | | 2,662,500 | | | | 3,494,687 | |
Troy Resources NL-Canadian Issued Legend Shares (Materials, Metals & Mining) (i) | | | | | | | 95,833 | | | | 61,610 | |
Yamana Gold Incorporated (Materials, Metals & Mining) | | | | | | | 2,162,731 | | | | 12,976,965 | |
Yamana Gold Incorporated-U.S. Exchange Traded Shares (Materials, Metals & Mining) | | | | | | | 640,537 | | | | 3,843,222 | |
| | | | |
| | | | | | | | | | | 270,979,765 | |
| | | | | | | | | | | | |
The accompanying notes are an integral part of these consolidated financial statements.
| | | | |
| 8 | | Wells Fargo Advantage Precious Metals Fund | | Consolidated portfolio of investments—September 30, 2014 (unaudited) |
| | | | | | | | | | | | | | |
| Security name | | | | | | | Shares | | | Value | |
| | | | | | | | | | | | | | |
| | | | |
| Peru: 0.15% | | | | | | | | | | | | | | |
Compania de Minas Buenaventura SA ADR (Materials, Metals & Mining) | | | | | | | | | 54,644 | | | $ | 632,778 | |
| | | | | | | | | | | | | | |
| | | | |
| South Africa: 1.04% | | | | | | | | | | | | | | |
AngloGold Ashanti Limited ADR (Materials, Metals & Mining) † | | | | | | | | | 200,591 | | | | 2,407,092 | |
Impala Platinum Holdings Limited (Materials, Metals & Mining) | | | | | | | | | 259,346 | | | | 1,999,787 | |
| | | | |
| | | | | | | | | | | | | 4,406,879 | |
| | | | | | | | | | | | | | |
| | | | |
| United Kingdom: 13.62% | | | | | | | | | | | | | | |
Fresnillo plc (Materials, Metals & Mining) | | | | | | | | | 1,250,000 | | | | 15,400,927 | |
Hochschild Mining plc (Materials, Metals & Mining) † | | | | | | | | | 599,251 | | | | 1,314,407 | |
Randgold Resources Limited ADR (Materials, Metals & Mining) | | | | | | | | | 610,000 | | | | 41,229,900 | |
| | | | |
| | | | | | | | | | | | | 57,945,234 | |
| | | | | | | | | | | | | | |
| | | | |
| United States: 6.89% | | | | | | | | | | | | | | |
Newmont Mining Corporation (Materials, Metals & Mining) | | | | | | | | | 160,455 | | | | 3,698,488 | |
Royal Gold Incorporated (Materials, Metals & Mining) | | | | | | | | | 394,436 | | | | 25,614,674 | |
| | | | |
| | | | | | | | | | | | | 29,313,162 | |
| | | | | | | | | | | | | | |
| | | | |
Total Common Stocks (Cost $347,614,155) | | | | | | | | | | | | | 375,257,570 | |
| | | | | | | | | | | | | | |
| | | | |
| | | | | | | | Troy ounces | | | | |
| Commodities: 7.30% | | | | | | | | | | | | | | |
Gold Bullion †** | | | | | | | | | 25,691 | | | | 31,059,570 | |
| | | | | | | | | | | | | | |
| | | | |
Total Commodities (Cost $21,028,323) | | | | | | | | | | | | | 31,059,570 | |
| | | | | | | | | | | | | | |
| | | | |
| | | Yield | | | | | Shares | | | | |
| Short-Term Investments: 2.16% | | | | | | | | | | | | | | |
| | | | |
| Investment Companies: 2.16% | | | | | | | | | | | | | | |
Wells Fargo Advantage Cash Investment Money Market Fund, Select Class (l)(u) | | | 0.07 | % | | | | | 9,195,095 | | | | 9,195,095 | |
| | | | | | | | | | | | | | |
| | | | |
Total Short-Term Investments (Cost $9,195,095) | | | | | | | | | | | | | 9,195,095 | |
| | | | | | | | | | | | | | |
| | | | | | | | |
| Total investments | | | | | | | | |
| (Cost $377,837,573) * | | | 97.70 | % | | | 415,512,235 | |
Other assets and liabilities, net | | | 2.30 | | | | 9,778,975 | |
| | | | | | | | |
| Total net assets | | | 100.00 | % | | $ | 425,291,210 | |
| | | | | | | | |
| † | Non-income-earning security |
| 144A | The security may be resold in transactions exempt from registration, normally to qualified institutional buyers, pursuant to Rule 144A under the Securities Act of 1933. |
| ** | Represents an investment held in Wells Fargo Special Investments (Cayman) SPC, the consolidated entity. |
| (l) | The security represents an affiliate of the Fund as defined in the Investment Company Act of 1940. |
| (u) | The rate represents the 7-day annualized yield at period end. |
| * | Cost for federal income tax purposes is $417,940,187 and unrealized gains (losses) consists of: |
| | | | |
Gross unrealized gains | | $ | 141,339,379 | |
Gross unrealized losses | | | (143,767,331 | ) |
| | | | |
Net unrealized losses | | $ | (2,427,952 | ) |
The accompanying notes are an integral part of these consolidated financial statements.
| | | | | | |
| Consolidated statement of assets and liabilities—September 30, 2014 (unaudited) | | Wells Fargo Advantage Precious Metals Fund | | | 9 | |
| | | | |
| | | | |
| |
Assets | | | | |
Investments | | | | |
In unaffiliated securities, at value (cost $347,614,155) | | $ | 375,257,570 | |
In commodities, at value (cost $21,028,323) | | | 31,059,570 | |
In affiliated securities, at value (cost $9,195,095) | | | 9,195,095 | |
| | | | |
Total investments, at value (cost $377,837,573) | | | 415,512,235 | |
Foreign currency, at value (cost $7,421,001) | | | 7,226,860 | |
Cash | | | 60,277 | |
Receivable for investments sold | | | 2,416,181 | |
Receivable for Fund shares sold | | | 1,282,399 | |
Receivable for dividends | | | 89,964 | |
Prepaid expenses and other assets | | | 58,432 | |
| | | | |
Total assets | | | 426,646,348 | |
| | | | |
| |
Liabilities | | | | |
Payable for Fund shares redeemed | | | 789,577 | |
Advisory fee payable | | | 188,790 | |
Distribution fees payable | | | 59,580 | |
Administration fees payable | | | 107,768 | |
Shareholder servicing fees payable | | | 86,909 | |
Accrued expenses and other liabilities | | | 122,514 | |
| | | | |
Total liabilities | | | 1,355,138 | |
| | | | |
Total net assets | | $ | 425,291,210 | |
| | | | |
| |
NET ASSETS CONSIST OF | | | | |
Paid-in capital | | $ | 536,554,198 | |
Accumulated net investment loss | | | (13,150,197 | ) |
Accumulated net realized losses on investments | | | (135,592,447 | ) |
Net unrealized gains on investments | | | 37,479,656 | |
| | | | |
Total net assets | | $ | 425,291,210 | |
| | | | |
| |
COMPUTATION OF NET ASSET VALUE AND OFFERING PRICE PER SHARE | | | | |
Net assets – Class A | | $ | 258,715,404 | |
Shares outstanding – Class A1 | | | 7,544,299 | |
Net asset value per share – Class A | | | $34.29 | |
Maximum offering price per share – Class A2 | | | $36.38 | |
Net assets – Class B | | $ | 4,703,499 | |
Shares outstanding – Class B1 | | | 150,434 | |
Net asset value per share – Class B | | | $31.27 | |
Net assets – Class C | | $ | 82,068,824 | |
Shares outstanding – Class C1 | | | 2,661,591 | |
Net asset value per share – Class C | | | $30.83 | |
Net assets – Administrator Class | | $ | 35,209,183 | |
Shares outstanding – Administrator Class1 | | | 1,021,303 | |
Net asset value per share – Administrator Class | | | $34.47 | |
Net assets – Institutional Class | | $ | 44,594,300 | |
Shares outstanding – Institutional Class1 | | | 1,287,477 | |
Net asset value per share – Institutional Class | | | $34.64 | |
| 1. | The Fund has an unlimited number of authorized shares. |
| 2. | Maximum offering price is computed as 100/94.25 of net asset value. On investments of $50,000 or more, the offering price is reduced. |
The accompanying notes are an integral part of these consolidated financial statements.
| | | | |
| 10 | | Wells Fargo Advantage Precious Metals Fund | | Consolidated statement of operations—six months ended September 30, 2014 (unaudited) |
| | | | |
| | | | |
| |
Investment income | | | | |
Dividends (net of foreign withholding taxes of $244,092) | | $ | 1,686,548 | |
Income from affiliated securities | | | 3,256 | |
Interest | | | 1,626 | |
| | | | |
Total investment income | | | 1,691,430 | |
| | | | |
| |
Expenses | | | | |
Advisory fee | | | 1,490,739 | |
Administration fees | | | | |
Fund level | | | 124,468 | |
Class A | | | 406,539 | |
Class B | | | 8,359 | |
Class C | | | 127,922 | |
Administrator Class | | | 17,634 | |
Institutional Class | | | 18,021 | |
Shareholder servicing fees | | | | |
Class A | | | 390,904 | |
Class B | | | 8,038 | |
Class C | | | 123,000 | |
Administrator Class | | | 44,085 | |
Distribution fees | | | | |
Class B | | | 24,113 | |
Class C | | | 369,002 | |
Custody and accounting fees | | | 37,360 | |
Professional fees | | | 28,387 | |
Registration fees | | | 28,720 | |
Shareholder report expenses | | | 34,207 | |
Trustees’ fees and expenses | | | 6,160 | |
Other fees and expenses | | | 25,785 | |
| | | | |
Total expenses | | | 3,313,443 | |
Less: Fee waivers and/or expense reimbursements | | | (285,235 | ) |
| | | | |
Net expenses | | | 3,028,208 | |
| | | | |
Net investment loss | | | (1,336,778 | ) |
| | | | |
| |
REALIZED AND UNREALIZED GAINS (LOSSES) ON INVESTMENTS | | | | |
| |
Net realized gains on: | | | | |
Unaffiliated securities | | | 6,163,773 | |
| |
Net change in unrealized gains (losses) on: | | | | |
Unaffiliated securities | | | (22,638,419 | ) |
Commodities | | | (11,116,084 | ) |
| | | | |
Net change in unrealized gains (losses) on investments | | | (33,754,503 | ) |
| | | | |
Net realized and unrealized gains (losses) on investments | | | (27,590,730 | ) |
| | | | |
Net decrease in net assets resulting from operations | | $ | (28,927,508 | ) |
| | | | |
The accompanying notes are an integral part of these consolidated financial statements.
| | | | | | |
| Consolidated statement of changes in net assets | | Wells Fargo Advantage Precious Metals Fund | | | 11 | |
| | | | | | | | | | | | | | | | |
| | | Six months ended
September 30, 2014
(unaudited) | | | Year ended
March 31, 2014 | |
| | | | |
Operations | | | | | | | | | | | | | | | | |
Net investment loss | | | | | | $ | (1,336,778 | ) | | | | | | $ | (116,890 | ) |
Net realized gains (losses) on investments | | | | | | | 6,163,773 | | | | | | | | (94,191,041 | ) |
Net change in unrealized gains (losses) on investments | | | | | | | (33,754,503 | ) | | | | | | | (158,763,967 | ) |
| | | | |
Net decrease in net assets resulting from operations | | | | | | | (28,927,508 | ) | | | | | | | (253,071,898 | ) |
| | | | |
| | | | |
Distributions to shareholders from | | | | | | | | | | | | | | | | |
Net realized gains | | | | | | | | | | | | | | | | |
Class A | | | | | | | 0 | | | | | | | | (1,732,919 | ) |
Class B | | | | | | | 0 | | | | | | | | (56,443 | ) |
Class C | | | | | | | 0 | | | | | | | | (644,334 | ) |
Administrator Class | | | | | | | 0 | | | | | | | | (208,267 | ) |
Institutional Class | | | | | | | 0 | | | | | | | | (234,533 | ) |
| | | | |
Total distributions to shareholders | | | | | | | 0 | | | | | | | | (2,876,496 | ) |
| | | | |
| | | | |
Capital share transactions | | | Shares | | | | | | | | Shares | | | | | |
Proceeds from shares sold | | | | | | | | | | | | | | | | |
Class A | | | 978,030 | | | | 38,597,249 | | | | 2,429,528 | | | | 94,413,758 | |
Class B | | | 224 | | | | 8,006 | | | | 6,082 | | | | 215,945 | |
Class C | | | 82,910 | | | | 2,929,238 | | | | 464,039 | | | | 16,503,538 | |
Administrator Class | | | 401,949 | | | | 16,207,335 | | | | 814,815 | | | | 31,629,743 | |
Institutional Class | | | 470,840 | | | | 19,077,398 | | | | 706,207 | | | | 27,233,344 | |
| | | | |
| | | | | | | 76,819,226 | | | | | | | | 169,996,328 | |
| | | | |
Reinvestment of distributions | | | | | | | | | | | | | | | | |
Class A | | | 0 | | | | 0 | | | | 48,309 | | | | 1,568,095 | |
Class B | | | 0 | | | | 0 | | | | 1,555 | | | | 46,307 | |
Class C | | | 0 | | | | 0 | | | | 16,486 | | | | 484,020 | |
Administrator Class | | | 0 | | | | 0 | | | | 3,702 | | | | 120,659 | |
Institutional Class | | | 0 | | | | 0 | | | | 7,060 | | | | 230,853 | |
| | | | |
| | | | | | | 0 | | | | | | | | 2,449,934 | |
| | | | |
Payment for shares redeemed | | | | | | | | | | | | | | | | |
Class A | | | (1,643,489 | ) | | | (64,953,848 | ) | | | (3,577,817 | ) | | | (140,470,142 | ) |
Class B | | | (67,533 | ) | | | (2,386,083 | ) | | | (205,969 | ) | | | (7,350,319 | ) |
Class C | | | (289,036 | ) | | | (10,164,914 | ) | | | (1,546,100 | ) | | | (53,949,247 | ) |
Administrator Class | | | (255,991 | ) | | | (9,912,525 | ) | | | (931,783 | ) | | | (34,759,227 | ) |
Institutional Class | | | (319,443 | ) | | | (12,480,623 | ) | | | (678,847 | ) | | | (26,388,223 | ) |
| | | | |
| | | | | | | (99,897,993 | ) | | | | | | | (262,917,158 | ) |
| | | | |
Net decrease in net assets resulting from capital share transactions | | | | | | | (23,078,767 | ) | | | | | | | (90,470,896 | ) |
| | | | |
Total decrease in net assets | | | | | | | (52,006,275 | ) | | | | | | | (346,419,290 | ) |
| | | | |
| | | | |
Net assets | | | | | | | | | | | | | | | | |
Beginning of period | | | | | | | 477,297,485 | | | | | | | | 823,716,775 | |
| | | | |
End of period | | | | | | $ | 425,291,210 | | | | | | | $ | 477,297,485 | |
| | | | |
Accumulated net investment loss | | | | | | $ | (13,150,197 | ) | | | | | | $ | (11,546,337 | ) |
| | | | |
The accompanying notes are an integral part of these consolidated financial statements.
| | | | |
| 12 | | Wells Fargo Advantage Precious Metals Fund | | Consolidated financial highlights |
(For a share outstanding throughout each period)
| | | | | | | | | | | | | | | | | | | | | | | | | | | | |
| | | Six months ended
September 30, 2014 (unaudited) | | | Year ended March 31 | | | Year ended October 31 | |
| CLASS A | | | 2014 | | | 2013 | | | 2012 | | | 20111 | | | 20102 | | | 20092 | |
Net asset value, beginning of period | | $ | 36.65 | | | $ | 53.59 | | | $ | 70.30 | | | $ | 85.64 | | | $ | 93.43 | | | $ | 64.40 | | | $ | 33.15 | |
Net investment income (loss) | | | (0.08 | )3 | | | 0.05 | 3 | | | (0.01 | )3 | | | (0.19 | )3 | | | (0.21 | )3 | | | (0.35 | )3 | | | (0.33 | )3 |
Net realized and unrealized gains (losses) on investments | | | (2.28 | ) | | | (16.78 | ) | | | (14.47 | ) | | | (13.39 | ) | | | 3.24 | | | | 29.38 | | | | 33.23 | |
| | | | | | | | | | | | | | | | | | | | | | | | | | | | |
Total from investment operations | | | (2.36 | ) | | | (16.73 | ) | | | (14.48 | ) | | | (13.58 | ) | | | 3.03 | | | | 29.03 | | | | 32.90 | |
Distributions to shareholders from | | | | | | | | | | | | | | | | | | | | | | | | | | | | |
Net investment income | | | 0.00 | | | | 0.00 | | | | 0.00 | | | | (1.27 | ) | | | (4.06 | ) | | | 0.00 | | | | 0.00 | |
Net realized gains | | | 0.00 | | | | (0.21 | ) | | | (2.23 | ) | | | (0.49 | ) | | | (6.76 | ) | | | 0.00 | | | | (1.65 | ) |
| | | | | | | | | | | | | | | | | | | | | | | | | | | | |
Total distributions to shareholders | | | 0.00 | | | | (0.21 | ) | | | (2.23 | ) | | | (1.76 | ) | | | (10.82 | ) | | | 0.00 | | | | (1.65 | ) |
Net asset value, end of period | | $ | 34.29 | | | $ | 36.65 | | | $ | 53.59 | | | $ | 70.30 | | | $ | 85.64 | | | $ | 93.43 | | | $ | 64.40 | |
Total return4 | | | (6.44 | )% | | | (31.17 | )% | | | (21.14 | )% | | | (15.95 | )% | | | 3.14 | % | | | 45.10 | % | | | 103.24 | % |
Ratios to average net assets (annualized) | | | | | | | | | | | | | | | | | | | | | | | | | | | | |
Gross expenses | | | 1.22 | % | | | 1.22 | % | | | 1.18 | % | | | 1.14 | % | | | 1.15 | % | | | 1.09 | % | | | 1.08 | % |
Net expenses | | | 1.10 | % | | | 1.09 | % | | | 1.09 | % | | | 1.09 | % | | | 1.09 | % | | | 1.05 | % | | | 1.08 | % |
Net investment income (loss) | | | (0.41 | )% | | | 0.12 | % | | | (0.02 | )% | | | (0.24 | )% | | | (0.57 | )% | | | (0.45 | )% | | | (0.62 | )% |
Supplemental data | | | | | | | | | | | | | | | | | | | | | | | | | | | | |
Portfolio turnover rate | | | 1 | % | | | 16 | % | | | 6 | % | | | 4 | % | | | 5 | % | | | 14 | % | | | 14 | % |
Net assets, end of period (000s omitted) | | | $258,715 | | | | $300,906 | | | | $498,874 | | | | $699,773 | | | | $873,142 | | | | $954,220 | | | | $594,910 | |
| 1. | For the five months ended March 31, 2011. The Fund changed its fiscal year end from October 31 to March 31, effective March 31, 2011. |
| 2. | After the close of business on July 16, 2010, the Fund acquired the net assets of Evergreen Precious Metals Fund which became the accounting and performance survivor in the transaction. The information for the periods prior to July 19, 2010 is that of Class A of Evergreen Precious Metals Fund. |
| 3. | Calculated based upon average shares outstanding |
| 4. | Total return calculations do not include any sales charges. Returns for periods of less than one year are not annualized. |
The accompanying notes are an integral part of these consolidated financial statements.
| | | | | | |
| Consolidated financial highlights | | Wells Fargo Advantage Precious Metals Fund | | | 13 | |
(For a share outstanding throughout each period)
| | | | | | | | | | | | | | | | | | | | | | | | | | | | |
| | | Six months ended
September 30, 2014 (unaudited) | | | Year ended March 31 | | | Year ended October 31 | |
| CLASS B | | | 2014 | | | 2013 | | | 2012 | | | 20111 | | | 20102 | | | 20092 | |
Net asset value, beginning of period | | $ | 33.54 | | | $ | 49.44 | | | $ | 65.53 | | | $ | 79.20 | | | $ | 86.53 | | | $ | 60.10 | | | $ | 31.25 | |
Net investment loss | | | (0.21 | )3 | | | (0.22 | )3 | | | (0.47 | )3 | | | (0.77 | )3 | | | (0.44 | )3 | | | (0.86 | )3 | | | (0.68 | )3 |
Net realized and unrealized gains (losses) on investments | | | (2.06 | ) | | | (15.47 | ) | | | (13.39 | ) | | | (12.29 | ) | | | 3.01 | | | | 27.29 | | | | 31.18 | |
| | | | | | | | | | | | | | | | | | | | | | | | | | | | |
Total from investment operations | | | (2.27 | ) | | | (15.69 | ) | | | (13.86 | ) | | | (13.06 | ) | | | 2.57 | | | | 26.43 | | | | 30.50 | |
Distributions to shareholders from | | | | | | | | | | | | | | | | | | | | | | | | | | | | |
Net investment income | | | 0.00 | | | | 0.00 | | | | 0.00 | | | | (0.12 | ) | | | (3.14 | ) | | | 0.00 | | | | 0.00 | |
Net realized gains | | | 0.00 | | | | (0.21 | ) | | | (2.23 | ) | | | (0.49 | ) | | | (6.76 | ) | | | 0.00 | | | | (1.65 | ) |
| | | | | | | | | | | | | | | | | | | | | | | | | | | | |
Total distributions to shareholders | | | 0.00 | | | | (0.21 | ) | | | (2.23 | ) | | | (0.61 | ) | | | (9.90 | ) | | | 0.00 | | | | (1.65 | ) |
Net asset value, end of period | | $ | 31.27 | | | $ | 33.54 | | | $ | 49.44 | | | $ | 65.53 | | | $ | 79.20 | | | $ | 86.53 | | | $ | 60.10 | |
Total return4 | | | (6.77 | )% | | | (31.68 | )% | | | (21.74 | )% | | | (16.58 | )% | | | 2.82 | % | | | 44.00 | % | | | 101.77 | % |
Ratios to average net assets (annualized) | | | | | | | | | | | | | | | | | | | | | | | | | | | | |
Gross expenses | | | 1.97 | % | | | 1.96 | % | | | 1.93 | % | | | 1.89 | % | | | 1.90 | % | | | 1.83 | % | | | 1.83 | % |
Net expenses | | | 1.85 | % | | | 1.84 | % | | | 1.84 | % | | | 1.84 | % | | | 1.84 | % | | | 1.80 | % | | | 1.83 | % |
Net investment loss | | | (1.16 | )% | | | (0.60 | )% | | | (0.78 | )% | | | (1.01 | )% | | | (1.32 | )% | | | (1.19 | )% | | | (1.37 | )% |
Supplemental data | | | | | | | | | | | | | | | | | | | | | | | | | | | | |
Portfolio turnover rate | | | 1 | % | | | 16 | % | | | 6 | % | | | 4 | % | | | 5 | % | | | 14 | % | | | 14 | % |
Net assets, end of period (000s omitted) | | | $4,703 | | | | $7,304 | | | | $20,570 | | | | $39,046 | | | | $71,761 | | | | $82,984 | | | | $69,553 | |
| 1. | For the five months ended March 31, 2011. The Fund changed its fiscal year end from October 31 to March 31, effective March 31, 2011. |
| 2. | After the close of business on July 16, 2010, the Fund acquired the net assets of Evergreen Precious Metals Fund which became the accounting and performance survivor in the transaction. The information for the periods prior to July 19, 2010 is that of Class B of Evergreen Precious Metals Fund. |
| 3. | Calculated based upon average shares outstanding |
| 4. | Total return calculations do not include any sales charges. Returns for periods of less than one year are not annualized. |
The accompanying notes are an integral part of these consolidated financial statements.
| | | | |
| 14 | | Wells Fargo Advantage Precious Metals Fund | | Consolidated financial highlights |
(For a share outstanding throughout each period)
| | | | | | | | | | | | | | | | | | | | | | | | | | | | |
| | | Six months ended
September 30, 2014 (unaudited) | | | Year ended March 31 | | | Year ended October 31 | |
| CLASS C | | | 2014 | | | 2013 | | | 2012 | | | 20111 | | | 20102 | | | 20092 | |
Net asset value, beginning of period | | $ | 33.08 | | | $ | 48.76 | | | $ | 64.66 | | | $ | 78.43 | | | $ | 85.86 | | | $ | 59.63 | | | $ | 31.02 | |
Net investment loss | | | (0.21 | )3 | | | (0.22 | )3 | | | (0.46 | )3 | | | (0.75 | )3 | | | (0.43 | )3 | | | (0.86 | )3 | | | (0.68 | )3 |
Net realized and unrealized gains (losses) on investments | | | (2.04 | ) | | | (15.25 | ) | | | (13.21 | ) | | | (12.18 | ) | | | 2.98 | | | | 27.09 | | | | 30.94 | |
| | | | | | | | | | | | | | | | | | | | | | | | | | | | |
Total from investment operations | | | (2.25 | ) | | | (15.47 | ) | | | (13.67 | ) | | | (12.93 | ) | | | 2.55 | | | | 26.23 | | | | 30.26 | |
Distributions to shareholders from | | | | | | | | | | | | | | | | | | | | | | | | | | | | |
Net investment income | | | 0.00 | | | | 0.00 | | | | 0.00 | | | | (0.35 | ) | | | (3.22 | ) | | | 0.00 | | | | 0.00 | |
Net realized gains | | | 0.00 | | | | (0.21 | ) | | | (2.23 | ) | | | (0.49 | ) | | | (6.76 | ) | | | 0.00 | | | | (1.65 | ) |
| | | | | | | | | | | | | | | | | | | | | | | | | | | | |
Total distributions to shareholders | | | 0.00 | | | | (0.21 | ) | | | (2.23 | ) | | | (0.84 | ) | | | (9.98 | ) | | | 0.00 | | | | (1.65 | ) |
Net asset value, end of period | | $ | 30.83 | | | $ | 33.08 | | | $ | 48.76 | | | $ | 64.66 | | | $ | 78.43 | | | $ | 85.86 | | | $ | 59.63 | |
Total return4 | | | (6.80 | )% | | | (31.67 | )% | | | (21.74 | )% | | | (16.58 | )% | | | 2.82 | % | | | 44.01 | % | | | 101.75 | % |
Ratios to average net assets (annualized) | | | | | | | | | | | | | | | | | | | | | | | | | | | | |
Gross expenses | | | 1.97 | % | | | 1.97 | % | | | 1.93 | % | | | 1.89 | % | | | 1.90 | % | | | 1.84 | % | | | 1.83 | % |
Net expenses | | | 1.85 | % | | | 1.84 | % | | | 1.84 | % | | | 1.84 | % | | | 1.84 | % | | | 1.80 | % | | | 1.83 | % |
Net investment loss | | | (1.16 | )% | | | (0.62 | )% | | | (0.77 | )% | | | (0.99 | )% | | | (1.31 | )% | | | (1.19 | )% | | | (1.37 | )% |
Supplemental data | | | | | | | | | | | | | | | | | | | | | | | | | | | | |
Portfolio turnover rate | | | 1 | % | | | 16 | % | | | 6 | % | | | 4 | % | | | 5 | % | | | 14 | % | | | 14 | % |
Net assets, end of period (000s omitted) | | | $82,069 | | | | $94,865 | | | | $191,782 | | | | $290,513 | | | | $398,047 | | | | $396,590 | | | | $273,636 | |
| 1. | For the five months ended March 31, 2011. The Fund changed its fiscal year end from October 31 to March 31, effective March 31, 2011. |
| 2. | After the close of business on July 16, 2010, the Fund acquired the net assets of Evergreen Precious Metals Fund which became the accounting and performance survivor in the transaction. The information for the periods prior to July 19, 2010 is that of Class C of Evergreen Precious Metals Fund. |
| 3. | Calculated based upon average shares outstanding |
| 4. | Total return calculations do not include any sales charges. Returns for periods of less than one year are not annualized. |
The accompanying notes are an integral part of these consolidated financial statements.
| | | | | | |
| Consolidated financial highlights | | Wells Fargo Advantage Precious Metals Fund | | | 15 | |
(For a share outstanding throughout each period)
| | | | | | | | | | | | | | | | | | | | | | | | |
| | | Six months ended
September 30, 2014 (unaudited) | | | Year ended March 31 | | | Year ended
October 31 20102 | |
| ADMINISTRATOR CLASS | | | 2014 | | | 2013 | | | 2012 | | | 20111 | | |
Net asset value, beginning of period | | $ | 36.82 | | | $ | 53.75 | | | $ | 70.42 | | | $ | 85.70 | | | $ | 93.65 | | | $ | 77.73 | |
Net investment income (loss) | | | (0.05 | )3 | | | 0.10 | 3 | | | 0.08 | 3 | | | (0.06 | )3 | | | (0.11 | )3 | | | (0.12 | )3 |
Net realized and unrealized gains (losses) on investments | | | (2.30 | ) | | | (16.82 | ) | | | (14.52 | ) | | | (13.41 | ) | | | 3.22 | | | | 16.04 | |
| | | | | | | | | | | | | | | | | | | | | | | | |
Total from investment operations | | | (2.35 | ) | | | (16.72 | ) | | | (14.44 | ) | | | (13.47 | ) | | | 3.11 | | | | 15.92 | |
Distributions to shareholders from | | | | | | | | | | | | | | | | | | | | | | | | |
Net investment income | | | 0.00 | | | | 0.00 | | | | 0.00 | | | | (1.32 | ) | | | (4.30 | ) | | | 0.00 | |
Net realized gains | | | 0.00 | | | | (0.21 | ) | | | (2.23 | ) | | | (0.49 | ) | | | (6.76 | ) | | | 0.00 | |
| | | | | | | | | | | | | | | | | | | | | | | | |
Total distributions to shareholders | | | 0.00 | | | | (0.21 | ) | | | (2.23 | ) | | | (1.81 | ) | | | (11.06 | ) | | | 0.00 | |
Net asset value, end of period | | $ | 34.47 | | | $ | 36.82 | | | $ | 53.75 | | | $ | 70.42 | | | $ | 85.70 | | | $ | 93.65 | |
Total return4 | | | (6.38 | )% | | | (31.06 | )% | | | (21.05 | )% | | | (15.81 | )% | | | 3.20 | % | | | 20.48 | % |
Ratios to average net assets (annualized) | | | | | | | | | | | | | | | | | | | | | | | | |
Gross expenses | | | 1.06 | % | | | 1.04 | % | | | 1.01 | % | | | 0.94 | % | | | 0.91 | % | | | 1.06 | % |
Net expenses | | | 0.96 | % | | | 0.95 | % | | | 0.95 | % | | | 0.92 | % | | | 0.91 | % | | | 0.95 | % |
Net investment income (loss) | | | (0.26 | )% | | | 0.26 | % | | | 0.13 | % | | | (0.08 | )% | | | (0.30 | )% | | | (0.54 | )% |
Supplemental data | | | | | | | | | | | | | | | | | | | | | | | | |
Portfolio turnover rate | | | 1 | % | | | 16 | % | | | 6 | % | | | 4 | % | | | 5 | % | | | 14 | % |
Net assets, end of period (000s omitted) | | | $35,209 | | | | $32,230 | | | | $53,142 | | | | $53,497 | | | | $94,103 | | | | $127 | |
| 1. | For the five months ended March 31, 2011. The Fund changed its fiscal year end from October 31 to March 31, effective March 31, 2011. |
| 2. | For the period from July 30, 2010 (commencement of class operations) to October 31, 2010 |
| 3. | Calculated based upon average shares outstanding |
| 4. | Returns for periods of less than one year are not annualized. |
The accompanying notes are an integral part of these consolidated financial statements.
| | | | |
| 16 | | Wells Fargo Advantage Precious Metals Fund | | Consolidated financial highlights |
(For a share outstanding throughout each period)
| | | | | | | | | | | | | | | | | | | | | | | | | | | | |
| | | Six months ended
September 30, 2014 (unaudited) | | | Year ended March 31 | | | Year ended October 31 | |
| INSTITUTIONAL CLASS | | | 2014 | | | 2013 | | | 2012 | | | 20111 | | | 20102 | | | 20092 | |
Net asset value, beginning of period | | $ | 36.96 | | | $ | 53.87 | | | $ | 70.43 | | | $ | 85.84 | | | $ | 93.68 | | | $ | 64.41 | | | $ | 33.07 | |
Net investment income (loss) | | | (0.02 | )3 | | | 0.16 | 3 | | | 0.19 | | | | 0.12 | | | | (0.06 | )3 | | | (0.14 | )3 | | | (0.20 | )3 |
Net realized and unrealized gains (losses) on investments | | | (2.30 | ) | | | (16.86 | ) | | | (14.52 | ) | | | (13.45 | ) | | | 3.26 | | | | 29.41 | | | | 33.19 | |
| | | | | | | | | | | | | | | | | | | | | | | | | | | | |
Total from investment operations | | | (2.32 | ) | | | (16.70 | ) | | | (14.33 | ) | | | (13.33 | ) | | | 3.20 | | | | 29.27 | | | | 32.99 | |
Distributions to shareholders from | | | | | | | | | | | | | | | | | | | | | | | | | | | | |
Net investment income | | | 0.00 | | | | 0.00 | | | | 0.00 | | | | (1.59 | ) | | | (4.28 | ) | | | 0.00 | | | | 0.00 | |
Net realized gains | | | 0.00 | | | | (0.21 | ) | | | (2.23 | ) | | | (0.49 | ) | | | (6.76 | ) | | | 0.00 | | | | (1.65 | ) |
| | | | | | | | | | | | | | | | | | | | | | | | | | | | |
Total distributions to shareholders | | | 0.00 | | | | (0.21 | ) | | | (2.23 | ) | | | (2.08 | ) | | | (11.04 | ) | | | 0.00 | | | | (1.65 | ) |
Net asset value, end of period | | $ | 34.64 | | | $ | 36.96 | | | $ | 53.87 | | | $ | 70.43 | | | $ | 85.84 | | | $ | 93.68 | | | $ | 64.41 | |
Total return4 | | | (6.28 | )% | | | (30.95 | )% | | | (20.89 | )% | | | (15.64 | )% | | | 3.32 | % | | | 45.47 | % | | | 103.78 | % |
Ratios to average net assets (annualized) | | | | | | | | | | | | | | | | | | | | | | | | | | | | |
Gross expenses | | | 0.79 | % | | | 0.79 | % | | | 0.75 | % | | | 0.71 | % | | | 0.72 | % | | | 0.78 | % | | | 0.82 | % |
Net expenses | | | 0.79 | % | | | 0.78 | % | | | 0.75 | % | | | 0.71 | % | | | 0.69 | % | | | 0.78 | % | | | 0.82 | % |
Net investment income (loss) | | | (0.10 | )% | | | 0.41 | % | | | 0.32 | % | | | 0.14 | % | | | (0.15 | )% | | | (0.18 | )% | | | (0.37 | )% |
Supplemental data | | | | | | | | | | | | | | | | | | | | | | | | | | | | |
Portfolio turnover rate | | | 1 | % | | | 16 | % | | | 6 | % | | | 4 | % | | | 5 | % | | | 14 | % | | | 14 | % |
Net assets, end of period (000s omitted) | | | $44,594 | | | | $41,993 | | | | $59,349 | | | | $78,846 | | | | $96,798 | | | | $84,087 | | | | $42,511 | |
| 1. | For the five months ended March 31, 2011. The Fund changed its fiscal year end from October 31 to March 31, effective March 31, 2011. |
| 2. | After the close of business on July 16, 2010, the Fund acquired the net assets of Evergreen Precious Metals Fund which became the accounting and performance survivor in the transaction. The information for the periods prior to July 19, 2010 is that of Class I of Evergreen Precious Metals Fund. |
| 3. | Calculated based upon average shares outstanding |
| 4. | Returns for periods of less than one year are not annualized. |
The accompanying notes are an integral part of these consolidated financial statements.
| | | | | | |
| Notes to consolidated financial statements (unaudited) | | Wells Fargo Advantage Precious Metals Fund | | | 17 | |
1. ORGANIZATION
Wells Fargo Funds Trust (the “Trust”), a Delaware statutory trust organized on March 10, 1999, is an open-end management investment company registered under the Investment Company Act of 1940, as amended (the “1940 Act”). These financial statements report on the Wells Fargo Advantage Precious Metals Fund (the “Fund”) which is a non-diversified series of the Trust.
2. INVESTMENT IN SUBSIDIARY
The Fund invests in precious metals and minerals through Wells Fargo Special Investments (Cayman) SPC (the “Subsidiary”), a wholly owned subsidiary incorporated on May 3, 2005 under the laws of the Cayman Islands as an exempted segregated portfolio company with limited liability. As of September 30, 2014, the Subsidiary held $31,059,570 in gold bullion representing 99.83% of its net assets. The Fund is the sole shareholder of the Subsidiary. As of September 30, 2014, the Fund held $31,111,481 in the Subsidiary, representing 7.32% of the Fund’s net assets.
In June 2013, Accounting Standards Update (ASU) No. 2013-08, “Financial Services - Investment Companies: Amendments to the Scope, Measurement, and Disclosure Requirements,” amended guidance in Topic 946, Financial Services – Investment Companies for determining whether an entity is defined as an investment company. These amendments are effective for an entity’s interim and annual reporting periods for fiscal years beginning after December 15, 2013. The Fund has adopted ASU No. 2013-08 as of April 1, 2014, the first reporting period since the effective date. Under the adoption of this guidance, Wells Fargo Funds Management, LLC (“Funds Management”) concluded that the Subsidiary meets the definition of an investment company and is consolidated herein. There is no material impact to the net asset value, results of operations, income or expenses as a result to the adoption.
The consolidated financial statements of the Fund include the financial results of its wholly-owned subsidiary. The Consolidated Portfolio of Investments includes positions of the Fund and the Subsidiary and the consolidated financial statements include the accounts of the Fund and the Subsidiary. Accordingly, all interfund balances and transactions between the Fund and the Subsidiary have been eliminated in consolidation.
3. SIGNIFICANT ACCOUNTING POLICIES
The following significant accounting policies, which are consistently followed in the preparation of the consolidated financial statements, are in conformity with U.S. generally accepted accounting principles which require management to make estimates and assumptions that affect the reported amounts of assets and liabilities, disclosure of contingent assets and liabilities at the date of the financial statements, and the reported amounts of revenues and expenses during the reporting period. Actual results could differ from those estimates.
Securities valuation
All investments are valued each business day as of the close of regular trading on the New York Stock Exchange (generally 4 p.m. Eastern Time).
Equity securities that are listed on a foreign or domestic exchange or market are valued at the official closing price or, if none, the last sales price. If no sale occurs on the primary exchange or market for the security that day, the prior day’s price will be deemed “stale” and fair values will be determined in accordance with the Fund’s Valuation Procedures.
Investments in commodities are valued at their last traded price.
The values of securities denominated in foreign currencies are translated into U.S. dollars at rates provided by an independent foreign currency pricing source at a time each business day specified by the Management Valuation Team of Funds Management.
Many securities markets and exchanges outside the U.S. close prior to the close of the New York Stock Exchange and therefore may not fully reflect trading or events that occur after the close of the principal exchange in which the foreign securities are traded, but before the close of the New York Stock Exchange. If such trading or events are expected to materially affect the value of such securities, then fair value pricing procedures approved by the Board of Trustees of the Fund are applied. These procedures take into account multiple factors including movements in U.S. securities markets after foreign exchanges close. Foreign securities that are fair valued under these procedures are categorized as Level 2 and the application of these procedures may result in transfers between Level 1 and Level 2. Depending on market activity, such fair valuations may be frequent. Such fair value pricing may result in net asset values that are higher or lower than net asset values based on the last reported sales price or latest quoted bid price. On September 30, 2014, such fair value pricing was not used in pricing foreign securities.
| | | | |
| 18 | | Wells Fargo Advantage Precious Metals Fund | | Notes to consolidated financial statements (unaudited) |
Investments in registered open-end investment companies are valued at net asset value.
Investments which are not valued using any of the methods discussed above are valued at their fair value, as determined in good faith by the Board of Trustees. The Board of Trustees has established a Valuation Committee comprised of the Trustees and has delegated to it the authority to take any actions regarding the valuation of portfolio securities that the Valuation Committee deems necessary or appropriate, including determining the fair value of portfolio securities, unless the determination has been delegated to the Management Valuation Team. The Board of Trustees retains the authority to make or ratify any valuation decisions or approve any changes to the Valuation Procedures as it deems appropriate. On a quarterly basis, the Board of Trustees receives reports on any valuation actions taken by the Valuation Committee or the Management Valuation Team which may include items for ratification.
Valuations of fair valued securities are compared to the next actual sales price when available, or other appropriate market values, to assess the continued appropriateness of the fair valuation methodologies used. These securities are fair valued on a day-to-day basis, taking into consideration changes to appropriate market information and any significant changes to the inputs considered in the valuation process until there is a readily available price provided on an exchange or by an independent pricing service. Valuations received from an independent pricing service or independent broker-dealer quotes are periodically validated by comparisons to most recent trades and valuations provided by other independent pricing services in addition to the review of prices by the adviser and/or subadviser. Unobservable inputs used in determining fair valuations are identified based on the type of security, taking into consideration factors utilized by market participants in valuing the investment, knowledge about the issuer and the current market environment.
Foreign currency translation
The accounting records of the Fund are maintained in U.S. dollars. The values of other assets and liabilities denominated in foreign currencies are translated into U.S. dollars at rates provided by an independent foreign currency pricing source at a time each business day specified by the Management Valuation Team. Purchases and sales of securities, and income and expenses are converted at the rate of exchange on the respective dates of such transactions. Net realized foreign exchange gains or losses arise from sales of foreign currencies, currency gains or losses realized between the trade and settlement dates on securities transactions, and the difference between the amounts of dividends, interest and foreign withholding taxes recorded and the U.S. dollar equivalent of the amounts actually paid or received. Net unrealized foreign exchange gains and losses arise from changes in the fair value of assets and liabilities other than investments in securities resulting from changes in exchange rates. The changes in net assets arising from changes in exchange rates and the changes in net assets resulting from changes in market prices of securities are not separately presented. Such changes are included in net realized and unrealized gains or losses from investments.
Investment transactions and income recognition
Investment transactions are recorded on a trade date basis. Realized gains or losses are recorded on the basis of identified cost.
Dividend income is recognized on the ex-dividend date, except for certain dividends from foreign securities, which are recorded as soon as the Fund is informed of the ex-dividend date. Dividend income from foreign securities is recorded net of foreign taxes withheld where recovery of such taxes is not assured.
Distributions to shareholders
Distributions to shareholders from net investment income and net realized gains, if any, are recorded on the ex-dividend date. Such distributions are determined in conformity with federal income tax regulations, which may differ in amount or character from net investment income and realized gains recognized for purposes of U.S. generally accepted accounting principles.
Federal and other taxes
The Fund intends to continue to qualify as a regulated investment company by distributing substantially all of its investment company taxable income and any net realized capital gains (after reduction for capital loss carryforwards) sufficient to relieve it from all, or substantially all, federal income taxes. Accordingly, no provision for federal income taxes was required.
The Subsidiary is classified as a controlled foreign corporation under Subchapter N of the Internal Revenue Code. Therefore, the Fund is required to increase its taxable income by its share of the Subsidiary’s income. Net investment losses of the Subsidiary cannot be deducted by the Fund in the current period nor carried forward to offset taxable income in future periods.
| | | | | | |
| Notes to consolidated financial statements (unaudited) | | Wells Fargo Advantage Precious Metals Fund | | | 19 | |
The Fund’s income and federal excise tax returns and all financial records supporting those returns for the prior three fiscal years are subject to examination by the federal and Delaware revenue authorities. Management has analyzed the Fund’s tax positions taken on federal, state, and foreign tax returns for all open tax years and does not believe that there are any uncertain tax positions that require recognition of a tax liability.
As of March 31, 2014, the Fund had capital loss carryforwards which consist of $2,205,181 in short-term capital losses and $57,088,478 in long-term capital losses.
As of March 31, 2014, the Fund had $42,220,947 of current year deferred post-October capital losses and a qualified late-year ordinary loss of $11,528,384 which were both recognized on the first day of the current fiscal year.
Class allocations
The separate classes of shares offered by the Fund differ principally in applicable sales charges, distribution, shareholder servicing, and administration fees. Class specific expenses are charged directly to that share class. Investment income, common expenses, and realized and unrealized gains (losses) on investments are allocated daily to each class of shares based on the relative proportion of net assets of each class.
4. FAIR VALUATION MEASUREMENTS
Fair value measurements of investments are determined within a framework that has established a fair value hierarchy based upon the various data inputs utilized in determining the value of the Fund’s investments. The three-level hierarchy gives the highest priority to unadjusted quoted prices in active markets for identical assets or liabilities (Level 1) and the lowest priority to significant unobservable inputs (Level 3). The Fund’s investments are classified within the fair value hierarchy based on the lowest level of input that is significant to the fair value measurement. The inputs are summarized into three broad levels as follows:
| n | | Level 1 – quoted prices in active markets for identical securities |
| n | | Level 2 – other significant observable inputs (including quoted prices for similar securities, interest rates, prepayment speeds, credit risk, use of amortized cost, etc.) |
| n | | Level 3 – significant unobservable inputs (including the Fund’s own assumptions in determining the fair value of investments) |
The inputs or methodologies used for valuing investments in securities are not necessarily an indication of the risk associated with investing in those securities.
The following is a summary of the inputs used in valuing the Fund’s assets and liabilities as of September 30, 2014:
| | | | | | | | | | | | | | | | |
| | | Quoted prices
(Level 1) | | | Other significant
observable inputs
(Level 2) | | | Significant
unobservable inputs
(Level 3) | | | Total | |
Assets | | | | | | | | | | | | | | | | |
Investments in : | | | | | | | | | | | | | | | | |
| | | | |
Common stocks | | | | | | | | | | | | | | | | |
Australia | | $ | 11,979,752 | | | $ | 0 | | | $ | 0 | | | $ | 11,979,752 | |
Canada | | | 270,979,765 | | | | 0 | | | | 0 | | | | 270,979,765 | |
Peru | | | 632,778 | | | | 0 | | | | 0 | | | | 632,778 | |
South Africa | | | 4,406,879 | | | | 0 | | | | 0 | | | | 4,406,879 | |
United Kingdom | | | 57,945,234 | | | | 0 | | | | 0 | | | | 57,945,234 | |
United States | | | 29,313,162 | | | | 0 | | | | 0 | | | | 29,313,162 | |
| | | | |
Commodities | | | 31,059,570 | | | | 0 | | | | 0 | | | | 31,059,570 | |
| | | | |
Short-term investments | | | | | | | | | | | | | | | | |
Investment companies | | | 9,195,095 | | | | 0 | | | | 0 | | | | 9,195,095 | |
Total assets | | $ | 415,512,235 | | | $ | 0 | | | $ | 0 | | | $ | 415,512,235 | |
Transfers in and transfers out are recognized at the end of the reporting period. At September 30, 2014, the Fund did not have any transfers into/out of Level 1, Level 2, or Level 3.
| | | | |
| 20 | | Wells Fargo Advantage Precious Metals Fund | | Notes to consolidated financial statements (unaudited) |
5. TRANSACTIONS WITH AFFILIATES
Advisory fee
The Trust has entered into an advisory contract with Funds Management, an indirect wholly owned subsidiary of Wells Fargo & Company (“Wells Fargo”). The adviser is responsible for implementing investment policies and guidelines and for supervising the subadviser, who is responsible for day-to-day portfolio management of the Fund.
Pursuant to the contract, Funds Management is entitled to receive an annual advisory fee starting at 0.60% and declining to 0.45% as the average daily net assets of the Fund increase. For the six months ended September 30, 2014, the advisory fee was equivalent to an annual rate of 0.60% of the Fund’s average daily net assets.
The Subsidiary has entered into separate advisory contract with Funds Management to manage the investment and reinvestment of its assets in conformity with its investment objectives and restrictions. Under this agreement, the Subsidiary does not pay Funds Management a fee for its services.
Funds Management has retained the services of a subadviser to provide daily portfolio management to the Fund. The fee for subadvisory services is borne by Funds Management. Wells Capital Management Incorporated, an affiliate of Funds Management and an indirect wholly owned subsidiary of Wells Fargo, is the subadviser to the Fund and is entitled to receive a fee from Funds Management at an annual rate starting at 0.40% and declining to 0.30% as the average daily net assets of the Fund increase.
Administration fees
The Trust has entered into an administration agreement with Funds Management. Under this agreement, for providing administrative services, which includes paying fees and expenses for services provided by the transfer agent, sub-transfer agents, omnibus account servicers and record-keepers, Funds Management is entitled to receive from the Fund an annual fund level administration fee starting at 0.05% and declining to 0.03% as the average daily net assets of the Fund increase and a class level administration fee which is calculated based on the average daily net assets of each class as follows:
| | | | |
| | | Class level
administration fee | |
Class A, Class B, Class C | | | 0.26 | % |
Administrator Class | | | 0.10 | |
Institutional Class | | | 0.08 | |
Funds Management has contractually waived and/or reimbursed advisory and administration fees to the extent necessary to maintain certain net operating expense ratios for the Fund. Waiver of fees and/or reimbursement of expenses by Funds Management were made first from fund level expenses on a proportionate basis and then from class specific expenses. Funds Management has committed through July 31, 2015 to waive fees and/or reimburse expenses to the extent necessary to cap the Fund’s expenses at 1.09% for Class A shares, 1.84% for Class B shares, 1.84% for Class C shares, 0.95% for Administrator Class shares, and 0.79% for Institutional Class shares. After this time, the cap may be increased or the commitment to maintain the cap may be terminated only with the approval of the Board of Trustees.
Distribution fees
The Trust has adopted a Distribution Plan for Class B and Class C shares of the Fund pursuant to Rule 12b-1 under the 1940 Act. Distribution fees are charged to Class B and Class C shares and paid to Wells Fargo Funds Distributor, LLC (“Funds Distributor”), the principal underwriter, at an annual rate of 0.75% of the average daily net assets of Class B and Class C shares.
In addition, Funds Distributor is entitled to receive the front-end sales charge from the purchase of Class A shares and a contingent deferred sales charges on the redemptions of certain shares. Funds Distributor is also entitled to receive the contingent deferred sales charges from redemptions of Class B and Class C shares. For the six months ended September 30, 2014, Funds Distributor received $16,345 from the sale of Class A shares and $80 and $423 in contingent deferred sales charges from redemptions of Class B and Class C shares, respectively.
Shareholder servicing fees
The Trust has entered into contracts with one or more shareholder servicing agents, whereby Class A, Class B, Class C, and Administrator Class of the Fund is charged a fee at an annual rate of 0.25% of the average daily net assets of each respective class.
| | | | | | |
| Notes to consolidated financial statements (unaudited) | | Wells Fargo Advantage Precious Metals Fund | | | 21 | |
A portion of these total shareholder servicing fees were paid to affiliates of Wells Fargo.
6. INVESTMENT PORTFOLIO TRANSACTIONS
Purchases and sales of securities, excluding U.S. government obligations (if any) and short-term securities, for the six months ended September 30, 2014 were $6,151,758 and $33,851,336, respectively.
7. BANK BORROWINGS
The Trust (excluding the money market funds and certain other funds in the Trust) and Wells Fargo Variable Trust are parties to a $150,000,000 revolving credit agreement whereby the Fund is permitted to use bank borrowings for temporary or emergency purposes, such as to fund shareholder redemption requests. Interest under the credit agreement is charged to the Fund based on a borrowing rate equal to the higher of the Federal Funds rate in effect on that day plus 1.25% or the overnight LIBOR rate in effect on that day plus 1.25%. In addition, an annual commitment fee equal to 0.10% of the unused balance is allocated to each participating fund. For the six months ended September 30, 2014, the Fund paid $442 in commitment fees.
For the six months ended September 30, 2014, there were no borrowings by the Fund under the agreement.
8. CONCENTRATION RISK
The Fund invests a substantial portion of its assets in precious metals companies and, therefore, would be more affected by changes in the precious metals sector than would be a fund whose investments are not heavily weighted in the sector.
9. INDEMNIFICATION
Under the Trust’s organizational documents, the officers and Trustees are indemnified against certain liabilities that may arise out of performance of their duties to the Trust. Additionally, in the normal course of business, the Trust may enter into contracts with service providers that contain a variety of indemnification clauses. The Trust’s maximum exposure under these arrangements is dependent on future claims that may be made against the Fund and, therefore, cannot be estimated.
| | | | |
| 22 | | Wells Fargo Advantage Precious Metals Fund | | Other information (unaudited) |
PROXY VOTING INFORMATION
A description of the policies and procedures that the Fund uses to determine how to vote proxies relating to portfolio securities is available without charge, upon request, by calling 1-800-222-8222, visiting our website at wellsfargoadvantagefunds.com, or visiting the SEC website at sec.gov. Information regarding how the Fund voted proxies relating to portfolio securities during the most recent 12-month period ended June 30 is available without charge on the Fund’s website at wellsfargoadvantagefunds.com or by visiting the SEC website at sec.gov.
PORTFOLIO HOLDINGS INFORMATION
The complete portfolio holdings for the Fund are publicly available monthly on the Fund’s website (wellsfargoadvantagefunds.com), on a one-month delayed basis. In addition, top ten holdings information (excluding derivative positions) for the Fund is publicly available on the Fund’s website on a monthly, seven-day or more delayed basis. The Fund files its complete schedule of portfolio holdings with the SEC for the first and third quarters of each fiscal year on Form N-Q, which is available without charge by visiting the SEC website at sec.gov. In addition, the Fund’s Form N-Q may be reviewed and copied at the SEC’s Public Reference Room in Washington, DC, and at regional offices in New York City, at 233 Broadway, and in Chicago, at 175 West Jackson Boulevard, Suite 900. Information about the Public Reference Room may be obtained by calling 1-800-SEC-0330.
| | | | | | |
| Other information (unaudited) | | Wells Fargo Advantage Precious Metals Fund | | | 23 | |
BOARD OF TRUSTEES AND OFFICERS
Each of the Trustees and Officers1 listed in the table below acts in identical capacities for each fund in the Wells Fargo Advantage family of funds, which consists of 133 mutual funds comprising the Wells Fargo Funds Trust, Wells Fargo Variable Trust, Wells Fargo Master Trust and four closed-end funds (collectively the “Fund Complex”). This table should be read in conjunction with the Prospectus and the Statement of Additional Information2. The mailing address of each Trustee and Officer is 525 Market Street, 12th Floor, San Francisco, CA 94105. Each Trustee and Officer serves an indefinite term, however, each Trustee serves such term until reaching the mandatory retirement age established by the Trustees.
Independent Trustees
| | | | | | |
Name and year of birth | | Position held and length of service* | | Principal occupations during past five years or longer | | Other directorships during past five years |
Peter G. Gordon (Born 1942) | | Trustee, since 1998; Chairman, since 2005 | | Co-Founder, Retired Chairman, President and CEO of Crystal Geyser Water Company. Trustee Emeritus, Colby College. | | Asset Allocation Trust |
Isaiah Harris, Jr. (Born 1952) | | Trustee, since 2009 | | Retired. Prior thereto, President and CEO of BellSouth Advertising and Publishing Corp. from 2005 to 2007, President and CEO of BellSouth Enterprises from 2004 to 2005 and President of BellSouth Consumer Services from 2000 to 2003. Emeritus member of the Iowa State University Foundation Board of Governors. Emeritus Member of the Advisory Board of Iowa State University School of Business. Advisory Board Member, Palm Harbor Academy. Mr. Harris is a certified public accountant. | | CIGNA Corporation; Asset Allocation Trust |
Judith M. Johnson (Born 1949) | | Trustee, since 2008; Audit Committee Chairman, since 2008 | | Retired. Prior thereto, Chief Executive Officer and Chief Investment Officer of Minneapolis Employees Retirement Fund from 1996 to 2008. Ms. Johnson is an attorney, certified public accountant and a certified managerial accountant. | | Asset Allocation Trust |
Leroy Keith, Jr. (Born 1939) | | Trustee, since 2010 | | Chairman, Bloc Global Services (development and construction). Trustee of the Evergreen Funds complex (and its predecessors) from 1983 to 2010. Former Managing Director, Almanac Capital Management (commodities firm), former Partner, Stonington Partners, Inc. (private equity fund), former Director, Obagi Medical Products Co. and former Director, Lincoln Educational Services. | | Trustee, Virtus Fund Complex (consisting of 50 portfolios as of 12/16/2013); Asset Allocation Trust |
David F. Larcker (Born 1950) | | Trustee, since 2009 | | James Irvin Miller Professor of Accounting at the Graduate School of Business, Stanford University, Morgan Stanley Director of the Center for Leadership Development and Research and Senior Faculty of The Rock Center for Corporate Governance since 2006. From 2005 to 2008, Professor of Accounting at the Graduate School of Business, Stanford University. Prior thereto, Ernst & Young Professor of Accounting at The Wharton School, University of Pennsylvania from 1985 to 2005. | | Asset Allocation Trust |
Olivia S. Mitchell (Born 1953) | | Trustee, since 2006 | | International Foundation of Employee Benefit Plans Professor, Wharton School of the University of Pennsylvania since 1993. Director of Wharton’s Pension Research Council and Boettner Center on Pensions & Retirement Research, and Research Associate at the National Bureau of Economic Research. Previously, Cornell University Professor from 1978 to 1993. | | Asset Allocation Trust |
| Timothy J. Penny (Born 1951) | | Trustee, since 1996 | | President and CEO of Southern Minnesota Initiative Foundation, a non-profit organization, since 2007 and Senior Fellow at the Humphrey Institute Policy Forum at the University of Minnesota since 1995. Member of the Board of Trustees of NorthStar Education Finance, Inc., a non-profit organization, since 2007. | | Asset Allocation Trust |
| | | | |
| 24 | | Wells Fargo Advantage Precious Metals Fund | | Other information (unaudited) |
| | | | | | |
Name and year of birth | | Position held and length of service* | | Principal occupations during past five years or longer | | Other directorships during past five years |
Michael S. Scofield (Born 1943) | | Trustee, since 2010 | | Served on the Investment Company Institute’s Board of Governors and Executive Committee from 2008-2011 as well the Governing Council of the Independent Directors Council from 2006-2011 and the Independent Directors Council Executive Committee from 2008-2011. Chairman of the IDC from 2008-2010. Institutional Investor (Fund Directions) Trustee of Year in 2007. Trustee of the Evergreen Funds complex (and its predecessors) from 1984 to 2010. Chairman of the Evergreen Funds from 2000-2010. Former Trustee of the Mentor Funds. Retired Attorney, Law Offices of Michael S. Scofield. | | Asset Allocation Trust |
Donald C. Willeke (Born 1940) | | Trustee, since 1996 | | Principal of the law firm of Willeke & Daniels. General Counsel of the Minneapolis Employees Retirement Fund from 1984 until its consolidation into the Minnesota Public Employees Retirement Association on June 30, 2010. Director and Vice Chair of The Tree Trust (non-profit corporation). Director of the American Chestnut Foundation (non-profit corporation). | | Asset Allocation Trust |
| * | Length of service dates reflect the Trustee’s commencement of service with the Trust’s predecessor entities, where applicable. |
Officers
| | | | | | |
Name and year of birth | | Position held and length of service | | Principal occupations during past five years or longer | | |
Karla M. Rabusch (Born 1959) | | President, since 2003 | | Executive Vice President of Wells Fargo Bank, N.A. and President of Wells Fargo Funds Management, LLC since 2003. | | |
Nancy Wiser1 (Born 1967) | | Treasurer, since 2012 | | Executive Vice President of Wells Fargo Funds Management, LLC since 2011. Chief Operating Officer and Chief Compliance Officer at LightBox Capital Management LLC, from 2008 to 2011. Owned and operated a consulting business providing services to various hedge funds including acting as Chief Operating Officer and Chief Compliance Officer for a hedge fund from 2007 to 2008. Chief Operating Officer and Chief Compliance Officer of GMN Capital LLC from 2006 to 2007. | | |
C. David Messman (Born 1960) | | Secretary, since 2000; Chief Legal Officer, since 2003 | | Assistant General Counsel of Wells Fargo Bank, N.A. since 2013 and Vice President and Managing Counsel of Wells Fargo Bank N.A. from 1996 to 2013. Senior Vice President and Secretary of Wells Fargo Funds Management , LLC since 2001. | | |
Debra Ann Early (Born 1964) | | Chief Compliance Officer, since 2007 | | Senior Vice President and Chief Compliance Officer of Wells Fargo Funds Management, LLC since 2007. Chief Compliance Officer of Parnassus Investments from 2005 to 2007. Chief Financial Officer of Parnassus Investments from 2004 to 2007. | | |
David Berardi (Born 1975) | | Assistant Treasurer, since 2009 | | Vice President of Wells Fargo Funds Management, LLC since 2009. Vice President of Evergreen Investment Management Company, LLC from 2008 to 2010. Assistant Vice President of Evergreen Investment Services, Inc. from 2004 to 2008. Manager of Fund Reporting and Control for Evergreen Investment Management Company, LLC from 2004 to 2010. | | |
Jeremy DePalma1 (Born 1974) | | Assistant Treasurer, since 2009 | | Senior Vice President of Wells Fargo Funds Management, LLC since 2009. Senior Vice President of Evergreen Investment Management Company, LLC from 2008 to 2010. Vice President, Evergreen Investment Services, Inc. from 2004 to 2007. Head of the Fund Reporting and Control Team within Fund Administration from 2005 to 2010. | | |
| 1. | Nancy Wiser acts as Treasurer of 73 funds in the Fund Complex. Jeremy DePalma acts as Treasurer of 60 funds and Assistant Treasurer of 73 funds in the Fund Complex. |
| 2. | The Statement of Additional Information includes additional information about the Trustees and is available, without charge, upon request, by calling 1-800-222-8222 or by visiting the website at wellsfargoadvantagefunds.com. |
| | | | | | |
| Other information (unaudited) | | Wells Fargo Advantage Precious Metals Fund | | | 25 | |
BOARD CONSIDERATION OF INVESTMENT ADVISORY AND SUB-ADVISORY AGREEMENTS:
Under Section 15 of the Investment Company Act of 1940 (the “1940 Act”), the Board of Trustees (the “Board”) of Wells Fargo Funds Trust (the “Trust”), all the members of which have no direct or indirect interest in the investment advisory and sub-advisory agreements and are not “interested persons” of the Trust, as defined in the 1940 Act (the “Independent Trustees”), must determine whether to approve the continuation of the Trust’s investment advisory and sub-advisory agreements. In this regard, at in-person meetings held on March 27-28, 2014 (the “March Meeting”) and May 15-16, 2014 (the “May Meeting”, and together with the March Meeting, the “Meetings”), the Board reviewed: (i) an investment advisory agreement with Wells Fargo Funds Management, LLC (“Funds Management”) for Wells Fargo Advantage Precious Metals Fund (the “Fund”) and (ii) an investment sub-advisory agreement with Wells Capital Management Incorporated (the “Sub-Adviser”), an affiliate of Funds Management, for the Fund. The investment advisory agreement with Funds Management and the investment sub-advisory agreement with the Sub-Adviser are collectively referred to as the “Advisory Agreements.”
At each of the March Meeting and the May Meeting, the Board received the information, considered the factors and reached the conclusions discussed below, and unanimously approved the renewal of the Advisory Agreements.
At the Meetings, the Board considered the factors and reached the conclusions described below relating to the selection of Funds Management and the Sub-Adviser and the continuation of the Advisory Agreements. Prior to the Meetings, the Trustees conferred extensively among themselves and with representatives of Funds Management about these matters. Also, the Board has adopted a team-based approach, with each team consisting of a sub-set of Trustees, to assist the full Board in the discharge of its duties in reviewing performance and other matters throughout the year. The Independent Trustees were assisted in their evaluation of the Advisory Agreements by independent legal counsel, from whom they received separate legal advice and with whom they met separately.
In providing information to the Board, Funds Management and the Sub-Adviser were guided by a detailed set of requests for information submitted to them by independent legal counsel on behalf of the Independent Trustees at the start of the Board’s annual contract renewal process earlier in 2014. In considering and approving the Advisory Agreements, the Trustees considered the information they believed relevant, including but not limited to the information discussed below. The Board considered not only the specific information presented in connection with the Meetings, but also the knowledge gained over time through interaction with Funds Management and the Sub-Adviser about various topics. In this regard, the Board reviewed reports of Funds Management at each of its quarterly meetings, which included, among other things, portfolio reviews and performance reports. In addition, the Board and the teams mentioned above confer with portfolio managers at various times throughout the year. The Board did not identify any particular information or consideration that was all-important or controlling, and each individual Trustee may have attributed different weights to various factors. After its deliberations, the Board unanimously approved the continuation of the Advisory Agreements and determined that the compensation payable to Funds Management and the Sub-Adviser is reasonable. The Board considered the continuation of the Advisory Agreements for the Fund as part of its consideration of the continuation of advisory agreements for funds across the complex, but its approvals were made on a fund-by-fund basis. The following summarizes a number of important, but not necessarily all, factors considered by the Board in support of its approvals.
Nature, extent and quality of services
The Board received and considered various information regarding the nature, extent and quality of services provided to the Fund by Funds Management and the Sub-Adviser under the Advisory Agreements. This information included, among other things, a summary of the background and experience of senior management of Funds Management, and the qualifications, background, tenure and responsibilities of each of the portfolio managers primarily responsible for the day-to-day portfolio management of the Fund.
The Board evaluated the ability of Funds Management and the Sub-Adviser to attract and retain qualified investment professionals, including research, advisory and supervisory personnel. The Board further considered the compliance programs and compliance records of Funds Management and the Sub-Adviser. In addition, the Board took into account the full range of services provided to the Fund by Funds Management and its affiliates.
Fund performance and expenses
The Board considered the performance results for the Fund over various time periods ended December 31, 2013. The Board also considered these results in comparison to the performance of funds in a universe that was determined by Lipper Inc. (“Lipper”) to be similar to the Fund (the “Universe”), and in comparison to the Fund’s benchmark index and to other comparative data. Lipper is an independent provider of investment company data. The Board received a description of the methodology used by Lipper to select the mutual funds in the performance Universe. The Board noted
| | | | |
| 26 | | Wells Fargo Advantage Precious Metals Fund | | Other information (unaudited) |
that the performance of the Fund (Class A) was higher than or in range of the average performance of the Universe for all periods under review. The Board also noted that the performance of the Fund was higher than its benchmark, the FTSE Gold Mines Index, for all periods under review.
The Board also received and considered information regarding the Fund’s net operating expense ratios and their various components, including actual management fees (which reflect fee waivers, if any, and include advisory, administration and transfer agent fees), custodian and other non-management fees, Rule 12b-1 and non-Rule 12b-1 service fees and fee waiver and expense reimbursement arrangements. The Board considered these ratios in comparison to the median ratios of funds in class-specific expense groups that were determined by Lipper to be similar to the Fund (the “Groups”). The Board received a description of the methodology used by Lipper to select the mutual funds in the expense Groups and an explanation of year-to-year variations in the funds comprising such expense Groups and their expense ratios. Based on the Lipper reports, the Board noted that the net operating expense ratios of the Fund were lower than or in range of the median net operating expense ratios of the expense Groups.
Based on its consideration of the factors and information it deemed relevant, including those described here, the Board concluded that the overall performance and expense structure of the Fund supported the re-approval of the Advisory Agreements.
Investment advisory and sub-advisory fee rates
The Board reviewed and considered the contractual investment advisory fee rates that are payable by the Fund to Funds Management for investment advisory services (the “Advisory Agreement Rates”), both on a stand-alone basis and on a combined basis with the Fund’s fund-level and class-level contractual administration fee rates (the “Management Rates”). The Board noted that the administration fees payable to Funds Management include transfer agency and sub-transfer agency costs. The Board also reviewed and considered the contractual investment sub-advisory fee rates that are payable by Funds Management to the Sub-Adviser for investment sub-advisory services (the “Sub-Advisory Agreement Rates”).
Among other information reviewed by the Board was a comparison of the Management Rates of the Fund with those of other funds in the expense Groups at a common asset level. The Board noted that the Management Rates of the Fund were lower than the average rates for the Fund’s expense Groups for all share classes.
The Board also received and considered information about the portion of the total advisory fee that was retained by Funds Management after payment of the fee to the Sub-Adviser for sub-advisory services. In assessing the reasonableness of this amount, the Board received and evaluated information about the nature and extent of responsibilities retained and risks assumed by Funds Management and not delegated to or assumed by the Sub-Adviser, and about Funds Management’s on-going oversight services. However, given the affiliation between Funds Management and the Sub-Adviser, the Board ascribed limited relevance to the allocation of the advisory fee between them.
The Board also received and considered information about the nature and extent of services offered and fee rates charged by Funds Management and the Sub-Adviser to other types of clients with investment strategies similar to those of the Fund. In this regard, the Board received information about the significantly greater scope of services, and compliance, reporting and other legal burdens and risks of managing mutual funds compared with those associated with managing assets of non-mutual fund clients such as collective funds or institutional separate accounts.
Based on its consideration of the factors and information it deemed relevant, including those described here, the Board determined that the Advisory Agreement Rates and the Sub-Advisory Agreement Rates were reasonable in light of the services covered by the Advisory Agreements.
Profitability
The Board received and considered information concerning the profitability of Funds Management, as well as the profitability of Wells Fargo as a whole, from providing services to the Fund and the fund family as a whole. The Board did not receive or consider to be necessary separate profitability information with respect to the Sub-Adviser, because its profitability information was subsumed in the collective Wells Fargo profitability analysis.
Funds Management explained the methodologies and estimates that it used in calculating profitability. Among other things, the Board noted that the levels of profitability reported on a fund-by-fund basis varied widely, depending on factors such as the size and type of fund. Based on its review, the Board did not deem the profits reported by Funds Management to be at a level that would prevent it from approving the continuation of the Advisory Agreements.
| | | | | | |
| Other information (unaudited) | | Wells Fargo Advantage Precious Metals Fund | | | 27 | |
Economies of scale
With respect to possible economies of scale, the Board noted the existence of breakpoints in the Fund’s advisory fee and administration fee structure, which operate generally to reduce the Fund’s expense ratios as the Fund grows in size. It considered that, for a small fund or a fund that shrinks in size, breakpoints conversely can result in higher fee levels. The Board also considered that fee waiver and expense reimbursement arrangements and competitive fee rates at the outset are means of sharing potential economies of scale with shareholders of the Fund and the fund family as a whole. The Board considered Funds Management’s view that any analyses of potential economies of scale in managing a particular fund are inherently limited in light of the joint and common costs and investments that Funds Management incurs across the fund family as a whole.
The Board concluded that the Fund’s fee and expense arrangements, including contractual breakpoints, constituted a reasonable approach to sharing potential economies of scale with the Fund and its shareholders.
Other benefits to Funds Management and the Sub-Adviser
The Board received and considered information regarding potential “fall-out” or ancillary benefits received by Funds Management and its affiliates, including the Sub-Adviser, as a result of their relationships with the Fund. Ancillary benefits could include, among others, benefits directly attributable to other relationships with the Fund and benefits potentially derived from an increase in Funds Management’s and the Sub-Adviser’s business as a result of their relationships with the Fund. The Board noted that various affiliates of Funds Management may receive distribution-related fees, shareholder servicing payments and sub-transfer agency fees in respect of shares sold or held through them and services provided.
The Board also reviewed information about soft dollar credits earned and utilized by the Sub-Adviser, fees earned by Funds Management and the Sub-Adviser from managing a private investment vehicle for the fund family’s securities lending collateral and commissions earned by an affiliated broker from portfolio transactions.
Based on its consideration of the factors and information it deemed relevant, including those described here, the Board did not find that any ancillary benefits received by Funds Management and its affiliates, including the Sub-Adviser, were unreasonable.
Conclusion
After considering the above-described factors and based on its deliberations and its evaluation of the information described above, the Board unanimously approved the continuation of the Advisory Agreements for an additional one-year period and determined that the compensation payable to Funds Management and the Sub-Adviser is reasonable.
| | | | |
| 28 | | Wells Fargo Advantage Precious Metals Fund | | List of abbreviations |
The following is a list of common abbreviations for terms and entities that may have appeared in this report.
| ACA | — ACA Financial Guaranty Corporation |
| ADR | — American depositary receipt |
| ADS | — American depositary shares |
| AGC | — Assured Guaranty Corporation |
| AGM | — Assured Guaranty Municipal |
| Ambac | — Ambac Financial Group Incorporated |
| AMT | — Alternative minimum tax |
| BAN | — Bond anticipation notes |
| BHAC | — Berkshire Hathaway Assurance Corporation |
| CAB | — Capital appreciation bond |
| CCAB | — Convertible capital appreciation bond |
| CDA | — Community Development Authority |
| CDO | — Collateralized debt obligation |
| DRIVER | — Derivative inverse tax-exempt receipts |
| DW&P | — Department of Water & Power |
| DWR | — Department of Water Resources |
| ECFA | — Educational & Cultural Facilities Authority |
| EDA | — Economic Development Authority |
| EDFA | — Economic Development Finance Authority |
| ETF | — Exchange-traded fund |
| FDIC | — Federal Deposit Insurance Corporation |
| FFCB | — Federal Farm Credit Banks |
| FGIC | — Financial Guaranty Insurance Corporation |
| FHA | — Federal Housing Administration |
| FHLB | — Federal Home Loan Bank |
| FHLMC | — Federal Home Loan Mortgage Corporation |
| FICO | — The Financing Corporation |
| FNMA | — Federal National Mortgage Association |
| GDR | — Global depositary receipt |
| GNMA | — Government National Mortgage Association |
| HCFR | — Healthcare facilities revenue |
| HEFA | — Health & Educational Facilities Authority |
| HEFAR | — Higher education facilities authority revenue |
| HFA | — Housing Finance Authority |
| HFFA | — Health Facilities Financing Authority |
| HUD | — Department of Housing and Urban Development |
| IDA | — Industrial Development Authority |
| IDAG | — Industrial Development Agency |
| KRW | — Republic of Korea won |
| LIBOR | — London Interbank Offered Rate |
| LLC | — Limited liability company |
| LLLP | — Limited liability limited partnership |
| LLP | — Limited liability partnership |
| MBIA | — Municipal Bond Insurance Association |
| MFHR | — Multifamily housing revenue |
| MSTR | — Municipal securities trust receipts |
| MUD | — Municipal Utility District |
| National | — National Public Finance Guarantee Corporation |
| PCFA | — Pollution Control Financing Authority |
| PCL | — Public Company Limited |
| PCR | — Pollution control revenue |
| PFA | — Public Finance Authority |
| PFFA | — Public Facilities Financing Authority |
| PFOTER | — Puttable floating option tax-exempt receipts |
| plc | — Public limited company |
| PUTTER | — Puttable tax-exempt receipts |
| R&D | — Research & development |
| Radian | — Radian Asset Assurance |
| RAN | — Revenue anticipation notes |
| RDA | — Redevelopment Authority |
| RDFA | — Redevelopment Finance Authority |
| REIT | — Real estate investment trust |
| ROC | — Reset option certificates |
| SAVRS | — Select auction variable rate securities |
| SBA | — Small Business Authority |
| SFHR | — Single-family housing revenue |
| SFMR | — Single-family mortgage revenue |
| SPA | — Standby purchase agreement |
| SPDR | — Standard & Poor’s Depositary Receipts |
| STRIPS | — Separate trading of registered interest and principal
securities |
| TAN | — Tax anticipation notes |
| TIPS | — Treasury inflation-protected securities |
| TRAN | — Tax revenue anticipation notes |
| TTFA | — Transportation Trust Fund Authority |
| TVA | — Tennessee Valley Authority |


For more information
More information about Wells Fargo Advantage Funds is available free upon request. To obtain literature, please write, email, visit the Fund’s website, or call:
Wells Fargo Advantage Funds
P.O. Box 8266
Boston, MA 02266-8266
Email: wfaf@wellsfargo.com
Website: wellsfargoadvantagefunds.com
Individual investors: 1-800-222-8222
Retail investment professionals: 1-888-877-9275
Institutional investment professionals: 1-866-765-0778
This report and the financial statements contained herein are submitted for the general information of the shareholders of Wells Fargo Advantage Funds. If this report is used for promotional purposes, distribution of the report must be accompanied or preceded by a current prospectus. Before investing, please consider the investment objectives, risks, charges, and expenses of the investment. For a current prospectus and, if available, a summary prospectus, containing this information, call 1-800-222-8222 or visit the Fund’s website at wellsfargoadvantagefunds.com. Read the prospectus carefully before you invest or send money.
Wells Fargo Funds Management, LLC, a wholly owned subsidiary of Wells Fargo & Company, provides investment advisory and administrative services for Wells Fargo Advantage Funds. Other affiliates of Wells Fargo & Company provide subadvisory and other services for the Funds. The Funds are distributed by Wells Fargo Funds Distributor, LLC, Member FINRA/SIPC, an affiliate of Wells Fargo & Company.
NOT FDIC INSURED ¡ NO BANK GUARANTEE ¡ MAY LOSE VALUE
© 2014 Wells Fargo Funds Management, LLC. All rights reserved.
| | |
 | | 228304 11-14 SA316/SAR316 09-14 |

Wells Fargo Advantage
Specialized Technology Fund

Semi-Annual Report
September 30, 2014

Reduce clutter. Save trees.
Sign up for electronic delivery of prospectuses and shareholder reports at wellsfargo.com/advantagedelivery
Contents
The views expressed and any forward-looking statements are as of September 30, 2014, unless otherwise noted, and are those of the Fund managers and/or Wells Fargo Funds Management, LLC. Discussions of individual securities, or the markets generally, or any Wells Fargo Advantage Fund are not intended as individual recommendations. Future events or results may vary significantly from those expressed in any forward-looking statements; the views expressed are subject to change at any time in response to changing circumstances in the market. Wells Fargo Funds Management, LLC and the Fund disclaim any obligation to publicly update or revise any views expressed or forward-looking statements.
NOT FDIC INSURED ¡ NO BANK GUARANTEE ¡ MAY LOSE VALUE
| | | | |
| 2 | | Wells Fargo Advantage Specialized Technology Fund | | Letter to shareholders (unaudited) |

Karla M. Rabusch
President
Wells Fargo Advantage Funds
Dear Valued Shareholder:
We are pleased to offer you this semi-annual report for the Wells Fargo Advantage Specialized Technology Fund for the six-month period that ended September 30, 2014. The broad U.S. stock market delivered positive results overall for this period.
2014’s fitful start gave way to a rally that carried through the second quarter of 2014.
Following a difficult first quarter for the U.S. economy—when unusually harsh weather kept consumers at home and disrupted business activities—the second quarter of 2014 brought warmer temperatures, and the U.S. economy picked up steam. Investors were heartened by encouraging economic data, driving stocks higher. In Europe, signs of economic improvement faded when gross domestic product (GDP) stagnated during the second quarter. Although select peripheral countries, such as Spain and Portugal, provided bright spots, some of Europe’s larger economies were pressured by weak economic growth and potential deflation. European stock returns generally were positive, but lackluster.
U.S. Federal Reserve (Fed) officials continued winding down their bond-buying program during the second quarter, leaving it on pace to likely end this year. They also revisited the question of when to begin raising short-term interest rates from near zero and released new projections showing rates rising more than previously expected in 2015 and 2016, but—on a positive note—they slightly reduced their outlook for rates over the longer term. The markets took this information in stride, with both U.S. stocks and bonds rallying.
Positive U.S. economic data—but increased tensions abroad—led to heightened volatility in the third quarter of 2014.
The third quarter brought a series of stock market surges that were interrupted by bouts of volatility as interest-rate concerns in the U.S. and increased tensions abroad triggered heightened investor uncertainty. In July, an escalating Russia/Ukraine situation and a growing perception that the Fed would raise short-term interest rates sooner than expected caused investors to pull back toward month-end; as a result, the S&P 500 Index1 dropped into negative territory for its overall monthly return. However, August brought a bounce-back—the S&P 500 Index delivered its largest monthly gain since February 2014 on a string of positive economic news, led by an upwardly revised 4.2% estimate of second-quarter 2014 GDP growth. In September, the stock market tended to rise, then swoon, then rise as positive economic data became overshadowed at times by growing discomfort over escalating tensions in Ukraine and the Middle East. Signs of slowing growth in Europe and China also concerned investors. Ultimately, U.S. stocks ended the third quarter up slightly overall, buoyed largely by another upward revision of second-quarter GDP growth to 4.6%. Strong corporate earnings also contributed to market gains, with a large number of U.S. companies exceeding consensus estimates for both revenues and earnings per share.
| 1. | The S&P 500 Index consists of 500 stocks chosen for market size, liquidity, and industry group representation. It is a market-value-weighted index with each stock’s weight in the index proportionate to its market value. You cannot invest directly in an index. |
| | | | | | |
| Letter to shareholders (unaudited) | | Wells Fargo Advantage Specialized Technology Fund | | | 3 | |
In contrast to the U.S., the third quarter brought news that the eurozone economy stalled in the second quarter. The weak economy has caused European consumers and businesses to continue to lose confidence. Despite new stimulus measures announced by the European Central Bank in early September, businesses and consumers across the 18 countries that share the euro appeared gloomier about their prospects in September 2014 than at any time since the end of 2013.
Information technology (IT) stocks delivered strong results for the reporting period, despite some volatility along the way.
As the reporting period began on April 1, 2014, faster-growing companies, including many IT firms, were challenged by a brief—but dramatic—investor rotation toward companies with slower growth potential but higher dividend yields. This shift—which occurred in an environment of generally improving corporate fundamentals—was influenced by a variety of concerns, such as the potential for an interest-rate increase earlier than many investors anticipated and the situation in Ukraine. However, in early May, investors began to refocus on growth fundamentals, leading to a rebound for many IT stocks. As the summer progressed, it became clear that investors were gravitating toward mega-cap IT companies, reflecting a somewhat defensive mindset—perhaps a reflection of increasing concern over escalating tensions overseas and slowing growth in Europe and China. As a result, larger-cap IT stocks tended to outperform smaller-cap IT stocks for the six-month period that ended September 30, 2014.
We employ a diverse array of investment strategies even as many variables are at work in the market.
Periods of uncertainty can present challenges, but experience has taught us that maintaining long-term investment goals can be an effective way to plan for the future. To help you create a sound strategy based on your personal goals and risk tolerance, Wells Fargo Advantage Funds offers more than 100 mutual funds and
other investments spanning a wide range of asset classes and investment styles. Although diversification cannot guarantee an investment profit or prevent losses, we believe it can be an effective way to manage investment risk and potentially smooth out overall portfolio performance. We encourage investors to know their investments and to understand that appropriate levels of risk-taking may unlock opportunities.
Thank you for choosing to invest with Wells Fargo Advantage Funds. We appreciate your confidence in us and remain committed to helping you meet your financial needs. For current information about your fund investments, contact your investment professional, visit our website at wellsfargoadvantagefunds.com, or call us directly at 1-800-222-8222. We are available 24 hours a day, 7 days a week.
Sincerely,

Karla M. Rabusch
President
Wells Fargo Advantage Funds
Information technology (IT) stocks delivered strong results for the reporting period, despite some volatility along the way.
Periods of uncertainty can present challenges, but experience has taught us that maintaining long-term investment goals can be an effective way to plan for the future.
| | | | |
| 4 | | Wells Fargo Advantage Specialized Technology Fund | | Performance highlights (unaudited) |
Investment objective
The Fund seeks long-term capital appreciation.
Adviser
Wells Fargo Funds Management, LLC
Subadviser
Allianz Global Investors U.S. LLC
Portfolio managers
Huachen Chen, CFA
Walter C. Price, Jr., CFA
Average annual total returns1 (%) as of September 30, 2014
| | | | | | | | | | | | | | | | | | | | | | | | | | | | | | | | | | |
| | | | | Including sales charge | | | Excluding sales charge | | | Expense ratios2 (%) | |
| | | Inception date | | 1 year | | | 5 year | | | 10 year | | | 1 year | | | 5 year | | | 10 year | | | Gross | | | Net3 | |
| Class A (WFSTX) | | 9-18-2000 | | | 10.79 | | | | 15.53 | | | | 11.41 | | | | 17.53 | | | | 16.90 | | | | 12.07 | | | | 1.51 | | | | 1.51 | |
| Class B (WFTBX)* | | 9-18-2000 | | | 11.72 | | | | 15.82 | | | | 11.47 | | | | 16.72 | | | | 16.04 | | | | 11.47 | | | | 2.26 | | | | 2.26 | |
| Class C (WFTCX) | | 9-18-2000 | | | 15.65 | | | | 16.02 | | | | 11.22 | | | | 16.65 | | | | 16.02 | | | | 11.22 | | | | 2.26 | | | | 2.26 | |
| Administrator Class (WFTDX) | | 7-30-2010 | | | – | | | | – | | | | – | | | | 17.72 | | | | 17.09 | | | | 12.16 | | | | 1.35 | | | | 1.35 | |
| Investor Class (WFTZX) | | 4-8-2005 | | | – | | | | – | | | | – | | | | 17.61 | | | | 16.82 | | | | 11.96 | | | | 1.57 | | | | 1.54 | |
| S&P North American Technology Index4 | | – | | | – | | | | – | | | | – | | | | 24.15 | | | | 16.10 | | | | 10.16 | | | | – | | | | – | |
| S&P 500 Index5 | | – | | | – | | | | – | | | | – | | | | 19.73 | | | | 15.70 | | | | 8.11 | | | | – | | | | – | |
| * | | Class B shares are closed to investment, except in connection with the reinvestment of any distributions and permitted exchanges. |
Figures quoted represent past performance, which is no guarantee of future results, and do not reflect taxes that a shareholder may pay on fund distributions or the redemption of fund shares. Investment return and principal value of an investment will fluctuate so that an investor’s shares, when redeemed, may be worth more or less than their original cost. Performance shown without sales charges would be lower if sales charges were reflected. Current performance may be lower or higher than the performance data quoted, which assumes the reinvestment of dividends and capital gains. Current month-end performance is available on the Fund’s website, wellsfargoadvantagefunds.com.
Index returns do not include transaction costs associated with buying and selling securities, any mutual fund fees or expenses, or any taxes. It is not possible to invest directly in an index.
For Class A shares, the maximum front-end sales charge is 5.75%. For Class B shares, the maximum contingent deferred sales charge is 5.00%. For Class C shares, the maximum contingent deferred sales charge is 1.00%. Performance including a contingent deferred sales charge assumes the sales charge for the corresponding time period. Administrator Class and Investor Class shares are sold without a front-end sales charge or contingent deferred sales charge.
Stock values fluctuate in response to the activities of individual companies and general market and economic conditions. Funds that concentrate their investments in limited sectors, such as technology, may be susceptible to financial, economic, or market events affecting those sectors. Certain investment strategies tend to increase the total risk of an investment (relative to the broader market). The Fund is exposed to convertible securities risk, foreign investment risk, non-diversification risk, and smaller-company securities risk. Consult the Fund’s prospectus for additional information on these and other risks.
Please see footnotes on page 5.
| | | | | | |
| Performance highlights (unaudited) | | Wells Fargo Advantage Specialized Technology Fund | | | 5 | |
| | | | |
| Ten largest equity holdings6 (%) as of September 30, 2014 | |
Apple Incorporated | | | 9.97 | |
Microsoft Corporation | | | 9.32 | |
Facebook Incorporated Class A | | | 5.61 | |
Tesla Motors Incorporated | | | 4.06 | |
Micron Technology Incorporated | | | 3.25 | |
Western Digital Corporation | | | 2.90 | |
SanDisk Corporation | | | 2.85 | |
Hewlett-Packard Company | | | 2.84 | |
Avago Technologies Limited | | | 2.83 | |
Lam Research Corporation | | | 2.37 | |
| | |
| Industry distribution7 as of September 30, 2014 |
|
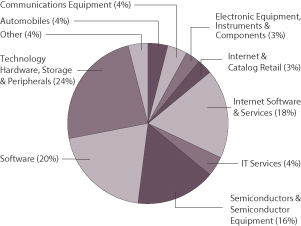 |
| 1. | Historical performance shown for Administrator Class shares prior to their inception reflects the performance of Class A shares, and includes the higher expenses applicable to Class A shares. If these expenses had not been included, returns would be higher. Historical performance shown for Investor Class shares prior to their inception reflects the performance of Class A shares and has been adjusted to reflect the higher expenses applicable to Investor Class shares. |
| 2. | Reflects the expense ratios as stated in the most recent prospectuses, which include the impact of 0.01% in acquired fund fees and expenses. The expense ratios shown are subject to change and may differ from the annualized expense ratios shown in the financial highlights of this report, which do not include acquired fund fees and expenses. |
| 3. | The Adviser has committed through July 31, 2015, to waive fees and/or reimburse expenses to the extent necessary to cap the Fund’s Total Annual Fund Operating Expenses After Fee Waiver, excluding certain expenses, at 1.50% for Class A, 2.25% for Class B, 2.25% for Class C, 1.35% for Administrator Class, and 1.53% for Investor Class. After this time, the cap may be increased or the commitment to maintain the cap may be terminated only with the approval of the Board of Trustees. Brokerage commissions, stamp duty fees, interest, taxes, acquired fund fees and expenses, and extraordinary expenses are excluded from the cap. Without this cap, the Fund’s returns would have been lower. |
| 4. | The S&P North American Technology Index is a modified capitalization-weighted index of selected technology stocks. You cannot invest directly in an index. |
| 5. | The S&P 500 Index consists of 500 stocks chosen for market size, liquidity, and industry group representation. It is a market-value weighted index with each stock’s weight in the index proportionate to its market value. You cannot invest directly in an index. |
| 6. | The ten largest equity holdings are calculated based on the value of the securities divided by total net assets of the Fund. Holdings are subject to change and may have changed since the date specified. |
| 7. | Industry distribution is subject to change and is calculated based on the total long-term investments of the Fund. |
| | | | |
| 6 | | Wells Fargo Advantage Specialized Technology Fund | | Fund expenses (unaudited) |
As a shareholder of the Fund, you incur two types of costs: (1) transaction costs, including sales charges (loads) on purchase payments and contingent deferred sales charges (if any) on redemptions and (2) ongoing costs, including management fees, distribution (12b-1) and/or shareholder service fees, and other Fund expenses. This example is intended to help you understand your ongoing costs (in dollars) of investing in the Fund and to compare these costs with the ongoing costs of investing in other mutual funds.
The example is based on an investment of $1,000 invested at the beginning of the six-month period and held for the entire period from April 1, 2014 to September 30, 2014.
Actual expenses
The “Actual” line of the table below provides information about actual account values and actual expenses. You may use the information in this line, together with the amount you invested, to estimate the expenses that you paid over the period. Simply divide your account value by $1,000 (for example, an $8,600 account value divided by $1,000 = 8.6), then multiply the result by the number in the “Actual” line under the heading entitled “Expenses paid during period” for your applicable class of shares to estimate the expenses you paid on your account during this period.
Hypothetical example for comparison purposes
The “Hypothetical” line of the table below provides information about hypothetical account values and hypothetical expenses based on the Fund’s actual expense ratio and an assumed rate of return of 5% per year before expenses, which is not the Fund’s actual return. The hypothetical account values and expenses may not be used to estimate the actual ending account balance or expenses you paid for the period. You may use this information to compare the ongoing costs of investing in the Fund and other funds. To do so, compare this 5% hypothetical example with the 5% hypothetical examples that appear in the shareholder reports of the other funds.
Please note that the expenses shown in the table are meant to highlight your ongoing costs only and do not reflect any transactional costs, such as sales charges (loads) and contingent deferred sales charges. Therefore, the “Hypothetical” line of the table is useful in comparing ongoing costs only and will not help you determine the relative total costs of owning different funds. In addition, if these transactional costs were included, your costs would have been higher.
| | | | | | | | | | | | | | | | |
| | | Beginning
account value
4-1-2014 | | | Ending
account value
9-30-2014 | | | Expenses
paid during
the period¹ | | | Net annualized
expense ratio | |
Class A | | | | | | | | | | | | | | | | |
Actual | | $ | 1,000.00 | | | $ | 1,069.48 | | | $ | 7.94 | | | | 1.53 | % |
Hypothetical (5% return before expenses) | | $ | 1,000.00 | | | $ | 1,017.40 | | | $ | 7.74 | | | | 1.53 | % |
Class B | | | | | | | | | | | | | | | | |
Actual | | $ | 1,000.00 | | | $ | 1,065.26 | | | $ | 11.80 | | | | 2.28 | % |
Hypothetical (5% return before expenses) | | $ | 1,000.00 | | | $ | 1,013.64 | | | $ | 11.51 | | | | 2.28 | % |
Class C | | | | | | | | | | | | | | | | |
Actual | | $ | 1,000.00 | | | $ | 1,065.47 | | | $ | 11.81 | | | | 2.28 | % |
Hypothetical (5% return before expenses) | | $ | 1,000.00 | | | $ | 1,013.64 | | | $ | 11.51 | | | | 2.28 | % |
Administrator Class | | | | | | | | | | | | | | | | |
Actual | | $ | 1,000.00 | | | $ | 1,069.83 | | | $ | 7.16 | | | | 1.38 | % |
Hypothetical (5% return before expenses) | | $ | 1,000.00 | | | $ | 1,018.15 | | | $ | 6.98 | | | | 1.38 | % |
Investor Class | | | | | | | | | | | | | | | | |
Actual | | $ | 1,000.00 | | | $ | 1,069.19 | | | $ | 8.09 | | | | 1.56 | % |
Hypothetical (5% return before expenses) | | $ | 1,000.00 | | | $ | 1,017.25 | | | $ | 7.89 | | | | 1.56 | % |
| 1. | Expenses paid is equal to the annualized expense ratio of each class multiplied by the average account value over the period, multiplied by the number of days in the most recent fiscal half-year divided by the number of days in the fiscal year (to reflect the one-half-year period). |
| | | | | | |
| Portfolio of investments—September 30, 2014 (unaudited) | | Wells Fargo Advantage Specialized Technology Fund | | | 7 | |
| | | | | | | | | | | | |
| Security name | | | | | | Shares | | | Value | |
| | | | | | | | | | | | |
| | | | |
Common Stocks: 93.44% | | | | | | | | | | | | |
| | | | |
Consumer Discretionary: 7.19% | | | | | | | | | | | | |
| | | | |
| Automobiles: 4.06% | | | | | | | | | | | | |
Tesla Motors Incorporated † | | | | | | | 54,015 | | | $ | 13,108,360 | |
| | | | | | | | | | | | |
| | | | |
| Household Durables: 0.79% | | | | | | | | | | | | |
Harman International Industries Incorporated | | | | | | | 26,000 | | | | 2,549,040 | |
| | | | | | | | | | | | |
| | | | |
| Internet & Catalog Retail: 2.34% | | | | | | | | | | | | |
Amazon.com Incorporated † | | | | | | | 8,005 | | | | 2,581,132 | |
JD.com Incorporated ADR †« | | | | | | | 21,247 | | | | 548,598 | |
Netflix Incorporated † | | | | | | | 5,365 | | | | 2,420,581 | |
The Priceline Group Incorporated † | | | | | | | 415 | | | | 480,811 | |
Vipshop Holdings Limited †« | | | | | | | 8,130 | | | | 1,536,651 | |
| | | | |
| | | | | | | | | | | 7,567,773 | |
| | | | | | | | | | | | |
| | | | |
Financials: 0.46% | | | | | | | | | | | | |
| | | | |
| REITs: 0.46% | | | | | | | | | | | | |
American Tower Corporation | | | | | | | 15,700 | | | | 1,469,991 | |
| | | | | | | | | | | | |
| | | | |
Health Care: 0.52% | | | | | | | | | | | | |
| | | | |
| Health Care Technology: 0.52% | | | | | | | | | | | | |
Veeva Systems Incorporated Class A † | | | | | | | 59,930 | | | | 1,688,228 | |
| | | | | | | | | | | | |
| | | | |
Industrials: 2.07% | | | | | | | | | | | | |
| | | | |
| Construction & Engineering: 1.07% | | | | | | | | | | | | |
Quanta Services Incorporated † | | | | | | | 94,970 | | | | 3,446,461 | |
| | | | | | | | | | | | |
| | | | |
| Electrical Equipment: 1.00% | | | | | | | | | | | | |
NIDEC Corporation | | | | | | | 48,000 | | | | 3,247,413 | |
| | | | | | | | | | | | |
| | | | |
Information Technology: 82.76% | | | | | | | | | | | | |
| | | | |
| Communications Equipment: 3.91% | | | | | | | | | | | | |
Cisco Systems Incorporated | | | | | | | 64,930 | | | | 1,634,288 | |
F5 Networks Incorporated † | | | | | | | 41,525 | | | | 4,930,679 | |
Palo Alto Networks Incorporated † | | | | | | | 31,510 | | | | 3,091,131 | |
QUALCOMM Incorporated | | | | | | | 39,625 | | | | 2,962,761 | |
| | | | |
| | | | | | | | | | | 12,618,859 | |
| | | | | | | | | | | | |
| | | | |
| Electronic Equipment, Instruments & Components: 2.36% | | | | | | | | | | | | |
Arrow Electronics Incorporated † | | | | | | | 17,390 | | | | 962,537 | |
CDW Corporation of Delaware | | | | | | | 101,125 | | | | 3,139,931 | |
Flextronics International Limited † | | | | | | | 145,865 | | | | 1,505,327 | |
Keyence Corporation | | | | | | | 700 | | | | 304,222 | |
Murata Manufacturing Company Limited | | | | | | | 11,600 | | | | 1,318,915 | |
OMRON Corporation | | | | | | | 8,400 | | | | 381,418 | |
| | | | |
| | | | | | | | | | | 7,612,350 | |
| | | | | | | | | | | | |
The accompanying notes are an integral part of these financial statements.
| | | | |
| 8 | | Wells Fargo Advantage Specialized Technology Fund | | Portfolio of investments—September 30, 2014 (unaudited) |
| | | | | | | | | | | | |
| Security name | | | | | | Shares | | | Value | |
| | | | | | | | | | | | |
| | | | |
| Internet Software & Services: 16.67% | | | | | | | | | | | | |
Akamai Technologies Incorporated † | | | | | | | 56,505 | | | $ | 3,378,999 | |
Alibaba Group Holding Limited ADR † | | | | | | | 20,930 | | | | 1,859,631 | |
Baidu Incorporated ADR † | | | | | | | 11,320 | | | | 2,470,364 | |
Facebook Incorporated Class A † | | | | | | | 229,165 | | | | 18,113,202 | |
Google Incorporated Class A † | | | | | | | 12,300 | | | | 7,237,443 | |
Google Incorporated Class C † | | | | | | | 12,550 | | | | 7,245,868 | |
Naver Corporation | | | | | | | 335 | | | | 256,190 | |
NetEase Incorporated ADR | | | | | | | 25,150 | | | | 2,154,349 | |
Pandora Media Incorporated † | | | | | | | 73,165 | | | | 1,767,666 | |
Renren Incorporated ADR †« | | | | | | | 1,036 | | | | 3,564 | |
Tencent Holdings Limited | | | | | | | 104,700 | | | | 1,557,384 | |
Twitter Incorporated † | | | | | | | 87,160 | | | | 4,495,713 | |
Yahoo! Incorporated † | | | | | | | 43,760 | | | | 1,783,220 | |
Yelp Incorporated † | | | | | | | 22,280 | | | | 1,520,610 | |
| | | | |
| | | | | | | | | | | 53,844,203 | |
| | | | | | | | | | | | |
| | | | |
| IT Services: 4.19% | | | | | | | | | | | | |
Alliance Data Systems Corporation † | | | | | | | 6,390 | | | | 1,586,445 | |
Computer Sciences Corporation | | | | | | | 43,855 | | | | 2,681,733 | |
Fiserv Incorporated † | | | | | | | 32,205 | | | | 2,081,570 | |
MasterCard Incorporated Class A | | | | | | | 38,940 | | | | 2,878,445 | |
Visa Incorporated Class A | | | | | | | 20,280 | | | | 4,327,144 | |
| | | | |
| | | | | | | | | | | 13,555,337 | |
| | | | | | | | | | | | |
| | | | |
| Semiconductors & Semiconductor Equipment: 14.74% | | | | | | | | | | | | |
Avago Technologies Limited | | | | | | | 105,125 | | | | 9,145,875 | |
Broadcom Corporation Class A | | | | | | | 66,105 | | | | 2,671,964 | |
Freescale Semiconductor Limited † | | | | | | | 70,195 | | | | 1,370,908 | |
Hynix Semiconductor Incorporated † | | | | | | | 57,895 | | | | 2,564,882 | |
Intel Corporation | | | | | | | 4,260 | | | | 148,333 | |
Lam Research Corporation | | | | | | | 102,510 | | | | 7,657,497 | |
Micron Technology Incorporated † | | | | | | | 306,085 | | | | 10,486,472 | |
NXP Semiconductor NV † | | | | | | | 35,460 | | | | 2,426,528 | |
Skyworks Solutions Incorporated | | | | | | | 110,540 | | | | 6,416,847 | |
SunPower Corporation †« | | | | | | | 75,960 | | | | 2,573,525 | |
Texas Instruments Incorporated | | | | | | | 45,610 | | | | 2,175,141 | |
| | | | |
| | | | | | | | | | | 47,637,972 | |
| | | | | | | | | | | | |
| | | | |
| Software: 18.87% | | | | | | | | | | | | |
Activision Blizzard Incorporated | | | | | | | 198,545 | | | | 4,127,751 | |
Aspen Technology Incorporated † | | | | | | | 66,095 | | | | 2,493,103 | |
Autodesk Incorporated † | | | | | | | 35,795 | | | | 1,972,305 | |
FireEye Incorporated †« | | | | | | | 110,610 | | | | 3,380,242 | |
Informatica Corporation † | | | | | | | 9,635 | | | | 329,902 | |
Intuit Incorporated | | | | | | | 48,140 | | | | 4,219,471 | |
Microsoft Corporation | | | | | | | 649,685 | | | | 30,119,397 | |
Oracle Corporation | | | | | | | 82,875 | | | | 3,172,455 | |
Salesforce.com Incorporated † | | | | | | | 36,495 | | | | 2,099,557 | |
ServiceNow Incorporated † | | | | | | | 125,130 | | | | 7,355,141 | |
The accompanying notes are an integral part of these financial statements.
| | | | | | |
| Portfolio of investments—September 30, 2014 (unaudited) | | Wells Fargo Advantage Specialized Technology Fund | | | 9 | |
| | | | | | | | | | | | | | |
| Security name | | | | | | | Shares | | | Value | |
| | | | | | | | | | | | | | |
| | | | |
| Software (continued) | | | | | | | | | | | | | | |
Tableau Software Incorporated Class A † | | | | | | | | | 23,210 | | | $ | 1,686,207 | |
| | | | |
| | | | | | | | | | | | | 60,955,531 | |
| | | | | | | | | | | | | | |
| | | | |
| Technology Hardware, Storage & Peripherals: 22.02% | | | | | | | | | | | | | | |
Apple Incorporated | | | | | | | | | 319,605 | | | | 32,200,204 | |
EMC Corporation | | | | | | | | | 112,430 | | | | 3,289,702 | |
Hewlett-Packard Company | | | | | | | | | 258,515 | | | | 9,169,527 | |
Lenovo Group Limited | | | | | | | | | 588,000 | | | | 875,391 | |
NEC Corporation | | | | | | | | | 21,000 | | | | 72,569 | |
SanDisk Corporation | | | | | | | | | 93,985 | | | | 9,205,831 | |
Seagate Technology plc | | | | | | | | | 121,565 | | | | 6,962,028 | |
Western Digital Corporation | | | | | | | | | 96,305 | | | | 9,372,398 | |
| | | | |
| | | | | | | | | | | | | 71,147,650 | |
| | | | | | | | | | | | | | |
| | | | |
Telecommunication Services: 0.44% | | | | | | | | | | | | | | |
| | | | |
| Wireless Telecommunication Services: 0.44% | | | | | | | | | | | | | | |
SBA Communications Corporation Class A † | | | | | | | | | 12,795 | | | | 1,418,966 | |
| | | | |
Total Common Stocks (Cost $213,057,044) | | | | | | | | | | | | | 301,868,134 | |
| | | | | | | | | | | | | | |
| | | | |
| | | Yield | | | | | | | | | |
| Short-Term Investments: 8.91% | | | | | | | | | | | | | | |
| | | | |
| Investment Companies: 8.91% | | | | | | | | | | | | | | |
Wells Fargo Advantage Cash Investment Money Market Fund, Select Class (l)(u) | | | 0.07 | % | | | | | 21,069,310 | | | | 21,069,310 | |
Wells Fargo Securities Lending Cash Investments, LLC (l)(u)(r) | | | 0.11 | | | | | | 7,722,850 | | | | 7,722,850 | |
| | | | |
Total Short-Term Investments (Cost $28,792,160) | | | | | | | | | | | | | 28,792,160 | |
| | | | | | | | | | | | | | |
| | | | | | | | |
| Total investments in securities | | | | | | | | |
| (Cost $241,849,204) * | | | 102.35 | % | | | 330,660,294 | |
Other assets and liabilities, net | | | (2.35 | ) | | | (7,601,635 | ) |
| | | | | | | | |
| Total net assets | | | 100.00 | % | | $ | 323,058,659 | |
| | | | | | | | |
| † | Non-income-earning security |
| « | All or a portion of this security is on loan. |
| (l) | The security represents an affiliate of the Fund as defined in the Investment Company Act of 1940. |
| (u) | The rate represents the 7-day annualized yield at period end. |
| (r) | The investment is a non-registered investment vehicle purchased with cash collateral received from securities on loan. |
| * | Cost for federal income tax purposes is $243,034,163 and unrealized gains (losses) consists of: |
| | | | |
Gross unrealized gains | | $ | 90,050,971 | |
Gross unrealized losses | | | (2,424,840 | ) |
| | | | |
Net unrealized gains | | $ | 87,626,131 | |
The accompanying notes are an integral part of these financial statements.
| | | | |
| 10 | | Wells Fargo Advantage Specialized Technology Fund | | Statement of assets and liabilities—September 30, 2014 (unaudited) |
| | | | |
| | | | |
| |
Assets | | | | |
Investments | | | | |
In unaffiliated securities (including $7,405,401 of securities loaned), at value (cost $213,057,044) | | $ | 301,868,134 | |
In affiliated securities, at value (cost $28,792,160) | | | 28,792,160 | |
| | | | |
Total investments, at value (cost $241,849,204) | | | 330,660,294 | |
Foreign currency, at value (cost $10) | | | 10 | |
Receivable for investments sold | | | 4,720,434 | |
Receivable for Fund shares sold | | | 319,575 | |
Receivable for dividends | | | 128,080 | |
Receivable for securities lending income | | | 2,156 | |
Prepaid expenses and other assets | | | 44,902 | |
| | | | |
Total assets | | | 335,875,451 | |
| | | | |
| |
Liabilities | | | | |
Payable for investments purchased | | | 4,521,449 | |
Payable for Fund shares redeemed | | | 161,949 | |
Payable upon receipt of securities loaned | | | 7,722,850 | |
Advisory fee payable | | | 224,952 | |
Distribution fees payable | | | 8,009 | |
Administration fees payable | | | 83,587 | |
Accrued expenses and other liabilities | | | 93,996 | |
| | | | |
Total liabilities | | | 12,816,792 | |
| | | | |
Total net assets | | $ | 323,058,659 | |
| | | | |
| |
NET ASSETS CONSIST OF | | | | |
Paid-in capital | | $ | 186,913,417 | |
Accumulated net investment loss | | | (869,129 | ) |
Accumulated net realized gains on investments | | | 48,203,353 | |
Net unrealized gains on investments | | | 88,811,018 | |
| | | | |
Total net assets | | $ | 323,058,659 | |
| | | | |
| |
COMPUTATION OF NET ASSET VALUE AND OFFERING PRICE PER SHARE | | | | |
Net assets – Class A | | $ | 162,796,475 | |
Shares outstanding – Class A1 | | | 14,294,135 | |
Net asset value per share – Class A | | | $11.39 | |
Maximum offering price per share – Class A2 | | | $12.08 | |
Net assets – Class B | | $ | 269,500 | |
Shares outstanding – Class B1 | | | 26,635 | |
Net asset value per share – Class B | | | $10.12 | |
Net assets – Class C | | $ | 12,651,445 | |
Shares outstanding – Class C1 | | | 1,253,549 | |
Net asset value per share – Class C | | | $10.09 | |
Net assets – Administrator Class | | $ | 35,632,073 | |
Shares outstanding – Administrator Class1 | | | 3,101,147 | |
Net asset value per share – Administrator Class | | | $11.49 | |
Net assets – Investor Class | | $ | 111,709,166 | |
Shares outstanding – Investor Class1 | | | 9,905,807 | |
Net asset value per share – Investor Class | | | $11.28 | |
| 1. | The Fund has an unlimited number of authorized shares. |
| 2. | Maximum offering price is computed as 100/94.25 of net asset value. On investments of $50,000 or more, the offering price is reduced. |
The accompanying notes are an integral part of these financial statements.
| | | | | | |
| Statement of operations—six months ended September 30, 2014 (unaudited) | | Wells Fargo Advantage Specialized Technology Fund | | | 11 | |
| | | | |
| | | | |
| |
Investment income | | | | |
Dividends (net of foreign withholding taxes of $37,846) | | $ | 1,522,076 | |
Securities lending income, net | | | 15,562 | |
Income from affiliated securities | | | 4,980 | |
| | | | |
Total investment income | | | 1,542,618 | |
| | | | |
| |
Expenses | | | | |
Advisory fee | | | 1,420,737 | |
Administration fees | | | | |
Fund level | | | 77,597 | |
Class A | | | 204,344 | |
Class B | | | 399 | |
Class C | | | 15,341 | |
Administrator Class | | | 16,937 | |
Investor Class | | | 171,548 | |
Shareholder servicing fees | | | | |
Class A | | | 196,484 | |
Class B | | | 384 | |
Class C | | | 14,752 | |
Administrator Class | | | 42,139 | |
Investor Class | | | 133,735 | |
Distribution fees | | | | |
Class B | | | 1,150 | |
Class C | | | 44,255 | |
Custody and accounting fees | | | 26,805 | |
Professional fees | | | 22,130 | |
Registration fees | | | 20,612 | |
Shareholder report expenses | | | 38,988 | |
Trustees’ fees and expenses | | | 6,242 | |
Other fees and expenses | | | 6,813 | |
| | | | |
Total expenses | | | 2,461,392 | |
Less: Fee waivers and/or expense reimbursements | | | (49,645 | ) |
| | | | |
Net expenses | | | 2,411,747 | |
| | | | |
Net investment loss | | | (869,129 | ) |
| | | | |
| |
REALIZED AND UNREALIZED GAINS (LOSSES) ON INVESTMENTS | | | | |
Net realized gains on investments | | | 13,135,506 | |
Net change in unrealized gains (losses) on investments | | | 8,515,920 | |
| | | | |
Net realized and unrealized gains (losses) on investments | | | 21,651,426 | |
| | | | |
Net increase in net assets resulting from operations | | $ | 20,782,297 | |
| | | | |
The accompanying notes are an integral part of these financial statements.
| | | | |
| 12 | | Wells Fargo Advantage Specialized Technology Fund | | Statement of changes in net assets |
| | | | | | | | | | | | | | | | |
| | | Six months ended
September 30, 2014
(unaudited) | | | Year ended
March 31, 2014 | |
| | | | |
Operations | | | | | | | | | | | | | | | | |
Net investment loss | | | | | | $ | (869,129 | ) | | | | | | $ | (1,737,288 | ) |
Net realized gains on investments | | | | | | | 13,135,506 | | | | | | | | 38,184,414 | |
Net change in unrealized gains (losses) on investments | | | | | | | 8,515,920 | | | | | | | | 45,121,377 | |
| | | | |
Net increase in net assets resulting from operations | | | | | | | 20,782,297 | | | | | | | | 81,568,503 | |
| | | | |
| | | | |
Distributions to shareholders from | | | | | | | | | | | | | | | | |
Net realized gains | | | | | | | | | | | | | | | | |
Class A | | | | | | | 0 | | | | | | | | (7,199,829 | ) |
Class B | | | | | | | 0 | | | | | | | | (20,871 | ) |
Class C | | | | | | | 0 | | | | | | | | (482,611 | ) |
Administrator Class | | | | | | | 0 | | | | | | | | (1,320,953 | ) |
Investor Class | | | | | | | 0 | | | | | | | | (4,850,141 | ) |
| | | | |
Total distributions to shareholders | | | | | | | 0 | | | | | | | | (13,874,405 | ) |
| | | | |
| | | | |
Capital share transactions | | | Shares | | | | | | | | Shares | | | | | |
Proceeds from shares sold | | | | | | | | | | | | | | | | |
Class A | | | 848,281 | | | | 9,414,950 | | | | 2,074,847 | | | | 20,245,085 | |
Class B | | | 1,676 | | | | 15,927 | | | | 16,812 | | | | 135,566 | |
Class C | | | 178,016 | | | | 1,732,546 | | | | 361,372 | | | | 3,314,738 | |
Administrator Class | | | 400,998 | | | | 4,347,971 | | | | 1,430,270 | | | | 13,667,681 | |
Investor Class | | | 653,283 | | | | 7,126,206 | | | | 1,221,274 | | | | 12,038,311 | |
| | | | |
| | | | | | | 22,637,600 | | | | | | | | 49,401,381 | |
| | | | |
Reinvestment of distributions | | | | | | | | | | | | | | | | |
Class A | | | 0 | | | | 0 | | | | 689,100 | | | | 6,973,694 | |
Class B | | | 0 | | | | 0 | | | | 2,141 | | | | 19,353 | |
Class C | | | 0 | | | | 0 | | | | 46,366 | | | | 418,224 | |
Administrator Class | | | 0 | | | | 0 | | | | 114,325 | | | | 1,164,971 | |
Investor Class | | | 0 | | | | 0 | | | | 475,186 | | | | 4,761,363 | |
| | | | |
| | | | | | | 0 | | | | | | | | 13,337,605 | |
| | | | |
Payment for shares redeemed | | | | | | | | | | | | | | | | |
Class A | | | (1,090,487 | ) | | | (11,955,974 | ) | | | (2,347,765 | ) | | | (23,287,523 | ) |
Class B | | | (12,385 | ) | | | (119,732 | ) | | | (45,790 | ) | | | (393,796 | ) |
Class C | | | (75,714 | ) | | | (751,523 | ) | | | (149,425 | ) | | | (1,242,368 | ) |
Administrator Class | | | (250,378 | ) | | | (2,746,963 | ) | | | (667,440 | ) | | | (6,452,465 | ) |
Investor Class | | | (608,231 | ) | | | (6,579,712 | ) | | | (1,600,804 | ) | | | (15,384,834 | ) |
| | | | |
| | | | | | | (22,153,904 | ) | | | | | | | (46,760,986 | ) |
| | | | |
Net increase in net assets resulting from capital share transactions | | | | | | | 483,696 | | | | | | | | 15,978,000 | |
| | | | |
Total increase in net assets | | | | | | | 21,265,993 | | | | | | | | 83,672,098 | |
| | | | |
| | | | |
Net assets | | | | | | | | | | | | | | | | |
Beginning of period | | | | | | | 301,792,666 | | | | | | | | 218,120,568 | |
| | | | |
End of period | | | | | | $ | 323,058,659 | | | | | | | $ | 301,792,666 | |
| | | | |
Accumulated net investment loss | | | | | | $ | (869,129 | ) | | | | | | $ | 0 | |
| | | | |
The accompanying notes are an integral part of these financial statements.
| | | | | | |
| Financial highlights | | Wells Fargo Advantage Specialized Technology Fund | | | 13 | |
(For a share outstanding throughout each period)
| | | | | | | | | | | | | | | | | | | | | | | | | | | | |
| | | Six months ended September 30, 2014 (unaudited) | | | Year ended March 31 | | | Year ended October 31 | |
| CLASS A | | | 2014 | | | 2013 | | | 2012 | | | 20111 | | | 2010 | | | 2009 | |
Net asset value, beginning of period | | $ | 10.65 | | | | $8.15 | | | $ | 8.40 | | | $ | 8.88 | | | $ | 7.74 | | | $ | 5.81 | | | $ | 4.52 | |
Net investment loss | | | (0.03 | ) | | | (0.06 | ) | | | (0.03 | )2 | | | (0.07 | ) | | | (0.04 | ) | | | (0.08 | ) | | | (0.04 | )2 |
Net realized and unrealized gains (losses) on investments | | | 0.77 | | | | 3.07 | | | | (0.00 | )3 | | | (0.05 | ) | | | 1.18 | | | | 2.01 | | | | 1.33 | |
| | | | | | | | | | | | | | | | | | | | | | | | | | | | |
Total from investment operations | | | 0.74 | | | | 3.01 | | | | (0.03 | ) | | | (0.12 | ) | | | 1.14 | | | | 1.93 | | | | 1.29 | |
Distributions to shareholders from | | | | | | | | | | | | | | | | | | | | | | | | | | | | |
Net realized gains | | | 0.00 | | | | (0.51 | ) | | | (0.22 | ) | | | (0.36 | ) | | | 0.00 | | | | 0.00 | | | | 0.00 | |
Net asset value, end of period | | $ | 11.39 | | | $ | 10.65 | | | $ | 8.15 | | | $ | 8.40 | | | $ | 8.88 | | | $ | 7.74 | | | $ | 5.81 | |
Total return4 | | | 6.95 | % | | | 37.27 | % | | | (0.17 | )% | | | (0.74 | )% | | | 14.60 | % | | | 33.22 | % | | | 28.54 | % |
Ratios to average net assets (annualized) | | | | | | | | | | | | | | | | | | | | | | | | | | | | |
Gross expenses | | | 1.55 | % | | | 1.60 | % | | | 1.64 | % | | | 1.70 | % | | | 1.67 | % | | | 1.73 | % | | | 1.85 | % |
Net expenses | | | 1.53 | % | | | 1.56 | % | | | 1.63 | % | | | 1.70 | % | | | 1.67 | % | | | 1.73 | % | | | 1.75 | % |
Net investment loss | | | (0.54 | )% | | | (0.63 | )% | | | (0.34 | )% | | | (0.92 | )% | | | (1.20 | )% | | | (1.23 | )% | | | (0.84 | )% |
Supplemental data | | | | | | | | | | | | | | | | | | | | | | | | | | | | |
Portfolio turnover rate | | | 49 | % | | | 132 | % | | | 127 | % | | | 169 | % | | | 43 | % | | | 164 | % | | | 144 | % |
Net assets, end of period (000s omitted) | | | $162,796 | | | | $154,833 | | | | $115,145 | | | | $144,308 | | | | $167,298 | | | | $147,945 | | | | $116,272 | |
| 1. | For the five months ended March 31, 2011. The Fund changed its fiscal year end from October 31 to March 31, effective March 31, 2011. |
| 2. | Calculated based upon average shares outstanding |
| 3. | Amount is less than $0.005. |
| 4. | Total return calculations do not include any sales charges. Returns for periods of less than one year are not annualized. |
The accompanying notes are an integral part of these financial statements.
| | | | |
| 14 | | Wells Fargo Advantage Specialized Technology Fund | | Financial highlights |
(For a share outstanding throughout each period)
| | | | | | | | | | | | | | | | | | | | | | | | | | | | |
| | | Six months ended September 30, 2014
(unaudited) | | | Year ended March 31 | | | Year ended October 31 | |
| CLASS B | | | 2014 | | | 2013 | | | 2012 | | | 20111 | | | 2010 | | | 2009 | |
Net asset value, beginning of period | | | $9.50 | | | $ | 7.37 | | | $ | 7.67 | | | $ | 8.20 | | | $ | 7.18 | | | $ | 5.42 | | | $ | 4.25 | |
Net investment loss | | | (0.06 | )2 | | | (0.12 | )2 | | | (0.08 | )2 | | | (0.13 | )2 | | | (0.06 | )2 | | | (0.12 | )2 | | | (0.07 | )2 |
Net realized and unrealized gains (losses) on investments | | | 0.68 | | | | 2.76 | | | | (0.00 | )3 | | | (0.04 | ) | | | 1.08 | | | | 1.88 | | | | 1.24 | |
| | | | | | | | | | | | | | | | | | | | | | | | | | | | |
Total from investment operations | | | 0.62 | | | | 2.64 | | | | (0.08 | ) | | | (0.17 | ) | | | 1.02 | | | | 1.76 | | | | 1.17 | |
Distributions to shareholders from | | | | | | | | | | | | | | | | | | | | | | | | | | | | |
Net realized gains | | | 0.00 | | | | (0.51 | ) | | | (0.22 | ) | | | (0.36 | ) | | | 0.00 | | | | 0.00 | | | | 0.00 | |
Net asset value, end of period | | $ | 10.12 | | | $ | 9.50 | | | $ | 7.37 | | | $ | 7.67 | | | $ | 8.20 | | | $ | 7.18 | | | $ | 5.42 | |
Total return4 | | | 6.53 | % | | | 36.18 | % | | | (0.84 | )% | | | (1.54 | )% | | | 14.21 | % | | | 32.47 | % | | | 27.53 | % |
Ratios to average net assets (annualized) | | | | | | | | | | | | | | | | | | | | | | | | | | | | |
Gross expenses | | | 2.31 | % | | | 2.35 | % | | | 2.39 | % | | | 2.45 | % | | | 2.42 | % | | | 2.48 | % | | | 2.60 | % |
Net expenses | | | 2.28 | % | | | 2.32 | % | | | 2.38 | % | | | 2.45 | % | | | 2.42 | % | | | 2.48 | % | | | 2.50 | % |
Net investment loss | | | (1.31 | )% | | | (1.36 | )% | | | (1.09 | )% | | | (1.69 | )% | | | (1.95 | )% | | | (1.97 | )% | | | (1.54 | )% |
Supplemental data | | | | | | | | | | | | | | | | | | | | | | | | | | | | |
Portfolio turnover rate | | | 49 | % | | | 132 | % | | | 127 | % | | | 169 | % | | | 43 | % | | | 164 | % | | | 144 | % |
Net assets, end of period (000s omitted) | | | $270 | | | | $355 | | | | $473 | | | | $851 | | | | $1,629 | | | | $1,888 | | | | $2,310 | |
| 1. | For the five months ended March 31, 2011. The Fund changed its fiscal year end from October 31 to March 31, effective March 31, 2011. |
| 2. | Calculated based upon average shares outstanding |
| 3. | Amount is less than $0.005. |
| 4. | Total return calculations do not include any sales charges. Returns for periods of less than one year are not annualized. |
The accompanying notes are an integral part of these financial statements.
| | | | | | |
| Financial highlights | | Wells Fargo Advantage Specialized Technology Fund | | | 15 | |
(For a share outstanding throughout each period)
| | | | | | | | | | | | | | | | | | | | | | | | | | | | |
| | | Six months ended September 30, 2014 (unaudited) | | | Year ended March 31 | | | Year ended October 31 | |
| CLASS C | | | 2014 | | | 2013 | | | 2012 | | | 20111 | | | 2010 | | | 2009 | |
Net asset value, beginning of period | | | $9.47 | | | $ | 7.35 | | | $ | 7.65 | | | $ | 8.18 | | | $ | 7.16 | | | $ | 5.41 | | | $ | 4.24 | |
Net investment loss | | | (0.06 | )2 | | | (0.12 | )2 | | | (0.08 | )2 | | | (0.12 | )2 | | | (0.06 | )2 | | | (0.12 | )2 | | | (0.07 | )2 |
Net realized and unrealized gains (losses) on investments | | | 0.68 | | | | 2.75 | | | | (0.00 | )3 | | | (0.05 | ) | | | 1.08 | | | | 1.87 | | | | 1.24 | |
| | | | | | | | | | | | | | | | | | | | | | | | | | | | |
Total from investment operations | | | 0.62 | | | | 2.63 | | | | (0.08 | ) | | | (0.17 | ) | | | 1.02 | | | | 1.75 | | | | 1.17 | |
Distributions to shareholders from | | | | | | | | | | | | | | | | | | | | | | | | | | | | |
Net realized gains | | | 0.00 | | | | (0.51 | ) | | | (0.22 | ) | | | (0.36 | ) | | | 0.00 | | | | 0.00 | | | | 0.00 | |
Net asset value, end of period | | $ | 10.09 | | | $ | 9.47 | | | $ | 7.35 | | | $ | 7.65 | | | $ | 8.18 | | | $ | 7.16 | | | $ | 5.41 | |
Total return4 | | | 6.55 | % | | | 36.14 | % | | | (0.84 | )% | | | (1.55 | )% | | | 14.25 | % | | | 32.35 | % | | | 27.59 | % |
Ratios to average net assets (annualized) | | | | | | | | | | | | | | | | | | | | | | | | | | | | |
Gross expenses | | | 2.30 | % | | | 2.35 | % | | | 2.39 | % | | | 2.45 | % | | | 2.43 | % | | | 2.48 | % | | | 2.60 | % |
Net expenses | | | 2.28 | % | | | 2.31 | % | | | 2.38 | % | | | 2.45 | % | | | 2.43 | % | | | 2.48 | % | | | 2.50 | % |
Net investment loss | | | (1.28 | )% | | | (1.38 | )% | | | (1.09 | )% | | | (1.66 | )% | | | (1.95 | )% | | | (1.98 | )% | | | (1.60 | )% |
Supplemental data | | | | | | | | | | | | | | | | | | | | | | | | | | | | |
Portfolio turnover rate | | | 49 | % | | | 132 | % | | | 127 | % | | | 169 | % | | | 43 | % | | | 164 | % | | | 144 | % |
Net assets, end of period (000s omitted) | | | $12,651 | | | | $10,907 | | | | $6,563 | | | | $7,194 | | | | $6,742 | | | | $5,566 | | | | $4,527 | |
| 1. | For the five months ended March 31, 2011. The Fund changed its fiscal year end from October 31 to March 31, effective March 31, 2011. |
| 2. | Calculated based upon average shares outstanding |
| 3. | Amount is less than $0.005. |
| 4. | Total return calculations do not include any sales charges. Returns for periods of less than one year are not annualized. |
The accompanying notes are an integral part of these financial statements.
| | | | |
| 16 | | Wells Fargo Advantage Specialized Technology Fund | | Financial highlights |
(For a share outstanding throughout each period)
| | | | | | | | | | | | | | | | | | | | | | | | |
| | | Six months ended September 30, 2014 (unaudited) | | | Year ended March 31 | | | Year ended October 31, 20102 | |
| ADMINISTRATOR CLASS | | | 2014 | | | 2013 | | | 2012 | | | 20111 | | |
Net asset value, beginning of period | | | $10.74 | | | | $8.20 | | | $ | 8.43 | | | $ | 8.88 | | | $ | 7.74 | | | $ | 6.63 | |
Net investment loss | | | (0.02 | ) | | | (0.05 | ) | | | (0.01 | )3 | | | (0.06 | ) | | | (0.04 | )3 | | | (0.02 | )3 |
Net realized and unrealized gains (losses) on investments | | | 0.77 | | | | 3.10 | | | | (0.00 | )4 | | | (0.03 | ) | | | 1.18 | | | | 1.13 | |
| | | | | | | | | | | | | | | | | | | | | | | | |
Total from investment operations | | | 0.75 | | | | 3.05 | | | | (0.01 | ) | | | (0.09 | ) | | | 1.14 | | | | 1.11 | |
Distributions to shareholders from | | | | | | | | | | | | | | | | | | | | | | | | |
Net realized gains | | | 0.00 | | | | (0.51 | ) | | | (0.22 | ) | | | (0.36 | ) | | | 0.00 | | | | 0.00 | |
Net asset value, end of period | | $ | 11.49 | | | $ | 10.74 | | | $ | 8.20 | | | $ | 8.43 | | | $ | 8.88 | | | $ | 7.74 | |
Total return5 | | | 6.98 | % | | | 37.54 | % | | | 0.07 | % | | | (0.51 | )% | | | 14.73 | % | | | 16.74 | % |
Ratios to average net assets (annualized) | | | | | | | | | | | | | | | | | | | | | | | | |
Gross expenses | | | 1.39 | % | | | 1.44 | % | | | 1.48 | % | | | 1.53 | % | | | 1.48 | % | | | 1.58 | % |
Net expenses | | | 1.38 | % | | | 1.40 | % | | | 1.42 | % | | | 1.50 | % | | | 1.48 | % | | | 1.50 | % |
Net investment loss | | | (0.38 | )% | | | (0.48 | )% | | | (0.14 | )% | | | (0.64 | )% | | | (1.03 | )% | | | (0.97 | )% |
Supplemental data | | | | | | | | | | | | | | | | | | | | | | | | |
Portfolio turnover rate | | | 49 | % | | | 132 | % | | | 127 | % | | | 169 | % | | | 43 | % | | | 164 | % |
Net assets, end of period (000s omitted) | | | $35,632 | | | | $31,681 | | | | $17,008 | | | | $7,546 | | | | $3,879 | | | | $108 | |
| 1. | For the five months ended March 31, 2011. The Fund changed its fiscal year end from October 31 to March 31, effective March 31, 2011. |
| 2. | For the period from July 30, 2010 (commencement of class operations) to October 31, 2010 |
| 3. | Calculated based upon average shares outstanding |
| 4. | Amount is less than $0.005. |
| 5. | Returns for periods of less than one year are not annualized. |
The accompanying notes are an integral part of these financial statements.
| | | | | | |
| Financial highlights | | Wells Fargo Advantage Specialized Technology Fund | | | 17 | |
(For a share outstanding throughout each period)
| | | | | | | | | | | | | | | | | | | | | | | | | | | | |
| | | Six months ended September 30, 2014 (unaudited) | | | Year ended March 31 | | | Year ended October 31 | |
| INVESTOR CLASS | | | 2014 | | | 2013 | | | 2012 | | | 20111 | | | 2010 | | | 2009 | |
Net asset value, beginning of period | | $ | 10.55 | | | | $8.08 | | | $ | 8.34 | | | $ | 8.81 | | | $ | 7.69 | | | $ | 5.78 | | | $ | 4.50 | |
Net investment loss | | | (0.03 | ) | | | (0.06 | ) | | | (0.03 | ) | | | (0.08 | ) | | | (0.05 | ) | | | (0.09 | )2 | | | (0.05 | )2 |
Net realized and unrealized gains (losses) on investments | | | 0.76 | | | | 3.04 | | | | (0.01 | ) | | | (0.03 | ) | | | 1.17 | | | | 2.00 | | | | 1.33 | |
| | | | | | | | | | | | | | | | | | | | | | | | | | | | |
Total from investment operations | | | 0.73 | | | | 2.98 | | | | (0.04 | ) | | | (0.11 | ) | | | 1.12 | | | | 1.91 | | | | 1.28 | |
Distributions to shareholders from | | | | | | | | | | | | | | | | | | | | | | | | | | | | |
Net realized gains | | | 0.00 | | | | (0.51 | ) | | | (0.22 | ) | | | (0.36 | ) | | | 0.00 | | | | 0.00 | | | | 0.00 | |
Net asset value, end of period | | $ | 11.28 | | | $ | 10.55 | | | $ | 8.08 | | | $ | 8.34 | | | $ | 8.81 | | | $ | 7.69 | | | $ | 5.78 | |
Total return3 | | | 6.92 | % | | | 37.23 | % | | | (0.29 | )% | | | (0.74 | )% | | | 14.56 | % | | | 33.04 | % | | | 28.44 | % |
Ratios to average net assets (annualized) | | | | | | | | | | | | | | | | | | | | | | | | | | | | |
Gross expenses | | | 1.61 | % | | | 1.66 | % | | | 1.70 | % | | | 1.77 | % | | | 1.74 | % | | | 1.82 | % | | | 1.96 | % |
Net expenses | | | 1.56 | % | | | 1.60 | % | | | 1.69 | % | | | 1.77 | % | | | 1.74 | % | | | 1.82 | % | | | 1.86 | % |
Net investment loss | | | (0.57 | )% | | | (0.67 | )% | | | (0.40 | )% | | | (0.98 | )% | | | (1.27 | )% | | | (1.32 | )% | | | (0.96 | )% |
Supplemental data | | | | | | | | | | | | | | | | | | | | | | | | | | | | |
Portfolio turnover rate | | | 49 | % | | | 132 | % | | | 127 | % | | | 169 | % | | | 43 | % | | | 164 | % | | | 144 | % |
Net assets, end of period (000s omitted) | | | $111,709 | | | | $104,016 | | | | $78,931 | | | | $87,706 | | | | $94,139 | | | | $81,544 | | | | $63,814 | |
| 1. | For the five months ended March 31, 2011. The Fund changed its fiscal year end from October 31 to March 31, effective March 31, 2011. |
| 2. | Calculated based upon average shares outstanding |
| 3. | Returns for periods of less than one year are not annualized. |
The accompanying notes are an integral part of these financial statements.
| | | | |
| 18 | | Wells Fargo Advantage Specialized Technology Fund | | Notes to financial statements (unaudited) |
1. ORGANIZATION
Wells Fargo Funds Trust (the “Trust”), a Delaware statutory trust organized on March 10, 1999, is an open-end management investment company registered under the Investment Company Act of 1940, as amended (the “1940 Act”). These financial statements report on the Wells Fargo Advantage Specialized Technology Fund (the “Fund”) which is a non-diversified series of the Trust.
2. SIGNIFICANT ACCOUNTING POLICIES
The following significant accounting policies, which are consistently followed in the preparation of the financial statements of the Fund, are in conformity with U.S. generally accepted accounting principles which require management to make estimates and assumptions that affect the reported amounts of assets and liabilities, disclosure of contingent assets and liabilities at the date of the financial statements, and the reported amounts of revenues and expenses during the reporting period. Actual results could differ from those estimates.
Securities valuation
All investments are valued each business day as of the close of regular trading on the New York Stock Exchange (generally 4 p.m. Eastern Time).
Equity securities that are listed on a foreign or domestic exchange or market are valued at the official closing price or, if none, the last sales price. If no sale occurs on the primary exchange or market for the security that day, the prior day’s price will be deemed “stale” and fair values will be determined in accordance with the Fund’s Valuation Procedures.
The values of securities denominated in foreign currencies are translated into U.S. dollars at rates provided by an independent foreign currency pricing source at a time each business day specified by the Management Valuation Team of Wells Fargo Funds Management, LLC (“Funds Management”).
Many securities markets and exchanges outside the U.S. close prior to the close of the New York Stock Exchange and therefore may not fully reflect trading or events that occur after the close of the principal exchange in which the foreign securities are traded, but before the close of the New York Stock Exchange. If such trading or events are expected to materially affect the value of such securities, then fair value pricing procedures approved by the Board of Trustees of the Fund are applied. These procedures take into account multiple factors including movements in U.S. securities markets after foreign exchanges close. Foreign securities that are fair valued under these procedures are categorized as Level 2 and the application of these procedures may result in transfers between Level 1 and Level 2. Depending on market activity, such fair valuations may be frequent. Such fair value pricing may result in net asset values that are higher or lower than net asset values based on the last reported sales price or latest quoted bid price. On September 30, 2014, such fair value pricing was not used in pricing foreign securities.
Investments in registered open-end investment companies are valued at net asset value. Non-registered investment vehicles are fair valued at net asset value.
Investments which are not valued using any of the methods discussed above are valued at their fair value, as determined in good faith by the Board of Trustees. The Board of Trustees has established a Valuation Committee comprised of the Trustees and has delegated to it the authority to take any actions regarding the valuation of portfolio securities that the Valuation Committee deems necessary or appropriate, including determining the fair value of portfolio securities, unless the determination has been delegated to the Management Valuation Team. The Board of Trustees retains the authority to make or ratify any valuation decisions or approve any changes to the Valuation Procedures as it deems appropriate. On a quarterly basis, the Board of Trustees receives reports on any valuation actions taken by the Valuation Committee or the Management Valuation Team which may include items for ratification.
Valuations of fair valued securities are compared to the next actual sales price when available, or other appropriate market values, to assess the continued appropriateness of the fair valuation methodologies used. These securities are fair valued on a day-to-day basis, taking into consideration changes to appropriate market information and any significant changes to the inputs considered in the valuation process until there is a readily available price provided on an exchange or by an independent pricing service. Valuations received from an independent pricing service or independent broker-dealer quotes are periodically validated by comparisons to most recent trades and valuations provided by other independent pricing services in addition to the review of prices by the adviser and/or subadviser. Unobservable inputs used in determining fair valuations are identified based on the type of security, taking into consideration factors utilized by market participants in valuing the investment, knowledge about the issuer and the current market environment.
| | | | | | |
| Notes to financial statements (unaudited) | | Wells Fargo Advantage Specialized Technology Fund | | | 19 | |
Foreign currency translation
The accounting records of the Fund are maintained in U.S. dollars. The values of other assets and liabilities denominated in foreign currencies are translated into U.S. dollars at rates provided by an independent foreign currency pricing source at a time each business day specified by the Management Valuation Team. Purchases and sales of securities, and income and expenses are converted at the rate of exchange on the respective dates of such transactions. Net realized foreign exchange gains or losses arise from sales of foreign currencies, currency gains or losses realized between the trade and settlement dates on securities transactions, and the difference between the amounts of dividends, interest and foreign withholding taxes recorded and the U.S. dollar equivalent of the amounts actually paid or received. Net unrealized foreign exchange gains and losses arise from changes in the fair value of assets and liabilities other than investments in securities resulting from changes in exchange rates. The changes in net assets arising from changes in exchange rates and the changes in net assets resulting from changes in market prices of securities are not separately presented. Such changes are included in net realized and unrealized gains or losses from investments.
Security loans
The Fund may lend its securities from time to time in order to earn additional income in the form of fees or interest on securities received as collateral or the investment of any cash received as collateral. The Fund continues to receive interest or dividends on the securities loaned. The Fund receives collateral in the form of cash or securities with a value at least equal to the value of the securities on loan. The value of the loaned securities is determined at the close of each business day and any additional required collateral is delivered to the Fund on the next business day. In a securities lending transaction, the net asset value of the Fund will be affected by an increase or decrease in the value of the securities loaned and by an increase or decrease in the value of the instrument in which collateral is invested. The amount of securities lending activity undertaken by the Fund fluctuates from time to time. In the event of default or bankruptcy by the borrower, the Fund may be prevented from recovering the loaned securities or gaining access to the collateral or may experience delays or costs in doing so. In addition, the investment of any cash collateral received may lose all or part of its value. The Fund has the right under the lending agreement to recover the securities from the borrower on demand.
The Fund lends its securities through an unaffiliated securities lending agent. Cash collateral received in connection with its securities lending transactions is invested in Wells Fargo Securities Lending Cash Investments, LLC (the “Securities Lending Fund”). The Securities Lending Fund is exempt from registration under Section 3(c)(7) of the 1940 Act and is managed by Funds Management and is subadvised by Wells Capital Management Incorporated (“WellsCap”). Funds Management receives an advisory fee starting at 0.05% and declining to 0.01% as the average daily net assets of the Securities Lending Fund increase. All of the fees received by Funds Management are paid to WellsCap for its services as subadviser. The Securities Lending Fund seeks to provide a positive return compared to the daily Fed Funds Open rate by investing in high-quality, U.S. dollar-denominated short-term money market instruments. Securities Lending Fund investments are fair valued based upon the amortized cost valuation technique. Income earned from investment in the Securities Lending Fund is included in securities lending income on the Statement of Operations.
Security transactions and income recognition
Securities transactions are recorded on a trade date basis. Realized gains or losses are recorded on the basis of identified cost.
Dividend income is recognized on the ex-dividend date, except for certain dividends from foreign securities, which are recorded as soon as the Fund is informed of the ex-dividend date. Dividend income from foreign securities is recorded net of foreign taxes withheld where recovery of such taxes is not assured.
Distributions to shareholders
Distributions to shareholders from net investment income and net realized gains, if any, are recorded on the ex-dividend date. Such distributions are determined in conformity with federal income tax regulations, which may differ in amount or character from net investment income and realized gains recognized for purposes of U.S. generally accepted accounting principles.
Federal and other taxes
The Fund intends to continue to qualify as a regulated investment company by distributing substantially all of its investment company taxable income and any net realized capital gains (after reduction for capital loss carryforwards) sufficient to relieve it from all, or substantially all, federal income taxes. Accordingly, no provision for federal income taxes was required.
| | | | |
| 20 | | Wells Fargo Advantage Specialized Technology Fund | | Notes to financial statements (unaudited) |
The Fund’s income and federal excise tax returns and all financial records supporting those returns for the prior three fiscal years are subject to examination by the federal and Delaware revenue authorities. Management has analyzed the Fund’s tax positions taken on federal, state, and foreign tax returns for all open tax years and does not believe that there are any uncertain tax positions that require recognition of a tax liability.
Class allocations
The separate classes of shares offered by the Fund differ principally in applicable sales charges, distribution, shareholder servicing, and administration fees. Class specific expenses are charged directly to that share class. Investment income, common expenses, and realized and unrealized gains (losses) on investments are allocated daily to each class of shares based on the relative proportion of net assets of each class.
3. FAIR VALUATION MEASUREMENTS
Fair value measurements of investments are determined within a framework that has established a fair value hierarchy based upon the various data inputs utilized in determining the value of the Fund’s investments. The three-level hierarchy gives the highest priority to unadjusted quoted prices in active markets for identical assets or liabilities (Level 1) and the lowest priority to significant unobservable inputs (Level 3). The Fund’s investments are classified within the fair value hierarchy based on the lowest level of input that is significant to the fair value measurement. The inputs are summarized into three broad levels as follows:
| n | | Level 1 – quoted prices in active markets for identical securities |
| n | | Level 2 – other significant observable inputs (including quoted prices for similar securities, interest rates, prepayment speeds, credit risk, use of amortized cost, etc.) |
| n | | Level 3 – significant unobservable inputs (including the Fund’s own assumptions in determining the fair value of investments) |
The inputs or methodologies used for valuing investments in securities are not necessarily an indication of the risk associated with investing in those securities.
The following is a summary of the inputs used in valuing the Fund’s assets and liabilities as of September 30, 2014:
| | | | | | | | | | | | | | | | |
| | | Quoted prices
(Level 1) | | | Other significant
observable inputs
(Level 2) | | | Significant
unobservable inputs
(Level 3) | | | Total | |
Assets | | | | | | | | | | | | | | | | |
Investments in: | | | | | | | | | | | | | | | | |
| | | | |
Common stocks | | | | | | | | | | | | | | | | |
Consumer discretionary | | $ | 23,225,173 | | | $ | 0 | | | $ | 0 | | | $ | 23,225,173 | |
Financials | | | 1,469,991 | | | | 0 | | | | 0 | | | | 1,469,991 | |
Health care | | | 1,688,228 | | | | 0 | | | | 0 | | | | 1,688,228 | |
Industrials | | | 6,693,874 | | | | 0 | | | | 0 | | | | 6,693,874 | |
Information technology | | | 267,371,902 | | | | 0 | | | | 0 | | | | 267,371,902 | |
Telecommunication services | | | 1,418,966 | | | | 0 | | | | 0 | | | | 1,418,966 | |
| | | | |
Short-term investments | | | | | | | | | | | | | | | | |
Investment companies | | | 21,069,310 | | | | 7,722,850 | | | | 0 | | | | 28,792,160 | |
Total assets | | $ | 322,937,444 | | | $ | 7,722,850 | | | $ | 0 | | | $ | 330,660,294 | |
Transfers in and transfers out are recognized at the end of the reporting period. At September 30, 2014, the Fund did not have any transfers into/out of Level 1, Level 2, or Level 3.
4. TRANSACTIONS WITH AFFILIATES AND OTHER EXPENSES
Advisory fee
The Trust has entered into an advisory contract with Funds Management, an indirect wholly owned subsidiary of Wells Fargo & Company (“Wells Fargo”). The adviser is responsible for implementing investment policies and guidelines and for supervising the subadviser, who is responsible for day-to-day portfolio management of the Fund.
| | | | | | |
| Notes to financial statements (unaudited) | | Wells Fargo Advantage Specialized Technology Fund | | | 21 | |
Pursuant to the contract, Funds Management is entitled to receive an annual advisory fee starting at 0.85% and declining to 0.75% as the average daily net assets of the Fund increase. Prior to August 1, 2014, Funds Management was entitled to receive an annual advisory fee which started at 0.95% and declined to 0.80% as the average daily net assets of the Fund increased. For the six months ended September 30, 2014, the advisory fee was equivalent to an annual rate of 0.92% of the Fund’s average daily net assets.
Funds Management has retained the services of a subadviser to provide daily portfolio management to the Fund. The fee for subadvisory services is borne by Funds Management. Allianz Global Investors U.S. LLC is the subadviser to the Fund and is entitled to receive a fee from Funds Management at an annual rate starting at 0.90% and declining to 0.55% as the average daily net assets of the Fund increase.
Administration fees
The Trust has entered into an administration agreement with Funds Management. Under this agreement, for providing administrative services, which includes paying fees and expenses for services provided by the transfer agent, sub-transfer agents, omnibus account servicers and record-keepers, Funds Management is entitled to receive from the Fund an annual fund level administration fee starting at 0.05% and declining to 0.03% as the average daily net assets of the Fund increase and a class level administration fee which is calculated based on the average daily net assets of each class as follows:
| | | | |
| | | Class level
administration fee | |
Class A, Class B, Class C | | | 0.26 | % |
Administrator Class | | | 0.10 | |
Investor Class | | | 0.32 | |
Funds Management has contractually waived and/or reimbursed advisory and administration fees to the extent necessary to maintain certain net operating expense ratios for the Fund. Waiver of fees and/or reimbursement of expenses by Funds Management were made first from fund level expenses on a proportionate basis and then from class specific expenses. Funds Management has committed through July 31, 2015 to waive fees and/or reimburse expenses to the extent necessary to cap the Fund’s expenses at 1.50% for Class A shares, 2.25% for Class B shares, 2.25% for Class C shares, 1.35% for Administrator Class shares, and 1.53% for Investor Class shares. After this time, the cap may be increased or the commitment to maintain the cap may be terminated only with the approval of the Board of Trustees. Prior to August 1, 2014, the Fund’s expenses were capped at 1.55% for Class A shares, 2.30% for Class B shares, 2.30% for Class C shares, 1.40% for Administrator Class shares, and 1.58% for Investor Class shares.
Distribution fees
The Trust has adopted a Distribution Plan for Class B and Class C shares of the Fund pursuant to Rule 12b-1 under the 1940 Act. Distribution fees are charged to Class B and Class C shares and paid to Wells Fargo Funds Distributor, LLC (“Funds Distributor”), the principal underwriter, at an annual rate of 0.75% of the average daily net assets of Class B and Class C shares.
In addition, Funds Distributor is entitled to receive the front-end sales charges from purchases of Class A shares and a contingent deferred sales charge on the redemption of certain shares. Funds Distributor is also entitled to receive the contingent deferred sales charges from redemptions of Class B and Class C shares. For the six months ended September 30, 2014, Funds Distributor received $16,616 from the sale of Class A shares and $310 in contingent deferred sales charges from redemptions of Class C shares.
Shareholder servicing fees
The Trust has entered into contracts with one or more shareholder servicing agents, whereby each class of the Fund is charged a fee at an annual rate of 0.25% of the average daily net assets of each respective class.
A portion of these total shareholder servicing fees were paid to affiliates of Wells Fargo.
5. INVESTMENT PORTFOLIO TRANSACTIONS
Purchases and sales of investments, excluding U.S. government obligations (if any) and short-term securities, for the six months ended September 30, 2014 were $145,464,898 and $145,128,030, respectively.
| | | | |
| 22 | | Wells Fargo Advantage Specialized Technology Fund | | Notes to financial statements (unaudited) |
6. BANK BORROWINGS
The Trust (excluding the money market funds and certain other funds in the Trust) and Wells Fargo Variable Trust are parties to a $150,000,000 revolving credit agreement whereby the Fund is permitted to use bank borrowings for temporary or emergency purposes, such as to fund shareholder redemption requests. Interest under the credit agreement is charged to the Fund based on a borrowing rate equal to the higher of the Federal Funds rate in effect on that day plus 1.25% or the overnight LIBOR rate in effect on that day plus 1.25%. In addition, an annual commitment fee equal to 0.10% of the unused balance is allocated to each participating fund. For the six months ended September 30, 2014, the Fund paid $226 in commitment fees
For the six months ended September 30, 2014, there were no borrowings by the Fund under the agreement.
7. CONCENTRATION RISK
The Fund invests a substantial portion of its assets in technology companies and, therefore, would be more affected by changes in the technology sector than would be a fund whose investments are not heavily weighted in the sector.
8. INDEMNIFICATION
Under the Trust’s organizational documents, the officers and Trustees are indemnified against certain liabilities that may arise out of performance of their duties to the Trust. Additionally, in the normal course of business, the Trust may enter into contracts with service providers that contain a variety of indemnification clauses. The Trust’s maximum exposure under these arrangements is dependent on future claims that may be made against the Fund and, therefore, cannot be estimated.
| | | | | | |
| Other information (unaudited) | | Wells Fargo Advantage Specialized Technology Fund | | | 23 | |
PROXY VOTING INFORMATION
A description of the policies and procedures that the Fund uses to determine how to vote proxies relating to portfolio securities is available without charge, upon request, by calling 1-800-222-8222, visiting our website at wellsfargoadvantagefunds.com, or visiting the SEC website at sec.gov. Information regarding how the Fund voted proxies relating to portfolio securities during the most recent 12-month period ended June 30 is available without charge on the Fund’s website at wellsfargoadvantagefunds.com or by visiting the SEC website at sec.gov.
PORTFOLIO HOLDINGS INFORMATION
The complete portfolio holdings for the Fund are publicly available monthly on the Fund’s website (wellsfargoadvantagefunds.com), on a one-month delayed basis. In addition, top ten holdings information (excluding derivative positions) for the Fund is publicly available on the Fund’s website on a monthly, seven-day or more delayed basis. The Fund files its complete schedule of portfolio holdings with the SEC for the first and third quarters of each fiscal year on Form N-Q, which is available without charge by visiting the SEC website at sec.gov. In addition, the Fund’s Form N-Q may be reviewed and copied at the SEC’s Public Reference Room in Washington, DC, and at regional offices in New York City, at 233 Broadway, and in Chicago, at 175 West Jackson Boulevard, Suite 900. Information about the Public Reference Room may be obtained by calling 1-800-SEC-0330.
| | | | |
| 24 | | Wells Fargo Advantage Specialized Technology Fund | | Other information (unaudited) |
BOARD OF TRUSTEES AND OFFICERS
Each of the Trustees and Officers1 listed in the table below acts in identical capacities for each fund in the Wells Fargo Advantage family of funds, which consists of 133 mutual funds comprising the Wells Fargo Funds Trust, Wells Fargo Variable Trust, Wells Fargo Master Trust and four closed-end funds (collectively the “Fund Complex”). This table should be read in conjunction with the Prospectus and the Statement of Additional Information2. The mailing address of each Trustee and Officer is 525 Market Street, 12th Floor, San Francisco, CA 94105. Each Trustee and Officer serves an indefinite term, however, each Trustee serves such term until reaching the mandatory retirement age established by the Trustees.
Independent Trustees
| | | | | | |
Name and
year of birth | | Position held and
length of service* | | Principal occupations during past five years or longer | | Other
directorships during
past five years |
| Peter G. Gordon (Born 1942) | | Trustee, since 1998; Chairman, since 2005 | | Co-Founder, Retired Chairman, President and CEO of Crystal Geyser Water Company. Trustee Emeritus, Colby College. | | Asset Allocation Trust |
| Isaiah Harris, Jr. (Born 1952) | | Trustee, since 2009 | | Retired. Prior thereto, President and CEO of BellSouth Advertising and Publishing Corp. from 2005 to 2007, President and CEO of BellSouth Enterprises from 2004 to 2005 and President of BellSouth Consumer Services from 2000 to 2003. Emeritus member of the Iowa State University Foundation Board of Governors. Emeritus Member of the Advisory Board of Iowa State University School of Business. Advisory Board Member, Palm Harbor Academy. Mr. Harris is a certified public accountant. | | CIGNA Corporation; Asset Allocation Trust |
| Judith M. Johnson (Born 1949) | | Trustee, since 2008;
Audit Committee Chairman, since 2008 | | Retired. Prior thereto, Chief Executive Officer and Chief Investment Officer of Minneapolis Employees Retirement Fund from 1996 to 2008. Ms. Johnson is an attorney, certified public accountant and a certified managerial accountant. | | Asset Allocation Trust |
| Leroy Keith, Jr. (Born 1939) | | Trustee, since 2010 | | Chairman, Bloc Global Services (development and construction). Trustee of the Evergreen Funds complex (and its predecessors) from 1983 to 2010. Former Managing Director, Almanac Capital Management (commodities firm), former Partner, Stonington Partners, Inc. (private equity fund), former Director, Obagi Medical Products Co. and former Director, Lincoln Educational Services. | | Trustee, Virtus Fund Complex (consisting of 50 portfolios as of 12/16/2013); Asset Allocation Trust |
| David F. Larcker (Born 1950) | | Trustee, since 2009 | | James Irvin Miller Professor of Accounting at the Graduate School of Business, Stanford University, Morgan Stanley Director of the Center for Leadership Development and Research and Senior Faculty of The Rock Center for Corporate Governance since 2006. From 2005 to 2008, Professor of Accounting at the Graduate School of Business, Stanford University. Prior thereto, Ernst & Young Professor of Accounting at The Wharton School, University of Pennsylvania from 1985 to 2005. | | Asset Allocation Trust |
| Olivia S. Mitchell (Born 1953) | | Trustee, since 2006 | | International Foundation of Employee Benefit Plans Professor, Wharton School of the University of Pennsylvania since 1993. Director of Wharton’s Pension Research Council and Boettner Center on Pensions & Retirement Research, and Research Associate at the National Bureau of Economic Research. Previously, Cornell University Professor from 1978 to 1993. | | Asset Allocation Trust |
| Timothy J. Penny (Born 1951) | | Trustee, since 1996 | | President and CEO of Southern Minnesota Initiative Foundation, a non-profit organization, since 2007 and Senior Fellow at the Humphrey Institute Policy Forum at the University of Minnesota since 1995. Member of the Board of Trustees of NorthStar Education Finance, Inc., a non-profit organization, since 2007. | | Asset Allocation Trust |
| | | | | | |
| Other information (unaudited) | | Wells Fargo Advantage Specialized Technology Fund | | | 25 | |
| | | | | | |
Name and
year of birth | | Position held and
length of service* | | Principal occupations during past five years or longer | | Other
directorships during
past five years |
| Michael S. Scofield (Born 1943) | | Trustee, since 2010 | | Served on the Investment Company Institute’s Board of Governors and Executive Committee from 2008-2011 as well the Governing Council of the Independent Directors Council from 2006-2011 and the Independent Directors Council Executive Committee from 2008-2011. Chairman of the IDC from 2008-2010. Institutional Investor (Fund Directions) Trustee of Year in 2007. Trustee of the Evergreen Funds complex (and its predecessors) from 1984 to 2010. Chairman of the Evergreen Funds from 2000-2010. Former Trustee of the Mentor Funds. Retired Attorney, Law Offices of Michael S. Scofield. | | Asset Allocation Trust |
| Donald C. Willeke (Born 1940) | | Trustee, since 1996 | | Principal of the law firm of Willeke & Daniels. General Counsel of the Minneapolis Employees Retirement Fund from 1984 until its consolidation into the Minnesota Public Employees Retirement Association on June 30, 2010. Director and Vice Chair of The Tree Trust (non-profit corporation). Director of the American Chestnut Foundation (non-profit corporation). | | Asset Allocation Trust |
| * | Length of service dates reflect the Trustee’s commencement of service with the Trust’s predecessor entities, where applicable. |
Officers
| | | | | | |
Name and
year of birth | | Position held and
length of service | | Principal occupations during past five years or longer | | |
Karla M. Rabusch
(Born 1959) | | President, since 2003 | | Executive Vice President of Wells Fargo Bank, N.A. and President of Wells Fargo Funds Management, LLC since 2003. | | |
Nancy Wiser1
(Born 1967) | | Treasurer, since 2012 | | Executive Vice President of Wells Fargo Funds Management, LLC since 2011. Chief Operating Officer and Chief Compliance Officer at LightBox Capital Management LLC, from 2008 to 2011. Owned and operated a consulting business providing services to various hedge funds including acting as Chief Operating Officer and Chief Compliance Officer for a hedge fund from 2007 to 2008. Chief Operating Officer and Chief Compliance Officer of GMN Capital LLC from 2006 to 2007. | | |
| C. David Messman (Born 1960) | | Secretary, since 2000; Chief Legal Officer, since 2003 | | Assistant General Counsel of Wells Fargo Bank, N.A. since 2013 and Vice President and Managing Counsel of Wells Fargo Bank N.A. from 1996 to 2013. Senior Vice President and Secretary of Wells Fargo Funds Management , LLC since 2001. | | |
Debra Ann Early
(Born 1964) | | Chief Compliance Officer, since 2007 | | Senior Vice President and Chief Compliance Officer of Wells Fargo Funds Management, LLC since 2007. Chief Compliance Officer of Parnassus Investments from 2005 to 2007. Chief Financial Officer of Parnassus Investments from 2004 to 2007. | | |
David Berardi
(Born 1975) | | Assistant Treasurer, since 2009 | | Vice President of Wells Fargo Funds Management, LLC since 2009. Vice President of Evergreen Investment Management Company, LLC from 2008 to 2010. Assistant Vice President of Evergreen Investment Services, Inc. from 2004 to 2008. Manager of Fund Reporting and Control for Evergreen Investment Management Company, LLC from 2004 to 2010. | | |
Jeremy DePalma1
(Born 1974) | | Assistant Treasurer, since 2009 | | Senior Vice President of Wells Fargo Funds Management, LLC since 2009. Senior Vice President of Evergreen Investment Management Company, LLC from 2008 to 2010. Vice President, Evergreen Investment Services, Inc. from 2004 to 2007. Head of the Fund Reporting and Control Team within Fund Administration from 2005 to 2010. | | |
| 1. | Nancy Wiser acts as Treasurer of 73 funds in the Fund Complex. Jeremy DePalma acts as Treasurer of 60 funds and Assistant Treasurer of 73 funds in the Fund Complex. |
| 2. | The Statement of Additional Information includes additional information about the Trustees and is available, without charge, upon request, by calling 1-800-222-8222 or by visiting the website at wellsfargoadvantagefunds.com. |
| | | | |
| 26 | | Wells Fargo Advantage Specialized Technology Fund | | Other information (unaudited) |
BOARD CONSIDERATION OF INVESTMENT ADVISORY AND SUB-ADVISORY AGREEMENTS:
Under Section 15 of the Investment Company Act of 1940 (the “1940 Act”), the Board of Trustees (the “Board”) of Wells Fargo Funds Trust (the “Trust”), all the members of which have no direct or indirect interest in the investment advisory and sub-advisory agreements and are not “interested persons” of the Trust, as defined in the 1940 Act (the “Independent Trustees”), must determine whether to approve the continuation of the Trust’s investment advisory and sub-advisory agreements. In this regard, at in-person meetings held on March 27-28, 2014 (the “March Meeting”) and May 15-16, 2014 (the “May Meeting”, and together with the March Meeting, the “Meetings”), the Board reviewed: (i) an investment advisory agreement with Wells Fargo Funds Management, LLC (“Funds Management”) for Wells Fargo Advantage Specialized Technology Fund (the “Fund”) and (ii) an investment sub-advisory agreement with Allianz Global Investors U.S. LLC (the “Sub-Adviser”) for the Fund. The investment advisory agreement with Funds Management and the investment sub-advisory agreement with the Sub-Adviser are collectively referred to as the “Advisory Agreements.”
At each of the March Meeting and the May Meeting, the Board received the information, considered the factors and reached the conclusions discussed below, and unanimously approved the renewal of the Advisory Agreements.
At the Meetings, the Board considered the factors and reached the conclusions described below relating to the selection of Funds Management and the Sub-Adviser and the continuation of the Advisory Agreements. Prior to the Meetings, the Trustees conferred extensively among themselves and with representatives of Funds Management about these matters. Also, the Board has adopted a team-based approach, with each team consisting of a sub-set of Trustees, to assist the full Board in the discharge of its duties in reviewing performance and other matters throughout the year. The Independent Trustees were assisted in their evaluation of the Advisory Agreements by independent legal counsel, from whom they received separate legal advice and with whom they met separately.
In providing information to the Board, Funds Management and the Sub-Adviser were guided by a detailed set of requests for information submitted to them by independent legal counsel on behalf of the Independent Trustees at the start of the Board’s annual contract renewal process earlier in 2014. In considering and approving the Advisory Agreements, the Trustees considered the information they believed relevant, including but not limited to the information discussed below. The Board considered not only the specific information presented in connection with the Meetings, but also the knowledge gained over time through interaction with Funds Management and the Sub-Adviser about various topics. In this regard, the Board reviewed reports of Funds Management at each of its quarterly meetings, which included, among other things, portfolio reviews and performance reports. In addition, the Board and the teams mentioned above confer with portfolio managers at various times throughout the year. The Board did not identify any particular information or consideration that was all-important or controlling, and each individual Trustee may have attributed different weights to various factors.
After its deliberations, the Board unanimously approved the continuation of the Advisory Agreements and determined that the compensation payable to Funds Management and the Sub-Adviser is reasonable. The Board considered the continuation of the Advisory Agreements for the Fund as part of its consideration of the continuation of advisory agreements for funds across the complex, but its approvals were made on a fund-by-fund basis. The following summarizes a number of important, but not necessarily all, factors considered by the Board in support of its approvals.
Nature, extent and quality of services
The Board received and considered various information regarding the nature, extent and quality of services provided to the Fund by Funds Management and the Sub-Adviser under the Advisory Agreements. This information included, among other things, a summary of the background and experience of senior management of Funds Management, and the qualifications, background, tenure and responsibilities of each of the portfolio managers primarily responsible for the day-to-day portfolio management of the Fund.
The Board evaluated the ability of Funds Management and the Sub-Adviser to attract and retain qualified investment professionals, including research, advisory and supervisory personnel. The Board further considered the compliance programs and compliance records of Funds Management and the Sub-Adviser. In addition, the Board took into account the full range of services provided to the Fund by Funds Management and its affiliates.
Fund performance and expenses
The Board considered the performance results for the Fund over various time periods ended December 31, 2013. The Board also considered these results in comparison to the performance of funds in a universe that was determined by Lipper Inc. (“Lipper”) to be similar to the Fund (the “Universe”), and in comparison to the Fund’s benchmark index and to other comparative data. Lipper is an independent provider of investment company data. The Board received a description of the methodology used by Lipper to select the mutual funds in the performance Universe. The Board noted
| | | | | | |
| Other information (unaudited) | | Wells Fargo Advantage Specialized Technology Fund | | | 27 | |
that the performance of the Fund (Class A) was higher than the average performance of the Universe for all periods under review. The Board also noted that the performance of the Fund was higher than its benchmark, the S&P North American Technology TR Index, for all periods under review except for the three-year period.
The Board also received and considered information regarding the Fund’s net operating expense ratios and their various components, including actual management fees (which reflect fee waivers, if any, and include advisory, administration and transfer agent fees), custodian and other non-management fees, Rule 12b-1 and non-Rule 12b-1 service fees and fee waiver and expense reimbursement arrangements. The Board considered these ratios in comparison to the median ratios of funds in class-specific expense groups that were determined by Lipper to be similar to the Fund (the “Groups”). The Board received a description of the methodology used by Lipper to select the mutual funds in the expense Groups and an explanation of year-to-year variations in the funds comprising such expense Groups and their expense ratios. Based on the Lipper reports, the Board noted that the net operating expense ratios of the Fund were in range of the median net operating expense ratios of the expense Groups, except for the Investor class which had a higher net operating expense ratio than the median of its expense Group. The Board viewed favorably Funds Management’s proposed to reduce the net operating expense caps for each share class of the Fund, including the Investor Class.
Based on its consideration of the factors and information it deemed relevant, including those described here, the Board concluded that the overall performance and expense structure of the Fund supported the re-approval of the Advisory Agreements.
Investment advisory and sub-advisory fee rates
The Board reviewed and considered the contractual investment advisory fee rates that are payable by the Fund to Funds Management for investment advisory services (the “Advisory Agreement Rates”), both on a stand-alone basis and on a combined basis with the Fund’s fund-level and class-level contractual administration fee rates (the “Management Rates”). The Board noted that the administration fees payable to Funds Management include transfer agency and sub-transfer agency costs. The Board also reviewed and considered the contractual investment sub-advisory fee rates that are payable by Funds Management to the Sub-Adviser for investment sub-advisory services (the “Sub-Advisory Agreement Rates”).
Among other information reviewed by the Board was a comparison of the Management Rates of the Fund with those of other funds in the expense Groups at a common asset level. The Board noted that the Management Rates of the Fund were higher than the average rates for the Fund’s expense Groups for the Investor Class and Class A, while the Management Rate for the Administrator Class was in range of the average rate for its expense Group. However, the Board viewed favorably Funds Management’s proposal to reduce the Advisory Agreement Rates for the Fund.
The Board also received and considered information about the portion of the total advisory fee that was retained by Funds Management after payment of the fee to the Sub-Adviser for sub-advisory services. The Board considered this amount in comparison to the median amount retained by advisers to funds in a sub-advised expense universe that was determined by Lipper to be similar to the Fund. In assessing the reasonableness of this amount, the Board received and evaluated information about the nature and extent of responsibilities retained and risks assumed by Funds Management and not delegated to or assumed by the Sub-Adviser, and about Funds Management’s on-going oversight services. The Board also considered that the sub-advisory fees paid to the Sub-Adviser had been negotiated by Funds Management on an arm’s length basis.
The Board also received and considered information about the nature and extent of services offered and fee rates charged by Funds Management and the Sub-Adviser to other types of clients with investment strategies similar to those of the Fund. In this regard, the Board received information about the significantly greater scope of services, and compliance, reporting and other legal burdens and risks of managing mutual funds compared with those associated with managing assets of non-mutual fund clients such as collective funds or institutional separate accounts.
Based on its consideration of the factors and information it deemed relevant, including those described here, the Board determined that the Advisory Agreement Rates and the Sub-Advisory Agreement Rates were reasonable in light of the services covered by the Advisory Agreements.
Profitability
The Board received and considered information concerning the profitability of Funds Management, as well as the profitability of Wells Fargo as a whole, from providing services to the Fund and the fund family as a whole. Funds Management explained the methodologies and estimates that it used in calculating profitability. Among other things, the Board noted that the levels of profitability reported on a fund-by-fund basis varied widely, depending on factors such as the size and type of fund. The Board did not consider profitability with respect to the Sub-Adviser, as the sub-advisory fees paid to the Sub-Adviser had been negotiated by Funds Management on an arm’s-length basis.
| | | | |
| 28 | | Wells Fargo Advantage Specialized Technology Fund | | Other information (unaudited) |
Based on its review, the Board did not deem the profits reported by Funds Management to be at a level that would prevent it from approving the continuation of the Advisory Agreements.
Economies of scale
With respect to possible economies of scale, the Board noted the existence of breakpoints in the Fund’s advisory fee and administration fee structure, which operate generally to reduce the Fund’s expense ratios as the Fund grows in size. It considered that, for a small fund or a fund that shrinks in size, breakpoints conversely can result in higher fee levels. The Board also considered that fee waiver and expense reimbursement arrangements and competitive fee rates at the outset are means of sharing potential economies of scale with shareholders of the Fund and the fund family as a whole. The Board considered Funds Management’s view that any analyses of potential economies of scale in managing a particular fund are inherently limited in light of the joint and common costs and investments that Funds Management incurs across the fund family as a whole.
The Board concluded that the Fund’s fee and expense arrangements, including contractual breakpoints, constituted a reasonable approach to sharing potential economies of scale with the Fund and its shareholders.
Other benefits to Funds Management and the Sub-Adviser
The Board received and considered information regarding potential “fall-out” or ancillary benefits received by Funds Management, the Sub-Adviser, and their affiliates as a result of their relationships with the Fund. Ancillary benefits could include, among others, benefits directly attributable to other relationships with the Fund and benefits potentially derived from an increase in Funds Management’s and the Sub-Adviser’s business as a result of their relationships with the Fund. The Board noted that various affiliates of Funds Management may receive distribution-related fees, shareholder servicing payments and sub-transfer agency fees in respect of shares sold or held through them and services provided.
The Board also reviewed information about soft dollar credits earned and utilized by the Sub-Adviser, fees earned by Funds Management and the Sub-Adviser from managing a private investment vehicle for the fund family’s securities lending collateral and commissions earned by an affiliated broker from portfolio transactions.
Based on its consideration of the factors and information it deemed relevant, including those described here, the Board did not find that any ancillary benefits received by Funds Management, the Sub-Adviser, and their affiliates were unreasonable.
Conclusion
After considering the above-described factors and based on its deliberations and its evaluation of the information described above, the Board unanimously approved the continuation of the Advisory Agreements for an additional one-year period and determined that the compensation payable to Funds Management and the Sub-Adviser is reasonable.
| | | | | | |
| List of abbreviations | | Wells Fargo Advantage Specialized Technology Fund | | | 29 | |
The following is a list of common abbreviations for terms and entities that may have appeared in this report.
| ACA | — ACA Financial Guaranty Corporation |
| ADR | — American depositary receipt |
| ADS | — American depositary shares |
| AGC | — Assured Guaranty Corporation |
| AGM | — Assured Guaranty Municipal |
| Ambac | — Ambac Financial Group Incorporated |
| AMT | — Alternative minimum tax |
| BAN | — Bond anticipation notes |
| BHAC | — Berkshire Hathaway Assurance Corporation |
| CAB | — Capital appreciation bond |
| CCAB | — Convertible capital appreciation bond |
| CDA | — Community Development Authority |
| CDO | — Collateralized debt obligation |
| DRIVER | — Derivative inverse tax-exempt receipts |
| DW&P | — Department of Water & Power |
| DWR | — Department of Water Resources |
| ECFA | — Educational & Cultural Facilities Authority |
| EDA | — Economic Development Authority |
| EDFA | — Economic Development Finance Authority |
| ETF | — Exchange-traded fund |
| FDIC | — Federal Deposit Insurance Corporation |
| FFCB | — Federal Farm Credit Banks |
| FGIC | — Financial Guaranty Insurance Corporation |
| FHA | — Federal Housing Administration |
| FHLB | — Federal Home Loan Bank |
| FHLMC | — Federal Home Loan Mortgage Corporation |
| FICO | — The Financing Corporation |
| FNMA | — Federal National Mortgage Association |
| GDR | — Global depositary receipt |
| GNMA | — Government National Mortgage Association |
| HCFR | — Healthcare facilities revenue |
| HEFA | — Health & Educational Facilities Authority |
| HEFAR | — Higher education facilities authority revenue |
| HFA | — Housing Finance Authority |
| HFFA | — Health Facilities Financing Authority |
| HUD | — Department of Housing and Urban Development |
| IDA | — Industrial Development Authority |
| IDAG | — Industrial Development Agency |
| KRW | — Republic of Korea won |
| LIBOR | — London Interbank Offered Rate |
| LLC | — Limited liability company |
| LLLP | — Limited liability limited partnership |
| LLP | — Limited liability partnership |
| MBIA | — Municipal Bond Insurance Association |
| MFHR | — Multifamily housing revenue |
| MSTR | — Municipal securities trust receipts |
| MUD | — Municipal Utility District |
| National | — National Public Finance Guarantee Corporation |
| PCFA | — Pollution Control Financing Authority |
| PCL | — Public Company Limited |
| PCR | — Pollution control revenue |
| PFA | — Public Finance Authority |
| PFFA | — Public Facilities Financing Authority |
| PFOTER | — Puttable floating option tax-exempt receipts |
| plc | — Public limited company |
| PUTTER | — Puttable tax-exempt receipts |
| R&D | — Research & development |
| Radian | — Radian Asset Assurance |
| RAN | — Revenue anticipation notes |
| RDA | — Redevelopment Authority |
| RDFA | — Redevelopment Finance Authority |
| REIT | — Real estate investment trust |
| ROC | — Reset option certificates |
| SAVRS | — Select auction variable rate securities |
| SBA | — Small Business Authority |
| SFHR | — Single-family housing revenue |
| SFMR | — Single-family mortgage revenue |
| SPA | — Standby purchase agreement |
| SPDR | — Standard & Poor’s Depositary Receipts |
| STRIPS | — Separate trading of registered interest and principal securities |
| TAN | — Tax anticipation notes |
| TIPS | — Treasury inflation-protected securities |
| TRAN | — Tax revenue anticipation notes |
| TTFA | — Transportation Trust Fund Authority |
| TVA | — Tennessee Valley Authority |
This page is intentionally left blank.
This page is intentionally left blank.
This page is intentionally left blank.


For more information
More information about Wells Fargo Advantage Funds is available free upon request. To obtain literature, please write, email, visit the Fund’s website, or call:
Wells Fargo Advantage Funds
P.O. Box 8266
Boston, MA 02266-8266
Email: wfaf@wellsfargo.com
Website: wellsfargoadvantagefunds.com
Individual investors: 1-800-222-8222
Retail investment professionals: 1-888-877-9275
Institutional investment professionals: 1-866-765-0778
This report and the financial statements contained herein are submitted for the general information of the shareholders of Wells Fargo Advantage Funds. If this report is used for promotional purposes, distribution of the report must be accompanied or preceded by a current prospectus. Before investing, please consider the investment objectives, risks, charges, and expenses of the investment. For a current prospectus and, if available, a summary prospectus, containing this information, call 1-800-222-8222 or visit the Fund’s website at wellsfargoadvantagefunds.com. Read the prospectus carefully before you invest or send money.
Wells Fargo Funds Management, LLC, a wholly owned subsidiary of Wells Fargo & Company, provides investment advisory and administrative services for Wells Fargo Advantage Funds. Other affiliates of Wells Fargo & Company provide subadvisory and other services for the Funds. The Funds are distributed by Wells Fargo Funds Distributor, LLC, Member FINRA/SIPC, an affiliate of Wells Fargo & Company.
NOT FDIC INSURED ¡ NO BANK GUARANTEE ¡ MAY LOSE VALUE
© 2014 Wells Fargo Funds Management, LLC. All rights reserved.
| | |
 | | 228305 11-14 SA317/SAR317 09-14 |

Wells Fargo Advantage Utility and Telecommunications Fund

Semi-Annual Report
September 30, 2014

Reduce clutter. Save trees.
Sign up for electronic delivery of prospectuses and shareholder reports at wellsfargo.com/advantagedelivery
Contents
The views expressed and any forward-looking statements are as of September 30, 2014, unless otherwise noted, and are those of the Fund managers and/or Wells Fargo Funds Management, LLC. Discussions of individual securities, or the markets generally, or any Wells Fargo Advantage Fund are not intended as individual recommendations. Future events or results may vary significantly from those expressed in any forward-looking statements; the views expressed are subject to change at any time in response to changing circumstances in the market. Wells Fargo Funds Management, LLC and the Fund disclaim any obligation to publicly update or revise any views expressed or forward-looking statements.
NOT FDIC INSURED ¡ NO BANK GUARANTEE ¡ MAY LOSE VALUE
| | | | |
| 2 | | Wells Fargo Advantage Utility and Telecommunications Fund | | Letter to shareholders (unaudited) |

Karla M. Rabusch
President
Wells Fargo Advantage Funds
Dear Valued Shareholder:
We are pleased to offer you this semi-annual report for the Wells Fargo Advantage Utility and Telecommunications Fund for the six-month period that ended September 30, 2014. The broad U.S. stock market delivered positive results overall for this period.
2014’s fitful start gave way to a rally that carried through the second quarter of 2014.
Following a difficult first quarter for the U.S. economy—when unusually harsh weather kept consumers at home and disrupted business activities—the second quarter of 2014 brought warmer temperatures, and the U.S. economy picked up steam. Investors were heartened by encouraging economic data, driving stocks higher. In Europe, signs of economic improvement faded when gross domestic product (GDP) stagnated during the second quarter. Although select peripheral countries, such as Spain and Portugal, provided bright spots, some of Europe’s larger economies were pressured by weak economic growth and potential deflation. European stock returns generally were positive, but lackluster.
U.S. Federal Reserve (Fed) officials continued winding down their bond-buying program during the second quarter, leaving it on pace to likely end this year. They also revisited the question of when to begin raising short-term interest rates from near zero and released new projections showing rates rising more than previously expected in 2015 and 2016, but—on a positive note—they slightly reduced their outlook for rates over the longer term. The markets took this information in stride, with both U.S. stocks and bonds rallying.
Positive U.S. economic data—but increased tensions abroad—led to heightened volatility in the third quarter of 2014.
The third quarter brought a series of stock market surges that were interrupted by bouts of volatility as interest-rate concerns in the U.S. and increased tensions abroad triggered heightened investor uncertainty. In July, an escalating Russia/Ukraine situation and a growing perception that the Fed would raise short-term interest rates sooner than expected caused investors to pull back toward month-end; as a result, the S&P 500 Index1 dropped into negative territory for its overall monthly return. However, August brought a bounce-back—the S&P 500 Index delivered its largest monthly gain since February 2014 on a string of positive economic news, led by an upwardly revised 4.2% estimate of second-quarter 2014 GDP growth. Then, in September, the stock market tended to rise, then swoon, then rise as positive economic data became overshadowed at times by growing discomfort over escalating tensions in Ukraine and the Middle East. Signs of slowing growth in Europe and China also concerned investors. Ultimately, U.S. stocks ended the third quarter up slightly overall, buoyed largely by another upward revision of second-quarter GDP growth (to 4.6%). Strong corporate earnings also contributed to market gains, with a large number of U.S. companies exceeding consensus estimates for both revenues and earnings per share.
| 1. | The S&P 500 Index consists of 500 stocks chosen for market size, liquidity, and industry group representation. It is a market-value-weighted index with each stock’s weight in the index proportionate to its market value. You cannot invest directly in an index. |
| | | | | | |
| Letter to shareholders (unaudited) | | Wells Fargo Advantage Utility and Telecommunications Fund | | | 3 | |
In contrast to the U.S., the third quarter brought news that the eurozone economy stalled in the second quarter. The weak economy has caused European consumers and businesses to continue to lose confidence. Despite new stimulus measures announced by the European Central Bank in early September, businesses and consumers across the 18 countries that share the euro appeared gloomier about their prospects in September 2014 than at any time since the end of 2013.
Utilities and telecommunication services stocks posted positive results for the six-month reporting period overall.
Utilities stocks, in particular, delivered relatively strong results compared with the broader market from the beginning of the reporting period (April 1, 2014) through the end of June 2014. In the low-yielding environment for bonds, these stocks were a big draw for investors seeking yield. They also drew investors who were seeking more defensive investments. Utilities stocks were especially desirable because historically many tended to deliver steady revenues and profits as a result of their regulated businesses. Telecommunication services stocks continued to post positive returns through the remainder of the reporting period (which ended September 30, 2014). However, utilities stocks did not; from roughly the end of June through the end of the reporting period, utilities stocks declined. This downturn coincided with a drop in natural gas prices, which stayed depressed over the rest of the reporting period due largely to cooler-than-expected temperatures, which led to minimal use of gas-powered air conditioners, and robust oil drilling in the U.S. that boosted the supply of natural gas in a low-demand environment. Despite their third-quarter weakness, utilities stocks posted positive results for the six-month reporting period overall.
We employ a diverse array of investment strategies even as many variables are at work in the market.
Periods of uncertainty can present challenges, but experience has taught us that maintaining long-term investment goals can be an effective way to plan for the future. To help you create a sound strategy based on your personal goals and risk tolerance, Wells Fargo Advantage Funds offers more than 100 mutual funds and other investments spanning a wide range of asset classes and investment styles. Although diversification cannot guarantee an investment profit or prevent losses, we believe it can be an effective way to manage investment risk and potentially smooth out overall portfolio performance. We encourage investors to know their investments and to understand that appropriate levels of risk-taking may unlock opportunities.
Thank you for choosing to invest with Wells Fargo Advantage Funds. We appreciate your confidence in us and remain committed to helping you meet your financial needs. For current information about your fund investments, contact your investment professional, visit our website at wellsfargoadvantagefunds.com, or call us directly at 1-800-222-8222. We are available 24 hours a day, 7 days a week.
Sincerely,

Karla M. Rabusch
President
Wells Fargo Advantage Funds
Utilities and telecommunication services stocks posted positive results for the six-month reporting period overall.
Periods of uncertainty can present challenges, but experience has taught us that maintaining long-term investment goals can be an effective way to plan for the future.
| | | | |
| 4 | | Wells Fargo Advantage Utility and Telecommunications Fund | | Performance highlights (unaudited) |
Investment objective
The Fund seeks total return, consisting of current income and capital appreciation.
Adviser
Wells Fargo Funds Management, LLC
Subadviser
Crow Point Partners, LLC
Portfolio manager
Timothy P. O’Brien, CFA
Average annual total returns1 (%) as of September 30, 2014
| | | | | | | | | | | | | | | | | | | | | | | | | | | | | | | | | | |
| | | | | Including sales charge | | | Excluding sales charge | | | Expense ratios2 (%) | |
| | | Inception date | | 1 year | | | 5 year | | | 10 year | | | 1 year | | | 5 year | | | 10 year | | | Gross | | | Net3 | |
| Class A (EVUAX) | | 1-4-1994 | | | 4.78 | | | | 10.70 | | | | 10.23 | | | | 11.17 | | | | 12.02 | | | | 10.88 | | | | 1.23 | | | | 1.15 | |
| Class B (EVUBX)* | | 1-4-1994 | | | 5.33 | | | | 10.93 | | | | 10.31 | | | | 10.33 | | | | 11.20 | | | | 10.31 | | | | 1.98 | | | | 1.90 | |
| Class C (EVUCX) | | 9-2-1994 | | | 9.33 | | | | 11.19 | | | | 10.06 | | | | 10.33 | | | | 11.19 | | | | 10.06 | | | | 1.98 | | | | 1.90 | |
| Administrator Class (EVUDX) | | 7-30-2010 | | | – | | | | – | | | | – | | | | 11.45 | | | | 12.23 | | | | 11.03 | | | | 1.07 | | | | 0.96 | |
| Institutional Class (EVUYX) | | 2-28-1994 | | | – | | | | – | | | | – | | | | 11.44 | | | | 12.37 | | | | 11.19 | | | | 0.80 | | | | 0.79 | |
| S&P Utilities Index4 | | – | | | – | | | | – | | | | – | | | | 17.13 | | | | 12.13 | | | | 9.54 | | | | – | | | | – | |
| S&P 500 Index5 | | – | | | – | | | | – | | | | – | | | | 19.73 | | | | 15.70 | | | | 8.11 | | | | – | | | | – | |
| * | | Class B shares are closed to investment, except in connection with the reinvestment of any distributions and permitted exchanges. |
Figures quoted represent past performance, which is no guarantee of future results, and do not reflect taxes that a shareholder may pay on fund distributions or the redemption of fund shares. Investment return and principal value of an investment will fluctuate so that an investor’s shares, when redeemed, may be worth more or less than their original cost. Performance shown without sales charges would be lower if sales charges were reflected. Current performance may be lower or higher than the performance data quoted, which assumes the reinvestment of dividends and capital gains. Current month-end performance is available on the Fund’s website, wellsfargoadvantagefunds.com.
Index returns do not include transaction costs associated with buying and selling securities, any mutual fund fees or expenses, or any taxes. It is not possible to invest directly in an index.
For Class A shares, the maximum front-end sales charge is 5.75%. For Class B shares, the maximum contingent deferred sales charge is 5.00%. For Class C shares, the maximum contingent deferred sales charge is 1.00%. Performance including a contingent deferred sales charge assumes the sales charge for the corresponding time period. Administrator Class and Institutional Class shares are sold without a front-end sales charge or contingent deferred sales charge.
Stock values fluctuate in response to the activities of individual companies and general market and economic conditions. Bond values fluctuate in response to the financial condition of individual issuers, general market and economic conditions, and changes in interest rates. In general, when interest rates rise, bond values fall and investors may lose principal value. The use of derivatives may reduce returns and/or increase volatility. Funds that concentrate their investments in limited sectors, such as utilities and telecommunications, may be susceptible to financial, economic, or market events affecting those sectors. Certain investment strategies tend to increase the total risk of an investment (relative to the broader market). The Fund is exposed to convertible securities risk, foreign investment risk, high-yield securities risk, non-diversification risk, smaller-company securities risk, and subsidiary risk. Consult the Fund’s prospectus for additional information on these and other risks.
Please see footnotes on page 5.
| | | | | | |
| Performance highlights (unaudited) | | Wells Fargo Advantage Utility and Telecommunications Fund | | | 5 | |
| | | | |
| Ten largest equity holdings6 (%) as of September 30, 2014 | |
Edison International | | | 5.25 | |
Sempra Energy | | | 5.19 | |
NextEra Energy Incorporated | | | 5.07 | |
ITC Holdings Corporation | | | 5.02 | |
Northeast Utilities | | | 4.68 | |
CMS Energy Corporation | | | 4.52 | |
Visa Incorporated Class A | | | 4.51 | |
National Fuel Gas Company | | | 4.11 | |
Alliant Energy Corporation | | | 3.90 | |
PNM Resources Incorporated | | | 3.51 | |
| | |
| Industry distribution7 as of September 30, 2014 |
|
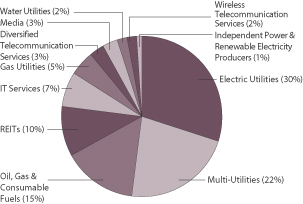 |
| 1. | Historical performance shown for Administrator Class shares prior to their inception reflects the performance of Institutional Class shares and has been adjusted to reflect the higher expenses applicable to Administrator Class shares. Historical performance shown for all classes of the Fund prior to July 19, 2010, is based on the performance of the Fund’s predecessor, Evergreen Utility and Telecommunications Fund. |
| 2. | Reflects the expense ratios as stated in the most recent prospectuses, which include the impact of 0.01% in acquired fund fees and expenses. The expense ratios shown are subject to change and may differ from the annualized expense ratios shown in the financial highlights of this report, which do not include acquired fund fees and expenses. |
| 3. | The Adviser has committed through July 31, 2015, to waive fees and/or reimburse expenses to the extent necessary to cap the Fund’s Total Annual Fund Operating Expenses After Fee Waiver, excluding certain expenses, at 1.14% for Class A, 1.89% for Class B, 1.89% for Class C, 0.95% for Administrator Class, and 0.78% for Institutional Class. After this time, the cap may be increased or the commitment to maintain the cap may be terminated only with the approval of the Board of Trustees. Brokerage commissions, stamp duty fees, interest, taxes, acquired fund fees and expenses, and extraordinary expenses are excluded from the cap. Without this cap, the Fund’s returns would have been lower. |
| 4. | The S&P Utilities Index is a market-value-weighted index, measuring the performance of all stocks within the utility sector of the S&P 500 Index. You cannot invest directly in an index. |
| 5. | The S&P 500 Index consists of 500 stocks chosen for market size, liquidity, and industry group representation. It is a market-value weighted index with each stock’s weight in the index proportionate to its market value. You cannot invest directly in an index. |
| 6. | The ten largest equity holdings are calculated based on the value of the securities divided by total net assets of the Fund. Holdings are subject to change and may have changed since the date specified. |
| 7. | Industry distribution is subject to change and is calculated based on the total long-term investments of the Fund. |
| | | | |
| 6 | | Wells Fargo Advantage Utility and Telecommunications Fund | | Fund expenses (unaudited) |
As a shareholder of the Fund, you incur two types of costs: (1) transaction costs, including sales charges (loads) on purchase payments and contingent deferred sales charges (if any) on redemptions and (2) ongoing costs, including management fees, distribution (12b-1) and/or shareholder service fees, and other Fund expenses. This example is intended to help you understand your ongoing costs (in dollars) of investing in the Fund and to compare these costs with the ongoing costs of investing in other mutual funds.
The example is based on an investment of $1,000 invested at the beginning of the six-month period and held for the entire period from April 1, 2014 to September 30, 2014.
Actual expenses
The “Actual” line of the table below provides information about actual account values and actual expenses. You may use the information in this line, together with the amount you invested, to estimate the expenses that you paid over the period. Simply divide your account value by $1,000 (for example, an $8,600 account value divided by $1,000 = 8.6), then multiply the result by the number in the “Actual” line under the heading entitled “Expenses paid during period” for your applicable class of shares to estimate the expenses you paid on your account during this period.
Hypothetical example for comparison purposes
The “Hypothetical” line of the table below provides information about hypothetical account values and hypothetical expenses based on the Fund’s actual expense ratio and an assumed rate of return of 5% per year before expenses, which is not the Fund’s actual return. The hypothetical account values and expenses may not be used to estimate the actual ending account balance or expenses you paid for the period. You may use this information to compare the ongoing costs of investing in the Fund and other funds. To do so, compare this 5% hypothetical example with the 5% hypothetical examples that appear in the shareholder reports of the other funds.
Please note that the expenses shown in the table are meant to highlight your ongoing costs only and do not reflect any transactional costs, such as sales charges (loads) and contingent deferred sales charges. Therefore, the “Hypothetical” line of the table is useful in comparing ongoing costs only and will not help you determine the relative total costs of owning different funds. In addition, if these transactional costs were included, your costs would have been higher.
| | | | | | | | | | | | | | | | |
| | | Beginning
account value
4-1-2014 | | | Ending
account value
9-30-2014 | | | Expenses
paid during
the period¹ | | | Net annualized
expense ratio | |
Class A | | | | | | | | | | | | | | | | |
Actual | | $ | 1,000.00 | | | $ | 992.22 | | | $ | 5.69 | | | | 1.14 | % |
Hypothetical (5% return before expenses) | | $ | 1,000.00 | | | $ | 1,019.35 | | | $ | 5.77 | | | | 1.14 | % |
Class B | | | | | | | | | | | | | | | | |
Actual | | $ | 1,000.00 | | | $ | 988.23 | | | $ | 9.42 | | | | 1.89 | % |
Hypothetical (5% return before expenses) | | $ | 1,000.00 | | | $ | 1,015.59 | | | $ | 9.55 | | | | 1.89 | % |
Class C | | | | | | | | | | | | | | | | |
Actual | | $ | 1,000.00 | | | $ | 988.53 | | | $ | 9.42 | | | | 1.89 | % |
Hypothetical (5% return before expenses) | | $ | 1,000.00 | | | $ | 1,015.59 | | | $ | 9.55 | | | | 1.89 | % |
Administrator Class | | | | | | | | | | | | | | | | |
Actual | | $ | 1,000.00 | | | $ | 993.22 | | | $ | 4.75 | | | | 0.95 | % |
Hypothetical (5% return before expenses) | | $ | 1,000.00 | | | $ | 1,020.31 | | | $ | 4.81 | | | | 0.95 | % |
Institutional Class | | | | | | | | | | | | | | | | |
Actual | | $ | 1,000.00 | | | $ | 992.40 | | | $ | 3.90 | | | | 0.78 | % |
Hypothetical (5% return before expenses) | | $ | 1,000.00 | | | $ | 1,021.16 | | | $ | 3.95 | | | | 0.78 | % |
| 1. | Expenses paid is equal to the annualized expense ratio of each class multiplied by the average account value over the period, multiplied by the number of days in the most recent fiscal half-year divided by the number of days in the fiscal year (to reflect the one-half-year period). |
| | | | | | |
| Portfolio of investments—September 30, 2014 (unaudited) | | Wells Fargo Advantage Utility and Telecommunications Fund | | | 7 | |
| | | | | | | | | | | | |
| Security name | | | | | | Shares | | | Value | |
| | | | | | | | | | | | |
| | | | |
Common Stocks: 95.30% | | | | | | | | | | | | |
| | | | |
Consumer Discretionary: 2.84% | | | | | | | | | | | | |
| | | | |
| Media: 2.84% | | | | | | | | | | | | |
Comcast Corporation Class A | | | | | | | 225,100 | | | $ | 12,105,878 | |
| | | | | | | | | | | | |
| | | | |
Energy: 13.14% | | | | | | | | | | | | |
| | | | |
| Oil, Gas & Consumable Fuels: 13.14% | | | | | | | | | | | | |
American Eagle Energy Corporation † | | | | | | | 320,000 | | | | 1,302,400 | |
Energen Corporation | | | | | | | 100,000 | | | | 7,224,000 | |
EQT Corporation | | | | | | | 58,600 | | | | 5,364,244 | |
EQT Midstream Partners LP | | | | | | | 100,000 | | | | 8,961,000 | |
Magnum Hunter Resources Corporation †« | | | | | | | 1,400,000 | | | | 7,798,000 | |
QR Energy LP | | | | | | | 85,002 | | | | 1,650,739 | |
The Williams Companies Incorporated | | | | | | | 270,000 | | | | 14,944,500 | |
Veresen Incorporated | | | | | | | 575,000 | | | | 8,743,471 | |
| | | | |
| | | | | | | | | | | 55,988,354 | |
| | | | | | | | | | | | |
| | | | |
Financials: 9.70% | | | | | | | | | | | | |
| | | | |
| REITs: 9.70% | | | | | | | | | | | | |
Ashford Hospitality Trust | | | | | | | 1,280,500 | | | | 13,086,710 | |
Chatham Lodging Trust | | | | | | | 600,000 | | | | 13,848,000 | |
Preferred Apartment Communities Incorporated | | | | | | | 750,000 | | | | 6,240,000 | |
Strategic Hotel & Resorts Incorporated † | | | | | | | 700,000 | | | | 8,155,000 | |
| | | | |
| | | | | | | | | | | 41,329,710 | |
| | | | | | | | | | | | |
| | | | |
Industrials: 0.10% | | | | | | | | | | | | |
| | | | |
| Construction & Engineering: 0.05% | | | | | | | | | | | | |
Ameresco Incorporated Class A † | | | | | | | 35,000 | | | | 239,750 | |
| | | | | | | | | | | | |
| | | | |
| Professional Services: 0.05% | | | | | | | | | | | | |
Hill International Incorporated † | | | | | | | 49,400 | | | | 197,600 | |
| | | | | | | | | | | | |
| | | | |
Information Technology: 6.40% | | | | | | | | | | | | |
| | | | |
| IT Services: 6.40% | | | | | | | | | | | | |
Convergys Corporation | | | | | | | 120,968 | | | | 2,155,650 | |
MasterCard Incorporated Class A | | | | | | | 80,000 | | | | 5,913,600 | |
Visa Incorporated Class A | | | | | | | 90,000 | | | | 19,203,300 | |
| | | | |
| | | | | | | | | | | 27,272,550 | |
| | | | | | | | | | | | |
| | | | |
Telecommunication Services: 5.01% | | | | | | | | | | | | |
| | | | |
| Diversified Telecommunication Services: 2.65% | | | | | | | | | | | | |
AT&T Incorporated | | | | | | | 150,000 | | | | 5,286,000 | |
CenturyLink Incorporated | | | | | | | 25,000 | | | | 1,022,250 | |
Verizon Communications Incorporated | | | | | | | 100,000 | | | | 4,999,000 | |
| | | | |
| | | | | | | | | | | 11,307,250 | |
| | | | | | | | | | | | |
The accompanying notes are an integral part of these financial statements.
| | | | |
| 8 | | Wells Fargo Advantage Utility and Telecommunications Fund | | Portfolio of investments—September 30, 2014 (unaudited) |
| | | | | | | | | | | | | | | | |
| Security name | | | | | | | | Shares | | | Value | |
| | | | | | | | | | | | | | | | |
| | | | |
| Wireless Telecommunication Services: 2.36% | | | | | | | | | | | | | | | | |
Shenandoah Telecommunications Company | | | | | | | | | | | 300,000 | | | $ | 7,443,000 | |
Turkcell Iletisim Hizmetleri AS ADR † | | | | | | | | | | | 200,000 | | | | 2,628,000 | |
| | | | |
| | | | | | | | | | | | | | | 10,071,000 | |
| | | | | | | | | | | | | | | | |
| | | | |
Utilities: 58.11% | | | | | | | | | | | | | | | | |
| | | | |
| Electric Utilities: 28.98% | | | | | | | | | | | | | | | | |
ALLETE Incorporated | | | | | | | | | | | 10,000 | | | | 443,900 | |
American Electric Power Company Incorporated | | | | | | | | | | | 175,000 | | | | 9,136,750 | |
Edison International | | | | | | | | | | | 400,000 | | | | 22,368,000 | |
Great Plains Energy Incorporated | | | | | | | | | | | 400,000 | | | | 9,668,000 | |
IDACORP Incorporated | | | | | | | | | | | 75,000 | | | | 4,020,750 | |
ITC Holdings Corporation | | | | | | | | | | | 600,000 | | | | 21,378,000 | |
NextEra Energy Incorporated | | | | | | | | | | | 230,000 | | | | 21,592,400 | |
Northeast Utilities | | | | | | | | | | | 450,000 | | | | 19,935,000 | |
PNM Resources Incorporated | | | | | | | | | | | 600,000 | | | | 14,946,000 | |
| | | | |
| | | | | | | | | | | | | | | 123,488,800 | |
| | | | | | | | | | | | | | | | |
| | | | |
| Gas Utilities: 4.76% | | | | | | | | | | | | | | | | |
National Fuel Gas Company | | | | | | | | | | | 250,000 | | | | 17,497,500 | |
SNAM Rete Gas SpA | | | | | | | | | | | 500,000 | | | | 2,766,080 | |
| | | | |
| | | | | | | | | | | | | | | 20,263,580 | |
| | | | | | | | | | | | | | | | |
| | | | |
| Independent Power & Renewable Electricity Producers: 1.27% | | | | | | | | | | | | | | | | |
Calpine Corporation † | | | | | | | | | | | 250,000 | | | | 5,425,000 | |
| | | | | | | | | | | | | | | | |
| | | | |
| Multi-Utilities: 20.84% | | | | | | | | | | | | | | | | |
Alliant Energy Corporation | | | | | | | | | | | 300,000 | | | | 16,623,000 | |
CenterPoint Energy Incorporated | | | | | | | | | | | 250,000 | | | | 6,117,500 | |
CMS Energy Corporation | | | | | | | | | | | 650,000 | | | | 19,279,000 | |
Dominion Resources Incorporated | | | | | | | | | | | 175,000 | | | | 12,090,750 | |
Northwestern Corporation | | | | | | | | | | | 102,411 | | | | 4,645,363 | |
Public Service Enterprise Group Incorporated | | | | | | | | | | | 200,000 | | | | 7,448,000 | |
SCANA Corporation | | | | | | | | | | | 10,060 | | | | 499,076 | |
Sempra Energy | | | | | | | | | | | 210,000 | | | | 22,129,800 | |
| | | | |
| | | | | | | | | | | | | | | 88,832,489 | |
| | | | | | | | | | | | | | | | |
| | | | |
| Water Utilities: 2.26% | | | | | | | | | | | | | | | | |
American Water Works Company Incorporated | | | | | | | | | | | 200,000 | | | | 9,646,000 | |
| | | | | | | | | | | | | | | | |
| | | | |
Total Common Stocks (Cost $264,900,333) | | | | | | | | | | | | | | | 406,167,961 | |
| | | | | | | | | | | | | | | | |
| | | | |
| | | Interest rate | | | Maturity date | | | Principal | | | | |
| Corporate Bonds and Notes: 1.15% | | | | | | | | | | | | | | | | |
| | | | |
Energy: 1.15% | | | | | | | | | | | | | | | | |
| | | | |
| Oil, Gas & Consumable Fuels: 1.15% | | | | | | | | | | | | | | | | |
Energy & Exploration Partners Incorporated | | | 8.00 | % | | | 7-1-2019 | | | $ | 5,000,000 | | | | 4,900,000 | |
| | | | | | | | | | | | | | | | |
| | | | |
Total Corporate Bonds and Notes (Cost $5,000,000) | | | | | | | | | | | | | | | 4,900,000 | |
| | | | | | | | | | | | | | | | |
The accompanying notes are an integral part of these financial statements.
| | | | | | |
| Portfolio of investments—September 30, 2014 (unaudited) | | Wells Fargo Advantage Utility and Telecommunications Fund | | | 9 | |
| | | | | | | | | | | | | | | | |
| Security name | | | | | Expiration date | | | Shares | | | Value | |
| | | | | | | | | | | | | | | | |
| | | | |
Warrants: 0.42% | | | | | | | | | | | | | | | | |
| | | | |
Energy: 0.42% | | | | | | | | | | | | | | | | |
| | | | |
| Oil, Gas & Consumable Fuels: 0.42% | | | | | | | | | | | | | | | | |
Kinder Morgan Incorporated † | | | | | | | 5-25-2017 | | | | 496,000 | | | $ | 1,805,440 | |
Magnum Hunter Resources Corporation †(a)« | | | | | | | 4-15-2016 | | | | 140,000 | | | | 0 | |
| | | | |
Total Warrants (Cost $553,300) | | | | | | | | | | | | | | | 1,805,440 | |
| | | | | | | | | | | | | | | | |
| | | | |
| | | Yield | | | | | | | | | | |
| Short-Term Investments: 2.74% | | | | | | | | | | | | | | | | |
| | | | |
| Investment Companies: 2.74% | | | | | | | | | | | | | | | | |
Wells Fargo Advantage Cash Investment Money Market Fund, Select Class (l)(u) | | | 0.07 | % | | | | | | | 7,969,130 | | | | 7,969,130 | |
Wells Fargo Securities Lending Cash Investments, LLC (l)(u)(r) | | | 0.11 | | | | | | | | 3,697,500 | | | | 3,697,500 | |
| | | | |
Total Short-Term Investments (Cost $11,666,630) | | | | | | | | | | | | | | | 11,666,630 | |
| | | | | | | | | | | | | | | | |
| | | | | | | | |
| Total investments in securities | | | | | | | | |
| (Cost $282,120,263) * | | | 99.61 | % | | | 424,540,031 | |
Other assets and liabilities, net | | | 0.39 | | | | 1,651,427 | |
| | | | | | | | |
| Total net assets | | | 100.00 | % | | $ | 426,191,458 | |
| | | | | | | | |
| † | Non-income-earning security |
| « | All or a portion of this security is on loan. |
| (a) | The security is fair valued by the Management Valuation Team, and in certain instances by the Board of Trustees, in accordance with procedures approved by the Board of Trustees. |
| (l) | The security represents an affiliate of the Fund as defined in the Investment Company Act of 1940. |
| (u) | The rate represents the 7-day annualized yield at period end. |
| (r) | The investment is a non-registered investment vehicle purchased with cash collateral received from securities on loan. |
| * | Cost for federal income tax purposes is $281,886,436 and unrealized gains (losses) consists of: |
| | | | |
Gross unrealized gains | | $ | 147,689,056 | |
Gross unrealized losses | | | (5,035,461 | ) |
| | | | |
Net unrealized gains | | $ | 142,653,595 | |
The accompanying notes are an integral part of these financial statements.
| | | | |
| 10 | | Wells Fargo Advantage Utility and Telecommunications Fund | | Statement of assets and liabilities—September 30, 2014 (unaudited) |
| | | | |
| | | | |
| |
Assets | | | | |
Investments | | | | |
In unaffiliated securities (including $3,491,770 of securities loaned), at value (cost $270,453,633) | | $ | 412,873,401 | |
In affiliated securities, at value (cost $11,666,630) | | | 11,666,630 | |
| | | | |
Total investments, at value (cost $282,120,263) | | | 424,540,031 | |
Cash | | | 7,723,339 | |
Foreign currency, at value (cost $286,805) | | | 277,819 | |
Receivable for investments sold | | | 6,599,485 | |
Receivable for Fund shares sold | | | 164,587 | |
Receivable for dividends and interest | | | 869,621 | |
Receivable for securities lending income | | | 3,934 | |
Prepaid expenses and other assets | | | 57,120 | |
| | | | |
Total assets | | | 440,235,936 | |
| | | | |
| |
Liabilities | | | | |
Payable for investments purchased | | | 9,731,645 | |
Payable for Fund shares redeemed | | | 142,797 | |
Payable upon receipt of securities loaned | | | 3,697,500 | |
Advisory fee payable | | | 187,123 | |
Distribution fees payable | | | 45,329 | |
Administration fees payable | | | 108,408 | |
Accrued expenses and other liabilities | | | 131,676 | |
| | | | |
Total liabilities | | | 14,044,478 | |
| | | | |
Total net assets | | $ | 426,191,458 | |
| | | | |
| |
NET ASSETS CONSIST OF | | | | |
Paid-in capital | | $ | 308,928,171 | |
Undistributed net investment income | | | 807,036 | |
Accumulated net realized losses on investments | | | (25,954,414 | ) |
Net unrealized gains on investments | | | 142,410,665 | |
| | | | |
Total net assets | | $ | 426,191,458 | |
| | | | |
| |
COMPUTATION OF NET ASSET VALUE AND OFFERING PRICE PER SHARE | | | | |
Net assets – Class A | | $ | 331,950,827 | |
Shares outstanding – Class A1 | | | 19,043,263 | |
Net asset value per share – Class A | | | $17.43 | |
Maximum offering price per share – Class A2 | | | $18.49 | |
Net assets – Class B | | $ | 11,179,523 | |
Shares outstanding – Class B1 | | | 639,979 | |
Net asset value per share – Class B | | | $17.47 | |
Net assets – Class C | | $ | 60,323,614 | |
Shares outstanding – Class C1 | | | 3,457,610 | |
Net asset value per share – Class C | | | $17.45 | |
Net assets – Administrator Class | | $ | 9,500,914 | |
Shares outstanding – Administrator Class1 | | | 544,618 | |
Net asset value per share – Administrator Class | | | $17.45 | |
Net assets – Institutional Class | | $ | 13,236,580 | |
Shares outstanding – Institutional Class1 | | | 759,589 | |
Net asset value per share – Institutional Class | | | $17.43 | |
| 1. | The Fund has an unlimited number of authorized shares. |
| 2. | Maximum offering price is computed as 100/94.25 of net asset value. On investments of $50,000 or more, the offering price is reduced. |
The accompanying notes are an integral part of these financial statements.
| | | | | | |
| Statement of operations—six months ended September 30, 2014 (unaudited) | | Wells Fargo Advantage Utility and Telecommunications Fund | | | 11 | |
| | | | |
| | | | |
| |
Investment income | | | | |
Dividends (net of foreign withholding taxes of $70,334) | | $ | 6,165,514 | |
Interest | | | 76,323 | |
Securities lending income, net | | | 22,932 | |
Income from affiliated securities | | | 4,298 | |
| | | | |
Total investment income | | | 6,269,067 | |
| | | | |
| |
Expenses | | | | |
Advisory fee | | | 1,347,760 | |
Administration fees | | | | |
Fund level | | | 112,313 | |
Class A | | | 457,251 | |
Class B | | | 16,632 | |
Class C | | | 81,371 | |
Administrator Class | | | 5,040 | |
Institutional Class | | | 4,822 | |
Shareholder servicing fees | | | | |
Class A | | | 439,664 | |
Class B | | | 15,992 | |
Class C | | | 78,241 | |
Administrator Class | | | 12,601 | |
Distribution fees | | | | |
Class B | | | 47,976 | |
Class C | | | 234,724 | |
Custody and accounting fees | | | 13,479 | |
Professional fees | | | 24,765 | |
Registration fees | | | 36,167 | |
Shareholder report expenses | | | 33,925 | |
Trustees’ fees and expenses | | | 5,591 | |
Interest expense | | | 293 | |
Other fees and expenses | | | 7,705 | |
| | | | |
Total expenses | | | 2,976,312 | |
Less: Fee waivers and/or expense reimbursements | | | (163,852 | ) |
| | | | |
Net expenses | | | 2,812,460 | |
| | | | |
Net investment income | | | 3,456,607 | |
| | | | |
| |
REALIZED AND UNREALIZED GAINS (LOSSES) ON INVESTMENTS | | | | |
Net realized gains on investments | | | 22,999,241 | |
Net change in unrealized gains (losses) on investments | | | (29,746,903 | ) |
| | | | |
Net realized and unrealized gains (losses) on investments | | | (6,747,662 | ) |
| | | | |
Net decrease in net assets resulting from operations | | $ | (3,291,055 | ) |
| | | | |
The accompanying notes are an integral part of these financial statements.
| | | | |
| 12 | | Wells Fargo Advantage Utility and Telecommunications Fund | | Statement of changes in net assets |
| | | | | | | | | | | | | | | | |
| | | Six months ended
September 30, 2014
(unaudited) | | | Year ended
March 31, 2014 | |
| | | | |
Operations | | | | | | | | | | | | | | | | |
Net investment income | | | | | | $ | 3,456,607 | | | | | | | $ | 8,581,256 | |
Net realized gains on investments | | | | | | | 22,999,241 | | | | | | | | 11,511,247 | |
Net change in unrealized gains (losses) on investments | | | | | | | (29,746,903 | ) | | | | | | | 34,753,654 | |
| | | | |
Net increase (decrease) in net assets resulting from operations | | | | | | | (3,291,055 | ) | | | | | | | 54,846,157 | |
| | | | |
| | | | |
Distributions to shareholders from | | | | | | | | | | | | | | | | |
Net investment income | | | | | | | | | | | | | | | | |
Class A | | | | | | | (2,861,748 | ) | | | | | | | (6,700,577 | ) |
Class B | | | | | | | (52,275 | ) | | | | | | | (190,117 | ) |
Class C | | | | | | | (278,355 | ) | | | | | | | (764,718 | ) |
Administrator Class | | | | | | | (93,001 | ) | | | | | | | (158,888 | ) |
Institutional Class | | | | | | | (128,968 | ) | | | | | | | (217,279 | ) |
| | | | |
Total distributions to shareholders | | | | | | | (3,414,347 | ) | | | | | | | (8,031,579 | ) |
| | | | |
| | | | |
Capital share transactions | | | Shares | | | | | | | | Shares | | | | | |
Proceeds from shares sold | | | | | | | | | | | | | | | | |
Class A | | | 1,119,180 | | | | 20,062,474 | | | | 2,373,417 | | | | 38,734,495 | |
Class B | | | 468 | | | | 9,046 | | | | 10,509 | | | | 170,548 | |
Class C | | | 190,512 | | | | 3,423,606 | | | | 316,711 | | | | 5,162,540 | |
Administrator Class | | | 143,673 | | | | 2,598,596 | | | | 265,029 | | | | 4,352,338 | |
Institutional Class | | | 220,229 | | | | 4,000,878 | | | | 143,504 | | | | 2,369,616 | |
| | | | |
| | | | | | | 30,094,600 | | | | | | | | 50,789,537 | |
| | | | |
Reinvestment of distributions | | | | | | | | | | | | | | | | |
Class A | | | 148,263 | | | | 2,688,035 | | | | 387,456 | | | | 6,243,698 | |
Class B | | | 2,386 | | | | 43,701 | | | | 9,597 | | | | 153,762 | |
Class C | | | 13,494 | | | | 246,318 | | | | 41,918 | | | | 673,037 | |
Administrator Class | | | 3,652 | | | | 66,220 | | | | 7,358 | | | | 119,387 | |
Institutional Class | | | 7,029 | | | | 126,968 | | | | 13,176 | | | | 213,074 | |
| | | | |
| | | | | | | 3,171,242 | | | | | | | | 7,402,958 | |
| | | | |
Payment for shares redeemed | | | | | | | | | | | | | | | | |
Class A | | | (1,983,222 | ) | | | (35,737,884 | ) | | | (2,975,627 | ) | | | (48,341,013 | ) |
Class B | | | (134,763 | ) | | | (2,432,001 | ) | | | (334,676 | ) | | | (5,430,603 | ) |
Class C | | | (205,325 | ) | | | (3,699,139 | ) | | | (520,509 | ) | | | (8,427,382 | ) |
Administrator Class | | | (131,924 | ) | | | (2,355,247 | ) | | | (109,015 | ) | | | (1,770,565 | ) |
Institutional Class | | | (49,738 | ) | | | (909,439 | ) | | | (98,666 | ) | | | (1,615,122 | ) |
| | | | |
| | | | | | | (45,133,710 | ) | | | | | | | (65,584,685 | ) |
| | | | |
Net decrease in net assets resulting from capital share transactions | | | | | | | (11,867,868 | ) | | | | | | | (7,392,190 | ) |
| | | | |
Total increase (decrease) in net assets | | | | | | | (18,573,270 | ) | | | | | | | 39,422,388 | |
| | | | |
| | | | |
Net assets | | | | | | | | | | | | | | | | |
Beginning of period | | | | | | | 444,764,728 | | | | | | | | 405,342,340 | |
| | | | |
End of period | | | | | | $ | 426,191,458 | | | | | | | $ | 444,764,728 | |
| | | | |
Undistributed net investment income | | | | | | $ | 807,036 | | | | | | | $ | 764,776 | |
| | | | |
The accompanying notes are an integral part of these financial statements.
| | | | | | |
| Financial highlights | | Wells Fargo Advantage Utility and Telecommunications Fund | | | 13 | |
(For a share outstanding throughout each period)
| | | | | | | | | | | | | | | | | | | | | | | | | | | | |
| | | Six months ended
September 30, 2014 (unaudited) | | | Year ended March 31 | | | Year ended October 31 | |
| CLASS A | | | 2014 | | | 2013 | | | 2012 | | | 20111 | | | 20102 | | | 20092 | |
Net asset value, beginning of period | | $ | 17.71 | | | $ | 15.85 | | | $ | 13.78 | | | $ | 12.59 | | | $ | 11.73 | | | $ | 10.77 | | | $ | 10.67 | |
Net investment income | | | 0.15 | | | | 0.36 | | | | 0.36 | | | | 0.28 | | | | 0.14 | | | | 0.29 | | | | 0.48 | |
Net realized and unrealized gains (losses) on investments | | | (0.28 | ) | | | 1.84 | | | | 2.07 | | | | 1.21 | | | | 0.87 | | | | 0.94 | | | | 0.11 | |
| | | | | | | | | | | | | | | | | | | | | | | | | | | | |
Total from investment operations | | | (0.13 | ) | | | 2.20 | | | | 2.43 | | | | 1.49 | | | | 1.01 | | | | 1.23 | | | | 0.59 | |
Distributions to shareholders from | | | | | | | | | | | | |
Net investment income | | | (0.15 | ) | | | (0.34 | ) | | | (0.36 | ) | | | (0.30 | ) | | | (0.15 | ) | | | (0.27 | ) | | | (0.49 | ) |
Net asset value, end of period | | $ | 17.43 | | | $ | 17.71 | | | $ | 15.85 | | | $ | 13.78 | | | $ | 12.59 | | | $ | 11.73 | | | $ | 10.77 | |
Total return3 | | | (0.78 | )% | | | 14.12 | % | | | 17.94 | % | | | 12.01 | % | | | 8.66 | % | | | 11.55 | % | | | 5.77 | % |
Ratios to average net assets (annualized) | | | | | | | | | | | | |
Gross expenses | | | 1.21 | % | | | 1.22 | % | | | 1.23 | % | | | 1.20 | % | | | 1.24 | % | | | 1.16 | % | | | 1.13 | % |
Net expenses | | | 1.14 | % | | | 1.14 | % | | | 1.14 | % | | | 1.14 | % | | | 1.14 | % | | | 1.12 | % | | | 1.13 | % |
Net investment income | | | 1.65 | % | | | 2.21 | % | | | 2.47 | % | | | 2.11 | % | | | 2.85 | % | | | 2.56 | % | | | 4.66 | % |
Supplemental data | | | | | | | | | | | | |
Portfolio turnover rate | | | 23 | % | | | 20 | % | | | 21 | % | | | 36 | % | | | 8 | % | | | 51 | % | | | 109 | % |
Net assets, end of period (000s omitted) | | | $331,951 | | | | $350,029 | | | | $316,551 | | | | $288,228 | | | | $283,716 | | | | $281,501 | | | | $301,953 | |
| 1. | For the five months ended March 31, 2011. The Fund changed its fiscal year end from October 31 to March 31, effective March 31, 2011. |
| 2. | After the close of business on July 16, 2010, the Fund acquired the net assets of Evergreen Utility and Telecommunications Fund which became the accounting and performance survivor in the transaction. The information for the periods prior to July 19, 2010 is that of Class A of Evergreen Utility and Telecommunications Fund. |
| 3. | Total return calculations do not include any sales charges. Returns for periods of less than one year are not annualized. |
The accompanying notes are an integral part of these financial statements.
| | | | |
| 14 | | Wells Fargo Advantage Utility and Telecommunications Fund | | Financial highlights |
(For a share outstanding throughout each period)
| | | | | | | | | | | | | | | | | | | | | | | | | | | | |
| | | Six months ended
September 30, 2014 (unaudited) | | | Year ended March 31 | | | Year ended October 31 | |
| CLASS B | | | 2014 | | | 2013 | | | 2012 | | | 20111 | | | 20102 | | | 20092 | |
Net asset value, beginning of period | | $ | 17.75 | | | $ | 15.87 | | | $ | 13.79 | | | $ | 12.59 | | | $ | 11.72 | | | $ | 10.77 | | | $ | 10.67 | |
Net investment income | | | 0.08 | 3 | | | 0.24 | 3 | | | 0.24 | 3 | | | 0.18 | 3 | | | 0.10 | 3 | | | 0.21 | 3 | | | 0.40 | 3 |
Net realized and unrealized gains (losses) on investments | | | (0.29 | ) | | | 1.85 | | | | 2.09 | | | | 1.22 | | | | 0.87 | | | | 0.93 | | | | 0.11 | |
| | | | | | | | | | | | | | | | | | | | | | | | | | | | |
Total from investment operations | | | (0.21 | ) | | | 2.09 | | | | 2.33 | | | | 1.40 | | | | 0.97 | | | | 1.14 | | | | 0.51 | |
Distributions to shareholders from | | | | | | | | | | | | |
Net investment income | | | (0.07 | ) | | | (0.21 | ) | | | (0.25 | ) | | | (0.20 | ) | | | (0.10 | ) | | | (0.19 | ) | | | (0.41 | ) |
Net asset value, end of period | | $ | 17.47 | | | $ | 17.75 | | | $ | 15.87 | | | $ | 13.79 | | | $ | 12.59 | | | $ | 11.72 | | | $ | 10.77 | |
Total return4 | | | (1.18 | )% | | | 13.32 | % | | | 17.08 | % | | | 11.21 | % | | | 8.32 | % | | | 10.64 | % | | | 4.97 | % |
Ratios to average net assets (annualized) | | | | | | | | | | | | |
Gross expenses | | | 1.96 | % | | | 1.97 | % | | | 1.97 | % | | | 1.95 | % | | | 1.99 | % | | | 1.91 | % | | | 1.88 | % |
Net expenses | | | 1.89 | % | | | 1.89 | % | | | 1.89 | % | | | 1.89 | % | | | 1.89 | % | | | 1.87 | % | | | 1.88 | % |
Net investment income | | | 0.88 | % | | | 1.46 | % | | | 1.70 | % | | | 1.35 | % | | | 2.09 | % | | | 1.82 | % | | | 3.92 | % |
Supplemental data | | | | | | | | | | | | |
Portfolio turnover rate | | | 23 | % | | | 20 | % | | | 21 | % | | | 36 | % | | | 8 | % | | | 51 | % | | | 109 | % |
Net assets, end of period (000s omitted) | | | $11,180 | | | | $13,698 | | | | $17,240 | | | | $20,613 | | | | $24,461 | | | | $27,042 | | | | $31,007 | |
| 1. | For the five months ended March 31, 2011. The Fund changed its fiscal year end from October 31 to March 31, effective March 31, 2011. |
| 2. | After the close of business on July 16, 2010, the Fund acquired the net assets of Evergreen Utility and Telecommunications Fund which became the accounting and performance survivor in the transaction. The information for the periods prior to July 19, 2010 is that of Class B of Evergreen Utility and Telecommunications Fund. |
| 3. | Calculated based upon average shares outstanding |
| 4. | Total return calculations do not include any sales charges. Returns for periods of less than one year are not annualized. |
The accompanying notes are an integral part of these financial statements.
| | | | | | |
| Financial highlights | | Wells Fargo Advantage Utility and Telecommunications Fund | | | 15 | |
(For a share outstanding throughout each period)
| | | | | | | | | | | | | | | | | | | | | | | | | | | | |
| | | Six months ended
September 30, 2014 (unaudited) | | | Year ended March 31 | | | Year ended October 31 | |
| CLASS C | | | 2014 | | | 2013 | | | 2012 | | | 20111 | | | 20102 | | | 20092 | |
Net asset value, beginning of period | | $ | 17.73 | | | $ | 15.86 | | | $ | 13.79 | | | $ | 12.59 | | | $ | 11.72 | | | $ | 10.77 | | | $ | 10.67 | |
Net investment income | | | 0.08 | | | | 0.24 | 3 | | | 0.23 | | | | 0.18 | 3 | | | 0.11 | 3 | | | 0.21 | 3 | | | 0.40 | |
Net realized and unrealized gains (losses) on investments | | | (0.28 | ) | | | 1.85 | | | | 2.09 | | | | 1.22 | | | | 0.86 | | | | 0.93 | | | | 0.11 | |
| | | | | | | | | | | | | | | | | | | | | | | | | | | | |
Total from investment operations | | | (0.20 | ) | | | 2.09 | | | | 2.32 | | | | 1.40 | | | | 0.97 | | | | 1.14 | | | | 0.51 | |
Distributions to shareholders from | | | | | | | | | | | | |
Net investment income | | | (0.08 | ) | | | (0.22 | ) | | | (0.25 | ) | | | (0.20 | ) | | | (0.10 | ) | | | (0.19 | ) | | | (0.41 | ) |
Net asset value, end of period | | $ | 17.45 | | | $ | 17.73 | | | $ | 15.86 | | | $ | 13.79 | | | $ | 12.59 | | | $ | 11.72 | | | $ | 10.77 | |
Total return4 | | | (1.15 | )% | | | 13.31 | % | | | 17.03 | % | | | 11.23 | % | | | 8.32 | % | | | 10.62 | % | | | 5.06 | % |
Ratios to average net assets (annualized) | | | | | | | | | | | | |
Gross expenses | | | 1.96 | % | | | 1.97 | % | | | 1.98 | % | | | 1.95 | % | | | 1.99 | % | | | 1.91 | % | | | 1.88 | % |
Net expenses | | | 1.89 | % | | | 1.89 | % | | | 1.89 | % | | | 1.89 | % | | | 1.89 | % | | | 1.87 | % | | | 1.88 | % |
Net investment income | | | 0.90 | % | | | 1.46 | % | | | 1.71 | % | | | 1.36 | % | | | 2.10 | % | | | 1.83 | % | | | 3.86 | % |
Supplemental data | | | | | | | | | | | | |
Portfolio turnover rate | | | 23 | % | | | 20 | % | | | 21 | % | | | 36 | % | | | 8 | % | | | 51 | % | | | 109 | % |
Net assets, end of period (000s omitted) | | | $60,324 | | | | $61,329 | | | | $57,431 | | | | $58,555 | | | | $60,655 | | | | $64,942 | | | | $80,526 | |
| 1. | For the five months ended March 31, 2011. The Fund changed its fiscal year end from October 31 to March 31, effective March 31, 2011. |
| 2. | After the close of business on July 16, 2010, the Fund acquired the net assets of Evergreen Utility and Telecommunications Fund which became the accounting and performance survivor in the transaction. The information for the periods prior to July 19, 2010 is that of Class C of Evergreen Utility and Telecommunications Fund. |
| 3. | Calculated based upon average shares outstanding |
| 4. | Total return calculations do not include any sales charges. Returns for periods of less than one year are not annualized. |
The accompanying notes are an integral part of these financial statements.
| | | | |
| 16 | | Wells Fargo Advantage Utility and Telecommunications Fund | | Financial highlights |
(For a share outstanding throughout each period)
| | | | | | | | | | | | | | | | | | | | | | | | |
| | | Six months ended
September 30, 2014 (unaudited) | | | Year ended March 31 | | | Year ended October 31, 20102 | |
| ADMINISTRATOR CLASS | | | 2014 | | | 2013 | | | 2012 | | | 20111 | | |
Net asset value, beginning of period | | $ | 17.73 | | | $ | 15.86 | | | $ | 13.79 | | | $ | 12.59 | | | $ | 11.74 | | | $ | 11.10 | |
Net investment income | | | 0.17 | | | | 0.40 | | | | 0.39 | | | | 0.30 | 3 | | | 0.12 | 3 | | | 0.06 | |
Net realized and unrealized gains (losses) on investments | | | (0.28 | ) | | | 1.84 | | | | 2.07 | | | | 1.23 | | | | 0.89 | | | | 0.63 | |
| | | | | | | | | | | | | | | | | | | | | | | | |
Total from investment operations | | | (0.11 | ) | | | 2.24 | | | | 2.46 | | | | 1.53 | | | | 1.01 | | | | 0.69 | |
Distributions to shareholders from | | | | | | | | | | | | |
Net investment income | | | (0.17 | ) | | | (0.37 | ) | | | (0.39 | ) | | | (0.33 | ) | | | (0.16 | ) | | | (0.05 | ) |
Net asset value, end of period | | $ | 17.45 | | | $ | 17.73 | | | $ | 15.86 | | | $ | 13.79 | | | $ | 12.59 | | | $ | 11.74 | |
Total return4 | | | (0.68 | )% | | | 14.41 | % | | | 18.16 | % | | | 12.32 | % | | | 8.70 | % | | | 6.22 | % |
Ratios to average net assets (annualized) | | | | | | | | | | | | |
Gross expenses | | | 1.05 | % | | | 1.04 | % | | | 1.04 | % | | | 1.01 | % | | | 1.04 | % | | | 1.14 | % |
Net expenses | | | 0.95 | % | | | 0.95 | % | | | 0.95 | % | | | 0.94 | % | | | 0.95 | % | | | 0.95 | % |
Net investment income | | | 1.84 | % | | | 2.38 | % | | | 2.66 | % | | | 2.32 | % | | | 2.37 | % | | | 2.23 | % |
Supplemental data | | | | | | | | | | | | |
Portfolio turnover rate | | | 23 | % | | | 20 | % | | | 21 | % | | | 36 | % | | | 8 | % | | | 51 | % |
Net assets, end of period (000s omitted) | | | $9,501 | | | | $9,383 | | | | $5,803 | | | | $4,945 | | | | $3,904 | | | | $11 | |
| 1. | For the five months ended March 31, 2011. The Fund changed its fiscal year end from October 31 to March 31, effective March 31, 2011. |
| 2. | For the period from July 30, 2010 (commencement of class operations) to October 31, 2010 |
| 3. | Calculated based upon average shares outstanding |
| 4. | Returns for periods of less than one year are not annualized. |
The accompanying notes are an integral part of these financial statements.
| | | | | | |
| Financial highlights | | Wells Fargo Advantage Utility and Telecommunications Fund | | | 17 | |
(For a share outstanding throughout each period)
| | | | | | | | | | | | | | | | | | | | | | | | | | | | |
| | | Six months ended
September 30, 2014 (unaudited) | | | Year ended March 31 | | | Year ended October 31 | |
| INSTITUTIONAL CLASS | | | 2014 | | | 2013 | | | 2012 | | | 20111 | | | 20102 | | | 20092 | |
Net asset value, beginning of period | | $ | 17.74 | | | $ | 15.87 | | | $ | 13.80 | | | $ | 12.61 | | | $ | 11.74 | | | $ | 10.78 | | | $ | 10.69 | |
Net investment income | | | 0.18 | | | | 0.42 | | | | 0.46 | | | | 0.33 | | | | 0.16 | | | | 0.31 | 3 | | | 0.51 | |
Net realized and unrealized gains (losses) on investments | | | (0.31 | ) | | | 1.85 | | | | 2.03 | | | | 1.21 | | | | 0.87 | | | | 0.95 | | | | 0.09 | |
| | | | | | | | | | | | | | | | | | | | | | | | | | | | |
Total from investment operations | | | (0.13 | ) | | | 2.27 | | | | 2.49 | | | | 1.54 | | | | 1.03 | | | | 1.26 | | | | 0.60 | |
Distributions to shareholders from | | | | | | | | | | | | |
Net investment income | | | (0.18 | ) | | | (0.40 | ) | | | (0.42 | ) | | | (0.35 | ) | | | (0.16 | ) | | | (0.30 | ) | | | (0.51 | ) |
Net asset value, end of period | | $ | 17.43 | | | $ | 17.74 | | | $ | 15.87 | | | $ | 13.80 | | | $ | 12.61 | | | $ | 11.74 | | | $ | 10.78 | |
Total return4 | | | (0.76 | )% | | | 14.58 | % | | | 18.34 | % | | | 12.42 | % | | | 8.85 | % | | | 11.75 | % | | | 6.03 | % |
Ratios to average net assets (annualized) | | | | | | | | | | | | |
Gross expenses | | | 0.79 | % | | | 0.79 | % | | | 0.80 | % | | | 0.77 | % | | | 0.81 | % | | | 0.86 | % | | | 0.89 | % |
Net expenses | | | 0.78 | % | | | 0.78 | % | | | 0.78 | % | | | 0.77 | % | | | 0.78 | % | | | 0.84 | % | | | 0.89 | % |
Net investment income | | | 2.03 | % | | | 2.56 | % | | | 2.97 | % | | | 2.50 | % | | | 3.22 | % | | | 2.73 | % | | | 4.88 | % |
Supplemental data | | | | | | | | | | | | |
Portfolio turnover rate | | | 23 | % | | | 20 | % | | | 21 | % | | | 36 | % | | | 8 | % | | | 51 | % | | | 109 | % |
Net assets, end of period (000s omitted) | | | $13,237 | | | | $10,325 | | | | $8,317 | | | | $6,918 | | | | $6,909 | | | | $7,123 | | | | $9,196 | |
| 1. | For the five months ended March 31, 2011. The Fund changed its fiscal year end from October 31 to March 31, effective March 31, 2011. |
| 2. | After the close of business on July 16, 2010, the Fund acquired the net assets of Evergreen Utility and Telecommunications Fund which became the accounting and performance survivor in the transaction. The information for the periods prior to July 19, 2010 is that of Class I of Evergreen Utility and Telecommunications Fund. |
| 3. | Calculated based upon average shares outstanding |
| 4. | Returns for periods of less than one year are not annualized. |
The accompanying notes are an integral part of these financial statements.
| | | | |
| 18 | | Wells Fargo Advantage Utility and Telecommunications Fund | | Notes to financial statements (unaudited) |
1. ORGANIZATION
Wells Fargo Funds Trust (the “Trust”), a Delaware statutory trust organized on March 10, 1999, is an open-end management investment company registered under the Investment Company Act of 1940, as amended (the “1940 Act”). These financial statements report on the Wells Fargo Advantage Utility and Telecommunications Fund (the “Fund”) which is a non-diversified series of the Trust.
2. SIGNIFICANT ACCOUNTING POLICIES
The following significant accounting policies, which are consistently followed in the preparation of the financial statements of the Fund, are in conformity with U.S. generally accepted accounting principles which require management to make estimates and assumptions that affect the reported amounts of assets and liabilities, disclosure of contingent assets and liabilities at the date of the financial statements, and the reported amounts of revenues and expenses during the reporting period. Actual results could differ from those estimates.
Securities valuation
All investments are valued each business day as of the close of regular trading on the New York Stock Exchange (generally 4 p.m. Eastern Time).
Equity securities that are listed on a foreign or domestic exchange or market are valued at the official closing price or, if none, the last sales price. If no sale occurs on the primary exchange or market for the security that day, the prior day’s price will be deemed “stale” and fair values will be determined in accordance with the Fund’s Valuation Procedures.
The values of securities denominated in foreign currencies are translated into U.S. dollars at rates provided by an independent foreign currency pricing source at a time each business day specified by the Management Valuation Team of Wells Fargo Funds Management, LLC (“Funds Management”).
Many securities markets and exchanges outside the U.S. close prior to the close of the New York Stock Exchange and therefore may not fully reflect trading or events that occur after the close of the principal exchange in which the foreign securities are traded, but before the close of the New York Stock Exchange. If such trading or events are expected to materially affect the value of such securities, then fair value pricing procedures approved by the Board of Trustees of the Fund are applied. These procedures take into account multiple factors including movements in U.S. securities markets after foreign exchanges close. Foreign securities that are fair valued under these procedures are categorized as Level 2 and the application of these procedures may result in transfers between Level 1 and Level 2. Depending on market activity, such fair valuations may be frequent. Such fair value pricing may result in net asset values that are higher or lower than net asset values based on the last reported sales price or latest quoted bid price. On September 30, 2014, such fair value pricing was not used in pricing foreign securities.
Investments in registered open-end investment companies are valued at net asset value. Non-registered investment vehicles are fair valued at net asset value.
Investments which are not valued using any of the methods discussed above are valued at their fair value, as determined in good faith by the Board of Trustees. The Board of Trustees has established a Valuation Committee comprised of the Trustees and has delegated to it the authority to take any actions regarding the valuation of portfolio securities that the Valuation Committee deems necessary or appropriate, including determining the fair value of portfolio securities, unless the determination has been delegated to the Management Valuation Team. The Board of Trustees retains the authority to make or ratify any valuation decisions or approve any changes to the Valuation Procedures as it deems appropriate. On a quarterly basis, the Board of Trustees receives reports on any valuation actions taken by the Valuation Committee or the Management Valuation Team which may include items for ratification.
Valuations of fair valued securities are compared to the next actual sales price when available, or other appropriate market values, to assess the continued appropriateness of the fair valuation methodologies used. These securities are fair valued on a day-to-day basis, taking into consideration changes to appropriate market information and any significant changes to the inputs considered in the valuation process until there is a readily available price provided on an exchange or by an independent pricing service. Valuations received from an independent pricing service or independent broker-dealer quotes are periodically validated by comparisons to most recent trades and valuations provided by other independent pricing services in addition to the review of prices by the adviser and/or subadviser. Unobservable inputs used in determining fair valuations are identified based on the type of security, taking into consideration factors utilized by market participants in valuing the investment, knowledge about the issuer and the current market environment.
| | | | | | |
| Notes to financial statements (unaudited) | | Wells Fargo Advantage Utility and Telecommunications Fund | | | 19 | |
Foreign currency translation
The accounting records of the Fund are maintained in U.S. dollars. The values of other assets and liabilities denominated in foreign currencies are translated into U.S. dollars at rates provided by an independent foreign currency pricing source at a time each business day specified by the Management Valuation Team. Purchases and sales of securities, and income and expenses are converted at the rate of exchange on the respective dates of such transactions. Net realized foreign exchange gains or losses arise from sales of foreign currencies, currency gains or losses realized between the trade and settlement dates on securities transactions, and the difference between the amounts of dividends, interest and foreign withholding taxes recorded and the U.S. dollar equivalent of the amounts actually paid or received. Net unrealized foreign exchange gains and losses arise from changes in the fair value of assets and liabilities other than investments in securities resulting from changes in exchange rates. The changes in net assets arising from changes in exchange rates and the changes in net assets resulting from changes in market prices of securities are not separately presented. Such changes are included in net realized and unrealized gains or losses from investments.
Security loans
The Fund may lend its securities from time to time in order to earn additional income in the form of fees or interest on securities received as collateral or the investment of any cash received as collateral. The Fund continues to receive interest or dividends on the securities loaned. The Fund receives collateral in the form of cash or securities with a value at least equal to the value of the securities on loan. The value of the loaned securities is determined at the close of each business day and any additional required collateral is delivered to the Fund on the next business day. In a securities lending transaction, the net asset value of the Fund will be affected by an increase or decrease in the value of the securities loaned and by an increase or decrease in the value of the instrument in which collateral is invested. The amount of securities lending activity undertaken by the Fund fluctuates from time to time. In the event of default or bankruptcy by the borrower, the Fund may be prevented from recovering the loaned securities or gaining access to the collateral or may experience delays or costs in doing so. In addition, the investment of any cash collateral received may lose all or part of its value. The Fund has the right under the lending agreement to recover the securities from the borrower on demand.
The Fund lends its securities through an unaffiliated securities lending agent. Cash collateral received in connection with its securities lending transactions is invested in Wells Fargo Securities Lending Cash Investments, LLC (the “Securities Lending Fund”). The Securities Lending Fund is exempt from registration under Section 3(c)(7) of the 1940 Act and is managed by Funds Management and is subadvised by Wells Capital Management Incorporated (“WellsCap”). Funds Management receives an advisory fee starting at 0.05% and declining to 0.01% as the average daily net assets of the Securities Lending Fund increase. All of the fees received by Funds Management are paid to WellsCap for its services as subadviser. The Securities Lending Fund seeks to provide a positive return compared to the daily Fed Funds Open rate by investing in high-quality, U.S. dollar-denominated short-term money market instruments. Securities Lending Fund investments are fair valued based upon the amortized cost valuation technique. Income earned from investment in the Securities Lending Fund is included in securities lending income on the Statement of Operations.
Options
The Fund is subject to equity price risk in the normal course of pursuing its investment objectives. The Fund may write covered call options or secured put options on individual securities and/or indexes. When the Fund writes an option, an amount equal to the premium received is recorded as a liability and is subsequently adjusted to the current market value of the written option. Premiums received from written options that expire unexercised are recognized as realized gains on the expiration date. For exercised options, the difference between the premium received and the amount paid on effecting a closing purchase transaction, including brokerage commissions, is treated as a realized gain or loss. If a call option is exercised, the premium is added to the proceeds from the sale of the underlying security in calculating the realized gain or loss on the sale. If a put option is exercised, the premium reduces the cost of the security purchased. The Fund, as a writer of an option, bears the market risk of an unfavorable change in the price of the security and/or index underlying the written option.
The Fund may also purchase call or put options. The premium is included in the Statement of Assets and Liabilities as an investment, the value of which is subsequently adjusted based on the current market value of the option. Premiums paid for purchased options that expire are recognized as realized losses on the expiration date. Premiums paid for purchased options that are exercised or closed are added to the amount paid or offset against the proceeds received for the underlying security to determine the realized gain or loss. The risk of loss associated with purchased options is limited to the premium paid.
Options traded on an exchange are regulated and terms of the options are standardized. Purchased options traded over-the-counter expose the Fund to counterparty risk in the event the counterparty does not perform. This risk can be
| | | | |
| 20 | | Wells Fargo Advantage Utility and Telecommunications Fund | | Notes to financial statements (unaudited) |
mitigated by having a master netting arrangement between the Fund and the counterparty and by having the counterparty post collateral to cover the Fund’s exposure to the counterparty.
Security transactions and income recognition
Securities transactions are recorded on a trade date basis. Realized gains or losses are recorded on the basis of identified cost.
Dividend income is recognized on the ex-dividend date, except for certain dividends from foreign securities, which are recorded as soon as the Fund is informed of the ex-dividend date. Dividend income from foreign securities is recorded net of foreign taxes withheld where recovery of such taxes is not assured.
Distributions to shareholders
Distributions to shareholders from net investment income and net realized gains, if any, are recorded on the ex-dividend date. Such distributions are determined in conformity with federal income tax regulations, which may differ in amount or character from net investment income and realized gains recognized for purposes of U.S. generally accepted accounting principles.
Federal and other taxes
The Fund intends to continue to qualify as a regulated investment company by distributing substantially all of its investment company taxable income and any net realized capital gains (after reduction for capital loss carryforwards) sufficient to relieve it from all, or substantially all, federal income taxes. Accordingly, no provision for federal income taxes was required.
The Fund’s income and federal excise tax returns and all financial records supporting those returns for the prior three fiscal years are subject to examination by the federal and Delaware revenue authorities. Management has analyzed the Fund’s tax positions taken on federal, state, and foreign tax returns for all open tax years and does not believe that there are any uncertain tax positions that require recognition of a tax liability.
As of March, 2014, the Fund had capital loss carryforwards available to offset future net realized capital gains in the amount of $49,187,482 expiring in 2017.
Class allocations
The separate classes of shares offered by the Fund differ principally in applicable sales charges, distribution, shareholder servicing, and administration fees. Class specific expenses are charged directly to that share class. Investment income, common expenses, and realized and unrealized gains (losses) on investments are allocated daily to each class of shares based on the relative proportion of net assets of each class.
3. FAIR VALUATION MEASUREMENTS
Fair value measurements of investments are determined within a framework that has established a fair value hierarchy based upon the various data inputs utilized in determining the value of the Fund’s investments. The three-level hierarchy gives the highest priority to unadjusted quoted prices in active markets for identical assets or liabilities (Level 1) and the lowest priority to significant unobservable inputs (Level 3). The Fund’s investments are classified within the fair value hierarchy based on the lowest level of input that is significant to the fair value measurement. The inputs are summarized into three broad levels as follows:
| n | | Level 1 – quoted prices in active markets for identical securities |
| n | | Level 2 – other significant observable inputs (including quoted prices for similar securities, interest rates, prepayment speeds, credit risk, use of amortized cost, etc.) |
| n | | Level 3 – significant unobservable inputs (including the Fund’s own assumptions in determining the fair value of investments) |
The inputs or methodologies used for valuing investments in securities are not necessarily an indication of the risk associated with investing in those securities.
| | | | | | |
| Notes to financial statements (unaudited) | | Wells Fargo Advantage Utility and Telecommunications Fund | | | 21 | |
The following is a summary of the inputs used in valuing the Fund’s assets and liabilities as of September 30, 2014:
| | | | | | | | | | | | | | | | |
| | | Quoted prices (Level 1) | | | Other significant observable inputs (Level 2) | | | Significant unobservable inputs (Level 3) | | | Total | |
Assets | | | | | | | | | | | | | | | | |
Investments in: | | | | | | | | | | | | |
| | | |
Common stocks | | | | | | | | | | | | |
Consumer discretionary | | $ | 12,105,878 | | | $ | 0 | | | $ | 0 | | | $ | 12,105,878 | |
Energy | | | 55,988,354 | | | | 0 | | | | 0 | | | | 55,988,354 | |
Financials | | | 41,329,710 | | | | 0 | | | | 0 | | | | 41,329,710 | |
Industrials | | | 437,350 | | | | 0 | | | | 0 | | | | 437,350 | |
Information technology | | | 27,272,550 | | | | 0 | | | | 0 | | | | 27,272,550 | |
Telecommunication services | | | 21,378,250 | | | | 0 | | | | 0 | | | | 21,378,250 | |
Utilities | | | 247,655,869 | | | | 0 | | | | 0 | | | | 247,655,869 | |
| | | | |
Corporate bonds and notes | | | 0 | | | | 4,900,000 | | | | 0 | | | | 4,900,000 | |
| | | | |
Warrants | | | | | | | | | | | | | | | | |
Energy | | | 0 | | | | 1,805,440 | | | | 0 | | | | 1,805,440 | |
| | | | |
Short-term investments | | | | | | | | | | | | | | | | |
Investment companies | | | 7,969,130 | | | | 3,697,500 | | | | 0 | | | | 11,666,630 | |
Total assets | | $ | 414,137,091 | | | $ | 10,402,940 | | | $ | 0 | | | $ | 424,540,031 | |
Transfers in and transfers out are recognized at the end of the reporting period. At September 30, 2014, the Fund did not have any transfers into/out of Level 1, Level 2, or Level 3.
4. TRANSACTIONS WITH AFFILIATES AND OTHER EXPENSES
Advisory fee
The Trust has entered into an advisory contract with Funds Management, an indirect wholly owned subsidiary of Wells Fargo & Company (“Wells Fargo”). The adviser is responsible for implementing investment policies and guidelines and for supervising the subadviser, who is responsible for day-to-day portfolio management of the Fund.
Pursuant to the contract, Funds Management is entitled to receive an annual advisory fee starting at 0.60% and declining to 0.45% as the average daily net assets of the Fund increase. For the six months ended September 30, 2014, the advisory fee was equivalent to an annual rate of 0.60% of the Fund’s average daily net assets.
Funds Management has retained the services of a subadviser to provide daily portfolio management to the Fund. The fee for subadvisory services is borne by Funds Management. Crow Point Partners, LLC is the subadviser to the Fund and is entitled to receive a fee from Funds Management at an annual rate starting at 0.20% and declining to 0.10% as the average daily net assets of the Fund increase.
Administration fees
The Trust has entered into an administration agreement with Funds Management. Under this agreement, for providing administrative services, which includes paying fees and expenses for services provided by the transfer agent, sub-transfer agents, omnibus account servicers and record-keepers, Funds Management is entitled to receive from the Fund an annual fund level administration fee starting at 0.05% and declining to 0.03% as the average daily net assets of the Fund increase and a class level administration fee which is calculated based on the average daily net assets of each class as follows:
| | | | |
| | | Class level administration fee | |
Class A, Class B, Class C | | | 0.26 | % |
Administrator Class | | | 0.10 | |
Institutional Class | | | 0.08 | |
Funds Management has contractually waived and/or reimbursed advisory and administration fees to the extent necessary to maintain certain net operating expense ratios for the Fund. Waiver of fees and/or reimbursement of
| | | | |
| 22 | | Wells Fargo Advantage Utility and Telecommunications Fund | | Notes to financial statements (unaudited) |
expenses by Funds Management were made first from fund level expenses on a proportionate basis and then from class specific expenses. Funds Management has committed through July 31, 2015 to waive fees and/or reimburse expenses to the extent necessary to cap the Fund’s expenses at 1.14% for Class A shares, 1.89% for Class B shares, 1.89% for Class C shares, 0.95% for Administrator Class shares, and 0.78% for Institutional Class shares. After this time, the cap may be increased or the commitment to maintain the cap may be terminated only with the approval of the Board of Trustees.
Distribution fees
The Trust has adopted a Distribution Plan for Class B and C shares of the Fund pursuant to Rule 12b-1 under the 1940 Act. Distribution fees are charged to Class B and Class C shares and paid to Wells Fargo Funds Distributor, LLC (“Funds Distributor”), the principal underwriter, at an annual rate of 0.75% of the average daily net assets of Class B and Class C shares.
In addition, Funds Distributor is entitled to receive the front-end sales charge from the purchase of Class A shares and a contingent deferred sales charge on the redemption of certain shares. Funds Distributor is also entitled to receive the contingent deferred sales charges from redemptions of Class B and Class C shares. For the six months ended September 30, 2014, Funds Distributor received $20,443 from the sale of Class A shares and $70 in contingent deferred sales charges from redemptions of Class C shares.
Shareholder servicing fees
The Trust has entered into contracts with one or more shareholder servicing agents, whereby Class A, Class B, Class C, and Administrator Class of the Fund is charged a fee at an annual rate of 0.25% of the average daily net assets of each respective class.
A portion of these total shareholder servicing fees were paid to affiliates of Wells Fargo.
5. INVESTMENT PORTFOLIO TRANSACTIONS
Purchases and sales of investments, excluding U.S. government obligations (if any) and short-term securities, for the six months ended September 30, 2014 were $102,652,997 and $99,130,290, respectively.
6. BANK BORROWINGS
The Trust (excluding the money market funds and certain other funds in the Trust) and Wells Fargo Variable Trust are parties to a $150,000,000 revolving credit agreement whereby the Fund is permitted to use bank borrowings for temporary or emergency purposes, such as to fund shareholder redemption requests. Interest under the credit agreement is charged to the Fund based on a borrowing rate equal to the higher of the Federal Funds rate in effect on that day plus 1.25% or the overnight LIBOR rate in effect on that day plus 1.25%. In addition, an annual commitment fee equal to 0.10% of the unused balance is allocated to each participating fund. For the six months ended September 30, 2014, the Fund paid $326 in commitment fees.
During the six months ended September 30, 2014, the Fund had average borrowings outstanding of $21,387 (on an annualized basis) at an average rate of 1.37% and paid interest in the amount of $293.
7. CONCENTRATION RISK
The Fund invests a substantial portion of its assets in utility and telecommunication companies and, therefore, would be more affected by changes in the utility and telecommunication sector than would be a fund whose investments are not heavily weighted in the sector.
8. INDEMNIFICATION
Under the Trust’s organizational documents, the officers and Trustees are indemnified against certain liabilities that may arise out of performance of their duties to the Trust. Additionally, in the normal course of business, the Trust may enter into contracts with service providers that contain a variety of indemnification clauses. The Trust’s maximum exposure under these arrangements is dependent on future claims that may be made against the Fund and, therefore, cannot be estimated.
| | | | | | |
| Other information (unaudited) | | Wells Fargo Advantage Utility and Telecommunications Fund | | | 23 | |
PROXY VOTING INFORMATION
A description of the policies and procedures that the Fund uses to determine how to vote proxies relating to portfolio securities is available without charge, upon request, by calling 1-800-222-8222, visiting our website at wellsfargoadvantagefunds.com, or visiting the SEC website at sec.gov. Information regarding how the Fund voted proxies relating to portfolio securities during the most recent 12-month period ended June 30 is available without charge on the Fund’s website at wellsfargoadvantagefunds.com or by visiting the SEC website at sec.gov.
PORTFOLIO HOLDINGS INFORMATION
The complete portfolio holdings for the Fund are publicly available monthly on the Fund’s website (wellsfargoadvantagefunds.com), on a one-month delayed basis. In addition, top ten holdings information (excluding derivative positions) for the Fund is publicly available on the Fund’s website on a monthly, seven-day or more delayed basis. The Fund files its complete schedule of portfolio holdings with the SEC for the first and third quarters of each fiscal year on Form N-Q, which is available without charge by visiting the SEC website at sec.gov. In addition, the Fund’s Form N-Q may be reviewed and copied at the SEC’s Public Reference Room in Washington, DC, and at regional offices in New York City, at 233 Broadway, and in Chicago, at 175 West Jackson Boulevard, Suite 900. Information about the Public Reference Room may be obtained by calling 1-800-SEC-0330.
| | | | |
| 24 | | Wells Fargo Advantage Utility and Telecommunications Fund | | Other information (unaudited) |
BOARD OF TRUSTEES AND OFFICERS
Each of the Trustees and Officers1 listed in the table below acts in identical capacities for each fund in the Wells Fargo Advantage family of funds, which consists of 133 mutual funds comprising the Wells Fargo Funds Trust, Wells Fargo Variable Trust, Wells Fargo Master Trust and four closed-end funds (collectively the “Fund Complex”). This table should be read in conjunction with the Prospectus and the Statement of Additional Information2. The mailing address of each Trustee and Officer is 525 Market Street, 12th Floor, San Francisco, CA 94105. Each Trustee and Officer serves an indefinite term, however, each Trustee serves such term until reaching the mandatory retirement age established by the Trustees.
Independent Trustees
| | | | | | |
Name and
year of birth | | Position held and
length of service* | | Principal occupations during past five years or longer | | Other
directorships during
past five years |
| Peter G. Gordon (Born 1942) | | Trustee, since 1998; Chairman, since 2005 | | Co-Founder, Retired Chairman, President and CEO of Crystal Geyser Water Company. Trustee Emeritus, Colby College. | | Asset Allocation Trust |
| Isaiah Harris, Jr. (Born 1952) | | Trustee, since 2009 | | Retired. Prior thereto, President and CEO of BellSouth Advertising and Publishing Corp. from 2005 to 2007, President and CEO of BellSouth Enterprises from 2004 to 2005 and President of BellSouth Consumer Services from 2000 to 2003. Emeritus member of the Iowa State University Foundation Board of Governors. Emeritus Member of the Advisory Board of Iowa State University School of Business. Advisory Board Member, Palm Harbor Academy. Mr. Harris is a certified public accountant. | | CIGNA Corporation; Asset Allocation Trust |
| Judith M. Johnson (Born 1949) | | Trustee, since 2008;
Audit Committee
Chairman, since 2008 | | Retired. Prior thereto, Chief Executive Officer and Chief Investment Officer of Minneapolis Employees Retirement Fund from 1996 to 2008. Ms. Johnson is an attorney, certified public accountant and a certified managerial accountant. | | Asset Allocation Trust |
| Leroy Keith, Jr. (Born 1939) | | Trustee, since 2010 | | Chairman, Bloc Global Services (development and construction). Trustee of the Evergreen Funds complex (and its predecessors) from 1983 to 2010. Former Managing Director, Almanac Capital Management (commodities firm), former Partner, Stonington Partners, Inc. (private equity fund), former Director, Obagi Medical Products Co. and former Director, Lincoln Educational Services. | | Trustee, Virtus Fund Complex (consisting of 50 portfolios as of 12/16/2013); Asset Allocation Trust |
| David F. Larcker (Born 1950) | | Trustee, since 2009 | | James Irvin Miller Professor of Accounting at the Graduate School of Business, Stanford University, Morgan Stanley Director of the Center for Leadership Development and Research and Senior Faculty of The Rock Center for Corporate Governance since 2006. From 2005 to 2008, Professor of Accounting at the Graduate School of Business, Stanford University. Prior thereto, Ernst & Young Professor of Accounting at The Wharton School, University of Pennsylvania from 1985 to 2005. | | Asset Allocation Trust |
| Olivia S. Mitchell (Born 1953) | | Trustee, since 2006 | | International Foundation of Employee Benefit Plans Professor, Wharton School of the University of Pennsylvania since 1993. Director of Wharton’s Pension Research Council and Boettner Center on Pensions & Retirement Research, and Research Associate at the National Bureau of Economic Research. Previously, Cornell University Professor from 1978 to 1993. | | Asset Allocation Trust |
| Timothy J. Penny (Born 1951) | | Trustee, since 1996 | | President and CEO of Southern Minnesota Initiative Foundation, a non-profit organization, since 2007 and Senior Fellow at the Humphrey Institute Policy Forum at the University of Minnesota since 1995. Member of the Board of Trustees of NorthStar Education Finance, Inc., a non-profit organization, since 2007. | | Asset Allocation Trust |
| | | | | | |
| Other information (unaudited) | | Wells Fargo Advantage Utility and Telecommunications Fund | | | 25 | |
| | | | | | |
Name and
year of birth | | Position held and
length of service* | | Principal occupations during past five years or longer | | Other
directorships during
past five years |
| Michael S. Scofield (Born 1943) | | Trustee, since 2010 | | Served on the Investment Company Institute’s Board of Governors and Executive Committee from 2008-2011 as well the Governing Council of the Independent Directors Council from 2006-2011 and the Independent Directors Council Executive Committee from 2008-2011. Chairman of the IDC from 2008-2010. Institutional Investor (Fund Directions) Trustee of Year in 2007. Trustee of the Evergreen Funds complex (and its predecessors) from 1984 to 2010. Chairman of the Evergreen Funds from 2000-2010. Former Trustee of the Mentor Funds. Retired Attorney, Law Offices of Michael S. Scofield. | | Asset Allocation Trust |
| Donald C. Willeke (Born 1940) | | Trustee, since 1996 | | Principal of the law firm of Willeke & Daniels. General Counsel of the Minneapolis Employees Retirement Fund from 1984 until its consolidation into the Minnesota Public Employees Retirement Association on June 30, 2010. Director and Vice Chair of The Tree Trust (non-profit corporation). Director of the American Chestnut Foundation (non-profit corporation). | | Asset Allocation Trust |
| * | Length of service dates reflect the Trustee’s commencement of service with the Trust’s predecessor entities, where applicable. |
Officers
| | | | | | |
Name and
year of birth | | Position held and
length of service | | Principal occupations during past five years or longer | | |
Karla M. Rabusch
(Born 1959) | | President, since 2003 | | Executive Vice President of Wells Fargo Bank, N.A. and President of Wells Fargo Funds Management, LLC since 2003. | | |
Nancy Wiser1
(Born 1967) | | Treasurer, since 2012 | | Executive Vice President of Wells Fargo Funds Management, LLC since 2011. Chief Operating Officer and Chief Compliance Officer at LightBox Capital Management LLC, from 2008 to 2011. Owned and operated a consulting business providing services to various hedge funds including acting as Chief Operating Officer and Chief Compliance Officer for a hedge fund from 2007 to 2008. Chief Operating Officer and Chief Compliance Officer of GMN Capital LLC from 2006 to 2007. | | |
C. David Messman
(Born 1960) | | Secretary, since 2000; Chief Legal Officer, since 2003 | | Assistant General Counsel of Wells Fargo Bank, N.A. since 2013 and Vice President and Managing Counsel of Wells Fargo Bank N.A. from 1996 to 2013. Senior Vice President and Secretary of Wells Fargo Funds Management, LLC since 2001. | | |
Debra Ann Early
(Born 1964) | | Chief Compliance Officer, since 2007 | | Senior Vice President and Chief Compliance Officer of Wells Fargo Funds Management, LLC since 2007. Chief Compliance Officer of Parnassus Investments from 2005 to 2007. Chief Financial Officer of Parnassus Investments from 2004 to 2007. | | |
David Berardi
(Born 1975) | | Assistant Treasurer, since 2009 | | Vice President of Wells Fargo Funds Management, LLC since 2009. Vice President of Evergreen Investment Management Company, LLC from 2008 to 2010. Assistant Vice President of Evergreen Investment Services, Inc. from 2004 to 2008. Manager of Fund Reporting and Control for Evergreen Investment Management Company, LLC from 2004 to 2010. | | |
| Jeremy DePalma1 (Born 1974) | | Assistant Treasurer, since 2009 | | Senior Vice President of Wells Fargo Funds Management, LLC since 2009. Senior Vice President of Evergreen Investment Management Company, LLC from 2008 to 2010. Vice President, Evergreen Investment Services, Inc. from 2004 to 2007. Head of the Fund Reporting and Control Team within Fund Administration from 2005 to 2010. | | |
| 1. | Nancy Wiser acts as Treasurer of 73 funds in the Fund Complex. Jeremy DePalma acts as Treasurer of 60 funds and Assistant Treasurer of 73 funds in the Fund Complex. |
| 2. | The Statement of Additional Information includes additional information about the Trustees and is available, without charge, upon request, by calling 1-800-222-8222 or by visiting the website at wellsfargoadvantagefunds.com. |
| | | | |
| 26 | | Wells Fargo Advantage Utility and Telecommunications Fund | | Other information (unaudited) |
BOARD CONSIDERATION OF INVESTMENT ADVISORY AND SUB-ADVISORY AGREEMENTS:
Under Section 15 of the Investment Company Act of 1940 (the “1940 Act”), the Board of Trustees (the “Board”) of Wells Fargo Funds Trust (the “Trust”), all the members of which have no direct or indirect interest in the investment advisory and sub-advisory agreements and are not “interested persons” of the Trust, as defined in the 1940 Act (the “Independent Trustees”), must determine whether to approve the continuation of the Trust’s investment advisory and sub-advisory agreements. In this regard, at in-person meetings held on March 27-28, 2014 (the “March Meeting”) and May 15-16, 2014 (the “May Meeting”, and together with the March Meeting, the “Meetings”), the Board reviewed: (i) an investment advisory agreement with Wells Fargo Funds Management, LLC (“Funds Management”) for Wells Fargo Advantage Utility and Telecommunications Fund (the “Fund”) and (ii) an investment sub-advisory agreement with Crow Point Partners LLC (the “Sub-Adviser”) for the Fund. The investment advisory agreement with Funds Management and the investment sub-advisory agreement with the Sub-Adviser are collectively referred to as the “Advisory Agreements.”
At each of the March Meeting and the May Meeting, the Board received the information, considered the factors and reached the conclusions discussed below, and unanimously approved the renewal of the Advisory Agreements.
At the Meetings, the Board considered the factors and reached the conclusions described below relating to the selection of Funds Management and the Sub-Adviser and the continuation of the Advisory Agreements. Prior to the Meetings, the Trustees conferred extensively among themselves and with representatives of Funds Management about these matters. Also, the Board has adopted a team-based approach, with each team consisting of a sub-set of Trustees, to assist the full Board in the discharge of its duties in reviewing performance and other matters throughout the year. The Independent Trustees were assisted in their evaluation of the Advisory Agreements by independent legal counsel, from whom they received separate legal advice and with whom they met separately.
In providing information to the Board, Funds Management and the Sub-Adviser were guided by a detailed set of requests for information submitted to them by independent legal counsel on behalf of the Independent Trustees at the start of the Board’s annual contract renewal process earlier in 2014. In considering and approving the Advisory Agreements, the Trustees considered the information they believed relevant, including but not limited to the information discussed below. The Board considered not only the specific information presented in connection with the Meetings, but also the knowledge gained over time through interaction with Funds Management and the Sub-Adviser about various topics. In this regard, the Board reviewed reports of Funds Management at each of its quarterly meetings, which included, among other things, portfolio reviews and performance reports. In addition, the Board and the teams mentioned above confer with portfolio managers at various times throughout the year. The Board did not identify any particular information or consideration that was all-important or controlling, and each individual Trustee may have attributed different weights to various factors.
After its deliberations, the Board unanimously approved the continuation of the Advisory Agreements and determined that the compensation payable to Funds Management and the Sub-Adviser is reasonable. The Board considered the continuation of the Advisory Agreements for the Fund as part of its consideration of the continuation of advisory agreements for funds across the complex, but its approvals were made on a fund-by-fund basis. The following summarizes a number of important, but not necessarily all, factors considered by the Board in support of its approvals.
Nature, extent and quality of services
The Board received and considered various information regarding the nature, extent and quality of services provided to the Fund by Funds Management and the Sub-Adviser under the Advisory Agreements. This information included, among other things, a summary of the background and experience of senior management of Funds Management, and the qualifications, background, tenure and responsibilities of each of the portfolio managers primarily responsible for the day-to-day portfolio management of the Fund.
The Board evaluated the ability of Funds Management and the Sub-Adviser to attract and retain qualified investment professionals, including research, advisory and supervisory personnel. The Board further considered the compliance programs and compliance records of Funds Management and the Sub-Adviser. In addition, the Board took into account the full range of services provided to the Fund by Funds Management and its affiliates.
Fund performance and expenses
The Board considered the performance results for the Fund over various time periods ended December 31, 2013. The Board also considered these results in comparison to the performance of funds in a universe that was determined by Lipper Inc. (“Lipper”) to be similar to the Fund (the “Universe”), and in comparison to the Fund’s benchmark index and to other comparative data. Lipper is an independent provider of investment company data. The Board received a description of the methodology used by Lipper to select the mutual funds in the performance Universe. The Board noted
| | | | | | |
| Other information (unaudited) | | Wells Fargo Advantage Utility and Telecommunications Fund | | | 27 | |
that the performance of the Fund (Class A) was higher than the average performance of the Universe for all periods under review. The Board also noted that the performance of the Fund was higher than its benchmark, the S&P Utilities Index, for all periods under review.
The Board also received and considered information regarding the Fund’s net operating expense ratios and their various components, including actual management fees (which reflect fee waivers, if any, and include advisory, administration and transfer agent fees), custodian and other non-management fees, Rule 12b-1 and non-Rule 12b-1 service fees and fee waiver and expense reimbursement arrangements. The Board considered these ratios in comparison to the median ratios of funds in class-specific expense groups that were determined by Lipper to be similar to the Fund (the “Groups”). The Board received a description of the methodology used by Lipper to select the mutual funds in the expense Groups and an explanation of year-to-year variations in the funds comprising such expense Groups and their expense ratios. Based on the Lipper reports, the Board noted that the net operating expense ratios of the Fund were lower than, equal to, or in range of the median net operating expense ratios of the expense Groups.
Based on its consideration of the factors and information it deemed relevant, including those described here, the Board concluded that the overall performance and expense structure of the Fund supported the re-approval of the Advisory Agreements.
Investment advisory and sub-advisory fee rates
The Board reviewed and considered the contractual investment advisory fee rates that are payable by the Fund to Funds Management for investment advisory services (the “Advisory Agreement Rates”), both on a stand-alone basis and on a combined basis with the Fund’s fund-level and class-level contractual administration fee rates (the “Management Rates”). The Board noted that the administration fees payable to Funds Management include transfer agency and sub-transfer agency costs. The Board also reviewed and considered the contractual investment sub-advisory fee rates that are payable by Funds Management to the Sub-Adviser for investment sub-advisory services (the “Sub-Advisory Agreement Rates”).
Among other information reviewed by the Board was a comparison of the Management Rates of the Fund with those of other funds in the expense Groups at a common asset level. The Board noted that the Management Rates of the Fund were in range of the average rates for the Fund’s expense Groups for all share classes.
The Board also received and considered information about the portion of the total advisory fee that was retained by Funds Management after payment of the fee to the Sub-Adviser for sub-advisory services. The Board considered this amount in comparison to the median amount retained by advisers to funds in a sub-advised expense universe that was determined by Lipper to be similar to the Fund. In assessing the reasonableness of this amount, the Board received and evaluated information about the nature and extent of responsibilities retained and risks assumed by Funds Management and not delegated to or assumed by the Sub-Adviser, and about Funds Management’s on-going oversight services. The Board also considered that the sub-advisory fees paid to the Sub-Adviser had been negotiated by Funds Management on an arm’s length basis.
The Board also received and considered information about the nature and extent of services offered and fee rates charged by Funds Management and the Sub-Adviser to other types of clients with investment strategies similar to those of the Fund. In this regard, the Board received information about the significantly greater scope of services, and compliance, reporting and other legal burdens and risks of managing mutual funds compared with those associated with managing assets of non-mutual fund clients such as collective funds or institutional separate accounts.
Based on its consideration of the factors and information it deemed relevant, including those described here, the Board determined that the Advisory Agreement Rates and the Sub-Advisory Agreement Rates were reasonable in light of the services covered by the Advisory Agreements.
Profitability
The Board received and considered information concerning the profitability of Funds Management, as well as the profitability of Wells Fargo as a whole, from providing services to the Fund and the fund family as a whole. Funds Management explained the methodologies and estimates that it used in calculating profitability. Among other things, the Board noted that the levels of profitability reported on a fund-by-fund basis varied widely, depending on factors such as the size and type of fund. The Board did not consider profitability with respect to the Sub-Adviser, as the sub-advisory fees paid to the Sub-Adviser had been negotiated by Funds Management on an arm’s-length basis.
Based on its review, the Board did not deem the profits reported by Funds Management to be at a level that would prevent it from approving the continuation of the Advisory Agreements.
| | | | |
| 28 | | Wells Fargo Advantage Utility and Telecommunications Fund | | Other information (unaudited) |
Economies of scale
With respect to possible economies of scale, the Board noted the existence of breakpoints in the Fund’s advisory fee and administration fee structure, which operate generally to reduce the Fund’s expense ratios as the Fund grows in size. It considered that, for a small fund or a fund that shrinks in size, breakpoints conversely can result in higher fee levels. The Board also considered that fee waiver and expense reimbursement arrangements and competitive fee rates at the outset are means of sharing potential economies of scale with shareholders of the Fund and the fund family as a whole. The Board considered Funds Management’s view that any analyses of potential economies of scale in managing a particular fund are inherently limited in light of the joint and common costs and investments that Funds Management incurs across the fund family as a whole.
The Board concluded that the Fund’s fee and expense arrangements, including contractual breakpoints, constituted a reasonable approach to sharing potential economies of scale with the Fund and its shareholders.
Other benefits to Funds Management and the Sub-Adviser
The Board received and considered information regarding potential “fall-out” or ancillary benefits received by Funds Management, the Sub-Adviser, and their affiliates as a result of their relationships with the Fund. Ancillary benefits could include, among others, benefits directly attributable to other relationships with the Fund and benefits potentially derived from an increase in Funds Management’s and the Sub-Adviser’s business as a result of their relationships with the Fund. The Board noted that various affiliates of Funds Management may receive distribution-related fees, shareholder servicing payments and sub-transfer agency fees in respect of shares sold or held through them and services provided.
The Board also reviewed information about soft dollar credits earned and utilized by the Sub-Adviser, fees earned by Funds Management and the Sub-Adviser from managing a private investment vehicle for the fund family’s securities lending collateral and commissions earned by an affiliated broker from portfolio transactions.
Based on its consideration of the factors and information it deemed relevant, including those described here, the Board did not find that any ancillary benefits received by Funds Management, the Sub-Adviser, and their affiliates were unreasonable.
Conclusion
After considering the above-described factors and based on its deliberations and its evaluation of the information described above, the Board unanimously approved the continuation of the Advisory Agreements for an additional one-year period and determined that the compensation payable to Funds Management and the Sub-Adviser is reasonable.
| | | | | | |
| List of abbreviations | | Wells Fargo Advantage Utility and Telecommunications Fund | | | 29 | |
The following is a list of common abbreviations for terms and entities that may have appeared in this report.
| ACA | — ACA Financial Guaranty Corporation |
| ADR | — American depositary receipt |
| ADS | — American depositary shares |
| AGC | — Assured Guaranty Corporation |
| AGM | — Assured Guaranty Municipal |
| Ambac | — Ambac Financial Group Incorporated |
| AMT | — Alternative minimum tax |
| BAN | — Bond anticipation notes |
| BHAC | — Berkshire Hathaway Assurance Corporation |
| CAB | — Capital appreciation bond |
| CCAB | — Convertible capital appreciation bond |
| CDA | — Community Development Authority |
| CDO | — Collateralized debt obligation |
| DRIVER | — Derivative inverse tax-exempt receipts |
| DW&P | — Department of Water & Power |
| DWR | — Department of Water Resources |
| ECFA | — Educational & Cultural Facilities Authority |
| EDA | — Economic Development Authority |
| EDFA | — Economic Development Finance Authority |
| ETF | — Exchange-traded fund |
| FDIC | — Federal Deposit Insurance Corporation |
| FFCB | — Federal Farm Credit Banks |
| FGIC | — Financial Guaranty Insurance Corporation |
| FHA | — Federal Housing Administration |
| FHLB | — Federal Home Loan Bank |
| FHLMC | — Federal Home Loan Mortgage Corporation |
| FICO | — The Financing Corporation |
| FNMA | — Federal National Mortgage Association |
| GDR | — Global depositary receipt |
| GNMA | — Government National Mortgage Association |
| HCFR | — Healthcare facilities revenue |
| HEFA | — Health & Educational Facilities Authority |
| HEFAR | — Higher education facilities authority revenue |
| HFA | — Housing Finance Authority |
| HFFA | — Health Facilities Financing Authority |
| HUD | — Department of Housing and Urban Development |
| IDA | — Industrial Development Authority |
| IDAG | — Industrial Development Agency |
| KRW | — Republic of Korea won |
| LIBOR | — London Interbank Offered Rate |
| LLC | — Limited liability company |
| LLLP | — Limited liability limited partnership |
| LLP | — Limited liability partnership |
| MBIA | — Municipal Bond Insurance Association |
| MFHR | — Multifamily housing revenue |
| MSTR | — Municipal securities trust receipts |
| MUD | — Municipal Utility District |
| National | — National Public Finance Guarantee Corporation |
| PCFA | — Pollution Control Financing Authority |
| PCL | — Public Company Limited |
| PCR | — Pollution control revenue |
| PFA | — Public Finance Authority |
| PFFA | — Public Facilities Financing Authority |
| PFOTER | — Puttable floating option tax-exempt receipts |
| plc | — Public limited company |
| PUTTER | — Puttable tax-exempt receipts |
| R&D | — Research & development |
| Radian | — Radian Asset Assurance |
| RAN | — Revenue anticipation notes |
| RDA | — Redevelopment Authority |
| RDFA | — Redevelopment Finance Authority |
| REIT | — Real estate investment trust |
| ROC | — Reset option certificates |
| SAVRS | — Select auction variable rate securities |
| SBA | — Small Business Authority |
| SFHR | — Single-family housing revenue |
| SFMR | — Single-family mortgage revenue |
| SPA | — Standby purchase agreement |
| SPDR | — Standard & Poor’s Depositary Receipts |
| STRIPS | — Separate trading of registered interest and |
| TAN | — Tax anticipation notes |
| TIPS | — Treasury inflation-protected securities |
| TRAN | — Tax revenue anticipation notes |
| TTFA | — Transportation Trust Fund Authority |
| TVA | — Tennessee Valley Authority |
This page is intentionally left blank.
This page is intentionally left blank.
This page is intentionally left blank.


For more information
More information about Wells Fargo Advantage Funds is available free upon request. To obtain literature, please write, email, visit the Fund’s website, or call:
Wells Fargo Advantage Funds
P.O. Box 8266
Boston, MA 02266-8266
Email: wfaf@wellsfargo.com
Website: wellsfargoadvantagefunds.com
Individual investors: 1-800-222-8222
Retail investment professionals: 1-888-877-9275
Institutional investment professionals: 1-866-765-0778
This report and the financial statements contained herein are submitted for the general information of the shareholders of Wells Fargo Advantage Funds. If this report is used for promotional purposes, distribution of the report must be accompanied or preceded by a current prospectus. Before investing, please consider the investment objectives, risks, charges, and expenses of the investment. For a current prospectus and, if available, a summary prospectus, containing this information, call 1-800-222-8222 or visit the Fund’s website at wellsfargoadvantagefunds.com. Read the prospectus carefully before you invest or send money.
Wells Fargo Funds Management, LLC, a wholly owned subsidiary of Wells Fargo & Company, provides investment advisory and administrative services for Wells Fargo Advantage Funds. Other affiliates of Wells Fargo & Company provide subadvisory and other services for the Funds. The Funds are distributed by Wells Fargo Funds Distributor, LLC, Member FINRA/SIPC, an affiliate of Wells Fargo & Company.
NOT FDIC INSURED ¡ NO BANK GUARANTEE ¡ MAY LOSE VALUE
© 2014 Wells Fargo Funds Management, LLC. All rights reserved.
| | |
 | | 228306 11-14 SA318/SAR318 09-14 |
Not applicable.
| ITEM 3. | AUDIT COMMITTEE FINANCIAL EXPERT |
Not applicable.
| ITEM 4. | PRINCIPAL ACCOUNTANT FEES AND SERVICES |
Not applicable.
| ITEM 5. | AUDIT COMMITTEE OF LISTED REGISTRANTS |
Not applicable.
A Portfolio of investments is included as part of the report to shareholders filed under Item 1 of this Form.
| ITEM 7. | DISCLOSURE OF PROXY VOTING POLICIES AND PROCEDURES FOR CLOSED-END MANAGEMENT INVESTMENT COMPANIES |
Not applicable.
| ITEM 8. | PORTFOLIO MANAGERS OF CLOSED-END MANAGEMENT INVESTMENT COMPANIES |
Not applicable.
| ITEM 9. | PURCHASES OF EQUITY SECURITIES BY CLOSED-END MANAGEMEENT INVESTMENT COMPANY AND AFFILIATED PURCHASERS |
Not applicable.
| ITEM 10. | SUBMISSION OF MATTERS TO A VOTE OF SECURITY HOLDERS |
There have been no material changes to the procedures by which shareholders may recommend nominees to the Registrant’s board of trustees that have been implemented since the Registrant’s last provided disclosure in response to the requirements of this Item.
| ITEM 11. | CONTROLS AND PROCEDURES |
(a) The President and Treasurer have concluded that the Wells Fargo Funds Trust (the “Trust”) disclosure controls and procedures (as defined in Rule 30a-3(c) under the Investment Company Act of 1940) provide reasonable assurances that material information relating to the Trust is made known to them by the appropriate persons, based on their evaluation of these controls and procedures as of a date within 90 days of the filing of this report.
(b) There were no significant changes in the Trust’s internal controls over financial reporting (as defined in Rule 30a-3(d) under the Investment Company Act of 1940) that occurred during the second fiscal quarter of the period covered by this report that materially affected, or is reasonably likely to materially affect, the registrant’s internal control over financial reporting.
(a)(1) Not applicable.
(a)(2) Certification pursuant to Rule 30a-2(a) under the Investment Company Act of 1940 (17 CFR 270.30a-2(a)) is filed and attached hereto as Exhibit 99.CERT.
(a)(3) Not applicable.
(b) Certification pursuant to Rule 30a-2(b) under the Investment Company Act of 1940 (17 CFR 270.30a-2(b)) is filed and attached hereto as Exhibit 99.906CERT.
SIGNATURES
Pursuant to the requirements of the Securities Exchange Act of 1934 and the Investment Company Act of 1940, the registrant has duly caused this report to be signed on its behalf by the undersigned, thereunto duly authorized.
| | |
| Wells Fargo Funds Trust |
| |
| By: | | |
| | /s/ Karla M. Rabusch |
| |
| | Karla M. Rabusch |
| | President |
| |
| Date: | | November 21, 2014 |
Pursuant to the requirements of the Securities Exchange Act of 1934 and the Investment Company Act of 1940, this report has been signed below by the following persons on behalf of the registrant and in the capacities and on the date indicated.
| | |
| Wells Fargo Funds Trust |
| |
| By: | | |
| | /s/ Karla M. Rabusch |
| |
| | Karla M. Rabusch |
| | President |
| |
| Date: | | November 21, 2014 |
| |
| By: | | |
| | /s/ Nancy Wiser |
| |
| | Nancy Wiser |
| | Treasurer |
| |
| Date: | | November 21, 2014 |