
UNITED STATES
SECURITIES AND EXCHANGE COMMISSION
Washington, D.C. 20549
FORM N-CSRS
CERTIFIED SHAREHOLDER REPORT OF REGISTERED
MANAGEMENT INVESTMENT COMPANIES
Investment Company Act file number: 811-09253
Wells Fargo Funds Trust
(Exact name of registrant as specified in charter)
525 Market St., San Francisco, CA 94105
(Address of principal executive offices) (Zip code)
C. David Messman
Wells Fargo Funds Management, LLC
525 Market St., San Francisco, CA 94105
(Name and address of agent for service)
Registrant’s telephone number, including area code: 800-222-8222
Date of fiscal year end: Registrant is making a filing for 2 of its series.
Wells Fargo Advantage Absolute Return Fund and Wells Fargo Advantage Asset Allocation Fund. Each series has an April 30 fiscal year end.
Date of reporting period: October 31, 2014
| ITEM 1. | REPORT TO STOCKHOLDERS |

Wells Fargo Advantage Absolute Return Fund

Semi-Annual Report
October 31, 2014

Reduce clutter. Save trees.
Sign up for electronic delivery of prospectuses and shareholder reports at wellsfargo.com/advantagedelivery
Contents
The views expressed and any forward-looking statements are as of October 31, 2014, unless otherwise noted, and are those of the Fund managers and/or Wells Fargo Funds Management, LLC. Discussions of individual securities, or the markets generally, or any Wells Fargo Advantage Fund are not intended as individual recommendations. Future events or results may vary significantly from those expressed in any forward-looking statements; the views expressed are subject to change at any time in response to changing circumstances in the market. Wells Fargo Funds Management, LLC and the Fund disclaim any obligation to publicly update or revise any views expressed or forward-looking statements.
NOT FDIC INSURED ¡ NO BANK GUARANTEE ¡ MAY LOSE VALUE
| | | | |
| 2 | | Wells Fargo Advantage Absolute Return Fund | | Letter to shareholders (unaudited) |

Karla M. Rabusch
President
Wells Fargo Advantage Funds
Major central banks continued to inject liquidity into global banks and markets through various accommodative monetary policies, including quantitative easing.
Dear Valued Shareholder:
We are pleased to offer you this semi-annual report for the Wells Fargo Advantage Absolute Return Fund for the six-month period that ended October 31, 2014. The period was marked by continued accommodative monetary policy in developed countries, broader economic growth, low inflation, and equity market gains.
Within equities, U.S. stocks (measured by the S&P 500 Index1) returned 7.12% over the past six months and developed-country international shares (measured by the MSCI EAFE Index (Net)2) declined 4.83%. The U.S. was the fastest-growing developed country, which benefited U.S. companies. In addition, a strong U.S. dollar held back the returns of non-U.S. investments in dollar terms. Most bond sectors gained modestly amid renewed confidence in economic growth that drove outperformance in credit-sensitive sectors as solid economic growth boosted company revenue and profits and kept default rates low. The Barclays U.S. Aggregate Bond Index3 returned 2.35% during the period. Short-term interest rates remained ultralow.
Major central banks continued to provide stimulus.
Major central banks continued to inject liquidity into global banks and markets through various accommodative monetary policies, including quantitative easing. In the U.S., the U.S. Federal Reserve (Fed) kept its key interest rate near zero in order to support the economy and the financial system. It tapered the size of its quantitative easing program each month until the program ended in October 2014 and discussed changes to its forward guidance as it begins to normalize monetary policy. Meanwhile, European markets continued to benefit from the European Central Bank’s (ECB’s) willingness to maintain low interest rates. In September 2014, the ECB cut its key rate to a historic low of 0.05%. In addition to its targeted longer-term refinancing operations that are designed to increase bank lending, the ECB released details of its asset-backed securities purchase program and the new covered bond purchase program, which are scheduled to begin in the fourth quarter of 2014. In Japan, the Bank of Japan maintained an aggressive monetary program aimed at combating deflation.
Economic growth was sluggish outside the U.S.
In the U.S., economic activity continued to expand. The unemployment rate ticked lower to 5.8% as of October 2014. More than 200,000 jobs were added to payrolls each month between February 2014 and October 2014. On the inflation front, the personal consumption expenditures price index rose from a deflationary danger zone toward the Fed’s longer-run objective of a 2% pace.
Elsewhere, economic data continued to show sluggish growth. The European Union’s gross domestic product was unchanged in the second quarter of 2014 and was up only 0.7% from a year earlier. The region’s unemployment rate remained high at 11.5% in September 2014. In Japan, its economy faltered in
| 1. | The S&P 500 Index consists of 500 stocks chosen for market size, liquidity, and industry group representation. It is a market-value-weighted index with each stock’s weight in the index proportionate to its market value. You cannot invest directly in an index. |
| 2. | The Morgan Stanley Capital International Europe, Australasia, and Far East (MSCI EAFE) Index (Net) is an unmanaged group of securities widely regarded by investors to be representations of the stock markets of Europe, Australasia, and the Far East. Calculations for EAFE use net dividends, which reflect the deduction of withholding taxes. You cannot invest directly in an index. Source: MSCI. MSCI makes no express or implied warranties or representations and shall have no liability whatsoever with respect to any MSCI data contained herein. The MSCI data may not be further redistributed or used as a basis for other indexes or any securities or financial products. This report is not approved, reviewed, or produced by MSCI. |
| 3. | The Barclays U.S. Aggregate Bond Index is a broad-based benchmark that measures the investment-grade, U.S. dollar-denominated, fixed-rate taxable bond market, including Treasuries, government-related and corporate securities, MBS (agency fixed-rate and hybrid ARM passthroughs), ABS, and CMBS. You cannot invest directly in an index. |
| | | | | | |
| Letter to shareholders (unaudited) | | Wells Fargo Advantage Absolute Return Fund | | | 3 | |
reaction to a sales tax increase despite Prime Minister Abe’s economic plans to promote growth.
While yields have been at historically low levels, there is a risk of rising rates and negative bond returns. However, fixed-income markets appear to have functioned well over the past year with sufficient liquidity and muted volatility.
Don’t let short-term uncertainty derail long-term investment goals.
Periods of uncertainty can present challenges, but experience has taught us that maintaining long-term investment goals can be an effective way to plan for the future. To help you create a sound strategy based on your personal goals and risk tolerance, Wells Fargo Advantage Funds offers more than 100 mutual funds spanning a wide range of asset classes and investment styles. Although diversification cannot guarantee an investment profit or prevent losses, we believe it can be an effective way to manage investment risk and potentially smooth out overall portfolio performance. We encourage investors to know their investments and to understand that appropriate levels of risk-taking may unlock opportunities.
Thank you for choosing to invest with Wells Fargo Advantage Funds. We appreciate your confidence in us and remain committed to helping you meet your financial needs. For current information about your fund investments, contact your investment professional, visit our website at wellsfargoadvantagefunds.com, or call us directly at 1-800-222-8222. We are available 24 hours a day, 7 days a week.
Sincerely,

Karla M. Rabusch
President
Wells Fargo Advantage Funds
Periods of uncertainty can present challenges, but experience has taught us that maintaining long-term investment goals can be an effective way to plan for the future.
| | | | |
| 4 | | Wells Fargo Advantage Absolute Return Fund | | Performance highlights (unaudited) |
Investment objective
The Fund seeks a positive total return.
Adviser
Wells Fargo Funds Management, LLC
Portfolio managers
Ben Inker, CFA1
Sam Wilderman, CFA1
Average annual total returns2 (%) as of October 31, 2014
| | | | | | | | | | | | | | | | | | | | | | | | | | | | | | | | | | |
| | | | | Including sales charge | | | Excluding sales charge | | | Expense ratios3 (%) | |
| | | Inception date | | 1 year | | | 5 year | | | 10 year | | | 1 year | | | 5 year | | | 10 year | | | Gross | | | Net4 | |
| Class A (WARAX) | | 3-1-2012 | | | (4.06 | ) | | | 4.56 | | | | 6.68 | | | | 1.75 | | | | 5.80 | | | | 7.31 | | | | 1.57 | | | | 1.57 | |
| Class C (WARCX) | | 3-1-2012 | | | 0.03 | | | | 5.01 | | | | 6.51 | | | | 1.03 | | | | 5.01 | | | | 6.51 | | | | 2.32 | | | | 2.32 | |
| Class R6 (WARRX) | | 10-31-2014 | | | – | | | | – | | | | – | | | | 2.21 | | | | 6.09 | | | | 7.54 | | | | 1.09 | | | | 1.09 | |
| Administrator Class (WARDX) | | 3-1-2012 | | | – | | | | – | | | | – | | | | 1.94 | | | | 5.99 | | | | 7.49 | | | | 1.41 | | | | 1.41 | |
| Institutional Class (WABIX) | | 11-30-2012 | | | – | | | | – | | | | – | | | | 2.21 | | | | 6.09 | | | | 7.54 | | | | 1.14 | | | | 1.14 | |
| MSCI World Index (Net)5 | | – | | | – | | | | – | | | | – | | | | 8.67 | | | | 11.41 | | | | 6.93 | | | | – | | | | – | |
| Barclays U.S. TIPS 1-10 Year Index6 | | – | | | – | | | | – | | | | – | | | | 0.60 | | | | 3.21 | | | | 3.96 | | | | – | | | | – | |
| Consumer Price Index7 | | – | | | – | | | | – | | | | – | | | | 1.66 | | | | 1.89 | | | | 2.21 | | | | – | | | | – | |
Figures quoted represent past performance, which is no guarantee of future results, and do not reflect taxes that a shareholder may pay on fund distributions or the redemption of fund shares. Investment return and principal value of an investment will fluctuate so that an investor’s shares, when redeemed, may be worth more or less than their original cost. Performance shown without sales charges would be lower if sales charges were reflected. Current performance may be lower or higher than the performance data quoted, which assumes the reinvestment of dividends and capital gains. Current month-end performance is available on the Fund’s website, wellsfargoadvantagefunds.com.
Index returns do not include transaction costs associated with buying and selling securities, any mutual fund fees or expenses, or any taxes. It is not possible to invest directly in an index.
For Class A shares, the maximum front-end sales charge is 5.75%. For Class C shares, the maximum contingent deferred sales charge is 1.00%. Performance including a contingent deferred sales charge assumes the sales charge for the corresponding time period. Class R6, Administrator Class, and Institutional Class shares are sold without a front-end sales charge or contingent deferred sales charge.
Absolute return funds are not intended to outperform stocks and bonds in strong markets, and there is no guarantee of positive returns or that the fund’s objectives will be achieved. Stock values fluctuate in response to the activities of individual companies and general market and economic conditions. Bond values fluctuate in response to the financial condition of individual issuers, general market and economic conditions, and changes in interest rates. In general, when interest rates rise, bond values fall and investors may lose principal value. Alternative investments such as, commodities and merger arbitrage strategies are speculative and entail a high degree of risk. Foreign investments are especially volatile and can rise or fall dramatically due to differences in the political and economic conditions of the host country. The fund will indirectly be exposed to all of the risks of an investment in the underlying funds and will indirectly bear expenses of the underlying funds. The use of derivatives may reduce returns and/or increase volatility. Certain investment strategies tend to increase the total risk of an investment (relative to the broader market). This fund is exposed to high-yield risk, mortgage- and asset-backed securities risk, and smaller-company securities risk. Consult the fund’s prospectus for additional information on these and other risks.
Please see footnotes on page 6.
| | | | | | |
| Performance highlights (unaudited) | | Wells Fargo Advantage Absolute Return Fund | | | 5 | |
|
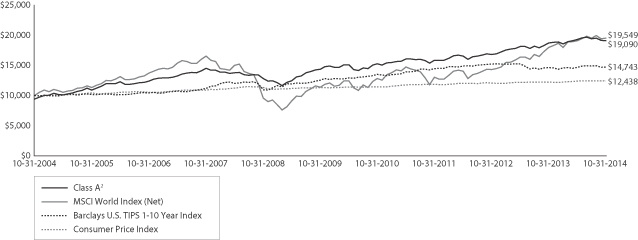
| Growth of $10,000 investment8 as of October 31, 2014 |
|
 |
Please see footnotes on page 6.
| | | | |
| 6 | | Wells Fargo Advantage Absolute Return Fund | | Performance highlights (unaudited) |
| | | | |
| Ten largest holdings9 (%) as of October 31, 2014 | |
GMO Alpha Only Fund, Class IV | | | 9.65 | |
U.S. Treasury Inflation Indexed Bonds, 1.88%, 07/15/2015 | | | 7.27 | |
GMO Systematic Global Macro Opportunity Fund, Class III | | | 4.97 | |
GMO Debt Opportunities Fund, Class VI | | | 4.25 | |
GMO Emerging Country Debt Fund, Class IV | | | 3.47 | |
Amazon.com Incorporation | | | 2.72 | |
GMO Special Opportunities Fund, Class VI | | | 2.05 | |
Philip Morris International Incorporation | | | 2.03 | |
Covidien plc | | | 1.94 | |
Express Scripts Holding Company | | | 1.59 | |
|
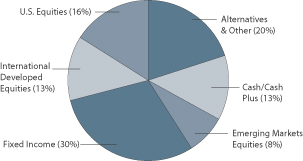
| Portfolio allocation10 as of October 31, 2014 |
|
 |
| 1. | The Fund invests substantially all of its investable assets directly in GMO Benchmark-Free Allocation Fund, an investment company advised by Grantham, Mayo, Van Otterloo & Co. LLC (GMO). Mr. Inker and Mr.Wilderman, co-heads and senior members of GMO’s Asset Allocation Team, have been primarily responsible for coordinating the portfolio management of GMO Benchmark-Free Allocation Fund since 2003 and 2012, respectively. |
| 2. | Historical performance shown for Class A, Class C, and Administrator Class prior to their inception is based on the performance of Class III shares of GMO Benchmark-Free Allocation Fund (GBMFX), in which the Fund invests all of its investable assets. The inception date of GMO Benchmark-Free Allocation Fund Class III shares is July 23, 2003. Returns for the Class III shares do not reflect GMO Benchmark-Free Allocation Fund’s current fee arrangement and have been adjusted downward to reflect the higher expense ratios applicable to Class A, Class C, and Administrator Class at their inception. These ratios were 1.66% for Class A, 2.41% for Class C, and 1.50% for Administrator Class. Historical performance shown for Class R6 shares prior to their inception reflects the performance of the Institutional Class shares, and includes the higher expenses applicable to the Institutional Class shares. If these expenses had not been included, returns would be higher. Historical performance shown for Institutional Class prior to its inception reflects the performance of the Administrator Class, and is not adjusted to reflect Institutional Class expenses. If these expenses had been included, returns for Institutional Class would be higher. |
| 3. | Reflects the expense ratios as stated in the most recent prospectuses, which includes the expenses of GMO Benchmark-Free Allocation Fund and other acquired fund fees and expenses. The expense ratios shown are subject to change and may differ from the annualized expense ratios shown in the financial highlights of this report, which do not include the expenses of GMO Benchmark-Free Allocation Fund and other acquired fund fees and expenses. |
| 4. | The Adviser has committed through August 31, 2015, to waive fees and/or reimburse expenses to the extent necessary to cap the Fund’s Total Annual Fund Operating Expenses After Fee Waiver, excluding certain expenses at 0.76% for Class A, 1.51% for Class C, 0.28% for Class R6, 0.57% for Administrator Class, and 0.33% for Institutional Class. After this time, the cap may be increased or the commitment to maintain the cap may be terminated only with the approval of the Board of Trustees. Brokerage commissions, stamp duty fees, interest, taxes, acquired fund fees and expenses (including the expenses of GMO Benchmark-Free Allocation Fund), and extraordinary expenses are excluded from the cap. Without these caps, the Fund’s returns would have been lower. |
| 5. | The Morgan Stanley Capital International World Index (Net) (“MSCI World Index (Net)”) is a free float-adjusted market capitalization weighted index that is designed to measure the equity market performance of developed markets. You cannot invest directly in an index. Source: MSCI. MSCI makes no express or implied warranties or representations and shall have no liability whatsoever with respect to any MSCI data contained herein. The MSCI data may not be further redistributed or used as a basis for other indexes or any securities or financial products. This report is not approved, reviewed, or produced by MSCI. |
| 6. | The Barclays U.S. TIPS 1-10 Year Index is an independently maintained and widely published index comprised of inflation-protected securities issued by the U.S. Treasury having a maturity of 1-10 years. You cannot invest directly in an index. |
| 7. | The Consumer Price Index for All Urban Consumers in U.S. All Items (Consumer Price Index) is published monthly by the U.S. government as an indicator of changes in price levels (or inflation) paid by urban consumers for a representative basket of goods and services. You cannot invest directly in an index. |
| 8. | The chart compares the performance of Class A shares for the most recent ten years with the performance of the MSCI World Index (Net), Consumer Price Index, and Barclays U.S. TIPS 1-10 Year Index. The chart assumes a hypothetical investment of $10,000 in Class A shares and reflects all operating expenses and assumes the maximum initial sales charge of 5.75%. |
| 9. | The ten largest holdings are calculated based on the value of the securities in the GMO Benchmark-Free Allocation Fund allocable to the Fund divided by the total net assets of the Fund. Holdings are subject to change and may have changed since the date specified. |
| 10. | Portfolio allocation is subject to change and represents the portfolio allocation of the GMO Benchmark-Free Allocation Fund, which is calculated based on the investment exposures of the underlying GMO funds and holdings of GMO Benchmark-Free Allocation Fund. |
| | | | | | |
| Fund expenses (unaudited) | | Wells Fargo Advantage Absolute Return Fund | | | 7 | |
As a shareholder of the Fund, you incur two types of costs: (1) transaction costs, including sales charges (loads) on purchase payments, redemption fees (if any) and exchange fees (if any), and (2) ongoing costs, including management fees, distribution (12b-1) and/or shareholder service fees, and other Fund expenses. This example is intended to help you understand your ongoing costs (in dollars) of investing in the Fund and to compare these costs with the ongoing costs of investing in other mutual funds.
The example is based on an investment of $1,000 invested at the beginning of the six-month period and held for the entire period from May 1, 2014 to October 31, 2014.
Actual expenses
The “Actual” line of the table below provides information about actual account values and actual expenses. You may use the information in this line, together with the amount you invested, to estimate the expenses that you paid over the period. Simply divide your account value by $1,000 (for example, an $8,600 account value divided by $1,000 = 8.6), then multiply the result by the number in the “Actual” line under the heading entitled “Expenses paid during period” for your applicable class of shares to estimate the expenses you paid on your account during this period.
Hypothetical example for comparison purposes
The “Hypothetical” line of the table below provides information about hypothetical account values and hypothetical expenses based on the Fund’s actual expense ratio and an assumed rate of return of 5% per year before expenses, which is not the Fund’s actual return. The hypothetical account values and expenses may not be used to estimate the actual ending account balance or expenses you paid for the period. You may use this information to compare the ongoing costs of investing in the Fund and other funds. To do so, compare this 5% hypothetical example with the 5% hypothetical examples that appear in the shareholder reports of the other funds.
Please note that the expenses shown in the table are meant to highlight your ongoing costs only and do not reflect any transactional costs, such as sales charges (loads), redemption fees, or exchange fees. Therefore, the “Hypothetical” line of the table is useful in comparing ongoing costs only and will not help you determine the relative total costs of owning different funds. In addition, if these transactional costs were included, your costs would have been higher.
| | | | | | | | | | | | | | | | |
| | | Beginning
account value
05-01-2014 | | | Ending
account value
10-31-2014 | | | Expenses
paid during
the period1 | | | Net annualized
expense ratio | |
Class A | | | | | | | | | | | | | | | | |
Actual | | $ | 1,000.00 | | | $ | 987.71 | | | $ | 3.56 | | | | 0.71 | % |
Hypothetical (5% return before expenses) | | $ | 1,000.00 | | | $ | 1,021.63 | | | $ | 3.62 | | | | 0.71 | % |
Class C | | | | | | | | | | | | | | | | |
Actual | | $ | 1,000.00 | | | $ | 984.03 | | | $ | 7.30 | | | | 1.46 | % |
Hypothetical (5% return before expenses) | | $ | 1,000.00 | | | $ | 1,017.85 | | | $ | 7.43 | | | | 1.46 | % |
Class R6 | | | | | | | | | | | | | | | | |
Actual | | $ | 1,000.00 | | | $ | 1,000.00 | | | $ | 1.41 | | | | 0.28 | % |
Hypothetical (5% return before expenses) | | $ | 1,000.00 | | | $ | 1,023.79 | | | $ | 1.43 | | | | 0.28 | % |
Administrator Class | | | | | | | | | | | | | | | | |
Actual | | $ | 1,000.00 | | | $ | 988.62 | | | $ | 2.76 | | | | 0.55 | % |
Hypothetical (5% return before expenses) | | $ | 1,000.00 | | | $ | 1,022.43 | | | $ | 2.80 | | | | 0.55 | % |
Institutional Class | | | | | | | | | | | | | | | | |
Actual | | $ | 1,000.00 | | | $ | 989.51 | | | $ | 1.40 | | | | 0.28 | % |
Hypothetical (5% return before expenses) | | $ | 1,000.00 | | | $ | 1,023.79 | | | $ | 1.43 | | | | 0.28 | % |
Please see footnotes on page 8.
| | | | |
| 8 | | Wells Fargo Advantage Absolute Return Fund | | Fund expenses (unaudited) |
| | | | | | | | | | | | | | | | |
Expenses including GMO Benchmark-Free Allocation Fund and
underlying fund expenses | | Beginning
account value
05-01-2014 | | | Ending
account value
10-31-2014 | | | Expenses
paid during
the period1 | | | Net annualized
expense ratio | |
Class A | | | | | | | | | | | | | | | | |
Actual | | $ | 1,000.00 | | | $ | 987.71 | | | $ | 7.36 | | | | 1.47 | % |
Hypothetical (5% return before expenses) | | $ | 1,000.00 | | | $ | 1,017.80 | | | $ | 7.48 | | | | 1.47 | % |
Class C | | | | | | | | | | | | | | | | |
Actual | | $ | 1,000.00 | | | $ | 984.03 | | | $ | 11.10 | | | | 2.22 | % |
Hypothetical (5% return before expenses) | | $ | 1,000.00 | | | $ | 1,014.01 | | | $ | 11.27 | | | | 2.22 | % |
Class R6 | | | | | | | | | | | | | | | | |
Actual | | $ | 1,000.00 | | | $ | 1,000.00 | | | $ | 5.24 | | | | 1.04 | % |
Hypothetical (5% return before expenses) | | $ | 1,000.00 | | | $ | 1,019.96 | | | $ | 5.30 | | | | 1.04 | % |
Administrator Class | | | | | | | | | | | | | | | | |
Actual | | $ | 1,000.00 | | | $ | 988.62 | | | $ | 6.57 | | | | 1.31 | % |
Hypothetical (5% return before expenses) | | $ | 1,000.00 | | | $ | 1,018.60 | | | $ | 6.67 | | | | 1.31 | % |
Institutional Class | | | | | | | | | | | | | | | | |
Actual | | $ | 1,000.00 | | | $ | 989.51 | | | $ | 5.22 | | | | 1.04 | % |
Hypothetical (5% return before expenses) | | $ | 1,000.00 | | | $ | 1,019.96 | | | $ | 5.30 | | | | 1.04 | % |
| 1. | Expenses paid is equal to the annualized expense ratio of each class multiplied by the average account value over the period, multiplied by the number of days in the most recent fiscal half-year divided by the number of days in the fiscal year (to reflect the one-half-year period). |
| | | | | | |
| Portfolio of investments—October 31, 2014 (unaudited) | | Wells Fargo Advantage Absolute Return Fund | | | 9 | |
| | | | | | | | | | | | |
| Security name | | | | | | Shares | | | Value | |
| | | | |
Investment Companies: 99.94% | | | | | | | | | | | | |
GMO Benchmark-Free Allocation Fund, Class MF (l) | | | | | | | 451,555,075 | | | $ | 12,201,018,116 | |
| | | | | | | | | | | | |
| | | | |
Total Investment Companies (Cost $11,895,335,900) | | | | | | | | | | | 12,201,018,116 | |
| | | | | | | | | | | | |
| | | | | | | | |
| Total investments (Cost $11,895,335,900) * | | | 99.94 | % | | | 12,201,018,116 | |
Other assets and liabilities, net | | | 0.06 | | | | 6,892,493 | |
| | | | | | | | |
| Total net assets | | | 100.00 | % | | $ | 12,207,910,609 | |
| | | | | | | | |
| | | | | | | | |
(l) | | The security represents an affiliate of the Fund as defined in the Investment Company Act of 1940. |
* | | Cost for federal income tax purposes is $11,896,380,488 and unrealized gains (losses) consists of: |
| | Gross unrealized gains | | $ | 304,637,628 | | | |
| | Gross unrealized losses | | | 0 | | | |
| | | | | | | | |
| | Net unrealized gains | | $ | 304,637,628 | | | |
The accompanying notes are an integral part of these financial statements.
| | | | |
| 10 | | Wells Fargo Advantage Absolute Return Fund | | Statement of assets and liabilities—October 31, 2014 (unaudited) |
| | | | |
| | | | |
| |
Assets | | | | |
Investment in affiliated investment companies, at value (cost $11,895,335,900) | | $ | 12,201,018,116 | |
Cash | | | 100,000 | |
Receivable for Fund shares sold | | | 43,037,372 | |
Prepaid expenses and other assets | | | 815,442 | |
| | | | |
Total assets | | | 12,244,970,930 | |
| | | | |
| |
Liabilities | | | | |
Payable for Fund shares redeemed | | | 30,238,013 | |
Advisory and fund level administration fee payable | | | 2,012,921 | |
Distribution fees payable | | | 1,223,059 | |
Administration fees payable | | | 1,572,055 | |
Shareholder servicing fees payable | | | 1,959,453 | |
Accrued expenses and other liabilities | | | 54,820 | |
| | | | |
Total liabilities | | | 37,060,321 | |
| | | | |
Total net assets | | $ | 12,207,910,609 | |
| | | | |
| |
NET ASSETS CONSIST OF | | | | |
Paid-in capital | | $ | 11,761,073,120 | |
Undistributed net investment income | | | 26,621,150 | |
Accumulated net realized gains on investments | | | 114,534,123 | |
Net unrealized gains on investments | | | 305,682,216 | |
| | | | |
Total net assets | | $ | 12,207,910,609 | |
| | | | |
| |
COMPUTATION OF NET ASSET VALUE AND OFFERING PRICE PER SHARE | | | | |
Net assets – Class A | | $ | 2,033,071,353 | |
Shares outstanding – Class A1 | | | 180,674,112 | |
Net asset value per share – Class A | | | $11.25 | |
Maximum offering price per share – Class A2 | | | $11.94 | |
Net assets – Class C | | $ | 1,835,812,163 | |
Shares outstanding – Class C1 | | | 165,550,057 | |
Net asset value per share – Class C | | | $11.09 | |
Net assets – Class R6 | | $ | 25,000 | |
Shares outstanding – Class R61 | | | 2,208 | |
Net asset value per share – Class R6 | | | $11.32 | |
Net assets – Administrator Class | | $ | 4,945,600,795 | |
Shares outstanding – Administrator Class1 | | | 438,176,712 | |
Net asset value per share – Administrator Class | | | $11.29 | |
Net assets – Institutional Class | | $ | 3,393,401,298 | |
Shares outstanding – Institutional Class1 | | | 299,733,961 | |
Net asset value per share – Institutional Class | | | $11.32 | |
| 1. | The Fund has an unlimited number of authorized shares. |
| 2. | Maximum offering price is computed as 100/94.25 of net asset value. On investments of $50,000 or more, the offering price is reduced. |
The accompanying notes are an integral part of these financial statements.
| | | | | | |
| Statement of operations—six months ended October 31, 2014 (unaudited) | | Wells Fargo Advantage Absolute Return Fund | | | 11 | |
| | | | |
| | | | |
| |
Investment income | | | | |
Dividends from affiliated investment companies | | $ | 85,179,985 | |
| | | | |
| |
Expenses | | | | |
Advisory and fund level administration fee | | | 10,959,196 | |
Administration fees | | | | |
Class A | | | 2,907,749 | |
Class C | | | 2,321,121 | |
Class R61 | | | 0 | |
Administrator Class | | | 2,392,654 | |
Institutional Class | | | 1,153,044 | |
Shareholder servicing fees | | | | |
Class A | | | 2,795,913 | |
Class C | | | 2,231,847 | |
Administrator Class | | | 5,911,132 | |
Distribution fees | | | | |
Class C | | | 6,695,542 | |
Custody and accounting fees | | | 17,292 | |
Professional fees | | | 19,790 | |
Registration fees | | | 481,119 | |
Shareholder report expenses | | | 290,223 | |
Trustees’ fees and expenses | | | 4,224 | |
Interest expense | | | 276 | |
Other fees and expenses | | | 54,290 | |
| | | | |
Total expenses | | | 38,235,412 | |
| | | | |
Net investment income | | | 46,944,573 | |
| | | | |
| |
REALIZED AND UNREALIZED GAINS (LOSSES) ON INVESTMENTS | | | | |
| |
Net realized gains (losses) on: | | | | |
Sale of affiliated investment companies | | | (612,867 | ) |
Capital gain distributions from affiliated investment companies | | | 73,005,656 | |
| | | | |
Net realized gains on investments | | | 72,392,789 | |
| | | | |
Net change in unrealized gains (losses) on investments | | | (283,107,174 | ) |
| | | | |
Net realized and unrealized gains (losses) on investments | | | (210,714,385 | ) |
| | | | |
Net decrease in net assets resulting from operations | | $ | (163,769,812 | ) |
| | | | |
| 1. | Class commenced operations on October 31, 2014. |
The accompanying notes are an integral part of these financial statements.
| | | | |
| 12 | | Wells Fargo Advantage Absolute Return Fund | | Statement of changes in net assets |
| | | | | | | | | | | | | | | | | | | | | | | | |
| | | Six months ended
October 31, 2014
(unaudited) | | | Year ended
April 30, 20141 | | | Year ended
September 30, 2013 | |
| | | | | | |
Operations | | | | | | | | | | | | | | | | | | | | | | | | |
Net investment income | | | | | | $ | 46,944,573 | | | | | | | $ | 74,067,536 | | | | | | | $ | 32,051,082 | |
Net realized gains on investments | | | | | | | 72,392,789 | | | | | | | | 42,187,940 | | | | | | | | 12,418 | |
Net change in unrealized gains (losses) on investments | | | | | | | (283,107,174 | ) | | | | | | | 343,524,892 | | | | | | | | 207,533,309 | |
| | | | | | | | | | | | | | | | | | | | | | | | |
Net increase (decrease) in net assets resulting from operations | | | | | | | (163,769,812 | ) | | | | | | | 459,780,368 | | | | | | | | 239,596,809 | |
| | | | | | | | | | | | | | | | | | | | | | | | |
| | | | | | |
Distributions to shareholders from | | | | | | | | | | | | | | | | | | | | | | | | |
Net investment income | | | | | | | | | | | | | | | | | | | | | | | | |
Class A | | | | | | | 0 | | | | | | | | (27,507,548 | ) | | | | | | | (1,729,307 | ) |
Class C | | | | | | | 0 | | | | | | | | (13,062,348 | ) | | | | | | | (641,104 | ) |
Administrator Class | | | | | | | 0 | | | | | | | | (52,881,692 | ) | | | | | | | (4,342,591 | ) |
Institutional Class | | | | | | | 0 | | | | | | | | (24,136,169 | ) | | | | | | | (26,050 | )2 |
Net realized gains | | | | | | | | | | | | | | | | | | | | | | | | |
Class A | | | | | | | 0 | | | | | | | | (509,966 | ) | | | | | | | 0 | |
Class C | | | | | | | 0 | | | | | | | | (355,267 | ) | | | | | | | 0 | |
Administrator Class | | | | | | | 0 | | | | | | | | (929,933 | ) | | | | | | | 0 | |
Institutional Class | | | | | | | 0 | | | | | | | | (352,503 | ) | | | | | | | 0 | 2 |
| | | | | | | | | | | | | | | | | | | | | | | | |
Total distributions to shareholders | | | | | | | 0 | | | | | | | | (119,735,426 | ) | | | | | | | (6,739,052 | ) |
| | | | | | | | | | | | | | | | | | | | | | | | |
| | | | | | |
Capital share transactions | | | Shares | | | | | | | | Shares | | | | | | | | Shares | | | | | |
Proceeds from shares sold | | | | | | | | | | | | | | | | | | | | | | | | |
Class A | | | 45,176,937 | | | | 517,092,660 | | | | 79,282,579 | | | | 883,615,839 | | | | 116,931,716 | | | | 1,250,575,310 | |
Class C | | | 33,158,328 | | | | 375,124,990 | | | | 52,611,704 | | | | 580,341,664 | | | | 74,738,531 | | | | 790,852,229 | |
Class R6 | | | 2,208 | 3 | | | 25,000 | 3 | | | N/A | | | | N/A | | | | N/A | | | | N/A | |
Administrator Class | | | 113,974,196 | | | | 1,307,833,960 | | | | 154,904,463 | | | | 1,731,111,195 | | | | 229,252,464 | | | | 2,445,179,878 | |
Institutional Class | | | 133,142,867 | | | | 1,533,477,629 | | | | 113,083,882 | | | | 1,264,358,346 | | | | 93,667,103 | 2 | | | 1,009,719,128 | 2 |
| | | | | | | | | | | | | | | | | | | | | | | | |
| | | | | | | 3,733,554,239 | | | | | | | | 4,459,427,044 | | | | | | | | 5,496,326,545 | |
| | | | | | | | | | | | | | | | | | | | | | | | |
Reinvestment of distributions | | | | | | | | | | | | | | | | | | | | | | | | |
Class A | | | 0 | | | | 0 | | | | 2,363,014 | | | | 26,302,913 | | | | 154,929 | | | | 1,588,018 | |
Class C | | | 0 | | | | 0 | | | | 995,262 | | | | 10,978,267 | | | | 51,550 | | | | 525,814 | |
Administrator Class | | | 0 | | | | 0 | | | | 3,800,981 | | | | 42,347,513 | | | | 342,110 | | | | 3,510,050 | |
Institutional Class | | | 0 | | | | 0 | | | | 1,978,847 | | | | 22,066,693 | | | | 218 | 2 | | | 2,239 | 2 |
| | | | | | | | | | | | | | | | | | | | | | | | |
| | | | | | | 0 | | | | | | | | 101,695,386 | | | | | | | | 5,626,121 | |
| | | | | | | | | | | | | | | | | | | | | | | | |
Payment for shares redeemed | | | | | | | | | | | | | | | | | | | | | | | | |
Class A | | | (64,388,991 | ) | | | (739,503,194 | ) | | | (20,013,523 | ) | | | (222,913,694 | ) | | | (18,062,305 | ) | | | (192,797,252 | ) |
Class C | | | (9,607,831 | ) | | | (108,129,279 | ) | | | (7,927,993 | ) | | | (87,444,171 | ) | | | (4,998,352 | ) | | | (53,053,507 | ) |
Administrator Class | | | (45,686,878 | ) | | | (520,840,993 | ) | | | (40,834,972 | ) | | | (455,697,237 | ) | | | (67,556,840 | ) | | | (722,769,141 | ) |
Institutional Class | | | (24,062,718 | ) | | | (275,635,257 | ) | | | (13,829,658 | ) | | | (154,375,173 | ) | | | (4,246,580 | )2 | | | (46,292,073 | )2 |
| | | | | | | | | | | | | | | | | | | | | | | | |
| | | | | | | (1,644,108,723 | ) | | | | | | | (920,430,275 | ) | | | | | | | (1,014,911,973 | ) |
| | | | | | | | | | | | | | | | | | | | | | | | |
Net increase in net assets resulting from capital share transactions | | | | | | | 2,089,445,516 | | | | | | | | 3,640,692,155 | | | | | | | | 4,487,040,693 | |
| | | | | | | | | | | | | | | | | | | | | | | | |
Total increase in net assets | | | | | | | 1,925,675,704 | | | | | | | | 3,980,737,097 | | | | | | | | 4,719,898,450 | |
| | | | | | | | | | | | | | | | | | | | | | | | |
| | | | | | |
Net assets | | | | | | | | | | | | | | | | | | | | | | | | |
Beginning of period | | | | | | | 10,282,234,905 | | | | | | | | 6,301,497,808 | | | | | | | | 1,581,599,358 | |
| | | | | | | | | | | | | | | | | | | | | | | | |
End of period | | | | | | $ | 12,207,910,609 | | | | | | | $ | 10,282,234,905 | | | | | | | $ | 6,301,497,808 | |
| | | | | | | | | | | | | | | | | | | | | | | | |
Undistributed (overdistributed) net investment income | | | | | | $ | 26,621,150 | | | | | | | $ | (20,323,423 | ) | | | | | | $ | 23,184,069 | |
| | | | | | | | | | | | | | | | | | | | | | | | |
| 1. | For the seven months ended April 30, 2014. The Fund changed its fiscal year end from September 30 to April 30, effective April 30, 2014. |
| 2. | For the period from November 30, 2012 (commencement of class operations) to September 30, 2013 |
| 3. | Class commenced operations on October 31, 2014. |
The accompanying notes are an integral part of these financial statements.
| | | | | | |
| Financial highlights | | Wells Fargo Advantage Absolute Return Fund | | | 13 | |
(For a share outstanding throughout each period)
| | | | | | | | | | | | | | | | |
| | | Six months ended
October 31, 2014
(unaudited) | | | Year ended
April 30, 20141 | | | Year ended
September 30 | |
| CLASS A | | | | 2013 | | | 20122 | |
Net asset value, beginning of period | | $ | 11.39 | | | $ | 10.94 | | | $ | 10.16 | | | $ | 10.00 | |
Net investment income (loss) | | | 0.06 | | | | 0.10 | | | | 0.08 | | | | (0.02 | )3 |
Net realized and unrealized gains (losses) on investments | | | (0.20 | ) | | | 0.51 | | | | 0.73 | | | | 0.18 | |
| | | | | | | | | | | | | | | | |
Total from investment operations | | | (0.14 | ) | | | 0.61 | | | | 0.81 | | | | 0.16 | |
Distributions to shareholders from | | | | | | | | | | | | | | | | |
Net investment income | | | 0.00 | | | | (0.16 | ) | | | (0.03 | ) | | | 0.00 | |
Net realized gains | | | 0.00 | | | | (0.00 | )4 | | | 0.00 | | | | 0.00 | |
| | | | | | | | | | | | | | | | |
Total distributions to shareholders | | | 0.00 | | | | (0.16 | ) | | | (0.03 | ) | | | 0.00 | |
Net asset value, end of period | | $ | 11.25 | | | $ | 11.39 | | | $ | 10.94 | | | $ | 10.16 | |
Total return5 | | | (1.23 | )% | | | 5.66 | % | | | 8.02 | % | | | 1.60 | % |
Ratios to average net assets (annualized) | | | | | | | | | | | | | | | | |
Gross expenses6 | | | 0.71 | % | | | 0.72 | % | | | 0.73 | % | | | 0.79 | % |
Net expenses6 | | | 0.71 | % | | | 0.72 | % | | | 0.73 | % | | | 0.78 | % |
Net investment income (loss) | | | 0.95 | % | | | 1.55 | % | | | 0.92 | % | | | (0.36 | )% |
Supplemental data | | | | | | | | | | | | | | | | |
Portfolio turnover rate | | | 0 | % | | | 0 | % | | | 0 | % | | | 0 | % |
Net assets, end of period (000s omitted) | | | $2,033,071 | | | | $2,277,448 | | | | $1,512,891 | | | | $398,557 | |
| 1. | For the seven months ended April 30, 2014. The Fund changed its fiscal year end from September 30 to April 30, effective April 30, 2014. |
| 2. | For the period from March 1, 2012 (commencement of class operations) to September 30, 2012 |
| 3. | Calculated based upon average shares outstanding |
| 4. | Amount is less than $0.005. |
| 5. | Total return calculations do not include any sales charges. Returns for periods of less than one year are not annualized. |
| 6. | Ratios do not include the expenses of GMO Benchmark-Free Allocation Fund, Class MF which were as follows: |
| | | | |
Six months ended October 31, 2014 (unaudited) | | | 0.55 | % |
Year ended April 30, 20141 | | | 0.54 | % |
Year ended September 30, 2013 | | | 0.50 | % |
Year ended September 30, 20122 | | | 0.49 | % |
The accompanying notes are an integral part of these financial statements.
| | | | |
| 14 | | Wells Fargo Advantage Absolute Return Fund | | Financial highlights |
(For a share outstanding throughout each period)
| | | | | | | | | | | | | | | | |
| | | Six months ended October 31, 2014 (unaudited) | | | Year ended April 30, 20141 | | | Year ended
September 30 | |
| CLASS C | | | | 2013 | | | 20122 | |
Net asset value, beginning of period | | $ | 11.27 | | | $ | 10.82 | | | $ | 10.11 | | | $ | 10.00 | |
Net investment income (loss) | | | 0.01 | | | | 0.06 | | | | 0.03 | | | | (0.06 | )3 |
Net realized and unrealized gains (losses) on investments | | | (0.19 | ) | | | 0.50 | | | | 0.70 | | | | 0.17 | |
| | | | | | | | | | | | | | | | |
Total from investment operations | | | (0.18 | ) | | | 0.56 | | | | 0.73 | | | | 0.11 | |
Distributions to shareholders from | | | | | | | | | | | | | | | | |
Net investment income | | | 0.00 | | | | (0.11 | ) | | | (0.02 | ) | | | 0.00 | |
Net realized gains | | | 0.00 | | | | (0.00 | )4 | | | 0.00 | | | | 0.00 | |
| | | | | | | | | | | | | | | | |
Total distributions to shareholders | | | 0.00 | | | | (0.11 | ) | | | (0.02 | ) | | | 0.00 | |
Net asset value, end of period | | $ | 11.09 | | | $ | 11.27 | | | $ | 10.82 | | | $ | 10.11 | |
Total return5 | | | (1.60 | )% | | | 5.23 | % | | | 7.20 | % | | | 1.10 | % |
Ratios to average net assets (annualized) | | | | | | | | | | | | | | | | |
Gross expenses6 | | | 1.46 | % | | | 1.47 | % | | | 1.48 | % | | | 1.54 | % |
Net expenses6 | | | 1.46 | % | | | 1.47 | % | | | 1.48 | % | | | 1.53 | % |
Net investment income (loss) | | | 0.00 | % | | | 0.78 | % | | | 0.14 | % | | | (1.11 | )% |
Supplemental data | | | | | | | | | | | | | | | | |
Portfolio turnover rate | | | 0 | % | | | 0 | % | | | 0 | % | | | 0 | % |
Net assets, end of period (000s omitted) | | | $1,835,812 | | | | $1,600,482 | | | | $1,042,487 | | | | $268,171 | |
| 1. | For the seven months ended April 30, 2014. The Fund changed its fiscal year end from September 30 to April 30, effective April 30, 2014. |
| 2. | For the period from March 1, 2012 (commencement of class operations) to September 30, 2012 |
| 3. | Calculated based upon average shares outstanding |
| 4. | Amount is less than $0.005. |
| 5. | Total return calculations do not include any sales charges. Returns for periods of less than one year are not annualized. |
| 6. | Ratios do not include the expenses of GMO Benchmark-Free Allocation Fund, Class MF which were as follows: |
| | | | |
Six months ended October 31, 2014 (unaudited) | | | 0.55 | % |
Year ended April 30, 20141 | | | 0.54 | % |
Year ended September 30, 2013 | | | 0.50 | % |
Year ended September 30, 20122 | | | 0.49 | % |
The accompanying notes are an integral part of these financial statements.
| | | | | | |
| Financial highlights | | Wells Fargo Advantage Absolute Return Fund | | | 15 | |
(For a share outstanding throughout each period)
| | | | |
| CLASS R6 | | Period ended
October 31, 20141
(unaudited) | |
Net asset value, beginning of period | | $ | 11.32 | |
Net investment income | | | 0.00 | |
Net realized and unrealized gains (losses) on investments | | | 0.00 | |
| | | | |
Total from investment operations | | | 0.00 | |
Net asset value, end of period | | $ | 11.32 | |
Total return2 | | | 0 | % |
Ratios to average net assets (annualized) | | | | |
Gross expenses3 | | | 0.00 | % |
Net expenses3 | | | 0.00 | % |
Net investment income | | | 0.00 | % |
Supplemental data | | | | |
Portfolio turnover rate | | | 0 | % |
Net assets, end of period (000s omitted) | | | $25 | |
| 1. | Class commenced operations on October 31, 2014. |
| 2. | Returns for periods of less than one year are not annualized. |
| 3. | Ratios do not include the expenses of GMO Benchmark-Free Allocation Fund. The expenses of GMO Benchmark-Free Allocation Fund, Class MF were 0.55%. |
The accompanying notes are an integral part of these financial statements.
| | | | |
| 16 | | Wells Fargo Advantage Absolute Return Fund | | Financial highlights |
(For a share outstanding throughout each period)
| | | | | | | | | | | | | | | | |
| | | Six months ended
October 31, 2014
(unaudited) | | | Year ended
April 30, 20141 | | | Year ended
September 30 | |
| ADMINISTRATOR CLASS | | | | 2013 | | | 20122 | |
Net asset value, beginning of period | | $ | 11.42 | | | $ | 10.97 | | | $ | 10.17 | | | $ | 10.00 | |
Net investment income (loss) | | | 0.05 | | | | 0.11 | | | | 0.09 | | | | (0.01 | )3 |
Net realized and unrealized gains (losses) on investments | | | (0.18 | ) | | | 0.51 | | | | 0.75 | | | | 0.18 | |
| | | | | | | | | | | | | | | | |
Total from investment operations | | | (0.13 | ) | | | 0.62 | | | | 0.84 | | | | 0.17 | |
Distributions to shareholders from | | | | | | | | | | | | | | | | |
Net investment income | | | 0.00 | | | | (0.17 | ) | | | (0.04 | ) | | | 0.00 | |
Net realized gains | | | 0.00 | | | | (0.00 | )4 | | | 0.00 | | | | 0.00 | |
| | | | | | | | | | | | | | | | |
Total distributions to shareholders | | | 0.00 | | | | (0.17 | ) | | | (0.04 | ) | | | 0.00 | |
Net asset value, end of period | | $ | 11.29 | | | $ | 11.42 | | | $ | 10.97 | | | $ | 10.17 | |
Total return5 | | | (1.14 | )% | | | 5.74 | % | | | 8.25 | % | | | 1.70 | % |
Ratios to average net assets (annualized) | | | | | | | | | | | | | | | | |
Gross expenses6 | | | 0.55 | % | | | 0.55 | % | | | 0.55 | % | | | 0.62 | % |
Net expenses6 | | | 0.55 | % | | | 0.55 | % | | | 0.55 | % | | | 0.59 | % |
Net investment income (loss) | | | 0.91 | % | | | 1.69 | % | | | 1.03 | % | | | (0.16 | )% |
Supplemental data | | | | | | | | | | | | | | | | |
Portfolio turnover rate | | | 0 | % | | | 0 | % | | | 0 | % | | | 0 | % |
Net assets, end of period (000s omitted) | | | $4,945,601 | | | | $4,223,678 | | | | $2,763,630 | | | | $914,872 | |
| 1. | For the seven months ended April 30, 2014. The Fund changed its fiscal year end from September 30 to April 30, effective April 30, 2014. |
| 2. | For the period from March 1, 2012 (commencement of class operations) to September 30, 2012 |
| 3. | Calculated based upon average shares outstanding |
| 4. | Amount is less than $0.005. |
| 5. | Returns for periods of less than one year are not annualized. |
| 6. | Ratios do not include the expenses of GMO Benchmark-Free Allocation Fund, Class MF which were as follows: |
| | | | |
Six months ended October 31, 2014 (unaudited) | | | 0.55 | % |
Year ended April 30, 20141 | | | 0.54 | % |
Year ended September 30, 2013 | | | 0.50 | % |
Year ended September 30, 20122 | | | 0.49 | % |
The accompanying notes are an integral part of these financial statements.
| | | | | | |
| Financial highlights | | Wells Fargo Advantage Absolute Return Fund | | | 17 | |
(For a share outstanding throughout each period)
| | | | | | | | | | | | |
| INSTITUTIONAL CLASS | | Six months ended
October 31, 2014
(unaudited) | | | Year ended
April 30, 20141 | | | Year ended
September 30, 20132 | |
Net asset value, beginning of period | | $ | 11.44 | | | $ | 10.99 | | | $ | 10.18 | |
Net investment income | | | 0.06 | 1 | | | 0.12 | | | | 0.14 | 3 |
Net realized and unrealized gains (losses) on investments | | | (0.18 | ) | | | 0.52 | | | | 0.71 | |
| | | | | | | | | | | | |
Total from investment operations | | | (0.12 | ) | | | 0.64 | | | | 0.85 | |
Distributions to shareholders from | | | | | | | | | | | | |
Net investment income | | | 0.00 | | | | (0.19 | ) | | | (0.04 | ) |
Net realized gains | | | 0.00 | | | | (0.00 | )4 | | | 0.00 | |
| | | | | | | | | | | | |
Total distributions to shareholders | | | 0.00 | | | | (0.19 | ) | | | (0.04 | ) |
Net asset value, end of period | | $ | 11.32 | | | $ | 11.44 | | | $ | 10.99 | |
Total return5 | | | (1.05 | )% | | | 5.93 | % | | | 8.41 | % |
Ratios to average net assets (annualized) | | | | | | | | | | | | |
Gross expenses6 | | | 0.28 | % | | | 0.29 | % | | | 0.30 | % |
Net expenses6 | | | 0.28 | % | | | 0.29 | % | | | 0.30 | % |
Net investment income | | | 1.01 | % | | | 1.84 | % | | | 1.56 | % |
Supplemental data | | | | | | | | | | | | |
Portfolio turnover rate | | | 0 | % | | | 0 | % | | | 0 | % |
Net assets, end of period (000s omitted) | | | $3,393,401 | | | | $2,180,627 | | | | $982,490 | |
| 1. | For the seven months ended April 30, 2014. The Fund changed its fiscal year end from September 30 to April 30, effective April 30, 2014. |
| 2. | For the period from November 30, 2012 (commencement of class operations) to September 30, 2013 |
| 3. | Calculated based upon average shares outstanding |
| 4. | Amount is less than $0.005. |
| 5. | Returns for periods of less than one year are not annualized. |
| 6. | Ratios do not include the expenses of GMO Benchmark-Free Allocation Fund, Class MF which were as follows: |
| | | | |
Six months ended October 31, 2014 (unaudited) | | | 0.55 | % |
Year ended April 30, 20141 | | | 0.54 | % |
Year ended September 30, 20132 | | | 0.50 | % |
The accompanying notes are an integral part of these financial statements.
| | | | |
| 18 | | Wells Fargo Advantage Absolute Return Fund | | Notes to financial statements (unaudited) |
1. ORGANIZATION
Wells Fargo Funds Trust (the “Trust”), a Delaware statutory trust organized on March 10, 1999, is an open-end management investment company registered under the Investment Company Act of 1940, as amended (the “1940 Act”). These financial statements report on the Wells Fargo Advantage Absolute Return Fund (the “Fund”) which is a diversified series of the Trust.
The Fund invests all of its investable assets in the GMO Benchmark-Free Allocation Fund (the “Benchmark-Free Allocation Fund”), an investment company managed by Grantham, Mayo, Van Otterloo & Co. LLC (“GMO”). Benchmark-Free Allocation Fund is a fund-of-funds that gains its investment exposures primarily by investing in GMO Implementation Fund. In addition, Benchmark-Free Allocation Fund may invest in other GMO Funds (together with GMO Implementation Fund, the “underlying funds”), whether now existing or created in the future. These additional underlying Funds may include, among others, GMO Alpha Only Fund, GMO Debt Opportunities Fund, GMO Emerging Country Debt Fund, GMO Special Opportunities Fund, and GMO Systematic Global Macro Opportunity Fund. GMO Implementation Fund is permitted to invest in any asset class. Benchmark-Free Allocation Fund also may invest in securities or derivatives directly. As of October 31, 2014, the Fund owned 62% of Benchmark-Free Allocation Fund. Because the Fund invests all of its assets in Benchmark-Free Allocation Fund, the shareholders of the Fund bear the fees and expense of Benchmark-Free Allocation Fund which are not included in the Statements of Operations but are incurred indirectly because they are considered in the calculation of the net asset value of Benchmark-Free Allocation Fund. As a result, the Fund’s actual expenses may be higher than those of other mutual funds that invest directly in securities.
2. SIGNIFICANT ACCOUNTING POLICIES
The following significant accounting policies, which are consistently followed in the preparation of the financial statements of the Fund, are in conformity with U.S. generally accepted accounting principles which require management to make estimates and assumptions that affect the reported amounts of assets and liabilities, disclosure of contingent assets and liabilities at the date of the financial statements, and the reported amounts of revenues and expenses during the reporting period. Actual results could differ from those estimates.
Securities valuation
All investments are valued each business day as of the close of regular trading on the New York Stock Exchange (generally 4 p.m. Eastern Time).
The Fund values its investment in Benchmark-Free Allocation Fund at net asset value. The valuation of investments in securities and the underlying funds held by Benchmark-Free Allocation Fund is discussed in the semi-annual report of Benchmark-Free Allocation Fund which is included in the mailing of this shareholder report. An unaudited Consolidated Statement of Assets and Liabilities and an unaudited Consolidated Schedule of Investments for Benchmark-Free Allocation Fund as of October 31, 2014 have also been included as an Appendix in this report for your reference. The unaudited Consolidated Schedule of Investments for Benchmark-Free Allocation Fund includes the holdings of its wholly owned investment in GMO Implementation Fund.
Investment transactions and income recognition
Investment transactions are recorded on a trade date basis. Realized gains and losses resulting from investment transactions are determined on the identified cost basis.
Income dividends and capital gain distributions from Benchmark-Free Allocation Fund are recorded on the ex-dividend date. Capital gain distributions from Benchmark-Free Allocation Fund are treated as realized gains.
Distributions to shareholders
Distributions to shareholders from net investment income and net realized gains, if any, are recorded on the ex-dividend date. Such distributions are determined in conformity with federal income tax regulations, which may differ in amount or character from net investment income and realized gains recognized for purposes of U.S. generally accepted accounting principles.
Federal and other taxes
The Fund intends to continue to qualify as a regulated investment company by distributing substantially all of its investment company taxable income and any net realized capital gains (after reduction for capital loss carryforwards) sufficient to relieve it from all, or substantially all, federal income taxes. Accordingly, no provision for federal income taxes was required.
The Fund’s income and federal excise tax returns and all financial records supporting those returns for the prior three fiscal years are subject to examination by the federal and Delaware revenue authorities. Management has analyzed the
| | | | | | |
| Notes to financial statements (unaudited) | | Wells Fargo Advantage Absolute Return Fund | | | 19 | |
Fund’s tax positions taken on federal, state, and foreign tax returns for all open tax years and does not believe that there are any uncertain tax positions that require recognition of a tax liability.
As of April 30, 2014, the Fund had a qualified late-year ordinary loss of $20,323,423 which was recognized on the first day of the current fiscal year.
Class allocations
The separate classes of shares offered by the Fund differ principally in applicable sales charges, distribution, shareholder servicing, and administration fees. Class specific expenses are charged directly to that share class. Investment income, common expenses, and realized and unrealized gains (losses) on investments are allocated daily to each class of shares based on the relative proportion of net assets of each class.
3. FAIR VALUATION MEASUREMENTS
Fair value measurements of investments are determined within a framework that has established a fair value hierarchy based upon the various data inputs utilized in determining the value of the Fund’s investments. The three-level hierarchy gives the highest priority to unadjusted quoted prices in active markets for identical assets or liabilities (Level 1) and the lowest priority to significant unobservable inputs (Level 3). The Fund’s investments are classified within the fair value hierarchy based on the lowest level of input that is significant to the fair value measurement. The inputs are summarized into three broad levels as follows:
| n | | Level 1 – quoted prices in active markets for identical securities |
| n | | Level 2 – other significant observable inputs (including quoted prices for similar securities, interest rates, prepayment speeds, credit risk, use of amortized cost, etc.) |
| n | | Level 3 – significant unobservable inputs (including the Fund’s own assumptions |
in determining the fair value of investments)
The inputs or methodologies used for valuing investments in securities are not necessarily an indication of the risk associated with investing in those securities.
As of October 31, 2014, Level 2 inputs were used in valuing the Fund’s investment in Benchmark-Free Allocation Fund.
Transfers in and transfers out are recognized at the end of the reporting period. At October 31, 2014, the Fund did not have any transfers into/out of Level 1, Level 2, or Level 3.
4. TRANSACTIONS WITH AFFILIATES
Advisory and administration fee
The Trust has entered into an advisory and administration contract with Wells Fargo Funds Management, LLC (“Funds Management”), an indirect wholly owned subsidiary of Wells Fargo & Company (“Wells Fargo”). The adviser is responsible for implementing investment policies and guidelines.
Pursuant to the contract, Funds Management is entitled to receive an annual advisory and fund level administration fee starting at 0.225% and declining to 0.175% as the average daily net assets of the Fund increase. For the six months ended October 31, 2014, the advisory and fund level administration fee was equivalent to an annual rate of 0.19% of the Fund’s average daily net assets.
Funds Management also provide class level administrative services which includes paying fees and expenses for services provided by the transfer agent, sub-transfer agents, omnibus account servicers and record-keepers, Funds Management is entitled to receive from the Fund an annual class level administration fee which is calculated based on the average daily net assets of each class as follows:
| | | | |
| | | Class level
administration fee | |
Class A, Class C | | | 0.26 | % |
Class R6 | | | 0.03 | |
Administrator Class | | | 0.10 | |
Institutional Class | | | 0.08 | |
| | | | |
| 20 | | Wells Fargo Advantage Absolute Return Fund | | Notes to financial statements (unaudited) |
Funds Management has contractually waived and/or reimbursed advisory and administration fees to the extent necessary to maintain certain net operating expense ratios for the Fund. Waiver of fees and/or reimbursement of expenses by Funds Management were made first from fund level expenses on a proportionate basis and then from class specific expenses. Funds Management has committed through August 31, 2015 to waive fees and/or reimburse expenses to the extent necessary to cap the Fund’s expenses at 0.76% for Class A shares, 1.51% for Class C shares, 0.28% for Class R6 shares, 0.57% for Administrator Class shares, and 0.33% for Institutional Class shares. After this time, the cap may be increased or the commitment to maintain the cap may be terminated only with the approval of the Board of Trustees.
Distribution fees
The Trust has adopted a Distribution Plan for Class C shares of the Fund pursuant to Rule 12b-1 under the 1940 Act. Distribution fees are charged to Class C shares and paid to Wells Fargo Funds Distributor, LLC (“Funds Distributor”), the principal underwriter, at an annual rate of 0.75% of the average daily net assets of Class C shares.
In addition, Funds Distributor is entitled to receive the front-end sales charge from the purchase of Class A shares and a contingent deferred sales charge on the redemption of certain shares. Funds Distributor is also entitled to receive the contingent deferred sales charges from redemptions of Class B and Class C shares. For the six months ended October 31, 2014, Funds Distributor received $522,849 from the sale of Class A shares and $18,668 and $30,497 in contingent deferred sales charges from redemptions of Class A and Class C shares, respectively.
Shareholder servicing fees
The Trust has entered into contracts with one or more shareholder servicing agents, whereby Class A, Class C, and Administrator Class of the Fund is charged a fee at an annual rate of 0.25% of the average daily net assets of each respective class.
A portion of these total shareholder servicing fees were paid to affiliates of Wells Fargo.
5. INVESTMENT TRANSACTIONS
For the six months ended October 31, 2014, the Fund made aggregate purchases and sales of $2,255,836,372 and $7,403,309, respectively, in its investment in Benchmark-Free Allocation Fund.
As a result of its investment in Benchmark-Free Allocation Fund, the Fund incurs purchase premium and redemption fees. These purchase premium and redemption fees are paid by the Fund to Benchmark-Free Allocation Fund to help offset estimated portfolio transaction and related costs incurred as a result of a purchase or redemption order by allocating estimated transaction costs to the purchasing or redeeming shareholder. The Fund is currently charged 0.13% for purchases and redemptions which are reflected in paid in capital. Prior to June 30, 2014, the Fund was charged 0.11% for purchases and redemptions. GMO reassesses these fees annually.
6. BANK BORROWINGS
The Trust (excluding the money market funds and certain other funds in the Trust) and Wells Fargo Variable Trust are parties to a $150,000,000 revolving credit agreement whereby the Fund is permitted to use bank borrowings for temporary or emergency purposes, such as to fund shareholder redemption requests. Interest under the credit agreement is charged to the Fund based on a borrowing rate equal to the higher of the Federal Funds rate in effect on that day plus 1.25% or the overnight LIBOR rate in effect on that day plus 1.25%. In addition, an annual commitment fee equal to 0.10% of the unused balance is allocated to each participating fund. For the six months ended October 31, 2014, the Fund paid $14,472 in commitment fees.
During the six months ended October 31, 2014, the Fund had average borrowings outstanding of $20,146 (on an annualized basis) at an average rate of 1.37% and paid interest in the amount of $276.
7. INDEMNIFICATION
Under the Trust’s organizational documents, the officers and Trustees are indemnified against certain liabilities that may arise out of performance of their duties to the Trust. Additionally, in the normal course of business, the Trust may enter into contracts with service providers that contain a variety of indemnification clauses. The Trust’s maximum exposure under these arrangements is dependent on future claims that may be made against the Fund and, therefore, cannot be estimated.
| | | | | | |
| Notes to financial statements (unaudited) | | Wells Fargo Advantage Absolute Return Fund | | | 21 | |
8. SUBSEQUENT DISTRIBUTION
On December 11, 2014, the Fund declared distributions from long-term capital gains to shareholders of record on December 10, 2014. The per share amounts payable on December 12, 2014 were as follows:
| | | | |
| | | Long-term capital gains | |
Class A | | $ | 0.10662 | |
Class C | | | 0.10662 | |
Class R6 | | | 0.10662 | |
Administrator Class | | | 0.10662 | |
Institutional Class | | | 0.10662 | |
These distributions are not reflected in the accompanying financial statements. The final determination of the source of all distributions is subject to change and made after the Fund’s tax year-end.
| | | | |
| 22 | | Wells Fargo Advantage Absolute Return Fund | | Other information (unaudited) |
PROXY VOTING INFORMATION
A description of the policies and procedures that the Fund uses to determine how to vote proxies relating to portfolio securities is available without charge, upon request, by calling 1-800-222-8222, visiting our website at wellsfargoadvantagefunds.com, or visiting the SEC website at sec.gov. Information regarding how the Fund voted proxies relating to portfolio securities during the most recent 12-month period ended June 30 is available without charge on the Fund’s website at wellsfargoadvantagefunds.com or by visiting the SEC website at sec.gov.
PORTFOLIO HOLDINGS INFORMATION
The complete portfolio holdings for the Fund are publicly available monthly on the Fund’s website (wellsfargoadvantagefunds.com), on a one-month delayed basis. In addition, top ten holdings information (excluding derivative positions) for the Fund is publicly available on the Fund’s website on a monthly, seven-day or more delayed basis. The Fund files its complete schedule of portfolio holdings with the SEC for the first and third quarters of each fiscal year on Form N-Q, which is available without charge by visiting the SEC website at sec.gov. In addition, the Fund’s Form N-Q may be reviewed and copied at the SEC’s Public Reference Room in Washington, DC, and at regional offices in New York City, at 233 Broadway, and in Chicago, at 175 West Jackson Boulevard, Suite 900. Information about the Public Reference Room may be obtained by calling 1-800-SEC-0330.
| | | | | | |
| Other information (unaudited) | | Wells Fargo Advantage Absolute Return Fund | | | 23 | |
BOARD OF TRUSTEES AND OFFICERS
Each of the Trustees and Officers1 listed in the table below acts in identical capacities for each fund in the Wells Fargo Advantage family of funds, which consists of 133 mutual funds comprising the Wells Fargo Funds Trust, Wells Fargo Variable Trust, Wells Fargo Master Trust and four closed-end funds (collectively the “Fund Complex”). This table should be read in conjunction with the Prospectus and the Statement of Additional Information2. The mailing address of each Trustee and Officer is 525 Market Street, 12th Floor, San Francisco, CA 94105. Each Trustee and Officer serves an indefinite term, however, each Trustee serves such term until reaching the mandatory retirement age established by the Trustees.
Independent Trustees
| | | | | | |
Name and year of birth | | Position held and length of service* | | Principal occupations during past five years or longer | | Other directorships during
past five years |
| Peter G. Gordon (Born 1942) | | Trustee, since 1998; Chairman, since 2005 | | Co-Founder, Retired Chairman, President and CEO of Crystal Geyser Water Company. Trustee Emeritus, Colby College. | | Asset Allocation Trust |
| Isaiah Harris, Jr. (Born 1952) | | Trustee, since 2009 | | Retired. Prior thereto, President and CEO of BellSouth Advertising and Publishing Corp. from 2005 to 2007, President and CEO of BellSouth Enterprises from 2004 to 2005 and President of BellSouth Consumer Services from 2000 to 2003. Emeritus member of the Iowa State University Foundation Board of Governors. Emeritus Member of the Advisory Board of Iowa State University School of Business. Advisory Board Member, Palm Harbor Academy. Mr. Harris is a certified public accountant. | | CIGNA Corporation; Asset Allocation Trust |
| Judith M. Johnson (Born 1949) | | Trustee, since 2008;
Audit Committee Chairman, since 2008 | | Retired. Prior thereto, Chief Executive Officer and Chief Investment Officer of Minneapolis Employees Retirement Fund from 1996 to 2008. Ms. Johnson is an attorney, certified public accountant and a certified managerial accountant. | | Asset Allocation Trust |
| Leroy Keith, Jr. (Born 1939) | | Trustee, since 2010** | | Chairman, Bloc Global Services (development and construction). Trustee of the Evergreen Funds complex (and its predecessors) from 1983 to 2010. Former Managing Director, Almanac Capital Management (commodities firm), former Partner, Stonington Partners, Inc. (private equity fund), former Director, Obagi Medical Products Co. and former Director, Lincoln Educational Services. | | Trustee, Virtus Fund Complex (consisting of 50 portfolios as of 12/16/2013); Asset Allocation Trust |
| David F. Larcker (Born 1950) | | Trustee, since 2009 | | James Irvin Miller Professor of Accounting at the Graduate School of Business, Stanford University, Morgan Stanley Director of the Center for Leadership Development and Research and Senior Faculty of The Rock Center for Corporate Governance since 2006. From 2005 to 2008, Professor of Accounting at the Graduate School of Business, Stanford University. Prior thereto, Ernst & Young Professor of Accounting at The Wharton School, University of Pennsylvania from 1985 to 2005. | | Asset Allocation Trust |
| Olivia S. Mitchell (Born 1953) | | Trustee, since 2006 | | International Foundation of Employee Benefit Plans Professor, Wharton School of the University of Pennsylvania since 1993. Director of Wharton’s Pension Research Council and Boettner Center on Pensions & Retirement Research, and Research Associate at the National Bureau of Economic Research. Previously, Cornell University Professor from 1978 to 1993. | | Asset Allocation Trust |
| Timothy J. Penny (Born 1951) | | Trustee, since 1996 | | President and CEO of Southern Minnesota Initiative Foundation, a non-profit organization, since 2007 and Senior Fellow at the Humphrey Institute Policy Forum at the University of Minnesota since 1995. Member of the Board of Trustees of NorthStar Education Finance, Inc., a non-profit organization, since 2007. | | Asset Allocation Trust |
| Michael S. Scofield (Born 1943) | | Trustee, since 2010 | | Served on the Investment Company Institute’s Board of Governors and Executive Committee from 2008-2011 as well the Governing Council of the Independent Directors Council from 2006-2011 and the Independent Directors Council Executive Committee from 2008-2011. Chairman of the IDC from 2008-2010. Institutional Investor (Fund Directions) Trustee of Year in 2007. Trustee of the Evergreen Funds complex (and its predecessors) from 1984 to 2010. Chairman of the Evergreen Funds from 2000-2010. Former Trustee of the Mentor Funds. Retired Attorney, Law Offices of Michael S. Scofield. | | Asset Allocation Trust |
| | | | |
| 24 | | Wells Fargo Advantage Absolute Return Fund | | Other information (unaudited) |
| | | | | | |
Name and year of birth | | Position held and length of service* | | Principal occupations during past five years or longer | | Other directorships during
past five years |
| Donald C. Willeke (Born 1940) | | Trustee, since 1996 | | Principal of the law firm of Willeke & Daniels. General Counsel of the Minneapolis Employees Retirement Fund from 1984 until its consolidation into the Minnesota Public Employees Retirement Association on June 30, 2010. Director and Vice Chair of The Tree Trust (non-profit corporation). Director of the American Chestnut Foundation (non-profit corporation). | | Asset Allocation Trust |
| * | Length of service dates reflect the Trustee’s commencement of service with the Trust’s predecessor entities, where applicable. |
| ** | Leroy Keith, Jr. will retire as a Trustee effective December 31, 2014. |
Officers
| | | | | | |
Name and year of birth | | Position held and
length of service | | Principal occupations during past five years or longer | | |
| Karla M. Rabusch (Born 1959) | | President, since 2003 | | Executive Vice President of Wells Fargo Bank, N.A. and President of Wells Fargo Funds Management, LLC since 2003. | | |
| Jeremy DePalma1 (Born 1974) | | Treasurer, since 2012 | | Senior Vice President of Wells Fargo Funds Management, LLC since 2009. Senior Vice President of Evergreen Investment Management Company, LLC from 2008 to 2010. Vice President, Evergreen Investment Services, Inc. from 2004 to 2007. Head of the Fund Reporting and Control Team within Fund Administration from 2005 to 2010. | | |
| C. David Messman (Born 1960) | | Secretary, since 2000; Chief Legal Officer, since 2003 | | Assistant General Counsel of Wells Fargo Bank, N.A. since 2013 and Vice President and Managing Counsel of Wells Fargo Bank N.A. from 1996 to 2013. Senior Vice President and Secretary of Wells Fargo Funds Management , LLC since 2001. | | |
Debra Ann Early (Born 1964) | | Chief Compliance Officer, since 2007 | | Senior Vice President and Chief Compliance Officer of Wells Fargo Funds Management, LLC since 2007. Chief Compliance Officer of Parnassus Investments from 2005 to 2007. Chief Financial Officer of Parnassus Investments from 2004 to 2007. | | |
David Berardi (Born 1975) | | Assistant Treasurer, since 2009 | | Vice President of Wells Fargo Funds Management, LLC since 2009. Vice President of Evergreen Investment Management Company, LLC from 2008 to 2010. Assistant Vice President of Evergreen Investment Services, Inc. from 2004 to 2008. Manager of Fund Reporting and Control for Evergreen Investment Management Company, LLC from 2004 to 2010. | | |
| 1. | Jeremy DePalma acts as Treasurer of 60 funds and Assistant Treasurer of 73 funds in the Fund Complex. |
| 2. | The Statement of Additional Information includes additional information about the Trustees and is available, without charge, upon request, by calling 1-800-222-8222 or by visiting the website at wellsfargoadvantagefunds.com. |
| | | | | | |
| Other information (unaudited) | | Wells Fargo Advantage Absolute Return Fund | | | 25 | |
BOARD CONSIDERATION OF INVESTMENT ADVISORY AGREEMENT:
Under Section 15 of the Investment Company Act of 1940 (the “1940 Act”), the Board of Trustees (the “Board”) of Wells Fargo Funds Trust (the “Trust”), all the members of which have no direct or indirect interest in the investment advisory and sub-advisory agreements and are not “interested persons” of the Trust, as defined in the 1940 Act (the “Independent Trustees”), must determine whether to approve the continuation of the Trust’s investment advisory agreement. In this regard, at in-person meetings held on March 27-28, 2014 (the “March Meeting”) and May 15-16, 2014 (the “May Meeting”, and together with the March Meeting, the “Meetings”), the Board reviewed an investment advisory agreement (the “Advisory Agreement”) with Wells Fargo Funds Management, LLC (“Funds Management”) for Wells Fargo Advantage Absolute Return Fund (the “Fund”).
The Fund is a gateway feeder fund that invests substantially all of its assets in the GMO Benchmark-Free Allocation Fund (the “GMO Fund”), a series of the GMO Trust, which is overseen by a different board of trustees. The GMO Fund is managed by Grantham Mayo Van Otterloo & Co. LLC (“GMO”). The Fund’s investment objective and principal investment strategies are substantially similar to those of the GMO Fund. References to the Fund and its performance and characteristics are also applicable to the GMO Fund, as relevant.
At the May Meeting, the Board received the information, considered the factors and reached the conclusions discussed below, and unanimously approved the renewal of the Advisory Agreements, as it had done at the March Meeting.
At the Meetings, the Board considered the factors and reached the conclusions described below relating to the selection of Funds Management and the continuation of the Advisory Agreement. Prior to the Meetings, the Trustees conferred extensively among themselves and with representatives of Funds Management about these matters. Also, the Board has adopted a team-based approach, with each team consisting of a sub-set of Trustees, to assist the full Board in the discharge of its duties in reviewing performance and other matters throughout the year. The Independent Trustees were assisted in their evaluation of the Advisory Agreement by independent legal counsel, from whom they received separate legal advice and with whom they met separately.
In providing information to the Board, Funds Management was guided by a detailed set of requests for information submitted to them by independent legal counsel on behalf of the Independent Trustees at the start of the Board’s annual contract renewal process earlier in 2014. In considering and approving the Advisory Agreement, the Trustees considered the information they believed relevant, including but not limited to the information discussed below. The Board considered not only the specific information presented in connection with the Meetings, but also the knowledge gained over time through interaction with Funds Management about various topics. In this regard, the Board reviewed reports at each of its quarterly meetings, which included, among other things, portfolio reviews and performance reports. In addition, the Board and the teams mentioned above confer with portfolio managers at various times throughout the year. The Board did not identify any particular information or consideration that was all-important or controlling, and each individual Trustee may have attributed different weights to various factors.
After its deliberations, the Board unanimously approved the continuation of the Advisory Agreement and determined that the compensation payable to Funds Management is reasonable. The Board considered the continuation of the Advisory Agreement for the Fund as part of its consideration of the continuation of advisory agreements for funds across the complex, but its approvals were made on a fund-by-fund basis. The following summarizes a number of important, but not necessarily all, factors considered by the Board in support of its approvals.
Nature, extent and quality of services
The Board received and considered various information regarding the nature, extent and quality of services provided to the Fund by Funds Management under the Advisory Agreement. This information included, among other things, a summary of the background and experience of senior management of Funds Management.
In light of the gateway feeder nature of the Fund, the Board was advised that the scope of services under the Advisory Agreement would include various responsibilities related to the oversight of the GMO Fund and its performance and investment management activities, as well as fund-level administrative services typically provided by Funds Management under a separate administration agreement.
The Board evaluated the ability of Funds Management to attract and retain qualified investment professionals, including research, advisory and supervisory personnel. The Board further considered the compliance programs and compliance records of Funds Management. In addition, the Board took into account the full range of services provided to the Fund by Funds Management and its affiliates.
| | | | |
| 26 | | Wells Fargo Advantage Absolute Return Fund | | Other information (unaudited) |
Fund performance and expenses
The Board considered the performance results for the Fund over various time periods ended December 31, 2013. The Board also considered these results in comparison to the performance of funds in a universe that was determined by Lipper Inc. (“Lipper”) to be similar to the Fund (the “Universe”), and in comparison to the Fund’s benchmark index and to other comparative data. Lipper is an independent provider of investment company data. The Board received a description of the methodology used by Lipper to select the mutual funds in the performance Universe. The Board noted that the performance of the Fund (Administrator Class) was higher than the average performance of the Universe for all periods under review. The Board also noted that the performance of the Fund was higher than or in range of its benchmarks, the Consumer Price Index, the MSCI World Index (Net) and the Barclays U.S. Treasury Inflation Note 1-10 Year Index, for all periods under review.
The Board also received and considered information regarding the Fund’s net operating expense ratios and their various components, including actual management fees (which reflect fee waivers, if any, and include advisory, administration and transfer agent fees), custodian and other non-management fees, acquired fund fees and expenses, Rule 12b-1 and non-Rule 12b-1 service fees and fee waiver and expense reimbursement arrangements, but excluding purchase premiums, redemption fees and indirect interest expenses, at both the Fund-level and the GMO Fund-level. The Board considered these ratios in comparison to the median ratios of funds in class-specific expense groups that were determined by Lipper to be similar to the Fund (the “Groups”). The Board received a description of the methodology used by Lipper to select the mutual funds in the expense Groups and an explanation of year-to-year variations in the funds comprising such expense Groups and their expense ratios. Based on the Lipper reports, the Board noted that the net operating expense ratios of the Fund, including indirect fees and expenses incurred at the GMO Fund-level, were lower than the median net operating expense ratios of the expense Groups.
Based on its consideration of the factors and information it deemed relevant, including those described here, the Board concluded that the overall performance and expense structure of the Fund supported the re-approval of the Advisory Agreement.
Investment advisory fee rates
The Board reviewed and considered the contractual investment advisory fee rates that are payable by the Fund to Funds Management for investment advisory services (the “Advisory Agreement Rates”), both on a stand-alone basis and on a combined basis with the Fund’s class-level contractual administration fee rates (the “Management Rates”). The Board noted that the Advisory Agreement Rates cover both advisory and fund-level administration services, including fund-level transfer agency and fund-level sub-transfer agency costs.
Among other information reviewed by the Board was a comparison of the Management Rates of the Fund with those of other funds in the expense Groups at a common asset level. The Board noted that the Management Rates of the Fund were lower than the average rates for the Fund’s expense Groups for all share classes. The Board viewed favorably the agreed-upon revision to the advisory fee schedule for the Fund that adds an additional breakpoint.
The Board also received and considered information about the nature and extent of services offered and fee rates charged by GMO to other types of clients with investment strategies similar to those of the GMO Fund. The Board received and considered this information because Fund shareholders incur advisory fees payable to GMO indirectly as acquired fund fees and expenses, even though the GMO Fund, which engages GMO, is overseen by a different board of trustees.
Based on its consideration of the factors and information it deemed relevant, including those described here, the Board determined that the Advisory Agreement Rates were reasonable in light of the services covered by the Advisory Agreement.
Profitability
The Board received and considered information concerning the profitability of Funds Management, as well as the profitability of Wells Fargo as a whole, from providing services to the Fund and the fund family as a whole. Funds Management explained the methodologies and estimates that it used in calculating profitability. Among other things, the Board noted that the levels of profitability reported on a fund-by-fund basis varied widely, depending on factors such as the size and type of fund. Based on its review, the Board did not deem the profits reported by Funds Management to be at a level that would prevent it from approving the continuation of the Advisory Agreement.
Economies of scale
With respect to possible economies of scale, the Board noted the existence of breakpoints in the Fund’s advisory fee structure, which operate generally to reduce the Fund’s expense ratios as the Fund grows in size. It considered that, for a
| | | | | | |
| Other information (unaudited) | | Wells Fargo Advantage Absolute Return Fund | | | 27 | |
small fund or a fund that shrinks in size, breakpoints conversely can result in higher fee levels. The Board took into account the agreed-upon revision to the advisory fee schedule for the Fund that adds an additional breakpoint. The Board also considered that fee waiver and expense reimbursement arrangements and competitive fee rates at the outset are means of sharing potential economies of scale with shareholders of the Fund and the fund family as a whole. The Board considered Funds Management’s view that any analyses of potential economies of scale in managing a particular fund are inherently limited in light of the joint and common costs and investments that Funds Management incurs across the fund family as a whole.
The Board concluded that the Fund’s fee and expense arrangements, including contractual breakpoints, constituted a reasonable approach to sharing potential economies of scale with the Fund and its shareholders.
Other benefits to Funds Management
The Board received and considered information regarding potential “fall-out” or ancillary benefits received by Funds Management and its affiliates as a result of their relationships with the Fund. Ancillary benefits could include, among others, benefits directly attributable to other relationships with the Fund and benefits potentially derived from an increase in Funds Management’s business as a result of its relationship with the Fund. The Board also noted that various affiliates of Funds Management may receive distribution-related fees, shareholder servicing payments and sub-transfer agency fees in respect of shares sold or held through them and services provided.
Based on its consideration of the factors and information it deemed relevant, including those described here, the Board did not find that any ancillary benefits received by Funds Management and its affiliates were unreasonable.
Conclusion
After considering the above-described factors and based on its deliberations and its evaluation of the information described above, the Board unanimously approved the continuation of the Advisory Agreement for an additional one-year period and determined that the compensation payable to Funds Management is reasonable.
| | | | |
| 28 | | Wells Fargo Advantage Absolute Return Fund | | List of abbreviations |
The following is a list of common abbreviations for terms and entities that may have appeared in this report.
| ACA | — ACA Financial Guaranty Corporation |
| ADR | — American depositary receipt |
| ADS | — American depositary shares |
| AGC | — Assured Guaranty Corporation |
| AGM | — Assured Guaranty Municipal |
| Ambac | — Ambac Financial Group Incorporated |
| AMT | — Alternative minimum tax |
| BAN | — Bond anticipation notes |
| BHAC | — Berkshire Hathaway Assurance Corporation |
| CAB | — Capital appreciation bond |
| CCAB | — Convertible capital appreciation bond |
| CDA | — Community Development Authority |
| CDO | — Collateralized debt obligation |
| DRIVER | — Derivative inverse tax-exempt receipts |
| DW&P | — Department of Water & Power |
| DWR | — Department of Water Resources |
| ECFA | — Educational & Cultural Facilities Authority |
| EDA | — Economic Development Authority |
| EDFA | — Economic Development Finance Authority |
| ETF | — Exchange-traded fund |
| FDIC | — Federal Deposit Insurance Corporation |
| FFCB | — Federal Farm Credit Banks |
| FGIC | — Financial Guaranty Insurance Corporation |
| FHA | — Federal Housing Administration |
| FHLB | — Federal Home Loan Bank |
| FHLMC | — Federal Home Loan Mortgage Corporation |
| FICO | — The Financing Corporation |
| FNMA | — Federal National Mortgage Association |
| GDR | — Global depositary receipt |
| GNMA | — Government National Mortgage Association |
| HCFR | — Healthcare facilities revenue |
| HEFA | — Health & Educational Facilities Authority |
| HEFAR | — Higher education facilities authority revenue |
| HFA | — Housing Finance Authority |
| HFFA | — Health Facilities Financing Authority |
| HUD | — Department of Housing and Urban Development |
| IDA | — Industrial Development Authority |
| IDAG | — Industrial Development Agency |
| KRW | — Republic of Korea won |
| LIBOR | — London Interbank Offered Rate |
| LLC | — Limited liability company |
| LLLP | — Limited liability limited partnership |
| LLP | — Limited liability partnership |
| MBIA | — Municipal Bond Insurance Association |
| MFHR | — Multifamily housing revenue |
| MSTR | — Municipal securities trust receipts |
| MUD | — Municipal Utility District |
| National | — National Public Finance Guarantee Corporation |
| PCFA | — Pollution Control Financing Authority |
| PCL | — Public Company Limited |
| PCR | — Pollution control revenue |
| PFA | — Public Finance Authority |
| PFFA | — Public Facilities Financing Authority |
| PFOTER | — Puttable floating option tax-exempt receipts |
| plc | — Public limited company |
| PUTTER | — Puttable tax-exempt receipts |
| R&D | — Research & development |
| Radian | — Radian Asset Assurance |
| RAN | — Revenue anticipation notes |
| RDA | — Redevelopment Authority |
| RDFA | — Redevelopment Finance Authority |
| REIT | — Real estate investment trust |
| ROC | — Reset option certificates |
| SAVRS | — Select auction variable rate securities |
| SBA | — Small Business Authority |
| SFHR | — Single-family housing revenue |
| SFMR | — Single-family mortgage revenue |
| SPA | — Standby purchase agreement |
| SPDR | — Standard & Poor’s Depositary Receipts |
| STRIPS | — Separate trading of registered interest and |
| TAN | — Tax anticipation notes |
| TIPS | — Treasury inflation-protected securities |
| TRAN | — Tax revenue anticipation notes |
| TTFA | — Transportation Trust Fund Authority |
| TVA | — Tennessee Valley Authority |
APPENDIX
GMO Benchmark-Free Allocation Fund
(A Series of GMO Trust)
Consolidated Schedule of Investments
(showing percentage of total net assets)
October 31, 2014 (Unaudited)
| | | | | | | | | | |
Shares /
Par Value ($) | | | Description | | Value ($) | |
| | | | | | | | | | |
| | | | | | COMMON STOCKS (a) — 42.6% | |
| | | |
| | | | | | Argentina — 0.5% | | | | |
| | | 205,700 | | | Aes Tiete SA | | | 1,241,081 | |
| | | 72,700 | | | Banco Bradesco SA | | | 1,070,841 | |
| | | 3,087,500 | | | Banco do Brasil SA | | | 34,551,990 | |
| | | 454,500 | | | Banco Santander Brasil SA | | | 2,444,790 | |
| | | 688,100 | | | Banco Santander Brasil SA ADR | | | 3,770,788 | |
| | | 686,900 | | | Brasil Brokers Participacoes SA | | | 878,711 | |
| | | 616,500 | | | Cia de Saneamento Basico do Estado de Sao Paulo ADR | | | 4,784,040 | |
| | | 145,600 | | | Cia de Saneamento de Minas Gerais-COPASA | | | 1,657,903 | |
| | | 375,500 | | | Companhia de Saneamento Basico do Estado de Sao Paulo | | | 2,938,808 | |
| | | 626,500 | | | Companhia Siderurgica Nacional SA | | | 2,081,271 | |
| | | 533,000 | | | Companhia Siderurgica Nacional SA Sponsored ADR | | | 1,748,240 | |
| | | 103,800 | | | Cosan Logistica SA | | | 173,845 | |
| | | 40,500 | | | Cosan Ltd-Class A | | | 428,895 | |
| | | 103,800 | | | Cosan SA Industria e Comercio | | | 1,448,822 | |
| | | 330,400 | | | CPFL Energia SA | | | 2,477,302 | |
| | | 82,800 | | | CPFL Energia SA ADR | | | 1,233,720 | |
| | | 280,300 | | | Cyrela Brazil Realty SA Empreendimentos e Participacoes | | | 1,392,830 | |
| | | 447,667 | | | Duratex SA | | | 1,609,248 | |
| | | 921,600 | | | EDP-Energias Do Brasil SA | | | 3,597,970 | |
| | | 239,300 | | | Equatorial Energia SA | | | 2,441,418 | |
| | | 99,200 | | | Grendene SA | | | 700,100 | |
| | | 178,500 | | | Grupo BTG Pactual | | | 2,261,082 | |
| | | 372,500 | | | Klabin SA | | | 1,841,529 | |
| | | 557,400 | | | Light SA | | | 4,580,646 | |
| | | 452,400 | | | MRV Engenharia e Participacoes SA | | | 1,496,319 | |
| | | 53,500 | | | Multiplus SA | | | 750,154 | |
| | | 559,900 | | | Petroleo Brasileiro SA | | | 3,298,946 | |
| | | 75,900 | | | Porto Seguro SA | | | 910,329 | |
| | | 160,157 | | | Sul America SA | | | 850,125 | |
| | | 604,700 | | | Tim Participacoes SA | | | 3,287,228 | |
| | | 315,900 | | | Tractebel Energia SA | | | 4,300,392 | |
| | | 407,900 | | | Transmissora Alianca de Energia Eletrica SA | | | 3,031,367 | |
| | | 55,500 | | | Ultrapar Participacoes SA | | | 1,209,525 | |
| | | 125,300 | | | Vale SA | | | 1,263,863 | |
| | | 102,100 | | | Vale SA Sponsored ADR | | | 1,030,189 | |
| | | | | | | | | | |
| | | | | | Total Argentina | | | 102,784,307 | |
| | | | | | | | | | |
| | | |
| | | | | | Australia — 0.0% | | | | |
| | | 716,799 | | | Arrium Ltd | | | 212,810 | |
| | | 61,784 | | | Bank of Queensland Ltd | | | 686,839 | |
| | | | | | | | | | |
Shares /
Par Value ($) | | | Description | | Value ($) | |
| | | | | | | | | | |
| | | | | | Australia — (continued) | | | | |
| | | 216,243 | | | BlueScope Steel Ltd * | | | 1,008,117 | |
| | | 1,019,420 | | | Goodman Fielder Ltd | | | 576,893 | |
| | | 106,775 | | | Investa Office Fund (REIT) | | | 336,886 | |
| | | 276,561 | | | Mirvac Group (REIT) | | | 438,767 | |
| | | 464,159 | | | Pacific Brands Ltd | | | 192,879 | |
| | | 140,654 | | | Stockland (REIT) | | | 525,874 | |
| | | 423,434 | | | TABCORP Holdings Ltd | | | 1,521,046 | |
| | | 204,338 | | | Tatts Group Ltd | | | 625,496 | |
| | | | | | | | | | |
| | | | | | Total Australia | | | 6,125,607 | |
| | | | | | | | | | |
| | | |
| | | | | | Austria — 0.1% | | | | |
| | | 182,553 | | | OMV AG | | | 5,738,195 | |
| | | 155,833 | | | Voestalpine AG | | | 6,242,344 | |
| | | | | | | | | | |
| | | | | | Total Austria | | | 11,980,539 | |
| | | | | | | | | | |
| | | |
| | | | | | Belgium — 0.1% | | | | |
| | | 18,686 | | | Ageas | | | 624,634 | |
| | | 247,226 | | | Belgacom SA | | | 9,337,363 | |
| | | 172,753 | | | Delhaize Group | | | 11,811,962 | |
| | | | | | | | | | |
| | | | | | Total Belgium | | | 21,773,959 | |
| | | | | | | | | | |
| | | |
| | | | | | Canada — 0.3% | | | | |
| | | 2,415 | | | Canadian Tire Corp Ltd-Class A | | | 264,781 | |
| | | 357,029 | | | Catamaran Corp * | | | 17,019,572 | |
| | | 2,100 | | | First Quantum Minerals Ltd | | | 31,676 | |
| | | 16,353 | | | Home Capital Group Inc | | | 783,807 | |
| | | 4,700 | | | RONA Inc | | | 57,340 | |
| | | 621,000 | | | Tim Hortons Inc (b) | | | 50,313,420 | |
| | | | | | | | | | |
| | | | | | Total Canada | | | 68,470,596 | |
| | | | | | | | | | |
| | | |
| | | | | | Chile — 0.0% | | | | |
| | | 2,933,723 | | | Enersis SA | | | 939,157 | |
| | | 113,100 | | | Enersis SA Sponsored ADR | | | 1,785,849 | |
| | | 52,929 | | | ENTEL Chile SA | | | 571,027 | |
| | | | | | | | | | |
| | | | | | Total Chile | | | 3,296,033 | |
| | | | | | | | | | |
| | | |
| | | | | | China — 0.1% | | | | |
| | | 7,350,000 | | | Bank of China Ltd | | | 3,518,084 | |
| | | 5,571,000 | | | China Construction Bank Corp | | | 4,156,517 | |
| | | 499,500 | | | China Mobile Ltd | | | 6,227,915 | |
| | | 1,718,000 | | | CNOOC Ltd | | | 2,685,780 | |
| | | 6,627,000 | | | Industrial & Commercial Bank of China | | | 4,391,486 | |
| | | | | | | | | | |
| | | | | | Total China | | | 20,979,782 | |
| | | | | | | | | | |
| | | |
| | | | | | Czech Republic — 0.1% | | | | |
| | | 648,887 | | | CEZ AS | | | 17,949,616 | |
| | | | | | | | | | |
APPENDIX
GMO Benchmark-Free Allocation Fund
(A Series of GMO Trust)
Consolidated Schedule of Investments — (Continued)
(showing percentage of total net assets)
October 31, 2014 (Unaudited)
| | | | | | | | | | |
Shares /
Par Value ($) | | | Description | | Value ($) | |
| | | | | | | | | | |
| | | | | | Denmark — 0.1% | | | | |
| | | 7,471 | | | AP Moeller-Maersk A/S | | | 17,434,148 | |
| | | 62,597 | | | Carlsberg A/S | | | 5,520,968 | |
| | | 3,786 | | | Jyske Bank A/S (Registered) * | | | 204,136 | |
| | | | | | | | | | |
| | | | | | Total Denmark | | | 23,159,252 | |
| | | | | | | | | | |
| | | |
| | | | | | Egypt — 0.0% | | | | |
| | | 1,114,127 | | | Al Ezz Steel Rebars SAE * | | | 2,534,327 | |
| | | 270,280 | | | Global Telecom Holding GDR * | | | 809,679 | |
| | | 8,028,016 | | | Orascom Telecom Media and Technology Holding SAE * | | | 1,347,540 | |
| | | 106,292 | | | Sidi Kerir Petrochemicals Co | | | 269,482 | |
| | | 675,869 | | | Telecom Egypt Co | | | 1,304,233 | |
| | | | | | | | | | |
| | | | | | Total Egypt | | | 6,265,261 | |
| | | | | | | | | | |
| | | |
| | | | | | Finland — 0.2% | | | | |
| | | 439,234 | | | Fortum Oyj | | | 10,186,620 | |
| | | 1,910 | | | Metso Oyj | | | 62,404 | |
| | | 1,917,393 | | | Nokia Oyj | | | 16,021,534 | |
| | | 464,779 | | | UPM–Kymmene Oyj | | | 7,372,563 | |
| | | | | | | | | | |
| | | | | | Total Finland | | | 33,643,121 | |
| | | | | | | | | | |
| | | |
| | | | | | France — 2.6% | | | | |
| | | 119,445 | | | Alstom SA * | | | 4,169,019 | |
| | | 971,610 | | | ArcelorMittal | | | 12,763,238 | |
| | | 1,832 | | | AXA | | | 42,316 | |
| | | 1,033 | | | BNP Paribas | | | 64,916 | |
| | | 343,186 | | | Bouygues SA | | | 11,865,301 | |
| | | 130,731 | | | Carrefour SA | | | 3,831,766 | |
| | | 34,221 | | | CNP Assurances | | | 639,767 | |
| | | 533,159 | | | Compagnie de Saint-Gobain | | | 22,917,758 | |
| | | 224,957 | | | Compagnie Generale des Etablissements Michelin | | | 19,539,074 | |
| | | 550,538 | | | Credit Agricole SA | | | 8,147,012 | |
| | | 251,368 | | | Electricite de France | | | 7,422,492 | |
| | | 2,301,742 | | | GDF Suez | | | 55,886,111 | |
| | | 363 | | | Lafarge SA | | | 25,192 | |
| | | 3,630,192 | | | Orange | | | 57,794,004 | |
| | | 667,641 | | | Peugeot SA * | | | 7,934,593 | |
| | | 290,529 | | | Renault SA | | | 21,611,366 | |
| | | 180,743 | | | Sanofi | | | 16,400,625 | |
| | | 165,161 | | | Schneider Electric SA | | | 13,012,391 | |
| | | 1,644 | | | Societe Generale | | | 79,226 | |
| | | 2,379,379 | | | Total SA | | | 142,056,675 | |
| | | 108,690 | | | Vallourec SA | | | 3,972,302 | |
| | | 487,281 | | | Veolia Environnement SA | | | 8,093,155 | |
| | | 555,152 | | | Vinci SA | | | 31,687,097 | |
| | | 2,184,365 | | | Vivendi SA | | | 53,362,470 | |
| | | | | | | | | | |
| | | | | | Total France | | | 503,317,866 | |
| | | | | | | | | | |
| | | | | | | | | | |
Shares /
Par Value ($) | | | Description | | Value ($) | |
| | | | | | | | | | |
| | | | | | Germany — 2.1% | | | | |
| | | 576 | | | Allianz SE (Registered) | | | 91,597 | |
| | | 22,677 | | | Aurubis AG | | | 1,183,794 | |
| | | 957,816 | | | BASF SE | | | 84,632,761 | |
| | | 504,560 | | | Bayerische Motoren Werke AG | | | 54,107,856 | |
| | | 1,156,883 | | | Daimler AG | | | 90,200,983 | |
| | | 303,880 | | | Deutsche Lufthansa AG (Registered) | | | 4,501,274 | |
| | | 1,827 | | | Deutsche Bank AG (Registered) | | | 57,133 | |
| | | 1,958,148 | | | Deutsche Telekom AG (Registered) | | | 29,515,785 | |
| | | 10,602 | | | Duerr AG | | | 744,729 | |
| | | 4,008,276 | | | E.ON AG | | | 69,103,053 | |
| | | 8,021 | | | Freenet AG | | | 210,452 | |
| | | 2,727 | | | Hannover Rueck SE | | | 227,615 | |
| | | 283,844 | | | K+S AG (Registered) | | | 7,954,654 | |
| | | 222,789 | | | Kloeckner & Co SE * | | | 2,617,106 | |
| | | 187,668 | | | Metro AG * | | | 5,982,566 | |
| | | 26,302 | | | Muenchener Rueckversicherungs-Gesellschaft AG (Registered) | | | 5,178,543 | |
| | | 1,065,871 | | | RWE AG | | | 37,818,988 | |
| | | 71,462 | | | Salzgitter AG | | | 2,158,073 | |
| | | 44,022 | | | Volkswagen AG | | | 9,388,493 | |
| | | | | | | | | | |
| | | | | | Total Germany | | | 405,675,455 | |
| | | | | | | | | | |
| | | |
| | | | | | Hong Kong — 0.1% | | | | |
| | | 2,098 | | | Cheung Kong Holdings Ltd | | | 37,325 | |
| | | 1,900,608 | | | Esprit Holdings Ltd | | | 2,380,841 | |
| | | 67,052 | | | Link (REIT) | | | 394,738 | |
| | | 425,319 | | | Sun Hung Kai Properties Ltd | | | 6,362,697 | |
| | | 73,500 | | | Swire Pacific Ltd-Class A | | | 965,015 | |
| | | 6,000 | | | Wharf Holdings Ltd (The) | | | 44,493 | |
| | | 356,639 | | | Yue Yuen Industrial Holdings | | | 1,201,836 | |
| | | | | | | | | | |
| | | | | | Total Hong Kong | | | 11,386,945 | |
| | | | | | | | | | |
| | | |
| | | | | | Hungary — 0.0% | | | | |
| | | 858,306 | | | Magyar Telekom Telecommunications Plc * | | | 1,187,892 | |
| | | 16,398 | | | MOL Hungarian Oil and Gas Plc | | | 780,274 | |
| | | 274,174 | | | OTP Bank Plc | | | 4,540,767 | |
| | | | | | | | | | |
| | | | | | Total Hungary | | | 6,508,933 | |
| | | | | | | | | | |
| | | |
| | | | | | India — 0.7% | | | | |
| | | 22,961 | | | Aban Offshore Ltd | | | 231,930 | |
| | | 17,145 | | | ACC Ltd | | | 417,338 | |
| | | 1,347,093 | | | Allahabad Bank | | | 2,521,841 | |
| | | 825,780 | | | Andhra Bank | | | 1,129,206 | |
| | | 1,026,251 | | | Ashok Leyland Ltd * | | | 775,717 | |
| | | 186,693 | | | Aurobindo Pharma Ltd | | | 2,948,740 | |
| | | 4,766 | | | Axis Bank Ltd (c) | | | 34,620 | |
APPENDIX
GMO Benchmark-Free Allocation Fund
(A Series of GMO Trust)
Consolidated Schedule of Investments — (Continued)
(showing percentage of total net assets)
October 31, 2014 (Unaudited)
| | | | | | | | | | |
Shares /
Par Value ($) | | | Description | | Value ($) | |
| | | | | | | | | | |
| | | | | | India — (continued) | | | | |
| | | 12,445 | | | Bajaj Auto Ltd | | | 528,547 | |
| | | 23,036 | | | Bank of Baroda (c) | | | 349,568 | |
| | | 823,721 | | | Bank of India | | | 3,800,956 | |
| | | 1,629,937 | | | Bharat Heavy Electricals Ltd | | | 6,792,833 | |
| | | 50,950 | | | Biocon Ltd | | | 370,719 | |
| | | 1,075,999 | | | Cairn India Ltd | | | 4,975,169 | |
| | | 637,994 | | | Canara Bank Ltd | | | 4,164,678 | |
| | | 799,369 | | | Coal India Ltd | | | 4,799,705 | |
| | | 876,897 | | | DLF Ltd | | | 1,773,987 | |
| | | 284,361 | | | GAIL India Ltd | | | 2,444,959 | |
| | | 33,214 | | | HCL Technologies Ltd | | | 873,720 | |
| | | 829,167 | | | HDFC Bank Ltd (c) | | | 13,470,258 | |
| | | 30,979 | | | Hero MotoCorp Ltd | | | 1,546,436 | |
| | | 1,131,151 | | | Hindalco Industries Ltd | | | 3,006,598 | |
| | | 1,295,822 | | | Housing Development & Infrastructure Ltd * | | | 1,759,535 | |
| | | 29,906 | | | ICICI Bank Ltd | | | 793,521 | |
| | | 15,100 | | | ICICI Bank Ltd Sponsored ADR | | | 851,036 | |
| | | 48,766 | | | IDFC Ltd (c) | | | 126,658 | |
| | | 12,460 | | | Infosys Ltd | | | 826,541 | |
| | | 73,250 | | | Infosys Ltd Sponsored ADR | | | 4,897,495 | |
| | | 79,791 | | | Jai Balaji Industries Ltd * | | | 22,299 | |
| | | 1,763,249 | | | Jaiprakash Associates Ltd | | | 894,408 | |
| | | 10,209 | | | JSW Steel Ltd | | | 208,882 | |
| | | 883,234 | | | Karnataka Bank Ltd | | | 1,788,265 | |
| | | 90,184 | | | Kiri Industries Ltd * | | | 185,882 | |
| | | 122,025 | | | LIC Housing Finance Ltd | | | 718,532 | |
| | | 99,269 | | | Mahindra & Mahindra Ltd | | | 2,097,556 | |
| | | 1,258,927 | | | NHPC Ltd | | | 421,653 | |
| | | 381,463 | | | NMDC Ltd | | | 1,062,795 | |
| | | 1,736,361 | | | NTPC Ltd | | | 4,243,511 | |
| | | 425,790 | | | Oil & Natural Gas Corp Ltd | | | 2,786,613 | |
| | | 70,068 | | | Oil India Ltd | | | 721,377 | |
| | | 577,545 | | | Oriental Bank of Commerce | | | 2,681,378 | |
| | | 691,205 | | | Power Finance Corp | | | 3,154,422 | |
| | | 268,448 | | | Punjab National Bank Ltd (c) | | | 4,063,252 | |
| | | 83,148 | | | Reliance Capital Ltd | | | 641,184 | |
| | | 1,381,668 | | | Reliance Communications Ltd | | | 2,376,980 | |
| | | 23,505 | | | Reliance Industries Ltd | | | 380,900 | |
| | | 152,395 | | | Reliance Infrastructure Ltd | | | 1,574,752 | |
| | | 303,268 | | | Rural Electrification Corp Ltd | | | 1,488,100 | |
| | | 823,521 | | | Sesa Sterlite Ltd | | | 3,431,530 | |
| | | 192,480 | | | State Bank of India | | | 8,461,632 | |
| | | 614,234 | | | Syndicate Bank | | | 1,255,565 | |
| | | 233,702 | | | Tata Global Beverages Ltd | | | 609,324 | |
| | | 1,021,728 | | | Tata Motors Ltd | | | 8,923,020 | |
| | | 19,452 | | | Tata Motors Ltd-Class A | | | 105,965 | |
| | | | | | | | | | |
Shares /
Par Value ($) | | | Description | | Value ($) | |
| | | | | | | | | | |
| | | | | | India — (continued) | | | | |
| | | 946,544 | | | Tata Power Co Ltd | | | 1,455,015 | |
| | | 296,035 | | | Tata Steel Ltd | | | 2,358,667 | |
| | | 105,535 | | | Tech Mahindra Ltd | | | 4,331,743 | |
| | | 15,381 | | | UCO Bank | | | 21,874 | |
| | | 2,377 | | | United Phosphorus Ltd (c) | | | 13,408 | |
| | | 65,523 | | | Wipro Ltd | | | 604,543 | |
| | | 21,281 | | | Yes Bank Ltd (c) | | | 240,842 | |
| | | | | | | | | | |
| | | | | | Total India | | | 129,538,180 | |
| | | | | | | | | | |
| | | |
| | | | | | Indonesia — 0.1% | | | | |
| | | 3,147,300 | | | Adaro Energy Tbk PT | | | 295,965 | |
| | | 12,701,200 | | | Astra International Tbk PT | | | 7,121,703 | |
| | | 1,196,700 | | | Bank Tabungan Negara Persero Tbk PT | | | 110,939 | |
| | | 1,279,200 | | | Gajah Tunggal Tbk PT | | | 152,464 | |
| | | 3,781,500 | | | Global Mediacom Tbk PT | | | 613,739 | |
| | | 5,571,900 | | | Harum Energy Tbk PT | | | 728,983 | |
| | | 620,100 | | | Indo Tambangraya Megah Tbk PT | | | 1,088,039 | |
| | | 537,600 | | | Indosat Tbk PT | | | 163,079 | |
| | �� | 798,700 | | | Media Nusantara Citra Tbk PT | | | 185,162 | |
| | | 32,277,900 | | | MNC Investama Tbk PT | | | 894,815 | |
| | | 3,205,700 | | | Perusahaan Gas Negara Persero Tbk PT | | | 1,579,094 | |
| | | 2,304,700 | | | Ramayana Lestari Sentosa Tbk PT | | | 154,755 | |
| | | 412,200 | | | Tambang Batubara Bukit Asam Persero Tbk PT | | | 442,231 | |
| | | 34,276,700 | | | Telekomunikasi Indonesia Persero Tbk PT | | | 7,806,427 | |
| | | 35,100 | | | Telekomunikasi Indonesia Persero Tbk PT Sponsored ADR | | | 1,591,785 | |
| | | 1,039,700 | | | XL Axiata Tbk PT | | | 475,455 | |
| | | | | | | | | | |
| | | | | | Total Indonesia | | | 23,404,635 | |
| | | | | | | | | | |
| | | |
| | | | | | Ireland — 0.1% | | | | |
| | | 438,975 | | | CRH Plc | | | 9,737,975 | |
| | | 8,574 | | | Smurfit Kappa Group Plc | | | 177,154 | |
| | | | | | | | | | |
| | | | | | Total Ireland | | | 9,915,129 | |
| | | | | | | | | | |
| | | |
| | | | | | Israel — 0.2% | | | | |
| | | 81,294 | | | Bank Hapoalim BM | | | 418,490 | |
| | | 730,757 | | | Bank Leumi Le-Israel * | | | 2,611,433 | |
| | | 341,500 | | | Check Point Software Technologies Ltd * | | | 25,356,375 | |
| | | 606,700 | | | Israel Discount Bank Ltd-Class A * | | | 978,497 | |
| | | 152,249 | | | Partner Communications Co Ltd * | | | 1,018,597 | |
| | | | | | | | | | |
| | | | | | Total Israel | | | 30,383,392 | |
| | | | | | | | | | |
APPENDIX
GMO Benchmark-Free Allocation Fund
(A Series of GMO Trust)
Consolidated Schedule of Investments — (Continued)
(showing percentage of total net assets)
October 31, 2014 (Unaudited)
| | | | | | | | | | |
Shares /
Par Value ($) | | | Description | | Value ($) | |
| | | | | | | | | | |
| | | | | | Italy — 0.7% | | | | |
| | | 5,164,131 | | | A2A SPA | | | 5,178,206 | |
| | | 11,266,416 | | | Enel SPA | | | 57,570,471 | |
| | | 1,196,956 | | | ENI SPA | | | 25,501,020 | |
| | | 9,105 | | | Exor SPA | | | 397,309 | |
| | | 664,954 | | | Finmeccanica SPA * | | | 6,008,793 | |
| | | 1,499,068 | | | Mediaset SPA * | | | 5,021,731 | |
| | | 44,065 | | | Mediolanum SPA | | | 297,091 | |
| | | 19,276 | | | Recordati SPA | | | 333,527 | |
| | | 22,283,435 | | | Telecom Italia SPA * | | | 25,253,400 | |
| | | 10,122,954 | | | Telecom Italia SPA-Di RISP | | | 9,057,429 | |
| | | | | | | | | | |
| | | | | | Total Italy | | | 134,618,977 | |
| | | | | | | | | | |
| | | |
| | | | | | Japan — 3.2% | | | | |
| | | 539,900 | | | Aeon Co Ltd | | | 5,342,222 | |
| | | 75,600 | | | Aisin Seiki Co Ltd | | | 2,518,143 | |
| | | 58,300 | | | Alfresa Holdings Corp | | | 739,822 | |
| | | 676,000 | | | Asahi Glass Co Ltd | | | 3,518,364 | |
| | | 412,000 | | | Asahi Kasei Corp | | | 3,380,959 | |
| | | 15,600 | | | Asatsu-DK Inc | | | 393,691 | |
| | | 72,258 | | | Calsonic Kansei Corp | | | 400,053 | |
| | | 687,822 | | | Canon Inc | | | 21,102,487 | |
| | | 47,200 | | | Central Japan Railway Co | | | 7,039,829 | |
| | | 286,000 | | | Chubu Electric Power Co Inc * | | | 3,431,878 | |
| | | 2,005,935 | | | Cosmo Oil Co Ltd | | | 3,125,615 | |
| | | 71,500 | | | Daihatsu Motor Co Ltd | | | 1,014,796 | |
| | | 150,000 | | | Daikyo Inc | | | 281,998 | |
| | | 68,500 | | | Daito Trust Construction Co Ltd | | | 8,535,152 | |
| | | 131,000 | | | Denki Kagaku Kogyo K K | | | 427,911 | |
| | | 336 | | | Electric Power Development Co Ltd | | | 11,750 | |
| | | 568 | | | FujiFilm Holdings Corp | | | 19,067 | |
| | | 13,401 | | | Fuji Oil Co Ltd | | | 212,819 | |
| | | 106,000 | | | Gunze Ltd | | | 295,002 | |
| | | 59,124 | | | Hakuhodo DY Holdings Inc | | | 584,708 | |
| | | 129,471 | | | Hanwa Co Ltd | | | 466,826 | |
| | | 68,707 | | | Haseko Corp | | | 503,617 | |
| | | 36,400 | | | Hitachi Chemical Co Ltd | | | 641,567 | |
| | | 847,427 | | | Honda Motor Co Ltd | | | 27,091,589 | |
| | | 87,100 | | | Idemitsu Kosan Co Ltd | | | 1,684,481 | |
| | | 262,692 | | | Inpex Corp | | | 3,359,946 | |
| | | 210,100 | | | IT Holdings Corp | | | 3,432,901 | |
| | | 1,866,700 | | | Itochu Corp | | | 22,565,677 | |
| | | 1,508,089 | | | Japan Tobacco Inc | | | 51,454,546 | |
| | | 369,900 | | | JFE Holdings Inc | | | 7,338,804 | |
| | | 523,800 | | | JX Holdings Inc | | | 2,243,775 | |
| | | 191,042 | | | K’s Holdings Corp | | | 5,276,060 | |
| | | 3,307,000 | | | Kawasaki Kisen Kaisha Ltd | | | 7,534,616 | |
| | | 3,824,000 | | | Kobe Steel Ltd | | | 6,075,752 | |
| | | | | | | | | | |
Shares /
Par Value ($) | | | Description | | Value ($) | |
| | | | | | | | | | |
| | | | | | Japan — (continued) | | | | |
| | | 18,286 | | | Kohnan Shoji Co Ltd | | | 209,825 | |
| | | 87,000 | | | Kuraray Co Ltd | | | 1,010,510 | |
| | | 567,500 | | | Kyocera Corp | | | 26,156,884 | |
| | | 46,900 | | | Leopalace21 Corp * | | | 293,756 | |
| | | 2,029,500 | | | Marubeni Corp | | | 13,048,562 | |
| | | 254,704 | | | Medipal Holdings Corp | | | 2,823,184 | |
| | | 1,718,500 | | | Mitsubishi Chemical Holdings Corp | | | 8,465,135 | |
| | | 1,464,069 | | | Mitsubishi Corp | | | 28,707,977 | |
| | | 46,100 | | | Mitsubishi UFJ Lease & Finance Co Ltd | | | 243,387 | |
| | | 142,429 | | | Mitsui Chemicals Inc | | | 412,573 | |
| | | 2,274,667 | | | Mitsui Engineering & Shipbuilding Co Ltd | | | 4,945,051 | |
| | | 1,682,974 | | | Mitsui & Co Ltd | | | 25,411,326 | |
| | | 98,012 | | | Mitsui Mining & Smelting Co Ltd | | | 259,984 | |
| | | 1,641,134 | | | Mitsui OSK Lines Ltd | | | 5,184,925 | |
| | | 62,736 | | | Net One Systems Co Ltd | | | 365,680 | |
| | | 20,000 | | | Nichirei Corp | | | 85,123 | |
| | | 483,200 | | | Nippon Light Metal Co Ltd | | | 713,637 | |
| | | 223,000 | | | Nippon Electric Glass Co Ltd | | | 1,036,960 | |
| | | 545,843 | | | Nippon Telegraph & Telephone Corp | | | 33,961,709 | |
| | | 2,099,000 | | | Nippon Yusen Kabushiki Kaisha | | | 5,441,782 | |
| | | 184,841 | | | Nipro Corp | | | 1,522,905 | |
| | | 7,249,528 | | | Nissan Motor Co Ltd | | | 66,128,011 | |
| | | 84,658 | | | Nisshinbo Holdings Inc | | | 699,144 | |
| | | 152,006 | | | North Pacific Bank Ltd | | | 626,644 | |
| | | 1,287,029 | | | NTT Docomo Inc | | | 21,706,880 | |
| | | 22,100 | | | Okinawa Electric Power Co | | | 673,979 | |
| | | 144 | | | ORIX JREIT Inc (REIT) | | | 191,990 | |
| | | 580,000 | | | Osaka Gas Co Ltd | | | 2,313,522 | |
| | | 14,405 | | | Resona Holdings Inc | | | 82,394 | |
| | | 377,600 | | | Ricoh Co Ltd | | | 3,899,607 | |
| | | 49,400 | | | Round One Corp | | | 298,028 | |
| | | 134,700 | | | Sekisui House Ltd | | | 1,674,979 | |
| | | 28,100 | | | Shimamura Co Ltd | | | 2,471,481 | |
| | | 12,919 | | | Showa Denko KK | | | 17,096 | |
| | | 81,691 | | | Showa Shell Sekiyu KK | | | 700,934 | |
| | | 4,810,200 | | | Sojitz Corp | | | 7,170,199 | |
| | | 197,000 | | | Sumitomo Heavy Industries Ltd | | | 1,080,039 | |
| | | 98,300 | | | Sumitomo Rubber Industries | | | 1,358,608 | |
| | | 1,410,900 | | | Sumitomo Corp | | | 15,053,901 | |
| | | 433,000 | | | Sumitomo Metal Mining Co Ltd | | | 6,006,798 | |
| | | 54,452 | | | Suzuken Co Ltd | | | 1,459,903 | |
| | | 306,626 | | | Takeda Pharmaceutical Co Ltd | | | 13,291,725 | |
| | | 101,478 | | | Tokyo Electric Power Co Inc (The) * | | | 365,901 | |
| | | 1,334,264 | | | Tokyo Electron Ltd (b) | | | 85,545,897 | |
| | | 46,500 | | | TonenGeneral Sekiyu KK | | | 405,852 | |
| | | 166,178 | | | Tosoh Corp | | | 722,638 | |
APPENDIX
GMO Benchmark-Free Allocation Fund
(A Series of GMO Trust)
Consolidated Schedule of Investments — (Continued)
(showing percentage of total net assets)
October 31, 2014 (Unaudited)
| | | | | | | | | | |
Shares /
Par Value ($) | | | Description | | Value ($) | |
| | | | | | | | | | |
| | | | | | Japan — (continued) | | | | |
| | | 354,300 | | | Toyota Tsusho Corp | | | 8,933,708 | |
| | | 514,000 | | | Ube Industries Ltd | | | 795,834 | |
| | | 505,700 | | | UNY Co Ltd | | | 2,680,934 | |
| | | 53,300 | | | West Japan Railway Co | | | 2,540,564 | |
| | | 2,188,067 | | | Yamada Denki Co Ltd | | | 7,014,119 | |
| | | | | | | | | | |
| | | | | | Total Japan | | | 618,258,607 | |
| | | | | | | | | | |
| | | |
| | | | | | Malaysia — 0.0% | | | | |
| | | 118,413 | | | Hong Leong Bank Berhad | | | 526,443 | |
| | | | | | | | | | |
| | | |
| | | | | | Mexico — 0.1% | | | | |
| | | 647,200 | | | America Movil SAB de CV | | | 15,798,152 | |
| | | | | | | | | | |
| | | |
| | | | | | Netherlands — 0.3% | | | | |
| | | 576,356 | | | Aegon NV | | | 4,697,560 | |
| | | 47,473 | | | Corbion NV | | | 767,509 | |
| | | 1,094,851 | | | Fiat Chrysler Automobiles NV | | | 12,249,086 | |
| | | 4,275 | | | ING Groep NV * | | | 61,219 | |
| | | 975,070 | | | Koninklijke Ahold NV | | | 16,331,090 | |
| | | 4,865,138 | | | Koninklijke KPN NV * | | | 16,014,731 | |
| | | 85,275 | | | SNS REAAL NV * (d) | | | — | |
| | | 17,200 | | | VimpelCom Ltd Sponsored ADR | | | 111,456 | |
| | | 60,000 | | | Ziggo NV (b) | | | 2,932,088 | |
| | | | | | | | | | |
| | | | | | Total Netherlands | | | 53,164,739 | |
| | | | | | | | | | |
| | | |
| | | | | | New Zealand — 0.0% | | | | |
| | | 370,005 | | | Chorus Ltd | | | 613,812 | |
| | | 118,103 | | | Fletcher Building Ltd | | | 796,595 | |
| | | 440,754 | | | Spark New Zealand Ltd | | | 1,087,694 | |
| | | | | | | | | | |
| | | | | | Total New Zealand | | | 2,498,101 | |
| | | | | | | | | | |
| | | |
| | | | | | Norway — 0.2% | | | | |
| | | 3,736 | | | DNB ASA | | | 68,639 | |
| | | 10,773 | | | Golden Ocean Group Ltd | | | 13,112 | |
| | | 1,046,663 | | | Statoil ASA | | | 23,953,334 | |
| | | 398,294 | | | Telenor ASA | | | 8,956,293 | |
| | | 2,580 | | | TGS Nopec Geophysical Co ASA | | | 60,185 | |
| | | 245,851 | | | Yara International ASA | | | 11,289,808 | |
| | | | | | | | | | |
| | | | | | Total Norway | | | 44,341,371 | |
| | | | | | | | | | |
| | | |
| | | | | | Peru — 0.0% | | | | |
| | | 27,455 | | | Companhia de Minas Buenaventura SA ADR | | | 252,586 | |
| | | 159,800 | | | Southern Copper Corp. | | | 4,599,044 | |
| | | | | | | | | | |
| | | | | | Total Peru | | | 4,851,630 | |
| | | | | | | | | | |
| | | |
| | | | | | Philippines — 0.0% | | | | |
| | | 16,140 | | | GT Capital Holdings Inc | | | 363,384 | |
| | | | | | | | | | |
Shares /
Par Value ($) | | | Description | | Value ($) | |
| | | | | | | | | | |
| | | | | | Philippines — (continued) | | | | |
| | | 429,500 | | | Puregold Price Club Inc | | | 331,303 | |
| | | | | | | | | | |
| | | | | | Total Philippines | | | 694,687 | |
| | | | | | | | | | |
| | | |
| | | | | | Poland — 0.2% | | | | |
| | | 16,336 | | | Asseco Poland SA | | | 242,502 | |
| | | 255,069 | | | Boryszew SA * | | | 484,911 | |
| | | 58,486 | | | Energa SA | | | 434,966 | |
| | | 105,647 | | | Jastrzebska Spolka Weglowa SA * | | | 907,888 | |
| | | 728,615 | | | KGHM Polska Miedz SA | | | 28,101,474 | |
| | | 1,176,305 | | | PGE SA | | | 7,717,795 | |
| | | 78,352 | | | Polski Koncern Naftowy Orlen SA | | | 976,125 | |
| | | 635,099 | | | Synthos SA | | | 789,245 | |
| | | 136,516 | | | Tauron Polska Energia SA | | | 213,214 | |
| | | | | | | | | | |
| | | | | | Total Poland | | | 39,868,120 | |
| | | | | | | | | | |
| | | |
| | | | | | Portugal — 0.1% | | | | |
| | | 2,630,824 | | | EDP-Energias de Portugal SA | | | 11,321,297 | |
| | | | | | | | | | |
| | | |
| | | | | | Qatar — 0.0% | | | | |
| | | 549 | | | Industries Qatar QSC | | | 28,583 | |
| | | | | | | | | | |
| | | |
| | | | | | Russia — 1.7% | | | | |
| | | 306,866 | | | Aeroflot-Russian Airlines * | | | 272,261 | |
| | | 76,783 | | | Bashneft OAO-Class S * | | | 2,370,780 | |
| | | 31,800 | | | CTC Media, Inc. | | | 202,248 | |
| | | 8,787 | | | Eurasia Drilling Co Ltd GDR | | | 221,572 | |
| | | 82,582 | | | Gazprom Neft JSC Sponsored ADR | | | 1,501,621 | |
| | | 7,041,771 | | | Gazprom OAO Sponsored ADR | | | 46,657,451 | |
| | | 51,268 | | | Globaltrans Investment Plc Sponsored GDR | | | 381,276 | |
| | | 4,468,789 | | | Lukoil OAO Sponsored ADR | | | 219,057,034 | |
| | | 7,405 | | | MegaFon OAO GDR | | | 173,494 | |
| | | 13,700 | | | Mobile Telesystems Sponsored ADR | | | 195,910 | |
| | | 1,467 | | | NovaTek OAO GDR | | | 157,985 | |
| | | 2,820,142 | | | Rosneft OJSC GDR (Registered) | | | 15,695,810 | |
| | | 2,153,551 | | | Sberbank Sponsored ADR | | | 16,399,162 | |
| | | 1,805 | | | Sistema JSFC Sponsored GDR (Registered) | | | 14,623 | |
| | | 2,168,591 | | | Surgutneftegas Sponsored ADR | | | 14,306,243 | |
| | | 172,045 | | | Tatneft Sponsored GDR | | | 6,149,383 | |
| | | 18,091 | | | TCS Group Holding Plc (Registered) * | | | 66,768 | |
| | | | | | | | | | |
| | | | | | Total Russia | | | 323,823,621 | |
| | | | | | | | | | |
| | | |
| | | | | | Singapore — 0.0% | | | | |
| | | 1,589,085 | | | Ezra Holdings Ltd | | | 1,009,734 | |
| | | 8,337,662 | | | Golden Agri-Resources Ltd | | | 3,378,846 | |
| | | 279,157 | | | Noble Group Ltd | | | 259,855 | |
| | | 137,000 | | | Singapore Technologies Engineering Ltd | | | 399,978 | |
APPENDIX
GMO Benchmark-Free Allocation Fund
(A Series of GMO Trust)
Consolidated Schedule of Investments — (Continued)
(showing percentage of total net assets)
October 31, 2014 (Unaudited)
| | | | | | | | | | |
Shares /
Par Value ($) | | | Description | | Value ($) | |
| | | | | | | | | | |
| | | | | | Singapore — (continued) | | | | |
| | | 896,000 | | | Swiber Holdings Ltd | | | 275,050 | |
| | | 1,906,795 | | | Yangzijiang Shipbuilding Holdings Ltd | | | 1,678,484 | |
| | | | | | | | | | |
| | | | | | Total Singapore | | | 7,001,947 | |
| | | | | | | | | | |
| | | |
| | | | | | South Africa — 0.2% | | | | |
| | | 2,691,606 | | | African Bank Investments Ltd (d) | | | 244 | |
| | | 304,650 | | | Capital Property Fund (REIT) * | | | 352,543 | |
| | | 177,143 | | | Kumba Iron Ore Ltd | | | 4,445,247 | |
| | | 625,179 | | | MTN Group Ltd | | | 13,843,369 | |
| | | 111,901 | | | Naspers Ltd-N Shares | | | 13,957,315 | |
| | | 32,483 | | | Sasol Ltd | | | 1,622,045 | |
| | | 1,647 | | | Sasol Ltd Sponsored ADR | | | 82,663 | |
| | | 263,527 | | | Vodacom Group Ltd | | | 3,199,557 | |
| | | 99,902 | | | Wilson Bayly Holmes-Ovcon Ltd | | | 1,177,379 | |
| | | | | | | | | | |
| | | | | | Total South Africa | | | 38,680,362 | |
| | | | | | | | | | |
| | | |
| | | | | | South Korea — 1.7% | | | | |
| | | 160,454 | | | BS Financial Group Inc | | | 2,496,769 | |
| | | 7,278 | | | Capro Corp * | | | 19,177 | |
| | | 18,862 | | | CJ E & M Corp * | | | 590,691 | |
| | | 6,427 | | | Daelim Industrial Co Ltd | | | 425,725 | |
| | | 67,444 | | | Daou Technology Inc | | | 702,000 | |
| | | 42,819 | | | DGB Financial Group Inc | | | 610,606 | |
| | | 54,919 | | | Dongbu Insurance Co Ltd | | | 3,070,294 | |
| | | 46,739 | | | GS Holdings | | | 1,807,989 | |
| | | 250,051 | | | Hana Financial Group Inc | | | 8,659,226 | |
| | | 2,258 | | | Hankook Tire Co Ltd | | | 116,341 | |
| | | 71,110 | | | Hankook Tire WorldwideCo Ltd | | | 1,443,144 | |
| | | 11,612 | | | Hanwha Corp | | | 297,527 | |
| | | 77,170 | | | Hyundai Marine & Fire Insurance Co Ltd | | | 2,038,075 | |
| | | 53,258 | | | Hyundai Mobis | | | 12,460,487 | |
| | | 60,231 | | | Hyundai Motor Co | | | 9,557,549 | |
| | | 147,044 | | | Iljin Holdings Co Ltd | | | 1,031,886 | |
| | | 307,672 | | | Industrial Bank of Korea | | | 4,499,184 | |
| | | 48,160 | | | Jahwa Electronics Co Ltd | | | 506,055 | |
| | | 158,650 | | | KB Financial Group Inc | | | 6,219,041 | |
| | | 20,082 | | | Kginicis Co Ltd | | | 287,376 | |
| | | 354,293 | | | Kia Motors Corp | | | 17,208,876 | |
| | | 5,940 | | | Kolon Industries Inc | | | 302,113 | |
| | | 8,438 | | | Korea Zinc Co Ltd | | | 3,177,689 | |
| | | 315,278 | | | KT Corp | | | 9,713,576 | |
| | | 21,700 | | | KT Corp Sponsored ADR | | | 332,661 | |
| | | 10,321 | | | Kwangju Bank * | | | 104,244 | |
| | | 10,499 | | | Kyongnam Bank * | | | 122,494 | |
| | | 59,930 | | | LF Corp | | | 1,890,253 | |
| | | 22,850 | | | LG International Corp | | | 463,190 | |
| | | 61,598 | | | LIG Insurance Co Ltd | | | 1,608,257 | |
| | | | | | | | | | |
Shares /
Par Value ($) | | | Description | | Value ($) | |
| | | | | | | | | | |
| | | | | | South Korea — (continued) | | | | |
| | | 2,077 | | | Lotte Shopping Co Ltd | | | 575,776 | |
| | | 91,044 | | | Meritz Fire & Marine Insurance Co Ltd | | | 1,090,706 | |
| | | 16,474 | | | Neowiz Games Corp * | | | 354,700 | |
| | | 39,601 | | | Partron Co Ltd | | | 326,083 | |
| | | 32,296 | | | S-Oil Corp | | | 1,226,904 | |
| | | 2,634 | | | Samsung Electronics Co Ltd GDR (Registered) | | | 1,519,999 | |
| | | 56,888 | | | Samsung Engineering Co Ltd * | | | 3,281,126 | |
| | | 43,993 | | | Samsung Heavy Industries Co Ltd | | | 1,072,203 | |
| | | 13,491 | | | Samsung SDI Co Ltd | | | 1,590,871 | |
| | | 14,080 | | | Samsung Card Co | | | 605,452 | |
| | | 167,223 | | | Samsung Electronics Co Ltd | | | 195,005,843 | |
| | | 4,726 | | | Seah Besteel Corp | | | 141,321 | |
| | | 22,767 | | | SFA Engineering Corp | | | 969,600 | |
| | | 171,289 | | | Shinhan Financial Group Co Ltd | | | 8,061,849 | |
| | | 28,715 | | | Silicon Works Co Ltd | | | 628,883 | |
| | | 2,892 | | | SK Gas Co Ltd | | | 377,867 | |
| | | 111,809 | | | SK Innovation Co Ltd | | | 9,145,987 | |
| | | 56,608 | | | SK Telecom Co Ltd | | | 14,185,906 | |
| | | 43,000 | | | SK Telecom Co Ltd ADR | | | 1,194,970 | |
| | | 4,279 | | | SK Holdings Co Ltd | | | 670,728 | |
| | | 81,928 | | | Sungwoo Hitech Co Ltd | | | 1,180,995 | |
| | | 540,079 | | | Woori Finance Holdings Co Ltd * (d) | | | 6,000,142 | |
| | | | | | | | | | |
| | | | | | Total South Korea | | | 340,970,406 | |
| | | | | | | | | | |
| | | |
| | | | | | Spain — 0.9% | | | | |
| | | 29,582 | | | Acciona SA * | | | 2,067,441 | |
| | | 139,909 | | | ACS Actividades de Construccion y Servicios SA | | | 5,193,123 | |
| | | 168,837 | | | Enagas | | | 5,666,127 | |
| | | 533,010 | | | Gas Natural SDG SA | | | 15,391,589 | |
| | | 7,336,076 | | | Iberdrola SA | | | 51,931,465 | |
| | | 386,969 | | | Indra Sistemas SA | | | 4,274,999 | |
| | | 383,449 | | | Repsol YPF SA | | | 8,569,694 | |
| | | 6,107,616 | | | Telefonica SA | | | 91,905,443 | |
| | | | | | | | | | |
| | | | | | Total Spain | | | 184,999,881 | |
| | | | | | | | | | |
| | | |
| | | | | | Sri Lanka — 0.0% | | | | |
| | | 1,065,600 | | | Anilana Hotels & Properties Ltd * | | | 48,296 | |
| | | | | | | | | | |
| | | |
| | | | | | Sweden — 0.2% | | | | |
| | | 765,702 | | | Ericsson LM-Class B | | | 9,047,838 | |
| | | 3,089 | | | Investor AB | | | 110,872 | |
| | | 126,301 | | | Skanska AB-Class B | | | 2,574,577 | |
| | | 268,405 | | | Tele2 AB-B Shares | | | 3,410,246 | |
| | | 3,134,633 | | | TeliaSonera AB | | | 21,706,603 | |
| | | | | | | | | | |
| | | | | | Total Sweden | | | 36,850,136 | |
| | | | | | | | | | |
APPENDIX
GMO Benchmark-Free Allocation Fund
(A Series of GMO Trust)
Consolidated Schedule of Investments — (Continued)
(showing percentage of total net assets)
October 31, 2014 (Unaudited)
| | | | | | | | | | |
Shares /
Par Value ($) | | | Description | | Value ($) | |
| | | | | | | | | | |
| | | | | | Switzerland — 0.1% | | | | |
| | | 168,428 | | | Holcim Ltd (Registered) | | | 11,954,097 | |
| | | 164 | | | Swiss Life Holding AG (Registered) * | | | 37,628 | |
| | | 28,194 | | | Zurich Insurance Group AG | | | 8,532,307 | |
| | | | | | | | | | |
| | | | | | Total Switzerland | | | 20,524,032 | |
| | | | | | | | | | |
| | | |
| | | | | | Taiwan — 0.9% | | | | |
| | | 1,323,000 | | | Acer Inc * | | | 909,151 | |
| | | 153,594 | | | Advantech Co Ltd | | | 1,068,626 | |
| | | 280,000 | | | ALI Corp | | | 231,517 | |
| | | 191,000 | | | Asia Plastic Recycling Holding Ltd | | | 241,359 | |
| | | 1,887,000 | | | Asustek Computer Inc | | | 19,266,613 | |
| | | 803,000 | | | Career Technology MFG Co Ltd | | | 921,132 | |
| | | 729,000 | | | Catcher Technology Co Ltd | | | 6,154,030 | |
| | | 1,456,000 | | | China Man-Made Fiber Corp * | | | 385,209 | |
| | | 2,525,000 | | | China Petrochemical Development
Corp * | | | 799,101 | |
| | | 1,565,000 | | | Chipbond Technology Corp | | | 2,885,679 | |
| | | 702,278 | | | Chong Hong Construction Co Ltd | | | 1,445,361 | |
| | | 2,176,470 | | | Chunghwa Telecom Co Ltd | | | 6,640,478 | |
| | | 500 | | | Chunghwa Telecom Co Ltd ADR | | | 15,170 | |
| | | 9,972,000 | | | Compal Electronics Inc | | | 7,370,471 | |
| | | 1,364,000 | | | Coretronic Corp | | | 2,052,914 | |
| | | 176,000 | | | Delta Electronics Inc | | | 1,055,858 | |
| | | 205,000 | | | Dynapack International Technology Corp | | | 498,630 | |
| | | 4,701,371 | | | E.Sun Financial Holding Co Ltd | | | 2,977,770 | |
| | | 418,000 | | | Elan Microelectronics Corp | | | 663,680 | |
| | | 164,812 | | | Elitegroup Computer Systems Co Ltd | | | 139,001 | |
| | | 758,000 | | | Far EasTone Telecommunications Co Ltd | | | 1,677,509 | |
| | | 110,000 | | | Faraday Technology Corp | | | 117,160 | |
| | | 350,151 | | | Flexium Interconnect Inc | | | 741,248 | |
| | | 1,655,750 | | | Foxconn Technology Co Ltd | | | 4,417,823 | |
| | | 57,000 | | | Fubon Financial Holding Co Ltd | | | 96,497 | |
| | | 1,341,500 | | | Highwealth Construction Corp | | | 2,321,798 | |
| | | 9,013,120 | | | Hon Hai Precision Industry Co Ltd | | | 28,526,497 | |
| | | 1,548,000 | | | HTC Corp | | | 6,854,339 | |
| | | 211,000 | | | Huaku Development Co Ltd | | | 346,657 | |
| | | 44,540 | | | ILI Technology Corp | | | 100,037 | |
| | | 171,000 | | | Kinsus Interconnect Technology Corp | | | 643,534 | |
| | | 2,547,628 | | | Lite-On Technology Corp | | | 3,575,384 | |
| | | 260,222 | | | Makalot Industrial Co Ltd | | | 1,361,480 | |
| | | 45,022 | | | MediaTek Inc | | | 643,047 | |
| | | 488,000 | | | Novatek Microelectronics Corp Ltd | | | 2,525,916 | |
| | | 2,563,000 | | | Pegatron Corp | | | 4,671,052 | |
| | | 362,000 | | | Phison Electronics Corp | | | 2,445,042 | |
| | | 808,000 | | | Pou Chen Corp | | | 890,972 | |
| | | | | | | | | | |
Shares /
Par Value ($) | | | Description | | Value ($) | |
| | | | | | | | | | |
| | | | | | Taiwan — (continued) | | | | |
| | | 2,062,808 | | | Powertech Technology Inc | | | 3,468,097 | |
| | | 3,066,000 | | | Quanta Computer Inc | | | 7,718,698 | |
| | | 1,756,020 | | | Radiant Opto-Electronics Corp | | | 6,136,074 | |
| | | 761,330 | | | Realtek Semiconductor Corp | | | 2,523,589 | |
| | | 7,332 | | | Silicon Motion Technology Corp ADR | | | 173,842 | |
| | | 582,000 | | | Simplo Technology Co Ltd | | | 2,831,465 | |
| | | 51,000 | | | Soft-World International Corp | | | 134,779 | |
| | | 1,228,000 | | | Synnex Technology International Corp | | | 1,726,388 | |
| | | 2,050,175 | | | Taishin Financial Holding Co Ltd | | | 978,002 | |
| | | 106,000 | | | Taiwan Cement Corp | | | 162,152 | |
| | | 570,000 | | | Taiwan Mobile Co Ltd | | | 1,849,606 | |
| | | 641,044 | | | Taiwan PCB Techvest Co Ltd | | | 945,885 | |
| | | 399,600 | | | Taiwan Semiconductor Manufacturing Co Ltd Sponsored ADR | | | 8,799,192 | |
| | | 864,085 | | | TPK Holding Co Ltd | | | 5,100,980 | |
| | | 1,335,000 | | | Tripod Technology Corp | | | 2,498,835 | |
| | | 2,159,000 | | | Unimicron Technology Corp | | | 1,661,903 | |
| | | 5,890,909 | | | Wistron Corp | | | 6,189,081 | |
| | | 176,260 | | | Wistron NeWeb Corp | | | 397,425 | |
| | | 1,348,000 | | | WPG Holdings Co Ltd | | | 1,642,039 | |
| | | 477,000 | | | Yungtay Engineering Co Ltd | | | 1,059,239 | |
| | | | | | | | | | |
| | | | | | Total Taiwan | | | 173,675,013 | |
| | | | | | | | | | |
| | | |
| | | | | | Thailand — 0.2% | | | | |
| | | 1,347,600 | | | Bangchak Petroleum Pcl
(Foreign Registered) | | | 1,386,828 | |
| | | 8,243,100 | | | Bangkok Dusit Medical Services Pcl (Foreign Registered) | | | 4,681,003 | |
| | | 8,160,900 | | | Banpu Pcl (Foreign Registered) | | | 7,080,561 | |
| | | 199,850 | | | Electricity Generating Pcl (Foreign Registered) | | | 1,055,586 | |
| | | 159,500 | | | Glow Energy Pcl (Foreign Registered) | | | 490,337 | |
| | | 1,337,800 | | | PTT Exploration & Production Pcl (Foreign Registered) | | | 6,014,614 | |
| | | 1,500,200 | | | PTT Pcl (Foreign Registered) | | | 16,978,090 | |
| | | 1,109,600 | | | Ratchaburi Electricity Generating Holding Pcl (Foreign Registered) | | | 2,070,736 | |
| | | 2,862,500 | | | Thai Oil Pcl (Foreign Registered) | | | 3,927,523 | |
| | | 1,275,100 | | | Thanachart Capital Pcl (Foreign Registered) | | | 1,370,332 | |
| | | 1,854,400 | | | TTW Pcl (Foreign Registered) | | | 688,766 | |
| | | | | | | | | | |
| | | | | | Total Thailand | | | 45,744,376 | |
| | | | | | | | | | |
| | | |
| | | | | | Turkey — 0.5% | | | | |
| | | 2,108,307 | | | Akbank TAS | | | 7,612,978 | |
| | | 4,201,341 | | | Asya Katilim Bankasi AS * | | | 1,360,973 | |
| | | 60,459 | | | Dogus Gayrimenkul Yatirim Ortakligi AS * | | | 107,714 | |
APPENDIX
GMO Benchmark-Free Allocation Fund
(A Series of GMO Trust)
Consolidated Schedule of Investments — (Continued)
(showing percentage of total net assets)
October 31, 2014 (Unaudited)
| | | | | | | | | | |
Shares /
Par Value ($) | | | Description | | Value ($) | |
| | | | | | | | | | |
| | | | | | Turkey — (continued) | | | | |
| | | 70,795 | | | Dogus Otomotiv Servis ve Ticaret AS | | | 303,896 | |
| | | 1,704,586 | | | EIS Eczacibasi Ilac ve Sinai ve Finansal Yatirimlar Sanayi ve Ticaret AS | | | 1,802,096 | |
| | | 3,566,365 | | | Emlak Konut Gayrimenkul Yatirim (REIT) | | | 4,005,708 | |
| | | 257,551 | | | Eregli Demir ve Celik Fabrikalari TAS | | | 536,799 | |
| | | 984,531 | | | Gubre Fabrikalari TAS | | | 1,863,572 | |
| | | 469,430 | | | Haci Omer Sabanci Holding AS | | | 2,141,475 | |
| | | 1,734,434 | | | Ipek Dogal Enerji Kaynaklari Ve Uretim AS * | | | 1,333,603 | |
| | | 209,253 | | | KOC Holding AS | | | 1,066,735 | |
| | | 392,256 | | | Koza Altin Isletmeleri AS | | | 2,528,264 | |
| | | 1,673,369 | | | Koza Anadolu Metal Madencilik Isletmeleri AS * | | | 1,301,925 | |
| | | 225,350 | | | Park Elektrik Madencilik Tekstil Sanayi ve Ticaret AS | | | 405,210 | |
| | | 1,309,232 | | | Tekfen Holding AS * | | | 3,292,008 | |
| | | 33,009 | | | Tupras-Turkiye Petrol Rafineriler AS | | | 715,934 | |
| | | 1,460,736 | | | Turk Telekomunikasyon AS | | | 4,195,985 | |
| | | 1,424,213 | | | Turkcell Iletisim Hizmetleri AS * | | | 8,279,331 | |
| | | 11,300 | | | Turkcell Iletisim Hizmetleri AS ADR * | | | 165,319 | |
| | | 470,441 | | | Turkiye Garanti Bankasi AS | | | 1,836,081 | |
| | | 7,178,176 | | | Turkiye IS Bankasi-Class C | | | 17,948,330 | |
| | | 398,876 | | | Turkiye Sise ve Cam Fabrikalari AS | | | 606,511 | |
| | | 3,616,649 | | | Turkiye Vakiflar Bankasi TAO-Class D | | | 7,772,742 | |
| | | 1,376,397 | | | Turkiye Halk Bankasi AS | | | 9,190,954 | |
| | | 3,711,829 | | | Yapi ve Kredi Bankasi AS | | | 8,128,734 | |
| | | | | | | | | | |
| | | | | | Total Turkey | | | 88,502,877 | |
| | | | | | | | | | |
| | | |
| | | | | | United Arab Emirates — 0.0% | | | | |
| | | 3,143,953 | | | Dana Gas PJSC * | | | 529,936 | |
| | | 2,977,795 | | | Eshraq Properties Co PJSC * | | | 887,423 | |
| | | | | | | | | | |
| | | | | | Total United Arab Emirates | | | 1,417,359 | |
| | | | | | | | | | |
| | | |
| | | | | | United Kingdom — 2.3% | | | | |
| | | 53,569 | | | Amlin Plc | | | 390,975 | |
| | | 1,084,699 | | | AstraZeneca Plc | | | 79,235,471 | |
| | | 610,217 | | | Aviva Plc | | | 5,104,009 | |
| | | 977,431 | | | BAE Systems Plc | | | 7,198,053 | |
| | | 135,553 | | | Balfour Beatty Plc | | | 334,892 | |
| | | 10,351,514 | | | BP Plc | | | 74,478,120 | |
| | | 15,934 | | | Bunzl Plc | | | 432,695 | |
| | | 131,400 | | | Cape Plc | | | 568,439 | |
| | | 44,988 | | | Catlin Group Ltd | | | 386,482 | |
| | | 1,677,889 | | | Centrica Plc | | | 8,137,715 | |
| | | | | | | | | | |
Shares /
Par Value ($) | | | Description | | Value ($) | |
| | | | | | | | | | |
| | | | | | United Kingdom — (continued) | | | | |
| | | 101,499 | | | Cobham Plc | | | 473,460 | |
| | | 169,522 | | | Debenhams Plc | | | 176,008 | |
| | | 82,796 | | | Drax Group Plc | | | 787,803 | |
| | | 757,658 | | | FirstGroup Plc * | | | 1,365,388 | |
| | | 8,963 | | | Glencore Plc | | | 45,986 | |
| | | 1,175,078 | | | Home Retail Group Plc | | | 3,448,314 | |
| | | 56,364 | | | Inchcape Plc | | | 627,912 | |
| | | 90,040 | | | Intermediate Capital Group Plc | | | 591,895 | |
| | | 21,032 | | | JD Wetherspoon Plc | | | 284,353 | |
| | | 2,180 | | | Kingfisher Plc | | | 10,561 | |
| | | 4,618,236 | | | Man Group Plc | | | 9,156,913 | |
| | | 18,108 | | | Marks & Spencer Group Plc | | | 117,916 | |
| | | 22,120 | | | Micro Focus International Plc | | | 352,399 | |
| | | 37,846 | | | National Express Group Plc | | | 151,108 | |
| | | 456 | | | Next Plc | | | 47,076 | |
| | | 854 | | | Pearson Plc | | | 16,008 | |
| | | 1,264,912 | | | Royal Dutch Shell Plc A Shares (London) | | | 45,184,874 | |
| | | 1,159,347 | | | Royal Dutch Shell Plc B Shares (London) | | | 42,832,571 | |
| | | 19,981 | | | RSA Insurance Group Plc | | | 154,606 | |
| | | 236,023 | | | Scottish & Southern Energy Plc | | | 6,049,501 | |
| | | 657,948 | | | Shire Plc (b) | | | 131,458,010 | |
| | | 88,956 | | | Spirit Pub Co Plc | | | 151,784 | |
| | | 12,782 | | | Standard Life Assurance Plc | | | 80,713 | |
| | | 3,526,649 | | | Tesco Plc | | | 9,789,934 | |
| | | 317,868 | | | Thomas Cook Group Plc * | | | 633,310 | |
| | | 49,826 | | | TUI Travel Plc | | | 318,394 | |
| | | 3,806,693 | | | Vodafone Group Plc | | | 12,658,983 | |
| | | 2,171,404 | | | WM Morrison Supermarkets Plc | | | 5,391,358 | |
| | | | | | | | | | |
| | | | | | Total United Kingdom | | | 448,623,989 | |
| | | | | | | | | | |
| | | |
| | | | | | United States — 21.7% | | | | |
| | | 382,506 | | | 3M Co. | | | 58,817,948 | |
| | | 781,800 | | | Abbott Laboratories | | | 34,078,662 | |
| | | 370,717 | | | Accenture Plc-Class A | | | 30,072,563 | |
| | | 65,800 | | | Allergan, Inc. | | | 12,505,948 | |
| | | 1,753,695 | | | Amazon.com, Inc. * | | | 535,683,675 | |
| | | 69,900 | | | Ametek, Inc. | | | 3,645,285 | |
| | | 435 | | | Amgen, Inc. | | | 70,548 | |
| | | 97,300 | | | Amphenol Corp.-Class A | | | 4,921,434 | |
| | | 146,745 | | | Analog Devices, Inc. | | | 7,281,487 | |
| | | 294,642 | | | Apple, Inc. | | | 31,821,336 | |
| | | 600,054 | | | Auxilium Pharmaceuticals, Inc. | | | 19,303,737 | |
| | | 234,100 | | | Bally Technologies, Inc. * | | | 18,821,640 | |
| | | 203,704 | | | Baxter International, Inc. | | | 14,287,798 | |
| | | 117,408 | | | Becton, Dickinson and Co. | | | 15,110,410 | |
APPENDIX
GMO Benchmark-Free Allocation Fund
(A Series of GMO Trust)
Consolidated Schedule of Investments — (Continued)
(showing percentage of total net assets)
October 31, 2014 (Unaudited)
| | | | | | | | | | |
Shares /
Par Value ($) | | | Description | | Value ($) | |
| | | | | | | | | | |
| | | | | | United States — (continued) | | | | |
| | | 347,000 | | | Bed Bath & Beyond, Inc. * | | | 23,366,980 | |
| | | 172,800 | | | CA, Inc. | | | 5,021,568 | |
| | | 368,300 | | | CareFusion Corp. | | | 21,129,371 | |
| | | 83,900 | | | CH Robinson Worldwide, Inc. | | | 5,806,719 | |
| | | 369,700 | | | Chevron Corp. | | | 44,345,515 | |
| | | 75,600 | | | Church & Dwight Co., Inc. | | | 5,474,196 | |
| | | 2,628,589 | | | Cisco Systems, Inc. | | | 64,321,573 | |
| | | 123,300 | | | Citrix Systems, Inc. * | | | 7,919,559 | |
| | | 182,600 | | | Coach, Inc. | | | 6,277,788 | |
| | | 2,177,203 | | | Coca-Cola Co. (The) | | | 91,181,262 | |
| | | 353,968 | | | Cognizant Technology Solutions Corp.-Class A * | | | 17,291,337 | |
| | | 525,919 | | | Colgate-Palmolive Co. | | | 35,173,463 | |
| | | 2,461,500 | | | Compuware Corp. (b) | | | 24,984,225 | |
| | | 299,890 | | | Conversant, Inc. | | | 10,571,122 | |
| | | 176,700 | | | Costco Wholesale Corp. | | | 23,566,479 | |
| | | 4,136,768 | | | Covidien Plc (b) | | | 382,402,834 | |
| | | 242,402 | | | Covisint Corp. | | | 700,542 | |
| | | 40,800 | | | CR Bard, Inc. | | | 6,689,976 | |
| | | 346,802 | | | Danaher Corp. | | | 27,882,881 | |
| | | 1,936,050 | | | DIRECTV * (b) | | | 168,029,779 | |
| | | 508 | | | Donaldson Co., Inc. | | | 21,123 | |
| | | 68,200 | | | Dover Corp. | | | 5,417,808 | |
| | | 192,034 | | | Dresser-Rand Group, Inc. | | | 15,689,178 | |
| | | 328,900 | | | eBay, Inc. * | | | 17,267,250 | |
| | | 595 | | | Eli Lilly & Co. | | | 39,466 | |
| | | 1,367,700 | | | EMC Corp. | | | 39,294,021 | |
| | | 465,357 | | | Emerson Electric Co. | | | 29,810,769 | |
| | | 200 | | | Equifax, Inc. | | | 15,148 | |
| | | 71,500 | | | Expeditors International of Washington, Inc. | | | 3,050,190 | |
| | | 4,083,717 | | | Express Scripts Holding Co. * | | | 313,711,140 | |
| | | 200 | | | Exxon Mobil Corp. | | | 19,342 | |
| | | 42,700 | | | F5 Networks, Inc. * | | | 5,251,246 | |
| | | 78,300 | | | Genuine Parts Co. | | | 7,601,364 | |
| | | 147,416 | | | Google, Inc.-Class A * | | | 83,713,124 | |
| | | 13,900 | | | Google, Inc.-Class C * | | | 7,771,212 | |
| | | 36,900 | | | Henry Schein, Inc. * | | | 4,429,107 | |
| | | 900 | | | Herbalife Ltd. | | | 47,214 | |
| | | 1,100 | | | Hewlett-Packard Co. | | | 39,468 | |
| | | 42,700 | | | Hormel Foods Corp. | | | 2,301,957 | |
| | | 16,000 | | | Hubbell, Inc.-Class B | | | 1,814,560 | |
| | | 7,257,903 | | | Hudson City Bancorp, Inc. (b) | | | 70,038,764 | |
| | | 103,463 | | | Humana, Inc. | | | 14,365,837 | |
| | | 234,436 | | | Illinois Tool Works, Inc. | | | 21,345,398 | |
| | | 214,299 | | | International Business Machines Corp. | | | 35,230,756 | |
| | | 4,431,000 | | | International Game Technology (b) | | | 72,624,090 | |
| | | | | | | | | | |
Shares /
Par Value ($) | | | Description | | Value ($) | |
| | | | | | | | | | |
| | | | | | United States — (continued) | | | | |
| | | 131,274 | | | Intuit, Inc. | | | 11,553,425 | |
| | | 12,146 | | | Intuitive Surgical, Inc. * | | | 6,021,987 | |
| | | 675,500 | | | Johnson & Johnson | | | 72,805,390 | |
| | | 662,332 | | | JPMorgan Chase & Co. | | | 40,057,839 | |
| | | 105,500 | | | Linear Technology Corp. | | | 4,519,620 | |
| | | 1,371,900 | | | Lorillard, Inc. (b) | | | 84,371,850 | |
| | | 53,791 | | | Magnachip Semiconductor Corp. * | | | 598,694 | |
| | | 205,800 | | | Mattel, Inc. | | | 6,394,206 | |
| | | 35,500 | | | McCormick & Co., Inc. (Non Voting) | | | 2,510,560 | |
| | | 420,634 | | | McDonald’s Corp. | | | 39,426,025 | |
| | | 2,174,900 | | | Microsoft Corp. | | | 102,111,555 | |
| | | 290,404 | | | Monsanto Co. | | | 33,408,076 | |
| | | 358,252 | | | Nike, Inc.-Class B | | | 33,306,688 | |
| | | 4,861,471 | | | Oracle Corp. | | | 189,840,442 | |
| | | 142,600 | | | Paychex, Inc. | | | 6,693,644 | |
| | | 866 | | | PepsiCo, Inc. | | | 83,283 | |
| | | 4,481,427 | | | Philip Morris International, Inc. | | | 398,891,817 | |
| | | 73,996 | | | Precision Castparts Corp. | | | 16,330,917 | |
| | | 828,895 | | | Procter & Gamble Co. (The) | | | 72,337,667 | |
| | | 865,978 | | | Qualcomm, Inc. | | | 67,987,933 | |
| | | 41,699 | | | Ralph Lauren Corp. | | | 6,873,663 | |
| | | 103,800 | | | Reynolds American, Inc. | | | 6,530,058 | |
| | | 62,864 | | | Rockwell Automation, Inc. | | | 7,062,770 | |
| | | 400 | | | Roper Industries, Inc. | | | 63,320 | |
| | | 1,877,200 | | | Safeway, Inc. (b) | | | 65,439,192 | |
| | | 285,600 | | | Sigma-Aldrich Corp. | | | 38,815,896 | |
| | | 160,757 | | | St Jude Medical, Inc. | | | 10,315,777 | |
| | | 179,007 | | | Stryker Corp. | | | 15,668,483 | |
| | | 249,000 | | | Sysco Corp. | | | 9,596,460 | |
| | | 466,900 | | | Teradata Corp. * | | | 19,759,208 | |
| | | 999,129 | | | TIBCO Software, Inc. | | | 23,349,645 | |
| | | 1,040,438 | | | Time Warner Cable, Inc. (b) | | | 153,162,878 | |
| | | 66,000 | | | Total System Services, Inc. | | | 2,230,140 | |
| | | 571,243 | | | TRW Automotive Holdings Corp. | | | 57,895,478 | |
| | | 200 | | | Tupperware Brands Corp. | | | 12,750 | |
| | | 560,081 | | | UnitedHealth Group, Inc. | | | 53,213,296 | |
| | | 39,800 | | | Varian Medical Systems, Inc. * | | | 3,347,976 | |
| | | 183,459 | | | VF Corp. | | | 12,416,505 | |
| | | 542,387 | | | Wal-Mart Stores, Inc. | | | 41,367,856 | |
| | | 24,000 | | | Waters Corp. * | | | 2,659,200 | |
| | | 1,900 | | | Wells Fargo & Co. | | | 100,871 | |
| | | 30,400 | | | WW Grainger, Inc. | | | 7,502,720 | |
| | | 187,200 | | | Xilinx, Inc. | | | 8,326,656 | |
| | | 77,000 | | | Zimmer Holdings, Inc. | | | 8,565,480 | |
| | | | | | | | | | |
| | | | | | Total United States | | | 4,252,997,068 | |
| | | | | | | | | | |
| | | |
| | | | | | TOTAL COMMON STOCKS
(COST $8,275,508,659) | | | 8,326,388,678 | |
| | | | | | | | | | |
APPENDIX
GMO Benchmark-Free Allocation Fund
(A Series of GMO Trust)
Consolidated Schedule of Investments — (Continued)
(showing percentage of total net assets)
October 31, 2014 (Unaudited)
| | | | | | | | | | |
Shares /
Par Value ($) | | | Description | | Value ($) | |
| | | | | | | | | | |
| | | | | | PREFERRED STOCKS (a) — 1.4% | |
| | | |
| | | | | | Argentina — 0.6% | | | | |
| | | 660,900 | | | AES Tiete SA | | | 4,996,557 | |
| | | 71,690 | | | Banco Bradesco SA | | | 1,079,865 | |
| | | 557,710 | | | Banco Bradesco SA ADR | | | 8,354,496 | |
| | | 557,800 | | | Banco do Estado do Rio Grande do Sul SA-Class B | | | 3,332,314 | |
| | | 43,050 | | | Bradespar SA | | | 290,884 | |
| | | 175,981 | | | Companhia de Transmissao de Energia Eletrica Paulista | | | 2,730,306 | |
| | | 1,337,939 | | | Companhia Energetica de Minas Gerais Sponsored ADR | | | 7,733,288 | |
| | | 296,800 | | | Companhia Energetica de Sao Paulo-Class B | | | 2,926,534 | |
| | | 224,200 | | | Companhia Paranaense de Energia-Class B | | | 3,132,306 | |
| | | 160,100 | | | Companhia Paranaense de Energia Sponsored ADR | | | 2,257,410 | |
| | | 1,663,827 | | | Companhia Energetica de Minas Gerais | | | 9,552,255 | |
| | | 724,900 | | | Eletropaulo Metropolitana SA | | | 2,024,978 | |
| | | 935,700 | | | Gerdau SA | | | 4,190,955 | |
| | | 124,700 | | | Gerdau SA Sponsored ADR | | | 564,891 | |
| | | 28,200 | | | Gol Linhas Aereas Inteligentes SA ADR | | | 145,794 | |
| | | 361,516 | | | Itau Unibanco Holding SA | | | 5,364,808 | |
| | | 658,266 | | | Itau Unibanco Holding SA ADR | | | 9,716,006 | |
| | | 3,588,908 | | | Itausa-Investimentos Itau SA | | | 14,321,539 | |
| | | 404,600 | | | Metalurgica Gerdau SA | | | 2,190,842 | |
| | | 4,275,500 | | | Oi SA | | | 2,247,197 | |
| | | 1,417,200 | | | Oi SA ADR | | | 751,116 | |
| | | 753,200 | | | Petroleo Brasileiro SA | | | 4,632,824 | |
| | | 314,100 | | | Telefonica Brasil SA | | | 6,420,266 | |
| | | 641,500 | | | Telefonica Brasil SA ADR | | | 13,112,260 | |
| | | 180,300 | | | Tim Participacoes SA ADR | | | 4,961,856 | |
| | | 569,000 | | | Vale SA | | | 4,951,049 | |
| | | | | | | | | | |
| | | | | | Total Argentina | | | 121,982,596 | |
| | | | | | | | | | |
| | | |
| | | | | | Germany — 0.4% | | | | |
| | | 252,953 | | | Porsche Automobil Holding SE | | | 20,770,544 | |
| | | 276,243 | | | Volkswagen AG | | | 59,075,091 | |
| | | | | | | | | | |
| | | | | | Total Germany | | | 79,845,635 | |
| | | | | | | | | | |
| | | |
| | | | | | Russia — 0.2% | | | | |
| | | 76,552 | | | Sberbank | | | 101,274 | |
| | | 49,513,856 | | | Surgutneftegaz OJSC | | | 33,891,640 | |
| | | 1,772 | | | Transneft | | | 3,856,271 | |
| | | | | | | | | | |
| | | | | | Total Russia | | | 37,849,185 | |
| | | | | | | | | | |
| | | | | | | | | | |
Shares /
Par Value ($) | | | Description | | Value ($) | |
| | | | | | | | | | |
| | | | | | South Korea — 0.2% | | | | |
| | | 19,762 | | | Hyundai Motor Co | | | 2,284,067 | |
| | | 20,586 | | | Hyundai Motor Co | | | 2,462,439 | |
| | | 28,095 | | | Samsung Electronics Co Ltd | | | 25,933,454 | |
| | | 163 | | | Samsung Electronics Co Ltd GDR | | | 74,780 | |
| | | | | | | | | | |
| | | | | | Total South Korea | | | 30,754,740 | |
| | | | | | | | | | |
| | | |
| | | | | | TOTAL PREFERRED STOCKS (COST $294,244,203) | | | 270,432,156 | |
| | | | | | | | | | |
| | |
| | | | | | RIGHTS/WARRANTS (a) — 0.0% | |
| | |
| | | | | | United Arab Emirates — 0.0% | |
| | | 1,035,755 | | | Eshraq Properties Co- Rights, Expires 11/20/14 * | | | 19,739 | |
| | | | | | | | | | |
| | | |
| | | | | | TOTAL RIGHTS/WARRANTS (COST $—) | | | 19,739 | |
| | | | | | | | | | |
| | |
| | | | | | INVESTMENT FUNDS (a) — 0.0% | |
| | | |
| | | | | | Thailand — 0.0% | | | | |
| | | 139,224 | | | BTS Rail Mass Transit Growth Infrastructure Fund | | | 42,744 | |
| | | 92,500 | | | TRUE Telecommunication Growth Infrastructure Fund | | | 31,798 | |
| | | | | | | | | | |
| | | | | | Total Thailand | | | 74,542 | |
| | | | | | | | | | |
| | | |
| | | | | | TOTAL INVESTMENT FUNDS (COST $85,292) | | | 74,542 | |
| | | | | | | | | | |
| | |
| | | | | | DEBT OBLIGATIONS (a) — 7.6% | |
| | | |
| | | | | | United States — 0.3% | | | | |
| | | | | | Bank Loans — 0.3% | | | | |
| | | 28,200,000 | | | 1011778 B.C. Unlimited Liability Company, 2014 Term Loan B, 3.50%, due 10/27/21 | | | 28,094,250 | |
| | | 21,900,000 | | | Level 3 Financing Inc., Incremental Term Loan B5, 3.50%, due 01/31/22 | | | 21,983,220 | |
| | | | | | | | | | |
| | | | | | Total Bank Loans | | | 50,077,470 | |
| | | | | | | | | | |
| | |
| | | | | | Asset-Backed Securities — 0.0% | |
| | | 1,599,399 | | | American Capital Strategies Ltd. Commercial Real Estate CDO Trust, Series 07-1A, Class A, 144A, 3 mo. LIBOR + .80%, 1.03%, due 11/23/52 | | | 1,599 | |
| | | 2,500,000 | | | Toll Road Investment Part II, Series C, 144A, NPFG, Zero Coupon, due 02/15/37 | | | 532,750 | |
| | | | | | | | | | |
| | | | | | Total Asset-Backed Securities | | | 534,349 | |
| | | | | | | | | | |
APPENDIX
GMO Benchmark-Free Allocation Fund
(A Series of GMO Trust)
Consolidated Schedule of Investments — (Continued)
(showing percentage of total net assets)
October 31, 2014 (Unaudited)
| | | | | | | | | | |
Shares /
Par Value ($) | | | Description | | Value ($) | |
| | | | | | | | | | |
| | | | | | U.S. Government — 7.3% | |
| | | 1,405,528,622 | | | U.S. Treasury Inflation Indexed Bonds, 1.88%, due 07/15/15 (e) | | | 1,431,332,722 | |
| | | | | | | | | | |
| | | | | | TOTAL DEBT OBLIGATIONS
(COST $1,489,014,898) | | | 1,481,944,541 | |
| | | | | | | | | | |
| | | |
| | | | | | MUTUAL FUNDS — 24.5% | | | | |
| | | |
| | | | | | United States — 24.5% | | | | |
| | | | | | Affiliated Issuers — 24.5% | | | | |
| | | 81,130,503 | | | GMO Alpha Only Fund, Class IV | | | 1,900,887,685 | |
| | | 33,546,991 | | | GMO Debt Opportunities Fund, Class VI | | | 837,668,373 | |
| | | 66,398,731 | | | GMO Emerging Country Debt Fund, Class IV | | | 683,906,928 | |
| | | 20,859,212 | | | GMO Special Opportunities Fund,
Class VI | | | 403,208,557 | |
| | | 30,224,303 | | | GMO Systematic Global Macro Opportunity Fund, Class III | | | 979,569,665 | |
| | | | | | | | | | |
| | | |
| | | | | | TOTAL MUTUAL FUNDS
(COST $4,784,970,341) | | | 4,805,241,208 | |
| | | | | | | | | | |
| | |
Principal Amount | | | | | | |
| | | | | | OPTIONS PURCHASED (a) — 0.1% | |
| | | |
| | | | | | Currency Options — 0.1% | | | | |
USD | | | 79,000,000 | | | USD Call/JPY Put, Expires 11/20/14, Strike 103.60, (OTC) (CP - DB) | | | 6,116,575 | |
USD | | | 79,000,000 | | | USD Put/JPY Call, Expires 11/20/14, Strike 98.90, (OTC) (CP - DB) | | | — | |
USD | | | 206,200,000 | | | USD Put/JPY Call, Expires 01/16/15, Strike 105.90, (OTC) (CP - DB) | | | 391,986 | |
USD | | | 206,200,000 | | | USD Call/JPY Put, Expires 01/16/15, Strike 105.90, (OTC) (CP - DB) | | | 11,975,065 | |
USD | | | 82,000,000 | | | USD Call/JPY Put, Expires 02/19/15, Strike 106.13, (OTC) (CP - MSCI) | | | 4,725,742 | |
USD | | | 82,000,000 | | | USD Put/JPY Call, Expires 02/19/15, Strike 98.95, (OTC) (CP - MSCI) | | | 27,388 | |
| | | | | | | | | | |
| | | | | | Total Currency Options | | | 23,236,756 | |
| | | | | | | | | | |
| | |
| | | | | | Options on Interest Rate Swaps — 0.0% | |
USD | | | 322,600,000 | | | USD Swaption Put, Expires 11/03/14, Strike 2.60, Upon potential exercise of the option, the Fund will enter into a swap with a notional amount of 322,600,000 USD in which it will pay a rate of 2.60% and will receive 3 month USD LIBOR, maturing on 11/05/24. | | | | |
| | | | | | | | | 25,486 | |
| | | | | | | | | | |
| | | |
| | | | | | TOTAL OPTIONS PURCHASED
(COST $11,897,910) | | | 23,262,242 | |
| | | | | | | | | | |
| | | | | | | | | | |
Shares / Par Value ($) | | | Description | | Value ($) | |
| | | | | | | | | | |
| | | | | | SHORT-TERM INVESTMENTS (a) — 23.4% | |
| | |
| | | | | | Money Market Fund — 0.1% | |
| | | 24,643,345 | | | State Street Institutional Treasury Money Market Fund-Premier Class, 0.00% (f) | | | 24,643,345 | |
| | | | | | | | | | |
| | |
| | | | | | U.S. Government — 23.3% | |
| | | 126,273,000 | | | U.S. Treasury Bill, 0.04%,
due 04/02/15 (b) (g) | | | 126,250,650 | |
| | | 70,130,000 | | | U.S. Treasury Bill, 0.01%,
due 01/15/15 (g) | | | 70,128,247 | |
| | | 652,311,000 | | | U.S. Treasury Bill, 0.01%,
due 12/26/14 (b) (g) | | | 652,299,258 | |
| | | 6,700,000 | | | U.S. Treasury Bill, 0.00%,
due 11/06/14 (g) (h) | | | 6,700,000 | |
| | | 395,000,000 | | | U.S. Treasury Bill, 0.04%,
due 03/05/15 (b) (g) | | | 394,943,120 | |
| | | 112,500,000 | | | U.S. Treasury Bill, 0.04%,
due 03/12/15 (b) (g) | | | 112,484,925 | |
| | | 150,000,000 | | | U.S. Treasury Bill, 0.02%,
due 02/26/15 (g) | | | 149,988,000 | |
| | | 150,000,000 | | | U.S. Treasury Bill, 0.02%,
due 02/12/15 (g) | | | 149,992,650 | |
| | | 30,000,000 | | | U.S. Treasury Bill, 0.01%,
due 01/29/15 (g) | | | 29,999,460 | |
| | | 110,414,000 | | | U.S. Treasury Bill, 0.05%,
due 04/16/15 (g) | | | 110,387,611 | |
| | | 401,170,000 | | | U.S. Treasury Bill, 0.05%, due 04/09/15 (g) | | | 401,078,132 | |
| | | 476,770,000 | | | U.S. Treasury Bill, 0.02%,
due 12/11/14 (g) | | | 476,766,186 | |
| | | 681,200,000 | | | U.S. Treasury Bill, 0.00%,
due 12/04/14 (b) (g) (h) | | | 681,198,637 | |
| | | 615,000,000 | | | U.S. Treasury Bill, 0.01%,
due 01/08/15 (g) | | | 614,991,390 | |
| | | 27,000,000 | | | U.S. Treasury Bill, 0.01%,
due 11/28/14 (g) | | | 26,999,865 | |
| | | 100,000,000 | | | U.S. Treasury Bill, 0.04%,
due 03/19/15 (g) | | | 99,985,800 | |
| | | 115,800,000 | | | U.S. Treasury Bill, 0.05%,
due 04/23/15 (g) | | | 115,771,166 | |
| | | 152,800,000 | | | U.S. Treasury Bill, 0.05%,
due 04/30/15 (g) | | | 152,760,272 | |
| | | 180,000,000 | | | U.S. Treasury Bill, 0.02%,
due 02/05/15 (b) (g) | | | 179,989,560 | |
| | | | | | | | | | |
| | | | | | Total U.S. Government | | | 4,552,714,929 | |
| | | | | | | | | | |
| | | |
| | | | | | TOTAL SHORT-TERM INVESTMENTS
(COST $4,577,356,461) | | | 4,577,358,274 | |
| | | | | | | | | | |
| | | |
| | | | | | TOTAL INVESTMENTS — 99.6%
(Cost $19,433,077,764) | | | 19,484,721,380 | |
| | | | | | | | | | |
APPENDIX
GMO Benchmark-Free Allocation Fund
(A Series of GMO Trust)
Consolidated Schedule of Investments — (Continued)
(showing percentage of total net assets)
October 31, 2014 (Unaudited)
| | | | | | | | | | |
Shares / Par Value ($) | | | Description | | Value ($) | |
| | | | | | | | | | |
| | |
| | | | | | SECURITIES SOLD SHORT (a) — (8.9)% | |
| | | |
| | | | | | COMMON STOCKS — (3.7)% | | | | |
| | | |
| | | | | | Ireland — 0.0% | | | | |
| | | (104,597 | ) | | Endo International Plc | | | (6,999,631 | ) |
| | | | | | | | | | |
| | | |
| | | | | | Italy — (0.1)% | | | | |
| | | (494,946 | ) | | GTECH SpA | | | (11,535,682 | ) |
| | | | | | | | | | |
| | | |
| | | | | | United States — (3.6)% | | | | |
| | | (10,776 | ) | | Alliance Data Systems Corp. | | | (3,053,380 | ) |
| | | (4,336,742 | ) | | Applied Materials, Inc. | | | (95,798,631 | ) |
| | | (2,534,143 | ) | | AT&T, Inc. | | | (88,289,542 | ) |
| | | (28,617 | ) | | Becton Dickinson and Co. | | | (3,683,008 | ) |
| | | (498,347 | ) | | Burger King Worldwide, Inc. | | | (16,285,980 | ) |
| | | (781,916 | ) | | Comcast Corp.-Class A | | | (43,114,848 | ) |
| | | (2,209,159 | ) | | Comcast Corp.-Class A | | | (122,276,951 | ) |
| | | (33,780 | ) | | Liberty Global Plc* | | | (1,502,197 | ) |
| | | (13,692 | ) | | Liberty Global Plc-Class A* | | | (622,575 | ) |
| | | (609,657 | ) | | M&T Bank Corp. | | | (74,487,892 | ) |
| | | (3,468,802 | ) | | Medtronic, Inc. | | | (236,433,544 | ) |
| | | (399,087 | ) | | Reynolds American, Inc. | | | (25,106,563 | ) |
| | | | | | | | | | |
| | | | | | Total United States | | | (710,655,111 | ) |
| | | | | | | | | | |
| | | |
| | | | | | TOTAL COMMON STOCKS (PROCEEDS $704,303,421) | | | (729,190,424 | ) |
| | | | | | | | | | |
| | |
| | | | | | DEBT OBLIGATIONS — (5.2)% | |
| | |
| | | | | | U.S. Government Agency — (5.2)% | |
| | | (963,500,000 | ) | | Federal National Mortgage Assoc., TBA, 4.00%, due 03/01/42 | | | (1,023,417,656 | ) |
| | | | | | | | | | |
| | | |
| | | | | | TOTAL DEBT OBLIGATIONS (PROCEEDS $1,019,556,547) | | | (1,023,417,656 | ) |
| | | | | | | | | | |
| | | |
| | | | | | TOTAL SECURITIES SOLD SHORT (PROCEEDS $1,723,859,968) | | | (1,752,608,080 | ) |
| | | | | | | | | | |
| | | |
| | | | | | Other Assets and Liabilities
(net) — 9.3% | | | 1,822,330,204 | |
| | | | | | | | | | |
| | | |
| | | | | | TOTAL NET
ASSETS — 100.0% | | $ | 19,554,443,504 | |
| | | | | | | | | | |
A summary of outstanding financial instruments at October 31, 2014 is as follows:
Forward Currency Contracts (a)
| | | | | | | | | | | | | | | | |
Settlement Date | | Counter party | | Currency Sold | | Currency
Purchased | | Net
Unrealized
Appreciation
(Depreciation) | |
| 12/15/2014 | | MSCI | | CAD | | 40,675,500 | | | USD | | | 36,463,061 | | $ | 410,194 | |
| 12/22/2014 | | BCLY | | EUR | | 143,828,589 | | | USD | | | 182,075,487 | | | 1,781,124 | |
| 12/22/2014 | | BOA | | EUR | | 143,050,303 | | | USD | | | 181,168,246 | | | 1,849,492 | |
| 12/22/2014 | | DB | | EUR | | 144,547,733 | | | USD | | | 183,059,296 | | | 1,863,460 | |
| 12/22/2014 | | GS | | EUR | | 144,547,733 | | | USD | | | 182,929,493 | | | 1,733,656 | |
| 11/25/2014 | | BCLY | | GBP | | 87,900,000 | | | USD | | | 141,870,160 | | | 1,280,482 | |
| 11/25/2014 | | DB | | GBP | | 90,499,600 | | | USD | | | 144,447,689 | | | (299,860 | ) |
| 12/19/2014 | | BCLY | | JPY | | 14,153,460,395 | | | USD | | | 130,914,796 | | | 4,849,063 | |
| 12/19/2014 | | BOA | | JPY | | 21,230,190,592 | | | USD | | | 196,357,664 | | | 7,259,065 | |
| 12/19/2014 | | DB | | JPY | | 14,153,460,395 | | | USD | | | 130,953,557 | | | 4,887,824 | |
| 12/19/2014 | | GS | | JPY | | 21,230,190,593 | | | USD | | | 196,409,618 | | | 7,311,019 | |
| 11/14/2014 | | BCLY | | KRW | | 149,894,700,000 | | | USD | | | 141,060,243 | | | 862,113 | |
| 11/04/2014 | | BCLY | | SEK | | 167,310,000 | | | USD | | | 23,805,780 | | | 1,147,790 | |
| 11/04/2014 | | BOA | | SEK | | 202,158,831 | | | USD | | | 28,651,571 | | | 1,274,171 | |
| 11/04/2014 | | DB | | SEK | | 234,685,000 | | | USD | | | 32,854,792 | | | 1,072,528 | |
| 11/04/2014 | | GS | | SEK | | 32,475,806 | | | USD | | | 4,534,673 | | | 136,630 | |
| 11/04/2014 | | MSCI | | SEK | | 169,845,000 | | | USD | | | 24,170,343 | | | 1,169,050 | |
| 01/09/2015 | | GS | | SEK | | 806,474,637 | | | USD | | | 109,639,488 | | | 406,621 | |
| 11/04/2014 | | GS | | USD | | 109,623,691 | | | SEK | | | 806,474,637 | | | (406,701 | ) |
| 11/25/2014 | | BCLY | | USD | | 94,855,919 | | | GBP | | | 58,100,000 | | | (1,929,181 | ) |
| 11/25/2014 | | DB | | USD | | 159,016,564 | | | GBP | | | 97,449,600 | | | (3,152,993 | ) |
| 11/25/2014 | | GS | | USD | | 17,926,559 | | | GBP | | | 11,000,000 | | | (332,857 | ) |
| 11/25/2014 | | JPM | | USD | | 19,313,212 | | | GBP | | | 11,850,000 | | | (359,996 | ) |
| 12/19/2014 | | DB | | USD | | 197,054,400 | | | JPY | | | 22,076,300,000 | | | (419,453 | ) |
| | | | | | | | | | | | | | | | |
| | | | | | | | | | | | | | $ | 32,393,241 | |
| | | | | | | | | | | | | | | | |
APPENDIX
GMO Benchmark-Free Allocation Fund
(A Series of GMO Trust)
Consolidated Schedule of Investments — (Continued)
(showing percentage of total net assets)
October 31, 2014 (Unaudited)
Written Options (a)
| | | | | | | | | | | | | | |
Number of Contracts | | | Expiration
Date | | Description | | Premiums | | Market Value | |
| Put | | | 2,363 | | | 11/21/2014 | | Euro STOXX 50, Strike 2,825 | | $2,378,749 | | $ | (152,525 | ) |
| Put | | | 1,603 | | | 11/21/2014 | | Euro STOXX 50, Strike 2,850 | | 2,428,694 | | | (126,214 | ) |
| Put | | | 3,075 | | | 11/21/2014 | | Euro STOXX 50, Strike 2,900 | | 3,713,939 | | | (359,036 | ) |
| Put | | | 3,448 | | | 11/21/2014 | | Euro STOXX 50, Strike 3,000 | | 3,598,098 | | | (931,944 | ) |
| Put | | | 2,831 | | | 11/22/2014 | | S&P 500, Strike 1,850 | | 12,933,983 | | | (467,115 | ) |
| Put | | | 1,393 | | | 11/22/2014 | | S&P 500, Strike 1,885 | | 6,960,350 | | | (362,180 | ) |
| | | | | | | | | | | | | | |
| | | | | | | | | | $32,013,813 | | $ | (2,399,014 | ) |
| | | | | | | | | | | | | | |
Swap Contracts (a)
Interest Rate Swaps
| | | | | | | | | | | | | | | | | | | | |
Notional
Amount | | Expiration
Date | | Counterparty | | Receive (Pay)# | | Fixed Rate | | | Variable Rate | | Net Unrealized
Appreciation/
(Depreciation) | |
| | 473,000,000 | | | GBP | | 7/16/2024 | | BCI (i) | | (Pay) | | | 3.45 | % | | 6 Month GBP LIBOR | | $ | (18,902,621 | ) |
| | 32,010,000,000 | | | JPY | | 10/3/2024 | | BCI (i) | | (Pay) | | | 0.66 | % | | 6 Month JPY LIBOR | | | (1,826,989 | ) |
| | 147,789,000,000 | | | JPY | | 10/6/2024 | | BCI (i) | | (Pay) | | | 0.66 | % | | 6 Month JPY LIBOR | | | (8,630,482 | ) |
| | 30,169,000,000 | | | JPY | | 10/7/2024 | | CSS (i) | | (Pay) | | | 0.66 | % | | 6 Month JPY LIBOR | | | (1,642,048 | ) |
| | 32,114,000,000 | | | JPY | | 10/9/2024 | | CSS (i) | | (Pay) | | | 0.65 | % | | 6 Month JPY LIBOR | | | (1,710,764 | ) |
| | 1,329,000,000 | | | MXN | | 8/11/2021 | | BCI (i) | | Receive | | | 5.54 | % | | TIIE | | | (665,026 | ) |
| | 664,000,000 | | | MXN | | 8/12/2021 | | BCI (i) | | Receive | | | 5.60 | % | | TIIE | | | (170,023 | ) |
| | 669,000,000 | | | MXN | | 8/19/2021 | | BCI (i) | | Receive | | | 5.61 | % | | TIIE | | | (146,624 | ) |
| | 1,022,000,000 | | | MXN | | 9/1/2021 | | BCI (i) | | Receive | | | 5.71 | % | | TIIE | | | 201,834 | |
| | 498,400,000 | | | MXN | | 9/2/2021 | | BCI (i) | | Receive | | | 5.75 | % | | TIIE | | | 179,743 | |
| | 664,500,000 | | | MXN | | 9/3/2021 | | BCI (i) | | Receive | | | 5.75 | % | | TIIE | | | 232,618 | |
| | 884,800,000 | | | MXN | | 9/6/2021 | | BCI (i) | | Receive | | | 5.79 | % | | TIIE | | | 474,700 | |
| | 620,000,000 | | | MXN | | 9/13/2021 | | BCI (i) | | Receive | | | 5.82 | % | | TIIE | | | 423,074 | |
| | 1,736,400,000 | | | MXN | | 9/30/2021 | | BCI (i) | | Receive | | | 5.76 | % | | TIIE | | | 612,498 | |
| | 689,200,000 | | | MXN | | 10/13/2021 | | BCI (i) | | (Pay) | | | 5.64 | % | | TIIE | | | 173,311 | |
| | 1,730,400,000 | | | MXN | | 10/15/2021 | | BCI (i) | | (Pay) | | | 5.73 | % | | TIIE | | | (326,111 | ) |
| | 1,386,300,000 | | | MXN | | 10/20/2021 | | BCI (i) | | (Pay) | | | 5.58 | % | | TIIE | | | 723,494 | |
| | 693,100,000 | | | MXN | | 10/21/2021 | | BCI (i) | | (Pay) | | | 5.60 | % | | TIIE | | | 312,352 | |
| | 695,000,000 | | | MXN | | 10/22/2021 | | BCI (i) | | (Pay) | | | 5.64 | % | | TIIE | | | 182,951 | |
| | 516,900,000 | | | MXN | | 10/9/2024 | | BCI (i) | | Receive | | | 6.10 | % | | TIIE | | | (118,374 | ) |
| | 1,305,700,000 | | | MXN | | 10/11/2024 | | BCI (i) | | Receive | | | 6.18 | % | | TIIE | | | 367,268 | |
| | 1,039,700,000 | | | MXN | | 10/16/2024 | | BCI (i) | | Receive | | | 6.03 | % | | TIIE | | | (681,854 | ) |
| | 519,800,000 | | | MXN | | 10/17/2024 | | BCI (i) | | Receive | | | 6.05 | % | | TIIE | | | (275,723 | ) |
| | 521,200,000 | | | MXN | | 10/18/2024 | | BCI (i) | | Receive | | | 6.08 | % | | TIIE | | | (185,537 | ) |
| | 1,094,200,000 | | | MXN | | 10/18/2024 | | BCI (i) | | Receive | | | 6.12 | % | | TIIE | | | (122,731 | ) |
| | 415,000,000 | | | SEK | | 8/5/2016 | | BCI (i) | | Receive | | | 0.63 | % | | 3 Month SEK STIBOR | | | 318,853 | |
| | 940,000,000 | | | SEK | | 8/6/2016 | | BCI (i) | | Receive | | | 0.62 | % | | 3 Month SEK STIBOR | | | 701,131 | |
| | 1,109,000,000 | | | SEK | | 8/7/2016 | | BCI (i) | | Receive | | | 0.63 | % | | 3 Month SEK STIBOR | | | 859,149 | |
| | 469,000,000 | | | SEK | | 8/11/2016 | | BCI (i) | | Receive | | | 0.62 | % | | 3 Month SEK STIBOR | | | 354,210 | |
| | 257,000,000 | | | SEK | | 8/13/2016 | | BCI (i) | | Receive | | | 0.63 | % | | 3 Month SEK STIBOR | | | 200,878 | |
| | 710,000,000 | | | SEK | | 8/13/2016 | | BCI (i) | | Receive | | | 0.63 | % | | 3 Month SEK STIBOR | | | 546,429 | |
| | 796,000,000 | | | SEK | | 8/15/2016 | | BCI (i) | | Receive | | | 0.63 | % | | 3 Month SEK STIBOR | | | 603,091 | |
| | 1,354,000,000 | | | SEK | | 8/18/2016 | | BCI (i) | | Receive | | | 0.62 | % | | 3 Month SEK STIBOR | | | 1,018,404 | |
| | 796,000,000 | | | SEK | | 8/19/2016 | | BCI (i) | | Receive | | | 0.62 | % | | 3 Month SEK STIBOR | | | 599,216 | |
| | 1,255,000,000 | | | SEK | | 8/20/2016 | | BCI (i) | | Receive | | | 0.63 | % | | 3 Month SEK STIBOR | | | 952,628 | |
| | 1,000,000,000 | | | SEK | | 8/21/2016 | | BCI (i) | | Receive | | | 0.61 | % | | 3 Month SEK STIBOR | | | 721,422 | |
| | 262,200,000 | | | USD | | 9/30/2016 | | CSS (i) | | Receive | | | 0.82 | % | | 3 Month USD LIBOR | | | 763,277 | |
| | 198,900,000 | | | USD | | 9/30/2019 | | CSS (i) | | Receive | | | 1.96 | % | | 3 Month USD LIBOR | | | 2,146,117 | |
APPENDIX
GMO Benchmark-Free Allocation Fund
(A Series of GMO Trust)
Consolidated Schedule of Investments — (Continued)
(showing percentage of total net assets)
October 31, 2014 (Unaudited)
| | | | | | | | | | | | | | | | | | |
Notional Amount | | Expiration
Date | | Counterparty | | Receive (Pay)# | | Fixed Rate | | | Variable Rate | | Net
Unrealized
Appreciation/
(Depreciation) | |
| 3,287,800,000 | | USD | | 9/28/2020 | | CSS (i) | | Receive | | | 3.20 | % | | 3 Month USD LIBOR | | $ | 13,429,156 | |
| 147,100,000 | | USD | | 9/30/2024 | | CSS (i) | | Receive | | | 2.66 | % | | 3 Month USD LIBOR | | | 2,612,348 | |
| 70,200,000 | | USD | | 10/9/2024 | | CSS (i) | | (Pay) | | | 2.56 | % | | 3 Month USD LIBOR | | | (560,642 | ) |
| 49,500,000 | | USD | | 10/9/2024 | | CSS (i) | | (Pay) | | | 2.53 | % | | 3 Month USD LIBOR | | | (265,044 | ) |
| 44,000,000 | | USD | | 10/9/2024 | | CSS (i) | | (Pay) | | | 2.51 | % | | 3 Month USD LIBOR | | | (141,752 | ) |
| 41,200,000 | | USD | | 10/10/2024 | | CSS (i) | | (Pay) | | | 2.48 | % | | 3 Month USD LIBOR | | | (12,345 | ) |
| 173,500,000 | | USD | | 10/17/2024 | | CSS (i) | | (Pay) | | | 2.21 | % | | 3 Month USD LIBOR | | | 4,160,150 | |
| 77,400,000 | | USD | | 10/21/2024 | | CSS (i) | | Receive | | | 2.69 | % | | 3 Month USD LIBOR | | | 1,498,903 | |
| 71,000,000 | | USD | | 9/30/2034 | | CSS (i) | | Receive | | | 3.11 | % | | 3 Month USD LIBOR | | | 1,950,381 | |
| 35,000,000 | | USD | | 7/24/2049 | | CSS (i) | | (Pay) | | | 3.66 | % | | 3 Month USD LIBOR | | | (1,566,751 | ) |
| 28,000,000 | | USD | | 7/24/2049 | | CSS (i) | | (Pay) | | | 3.66 | % | | 3 Month USD LIBOR | | | (1,215,709 | ) |
| 35,000,000 | | USD | | 7/29/2049 | | CSS (i) | | (Pay) | | | 3.33 | % | | 3 Month USD LIBOR | | | (1,887,673 | ) |
| 35,000,000 | | USD | | 7/29/2049 | | CSS (i) | | (Pay) | | | 3.33 | % | | 3 Month USD LIBOR | | | (1,447,999 | ) |
| 36,000,000 | | USD | | 7/29/2049 | | CSS (i) | | (Pay) | | | 3.33 | % | | 3 Month USD LIBOR | | | (1,553,975 | ) |
| 36,000,000 | | USD | | 7/30/2049 | | CSS (i) | | (Pay) | | | 3.62 | % | | 3 Month USD LIBOR | | | (1,333,929 | ) |
| 43,000,000 | | USD | | 8/5/2049 | | CSS (i) | | (Pay) | | | 3.73 | % | | 3 Month USD LIBOR | | | (2,418,388 | ) |
| 99,600,000 | | USD | | 9/12/2049 | | CSS (i) | | (Pay) | | | 3.66 | % | | 3 Month USD LIBOR | | | (4,277,114 | ) |
| | | | | | | | | | | | | | | | | | |
| | | | | | | | | | | | | | | | $ | (14,766,642 | ) |
| | | | | | | | | | | | | | Premiums to (Pay) Receive | | $ | (1,365,030 | ) |
| | | | | | | | | | | | | | | | | | |
| # | Receive - Fund receives fixed rate and pays variable rate. |
| | (Pay) - Fund pays fixed rate and receives variable rate. |
As of October 31, 2014, for the above contracts and/or agreements, the Fund had sufficient cash and/or securities to cover commitments or collateral requirements, if any, of the relevant broker or exchange.
APPENDIX
GMO Benchmark-Free Allocation Fund
(A Series of GMO Trust)
Consolidated Schedule of Investments — (Continued)
(showing percentage of total net assets)
October 31, 2014 (Unaudited)
Notes to Schedule of Investments:
144A - Securities exempt from registration under Rule 144A of the Securities Act of 1933. These securities may be resold in transactions exempt from registration, normally to qualified institutional investors.
ADR - American Depositary Receipt
CDO - Collateralized Debt Obligation
CP - Counterparty
GBP LIBOR - London Interbank Offered Rate denominated in British Pounds.
GDR - Global Depository Receipt
JPY LIBOR - London Interbank Offered Rate denominated in Japanese Yen.
NPFG - National Public Finance Guarantee Corporation.
OJSC - Open Joint-Stock Company
OTC - Over-the-Counter
REIT - Real Estate Investment Trust
SEK STIBOR - Stockholm Interbank Offered Rate denominated in Swedish Krona.
TBA - To Be Announced - Delayed Delivery Security
TIIE - Tasa de Interes Interbacaria de Equilibrio - 28 - Day Interbank Equilibrium Interest Rate - Mexico
USD LIBOR - London Interbank Offered Rate denominated in United States Dollars.
| * | Non-income producing security. |
| (a) | All or a portion of this security is owned by GMO Implementation Fund, which is a 100% owned subsidiary of GMO Benchmark-Free Allocation Fund. |
| (b) | All or a portion of this security has been pledged to cover margin requirements on futures and/or cleared swap contracts, collateral on securities sold short, OTC swap contracts and forward currency contracts, and/or written options, if any. |
| (c) | Security valued at the local price and adjusted by applying a premium or discount since holding exceeds foreign ownership limits. |
| (d) | Security valued at fair value using methods determined in good faith by or at the direction of the Trustees of GMO Trust. |
| (e) | Indexed security in which price and/or coupon is linked to the prices of a specific instrument or financial statistic. |
| (f) | The rate disclosed is the 7 day net yield as of October 31, 2014. Note: Yield rounds to 0.00%. |
| (g) | The rate shown represents yield-to-maturity. |
| (i) | Interest rate swap was cleared through CME Group. |
Counterparty Abbreviations:
BCI - Barclays Capital Inc.
BCLY - Barclays Bank PLC
BOA - Bank of America, N.A.
CSS - Credit Suisse Securities (USA) LLC
DB - Deutsche Bank AG
GS - Goldman Sachs International
JPM - JPMorgan Chase Bank, N.A.
MSCI - Morgan Stanley & Co. International PLC
Currency Abbreviations:
AUD - Australian Dollar
CAD - Canadian Dollar
EUR - Euro
GBP - British Pound
JPY - Japanese Yen
KRW - South Korean Won
MXN - Mexican Peso
SEK - Swedish Krona
USD - United States Dollar
APPENDIX
GMO Benchmark-Free Allocation Fund
(A Series of GMO Trust)
Consolidated Statement of Assets and Liabilities — October 31, 2014 (Unaudited)
| | | | |
Assets: | | | | |
Investments in affiliated issuers, at value(a) | | $ | 4,805,241,208 | |
Investments in unaffiliated issuers, at value(b) | | | 14,679,480,172 | |
Foreign currency, at value(c) | | | 6,536,621 | |
Receivable for investments sold | | | 61,161,697 | |
Receivable for investments sold short | | | 1,057,782,395 | |
Cash | | | 111,119 | |
Receivable for Fund shares sold | | | 73,236,103 | |
Dividends and interest receivable | | | 18,884,909 | |
Foreign taxes receivable | | | 8,027,151 | |
Unrealized appreciation on open forward currency contracts | | | 39,294,282 | |
Due from broker | | | 723,304,420 | |
Receivable for expenses reimbursed and/or waived by Manager | | | 3,461,069 | |
Miscellaneous receivable | | | 52,603 | |
| | | | |
Total assets | | | 21,476,573,749 | |
| | | | |
Liabilities: | | | | |
Investments sold short, at value(d) | | | 1,752,608,080 | |
Payable for investments purchased | | | 135,676,275 | |
Payable for investments purchased short | | | 3,202,456 | |
Payable for Fund shares repurchased | | | 583,130 | |
Accrued capital gain taxes payable | | | 1,597,056 | |
Payable to affiliate for: | | | | |
Management fee | | | 10,558,652 | |
Supplemental support fee – Class MF | | | 1,014,831 | |
Shareholder service fee | | | 801,763 | |
Due to broker | | | 882 | |
Payable for variation margin on open cleared swap contracts | | | 2,138,903 | |
Unrealized depreciation on open forward currency contracts | | | 6,901,041 | |
Interest and dividend payable for short sales | | | 2,285,211 | |
Written options outstanding, at value(e) | | | 2,399,014 | |
Payable to agents unaffiliated with the Manager | | | 3,348 | |
Payable to Trustees and related expenses | | | 15,618 | |
Accrued expenses | | | 2,343,985 | |
| | | | |
Total liabilities | | | 1,922,130,245 | |
| | | | |
Net assets | | $ | 19,554,443,504 | |
| | | | |
(a) Cost of investments – affiliated issuers: | | $ | 4,784,970,341 | |
(b) Cost of investments – unaffiliated issuers: | | $ | 14,648,107,423 | |
(c) Cost of foreign currency: | | $ | 6,475,157 | |
(d) Proceeds from securities sold short: | | $ | 1,723,859,968 | |
(e) Premiums on written options: | | $ | 32,013,813 | |
Net assets consist of: | | | | |
Paid-in capital | | $ | 19,149,564,738 | |
Accumulated undistributed net investment income | | | 171,841,157 | |
Accumulated net realized gain | | | 166,830,088 | |
Net unrealized appreciation | | | 66,207,521 | |
| | | | |
| | $ | 19,554,443,504 | |
| | | | |
Net assets attributable to: | | | | |
Class III shares | | $ | 4,653,293,818 | |
| | | | |
Class IV shares | | $ | 2,704,158,391 | |
| | | | |
Class MF shares | | $ | 12,196,991,295 | |
| | | | |
APPENDIX
GMO Benchmark-Free Allocation Fund
(A Series of GMO Trust)
Consolidated Statement of Assets and Liabilities — October 31, 2014 (Unaudited) — (Continued)
| | | | |
Shares outstanding: | | | | |
Class III | | | 172,311,671 | |
| | | | |
Class IV | | | 100,164,718 | |
| | | | |
Class MF | | | 451,555,075 | |
| | | | |
Net asset value per share: | | | | |
Class III | | $ | 27.01 | |
| | | | |
Class IV | | $ | 27.00 | |
| | | | |
Class MF | | $ | 27.01 | |
| | | | |
This page is intentionally left blank.
This page is intentionally left blank.
This page is intentionally left blank.


For more information
More information about Wells Fargo Advantage Funds is available free upon request. To obtain literature, please write, email, visit the Fund’s website, or call:
Wells Fargo Advantage Funds
P.O. Box 8266
Boston, MA 02266-8266
Email: wfaf@wellsfargo.com
Website: wellsfargoadvantagefunds.com
Individual investors: 1-800-222-8222
Retail investment professionals: 1-888-877-9275
Institutional investment professionals: 1-866-765-0778
This report and the financial statements contained herein are submitted for the general information of the shareholders of Wells Fargo Advantage Funds. If this report is used for promotional purposes, distribution of the report must be accompanied or preceded by a current prospectus. Before investing, please consider the investment objectives, risks, charges, and expenses of the investment. For a current prospectus and, if available, a summary prospectus, containing this information, call 1-800-222-8222 or visit the Fund’s website at wellsfargoadvantagefunds.com. Read the prospectus carefully before you invest or send money.
Wells Fargo Funds Management, LLC, a wholly owned subsidiary of Wells Fargo & Company, provides investment advisory and administrative services for Wells Fargo Advantage Funds. Other affiliates of Wells Fargo & Company provide subadvisory and other services for the Funds. The Funds are distributed by Wells Fargo Funds Distributor, LLC, Member FINRA/SIPC, an affiliate of Wells Fargo & Company.
NOT FDIC INSURED ¡ NO BANK GUARANTEE ¡ MAY LOSE VALUE
© 2014 Wells Fargo Funds Management, LLC. All rights reserved.
| | |
 | | 229612 12-14 SA260/SAR260 10-14 |

Wells Fargo Advantage
Asset Allocation Fund

Semi-Annual Report
October 31, 2014

Reduce clutter. Save trees.
Sign up for electronic delivery of prospectuses and shareholder reports at wellsfargo.com/advantagedelivery
Contents
The views expressed and any forward-looking statements are as of October 31, 2014, unless otherwise noted, and are those of the Fund managers and/or Wells Fargo Funds Management, LLC. Discussions of individual securities, or the markets generally, or any Wells Fargo Advantage Fund are not intended as individual recommendations. Future events or results may vary significantly from those expressed in any forward-looking statements; the views expressed are subject to change at any time in response to changing circumstances in the market. Wells Fargo Funds Management, LLC and the Fund disclaim any obligation to publicly update or revise any views expressed or forward-looking statements.
NOT FDIC INSURED ¡ NO BANK GUARANTEE ¡ MAY LOSE VALUE
| | | | |
| 2 | | Wells Fargo Advantage Asset Allocation Fund | | Letter to shareholders (unaudited) |

Karla M. Rabusch
President
Wells Fargo Advantage Funds
Major central banks continued to inject liquidity into global banks and markets through various accommodative monetary policies, including quantitative easing.
Dear Valued Shareholder:
We are pleased to offer you this semi-annual report for the Wells Fargo Advantage Asset Allocation Fund for the six-month period that ended October 31, 2014. The period was marked by continued accommodative monetary policy in developed countries, broader economic growth, low inflation, and equity market gains.
Within equities, U.S. stocks (measured by the S&P 500 Index1) returned 7.12% over the past six months and developed-country international shares (measured by the MSCI EAFE Index (Net)2) declined 4.83%. The U.S. was the fastest-growing developed country, which benefited U.S. companies. In addition, a strong U.S. dollar held back the returns of non-U.S. investments in dollar terms. Most bond sectors gained modestly amid renewed confidence in economic growth that drove outperformance in credit-sensitive sectors as solid economic growth boosted company revenue and profits and kept default rates low. The Barclays U.S. Aggregate Bond Index3 returned 2.35% during the period. Short-term interest rates remained ultra-low.
Major central banks continued to provide stimulus.
Major central banks continued to inject liquidity into global banks and markets through various accommodative monetary policies, including quantitative easing. In the U.S., the U.S. Federal Reserve (Fed) kept its key interest rate near zero in order to support the economy and the financial system. It tapered the size of its quantitative easing program each month until the program ended in October 2014 and discussed changes to its forward guidance as it begins to normalize monetary policy. Meanwhile, European markets continued to benefit from the European Central Bank’s (ECB’s) willingness to maintain low interest rates. In September 2014, the ECB cut its key rate to a historic low of 0.05%. In addition to its targeted longer-term refinancing operations that are designed to increase bank lending, the ECB released details of its asset-backed securities purchase program and the new covered bond purchase program, which are scheduled to begin in the fourth quarter of 2014. In Japan, the Bank of Japan maintained an aggressive monetary program aimed at combating deflation.
Economic growth was sluggish outside the U.S.
In the U.S., economic activity continued to expand. The unemployment rate ticked lower to 5.8% as of October 2014. More than 200,000 jobs were added to payrolls each month between February 2014 and October 2014. On the inflation front, the personal consumption expenditures price index rose from a deflationary danger zone toward the Fed’s longer-run objective of a 2% pace.
Elsewhere, economic data continued to show sluggish growth. The European Union’s gross domestic product was unchanged in the second quarter of 2014 and was up only 0.7% from a year earlier. The region’s unemployment rate remained high at 11.5% in September 2014. In Japan, its economy faltered in reaction to a sales tax increase despite Prime Minister Abe’s economic plans to promote growth.
| 1. | The S&P 500 Index consists of 500 stocks chosen for market size, liquidity, and industry group representation. It is a market-value-weighted index with each stock’s weight in the index proportionate to its market value. You cannot invest directly in an index. |
| 2. | The Morgan Stanley Capital International Europe, Australasia, and Far East (MSCI EAFE) Index (Net) is an unmanaged group of securities widely regarded by investors to be representations of the stock markets of Europe, Australasia, and the Far East. Calculations for EAFE use net dividends, which reflect the deduction of withholding taxes. You cannot invest directly in an index. Source: MSCI. MSCI makes no express or implied warranties or representations and shall have no liability whatsoever with respect to any MSCI data contained herein. The MSCI data may not be further redistributed or used as a basis for other indexes or any securities or financial products. This report is not approved, reviewed, or produced by MSCI. |
| 3. | The Barclays U.S. Aggregate Bond Index is a broad-based benchmark that measures the investment-grade, U.S. dollar-denominated, fixed-rate taxable bond market, including Treasuries, government-related and corporate securities, MBS (agency fixed-rate and hybrid ARM passthroughs), ABS, and CMBS. You cannot invest directly in an index. |
| | | | | | |
| Letter to shareholders (unaudited) | | Wells Fargo Advantage Asset Allocation Fund | | | 3 | |
While yields have been at historically low levels, there is a risk of rising rates and negative bond returns. However, fixed-income markets appear to have functioned well over the past year with sufficient liquidity and muted volatility.
Don’t let short-term uncertainty derail long-term investment goals.
Periods of uncertainty can present challenges, but experience has taught us that maintaining long-term investment goals can be an effective way to plan for the future. To help you create a sound strategy based on your personal goals and risk tolerance, Wells Fargo Advantage Funds offers more than 100 mutual funds spanning a wide range of asset classes and investment styles. Although diversification cannot guarantee an investment profit or prevent losses, we believe it can be an effective way to manage investment risk and potentially smooth out overall portfolio performance. We encourage investors to know their investments and to understand that appropriate levels of risk-taking may unlock opportunities.
Thank you for choosing to invest with Wells Fargo Advantage Funds. We appreciate your confidence in us and remain committed to helping you meet your financial needs. For current information about your fund investments, contact your investment professional, visit our website at wellsfargoadvantagefunds.com, or call us directly at 1-800-222-8222. We are available 24 hours a day, 7 days a week.
Sincerely,

Karla M. Rabusch
President
Wells Fargo Advantage Funds
Periods of uncertainty can present challenges, but experience has taught us that maintaining long-term investment goals can be an effective way to plan for the future.
| | | | |
| 4 | | Wells Fargo Advantage Asset Allocation Fund | | Performance highlights (unaudited) |
Investment objective
The Fund seeks long-term total return, consisting of capital appreciation and current income.
Adviser
Wells Fargo Funds Management, LLC
Portfolio managers
Ben Inker, CFA1
Sam Wilderman, CFA1
Average annual total returns2 (%) as of October 31, 2014
| | | | | | | | | | | | | | | | | | | | | | | | | | | | | | | | | | |
| | | | | Including sales charge | | | Excluding sales charge | | | Expense ratios3 (%) | |
| | | Inception date | | 1 year | | | 5 year | | | 10 year | | | 1 year | | | 5 year | | | 10 year | | | Gross | | | Net4 | |
| Class A (EAAFX) | | 7-29-1996 | | | (3.29 | ) | | | 5.82 | | | | 5.29 | | | | 2.60 | | | | 7.08 | | | | 5.91 | | | | 1.36 | | | | 1.36 | |
| Class B (EABFX)* | | 10-3-2002 | | | (3.18 | ) | | | 5.96 | | | | 5.37 | | | | 1.82 | | | | 6.28 | | | | 5.37 | | | | 2.11 | | | | 2.11 | |
| Class C (EACFX) | | 10-3-2002 | | | 0.83 | | | | 6.27 | | | | 5.13 | | | | 1.83 | | | | 6.27 | | | | 5.13 | | | | 2.11 | | | | 2.11 | |
| Class R (EAXFX) | | 10-10-2003 | | | – | | | | – | | | | – | | | | 2.38 | | | | 6.81 | | | | 5.67 | | | | 1.61 | | | | 1.61 | |
| Administrator Class (EAIFX) | | 10-3-2002 | | | – | | | | – | | | | – | | | | 2.79 | | | | 7.30 | | | | 6.17 | | | | 1.20 | | | | 1.15 | |
| Institutional Class (EAAIX) | | 11-30-2012 | | | – | | | | – | | | | – | | | | 3.05 | | | | 7.39 | | | | 6.21 | | | | 0.93 | | | | 0.93 | |
| GMO Global Balanced Index5 | | – | | | – | | | | – | | | | – | | | | 6.57 | | | | 8.60 | | | | 6.10 | | | | – | | | | – | |
| Barclays U.S. Aggregate Bond Index6 | | – | | | – | | | | – | | | | – | | | | 4.14 | | | | 4.22 | | | | 4.64 | | | | – | | | | – | |
| MSCI All Country World Index (Net)7 | | – | | | – | | | | – | | | | – | | | | 7.77 | | | | 10.57 | | | | 7.09 | | | | – | | | | – | |
| * | | Class B shares are closed to investment, except in connection with the reinvestment of any distributions and permitted exchanges. |
Figures quoted represent past performance, which is no guarantee of future results, and do not reflect taxes that a shareholder may pay on fund distributions or the redemption of fund shares. Investment return and principal value of an investment will fluctuate so that an investor’s shares, when redeemed, may be worth more or less than their original cost. Performance shown without sales charges would be lower if sales charges were reflected. Current performance may be lower or higher than the performance data quoted, which assumes the reinvestment of dividends and capital gains. Current month-end performance is available on the Fund’s website, wellsfargoadvantagefunds.com.
Index returns do not include transaction costs associated with buying and selling securities, any mutual fund fees or expenses, or any taxes. It is not possible to invest directly in an index.
For Class A shares, the maximum front-end sales charge is 5.75%. For Class B shares, the maximum contingent deferred sales charge is 5.00%. For Class C shares, the maximum contingent deferred sales charge is 1.00%. Performance including a contingent deferred sales charge assumes the sales charge for the corresponding time period. Class R, Administrator Class, and Institutional Class shares are sold without a front-end sales charge or contingent deferred sales charge.
Balanced funds may invest in stocks and bonds. Stock values fluctuate in response to the activities of individual companies and general market and economic conditions. Bond values fluctuate in response to the financial condition of individual issuers, general market and economic conditions, and changes in interest rates. In general, when interest rates rise, bond values fall and investors may lose principal value. Alternative investments, such as short sales are speculative and entail a high degree of risk. Foreign investments are especially volatile and can rise or fall dramatically due to differences in the political and economic conditions of the host country. The Fund will indirectly be exposed to all of the risks of an investment in the underlying funds and will indirectly bear expenses of the underlying funds. The use of derivatives may reduce returns and/or increase volatility. Certain investment strategies tend to increase the total risk of an investment (relative to the broader market). The Fund is exposed to high-yield securities risk, mortgage- and asset-backed securities risk, and smaller-company securities risk. Consult the Fund’s prospectus for additional information on these and other risks. The Fund invests all of its assets in Asset Allocation Trust, an open-end management investment company having the same investment objective and strategy as the Fund. Any portfolio data shown for the Fund represents that of the Asset Allocation Trust.
Please see footnotes on page 5.
| | | | | | |
| Performance highlights (unaudited) | | Wells Fargo Advantage Asset Allocation Fund | | | 5 | |
| | | | |
| Ten largest holdings8 (%) as of October 31, 2014 | |
GMO International Equity Fund Class IV | | | 27.00 | |
GMO Asset Allocation Bond Fund Class VI | | | 21.83 | |
GMO U.S. Core Equity Fund Class VI | | | 16.92 | |
GMO Alpha Only Fund Class IV | | | 9.65 | |
GMO Emerging Markets Fund Class VI | | | 8.05 | |
GMO Risk Premium Fund Class VI | | | 4.92 | |
GMO Debt Opportunities Fund Class VI | | | 4.54 | |
GMO Emerging Country Debt Fund Class IV | | | 3.49 | |
GMO U.S. Treasury Fund Class IV | | | 3.40 | |
|
| Portfolio allocation9 as of October 31, 2014 |
|
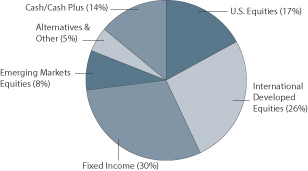
|
| 1. | The Fund invests all of its investable assets directly in Asset Allocation Trust, an investment company advised by Grantham, Mayo, Van Otterloo & Co. LLC (GMO). Mr. Inker and Mr. Wilderman, the co-heads and, senior members of GMO’s Asset Allocation Team, are primarily responsible for coordinating the portfolio management of Asset Allocation Trust. |
| 2. | Historical performance shown for all classes of the Fund prior to July 19, 2010, is based on the performance of the Fund’s predecessor, Evergreen Asset Allocation Fund. Historical performance shown for Institutional Class shares prior to their inception reflects the performance of Administrator Class shares, and includes the higher expenses applicable to Administrator Class. If these expenses had been included, returns for Institutional Class would be higher. |
| 3. | Reflects the expense ratios as stated in the most recent prospectuses, which includes the expenses of Asset Allocation Trust and other acquired fund fees and expenses. The expense ratios shown are subject to change and may differ from the annualized expense ratios shown in the financial highlights of this report, which do not include the expenses of Asset Allocation Trust and other acquired fund fees and expenses. |
| 4. | The Adviser has committed through August 31, 2015, to waive fees and/or reimburse expenses to the extent necessary to cap the Fund’s Total Annual Fund Operating Expenses After Fee Waiver at 0.87% for Class A, 1.62% for Class B, 1.62% for Class C, 1.12% for Class R, 0.64% for Administrator Class, and 0.44% for Institutional Class. After this time, the cap may be increased or the commitment to maintain the cap may be terminated only with the approval of the Board of Trustees. Brokerage commissions, stamp duty fees, interest, taxes, acquired fund fees and expenses (including the expenses of Asset Allocation Trust), and extraordinary expenses are excluded from the cap. Without this cap, the Fund’s returns would have been lower. |
| 5. | The GMO Global Balanced Index is a composite benchmark computed by GMO. Since May 1, 2007, the GMO Global Balanced Index has been comprised of 65% MSCI All Country World Index (Net) and 35% Barclays U.S. Aggregate Bond Index. Prior to May 1, 2007, it was composed of 48.75% S&P 500 Index, 16.25% MSCI All Country World ex-U.S. Index, and 35% Barclays U.S. Aggregate Bond Index. You cannot invest directly in an index. |
| 6. | The Barclays U.S. Aggregate Bond Index is a broad-based benchmark that measures the investment-grade, U.S. dollar-denominated, fixed-rate taxable bond market, including Treasuries, government-related and corporate securities, MBS (agency fixed-rate and hybrid ARM passthroughs), ABS, and CMBS. You cannot invest directly in an index. |
| 7. | The MSCI All Country World Index (Net) is a free float-adjusted market capitalization weighted index that is designed to measure the equity market performance of developed and emerging markets. You cannot invest directly in an index. Source: MSCI. MSCI makes no express or implied warranties or representations and shall have no liability whatsoever with respect to any MSCI data contained herein. The MSCI data may not be further redistributed or used as a basis for other indexes or any securities or financial products. This report is not approved, reviewed, or produced by MSCI. |
| 8. | The ten largest holdings are calculated based on the value of the securities of the Asset Allocation Trust divided by the total net assets of the Fund. Holdings are subject to change and may have changed since the date specified. |
| 9. | Portfolio allocation is subject to change and represents the portfolio allocation of Asset Allocation Trust, which is calculated based on the investment exposures of the underlying GMO funds and holdings of Asset Allocation Trust. |
| | | | |
| 6 | | Wells Fargo Advantage Asset Allocation Fund | | Fund expenses (unaudited) |
As a shareholder of the Fund, you incur two types of costs: (1) transaction costs, including sales charges (loads) on purchase payments and contingent deferred sales charges (if any) on redemptions and (2) ongoing costs, including management fees, distribution (12b-1) and/or shareholder service fees, and other Fund expenses. This example is intended to help you understand your ongoing costs (in dollars) of investing in the Fund and to compare these costs with the ongoing costs of investing in other mutual funds.
The example is based on an investment of $1,000 invested at the beginning of the six-month period and held for the entire period from May 1, 2014 to October 31, 2014.
Actual expenses
The “Actual” line of the table below provides information about actual account values and actual expenses. You may use the information in this line, together with the amount you invested, to estimate the expenses that you paid over the period. Simply divide your account value by $1,000 (for example, an $8,600 account value divided by $1,000 = 8.6), then multiply the result by the number in the “Actual” line under the heading entitled “Expenses paid during period” for your applicable class of shares to estimate the expenses you paid on your account during this period.
Hypothetical example for comparison purposes
The “Hypothetical” line of the table below provides information about hypothetical account values and hypothetical expenses based on the Fund’s actual expense ratio and an assumed rate of return of 5% per year before expenses, which is not the Fund’s actual return. The hypothetical account values and expenses may not be used to estimate the actual ending account balance or expenses you paid for the period. You may use this information to compare the ongoing costs of investing in the Fund and other funds. To do so, compare this 5% hypothetical example with the 5% hypothetical examples that appear in the shareholder reports of the other funds.
Please note that the expenses shown in the table are meant to highlight your ongoing costs only and do not reflect any transactional costs, such as sales charges (loads) and contingent deferred sales charges. Therefore, the “Hypothetical” line of the table is useful in comparing ongoing costs only and will not help you determine the relative total costs of owning different funds. In addition, if these transactional costs were included, your costs would have been higher.
| | | | | | | | | | | | | | | | |
| Wells Fargo Advantage Asset Allocation Fund | | Beginning
account value
5-1-2014 | | | Ending
account value
10-31-2014 | | | Expenses
paid during
the period¹ | | | Net annualized
expense ratio | |
Class A | | | | | | | | | | | | | | | | |
Actual | | $ | 1,000.00 | | | $ | 987.53 | | | $ | 4.21 | | | | 0.84 | % |
Hypothetical (5% return before expenses) | | $ | 1,000.00 | | | $ | 1,020.97 | | | $ | 4.28 | | | | 0.84 | % |
Class B | | | | | | | | | | | | | | | | |
Actual | | $ | 1,000.00 | | | $ | 983.89 | | | $ | 7.95 | | | | 1.59 | % |
Hypothetical (5% return before expenses) | | $ | 1,000.00 | | | $ | 1,017.19 | | | $ | 8.08 | | | | 1.59 | % |
Class C | | | | | | | | | | | | | | | | |
Actual | | $ | 1,000.00 | | | $ | 983.48 | | | $ | 7.95 | | | | 1.59 | % |
Hypothetical (5% return before expenses) | | $ | 1,000.00 | | | $ | 1,017.19 | | | $ | 8.08 | | | | 1.59 | % |
Class R | | | | | | | | | | | | | | | | |
Actual | | $ | 1,000.00 | | | $ | 985.99 | | | $ | 5.46 | | | | 1.09 | % |
Hypothetical (5% return before expenses) | | $ | 1,000.00 | | | $ | 1,019.71 | | | $ | 5.55 | | | | 1.09 | % |
Administrator Class | | | | | | | | | | | | | | | | |
Actual | | $ | 1,000.00 | | | $ | 988.31 | | | $ | 3.21 | | | | 0.64 | % |
Hypothetical (5% return before expenses) | | $ | 1,000.00 | | | $ | 1,021.98 | | | $ | 3.26 | | | | 0.64 | % |
Institutional Class | | | | | | | | | | | | | | | | |
Actual | | $ | 1,000.00 | | | $ | 989.65 | | | $ | 2.06 | | | | 0.41 | % |
Hypothetical (5% return before expenses) | | $ | 1,000.00 | | | $ | 1,023.14 | | | $ | 2.09 | | | | 0.41 | % |
| | | | | | |
| Fund expenses (unaudited) | | Wells Fargo Advantage Asset Allocation Fund | | | 7 | |
| | | | | | | | | | | | | | | | |
Wells Fargo Advantage Asset Allocation Fund including
underlying fund expenses | | Beginning
account value
5-1-2014 | | | Ending
account value
10-31-2014 | | | Expenses
paid during
the period¹ | | | Net annualized
expense ratio | |
Class A | | | | | | | | | | | | | | | | |
Actual | | $ | 1,000.00 | | | $ | 987.53 | | | $ | 6.91 | | | | 1.38 | % |
Hypothetical (5% return before expenses) | | $ | 1,000.00 | | | $ | 1,018.25 | | | $ | 7.02 | | | | 1.38 | % |
Class B | | | | | | | | | | | | | | | | |
Actual | | $ | 1,000.00 | | | $ | 983.89 | | | $ | 10.65 | | | | 2.13 | % |
Hypothetical (5% return before expenses) | | $ | 1,000.00 | | | $ | 1,014.47 | | | $ | 10.82 | | | | 2.13 | % |
Class C | | | | | | | | | | | | | | | | |
Actual | | $ | 1,000.00 | | | $ | 983.48 | | | $ | 10.65 | | | | 2.13 | % |
Hypothetical (5% return before expenses) | | $ | 1,000.00 | | | $ | 1,014.47 | | | $ | 10.82 | | | | 2.13 | % |
Class R | | | | | | | | | | | | | | | | |
Actual | | $ | 1,000.00 | | | $ | 985.99 | | | $ | 8.16 | | | | 1.63 | % |
Hypothetical (5% return before expenses) | | $ | 1,000.00 | | | $ | 1,016.99 | | | $ | 8.29 | | | | 1.63 | % |
Administrator Class | | | | | | | | | | | | | | | | |
Actual | | $ | 1,000.00 | | | $ | 988.31 | | | $ | 5.91 | | | | 1.18 | % |
Hypothetical (5% return before expenses) | | $ | 1,000.00 | | | $ | 1,019.26 | | | $ | 6.01 | | | | 1.18 | % |
Institutional Class | | | | | | | | | | | | | | | | |
Actual | | $ | 1,000.00 | | | $ | 989.65 | | | $ | 4.76 | | | | 0.95 | % |
Hypothetical (5% return before expenses) | | $ | 1,000.00 | | | $ | 1,020.42 | | | $ | 4.84 | | | | 0.95 | % |
| Asset Allocation Trust | | | | | | | | | | | | |
Actual | | $ | 1,000.00 | | | $ | 991.70 | | | $ | 0.00 | | | | 0.00 | % |
Hypothetical (5% return before expenses) | | $ | 1,000.00 | | | $ | 1,025.21 | | | $ | 0.00 | | | | 0.00 | % |
| Asset Allocation Trust including underlying fund expenses | | | | | | | | | | | | |
Actual | | $ | 1,000.00 | | | $ | 991.70 | | | $ | 2.71 | | | | 0.54 | % |
Hypothetical (5% return before expenses) | | $ | 1,000.00 | | | $ | 1,022.48 | | | $ | 2.75 | | | | 0.54 | % |
| 1. | Expenses paid is equal to the annualized expense ratio multiplied by the average account value over the period, multiplied by the number of days in the most recent fiscal half-year divided by the number of days in the fiscal year (to reflect the one-half-year period). |
| | | | |
| 8 | | Wells Fargo Advantage Asset Allocation Fund | | Portfolio of investments—October 31, 2014 (unaudited) |
| | | | | | | | | | | | |
| Security name | | | | | | Shares | | | Value | |
| | | | |
Investment Companies: 100.15% | | | | | | | | | | | | |
Asset Allocation Trust (l) | | | | | | | 398,185,480 | | | $ | 6,159,136,006 | |
| | | | | | | | | | | | |
| | | | |
Total Investment Companies (Cost $4,405,501,063) | | | | | | | | | | | 6,159,136,006 | |
| | | | | | | | | | | | |
| | | | | | | | |
| Total investments (Cost $4,405,501,063)* | | | 100.15 | % | | | 6,159,136,006 | |
Other assets and liabilities, net | | | (0.15 | ) | | | (9,467,840 | ) |
| | | | | | | | |
| Total net assets | | | 100.00 | % | | $ | 6,149,668,166 | |
| | | | | | | | |
| (l) | The security represents an affiliate of the Fund as defined in the Investment Company Act of 1940. |
| * | Cost for federal income tax purposes is $4,405,676,657 and unrealized gains (losses) consists of: |
| | | | |
Gross unrealized gains | | $ | 1,753,459,349 | |
Gross unrealized losses | | | 0 | |
| | | | |
Net unrealized gains | | $ | 1,753,459,349 | |
The accompanying notes are an integral part of these financial statements.
| | | | | | |
| Statement of assets and liabilities—October 31, 2014 (unaudited) | | Wells Fargo Advantage Asset Allocation Fund | | | 9 | |
| | | | |
| | | | |
| |
Assets | | | | |
Investment in affiliated investment companies, at value (cost $4,405,501,063) | | $ | 6,159,136,006 | |
Receivable for investments sold | | | 3,294,425 | |
Receivable for Fund shares sold | | | 2,741,370 | |
Prepaid expenses and other assets | | | 44,942 | |
| | | | |
Total assets | | | 6,165,216,743 | |
| | | | |
| |
Liabilities | | | | |
Payable for Fund shares redeemed | | | 9,197,998 | |
Advisory fee payable | | | 1,209,849 | |
Distribution fees payable | | | 1,651,994 | |
Administration fees payable | | | 1,724,662 | |
Shareholder servicing fees payable | | | 1,179,141 | |
Accrued expenses and other liabilities | | | 584,933 | |
| | | | |
Total liabilities | | | 15,548,577 | |
| | | | |
Total net assets | | $ | 6,149,668,166 | |
| | | | |
| |
NET ASSETS CONSIST OF | | | | |
Paid-in capital | | $ | 4,326,451,891 | |
Accumulated net investment loss | | | (43,811,416 | ) |
Accumulated net realized gains on investments | | | 113,392,748 | |
Net unrealized gains on investments | | | 1,753,634,943 | |
| | | | |
Total net assets | | $ | 6,149,668,166 | |
| | | | |
| |
COMPUTATION OF NET ASSET VALUE AND OFFERING PRICE PER SHARE | | | | |
Net assets – Class A | | $ | 2,123,904,304 | |
Shares outstanding – Class A1 | | | 149,067,519 | |
Net asset value per share – Class A | | | $14.25 | |
Maximum offering price per share – Class A2 | | | $15.12 | |
Net assets – Class B | | $ | 235,303,301 | |
Shares outstanding – Class B1 | | | 16,751,706 | |
Net asset value per share – Class B | | | $14.05 | |
Net assets – Class C | | $ | 2,211,009,554 | |
Shares outstanding – Class C1 | | | 161,493,398 | |
Net asset value per share – Class C | | | $13.69 | |
Net assets – Class R | | $ | 32,518,606 | |
Shares outstanding – Class R1 | | | 2,309,990 | |
Net asset value per share – Class R | | | $14.08 | |
Net assets – Administrator Class | | $ | 673,788,663 | |
Shares outstanding – Administrator Class1 | | | 46,878,818 | |
Net asset value per share – Administrator Class | | | $14.37 | |
Net assets – Institutional Class | | $ | 873,143,738 | |
Shares outstanding – Institutional Class1 | | | 60,882,664 | |
Net asset value per share – Institutional Class | | | $14.34 | |
| 1. | The Fund has an unlimited number of authorized shares. |
| 2. | Maximum offering price is computed as 100/94.25 of net asset value. On investments of $50,000 or more, the offering price is reduced. |
The accompanying notes are an integral part of these financial statements.
| | | | |
| 10 | | Wells Fargo Advantage Asset Allocation Fund | | Statement of operations—six months ended October 31, 2014 (unaudited) |
| | | | |
| | | | |
| |
Investment income | | $ | 0 | |
| | | | |
| |
Expenses | | | | |
Advisory fee | | | 7,362,295 | |
Administration fees | | | | |
Fund level | | | 3,148,753 | |
Class A | | | 3,054,662 | |
Class B | | | 364,557 | |
Class C | | | 3,078,603 | |
Class R | | | 44,981 | |
Administrator Class | | | 381,537 | |
Institutional Class | | | 320,765 | |
Shareholder servicing fees | | | | |
Class A | | | 2,937,175 | |
Class B | | | 349,948 | |
Class C | | | 2,960,195 | |
Class R | | | 42,397 | |
Administrator Class | | | 943,146 | |
Distribution fees | | | | |
Class B | | | 1,051,607 | |
Class C | | | 8,880,586 | |
Class R | | | 43,251 | |
Custody and accounting fees | | | 159,032 | |
Professional fees | | | 21,167 | |
Registration fees | | | 44,460 | |
Shareholder report expenses | | | 188,937 | |
Trustees’ fees and expenses | | | 601 | |
Interest expense | | | 1,295 | |
Other fees and expenses | | | 59,551 | |
| | | | |
Total expenses | | | 35,439,501 | |
Less: Fee waivers and/or expense reimbursements | | | (152,710 | ) |
| | | | |
Net expenses | | | 35,286,791 | |
| | | | |
Net investment loss | | | (35,286,791 | ) |
| | | | |
| |
REALIZED AND UNREALIZED GAINS (LOSSES) ON INVESTMENTS | | | | |
Net realized gains on investments | | | 113,568,341 | |
Net change in unrealized gains (losses) on investments | | | (163,324,923 | ) |
| | | | |
Net realized and unrealized gains (losses) on investments | | | (49,756,582 | ) |
| | | | |
Net decrease in net assets resulting from operations | | $ | (85,043,373 | ) |
| | | | |
The accompanying notes are an integral part of these financial statements.
| | | | | | |
| Statement of changes in net assets | | Wells Fargo Advantage Asset Allocation Fund | | | 11 | |
| | | | | | | | | | | | | | | | | | | | | | | | |
| | | Six months ended October 31, 2014 (unaudited) | | | Year ended April 30, 20141 | | | Year ended September 30, 2013 | |
| | | | | | |
Operations | | | | | | | | | | | | | | | | | | | | | | | | |
Net investment loss | | | | | | $ | (35,286,791 | ) | | | | | | $ | (42,423,217 | ) | | | | | | $ | (77,070,007 | ) |
Net realized gains on investments | | | | | | | 113,568,341 | | | | | | | | 125,347,677 | | | | | | | | 264,727,390 | |
Net change in unrealized gains (losses) on investments | | | | | | | (163,324,923 | ) | | | | | | | 352,039,882 | | | | | | | | 399,339,730 | |
| | | | | | | | | | | | | | | | | | | | | | | | |
Net increase (decrease) in net assets resulting from operations | | | | | | | (85,043,373 | ) | | | | | | | 434,964,342 | | | | | | | | 586,997,113 | |
| | | | | | | | | | | | | | | | | | | | | | | | |
| | | | | | |
Distributions to shareholders from | | | | | | | | | | | | | | | | | | | | | | | | |
Net investment income | | | | | | | | | | | | | | | | | | | | | | | | |
Class A | | | | | | | 0 | | | | | | | | (40,607,461 | ) | | | | | | | (57,362,902 | ) |
Class B | | | | | | | 0 | | | | | | | | (2,586,640 | ) | | | | | | | (9,294,476 | ) |
Class C | | | | | | | 0 | | | | | | | | (22,318,368 | ) | | | | | | | (43,156,505 | ) |
Class R | | | | | | | 0 | | | | | | | | (513,277 | ) | | | | | | | (645,944 | ) |
Administrator Class | | | | | | | 0 | | | | | | | | (14,587,845 | ) | | | | | | | (42,289,555 | ) |
Institutional Class | | | | | | | 0 | | | | | | | | (15,076,483 | ) | | | | | | | (2,036 | )2 |
| | | | | | | | | | | | | | | | | | | | | | | | |
Total distributions to shareholders | | | | | | | 0 | | | | | | | | (95,690,074 | ) | | | | | | | (152,751,418 | ) |
| | | | | | | | | | | | | | | | | | | | | | | | |
| | | | | | |
Capital share transactions | | | Shares | | | | | | | | Shares | | | | | | | | Shares | | | | | |
Proceeds from shares sold | | | | | | | | | | | | | | | | | | | | | | | | |
Class A | | | 6,813,517 | | | | 98,849,140 | | | | 12,974,609 | | | | 181,904,545 | | | | 27,500,064 | | | | 363,545,549 | |
Class B | | | 3,695 | | | | 41,055 | | | | 29,272 | | | | 406,419 | | | | 181,414 | | | | 2,354,447 | |
Class C | | | 3,207,490 | | | | 44,737,383 | | | | 5,118,301 | | | | 69,352,064 | | | | 10,368,647 | | | | 132,219,134 | |
Class R | | | 209,508 | | | | 3,007,944 | | | | 379,660 | | | | 5,269,287 | | | | 1,065,336 | | | | 13,931,892 | |
Administrator Class | | | 4,786,503 | | | | 70,040,837 | | | | 8,979,653 | | | | 127,175,642 | | | | 23,349,295 | | | | 310,106,152 | |
Institutional Class | | | 17,206,969 | | | | 251,416,304 | | | | 9,608,319 | | | | 135,592,201 | | | | 55,968,375 | 2 | | | 740,279,694 | 2 |
| | | | | | | | | | | | | | | | | | | | | | | | |
| | | | | | | 468,092,663 | | | | | | | | 519,700,158 | | | | | | | | 1,562,436,868 | |
| | | | | | | | | | | | | | | | | | | | | | | | |
Reinvestment of distributions | | | | | | | | | | | | | | | | | | | | | | | | |
Class A | | | 0 | | | | 0 | | | | 2,689,297 | | | | 37,677,047 | | | | 4,125,827 | | | | 52,563,034 | |
Class B | | | 0 | | | | 0 | | | | 178,568 | | | | 2,482,088 | | | | 702,281 | | | | 8,848,740 | |
Class C | | | 0 | | | | 0 | | | | 1,281,741 | | | | 17,367,591 | | | | 2,710,463 | | | | 33,365,798 | |
Class R | | | 0 | | | | 0 | | | | 32,649 | | | | 452,844 | | | | 42,436 | | | | 535,537 | |
Administrator Class | | | 0 | | | | 0 | | | | 728,783 | | | | 10,283,122 | | | | 2,570,656 | | | | 32,955,810 | |
Institutional Class | | | 0 | | | | 0 | | | | 1,025,862 | | | | 14,413,362 | | | | 159 | 2 | | | 2,036 | 2 |
| | | | | | | | | | | | | | | | | | | | | | | | |
| | | | | | | 0 | | | | | | | | 82,676,054 | | | | | | | | 128,270,955 | |
| | | | | | | | | | | | | | | | | | | | | | | | |
Payment for shares redeemed | | | | | | | | | | | | | | | | | | | | | | | | |
Class A | | | (23,950,151 | ) | | | (347,957,963 | ) | | | (19,264,010 | ) | | | (270,923,127 | ) | | | (40,596,506 | ) | | | (537,198,888 | ) |
Class B | | | (5,604,232 | ) | | | (80,374,460 | ) | | | (9,698,442 | ) | | | (134,202,661 | ) | | | (21,094,620 | ) | | | (274,546,944 | ) |
Class C | | | (12,546,122 | ) | | | (174,671,111 | ) | | | (17,362,843 | ) | | | (235,186,592 | ) | | | (41,366,030 | ) | | | (526,212,402 | ) |
Class R | | | (279,986 | ) | | | (4,010,458 | ) | | | (531,495 | ) | | | (7,422,480 | ) | | | (951,593 | ) | | | (12,390,495 | ) |
Administrator Class | | | (11,271,499 | ) | | | (165,019,717 | ) | | | (14,839,383 | ) | | | (210,262,915 | ) | | | (87,550,899 | ) | | | (1,161,108,304 | ) |
Institutional Class | | | (5,779,404 | ) | | | (83,880,751 | ) | | | (10,325,655 | ) | | | (145,893,598 | ) | | | (6,821,961 | )2 | | | (92,435,938 | )2 |
| | | | | | | | | | | | | | | | | | | | | | | | |
| | | | | | | (855,914,460 | ) | | | | | | | (1,003,891,373 | ) | | | | | | | (2,603,892,971 | ) |
| | | | | | | | | | | | | | | | | | | | | | | | |
Net decrease in net assets resulting from capital share transactions | | | | | | | (387,821,797 | ) | | | | | | | (401,515,161 | ) | | | | | | | (913,185,148 | ) |
| | | | | | | | | | | | | | | | | | | | | | | | |
Total decrease in net assets | | | | | | | (472,865,170 | ) | | | | | | | (62,240,893 | ) | | | | | | | (478,939,453 | ) |
| | | | | | | | | | | | | | | | | | | | | | | | |
| | | | | | |
Net assets | | | | | | | | | | | | | | | | | | | | | | | | |
Beginning of period | | | | | | | 6,622,533,336 | | | | | | | | 6,684,774,229 | | | | | | | | 7,163,713,682 | |
| | | | | | | | | | | | | | | | | | | | | | | | |
End of period | | | | | | $ | 6,149,668,166 | | | | | | | $ | 6,622,533,336 | | | | | | | $ | 6,684,774,229 | |
| | | | | | | | | | | | | | | | | | | | | | | | |
Undistributed (accumulated) net investment income (loss) | | | | | | $ | (43,811,416 | ) | | | | | | $ | (8,524,625 | ) | | | | | | $ | 25,585,977 | |
| | | | | | | | | | | | | | | | | | | | | | | | |
| 1. | For the seven months ended April 30, 2014. The Fund changed its fiscal year end from September 30 to April 30, effective April 30, 2014. |
| 2. | For the period from November 30, 2012 (commencement of class operations) to September 30, 2013 |
The accompanying notes are an integral part of these financial statements.
| | | | |
| 12 | | Wells Fargo Advantage Asset Allocation Fund | | Financial highlights |
(For a share outstanding throughout each period)
| | | | | | | | | | | | | | | | | | | | | | | | | | | | |
| | | Six months ended
October 31, 2014 (unaudited) | | | Year ended April 30, 20141 | | | Year ended September 30 | | | Year ended December 31, 20092 | |
| CLASS A | | | | 2013 | | | 2012 | | | 2011 | | | 20102,3 | | |
Net asset value, beginning of period | | $ | 14.43 | | | $ | 13.73 | | | $ | 12.91 | | | $ | 11.70 | | | $ | 11.76 | | | $ | 11.37 | | | | $9.38 | |
Net investment loss | | | (0.06 | )4 | | | (0.07 | ) | | | (0.11 | ) | | | (0.12 | ) | | | (0.09 | ) | | | (0.08 | ) | | | (0.08 | ) |
Net realized and unrealized gains (losses) on investments | | | (0.12 | ) | | | 1.01 | | | | 1.26 | | | | 1.56 | | | | 0.20 | | | | 0.47 | | | | 2.34 | |
| | | | | | | | | | | | | | | | | | | | | | | | | | | | |
Total from investment operations | | | (0.18 | ) | | | 0.94 | | | | 1.15 | | | | 1.44 | | | | 0.11 | | | | 0.39 | | | | 2.26 | |
Distributions to shareholders from | | | | | | | | | | | | | | | | | | | | | | | | | | | | |
Net investment income | | | 0.00 | | | | (0.24 | ) | | | (0.33 | ) | | | (0.23 | ) | | | (0.14 | ) | | | (0.00 | )5 | | | (0.27 | ) |
Tax basis return of capital | | | 0.00 | | | | 0.00 | | | | 0.00 | | | | 0.00 | | | | (0.03 | ) | | | 0.00 | | | | 0.00 | |
| | | | | | | | | | | | | | | | | | | | | | | | | | | | |
Total distributions to shareholders | | | 0.00 | | | | (0.24 | ) | | | (0.33 | ) | | | (0.23 | ) | | | (0.17 | ) | | | (0.00 | )5 | | | (0.27 | ) |
Net asset value, end of period | | $ | 14.25 | | | $ | 14.43 | | | $ | 13.73 | | | $ | 12.91 | | | $ | 11.70 | | | $ | 11.76 | | | $ | 11.37 | |
Total return6 | | | (1.25 | )% | | | 6.92 | % | | | 9.12 | % | | | 12.48 | % | | | 0.94 | % | | | 3.45 | % | | | 24.10 | % |
Ratios to average net assets (annualized) | | | | | | | | | | | | | | | | | | | | | | | | | | | | |
Gross expenses7 | | | 0.84 | % | | | 0.85 | % | | | 0.84 | % | | | 0.84 | % | | | 0.85 | % | | | 0.85 | % | | | 0.87 | % |
Net expenses7 | | | 0.84 | % | | | 0.85 | % | | | 0.84 | % | | | 0.84 | % | | | 0.84 | % | | | 0.85 | % | | | 0.87 | % |
Net investment loss | | | (0.84 | )% | | | (0.85 | )% | | | (0.84 | )% | | | (0.84 | )% | | | (0.84 | )% | | | (0.85 | )% | | | (0.87 | )% |
Supplemental data | | | | | | | | | | | | | | | | | | | | | | | | | | | | |
Portfolio turnover rate | | | 0 | % | | | 1 | % | | | 0 | % | | | 1 | % | | | 1 | % | | | 1 | % | | | 2 | % |
Net assets, end of period (000s omitted) | | | $2,123,904 | | | | $2,398,503 | | | | $2,332,077 | | | | $2,307,609 | | | | $2,336,095 | | | | $2,957,689 | | | | $3,077,187 | |
| 1. | For the seven months ended April 30, 2014. The Fund changed its fiscal year end from September 30 to April 30, effective April 30, 2014. |
| 2. | After the close of business on July 16, 2010, the Fund acquired the net assets of Evergreen Asset Allocation Fund which became the accounting and performance survivor in the transaction. The information for the periods prior to July 19, 2010 is that of Class A of Evergreen Asset Allocation Fund. |
| 3. | For the nine months ended September 30, 2010. The Fund changed its fiscal year end from December 31 to September 30, effective September 30, 2010. |
| 4. | Calculated based upon average shares outstanding |
| 5. | Amount is less than $0.005. |
| 6. | Total return calculations do not include any sales charges. Returns for periods of less than one year are not annualized. |
| 7. | Ratios do not include any expenses from Asset Allocation Trust. Asset Allocation Trust does not have any net expenses. |
The accompanying notes are an integral part of these financial statements.
| | | | | | |
| Financial highlights | | Wells Fargo Advantage Asset Allocation Fund | | | 13 | |
(For a share outstanding throughout each period)
| | | | | | | | | | | | | | | | | | | | | | | | | | | | |
| | | Six months ended
October 31, 2014 (unaudited) | | | Year ended April 30, 20141 | | | Year ended September 30 | | | Year ended December 31, 20092 | |
| CLASS B | | | | 2013 | | | 2012 | | | 2011 | | | 20102,3 | | |
Net asset value, beginning of period | | $ | 14.28 | | | $ | 13.51 | | | $ | 12.66 | | | $ | 11.54 | | | $ | 11.60 | | | $ | 11.27 | | | | $9.30 | |
Net investment loss | | | (0.12 | )4 | | | (0.13 | )4 | | | (0.21 | )4 | | | (0.19 | )4 | | | (0.19 | )4 | | | (0.14 | ) | | | (0.17 | ) |
Net realized and unrealized gains (losses) on investments | | | (0.11 | ) | | | 0.99 | | | | 1.26 | | | | 1.51 | | | | 0.21 | | | | 0.47 | | | | 2.32 | |
| | | | | | | | | | | | | | | | | | | | | | | | | | | | |
Total from investment operations | | | (0.23 | ) | | | 0.86 | | | | 1.05 | | | | 1.32 | | | | 0.02 | | | | 0.33 | | | | 2.15 | |
Distributions to shareholders from | | | | | | | | | | | | | | | | | | | | | | | | | | | | |
Net investment income | | | 0.00 | | | | (0.09 | ) | | | (0.20 | ) | | | (0.20 | ) | | | (0.07 | ) | | | (0.00 | )5 | | | (0.18 | ) |
Tax basis return of capital | | | 0.00 | | | | 0.00 | | | | 0.00 | | | | 0.00 | | | | (0.01 | ) | | | 0.00 | | | | 0.00 | |
| | | | | | | | | | | | | | | | | | | | | | | | | | | | |
Total distributions to shareholders | | | 0.00 | | | | (0.09 | ) | | | (0.20 | ) | | | (0.20 | ) | | | (0.08 | ) | | | (0.00 | )5 | | | (0.18 | ) |
Net asset value, end of period | | $ | 14.05 | | | $ | 14.28 | | | $ | 13.51 | | | $ | 12.66 | | | $ | 11.54 | | | $ | 11.60 | | | $ | 11.27 | |
Total return6 | | | (1.61 | )% | | | 6.40 | % | | | 8.40 | % | | | 11.61 | % | | | 0.17 | % | | | 2.95 | % | | | 23.14 | % |
Ratios to average net assets (annualized) | | | | | | | | | | | | | | | | | | | | | | | | | | | | |
Gross expenses7 | | | 1.59 | % | | | 1.60 | % | | | 1.59 | % | | | 1.59 | % | | | 1.60 | % | | | 1.60 | % | | | 1.62 | % |
Net expenses7 | | | 1.59 | % | | | 1.60 | % | | | 1.59 | % | | | 1.59 | % | | | 1.59 | % | | | 1.59 | % | | | 1.62 | % |
Net investment loss | | | (1.59 | )% | | | (1.60 | )% | | | (1.59 | )% | | | (1.59 | )% | | | (1.59 | )% | | | (1.59 | )% | | | (1.62 | )% |
Supplemental data | | | | | | | | | | | | | | | | | | | | | | | | | | | | |
Portfolio turnover rate | | | 0 | % | | | 1 | % | | | 0 | % | | | 1 | % | | | 1 | % | | | 1 | % | | | 2 | % |
Net assets, end of period (000s omitted) | | | $235,303 | | | | $319,225 | | | | $430,116 | | | | $659,186 | | | | $917,860 | | | | $1,253,485 | | | | $1,415,023 | |
| 1. | For the seven months ended April 30, 2014. The Fund changed its fiscal year end from September 30 to April 30, effective April 30, 2014. |
| 2. | After the close of business on July 16, 2010, the Fund acquired the net assets of Evergreen Asset Allocation Fund which became the accounting and performance survivor in the transaction. The information for the periods prior to July 19, 2010 is that of Class B of Evergreen Asset Allocation Fund. |
| 3. | For the nine months ended September 30, 2010. The Fund changed its fiscal year end from December 31 to September 30, effective September 30, 2010. |
| 4. | Calculated based upon average shares outstanding |
| 5. | Amount is less than $0.005. |
| 6. | Total return calculations do not include any sales charges. Returns for periods of less than one year are not annualized. |
| 7. | Ratios do not include any expenses from Asset Allocation Trust. Asset Allocation Trust does not have any net expenses. |
The accompanying notes are an integral part of these financial statements.
| | | | |
| 14 | | Wells Fargo Advantage Asset Allocation Fund | | Financial highlights |
(For a share outstanding throughout each period)
| | | | | | | | | | | | | | | | | | | | | | | | | | | | |
| | | Six months ended
October 31, 2014 (unaudited) | | | Year ended April 30, 20141 | | | Year ended September 30 | | | Year ended December 31, 20092 | |
| CLASS C | | | | 2013 | | | 2012 | | | 2011 | | | 20102,3 | | |
Net asset value, beginning of period | | $ | 13.92 | | | $ | 13.20 | | | $ | 12.40 | | | $ | 11.30 | | | $ | 11.36 | | | $ | 11.04 | | | | $9.12 | |
Net investment loss | | | (0.12 | ) | | | (0.14 | ) | | | (0.20 | )4 | | | (0.19 | )4 | | | (0.19 | )4 | | | (0.14 | ) | | | (0.16 | ) |
Net realized and unrealized gains (losses) on investments | | | (0.11 | ) | | | 0.99 | | | | 1.22 | | | | 1.49 | | | | 0.21 | | | | 0.46 | | | | 2.27 | |
| | | | | | | | | | | | | | | | | | | | | | | | | | | | |
Total from investment operations | | | (0.23 | ) | | | 0.85 | | | | 1.02 | | | | 1.30 | | | | 0.02 | | | | 0.32 | | | | 2.11 | |
Distributions to shareholders from | | | | | | | | | | | | | | | | | | | | | | | | | | | | |
Net investment income | | | 0.00 | | | | (0.13 | ) | | | (0.22 | ) | | | (0.20 | ) | | | (0.07 | ) | | | (0.00 | )5 | | | (0.19 | ) |
Tax basis return of capital | | | 0.00 | | | | 0.00 | | | | 0.00 | | | | 0.00 | | | | (0.01 | ) | | | 0.00 | | | | 0.00 | |
| | | | | | | | | | | | | | | | | | | | | | | | | | | | |
Total distributions to shareholders | | | 0.00 | | | | (0.13 | ) | | | (0.22 | ) | | | (0.20 | ) | | | (0.08 | ) | | | (0.00 | )5 | | | (0.19 | ) |
Net asset value, end of period | | $ | 13.69 | | | $ | 13.92 | | | $ | 13.20 | | | $ | 12.40 | | | $ | 11.30 | | | $ | 11.36 | | | $ | 11.04 | |
Total return6 | | | (1.65 | )% | | | 6.44 | % | | | 8.32 | % | | | 11.64 | % | | | 0.18 | % | | | 2.92 | % | | | 23.08 | % |
Ratios to average net assets (annualized) | | | | | | | | | | | | | | | | | | | | | | | | | | | | |
Gross expenses7 | | | 1.59 | % | | | 1.60 | % | | | 1.59 | % | | | 1.59 | % | | | 1.60 | % | | | 1.60 | % | | | 1.62 | % |
Net expenses7 | | | 1.59 | % | | | 1.60 | % | | | 1.59 | % | | | 1.59 | % | | | 1.59 | % | | | 1.60 | % | | | 1.62 | % |
Net investment loss | | | (1.59 | )% | | | (1.60 | )% | | | (1.59 | )% | | | (1.59 | )% | | | (1.59 | )% | | | (1.60 | )% | | | (1.62 | )% |
Supplemental data | | | | | | | | | | | | | | | | | | | | | | | | | | | | |
Portfolio turnover rate | | | 0 | % | | | 1 | % | | | 0 | % | | | 1 | % | | | 1 | % | | | 1 | % | | | 2 | % |
Net assets, end of period (000s omitted) | | | $2,211,010 | | | | $2,377,997 | | | | $2,399,839 | | | | $2,604,438 | | | | $2,736,064 | | | | $3,290,791 | | | | $3,490,657 | |
| 1. | For the seven months ended April 30, 2014. The Fund changed its fiscal year end from September 30 to April 30, effective April 30, 2014. |
| 2. | After the close of business on July 16, 2010, the Fund acquired the net assets of Evergreen Asset Allocation Fund which became the accounting and performance survivor in the transaction. The information for the periods prior to July 19, 2010 is that of Class C of Evergreen Asset Allocation Fund. |
| 3. | For the nine months ended September 30, 2010. The Fund changed its fiscal year end from December 31 to September 30, effective September 30, 2010. |
| 4. | Calculated based upon average shares outstanding |
| 5. | Amount is less than $0.005. |
| 6. | Total return calculations do not include any sales charges. Returns for periods of less than one year are not annualized. |
| 7. | Ratios do not include any expenses from Asset Allocation Trust. Asset Allocation Trust does not have any net expenses. |
The accompanying notes are an integral part of these financial statements.
| | | | | | |
| Financial highlights | | Wells Fargo Advantage Asset Allocation Fund | | | 15 | |
(For a share outstanding throughout each period)
| | | | | | | | | | | | | | | | | | | | | | | | | | | | |
| | | Six months ended
October 31, 2014 (unaudited) | | | Year ended April 30, 20141 | | | Year ended | | | Year ended December 31, 20092 | |
| CLASS R | | | | 2013 | | | 2012 | | | 2011 | | | 20102,3 | | |
Net asset value, beginning of period | | $ | 14.28 | | | $ | 13.58 | | | $ | 12.76 | | | $ | 11.59 | | | $ | 11.66 | | | $ | 11.29 | | | | $9.32 | |
Net investment loss | | | (0.08 | ) | | | (0.10 | ) | | | (0.14 | )4 | | | (0.13 | )4 | | | (0.10 | ) | | | (0.06 | ) | | | (0.11 | )4 |
Net realized and unrealized gains (losses) on investments | | | (0.12 | ) | | | 1.01 | | | | 1.26 | | | | 1.52 | | | | 0.19 | | | | 0.43 | | | | 2.33 | |
| | | | | | | | | | | | | | | | | | | | | | | | | | | | |
Total from investment operations | | | (0.20 | ) | | | 0.91 | | | | 1.12 | | | | 1.39 | | | | 0.09 | | | | 0.37 | | | | 2.22 | |
Distributions to shareholders from | | | | | | | | | | | | | | | | | | | | | | | | | | | | |
Net investment income | | | 0.00 | | | | (0.21 | ) | | | (0.30 | ) | | | (0.22 | ) | | | (0.13 | ) | | | (0.00 | )5 | | | (0.25 | ) |
Tax basis return of capital | | | 0.00 | | | | 0.00 | | | | 0.00 | | | | 0.00 | | | | (0.03 | ) | | | 0.00 | | | | 0.00 | |
| | | | | | | | | | | | | | | | | | | | | | | | | | | | |
Total distributions to shareholders | | | 0.00 | | | | (0.21 | ) | | | (0.30 | ) | | | (0.22 | ) | | | (0.16 | ) | | | (0.00 | )5 | | | (0.25 | ) |
Net asset value, end of period | | $ | 14.08 | | | $ | 14.28 | | | $ | 13.58 | | | $ | 12.76 | | | $ | 11.59 | | | $ | 11.66 | | | $ | 11.29 | |
Total return6 | | | (1.40 | )% | | | 6.74 | % | | | 8.92 | % | | | 12.16 | % | | | 0.71 | % | | | 3.30 | % | | | 23.77 | % |
Ratios to average net assets (annualized) | | | | | | | | | | | | | | | | | | | | | | | | | | | | |
Gross expenses7 | | | 1.09 | % | | | 1.10 | % | | | 1.09 | % | | | 1.09 | % | | | 1.09 | % | | | 1.10 | % | | | 1.12 | % |
Net expenses7 | | | 1.09 | % | | | 1.10 | % | | | 1.09 | % | | | 1.09 | % | | | 1.09 | % | | | 1.09 | % | | | 1.12 | % |
Net investment loss | | | (1.09 | )% | | | (1.10 | )% | | | (1.09 | )% | | | (1.09 | )% | | | (1.09 | )% | | | (1.09 | )% | | | (1.12 | )% |
Supplemental data | | | | | | | | | | | | | | | | | | | | | | | | | | | | |
Portfolio turnover rate | | | 0 | % | | | 1 | % | | | 0 | % | | | 1 | % | | | 1 | % | | | 1 | % | | | 2 | % |
Net assets, end of period (000s omitted) | | | $32,519 | | | | $33,984 | | | | $33,934 | | | | $29,899 | | | | $23,580 | | | | $20,893 | | | | $16,279 | |
| 1. | For the seven months ended April 30, 2014. The Fund changed its fiscal year end from September 30 to April 30, effective April 30, 2014. |
| 2. | After the close of business on July 16, 2010, the Fund acquired the net assets of Evergreen Asset Allocation Fund which became the accounting and performance survivor in the transaction. The information for the periods prior to July 19, 2010 is that of Class R of Evergreen Asset Allocation Fund. |
| 3. | For the nine months ended September 30, 2010. The Fund changed its fiscal year end from December 31 to September 30, effective September 30, 2010. |
| 4. | Calculated based upon average shares outstanding |
| 5. | Amount is less than $0.005. |
| 6. | Returns for periods of less than one year are not annualized. |
| 7. | Ratios do not include any expenses from Asset Allocation Trust. Asset Allocation Trust does not have any net expenses. |
The accompanying notes are an integral part of these financial statements.
| | | | |
| 16 | | Wells Fargo Advantage Asset Allocation Fund | | Financial highlights |
(For a share outstanding throughout each period)
| | | | | | | | | | | | | | | | | | | | | | | | | | | | |
| | | Six months ended
October 31, 2014 (unaudited) | | | Year ended April 30, 20141 | | | Year ended September 30 | | | Year ended December 31, 20092 | |
| ADMINISTRATOR CLASS | | | | 2013 | | | 2012 | | | 2011 | | | 20102,3 | | |
Net asset value, beginning of period | | $ | 14.54 | | | $ | 13.84 | | | $ | 13.01 | | | $ | 11.77 | | | $ | 11.84 | | | $ | 11.42 | | | | $9.42 | |
Net investment loss | | | (0.05 | )4 | | | (0.05 | )4 | | | (0.08 | )4 | | | (0.09 | ) | | | (0.08 | )4 | | | (0.01 | ) | | | (0.06 | )4 |
Net realized and unrealized gains (losses) on investments | | | (0.12 | ) | | | 1.01 | | | | 1.27 | | | | 1.57 | | | | 0.22 | | | | 0.43 | | | | 2.36 | |
| | | | | | | | | | | | | | | | | | | | | | | | | | | | |
Total from investment operations | | | (0.17 | ) | | | 0.96 | | | | 1.19 | | | | 1.48 | | | | 0.14 | | | | 0.42 | | | | 2.30 | |
Distributions to shareholders from | | | | | | | | | | | | | | | | | | | | | | | | | | | | |
Net investment income | | | 0.00 | | | | (0.26 | ) | | | (0.36 | ) | | | (0.24 | ) | | | (0.17 | ) | | | (0.00 | )5 | | | (0.30 | ) |
Tax basis return of capital | | | 0.00 | | | | 0.00 | | | | 0.00 | | | | 0.00 | | | | (0.04 | ) | | | 0.00 | | | | 0.00 | |
| | | | | | | | | | | | | | | | | | | | | | | | | | | | |
Total distributions to shareholders | | | 0.00 | | | | (0.26 | ) | | | (0.36 | ) | | | (0.24 | ) | | | (0.21 | ) | | | (0.00 | )5 | | | (0.30 | ) |
Net asset value, end of period | | $ | 14.37 | | | $ | 14.54 | | | $ | 13.84 | | | $ | 13.01 | | | $ | 11.77 | | | $ | 11.84 | | | $ | 11.42 | |
Total return6 | | | (1.17 | )% | | | 7.01 | % | | | 9.39 | % | | | 12.74 | % | | | 1.12 | % | | | 3.70 | % | | | 24.40 | % |
Ratios to average net assets (annualized) | | | | | | | | | | | | | | | | | | | | | | | | | | | | |
Gross expenses7 | | | 0.68 | % | | | 0.69 | % | | | 0.67 | % | | | 0.64 | % | | | 0.65 | % | | | 0.63 | % | | | 0.62 | % |
Net expenses7 | | | 0.64 | % | | | 0.64 | % | | | 0.64 | % | | | 0.62 | % | | | 0.63 | % | | | 0.60 | % | | | 0.62 | % |
Net investment loss | | | (0.64 | )% | | | (0.64 | )% | | | (0.64 | )% | | | (0.62 | )% | | | (0.63 | )% | | | (0.60 | )% | | | (0.62 | )% |
Supplemental data | | | | | | | | | | | | | | | | | | | | | | | | | | | | |
Portfolio turnover rate | | | 0 | % | | | 1 | % | | | 0 | % | | | 1 | % | | | 1 | % | | | 1 | % | | | 2 | % |
Net assets, end of period (000s omitted) | | | $673,789 | | | | $776,035 | | | | $809,554 | | | | $1,562,582 | | | | $1,423,427 | | | | $810,355 | | | | $639,903 | |
| 1. | For the seven months ended April 30, 2014. The Fund changed its fiscal year end from September 30 to April 30, effective April 30, 2014. |
| 2. | After the close of business on July 16, 2010, the Fund acquired the net assets of Evergreen Asset Allocation Fund which became the accounting and performance survivor in the transaction. The information for the periods prior to July 19, 2010 is that of Class I of Evergreen Asset Allocation Fund. |
| 3. | For the nine months ended September 30, 2010. The Fund changed its fiscal year end from December 31 to September 30, effective September 30, 2010. |
| 4. | Calculated based upon average shares outstanding |
| 5. | Amount is less than $0.005. |
| 6. | Returns for periods of less than one year are not annualized. |
| 7. | Ratios do not include any expenses from Asset Allocation Trust. Asset Allocation Trust does not have any net expenses. |
The accompanying notes are an integral part of these financial statements.
| | | | | | |
| Financial highlights | | Wells Fargo Advantage Asset Allocation Fund | | | 17 | |
(For a share outstanding throughout each period)
| | | | | | | | | | | | |
| | | Six months ended
October 31, 2014 (unaudited) | | | Year ended April 30, 20141 | | | Year ended September 30, 20132 | |
| INSTITUTIONAL CLASS | | | |
Net asset value, beginning of period | | $ | 14.49 | | | $ | 13.82 | | | $ | 13.01 | |
Net investment loss | | | (0.03 | )3 | | | (0.03 | ) | | | (0.05 | )3 |
Net realized and unrealized gains (losses) on investments | | | (0.12 | ) | | | 1.01 | | | | 1.26 | |
| | | | | | | | | | | | |
Total from investment operations | | | (0.15 | ) | | | 0.98 | | | | 1.21 | |
Distributions to shareholders from | | | | | | | | | | | | |
Net investment income | | | 0.00 | | | | (0.31 | ) | | | (0.40 | ) |
Net asset value, end of period | | $ | 14.34 | | | $ | 14.49 | | | $ | 13.82 | |
Total return4 | | | (1.04 | )% | | | 7.15 | % | | | 9.58 | % |
Ratios to average net assets (annualized) | | | | | | | | | | | | |
Gross expenses5 | | | 0.41 | % | | | 0.42 | % | | | 0.42 | % |
Net expenses5 | | | 0.41 | % | | | 0.42 | % | | | 0.42 | % |
Net investment loss | | | (0.41 | )% | | | (0.42 | )% | | | (0.42 | )% |
Supplemental data | | | | | | | | | | | | |
Portfolio turnover rate | | | 0 | % | | | 1 | % | | | 0 | % |
Net assets, end of period (000s omitted) | | | $873,144 | | | | $716,789 | | | | $679,254 | |
| 1. | For the seven months ended April 30, 2014. The Fund changed its fiscal year end from September 30 to April 30, effective April 30, 2014. |
| 2. | For the period from November 30, 2012 (commencement of class operations) to September 30, 2013 |
| 3. | Calculated based upon average shares outstanding |
| 4. | Returns for periods of less than one year are not annualized. |
| 5. | Ratios do not include any expenses from Asset Allocation Trust. Asset Allocation Trust does not have any net expenses. |
The accompanying notes are an integral part of these financial statements.
| | | | |
| 18 | | Wells Fargo Advantage Asset Allocation Fund | | Notes to financial statements (unaudited) |
1. ORGANIZATION
Wells Fargo Funds Trust (the “Trust”), a Delaware statutory trust organized on March 10, 1999, is an open-end management investment company registered under the Investment Company Act of 1940, as amended (the “1940 Act”). These financial statements report on the Wells Fargo Advantage Asset Allocation Fund (the “Fund”) which is a diversified series of the Trust.
The Fund invests all of its investable assets in Asset Allocation Trust, an investment company managed by Grantham, Mayo, Van Otterloo & Co. LLC (“GMO”). Asset Allocation Trust in turn invests its assets in GMO-managed mutual funds (“underlying funds”) and may be exposed to foreign and U.S. equity investments, U.S. and foreign fixed income securities, and from time to time, other alternative asset classes. At October 31, 2014, the Fund owned 100% of Asset Allocation Trust. Because the Fund invests all of its assets in Asset Allocation Trust, the shareholders of the Fund bear the fees and expenses of Asset Allocation Trust which are not included in the Statement of Operations but are incurred indirectly because they are considered in the calculation of the net asset value of Asset Allocation Trust. As a result, the Fund’s actual expenses may be higher than those of other mutual funds that invest directly in securities. The financial statements of Asset Allocation Trust, including the Portfolio of Investments, are included elsewhere in this report and should be read in conjunction with the Fund’s financial statements.
2. SIGNIFICANT ACCOUNTING POLICIES
The following significant accounting policies, which are consistently followed in the preparation of the financial statements of the Fund, are in conformity with U.S. generally accepted accounting principles which require management to make estimates and assumptions that affect the reported amounts of assets and liabilities, disclosure of contingent assets and liabilities at the date of the financial statements, and the reported amounts of revenues and expenses during the reporting period. Actual results could differ from those estimates.
Valuation
All investments are valued each business day as of the close of regular trading on the New York Stock Exchange (generally 4 p.m. Eastern Time).
The Fund values its investment in Asset Allocation Trust at net asset value. The valuation of investments in securities and the underlying funds held by Asset Allocation Trust is discussed in its Notes to Financial Statements, which is included elsewhere in this report.
Investment transactions and income recognition
Investment transactions are recorded on a trade date basis. Realized gains or losses resulting from investment transactions are determined on the identified cost basis. Income dividends and capital gain distributions from Asset Allocation Trust are recorded on the ex-dividend date. Capital gain distributions from Asset Allocation Trust are treated as realized gains.
Distributions to shareholders
Distributions to shareholders from net investment income and net realized gains, if any, are recorded on the ex-dividend date. Net investment income is primarily derived from redemptions in Asset Allocation Trust which are deemed dividends to the Fund. Such distributions are determined in conformity with federal income tax regulations, which may differ in amount or character from net investment income and realized gains recognized for purposes of U.S. generally accepted accounting principles.
Federal and other taxes
The Fund intends to continue to qualify as a regulated investment company by distributing substantially all of its investment company taxable income and any net realized capital gains (after reduction for capital loss carryforwards) sufficient to relieve it from all, or substantially all, federal income taxes. Accordingly, no provision for federal income taxes was required.
The Fund’s income and federal excise tax returns and all financial records supporting those returns for the prior three fiscal years are subject to examination by the federal and Delaware revenue authorities. Management has analyzed the Fund’s tax positions taken on federal, state, and foreign tax returns for all open tax years and does not believe that there are any uncertain tax positions that require recognition of a tax liability.
As of April 30, 2014, the Fund had a qualified late-year ordinary loss of $8,388,141 which was recognized on the first day of the current fiscal year.
| | | | | | |
| Notes to financial statements (unaudited) | | Wells Fargo Advantage Asset Allocation Fund | | | 19 | |
Class allocations
The separate classes of shares offered by the Fund differ principally in applicable sales charges, distribution, shareholder servicing, and administration fees. Class specific expenses are charged directly to that share class. Investment income, common expenses, and realized and unrealized gains (losses) on investments are allocated daily to each class of shares based on the relative proportion of net assets of each class.
3. FAIR VALUATION MEASUREMENTS
Fair value measurements of investments are determined within a framework that has established a fair value hierarchy based upon the various data inputs utilized in determining the value of the Fund’s investments. The three-level hierarchy gives the highest priority to unadjusted quoted prices in active markets for identical assets or liabilities (Level 1) and the lowest priority to significant unobservable inputs (Level 3). The Fund’s investments are classified within the fair value hierarchy based on the lowest level of input that is significant to the fair value measurement. The inputs are summarized into three broad levels as follows:
| n | | Level 1 – quoted prices in active markets for identical securities |
| n | | Level 2 – other significant observable inputs (including quoted prices for similar securities, interest rates, prepayment speeds, credit risk, use of amortized cost, etc.) |
| n | | Level 3 – significant unobservable inputs (including the Fund’s own assumptions in determining the fair value of investments) |
The inputs or methodologies used for valuing investments in securities are not necessarily an indication of the risk associated with investing in those securities.
At October 31, 2014, Level 2 inputs were used in valuing the Fund’s investment in Asset Allocation Trust.
Transfers in and transfers out are recognized at the end of the reporting period. At October 31, 2014, the Fund did not have any transfers into/out of Level 1, Level 2, or Level 3.
4. TRANSACTIONS WITH AFFILIATES
Advisory fee
The Trust has entered into an advisory contract with Wells Fargo Funds Management, LLC (“Funds Management”), an indirect wholly owned subsidiary of Wells Fargo & Company (“Wells Fargo”). The adviser is responsible for implementing investment policies and guidelines of the Fund.
Pursuant to the contract, Funds Management is entitled to receive an annual advisory fee starting at 0.25% and declining to 0.175% as the average daily net assets of the Fund increase. For the six months ended October 31, 2014, the advisory fee was equivalent to an annual rate of 0.22% of the Fund’s average daily net assets.
Administration fees
The Trust has entered into an administration agreement with Funds Management. Under this agreement, for providing administrative services, which includes paying fees and expenses for services provided by the transfer agent, sub-transfer agents, omnibus account servicers and record-keepers, Funds Management is entitled to receive from the Fund an annual fund level administration fee starting at 0.10% and declining to 0.06% as the average daily net assets of the Fund increase and a class level administration fee which is calculated based on the average daily net assets of each class as follows:
| | | | |
| | | Class level administration fee | |
Class A, Class B, Class C, Class R | | | 0.26 | % |
Administrator Class | | | 0.10 | |
Institutional Class | | | 0.08 | |
Funds Management has contractually waived and/or reimbursed advisory and administration fees to the extent necessary to maintain certain net operating expense ratios for the Fund. Waiver of fees and/or reimbursement of expenses by Funds Management were made first from fund level expenses on a proportionate basis and then from class specific expenses. Funds Management has committed through August 31, 2015 to waive fees and/or reimburse expenses
| | | | |
| 20 | | Wells Fargo Advantage Asset Allocation Fund | | Notes to financial statements (unaudited) |
to the extent necessary to cap the Fund’s expenses at 0.87% for Class A shares, 1.62% for Class B shares, 1.62% for Class C shares, 1.12% for Class R shares, 0.64% for Administrator Class shares, and 0.44% for Institutional Class shares. After this time, the cap may be increased or the commitment to maintain the cap may be terminated only with the approval of the Board of Trustees.
Distribution fees
The Trust has adopted a Distribution Plan for Class B, Class C, and Class R shares of the Fund pursuant to Rule 12b-1 under the 1940 Act. Distribution fees are charged to Class B, Class C, and Class R shares and paid to Wells Fargo Funds Distributor, LLC (“Funds Distributor”), the principal underwriter, at an annual rate of 0.75% of the average daily net assets of Class B and Class C shares and 0.25% of the average daily net assets of Class R shares.
In addition, Funds Distributor is entitled to receive the front-end sales charge from the purchase of Class A shares and a contingent deferred sales charge on the redemption of certain shares. Funds Distributor is also entitled to receive the contingent deferred sales charges from redemptions of Class B and Class C shares. For the six months ended October 31, 2014, Funds Distributor received $127,845 from the sale of Class A shares and $11,629 and $9,592 in contingent deferred sales charges from redemptions of Class B and Class C shares, respectively.
Shareholder servicing fees
The Trust has entered into contracts with one or more shareholder servicing agents, whereby Class A, Class B, Class C, Class R, and Administrator Class of the Fund is charged a fee at an annual rate of 0.25% of the average daily net assets of each respective class.
A portion of these total shareholder servicing fees were paid to affiliates of Wells Fargo.
5. INVESTMENT PORTFOLIO TRANSACTIONS
For the six months ended October 31, 2014, the Fund made aggregate purchases and sales of $15,131,333 and $439,014,137, respectively, in its investment into Asset Allocation Trust.
6. BANK BORROWINGS
The Trust (excluding the money market funds and certain other funds in the Trust) and Wells Fargo Variable Trust are parties to a $150,000,000 revolving credit agreement whereby the Fund is permitted to use bank borrowings for temporary or emergency purposes, such as to fund shareholder redemption requests. Interest under the credit agreement is charged to the Fund based on a borrowing rate equal to the higher of the Federal Funds rate in effect on that day plus 1.25% or the overnight LIBOR rate in effect on that day plus 1.25%. In addition, an annual commitment fee equal to 0.10% of the unused balance is allocated to each participating fund. For the six months ended October 31, 2014, the Fund paid $11,325 in commitment fees.
During the six months ended October 31, 2014, the Fund had average borrowings outstanding of $94,526 (on an annualized basis) at an average rate of 1.37% and paid interest in the amount of $1,295.
7. INDEMNIFICATION
Under the Trust’s organizational documents, the officers and directors are indemnified against certain liabilities that may arise out of performance of their duties to the Trust. Additionally, in the normal course of business, the Trust may enter into contracts with service providers that contain a variety of indemnification clauses. The Trust’s maximum exposure under these arrangements is dependent on future claims that may be made against the Fund and, therefore, cannot be estimated.
| | | | | | |
| Other information (unaudited) | | Wells Fargo Advantage Asset Allocation Fund | | | 21 | |
PROXY VOTING INFORMATION
A description of the policies and procedures that the Fund uses to determine how to vote proxies relating to portfolio securities is available without charge, upon request, by calling 1-800-222-8222, visiting our website at wellsfargoadvantagefunds.com, or visiting the SEC website at sec.gov. Information regarding how the Fund voted proxies relating to portfolio securities during the most recent 12-month period ended June 30 is available without charge on the Fund’s website at wellsfargoadvantagefunds.com or by visiting the SEC website at sec.gov.
PORTFOLIO HOLDINGS INFORMATION
The complete portfolio holdings for the Fund are publicly available monthly on the Fund’s website (wellsfargoadvantagefunds.com), on a one-month delayed basis. In addition, top ten holdings information (excluding derivative positions) for the Fund is publicly available on the Fund’s website on a monthly, seven-day or more delayed basis. The Fund files its complete schedule of portfolio holdings with the SEC for the first and third quarters of each fiscal year on Form N-Q, which is available without charge by visiting the SEC website at sec.gov. In addition, the Fund’s Form N-Q may be reviewed and copied at the SEC’s Public Reference Room in Washington, DC, and at regional offices in New York City, at 233 Broadway, and in Chicago, at 175 West Jackson Boulevard, Suite 900. Information about the Public Reference Room may be obtained by calling 1-800-SEC-0330.
| | | | |
| 22 | | Wells Fargo Advantage Asset Allocation Fund | | Other information (unaudited) |
BOARD OF TRUSTEES AND OFFICERS
Each of the Trustees and Officers1 listed in the table below acts in identical capacities for each fund in the Wells Fargo Advantage family of funds, which consists of 133 mutual funds comprising the Wells Fargo Funds Trust, Wells Fargo Variable Trust, Wells Fargo Master Trust and four closed-end funds (collectively the “Fund Complex”). This table should be read in conjunction with the Prospectus and the Statement of Additional Information2. The mailing address of each Trustee and Officer is 525 Market Street, 12th Floor, San Francisco, CA 94105. Each Trustee and Officer serves an indefinite term, however, each Trustee serves such term until reaching the mandatory retirement age established by the Trustees.
Independent Trustees
| | | | | | |
Name and year of birth | | Position held and length of service* | | Principal occupations during past five years or longer | | Other directorships during
past five years |
| Peter G. Gordon (Born 1942) | | Trustee, since 1998; Chairman, since 2005 | | Co-Founder, Retired Chairman, President and CEO of Crystal Geyser Water Company. Trustee Emeritus, Colby College. | | Asset Allocation Trust |
| Isaiah Harris, Jr. (Born 1952) | | Trustee, since 2009 | | Retired. Prior thereto, President and CEO of BellSouth Advertising and Publishing Corp. from 2005 to 2007, President and CEO of BellSouth Enterprises from 2004 to 2005 and President of BellSouth Consumer Services from 2000 to 2003. Emeritus member of the Iowa State University Foundation Board of Governors. Emeritus Member of the Advisory Board of Iowa State University School of Business. Advisory Board Member, Palm Harbor Academy. Mr. Harris is a certified public accountant. | | CIGNA Corporation; Asset Allocation Trust |
| Judith M. Johnson (Born 1949) | | Trustee, since 2008;
Audit Committee Chairman, since 2008 | | Retired. Prior thereto, Chief Executive Officer and Chief Investment Officer of Minneapolis Employees Retirement Fund from 1996 to 2008. Ms. Johnson is an attorney, certified public accountant and a certified managerial accountant. | | Asset Allocation Trust |
| Leroy Keith, Jr. (Born 1939) | | Trustee, since 2010** | | Chairman, Bloc Global Services (development and construction). Trustee of the Evergreen Funds complex (and its predecessors) from 1983 to 2010. Former Managing Director, Almanac Capital Management (commodities firm), former Partner, Stonington Partners, Inc. (private equity fund), former Director, Obagi Medical Products Co. and former Director, Lincoln Educational Services. | | Trustee, Virtus Fund Complex (consisting of 50 portfolios as of 12/16/2013); Asset Allocation Trust |
| David F. Larcker (Born 1950) | | Trustee, since 2009 | | James Irvin Miller Professor of Accounting at the Graduate School of Business, Stanford University, Morgan Stanley Director of the Center for Leadership Development and Research and Senior Faculty of The Rock Center for Corporate Governance since 2006. From 2005 to 2008, Professor of Accounting at the Graduate School of Business, Stanford University. Prior thereto, Ernst & Young Professor of Accounting at The Wharton School, University of Pennsylvania from 1985 to 2005. | | Asset Allocation Trust |
| Olivia S. Mitchell (Born 1953) | | Trustee, since 2006 | | International Foundation of Employee Benefit Plans Professor, Wharton School of the University of Pennsylvania since 1993. Director of Wharton’s Pension Research Council and Boettner Center on Pensions & Retirement Research, and Research Associate at the National Bureau of Economic Research. Previously, Cornell University Professor from 1978 to 1993. | | Asset Allocation Trust |
| Timothy J. Penny (Born 1951) | | Trustee, since 1996 | | President and CEO of Southern Minnesota Initiative Foundation, a non-profit organization, since 2007 and Senior Fellow at the Humphrey Institute Policy Forum at the University of Minnesota since 1995. Member of the Board of Trustees of NorthStar Education Finance, Inc., a non-profit organization, since 2007. | | Asset Allocation Trust |
| | | | | | |
| Other information (unaudited) | | Wells Fargo Advantage Asset Allocation Fund | | | 23 | |
| | | | | | |
Name and year of birth | | Position held and length of service* | | Principal occupations during past five years or longer | | Other directorships during
past five years |
| Michael S. Scofield (Born 1943) | | Trustee, since 2010 | | Served on the Investment Company Institute’s Board of Governors and Executive Committee from 2008-2011 as well the Governing Council of the Independent Directors Council from 2006-2011 and the Independent Directors Council Executive Committee from 2008-2011. Chairman of the IDC from 2008-2010. Institutional Investor (Fund Directions) Trustee of Year in 2007. Trustee of the Evergreen Funds complex (and its predecessors) from 1984 to 2010. Chairman of the Evergreen Funds from 2000-2010. Former Trustee of the Mentor Funds. Retired Attorney, Law Offices of Michael S. Scofield. | | Asset Allocation Trust |
| Donald C. Willeke (Born 1940) | | Trustee, since 1996 | | Principal of the law firm of Willeke & Daniels. General Counsel of the Minneapolis Employees Retirement Fund from 1984 until its consolidation into the Minnesota Public Employees Retirement Association on June 30, 2010. Director and Vice Chair of The Tree Trust (non-profit corporation). Director of the American Chestnut Foundation (non-profit corporation). | | Asset Allocation Trust |
| * | Length of service dates reflect the Trustee’s commencement of service with the Trust’s predecessor entities, where applicable. |
| ** | Leroy Keith, Jr. will retire as a Trustee effective December 31, 2014. |
Officers
| | | | | | |
Name and year of birth | | Position held and
length of service | | Principal occupations during past five years or longer | | |
| Karla M. Rabusch (Born 1959) | | President, since 2003 | | Executive Vice President of Wells Fargo Bank, N.A. and President of Wells Fargo Funds Management, LLC since 2003. | | |
| Jeremy DePalma1 (Born 1974) | | Treasurer, since 2012 | | Senior Vice President of Wells Fargo Funds Management, LLC since 2009. Senior Vice President of Evergreen Investment Management Company, LLC from 2008 to 2010. Vice President, Evergreen Investment Services, Inc. from 2004 to 2007. Head of the Fund Reporting and Control Team within Fund Administration from 2005 to 2010. | | |
| C. David Messman (Born 1960) | | Secretary, since 2000; Chief Legal Officer, since 2003 | | Assistant General Counsel of Wells Fargo Bank, N.A. since 2013 and Vice President and Managing Counsel of Wells Fargo Bank N.A. from 1996 to 2013. Senior Vice President and Secretary of Wells Fargo Funds Management , LLC since 2001. | | |
Debra Ann Early (Born 1964) | | Chief Compliance Officer, since 2007 | | Senior Vice President and Chief Compliance Officer of Wells Fargo Funds Management, LLC since 2007. Chief Compliance Officer of Parnassus Investments from 2005 to 2007. Chief Financial Officer of Parnassus Investments from 2004 to 2007. | | |
David Berardi (Born 1975) | | Assistant Treasurer, since 2009 | | Vice President of Wells Fargo Funds Management, LLC since 2009. Vice President of Evergreen Investment Management Company, LLC from 2008 to 2010. Assistant Vice President of Evergreen Investment Services, Inc. from 2004 to 2008. Manager of Fund Reporting and Control for Evergreen Investment Management Company, LLC from 2004 to 2010. | | |
| 1. | Jeremy DePalma acts as Treasurer of 60 funds and Assistant Treasurer of 73 funds in the Fund Complex. |
| 2. | The Statement of Additional Information includes additional information about the Trustees and is available, without charge, upon request, by calling 1-800-222-8222 or by visiting the website at wellsfargoadvantagefunds.com. |
| | | | |
| 24 | | Asset Allocation Trust | | Portfolio of investments—October 31, 2014 (unaudited) |
| | | | | | | | | | | | | | | | |
| Security name | | | | | | | | Shares | | | Value | |
| | | | |
Investment Companies: 99.66% | | | | | | | | | | | | | | | | |
| | | | |
| Alternative & Other Funds: 9.64% | | | | | | | | | | | | | | | | |
GMO Alpha Only Fund Class IV †(l) | | | | | | | | | | | 25,338,382 | | | $ | 593,678,295 | |
| | | | | | | | | | | | | | | | |
| | | | |
| Emerging Equity Funds: 8.04% | | | | | | | | | | | | | | | | |
GMO Emerging Markets Fund Class VI (l) | | | | | | | | | | | 46,123,611 | | | | 494,906,349 | |
| | | | | | | | | | | | | | | | |
| | | | |
| Fixed Income Funds: 33.21% | | | | | | | | | | | | | | | | |
GMO Asset Allocation Bond Fund Class VI (l) | | | | | | | | | | | 52,061,169 | | | | 1,342,657,552 | |
GMO Debt Opportunities Fund Class VI (l) | | | | | | | | | | | 11,175,877 | | | | 279,061,653 | |
GMO Emerging Country Debt Fund Class IV (l) | | | | | | | | | | | 20,865,195 | | | | 214,911,505 | |
GMO U.S. Treasury Fund Class IV (l) | | | | | | | | | | | 8,353,837 | | | | 208,845,918 | |
| | | | |
| | | | | | | | | | | | | | | 2,045,476,628 | |
| | | | | | | | | | | | | | | | |
| | | | |
| International Developed Equity Funds: 31.88% | | | | | | | | | | | | | | | | |
GMO International Equity Fund Class IV (l) | | | | | | | | | | | 68,086,925 | | | | 1,660,640,102 | |
GMO Risk Premium Fund Class VI (l) | | | | | | | | | | | 29,865,710 | | | | 302,838,299 | |
| | | | |
| | | | | | | | | | | | | | | 1,963,478,401 | |
| | | | | | | | | | | | | | | | |
| | | | |
| U.S. Equity Fund: 16.89% | | | | | | | | | | | | | | | | |
GMO U.S. Core Equity Fund Class VI (l) | | | | | | | | | | | 57,708,726 | | | | 1,040,488,323 | |
| | | | | | | | | | | | | | | | |
| | | | |
Total Investment Companies (Cost $5,580,223,997) | | | | | | | | | | | | | | | 6,138,027,996 | |
| | | | | | | | | | | | | | | | |
| | | | |
| | | Interest rate | | | Maturity date | | | Principal | | | | |
| | | | |
Short-Term Investments: 0.34% | | | | | | | | | | | | | | | | |
| | | | |
| Time Deposit: 0.34% | | | | | | | | | | | | | | | | |
State Street Bank Euro Dollar | | | 0.01 | % | | | 11-3-2014 | | | $ | 21,149,814 | | | | 21,149,814 | |
| | | | | | | | | | | | | | | | |
| | | | |
Total Short-Term Investments (Cost $21,149,814) | | | | | | | | | | | | | | | 21,149,814 | |
| | | | | | | | | | | | | | | | |
| | | | | | | | |
| Total investments in securities (Cost $5,601,373,811)* | | | 100.00 | % | | | 6,159,177,810 | |
Other assets and liabilities, net | | | 0.00 | | | | (41,804 | ) |
| | | | | | | | |
| Total net assets | | | 100.00 | % | | $ | 6,159,136,006 | |
| | | | | | | | |
| † | Non-income-earning security |
| (l) | The security represents an affiliate of the Trust as defined in the Investment Company Act of 1940. |
| * | Cost for federal income tax purposes is $5,684,005,318 and unrealized gains (losses) consists of: |
| | | | |
Gross unrealized gains | | $ | 483,678,274 | |
Gross unrealized losses | | | (8,505,782 | ) |
| | | | |
Net unrealized gains | | $ | 475,172,492 | |
The accompanying notes are an integral part of these financial statements.
| | | | | | |
| Statement of assets and liabilities—October 31, 2014 (unaudited) | | Asset Allocation Trust | | | 25 | |
| | | | |
| | | | |
| |
Assets | | | | |
Investments | | | | |
In affiliated investment companies, at value (cost $5,580,223,997) | | $ | 6,138,027,996 | |
In unaffiliated securities, at value (cost $21,149,814) | | | 21,149,814 | |
| | | | |
Total investments, at value (cost $5,601,373,811) | | | 6,159,177,810 | |
Receivable for investments sold | | | 3,250,915 | |
Receivable for interest | | | 7,888 | |
Receivable from administrator | | | 7,644 | |
Prepaid expenses and other assets | | | 2,332 | |
| | | | |
Total assets | | | 6,162,446,589 | |
| | | | |
| |
Liabilities | | | | |
Payable for investments purchased | | | 7,869 | |
Payable for Trust shares redeemed | | | 3,294,425 | |
Accrued expenses and other liabilities | | | 8,289 | |
| | | | |
Total liabilities | | | 3,310,583 | |
| | | | |
Total net assets | | $ | 6,159,136,006 | |
| | | | |
| |
NET ASSETS CONSIST OF | | | | |
Paid-in capital | | $ | 5,725,639,704 | |
Undistributed net investment income | | | 42,386,139 | |
Accumulated net realized losses on investments | | | (166,693,836 | ) |
Net unrealized gains on investments | | | 557,803,999 | |
| | | | |
Total net assets | | $ | 6,159,136,006 | |
| | | | |
| |
COMPUTATION OF NET ASSET VALUE | | | | |
Net assets | | $ | 6,159,136,006 | |
Shares outstanding1 | | | 398,185,480 | |
Net asset value per share | | | $15.47 | |
| 1. | The Fund has an unlimited number of authorized shares. |
The accompanying notes are an integral part of these financial statements.
| | | | |
| 26 | | Asset Allocation Trust | | Statement of operations—six months ended October 31, 2014 (unaudited) |
| | | | |
| | | | |
| |
Investment income | | | | |
Dividends from affiliated investment companies | | $ | 42,384,963 | |
Interest | | | 1,176 | |
| | | | |
Total investment income | | | 42,386,139 | |
| | | | |
| |
Expenses | | | | |
Custody and accounting fees | | | 6,131 | |
Professional fees | | | 33,525 | |
Shareholder report expenses | | | 1,194 | |
Other fees and expenses | | | 2,235 | |
| | | | |
Total expenses | | | 43,085 | |
Less: Fee waivers and/or expense reimbursements | | | (43,085 | ) |
| | | | |
Net expenses | | | 0 | |
| | | | |
Net investment income | | | 42,386,139 | |
| | | | |
| |
REALIZED AND UNREALIZED GAINS (LOSSES) ON INVESTMENTS | | | | |
Net realized gains on: | | | | |
Sale of affiliated investment companies | | | 53,829,666 | |
Capital gain distributions from affiliated investment companies | | | 32,051,086 | |
| | | | |
Net realized gains on investments | | | 85,880,752 | |
Net change in unrealized gains (losses) on investments | | | (178,020,343 | ) |
| | | | |
Net realized and unrealized gains (losses) on investments | | | (92,139,591 | ) |
| | | | |
Net decrease in net assets resulting from operations | | $ | (49,753,452 | ) |
| | | | |
The accompanying notes are an integral part of these financial statements.
| | | | | | |
| Statement of changes in net assets | | Asset Allocation Trust | | | 27 | |
| | | | | | | | | | | | | | | | | | | | | | | | |
| | | Six months ended October 31, 2014 (unaudited) | | | Year ended April 30, 20141 | | | Year ended September 30, 2013 | |
| | | | | | |
Operations | | | | | | | | | | | | | | | | | | | | | | | | |
Net investment income | | | | | | $ | 42,386,139 | | | | | | | $ | 82,091,358 | | | | | | | $ | 223,770,238 | |
Net realized gains on investments | | | | | | | 85,880,752 | | | | | | | | 298,088,126 | | | | | | | | 369,522,918 | |
Net change in unrealized gains (losses) on investments | | | | | | | (178,020,343 | ) | | | | | | | 97,204,595 | | | | | | | | 70,773,942 | |
| | | | | | | | | | | | | | | | | | | | | | | | |
Net increase (decrease) in net assets resulting from operations | | | | | | | (49,753,452 | ) | | | | | | | 477,384,079 | | | | | | | | 664,067,098 | |
| | | | | | | | | | | | | | | | | | | | | | | | |
| | | | | | |
Capital share transactions | | | Shares | | | | | | | | Shares | | | | | | | | Shares | | | | | |
Contributions | | | 964,269 | | | | 15,131,333 | | | | 2,504,241 | | | | 37,910,608 | | | | 2,230,457 | | | | 30,551,031 | |
Withdrawals | | | (27,909,042 | ) | | | (438,072,696 | ) | | | (38,329,256 | ) | | | (577,483,198 | ) | | | (85,149,391 | ) | | | (1,175,072,850 | ) |
| | | | | | | | | | | | | | | | | | | | | | | | |
Net decrease in net assets resulting from capital share transactions | | | | | | | (422,941,363 | ) | | | | | | | (539,572,590 | ) | | | | | | | (1,144,521,819 | ) |
| | | | | | | | | | | | | | | | | | | | | | | | |
Total decrease in net assets | | | | | | | (472,694,815 | ) | | | | | | | (62,188,511 | ) | | | | | | | (480,454,721 | ) |
| | | | | | | | | | | | | | | | | | | | | | | | |
| | | | | | |
Net assets | | | | | | | | | | | | | | | | | | | | | | | | |
Beginning of period | | | | | | | 6,631,830,821 | | | | | | | | 6,694,019,332 | | | | | | | | 7,174,474,053 | |
| | | | | | | | | | | | | | | | | | | | | | | | |
End of period | | | | | | $ | 6,159,136,006 | | | | | | | $ | 6,631,830,821 | | | | | | | $ | 6,694,019,332 | |
| | | | | | | | | | | | | | | | | | | | | | | | |
Undistributed net investment income | | | | | | $ | 42,386,139 | | | | | | | $ | 0 | | | | | | | $ | 0 | |
| | | | | | | | | | | | | | | | | | | | | | | | |
| 1. | For the seven months ended April 30, 2014. The Fund changed its fiscal year end from September 30 to April 30, effective April 30, 2014. |
The accompanying notes are an integral part of these financial statements.
| | | | |
| 28 | | Asset Allocation Trust | | Financial highlights |
(For a share outstanding throughout each period)
| | | | | | | | | | | | | | | | | | | | | | | | | | | | |
| | | Six months ended
October 31, 2014 (unaudited) | | | Year ended
April 30, 20141 | | | Year ended September 30 | | | Year ended December 31, 2009 | |
| | | | | 2013 | | | 2012 | | | 2011 | | | 20102 | | |
Net asset value, beginning of period | | $ | 15.60 | | | $ | 14.52 | | | $ | 13.19 | | | $ | 11.64 | | | $ | 11.43 | | | $ | 10.98 | | | | $8.77 | |
Net investment income | | | 0.11 | | | | 0.19 | | | | 0.49 | | | | 0.42 | | | | 0.21 | | | | 0.12 | 3 | | | 0.24 | |
Net realized and unrealized gains (losses) on investments | | | (0.24 | ) | | | 0.89 | | | | 0.84 | | | | 1.13 | | | | 0.00 | 4 | | | 0.33 | | | | 1.97 | |
| | | | | | | | | | | | | | | | | | | | | | | | | | | | |
Total from investment operations | | | (0.13 | ) | | | 1.08 | | | | 1.33 | | | | 1.55 | | | | 0.21 | | | | 0.45 | | | | 2.21 | |
Net asset value, end of period | | $ | 15.47 | | | $ | 15.60 | | | $ | 14.52 | | | $ | 13.19 | | | $ | 11.64 | | | $ | 11.43 | | | $ | 10.98 | |
Total return5 | | | (0.83 | )% | | | 7.44 | % | | | 10.08 | % | | | 13.32 | % | | | 1.84 | % | | | 4.10 | % | | | 25.20 | % |
Ratios to average net assets (annualized) | | | | | | | | | | | | | | | | | | | | | | | | | | | | |
Gross expenses6 | | | 0.00 | % | | | 0.00 | % | | | 0.00 | % | | | 0.00 | % | | | 0.00 | % | | | 0.00 | % | | | 0.00 | % |
Net expenses6 | | | 0.00 | % | | | 0.00 | % | | | 0.00 | % | | | 0.00 | % | | | 0.00 | % | | | 0.00 | % | | | 0.00 | % |
Net investment income | | | 1.28 | % | | | 2.12 | % | | | 3.23 | % | | | 3.10 | % | | | 1.64 | % | | | 1.48 | % | | | 2.48 | % |
Supplemental data | | | | | | | | | | | | | | | | | | | | | | | | | | | | |
Portfolio turnover rate | | | 27 | % | | | 40 | % | | | 36 | % | | | 31 | % | | | 22 | % | | | 15 | % | | | 22 | % |
Net assets, end of period (000s omitted) | | | $6,159,136 | | | | $6,631,831 | | | | $6,694,019 | | | | $7,174,474 | | | | $7,447,698 | | | | $8,349,759 | | | | $8,635,057 | |
| 1. | For the seven months ended April 30, 2014. The Fund changed its fiscal year end from September 30 to April 30, effective April 30, 2014. |
| 2. | For the nine months ended September 30, 2010. The Fund changed its fiscal year end from December 31 to September 30, effective September 30, 2010. |
| 3. | Calculated based upon average shares outstanding |
| 4. | Amount is less than $0.005. |
| 5. | Returns for periods of less than one year are not annualized. |
| 6. | Excludes expenses incurred indirectly through investment in underlying funds. |
The accompanying notes are an integral part of these financial statements.
| | | | | | |
| Notes to financial statements (unaudited) | | Asset Allocation Trust | | | 29 | |
1. ORGANIZATION
Asset Allocation Trust (the “Trust”) was organized as a statutory trust under the laws of the state of Delaware on June 14, 2005 and is registered under the Investment Company Act of 1940, as amended, as a no-load, open-end management investment company. The Trust issues its shares of beneficial interest solely in private placement transactions that do not involve any “public offering” within the meaning of Section 4(2) of the Securities Act of 1933, as amended. The Trust is only offered to the Wells Fargo Advantage Asset Allocation Fund, a diversified series of Wells Fargo Funds Trust, an open-end management investment company, which was organized as a Delaware statutory trust on March 10, 1999.
The Trust operates as a “fund-of-funds” which primarily invests in shares of open-end mutual funds (“underlying funds”) managed by Grantham, Mayo, Van Otterloo & Co. LLC (“GMO”). Each underlying fund’s accounting policies are outlined in the underlying fund’s financial statements, which are available upon request.
2. SIGNIFICANT ACCOUNTING POLICIES
The following significant accounting policies, which are consistently followed in the preparation of the financial statements of the Trust, are in conformity with U.S. generally accepted accounting principles which require management to make estimates and assumptions that affect the reported amounts of assets and liabilities, disclosure of contingent assets and liabilities at the date of the financial statements, and the reported amounts of revenues and expenses during the reporting period. Actual results could differ from those estimates.
Securities valuation
All investments are valued each business day as of the close of regular trading on the New York Stock Exchange (generally 4 p.m. Eastern Time).
Investments in each class of the underlying funds are valued at the net asset value per share as reported by the underlying funds. Some of the classes of the underlying funds are not publicly available.
Short-term securities, with maturities of 60 days or less at time of purchase, generally are valued at amortized cost which approximates fair value. The amortized cost method involves valuing a security at its cost, plus accretion of discount or minus amortization of premium over the period until maturity.
Investments which are not valued using any of the methods discussed above are valued at their fair value, as determined in good faith and approved by the Board of Trustees of the Trust. The Board of Trustees has established a Valuation Committee comprised of the Trustees and has delegated to it the authority to take any actions regarding the valuation of portfolio securities that the Valuation Committee deems necessary or appropriate, including determining the fair value of portfolio securities, unless the determination has been delegated to the Management Valuation Team of Wells Fargo Funds Management, LLC (“Funds Management”). The Board of Trustees retains the authority to make or ratify any valuation decisions or approve any changes to the Valuation Procedures as it deems appropriate. On a quarterly basis, the Board of Trustees receives reports on any valuation actions taken by the Valuation Committee or the Management Valuation Team which may include items for ratification.
Valuations of fair valued securities are compared to the next actual sales price when available, or other appropriate market values, to assess the continued appropriateness of the fair valuation methodology used. These securities are fair valued on a day-to-day basis, taking into consideration changes to appropriate market information and any significant changes to the inputs considered in the valuation process until there is a readily available price provided on the exchange or by an independent pricing service. Valuations received from an independent pricing service or independent broker-dealer quotes are periodically validated by comparisons to most recent trades and valuations provided by other independent pricing services in addition to the review of prices by the adviser and/or subadviser. Unobservable inputs used in determining fair valuations are identified based on the type of security, taking into consideration factors utilized by market participants in valuing the investment, knowledge about the issuer and the current market environment.
Investment transactions and income recognition
Investment transactions are recorded on trade date. Income dividends and capital gain distributions from underlying funds are recorded on the ex-dividend date. Capital gain distributions from the underlying funds are treated as realized gains.
Interest income is accrued daily and bond discounts are accreted and premiums are amortized daily based on the effective interest method. To the extent debt obligations are placed on non-accrual status, any related interest income may be reduced by writing off interest receivables when the collection of all or a portion of interest has become doubtful based on consistently applied procedures. If the issuer subsequently resumes interest payments or when the collectability of interest is reasonably assured, the debt obligation is removed from non-accrual status.
| | | | |
| 30 | | Asset Allocation Trust | | Notes to financial statements (unaudited) |
Distributions to shareholders
Distributions to shareholders from net investment income and net realized gains, if any, are recorded on the ex-dividend date. Such distributions are determined in conformity with federal income tax regulations, which may differ in amount or character from net investment income and realized gains recognized for purposes of U.S. generally accepted accounting principles.
Federal and other taxes
The Trust intends to continue to qualify as a regulated investment company by distributing substantially all of its investment company taxable income and any net realized capital gains (after reduction for capital loss carryforwards) sufficient to relieve it from all, or substantially all, federal income taxes. Accordingly, no provision for federal income taxes was required.
The Trust’s income and federal excise tax returns and all financial records supporting those returns for the prior three fiscal years are subject to examination by the federal and Delaware revenue authorities. Management has analyzed the Trust’s tax positions taken on federal, state, and foreign tax returns for all open tax years and does not believe that there are any uncertain tax positions that require recognition of a tax liability.
As of April 30, 2014, the Trust had capital loss carryforwards available to offset future net realized capital gains in the amount of $164,112,423 with $94,623,111 expiring in 2017; $65,386,905 expiring in 2018; and $4,102,407 expiring in 2019.
3. FAIR VALUATION MEASUREMENTS
Fair value measurements of investments are determined within a framework that has established a fair value hierarchy based upon the various data inputs utilized in determining the value of the Trust’s investments. The three-level hierarchy gives the highest priority to unadjusted quoted prices in active markets for identical assets or liabilities (Level 1) and the lowest priority to significant unobservable inputs (Level 3). The Trust’s investments are classified within the fair value hierarchy based on the lowest level of input that is significant to the fair value measurement. The inputs are summarized into three broad levels as follows:
| n | | Level 1 – quoted prices in active markets for identical securities |
| n | | Level 2 – other significant observable inputs (including quoted prices for similar securities, interest rates, prepayment speeds, credit risk, use of amortized cost, etc.) |
| n | | Level 3 – significant unobservable inputs (including the Trust’s own assumptions in determining the fair value of investments) |
The inputs or methodologies used for valuing investments in securities are not necessarily an indication of the risk associated with investing in those securities.
The following is a summary of the inputs used in valuing the Trust’s assets and liabilities as of October 31, 2014:
| | | | | | | | | | | | | | | | |
| Investments in securities | | Quoted prices (Level 1) | | | Other significant
observable inputs (Level 2) | | | Significant unobservable inputs (Level 3) | | | Total | |
Assets | | | | | | | | | | | | | | | | |
Investments in: | | | | | | | | | | | | | | | | |
| | | | |
Investment companies | | $ | 6,138,027,996 | | | $ | 0 | | | $ | 0 | | | $ | 6,138,027,996 | |
| | | | |
Short-term investments | | | | | | | | | | | | | | | | |
Time deposit | | | 0 | | | | 21,149,814 | | | | 0 | | | | 21,149,814 | |
Total assets | | $ | 6,138,027,996 | | | $ | 21,149,814 | | | $ | 0 | | | $ | 6,159,177,810 | |
Transfers in and transfers out are recognized at the end of the reporting period. At October 31, 2014, the Trust did not have any transfers into/out of Level 1, Level 2, or Level 3.
4. TRANSACTIONS WITH AFFILIATES
GMO, a private company founded in 1977, is the adviser to the Trust. GMO also serves as adviser to each of the underlying funds. GMO does not receive a fee from the Trust for its advisory services. However, the Trust incurs fees and expenses indirectly as a shareholder of the underlying GMO–managed funds, including its indirect share of management or other fees paid to GMO.
| | | | | | |
| Notes to financial statements (unaudited) | | Asset Allocation Trust | | | 31 | |
Funds Management, an indirect wholly owned subsidiary of Wells Fargo & Company (“Wells Fargo”), serves as the administrator to the Trust. As administrator, Funds Management provides the Trust with facilities, equipment and personnel. Funds Management receives no compensation from the Trust for its services. During the six months ended October 31, 2014, Funds Management voluntarily reimbursed the Trust for expenses in the amount of $43,085.
5. INVESTMENT PORTFOLIO TRANSACTIONS
Purchases and sales of investments, excluding U.S. government obligations (if any) and short-term securities, for the six months ended October 31, 2014 were $1,732,844,979 and $2,080,035,059, respectively.
6. INVESTMENTS IN AFFILIATES
An affiliated investment is a company in which the Trust has ownership of at least 5% of the outstanding voting shares, or a company which is under common control. The following is a summary of transactions in issuers that were either affiliates of the Trust at the beginning of the period or the end of the period.
| | | | | | | | | | | | | | | | | | | | | | | | | | |
| | | Shares,
beginning
of period | | | Shares
purchased | | | Shares
sold | | | Shares,
end of
period | | | Value,
end of
period | | Dividends
from
affiliates | | | Capital gain
distributions
from affiliates | |
GMO Alpha Only Fund Class IV | | | 27,647,746 | | | | 16,435,025 | | | | 18,744,389 | | | | 25,338,382 | | | $593,678,295 | | $ | 0 | | | $ | 0 | |
GMO Asset Allocation Bond Fund Class VI | | | 35,880,338 | | | | 21,282,747 | | | | 5,101,916 | | | | 52,061,169 | | | 1,342,657,552 | | | 557,138 | | | | 0 | |
GMO Debt Opportunities Fund Class VI | | | 75,253,530 | | | | 9,343,714 | | | | 73,421,367 | | | | 11,175,877 | | | 279,061,653 | | | 0 | | | | 0 | |
GMO Emerging Country Debt Fund Class IV | | | 23,117,070 | | | | 794,700 | | | | 3,046,575 | | | | 20,865,195 | | | 214,911,505 | | | 8,368,187 | | | | 0 | |
GMO Emerging Markets Fund Class VI | | | 54,743,758 | | | | 0 | | | | 8,620,147 | | | | 46,123,611 | | | 494,906,349 | | | 0 | | | | 0 | |
GMO International Equity Fund Class IV | | | 66,422,496 | | | | 4,427,186 | | | | 2,762,757 | | | | 68,086,925 | | | 1,660,640,102 | | | 28,699,211 | | | | 0 | |
GMO Risk Premium Fund Class VI | | | 15,613,501 | | | | 15,488,585 | | | | 1,236,376 | | | | 29,865,710 | | | 302,838,299 | | | 0 | | | | 4,996,722 | |
GMO Special Situations Fund Class VI | | | 1,263,059 | | | | 0 | | | | 1,263,059 | | | | 0 | | | 0 | | | 0 | | | | 0 | |
GMO Strategic Fixed Income Fund Class VI | | | 41,765,969 | | | | 129,090 | | | | 41,895,059 | | | | 0 | | | 0 | | | 2,146,771 | | | | 0 | |
GMO U.S. Core Equity Fund Class VI | | | 68,550,482 | | | | 1,929,145 | | | | 12,770,901 | | | | 57,708,726 | | | 1,040,488,323 | | | 2,574,960 | | | | 27,046,565 | |
GMO U.S. Treasury Fund Class IV | | | 2,638,214 | | | | 10,232,111 | | | | 4,516,488 | | | | 8,353,837 | | | 208,845,918 | | | 38,696 | | | | 7,799 | |
| | | | | | | | | | | | | | | | | | | $6,138,027,996 | | $ | 42,384,963 | | | $ | 32,051,086 | |
7. INDEMNIFICATION
Under the Trust’s organizational documents, the officers and directors are indemnified against certain liabilities that may arise out of performance of their duties to the Trust. Additionally, in the normal course of business, the Trust may enter into contracts with service providers that contain a variety of indemnification clauses. The Trust’s maximum exposure under these arrangements is dependent on future claims that may be made against the Trust and, therefore, cannot be estimated.
| | | | |
| 32 | | Asset Allocation Trust | | Other information (unaudited) |
PROXY VOTING INFORMATION
A description of the policies and procedures that the Trust uses to determine how to vote proxies relating to portfolio securities is available without charge, upon request, by calling 1-800-222-8222, visiting our website at wellsfargoadvantagefunds.com, or visiting the SEC website at sec.gov. Information regarding how the Trust voted proxies relating to portfolio securities during the most recent 12-month period ended June 30 is available without charge on the Trust’s website at wellsfargoadvantagefunds.com or by visiting the SEC website at sec.gov.
PORTFOLIO HOLDINGS INFORMATION
The complete portfolio holdings for the Trust are publicly available monthly on the Trust’s website (wellsfargoadvantagefunds.com), on a one-month delayed basis. In addition, top ten holdings information (excluding derivative positions) for the Trust is publicly available on the Trust’s website on a monthly, seven-day or more delayed basis. The Trust files its complete schedule of portfolio holdings with the SEC for the first and third quarters of each fiscal year on Form N-Q, which is available without charge by visiting the SEC website at sec.gov. In addition, the Trust’s Form N-Q may be reviewed and copied at the SEC’s Public Reference Room in Washington, DC, and at regional offices in New York City, at 233 Broadway, and in Chicago, at 175 West Jackson Boulevard, Suite 900. Information about the Public Reference Room may be obtained by calling 1-800-SEC-0330.
| | | | | | |
| Other information (unaudited) | | Asset Allocation Trust | | | 33 | |
BOARD OF TRUSTEES AND OFFICERS
The following table provides basic information about the Board of Trustees (the “Trustees”) and Officers of Asset Allocation Trust. Each of the Trustees and Officers listed below acts in identical capacities. The mailing address of each Trustee and Officer is 525 Market Street, 12th Floor, San Francisco, CA 94105. Each Trustee and Officer serves an indefinite term, however, each Trustee serves such term until reaching the mandatory retirement age established by the Trustees.
Independent Trustees
| | | | | | |
Name and year of birth | | Position held and length of service* | | Principal occupations during past five years or longer | | Other directorships during
past five years |
| Peter G. Gordon (Born 1942) | | Trustee, since 2010; Chairman, since 2010 | | Co-Founder, Retired Chairman, President and CEO of Crystal Geyser Water Company. Trustee Emeritus, Colby College. | | Wells Fargo Advantage family of funds consisting of 133 funds. |
| Isaiah Harris, Jr. (Born 1952) | | Trustee, since 2010 | | Retired. Prior thereto, President and CEO of BellSouth Advertising and Publishing Corp. from 2005 to 2007, President and CEO of BellSouth Enterprises from 2004 to 2005 and President of BellSouth Consumer Services from 2000 to 2003. Emeritus member of the Iowa State University Foundation Board of Governors. Emeritus Member of the Advisory Board of Iowa State University School of Business. Advisory Board Member, Palm Harbor Academy. Mr. Harris is a certified public accountant. | | CIGNA Corporation; Wells Fargo Advantage family of funds consisting of 133 funds. |
| Judith M. Johnson (Born 1949) | | Trustee, since 2010;
Audit Committee Chairman, since 2010 | | Retired. Prior thereto, Chief Executive Officer and Chief Investment Officer of Minneapolis Employees Retirement Fund from 1996 to 2008. Ms. Johnson is an attorney, certified public accountant and a certified managerial accountant. | | Wells Fargo Advantage family of funds consisting of 133 funds. |
| Leroy Keith, Jr. (Born 1939) | | Trustee, since 2010** | | Chairman, Bloc Global Services (development and construction). Trustee of the Evergreen Funds complex (and its predecessors) from 1983 to 2010. Former Managing Director, Almanac Capital Management (commodities firm), former Partner, Stonington Partners, Inc. (private equity fund), former Director, Obagi Medical Products Co. and former Director, Lincoln Educational Services. | | Trustee, Virtus Fund Complex (consisting of 50 portfolios as of 12/16/2013); Wells Fargo Advantage family of funds consisting of 133 funds. |
| David F. Larcker (Born 1950) | | Trustee, since 2010 | | James Irvin Miller Professor of Accounting at the Graduate School of Business, Stanford University, Morgan Stanley Director of the Center for Leadership Development and Research and Senior Faculty of The Rock Center for Corporate Governance since 2006. From 2005 to 2008, Professor of Accounting at the Graduate School of Business, Stanford University. Prior thereto, Ernst & Young Professor of Accounting at The Wharton School, University of Pennsylvania from 1985 to 2005. | | Wells Fargo Advantage family of funds consisting of 133 funds. |
| Olivia S. Mitchell (Born 1953) | | Trustee, since 2010 | | International Foundation of Employee Benefit Plans Professor, Wharton School of the University of Pennsylvania since 1993. Director of Wharton’s Pension Research Council and Boettner Center on Pensions & Retirement Research, and Research Associate at the National Bureau of Economic Research. Previously, Cornell University Professor from 1978 to 1993. | | Wells Fargo Advantage family of funds consisting of 133 funds. |
| Timothy J. Penny (Born 1951) | | Trustee, since 2010 | | President and CEO of Southern Minnesota Initiative Foundation, a non-profit organization, since 2007 and Senior Fellow at the Humphrey Institute Policy Forum at the University of Minnesota since 1995. Member of the Board of Trustees of NorthStar Education Finance, Inc., a non-profit organization, since 2007. | | Wells Fargo Advantage family of funds consisting of 133 funds. |
| | | | |
| 34 | | Asset Allocation Trust | | Other information (unaudited) |
| | | | | | |
Name and year of birth | | Position held and length of service* | | Principal occupations during past five years or longer | | Other directorships during
past five years |
| Michael S. Scofield (Born 1943) | | Trustee, since 2005 | | Served on the Investment Company Institute’s Board of Governors and Executive Committee from 2008-2011 as well the Governing Council of the Independent Directors Council from 2006-2011 and the Independent Directors Council Executive Committee from 2008-2011. Chairman of the IDC from 2008-2010. Institutional Investor (Fund Directions) Trustee of Year in 2007. Trustee of the Evergreen Funds complex (and its predecessors) from 1984 to 2010. Chairman of the Evergreen Funds from 2000-2010. Former Trustee of the Mentor Funds. Retired Attorney, Law Offices of Michael S. Scofield. | | Wells Fargo Advantage family of funds consisting of 133 funds. |
| Donald C. Willeke (Born 1940) | | Trustee, since 2010 | | Principal of the law firm of Willeke & Daniels. General Counsel of the Minneapolis Employees Retirement Fund from 1984 until its consolidation into the Minnesota Public Employees Retirement Association on June 30, 2010. Director and Vice Chair of The Tree Trust (non-profit corporation). Director of the American Chestnut Foundation (non-profit corporation). | | Wells Fargo Advantage family of funds consisting of 133 funds. |
| * | Length of service dates reflect the Trustee’s commencement of service with the Trust’s predecessor entities, where applicable. |
| ** | Leroy Keith, Jr. will retire as a Trustee effective December 31, 2014. |
Officers
| | | | | | |
Name and year of birth | | Position held and
length of service | | Principal occupations during past five years or longer | | |
| Karla M. Rabusch (Born 1959) | | President, since 2010 | | Executive Vice President of Wells Fargo Bank, N.A. and President of Wells Fargo Funds Management, LLC since 2003. | | |
| Jeremy DePalma (Born 1974) | | Treasurer, since 2012 | | Senior Vice President of Wells Fargo Funds Management, LLC since 2009. Senior Vice President of Evergreen Investment Management Company, LLC from 2008 to 2010. Vice President, Evergreen Investment Services, Inc. from 2004 to 2007. Head of the Fund Reporting and Control Team within Fund Administration from 2005 to 2010. | | |
| C. David Messman (Born 1960) | | Secretary, since 2010; Chief Legal Officer, since 2010 | | Assistant General Counsel of Wells Fargo Bank, N.A. since 2013 and Vice President and Managing Counsel of Wells Fargo Bank N.A. from 1996 to 2013. Senior Vice President and Secretary of Wells Fargo Funds Management , LLC since 2001. | | |
| Debra Ann Early (Born 1964) | | Chief Compliance Officer, since 2010 | | Senior Vice President and Chief Compliance Officer of Wells Fargo Funds Management, LLC since 2007. Chief Compliance Officer of Parnassus Investments from 2005 to 2007. Chief Financial Officer of Parnassus Investments from 2004 to 2007. | | |
| David Berardi (Born 1975) | | Assistant Treasurer, since 2009 | | Vice President of Wells Fargo Funds Management, LLC since 2009. Vice President of Evergreen Investment Management Company, LLC from 2008 to 2010. Assistant Vice President of Evergreen Investment Services, Inc. from 2004 to 2008. Manager of Fund Reporting and Control for Evergreen Investment Management Company, LLC from 2004 to 2010. | | |
| | | | | | |
| Other information (unaudited) | | Wells Fargo Advantage Asset Allocation Fund | | | 35 | |
BOARD CONSIDERATION OF INVESTMENT ADVISORY AGREEMENTS:
Under Section 15 of the Investment Company Act of 1940 (the “1940 Act”), the Board of Trustees (each a “Board” and collectively the “Boards”) of each of Wells Fargo Funds Trust (“Funds Trust”) and Asset Allocation Trust (collectively with Funds Trust, the “Trusts”), all the members of which have no direct or indirect interest in the investment advisory agreements and are not “interested persons” of the Trusts, as defined in the 1940 Act (the “Independent Trustees”), must determine whether to approve the continuation of the Trusts’ investment advisory agreements. In this regard, at in-person meetings held on March 27-28, 2014 (the “March Meeting”) and May 15-16, 2014 (the “May Meeting”, and together with the March Meeting, the “Meetings”), the Funds Trust Board reviewed an investment advisory agreement with Wells Fargo Funds Management, LLC (“Funds Management”) for Wells Fargo Advantage Asset Allocation Fund (the “Asset Allocation Fund”), and the Asset Allocation Trust Board reviewed an investment advisory agreement with Grantham, Mayo, Van Otterloo & Co. LLC (“GMO”) for the Asset Allocation Trust. The Asset Allocation Fund and the Asset Allocation Trust are collectively referred to as the “Funds” and individually as a “Fund.” The investment advisory agreements with Funds Management and GMO are collectively referred to as the “Advisory Agreements.”
At the May Meeting, the Board received the information, considered the factors and reached the conclusions discussed below, and unanimously approved the renewal of the Advisory Agreements, as it had done at the March Meeting.
At the Meetings, the Boards considered the factors and reached the conclusions described below relating to the selection of Funds Management and GMO, as applicable, and the continuation of the Advisory Agreements. Prior to the Meetings, the Trustees conferred extensively among themselves and with representatives of Funds Management about these matters. Also, the Boards have adopted a team-based approach, with each team consisting of a sub-set of Trustees, to assist them in the discharge of their duties in reviewing performance and other matters throughout the year. The Independent Trustees were assisted in their evaluation of the Advisory Agreements by independent legal counsel, from whom they received separate legal advice and with whom they met separately.
The Asset Allocation Fund is a gateway fund advised by Funds Management that invests substantially all of its assets in the Asset Allocation Trust, which in turn invests in underlying funds that are advised by GMO. The Asset Allocation Trust’s investment objective and investment strategies are substantially similar to those of the Asset Allocation Fund. Information provided to the Boards regarding the Asset Allocation Fund is also applicable to the Asset Allocation Trust, as relevant.
In providing information to the Boards, Funds Management and GMO were guided by a detailed set of requests for information submitted to them by independent legal counsel on behalf of the Independent Trustees at the start of the Boards’ annual contract renewal process earlier in 2014. In considering and approving the Advisory Agreements, the Trustees considered the information they believed relevant, including but not limited to the information discussed below. The Boards considered not only the specific information presented in connection with the Meetings, but also the knowledge gained over time through interaction with Funds Management and GMO about various topics. In this regard, the Boards reviewed reports at each of their quarterly meetings, which included, among other things, portfolio reviews and performance reports. In addition, the Boards and the teams mentioned above confer with portfolio managers at various times throughout the year. The Boards did not identify any particular information or consideration that was all-important or controlling, and each individual Trustee may have attributed different weights to various factors. The Boards evaluated information provided to them about both Funds together and with respect to each Fund separately as they considered appropriate.
After their deliberations, the Boards unanimously approved the continuation of the Advisory Agreements and determined that the compensation payable thereunder, if any, is reasonable. The Boards considered the continuation of the Advisory Agreements for the Funds as part of their consideration of the continuation of advisory agreements for funds across the complex, but their approvals were made on a fund-by-fund basis. The following summarizes a number of important, but not necessarily all, factors considered by the Boards in support of their approvals.
Nature, extent and quality of services
The Boards received and considered various information regarding the nature, extent and quality of services provided to the respective Funds by Funds Management and GMO under the respective Advisory Agreements. This information included, among other things, a summary of the background and experience of senior management of Funds Management and GMO, and the qualifications, background, tenure and responsibilities of each of the portfolio managers of GMO primarily responsible for the day-to-day portfolio management of the Asset Allocation Trust.
| | | | |
| 36 | | Wells Fargo Advantage Asset Allocation Fund | | Other information (unaudited) |
The Boards evaluated the ability of Funds Management and GMO to attract and retain qualified investment professionals, including research, advisory and supervisory personnel. The Boards further considered the compliance programs and compliance records of Funds Management and GMO. In addition, the Boards took into account the full range of services provided to the Funds by Funds Management and its affiliates.
Fund performance and expenses
The Boards considered the performance results for the Asset Allocation Fund over various time periods ended December 31, 2013. The Boards also considered these results in comparison to the performance of funds in a universe that was determined by Lipper Inc. (“Lipper”) to be similar to the Asset Allocation Fund (the “Universe”), and in comparison to the Asset Allocation Fund’s benchmark index and to other comparative data. Lipper is an independent provider of investment company data. The Boards received a description of the methodology used by Lipper to select the mutual funds in the performance Universe. The Boards noted that the performance of the Asset Allocation Fund (Administrator Class) was higher than or in range of the average performance of the Universe for all periods under review except for the five-year period. The Boards also noted that the performance of the Asset Allocation Fund was higher than or in range of its benchmark, the GMO Global Balanced Index, for all periods under review except for the one- and five-year periods under review. The Boards viewed favorably the Asset Allocation Fund’s recent positive performance compared to the Universe.
The Funds Trust Board also received and considered information regarding the Asset Allocation Fund’s net operating expense ratios and their various components, including actual management fees (which reflect fee waivers, if any, and include advisory, administration and transfer agent fees), custodian and other non-management fees, acquired fund fees and expenses, Rule 12b-1 and non-Rule 12b-1 service fees and fee waiver and expense reimbursement arrangements. The Funds Trust Board considered these ratios in comparison to the median ratios of funds in class-specific expense groups that were determined by Lipper to be similar to the Asset Allocation Fund (the “Groups”). The Funds Trust Board received a description of the methodology used by Lipper to select the mutual funds in the expense Groups and an explanation of year-to-year variations in the funds comprising such expense Groups and their expense ratios. Based on the Lipper reports, the Funds Trust Board noted that the net operating expense ratios of the Asset Allocation Fund were lower than or in range of the median net operating expense ratios of the expense Groups.
Based on its consideration of the factors and information it deemed relevant, including those described here, each Board concluded that the overall performance and expense structure of the Fund supported the re-approval of the applicable Advisory Agreement.
Investment advisory fee rates
The Funds Trust Board reviewed and considered the contractual investment advisory fee rates that are payable by the Asset Allocation Fund to Funds Management for investment advisory services (the “Advisory Agreement Rates”), both on a stand-alone basis and on a combined basis with the Asset Allocation Fund’s fund-level and class-level contractual administration fee rates (the “Management Rates”). The Funds Trust Board noted that the administration fees payable to Funds Management include transfer agency costs and that, in light of the administration fees payable by the Asset Allocation Fund to Funds Management, Asset Allocation Trust does not pay Funds Management a separate fee for administrative services provided by it to the Asset Allocation Trust.
Among other information reviewed by the Funds Trust Board was a comparison of the Management Rates of the Asset Allocation Fund with those of other funds in the expense Groups at a common asset level. The Board noted that the Management Rates of the Asset Allocation Fund were lower than or in range of the average rates for the Asset Allocation Fund’s expense Groups for all share classes.
The Asset Allocation Trust Board noted that the Asset Allocation Trust does not pay a fee to GMO for its advisory services and that GMO earns advisory fees from the underlying GMO funds in which the Asset Allocation Trust invests. The Asset Allocation Trust Board also received and considered information about the nature and extent of services offered and fee rates charged by GMO to other clients with investment strategies similar to those of the Asset Allocation Trust. In this regard, GMO reported that, like the Asset Allocation Trust, these other clients do not pay an advisory fee to GMO and GMO earns advisory fees from the underlying GMO Funds in which the clients invest.
Based on its consideration of the factors and information it deemed relevant, including those described here, each Board determined that the compensation payable under the applicable Advisory Agreement, if any, was reasonable.
Profitability
The Funds Trust Board received and considered information concerning the profitability of Funds Management, as well as the profitability of Wells Fargo as a whole, from providing services to the Asset Allocation Fund and the fund family as a whole.
| | | | | | |
| Other information (unaudited) | | Wells Fargo Advantage Asset Allocation Fund | | | 37 | |
Funds Management explained the methodologies and estimates that it used in calculating profitability. Among other things, the Funds Trust Board noted that the levels of profitability reported on a fund-by-fund basis varied widely, depending on factors such as the size and type of fund. Based on its review, the Funds Trust Board did not deem the profits reported by Funds Management to be at a level that would prevent it from approving the continuation of the Advisory Agreement with Funds Management.
The Asset Allocation Trust Board noted that the Asset Allocation Trust does not pay fees to GMO for its advisory services and, thus, that GMO’s profitability from its relationship with the Asset Allocation Trust was not a material factor in determining whether to renew the Advisory Agreement with GMO.
Economies of scale
With respect to possible economies of scale, the Funds Trust Board noted the existence of breakpoints in the Asset Allocation Fund’s advisory fee and administration fee structure, which operate generally to reduce the Asset Allocation Fund’s expense ratios as the Asset Allocation Fund grows in size. The Funds Trust Board considered that, for a small fund or a fund that shrinks in size, breakpoints conversely can result in higher fee levels. The Funds Trust Board also considered that fee waiver and expense reimbursement arrangements and competitive fee rates at the outset are means of sharing potential economies of scale with shareholders of the Asset Allocation Fund and the fund family as a whole. The Funds Trust Board considered Funds Management’s view that any analyses of potential economies of scale in managing a particular fund are inherently limited in light of the joint and common costs and investments that Funds Management incurs across the fund family as a whole.
The Funds Trust Board concluded that the Asset Allocation Fund’s fee and expense arrangements, including contractual breakpoints, constituted a reasonable approach to sharing potential economies of scale with the Asset Allocation Fund and its shareholders.
The Asset Allocation Trust Board noted that the Asset Allocation Trust does not pay fees to GMO for its advisory services and thus that any possible economies of scale were not a material factor in determining whether to renew the Advisory Agreement with GMO.
Other benefits to Funds Management and GMO
The Boards received and considered information regarding potential “fall-out” or ancillary benefits received by Funds Management and its affiliates and GMO as a result of their relationships with the Funds. Ancillary benefits could include, among others, benefits directly attributable to other relationships with the Funds and benefits potentially derived from an increase in Funds Management’s and GMO’s business as a result of their relationships with the Funds. The Boards received information about fees received by GMO from the underlying GMO funds held by Asset Allocation Trust and about benefits to GMO from soft dollar credits generated by those underlying funds. The Funds Trust Board also noted that various affiliates of Funds Management may receive distribution-related fees, shareholder servicing payments and sub-transfer agency fees in respect of shares sold or held through them and services provided.
Based on their consideration of the factors and information they deemed relevant, including those described here, the Boards did not find that any ancillary benefits received by Funds Management and its affiliates and GMO were unreasonable.
Conclusion
After considering the above-described factors and based on their deliberations and evaluation of the information described above, the Boards unanimously approved the continuation of the Advisory Agreements for an additional one-year period and determined that the compensation payable thereunder, if any, is reasonable.
| | | | |
| 38 | | Wells Fargo Advantage Asset Allocation Fund | | List of abbreviations |
The following is a list of common abbreviations for terms and entities that may have appeared in this report.
| ACA | — ACA Financial Guaranty Corporation |
| ADR | — American depositary receipt |
| ADS | — American depositary shares |
| AGC | — Assured Guaranty Corporation |
| AGM | — Assured Guaranty Municipal |
| Ambac | — Ambac Financial Group Incorporated |
| AMT | — Alternative minimum tax |
| BAN | — Bond anticipation notes |
| BHAC | — Berkshire Hathaway Assurance Corporation |
| CAB | — Capital appreciation bond |
| CCAB | — Convertible capital appreciation bond |
| CDA | — Community Development Authority |
| CDO | — Collateralized debt obligation |
| DRIVER | — Derivative inverse tax-exempt receipts |
| DW&P | — Department of Water & Power |
| DWR | — Department of Water Resources |
| ECFA | — Educational & Cultural Facilities Authority |
| EDA | — Economic Development Authority |
| EDFA | — Economic Development Finance Authority |
| ETF | — Exchange-traded fund |
| FDIC | — Federal Deposit Insurance Corporation |
| FFCB | — Federal Farm Credit Banks |
| FGIC | — Financial Guaranty Insurance Corporation |
| FHA | — Federal Housing Administration |
| FHLB | — Federal Home Loan Bank |
| FHLMC | — Federal Home Loan Mortgage Corporation |
| FICO | — The Financing Corporation |
| FNMA | — Federal National Mortgage Association |
| GDR | — Global depositary receipt |
| GNMA | — Government National Mortgage Association |
| HCFR | — Healthcare facilities revenue |
| HEFA | — Health & Educational Facilities Authority |
| HEFAR | — Higher education facilities authority revenue |
| HFA | — Housing Finance Authority |
| HFFA | — Health Facilities Financing Authority |
| HUD | — Department of Housing and Urban Development |
| IDA | — Industrial Development Authority |
| IDAG | — Industrial Development Agency |
| KRW | — Republic of Korea won |
| LIBOR | — London Interbank Offered Rate |
| LLC | — Limited liability company |
| LLLP | — Limited liability limited partnership |
| LLP | — Limited liability partnership |
| MBIA | — Municipal Bond Insurance Association |
| MFHR | — Multifamily housing revenue |
| MSTR | — Municipal securities trust receipts |
| MUD | — Municipal Utility District |
| National | — National Public Finance Guarantee Corporation |
| PCFA | — Pollution Control Financing Authority |
| PCL | — Public Company Limited |
| PCR | — Pollution control revenue |
| PFA | — Public Finance Authority |
| PFFA | — Public Facilities Financing Authority |
| PFOTER | — Puttable floating option tax-exempt receipts |
| plc | — Public limited company |
| PUTTER | — Puttable tax-exempt receipts |
| R&D | — Research & development |
| Radian | — Radian Asset Assurance |
| RAN | — Revenue anticipation notes |
| RDA | — Redevelopment Authority |
| RDFA | — Redevelopment Finance Authority |
| REIT | — Real estate investment trust |
| ROC | — Reset option certificates |
| SAVRS | — Select auction variable rate securities |
| SBA | — Small Business Authority |
| SFHR | — Single-family housing revenue |
| SFMR | — Single-family mortgage revenue |
| SPA | — Standby purchase agreement |
| SPDR | — Standard & Poor’s Depositary Receipts |
| STRIPS | — Separate trading of registered interest and |
| TAN | — Tax anticipation notes |
| TIPS | — Treasury inflation-protected securities |
| TRAN | — Tax revenue anticipation notes |
| TTFA | — Transportation Trust Fund Authority |
| TVA | — Tennessee Valley Authority |
This page is intentionally left blank.
This page is intentionally left blank.


For more information
More information about Wells Fargo Advantage Funds is available free upon request. To obtain literature, please write, email, visit the Fund’s website, or call:
Wells Fargo Advantage Funds
P.O. Box 8266
Boston, MA 02266-8266
Email: wfaf@wellsfargo.com
Website: wellsfargoadvantagefunds.com
Individual investors: 1-800-222-8222
Retail investment professionals: 1-888-877-9275
Institutional investment professionals: 1-866-765-0778
This report and the financial statements contained herein are submitted for the general information of the shareholders of Wells Fargo Advantage Funds. If this report is used for promotional purposes, distribution of the report must be accompanied or preceded by a current prospectus. Before investing, please consider the investment objectives, risks, charges, and expenses of the investment. For a current prospectus and, if available, a summary prospectus, containing this information, call 1-800-222-8222 or visit the Fund’s website at wellsfargoadvantagefunds.com. Read the prospectus carefully before you invest or send money.
Wells Fargo Funds Management, LLC, a wholly owned subsidiary of Wells Fargo & Company, provides investment advisory and administrative services for Wells Fargo Advantage Funds. Other affiliates of Wells Fargo & Company provide subadvisory and other services for the Funds. The Funds are distributed by Wells Fargo Funds Distributor, LLC, Member FINRA/SIPC, an affiliate of Wells Fargo & Company.
NOT FDIC INSURED ¡ NO BANK GUARANTEE ¡ MAY LOSE VALUE
© 2014 Wells Fargo Funds Management, LLC. All rights reserved.
| | |
 | | 229613 12-14 SA224/SAR224 10-14 |
Not applicable.
| ITEM 3. | AUDIT COMMITTEE FINANCIAL EXPERT |
Not applicable.
| ITEM 4. | PRINCIPAL ACCOUNTANT FEES AND SERVICES |
Not applicable.
| ITEM 5. | AUDIT COMMITTEE OF LISTED REGISTRANTS |
Not applicable.
A Portfolio of investments for each Fund is included as part of the report to shareholders filed under Item 1 of this Form.
| ITEM 7. | DISCLOSURE OF PROXY VOTING POLICIES AND PROCEDURES FOR CLOSED-END MANAGEMENT INVESTMENT COMPANIES |
Not applicable.
| ITEM 8. | PORTFOLIO MANAGERS OF CLOSED-END MANAGEMENT INVESTMENT COMPANIES |
Not applicable.
| ITEM 9. | PURCHASES OF EQUITY SECURITIES BY CLOSED-END MANAGEMENT INVESTMENT COMPANY AND AFFILIATED PURCHASERS |
Not applicable.
| ITEM 10. | SUBMISSION OF MATTERS TO A VOTE OF SECURITY HOLDERS |
There have been no material changes to the procedures by which shareholders may recommend nominees to the Registrant’s board of trustees that have been implemented since the Registrant’s last provided disclosure in response to the requirements of this Item.
| ITEM 11. | CONTROLS AND PROCEDURES |
(a) The President and Treasurer have concluded that the Wells Fargo Funds Trust (the “Trust”) disclosure controls and procedures (as defined in Rule 30a-3(c) under the Investment Company Act of 1940) provide reasonable
assurances that material information relating to the Trust is made known to them by the appropriate persons, based on their evaluation of these controls and procedures as of a date within 90 days of the filing of this report.
(b) There were no significant changes in the Trust’s internal controls over financial reporting (as defined in Rule 30a-3(d) under the Investment Company Act of 1940) that occurred during the second fiscal quarter of the period covered by this report that materially affected, or is reasonably likely to materially affect, the registrant’s internal control over financial reporting.
(a)(1) Not applicable.
(a)(2) Certification pursuant to Rule 30a-2(a) under the Investment Company Act of 1940 (17 CFR 270.30a-2(a)) is filed and attached hereto as Exhibit 99.CERT.
(a)(3) Not applicable.
(b) Certification pursuant to Rule 30a-2(b) under the Investment Company Act of 1940 (17 CFR 270.30a-2(b)) is filed and attached hereto as Exhibit 99.906CERT.
SIGNATURES
Pursuant to the requirements of the Securities Exchange Act of 1934 and the Investment Company Act of 1940, the registrant has duly caused this report to be signed on its behalf by the undersigned, thereunto duly authorized.
| | |
| Wells Fargo Funds Trust |
| |
| By: | | /s/ Karla M. Rabusch |
| |
| | Karla M. Rabusch |
| | President |
| |
| Date: | | December 23, 2014 |
Pursuant to the requirements of the Securities Exchange Act of 1934 and the Investment Company Act of 1940, this report has been signed below by the following persons on behalf of the registrant and in the capacities and on the date indicated.
| | |
| Wells Fargo Funds Trust |
| |
| By: | | /s/ Karla M. Rabusch |
| |
| | Karla M. Rabusch |
| | President |
| |
| Date: | | December 23, 2014 |
| |
| By: | | /s/ Jeremy DePalma |
| |
| | Jeremy DePalma |
| | Treasurer |
| |
| Date: | | December 23, 2014 |