
UNITED STATES
SECURITIES AND EXCHANGE COMMISSION
Washington, D.C. 20549
FORM N-CSRS
CERTIFIED SHAREHOLDER REPORT OF REGISTERED
MANAGEMENT INVESTMENT COMPANIES
Investment Company Act file number: 811-09253
Wells Fargo Funds Trust
(Exact name of registrant as specified in charter)
525 Market St., San Francisco, CA 94105
(Address of principal executive offices) (Zip code)
C. David Messman
Wells Fargo Funds Management, LLC
525 Market St., San Francisco, CA 94105
(Name and address of agent for service)
Registrant’s telephone number, including area code: 800-222-8222
Date of fiscal year end: The registrant is making a filing for 17 of its series.
Wells Fargo Advantage Growth Balanced Fund, Wells Fargo Advantage Moderate Balanced Fund, Wells Fargo Advantage C&B Large Cap Value Fund, Wells Fargo Advantage Diversified Equity Fund, Wells Fargo Advantage Emerging Growth Fund, Wells Fargo Advantage Index Fund, Wells Fargo Advantage International Value Fund, Wells Fargo Advantage Small Company Growth Fund, Wells Fargo Advantage Small Company Value Fund, Wells Fargo Advantage Core Bond Fund, Wells Fargo Advantage Real Return Fund (formerly, Wells Fargo Advantage Inflation-Protected Bond Fund), Wells Fargo Advantage WealthBuilder Conservative Allocation Portfolio, Wells Fargo Advantage WealthBuilder Moderate Balanced Portfolio, Wells Fargo Advantage WealthBuilder Growth Balanced Portfolio, Wells Fargo Advantage WealthBuilder Growth Allocation Portfolio, Wells Fargo Advantage WealthBuilder Equity Portfolio, and Wells Fargo Advantage WealthBuilder Tactical Equity Portfolio. Each series has a May 31 fiscal year end.
Date of reporting period: November 30, 2014
| ITEM 1. | REPORT TO STOCKHOLDERS |

Wells Fargo Advantage Allocation Funds

Semi-Annual Report
November 30, 2014
| n | | Wells Fargo Advantage Growth Balanced Fund |
| n | | Wells Fargo Advantage Moderate Balanced Fund |

Reduce clutter. Save trees.
Sign up for electronic delivery of prospectuses and shareholder reports at wellsfargo.com/advantagedelivery
Contents
The views expressed and any forward-looking statements are as of November 30, 2014, unless otherwise noted, and are those of the Fund managers and/or Wells Fargo Funds Management, LLC. Discussions of individual securities, or the markets generally, or any Wells Fargo Advantage Fund are not intended as individual recommendations. Future events or results may vary significantly from those expressed in any forward-looking statements; the views expressed are subject to change at any time in response to changing circumstances in the market. Wells Fargo Funds Management, LLC and the Funds disclaim any obligation to publicly update or revise any views expressed or forward-looking statements.
NOT FDIC INSURED ¡ NO BANK GUARANTEE ¡ MAY LOSE VALUE
| | | | |
| 2 | | Wells Fargo Advantage Allocation Funds | | Letter to shareholders (unaudited) |

Karla M. Rabusch
President
Wells Fargo Advantage Funds
Major central banks continued to inject liquidity into global banks and markets through various accommodative monetary policies, including quantitative easing.
Dear Valued Shareholder:
We are pleased to offer you this semi-annual report for the Wells Fargo Advantage Allocation Funds for the six-month period that ended November 30, 2014. The period was marked by continued accommodative monetary policy in developed countries, broader economic growth, low inflation, and equity market gains.
The U.S. stock market outperformed most international markets; the S&P 500 Index1, a proxy for U.S. large-cap stocks, ended the period with an 8.58% gain. The MSCI EAFE Index (Net)2, a proxy for international developed markets, ended the period with a 5.07% loss. The U.S. was the fastest-growing developed country, which benefited U.S. companies. In addition, a strong U.S. dollar held back the returns of non-U.S. investments in dollar terms. Most bond sectors gained modestly amid renewed confidence in economic growth that drove outperformance in credit-sensitive sectors as solid economic growth boosted company revenue and profits and kept default rates low. The Barclays U.S. Aggregate Bond Index3 returned 1.91% during the period. Short-term interest rates remained ultralow.
Major central banks continued to provide stimulus.
Major central banks continued to inject liquidity into global banks and markets through various accommodative monetary policies, including quantitative easing. In the U.S., the Federal Reserve (Fed) kept its key interest rate effectively near zero in order to support the economy and the financial system. It tapered the size of its quantitative easing program each month until the program ended in October 2014 and also discussed changes to its forward guidance as it begins to normalize monetary policy.
Meanwhile, European markets continued to benefit from the European Central Bank’s (ECB’s) willingness to maintain low interest rates. In September 2014, the ECB cut its key rate to a historic low of 0.05%. In addition to its targeted longer-term refinancing operations that are designed to increase bank lending, the ECB released details of its asset-backed securities purchase program and the new covered bond purchase program, which are scheduled to begin in the fourth quarter of 2014. In Japan, the Bank of Japan maintained an aggressive monetary program aimed at combating deflation.
Challenging geopolitical situations and concerns about slowing global growth remained.
Geopolitical events were major negatives throughout the reporting period. The ongoing standoff between the West (the U.S., Europe, and their allies) and Russia over Ukraine continued throughout the reporting period. As of November 2014, most investors believed that the situation would not result in a war. However, economic sanctions from the West against Russia and from Russia against the West contributed to slower growth in Europe, a key Russian trading partner. In the Middle East, the advance of Islamic militants in Syria and Iraq led to airstrikes by the U.S. and its allies and fears of a prolonged regional war.
| 1. | The S&P 500 Index consists of 500 stocks chosen for market size, liquidity, and industry group representation. It is a market-value-weighted index with each stock’s weight in the index proportionate to its market value. You cannot invest directly in an index. |
| 2. | The Morgan Stanley Capital International Europe, Australasia, and Far East (MSCI EAFE) Index (Net) is an unmanaged group of securities widely regarded by investors to be representations of the stock markets of Europe, Australasia, and the Far East. Calculations for EAFE use net dividends, which reflect the deduction of withholding taxes. You cannot invest directly in an index. Source: MSCI. MSCI makes no express or implied warranties or representations and shall have no liability whatsoever with respect to any MSCI data contained herein. The MSCI data may not be further redistributed or used as a basis for other indexes or any securities or financial products. This report is not approved, reviewed, or produced by MSCI. |
| 3. | The Barclays U.S. Aggregate Bond Index is a broad-based benchmark that measures the investment-grade, U.S. dollar-denominated, fixed-rate taxable bond market, including Treasuries, government-related and corporate securities, MBS (agency fixed-rate and hybrid ARM passthroughs), ABS, and CMBS. You cannot invest directly in an index. |
| | | | | | |
| Letter to shareholders (unaudited) | | Wells Fargo Advantage Allocation Funds | | | 3 | |
Economic news out of Europe trended lower for most of 2014. Slower European growth and expectations of higher U.S. interest rates sent the euro lower during the quarter, pressuring European returns for U.S. dollar-denominated investors. Returns in Asia were dampened by a sluggish Japanese economy as well as a late-period decline in the yen. Among countries in the MSCI EAFE Index (Net), most of the major markets (such as Japan, Germany, and France) ended the period with losses. By contrast, U.S. economic news remained favorable; gross domestic product grew at a 3.9% annualized gain, pushing the U.S. stock market to a solid gain. Meanwhile, 10-year U.S. Treasury yields trended lower over the period, reaching 2.20% by the end of November.
Don’t let short-term uncertainty derail long-term investment goals.
Periods of uncertainty can present challenges, but experience has taught us that maintaining long-term investment goals can be an effective way to plan for the future. To help you create a sound strategy based on your personal goals and risk tolerance, Wells Fargo Advantage Funds offers more than 100 mutual funds and other investments spanning a wide range of asset classes and investment styles. Although diversification cannot guarantee an investment profit or prevent losses, we believe it can be an effective way to manage investment risk and potentially smooth out overall portfolio performance. We encourage investors to know their investments and to understand that appropriate levels of risk-taking may unlock opportunities.
Thank you for choosing to invest with Wells Fargo Advantage Funds. We appreciate your confidence in us and remain committed to helping you meet your financial needs. For current information about your fund investments, contact your investment professional, visit our website at wellsfargoadvantagefunds.com, or call us directly at 1-800-222-8222. We are available 24 hours a day, 7 days a week.
Sincerely,

Karla M. Rabusch
President
Wells Fargo Advantage Funds
Periods of uncertainty can present challenges, but experience has taught us that maintaining long-term investment goals can be an effective way to plan for the future.
| | | | |
| 4 | | Wells Fargo Advantage Allocation Funds | | Performance highlights (unaudited) |
Wells Fargo Advantage Growth Balanced Fund1
Investment objective
The Fund seeks total return, consisting of capital appreciation and current income.
Adviser
Wells Fargo Funds Management, LLC
Subadviser
Wells Capital Management Incorporated
Subadvisers for the master portfolios
Artisan Partners Limited Partnership
Cooke & Bieler, L.P.
Galliard Capital Management, Inc.
Golden Capital Management, LLC
LSV Asset Management
Peregrine Capital Management, Inc.
Phocas Financial Corporation
Wells Capital Management Incorporated
Portfolio managers
Thomas C. Biwer, CFA
Erik J. Sens, CFA
Aldo Ceccarelli, CFA
Kandarp R. Acharya, CFA, FRM
Christian L. Chan, CFA
Average annual total returns (%) as of November 30, 2014
| | | | | | | | | | | | | | | | | | | | | | | | | | | | | | | | | | |
| | | | | Including sales charge | | | Excluding sales charge | | | Expense ratios2 (%) | |
| | | Inception date | | 1 year | | | 5 year | | | 10 year | | | 1 year | | | 5 year | | | 10 year | | | Gross | | | Net3 | |
| Class A (WFGBX) | | 10-14-1998 | | | 2.81 | | | | 10.40 | | | | 5.49 | | | | 9.08 | | | | 11.72 | | | | 6.11 | | | | 1.39 | | | | 1.20 | |
| Class B (NVGRX)* | | 10-1-1998 | | | 3.24 | | | | 10.60 | | | | 5.55 | | | | 8.24 | | | | 10.87 | | | | 5.55 | | | | 2.14 | | | | 1.95 | |
| Class C (WFGWX) | | 10-1-1998 | | | 7.27 | | | | 10.88 | | | | 5.32 | | | | 8.27 | | | | 10.88 | | | | 5.32 | | | | 2.14 | | | | 1.95 | |
| Administrator Class (NVGBX) | | 11-11-1994 | | | – | | | | – | | | | – | | | | 9.32 | | | | 12.00 | | | | 6.38 | | | | 1.23 | | | | 0.95 | |
| Growth Balanced Composite Index4 | | – | | | – | | | | – | | | | – | | | | 10.19 | | | | 11.20 | | | | 7.07 | | | | – | | | | – | |
| Barclays U.S. Aggregate Bond Index5 | | – | | | – | | | | – | | | | – | | | | 5.27 | | | | 4.10 | | | | 4.79 | | | | – | | | | – | |
| MSCI EAFE Index (Net)6 | | – | | | – | | | | – | | | | – | | | | (0.02 | ) | | | 6.38 | | | | 5.25 | | | | – | | | | – | |
| Russell 1000® Growth Index7 | | – | | | – | | | | – | | | | – | | | | 17.50 | | | | 16.77 | | | | 9.02 | | | | – | | | | – | |
| Russell 1000® Value Index8 | | – | | | – | | | | – | | | | – | | | | 15.62 | | | | 15.69 | | | | 7.59 | | | | – | | | | – | |
| Russell 2000® Index9 | | – | | | – | | | | – | | | | – | | | | 3.99 | | | | 16.69 | | | | 7.78 | | | | – | | | | – | |
| S&P 500 Index10 | | – | | | – | | | | – | | | | – | | | | 16.86 | | | | 15.96 | | | | 8.06 | | | | – | | | | – | |
| * | | Class B shares are closed to investment, except in connection with the reinvestment of any distributions and permitted exchanges. |
Figures quoted represent past performance, which is no guarantee of future results, and do not reflect taxes that a shareholder may pay on fund distributions or the redemption of fund shares. Investment return and principal value of an investment will fluctuate so that an investor’s shares, when redeemed, may be worth more or less than their original cost. Performance shown without sales charges would be lower if sales charges were reflected. Current performance may be lower or higher than the performance data quoted, which assumes the reinvestment of dividends and capital gains. Current month-end performance is available on the Fund’s website, wellsfargoadvantagefunds.com.
Index returns do not include transaction costs associated with buying and selling securities, any mutual fund fees or expenses, or any taxes. It is not possible to invest directly in an index.
For Class A shares, the maximum front-end sales charge is 5.75%. For Class B shares, the maximum contingent deferred sales charge is 5.00%. For Class C shares, the maximum contingent deferred sales charge is 1.00%. Performance including a contingent deferred sales charge assumes the sales charge for the corresponding time period. Administrator Class shares are sold without a front-end sales charge or contingent deferred sales charge.
Balanced funds may invest in stocks and bonds. Stock values fluctuate in response to the activities of individual companies and general market and economic conditions. Bond values fluctuate in response to the financial condition of individual issuers, general market and economic conditions, and changes in interest rates. Changes in market conditions and government policies may lead to periods of heightened volatility in the bond market and reduced liquidity for certain bonds held by the Fund. In general, when interest rates rise, bond values fall and investors may lose principal value. Interest rate changes and their impact on the Fund and its share price can be sudden and unpredictable. The use of derivatives may reduce returns and/or increase volatility. Certain investment strategies tend to increase the total risk of an investment (relative to the broader market). This Fund is exposed to mortgage- and asset-backed securities risk, and smaller-company securities risk. Consult the Fund’s prospectus for additional information on these and other risks.
Please see footnotes on page 5.
| | | | | | |
| Performance highlights (unaudited) | | Wells Fargo Advantage Allocation Funds | | | 5 | |
Wells Fargo Advantage Growth Balanced Fund (continued)
| | | | |
| Ten largest long-term holdings11 (%) as of November 30, 2014 | |
Apple Incorporated | | | 1.42 | |
Facebook Incorporated Class A | | | 0.63 | |
JPMorgan Chase & Company | | | 0.63 | |
Exxon Mobil Corporation | | | 0.61 | |
U.S. Treasury Bond, 4.25%, 11-15-2040 | | | 0.55 | |
FNMA Series 2002 W4 Class A4, 6.25%, 5-25-2042 | | | 0.54 | |
FNMA, 3.50%, 9-1-2032 | | | 0.53 | |
Johnson & Johnson | | | 0.52 | |
Bank of America Corporation | | | 0.50 | |
American Express Company | | | 0.49 | |
|
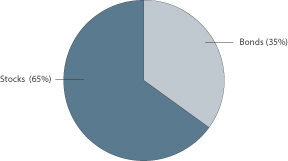
| Neutral target allocation12 as of November 30, 2014 |
|
 |
|
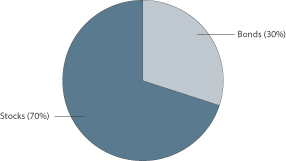
| Current target allocation12 as of November 30, 2014 |
|
 |
| 1. | The Fund is a gateway blended fund that invests all of its assets in two or more affiliated master portfolios of the Wells Fargo Master Trust (the “Master Trust”) in varying proportions. References to the investment activities of the Fund are intended to refer to the investment activities of the affiliated master portfolios in which it invests. See Notes to Financial Statements for a discussion of the Master Trust. |
| 2. | Reflects the expense ratios as stated in the most recent prospectuses. The expense ratios shown are subject to change and may differ from the annualized expense ratios shown in the financial highlights of this report. |
| 3. | The Adviser has committed through September 30, 2015, to waive fees and/or reimburse expenses to the extent necessary to cap the Fund’s Total Annual Fund Operating Expenses After Fee Waiver, excluding certain expenses, at the amounts shown. After this time, the cap may be increased or the commitment to maintain the cap may be terminated only with the approval of the Board of Trustees. Brokerage commissions, stamp duty fees, interest, taxes, acquired fund fees and expenses, and extraordinary expenses are excluded from the cap. Fees from the affiliated master portfolios are included in the cap. Without this cap, the Fund’s returns would have been lower. |
| 4. | Source: Wells Fargo Funds Management, LLC. The Growth Balanced Composite Index is weighted 35% in the Barclays U.S. Aggregate Bond Index, 16.25% in the Russell 1000® Value Index, 16.25% in the S&P 500 Index, 16.25% in the Russell 1000® Growth Index, 9.75% in the MSCI EAFE Index (Net), and 6.50% in the Russell 2000® Index. You cannot invest directly in an index. |
| 5. | The Barclays U.S. Aggregate Bond Index is a broad-based benchmark that measures the investment-grade, U.S. dollar-denominated, fixed-rate taxable bond market, including Treasuries, government-related and corporate securities, MBS (agency fixed-rate and hybrid ARM passthroughs), ABS, and CMBS. You cannot invest directly in an index. |
| 6. | The Morgan Stanley Capital International Europe, Australasia, and Far East (MSCI EAFE) Index (Net) is an unmanaged group of securities widely regarded by investors to be representations of the stock markets of Europe, Australasia, and the Far East. Calculations for EAFE use net dividends, which reflect the deduction of withholding taxes. You cannot invest directly in an index. Source: MSCI. MSCI makes no express or implied warranties or representations and shall have no liability whatsoever with respect to any MSCI data contained herein. The MSCI data may not be further redistributed or used as a basis for other indexes or any securities or financial products. This report is not approved, reviewed, or produced by MSCI. |
| 7. | The Russell 1000® Growth Index measures the performance of those Russell 1000 companies with higher price-to-book ratios and higher forecasted growth values. You cannot invest directly in an index. |
| 8. | The Russell 1000® Value Index measures the performance of those Russell 1000 companies with lower price-to-book ratios and lower forecasted growth values. You cannot invest directly in an index. |
| 9. | The Russell 2000® Index measures the performance of the 2,000 smallest companies in the Russell 3000® Index, which represents approximately 8% of the total market capitalization of the Russell 3000 Index. You cannot invest directly in an index. |
| 10. | The S&P 500 Index consists of 500 stocks chosen for market size, liquidity, and industry group representation. It is a market-value-weighted index with each stock’s weight in the index proportionate to its market value. You cannot invest directly in an index. |
| 11. | The ten largest long-term holdings are calculated based on the value of the securities of the affiliated master portfolios allocable to the Fund divided by the total net assets of the Fund. Holdings are subject to change and may have changed since the date specified. |
| 12. | Target allocations are subject to change. Cash and cash equivalents are not reflected in the calculations of target allocations. Neutral target allocation is the target allocation of the Fund as stated in the Fund’s prospectus. Current target allocation is the current allocation of the Fund based on the Tactical Asset Allocation (TAA) Model as of the date specified. |
| | | | |
| 6 | | Wells Fargo Advantage Allocation Funds | | Performance highlights (unaudited) |
Wells Fargo Advantage Moderate Balanced Fund1
Investment objective
The Fund seeks total return, consisting of current income and capital appreciation.
Adviser
Wells Fargo Funds Management, LLC
Subadviser
Wells Capital Management Incorporated
Subadvisers for the master portfolios
Artisan Partners Limited Partnership
Cooke & Bieler, L.P.
Galliard Capital Management, Inc.
Golden Capital Management, LLC
LSV Asset Management
Peregrine Capital Management, Inc.
Phocas Financial Corporation
Wells Capital Management Incorporated
Portfolio managers
Thomas C. Biwer, CFA
Erik J. Sens, CFA
Aldo Ceccarelli, CFA
Kandarp R. Acharya, CFA, FRM
Christian L. Chan, CFA
Average annual total returns (%) as of November 30, 2014
| | | | | | | | | | | | | | | | | | | | | | | | | | | | | | | | | | |
| | | | | Including sales charge | | | Excluding sales charge | | | Expense ratios2 (%) | |
| | | Inception date | | 1 year | | | 5 year | | | 10 year | | | 1 year | | | 5 year | | | 10 year | | | Gross | | | Net3 | |
| Class A (WFMAX) | | 1-30-2004 | | | 1.01 | | | | 7.58 | | | | 4.72 | | | | 7.17 | | | | 8.86 | | | | 5.34 | | | | 1.36 | | | | 1.15 | |
| Class B (WMOBX)* | | 1-30-2004 | | | 1.34 | | | | 7.75 | | | | 4.79 | | | | 6.34 | | | | 8.05 | | | | 4.79 | | | | 2.11 | | | | 1.90 | |
| Class C (WFBCX) | | 1-30-2004 | | | 5.37 | | | | 8.05 | | | | 4.55 | | | | 6.37 | | | | 8.05 | | | | 4.55 | | | | 2.11 | | | | 1.90 | |
| Administrator Class (NVMBX) | | 11-11-1994 | | | – | | | | – | | | | – | | | | 7.41 | | | | 9.13 | | | | 5.60 | | | | 1.20 | | | | 0.90 | |
| Moderate Balanced Composite Index4 | | – | | | – | | | | – | | | | – | | | | 7.52 | | | | 7.93 | | | | 5.89 | | | | – | | | | – | |
| Barclays Short Treasury 9–12 Months Index5 | | – | | | – | | | | – | | | | – | | | | 0.24 | | | | 0.35 | | | | 2.01 | | | | – | | | | – | |
| Barclays U.S. Aggregate Bond Index6 | | – | | | – | | | | – | | | | – | | | | 5.27 | | | | 4.10 | | | | 4.79 | | | | – | | | | – | |
| MSCI EAFE Index (Net)7 | | – | | | – | | | | – | | | | – | | | | (0.02 | ) | | | 6.38 | | | | 5.25 | | | | – | | | | – | |
| Russell 1000® Growth Index8 | | – | | | – | | | | – | | | | – | | | | 17.50 | | | | 16.77 | | | | 9.02 | | | | – | | | | – | |
| Russell 1000® Value Index9 | | – | | | – | | | | – | | | | – | | | | 15.62 | | | | 15.69 | | | | 7.59 | | | | – | | | | – | |
| Russell 2000® Index10 | | – | | | – | | | | – | | | | – | | | | 3.99 | | | | 16.69 | | | | 7.78 | | | | – | | | | – | |
| S&P 500 Index11 | | – | | | – | | | | – | | | | – | | | | 16.86 | | | | 15.96 | | | | 8.06 | | | | – | | | | – | |
| * | | Class B shares are closed to investment, except in connection with the reinvestment of any distributions and permitted exchanges. |
Figures quoted represent past performance, which is no guarantee of future results, and do not reflect taxes that a shareholder may pay on fund distributions or the redemption of fund shares. Investment return and principal value of an investment will fluctuate so that an investor’s shares, when redeemed, may be worth more or less than their original cost. Performance shown without sales charges would be lower if sales charges were reflected. Current performance may be lower or higher than the performance data quoted, which assumes the reinvestment of dividends and capital gains. Current month-end performance is available on the Fund’s website, wellsfargoadvantagefunds.com.
Index returns do not include transaction costs associated with buying and selling securities, any mutual fund fees or expenses, or any taxes. It is not possible to invest directly in an index.
For Class A shares, the maximum front-end sales charge is 5.75%. For Class B shares, the maximum contingent deferred sales charge is 5.00%. For Class C shares, the maximum contingent deferred sales charge is 1.00%. Performance including a contingent deferred sales charge assumes the sales charge for the corresponding time period. Administrator Class shares are sold without a front-end sales charge or contingent deferred sales charge.
Balanced funds may invest in stocks and bonds. Stock values fluctuate in response to the activities of individual companies and general market and economic conditions. Bond values fluctuate in response to the financial condition of individual issuers, general market and economic conditions, and changes in interest rates. Changes in market conditions and government policies may lead to periods of heightened volatility in the bond market and reduced liquidity for certain bonds held by the Fund. In general, when interest rates rise, bond values fall and investors may lose principal value. Interest rate changes and their impact on the Fund and its share price can be sudden and unpredictable. The use of derivatives may reduce returns and/or increase volatility. Certain investment strategies tend to increase the total risk of an investment (relative to the broader market). The Fund is exposed to mortgage- and asset-backed securities risk. Consult the Fund’s prospectus for additional information on these and other risks.
Please see footnotes on page 7.
| | | | | | |
| Performance highlights (unaudited) | | Wells Fargo Advantage Allocation Funds | | | 7 | |
Wells Fargo Advantage Moderate Balanced Fund (continued)
| | | | |
| Ten largest long-term holdings12 (%) as of November 30, 2014 | |
FHLMC Structured Pass-Through Securities Series T-58 Class 4A, 7.50%, 9-25-2043 | | | 0.92 | |
Apple Incorporated | | | 0.88 | |
U.S. Treasury Bond, 4.25%, 11-15-2040 | | | 0.73 | |
FNMA Series 2002-W4 Class A4, 6.25%, 5-25-2042 | | | 0.70 | |
FNMA, 3.50%, 9-1-2032 | | | 0.70 | |
FNMA Series 2006-M2 Class A2F, 5.26%, 5-25-2020 | | | 0.55 | |
FHLMC Structured Pass-Through Securities
Series T-55 Class 1A2, 7.00%, 3-25-2043 | | | 0.44 | |
FNMA Series 2004-T3 Class A1, 6.00%, 2-25-2044 | | | 0.43 | |
FNMA Series 2004-W11 Class 1A3, 7.00%, 5-25-2044 | | | 0.42 | |
U.S. Treasury Note, 0.88%, 8-15-2017 | | | 0.42 | |
|
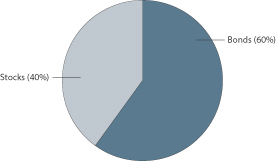
| Neutral target allocation13 as of November 30, 2014 |
|
 |
|
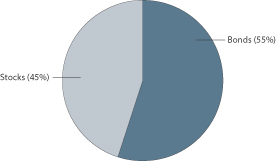
| Current target allocation13 as of November 30, 2014 |
|
 |
| 1. | The Fund is a gateway blended fund that invests all of its assets in two or more affiliated master portfolios of the Wells Fargo Master Trust (the “Master Trust”) in varying proportions. References to the investment activities of the Fund are intended to refer to the investment activities of the affiliated master portfolios in which it invests. See Notes to Financial Statements for a discussion of the Master Trust. |
| 2. | Reflects the expense ratios as stated in the most recent prospectuses. The expense ratios shown are subject to change and may differ from the annualized expense ratios shown in the financial highlights of this report. |
| 3. | The Adviser has committed through September 30, 2015, to waive fees and/or reimburse expenses to the extent necessary to cap the Fund’s Total Annual Fund Operating Expenses After Fee Waiver, excluding certain expenses, at the amounts shown. After this time, the cap may be increased or the commitment to maintain the cap may be terminated only with the approval of the Board of Trustees. Brokerage commissions, stamp duty fees, interest, taxes, acquired fund fees and expenses, and extraordinary expenses are excluded from the cap. Fees from the affiliated master portfolios are included in the cap. Without this cap, the Fund’s returns would have been lower. |
| 4. | Source: Wells Fargo Funds Management, LLC. The Moderate Balanced Composite Index is weighted 45% in the Barclays U.S. Aggregate Bond Index, 15% in the Barclays Short Treasury: 9-12 Months Index, 10% in the Russell 2000® Index, 10% in the S&P 500 Index, 10% in the Russell 1000® Growth Index, 6% in the MSCI EAFE Index (Net), and 4% in the Russell 2000® Index. You cannot invest directly in an index. |
| 5. | The Barclays U.S. Short Treasury: 9–12 Months Index is an unmanaged index that includes aged U.S. Treasury bills, notes, and bonds with a remaining maturity from 9 up to (but not including) 12 months. It excludes zero-coupon STRIPS. You cannot invest directly in an index. |
| 6. | The Barclays U.S. Aggregate Bond Index is a broad-based benchmark that measures the investment-grade, U.S. dollar-denominated, fixed-rate taxable bond market, including Treasuries, government-related and corporate securities, MBS (agency fixed-rate and hybrid ARM passthroughs), ABS, and CMBS. You cannot invest directly in an index. |
| 7. | The Morgan Stanley Capital International Europe, Australasia, and Far East (MSCI EAFE) Index (Net) is an unmanaged group of securities widely regarded by investors to be representations of the stock markets of Europe, Australasia, and the Far East. Calculations for EAFE use net dividends, which reflect the deduction of withholding taxes. You cannot invest directly in an index. Source: MSCI. MSCI makes no express or implied warranties or representations and shall have no liability whatsoever with respect to any MSCI data contained herein. The MSCI data may not be further redistributed or used as a basis for other indexes or any securities or financial products. This report is not approved, reviewed, or produced by MSCI. |
| 8. | The Russell 1000® Growth Index measures the performance of those Russell 1000 companies with higher price-to-book ratios and higher forecasted growth values. You cannot invest directly in an index. |
| 9. | The Russell 1000® Value Index measures the performance of those Russell 1000 companies with lower price-to-book ratios and lower forecasted growth values. You cannot invest directly in an index. |
| 10. | The Russell 2000® Index measures the performance of the 2,000 smallest companies in the Russell 3000® Index, which represents approximately 8% of the total market capitalization of the Russell 3000 Index. You cannot invest directly in an index. |
| 11. | The S&P 500 Index consists of 500 stocks chosen for market size, liquidity, and industry group representation. It is a market-value-weighted index with each stock’s weight in the index proportionate to its market value. You cannot invest directly in an index. |
| 12. | The ten largest long-term holdings are calculated based on the value of the securities of the affiliated master portfolios allocable to the Fund divided by the total net assets of the Fund. Holdings are subject to change and may have changed since the date specified. |
| 13. | Target allocations are subject to change. Cash and cash equivalents are not reflected in the calculations of target allocations. Neutral target allocation is the target allocation of the Fund as stated in the Fund’s prospectus. Current target allocation is the current allocation of the Fund based on our Tactical Asset Allocation (TAA) Model as of the date specified. |
| | | | |
| 8 | | Wells Fargo Advantage Allocation Funds | | Fund expenses (unaudited) |
As a shareholder of the Fund, you incur two types of costs: (1) transaction costs, including sales charges (loads) on purchase payments and contingent deferred sales charges (if any) on redemptions and (2) ongoing costs, including management fees, distribution (12b-1) and/or shareholder service fees, and other Fund expenses. This example is intended to help you understand your ongoing costs (in dollars) of investing in the Fund and to compare these costs with the ongoing costs of investing in other mutual funds.
The example is based on an investment of $1,000 invested at the beginning of the six-month period and held for the entire period from June 1, 2014 to November 30, 2014.
Actual expenses
The “Actual” line of the table below provides information about actual account values and actual expenses. You may use the information in this line, together with the amount you invested, to estimate the expenses that you paid over the period. Simply divide your account value by $1,000 (for example, an $8,600 account value divided by $1,000 = 8.6), then multiply the result by the number in the “Actual” line under the heading entitled “Expenses paid during period” for your applicable class of shares to estimate the expenses you paid on your account during this period.
Hypothetical example for comparison purposes
The “Hypothetical” line of the table below provides information about hypothetical account values and hypothetical expenses based on the Fund’s actual expense ratio and an assumed rate of return of 5% per year before expenses, which is not the Fund’s actual return. The hypothetical account values and expenses may not be used to estimate the actual ending account balance or expenses you paid for the period. You may use this information to compare the ongoing costs of investing in the Fund and other funds. To do so, compare this 5% hypothetical example with the 5% hypothetical examples that appear in the shareholder reports of the other funds.
Please note that the expenses shown in the table are meant to highlight your ongoing costs only and do not reflect any transactional costs, such as sales charges (loads) and contingent deferred sales charges. Therefore, the “Hypothetical” line of the table is useful in comparing ongoing costs only and will not help you determine the relative total costs of owning different funds. In addition, if these transactional costs were included, your costs would have been higher.
| | | | | | | | | | | | | | | | |
| Wells Fargo Advantage Growth Balanced Fund | | Beginning
account value
6-1-2014 | | | Ending
account value
11-30-2014 | | | Expenses
paid during
the period¹ | | | Net annualized
expense ratio | |
Class A | | | | | | | | | | | | | | | | |
Actual | | $ | 1,000.00 | | | $ | 1,045.84 | | | $ | 6.15 | | | | 1.20 | % |
Hypothetical (5% return before expenses) | | $ | 1,000.00 | | | $ | 1,019.05 | | | $ | 6.07 | | | | 1.20 | % |
Class B | | | | | | | | | | | | | | | | |
Actual | | $ | 1,000.00 | | | $ | 1,041.80 | | | $ | 9.98 | | | | 1.95 | % |
Hypothetical (5% return before expenses) | | $ | 1,000.00 | | | $ | 1,015.29 | | | $ | 9.85 | | | | 1.95 | % |
Class C | | | | | | | | | | | | | | | | |
Actual | | $ | 1,000.00 | | | $ | 1,042.00 | | | $ | 9.98 | | | | 1.95 | % |
Hypothetical (5% return before expenses) | | $ | 1,000.00 | | | $ | 1,015.29 | | | $ | 9.85 | | | | 1.95 | % |
Administrator Class | | | | | | | | | | | | | | | | |
Actual | | $ | 1,000.00 | | | $ | 1,046.79 | | | $ | 4.87 | | | | 0.95 | % |
Hypothetical (5% return before expenses) | | $ | 1,000.00 | | | $ | 1,020.31 | | | $ | 4.81 | | | | 0.95 | % |
| Wells Fargo Advantage Moderate Balanced Fund | | | | | | | | | | | | |
Class A | | | | | | | | | | | | | | | | |
Actual | | $ | 1,000.00 | | | $ | 1,034.07 | | | $ | 5.86 | | | | 1.15 | % |
Hypothetical (5% return before expenses) | | $ | 1,000.00 | | | $ | 1,019.30 | | | $ | 5.82 | | | | 1.15 | % |
Class B | | | | | | | | | | | | | | | | |
Actual | | $ | 1,000.00 | | | $ | 1,030.22 | | | $ | 9.67 | | | | 1.90 | % |
Hypothetical (5% return before expenses) | | $ | 1,000.00 | | | $ | 1,015.54 | | | $ | 9.60 | | | | 1.90 | % |
Class C | | | | | | | | | | | | | | | | |
Actual | | $ | 1,000.00 | | | $ | 1,029.84 | | | $ | 9.67 | | | | 1.90 | % |
Hypothetical (5% return before expenses) | | $ | 1,000.00 | | | $ | 1,015.54 | | | $ | 9.60 | | | | 1.90 | % |
Administrator Class | | | | | | | | | | | | | | | | |
Actual | | $ | 1,000.00 | | | $ | 1,035.50 | | | $ | 4.59 | | | | 0.90 | % |
Hypothetical (5% return before expenses) | | $ | 1,000.00 | | | $ | 1,020.56 | | | $ | 4.56 | | | | 0.90 | % |
| 1. | Expenses paid is equal to the annualized expense ratio of each class multiplied by the average account value over the period, multiplied by the number of days in the most recent fiscal half-year divided by the number of days in the fiscal year (to reflect the one-half-year period). |
| | | | | | |
| Portfolio of investments—November 30, 2014 (unaudited) | | Wells Fargo Advantage Allocation Funds | | | 9 | |
GROWTH BALANCED FUND
| | | | | | | | | | | | | | | | | | |
| Security name | | | | | | | | | | | | | Value | |
| | | | | |
Investment Companies: 99.53% | | | | | | | | | | | | | | | | | | |
| | | | | |
| Affiliated Master Portfolios: 99.53% | | | | | | | | | | | | | | | | | | |
Wells Fargo Advantage C&B Large Cap Value Portfolio | | | | | | | | | | | | | | | | $ | 13,978,816 | |
Wells Fargo Advantage Core Bond Portfolio | | | | | | | | | | | | | | | | | 17,329,092 | |
Wells Fargo Advantage Diversified Large Cap Growth Portfolio | | | | | | | | | | | | | | | | | 41,963,301 | |
Wells Fargo Advantage Emerging Growth Portfolio | | | | | | | | | | | | | | | | | 4,174,204 | |
Wells Fargo Advantage Index Portfolio | | | | | | | | | | | | | | | | | 41,898,638 | |
Wells Fargo Advantage International Growth Portfolio | | | | | | | | | | | | | | | | | 12,561,468 | |
Wells Fargo Advantage International Value Portfolio | | | | | | | | | | | | | | | | | 11,882,416 | |
Wells Fargo Advantage Large Company Value Portfolio | | | | | | | | | | | | | | | | | 27,704,476 | |
Wells Fargo Advantage Managed Fixed Income Portfolio | | | | | | | | | | | | | | | | | 60,671,936 | |
Wells Fargo Advantage Real Return Portfolio | | | | | | | | | | | | | | | | | 8,654,899 | |
Wells Fargo Advantage Small Company Growth Portfolio | | | | | | | | | | | | | | | | | 4,119,429 | |
Wells Fargo Advantage Small Company Value Portfolio | | | | | | | | | | | | | | | | | 8,183,087 | |
| | | | | |
Total Investment Companies (Cost $214,493,934) | | | | | | | | | | | | | | | | | 253,121,762 | |
| | | | | | | | | | | | | | | | | | |
| | | | | |
| | | | | Yield | | | Maturity date | | | Principal | | | | |
| | | | | |
Short-Term Investments: 0.51% | | | | | | | | | | | | | | | | | | |
| | | | | |
| U.S. Treasury Securities: 0.51% | | | | | | | | | | | | | | | | | | |
U.S. Treasury Bill #(z) | | | | | 0.02 | % | | | 12-4-2014 | | | $ | 420,000 | | | | 419,999 | |
U.S. Treasury Bill #(z) | | | | | 0.02 | | | | 12-11-2014 | | | | 870,000 | | | | 869,995 | |
| | | | | |
Total Short-Term Investments (Cost $1,289,994) | | | | | | | | | | | | | | | | | 1,289,994 | |
| | | | | | | | | | | | | | | | | | |
| | | | | | | | |
| Total investments in securities (Cost $215,783,928) * | | | 100.04 | % | | | 254,411,756 | |
Other assets and liabilities, net | | | (0.04 | ) | | | (103,321 | ) |
| | | | | | | | |
| Total net assets | | | 100.00 | % | | $ | 254,308,435 | |
| | | | | | | | |
| # | All or a portion of this security is segregated as collateral for investments in derivative instruments. |
| (z) | Zero coupon security. The rate represents the current yield to maturity. |
| * | Cost for federal income tax purposes is $216,728,230 and unrealized gains (losses) consists of: |
| | | | |
Gross unrealized gains | | $ | 37,683,526 | |
Gross unrealized losses | | | 0 | |
| | | | |
Net unrealized gains | | $ | 37,683,526 | |
The accompanying notes are an integral part of these financial statements.
| | | | |
| 10 | | Wells Fargo Advantage Allocation Funds | | Portfolio of investments—November 30, 2014 (unaudited) |
MODERATE BALANCED FUND
| | | | | | | | | | | | | | | | | | |
| Security name | | | | | | | | | | | | | Value | |
| | | | | |
Investment Companies: 99.49% | | | | | | | | | | | | | | | | | | |
| | | | | |
| Affiliated Master Portfolios: 99.49% | | | | | | | | | | | | | | | | | | |
Wells Fargo Advantage C&B Large Cap Value Portfolio | | | | | | | | | | | | | | | | $ | 5,838,603 | |
Wells Fargo Advantage Core Bond Portfolio | | | | | | | | | | | | | | | | | 15,309,634 | |
Wells Fargo Advantage Diversified Large Cap Growth Portfolio | | | | | | | | | | | | | | | | | 17,471,151 | |
Wells Fargo Advantage Emerging Growth Portfolio | | | | | | | | | | | | | | | | | 1,710,762 | |
Wells Fargo Advantage Index Portfolio | | | | | | | | | | | | | | | | | 17,449,921 | |
Wells Fargo Advantage International Growth Portfolio | | | | | | | | | | | | | | | | | 5,272,142 | |
Wells Fargo Advantage International Value Portfolio | | | | | | | | | | | | | | | | | 5,044,709 | |
Wells Fargo Advantage Large Company Value Portfolio | | | | | | | | | | | | | | | | | 11,566,901 | |
Wells Fargo Advantage Managed Fixed Income Portfolio | | | | | | | | | | | | | | | | | 53,586,889 | |
Wells Fargo Advantage Real Return Portfolio | | | | | | | | | | | | | | | | | 7,662,398 | |
Wells Fargo Advantage Small Company Growth Portfolio | | | | | | | | | | | | | | | | | 1,726,291 | |
Wells Fargo Advantage Small Company Value Portfolio | | | | | | | | | | | | | | | | | 3,389,909 | |
Wells Fargo Advantage Stable Income Portfolio | | | | | | | | | | | | | | | | | 25,378,474 | |
| | | | | |
Total Investment Companies (Cost $155,084,202) | | | | | | | | | | | | | | | | | 171,407,784 | |
| | | | | | | | | | | | | | | | | | |
| | | | | |
| | | | | Yield | | | Maturity date | | | Principal | | | | |
| | | | | |
Short-Term Investments: 0.50% | | | | | | | | | | | | | | | | | | |
| | | | | |
| U.S. Treasury Securities: 0.50% | | | | | | | | | | | | | | | | | | |
U.S. Treasury Bill #(z) | | | | | 0.02 | % | | | 12-11-2014 | | | $ | 570,000 | | | | 569,997 | |
U.S. Treasury Bill #(z) | | | | | 0.03 | | | | 12-4-2014 | | | | 290,000 | | | | 289,999 | |
| | | | | |
Total Short-Term Investments (Cost $859,996) | | | | | | | | | | | | | | | | | 859,996 | |
| | | | | | | | | | | | | | | | | | |
| | | | | | | | |
| Total investments in securities (Cost $155,944,198) * | | | 99.99 | % | | | 172,267,780 | |
Other assets and liabilities, net | | | 0.01 | | | | 11,981 | |
| | | | | | | | |
| Total net assets | | | 100.00 | % | | $ | 172,279,761 | |
| | | | | | | | |
| # | All or a portion of this security is segregated as collateral for investments in derivative instruments. |
| (z) | Zero coupon security. The rate represents the current yield to maturity. |
| * | Cost for federal income tax purposes is $155,112,410 and unrealized gains (losses) consists of: |
| | | | |
Gross unrealized gains | | $ | 17,155,370 | |
Gross unrealized losses | | | 0 | |
| | | | |
Net unrealized gains | | $ | 17,155,370 | |
The accompanying notes are an integral part of these financial statements.
| | | | | | |
| Statements of assets and liabilities—November 30, 2014 (unaudited) | | Wells Fargo Advantage Allocation Funds | | | 11 | |
| | | | | | | | |
| | | Growth
Balanced Fund | | | Moderate
Balanced Fund | |
| | |
Assets | | | | | | | | |
Investments | | | | | | | | |
In affiliated Master Portfolios, at value (see cost below) | | $ | 253,121,762 | | | $ | 171,407,784 | |
In unaffiliated securities, at value (see cost below) | | | 1,289,994 | | | | 859,996 | |
| | | | |
Total investments, at value (see cost below) | | | 254,411,756 | | | | 172,267,780 | |
Receivable for Fund shares sold | | | 148,779 | | | | 153,638 | |
Prepaid expenses and other assets | | | 38,364 | | | | 25,876 | |
| | | | |
Total assets | | | 254,598,899 | | | | 172,447,294 | |
| | | | |
| | |
Liabilities | | | | | | | | |
Payable for Fund shares redeemed
| | | 75,830 | | | | 26,313 | |
Payable for daily variation margin on open futures contracts | | | 91,000 | | | | 63,000 | |
Distribution fees payable | | | 8,390 | | | | 3,207 | |
Administration fees payable | | | 39,334 | | | | 19,767 | |
Shareholder report expenses payable | | | 14,011 | | | | 11,330 | |
Shareholder servicing fees payable | | | 51,728 | | | | 35,109 | |
Accrued expenses and other liabilities | | | 10,171 | | | | 8,807 | |
| | | | |
Total liabilities | | | 290,464 | | | | 167,533 | |
| | | | |
Total net assets | | $ | 254,308,435 | | | $ | 172,279,761 | |
| | | | |
| | |
NET ASSETS CONSIST OF | | | | | | | | |
Paid-in capital | | $ | 366,376,302 | | | $ | 147,886,545 | |
Undistributed net investment income | | | 2,412,552 | | | | 3,473,186 | |
Accumulated net realized gains (losses) on investments | | | (153,878,367 | ) | | | 4,053,773 | |
Net unrealized gains on investments | | | 39,397,948 | | | | 16,866,257 | |
| | | | |
Total net assets | | $ | 254,308,435 | | | $ | 172,279,761 | |
| | | | |
| | |
COMPUTATION OF NET ASSET VALUE AND OFFERING PRICE PER SHARE | | | | | | | | |
Net assets – Class A | | $ | 63,676,829 | | | $ | 19,262,556 | |
Shares outstanding – Class A1 | | | 1,603,907 | | | | 803,394 | |
Net asset value per share – Class A | | | $39.70 | | | | $23.98 | |
Maximum offering price per share – Class A2 | | | $42.12 | | | | $25.44 | |
Net assets – Class B | | $ | 288,424 | | | $ | 235,219 | |
Shares outstanding – Class B1 | | | 8,149 | | | | 9,860 | |
Net asset value per share – Class B | | | $35.39 | | | | $23.86 | |
Net assets – Class C | | $ | 13,463,591 | | | $ | 5,081,686 | |
Shares outstanding – Class C1 | | | 387,668 | | | | 216,500 | |
Net asset value per share – Class C | | | $34.73 | | | | $23.47 | |
Net assets – Administrator Class | | $ | 176,879,591 | | | $ | 147,700,300 | |
Shares outstanding – Administrator Class1 | | | 4,971,945 | | | | 6,100,921 | |
Net asset value per share – Administrator Class | | | $35.58 | | | | $24.21 | |
| | |
Investments in affiliated Master Portfolios, at cost | | $ | 214,493,934 | | | $ | 155,084,202 | |
| | | | |
Investments in unaffiliated securities, at cost | | $ | 1,289,994 | | | $ | 859,996 | |
| | | | |
Total investments, at cost | | $ | 215,783,928 | | | $ | 155,944,198 | |
| | | | |
| 1. | Each Fund has an unlimited number of authorized shares. |
| 2. | Maximum offering price is computed as 100/94.25 of net asset value. On investments of $50,000 or more, the offering price is reduced. |
The accompanying notes are an integral part of these financial statements.
| | | | |
| 12 | | Wells Fargo Advantage Allocation Funds | | Statements of operations—six months ended November 30, 2014 (unaudited) |
| | | | | | | | |
| | | Growth
Balanced Fund | | | Moderate
Balanced Fund | |
| | |
Investment income | | | | | | | | |
Interest allocated from affiliated Master Portfolios** | | $ | 1,385,894 | | | $ | 1,409,241 | |
Dividends allocated from affiliated Master Portfolios* | | | 1,228,763 | | | | 510,549 | |
Securities lending income allocated from affiliated Master Portfolios | | | 16,679 | | | | 7,527 | |
Interest | | | 105 | | | | 70 | |
Expenses allocated from affiliated Master Portfolios | | | (696,170 | ) | | | (460,415 | ) |
Waivers allocated from affiliated Master Portfolios | | | 54,598 | | | | 67,135 | |
| | | | |
Total investment income | | | 1,989,869 | | | | 1,534,107 | |
| | | | |
| | |
Expenses | | | | | | | | |
Advisory fee | | | 312,390 | | | | 210,584 | |
Administration fees | | | | | | | | |
Fund level | | | 62,478 | | | | 42,117 | |
Class A | | | 80,048 | | | | 24,253 | |
Class B | | | 496 | | | | 349 | |
Class C | | | 16,808 | | | | 6,284 | |
Administrator Class | | | 87,513 | | | | 72,355 | |
Shareholder servicing fees | | | | | | | | |
Class A | | | 76,969 | | | | 23,321 | |
Class B | | | 477 | | | | 335 | |
Class C | | | 16,162 | | | | 6,041 | |
Administrator Class | | | 218,566 | | | | 180,887 | |
Distribution fees | | | | | | | | |
Class B | | | 1,432 | | | | 1,006 | |
Class C | | | 48,485 | | | | 18,128 | |
Custody and accounting fees | | | 5,186 | | | | 3,728 | |
Professional fees | | | 14,713 | | | | 15,244 | |
Registration fees | | | 25,578 | | | | 23,541 | |
Shareholder report expenses | | | 33,888 | | | | 17,098 | |
Trustees’ fees and expenses | | | 6,423 | | | | 5,537 | |
Other fees and expenses | | | 5,110 | | | | 5,254 | |
| | | | |
Total expenses | | | 1,012,722 | | | | 656,062 | |
Less: Fee waivers and/or expense reimbursements | | | (323,687 | ) | | | (242,406 | ) |
| | | | |
Net expenses | | | 689,035 | | | | 413,656 | |
| | | | |
Net investment income | | | 1,300,834 | | | | 1,120,451 | |
| | | | |
| | |
REALIZED AND UNREALIZED GAINS (LOSSES) ON INVESTMENTS | | | | | | | | |
| | |
Net realized gains on: | | | | | | | | |
Securities transactions allocated from affiliated Master Portfolios | | | 6,126,830 | | | | 2,828,494 | |
Futures transactions | | | 786,354 | | | | 507,024 | |
| | | | |
Net realized gains on investments | | | 6,913,184 | | | | 3,335,518 | |
| | | | |
| | |
Net change in unrealized gains (losses) on: | | | | | | | | |
Securities transactions allocated from affiliated Master Portfolios | | | 2,768,405 | | | | 1,135,700 | |
Futures transactions | | | 313,666 | | | | 246,014 | |
| | | | |
Net change in unrealized gains (losses) on investments | | | 3,082,071 | | | | 1,381,714 | |
| | | | |
Net realized and unrealized gains (losses) on investments | | | 9,995,255 | | | | 4,717,232 | |
| | | | |
Net increase in net assets resulting from operations | | $ | 11,296,089 | | | $ | 5,837,683 | |
| | | | |
| | |
** Net of foreign interest withholding taxes allocated from affiliated Master Portfolios in the amount of | | | $638 | | | | $560 | |
* Net of foreign dividend withholding taxes allocated from affiliated Master Portfolios in the amount of | | | $30,842 | | | | $12,733 | |
The accompanying notes are an integral part of these financial statements.
| | | | | | |
| Statements of changes in net assets | | Wells Fargo Advantage Allocation Funds | | | 13 | |
| | | | | | | | | | | | | | | | |
| | | Growth Balanced Fund | |
| | | Six months ended November 30, 2014
(unaudited) | | | Year ended May 31, 2014 | |
| | | | |
Operations | | | | | | | | | | | | | | | | |
Net investment income | | | | | | $ | 1,300,834 | | | | | | | $ | 2,929,153 | |
Net realized gains on investments | | | | | | | 6,913,184 | | | | | | | | 15,766,495 | |
Net change in unrealized gains (losses) on investments | | | | | | | 3,082,071 | | | | | | | | 15,973,472 | |
| | | | |
Net increase in net assets resulting from operations | | | | | | | 11,296,089 | | | | | | | | 34,669,120 | |
| | | | |
| | | | |
Distributions to shareholders from | | | | | | | | | | | | | | | | |
Net investment income | | | | | | | | | | | | | | | | |
Class A | | | | | | | 0 | | | | | | | | (546,500 | ) |
Class B | | | | | | | 0 | | | | | | | | (1,163 | ) |
Class C | | | | | | | 0 | | | | | | | | (55,253 | ) |
Administrator Class | | | | | | | 0 | | | | | | | | (2,226,393 | ) |
| | | | |
Total distributions to shareholders | | | | | | | 0 | | | | | | | | (2,829,309 | ) |
| | | | |
| | | | |
Capital share transactions | | | Shares | | | | | | | | Shares | | | | | |
Proceeds from shares sold | | | | | | | | | | | | | | | | |
Class A | | | 94,960 | | | | 3,656,115 | | | | 194,629 | | | | 6,998,960 | |
Class B | | | 1,549 | | | | 53,164 | | | | 3,979 | | | | 128,300 | |
Class C | | | 34,232 | | | | 1,156,156 | | | | 99,662 | | | | 3,144,748 | |
Administrator Class | | | 228,684 | | | | 7,900,052 | | | | 686,725 | | | | 22,150,590 | |
| | | | |
| | | | | | | 12,765,487 | | | | | | | | 32,422,598 | |
| | | | |
Reinvestment of distributions | | | | | | | | | | | | | | | | |
Class A | | | 0 | | | | 0 | | | | 14,849 | | | | 539,599 | |
Class B | | | 0 | | | | 0 | | | | 35 | | | | 1,141 | |
Class C | | | 0 | | | | 0 | | | | 1,637 | | | | 52,395 | |
Administrator Class | | | 0 | | | | 0 | | | | 67,509 | | | | 2,193,375 | |
| | | | |
| | | | | | | 0 | | | | | | | | 2,786,510 | |
| | | | |
Payment for shares redeemed | | | | | | | | | | | | | | | | |
Class A | | | (100,948 | ) | | | (3,880,078 | ) | | | (271,847 | ) | | | (9,792,448 | ) |
Class B | | | (7,409 | ) | | | (255,364 | ) | | | (22,505 | ) | | | (727,480 | ) |
Class C | | | (25,680 | ) | | | (864,666 | ) | | | (39,648 | ) | | | (1,259,505 | ) |
Administrator Class | | | (410,197 | ) | | | (14,077,311 | ) | | | (1,460,577 | ) | | | (47,159,492 | ) |
| | | | |
| | | | | | | (19,077,419 | ) | | | | | | | (58,938,925 | ) |
| | | | |
Net decrease in net assets resulting from capital share transactions | | | | | | | (6,311,932 | ) | | | | | | | (23,729,817 | ) |
| | | | |
Total increase in net assets | | | | | | | 4,984,157 | | | | | | | | 8,109,994 | |
| | | | |
| | | | |
Net assets | | | | | | | | | | | | | | | | |
Beginning of period | | | | | | | 249,324,278 | | | | | | | | 241,214,284 | |
| | | | |
End of period | | | | | | $ | 254,308,435 | | | | | | | $ | 249,324,278 | |
| | | | |
Undistributed net investment income | | | | | | $ | 2,412,552 | | | | | | | $ | 1,111,718 | |
| | | | |
The accompanying notes are an integral part of these financial statements.
| | | | |
| 14 | | Wells Fargo Advantage Allocation Funds | | Statements of changes in net assets |
| | | | | | | | | | | | | | | | |
| | | Moderate Balanced Fund | |
| | | Six months ended
November 30, 2014
(unaudited) | | | Year ended
May 31, 2014 | |
| | | | |
Operations | | | | | | | | | | | | | | | | |
Net investment income | | | | | | $ | 1,120,451 | | | | | | | $ | 2,438,190 | |
Net realized gains on investments | | | | | | | 3,335,518 | | | | | | | | 6,681,099 | |
Net change in unrealized gains (losses) on investments | | | | | | | 1,381,714 | | | | | | | | 7,084,717 | |
| | | | |
Net increase in net assets resulting from operations | | | | | | | 5,837,683 | | | | | | | | 16,204,006 | |
| | | | |
| | | | |
Distributions to shareholders from | | | | | | | | | | | | | | | | |
Net investment income | | | | | | | | | | | | | | | | |
Class A | | | | | | | 0 | | | | | | | | (97,654 | ) |
Class B | | | | | | | 0 | | | | | | | | (736 | ) |
Class C | | | | | | | 0 | | | | | | | | (14,477 | ) |
Administrator Class | | | | | | | 0 | | | | | | | | (970,104 | ) |
| | | | |
Total distributions to shareholders | | | | | | | 0 | | | | | | | | (1,082,971 | ) |
| | | | |
| | | | |
Capital share transactions | | | Shares | | | | | | | | Shares | | | | | |
Proceeds from shares sold | | | | | | | | | | | | | | | | |
Class A | | | 78,248 | | | | 1,836,614 | | | | 452,763 | | | | 9,968,564 | |
Class B | | | 1,074 | | | | 24,957 | | | | 3,798 | | | | 81,897 | |
Class C | | | 45,631 | | | | 1,047,302 | | | | 83,699 | | | | 1,821,475 | |
Administrator Class | | | 225,847 | | | | 5,340,875 | | | | 814,765 | | | | 18,218,885 | |
| | | | |
| | | | | | | 8,249,748 | | | | | | | | 30,090,821 | |
| | | | |
Reinvestment of distributions | | | | | | | | | | | | | | | | |
Class A | | | 0 | | | | 0 | | | | 4,246 | | | | 94,771 | |
Class B | | | 0 | | | | 0 | | | | 30 | | | | 668 | |
Class C | | | 0 | | | | 0 | | | | 559 | | | | 12,306 | |
Administrator Class | | | 0 | | | | 0 | | | | 42,641 | | | | 958,985 | |
| | | | |
| | | | | | | 0 | | | | | | | | 1,066,730 | |
| | | | |
Payment for shares redeemed | | | | | | | | | | | | | | | | |
Class A | | | (58,431 | ) | | | (1,374,871 | ) | | | (161,021 | ) | | | (3,577,396 | ) |
Class B | | | (7,622 | ) | | | (178,419 | ) | | | (16,252 | ) | | | (358,633 | ) |
Class C | | | (25,283 | ) | | | (580,140 | ) | | | (11,008 | ) | | | (242,512 | ) |
Administrator Class | | | (293,542 | ) | | | (6,940,696 | ) | | | (1,559,569 | ) | | | (35,094,813 | ) |
| | | | |
| | | | | | | (9,074,126 | ) | | | | | | | (39,273,354 | ) |
| | | | |
Net decrease in net assets resulting from capital share transactions | | | | | | | (824,378 | ) | | | | | | | (8,115,803 | ) |
| | | | |
Total increase in net assets | | | | | | | 5,013,305 | | | | | | | | 7,005,232 | |
| | | | |
| | | | |
Net assets | | | | | | | | | | | | | | | | |
Beginning of period | | | | | | | 167,266,456 | | | | | | | | 160,261,224 | |
| | | | |
End of period | | | | | | $ | 172,279,761 | | | | | | | $ | 167,266,456 | |
| | | | |
Undistributed net investment income | | | | | | $ | 3,473,186 | | | | | | | $ | 2,352,735 | |
| | | | |
The accompanying notes are an integral part of these financial statements.
This page is intentionally left blank.
| | | | |
| 16 | | Wells Fargo Advantage Allocation Funds | | Financial highlights |
| | | | | | | | | | | | | | | | | | | | | | | | |
| Growth Balanced Fund | | Beginning
net asset
value per
share | | | Net
investment
income1 | | | Net realized
and unrealized
gains (losses)
on investments | | | Distributions
from net
investment
income | | | Distributions
from net
realized gains | | | Ending
net asset
value per
share | |
Class A | | | | | | | | | | | | | | | | | | | | | | | | |
Six months ended November 30, 2014 (unaudited) | | $ | 37.96 | | | | 0.17 | | | | 1.57 | | | | 0.00 | | | | 0.00 | | | $ | 39.70 | |
Year ended May 31, 2014 | | $ | 33.35 | | | | 0.35 | | | | 4.60 | | | | (0.34 | ) | | | 0.00 | | | $ | 37.96 | |
Year ended May 31, 2013 | | $ | 27.77 | | | | 0.32 | | | | 5.70 | | | | (0.44 | ) | | | 0.00 | | | $ | 33.35 | |
Year ended May 31, 2012 | | $ | 29.34 | | | | 0.39 | 4 | | | (1.73 | ) | | | (0.23 | ) | | | 0.00 | | | $ | 27.77 | |
Year ended May 31, 20115 | | $ | 25.89 | | | | 0.23 | | | | 4.11 | | | | (0.89 | ) | | | 0.00 | | | $ | 29.34 | |
Year ended September 30, 2010 | | $ | 24.12 | | | | 0.40 | 4 | | | 1.75 | | | | (0.38 | ) | | | 0.00 | | | $ | 25.89 | |
Year ended September 30, 2009 | | $ | 25.63 | | | | 0.41 | 4 | | | (1.32 | ) | | | (0.52 | ) | | | (0.08 | ) | | $ | 24.12 | |
Class B | | | | | | | | | | | | | | | | | | | | | | | | |
Six months ended November 30, 2014 (unaudited) | | $ | 33.97 | | | | 0.03 | 4 | | | 1.39 | | | | 0.00 | | | | 0.00 | | | $ | 35.39 | |
Year ended May 31, 2014 | | $ | 29.84 | | | | 0.08 | 4 | | | 4.10 | | | | (0.05 | ) | | | 0.00 | | | $ | 33.97 | |
Year ended May 31, 2013 | | $ | 24.80 | | | | 0.12 | 4 | | | 5.05 | | | | (0.13 | ) | | | 0.00 | | | $ | 29.84 | |
Year ended May 31, 2012 | | $ | 26.17 | | | | 0.15 | 4 | | | (1.52 | ) | | | 0.00 | | | | 0.00 | | | $ | 24.80 | |
Year ended May 31, 20115 | | $ | 23.07 | | | | 0.12 | 4 | | | 3.62 | | | | (0.64 | ) | | | 0.00 | | | $ | 26.17 | |
Year ended September 30, 2010 | | $ | 21.46 | | | | 0.22 | 4 | | | 1.53 | | | | (0.14 | ) | | | 0.00 | | | $ | 23.07 | |
Year ended September 30, 2009 | | $ | 22.70 | | | | 0.22 | 4 | | | (1.13 | ) | | | (0.25 | ) | | | (0.08 | ) | | $ | 21.46 | |
Class C | | | | | | | | | | | | | | | | | | | | | | | | |
Six months ended November 30, 2014 (unaudited) | | $ | 33.33 | | | | 0.03 | 4 | | | 1.37 | | | | 0.00 | | | | 0.00 | | | $ | 34.73 | |
Year ended May 31, 2014 | | $ | 29.38 | | | | 0.10 | 4 | | | 4.00 | | | | (0.15 | ) | | | 0.00 | | | $ | 33.33 | |
Year ended May 31, 2013 | | $ | 24.52 | | | | 0.13 | 4 | | | 4.98 | | | | (0.25 | ) | | | 0.00 | | | $ | 29.38 | |
Year ended May 31, 2012 | | $ | 25.94 | | | | 0.16 | 4 | | | (1.53 | ) | | | (0.05 | ) | | | 0.00 | | | $ | 24.52 | |
Year ended May 31, 20115 | | $ | 22.93 | | | | 0.12 | 4 | | | 3.60 | | | | (0.71 | ) | | | 0.00 | | | $ | 25.94 | |
Year ended September 30, 2010 | | $ | 21.42 | | | | 0.19 | 4 | | | 1.56 | | | | (0.24 | ) | | | 0.00 | | | $ | 22.93 | |
Year ended September 30, 2009 | | $ | 22.77 | | | | 0.23 | 4 | | | (1.17 | ) | | | (0.33 | ) | | | (0.08 | ) | | $ | 21.42 | |
Administrator Class | | | | | | | | | | | | | | | | | | | | | | | | |
Six months ended November 30, 2014 (unaudited) | | $ | 33.98 | | | | 0.23 | | | | 1.37 | | | | 0.00 | | | | 0.00 | | | $ | 35.58 | |
Year ended May 31, 2014 | | $ | 29.89 | | | | 0.41 | 4 | | | 4.10 | | | | (0.42 | ) | | | 0.00 | | | $ | 33.98 | |
Year ended May 31, 2013 | | $ | 24.93 | | | | 0.65 | 4 | | | 4.82 | | | | (0.51 | ) | | | 0.00 | | | $ | 29.89 | |
Year ended May 31, 2012 | | $ | 26.39 | | | | 0.41 | 4 | | | (1.57 | ) | | | (0.30 | ) | | | 0.00 | | | $ | 24.93 | |
Year ended May 31, 20115 | | $ | 23.39 | | | | 0.31 | 4 | | | 3.64 | | | | (0.95 | ) | | | 0.00 | | | $ | 26.39 | |
Year ended September 30, 2010 | | $ | 21.81 | | | | 0.46 | 4 | | | 1.55 | | | | (0.43 | ) | | | 0.00 | | | $ | 23.39 | |
Year ended September 30, 2009 | | $ | 23.29 | | | | 0.41 | 4 | | | (1.21 | ) | | | (0.60 | ) | | | (0.08 | ) | | $ | 21.81 | |
| 1. | Includes net expenses allocated from the affiliated Master Portfolios in which the Fund invests. |
| 2. | Total return calculations do not include any sales charges. Returns for periods of less than one year are not annualized. |
| 3. | Portfolio turnover rate is calculated by aggregating the results of multiplying the Fund’s investment percentage in the respective affiliated Master Portfolio by the corresponding affiliated Master Portfolio’s portfolio turnover rate. |
| 4. | Calculated based upon average shares outstanding |
| 5. | For the eight months ended May 31, 2011. The Fund changed its fiscal year end from September 30 to May 31, effective May 31, 2011. |
The accompanying notes are an integral part of these financial statements.
| | | | | | |
| Financial highlights | | Wells Fargo Advantage Allocation Funds | | | 17 | |
| | | | | | | | | | | | | | | | | | | | | | |
| Ratio to average net assets (annualized) | | | Total
return2 | | | Portfolio
turnover
rate3 | | | Net assets at
end of period
(000s omitted) | |
Net investment
income1 | | | Gross
expenses1 | | | Net
expenses1 | | | | |
| | | | | | | | | | | | | | | | | | | | | | | |
| | 0.91 | % | | | 1.40 | % | | | 1.20 | % | | | 4.58 | % | | | 35 | % | | $ | 63,677 | |
| | 1.05 | % | | | 1.39 | % | | | 1.20 | % | | | 14.87 | % | | | 77 | % | | $ | 61,117 | |
| | 1.23 | % | | | 1.39 | % | | | 1.20 | % | | | 21.85 | % | | | 80 | % | | $ | 55,777 | |
| | 1.40 | % | | | 1.36 | % | | | 1.20 | % | | | (4.53 | )% | | | 107 | % | | $ | 49,403 | |
| | 1.43 | % | | | 1.35 | % | | | 1.20 | % | | | 17.02 | % | | | 70 | % | | $ | 60,055 | |
| | 1.61 | % | | | 1.38 | % | | | 1.20 | % | | | 9.00 | % | | | 94 | % | | $ | 55,284 | |
| | 1.95 | % | | | 1.32 | % | | | 1.20 | % | | | (2.95 | )% | | | 105 | % | | $ | 55,318 | |
| | | | | | | | | | | | | | | | | | | | | | |
| | 0.15 | % | | | 2.14 | % | | | 1.95 | % | | | 4.18 | % | | | 35 | % | | $ | 288 | |
| | 0.25 | % | | | 2.14 | % | | | 1.95 | % | | | 14.00 | % | | | 77 | % | | $ | 476 | |
| | 0.45 | % | | | 2.12 | % | | | 1.95 | % | | | 20.91 | % | | | 80 | % | | $ | 970 | |
| | 0.61 | % | | | 2.10 | % | | | 1.95 | % | | | (5.23 | )% | | | 107 | % | | $ | 1,704 | |
| | 0.62 | % | | | 2.09 | % | | | 1.95 | % | | | 16.43 | % | | | 70 | % | | $ | 4,163 | |
| | 0.96 | % | | | 2.12 | % | | | 1.95 | % | | | 8.19 | % | | | 94 | % | | $ | 6,924 | |
| | 1.21 | % | | | 2.08 | % | | | 1.95 | % | | | (3.66 | )% | | | 105 | % | | $ | 13,869 | |
| | | | | | | | | | | | | | | | | | | | | | |
| | 0.16 | % | | | 2.14 | % | | | 1.95 | % | | | 4.20 | % | | | 35 | % | | $ | 13,464 | |
| | 0.31 | % | | | 2.14 | % | | | 1.95 | % | | | 13.99 | % | | | 77 | % | | $ | 12,637 | |
| | 0.48 | % | | | 2.14 | % | | | 1.95 | % | | | 20.97 | % | | | 80 | % | | $ | 9,326 | |
| | 0.65 | % | | | 2.11 | % | | | 1.95 | % | | | (5.26 | )% | | | 107 | % | | $ | 7,656 | |
| | 0.68 | % | | | 2.10 | % | | | 1.95 | % | | | 16.45 | % | | | 70 | % | | $ | 8,388 | |
| | 0.84 | % | | | 2.12 | % | | | 1.95 | % | | | 8.20 | % | | | 94 | % | | $ | 7,665 | |
| | 1.21 | % | | | 2.06 | % | | | 1.95 | % | | | (3.69 | )% | | | 105 | % | | $ | 7,738 | |
| | | | | | | | | | | | | | | | | | | | | | |
| | 1.15 | % | | | 1.24 | % | | | 0.95 | % | | | 4.68 | % | | | 35 | % | | $ | 176,880 | |
| | 1.29 | % | | | 1.23 | % | | | 0.95 | % | | | 15.16 | % | | | 77 | % | | $ | 175,094 | |
| | 1.47 | % | | | 1.22 | % | | | 0.95 | % | | | 22.18 | % | | | 80 | % | | $ | 175,142 | |
| | 1.64 | % | | | 1.20 | % | | | 0.95 | % | | | (4.30 | )% | | | 107 | % | | $ | 220,021 | |
| | 1.66 | % | | | 1.19 | % | | | 0.95 | % | | | 17.19 | % | | | 70 | % | | $ | 273,174 | |
| | 2.04 | % | | | 1.19 | % | | | 0.95 | % | | | 9.32 | % | | | 94 | % | | $ | 287,073 | |
| | 2.18 | % | | | 1.14 | % | | | 0.95 | % | | | (2.68 | )% | | | 105 | % | | $ | 861,399 | |
The accompanying notes are an integral part of these financial statements.
| | | | |
| 18 | | Wells Fargo Advantage Allocation Funds | | Financial highlights |
| | | | | | | | | | | | | | | | | | | | | | | | |
| Moderate Balanced Fund | |
Beginning
net asset
value per
share | | | Net
investment
income1 | | | Net realized
and unrealized
gains (losses)
on investments | | | Distributions
from net
investment
income | | | Distributions
from net
realized gains | | |
Ending
net asset
value per
share | |
Class A | | | | | | | | | | | | | | | | | | | | | | | | |
Six months ended November 30, 2014 (unaudited) | | $ | 23.19 | | | | 0.14 | | | | 0.65 | | | | 0.00 | | | | 0.00 | | | $ | 23.98 | |
Year ended May 31, 2014 | | $ | 21.21 | | | | 0.29 | 4 | | | 1.82 | | | | (0.13 | ) | | | 0.00 | | | $ | 23.19 | |
Year ended May 31, 2013 | | $ | 18.84 | | | | 0.21 | | | | 2.50 | | | | (0.34 | ) | | | 0.00 | | | $ | 21.21 | |
Year ended May 31, 2012 | | $ | 19.64 | | | | 0.32 | | | | (0.54 | ) | | | (0.58 | ) | | | 0.00 | | | $ | 18.84 | |
Year ended May 31, 20115 | | $ | 17.97 | | | | 0.28 | | | | 1.80 | | | | (0.41 | ) | | | 0.00 | | | $ | 19.64 | |
Year ended September 30, 2010 | | $ | 17.12 | | | | 0.38 | 4 | | | 1.03 | | | | (0.56 | ) | | | 0.00 | | | $ | 17.97 | |
Year ended September 30, 2009 | | $ | 17.85 | | | | 0.38 | | | | (0.36 | ) | | | (0.57 | ) | | | (0.18 | ) | | $ | 17.12 | |
Class B | | | | | | | | | | | | | | | | | | | | | | | | |
Six months ended November 30, 2014 (unaudited) | | $ | 23.16 | | | | 0.05 | 4 | | | 0.65 | | | | 0.00 | | | | 0.00 | | | $ | 23.86 | |
Year ended May 31, 2014 | | $ | 21.25 | | | | 0.11 | 4 | | | 1.83 | | | | (0.03 | ) | | | 0.00 | | | $ | 23.16 | |
Year ended May 31, 2013 | | $ | 18.86 | | | | 0.13 | 4 | | | 2.43 | | | | (0.17 | ) | | | 0.00 | | | $ | 21.25 | |
Year ended May 31, 2012 | | $ | 19.58 | | | | 0.18 | 4 | | | (0.53 | ) | | | (0.37 | ) | | | 0.00 | | | $ | 18.86 | |
Year ended May 31, 20115 | | $ | 17.85 | | | | 0.14 | 4 | | | 1.84 | | | | (0.25 | ) | | | 0.00 | | | $ | 19.58 | |
Year ended September 30, 2010 | | $ | 16.99 | | | | 0.30 | | | | 0.97 | | | | (0.41 | ) | | | 0.00 | | | $ | 17.85 | |
Year ended September 30, 2009 | | $ | 17.67 | | | | 0.26 | 4 | | | (0.34 | ) | | | (0.42 | ) | | | (0.18 | ) | | $ | 16.99 | |
Class C | | | | | | | | | | | | | | | | | | | | | | | | |
Six months ended November 30, 2014 (unaudited) | | $ | 22.79 | | | | 0.04 | 4 | | | 0.64 | | | | 0.00 | | | | 0.00 | | | $ | 23.47 | |
Year ended May 31, 2014 | | $ | 20.96 | | | | 0.12 | 4 | | | 1.80 | | | | (0.09 | ) | | | 0.00 | | | $ | 22.79 | |
Year ended May 31, 2013 | | $ | 18.63 | | | | 0.11 | | | | 2.42 | | | | (0.20 | ) | | | 0.00 | | | $ | 20.96 | |
Year ended May 31, 2012 | | $ | 19.45 | | | | 0.18 | 4 | | | (0.53 | ) | | | (0.47 | ) | | | 0.00 | | | $ | 18.63 | |
Year ended May 31, 20115 | | $ | 17.77 | | | | 0.14 | 4 | | | 1.83 | | | | (0.29 | ) | | | 0.00 | | | $ | 19.45 | |
Year ended September 30, 2010 | | $ | 16.96 | | | | 0.28 | 4 | | | 0.99 | | | | (0.46 | ) | | | 0.00 | | | $ | 17.77 | |
Year ended September 30, 2009 | | $ | 17.64 | | | | 0.26 | 4 | | | (0.34 | ) | | | (0.42 | ) | | | (0.18 | ) | | $ | 16.96 | |
Administrator Class | | | | | | | | | | | | | | | | | | | | | | | | |
Six months ended November 30, 2014 (unaudited) | | $ | 23.38 | | | | 0.17 | | | | 0.66 | | | | 0.00 | | | | 0.00 | | | $ | 24.21 | |
Year ended May 31, 2014 | | $ | 21.36 | | | | 0.38 | | | | 1.79 | | | | (0.15 | ) | | | 0.00 | | | $ | 23.38 | |
Year ended May 31, 2013 | | $ | 18.96 | | | | 0.41 | | | | 2.38 | | | | (0.39 | ) | | | 0.00 | | | $ | 21.36 | |
Year ended May 31, 2012 | | $ | 19.77 | | | | 0.40 | | | | (0.58 | ) | | | (0.63 | ) | | | 0.00 | | | $ | 18.96 | |
Year ended May 31, 20115 | | $ | 18.11 | | | | 0.29 | | | | 1.83 | | | | (0.46 | ) | | | 0.00 | | | $ | 19.77 | |
Year ended September 30, 2010 | | $ | 17.23 | | | | 0.52 | 4 | | | 0.95 | | | | (0.59 | ) | | | 0.00 | | | $ | 18.11 | |
Year ended September 30, 2009 | | $ | 17.98 | | | | 0.42 | 4 | | | (0.37 | ) | | | (0.62 | ) | | | (0.18 | ) | | $ | 17.23 | |
| 1. | Includes net expenses allocated from the affiliated Master Portfolios in which the Fund invests. |
| 2. | Total return calculations do not include any sales charges. Returns for periods of less than one year are not annualized. |
| 3. | Portfolio turnover rate is calculated by aggregating the results of multiplying the Fund’s investment percentage in the respective affiliated Master Portfolio by the corresponding affiliated Master Portfolio’s portfolio turnover rate. |
| 4. | Calculated based upon average shares outstanding |
| 5. | For the eight months ended May 31, 2011. The Fund changed its fiscal year end from September 30 to May 31, effective May 31, 2011. |
The accompanying notes are an integral part of these financial statements.
| | | | | | |
| Financial highlights | | Wells Fargo Advantage Allocation Funds | | | 19 | |
| | | | | | | | | | | | | | | | | | | | | | |
Ratio to average net assets (annualized) | | | Total
return2 | | | Portfolio
turnover
rate3 | | | Net assets at
end of period
(000s omitted) | |
Net investment
income1 | | | Gross
expenses1 | | | Net
expenses1 | | | | |
| | | | | | | | | | | | | | | | | | | | | | | |
| | 1.14 | % | | | 1.36 | % | | | 1.15 | % | | | 3.41 | % | | | 39 | % | | $ | 19,263 | |
| | 1.29 | % | | | 1.36 | % | | | 1.15 | % | | | 9.94 | % | | | 89 | % | | $ | 18,169 | |
| | 1.41 | % | | | 1.36 | % | | | 1.15 | % | | | 14.57 | % | | | 86 | % | | $ | 10,344 | |
| | 1.68 | % | | | 1.33 | % | | | 1.15 | % | | | (0.93 | )% | | | 115 | % | | $ | 9,935 | |
| | 1.89 | % | | | 1.34 | % | | | 1.15 | % | | | 11.72 | % | | | 70 | % | | $ | 10,702 | |
| | 2.42 | % | | | 1.37 | % | | | 1.15 | % | | | 8.41 | % | | | 103 | % | | $ | 7,992 | |
| | 2.47 | % | | | 1.31 | % | | | 1.15 | % | | | 0.94 | % | | | 116 | % | | $ | 8,669 | |
| | | | | | | | | | | | | | | | | | | | | | |
| | 0.39 | % | | | 2.10 | % | | | 1.90 | % | | | 3.02 | % | | | 39 | % | | $ | 235 | |
| | 0.50 | % | | | 2.11 | % | | | 1.90 | % | | | 9.15 | % | | | 89 | % | | $ | 380 | |
| | 0.65 | % | | | 2.11 | % | | | 1.90 | % | | | 13.65 | % | | | 86 | % | | $ | 613 | |
| | 0.94 | % | | | 2.08 | % | | | 1.90 | % | | | (1.66 | )% | | | 115 | % | | $ | 807 | |
| | 1.11 | % | | | 2.09 | % | | | 1.90 | % | | | 11.16 | % | | | 70 | % | | $ | 1,097 | |
| | 1.65 | % | | | 2.12 | % | | | 1.90 | % | | | 7.58 | % | | | 103 | % | | $ | 1,257 | |
| | 1.72 | % | | | 2.06 | % | | | 1.90 | % | | | 0.19 | % | | | 116 | % | | $ | 1,720 | |
| | | | | | | | | | | | | | | | | | | | | | |
| | 0.39 | % | | | 2.11 | % | | | 1.90 | % | | | 2.98 | % | | | 39 | % | | $ | 5,082 | |
| | 0.54 | % | | | 2.11 | % | | | 1.90 | % | | | 9.15 | % | | | 89 | % | | $ | 4,469 | |
| | 0.66 | % | | | 2.11 | % | | | 1.90 | % | | | 13.65 | % | | | 86 | % | | $ | 2,576 | |
| | 0.92 | % | | | 2.08 | % | | | 1.90 | % | | | (1.67 | )% | | | 115 | % | | $ | 2,319 | |
| | 1.16 | % | | | 2.09 | % | | | 1.90 | % | | | 11.17 | % | | | 70 | % | | $ | 2,364 | |
| | 1.59 | % | | | 2.12 | % | | | 1.90 | % | | | 7.58 | % | | | 103 | % | | $ | 1,726 | |
| | 1.72 | % | | | 2.05 | % | | | 1.90 | % | | | 0.21 | % | | | 116 | % | | $ | 1,445 | |
| | | | | | | | | | | | | | | | | | | | | | |
| | 1.39 | % | | | 1.20 | % | | | 0.90 | % | | | 3.55 | % | | | 39 | % | | $ | 147,700 | |
| | 1.52 | % | | | 1.20 | % | | | 0.90 | % | | | 10.18 | % | | | 89 | % | | $ | 144,248 | |
| | 1.66 | % | | | 1.20 | % | | | 0.90 | % | | | 14.81 | % | | | 86 | % | | $ | 146,729 | |
| | 1.92 | % | | | 1.17 | % | | | 0.90 | % | | | (0.66 | )% | | | 115 | % | | $ | 172,587 | |
| | 2.14 | % | | | 1.18 | % | | | 0.90 | % | | | 11.93 | % | | | 70 | % | | $ | 192,305 | |
| | 3.06 | % | | | 1.18 | % | | | 0.90 | % | | | 8.65 | % | | | 103 | % | | $ | 176,179 | |
| | 2.72 | % | | | 1.13 | % | | | 0.90 | % | | | 1.14 | % | | | 116 | % | | $ | 330,340 | |
The accompanying notes are an integral part of these financial statements.
| | | | |
| 20 | | Wells Fargo Advantage Allocation Funds | | Notes to financial statements (unaudited) |
1. ORGANIZATION
Wells Fargo Funds Trust (the “Trust”), a Delaware statutory trust organized on March 10, 1999, is an open-end management investment company registered under the Investment Company Act of 1940, as amended (the “1940 Act”). These financial statements report on the following funds: the Wells Fargo Advantage Growth Balanced Fund (“Growth Balanced Fund”) and the Wells Fargo Advantage Moderate Balanced Fund (“Moderate Balanced Fund”) (each, a “Fund”, collectively, the “Funds”). Each Fund is a diversified series of the Trust.
Each Fund seeks to achieve its investment objective by investing all investable assets in separate diversified portfolios (each, an “affiliated Master Portfolio”, collectively, the “affiliated Master Portfolios”) of Wells Fargo Master Trust, a registered open-end management investment company. Each affiliated Master Portfolio directly acquires portfolio securities, and a Fund investing in an affiliated Master Portfolio acquires an indirect interest in those securities. Each Fund accounts for its investment in the affiliated Master Portfolios as partnership investments and records on a daily basis its share of the affiliated Master Portfolio’s income, expense and realized and unrealized gains and losses. The financial statements of the affiliated Master Portfolios for the six months ended November 30, 2014 are included in this report and should be read in conjunction with each Fund’s financial statements. As of November 30, 2014, the Funds own the following percentages of the affiliated Master Portfolios:
| | | | | | | | |
| | | Growth Balanced Fund | | | Moderate Balanced Fund | |
Wells Fargo Advantage C&B Large Cap Value Portfolio | | | 4 | % | | | 2 | % |
Wells Fargo Advantage Core Bond Portfolio | | | 1 | | | | 1 | |
Wells Fargo Advantage Diversified Large Cap Growth Portfolio | | | 31 | | | | 13 | |
Wells Fargo Advantage Emerging Growth Portfolio | | | 0 | * | | | 0 | * |
Wells Fargo Advantage Index Portfolio | | | 1 | | | | 1 | |
Wells Fargo Advantage International Growth Portfolio | | | 8 | | | | 3 | |
Wells Fargo Advantage International Value Portfolio | | | 2 | | | | 1 | |
Wells Fargo Advantage Large Company Value Portfolio | | | 31 | | | | 13 | |
Wells Fargo Advantage Managed Fixed Income Portfolio | | | 53 | | | | 47 | |
Wells Fargo Advantage Real Return Portfolio | | | 20 | | | | 17 | |
Wells Fargo Advantage Small Company Growth Portfolio | | | 1 | | | | 0 | * |
Wells Fargo Advantage Small Company Value Portfolio | | | 4 | | | | 2 | |
Wells Fargo Advantage Stable Income Portfolio | | | N/A | | | | 100 | |
| * | The amount invested is less than 1%. |
2. SIGNIFICANT ACCOUNTING POLICIES
The following significant accounting policies, which are consistently followed in the preparation of the financial statements of each Fund, are in conformity with U.S. generally accepted accounting principles which require management to make estimates and assumptions that affect the reported amounts of assets and liabilities, disclosure of contingent assets and liabilities at the date of the financial statements, and the reported amounts of revenues and expenses during the reporting period. Actual results could differ from those estimates.
Securities valuation
All investments are valued each business day as of the close of regular trading on the New York Stock Exchange (generally 4 p.m. Eastern Time).
Investments in the affiliated Master Portfolios are valued daily based on each Fund’s proportionate share of each affiliated Master Portfolio’s net assets, which are also valued daily. Securities held in the affiliated Master Portfolios are valued as discussed in the Notes to Financial Statements of the affiliated Master Portfolios, which are included elsewhere in this report.
Futures that are listed on a foreign or domestic exchange or market are valued at the official closing price or, if none, the last sales price.
| | | | | | |
| Notes to financial statements (unaudited) | | Wells Fargo Advantage Allocation Funds | | | 21 | |
Short-term securities, with maturities of 60 days or less at time of purchase, generally are valued at amortized cost which approximates fair value. The amortized cost method involves valuing a security at its cost, plus accretion of discount or minus amortization of premium over the period until maturity.
Investments which are not valued using any of the methods discussed above are valued at their fair value, as determined in good faith by the Board of Trustees of the Funds. The Board of Trustees has established a Valuation Committee comprised of the Trustees and has delegated to it the authority to take any actions regarding the valuation of portfolio securities that the Valuation Committee deems necessary or appropriate, including determining the fair value of portfolio securities, unless the determination has been delegated to the Management Valuation Team of Wells Fargo Funds Management, LLC (“Funds Management”). The Board of Trustees retains the authority to make or ratify any valuation decisions or approve any changes to the Valuation Procedures as it deems appropriate. On a quarterly basis, the Board of Trustees receives reports on any valuation actions taken by the Valuation Committee or the Management Valuation Team which may include items for ratification.
Valuations of fair valued securities are compared to the next actual sales price when available, or other appropriate market values, to assess the continued appropriateness of the fair valuation methodologies used. These securities are fair valued on a day-to-day basis, taking into consideration changes to appropriate market information and any significant changes to the inputs considered in the valuation process until there is a readily available price provided on an exchange or by an independent pricing service. Valuations received from an independent pricing service or independent broker-dealer quotes are periodically validated by comparisons to most recent trades and valuations provided by other independent pricing services in addition to the review of prices by the adviser and/or subadviser. Unobservable inputs used in determining fair valuations are identified based on the type of security, taking into consideration factors utilized by market participants in valuing the investment, knowledge about the issuer and the current market environment.
Futures contracts
Each Fund is subject to interest rate risk and equity price risk in the normal course of pursuing its investment objectives. The Fund may buy and sell futures contracts in order to gain exposure to, or protect against, changes in security values and interest rates. The primary risks associated with the use of futures contracts are the imperfect correlation between changes in market values of securities held by the Fund and the prices of futures contracts, and the possibility of an illiquid market.
The aggregate principal amounts of the contracts are not recorded in the financial statements. Fluctuations in the value of the contracts are recorded in the Statements of Assets and Liabilities as an asset or liability and in the Statements of Operations as unrealized gains or losses until the contracts are closed, at which point they are recorded as net realized gains or losses on futures contracts. With futures contracts, there is minimal counterparty risk to the Fund since futures are exchange traded and the exchange’s clearinghouse, as counterparty to all exchange traded futures, guarantees the futures against default.
Security transactions and income recognition
Securities transactions are recorded on a trade date basis in each affiliated Master Portfolio. Realized gains or losses in each affiliated Master Portfolio are recorded on the basis of identified cost.
Interest income is accrued daily and bond discounts are accreted and premiums are amortized daily based on the effective interest method by each Fund and each affiliated Master Portfolio. To the extent debt obligations are placed on non-accrual status, any related interest income may be reduced by writing off interest receivables when the collection of all or a portion of interest has become doubtful based on consistently applied procedures. If the issuer subsequently resumes interest payments or when the collectability of interest is reasonably assured, the debt obligation is removed from non-accrual status.
Dividend income in each affiliated Master Portfolio is recognized on the ex-dividend date, except for certain dividends from foreign securities which are recorded as soon as the custodian verifies the ex-dividend date.
Income from foreign securities in each affiliated Master Portfolio is recorded net of foreign taxes withheld where recovery of such taxes is not assured.
Each Fund records daily its proportionate share of each affiliated Master Portfolio’s interest and dividend income and realized and unrealized gains or losses.
Distributions to shareholders
Distributions to shareholders from net investment income and net realized gains, if any, are recorded on the ex-dividend date. Such distributions are determined in conformity with federal income tax regulations, which may differ in amount or character from net investment income and realized gains recognized for purposes of U.S. generally accepted accounting principles.
| | | | |
| 22 | | Wells Fargo Advantage Allocation Funds | | Notes to financial statements (unaudited) |
Federal and other taxes
Each Fund is treated as a separate entity for federal income tax purposes. Each Fund intends to continue to qualify as a regulated investment company by distributing substantially all of its investment company taxable income and any net realized capital gains (after reduction for capital loss carryforwards) sufficient to relieve it from all, or substantially all, federal income taxes. Accordingly, no provision for federal income taxes was required.
Each Fund’s income and federal excise tax returns and all financial records supporting those returns for the prior three fiscal years are subject to examination by the federal and Delaware revenue authorities. Management has analyzed each Fund’s tax positions taken on federal, state, and foreign tax returns for all open tax years and does not believe that there are any uncertain tax positions that require recognition of a tax liability.
As of May 31, 2014, Growth Balanced Fund had capital loss carryforwards that are available to offset future net realized capital gains in the amount of $159,605,297 with $7,499,740 expiring in 2016; $69,527,330 expiring in 2017; and $82,578,227 expiring in 2018.
Class allocations
The separate classes of shares offered by each Fund differ principally in applicable sales charges, distribution, shareholder servicing, and administration fees. Class specific expenses are charged directly to that share class. Investment income, common expenses, and realized and unrealized gains (losses) on investments are allocated daily to each class of shares based on the relative proportion of net assets of each class.
3. FAIR VALUATION MEASUREMENTS
Fair value measurements of investments are determined within a framework that has established a fair value hierarchy based upon the various data inputs utilized in determining the value of each Fund’s investments. The three-level hierarchy gives the highest priority to unadjusted quoted prices in active markets for identical assets or liabilities (Level 1) and the lowest priority to significant unobservable inputs (Level 3). Each Fund’s investments are classified within the fair value hierarchy based on the lowest level of input that is significant to the fair value measurement. The inputs are summarized into three broad levels as follows:
| n | | Level 1 – quoted prices in active markets for identical securities |
| n | | Level 2 – other significant observable inputs (including quoted prices for similar securities, interest rates, prepayment speeds, credit risk, use of amortized cost, etc.) |
| n | | Level 3 – significant unobservable inputs (including the Fund’s own assumptions in determining the fair value of investments) |
The inputs or methodologies used for valuing investments in securities are not necessarily an indication of the risk associated with investing in those securities.
The following is a summary of the inputs used in valuing the Fund’s assets and liabilities as of November 30, 2014:
| | | | | | | | | | | | | | | | |
| Growth Balanced Fund | | Quoted prices (Level 1) | | | Other significant
observable inputs (Level 2) | | | Significant unobservable inputs (Level 3) | | | Total | |
Assets | | | | | | | | | | | | | | | | |
Investments in: | | | | | | | | | | | | | | | | |
| | | | |
Affiliated master portfolios | | $ | 0 | | | $ | 253,121,762 | | | $ | 0 | | | $ | 253,121,762 | |
| | | | |
Short-term investments | | | | | | | | | | | | | | | | |
U.S. Treasury securities | | | 869,995 | | | | 419,999 | | | | 0 | | | | 1,289,994 | |
Total assets | | $ | 869,995 | | | $ | 253,541,761 | | | $ | 0 | | | $ | 254,411,756 | |
Liabilities | | | | | | | | | | | | | | | | |
Futures contracts | | $ | 91,000 | | | $ | 0 | | | $ | 0 | | | $ | 91,000 | |
Total liabilities | | $ | 91,000 | | | $ | 0 | | | $ | 0 | | | $ | 91,000 | |
| | | | | | |
| Notes to financial statements (unaudited) | | Wells Fargo Advantage Allocation Funds | | | 23 | |
| | | | | | | | | | | | | | | | |
| Moderate Balanced Fund | | Quoted prices (Level 1) | | | Other significant
observable inputs (Level 2) | | | Significant unobservable inputs (Level 3) | | | Total | |
Assets | | | | | | | | | | | | | | | | |
Investments in: | | | | | | | | | | | | | | | | |
| | | | |
Affiliated master portfolios | | $ | 0 | | | $ | 171,407,784 | | | $ | 0 | | | $ | 171,407,784 | |
| | | | |
Short-term investments | | | | | | | | | | | | | | | | |
U.S. Treasury securities | | | 569,997 | | | | 289,999 | | | | 0 | | | | 859,996 | |
Total assets | | $ | 569,997 | | | $ | 171,697,783 | | | $ | 0 | | | $ | 172,267,780 | |
Liabilities | | | | | | | | | | | | | | | | |
Futures contracts | | $ | 63,000 | | | $ | 0 | | | $ | 0 | | | $ | 63,000 | |
Total liabilities | | $ | 63,000 | | | $ | 0 | | | $ | 0 | | | $ | 63,000 | |
Futures contracts are reported at their variation margin at measurement date, which represents the amount due from the Fund at that date. All other assets and liabilities included in the are reported at their market value at measurement date.
Transfers in and transfers out are recognized at the end of the reporting period. At November 31, 2014, the Funds did not have any transfers into/out of Level 1, Level 2, or Level 3.
4. TRANSACTIONS WITH AFFILIATES
Advisory fees
The Trust has entered into an advisory contract with Funds Management, an indirect wholly owned subsidiary of Wells Fargo & Company (“Wells Fargo”). The adviser is responsible for implementing investment policies and guidelines and for supervising the subadviser, who is responsible for day-to-day portfolio management of the Funds.
Funds Management is entitled to receive an annual advisory fee starting at 0.25% and declining to 0.19% as the average daily net assets of each Fund increase. For the six months ended November 30, 2014, the advisory fee was equivalent to an annual rate of 0.25% of each Fund’s average daily net assets.
Funds Management has retained the services of a subadviser to provide daily portfolio management to the Funds. The fee for subadvisory services is borne by Funds Management. Wells Capital Management Incorporated, an affiliate of Funds Management and an indirect wholly owned subsidiary of Wells Fargo, is the subadviser to each Fund and is entitled to receive a fee from Funds Management at an annual rate starting at 0.10% and declining to 0.05% as the average daily net assets of each Fund increase.
Funds Management also serves as the adviser to each affiliated Master Portfolio and is entitled to receive a fee from each affiliated Master Portfolio for those services.
Administration fees
The Trust has entered into an administration agreement with Funds Management. Under this agreement, for providing administrative services, which includes paying fees and expenses for services provided by the transfer agent, sub-transfer agents, omnibus account servicers, and record-keepers, Funds Management is entitled to receive from each Fund an annual fund level administration fee starting at 0.05% and declining to 0.03% as the average daily net assets of each Fund increase and a class level administration fee which is calculated based on the average daily net assets of each class as follows:
| | | | |
| | | Class level
administration fee | |
Class A, Class B, Class C | | | 0.26 | % |
Administrator Class | | | 0.10 | |
Funds Management has contractually waived and/or reimbursed advisory and administration fees to the extent necessary to maintain certain net operating expense ratios for the Funds. Waiver of fees and/or reimbursement of expenses by Funds Management were made first from fund level expenses on a proportionate basis and then from class
| | | | |
| 24 | | Wells Fargo Advantage Allocation Funds | | Notes to financial statements (unaudited) |
specific expenses. Funds Management has committed through September 30, 2015 to waive fees and/or reimburse expenses to the extent necessary to cap each Fund’s expenses as follows:
| | | | | | | | | | | | | | | | |
| | | Class A | | | Class B | | | Class C | | | Administrator
Class | |
Growth Balanced Fund | | | 1.20 | % | | | 1.95 | % | | | 1.95 | % | | | 0.95 | % |
Moderate Balanced Fund | | | 1.15 | % | | | 1.90 | % | | | 1.90 | % | | | 0.90 | % |
After September 30, 2015, the cap may be increased or the commitment to maintain the cap may be terminated only with the approval of the Board of Trustees.
Distribution fees
The Trust has adopted a Distribution Plan for Class B and Class C shares of the Funds pursuant to Rule 12b-1 under the 1940 Act. Distribution fees are charged to the Class B and Class C shares and paid to Wells Fargo Funds Distributor, LLC (“Funds Distributor”), the principal underwriter of each Fund, at an annual rate of 0.75% of the average daily net assets of Class B and Class C shares.
In addition, Funds Distributor is entitled to receive the front-end sales charge from the purchase of Class A shares and a contingent deferred sales charge on the redemption of certain shares. Funds Distributor is also entitled to receive the contingent deferred sales charges from redemptions of Class B and Class C shares. For the six months ended November 30, 2014, Funds Distributor received the following amounts in front-end sales charges and contingent deferred sales charges.
| | | | | | | | |
| | | Front-end sales charges | | | Contingent deferred sales charges | |
| | | Class A | | | Class C | |
Growth Balanced Fund | | $ | 8,789 | | | $ | 0 | |
Moderate Balanced Fund | | | 2,502 | | | | 50 | |
Shareholder servicing fees
The Trust has entered into contracts with one or more shareholder servicing agents, whereby Class A, Class B, Class C, and Administrator Class of each applicable Fund is charged a fee at an annual rate of 0.25% of the average daily net assets of each respective class.
A portion of these total shareholder servicing fees were paid to affiliates of Wells Fargo.
5. INVESTMENT PORTFOLIO TRANSACTIONS
Purchases and sales of investments, excluding short-term securities, for the six months ended November 30, 2014 were as follows:
| | | | | | | | | | | | | | | | |
| | | Purchases at cost* | | | Sales proceeds* | |
| | | U.S.
government | | | Non-U.S.
government | | | U.S.
government | | | Non-U.S.
government | |
Growth Balanced Fund | | $ | 46,759,923 | | | $ | 48,433,826 | | | $ | 51,121,835 | | | $ | 49,598,498 | |
Moderate Balanced Fund | | | 41,310,840 | | | | 31,673,375 | | | | 45,164,453 | | | | 27,952,383 | |
| * | The Funds seek to achieve their investment objective by investing all of their investable assets in affiliated Master Portfolios. Purchases and sales related to these investments have been calculated by aggregating the results of multiplying each Fund’s ownership percentage of the respective affiliated Master Portfolio by the corresponding affiliated Master Portfolio’s purchases and sales. Purchases and sales of unaffiliated securities in which the Funds invest are actual purchases and sale of those securities. |
6. DERIVATIVE TRANSACTIONS
During the six months ended November 30, 2014, the Funds entered into futures contracts to gain market exposure to certain asset classes consistent with an active asset allocation strategy.
| | | | | | |
| Notes to financial statements (unaudited) | | Wells Fargo Advantage Allocation Funds | | | 25 | |
At November 30, 2014, the Funds had long and short futures contracts outstanding as follows:
| | | | | | | | | | | | | | | | | | | | | | | | |
| | | Expiration
date | | | Counterparty | | | Contracts | | | Type | | | Contract value at
November 30, 2014 | | | Unrealized
gains
(losses) | |
Growth Balanced Fund | | | 12-18-2014 | | | | Goldman Sachs | | | | 24 Long | | | | S&P 500 Index | | | $ | 12,397,800 | | | $ | 951,805 | |
| | | 3-20-2015 | | | | Goldman Sachs | | | | 88 Short | | | | U.S. Treasury Bond | | | | 12,551,000 | | | | (181,685 | ) |
Moderate Balanced Fund | | | 12-18-2014 | | | | Goldman Sachs | | | | 17 Long | | | | S&P 500 Index | | | | 8,781,775 | | | | 666,551 | |
| | | 3-20-2015 | | | | Goldman Sachs | | | | 60 Short | | | | U.S. Treasury Bond | | | | 8,557,500 | | | | (123,876 | ) |
The Funds had average notional amounts in futures contracts outstanding during the six months ended November 30, 2014 as follows:
| | | | | | | | |
| | | Long contracts | | | Short contracts | |
Growth Balanced Fund | | $ | 13,227,685 | | | $ | 13,972,425 | |
Moderate Balanced Fund | | | 9,064,761 | | | | 9,222,818 | |
A summary of derivative instruments by primary risk exposure is outlined in the following tables.
The fair value of derivative instruments as of November 30, 2014 was as follows for Growth Balanced Fund:
| | | | | | | | | | | | |
| | | Asset derivatives | | | Liability derivatives | |
| | | Statements of Assets and
Liabilities location | | Fair value | | | Statements of Assets and
Liabilities location | | Fair value | |
Interest rate contracts | | Receivable for daily variation margin on open futures contracts | | $ | 0 | | | Payable for daily variation margin on open futures contracts | | $ | 55,000 | * |
Equity contracts | | Receivable for daily variation margin on open futures contracts | | | 0 | | | Payable for daily variation margin on open futures contracts | | | 36,000 | * |
| | | | $ | 0 | | | | | $ | 91,000 | |
| * | Only the current day’s variation margin as of November 30, 2014 is reported separately on the Statements of Assets and Liabilities. |
The effect of derivative instruments on the Statements of Operations for the six months ended November 30, 2014 was as follows for Growth Balanced Fund:
| | | | | | | | |
| | | Amount of realized
gains (losses) on
derivatives | | | Change in unrealized
gains (losses) on
derivatives | |
Interest rate contracts | | $ | (456,989 | ) | | $ | (106,881 | ) |
Equity contracts | | | 1,243,343 | | | | 420,547 | |
| | | $ | 786,354 | | | $ | 313,666 | |
The fair value of derivative instruments as of November 30, 2014 was as follows for Moderate Balanced Fund:
| | | | | | | | | | | | |
| | | Asset derivatives | | | Liability derivatives | |
| | | Statements of Assets and
Liabilities location | | Fair value | | | Statements of Assets and
Liabilities location | | Fair value | |
Interest rate contracts | | Receivable for daily variation margin on open futures contracts | | $ | 0 | | | Payable for daily variation margin on open futures contracts | | $ | 37,500 | * |
Equity contracts | | Receivable for daily variation margin on open futures contracts | | | 0 | | | Payable for daily variation margin on open futures contracts | | | 25,500 | * |
| | | | | $ | 0 | | | | | $ | 63,000 | |
| * | Only the current day’s variation margin as of November 30, 2014 is reported separately on the Statements of Assets and Liabilities. |
| | | | |
| 26 | | Wells Fargo Advantage Allocation Funds | | Notes to financial statements (unaudited) |
The effect of derivative instruments on the Statements of Operations for the six months ended November 30, 2014 was as follows for Moderate Balanced Fund:
| | | | | | | | |
| | | Amount of realized
gains (losses) on derivatives | | | Change in unrealized
gains (losses) on derivatives | |
Interest rate contracts | | $ | (302,813 | ) | | $ | 319,190 | |
Equity contracts | | | 809,837 | | | | (73,176 | ) |
| | | $ | 507,024 | | | $ | 246,014 | |
For certain types of derivative transactions, the Funds have entered into International Swaps and Derivatives Association, Inc. master agreements (“ISDA Master Agreements”) or similar agreements with approved counterparties. The ISDA Master Agreements or similar agreements may have requirements to deliver/deposit securities or cash to/with an exchange or broker-dealer as collateral and allows the Funds to offset, with each counterparty, certain derivative financial instrument’s assets and/or liabilities with collateral held or pledged. Collateral requirements differ by type of derivative. Collateral or margin requirements are set by the broker or exchange clearing house for exchange traded derivatives while collateral terms are contract specific for over-the-counter traded derivatives. Cash collateral that has been pledged to cover obligations of the Funds under ISDA Master Agreements or similar agreements, if any, will be reported separately in the Statements of Assets and Liabilities. Securities pledged as collateral, if any, for the same purpose are noted in the Portfolio of Investments. With respect to balance sheet offsetting, absent an event of default by the counterparty or a termination of the agreement, the reported amounts of financial assets and financial liabilities in the Statements of Assets and Liabilities are not offset across transactions between the Funds and the applicable counterparty. A reconciliation of the gross amounts on the Statements of Assets and Liabilities to the net amounts by derivative type, including any collateral exposure, is as follows:
| | | | | | | | | | | | | | | | | | | | |
| | | Derivative type | | Counterparty | | Gross amounts
of liabilities in the
Statements of
Assets and
Liabilities | | | Amounts
subject to
netting
agreements | | | Collateral
pledged1 | | | Net amount
of liabilities | |
Growth Balanced Fund | | Futures – variation margin | | Goldman Sachs | | $ | 91,000 | | | $ | 0 | | | $ | (91,000 | ) | | $ | 0 | |
Moderate Balanced Fund | | Futures – variation margin | | Goldman Sachs | | | 63,000 | | | | 0 | | | | (63,000 | ) | | | 0 | |
| | 1 | Collateral pledged within this table is limited to the collateral for the net transaction with the counterparty. | |
7. BANK BORROWINGS
Each Fund and certain funds in the Trust are party to a $25,000,000 revolving credit agreement whereby each Fund is permitted to use bank borrowings for temporary or emergency purposes, such as to fund shareholder redemption requests. Interest under the credit agreement is charged to each Fund based on a borrowing rate equal to the higher of the Federal Funds rate in effect on that day plus 1.25% or the overnight LIBOR rate in effect on that day plus 1.25%. In addition, an annual commitment fee equal to 0.15% of the unused balance is allocated to each participating fund. For the six months ended November 30, 2015, the Funds paid the following amounts in commitment fees:
| | | | |
| | | Commitment fee | |
Growth Balanced Fund | | $ | 302 | |
Moderate Balanced Fund | | | 151 | |
For the six months ended November 30, 2014, there were no borrowings by the Funds under the agreement.
8. INDEMNIFICATION
Under the Trust’s organizational documents, the officers and Trustees are indemnified against certain liabilities that may arise out of performance of their duties to the Trust. Additionally, in the normal course of business, the Trust may enter into contracts with service providers that contain a variety of indemnification clauses. The Trust’s maximum exposure under these arrangements is dependent on future claims that may be made against the Funds and, therefore, cannot be estimated.
| | | | | | |
| Notes to financial statements (unaudited) | | Wells Fargo Advantage Allocation Funds | | | 27 | |
9. SUBSEQUENT DISTRIBUTIONS
On December 19, 2014, the Funds declared distributions from net investment income to shareholders of record on December 18, 2014. The per share amounts payable on December 22, 2014 were as follows:
| | | | | | | | |
| Net investment income | | Growth
Balanced
Fund | | | Moderate
Balanced
Fund | |
Class A | | $ | 0.16692 | | | $ | 0.44320 | |
Class B | | | 0.00000 | | | | 0.00000 | |
Class C | | | 0.07508 | | | | 0.23375 | |
Administrator Class | | | 0.20618 | | | | 0.52200 | |
These distributions are not reflected in the accompanying financial statements. The final determination of the source of all distributions is subject to change and made after the tax year-end of each Fund.
| | | | |
| 28 | | Wells Fargo Advantage Allocation Funds | | Portfolio of investments—November 30, 2014 (unaudited) |
C&B LARGE CAP VALUE PORTFOLIO
| | | | | | | | | | | | |
| Security name | | | | | | Shares | | | Value | |
| | | | |
Common Stocks: 91.51% | | | | | | | | | | | | |
| | | | |
Consumer Discretionary: 12.57% | | | | | | | | | | | | |
| | | | |
| Hotels, Restaurants & Leisure: 5.01% | | | | | | | | | | | | |
Carnival Corporation | | | | | | | 210,400 | | | $ | 9,291,264 | |
McDonald’s Corporation | | | | | | | 79,000 | | | | 7,647,990 | |
| | | | |
| | | | | | | | | | | 16,939,254 | |
| | | | | | | | | | | | |
| | | | |
| Media: 5.16% | | | | | | | | | | | | |
Omnicom Group Incorporated | | | | | | | 127,500 | | | | 9,851,925 | |
Twenty-First Century Fox Incorporated | | | | | | | 206,700 | | | | 7,606,560 | |
| | | | |
| | | | | | | | | | | 17,458,485 | |
| | | | | | | | | | | | |
| | | | |
| Multiline Retail: 2.40% | | | | | | | | | | | | |
Kohl’s Corporation | | | | | | | 135,900 | | | | 8,102,358 | |
| | | | | | | | | | | | |
| | | | |
Consumer Staples: 10.64% | | | | | | | | | | | | |
| | | | |
| Beverages: 1.34% | | | | | | | | | | | | |
Diageo plc ADR | | | | | | | 36,800 | | | | 4,533,760 | |
| | | | | | | | | | | | |
| | | | |
| Food Products: 2.07% | | | | | | | | | | | | |
Unilever NV ADR | | | | | | | 172,600 | | | | 7,014,464 | |
| | | | | | | | | | | | |
| | | | |
| Household Products: 4.70% | | | | | | | | | | | | |
Colgate-Palmolive Company | | | | | | | 67,800 | | | | 4,718,202 | |
Henkel AG & Company KGaA ADR | | | | | | | 51,200 | | | | 5,067,776 | |
The Procter & Gamble Company | | | | | | | 67,600 | | | | 6,113,068 | |
| | | | |
| | | | | | | | | | | 15,899,046 | |
| | | | | | | | | | | | |
| | | | |
| Tobacco: 2.53% | | | | | | | | | | | | |
Philip Morris International | | | | | | | 98,300 | | | | 8,545,219 | |
| | | | | | | | | | | | |
| | | | |
Energy: 8.69% | | | | | | | | | | | | |
| | | | |
| Oil, Gas & Consumable Fuels: 8.69% | | | | | | | | | | | | |
Chevron Corporation | | | | | | | 60,440 | | | | 6,580,103 | |
Devon Energy Corporation | | | | | | | 117,300 | | | | 6,917,181 | |
Exxon Mobil Corporation | | | | | | | 85,350 | | | | 7,727,589 | |
Noble Energy Incorporated | | | | | | | 75,600 | | | | 3,718,008 | |
World Fuel Services Corporation | | | | | | | 98,600 | | | | 4,464,608 | |
| | | | |
| | | | | | | | | | | 29,407,489 | |
| | | | | | | | | | | | |
| | | | |
Financials: 23.88% | | | | | | | | | | | | |
| | | | |
| Banks: 7.12% | | | | | | | | | | | | |
Bank of America Corporation | | | | | | | 334,100 | | | | 5,693,064 | |
JPMorgan Chase & Company | | | | | | | 174,800 | | | | 10,515,968 | |
PNC Financial Services Group Incorporated | | | | | | | 90,000 | | | | 7,872,300 | |
| | | | |
| | | | | | | | | | | 24,081,332 | |
| | | | | | | | | | | | |
The accompanying notes are an integral part of these financial statements.
| | | | | | |
| Portfolio of investments—November 30, 2014 (unaudited) | | Wells Fargo Advantage Allocation Funds | | | 29 | |
C&B LARGE CAP VALUE PORTFOLIO
| | | | | | | | | | | | |
| Security name | | | | | | Shares | | | Value | |
| | | | |
| Capital Markets: 3.92% | | | | | | | | | | | | |
State Street Corporation | | | | | | | 172,700 | | | $ | 13,251,271 | |
| | | | | | | | | | | | |
| | | | |
| Consumer Finance: 2.23% | | | | | | | | | | | | |
American Express Company | | | | | | | 81,400 | | | | 7,522,988 | |
| | | | | | | | | | | | |
| | | | |
| Diversified Financial Services: 1.52% | | | | | | | | | | | | |
Berkshire Hathaway Incorporated Class B † | | | | | | | 34,600 | | | | 5,144,674 | |
| | | | | | | | | | | | |
| | | | |
| Insurance: 9.09% | | | | | | | | | | | | |
Axis Capital Holdings Limited | | | | | | | 33,700 | | | | 1,686,685 | |
FNF Group | | | | | | | 233,900 | | | | 7,578,360 | |
RenaissanceRe Holdings Limited | | | | | | | 79,200 | | | | 7,755,264 | |
The Progressive Corporation | | | | | | | 333,600 | | | | 9,087,264 | |
Willis Group Holdings plc | | | | | | | 108,500 | | | | 4,634,035 | |
| | | | |
| | | | | | | | | | | 30,741,608 | |
| | | | | | | | | | | | |
| | | | |
Health Care: 13.79% | | | | | | | | | | | | |
| | | | |
| Health Care Equipment & Supplies: 4.49% | | | | | | | | | | | | |
Baxter International Incorporated | | | | | | | 98,900 | | | | 7,219,700 | |
Becton Dickinson & Company | | | | | | | 56,700 | | | | 7,956,711 | |
| | | | |
| | | | | | | | | | | 15,176,411 | |
| | | | | | | | | | | | |
| | | | |
| Health Care Providers & Services: 6.76% | | | | | | | | | | | | |
Cardinal Health Incorporated | | | | | | | 81,300 | | | | 6,682,047 | |
Laboratory Corporation of America Holdings † | | | | | | | 84,300 | | | | 8,821,152 | |
UnitedHealth Group Incorporated | | | | | | | 74,700 | | | | 7,367,661 | |
| | | | |
| | | | | | | | | | | 22,870,860 | |
| | | | | | | | | | | | |
| | | | |
| Pharmaceuticals: 2.54% | | | | | | | | | | | | |
Johnson & Johnson | | | | | | | 79,400 | | | | 8,595,050 | |
| | | | | | | | | | | | |
| | | | |
Industrials: 9.45% | | | | | | | | | | | | |
| | | | |
| Air Freight & Logistics: 2.68% | | | | | | | | | | | | |
United Parcel Service Incorporated Class B | | | | | | | 82,600 | | | | 9,079,392 | |
| | | | | | | | | | | | |
| | | | |
| Electrical Equipment: 1.09% | | | | | | | | | | | | |
Eaton Corporation plc | | | | | | | 54,100 | | | | 3,669,603 | |
| | | | | | | | | | | | |
| | | | |
| Industrial Conglomerates: 2.52% | | | | | | | | | | | | |
3M Company | | | | | | | 53,200 | | | | 8,516,788 | |
| | | | | | | | | | | | |
| | | | |
| Machinery: 3.16% | | | | | | | | | | | | |
Illinois Tool Works Incorporated | | | | | | | 28,000 | | | | 2,658,040 | |
Parker Hannifin Corporation | | | | | | | 62,200 | | | | 8,025,666 | |
| | | | |
| | | | | | | | | | | 10,683,706 | |
| | | | | | | | | | | | |
| | | | |
Information Technology: 6.64% | | | | | | | | | | | | |
| | | | |
| Communications Equipment: 2.09% | | | | | | | | | | | | |
QUALCOMM Incorporated | | | | | | | 97,000 | | | | 7,071,300 | |
| | | | | | | | | | | | |
The accompanying notes are an integral part of these financial statements.
| | | | |
| 30 | | Wells Fargo Advantage Allocation Funds | | Portfolio of investments—November 30, 2014 (unaudited) |
C&B LARGE CAP VALUE PORTFOLIO
| | | | | | | | | | | | | | | | |
| Security name | | | | | | | | | Shares | | | Value | |
| | | | | |
| IT Services: 4.55% | | | | | | | | | | | | | | | | |
Fiserv Incorporated † | | | | | | | | | | | 99,700 | | | $ | 7,127,553 | |
The Western Union Company | | | | | | | | | | | 444,000 | | | | 8,249,520 | |
| | | | | |
| | | | | | | | | | | | | | | 15,377,073 | |
| | | | | | | | | | | | | | | | |
| | | | | |
Materials: 5.85% | | | | | | | | | | | | | | | | |
| | | | | |
| Containers & Packaging: 5.85% | | | | | | | | | | | | | | | | |
Ball Corporation | | | | | | | | | | | 69,500 | | | | 4,661,365 | |
Crown Holdings Incorporated † | | | | | | | | | | | 222,800 | | | | 11,028,600 | |
Rock-Tenn Company Class A | | | | | | | | | | | 71,900 | | | | 4,084,639 | |
| | | | | |
| | | | | | | | | | | | | | | 19,774,604 | |
| | | | | | | | | | | | | | | | |
| | | | | |
Total Common Stocks (Cost $214,789,569) | | | | | | | | | | | | | | | 309,456,735 | |
| | | | | | | | | | | | | | | | |
| | | | | |
| | | Dividend yield | | | | | | | | | | | |
| | | | | |
Preferred Stocks: 0.45% | | | | | | | | | | | | | | | | |
| | | | | |
Consumer Staples: 0.45% | | | | | | | | | | | | | | | | |
| | | | | |
| Household Products: 0.45% | | | | | | | | | | | | | | | | |
Henkel AG & Company KGaA ADR ± | | | 1.51 | % | | | | | | | 13,600 | | | | 1,507,315 | |
| | | | | | | | | | | | | | | | |
| | | | | |
Total Preferred Stocks (Cost $597,017) | | | | | | | | | | | | | | | 1,507,315 | |
| | | | | | | | | | | | | | | | |
| | | | | |
| | | Yield | | | | | | | | | | | |
| | | | | |
Short-Term Investments: 7.34% | | | | | | | | | | | | | | | | |
| | | | | |
| Investment Companies: 7.34% | | | | | | | | | | | | | | | | |
Wells Fargo Advantage Cash Investment Money Market Fund, Select Class (l)(u) | | | 0.08 | | | | | | | | 24,831,887 | | | | 24,831,887 | |
| | | | | | | | | | | | | | | | |
| | | | | |
Total Short-Term Investments (Cost $24,831,887) | | | | | | | | | | | | | | | 24,831,887 | |
| | | | | | | | | | | | | | | | |
| | | | | | | | |
| Total investments in securities (Cost $240,218,473) * | | | 99.30 | % | | | 335,795,937 | |
Other assets and liabilities, net | | | 0.70 | | | | 2,369,039 | |
| | | | | | | | |
| Total net assets | | | 100.00 | % | | $ | 338,164,976 | |
| | | | | | | | |
| † | Non-income-earning security |
| ± | Variable rate investment. The rate shown is the rate in effect at period end. |
| (l) | The security represents an affiliate of the Portfolio as defined in the Investment Company Act of 1940. |
| (u) | The rate represents the 7-day annualized yield at period end. |
| * | Cost for federal income tax purposes is $249,058,432 and unrealized gains (losses) consists of: |
| | | | |
Gross unrealized gains | | $ | 96,955,131 | |
Gross unrealized losses | | | (10,217,626 | ) |
| | | | |
Net unrealized gains | | $ | 86,737,505 | |
The accompanying notes are an integral part of these financial statements.
| | | | | | |
| Portfolio of investments—November 30, 2014 (unaudited) | | Wells Fargo Advantage Allocation Funds | | | 31 | |
DIVERSIFIED LARGE CAP GROWTH PORTFOLIO
| | | | | | | | | | | | |
| Security name | | | | | | Shares | | | Value | |
| | | | |
Common Stocks: 99.14% | | | | | | | | | | | | |
| | | | |
Consumer Discretionary: 25.59% | | | | | | | | | | | | |
| | | | |
| Auto Components: 1.17% | | | | | | | | | | | | |
BorgWarner Incorporated | | | | | | | 2,560 | | | $ | 144,794 | |
Delphi Automotive plc | | | | | | | 19,530 | | | | 1,424,714 | |
| | | | |
| | | | | | | | | | | 1,569,508 | |
| | | | | | | | | | | | |
| | | | |
| Distributors: 0.52% | | | | | | | | | | | | |
LKQ Corporation † | | | | | | | 23,900 | | | | 694,295 | |
| | | | | | | | | | | | |
| | | | |
| Hotels, Restaurants & Leisure: 4.78% | | | | | | | | | | | | |
Chipotle Mexican Grill Incorporated † | | | | | | | 3,130 | | | | 2,077,131 | |
Hilton Worldwide Holdings Incorporated † | | | | | | | 7,368 | | | | 193,189 | |
Las Vegas Sands Corporation | | | | | | | 13,660 | | | | 870,005 | |
Marriott International Incorporated Class A | | | | | | | 8,700 | | | | 685,473 | |
Starbucks Corporation | | | | | | | 21,214 | | | | 1,722,789 | |
Wynn Resorts Limited | | | | | | | 4,860 | | | | 868,045 | |
| | | | |
| | | | | | | | | | | 6,416,632 | |
| | | | | | | | | | | | |
| | | | |
| Internet & Catalog Retail: 2.92% | | | | | | | | | | | | |
Amazon.com Incorporated † | | | | | | | 7,460 | | | | 2,526,254 | |
Netflix Incorporated † | | | | | | | 280 | | | | 97,045 | |
The Priceline Group Incorporated † | | | | | | | 1,120 | | | | 1,299,413 | |
| | | | |
| | | | | | | | | | | 3,922,712 | |
| | | | | | | | | | | | |
| | | | |
| Media: 5.94% | | | | | | | | | | | | |
CBS Corporation Class B | | | | | | | 14,780 | | | | 811,126 | |
Comcast Corporation Class A | | | | | | | 36,450 | | | | 2,079,108 | |
Liberty Global plc Class C † | | | | | | | 31,320 | | | | 1,563,494 | |
The Walt Disney Company | | | | | | | 15,900 | | | | 1,470,909 | |
Time Warner Incorporated | | | | | | | 10,610 | | | | 903,123 | |
Twenty-First Century Fox Incorporated | | | | | | | 31,320 | | | | 1,152,576 | |
| | | | |
| | | | | | | | | | | 7,980,336 | |
| | | | | | | | | | | | |
| | | | |
| Multiline Retail: 2.08% | | | | | | | | | | | | |
Dollar Tree Incorporated † | | | | | | | 31,610 | | | | 2,160,860 | |
Nordstrom Incorporated | | | | | | | 8,340 | | | | 636,842 | |
| | | | |
| | | | | | | | | | | 2,797,702 | |
| | | | | | | | | | | | |
| | | | |
| Specialty Retail: 4.53% | | | | | | | | | | | | |
Cabela’s Incorporated †« | | | | | | | 3,680 | | | | 199,603 | |
CarMax Incorporated † | | | | | | | 30,120 | | | | 1,716,238 | |
O’Reilly Automotive Incorporated † | | | | | | | 4,590 | | | | 838,777 | |
TJX Companies Incorporated | | | | | | | 26,500 | | | | 1,753,240 | |
Tractor Supply Company | | | | | | | 20,440 | | | | 1,572,449 | |
| | | | |
| | | | | | | | | | | 6,080,307 | |
| | | | | | | | | | | | |
The accompanying notes are an integral part of these financial statements.
| | | | |
| 32 | | Wells Fargo Advantage Allocation Funds | | Portfolio of investments—November 30, 2014 (unaudited) |
DIVERSIFIED LARGE CAP GROWTH PORTFOLIO
| | | | | | | | | | | | |
| Security name | | | | | | Shares | | | Value | |
| | | | |
| Textiles, Apparel & Luxury Goods: 3.65% | | | | | | | | | | | | |
Nike Incorporated Class B | | | | | | | 25,020 | | | $ | 2,484,236 | |
Under Armour Incorporated Class A † | | | | | | | 19,520 | | | | 1,415,005 | |
VF Corporation | | | | | | | 13,420 | | | | 1,008,781 | |
| | | | |
| | | | | | | | | | | 4,908,022 | |
| | | | | | | | | | | | |
| | | | |
Consumer Staples: 3.93% | | | | | | | | | | | | |
| | | | |
| Beverages: 0.95% | | | | | | | | | | | | |
Constellation Brands Incorporated Class A † | | | | | | | 10,240 | | | | 987,136 | |
The Coca-Cola Company | | | | | | | 6,650 | | | | 298,120 | |
| | | | |
| | | | | | | | | | | 1,285,256 | |
| | | | | | | | | | | | |
| | | | |
| Food & Staples Retailing: 1.93% | | | | | | | | | | | | |
Costco Wholesale Corporation | | | | | | | 11,450 | | | | 1,627,274 | |
CVS Health Corporation | | | | | | | 4,200 | | | | 383,712 | |
Sprouts Farmers Market Incorporated † | | | | | | | 15,228 | | | | 484,098 | |
Walgreen Company | | | | | | | 1,370 | | | | 93,996 | |
| | | | |
| | | | | | | | | | | 2,589,080 | |
| | | | | | | | | | | | |
| | | | |
| Household Products: 0.42% | | | | | | | | | | | | |
Colgate-Palmolive Company | | | | | | | 8,180 | | | | 569,246 | |
| | | | | | | | | | | | |
| | | | |
| Personal Products: 0.63% | | | | | | | | | | | | |
Estee Lauder Companies Incorporated Class A | | | | | | | 11,370 | | | | 842,972 | |
| | | | | | | | | | | | |
| | | | |
Energy: 4.39% | | | | | | | | | | | | |
| | | | |
| Energy Equipment & Services: 1.10% | | | | | | | | | | | | |
Halliburton Company | | | | | | | 14,080 | | | | 594,176 | |
Schlumberger Limited | | | | | | | 10,280 | | | | 883,566 | |
| | | | |
| | | | | | | | | | | 1,477,742 | |
| | | | | | | | | | | | |
| | | | |
| Oil, Gas & Consumable Fuels: 3.29% | | | | | | | | | | | | |
Antero Resources Corporation † | | | | | | | 13,592 | | | | 637,737 | |
Concho Resources Incorporated † | | | | | | | 14,460 | | | | 1,377,315 | |
Continental Resources Incorporated †« | | | | | | | 2,250 | | | | 92,205 | |
EOG Resources Incorporated | | | | | | | 4,830 | | | | 418,858 | |
Memorial Resource Development Corporation † | | | | | | | 5,877 | | | | 126,943 | |
Pioneer Natural Resources Company | | | | | | | 11,610 | | | | 1,662,900 | |
Whiting Petroleum Corporation † | | | | | | | 2,500 | | | | 104,425 | |
| | | | |
| | | | | | | | | | | 4,420,383 | |
| | | | | | | | | | | | |
| | | | |
Financials: 6.32% | | | | | | | | | | | | |
| | | | |
| Capital Markets: 2.71% | | | | | | | | | | | | |
Affiliated Managers Group Incorporated † | | | | | | | 4,660 | | | | 948,729 | |
Ameriprise Financial Incorporated | | | | | | | 5,890 | | | | 776,125 | |
Northern Trust Corporation | | | | | | | 4,410 | | | | 298,689 | |
TD Ameritrade Holding Corporation | | | | | | | 46,710 | | | | 1,616,633 | |
| | | | |
| | | | | | | | | | | 3,640,176 | |
| | | | | | | | | | | | |
The accompanying notes are an integral part of these financial statements.
| | | | | | |
| Portfolio of investments—November 30, 2014 (unaudited) | | Wells Fargo Advantage Allocation Funds | | | 33 | |
DIVERSIFIED LARGE CAP GROWTH PORTFOLIO
| | | | | | | | | | | | |
| Security name | | | | | | Shares | | | Value | |
| | | | |
| Consumer Finance: 2.11% | | | | | | | | | | | | |
American Express Company | | | | | | | 16,470 | | | $ | 1,522,157 | |
Discover Financial Services | | | | | | | 20,110 | | | | 1,318,211 | |
| | | | |
| | | | | | | | | | | 2,840,368 | |
| | | | | | | | | | | | |
| | | | |
| Diversified Financial Services: 1.05% | | | | | | | | | | | | |
IntercontinentalExchange Group Incorporated | | | | | | | 6,220 | | | | 1,405,658 | |
| | | | | | | | | | | | |
| | | | |
| REITs: 0.45% | | | | | | | | | | | | |
American Tower Corporation | | | | | | | 5,770 | | | | 605,908 | |
| | | | | | | | | | | | |
| | | | |
Health Care: 15.83% | | | | | | | | | | | | |
| | | | |
| Biotechnology: 8.39% | | | | | | | | | | | | |
Alexion Pharmaceuticals Incorporated † | | | | | | | 13,850 | | | | 2,699,365 | |
Biogen Idec Incorporated † | | | | | | | 8,310 | | | | 2,556,904 | |
BioMarin Pharmaceutical Incorporated † | | | | | | | 2,030 | | | | 182,132 | |
Celgene Corporation † | | | | | | | 23,560 | | | | 2,678,536 | |
Gilead Sciences Incorporated † | | | | | | | 13,230 | | | | 1,327,234 | |
Medivation Incorporated † | | | | | | | 2,610 | | | | 302,473 | |
Regeneron Pharmaceuticals Incorporated † | | | | | | | 3,660 | | | | 1,522,963 | |
| | | | |
| | | | | | | | | | | 11,269,607 | |
| | | | | | | | | | | | |
| | | | |
| Health Care Equipment & Supplies: 0.89% | | | | | | | | | | | | |
Covidien plc | | | | | | | 11,820 | | | | 1,193,820 | |
| | | | | | | | | | | | |
| | | | |
| Health Care Providers & Services: 1.92% | | | | | | | | | | | | |
AmerisourceBergen Corporation | | | | | | | 11,463 | | | | 1,043,706 | |
Envision Healthcare Holdings Incorporated † | | | | | | | 7,057 | | | | 249,536 | |
McKesson Corporation | | | | | | | 6,110 | | | | 1,287,744 | |
| | | | |
| | | | | | | | | | | 2,580,986 | |
| | | | | | | | | | | | |
| | | | |
| Health Care Technology: 1.04% | | | | | | | | | | | | |
Cerner Corporation † | | | | | | | 21,690 | | | | 1,396,836 | |
| | | | | | | | | | | | |
| | | | |
| Life Sciences Tools & Services: 0.52% | | | | | | | | | | | | |
Mettler-Toledo International Incorporated † | | | | | | | 1,570 | | | | 460,418 | |
Quintiles Transnational Holdings Incorporated † | | | | | | | 4,054 | | | | 234,402 | |
| | | | |
| | | | | | | | | | | 694,820 | |
| | | | | | | | | | | | |
| | | | |
| Pharmaceuticals: 3.07% | | | | | | | | | | | | |
AbbVie Incorporated | | | | | | | 18,060 | | | | 1,249,752 | |
Jazz Pharmaceuticals plc † | | | | | | | 360 | | | | 63,752 | |
Merck & Company Incorporated | | | | | | | 9,070 | | | | 547,828 | |
Perrigo Company plc | | | | | | | 14,150 | | | | 2,266,688 | |
| | | | |
| | | | | | | | | | | 4,128,020 | |
| | | | | | | | | | | | |
The accompanying notes are an integral part of these financial statements.
| | | | |
| 34 | | Wells Fargo Advantage Allocation Funds | | Portfolio of investments—November 30, 2014 (unaudited) |
DIVERSIFIED LARGE CAP GROWTH PORTFOLIO
| | | | | | | | | | | | |
| Security name | | | | | | Shares | | | Value | |
| | | | |
Industrials: 11.17% | | | | | | | | | | | | |
| | | | |
| Aerospace & Defense: 1.39% | | | | | | | | | | | | |
Precision Castparts Corporation | | | | | | | 2,370 | | | $ | 563,823 | |
The Boeing Company | | | | | | | 4,630 | | | | 622,087 | |
United Technologies Corporation | | | | | | | 6,170 | | | | 679,194 | |
| | | | |
| | | | | | | | | | | 1,865,104 | |
| | | | | | | | | | | | |
| | | | |
| Air Freight & Logistics: 0.81% | | | | | | | | | | | | |
United Parcel Service Incorporated Class B | | | | | | | 9,900 | | | | 1,088,208 | |
| | | | | | | | | | | | |
| | | | |
| Airlines: 1.16% | | | | | | | | | | | | |
Delta Air Lines Incorporated | | | | | | | 18,630 | | | | 869,462 | |
Southwest Airlines Company | | | | | | | 16,440 | | | | 687,521 | |
| | | | |
| | | | | | | | | | | 1,556,983 | |
| | | | | | | | | | | | |
| | | | |
| Commercial Services & Supplies: 0.35% | | | | | | | | | | | | |
Tyco International plc | | | | | | | 10,900 | | | | 467,610 | |
| | | | | | | | | | | | |
| | | | |
| Electrical Equipment: 0.25% | | | | | | | | | | | | |
Rockwell Automation Incorporated | | | | | | | 2,920 | | | | 336,997 | |
| | | | | | | | | | | | |
| | | | |
| Industrial Conglomerates: 0.90% | | | | | | | | | | | | |
3M Company | | | | | | | 3,220 | | | | 515,490 | |
Danaher Corporation | | | | | | | 8,280 | | | | 691,877 | |
| | | | |
| | | | | | | | | | | 1,207,367 | |
| | | | | | | | | | | | |
| | | | |
| Machinery: 1.03% | | | | | | | | | | | | |
Cummins Incorporated | | | | | | | 6,416 | | | | 934,298 | |
Flowserve Corporation | | | | | | | 4,110 | | | | 241,956 | |
Pentair plc | | | | | | | 3,220 | | | | 208,366 | |
| | | | |
| | | | | | | | | | | 1,384,620 | |
| | | | | | | | | | | | |
| | | | |
| Road & Rail: 4.61% | | | | | | | | | | | | |
Canadian Pacific Railway Limited | | | | | | | 4,540 | | | | 876,946 | |
CSX Corporation | | | | | | | 16,990 | | | | 619,965 | |
Genesee & Wyoming Incorporated Class A † | | | | | | | 3,330 | | | | 328,305 | |
Kansas City Southern | | | | | | | 6,890 | | | | 819,497 | |
Norfolk Southern Corporation | | | | | | | 10,510 | | | | 1,173,336 | |
Union Pacific Corporation | | | | | | | 20,390 | | | | 2,380,940 | |
| | | | |
| | | | | | | | | | | 6,198,989 | |
| | | | | | | | | | | | |
| | | | |
| Trading Companies & Distributors: 0.67% | | | | | | | | | | | | |
W.W. Grainger Incorporated | | | | | | | 3,650 | | | | 896,732 | |
| | | | | | | | | | | | |
| | | | |
Information Technology: 27.66% | | | | | | | | | | | | |
| | | | |
| Communications Equipment: 1.81% | | | | | | | | | | | | |
Cisco Systems Incorporated | | | | | | | 12,120 | | | | 334,997 | |
F5 Networks Incorporated † | | | | | | | 2,500 | | | | 322,975 | |
Palo Alto Networks Incorporated † | | | | | | | 5,772 | | | | 709,956 | |
QUALCOMM Incorporated | | | | | | | 14,541 | | | | 1,060,039 | |
| | | | |
| | | | | | | | | | | 2,427,967 | |
| | | | | | | | | | | | |
The accompanying notes are an integral part of these financial statements.
| | | | | | |
| Portfolio of investments—November 30, 2014 (unaudited) | | Wells Fargo Advantage Allocation Funds | | | 35 | |
DIVERSIFIED LARGE CAP GROWTH PORTFOLIO
| | | | | | | | | | | | |
| Security name | | | | | | Shares | | | Value | |
| | | | |
| Electronic Equipment, Instruments & Components: 0.72% | | | | | | | | | | | | |
TE Connectivity Limited | | | | | | | 15,040 | | | $ | 965,568 | |
| | | | | | | | | | | | |
| | | | |
| Internet Software & Services: 8.36% | | | | | | | | | | | | |
Akamai Technologies Incorporated † | | | | | | | 14,560 | | | | 940,722 | |
Alibaba Group Holding Limited ADR † | | | | | | | 3,770 | | | | 420,883 | |
Facebook Incorporated Class A † | | | | | | | 51,660 | | | | 4,013,982 | |
Google Incorporated Class A † | | | | | | | 4,644 | | | | 2,549,928 | |
Google Incorporated Class C † | | | | | | | 5,014 | | | | 2,716,736 | |
Pandora Media Incorporated † | | | | | | | 26,150 | | | | 514,109 | |
Twitter Incorporated † | | | | | | | 1,750 | | | | 73,045 | |
| | | | |
| | | | | | | | | | | 11,229,405 | |
| | | | | | | | | | | | |
| | | | |
| IT Services: 5.34% | | | | | | | | | | | | |
Accenture plc | | | | | | | 9,420 | | | | 813,229 | |
Alliance Data Systems Corporation † | | | | | | | 5,170 | | | | 1,477,948 | |
MasterCard Incorporated Class A | | | | | | | 22,600 | | | | 1,972,754 | |
Visa Incorporated Class A | | | | | | | 11,260 | | | | 2,907,219 | |
| | | | |
| | | | | | | | | | | 7,171,150 | |
| | | | | | | | | | | | |
| | | | |
| Semiconductors & Semiconductor Equipment: 3.07% | | | | | | | | | | | | |
ARM Holdings plc ADR | | | | | | | 14,120 | | | | 604,901 | |
Microchip Technology Incorporated « | | | | | | | 34,870 | | | | 1,574,381 | |
Micron Technology Incorporated † | | | | | | | 32,950 | | | | 1,184,553 | |
Texas Instruments Incorporated | | | | | | | 14,110 | | | | 767,866 | |
| | | | |
| | | | | | | | | | | 4,131,701 | |
| | | | | | | | | | | | |
| | | | |
| Software: 4.09% | | | | | | | | | | | | |
Adobe Systems Incorporated † | | | | | | | 8,430 | | | | 621,122 | |
Microsoft Corporation | | | | | | | 19,150 | | | | 915,562 | |
Salesforce.com Incorporated † | | | | | | | 34,114 | | | | 2,042,405 | |
ServiceNow Incorporated † | | | | | | | 21,000 | | | | 1,343,160 | |
Splunk Incorporated † | | | | | | | 6,460 | | | | 433,466 | |
Tableau Software Incorporated Class A † | | | | | | | 1,650 | | | | 138,402 | |
| | | | |
| | | | | | | | | | | 5,494,117 | |
| | | | | | | | | | | | |
| | | | |
| Technology Hardware, Storage & Peripherals: 4.27% | | | | | | | | | | | | |
Apple Incorporated | | | | | | | 41,207 | | | | 4,900,749 | |
Western Digital Corporation | | | | | | | 8,120 | | | | 838,552 | |
| | | | |
| | | | | | | | | | | 5,739,301 | |
| | | | | | | | | | | | |
| | | | |
Materials: 3.13% | | | | | | | | | | | | |
| | | | |
| Chemicals: 3.13% | | | | | | | | | | | | |
Airgas Incorporated | | | | | | | 1,480 | | | | 171,132 | |
Ecolab Incorporated | | | | | | | 6,230 | | | | 678,754 | |
Monsanto Company | | | | | | | 13,740 | | | | 1,647,563 | |
Praxair Incorporated | | | | | | | 13,270 | | | | 1,703,603 | |
| | | | |
| | | | | | | | | | | 4,201,052 | |
| | | | | | | | | | | | |
The accompanying notes are an integral part of these financial statements.
| | | | |
| 36 | | Wells Fargo Advantage Allocation Funds | | Portfolio of investments—November 30, 2014 (unaudited) |
DIVERSIFIED LARGE CAP GROWTH PORTFOLIO
| | | | | | | | | | | | | | | | |
| Security name | | | | | | | | | Shares | | | Value | |
| | | | | |
Telecommunication Services: 1.12% | | | | | | | | | | | | | | | | |
| | | | | |
| Wireless Telecommunication Services: 1.12% | | | | | | | | | | | | | | | | |
SBA Communications Corporation Class A † | | | | | | | | | | | 12,333 | | | $ | 1,500,556 | |
| | | | | | | | | | | | | | | | |
| | | | | |
Total Common Stocks (Cost $87,975,922) | | | | | | | | | | | | | | | 133,173,819 | |
| | | | | | | | | | | | | | | | |
| | | | | |
| | | Yield | | | | | | | | | | | |
| | | | | |
Short-Term Investments: 2.42% | | | | | | | | | | | | | | | | |
| | | | | |
| Investment Companies: 2.42% | | | | | | | | | | | | | | | | |
Securities Lending Cash Investments, LLC (r)(l)(u) | | | 0.12 | % | | | | | | | 1,815,925 | | | | 1,815,925 | |
Wells Fargo Advantage Cash Investment Money Market Fund, Select Class (l)(u) | | | 0.08 | | | | | | | | 1,435,598 | | | | 1,435,598 | |
| | | | | |
Total Short-Term Investments (Cost $3,251,523) | | | | | | | | | | | | | | | 3,251,523 | |
| | | | | | | | | | | | | | | | |
| | | | | | | | |
| Total investments in securities (Cost $91,227,445) * | | | 101.56 | % | | | 136,425,342 | |
Other assets and liabilities, net | | | (1.56 | ) | | | (2,099,469 | ) |
| | | | | | | | |
| Total net assets | | | 100.00 | % | | $ | 134,325,873 | |
| | | | | | | | |
| † | Non-income-earning security |
| « | All or a portion of this security is on loan. |
| (r) | The investment is a non-registered investment vehicle purchased with cash collateral received from securities on loan. |
| (l) | The security represents an affiliate of the Portfolio as defined in the Investment Company Act of 1940. |
| (u) | The rate represents the 7-day annualized yield at period end. |
| * | Cost for federal income tax purposes is $91,565,195 and unrealized gains (losses) consists of: |
| | | | |
Gross unrealized gains | | $ | 46,274,226 | |
Gross unrealized losses | | | (1,414,079 | ) |
| | | | |
Net unrealized gains | | $ | 44,860,147 | |
The accompanying notes are an integral part of these financial statements.
| | | | | | |
| Portfolio of investments—November 30, 2014 (unaudited) | | Wells Fargo Advantage Allocation Funds | | | 37 | |
EMERGING GROWTH PORTFOLIO
| | | | | | | | | | | | |
| Security name | | | | | | Shares | | | Value | |
| | | | |
Common Stocks: 99.54% | | | | | | | | | | | | |
| | | | |
Consumer Discretionary: 12.72% | | | | | | | | | | | | |
| | | | |
| Auto Components: 2.66% | | | | | | | | | | | | |
Gentherm Incorporated † | | | | | | | 534,700 | | | $ | 20,152,843 | |
Motorcar Parts of America Incorporated † | | | | | | | 285,572 | | | | 9,638,055 | |
| | | | |
| | | | | | | | | | | 29,790,898 | |
| | | | | | | | | | | | |
| | | | |
| Diversified Consumer Services: 2.00% | | | | | | | | | | | | |
Grand Canyon Education Incorporated † | | | | | | | 385,600 | | | | 17,610,352 | |
LifeLock Incorporated † | | | | | | | 289,700 | | | | 4,782,947 | |
| | | | |
| | | | | | | | | | | 22,393,299 | |
| | | | | | | | | | | | |
| | | | |
| Hotels, Restaurants & Leisure: 3.79% | | | | | | | | | | | | |
Fiesta Restaurant Group Incorporated † | | | | | | | 464,155 | | | | 26,020,529 | |
Jack In the Box Incorporated | | | | | | | 63,000 | | | | 4,693,500 | |
The Habit Restaurants Incorporated Class A † | | | | | | | 105,453 | | | | 3,418,786 | |
Zoe’s Kitchen Incorporated «† | | | | | | | 262,630 | | | | 8,306,987 | |
| | | | |
| | | | | | | | | | | 42,439,802 | |
| | | | | | | | | | | | |
| | | | |
| Internet & Catalog Retail: 0.15% | | | | | | | | | | | | |
RetailMeNot Incorporated Ǡ | | | | | | | 116,307 | | | | 1,712,621 | |
| | | | | | | | | | | | |
| | | | |
| Media: 1.10% | | | | | | | | | | | | |
IMAX Corporation † | | | | | | | 391,510 | | | | 12,285,584 | |
| | | | | | | | | | | | |
| | | | |
| Specialty Retail: 1.67% | | | | | | | | | | | | |
Boot Barn Holdings Incorporated † | | | | | | | 176,379 | | | | 3,809,786 | |
Five Below Incorporated Ǡ | | | | | | | 320,697 | | | | 14,963,722 | |
| | | | |
| | | | | | | | | | | 18,773,508 | |
| | | | | | | | | | | | |
| | | | |
| Textiles, Apparel & Luxury Goods: 1.35% | | | | | | | | | | | | |
G-III Apparel Group Limited † | | | | | | | 170,600 | | | | 15,096,394 | |
| | | | | | | | | | | | |
| | | | |
Consumer Staples: 1.47% | | | | | | | | | | | | |
| | | | |
| Food & Staples Retailing: 1.47% | | | | | | | | | | | | |
Diplomat Pharmacy Incorporated † | | | | | | | 137,726 | | | | 3,699,320 | |
United Natural Foods Incorporated † | | | | | | | 170,240 | | | | 12,800,346 | |
| | | | |
| | | | | | | | | | | 16,499,666 | |
| | | | | | | | | | | | |
| | | | |
Energy: 2.90% | | | | | | | | | | | | |
| | | | |
| Energy Equipment & Services: 0.05% | | | | | | | | | | | | |
RigNet Incorporated † | | | | | | | 12,800 | | | | 524,160 | |
| | | | | | | | | | | | |
| | | | |
| Oil, Gas & Consumable Fuels: 2.85% | | | | | | | | | | | | |
Bonanza Creek Energy Incorporated † | | | | | | | 172,500 | | | | 4,695,450 | |
Diamondback Energy Incorporated † | | | | | | | 154,957 | | | | 8,739,575 | |
Oasis Petroleum Incorporated † | | | | | | | 173,600 | | | | 3,190,768 | |
Parsley Energy Incorporated Class A † | | | | | | | 462,048 | | | | 5,840,287 | |
RSP Permian Incorporated Ǡ | | | | | | | 437,788 | | | | 9,526,267 | |
| | | | |
| | | | | | | | | | | 31,992,347 | |
| | | | | | | | | | | | |
The accompanying notes are an integral part of these financial statements.
| | | | |
| 38 | | Wells Fargo Advantage Allocation Funds | | Portfolio of investments—November 30, 2014 (unaudited) |
EMERGING GROWTH PORTFOLIO
| | | | | | | | | | | | |
| Security name | | | | | | Shares | | | Value | |
| | | | |
Financials: 7.71% | | | | | | | | | | | | |
| | | | |
| Capital Markets: 1.60% | | | | | | | | | | | | |
Financial Engines Incorporated « | | | | | | | 547,630 | | | $ | 17,896,548 | |
| | | | | | | | | | | | |
| | | | |
| Consumer Finance: 2.87% | | | | | | | | | | | | |
Encore Capital Group Incorporated Ǡ | | | | | | | 149,600 | | | | 6,419,336 | |
PRA Group Incorporated † | | | | | | | 439,800 | | | | 25,737,096 | |
| | | | |
| | | | | | | | | | | 32,156,432 | |
| | | | | | | | | | | | |
| | | | |
| Diversified Financial Services: 3.24% | | | | | | | | | | | | |
MarketAxess Holdings Incorporated | | | | | | | 552,671 | | | | 36,238,637 | |
| | | | | | | | | | | | |
| | | | |
Health Care: 31.09% | | | | | | | | | | | | |
| | | | |
| Biotechnology: 3.36% | | | | | | | | | | | | |
Exact Sciences Corporation Ǡ | | | | | | | 177,453 | | | | 4,404,383 | |
Hyperion Therapeutics Incorporated † | | | | | | | 239,823 | | | | 4,913,973 | |
Ligand Pharmaceuticals Incorporated † | | | | | | | 65,100 | | | | 3,505,635 | |
NPS Pharmaceuticals Incorporated † | | | | | | | 434,100 | | | | 14,403,438 | |
PTC Therapeutics Incorporated † | | | | | | | 207,700 | | | | 9,294,575 | |
Repligen Corporation † | | | | | | | 48,600 | | | | 1,111,482 | |
| | | | |
| | | | | | | | | | | 37,633,486 | |
| | | | | | | | | | | | |
| | | | |
| Health Care Equipment & Supplies: 10.59% | | | | | | | | | | | | |
Align Technology Incorporated † | | | | | | | 94,200 | | | | 5,359,980 | |
Cardiovascular Systems Incorporated † | | | | | | | 584,558 | | | | 17,922,548 | |
Cynosure Incorporated Class A † | | | | | | | 616,678 | | | | 17,001,812 | |
DexCom Incorporated † | | | | | | | 439,900 | | | | 22,637,254 | |
Endologix Incorporated † | | | | | | | 618,094 | | | | 7,930,146 | |
Insulet Corporation † | | | | | | | 164,300 | | | | 7,654,737 | |
NxStage Medical Incorporated † | | | | | | | 372,460 | | | | 6,436,109 | |
Oxford Immunotec Global plc † | | | | | | | 264,771 | | | | 3,463,205 | |
Spectranetics Corporation Ǡ | | | | | | | 773,614 | | | | 25,397,748 | |
Tandem Diabetes Care Incorporated Ǡ | | | | | | | 337,737 | | | | 4,772,224 | |
| | | | |
| | | | | | | | | | | 118,575,763 | |
| | | | | | | | | | | | |
| | | | |
| Health Care Providers & Services: 9.84% | | | | | | | | | | | | |
AAC Holdings Incorporated Ǡ | | | | | | | 229,581 | | | | 6,625,708 | |
Acadia Healthcare Company Incorporated † | | | | | | | 588,960 | | | | 36,521,409 | |
Adeptus Health Incorporated Class A † | | | | | | | 231,601 | | | | 7,049,934 | |
ExamWorks Group Incorporated † | | | | | | | 697,028 | | | | 27,428,052 | |
HealthEquity Incorporated † | | | | | | | 217,602 | | | | 5,403,058 | |
MWI Veterinary Supply Incorporated † | | | | | | | 98,300 | | | | 16,064,186 | |
Team Health Holdings Incorporated † | | | | | | | 195,300 | | | | 11,163,348 | |
| | | | |
| | | | | | | | | | | 110,255,695 | |
| | | | | | | | | | | | |
| | | | |
| Health Care Technology: 0.95% | | | | | | | | | | | | |
Medidata Solutions Incorporated † | | | | | | | 248,400 | | | | 10,609,164 | |
| | | | | | | | | | | | |
The accompanying notes are an integral part of these financial statements.
| | | | | | |
| Portfolio of investments—November 30, 2014 (unaudited) | | Wells Fargo Advantage Allocation Funds | | | 39 | |
EMERGING GROWTH PORTFOLIO
| | | | | | | | | | | | |
| Security name | | | | | | Shares | | | Value | |
| | | | |
| Life Sciences Tools & Services: 1.22% | | | | | | | | | | | | |
ICON plc ADR † | | | | | | | 187,800 | | | $ | 10,430,412 | |
INC Research Holdings Incorporated Class A † | | | | | | | 132,129 | | | | 3,222,626 | |
| | | | |
| | | | | | | | | | | 13,653,038 | |
| | | | | | | | | | | | |
| | | | |
| Pharmaceuticals: 5.13% | | | | | | | | | | | | |
Akorn Incorporated Ǡ | | | | | | | 841,434 | | | | 33,716,260 | |
ANI Pharmaceuticals Incorporated † | | | | | | | 200,200 | | | | 10,832,822 | |
BioDelivery Sciences International Incorporated † | | | | | | | 427,600 | | | | 6,563,660 | |
Intersect ENT Incorporated † | | | | | | | 309,475 | | | | 5,353,918 | |
Lannett Company Incorporated † | | | | | | | 20,969 | | | | 1,030,207 | |
| | | | |
| | | | | | | | | | | 57,496,867 | |
| | | | | | | | | | | | |
| | | | |
Industrials: 10.59% | | | | | | | | | | | | |
| | | | |
| Aerospace & Defense: 1.01% | | | | | | | | | | | | |
TASER International Incorporated Ǡ | | | | | | | 528,100 | | | | 11,343,588 | |
| | | | | | | | | | | | |
| | | | |
| Electrical Equipment: 1.69% | | | | | | | | | | | | |
Power Solutions International Incorporated Ǡ | | | | | | | 289,199 | | | | 18,985,914 | |
| | | | | | | | | | | | |
| | | | |
| Machinery: 1.54% | | | | | | | | | | | | |
Proto Labs Incorporated † | | | | | | | 97,855 | | | | 6,350,790 | |
The Middleby Corporation † | | | | | | | 113,450 | | | | 10,850,358 | |
| | | | |
| | | | | | | | | | | 17,201,148 | |
| | | | | | | | | | | | |
| | | | |
| Professional Services: 3.97% | | | | | | | | | | | | |
Corporate Executive Board Company | | | | | | | 76,046 | | | | 5,567,328 | |
On Assignment Incorporated † | | | | | | | 670,113 | | | | 20,592,572 | |
Paylocity Holding Corporation Ǡ | | | | | | | 251,133 | | | | 7,305,459 | |
Wageworks Incorporated † | | | | | | | 188,750 | | | | 11,026,775 | |
| | | | |
| | | | | | | | | | | 44,492,134 | |
| | | | | | | | | | | | |
| | | | |
| Road & Rail: 1.13% | | | | | | | | | | | | |
Saia Incorporated † | | | | | | | 227,900 | | | | 12,641,613 | |
| | | | | | | | | | | | |
| | | | |
| Trading Companies & Distributors: 1.25% | | | | | | | | | | | | |
DXP Enterprises Incorporated † | | | | | | | 51,516 | | | | 3,027,080 | |
H&E Equipment Services Incorporated | | | | | | | 312,600 | | | | 10,941,000 | |
| | | | |
| | | | | | | | | | | 13,968,080 | |
| | | | | | | | | | | | |
| | | | |
Information Technology: 32.56% | | | | | | | | | | | | |
| | | | |
| Electronic Equipment, Instruments & Components: 1.62% | | | | | | | | | | | | |
Cognex Corporation † | | | | | | | 254,700 | | | | 10,368,837 | |
Universal Display Corporation Ǡ | | | | | | | 278,300 | | | | 7,720,042 | |
| | | | |
| | | | | | | | | | | 18,088,879 | |
| | | | | | | | | | | | |
| | | | |
| Internet Software & Services: 12.58% | | | | | | | | | | | | |
Borderfree Incorporated † | | | | | | | 680,539 | | | | 6,812,195 | |
ChannelAdvisor Corporation Ǡ | | | | | | | 381,500 | | | | 6,714,400 | |
DealerTrack Holdings Incorporated † | | | | | | | 362,900 | | | | 17,114,364 | |
Demandware Incorporated † | | | | | | | 371,500 | | | | 20,804,000 | |
The accompanying notes are an integral part of these financial statements.
| | | | |
| 40 | | Wells Fargo Advantage Allocation Funds | | Portfolio of investments—November 30, 2014 (unaudited) |
EMERGING GROWTH PORTFOLIO
| | | | | | | | | | | | | | | | |
| Security name | | | | | | | | | Shares | | | Value | |
| | | | | |
| Internet Software & Services (continued) | | | | | | | | | | | | | | | | |
Envestnet Incorporated † | | | | | | | | | | | 689,492 | | | $ | 35,267,516 | |
HomeAway Incorporated † | | | | | | | | | | | 585,845 | | | | 18,372,099 | |
Q2 Holdings Incorporated † | | | | | | | | | | | 367,249 | | | | 6,827,159 | |
SPS Commerce Incorporated † | | | | | | | | | | | 497,432 | | | | 28,990,337 | |
| | | | | |
| | | | | | | | | | | | | | | 140,902,070 | |
| | | | | | | | | | | | | | | | |
| | | | | |
| IT Services: 2.85% | | | | | | | | | | | | | | | | |
iGATE Corporation † | | | | | | | | | | | 184,500 | | | | 6,817,275 | |
InterXion Holding NV † | | | | | | | | | | | 286,400 | | | | 7,981,968 | |
Maximus Incorporated | | | | | | | | | | | 185,200 | | | | 9,702,628 | |
Wex Incorporated † | | | | | | | | | | | 65,821 | | | | 7,443,039 | |
| | | | | |
| | | | | | | | | | | | | | | 31,944,910 | |
| | | | | | | | | | | | | | | | |
| | | | | |
| Semiconductors & Semiconductor Equipment: 2.31% | | | | | | | | | | | | | | | | |
Cavium Incorporated † | | | | | | | | | | | 203,900 | | | | 11,540,740 | |
Veeco Instruments Incorporated † | | | | | | | | | | | 383,900 | | | | 14,361,699 | |
| | | | | |
| | | | | | | | | | | | | | | 25,902,439 | |
| | | | | | | | | | | | | | | | |
| | | | | |
| Software: 13.20% | | | | | | | | | | | | | | | | |
Aspen Technology Incorporated † | | | | | | | | | | | 81,700 | | | | 3,083,358 | |
Callidus Software Incorporated † | | | | | | | | | | | 785,950 | | | | 12,551,622 | |
Fleetmatics Group plc Ǡ | | | | | | | | | | | 626,720 | | | | 22,054,277 | |
Guidewire Software Incorporated † | | | | | | | | | | | 243,801 | | | | 12,304,636 | |
HubSpot Incorporated † | | | | | | | | | | | 96,803 | | | | 3,425,858 | |
MobileIron Incorporated Ǡ | | | | | | | | | | | 840,888 | | | | 7,795,032 | |
Proofpoint Incorporated † | | | | | | | | | | | 749,140 | | | | 32,527,659 | |
PROS Holdings Incorporated † | | | | | | | | | | | 439,422 | | | | 12,567,469 | |
Synchronoss Technologies Incorporated † | | | | | | | | | | | 367,801 | | | | 15,752,917 | |
Tyler Technologies Incorporated † | | | | | | | | | | | 104,425 | | | | 11,338,467 | |
Ultimate Software Group Incorporated † | | | | | | | | | | | 98,170 | | | | 14,454,551 | |
| | | | | |
| | | | | | | | | | | | | | | 147,855,846 | |
| | | | | | | | | | | | | | | | |
| | | | | |
Materials: 0.50% | | | | | | | | | | | | | | | | |
| | | | | |
| Chemicals: 0.50% | | | | | | | | | | | | | | | | |
Balchem Corporation | | | | | | | | | | | 86,300 | | | | 5,609,500 | |
| | | | | | | | | | | | | | | | |
| | | | | |
Total Common Stocks (Cost $797,241,970) | | | | | | | | | | | | | | | 1,114,960,030 | |
| | | | | | | | | | | | | | | | |
| | | | | |
| | | Yield | | | | | | | | | | | |
| | | | | |
Short-Term Investments: 12.22% | | | | | | | | | | | | | | | | |
| | | | | |
| Investment Companies: 12.22% | | | | | | | | | | | | | | | | |
Securities Lending Cash Investments, LLC (l)(u)(r) | | | 0.12 | % | | | | | | | 130,887,098 | | | | 130,887,098 | |
Wells Fargo Advantage Cash Investment Money Market Fund, Select Class (l)(u) | | | 0.08 | | | | | | | | 5,987,366 | | | | 5,987,366 | |
| | | | | |
Total Short-Term Investments (Cost $136,874,464) | | | | | | | | | | | | | | | 136,874,464 | |
| | | | | | | | | | | | | | | | |
| | | | | | | | |
| Total investments in securities (Cost $934,116,434) * | | | 111.76 | % | | | 1,251,834,494 | |
Other assets and liabilities, net | | | (11.76 | ) | | | (131,745,558 | ) |
| | | | | | | | |
| Total net assets | | | 100.00 | % | | $ | 1,120,088,936 | |
| | | | | | | | |
The accompanying notes are an integral part of these financial statements.
| | | | | | |
| Portfolio of investments—November 30, 2014 (unaudited) | | Wells Fargo Advantage Allocation Funds | | | 41 | |
EMERGING GROWTH PORTFOLIO
| † | Non-income-earning security |
| « | All or a portion of this security is on loan. |
| (l) | The security represents an affiliate of the Portfolio as defined in the Investment Company Act of 1940. |
| (u) | The rate represents the 7-day annualized yield at period end. |
| (r) | The investment is a non-registered investment vehicle purchased with cash collateral received from securities on loan. |
| * | Cost for federal income tax purposes is $936,487,448 and unrealized gains (losses) consists of: |
| | | | |
Gross unrealized gains | | $ | 344,568,180 | |
Gross unrealized losses | | | (29,221,134 | ) |
| | | | |
Net unrealized gains | | $ | 315,347,046 | |
The accompanying notes are an integral part of these financial statements.
| | | | |
| 42 | | Wells Fargo Advantage Allocation Funds | | Summary portfolio of investments—November 30, 2014 (unaudited) |
INDEX PORTFOLIO
The Summary Portfolio of Investments shows the 50 largest portfolio holdings in unaffiliated issuers and any holdings exceeding 1% of the total net assets as of the report date. The remaining securities held are grouped as “Other securities” in each category. You can request a complete schedule of portfolio holdings as of the report date, free of charge, by accessing the following website: http://a584.g.akamai.net/f/584/1326/1d/www.wellsfargoadvantagefunds.com/pdf/semi/holdings/index.pdf or by calling Wells Fargo Advantage Funds at 1-800-222-8222. This complete schedule, filed on Form N-CSRS, is also available on the SEC’s website at sec.gov.
| | | | | | | | | | | | | | | | |
| Security name | | | | | | Shares | | | Value | | | Percent of
net assets | |
| | | | | |
Common Stocks: 98.72% | | | | | | | | | | | | | | | | |
| | | | | |
Consumer Discretionary: 11.80% | | | | | | | | | | | | | | | | |
| | | | | |
| Auto Components: 0.41% | | | | | | | | | | | | | | | | |
Other securities | | | | | | | | | | $ | 11,700,990 | | | | 0.41 | % |
| | | | | | | | | | | | | | | | |
| | | | | |
| Automobiles: 0.65% | | | | | | | | | | | | | | | | |
Other securities | | | | | | | | | | | 18,756,441 | | | | 0.65 | |
| | | | | | | | | | | | | | | | |
| | | | | |
| Distributors: 0.08% | | | | | | | | | | | | | | | | |
Other securities | | | | | | | | | | | 2,434,550 | | | | 0.08 | |
| | | | | | | | | | | | | | | | |
| | | | | |
| Diversified Consumer Services: 0.05% | | | | | | | | | | | | | | | | |
Other securities | | | | | | | | | | | 1,431,853 | | | | 0.05 | |
| | | | | | | | | | | | | | | | |
| | | | | |
| Hotels, Restaurants & Leisure: 1.58% | | | | | | | | | | | | | | | | |
McDonald’s Corporation | | | | | | | 151,931 | | | | 14,708,440 | | | | 0.51 | |
Other securities | | | | | | | | | | | 30,817,521 | | | | 1.07 | |
| | | | | |
| | | | | | | | | | | 45,525,961 | | | | 1.58 | |
| | | | | | | | | | | | | | | | |
| | | | | |
| Household Durables: 0.42% | | | | | | | | | | | | | | | | |
Other securities | | | | | | | | | | | 12,109,918 | | | | 0.42 | |
| | | | | | | | | | | | | | | | |
| | | | | |
| Internet & Catalog Retail: 1.22% | | | | | | | | | | | | | | | | |
Amazon.com Incorporated † | | | | | | | 58,621 | | | | 19,851,415 | | | | 0.69 | |
Other securities | | | | | | | | | | | 15,241,491 | | | | 0.53 | |
| | | | | |
| | | | | | | | | | | 35,092,906 | | | | 1.22 | |
| | | | | | | | | | | | | | | | |
| | | | | |
| Leisure Products: 0.09% | | | | | | | | | | | | | | | | |
Other securities | | | | | | | | | | | 2,700,223 | | | | 0.09 | |
| | | | | | | | | | | | | | | | |
| | | | | |
| Media: 3.47% | | | | | | | | | | | | | | | | |
Comcast Corporation Class A | | | | | | | 400,450 | | | | 22,841,668 | | | | 0.79 | |
The Walt Disney Company | | | | | | | 244,348 | | | | 22,604,633 | | | | 0.78 | |
Other securities | | | | | | | | | | | 54,635,756 | | | | 1.90 | |
| | | | | |
| | | | | | | | | | | 100,082,057 | | | | 3.47 | |
| | | | | | | | | | | | | | | | |
| | | | | |
| Multiline Retail: 0.72% | | | | | | | | | | | | | | | | |
Other securities | | | | | | | | | | | 20,853,280 | | | | 0.72 | |
| | | | | | | | | | | | | | | | |
| | | | | |
| Specialty Retail: 2.25% | | | | | | | | | | | | | | | | |
Home Depot Incorporated | | | | | | | 208,251 | | | | 20,700,149 | | | | 0.72 | |
Other securities | | | | | | | | | | | 44,236,594 | | | | 1.53 | |
| | | | | |
| | | | | | | | | | | 64,936,743 | | | | 2.25 | |
| | | | | | | | | | | | | | | | |
The accompanying notes are an integral part of these financial statements.
| | | | | | |
| Summary portfolio of investments—November 30, 2014 (unaudited) | | Wells Fargo Advantage Allocation Funds | | | 43 | |
INDEX PORTFOLIO
| | | | | | | | | | | | | | | | |
| Security name | | | | | | Shares | | | Value | | | Percent of
net assets | |
| | | | | |
| Textiles, Apparel & Luxury Goods: 0.86% | | | | | | | | | | | | | | | | |
Other securities | | | | | | | | | | $ | 24,857,285 | | | | 0.86 | % |
| | | | | | | | | | | | | | | | |
| | | | | |
Consumer Staples: 9.76% | | | | | | | | | | | | | | | | |
| | | | | |
| Beverages: 2.21% | | | | | | | | | | | | | | | | |
PepsiCo Incorporated | | | | | | | 233,141 | | | | 23,337,414 | | | | 0.81 | |
The Coca-Cola Company | | | | | | | 610,759 | | | | 27,380,326 | | | | 0.95 | |
Other securities | | | | | | | | | | | 13,041,583 | | | | 0.45 | |
| | | | | |
| | | | | | | | | | | 63,759,323 | | | | 2.21 | |
| | | | | | | | | | | | | | | | |
| | | | | |
| Food & Staples Retailing: 2.39% | | | | | | | | | | | | | | | | |
CVS Health Corporation | | | | | | | 179,194 | | | | 16,371,164 | | | | 0.57 | |
Wal-Mart Stores Incorporated | | | | | | | 244,319 | | | | 21,387,685 | | | | 0.74 | |
Other securities | | | | | | | | | | | 31,144,786 | | | | 1.08 | |
| | | | | |
| | | | | | | | | | | 68,903,635 | | | | 2.39 | |
| | | | | | | | | | | | | | | | |
| | | | | |
| Food Products: 1.62% | | | | | | | | | | | | | | | | |
Other securities | | | | | | | | | | | 46,651,671 | | | | 1.62 | |
| | | | | | | | | | | | | | | | |
| | | | | |
| Household Products: 1.94% | | | | | | | | | | | | | | | | |
The Procter & Gamble Company | | | | | | | 418,947 | | | | 37,885,377 | | | | 1.31 | |
Other securities | | | | | | | | | | | 18,015,315 | | | | 0.63 | |
| | | | | |
| | | | | | | | | | | 55,900,692 | | | | 1.94 | |
| | | | | | | | | | | | | | | | |
| | | | | |
| Personal Products: 0.11% | | | | | | | | | | | | | | | | |
Other securities | | | | | | | | | | | 3,238,424 | | | | 0.11 | |
| | | | | | | | | | | | | | | | |
| | | | | |
| Tobacco: 1.49% | | | | | | | | | | | | | | | | |
Altria Group Incorporated | | | | | | | 306,893 | | | | 15,424,442 | | | | 0.53 | |
Philip Morris International | | | | | | | 241,704 | | | | 21,011,329 | | | | 0.73 | |
Other securities | | | | | | | | | | | 6,659,608 | | | | 0.23 | |
| | | | | |
| | | | | | | | | | | 43,095,379 | | | | 1.49 | |
| | | | | | | | | | | | | | | | |
| | | | | |
Energy: 8.28% | | | | | | | | | | | | | | | | |
| | | | | |
| Energy Equipment & Services: 1.37% | | | | | | | | | | | | | | | | |
Schlumberger Limited | | | | | | | 200,594 | | | | 17,241,054 | | | | 0.60 | |
Other securities | | | | | | | | | | | 22,293,272 | | | | 0.77 | |
| | | | | |
| | | | | | | | | | | 39,534,326 | | | | 1.37 | |
| | | | | | | | | | | | | | | | |
| | | | | |
| Oil, Gas & Consumable Fuels: 6.91% | | | | | | | | | | | | | | | | |
Chevron Corporation | | | | | | | 293,816 | | | | 31,987,748 | | | | 1.11 | |
ConocoPhillips Company | | | | | | | 190,248 | | | | 12,569,685 | | | | 0.44 | |
Exxon Mobil Corporation | | | | | | | 659,864 | | | | 59,744,087 | | | | 2.07 | |
Other securities | | | | | | | | | | | 95,008,234 | | | | 3.29 | |
| | | | | |
| | | | | | | | | | | 199,309,754 | | | | 6.91 | |
| | | | | | | | | | | | | | | | |
The accompanying notes are an integral part of these financial statements.
| | | | |
| 44 | | Wells Fargo Advantage Allocation Funds | | Summary portfolio of investments—November 30, 2014 (unaudited) |
INDEX PORTFOLIO
| | | | | | | | | | | | | | | | |
| Security name | | | | | | Shares | | | Value | | | Percent of
net assets | |
| | | | | |
Financials: 16.09% | | | | | | | | | | | | | | | | |
| | | | | |
| Banks: 5.82% | | | | | | | | | | | | | | | | |
Bank of America Corporation | | | | | | | 1,627,090 | | | $ | 27,725,614 | | | | 0.96 | % |
Citigroup Incorporated | | | | | | | 469,098 | | | | 25,317,219 | | | | 0.88 | |
JPMorgan Chase & Company | | | | | | | 581,972 | | | | 35,011,436 | | | | 1.21 | |
Wells Fargo & Company (l) | | | | | | | 735,042 | | | | 40,045,088 | | | | 1.39 | |
Other securities | | | | | | | | | | | 39,664,343 | | | | 1.38 | |
| | | | | |
| | | | | | | | | | | 167,763,700 | | | | 5.82 | |
| | | | | | | | | | | | | | | | |
| | | | | |
| Capital Markets: 2.21% | | | | | | | | | | | | | | | | |
Other securities | | | | | | | | | | | 63,718,879 | | | | 2.21 | |
| | | | | | | | | | | | | | | | |
| | | | | |
| Consumer Finance: 0.91% | | | | | | | | | | | | | | | | |
American Express Company | | | | | | | 139,262 | | | | 12,870,594 | | | | 0.45 | |
Other securities | | | | | | | | | | | 13,271,058 | | | | 0.46 | |
| | | | | |
| | | | | | | | | | | 26,141,652 | | | | 0.91 | |
| | | | | | | | | | | | | | | | |
| | | | | |
| Diversified Financial Services: 2.04% | | | | | | | | | | | | | | | | |
Berkshire Hathaway Incorporated Class B † | | | | | | | 282,071 | | | | 41,941,137 | | | | 1.45 | |
Other securities | | | | | | | | | | | 16,880,589 | | | | 0.59 | |
| | | | | |
| | | | | | | | | | | 58,821,726 | | | | 2.04 | |
| | | | | | | | | | | | | | | | |
| | | | | |
| Insurance: 2.73% | | | | | | | | | | | | | | | | |
Other securities | | | | | | | | | | | 78,852,821 | | | | 2.73 | |
| | | | | | | | | | | | | | | | |
| | | | | |
| Real Estate Management & Development: 0.05% | | | | | | | | | | | | | | | | |
Other securities | | | | | | | | | | | 1,456,421 | | | | 0.05 | |
| | | | | | | | | | | | | | | | |
| | | | | |
| REITs: 2.28% | | | | | | | | | | | | | | | | |
Other securities | | | | | | | | | | | 65,866,613 | | | | 2.28 | |
| | | | | | | | | | | | | | | | |
| | | | | |
| Thrifts & Mortgage Finance: 0.05% | | | | | | | | | | | | | | | | |
Other securities | | | | | | | | | | | 1,438,507 | | | | 0.05 | |
| | | | | | | | | | | | | | | | |
| | | | | |
Health Care: 14.15% | | | | | | | | | | | | | | | | |
| | | | | |
| Biotechnology: 2.89% | | | | | | | | | | | | | | | | |
Amgen Incorporated | | | | | | | 117,532 | | | | 19,429,215 | | | | 0.67 | |
Celgene Corporation † | | | | | | | 123,706 | | | | 14,064,135 | | | | 0.49 | |
Gilead Sciences Incorporated † | | | | | | | 233,896 | | | | 23,464,447 | | | | 0.81 | |
Other securities | | | | | | | | | | | 26,300,040 | | | | 0.92 | |
| | | | | |
| | | | | | | | | | | 83,257,837 | | | | 2.89 | |
| | | | | | | | | | | | | | | | |
| | | | | |
| Health Care Equipment & Supplies: 2.19% | | | | | | | | | | | | | | | | |
Other securities | | | | | | | | | | | 63,179,808 | | | | 2.19 | |
| | | | | | | | | | | | | | | | |
| | | | | |
| Health Care Providers & Services: 2.24% | | | | | | | | | | | | | | | | |
UnitedHealth Group Incorporated | | | | | | | 150,337 | | | | 14,827,738 | | | | 0.51 | |
Other securities | | | | | | | | | | | 49,852,543 | | | | 1.73 | |
| | | | | |
| | | | | | | | | | | 64,680,281 | | | | 2.24 | |
| | | | | | | | | | | | | | | | |
The accompanying notes are an integral part of these financial statements.
| | | | | | |
| Summary portfolio of investments—November 30, 2014 (unaudited) | | Wells Fargo Advantage Allocation Funds | | | 45 | |
INDEX PORTFOLIO
| | | | | | | | | | | | | | | | |
| Security name | | | | | | Shares | | | Value | | | Percent of
net assets | |
| | | | | |
| Health Care Technology: 0.11% | | | | | | | | | | | | | | | | |
Other securities | | | | | | | | | | $ | 3,024,610 | | | | 0.11 | % |
| | | | | | | | | | | | | | | | |
| | | | | |
| Life Sciences Tools & Services: 0.43% | | | | | | | | | | | | | | | | |
Other securities | | | | | | | | | | | 12,486,464 | | | | 0.43 | |
| | | | | | | | | | | | | | | | |
| | | | | |
| Pharmaceuticals: 6.29% | | | | | | | | | | | | | | | | |
Abbvie Incorporated | | | | | | | 246,279 | | | | 17,042,507 | | | | 0.59 | |
Bristol-Myers Squibb Company | | | | | | | 256,523 | | | | 15,147,683 | | | | 0.53 | |
Johnson & Johnson | | | | | | | 436,375 | | | | 47,237,594 | | | | 1.64 | |
Merck & Company Incorporated | | | | | | | 446,331 | | | | 26,958,392 | | | | 0.93 | |
Pfizer Incorporated | | | | | | | 981,104 | | | | 30,561,390 | | | | 1.06 | |
Other securities | | | | | | | | | | | 44,629,381 | | | | 1.54 | |
| | | | | |
| | | | | | | | | | | 181,576,947 | | | | 6.29 | |
| | | | | | | | | | | | | | | | |
| | | | | |
Industrials: 10.32% | | | | | | | | | | | | | | | | |
| | | | | |
| Aerospace & Defense: 2.63% | | | | | | | | | | | | | | | | |
Boeing Company | | | | | | | 103,694 | | | | 13,932,326 | | | | 0.48 | |
United Technologies Corporation | | | | | | | 131,638 | | | | 14,490,711 | | | | 0.50 | |
Other securities | | | | | | | | | | | 47,401,640 | | | | 1.65 | |
| | | | | |
| | | | | | | | | | | 75,824,677 | | | | 2.63 | |
| | | | | | | | | | | | | | | | |
| | | | | |
| Air Freight & Logistics: 0.78% | | | | | | | | | | | | | | | | |
Other securities | | | | | | | | | | | 22,373,609 | | | | 0.78 | |
| | | | | | | | | | | | | | | | |
| | | | | |
| Airlines: 0.37% | | | | | | | | | | | | | | | | |
Other securities | | | | | | | | | | | 10,520,786 | | | | 0.37 | |
| | | | | | | | | | | | | | | | |
| | | | | |
| Building Products: 0.07% | | | | | | | | | | | | | | | | |
Other securities | | | | | | | | | | | 2,135,237 | | | | 0.07 | |
| | | | | | | | | | | | | | | | |
| | | | | |
| Commercial Services & Supplies: 0.46% | | | | | | | | | | | | | | | | |
Other securities | | | | | | | | | | | 13,187,947 | | | | 0.46 | |
| | | | | | | | | | | | | | | | |
| | | | | |
| Construction & Engineering: 0.12% | | | | | | | | | | | | | | | | |
Other securities | | | | | | | | | | | 3,490,225 | | | | 0.12 | |
| | | | | | | | | | | | | | | | |
| | | | | |
| Electrical Equipment: 0.56% | | | | | | | | | | | | | | | | |
Other securities | | | | | | | | | | | 16,278,770 | | | | 0.56 | |
| | | | | | | | | | | | | | | | |
| | | | | |
| Industrial Conglomerates: 2.34% | | | | | | | | | | | | | | | | |
3M Company | | | | | | | 100,258 | | | | 16,050,303 | | | | 0.56 | |
General Electric Company | | | | | | | 1,552,517 | | | | 41,126,175 | | | | 1.43 | |
Other securities | | | | | | | | | | | 10,324,201 | | | | 0.35 | |
| | | | | |
| | | | | | | | | | | 67,500,679 | | | | 2.34 | |
| | | | | | | | | | | | | | | | |
| | | | | |
| Machinery: 1.56% | | | | | | | | | | | | | | | | |
Other securities | | | | | | | | | | | 45,123,333 | | | | 1.56 | |
| | | | | | | | | | | | | | | | |
| | | | | |
| Professional Services: 0.19% | | | | | | | | | | | | | | | | |
Other securities | | | | | | | | | | | 5,387,604 | | | | 0.19 | |
| | | | | | | | | | | | | | | | |
The accompanying notes are an integral part of these financial statements.
| | | | |
| 46 | | Wells Fargo Advantage Allocation Funds | | Summary portfolio of investments—November 30, 2014 (unaudited) |
INDEX PORTFOLIO
| | | | | | | | | | | | | | | | |
| Security name | | | | | | Shares | | | Value | | | Percent of
net assets | |
| | | | | |
| Road & Rail: 1.04% | | | | | | | | | | | | | | | | |
Union Pacific Corporation | | | | | | | 138,856 | | | $ | 16,214,215 | | | | 0.56 | % |
Other securities | | | | | | | | | | | 13,804,879 | | | | 0.48 | |
| | | | | |
| | | | | | | | | | | 30,019,094 | | | | 1.04 | |
| | | | | | | | | | | | | | | | |
| | | | | |
| Trading Companies & Distributors: 0.20% | | | | | | | | | | | | | | | | |
Other securities | | | | | | | | | | | 5,905,054 | | | | 0.20 | |
| | | | | | | | | | | | | | | | |
| | | | | |
Information Technology: 19.71% | | | | | | | | | | | | | | | | |
| | | | | |
| Communications Equipment: 1.63% | | | | | | | | | | | | | | | | |
Cisco Systems Incorporated | | | | | | | 788,985 | | | | 21,807,545 | | | | 0.76 | |
QUALCOMM Incorporated | | | | | | | 259,326 | | | | 18,904,865 | | | | 0.65 | |
Other securities | | | | | | | | | | | 6,264,587 | | | | 0.22 | |
| | | | | |
| | | | | | | | | | | 46,976,997 | | | | 1.63 | |
| | | | | | | | | | | | | | | | |
| | | | | |
| Electronic Equipment, Instruments & Components: 0.40% | | | | | | | | | | | | | | | | |
Other securities | | | | | | | | | | | 11,562,764 | | | | 0.40 | |
| | | | | | | | | | | | | | | | |
| | | | | |
| Internet Software & Services: 3.22% | | | | | | | | | | | | | | | | |
Facebook Incorporated Class A † | | | | | | | 322,352 | | | | 25,046,750 | | | | 0.87 | |
Google Incorporated Class A † | | | | | | | 43,957 | | | | 24,135,910 | | | | 0.84 | |
Google Incorporated Class C † | | | | | | | 43,954 | | | | 23,815,596 | | | | 0.82 | |
Other securities | | | | | | | | | | | 19,823,577 | | | | 0.69 | |
| | | | | |
| | | | | | | | | | | 92,821,833 | | | | 3.22 | |
| | | | | | | | | | | | | | | | |
| | | | | |
| IT Services: 3.25% | | | | | | | | | | | | | | | | |
International Business Machines Corporation | | | | | | | 143,550 | | | | 23,279,504 | | | | 0.81 | |
MasterCard Incorporated | | | | | | | 152,294 | | | | 13,293,743 | | | | 0.46 | |
Visa Incorporated Class A | | | | | | | 76,169 | | | | 19,666,074 | | | | 0.68 | |
Other securities | | | | | | | | | | | 37,579,995 | | | | 1.30 | |
| | | | | |
| | | | | | | | | | | 93,819,316 | | | | 3.25 | |
| | | | | | | | | | | | | | | | |
| | | | | |
| Semiconductors & Semiconductor Equipment: 2.45% | | | | | | | | | | | | | | | | |
Intel Corporation | | | | | | | 766,054 | | | | 28,535,512 | | | | 0.99 | |
Other securities | | | | | | | | | | | 42,234,165 | | | | 1.46 | |
| | | | | |
| | | | | | | | | | | 70,769,677 | | | | 2.45 | |
| | | | | | | | | | | | | | | | |
| | | | | |
| Software: 3.79% | | | | | | | | | | | | | | | | |
Microsoft Corporation | | | | | | | 1,274,928 | | | | 60,954,308 | | | | 2.11 | |
Oracle Corporation | | | | | | | 503,183 | | | | 21,339,991 | | | | 0.74 | |
Other securities | | | | | | | | | | | 26,985,129 | | | | 0.94 | |
| | | | | |
| | | | | | | | | | | 109,279,428 | | | | 3.79 | |
| | | | | | | | | | | | | | | | |
| | | | | |
| Technology Hardware, Storage & Peripherals: 4.97% | | | | | | | | | | | | | | | | |
Apple Incorporated | | | | | | | 926,486 | | | | 110,186,980 | | | | 3.82 | |
Other securities | | | | | | | | | | | 33,354,688 | | | | 1.15 | |
| | | | | |
| | | | | | | | | | | 143,541,668 | | | | 4.97 | |
| | | | | | | | | | | | | | | | |
The accompanying notes are an integral part of these financial statements.
| | | | | | |
| Summary portfolio of investments—November 30, 2014 (unaudited) | | Wells Fargo Advantage Allocation Funds | | | 47 | |
INDEX PORTFOLIO
| | | | | | | | | | | | | | | | | | |
| Security name | | | | | | | Shares | | | Value | | | Percent of
net assets | |
| | | | | |
Materials: 3.17% | | | | | | | | | | | | | | | | | | |
| | | | | |
| Chemicals: 2.34% | | | | | | | | | | | | | | | | | | |
Other securities | | | | | | | | | | | | $ | 67,498,229 | | | | 2.34 | % |
| | | | | | | | | | | | | | | | | | |
| | | | | |
| Construction Materials: 0.09% | | | | | | | | | | | | | | | | | | |
Other securities | | | | | | | | | | | | | 2,482,357 | | | | 0.09 | |
| | | | | | | | | | | | | | | | | | |
| | | | | |
| Containers & Packaging: 0.20% | | | | | | | | | | | | | | | | | | |
Other securities | | | | | | | | | | | | | 5,890,602 | | | | 0.20 | |
| | | | | | | | | | | | | | | | | | |
| | | | | |
| Metals & Mining: 0.42% | | | | | | | | | | | | | | | | | | |
Other securities | | | | | | | | | | | | | 12,096,064 | | | | 0.42 | |
| | | | | | | | | | | | | | | | | | |
| | | | | |
| Paper & Forest Products: 0.12% | | | | | | | | | | | | | | | | | | |
Other securities | | | | | | | | | | | | | 3,555,995 | | | | 0.12 | |
| | | | | | | | | | | | | | | | | | |
| | | | | |
Telecommunication Services: 2.38% | | | | | | | | | | | | | | | | | | |
| | | | | |
| Diversified Telecommunication Services: 2.38% | | | | | | | | | | | | | | | | | | |
AT&T Incorporated | | | | | | | | | 802,415 | | | | 28,389,443 | | | | 0.98 | |
Verizon Communications Incorporated | | | | | | | | | 641,380 | | | | 32,447,414 | | | | 1.13 | |
Other securities | | | | | | | | | | | | | 7,783,311 | | | | 0.27 | |
| | | | | |
| | | | | | | | | | | | | 68,620,168 | | | | 2.38 | |
| | | | | | | | | | | | | | | | | | |
| | | | | |
Utilities: 3.06% | | | | | | | | | | | | | | | | | | |
| | | | | |
| Electric Utilities: 1.75% | | | | | | | | | | | | | | | | | | |
Other securities | | | | | | | | | | | | | 50,499,192 | | | | 1.75 | |
| | | | | | | | | | | | | | | | | | |
| | | | | |
| Gas Utilities: 0.03% | | | | | | | | | | | | | | | | | | |
Other securities | | | | | | | | | | | | | 967,055 | | | | 0.03 | |
| | | | | | | | | | | | | | | | | | |
| | | | | |
| Independent Power & Renewable Electricity Producers: 0.11% | | | | | | | | | | | | | | | | | | |
Other securities | | | | | | | | | | | | | 3,061,443 | | | | 0.11 | |
| | | | | | | | | | | | | | | | | | |
| | | | | |
| Multi-Utilities: 1.17% | | | | | | | | | | | | | | | | | | |
Other securities | | | | | | | | | | | | | 33,837,538 | | | | 1.17 | |
| | | | | | | | | | | | | | | | | | |
| | | | | |
Total Common Stocks (Cost $1,423,799,062) | | | | | | | | | | | | | 2,848,169,018 | | | | 98.72 | |
| | | | | | | | | | | | | | | | | | |
| | | | | |
| | | Yield | | | | | | | | | | | | |
| Short-Term Investments: 1.86% | | | | | | | | | | | | | | | | | | |
| | | | | |
| Investment Companies: 1.77% | | | | | | | | | | | | | | | | | | |
Securities Lending Cash Investments, LLC (l)(r)(u) | | | 0.12 | % | | | | | 15,878,700 | | | | 15,878,700 | | | | 0.55 | |
Wells Fargo Advantage Cash Investment Money Market Fund, Select Class (l)(u) | | | 0.08 | | | | | | 35,068,768 | | | | 35,068,768 | | | | 1.22 | |
| | | | | |
| | | | | | | | | | | | | 50,947,468 | | | | 1.77 | |
| | | | | | | | | | | | | | | | | | |
The accompanying notes are an integral part of these financial statements.
| | | | |
| 48 | | Wells Fargo Advantage Allocation Funds | | Summary portfolio of investments—November 30, 2014 (unaudited) |
INDEX PORTFOLIO
| | | | | | | | | | | | | | | | | | | | |
| Security name | | Yield | | | Maturity date | | | Principal | | | Value | | | Percent of
net assets | |
| | | | | |
| U.S. Treasury Securities: 0.09% | | | | | | | | | | | | | | | | | | | | |
U.S. Treasury Bill (z)# | | | 0.01 | % | | | 1-8-2015 | | | $ | 1,900,000 | | | $ | 1,899,975 | | | | 0.06 | % |
U.S. Treasury Bill (z)# | | | 0.02 | | | | 12-18-2014 | | | | 180,000 | | | | 179,998 | | | | 0.01 | |
U.S. Treasury Bill (z)# | | | 0.02 | | | | 3-5-2015 | | | | 360,000 | | | | 359,981 | | | | 0.01 | |
U.S. Treasury Bill (z)# | | | 0.06 | | | | 4-23-2015 | | | | 225,000 | | | | 224,946 | | | | 0.01 | |
| | | | | |
| | | | | | | | | | | | | | | 2,664,900 | | | | 0.09 | |
| | | | | | | | | | | | | | | | | | | | |
| | | | | |
Total Short-Term Investments (Cost $53,612,375) | | | | | | | | | | | | | | | 53,612,368 | | | | 1.86 | |
| | | | | | | | | | | | | | | | | | | | |
| | | | |
| Total investments in securities (Cost $1,477,411,437) * | | | | | | | | | | | | 2,901,781,386 | | | | 100.58 | % |
Other assets and liabilities, net | | | | | | | | | | | | | | | (16,627,350 | ) | | | (0.58 | ) |
| | | | | | | | | | | | | | | | | | | | |
| Total net assets | | | | | | | | | | | | | | $ | 2,885,154,036 | | | | 100.00 | % |
| | | | | | | | | | | | | | | | | | | | |
| † | Non-income-earning security |
| (l) | The security represents an affiliate of the Portfolio as defined in the Investment Company Act of 1940. |
| (u) | The rate represents the 7-day annualized yield at period end. |
| (r) | The investment is a non-registered investment vehicle purchased with cash collateral received from securities on loan. |
| (z) | Zero coupon security. The rate represents the current yield to maturity. |
| # | All or a portion of this security is segregated as collateral for investments in derivative instruments. |
| * | Cost for federal income tax purposes is $1,556,651,323 and unrealized gains (losses) consists of: |
| | | | |
Gross unrealized gains | | $ | 1,443,250,527 | |
Gross unrealized losses | | | (98,120,464 | ) |
| | | | |
Net unrealized gains | | $ | 1,345,130,063 | |
The accompanying notes are an integral part of these financial statements.
| | | | | | |
| Portfolio of investments—November 30, 2014 (unaudited) | | Wells Fargo Advantage Allocation Funds | | | 49 | |
INTERNATIONAL GROWTH PORTFOLIO
| | | | | | | | | | | | |
| Security name | | | | | | Shares | | | Value | |
| | | | |
Common Stocks: 96.93% | | | | | | | | | | | | |
| | | | |
| Belgium: 3.97% | | | | | | | | | | | | |
Anheuser-Busch InBev NV (Consumer Staples, Beverages) | | | | | | | 28,940 | | | $ | 3,401,507 | |
Telenet Group Holding NV (Consumer Discretionary, Media) † | | | | | | | 22,489 | | | | 1,286,381 | |
UCB SA (Health Care, Pharmaceuticals) | | | | | | | 19,855 | | | | 1,558,427 | |
| | | | |
| | | | | | | | | | | 6,246,315 | |
| | | | | | | | | | | | |
| | | | |
| Brazil: 0.18% | | | | | | | | | | | | |
Ambev SA ADR (Consumer Staples, Beverages) | | | | | | | 42,189 | | | | 276,338 | |
| | | | | | | | | | | | |
| | | | |
| China: 10.45% | | | | | | | | | | | | |
Alibaba Group Holding Limited ADR (Information Technology, Internet Software & Services) † | | | | | | | 4,262 | | | | 475,810 | |
Baidu Incorporated ADR (Information Technology, Internet Software & Services) † | | | | | | | 37,490 | | | | 9,189,174 | |
China Mobile Limited (Telecommunication Services, Wireless Telecommunication Services) | | | | | | | 233,000 | | | | 2,870,849 | |
Industrial & Commercial Bank of China Limited Class H (Financials, Banks) | | | | | | | 1,541,000 | | | | 1,045,231 | |
Tencent Holdings Limited (Information Technology, Internet Software & Services) | | | | | | | 178,400 | | | | 2,852,596 | |
| | | | |
| | | | | | | | | | | 16,433,660 | |
| | | | | | | | | | | | |
| | | | |
| Denmark: 0.19% | | | | | | | | | | | | |
Rockwool International AS B Shares (Industrials, Building Products) | | | | | | | 2,420 | | | | 300,679 | |
| | | | | | | | | | | | |
| | | | |
| France: 5.75% | | | | | | | | | | | | |
France Telecom SA (Telecommunication Services, Diversified Telecommunication Services) | | | | | | | 57,178 | | | | 1,007,791 | |
L’Oreal SA (Consumer Staples, Personal Products) | | | | | | | 6,608 | | | | 1,128,104 | |
LVMH Moet Hennessy Louis Vuitton SA (Consumer Discretionary, Textiles, Apparel & Luxury Goods) « | | | | | | | 6,670 | | | | 1,199,275 | |
Pernod-Ricard SA (Consumer Staples, Beverages) | | | | | | | 2,016 | | | | 239,086 | |
Publicis Groupe SA (Consumer Discretionary, Media) | | | | | | | 102 | | | | 7,496 | |
Schneider Electric SA (Industrials, Electrical Equipment) | | | | | | | 19,776 | | | | 1,614,237 | |
Technip SA (Energy, Energy Equipment & Services) | | | | | | | 8,423 | | | | 548,142 | |
Vinci SA (Industrials, Construction & Engineering) | | | | | | | 13,889 | | | | 751,338 | |
Zodiac Aerospace SA (Industrials, Aerospace & Defense) | | | | | | | 77,004 | | | | 2,553,498 | |
| | | | |
| | | | | | | | | | | 9,048,967 | |
| | | | | | | | | | | | |
| | | | |
| Germany: 11.84% | | | | | | | | | | | | |
Allianz AG (Financials, Insurance) | | | | | | | 8,365 | | | | 1,441,066 | |
Bayer AG (Health Care, Pharmaceuticals) | | | | | | | 45,409 | | | | 6,833,965 | |
Beiersdorf AG (Consumer Staples, Personal Products) | | | | | | | 23,029 | | | | 2,051,123 | |
Deutsche Post AG (Industrials, Air Freight & Logistics) | | | | | | | 69,999 | | | | 2,326,869 | |
Linde AG (Materials, Chemicals) | | | | | | | 27,948 | | | | 5,277,210 | |
MTU Aero Engines AG (Industrials, Aerospace & Defense) | | | | | | | 7,732 | | | | 689,532 | |
| | | | |
| | | | | | | | | | | 18,619,765 | |
| | | | | | | | | | | | |
| | | | |
| Hong Kong: 6.39% | | | | | | | | | | | | |
AIA Group Limited (Financials, Insurance) | | | | | | | 950,800 | | | | 5,492,765 | |
Beijing Enterprises Holdings Limited (Industrials, Industrial Conglomerates) | | | | | | | 284,500 | | | | 2,270,893 | |
Sands China Limited (Consumer Discretionary, Hotels, Restaurants & Leisure) | | | | | | | 382,800 | | | | 2,292,881 | |
| | | | |
| | | | | | | | | | | 10,056,539 | |
| | | | | | | | | | | | |
The accompanying notes are an integral part of these financial statements.
| | | | |
| 50 | | Wells Fargo Advantage Allocation Funds | | Portfolio of investments—November 30, 2014 (unaudited) |
INTERNATIONAL GROWTH PORTFOLIO
| | | | | | | | | | | | |
| Security name | | | | | | Shares | | | Value | |
| | | | |
| Ireland: 3.59% | | | | | | | | | | | | |
Covidien plc (Health Care, Health Care Equipment & Supplies) | | | | | | | 55,835 | | | $ | 5,639,335 | |
| | | | | | | | | | | | |
| | | | |
| Japan: 14.80% | | | | | | | | | | | | |
Ishikawajima-Harima Heavy Industries Company Limited (Industrials, Machinery) | | | | | | | 701,000 | | | | 3,544,282 | |
JS Group Corporation (Industrials, Building Products) | | | | | | | 60,000 | | | | 1,276,144 | |
Kawasaki Heavy Industries Limited (Industrials, Machinery) | | | | | | | 78,116 | | | | 343,613 | |
KDDI Corporation (Telecommunication Services, Wireless Telecommunication Services) | | | | | | | 35,800 | | | | 2,293,951 | |
NGK Insulators Limited (Industrials, Machinery) | | | | | | | 130,000 | | | | 2,886,576 | |
Olympus Corporation (Health Care, Health Care Equipment & Supplies) † | | | | | | | 113,400 | | | | 4,128,154 | |
Ono Pharmaceutical Company Limited (Health Care, Pharmaceuticals) | | | | | | | 12,200 | | | | 1,044,510 | |
SoftBank Corporation (Telecommunication Services, Wireless Telecommunication Services) | | | | | | | 39,269 | | | | 2,635,030 | |
Toyota Motor Corporation (Consumer Discretionary, Automobiles) | | | | | | | 83,200 | | | | 5,127,874 | |
| | | | |
| | | | | | | | | | | 23,280,134 | |
| | | | | | | | | | | | |
| | | | |
| Mexico: 3.05% | | | | | | | | | | | | |
Grupo Televisa SAB ADR (Consumer Discretionary, Media) | | | | | | | 128,450 | | | | 4,797,608 | |
| | | | | | | | | | | | |
| | | | |
| Netherlands: 4.45% | | | | | | | | | | | | |
ASML Holdings NV (Information Technology, Semiconductors & Semiconductor Equipment) | | | | | | | 46,681 | | | | 4,933,172 | |
Nielsen Holdings NV (Industrials, Professional Services) « | | | | | | | 7,161 | | | | 299,115 | |
Unilever NV (Consumer Staples, Food Products) « | | | | | | | 43,287 | | | | 1,764,250 | |
| | | | |
| | | | | | | | | | | 6,996,537 | |
| | | | | | | | | | | | |
| | | | |
| South Korea: 0.38% | | | | | | | | | | | | |
Naver Corporation (Information Technology, Internet Software & Services) | | | | | | | 844 | | | | 575,896 | |
Orion Corporation (Consumer Staples, Food Products) | | | | | | | 18 | | | | 15,889 | |
| | | | |
| | | | | | | | | | | 591,785 | |
| | | | | | | | | | | | |
| | | | |
| Spain: 1.97% | | | | | | | | | | | | |
Grifols SA (Health Care, Biotechnology) | | | | | | | 20,597 | | | | 918,153 | |
Grifols SA ADR (Health Care, Biotechnology) | | | | | | | 18,313 | | | | 681,976 | |
Telefonica SA (Telecommunication Services, Diversified Telecommunication Services) | | | | | | | 93,451 | | | | 1,497,700 | |
| | | | |
| | | | | | | | | | | 3,097,829 | |
| | | | | | | | | | | | |
| | | | |
| Sweden: 0.83% | | | | | | | | | | | | |
Swedbank AB (Financials, Banks) | | | | | | | 49,780 | | | | 1,306,046 | |
| | | | | | | | | | | | |
| | | | |
| Switzerland: 8.85% | | | | | | | | | | | | |
Actelion Limited (Health Care, Biotechnology) | | | | | | | 17,281 | | | | 2,056,005 | |
Nestle SA (Consumer Staples, Food Products) | | | | | | | 57,662 | | | | 4,331,740 | |
Roche Holdings AG (Health Care, Pharmaceuticals) | | | | | | | 15,380 | | | | 4,608,824 | |
Swatch Group AG Class B (Consumer Discretionary, Textiles, Apparel & Luxury Goods) | | | | | | | 1,238 | | | | 612,110 | |
Syngenta AG (Materials, Chemicals) | | | | | | | 2,906 | | | | 957,784 | |
Zurich Financial Services AG (Financials, Insurance) | | | | | | | 4,311 | | | | 1,351,665 | |
| | | | |
| | | | | | | | | | | 13,918,128 | |
| | | | | | | | | | | | |
| | | | |
| United Kingdom: 18.10% | | | | | | | | | | | | |
Babcock International Group plc (Industrials, Commercial Services & Supplies) | | | | | | | 47,400 | | | | 842,899 | |
BT Group plc (Telecommunication Services, Diversified Telecommunication Services) | | | | | | | 266,746 | | | | 1,711,318 | |
The accompanying notes are an integral part of these financial statements.
| | | | | | |
| Portfolio of investments—November 30, 2014 (unaudited) | | Wells Fargo Advantage Allocation Funds | | | 51 | |
INTERNATIONAL GROWTH PORTFOLIO
| | | | | | | | | | | | | | | | |
| Security name | | | | | | | | | Shares | | | Value | |
| | | | | |
| United Kingdom (continued) | | | | | | | | | | | | | | | | |
Croda International plc (Materials, Chemicals) | | | | | | | | | | | 52,433 | | | $ | 2,012,409 | |
Diageo plc (Consumer Staples, Beverages) | | | | | | | | | | | 4,956 | | | | 153,551 | |
Intercontinental Hotels Group plc (Consumer Discretionary, Hotels, Restaurants & Leisure) | | | | | | | | | | | 36,646 | | | | 1,553,219 | |
Johnson Matthey plc (Materials, Chemicals) | | | | | | | | | | | 62,393 | | | | 3,245,600 | |
Liberty Global plc Class A (Consumer Discretionary, Media) | | | | | | | | | | | 53,969 | | | | 2,805,848 | |
Liberty Global plc Class C (Consumer Discretionary, Media) † | | | | | | | | | | | 90,152 | | | | 4,500,388 | |
Lloyds Banking Group plc (Financials, Banks) † | | | | | | | | | | | 982,846 | | | | 1,235,117 | |
Prudential plc (Financials, Insurance) | | | | | | | | | | | 78,205 | | | | 1,893,400 | |
Rolls-Royce Holdings plc (Industrials, Aerospace & Defense) | | | | | | | | | | | 158,153 | | | | 2,083,935 | |
Rolls-Royce Holdings plc Class C Preference Shares (Industrials, Aerospace & Defense) †(a) | | | | | | | | | | | 18,495,180 | | | | 28,926 | |
SABMiller plc (Consumer Staples, Beverages) | | | | | | | | | | | 59,469 | | | | 3,314,860 | |
Saga plc (Financials, Diversified Financial Services) †« | | | | | | | | | | | 55,063 | | | | 132,450 | |
Smiths Group plc (Industrials, Industrial Conglomerates) | | | | | | | | | | | 26,695 | | | | 483,059 | |
WPP plc (Consumer Discretionary, Media) | | | | | | | | | | | 118,085 | | | | 2,474,779 | |
| | | | | |
| | | | | | | | | | | | | | | 28,471,758 | |
| | | | | | | | | | | | | | | | |
| | | | | |
| United States: 2.14% | | | | | | | | | | | | | | | | |
Cognizant Technology Solutions Corporation Class A (Information Technology, IT Services) † | | | | | | | | | | | 33,777 | | | | 1,823,620 | |
Schlumberger Limited (Energy, Energy Equipment & Services) | | | | | | | | | | | 17,924 | | | | 1,540,568 | |
| | | | | |
| | | | | | | | | | | | | | | 3,364,188 | |
| | | | | | | | | | | | | | | | |
| | | | | |
Total Common Stocks (Cost $118,310,333) | | | | | | | | | | | | | | | 152,445,611 | |
| | | | | | | | | | | | | | | | |
| | | | | |
Participation Notes: 0.78% | | | | | | | | | | | | | | | | |
| | | | | |
| United Kingdom: 0.78% | | | | | | | | | | | | | | | | |
HSBC Bank plc (Ryanair Holdings plc) (Industrials, Airlines) | | | | | | | | | | | 115,900 | | | | 1,232,086 | |
| | | | | | | | | | | | | | | | |
| | | | | |
Total Participation Notes (Cost $969,118) | | | | | | | | | | | | | | | 1,232,086 | |
| | | | | | | | | | | | | | | | |
| | | | | |
| | | Dividend yield | | | | | | | | | | | |
| | | | | |
Preferred Stocks: 1.33% | | | | | | | | | | | | | | | | |
| | | | | |
| Germany: 1.33% | | | | | | | | | | | | | | | | |
Henkel AG & Company KGaA (Consumer Staples, Household Products) ± | | | 1.51 | % | | | | | | | 18,843 | | | | 2,091,882 | |
| | | | | | | | | | | | | | | | |
| | | | | |
Total Preferred Stocks (Cost $1,392,735) | | | | | | | | | | | | | | | 2,091,882 | |
| | | | | | | | | | | | | | | | |
| | | | | |
| | | Yield | | | | | | | | | | | |
| Short-Term Investments: 2.08% | | | | | | | | | | | | | | | | |
| | | | | |
| Investment Companies: 2.08% | | | | | | | | | | | | | | | | |
Securities Lending Cash Investments, LLC (l)(u)(r) | | | 0.12 | | | | | | | | 1,787,826 | | | | 1,787,826 | |
Wells Fargo Advantage Cash Investment Money Market Fund, Select Class (l)(u) | | | 0.08 | | | | | | | | 1,480,017 | | | | 1,480,017 | |
| | | | | |
Total Short-Term Investments (Cost $3,267,843) | | | | | | | | | | | | | | | 3,267,843 | |
| | | | | | | | | | | | | | | | |
| | | | | | | | |
| Total investments in securities (Cost $123,940,029) * | | | 101.12 | % | | | 159,037,422 | |
Other assets and liabilities, net | | | (1.12 | ) | | | (1,754,016 | ) |
| | | | | | | | |
| Total net assets | | | 100.00 | % | | $ | 157,283,406 | |
| | | | | | | | |
The accompanying notes are an integral part of these financial statements.
| | | | |
| 52 | | Wells Fargo Advantage Allocation Funds | | Portfolio of investments—November 30, 2014 (unaudited) |
INTERNATIONAL GROWTH PORTFOLIO
| † | Non-income-earning security |
| « | All or a portion of this security is on loan. |
| (a) | The security is fair valued in accordance with procedures approved by the Board of Trustees. |
| ± | Variable rate investment. The rate shown is the rate in effect at period end. |
| (l) | The security represents an affiliate of the Portfolio as defined in the Investment Company Act of 1940. |
| (u) | The rate represents the 7-day annualized yield at period end. |
| (r) | The investment is a non-registered investment vehicle purchased with cash collateral received from securities on loan. |
| * | Cost for federal income tax purposes is $124,190,209 and unrealized gains (losses) consists of: |
| | | | |
Gross unrealized gains | | $ | 37,566,124 | |
Gross unrealized losses | | | (2,718,911 | ) |
| | | | |
Net unrealized gains | | $ | 34,847,213 | |
The following table shows the percent of total long-term investments by sector as of November 30, 2014:
| | | | |
Health Care | | | 17.64 | % |
Consumer Discretionary | | | 17.12 | |
Industrials | | | 15.10 | |
Information Technology | | | 12.74 | |
Consumer Staples | | | 12.05 | |
Financials | | | 8.92 | |
Telecommunication Services | | | 7.71 | |
Materials | | | 7.38 | |
Energy | | | 1.34 | |
| | | | |
| | | 100.00 | % |
| | | | |
The accompanying notes are an integral part of these financial statements.
| | | | | | |
| Portfolio of investments—November 30, 2014 (unaudited) | | Wells Fargo Advantage Allocation Funds | | | 53 | |
INTERNATIONAL VALUE PORTFOLIO
| | | | | | | | | | | | |
| Security name | | | | | | Shares | | | Value | |
| | | | |
Common Stocks: 96.52% | | | | | | | | | | | | |
| | | | |
| Australia: 5.51% | | | | | | | | | | | | |
Arrium Limited (Materials, Metals & Mining) | | | | | | | 3,063,400 | | | $ | 625,892 | |
Bendigo Bank Limited (Financials, Banks) | | | | | | | 272,500 | | | | 2,962,375 | |
Boart Longyear Group Limited (Industrials, Construction & Engineering) †« | | | | | | | 199,991 | | | | 31,497 | |
Cabcharge Australia Limited (Industrials, Commercial Services & Supplies) | | | | | | | 207,386 | | | | 842,133 | |
Challenger Financial Services Group Limited (Financials, Diversified Financial Services) | | | | | | | 475,400 | | | | 2,569,896 | |
Downer EDI Limited (Industrials, Commercial Services & Supplies) | | | | | | | 518,900 | | | | 1,899,480 | |
Fortescue Metals Group Limited (Materials, Metals & Mining) « | | | | | | | 394,700 | | | | 987,864 | |
Independence Group NL (Materials, Metals & Mining) | | | | | | | 404,400 | | | | 1,445,916 | |
Lend Lease Corporation Limited (Financials, Real Estate Management & Development) | | | | | | | 350,500 | | | | 4,574,175 | |
Metcash Limited (Consumer Staples, Food & Staples Retailing) « | | | | | | | 785,500 | | | | 1,745,297 | |
Mincor Resources NL (Materials, Metals & Mining) (i) | | | | | | | 570,994 | | | | 277,070 | |
Mineral Resources Limited (Materials, Metals & Mining) | | | | | | | 144,300 | | | | 937,289 | |
Myer Holdings Limited (Consumer Discretionary, Multiline Retail) « | | | | | | | 577,400 | | | | 796,296 | |
Panoramic Resources Limited (Materials, Metals & Mining) | | | | | | | 368,800 | | | | 128,723 | |
Primary Health Care Limited (Health Care, Health Care Providers & Services) | | | | | | | 339,000 | | | | 1,356,376 | |
Rio Tinto Limited (Materials, Metals & Mining) | | | | | | | 66,800 | | | | 3,360,830 | |
Seven Network Limited (Industrials, Trading Companies & Distributors) | | | | | | | 165,800 | | | | 842,639 | |
Toll Holdings Limited (Industrials, Air Freight & Logistics) | | | | | | | 283,600 | | | | 1,361,658 | |
United Construction Group Limited (Industrials, Construction & Engineering) | | | | | | | 152,800 | | | | 269,263 | |
| | | | |
| | | | | | | | | | | 27,014,669 | |
| | | | | | | | | | | | |
| | | | |
| Austria: 1.30% | | | | | | | | | | | | |
OMV AG (Energy, Oil, Gas & Consumable Fuels) | | | | | | | 41,100 | | | | 1,189,533 | |
Raiffeisen Bank International AG (Financials, Banks) | | | | | | | 81,200 | | | | 1,681,258 | |
RHI AG (Materials, Construction Materials) (i) | | | | | | | 64,721 | | | | 1,518,437 | |
Voestalpine AG (Materials, Metals & Mining) | | | | | | | 47,700 | | | | 1,982,393 | |
| | | | |
| | | | | | | | | | | 6,371,621 | |
| | | | | | | | | | | | |
| | | | |
| Belgium: 0.59% | | | | | | | | | | | | |
Delhaize Group SA (Consumer Staples, Food & Staples Retailing) | | | | | | | 39,400 | | | | 2,882,203 | |
| | | | | | | | | | | | |
| | | | |
| Brazil: 0.99% | | | | | | | | | | | | |
Banco do Brasil SA (Financials, Banks) | | | | | | | 196,000 | | | | 2,261,965 | |
Companhia de Saneamento Basico do Estado de Sao Paulo (Utilities, Water Utilities) | | | | | | | 253,200 | | | | 1,885,537 | |
Companhia de Saneamento de Minas Gerais SA (Utilities, Water Utilities) | | | | | | | 72,400 | | | | 686,782 | |
| | | | |
| | | | | | | | | | | 4,834,284 | |
| | | | | | | | | | | | |
| | | | |
| Canada: 2.91% | | | | | | | | | | | | |
Magna International Incorporated Class A (Consumer Discretionary, Auto Components) | | | | | | | 65,800 | | | | 7,091,950 | |
Metro Incorporated (Consumer Staples, Food & Staples Retailing) | | | | | | | 48,400 | | | | 3,802,102 | |
WestJet Airlines Limited (Industrials, Airlines) | | | | | | | 120,000 | | | | 3,388,408 | |
| | | | |
| | | | | | | | | | | 14,282,460 | |
| | | | | | | | | | | | |
| | | | |
| China: 2.46% | | | | | | | | | | | | |
China BlueChemical Limited (Materials, Chemicals) | | | | | | | 1,984,000 | | | | 718,905 | |
China Communications Services Corporation Limited (Telecommunication Services, Diversified Telecommunication Services) | | | | | | | 2,836,000 | | | | 1,382,362 | |
China Petroleum & Chemical Corporation (Energy, Oil, Gas & Consumable Fuels) | | | | | | | 6,116,500 | | | | 5,008,417 | |
The accompanying notes are an integral part of these financial statements.
| | | | |
| 54 | | Wells Fargo Advantage Allocation Funds | | Portfolio of investments—November 30, 2014 (unaudited) |
INTERNATIONAL VALUE PORTFOLIO
| | | | | | | | | | | | |
| Security name | | | | | | Shares | | | Value | |
| | | | |
| China (continued) | | | | | | | | | | | | |
China Railway Construction Corporation Limited (Industrials, Construction & Engineering) | | | | | | | 1,747,500 | | | $ | 2,007,792 | |
Dongfeng Motor Group Company Limited (Consumer Discretionary, Automobiles) | | | | | | | 1,730,000 | | | | 2,632,400 | |
Shanghai Pharmaceuticals Holding Company Limited (Health Care, Pharmaceuticals) | | | | | | | 131,600 | | | | 313,604 | |
| | | | |
| | | | | | | | | | | 12,063,480 | |
| | | | | | | | | | | | |
| | | | |
| Czech Republic: 0.33% | | | | | | | | | | | | |
CEZ AS (Utilities, Electric Utilities) | | | | | | | 57,500 | | | | 1,602,829 | |
| | | | | | | | | | | | |
| | | | |
| Finland: 0.94% | | | | | | | | | | | | |
Kesko Oyj (Consumer Staples, Food & Staples Retailing) | | | | | | | 63,800 | | | | 2,485,585 | |
TietoEnator Oyj (Information Technology, IT Services) | | | | | | | 82,700 | | | | 2,121,872 | |
| | | | |
| | | | | | | | | | | 4,607,457 | |
| | | | | | | | | | | | |
| | | | |
| France: 8.40% | | | | | | | | | | | | |
Alstom SA (Industrials, Machinery) † | | | | | | | 83,800 | | | | 2,932,659 | |
AXA SA (Financials, Insurance) | | | | | | | 132,200 | | | | 3,193,698 | |
BNP Paribas SA (Financials, Banks) | | | | | | | 49,100 | | | | 3,150,064 | |
Compagnie Generale des Etablissements Michelin SCA Class B (Consumer Discretionary, Auto Components) | | | | | | | 24,000 | | | | 2,208,383 | |
Credit Agricole SA (Financials, Banks) | | | | | | | 219,328 | | | | 3,085,245 | |
Electricite de France SA (Utilities, Electric Utilities) | | | | | | | 122,100 | | | | 3,657,690 | |
Renault SA (Consumer Discretionary, Automobiles) | | | | | | | 40,500 | | | | 3,251,429 | |
Sanofi-Aventis SA (Health Care, Pharmaceuticals) | | | | | | | 61,400 | | | | 5,948,503 | |
SCOR SE (Financials, Insurance) | | | | | | | 109,700 | | | | 3,424,776 | |
Societe Generale SA (Financials, Banks) | | | | | | | 39,000 | | | | 1,935,769 | |
Thales SA (Industrials, Aerospace & Defense) | | | | | | | 59,100 | | | | 3,137,871 | |
Total SA (Energy, Oil, Gas & Consumable Fuels) | | | | | | | 93,700 | | | | 5,245,423 | |
| | | | |
| | | | | | | | | | | 41,171,510 | |
| | | | | | | | | | | | |
| | | | |
| Germany: 7.87% | | | | | | | | | | | | |
Allianz AG (Financials, Insurance) | | | | | | | 35,700 | | | | 6,150,156 | |
BASF SE (Materials, Chemicals) | | | | | | | 46,500 | | | | 4,224,353 | |
Bayerische Motoren Werke AG (Consumer Discretionary, Automobiles) | | | | | | | 26,100 | | | | 2,986,188 | |
Daimler AG (Consumer Discretionary, Automobiles) | | | | | | | 69,300 | | | | 5,846,391 | |
Deutsche Bank AG (Financials, Capital Markets) | | | | | | | 41,200 | | | | 1,347,504 | |
E.ON SE (Utilities, Multi-Utilities) | | | | | | | 87,200 | | | | 1,546,709 | |
Gildemeister AG (Industrials, Machinery) | | | | | | | 58,200 | | | | 1,542,870 | |
Hannover Rueckversicherung AG (Financials, Insurance) | | | | | | | 31,000 | | | | 2,768,019 | |
Muenchener Rueckversicherungs Gesellschaft AG (Financials, Insurance) | | | | | | | 19,700 | | | | 4,060,529 | |
Norddeutsche Affinerie AG (Materials, Metals & Mining) | | | | | | | 25,900 | | | | 1,428,317 | |
Stada Arzneimittel AG (Health Care, Pharmaceuticals) | | | | | | | 43,300 | | | | 1,560,312 | |
Volkswagen AG (Consumer Discretionary, Automobiles) | | | | | | | 22,600 | | | | 5,115,241 | |
| | | | |
| | | | | | | | | | | 38,576,589 | |
| | | | | | | | | | | | |
| | | | |
| Hong Kong: 1.90% | | | | | | | | | | | | |
China Resources Cement Holdings Limited (Materials, Construction Materials) | | | | | | | 743,000 | | | | 509,711 | |
Kingboard Laminates Holdings Limited (Information Technology, Electronic Equipment, Instruments & Components) | | | | | | | 2,204,000 | | | | 898,095 | |
Shenzhen International Holdings Limited (Industrials, Transportation Infrastructure) | | | | | | | 1,158,500 | | | | 1,738,893 | |
Skyworth Digital Holdings Limited (Consumer Discretionary, Household Durables) | | | | | | | 3,680,000 | | | | 2,054,752 | |
Wheelock & Company Limited (Financials, Real Estate Management & Development) | | | | | | | 379,000 | | | | 1,906,021 | |
Yue Yuen Industrial Holdings Limited (Consumer Discretionary, Textiles, Apparel & Luxury Goods) | | | | | | | 611,500 | | | | 2,192,124 | |
| | | | |
| | | | | | | | | | | 9,299,596 | |
| | | | | | | | | | | | |
The accompanying notes are an integral part of these financial statements.
| | | | | | |
| Portfolio of investments—November 30, 2014 (unaudited) | | Wells Fargo Advantage Allocation Funds | | | 55 | |
INTERNATIONAL VALUE PORTFOLIO
| | | | | | | | | | | | |
| Security name | | | | | | Shares | | | Value | |
| | | | |
| Hungary: 0.01% | | | | | | | | | | | | |
Richter Gedeon (Health Care, Pharmaceuticals) | | | | | | | 3,800 | | | $ | 59,155 | |
| | | | | | | | | | | | |
| | | | |
| India: 1.56% | | | | | | | | | | | | |
Gail Limited (Utilities, Gas Utilities) (i) | | | | | | | 41,200 | | | | 1,957,000 | |
Tata Motors Limited ADR (Consumer Discretionary, Automobiles) (i) | | | | | | | 83,800 | | | | 3,826,308 | |
Tata Steel Limited GDR (Industrials, Machinery) | | | | | | | 245,900 | | | | 1,876,217 | |
| | | | |
| | | | | | | | | | | 7,659,525 | |
| | | | | | | | | | | | |
| | | | |
| Ireland: 0.62% | | | | | | | | | | | | |
Irish Life & Permanent Group Holdings plc (Financials, Insurance) † | | | | | | | 111,500 | | | | 8,324 | |
Smurfit Kappa Group plc (Materials, Containers & Packaging) | | | | | | | 130,200 | | | | 3,018,205 | |
| | | | |
| | | | | | | | | | | 3,026,529 | |
| | | | | | | | | | | | |
| | | | |
| Israel: 1.15% | | | | | | | | | | | | |
Bank Hapoalim Limited (Financials, Banks) | | | | | | | 542,900 | | | | 2,705,965 | |
Teva Pharmaceutical Industries Limited (Health Care, Pharmaceuticals) | | | | | | | 51,404 | | | | 2,923,613 | |
| | | | |
| | | | | | | | | | | 5,629,578 | |
| | | | | | | | | | | | |
| | | | |
| Italy: 1.30% | | | | | | | | | | | | |
Enel SpA (Utilities, Electric Utilities) | | | | | | | 688,400 | | | | 3,323,514 | |
ENI SpA (Energy, Oil, Gas & Consumable Fuels) | | | | | | | 153,300 | | | | 3,065,371 | |
| | | | |
| | | | | | | | | | | 6,388,885 | |
| | | | | | | | | | | | |
| | | | |
| Japan: 19.78% | | | | | | | | | | | | |
Adeka Corporation (Materials, Chemicals) | | | | | | | 203,200 | | | | 2,448,605 | |
Aisin Seiki Company Limited (Consumer Discretionary, Auto Components) | | | | | | | 46,400 | | | | 1,659,796 | |
Anritsu Corporation (Information Technology, Electronic Equipment, Instruments & Components) | | | | | | | 69,000 | | | | 479,110 | |
Aoyama Trading Company Limited (Consumer Discretionary, Specialty Retail) | | | | | | | 73,100 | | | | 1,586,800 | |
Aozora Bank Limited (Financials, Banks) | | | | | | | 588,000 | | | | 1,912,598 | |
Calsonic Kansei Corporation (Consumer Discretionary, Auto Components) | | | | | | | 326,000 | | | | 1,788,371 | |
Chiba Bank Limited (Financials, Banks) | | | | | | | 329,000 | | | | 2,187,419 | |
CKD Corporation (Industrials, Machinery) | | | | | | | 10,200 | | | | 85,437 | |
DCM Japan Holdings Company Limited (Consumer Discretionary, Specialty Retail) | | | | | | | 143,100 | | | | 911,634 | |
Denki Kagaku Kogyo Kabushiki Kaisha (Materials, Chemicals) | | | | | | | 682,000 | | | | 2,327,547 | |
Eizo Nanao Corporation (Information Technology, Technology Hardware, Storage & Peripherals) | | | | | | | 63,300 | | | | 1,153,770 | |
Fukuoka Financial Group Incorporated (Financials, Banks) | | | | | | | 357,000 | | | | 1,946,398 | |
Itochu Corporation (Industrials, Trading Companies & Distributors) | | | | | | | 200,700 | | | | 2,310,240 | |
JX Holdings Incorporated (Energy, Oil, Gas & Consumable Fuels) | | | | | | | 408,000 | | | | 1,518,267 | |
Kaken Pharmaceutical Company Limited (Health Care, Pharmaceuticals) | | | | | | | 41,000 | | | | 870,650 | |
KDDI Corporation (Telecommunication Services, Wireless Telecommunication Services) | | | | | | | 67,800 | | | | 4,344,411 | |
Kyorin Company Limited (Health Care, Pharmaceuticals) | | | | | | | 99,000 | | | | 1,927,109 | |
Maeda Road Construction Company Limited (Industrials, Construction & Engineering) | | | | | | | 148,000 | | | | 2,096,469 | |
Marubeni Corporation (Industrials, Trading Companies & Distributors) | | | | | | | 516,000 | | | | 3,253,752 | |
Miraca Holdings Incorporated (Health Care, Health Care Providers & Services) | | | | | | | 25,100 | | | | 952,857 | |
Mitsubishi Corporation (Industrials, Trading Companies & Distributors) | | | | | | | 35,500 | | | | 671,589 | |
Mitsubishi UFJ Financial Group Incorporated (Financials, Banks) | | | | | | | 657,100 | | | | 3,800,737 | |
Mitsui & Company Limited (Industrials, Trading Companies & Distributors) | | | | | | | 260,300 | | | | 3,591,820 | |
Mizuho Financial Group Incorporated (Financials, Banks) | | | | | | | 2,244,400 | | | | 3,867,699 | |
Namura Shipbuilding Company Limited (Industrials, Machinery) | | | | | | | 108,800 | | | | 1,271,641 | |
The accompanying notes are an integral part of these financial statements.
| | | | |
| 56 | | Wells Fargo Advantage Allocation Funds | | Portfolio of investments—November 30, 2014 (unaudited) |
INTERNATIONAL VALUE PORTFOLIO
| | | | | | | | | | | | |
| Security name | | | | | | Shares | | | Value | |
| | | | |
| Japan (continued) | | | | | | | | | | | | |
Nippon Telegraph & Telephone Corporation (Telecommunication Services, Diversified Telecommunication Services) | | | | | | | 117,000 | | | $ | 6,261,625 | |
Nissan Motor Company Limited (Consumer Discretionary, Automobiles) | | | | | | | 367,800 | | | | 3,435,631 | |
NTT DoCoMo Incorporated (Telecommunication Services, Wireless Telecommunication Services) | | | | | | | 180,000 | | | | 2,808,376 | |
Otsuka Holdings Company Limited (Health Care, Pharmaceuticals) | | | | | | | 123,100 | | | | 3,892,582 | |
Rengo Company Limited (Materials, Containers & Packaging) | | | | | | | 189,000 | | | | 761,288 | |
Resona Holdings Incorporated (Financials, Banks) | | | | | | | 1,013,300 | | | | 5,471,666 | |
Saizeriya Company Limited (Consumer Discretionary, Hotels, Restaurants & Leisure) | | | | | | | 84,000 | | | | 1,123,350 | |
Sankyu Incorporated (Industrials, Road & Rail) | | | | | | | 370,000 | | | | 1,446,701 | |
Sojitz Corporation (Industrials, Trading Companies & Distributors) | | | | | | | 678,000 | | | | 971,265 | |
Sumitomo Corporation (Industrials, Trading Companies & Distributors) | | | | | | | 285,000 | | | | 3,040,448 | |
Sumitomo Metal Mining Company Limited (Materials, Metals & Mining) | | | | | | | 109,000 | | | | 1,668,939 | |
Sumitomo Mitsui Financial Group Incorporated (Financials, Banks) | | | | | | | 100,400 | | | | 3,786,045 | |
The Keiyo Bank Limited (Financials, Banks) | | | | | | | 62,000 | | | | 344,299 | |
Toshiba TEC Corporation (Information Technology, Technology Hardware, Storage & Peripherals) | | | | | | | 234,000 | | | | 1,660,302 | |
Toyo Tire & Rubber Company Limited (Consumer Discretionary, Auto Components) | | | | | | | 162,500 | | | | 3,327,505 | |
Tsumura & Company (Health Care, Pharmaceuticals) | | | | | | | 79,300 | | | | 1,783,532 | |
Tsuruha Holdings Incorporated (Consumer Staples, Food & Staples Retailing) | | | | | | | 16,800 | | | | 948,513 | |
West Japan Railway Company (Industrials, Road & Rail) | | | | | | | 54,200 | | | | 2,587,825 | |
Yokohama Rubber Company Limited (Consumer Discretionary, Auto Components) | | | | | | | 297,000 | | | | 2,732,991 | |
| | | | |
| | | | | | | | | | | 97,017,609 | |
| | | | | | | | | | | | |
| | | | |
| Liechtenstein: 0.13% | | | | | | | | | | | | |
Verwaltungs-und Privat-Bank AG (Financials, Capital Markets) (i) | | | | | | | 7,800 | | | | 634,823 | |
| | | | | | | | | | | | |
| | | | |
| Netherlands: 2.80% | | | | | | | | | | | | |
Aegon NV (Financials, Insurance) | | | | | | | 334,000 | | | | 2,623,658 | |
ING Groep NV (Financials, Banks) † | | | | | | | 237,100 | | | | 3,475,376 | |
Koninklijke Ahold NV (Consumer Staples, Food & Staples Retailing) | | | | | | | 263,630 | | | | 4,659,733 | |
Nutreco NV (Consumer Staples, Food Products) | | | | | | | 52,400 | | | | 2,998,282 | |
| | | | |
| | | | | | | | | | | 13,757,049 | |
| | | | | | | | | | | | |
| | | | |
| Norway: 1.65% | | | | | | | | | | | | |
Atea ASA (Information Technology, IT Services) | | | | | | | 84,900 | | | | 881,012 | |
DnB Nor ASA (Financials, Banks) | | | | | | | 148,800 | | | | 2,464,224 | |
Marine Harvest ASA (Consumer Staples, Food Products) | | | | | | | 94,300 | | | | 1,333,786 | |
Statoil ASA (Energy, Oil, Gas & Consumable Fuels) | | | | | | | 61,700 | | | | 1,162,124 | |
Yara International ASA (Materials, Chemicals) | | | | | | | 53,600 | | | | 2,272,843 | |
| | | | |
| | | | | | | | | | | 8,113,989 | |
| | | | | | | | | | | | |
| | | | |
| Poland: 0.60% | | | | | | | | | | | | |
Asseco Poland SA (Information Technology, Software) | | | | | | | 101,800 | | | | 1,629,236 | |
KGHM Polska Miedz SA (Materials, Metals & Mining) | | | | | | | 36,500 | | | | 1,334,439 | |
| | | | |
| | | | | | | | | | | 2,963,675 | |
| | | | | | | | | | | | |
| | | | |
| Russia: 1.06% | | | | | | | | | | | | |
Gazprom Neft Sponsored ADR (Energy, Oil, Gas & Consumable Fuels) (i) | | | | | | | 150,014 | | | | 2,439,228 | |
Gazprom Neft Sponsored ADR (Energy, Oil, Gas & Consumable Fuels) | | | | | | | 886 | | | | 14,430 | |
LUKOIL ADR (Energy, Oil, Gas & Consumable Fuels) | | | | | | | 60,400 | | | | 2,763,300 | |
| | | | |
| | | | | | | | | | | 5,216,958 | |
| | | | | | | | | | | | |
The accompanying notes are an integral part of these financial statements.
| | | | | | |
| Portfolio of investments—November 30, 2014 (unaudited) | | Wells Fargo Advantage Allocation Funds | | | 57 | |
INTERNATIONAL VALUE PORTFOLIO
| | | | | | | | | | | | |
| Security name | | | | | | Shares | | | Value | |
| | | | |
| Singapore: 1.13% | | | | | | | | | | | | |
DBS Group Holdings Limited (Financials, Banks) | | | | | | | 227,000 | | | $ | 3,453,856 | |
United Overseas Bank Limited (Financials, Banks) | | | | | | | 113,000 | | | | 2,080,872 | |
| | | | |
| | | | | | | | | | | 5,534,728 | |
| | | | | | | | | | | | |
| | | | |
| South Africa: 0.66% | | | | | | | | | | | | |
Barclays Africa Group Limited (Financials, Banks) | | | | | | | 200,300 | | | | 3,224,974 | |
| | | | | | | | | | | | |
| | | | |
| South Korea: 2.51% | | | | | | | | | | | | |
E-MART Company Limited (Consumer Staples, Food & Staples Retailing) | | | | | | | 8,500 | | | | 1,687,802 | |
GS Retail Company Limited (Consumer Staples, Food & Staples Retailing) | | | | | | | 13,449 | | | | 307,107 | |
Industrial Bank of Korea (Financials, Banks) | | | | | | | 192,500 | | | | 2,614,852 | |
Kwangju Bank (Financials, Banks) † | | | | | | | 13,510 | | | | 120,108 | |
Kyongnam Bank (Financials, Banks) † | | | | | | | 20,645 | | | | 237,577 | |
SK Telecom Company Limited (Telecommunication Services, Wireless Telecommunication Services) | | | | | | | 22,300 | | | | 5,645,697 | |
Woori Bank (Financials, Banks) † | | | | | | | 178,044 | | | | 1,719,456 | |
| | | | |
| | | | | | | | | | | 12,332,599 | |
| | | | | | | | | | | | |
| | | | |
| Spain: 1.53% | | | | | | | | | | | | |
Banco Santander Central Hispano SA (Financials, Banks) | | | | | | | 429,681 | | | | 3,875,691 | |
Repsol YPF SA (Energy, Oil, Gas & Consumable Fuels) | | | | | | | 123,800 | | | | 2,780,499 | |
Telefonica SA (Telecommunication Services, Diversified Telecommunication Services) | | | | | | | 52,400 | | | | 839,793 | |
| | | | |
| | | | | | | | | | | 7,495,983 | |
| | | | | | | | | | | | |
| | | | |
| Sweden: 2.22% | | | | | | | | | | | | |
Boliden AB (Materials, Metals & Mining) | | | | | | | 169,300 | | | | 2,861,293 | |
Nordea Bank AB (Financials, Banks) | | | | | | | 177,300 | | | | 2,215,269 | |
Saab AB (Industrials, Aerospace & Defense) | | | | | | | 113,500 | | | | 3,169,651 | |
Skandinaviska Enskilda Banken AB Class A (Financials, Banks) | | | | | | | 144,900 | | | | 1,914,430 | |
Teliasonera AB (Telecommunication Services, Diversified Telecommunication Services) | | | | | | | 103,000 | | | | 734,994 | |
| | | | |
| | | | | | | | | | | 10,895,637 | |
| | | | | | | | | | | | |
| | | | |
| Switzerland: 5.06% | | | | | | | | | | | | |
Baloise Holding AG (Financials, Insurance) | | | | | | | 28,800 | | | | 3,763,458 | |
Credit Suisse Group AG (Financials, Capital Markets) | | | | | | | 184,595 | | | | 4,935,276 | |
GAM Holding AG (Financials, Capital Markets) | | | | | | | 79,700 | | | | 1,411,204 | |
Georg Fischer AG (Industrials, Machinery) | | | | | | | 3,000 | | | | 1,837,432 | |
Novartis AG (Health Care, Pharmaceuticals) | | | | | | | 34,700 | | | | 3,359,513 | |
Swiss Reinsurance AG (Financials, Insurance) | | | | | | | 48,500 | | | | 4,148,175 | |
Zurich Financial Services AG (Financials, Insurance) | | | | | | | 17,100 | | | | 5,361,512 | |
| | | | |
| | | | | | | | | | | 24,816,570 | |
| | | | | | | | | | | | |
| | | | |
| Taiwan: 0.49% | | | | | | | | | | | | |
Pegatron Corporation (Information Technology, Technology Hardware, Storage & Peripherals) | | | | | | | 1,035,000 | | | | 2,401,260 | |
| | | | | | | | | | | | |
| | | | |
| Thailand: 0.79% | | | | | | | | | | | | |
Bangchak Petroleum plc (Energy, Oil, Gas & Consumable Fuels) | | | | | | | 2,188,900 | | | | 2,366,559 | |
Thanachart Capital plc (Financials, Banks) | | | | | | | 1,481,500 | | | | 1,511,504 | |
| | | | |
| | | | | | | | | | | 3,878,063 | |
| | | | | | | | | | | | |
The accompanying notes are an integral part of these financial statements.
| | | | |
| 58 | | Wells Fargo Advantage Allocation Funds | | Portfolio of investments—November 30, 2014 (unaudited) |
INTERNATIONAL VALUE PORTFOLIO
| | | | | | | | | | | | | | | | |
| Security name | | | | | | | | | Shares | | | Value | |
| | | | | |
| United Kingdom: 18.27% | | | | | | | | | | | | | | | | |
3i Group plc (Financials, Capital Markets) | | | | | | | | | | | 316,400 | | | $ | 2,197,133 | |
Alent plc (Materials, Chemicals) | | | | | | | | | | | 111,265 | | | | 592,011 | |
AMEC plc (Energy, Energy Equipment & Services) | | | | | | | | | | | 83,300 | | | | 1,217,478 | |
Amlin plc (Financials, Insurance) | | | | | | | | | | | 279,000 | | | | 1,942,657 | |
Anglo American plc (Materials, Metals & Mining) | | | | | | | | | | | 107,000 | | | | 2,211,504 | |
AstraZeneca plc (Health Care, Pharmaceuticals) | | | | | | | | | | | 89,800 | | | | 6,713,378 | |
Aviva plc (Financials, Insurance) | | | | | | | | | | | 314,900 | | | | 2,501,919 | |
BAE Systems plc (Industrials, Aerospace & Defense) | | | | | | | | | | | 684,100 | | | | 5,147,446 | |
Barclays plc (Financials, Banks) | | | | | | | | | | | 715,000 | | | | 2,741,415 | |
Barratt Developments plc (Consumer Discretionary, Household Durables) | | | | | | | | | | | 236,200 | | | | 1,700,426 | |
BP plc (Energy, Oil, Gas & Consumable Fuels) | | | | | | | | | | | 844,300 | | | | 5,548,680 | |
BT Group plc (Telecommunication Services, Diversified Telecommunication Services) | | | | | | | | | | | 727,900 | | | | 4,669,864 | |
Carillion plc (Industrials, Construction & Engineering) | | | | | | | | | | | 261,500 | | | | 1,421,636 | |
Centrica plc (Utilities, Multi-Utilities) | | | | | | | | | | | 898,500 | | | | 3,999,354 | |
Chemring Group plc (Industrials, Aerospace & Defense) | | | | | | | | | | | 247,200 | | | | 913,392 | |
Debenhams plc (Consumer Discretionary, Multiline Retail) | | | | | | | | | | | 1,238,200 | | | | 1,394,313 | |
Firstgroup plc (Industrials, Road & Rail) † | | | | | | | | | | | 254,700 | | | | 450,137 | |
GlaxoSmithKline plc (Health Care, Pharmaceuticals) | | | | | | | | | | | 75,900 | | | | 1,762,808 | |
Home Retail Group plc (Consumer Discretionary, Internet & Catalog Retail) | | | | | | | | | | | 290,000 | | | | 908,935 | |
J Sainsbury plc (Consumer Staples, Food & Staples Retailing) « | | | | | | | | | | | 907,900 | | | | 3,314,177 | |
Kesa Electricals plc (Consumer Discretionary, Specialty Retail) (i) | | | | | | | | | | | 547,900 | | | | 571,991 | |
Lloyds Banking Group plc (Financials, Banks) † | | | | | | | | | | | 1,749,400 | | | | 2,198,426 | |
Marston’s plc (Consumer Discretionary, Hotels, Restaurants & Leisure) | | | | | | | | | | | 558,800 | | | | 1,264,625 | |
Mondi plc (Materials, Paper & Forest Products) | | | | | | | | | | | 127,600 | | | | 2,185,253 | |
Old Mutual plc (Financials, Insurance) | | | | | | | | | | | 982,800 | | | | 3,078,811 | |
Pace plc (Consumer Discretionary, Household Durables) | | | | | | | | | | | 308,800 | | | | 1,736,736 | |
Petrofac Limited (Energy, Energy Equipment & Services) | | | | | | | | | | | 84,300 | | | | 1,087,723 | |
Premier Foods plc (Consumer Staples, Food Products) † | | | | | | | | | | | 73,926 | | | | 42,780 | |
Royal Dutch Shell plc Class A (Energy, Oil, Gas & Consumable Fuels) | | | | | | | | | | | 14,300 | | | | 477,666 | |
Royal Dutch Shell plc Class B (Energy, Oil, Gas & Consumable Fuels) | | | | | | | | | | | 322,700 | | | | 11,219,547 | |
Standard Chartered plc (Financials, Banks) | | | | | | | | | | | 253,000 | | | | 3,708,031 | |
Tate & Lyle plc (Consumer Staples, Food Products) | | | | | | | | | | | 158,800 | | | | 1,498,872 | |
Tesco plc (Consumer Staples, Food & Staples Retailing) | | | | | | | | | | | 1,033,600 | | | | 3,014,059 | |
Tullett Prebon plc (Financials, Capital Markets) | | | | | | | | | | | 279,500 | | | | 1,102,462 | |
Vesuvius plc (Industrials, Machinery) | | | | | | | | | | | 145,400 | | | | 946,690 | |
WH Smith plc (Consumer Discretionary, Specialty Retail) | | | | | | | | | | | 111,900 | | | | 2,210,397 | |
William Morrison Supermarkets plc (Consumer Staples, Food & Staples Retailing) | | | | | | | | | | | 679,700 | | | | 1,897,546 | |
| | | | | |
| | | | | | | | | | | | | | | 89,590,278 | |
| | | | | | | | | | | | | | | | |
| | | | | |
Total Common Stocks (Cost $467,306,073) | | | | | | | | | | | | | | | 473,344,565 | |
| | | | | | | | | | | | | | | | |
| | | | | |
| | | Dividend yield | | | | | | | | | | | |
| | | | | |
Preferred Stocks: 0.94% | | | | | | | | | | | | | | | | |
| | | | | |
| Brazil: 0.94% | | | | | | | | | | | | | | | | |
Banco do Estado do Rio Grande do Sul SA (Financials, Banks) ± | | | 5.03 | % | | | | | | | 349,800 | | | | 2,004,819 | |
Companhia Energetica de Minas Gerais SA (Utilities, Electric Utilities) ± | | | 12.06 | | | | | | | | 109,056 | | | | 599,099 | |
Companhia Vale Do Rio Doce Class A (Materials, Metals & Mining) ± | | | 8.32 | | | | | | | | 257,700 | | | | 2,003,446 | |
| | | | | |
Total Preferred Stocks (Cost $7,494,241) | | | | | | | | | | | | | | | 4,607,364 | |
| | | | | | | | | | | | | | | | |
The accompanying notes are an integral part of these financial statements.
| | | | | | |
| Portfolio of investments—November 30, 2014 (unaudited) | | Wells Fargo Advantage Allocation Funds | | | 59 | |
INTERNATIONAL VALUE PORTFOLIO
| | | | | | | | | | | | | | | | | | |
| Security name | | | | | Expiration date | | | | | Shares | | | Value | |
| | | | | |
Rights: 0.01% | | | | | | | | | | | | | | | | | | |
| | | | | |
| Spain: 0.01% | | | | | | | | | | | | | | | | | | |
Telefonica SA † | | | | | | | 2-27-2015 | | | | | | 52,400 | | | $ | 23,994 | |
| | | | | | | | | | | | | | | | | | |
| | | | | |
Total Rights (Cost $22,818) | | | | | | | | | | | | | | | | | 23,994 | |
| | | | | | | | | | | | | | | | | | |
| | | | | |
| | | Yield | | | | | | | | | | | | |
| | | | | |
Short-Term Investments: 4.24% | | | | | | | | | | | | | | | | | | |
| | | | | |
| Investment Companies: 4.24% | | | | | | | | | | | | | | | | | | |
Securities Lending Cash Investments, LLC (l)(u)(r) | | | 0.12 | % | | | | | | | | | 14,194,341 | | | | 14,194,341 | |
Wells Fargo Advantage Cash Investment Money Market Fund, Select Class (l)(u) | | | 0.08 | | | | | | | | | | 6,617,840 | | | | 6,617,840 | |
| | | | | |
Total Short-Term Investments (Cost $20,812,181) | | | | | | | | | | | | | | | | | 20,812,181 | |
| | | | | | | | | | | | | | | | | | |
| | | | | | | | |
| Total investments in securities (Cost $495,635,313) * | | | 101.71 | % | | | 498,788,104 | |
Other assets and liabilities, net | | | (1.71 | ) | | | (8,394,726 | ) |
| | | | | | | | |
| Total net assets | | | 100.00 | % | | $ | 490,393,378 | |
| | | | | | | | |
| † | Non-income-earning security |
| « | All or a portion of this security is on loan. |
| ± | Variable rate investment. The interest rate shown is the rate in effect at period end. |
| (l) | The security represents an affiliate of the Portfolio as defined in the Investment Company Act of 1940. |
| (u) | The rate represents the 7-day annualized yield at period end. |
| (r) | The investment is a non-registered investment vehicle purchased with cash collateral received from securities on loan. |
| * | Cost for federal income tax purposes is $452,438,425 and unrealized gains (losses) consists of: |
| | | | |
Gross unrealized gains | | $ | 159,488,851 | |
Gross unrealized losses | | | (113,139,172 | ) |
| | | | |
Net unrealized gains | | $ | 46,349,679 | |
The following table shows the percent of total long-term investments by sector as of November 30, 2014:
| | | | |
Financials | | | 30.21 | % |
Consumer Discretionary | | | 13.47 | |
Industrials | | | 11.94 | |
Energy | | | 9.86 | |
Materials | | | 8.75 | |
Health Care | | | 6.99 | |
Consumer Staples | | | 6.82 | |
Telecommunication Services | | | 5.58 | |
Utilities | | | 4.03 | |
Information Technology | | | 2.35 | |
| | | | |
| | | 100.00 | % |
| | | | |
The accompanying notes are an integral part of these financial statements.
| | | | |
| 60 | | Wells Fargo Advantage Allocation Funds | | Portfolio of investments—November 30, 2014 (unaudited) |
LARGE COMPANY VALUE PORTFOLIO
| | | | | | | | | | | | |
| Security name | | | | | | Shares | | | Value | |
| | | | |
Common Stocks: 98.80% | | | | | | | | | | | | |
| | | | |
Consumer Discretionary: 8.73% | | | | | | | | | | | | |
| | | | |
| Automobiles: 1.02% | | | | | | | | | | | | |
Ford Motor Company | | | | | | | 57,585 | | | $ | 905,812 | |
| | | | | | | | | | | | |
| | | | |
| Hotels, Restaurants & Leisure: 2.27% | | | | | | | | | | | | |
Las Vegas Sands Corporation | | | | | | | 10,359 | | | | 659,765 | |
Norwegian Cruise Line Holdings Limited † | | | | | | | 30,830 | | | | 1,353,129 | |
| | | | |
| | | | | | | | | | | 2,012,894 | |
| | | | | | | | | | | | |
| | | | |
| Household Durables: 1.88% | | | | | | | | | | | | |
Newell Rubbermaid Incorporated | | | | | | | 28,697 | | | | 1,041,986 | |
Toll Brothers Incorporated † | | | | | | | 17,999 | | | | 629,785 | |
| | | | |
| | | | | | | | | | | 1,671,771 | |
| | | | | | | | | | | | |
| | | | |
| Media: 2.52% | | | | | | | | | | | | |
Gannett Company Incorporated | | | | | | | 12,760 | | | | 415,338 | |
The Walt Disney Company | | | | | | | 4,950 | | | | 457,925 | |
Viacom Incorporated Class B | | | | | | | 18,073 | | | | 1,366,861 | |
| | | | |
| | | | | | | | | | | 2,240,124 | |
| | | | | | | | | | | | |
| | | | |
| Textiles, Apparel & Luxury Goods: 1.04% | | | | | | | | | | | | |
PVH Corporation | | | | | | | 7,272 | | | | 924,562 | |
| | | | | | | | | | | | |
| | | | |
Consumer Staples: 4.82% | | | | | | | | | | | | |
| | | | |
| Food & Staples Retailing: 2.96% | | | | | | | | | | | | |
CVS Health Corporation | | | | | | | 28,745 | | | | 2,626,143 | |
| | | | | | | | | | | | |
| | | | |
| Household Products: 1.40% | | | | | | | | | | | | |
The Procter & Gamble Company | | | | | | | 13,758 | | | | 1,244,136 | |
| | | | | | | | | | | | |
| | | | |
| Personal Products: 0.46% | | | | | | | | | | | | |
Herbalife Limited « | | | | | | | 9,385 | | | | 405,901 | |
| | | | | | | | | | | | |
| | | | |
Energy: 9.05% | | | | | | | | | | | | |
| | | | |
| Energy Equipment & Services: 1.00% | | | | | | | | | | | | |
Baker Hughes Incorporated | | | | | | | 15,574 | | | | 887,718 | |
| | | | | | | | | | | | |
| | | | |
| Oil, Gas & Consumable Fuels: 8.05% | | | | | | | | | | | | |
Chevron Corporation | | | | | | | 9,775 | | | | 1,064,204 | |
ConocoPhillips Company | | | | | | | 14,775 | | | | 976,184 | |
Exxon Mobil Corporation | | | | | | | 13,508 | | | | 1,223,014 | |
Marathon Oil Corporation | | | | | | | 42,007 | | | | 1,214,842 | |
Noble Energy Incorporated | | | | | | | 15,968 | | | | 785,306 | |
Valero Energy Corporation | | | | | | | 28,154 | | | | 1,368,566 | |
Whiting Petroleum Corporation † | | | | | | | 12,415 | | | | 518,575 | |
| | | | |
| | | | | | | | | | | 7,150,691 | |
| | | | | | | | | | | | |
The accompanying notes are an integral part of these financial statements.
| | | | | | |
| Portfolio of investments—November 30, 2014 (unaudited) | | Wells Fargo Advantage Allocation Funds | | | 61 | |
LARGE COMPANY VALUE PORTFOLIO
| | | | | | | | | | | | |
| Security name | | | | | | Shares | | | Value | |
| | | | |
Financials: 29.36% | | | | | | | | | | | | |
| | | | |
| Banks: 12.28% | | | | | | | | | | | | |
Bank of America Corporation | | | | | | | 121,134 | | | $ | 2,064,123 | |
BOK Financial Corporation | | | | | | | 20,039 | | | | 1,291,514 | |
Citigroup Incorporated | | | | | | | 41,091 | | | | 2,217,681 | |
First Republic Bank | | | | | | | 29,589 | | | | 1,524,721 | |
JPMorgan Chase & Company | | | | | | | 35,754 | | | | 2,150,961 | |
KeyCorp | | | | | | | 122,684 | | | | 1,656,234 | |
| | | | |
| | | | | | | | | | | 10,905,234 | |
| | | | | | | | | | | | |
| | | | |
| Capital Markets: 2.28% | | | | | | | | | | | | |
Ameriprise Financial Incorporated | | | | | | | 7,966 | | | | 1,049,680 | |
Goldman Sachs Group Incorporated | | | | | | | 5,193 | | | | 978,413 | |
| | | | |
| | | | | | | | | | | 2,028,093 | |
| | | | | | | | | | | | |
| | | | |
| Consumer Finance: 1.05% | | | | | | | | | | | | |
American Express Company | | | | | | | 10,096 | | | | 933,072 | |
| | | | | | | | | | | | |
| | | | |
| Insurance: 8.85% | | | | | | | | | | | | |
ACE Limited | | | | | | | 7,968 | | | | 911,061 | |
American International Group Incorporated | | | | | | | 42,022 | | | | 2,302,806 | |
Endurance Specialty Holdings Limited | | | | | | | 19,620 | | | | 1,157,188 | |
MetLife Incorporated | | | | | | | 30,141 | | | | 1,676,141 | |
The Hartford Financial Services Group Incorporated | | | | | | | 43,741 | | | | 1,806,503 | |
| | | | |
| | | | | | | | | | | 7,853,699 | |
| | | | | | | | | | | | |
| | | | |
| REITs: 4.90% | | | | | | | | | | | | |
Alexandria Real Estate Equities Incorporated | | | | | | | 11,116 | | | | 955,087 | |
American Campus Communities Incorporated | | | | | | | 23,430 | | | | 937,200 | |
American Tower Corporation | | | | | | | 13,983 | | | | 1,468,355 | |
LaSalle Hotel Properties | | | | | | | 24,497 | | | | 988,944 | |
| | | | |
| | | | | | | | | | | 4,349,586 | |
| | | | | | | | | | | | |
| | | | |
Health Care: 13.56% | | | | | | | | | | | | |
| | | | |
| Biotechnology: 0.88% | | | | | | | | | | | | |
Gilead Sciences Incorporated † | | | | | | | 7,831 | | | | 785,606 | |
| | | | | | | | | | | | |
| | | | |
| Health Care Equipment & Supplies: 2.97% | | | | | | | | | | | | |
Medtronic Incorporated | | | | | | | 14,952 | | | | 1,104,504 | |
Stryker Corporation | | | | | | | 16,469 | | | | 1,530,135 | |
| | | | |
| | | | | | | | | | | 2,634,639 | |
| | | | | | | | | | | | |
| | | | |
| Health Care Providers & Services: 2.96% | | | | | | | | | | | | |
Cigna Corporation | | | | | | | 16,419 | | | | 1,689,351 | |
HCA Holdings Incorporated † | | | | | | | 13,462 | | | | 938,167 | |
| | | | |
| | | | | | | | | | | 2,627,518 | |
| | | | | | | | | | | | |
| | | | |
| Pharmaceuticals: 6.75% | | | | | | | | | | | | |
Johnson & Johnson | | | | | | | 8,586 | | | | 929,435 | |
Merck & Company Incorporated | | | | | | | 32,684 | | | | 1,974,114 | |
The accompanying notes are an integral part of these financial statements.
| | | | |
| 62 | | Wells Fargo Advantage Allocation Funds | | Portfolio of investments—November 30, 2014 (unaudited) |
LARGE COMPANY VALUE PORTFOLIO
| | | | | | | | | | | | |
| Security name | | | | | | Shares | | | Value | |
| | | | |
| Pharmaceuticals (continued) | | | | | | | | | | | | |
Novartis AG ADR | | | | | | | 16,667 | | | $ | 1,610,866 | |
Pfizer Incorporated | | | | | | | 47,367 | | | | 1,475,482 | |
| | | | |
| | | | | | | | | | | 5,989,897 | |
| | | | | | | | | | | | |
| | | | |
Industrials: 11.50% | | | | | | | | | | | | |
| | | | |
| Aerospace & Defense: 0.94% | | | | | | | | | | | | |
Triumph Group Incorporated | | | | | | | 12,351 | | | | 840,609 | |
| | | | | | | | | | | | |
| | | | |
| Airlines: 1.30% | | | | | | | | | | | | |
United Continental Holdings Incorporated † | | | | | | | 18,839 | | | | 1,153,512 | |
| | | | | | | | | | | | |
| | | | |
| Commercial Services & Supplies: 1.04% | | | | | | | | | | | | |
West Corporation | | | | | | | 29,715 | | | | 928,297 | |
| | | | | | | | | | | | |
| | | | |
| Construction & Engineering: 0.85% | | | | | | | | | | | | |
Quanta Services Incorporated † | | | | | | | 24,711 | | | | 753,686 | |
| | | | | | | | | | | | |
| | | | |
| Electrical Equipment: 0.72% | | | | | | | | | | | | |
Eaton Corporation plc | | | | | | | 9,411 | | | | 638,348 | |
| | | | | | | | | | | | |
| | | | |
| Industrial Conglomerates: 1.45% | | | | | | | | | | | | |
General Electric Company | | | | | | | 48,541 | | | | 1,285,851 | |
| | | | | | | | | | | | |
| | | | |
| Machinery: 3.97% | | | | | | | | | | | | |
Crane Company | | | | | | | 10,314 | | | | 608,835 | |
Dover Corporation | | | | | | | 11,299 | | | | 869,910 | |
Stanley Black & Decker Incorporated | | | | | | | 15,350 | | | | 1,449,654 | |
The Timken Company | | | | | | | 13,991 | | | | 598,675 | |
| | | | |
| | | | | | | | | | | 3,527,074 | |
| | | | | | | | | | | | |
| | | | |
| Road & Rail: 0.51% | | | | | | | | | | | | |
AMERCO | | | | | | | 1,622 | | | | 451,240 | |
| | | | | | | | | | | | |
| | | | |
| Trading Companies & Distributors: 0.72% | | | | | | | | | | | | |
WESCO International Incorporated † | | | | | | | 7,726 | | | | 636,545 | |
| | | | | | | | | | | | |
| | | | |
Information Technology: 12.73% | | | | | | | | | | | | |
| | | | |
| Electronic Equipment, Instruments & Components: 1.82% | | | | | | | | | | | | |
Synnex Corporation | | | | | | | 15,724 | | | | 1,123,323 | |
TE Connectivity Limited | | | | | | | 7,718 | | | | 495,496 | |
| | | | |
| | | | | | | | | | | 1,618,819 | |
| | | | | | | | | | | | |
| | | | |
| Internet Software & Services: 2.12% | | | | | | | | | | | | |
AOL Incorporated † | | | | | | | 17,068 | | | | 787,859 | |
Yahoo! Incorporated † | | | | | | | 21,125 | | | | 1,093,008 | |
| | | | |
| | | | | | | | | | | 1,880,867 | |
| | | | | | | | | | | | |
| | | | |
| IT Services: 0.53% | | | | | | | | | | | | |
Teradata Corporation † | | | | | | | 10,346 | | | | 467,018 | |
| | | | | | | | | | | | |
The accompanying notes are an integral part of these financial statements.
| | | | | | |
| Portfolio of investments—November 30, 2014 (unaudited) | | Wells Fargo Advantage Allocation Funds | | | 63 | |
LARGE COMPANY VALUE PORTFOLIO
| | | | | | | | | | | | | | | | |
| Security name | | | | | | | | | Shares | | | Value | |
| | | | | |
| Semiconductors & Semiconductor Equipment: 2.04% | | | | | | | | | | | | | | | | |
Skyworks Solutions Incorporated | | | | | | | | | | | 26,834 | | | $ | 1,810,490 | |
| | | | | | | | | | | | | | | | |
| | | | | |
| Technology Hardware, Storage & Peripherals: 6.22% | | | | | | | | | | | | | | | | |
Apple Incorporated | | | | | | | | | | | 13,430 | | | | 1,597,230 | |
EMC Corporation | | | | | | | | | | | 48,172 | | | | 1,462,020 | |
Hewlett-Packard Company | | | | | | | | | | | 23,512 | | | | 918,379 | |
NCR Corporation † | | | | | | | | | | | 35,415 | | | | 1,050,055 | |
Seagate Technology plc | | | | | | | | | | | 7,504 | | | | 496,089 | |
| | | | | |
| | | | | | | | | | | | | | | 5,523,773 | |
| | | | | | | | | | | | | | | | |
| | | | | |
Materials: 3.62% | | | | | | | | | | | | | | | | |
| | | | | |
| Chemicals: 1.90% | | | | | | | | | | | | | | | | |
Cabot Corporation | | | | | | | | | | | 13,440 | | | | 578,995 | |
Huntsman Corporation | | | | | | | | | | | 43,520 | | | | 1,110,630 | |
| | | | | |
| | | | | | | | | | | | | | | 1,689,625 | |
| | | | | | | | | | | | | | | | |
| | | | | |
| Containers & Packaging: 1.07% | | | | | | | | | | | | | | | | |
Crown Holdings Incorporated † | | | | | | | | | | | 19,245 | | | | 952,628 | |
| | | | | | | | | | | | | | | | |
| | | | | |
| Paper & Forest Products: 0.65% | | | | | | | | | | | | | | | | |
International Paper Company | | | | | | | | | | | 10,711 | | | | 576,466 | |
| | | | | | | | | | | | | | | | |
| | | | | |
Telecommunication Services: 1.93% | | | | | | | | | | | | | | | | |
| | | | | |
| Diversified Telecommunication Services: 1.93% | | | | | | | | | | | | | | | | |
CenturyLink Incorporated | | | | | | | | | | | 17,637 | | | | 719,060 | |
Verizon Communications Incorporated | | | | | | | | | | | 19,685 | | | | 995,864 | |
| | | | | |
| | | | | | | | | | | | | | | 1,714,924 | |
| | | | | | | | | | | | | | | | |
| | | | | |
Utilities: 3.50% | | | | | | | | | | | | | | | | |
| | | | | |
| Electric Utilities: 2.60% | | | | | | | | | | | | | | | | |
Duke Energy Corporation | | | | | | | | | | | 13,268 | | | | 1,073,381 | |
The Southern Company | | | | | | | | | | | 26,004 | | | | 1,233,370 | |
| | | | | |
| | | | | | | | | | | | | | | 2,306,751 | |
| | | | | | | | | | | | | | | | |
| | | | | |
| Independent Power & Renewable Electricity Producers: 0.90% | | | | | | | | | | | | | | | | |
AES Corporation | | | | | | | | | | | 57,960 | | | | 803,905 | |
| | | | | | | | | | | | | | | | |
| | | | | |
Total Common Stocks (Cost $69,483,953) | | | | | | | | | | | | | | | 87,737,524 | |
| | | | | | | | | | | | | | | | |
| | | Yield | | | | | | | | | | | |
| | | | | |
Short-Term Investments: 2.41% | | | | | | | | | | | | | | | | |
| | | | | |
| Investment Companies: 2.41% | | | | | | | | | | | | | | | | |
Securities Lending Cash Investments, LLC (l)(r)(u) | | | 0.12 | % | | | | | | | 404,950 | | | | 404,950 | |
Wells Fargo Advantage Cash Investment Money Market Fund, Select Class (l)(u) | | | 0.08 | | | | | | | | 1,733,742 | | | | 1,733,742 | |
| | | | | |
Total Short-Term Investments (Cost $2,138,692) | | | | | | | | | | | | | | | 2,138,692 | |
| | | | | | | | | | | | | | | | |
| | | | | | | | |
| Total investments in securities (Cost $71,622,645) * | | | 101.21 | % | | | 89,876,216 | |
Other assets and liabilities, net | | | (1.21 | ) | | | (1,073,498 | ) |
| | | | | | | | |
| Total net assets | | | 100.00 | % | | $ | 88,802,718 | |
| | | | | | | | |
The accompanying notes are an integral part of these financial statements.
| | | | |
| 64 | | Wells Fargo Advantage Allocation Funds | | Portfolio of investments—November 30, 2014 (unaudited) |
LARGE COMPANY VALUE PORTFOLIO
| † | Non-income-earning security |
| « | All or a portion of this security is on loan. |
| (l) | The security represents an affiliate of the Portfolio as defined in the Investment Company Act of 1940. |
| (r) | The investment is a non-registered investment vehicle purchased with cash collateral received from securities on loan. |
| (u) | The rate represents the 7-day annualized yield at period end. |
| * | Cost for federal income tax purposes is $72,235,908 and unrealized gains (losses) consists of: |
| | | | |
Gross unrealized gains | | $ | 19,528,368 | |
Gross unrealized losses | | | (1,888,060 | ) |
| | | | |
Net unrealized gains | | $ | 17,640,308 | |
The accompanying notes are an integral part of these financial statements.
| | | | | | |
| Portfolio of investments—November 30, 2014 (unaudited) | | Wells Fargo Advantage Allocation Funds | | | 65 | |
SMALL COMPANY GROWTH PORTFOLIO
| | | | | | | | | | | | |
| Security name | | | | | | Shares | | | Value | |
| | | | |
Common Stocks: 96.13% | | | | | | | | | | | | |
| | | | |
Consumer Discretionary: 12.96% | | | | | | | | | | | | |
| | | | |
| Auto Components: 0.66% | | | | | | | | | | | | |
Modine Manufacturing Company † | | | | | | | 253,128 | | | $ | 3,080,566 | |
| | | | | | | | | | | | |
| | | | |
| Diversified Consumer Services: 1.38% | | | | | | | | | | | | |
2U Incorporated Ǡ | | | | | | | 159,562 | | | | 2,884,881 | |
Nord Anglia Education Incorporated † | | | | | | | 216,620 | | | | 3,585,061 | |
| | | | |
| | | | | | | | | | | 6,469,942 | |
| | | | | | | | | | | | |
| | | | |
| Hotels, Restaurants & Leisure: 2.58% | | | | | | | | | | | | |
Brinker International Incorporated | | | | | | | 79,275 | | | | 4,465,561 | |
Del Frisco’s Restaurant Group Incorporated † | | | | | | | 150,506 | | | | 3,344,243 | |
Krispy Kreme Doughnuts Incorporated † | | | | | | | 208,310 | | | | 4,241,192 | |
| | | | |
| | | | | | | | | | | 12,050,996 | |
| | | | | | | | | | | | |
| | | | |
| Household Durables: 0.18% | | | | | | | | | | | | |
LGI Homes Incorporated Ǡ | | | | | | | 53,415 | | | | 853,572 | |
| | | | | | | | | | | | |
| | | | |
| Leisure Products: 0.56% | | | | | | | | | | | | |
Malibu Boats Incorporated † | | | | | | | 140,100 | | | | 2,622,672 | |
| | | | | | | | | | | | |
| | | | |
| Media: 1.89% | | | | | | | | | | | | |
IMAX Corporation † | | | | | | | 150,976 | | | | 4,737,627 | |
Lions Gate Entertainment Corporation | | | | | | | 121,409 | | | | 4,115,765 | |
| | | | |
| | | | | | | | | | | 8,853,392 | |
| | | | | | | | | | | | |
| | | | |
| Multiline Retail: 0.78% | | | | | | | | | | | | |
Burlington Stores Incorporated † | | | | | | | 81,990 | | | | 3,662,493 | |
| | | | | | | | | | | | |
| | | | |
| Specialty Retail: 2.99% | | | | | | | | | | | | |
Chico’s FAS Incorporated | | | | | | | 160,897 | | | | 2,553,435 | |
Christopher & Banks Corporation † | | | | | | | 366,393 | | | | 2,652,685 | |
Dick’s Sporting Goods Incorporated | | | | | | | 84,239 | | | | 4,263,336 | |
Monro Muffler Brake Incorporated | | | | | | | 82,763 | | | | 4,534,585 | |
| | | | |
| | | | | | | | | | | 14,004,041 | |
| | | | | | | | | | | | |
| | | | |
| Textiles, Apparel & Luxury Goods: 1.94% | | | | | | | | | | | | |
Movado Group Incorporated | | | | | | | 62,290 | | | | 1,789,592 | |
Skechers U.S.A. Incorporated Class A † | | | | | | | 71,058 | | | | 4,363,672 | |
Tumi Holdings Incorporated † | | | | | | | 134,479 | | | | 2,943,745 | |
| | | | |
| | | | | | | | | | | 9,097,009 | |
| | | | | | | | | | | | |
| | | | |
Consumer Staples: 1.50% | | | | | | | | | | | | |
| | | | |
| Food Products: 1.50% | | | | | | | | | | | | |
Darling Ingredients Incorporated † | | | | | | | 164,827 | | | | 3,065,782 | |
Whitewave Foods Company † | | | | | | | 107,916 | | | | 3,952,963 | |
| | | | |
| | | | | | | | | | | 7,018,745 | |
| | | | | | | | | | | | |
The accompanying notes are an integral part of these financial statements.
| | | | |
| 66 | | Wells Fargo Advantage Allocation Funds | | Portfolio of investments—November 30, 2014 (unaudited) |
SMALL COMPANY GROWTH PORTFOLIO
| | | | | | | | | | | | |
| Security name | | | | | | Shares | | | Value | |
| | | | |
Energy: 4.06% | | | | | | | | | | | | |
| | | | |
| Energy Equipment & Services: 1.42% | | | | | | | | | | | | |
C&J Energy Services Incorporated † | | | | | | | 130,160 | | | $ | 1,971,924 | |
Hornbeck Offshore Services Incorporated † | | | | | | | 92,340 | | | | 2,450,704 | |
Natural Gas Services Group Incoporated † | | | | | | | 95,515 | | | | 2,212,128 | |
| | | | |
| | | | | | | | | | | 6,634,756 | |
| | | | | | | | | | | | |
| | | | |
| Oil, Gas & Consumable Fuels: 2.64% | | | | | | | | | | | | |
Delek US Holdings Incorporated | | | | | | | 96,975 | | | | 2,899,553 | |
Diamondback Energy Incorporated † | | | | | | | 37,139 | | | | 2,094,640 | |
GasLog Limited « | | | | | | | 131,063 | | | | 2,311,951 | |
Oasis Petroleum Incorporated † | | | | | | | 98,311 | | | | 1,806,956 | |
Ring Energy Incorporated Ǡ | | | | | | | 147,350 | | | | 1,408,666 | |
Sanchez Energy Corporation Ǡ | | | | | | | 164,170 | | | | 1,853,479 | |
| | | | |
| | | | | | | | | | | 12,375,245 | |
| | | | | | | | | | | | |
| | | | |
Financials: 10.00% | | | | | | | | | | | | |
| | | | |
| Banks: 2.96% | | | | | | | | | | | | |
PacWest Bancorp | | | | | | | 70,629 | | | | 3,284,249 | |
ServisFirst Bancshares Incorporated | | | | | | | 70,980 | | | | 2,242,968 | |
Signature Bank † | | | | | | | 30,593 | | | | 3,710,013 | |
SVB Financial Group † | | | | | | | 43,932 | | | | 4,619,450 | |
| | | | |
| | | | | | | | | | | 13,856,680 | |
| | | | | | | | | | | | |
| | | | |
| Capital Markets: 3.95% | | | | | | | | | | | | |
Evercore Partners Incorporated Class A | | | | | | | 120,264 | | | | 6,073,332 | |
LPL Financial Holdings Incorporated | | | | | | | 106,901 | | | | 4,561,466 | |
Stifel Financial Corporation † | | | | | | | 93,428 | | | | 4,534,061 | |
Virtus Investment Partners Incorporated | | | | | | | 21,604 | | | | 3,327,016 | |
| | | | |
| | | | | | | | | | | 18,495,875 | |
| | | | | | | | | | | | |
| | | | |
| Insurance: 1.11% | | | | | | | | | | | | |
Argo Group International Holdings Limited | | | | | | | 91,920 | | | | 5,187,965 | |
| | | | | | | | | | | | |
| | | | |
| REITs: 0.85% | | | | | | | | | | | | |
QTS Realty Trust Incorporated Class A « | | | | | | | 123,255 | | | | 4,008,253 | |
| | | | | | | | | | | | |
| | | | |
| Thrifts & Mortgage Finance: 1.13% | | | | | | | | | | | | |
Essent Group Limited † | | | | | | | 209,854 | | | | 5,288,321 | |
| | | | | | | | | | | | |
| | | | |
Health Care: 25.38% | | | | | | | | | | | | |
| | | | |
| Biotechnology: 7.62% | | | | | | | | | | | | |
Alnylam Pharmaceuticals Incorporated † | | | | | | | 41,892 | | | | 4,212,241 | |
AMAG Pharmaceuticals Incorporated † | | | | | | | 73,960 | | | | 2,751,312 | |
Celldex Therapeutics Incorporated Ǡ | | | | | | | 154,590 | | | | 3,135,085 | |
Cepheid Incorporated † | | | | | | | 137,380 | | | | 7,566,890 | |
Exact Sciences Corporation † | | | | | | | 183,912 | | | | 4,564,696 | |
Intrexon Corporation Ǡ | | | | | | | 85,827 | | | | 2,276,990 | |
NPS Pharmaceuticals Incorporated † | | | | | | | 98,790 | | | | 3,277,852 | |
The accompanying notes are an integral part of these financial statements.
| | | | | | |
| Portfolio of investments—November 30, 2014 (unaudited) | | Wells Fargo Advantage Allocation Funds | | | 67 | |
SMALL COMPANY GROWTH PORTFOLIO
| | | | | | | | | | | | |
| Security name | | | | | | Shares | | | Value | |
| | | | |
| Biotechnology (continued) | | | | | | | | | | | | |
Portola Pharmaceuticals Incorporated † | | | | | | | 97,815 | | | $ | 2,750,558 | |
Tesaro Incorporated Ǡ | | | | | | | 97,421 | | | | 3,361,999 | |
Tetraphase Pharmaceuticals † | | | | | | | 67,198 | | | | 1,774,027 | |
| | | | |
| | | | | | | | | | | 35,671,650 | |
| | | | | | | | | | | | |
| | | | |
| Health Care Equipment & Supplies: 7.29% | | | | | | | | | | | | |
Accuray Incorporated Ǡ | | | | | | | 384,328 | | | | 2,648,020 | |
Analogic Corporation | | | | | | | 46,130 | | | | 3,360,109 | |
Atricure Incorporated † | | | | | | | 186,830 | | | | 3,499,326 | |
Cerus Corporation Ǡ | | | | | | | 599,269 | | | | 2,714,689 | |
DexCom Incorporated † | | | | | | | 86,876 | | | | 4,470,639 | |
Endologix Incorporated † | | | | | | | 341,722 | | | | 4,384,293 | |
Inogen Incorporated † | | | | | | | 128,430 | | | | 3,119,565 | |
Insulet Corporation † | | | | | | | 73,149 | | | | 3,408,012 | |
Nevro Corporation † | | | | | | | 48,221 | | | | 1,301,485 | |
Spectranetics Corporation † | | | | | | | 148,384 | | | | 4,871,447 | |
Veracyte Incorporated Ǡ | | | | | | | 56,380 | | | | 367,598 | |
| | | | |
| | | | | | | | | | | 34,145,183 | |
| | | | | | | | | | | | |
| | | | |
| Health Care Providers & Services: 5.90% | | | | | | | | | | | | |
Adeptus Health Incorporated Class A Ǡ | | | | | | | 123,230 | | | | 3,751,121 | |
AMN Healthcare Services Incorporated † | | | | | | | 333,469 | | | | 5,708,989 | |
Capital Senior Living Corporation † | | | | | | | 142,590 | | | | 3,628,916 | |
Ensign Group Incorporated | | | | | | | 84,645 | | | | 3,336,706 | |
HealthEquity Incorporated † | | | | | | | 246,210 | | | | 6,113,394 | |
LifePoint Hospitals Incorporated † | | | | | | | 73,716 | | | | 5,100,410 | |
| | | | |
| | | | | | | | | | | 27,639,536 | |
| | | | | | | | | | | | |
| | | | |
| Health Care Technology: 0.70% | | | | | | | | | | | | |
Imprivata Incorporated † | | | | | | | 70,190 | | | | 1,039,514 | |
Medidata Solutions Incorporated † | | | | | | | 52,122 | | | | 2,226,131 | |
| | | | |
| | | | | | | | | | | 3,265,645 | |
| | | | | | | | | | | | |
| | | | |
| Life Sciences Tools & Services: 1.28% | | | | | | | | | | | | |
ICON plc ADR † | | | | | | | 107,632 | | | | 5,977,881 | |
| | | | | | | | | | | | |
| | | | |
| Pharmaceuticals: 2.59% | | | | | | | | | | | | |
Akorn Incorporated † | | | | | | | 124,781 | | | | 4,999,975 | |
Cempra Holdings Incorporated Ǡ | | | | | | | 154,960 | | | | 2,229,874 | |
Pacira Pharmaceuticals Incorporated † | | | | | | | 32,418 | | | | 3,045,023 | |
Pernix Therapeutics Holdings Incorporated † | | | | | | | 181,650 | | | | 1,883,711 | |
| | | | |
| | | | | | | | | | | 12,158,583 | |
| | | | | | | | | | | | |
| | | | |
Industrials: 13.66% | | | | | | | | | | | | |
| | | | |
| Aerospace & Defense: 1.66% | | | | | | | | | | | | |
Astronics Corporation | | | | | | | 82,778 | | | | 4,057,778 | |
Esterline Technologies Corporation † | | | | | | | 31,301 | | | | 3,719,498 | |
| | | | |
| | | | | | | | | | | 7,777,276 | �� |
| | | | | | | | | | | | |
The accompanying notes are an integral part of these financial statements.
| | | | |
| 68 | | Wells Fargo Advantage Allocation Funds | | Portfolio of investments—November 30, 2014 (unaudited) |
SMALL COMPANY GROWTH PORTFOLIO
| | | | | | | | | | | | |
| Security name | | | | | | Shares | | | Value | |
| | | | |
| Air Freight & Logistics: 0.96% | | | | | | | | | | | | |
Hub Group Incorporated Class A † | | | | | | | 118,989 | | | $ | 4,476,366 | |
| | | | | | | | | | | | |
| | | | |
| Building Products: 2.79% | | | | | | | | | | | | |
A.O. Smith Corporation | | | | | | | 93,439 | | | | 5,039,165 | |
NCI Building Systems Incorporated † | | | | | | | 228,674 | | | | 4,267,057 | |
PGT Incorporated † | | | | | | | 399,440 | | | | 3,758,730 | |
| | | | |
| | | | | | | | | | | 13,064,952 | |
| | | | | | | | | | | | |
| | | | |
| Commercial Services & Supplies: 2.95% | | | | | | | | | | | | |
Copart Incorporated † | | | | | | | 126,200 | | | | 4,586,108 | |
Kar Auction Services Incorporated | | | | | | | 140,880 | | | | 4,881,492 | |
TrueBlue Incorporated † | | | | | | | 189,500 | | | | 4,349,025 | |
| | | | |
| | | | | | | | | | | 13,816,625 | |
| | | | | | | | | | | | |
| | | | |
| Machinery: 0.98% | | | | | | | | | | | | |
Wabash National Corporation † | | | | | | | 425,898 | | | | 4,595,439 | |
| | | | | | | | | | | | |
| | | | |
| Professional Services: 1.54% | | | | | | | | | | | | |
On Assignment Incorporated † | | | | | | | 175,604 | | | | 5,396,311 | |
RPX Corporation † | | | | | | | 137,685 | | | | 1,806,427 | |
| | | | |
| | | | | | | | | | | 7,202,738 | |
| | | | | | | | | | | | |
| | | | |
| Road & Rail: 2.28% | | | | | | | | | | | | |
Genesee & Wyoming Incorporated Class A † | | | | | | | 36,187 | | | | 3,567,676 | |
Roadrunner Transportation Systems Incorporated † | | | | | | | 126,907 | | | | 2,856,677 | |
Swift Transportation Company † | | | | | | | 146,206 | | | | 4,250,208 | |
| | | | |
| | | | | | | | | | | 10,674,561 | |
| | | | | | | | | | | | |
| | | | |
| Trading Companies & Distributors: 0.50% | | | | | | | | | | | | |
MSC Industrial Direct Company | | | | | | | 30,090 | | | | 2,337,090 | |
| | | | | | | | | | | | |
| | | | |
Information Technology: 24.22% | | | | | | | | | | | | |
| | | | |
| Communications Equipment: 2.41% | | | | | | | | | | | | |
Infinera Corporation † | | | | | | | 255,452 | | | | 3,481,811 | |
Palo Alto Networks Incorporated † | | | | | | | 38,013 | | | | 4,675,599 | |
Riverbed Technology Incorporated † | | | | | | | 151,647 | | | | 3,135,302 | |
| | | | |
| | | | | | | | | | | 11,292,712 | |
| | | | | | | | | | | | |
| | | | |
| Electronic Equipment, Instruments & Components: 1.05% | | | | | | | | | | | | |
OSI Systems Incorporated † | | | | | | | 69,616 | | | | 4,912,801 | |
| | | | | | | | | | | | |
| | | | |
| Internet Software & Services: 5.00% | | | | | | | | | | | | |
Benefitfocus Incorporated Ǡ | | | | | | | 96,160 | | | | 2,604,974 | |
Cornerstone OnDemand Incorporated Ǡ | | | | | | | 124,730 | | | | 3,962,672 | |
Everyday Health Incorporated Ǡ | | | | | | | 205,800 | | | | 2,663,052 | |
Marketo Incorporated Ǡ | | | | | | | 126,480 | | | | 4,042,301 | |
Pandora Media Incorporated † | | | | | | | 161,360 | | | | 3,172,338 | |
TrueCar Incorporated Ǡ | | | | | | | 225,860 | | | | 4,327,478 | |
Zillow Incorporated Class A † | | | | | | | 22,431 | | | | 2,654,933 | |
| | | | |
| | | | | | | | | | | 23,427,748 | |
| | | | | | | | | | | | |
The accompanying notes are an integral part of these financial statements.
| | | | | | |
| Portfolio of investments—November 30, 2014 (unaudited) | | Wells Fargo Advantage Allocation Funds | | | 69 | |
SMALL COMPANY GROWTH PORTFOLIO
| | | | | | | | | | | | |
| Security name | | | | | | Shares | | | Value | |
| | | | |
| IT Services: 3.31% | | | | | | | | | | | | |
EVERTEC Incorporated | | | | | | | 169,099 | | | $ | 3,726,942 | |
InterXion Holding NV † | | | | | | | 122,524 | | | | 3,414,744 | |
Maximus Incorporated | | | | | | | 78,110 | | | | 4,092,183 | |
Vantiv Incorporated Class A † | | | | | | | 126,080 | | | | 4,253,939 | |
| | | | |
| | | | | | | | | | | 15,487,808 | |
| | | | | | | | | | | | |
| | | | |
| Semiconductors & Semiconductor Equipment: 5.94% | | | | | | | | | | | | |
Applied Micro Circuits Corporation † | | | | | | | 369,397 | | | | 2,183,136 | |
Exar Corporation † | | | | | | | 242,611 | | | | 2,215,038 | |
Microsemi Corporation † | | | | | | | 133,838 | | | | 3,640,394 | |
Nanometrics Incorporated † | | | | | | | 169,769 | | | | 2,519,372 | |
Semtech Corporation † | | | | | | | 125,453 | | | | 3,194,033 | |
Spansion Incorporated Class A † | | | | | | | 230,065 | | | | 5,376,619 | |
Synaptics Incorporated † | | | | | | | 53,852 | | | | 3,392,137 | |
Teradyne Incorporated | | | | | | | 265,927 | | | | 5,278,651 | |
| | | | |
| | | | | | | | | | | 27,799,380 | |
| | | | | | | | | | | | |
| | | | |
| Software: 6.51% | | | | | | | | | | | | |
Bottomline Technologies Incorporated † | | | | | | | 120,610 | | | | 2,957,357 | |
Cadence Design Systems Incorporated † | | | | | | | 289,902 | | | | 5,470,451 | |
PTC Incorporated † | | | | | | | 126,776 | | | | 4,953,138 | |
Qlik Technologies Incorporated † | | | | | | | 155,053 | | | | 4,780,284 | |
SS&C Technologies Holdings | | | | | | | 137,313 | | | | 6,941,172 | |
Synchronoss Technologies Incorporated † | | | | | | | 58,060 | | | | 2,486,710 | |
Ultimate Software Group Incorporated † | | | | | | | 19,721 | | | | 2,903,720 | |
| | | | |
| | | | | | | | | | | 30,492,832 | |
| | | | | | | | | | | | |
| | | | |
Materials: 4.35% | | | | | | | | | | | | |
| | | | |
| Chemicals: 2.05% | | | | | | | | | | | | |
Calgon Carbon Corporation † | | | | | | | 198,459 | | | | 4,050,548 | |
Flotek Industries Incorporated † | | | | | | | 142,017 | | | | 2,766,491 | |
Methanex Corporation | | | | | | | 54,136 | | | | 2,796,666 | |
| | | | |
| | | | | | | | | | | 9,613,705 | |
| | | | | | | | | | | | |
| | | | |
| Metals & Mining: 1.41% | | | | | | | | | | | | |
Constellium NV Class A † | | | | | | | 184,859 | | | | 2,911,529 | |
Steel Dynamics Incorporated | | | | | | | 163,941 | | | | 3,695,230 | |
| | | | |
| | | | | | | | | | | 6,606,759 | |
| | | | | | | | | | | | |
| | | | |
| Paper & Forest Products: 0.89% | | | | | | | | | | | | |
Boise Cascade Company † | | | | | | | 116,677 | | | | 4,164,202 | |
| | | | | | | | | | | | |
| | | | |
Total Common Stocks (Cost $377,232,425) | | | | | | | | | | | 450,161,995 | |
| | | | | | | | | | | | |
The accompanying notes are an integral part of these financial statements.
| | | | |
| 70 | | Wells Fargo Advantage Allocation Funds | | Portfolio of investments—November 30, 2014 (unaudited) |
SMALL COMPANY GROWTH PORTFOLIO
| | | | | | | | | | | | | | |
| Security name | | Yield | | | | | Shares | | | Value | |
| | | | |
Short-Term Investments: 13.93% | | | | | | | | | | | | | | |
| | | | |
| Investment Companies: 13.93% | | | | | | | | | | | | | | |
Securities Lending Cash Investments, LLC (l)(r)(u) | | | 0.12 | % | | | | | 48,391,400 | | | $ | 48,391,400 | |
Wells Fargo Advantage Cash Investment Money Market Fund, Select Class (l)(u) | | | 0.08 | | | | | | 16,841,539 | | | | 16,841,539 | |
| | | | |
Total Short-Term Investments (Cost $65,232,939) | | | | | | | | | | | | | 65,232,939 | |
| | | | | | | | | | | | | | |
| | | | | | | | |
| Total investments in securities (Cost $442,465,364) * | | | 110.06 | % | | | 515,394,934 | |
Other assets and liabilities, net | | | (10.06 | ) | | | (47,111,790 | ) |
| | | | | | | | |
| Total net assets | | | 100.00 | % | | $ | 468,283,144 | |
| | | | | | | | |
| † | Non-income-earning security |
| « | All or a portion of this security is on loan. |
| (l) | The security represents an affiliate of the Portfolio as defined in the Investment Company Act of 1940. |
| (r) | The investment is a non-registered investment vehicle purchased with cash collateral received from securities on loan. |
| (u) | The rate represents the 7-day annualized yield at period end. |
| * | Cost for federal income tax purposes is $444,521,024 and unrealized gains (losses) consists of: |
| | | | |
Gross unrealized gains | | $ | 90,430,733 | |
Gross unrealized losses | | | (19,556,823 | ) |
| | | | |
Net unrealized gains | | $ | 70,873,910 | |
The accompanying notes are an integral part of these financial statements.
| | | | | | |
| Portfolio of investments—November 30, 2014 (unaudited) | | Wells Fargo Advantage Allocation Funds | | | 71 | |
SMALL COMPANY VALUE PORTFOLIO
| | | | | | | | | | | | |
| Security name | | | | | | Shares | | | Value | |
| | | | |
Common Stocks: 96.29% | | | | | | | | | | | | |
| | | | |
Consumer Discretionary: 16.30% | | | | | | | | | | | | |
| | | | |
| Auto Components: 2.35% | | | | | | | | | | | | |
American Axle & Manufacturing Holdings Incorporated † | | | | | | | 130,919 | | | $ | 2,793,811 | |
Dana Holding Corporation | | | | | | | 94,200 | | | | 1,997,040 | |
| | | | |
| | | | | | | | | | | 4,790,851 | |
| | | | | | | | | | | | |
| | | | |
| Automobiles: 0.76% | | | | | | | | | | | | |
Thor Industries Incorporated | | | | | | | 26,450 | | | | 1,554,202 | |
| | | | | | | | | | | | |
| | | | |
| Distributors: 1.29% | | | | | | | | | | | | |
Core Mark Holding Company Incorporated | | | | | | | 43,818 | | | | 2,633,900 | |
| | | | | | | | | | | | |
| | | | |
| Diversified Consumer Services: 2.11% | | | | | | | | | | | | |
Apollo Group Incorporated Class A † | | | | | | | 38,092 | | | | 1,189,232 | |
Houghton Mifflin Harcourt Company † | | | | | | | 72,176 | | | | 1,387,223 | |
Steiner Leisure Limited † | | | | | | | 39,089 | | | | 1,730,470 | |
| | | | |
| | | | | | | | | | | 4,306,925 | |
| | | | | | | | | | | | |
| | | | |
| Hotels, Restaurants & Leisure: 1.11% | | | | | | | | | | | | |
ClubCorp Holdings Incorporated | | | | | | | 114,994 | | | | 2,266,532 | |
| | | | | | | | | | | | |
| | | | |
| Household Durables: 0.59% | | | | | | | | | | | | |
The Ryland Group Incorporated | | | | | | | 30,688 | | | | 1,200,821 | |
| | | | | | | | | | | | |
| | | | |
| Media: 1.14% | | | | | | | | | | | | |
Scholastic Corporation | | | | | | | 65,393 | | | | 2,321,452 | |
| | | | | | | | | | | | |
| | | | |
| Specialty Retail: 3.64% | | | | | | | | | | | | |
Asbury Automotive Group Incorporated † | | | | | | | 24,709 | | | | 1,870,718 | |
DSW Incorporated Class A | | | | | | | 82,288 | | | | 2,919,578 | |
Francescas Holdings Corporation † | | | | | | | 100,030 | | | | 1,268,380 | |
Rent-A-Center Incorporated | | | | | | | 39,399 | | | | 1,359,266 | |
| | | | |
| | | | | | | | | | | 7,417,942 | |
| | | | | | | | | | | | |
| | | | |
| Textiles, Apparel & Luxury Goods: 3.31% | | | | | | | | | | | | |
G-III Apparel Group Limited † | | | | | | | 26,169 | | | | 2,315,695 | |
Oxford Industries Incorporated | | | | | | | 31,997 | | | | 2,119,161 | |
Vera Bradley Incorporated †« | | | | | | | 100,354 | | | | 2,307,138 | |
| | | | |
| | | | | | | | | | | 6,741,994 | |
| | | | | | | | | | | | |
| | | | |
Consumer Staples: 0.79% | | | | | | | | | | | | |
| | | | |
| Food Products: 0.79% | | | | | | | | | | | | |
Post Holdings Incorporated † | | | | | | | 40,077 | | | | 1,603,080 | |
| | | | | | | | | | | | |
| | | | |
Energy: 2.96% | | | | | | | | | | | | |
| | | | |
| Oil, Gas & Consumable Fuels: 2.96% | | | | | | | | | | | | |
Carrizo Oil & Gas Incorporated † | | | | | | | 38,500 | | | | 1,519,210 | |
Laredo Petroleum Holdings Incorporated †« | | | | | | | 94,761 | | | | 990,252 | |
The accompanying notes are an integral part of these financial statements.
| | | | |
| 72 | | Wells Fargo Advantage Allocation Funds | | Portfolio of investments—November 30, 2014 (unaudited) |
SMALL COMPANY VALUE PORTFOLIO
| | | | | | | | | | | | |
| Security name | | | | | | Shares | | | Value | |
| | | | |
| Oil, Gas & Consumable Fuels (continued) | | | | | | | | | | | | |
PDC Energy Incorporated † | | | | | | | 40,100 | | | $ | 1,183,351 | |
Rex Energy Corporation †« | | | | | | | 164,810 | | | | 1,156,966 | |
Sanchez Energy Corporation †« | | | | | | | 105,041 | | | | 1,185,913 | |
| | | | |
| | | | | | | | | | | 6,035,692 | |
| | | | | | | | | | | | |
| | | | |
Financials: 39.15% | | | | | | | | | | | | |
| | | | |
| Banks: 17.73% | | | | | | | | | | | | |
BancorpSouth Incorporated | | | | | | | 124,092 | | | | 2,716,374 | |
BankUnited Incorporated | | | | | | | 63,450 | | | | 1,916,190 | |
City National Corporation | | | | | | | 30,254 | | | | 2,335,306 | |
Columbia Banking System Incorporated | | | | | | | 55,735 | | | | 1,531,040 | |
Great Western Bancorp Incorporated † | | | | | | | 97,140 | | | | 2,172,050 | |
IBERIABANK Corporation | | | | | | | 39,117 | | | | 2,555,122 | |
Independent Bank Group Incorporated | | | | | | | 46,923 | | | | 2,012,997 | |
Investors Bancorp Incorporated | | | | | | | 219,394 | | | | 2,371,649 | |
MB Financial Incorporated | | | | | | | 57,448 | | | | 1,809,612 | |
National Bank Holdings Corporation Class A | | | | | | | 111,725 | | | | 2,148,472 | |
Old National Bancorp | | | | | | | 123,274 | | | | 1,750,491 | |
PrivateBancorp Incorporated | | | | | | | 94,397 | | | | 2,968,786 | |
Square 1 Financial Incorporated † | | | | | | | 22,840 | | | | 488,319 | |
ViewPoint Financial Group Incorporated | | | | | | | 76,636 | | | | 1,827,002 | |
Webster Financial Corporation | | | | | | | 67,837 | | | | 2,134,830 | |
Western Alliance Bancorp † | | | | | | | 129,978 | | | | 3,435,319 | |
Wintrust Financial Corporation | | | | | | | 44,177 | | | | 1,974,270 | |
| | | | |
| | | | | | | | | | | 36,147,829 | |
| | | | | | | | | | | | |
| | | | |
| Capital Markets: 1.05% | | | | | | | | | | | | |
Stifel Financial Corporation † | | | | | | | 43,993 | | | | 2,134,980 | |
| | | | | | | | | | | | |
| | | | |
| Insurance: 7.81% | | | | | | | | | | | | |
American Equity Investment Life Holding Company | | | | | | | 74,008 | | | | 1,998,216 | |
AmTrust Financial Services Incorporated | | | | | | | 39,156 | | | | 2,009,486 | |
CNO Financial Group Incorporated | | | | | | | 120,410 | | | | 2,087,909 | |
Employers Holdings Incorporated | | | | | | | 93,624 | | | | 1,898,695 | |
OneBeacon Insurance Group Limited | | | | | | | 99,656 | | | | 1,586,524 | |
Primerica Incorporated | | | | | | | 48,663 | | | | 2,551,401 | |
Selective Insurance Group Incorporated | | | | | | | 73,926 | | | | 1,978,999 | |
Symetra Financial Corporation | | | | | | | 79,964 | | | | 1,811,984 | |
| | | | |
| | | | | | | | | | | 15,923,214 | |
| | | | | | | | | | | | |
| | | | |
| Real Estate Management & Development: 0.78% | | | | | | | | | | | | |
Alexander & Baldwin Incorporated | | | | | | | 41,981 | | | | 1,598,636 | |
| | | | | | | | | | | | |
| | | | |
| REITs: 11.78% | | | | | | | | | | | | |
CareTrust REIT Incorporated † | | | | | | | 100,624 | | | | 1,627,090 | |
Cousins Properties Incorporated | | | | | | | 174,260 | | | | 2,132,942 | |
Education Realty Trust Incorporated | | | | | | | 245,042 | | | | 2,852,289 | |
Gramercy Property Trust Incorporated « | | | | | | | 308,200 | | | | 1,818,380 | |
Parkway Properties Incorporated | | | | | | | 103,997 | | | | 2,025,862 | |
The accompanying notes are an integral part of these financial statements.
| | | | | | |
| Portfolio of investments—November 30, 2014 (unaudited) | | Wells Fargo Advantage Allocation Funds | | | 73 | |
SMALL COMPANY VALUE PORTFOLIO
| | | | | | | | | | | | |
| Security name | | | | | | Shares | | | Value | |
| | | | |
| REITs (continued) | | | | | | | | | | | | |
Pebblebrook Hotel Trust | | | | | | | 61,092 | | | $ | 2,637,342 | |
Physicians Realty Trust | | | | | | | 134,300 | | | | 2,076,278 | |
Ramco-Gershenson Properties Trust | | | | | | | 117,121 | | | | 2,096,466 | |
Sabra Health Care REIT Incorporated | | | | | | | 82,541 | | | | 2,336,736 | |
STAG Industrial Incorporated | | | | | | | 90,459 | | | | 2,156,543 | |
Sunstone Hotel Investors Incorporated | | | | | | | 140,367 | | | | 2,247,276 | |
| | | | |
| | | | | | | | | | | 24,007,204 | |
| | | | | | | | | | | | |
| | | | |
Health Care: 5.62% | | | | | | | | | | | | |
| | | | |
| Health Care Equipment & Supplies: 1.34% | | | | | | | | | | | | |
Alere Incorporated † | | | | | | | 68,497 | | | | 2,732,345 | |
| | | | | | | | | | | | |
| | | | |
| Health Care Providers & Services: 4.28% | | | | | | | | | | | | |
Ensign Group Incorporated | | | | | | | 61,144 | | | | 2,410,296 | |
Health Net Incorporated † | | | | | | | 64,163 | | | | 3,296,695 | |
WellCare Health Plans Incorporated † | | | | | | | 41,013 | | | | 3,024,299 | |
| | | | |
| | | | | | | | | | | 8,731,290 | |
| | | | | | | | | | | | |
| | | | |
Industrials: 9.77% | | | | | | | | | | | | |
| | | | |
| Air Freight & Logistics: 1.09% | | | | | | | | | | | | |
Atlas Air Worldwide Holdings Incorporated † | | | | | | | 48,655 | | | | 2,221,101 | |
| | | | | | | | | | | | |
| | | | |
| Commercial Services & Supplies: 3.04% | | | | | | | | | | | | |
ACCO Brands Corporation † | | | | | | | 255,684 | | | | 2,239,792 | |
Quad Graphics Incorporated | | | | | | | 89,777 | | | | 1,949,059 | |
United Stationers Incorporated | | | | | | | 49,119 | | | | 2,016,826 | |
| | | | |
| | | | | | | | | | | 6,205,677 | |
| | | | | | | | | | | | |
| | | | |
| Construction & Engineering: 0.97% | | | | | | | | | | | | |
Tutor Perini Corporation † | | | | | | | 78,095 | | | | 1,971,899 | |
| | | | | | | | | | | | |
| | | | |
| Machinery: 0.97% | | | | | | | | | | | | |
Briggs & Stratton Corporation | | | | | | | 67,031 | | | | 1,343,972 | |
Global Brass & Copper Holdings Incorporated | | | | | | | 51,986 | | | | 636,829 | |
| | | | |
| | | | | | | | | | | 1,980,801 | |
| | | | | | | | | | | | |
| | | | |
| Professional Services: 1.65% | | | | | | | | | | | | |
FTI Consulting Incorporated † | | | | | | | 66,881 | | | | 2,592,976 | |
Hill International Incorporated † | | | | | | | 211,016 | | | | 770,208 | |
| | | | |
| | | | | | | | | | | 3,363,184 | |
| | | | | | | | | | | | |
| | | | |
| Road & Rail: 1.36% | | | | | | | | | | | | |
Quality Distribution Incorporated † | | | | | | | 133,277 | | | | 1,608,653 | |
Universal Truckload Services | | | | | | | 42,306 | | | | 1,161,723 | |
| | | | |
| | | | | | | | | | | 2,770,376 | |
| | | | | | | | | | | | |
| | | | |
| Trading Companies & Distributors: 0.69% | | | | | | | | | | | | |
TAL International Group Incorporated « | | | | | | | 31,909 | | | | 1,410,059 | |
| | | | | | | | | | | | |
The accompanying notes are an integral part of these financial statements.
| | | | |
| 74 | | Wells Fargo Advantage Allocation Funds | | Portfolio of investments—November 30, 2014 (unaudited) |
SMALL COMPANY VALUE PORTFOLIO
| | | | | | | | | | | | |
| Security name | | | | | | Shares | | | Value | |
| | | | |
Information Technology: 11.91% | | | | | | | | | | | | |
| | | | |
| Communications Equipment: 2.05% | | | | | | | | | | | | |
ARRIS Group Incorporated † | | | | | | | 95,933 | | | $ | 2,855,925 | |
Extreme Networks Incorporated † | | | | | | | 367,680 | | | | 1,331,002 | |
| | | | |
| | | | | | | | | | | 4,186,927 | |
| | | | | | | | | | | | |
| | | | |
| Electronic Equipment, Instruments & Components: 5.04% | | | | | | | | | | | | |
Celestica Incorporated † | | | | | | | 184,936 | | | | 1,989,911 | |
Itron Incorporated † | | | | | | | 46,834 | | | | 1,892,094 | |
Plexus Corporation † | | | | | | | 52,721 | | | | 2,056,646 | |
Sanmina Corporation † | | | | | | | 95,180 | | | | 2,341,428 | |
Tech Data Corporation † | | | | | | | 31,958 | | | | 1,991,942 | |
| | | | |
| | | | | | | | | | | 10,272,021 | |
| | | | | | | | | | | | |
| | | | |
| Semiconductors & Semiconductor Equipment: 2.14% | | | | | | | | | | | | |
Advanced Energy Industries Incorporated † | | | | | | | 114,315 | | | | 2,335,455 | |
Photronics Incorporated † | | | | | | | 113,925 | | | | 1,027,604 | |
Xcerra Corporation † | | | | | | | 124,511 | | | | 997,333 | |
| | | | |
| | | | | | | | | | | 4,360,392 | |
| | | | | | | | | | | | |
| | | | |
| Software: 1.53% | | | | | | | | | | | | |
EPIQ Systems Incorporated | | | | | | | 97,481 | | | | 1,495,359 | |
Mentor Graphics Corporation | | | | | | | 73,693 | | | | 1,636,722 | |
| | | | |
| | | | | | | | | | | 3,132,081 | |
| | | | | | | | | | | | |
| | | | |
| Technology Hardware, Storage & Peripherals: 1.15% | | | | | | | | | | | | |
QLogic Corporation † | | | | | | | 202,559 | | | | 2,337,531 | |
| | | | | | | | | | | | |
| | | | |
Materials: 4.42% | | | | | | | | | | | | |
| | | | |
| Chemicals: 1.37% | | | | | | | | | | | | |
Chemtura Corporation † | | | | | | | 85,113 | | | | 1,983,133 | |
Zep Incorporated | | | | | | | 59,452 | | | | 809,142 | |
| | | | |
| | | | | | | | | | | 2,792,275 | |
| | | | | | | | | | | | |
| | | | |
| Metals & Mining: 3.05% | | | | | | | | | | | | |
Commercial Metals Company | | | | | | | 110,219 | | | | 1,800,978 | |
Horsehead Holding Corporation † | | | | | | | 153,518 | | | | 2,397,951 | |
Suncoke Energy Incorporated | | | | | | | 99,083 | | | | 2,014,357 | |
| | | | |
| | | | | | | | | | | 6,213,286 | |
| | | | | | | | | | | | |
| | | | |
Telecommunication Services: 0.50% | | | | | | | | | | | | |
| | | | |
| Diversified Telecommunication Services: 0.50% | | | | | | | | | | | | |
ORBCOMM Incorporated † | | | | | | | 157,260 | | | | 1,019,045 | |
| | | | | | | | | | | | |
| | | | |
Utilities: 4.87% | | | | | | | | | | | | |
| | | | |
| Electric Utilities: 4.87% | | | | | | | | | | | | |
El Paso Electric Company | | | | | | | 60,431 | | | | 2,286,104 | |
PNM Resources Incorporated | | | | | | | 82,597 | | | | 2,392,009 | |
The accompanying notes are an integral part of these financial statements.
| | | | | | |
| Portfolio of investments—November 30, 2014 (unaudited) | | Wells Fargo Advantage Allocation Funds | | | 75 | |
SMALL COMPANY VALUE PORTFOLIO
| | | | | | | | | | | | | | | | |
| Security name | | | | | | | | Shares | | | Value | |
| | | | |
| Electric Utilities (continued) | | | | | | | | | | | | | | | | |
Portland General Electric Company | | | | | | | | | | | 73,294 | | | $ | 2,702,350 | |
UIL Holdings Corporation | | | | | | | | | | | 64,000 | | | | 2,547,202 | |
| | | | |
| | | | | | | | | | | | | | | 9,927,665 | |
| | | | | | | | | | | | | | | | |
| | | | |
Total Common Stocks (Cost $153,876,536) | | | | | | | | | | | | | | | 196,313,209 | |
| | | | | | | | | | | | | | | | |
| | | | |
| | | | | | Expiration date | | | | | | | |
| | | | |
Warrants: 0.00% | | | | | | | | | | | | | | | | |
| | | | |
Health Care: 0.00% | | | | | | | | | | | | | | | | |
| | | | |
| Health Care Equipment & Supplies: 0.00% | | | | | | | | | | | | | | | | |
EnteroMedics Incorporated †(a) | | | | | | | 5-14-2016 | | | | 9,104 | | | | 6,201 | |
| | | | | | | | | | | | | | | | |
| | | | |
Total Warrants (Cost $0) | | | | | | | | | | | | | | | 6,201 | |
| | | | | | | | | | | | | | | | |
| | | | |
| | | Yield | | | | | | | | | | |
| Short-Term Investments: 6.76% | | | | | | | | | | | | | | | | |
| | | | |
| Investment Companies: 6.76% | | | | | | | | | | | | | | | | |
Securities Lending Cash Investments, LLC (u)(l)(r) | | | 0.12 | % | | | | | | | 6,184,225 | | | | 6,184,225 | |
Wells Fargo Advantage Cash Investment Money Market Fund, Select Class (u)(l) | | | 0.08 | | | | | | | | 7,594,762 | | | | 7,594,762 | |
| | | | |
Total Short-Term Investments (Cost $13,778,987) | | | | | | | | | | | | | | | 13,778,987 | |
| | | | | | | | | | | | | | | | |
| | | | | | | | |
| Total investments in securities (Cost $167,655,523) * | | | 103.05 | % | | | 210,098,397 | |
Other assets and liabilities, net | | | (3.05 | ) | | | (6,213,944 | ) |
| | | | | | | | |
| Total net assets | | | 100.00 | % | | $ | 203,884,453 | |
| | | | | | | | |
| † | Non-income-earning security |
| « | All or a portion of this security is on loan. |
| (a) | The security is fair valued in accordance with procedures approved by the Board of Trustees. |
| (u) | The rate represents the 7-day annualized yield at period end. |
| (l) | The security represents an affiliate of the Portfolio as defined in the Investment Company Act of 1940. |
| (r) | The investment is a non-registered investment vehicle purchased with cash collateral received from securities on loan. |
| * | Cost for federal income tax purposes is $168,006,920 and unrealized gains (losses) consists of: |
| | | | |
Gross unrealized gains | | $ | 48,781,875 | |
Gross unrealized losses | | | (6,690,398 | ) |
| | | | |
Net unrealized gains | | $ | 42,091,477 | |
The accompanying notes are an integral part of these financial statements.
| | | | |
| 76 | | Wells Fargo Advantage Allocation Funds | | Summary portfolio of investments—November 30, 2014 (unaudited) |
CORE BOND PORTFOLIO
The Summary Portfolio of Investments shows the 50 largest portfolio holdings in unaffiliated issuers and any holdings exceeding 1% of the total net assets as of the report date. The remaining securities held are grouped as “Other securities” in each category. You can request a complete schedule of portfolio holdings as of the report date, free of charge, by accessing the following website:
http://a584.g.akamai.net/f/584/1326/1d/www.wellsfargoadvantagefunds.com/pdf/semi/holdings/corebond.pdf or by calling Wells Fargo Advantage Funds at 1-800-222-8222. This complete schedule, filed on Form N-CSRS, is also available on the SEC’s website at sec.gov.
| | | | | | | | | | | | | | | | | | | | |
| Security name | | Interest rate | | | Maturity date | | | Principal | | | Value | | | Percent of
net assets | |
| | | | | |
Agency Securities: 29.23% | | | | | | | | | | | | | | | | | | | | |
FHLMC | | | 0.85-7.50 | % | | | 8-1-2017 to 1-15-2045 | | | $ | 176,335,247 | | | $ | 185,188,504 | | | | 6.21 | % |
FHLMC | | | 4.00 | | | | 11-15-2039 | | | | 9,514,843 | | | | 10,261,882 | | | | 0.34 | |
FHLMC | | | 5.00 | | | | 8-1-2039 | | | | 15,552,178 | | | | 17,550,342 | | | | 0.59 | |
FNMA | | | 0.00-7.50 | | | | 9-1-2016 to 12-11-2044 | | | | 249,631,627 | | | | 265,832,530 | | | | 8.89 | |
FNMA | | | 2.50 | | | | 11-1-2027 | | | | 14,796,323 | | | | 15,143,122 | | | | 0.51 | |
FNMA ± | | | 2.82 | | | | 11-1-2044 | | | | 10,766,329 | | | | 11,168,639 | | | | 0.37 | |
FNMA | | | 3.00 | | | | 10-25-2042 | | | | 17,211,045 | | | | 17,442,327 | | | | 0.58 | |
FNMA ± | | | 3.23 | | | | 4-1-2044 | | | | 14,871,672 | | | | 15,580,571 | | | | 0.52 | |
FNMA %% | | | 3.50 | | | | 1-14-2045 | | | | 20,700,000 | | | | 21,510,210 | | | | 0.72 | |
FNMA | | | 4.00 | | | | 3-1-2032 | | | | 18,152,985 | | | | 19,574,150 | | | | 0.65 | |
FNMA %% | | | 4.00 | | | | 1-14-2045 | | | | 33,400,000 | | | | 35,547,514 | | | | 1.19 | |
FNMA %% | | | 4.50 | | | | 1-14-2045 | | | | 37,100,000 | | | | 40,218,719 | | | | 1.35 | |
FNMA | | | 5.00 | | | | 7-1-2041 | | | | 10,584,486 | | | | 11,894,460 | | | | 0.40 | |
FNMA Series 2012-130 Class DC | | | 3.00 | | | | 12-25-2042 | | | | 18,092,447 | | | | 18,335,573 | | | | 0.61 | |
GNMA | | | 3.50-8.05 | | | | 7-15-2019 to 12-18-2044 | | | | 3,287,698 | | | | 3,455,883 | | | | 0.11 | |
GNMA %% | | | 3.00 | | | | 1-21-2045 | | | | 34,900,000 | | | | 35,639,581 | | | | 1.19 | |
GNMA %% | | | 3.50 | | | | 1-21-2045 | | | | 67,400,000 | | | | 70,587,020 | | | | 2.36 | |
GNMA %% | | | 4.00 | | | | 12-18-2044 | | | | 20,500,000 | | | | 21,987,851 | | | | 0.74 | |
GNMA %% | | | 4.00 | | | | 1-21-2045 | | | | 44,600,000 | | | | 47,704,571 | | | | 1.60 | |
Other securities | | | | | | | | | | | | | | | 9,051,151 | | | | 0.30 | |
| | | | | | | | | | | | | | | | | | | | |
| | | | | |
Total Agency Securities (Cost $864,562,687) | | | | | | | | | | | | | | | 873,674,600 | | | | 29.23 | |
| | | | | | | | | | | | | | | | | | | | |
| | | | | |
Asset-Backed Securities: 15.30% | | | | | | | | | | | | | | | | | | | | |
Ally Auto Receivables Trust | | | 0.63-2.23 | | | | 2-16-2016 to 1-15-2020 | | | | 13,585,541 | | | | 13,615,857 | | | | 0.45 | |
Ally Auto Receivables Trust Series 2014-1 Class A4 | | | 1.53 | | | | 4-15-2019 | | | | 17,815,000 | | | | 17,875,446 | | | | 0.60 | |
Capital Auto Receivables Asset Trust | | | 0.46-1.83 | | | | 6-20-2016 to 3-16-2020 | | | | 53,424,000 | | | | 53,681,611 | | | | 1.80 | |
Chase Issuance Trust | | | 0.52-1.58 | | | | 7-15-2020 to 8-16-2021 | | | | 20,081,000 | | | | 20,050,526 | | | | 0.67 | |
Chase Issuance Trust Series 2013-A9 Class A ± | | | 0.57 | | | | 11-16-2020 | | | | 13,959,000 | | | | 13,986,778 | | | | 0.47 | |
Citibank Credit Card Issuance Trust Series 2013-A7 Class A7 ± | | | 0.59 | | | | 9-10-2020 | | | | 14,099,000 | | | | 14,126,846 | | | | 0.47 | |
Citibank Credit Card Issuance Trust Series 2014-A3 Class A3 ± | | | 0.36 | | | | 5-9-2018 | | | | 15,918,000 | | | | 15,918,000 | | | | 0.53 | |
Citibank Credit Card Issuance Trust Series 2014-A6 Class A6 | | | 2.15 | | | | 7-15-2021 | | | | 32,537,000 | | | | 32,764,173 | | | | 1.10 | |
Ford Credit Auto Owner Trust Series 2014-1 Class A 144A | | | 2.26 | | | | 11-15-2025 | | | | 9,567,000 | | | | 9,664,689 | | | | 0.32 | |
SLM Student Loan Trust | | | 0.33-2.95 | | | | 1-25-2018 to 2-15-2046 | | | | 81,650,356 | | | | 81,304,077 | | | | 2.75 | |
Toyota Auto Receivables Owner Trust Series 2014-B Class A2 | | | 0.40 | | | | 12-15-2016 | | | | 9,637,000 | | | | 9,632,422 | | | | 0.32 | |
Other securities | | | | | | | | | | | | | | | 174,866,428 | | | | 5.82 | |
| | | | | | | | | | | | | | | | | | | | |
| | | | |
Total Asset-Backed Securities (Cost $456,083,939) | | | | | | | | | | | | 457,486,853 | | | | 15.30 | |
| | | | | | | | | | | | | | | | | | | | |
The accompanying notes are an integral part of these financial statements.
| | | | | | |
| Summary portfolio of investments—November 30, 2014 (unaudited) | | Wells Fargo Advantage Allocation Funds | | | 77 | |
CORE BOND PORTFOLIO
| | | | | | | | | | | | | | | | | | | | |
| Security name | | Interest rate | | | Maturity date | | | Principal | | | Value | | | Percent of
net assets | |
| | | | | |
Corporate Bonds and Notes: 18.91% | | | | | | | | | | | | | | | | | | | | |
| | | | | |
Consumer Discretionary: 1.47% | | | | | | | | | | | | | | | | | | | | |
| | | | | |
| Auto Components: 0.06% | | | | | | | | | | | | | | | | | | | | |
Other securities | | | | | | | | | | | | | | $ | 1,866,917 | | | | 0.06 | % |
| | | | | | | | | | | | | | | | | | | | |
| | | | | |
| Automobiles: 0.46% | | | | | | | | | | | | | | | | | | | | |
Other securities | | | | | | | | | | | | | | | 13,740,624 | | | | 0.46 | |
| | | | | | | | | | | | | | | | | | | | |
| | | | | |
| Hotels, Restaurants & Leisure: 0.08% | | | | | | | | | | | | | | | | | | | | |
Other securities | | | | | | | | | | | | | | | 2,213,359 | | | | 0.08 | |
| | | | | | | | | | | | | | | | | | | | |
| | | | | |
| Media: 0.69% | | | | | | | | | | | | | | | | | | | | |
Other securities | | | | | | | | | | | | | | | 20,431,905 | | | | 0.69 | |
| | | | | | | | | | | | | | | | | | | | |
| | | | | |
| Multiline Retail: 0.12% | | | | | | | | | | | | | | | | | | | | |
Other securities | | | | | | | | | | | | | | | 3,663,449 | | | | 0.12 | |
| | | | | | | | | | | | | | | | | | | | |
| | | | | |
| Specialty Retail: 0.06% | | | | | | | | | | | | | | | | | | | | |
Other securities | | | | | | | | | | | | | | | 1,872,573 | | | | 0.06 | |
| | | | | | | | | | | | | | | | | | | | |
| | | | | |
Consumer Staples: 1.15% | | | | | | | | | | | | | | | | | | | | |
| | | | | |
| Beverages: 0.32% | | | | | | | | | | | | | | | | | | | | |
Other securities | | | | | | | | | | | | | | | 9,711,190 | | | | 0.32 | |
| | | | | | | | | | | | | | | | | | | | |
| | | | | |
| Food Products: 0.54% | | | | | | | | | | | | | | | | | | | | |
Other securities | | | | | | | | | | | | | | | 16,091,974 | | | | 0.54 | |
| | | | | | | | | | | | | | | | | | | | |
| | | | | |
| Tobacco: 0.29% | | | | | | | | | | | | | | | | | | | | |
Other securities | | | | | | | | | | | | | | | 8,644,910 | | | | 0.29 | |
| | | | | | | | | | | | | | | | | | | | |
| | | | | |
Energy: 2.21% | | | | | | | | | | | | | | | | | | | | |
| | | | | |
| Energy Equipment & Services: 0.02% | | | | | | | | | | | | | | | | | | | | |
Other securities | | | | | | | | | | | | | | | 759,848 | | | | 0.02 | |
| | | | | | | | | | | | | | | | | | | | |
| | | | | |
| Oil, Gas & Consumable Fuels: 2.19% | | | | | | | | | | | | | | | | | | | | |
Other securities | | | | | | | | | | | | | | | 65,416,863 | | | | 2.19 | |
| | | | | | | | | | | | | | | | | | | | |
| | | | | |
Financials: 7.34% | | | | | | | | | | | | | | | | | | | | |
| | | | | |
| Banks: 2.87% | | | | | | | | | | | | | | | | | | | | |
Bank of America Corporation | | | 1.50 | % | | | 10-9-2015 | | | $ | 11,242,000 | | | | 11,309,171 | | | | 0.38 | |
Other securities | | | | | | | | | | | | | | | 74,333,179 | | | | 2.49 | |
| | | | | |
| | | | | | | | | | | | | | | 85,642,350 | | | | 2.87 | |
| | | | | | | | | | | | | | | | | | | | |
| | | | | |
| Capital Markets: 1.23% | | | | | | | | | | | | | | | | | | | | |
Other securities | | | | | | | | | | | | | | | 36,754,181 | | | | 1.23 | |
| | | | | | | | | | | | | | | | | | | | |
| | | | | |
| Consumer Finance: 1.03% | | | | | | | | | | | | | | | | | | | | |
Other securities | | | | | | | | | | | | | | | 30,924,184 | | | | 1.03 | |
| | | | | | | | | | | | | | | | | | | | |
The accompanying notes are an integral part of these financial statements.
| | | | |
| 78 | | Wells Fargo Advantage Allocation Funds | | Summary portfolio of investments—November 30, 2014 (unaudited) |
CORE BOND PORTFOLIO
| | | | | | | | | | | | | | |
| Security name | | | | | | | | Value | | | Percent of
net assets | |
| | | | | |
| Diversified Financial Services: 0.19% | | | | | | | | | | | | | | |
Other securities | | | | | | | | $ | 5,732,694 | | | | 0.19 | % |
| | | | | | | | | | | | | | |
| | | | | |
| Insurance: 0.92% | | | | | | | | | | | | | | |
Other securities | | | | | | | | | 27,633,687 | | | | 0.92 | |
| | | | | | | | | | | | | | |
| | | | | |
| REITs: 1.10% | | | | | | | | | | | | | | |
Other securities | | | | | | | | | 32,844,870 | | | | 1.10 | |
| | | | | | | | | | | | | | |
| | | | | |
Health Care: 1.54% | | | | | | | | | | | | | | |
| | | | | |
| Biotechnology: 0.58% | | | | | | | | | | | | | | |
Other securities | | | | | | | | | 17,252,876 | | | | 0.58 | |
| | | | | | | | | | | | | | |
| | | | | |
| Health Care Providers & Services: 0.32% | | | | | | | | | | | | | | |
Other securities | | | | | | | | | 9,584,490 | | | | 0.32 | |
| | | | | | | | | | | | | | |
| | | | | |
| Life Sciences Tools & Services: 0.25% | | | | | | | | | | | | | | |
Other securities | | | | | | | | | 7,547,238 | | | | 0.25 | |
| | | | | | | | | | | | | | |
| | | | | |
| Pharmaceuticals: 0.39% | | | | | | | | | | | | | | |
Other securities | | | | | | | | | 11,642,987 | | | | 0.39 | |
| | | | | | | | | | | | | | |
| | | | | |
Industrials: 0.72% | | | | | | | | | | | | | | |
| | | | | |
| Aerospace & Defense: 0.27% | | | | | | | | | | | | | | |
Other securities | | | | | | | | | 7,933,394 | | | | 0.27 | |
| | | | | | | | | | | | | | |
| | | | | |
| Machinery: 0.06% | | | | | | | | | | | | | | |
Other securities | | | | | | | | | 1,725,506 | | | | 0.06 | |
| | | | | | | | | | | | | | |
| | | | | |
| Road & Rail: 0.39% | | | | | | | | | | | | | | |
Other securities | | | | | | | | | 11,705,600 | | | | 0.39 | |
| | | | | | | | | | | | | | |
| | | | | |
Information Technology: 1.10% | | | | | | | | | | | | | | |
| | | | | |
| Electronic Equipment, Instruments & Components: 0.15% | | | | | | | | | | | | | | |
Other securities | | | | | | | | | 4,355,384 | | | | 0.15 | |
| | | | | | | | | | | | | | |
| | | | | |
| IT Services: 0.13% | | | | | | | | | | | | | | |
Other securities | | | | | | | | | 3,748,573 | | | | 0.13 | |
| | | | | | | | | | | | | | |
| | | | | |
| Semiconductors & Semiconductor Equipment: 0.02% | | | | | | | | | | | | | | |
Other securities | | | | | | | | | 725,092 | | | | 0.02 | |
| | | | | | | | | | | | | | |
| | | | | |
| Software: 0.32% | | | | | | | | | | | | | | |
Other securities | | | | | | | | | 9,646,263 | | | | 0.32 | |
| | | | | | | | | | | | | | |
| | | | | |
| Technology Hardware, Storage & Peripherals: 0.48% | | | | | | | | | | | | | | |
Other securities | | | | | | | | | 14,508,523 | | | | 0.48 | |
| | | | | | | | | | | | | | |
| | | | | |
Materials: 0.50% | | | | | | | | | | | | | | |
| | | | | |
| Chemicals: 0.33% | | | | | | | | | | | | | | |
Other securities | | | | | | | | | 9,930,161 | | | | 0.33 | |
| | | | | | | | | | | | | | |
The accompanying notes are an integral part of these financial statements.
| | | | | | |
| Summary portfolio of investments—November 30, 2014 (unaudited) | | Wells Fargo Advantage Allocation Funds | | | 79 | |
CORE BOND PORTFOLIO
| | | | | | | | | | | | | | | | | | | | |
| Security name | | Interest rate | | | Maturity date | | | Principal | | | Value | | | Percent of
net assets | |
| | | | | |
| Metals & Mining: 0.17% | | | | | | | | | | | | | | | | | | | | |
Other securities | | | | | | | | | | | | | | $ | 5,031,707 | | | | 0.17 | % |
| | | | | | | | | | | | | | | | | | | | |
| | | | | |
Telecommunication Services: 1.31% | | | | | | | | | | | | | | | | | | | | |
| | | | | |
| Diversified Telecommunication Services: 1.31% | | | | | | | | | | | | | | | | | | | | |
Verizon Communications Incorporated | | | 1.35-5.15 | % | | | 6-9-2017 to 11-1-2034 | | | $ | 32,724,000 | | | | 33,597,214 | | | | 1.13 | |
Other securities | | | | | | | | | | | | | | | 5,503,246 | | | | 0.18 | |
| | | | | |
| | | | | | | | | | | | | | | 39,100,460 | | | | 1.31 | |
| | | | | | | | | | | | | | | | | | | | |
| | | | | |
Utilities: 1.57% | | | | | | | | | | | | | | | | | | | | |
| | | | | |
| Electric Utilities: 0.89% | | | | | | | | | | | | | | | | | | | | |
Other securities | | | | | | | | | | | | | | | 26,556,052 | | | | 0.89 | |
| | | | | | | | | | | | | | | | | | | | |
| | | | | |
| Gas Utilities: 0.09% | | | | | | | | | | | | | | | | | | | | |
Other securities | | | | | | | | | | | | | | | 2,608,803 | | | | 0.09 | |
| | | | | | | | | | | | | | | | | | | | |
| | | | | |
| Multi-Utilities: 0.59% | | | | | | | | | | | | | | | | | | | | |
Other securities | | | | | | | | | | | | | | | 17,718,580 | | | | 0.59 | |
| | | | | | | | | | | | | | | | | | | | |
| | | | |
Total Corporate Bonds and Notes (Cost $550,940,409) | | | | | | | | | | | | 565,267,267 | | | | 18.91 | |
| | | | | | | | | | | | | | | | | | | | |
| | | | | |
Municipal Obligations: 0.98% | | | | | | | | | | | | | | | | | | | | |
| | | | | |
| California: 0.27% | | | | | | | | | | | | | | | | | | | | |
Other securities | | | | | | | | | | | | | | | 8,188,556 | | | | 0.27 | |
| | | | | | | | | | | | | | | | | | | | |
| | | | | |
| Illinois: 0.05% | | | | | | | | | | | | | | | | | | | | |
Other securities | | | | | | | | | | | | | | | 1,585,771 | | | | 0.05 | |
| | | | | | | | | | | | | | | | | | | | |
| | | | | |
| Nevada: 0.14% | | | | | | | | | | | | | | | | | | | | |
Other securities | | | | | | | | | | | | | | | 4,240,684 | | | | 0.14 | |
| | | | | | | | | | | | | | | | | | | | |
| | | | | |
| New Jersey: 0.18% | | | | | | | | | | | | | | | | | | | | |
Other securities | | | | | | | | | | | | | | | 5,407,466 | | | | 0.18 | |
| | | | | | | | | | | | | | | | | | | | |
| | | | | |
| New York: 0.14% | | | | | | | | | | | | | | | | | | | | |
Other securities | | | | | | | | | | | | | | | 4,024,594 | | | | 0.14 | |
| | | | | | | | | | | | | | | | | | | | |
| | | | | |
| Ohio: 0.04% | | | | | | | | | | | | | | | | | | | | |
Other securities | | | | | | | | | | | | | | | 1,212,740 | | | | 0.04 | |
| | | | | | | | | | | | | | | | | | | | |
| | | | | |
| Texas: 0.16% | | | | | | | | | | | | | | | | | | | | |
Other securities | | | | | | | | | | | | | | | 4,763,967 | | | | 0.16 | |
| | | | | | | | | | | | | | | | | | | | |
| | | | | |
Total Municipal Obligations (Cost $22,612,089) | | | | | | | | | | | | | | | 29,423,778 | | | | 0.98 | |
| | | | | | | | | | | | | | | | | | | | |
| | | | | |
Non-Agency Mortgage Backed Securities: 5.16% | | | | | | | | | | | | | | | | | | | | |
Commercial Mortgage Trust | | | 3.07-4.21 | | | | 12-10-2044 to 12-10-2047 | | | | 45,320,000 | | | | 47,520,293 | | | | 1.58 | |
Impact Funding LLC Series 2010-1 Class A1 144A | | | 5.31 | | | | 1-25-2051 | | | | 10,841,564 | | | | 12,449,324 | | | | 0.42 | |
Other securities | | | | | | | | | | | | | | | 94,131,398 | | | | 3.16 | |
| | | | | | | | | | | | | | | | | | | | |
| | | |
Total Non-Agency Mortgage Backed Securities (Cost $151,195,776) | | | | | | | | 154,101,015 | | | | 5.16 | |
| | | | | | | | | | | | | | | | | | | | |
The accompanying notes are an integral part of these financial statements.
| | | | |
| 80 | | Wells Fargo Advantage Allocation Funds | | Summary portfolio of investments—November 30, 2014 (unaudited) |
CORE BOND PORTFOLIO
| | | | | | | | | | | | | | | | | | | | |
| Security name | | Interest rate | | | Maturity date | | | Principal | | | Value | | | Percent of
net assets | |
| | | | | |
U.S. Treasury Securities: 29.96% | | | | | | | | | | | | | | | | | | | | |
U.S. Treasury Bond | | | 3.13-3.75 | % | | | 11-15-2041 to 11-15-2043 | | | $ | 7,802,000 | | | $ | 8,920,653 | | | | 0.30 | % |
U.S. Treasury Bond | | | 3.13 | | | | 2-15-2043 | | | | 20,513,000 | | | | 21,412,044 | | | | 0.72 | |
U.S. Treasury Bond | | | 3.13 | | | | 8-15-2044 | | | | 11,625,000 | | | | 12,143,580 | | | | 0.41 | |
U.S. Treasury Bond | | | 3.38 | | | | 5-15-2044 | | | | 13,915,000 | | | | 15,226,057 | | | | 0.51 | |
U.S. Treasury Bond | | | 3.63 | | | | 8-15-2043 | | | | 8,969,000 | | | | 10,260,393 | | | | 0.34 | |
U.S. Treasury Bond | | | 3.63 | | | | 2-15-2044 | | | | 15,814,000 | | | | 18,098,380 | | | | 0.60 | |
U.S. Treasury Note ## | | | 0.38 | | | | 10-31-2016 | | | | 9,873,000 | | | | 9,858,348 | | | | 0.33 | |
U.S. Treasury Note %% | | | 0.50 | | | | 11-30-2016 | | | | 19,946,000 | | | | 19,949,183 | | | | 0.67 | |
U.S. Treasury Note | | | 0.63-2.75 | | | | 8-31-2017 to 11-15-2024 | | | | 45,891,000 | | | | 46,638,190 | | | | 1.56 | |
U.S. Treasury Note | | | 0.63 | | | | 9-30-2017 | | | | 56,005,000 | | | | 55,663,706 | | | | 1.86 | |
U.S. Treasury Note ## | | | 0.88 | | | | 5-15-2017 | | | | 30,714,000 | | | | 30,853,165 | | | | 1.03 | |
U.S. Treasury Note | | | 0.88 | | | | 8-15-2017 | | | | 139,524,000 | | | | 139,829,279 | | | | 4.68 | |
U.S. Treasury Note ## | | | 0.88 | | | | 10-15-2017 | | | | 138,683,000 | | | | 138,845,536 | | | | 4.64 | |
U.S. Treasury Note | | | 1.00 | | | | 9-15-2017 | | | | 12,558,000 | | | | 12,629,618 | | | | 0.42 | |
U.S. Treasury Note | | | 1.50 | | | | 1-31-2019 | | | | 9,563,000 | | | | 9,638,462 | | | | 0.32 | |
U.S. Treasury Note | | | 1.50 | | | | 5-31-2019 | | | | 20,847,000 | | | | 20,941,458 | | | | 0.70 | |
U.S. Treasury Note | | | 1.50 | | | | 10-31-2019 | | | | 31,889,000 | | | | 31,918,912 | | | | 1.07 | |
U.S. Treasury Note | | | 1.63 | | | | 3-31-2019 | | | | 34,453,000 | | | | 34,840,596 | | | | 1.16 | |
U.S. Treasury Note | | | 1.63 | | | | 6-30-2019 | | | | 26,028,000 | | | | 26,282,189 | | | | 0.88 | |
U.S. Treasury Note | | | 1.63 | | | | 7-31-2019 | | | | 34,285,000 | | | | 34,593,016 | | | | 1.16 | |
U.S. Treasury Note | | | 1.63 | | | | 8-31-2019 | | | | 45,236,000 | | | | 45,607,071 | | | | 1.53 | |
U.S. Treasury Note %% | | | 1.63 | | | | 11-30-2019 | | | | 11,300,000 | | | | 11,292,093 | | | | 0.38 | |
U.S. Treasury Note | | | 1.75 | | | | 9-30-2019 | | | | 25,287,000 | | | | 25,622,837 | | | | 0.86 | |
U.S. Treasury Note | | | 2.00 | | | | 10-31-2021 | | | | 20,939,000 | | | | 21,099,309 | | | | 0.71 | |
U.S. Treasury Note | | | 2.50 | | | | 5-15-2024 | | | | 40,711,000 | | | | 41,941,856 | | | | 1.40 | |
U.S. Treasury Note | | | 3.13 | | | | 4-30-2017 | | | | 48,591,000 | | | | 51,464,720 | | | | 1.72 | |
| | | | | | | | | | | | | | | | | | | | |
| | | | |
Total U.S. Treasury Securities (Cost $878,685,604) | | | | | | | | | | | | 895,570,651 | | | | 29.96 | |
| | | | | | | | | | | | | | | | | | | | |
| | | | | |
Yankee Corporate Bonds and Notes: 5.21% | | | | | | | | | | | | | | | | | | | | |
| | | | | |
Consumer Discretionary: 0.34% | | | | | | | | | | | | | | | | | | | | |
| | | | | |
| Media: 0.17% | | | | | | | | | | | | | | | | | | | | |
Other securities | | | | | | | | | | | | | | | 4,937,892 | | | | 0.17 | |
| | | | | | | | | | | | | | | | | | | | |
| | | | | |
| Textiles, Apparel & Luxury Goods: 0.17% | | | | | | | | | | | | | | | | | | | | |
Other securities | | | | | | | | | | | | | | | 5,054,241 | | | | 0.17 | |
| | | | | | | | | | | | | | | | | | | | |
| | | | | |
Consumer Staples: 0.16% | | | | | | | | | | | | | | | | | | | | |
| | | | | |
| Beverages: 0.16% | | | | | | | | | | | | | | | | | | | | |
Other securities | | | | | | | | | | | | | | | 4,784,078 | | | | 0.16 | |
| | | | | | | | | | | | | | | | | | | | |
| | | | | |
Energy: 1.22% | | | | | | | | | | | | | | | | | | | | |
| | | | | |
| Oil, Gas & Consumable Fuels: 1.22% | | | | | | | | | | | | | | | | | | | | |
Other securities | | | | | | | | | | | | | | | 36,574,843 | | | | 1.22 | |
| | | | | | | | | | | | | | | | | | | | |
The accompanying notes are an integral part of these financial statements.
| | | | | | |
| Summary portfolio of investments—November 30, 2014 (unaudited) | | Wells Fargo Advantage Allocation Funds | | | 81 | |
CORE BOND PORTFOLIO
| | | | | | | | | | | | | | | | | | | | |
| Security name | | Interest rate | | | Maturity date | | | Principal | | | Value | | | Percent of
net assets | |
| | | | | |
Financials: 2.30% | | | | | | | | | | | | | | | | | | | | |
| | | | | |
| Banks: 1.88% | | | | | | | | | | | | | | | | | | | | |
Bank of Tokyo-Mitsubishi UFJ Limited 144A | | | 2.35 | % | | | 9-8-2019 | | | $ | 10,515,000 | | | $ | 10,531,298 | | | | 0.35 | % |
Other securities | | | | | | | | | | | | | | | 45,727,296 | | | | 1.53 | |
| | | | | |
| | | | | | | | | | | | | | | 56,258,594 | | | | 1.88 | |
| | | | | | | | | | | | | | | | | | | | |
| | | | | |
| Consumer Finance: 0.16% | | | | | | | | | | | | | | | | | | | | |
Other securities | | | | | | | | | | | | | | | 4,790,924 | | | | 0.16 | |
| | | | | | | | | | | | | | | | | | | | |
| | | | | |
| Diversified Financial Services: 0.26% | | | | | | | | | | | | | | | | | | | | |
Other securities | | | | | | | | | | | | | | | 7,608,191 | | | | 0.26 | |
| | | | | | | | | | | | | | | | | | | | |
| | | | | |
Health Care: 0.32% | | | | | | | | | | | | | | | | | | | | |
| | | | | |
| Pharmaceuticals: 0.32% | | | | | | | | | | | | | | | | | | | | |
Other securities | | | | | | | | | | | | | | | 9,694,119 | | | | 0.32 | |
| | | | | | | | | | | | | | | | | | | | |
| | | | | |
Information Technology: 0.37% | | | | | | | | | | | | | | | | | | | | |
| | | | | |
| Internet Software & Services: 0.37% | | | | | | | | | | | | | | | | | | | | |
Other securities | | | | | | | | | | | | | | | 11,104,517 | | | | 0.37 | |
| | | | | | | | | | | | | | | | | | | | |
| | | | | |
Materials: 0.17% | | | | | | | | | | | | | | | | | | | | |
| | | | | |
| Chemicals: 0.05% | | | | | | | | | | | | | | | | | | | | |
Other securities | | | | | | | | | | | | | | | 1,388,576 | | | | 0.05 | |
| | | | | | | | | | | | | | | | | | | | |
| | | | | |
| Metals & Mining: 0.12% | | | | | | | | | | | | | | | | | | | | |
Other securities | | | | | | | | | | | | | | | 3,633,585 | | | | 0.12 | |
| | | | | | | | | | | | | | | | | | | | |
| | | | | |
Telecommunication Services: 0.23% | | | | | | | | | | | | | | | | | | | | |
| | | | | |
| Diversified Telecommunication Services: 0.08% | | | | | | | | | | | | | | | | | | | | |
Other securities | | | | | | | | | | | | | | | 2,348,995 | | | | 0.08 | |
| | | | | | | | | | | | | | | | | | | | |
| | | | | |
| Wireless Telecommunication Services: 0.15% | | | | | | | | | | | | | | | | | | | | |
Other securities | | | | | | | | | | | | | | | 4,485,633 | | | | 0.15 | |
| | | | | | | | | | | | | | | | | | | | |
| | | | | |
Utilities: 0.10% | | | | | | | | | | | | | | | | | | | | |
| | | | | |
| Electric Utilities: 0.10% | | | | | | | | | | | | | | | | | | | | |
Other securities | | | | | | | | | | | | | | | 2,969,249 | | | | 0.10 | |
| | | | | | | | | | | | | | | | | | | | |
| | | | |
Total Yankee Corporate Bonds and Notes (Cost $152,240,431) | | | | | | | | | | | | 155,633,437 | | | | 5.21 | |
| | | | | | | | | | | | | | | | | | | | |
| | | | | |
Yankee Government Bonds: 1.43% | | | | | | | | | | | | | | | | | | | | |
Other securities | | | | | | | | | | | | | | | 42,692,495 | | | | 1.43 | |
| | | | | | | | | | | | | | | | | | | | |
| | | | | |
Total Yankee Government Bonds (Cost $40,387,654) | | | | | | | | | | | | | | | 42,692,495 | | | | 1.43 | |
| | | | | | | | | | | | | | | | | | | | |
The accompanying notes are an integral part of these financial statements.
| | | | |
| 82 | | Wells Fargo Advantage Allocation Funds | | Summary portfolio of investments—November 30, 2014 (unaudited) |
CORE BOND PORTFOLIO
| | | | | | | | | | | | | | | | | | |
| Security name | | Yield | | | | | Shares | | | Value | | | Percent of
net assets | |
| Short-Term Investments: 5.50% | | | | | | | | | | | | | | | | | | |
| | | | | |
| Investment Companies: 5.50% | | | | | | | | | | | | | | | | | | |
Securities Lending Cash Investments, LLC (l)(u)(r) | | | 0.12 | % | | | | | 747,555 | | | $ | 747,555 | | | | 0.03 | % |
Wells Fargo Advantage Cash Investment Money Market Fund, Select Class (l)(u)## | | | 0.08 | | | | | | 163,584,955 | | | | 163,584,955 | | | | 5.47 | |
| | | | | |
| | | | | | | | | | | | | 164,332,510 | | | | 5.50 | |
| | | | | | | | | | | | | | | | | | |
| | | | | |
Total Short-Term Investments (Cost $164,332,510) | | | | | | | | | | | | | 164,332,510 | | | | 5.50 | |
| | | | | | | | | | | | | | | | | | |
| | | | |
| Total investments in securities (Cost $3,281,041,099) * | | | | | | | | | | 3,338,182,606 | | | | 111.68 | % |
Other assets and liabilities, net | | | | | | | | | | | | | (349,138,883 | ) | | | (11.68 | ) |
| | | | | | | | | | | | | | | | | | |
| Total net assets | | | | | | | | | | | | $ | 2,989,043,723 | | | | 100.00 | % |
| | | | | | | | | | | | | | | | | | |
| ± | Variable rate investment. The rate shown is the rate in effect at period end. |
| %% | Security issued on a when-issued basis |
| 144A | The security may be resold in transactions exempt from registration, normally to qualified institutional buyers, pursuant to Rule 144A under the Securities Act of 1933. |
| ## | All or a portion of this security has been segregated for when-issued securities. |
| (l) | The security represents an affiliate of the Portfolio as defined in the Investment Company Act of 1940. |
| (u) | The rate represents the 7-day annualized yield at period end. |
| (r) | The investment is a non-registered investment vehicle purchased with cash collateral received from securities on loan. |
| * | Cost for federal income tax purposes is $3,286,132,910 and unrealized gains (losses) consists of: |
| | | | |
Gross unrealized gains | | $ | 60,627,009 | |
Gross unrealized losses | | | (8,577,313 | ) |
| | | | |
Net unrealized gains | | $ | 52,049,696 | |
The accompanying notes are an integral part of these financial statements.
| | | | | | |
| Portfolio of investments—November 30, 2014 (unaudited) | | Wells Fargo Advantage Allocation Funds | | | 83 | |
MANAGED FIXED INCOME PORTFOLIO
| | | | | | | | | | | | | | | | |
| Security name | | Interest rate | | | Maturity date | | | Principal | | | Value | |
| | | | |
Agency Securities: 29.45% | | | | | | | | | | | | | | | | |
FHLMC | | | 3.50 | % | | | 9-1-2032 | | | $ | 1,235,724 | | | $ | 1,299,196 | |
FHLMC | | | 4.00 | | | | 4-1-2044 | | | | 990,110 | | | | 1,064,680 | |
FHLMC | | | 4.00 | | | | 8-1-2044 | | | | 826,471 | | | | 886,677 | |
FHLMC Structured Pass-Through Securities Series T-20 Class A6 | | | 7.99 | | | | 9-25-2029 | | | | 116,745 | | | | 123,699 | |
FHLMC Structured Pass-Through Securities Series T-58 Class 4A | | | 7.50 | | | | 9-25-2043 | | | | 1,263,612 | | | | 1,505,487 | |
FNMA | | | 2.57 | | | | 9-1-2019 | | | | 540,555 | | | | 557,925 | |
FNMA | | | 2.57 | | | | 9-1-2019 | | | | 540,831 | | | | 558,198 | |
FNMA | | | 2.78 | | | | 10-1-2020 | | | | 550,000 | | | | 571,164 | |
FNMA | | | 3.00 | | | | 12-1-2032 | | | | 86,526 | | | | 89,514 | |
FNMA | | | 3.04 | | | | 10-1-2022 | | | | 597,384 | | | | 623,052 | |
FNMA | | | 3.10 | | | | 4-1-2021 | | | | 1,100,000 | | | | 1,152,824 | |
FNMA | | | 3.12 | | | | 5-1-2022 | | | | 556,314 | | | | 583,613 | |
FNMA | | | 3.31 | | | | 6-1-2021 | | | | 550,000 | | | | 585,430 | |
FNMA | | | 3.50 | | | | 9-1-2032 | | | | 2,428,810 | | | | 2,558,629 | |
FNMA | | | 3.50 | | | | 10-1-2032 | | | | 1,142,074 | | | | 1,203,122 | |
FNMA | | | 3.50 | | | | 11-1-2042 | | | | 440,545 | | | | 459,812 | |
FNMA | | | 3.50 | | | | 11-1-2042 | | | | 672,049 | | | | 701,846 | |
FNMA | | | 3.50 | | | | 2-1-2043 | | | | 329,119 | | | | 343,851 | |
FNMA | | | 5.00 | | | | 9-1-2033 | | | | 378,294 | | | | 420,724 | |
FNMA | | | 5.50 | | | | 2-1-2036 | | | | 1,002,178 | | | | 1,090,804 | |
FNMA Series 2002-90 Class A2 | | | 6.50 | | | | 11-25-2042 | | | | 526,640 | | | | 597,797 | |
FNMA Series 2002-T4 Class A2 | | | 7.00 | | | | 12-25-2041 | | | | 250,269 | | | | 289,066 | |
FNMA Series 2002-W4 Class A4 | | | 6.25 | | | | 5-25-2042 | | | | 2,317,753 | | | | 2,584,802 | |
FNMA Series 2003-86 Class PT | | | 4.50 | | | | 9-25-2018 | | | | 416,830 | | | | 437,778 | |
FNMA Series 2003-W4 Class 3A ± | | | 6.59 | | | | 10-25-2042 | | | | 382,614 | | | | 437,243 | |
FNMA Series 2004-T2 Class 1A1 | | | 6.00 | | | | 11-25-2043 | | | | 1,008,084 | | | | 1,134,550 | |
FNMA Series 2004-T3 Class A1 | | | 6.00 | | | | 2-25-2044 | | | | 1,375,444 | | | | 1,562,635 | |
FNMA Series 2004-W1 Class 2A2 | | | 7.00 | | | | 12-25-2033 | | | | 234,290 | | | | 274,674 | |
FNMA Series 2004-W11 Class 1A3 | | | 7.00 | | | | 5-25-2044 | | | | 1,300,436 | | | | 1,537,644 | |
FNMA Series 2004-W8 Class 3A | | | 7.50 | | | | 6-25-2044 | | | | 555,013 | | | | 652,544 | |
FNMA Series 2006-M2 Class A2F ± | | | 5.26 | | | | 5-25-2020 | | | | 1,822,740 | | | | 2,025,004 | |
GNMA | | | 6.50 | | | | 10-15-2023 | | | | 38,683 | | | | 44,111 | |
GNMA | | | 6.50 | | | | 11-15-2023 | | | | 23,477 | | | | 26,798 | |
GNMA | | | 6.50 | | | | 11-15-2023 | | | | 17,765 | | | | 20,258 | |
GNMA | | | 6.50 | | | | 12-15-2023 | | | | 30,322 | | | | 34,577 | |
GNMA | | | 6.50 | | | | 1-15-2024 | | | | 59,496 | | | | 67,844 | |
GNMA | | | 7.00 | | | | 8-15-2027 | | | | 130,791 | | | | 153,135 | |
SBA Series 2006-20B Class 1 | | | 5.35 | | | | 2-1-2026 | | | | 896,452 | | | | 973,004 | |
SBA Series 2006-20H Class 1 | | | 5.70 | | | | 8-1-2026 | | | | 452,817 | | | | 504,562 | |
SBA Series 2007-20J Class 1 | | | 5.57 | | | | 10-1-2027 | | | | 930,644 | | | | 1,048,406 | |
SBA Series 2013-10B Class1 | | | 3.64 | | | | 9-10-2023 | | | | 917,567 | | | | 965,818 | |
SBA Series 2013-20A Class 1 | | | 2.13 | | | | 1-1-2033 | | | | 573,937 | | | | 560,547 | |
SBA Series 2014-10A Class 1 | | | 3.19 | | | | 3-10-2024 | | | | 799,197 | | | | 828,644 | |
SBA Series 2014-20A Class 1 | | | 3.46 | | | | 1-1-2034 | | | | 490,577 | | | | 509,141 | |
| | | | |
Total Agency Securities (Cost $31,941,637) | | | | | | | | | | | | | | | 33,650,829 | |
| | | | | | | | | | | | | | | | |
| | | | |
Asset-Backed Securities: 3.51% | | | | | | | | | | | | | | | | |
American Express Credit Accounts Series 2014-2 Class A | | | 1.26 | | | | 1-15-2020 | | | | 570,000 | | | | 571,670 | |
Barclays Dryrock Issuance Trust Series 2014-3 Class A | | | 2.41 | | | | 7-15-2022 | | | | 570,000 | | | | 579,118 | |
Capital Auto Receivables Asset Trust Series 2014-2 Class A3 | | | 1.26 | | | | 5-21-2018 | | | | 550,000 | | | | 552,479 | |
The accompanying notes are an integral part of these financial statements.
| | | | |
| 84 | | Wells Fargo Advantage Allocation Funds | | Portfolio of investments—November 30, 2014 (unaudited) |
MANAGED FIXED INCOME PORTFOLIO
| | | | | | | | | | | | | | | | |
| Security name | | Interest rate | | | Maturity date | | | Principal | | | Value | |
| | | | |
Asset-Backed Securities (continued) | | | | | | | | | | | | | | | | |
Capital Auto Receivables Asset Trust Series 2014-3 Class A3 | | | 1.48 | % | | | 11-20-2018 | | | $ | 570,000 | | | $ | 572,407 | |
CNH Equipment Trust Series 2014-A Class A3 | | | 0.84 | | | | 5-15-2019 | | | | 550,000 | | | | 549,594 | |
Fifth Third Auto Trust Series 2014-1 Class A3 | | | 0.68 | | | | 4-16-2018 | | | | 550,000 | | | | 549,906 | |
Green Tree Financial Corporation Series 1997-7 Class A8 ± | | | 6.86 | | | | 7-15-2028 | | | | 80,442 | | | | 81,690 | |
Nissan Auto Receivables Owner Trust Series 2014-A Class A3 | | | 0.72 | | | | 8-15-2018 | | | | 550,000 | | | | 549,757 | |
| | | | |
Total Asset-Backed Securities (Cost $3,990,014) | | | | | | | | | | | | | | | 4,006,621 | |
| | | | | | | | | | | | | | | | |
| | | | |
Corporate Bonds and Notes: 30.57% | | | | | | | | | | | | | | | | |
| | | | |
Consumer Discretionary: 3.75% | | | | | | | | | | | | | | | | |
| | | | |
| Automobiles: 0.60% | | | | | | | | | | | | | | | | |
Daimler Finance North America LLC 144A | | | 2.38 | | | | 8-1-2018 | | | | 260,000 | | | | 264,668 | |
General Motors Company | | | 4.88 | | | | 10-2-2023 | | | | 400,000 | | | | 424,000 | |
| | | | |
| | | | | | | | | | | | | | | 688,668 | |
| | | | | | | | | | | | | | | | |
| | | | |
| Diversified Consumer Services: 2.67% | | | | | | | | | | | | | | | | |
Dartmouth College | | | 4.75 | | | | 6-1-2019 | | | | 440,000 | | | | 493,808 | |
Massachusetts Institute of Technology | | | 3.96 | | | | 7-1-2038 | | | | 200,000 | | | | 207,269 | |
Massachusetts Institute of Technology | | | 7.25 | | | | 11-2-2096 | | | | 500,000 | | | | 847,046 | |
Northwestern University | | | 4.64 | | | | 12-1-2044 | | | | 350,000 | | | | 399,294 | |
Pepperdine University | | | 5.45 | | | | 8-1-2019 | | | | 465,000 | | | | 533,550 | |
The President and Fellows of Harvard College | | | 3.53 | | | | 10-1-2031 | | | | 250,000 | | | | 251,826 | |
The President and Fellows of Harvard College | | | 5.63 | | | | 10-1-2038 | | | | 250,000 | | | | 317,426 | |
| | | | |
| | | | | | | | | | | | | | | 3,050,219 | |
| | | | | | | | | | | | | | | | |
| | | | |
| Media: 0.48% | | | | | | | | | | | | | | | | |
DIRECTV Holdings LLC | | | 2.40 | | | | 3-15-2017 | | | | 400,000 | | | | 409,310 | |
Time Warner Incorporated | | | 3.40 | | | | 6-15-2022 | | | | 140,000 | | | | 141,928 | |
| | | | |
| | | | | | | | | | | | | | | 551,238 | |
| | | | | | | | | | | | | | | | |
| | | | |
Consumer Staples: 2.31% | | | | | | | | | | | | | | | | |
| | | | |
| Food & Staples Retailing: 1.02% | | | | | | | | | | | | | | | | |
CVS Caremark Corporation | | | 4.00 | | | | 12-5-2023 | | | | 275,000 | | | | 291,093 | |
SABMiller Holdings Incorporated 144A | | | 3.75 | | | | 1-15-2022 | | | | 500,000 | | | | 524,827 | |
Sysco Corporation | | | 3.50 | | | | 10-2-2024 | | | | 250,000 | | | | 257,129 | |
Wal-Mart Stores Incorporated | | | 5.80 | | | | 2-15-2018 | | | | 84,000 | | | | 96,064 | |
| | | | |
| | | | | | | | | | | | | | | 1,169,113 | |
| | | | | | | | | | | | | | | | |
| | | | |
| Food Products: 1.07% | | | | | | | | | | | | | | | | |
Archer-Daniels-Midland Company | | | 4.48 | | | | 3-1-2021 | | | | 400,000 | | | | 442,739 | |
Cargill Incorporated 144A | | | 4.31 | | | | 5-14-2021 | | | | 419,000 | | | | 463,259 | |
Kraft Foods Group Incorporated | | | 3.50 | | | | 6-6-2022 | | | | 300,000 | | | | 310,164 | |
| | | | |
| | | | | | | | | | | | | | | 1,216,162 | |
| | | | | | | | | | | | | | | | |
| | | | |
| Household Products: 0.22% | | | | | | | | | | | | | | | | |
The Procter & Gamble Company | | | 5.50 | | | | 2-1-2034 | | | | 200,000 | | | | 251,058 | |
| | | | | | | | | | | | | | | | |
The accompanying notes are an integral part of these financial statements.
| | | | | | |
| Portfolio of investments—November 30, 2014 (unaudited) | | Wells Fargo Advantage Allocation Funds | | | 85 | |
MANAGED FIXED INCOME PORTFOLIO
| | | | | | | | | | | | | | | | |
| Security name | | Interest rate | | | Maturity date | | | Principal | | | Value | |
| | | | |
Energy: 1.09% | | | | | | | | | | | | | | | | |
| | | | |
| Oil, Gas & Consumable Fuels: 1.09% | | | | | | | | | | | | | | | | |
Chevron Corporation | | | 2.36 | % | | | 12-5-2022 | | | $ | 120,000 | | | $ | 116,760 | |
Chevron Corporation | | | 3.19 | | | | 6-24-2023 | | | | 250,000 | | | | 257,152 | |
ConocoPhillips Company | | | 3.35 | | | | 11-15-2024 | | | | 370,000 | | | | 375,751 | |
EQT Corporation | | | 8.13 | | | | 6-1-2019 | | | | 400,000 | | | | 489,934 | |
| | | | |
| | | | | | | | | | | | | | | 1,239,597 | |
| | | | | | | | | | | | | | | | |
| | | | |
Financials: 13.94% | | | | | | | | | | | | | | | | |
| | | | |
| Banks: 5.78% | | | | | | | | | | | | | | | | |
Bank of America Corporation | | | 2.60 | | | | 1-15-2019 | | | | 155,000 | | | | 157,303 | |
Bank of America Corporation | | | 4.00 | | | | 4-1-2024 | | | | 700,000 | | | | 733,147 | |
Chase Capital VI ± | | | 0.86 | | | | 8-1-2028 | | | | 1,000,000 | | | | 852,100 | |
Citigroup Incorporated | | | 6.13 | | | | 11-21-2017 | | | | 435,000 | | | | 490,108 | |
CoreStates Capital Trust II ±144A | | | 0.88 | | | | 1-15-2027 | | | | 750,000 | | | | 652,500 | |
Credit Suisse New York | | | 3.63 | | | | 9-9-2024 | | | | 250,000 | | | | 255,609 | |
Manufacturers & Traders Trust Company ± | | | 5.59 | | | | 12-28-2020 | | | | 758,000 | | | | 790,197 | |
National Capital Commerce Incorporated ±(i) | | | 1.22 | | | | 4-1-2027 | | | | 400,000 | | | | 332,000 | |
National City Bank ± | | | 0.60 | | | | 6-7-2017 | | | | 250,000 | | | | 248,760 | |
NTC Capital Trust Series A ± | | | 0.75 | | | | 1-15-2027 | | | | 450,000 | | | | 391,500 | |
Regions Financial Corporation | | | 5.75 | | | | 6-15-2015 | | | | 760,000 | | | | 777,706 | |
UBS Preferred Funding Trust V Series 1 ± | | | 6.24 | | | | 5-29-2049 | | | | 700,000 | | | | 726,250 | |
US Bancorp | | | 2.95 | | | | 7-15-2022 | | | | 200,000 | | | | 198,743 | |
| | | | |
| | | | | | | | | | | | | | | 6,605,923 | |
| | | | | | | | | | | | | | | | |
| | | | |
| Capital Markets: 0.94% | | | | | | | | | | | | | | | | |
Goldman Sachs Capital II ± | | | 4.00 | | | | 12-31-2049 | | | | 115,000 | | | | 85,819 | |
Goldman Sachs Group Incorporated | | | 5.75 | | | | 1-24-2022 | | | | 200,000 | | | | 231,868 | |
Morgan Stanley | | | 3.70 | | | | 10-23-2024 | | | | 100,000 | | | | 101,717 | |
Morgan Stanley | | | 5.50 | | | | 7-24-2020 | | | | 350,000 | | | | 398,202 | |
The Bank of New York Mellon Corporation | | | 3.25 | | | | 9-11-2024 | | | | 250,000 | | | | 252,951 | |
| | | | |
| | | | | | | | | | | | | | | 1,070,557 | |
| | | | | | | | | | | | | | | | |
| | | | |
| Consumer Finance: 0.14% | | | | | | | | | | | | | | | | |
Caterpillar Financial Services Corporation | | | 3.75 | | | | 11-24-2023 | | | | 150,000 | | | | 159,506 | |
| | | | | | | | | | | | | | | | |
| | | | |
| Diversified Financial Services: 2.60% | | | | | | | | | | | | | | | | |
ABB Treasury Center USA Incorporated 144A | | | 4.00 | | | | 6-15-2021 | | | | 510,000 | | | | 550,457 | |
Deutsche Bank Capital Funding Trust VII ±144A | | | 5.63 | | | | 1-29-2049 | | | | 500,000 | | | | 510,000 | |
General Electric Capital Corporation ± | | | 0.61 | | | | 5-5-2026 | | | | 450,000 | | | | 420,806 | |
Toll Road Investors Partnership II LP 144A¤ | | | 0.00 | | | | 2-15-2015 | | | | 1,500,000 | | | | 1,488,864 | |
| | | | |
| | | | | | | | | | | | | | | 2,970,127 | |
| | | | | | | | | | | | | | | | |
| | | | |
| Insurance: 1.47% | | | | | | | | | | | | | | | | |
Minnesota Life Insurance Company 144A | | | 8.25 | | | | 9-15-2025 | | | | 650,000 | | | | 819,920 | |
NLV Financial Corporation 144A | | | 7.50 | | | | 8-15-2033 | | | | 565,000 | | | | 632,940 | |
Pacific LifeCorp 144A | | | 6.00 | | | | 2-10-2020 | | | | 200,000 | | | | 229,332 | |
| | | | |
| | | | | | | | | | | | | | | 1,682,192 | |
| | | | | | | | | | | | | | | | |
The accompanying notes are an integral part of these financial statements.
| | | | |
| 86 | | Wells Fargo Advantage Allocation Funds | | Portfolio of investments—November 30, 2014 (unaudited) |
MANAGED FIXED INCOME PORTFOLIO
| | | | | | | | | | | | | | | | |
| Security name | | Interest rate | | | Maturity date | | | Principal | | | Value | |
| | | | |
| REITs: 3.01% | | | | | | | | | | | | | | | | |
AvalonBay Communities Incorporated | | | 2.95 | % | | | 9-15-2022 | | | $ | 190,000 | | | $ | 187,742 | |
AvalonBay Communities Incorporated | | | 3.63 | | | | 10-1-2020 | | | | 40,000 | | | | 41,925 | |
Boston Properties LP | | | 3.70 | | | | 11-15-2018 | | | | 180,000 | | | | 191,326 | |
Boston Properties LP | | | 5.88 | | | | 10-15-2019 | | | | 200,000 | | | | 231,040 | |
Duke Realty LP | | | 3.88 | | | | 10-15-2022 | | | | 150,000 | | | | 154,529 | |
Duke Realty LP | | | 6.75 | | | | 3-15-2020 | | | | 250,000 | | | | 297,088 | |
ERP Operation LP | | | 4.63 | | | | 12-15-2021 | | | | 470,000 | | | | 518,918 | |
Liberty Property LP | | | 6.63 | | | | 10-1-2017 | | | | 400,000 | | | | 452,258 | |
Potlatch Corporation | | | 7.50 | | | | 11-1-2019 | | | | 160,000 | | | | 181,600 | |
Realty Income Corporation | | | 4.65 | | | | 8-1-2023 | | | | 370,000 | | | | 399,013 | |
Simon Property Group LP | | | 3.38 | | | | 10-1-2024 | | | | 300,000 | | | | 304,969 | |
UDR Incorporated | | | 4.63 | | | | 1-10-2022 | | | | 260,000 | | | | 282,116 | |
Vornado Realty LP | | | 2.50 | | | | 6-30-2019 | | | | 200,000 | | | | 200,337 | |
| | | | |
| | | | | | | | | | | | | | | 3,442,861 | |
| | | | | | | | | | | | | | | | |
| | | | |
Health Care: 1.30% | | | | | | | | | | | | | | | | |
| | | | |
| Health Care Providers & Services: 0.11% | | | | | | | | | | | | | | | | |
Howard Hughes Medical Institute | | | 3.50 | | | | 9-1-2023 | | | | 120,000 | | | | 125,213 | |
| | | | | | | | | | | | | | | | |
| | | | |
| Life Sciences Tools & Services: 0.13% | | | | | | | | | | | | | | | | |
Thermo Fisher Scientific Incorporated | | | 3.30 | | | | 2-15-2022 | | | | 150,000 | | | | 151,512 | |
| | | | | | | | | | | | | | | | |
| | | | |
| Pharmaceuticals: 1.06% | | | | | | | | | | | | | | | | |
Bayer US Finance LLC 144A | | | 3.38 | | | | 10-8-2024 | | | | 240,000 | | | | 243,258 | |
Novartis Capital Corporation | | | 3.40 | | | | 5-6-2024 | | | | 370,000 | | | | 383,908 | |
Roche Holdings Incorporated 144A | | | 3.35 | | | | 9-30-2024 | | | | 400,000 | | | | 413,166 | |
Roche Holdings Incorporated 144A | | | 6.00 | | | | 3-1-2019 | | | | 144,000 | | | | 167,031 | |
| | | | |
| | | | | | | | | | | | | | | 1,207,363 | |
| | | | | | | | | | | | | | | | |
| | | | |
Industrials: 2.39% | | | | | | | | | | | | | | | | |
| | | | |
| Aerospace & Defense: 0.46% | | | | | | | | | | | | | | | | |
BAE Systems Holdings Incorporated 144A | | | 3.80 | | | | 10-7-2024 | | | | 100,000 | | | | 102,537 | |
Raytheon Company %% | | | 3.15 | | | | 12-15-2024 | | | | 240,000 | | | | 240,953 | |
United Technologies Corporation | | | 3.10 | | | | 6-1-2022 | | | | 180,000 | | | | 184,760 | |
| | | | |
| | | | | | | | | | | | | | | 528,250 | |
| | | | | | | | | | | | | | | | |
| | | | |
| Air Freight & Logistics: 0.21% | | | | | | | | | | | | | | | | |
FedEx Corporation | | | 4.00 | | | | 1-15-2024 | | | | 225,000 | | | | 238,348 | |
| | | | | | | | | | | | | | | | |
| | | | |
| Machinery: 0.75% | | | | | | | | | | | | | | | | |
Deere & Company | | | 2.60 | | | | 6-8-2022 | | | | 340,000 | | | | 337,294 | |
Parker Hannifin Corporation | | | 3.30 | | | | 11-21-2024 | | | | 260,000 | | | | 264,749 | |
Valmont Industries Incorporated | | | 5.00 | | | | 10-1-2044 | | | | 260,000 | | | | 258,388 | |
| | | | |
| | | | | | | | | | | | | | | 860,431 | |
| | | | | | | | | | | | | | | | |
| | | | |
| Road & Rail: 0.64% | | | | | | | | | | | | | | | | |
Burlington Northern Santa Fe LLC | | | 3.05 | | | | 9-1-2022 | | | | 100,000 | | | | 100,917 | |
Burlington Northern Santa Fe LLC | | | 3.40 | | | | 9-1-2024 | | | | 150,000 | | | | 152,280 | |
The accompanying notes are an integral part of these financial statements.
| | | | | | |
| Portfolio of investments—November 30, 2014 (unaudited) | | Wells Fargo Advantage Allocation Funds | | | 87 | |
MANAGED FIXED INCOME PORTFOLIO
| | | | | | | | | | | | | | | | |
| Security name | | Interest rate | | | Maturity date | | | Principal | | | Value | |
| | | | |
| Road & Rail (continued) | | | | | | | | | | | | | | | | |
Burlington Northern Santa Fe LLC | | | 3.45 | % | | | 9-15-2021 | | | $ | 250,000 | | | $ | 262,303 | |
Union Pacific Corporation | | | 7.88 | | | | 1-15-2019 | | | | 171,000 | | | | 208,967 | |
| | | | |
| | | | | | | | | | | | | | | 724,467 | |
| | | | | | | | | | | | | | | | |
| | | | |
| Transportation Infrastructure: 0.33% | | | | | | | | | | | | | | | | |
Vessel Management Service | | | 3.43 | | | | 8-15-2036 | | | | 372,000 | | | | 381,604 | |
| | | | | | | | | | | | | | | | |
| | | | |
Information Technology: 1.41% | | | | | | | | | | | | | | | | |
| | | | |
| Communications Equipment: 0.09% | | | | | | | | | | | | | | | | |
Cisco Systems Incorporated | | | 2.13 | | | | 3-1-2019 | | | | 100,000 | | | | 100,790 | |
| | | | | | | | | | | | | | | | |
| | | | |
| Electronic Equipment, Instruments & Components: 0.25% | | | | | | | | | | | | | | | | |
Jabil Circuit Incorporated | | | 8.25 | | | | 3-15-2018 | | | | 250,000 | | | | 288,750 | |
| | | | | | | | | | | | | | | | |
| | | | |
| IT Services: 0.55% | | | | | | | | | | | | | | | | |
Fiserv Incorporated | | | 3.13 | | | | 10-1-2015 | | | | 500,000 | | | | 510,332 | |
Fiserv Incorporated | | | 4.75 | | | | 6-15-2021 | | | | 100,000 | | | | 110,992 | |
| | | | |
| | | | | | | | | | | | | | | 621,324 | |
| | | | | | | | | | | | | | | | |
| | | | |
| Software: 0.34% | | | | | | | | | | | | | | | | |
Oracle Corporation | | | 2.38 | | | | 1-15-2019 | | | | 160,000 | | | | 163,569 | |
Oracle Corporation | | | 3.40 | | | | 7-8-2024 | | | | 220,000 | | | | 226,501 | |
| | | | |
| | | | | | | | | | | | | | | 390,070 | |
| | | | | | | | | | | | | | | | |
| | | | |
| Technology Hardware, Storage & Peripherals: 0.18% | | | | | | | | | | | | | | | | |
Apple Incorporated | | | 2.85 | | | | 5-6-2021 | | | | 200,000 | | | | 205,312 | |
| | | | | | | | | | | | | | | | |
| | | | |
Materials: 1.30% | | | | | | | | | | | | | | | | |
| | | | |
| Chemicals: 0.99% | | | | | | | | | | | | | | | | |
Ecolab Incorporated | | | 4.35 | | | | 12-8-2021 | | | | 330,000 | | | | 362,416 | |
Valspar Corporation | | | 5.10 | | | | 8-1-2015 | | | | 750,000 | | | | 767,918 | |
| | | | |
| | | | | | | | | | | | | | | 1,130,334 | |
| | | | | | | | | | | | | | | | |
| | | | |
| Paper & Forest Products: 0.31% | | | | | | | | | | | | | | | | |
Georgia Pacific LLC 144A | | | 3.73 | | | | 7-15-2023 | | | | 340,000 | | | | 354,279 | |
| | | | | | | | | | | | | | | | |
| | | | |
Telecommunication Services: 0.44% | | | | | | | | | | | | | | | | |
| | | | |
| Diversified Telecommunication Services: 0.44% | | | | | | | | | | | | | | | | |
Verizon Communications Incorporated | | | 3.50 | | | | 11-1-2024 | | | | 110,000 | | | | 110,155 | |
Verizon Communications Incorporated | | | 5.15 | | | | 9-15-2023 | | | | 350,000 | | | | 394,067 | |
| | | | |
| | | | | | | | | | | | | | | 504,222 | |
| | | | | | | | | | | | | | | | |
| | | | |
Utilities: 2.64% | | | | | | | | | | | | | | | | |
| | | | |
| Electric Utilities: 2.46% | | | | | | | | | | | | | | | | |
Atlantic City Electric Company | | | 7.75 | | | | 11-15-2018 | | | | 255,000 | | | | 310,200 | |
Connecticut Light & Power | | | 5.38 | | | | 3-1-2017 | | | | 250,000 | | | | 273,117 | |
Entergy Texas Incorporated | | | 7.13 | | | | 2-1-2019 | | | | 250,000 | | | | 298,802 | |
Great River Energy 144A | | | 5.83 | | | | 7-1-2017 | | | | 397,397 | | | | 425,725 | |
The accompanying notes are an integral part of these financial statements.
| | | | |
| 88 | | Wells Fargo Advantage Allocation Funds | | Portfolio of investments—November 30, 2014 (unaudited) |
MANAGED FIXED INCOME PORTFOLIO
| | | | | | | | | | | | | | | | |
| Security name | | Interest rate | | | Maturity date | | | Principal | | | Value | |
| | | | |
| Electric Utilities (continued) | | | | | | | | | | | | | | | | |
ITC Holdings Corporation | | | 3.65 | % | | | 6-15-2024 | | | $ | 120,000 | | | $ | 122,397 | |
Kentucky Utilities Company | | | 3.25 | | | | 11-1-2020 | | | | 250,000 | | | | 262,346 | |
Monongahela Power Company 144A | | | 4.10 | | | | 4-15-2024 | | | | 380,000 | | | | 406,755 | |
Otter Tail Corporation (i) | | | 9.00 | | | | 12-15-2016 | | | | 350,000 | | | | 399,615 | |
PacifiCorp | | | 3.60 | | | | 4-1-2024 | | | | 300,000 | | | | 312,982 | |
| | | | |
| | | | | | | | | | | | | | | 2,811,939 | |
| | | | | | | | | | | | | | | | |
| | | | |
| Gas Utilities: 0.18% | | | | | | | | | | | | | | | | |
Southern California Gas Company | | | 3.15 | | | | 9-15-2024 | | | | 200,000 | | | | 202,984 | |
| | | | | | | | | | | | | | | | |
| | | | |
Total Corporate Bonds and Notes (Cost $33,187,226) | | | | | | | | | | | | | | | 34,924,413 | |
| | | | | | | | | | | | | | | | |
| | | | |
Municipal Obligations: 9.32% | | | | | | | | | | | | | | | | |
| | | | |
| Arizona: 1.02% | | | | | | | | | | | | | | | | |
Arizona School Facilities Board Refunding Certificates of Participation Series A-3 (Miscellaneous Revenue) | | | 2.38 | | | | 9-1-2019 | | | | 235,000 | | | | 239,397 | |
Maricopa County AZ Elementary School District #28 Kyrene Elementary Build America Bonds Series D (GO) | | | 5.38 | | | | 7-1-2019 | | | | 800,000 | | | | 928,168 | |
| | | | |
| | | | | | | | | | | | | | | 1,167,565 | |
| | | | | | | | | | | | | | | | |
| | | | |
| Arkansas: 0.31% | | | | | | | | | | | | | | | | |
Arkansas Taxable Amendment 82 Series A (GO) | | | 2.61 | | | | 7-1-2021 | | | | 350,000 | | | | 359,090 | |
| | | | | | | | | | | | | | | | |
| | | | |
| California: 0.23% | | | | | | | | | | | | | | | | |
California Build America Bonds (GO) | | | 6.88 | | | | 11-1-2026 | | | | 200,000 | | | | 265,572 | |
| | | | | | | | | | | | | | | | |
| | | | |
| Georgia: 0.52% | | | | | | | | | | | | | | | | |
Cherokee County GA School System Build America Bonds (GO) | | | 5.87 | | | | 8-1-2028 | | | | 500,000 | | | | 593,235 | |
| | | | | | | | | | | | | | | | |
| | | | |
| Indiana: 0.22% | | | | | | | | | | | | | | | | |
Indiana Housing & CDA Series A-2 (Housing Revenue, GNMA/FNMA Insured) | | | 5.51 | | | | 1-1-2039 | | | | 245,000 | | | | 250,902 | |
| | | | | | | | | | | | | | | | |
| Kentucky: 0.16% | | | | | | | | | | | | | |
Kentucky Housing Corporation Series D (Housing Revenue) | | | 5.75 | | | | 7-1-2037 | | | | 170,000 | | | | 177,385 | |
| | | | | | | | | | | | | | | | |
| Maryland: 0.26% | | | | | | | | | | | | | |
Baltimore County MD (GO) | | | 3.57 | | | | 8-1-2032 | | | | 300,000 | | | | 291,276 | |
| | | | | | | | | | | | | | | | |
| Massachusetts: 0.87% | | | | | | | | | | | | | |
Boston MA Series C Qualified School Construction Bonds (GO) | | | 4.40 | | | | 4-1-2026 | | | | 400,000 | | | | 438,792 | |
Massachusetts Build America Bonds Series D (GO) | | | 4.50 | | | | 8-1-2031 | | | | 500,000 | | | | 550,460 | |
| | | | |
| | | | | | | | | | | | | | | 989,252 | |
| | | | | | | | | | | | | | | | |
| Minnesota: 0.25% | | | | | | | | | | | | | |
Minnetonka MN Independent School District #276 Series E (GO) | | | 2.55 | | | | 1-1-2024 | | | | 290,000 | | | | 283,756 | |
| | | | | | | | | | | | | | | | |
| Missouri: 0.38% | | | | | | | | | | | | | |
Missouri Higher Education Loan Authority Notes Class A-1 (Education Revenue) ± | | | 1.08 | | | | 8-27-2029 | | | | 434,382 | | | | 436,936 | |
| | | | | | | | | | | | | | | | |
| New Hampshire: 0.19% | | | | | | | | | | | | | |
New Hampshire HFA SFMR Series D (Housing Revenue) | | | 5.53 | | | | 7-1-2037 | | | | 220,000 | | | | 220,810 | |
| | | | | | | | | | | | | | | | |
| New Jersey: 1.09% | | | | | | | | | | | | | |
Hudson County NJ Improvement Authority Hudson County Lease Project (Miscellaneous Revenue, AGM Insured) | | | 7.40 | | | | 12-1-2025 | | | | 1,030,000 | | | | 1,242,788 | |
| | | | | | | | | | | | | | | | |
The accompanying notes are an integral part of these financial statements.
| | | | | | |
| Portfolio of investments—November 30, 2014 (unaudited) | | Wells Fargo Advantage Allocation Funds | | | 89 | |
MANAGED FIXED INCOME PORTFOLIO
| | | | | | | | | | | | | | | | |
| Security name | | Interest rate | | | Maturity date | | | Principal | | | Value | |
| North Carolina: 0.34% | | | | | | | | | | | | | |
Duke University North Carolina Series A (Education Revenue) | | | 5.85 | % | | | 4-1-2037 | | | $ | 300,000 | | | $ | 392,505 | |
| | | | | | | | | | | | | | | | |
| Ohio: 0.34% | | | | | | | | | | | | | |
Ohio Housing Finance Agency Series O (Housing Revenue, GNMA/FNMA Insured) | | | 5.47 | | | | 9-1-2025 | | | | 120,000 | | | | 123,169 | |
Ohio Veterans Compensation (GO) | | | 3.38 | | | | 10-1-2021 | | | | 250,000 | | | | 263,898 | |
| | | | |
| | | | | | | | | | | | | | | 387,067 | |
| | | | | | | | | | | | | | | | |
| Oklahoma: 0.34% | | | | | | | | | | | | | |
Oklahoma Water Resource Board Revolving Fund Series A (Water & Sewer Revenue) | | | 3.27 | | | | 4-1-2023 | | | | 375,000 | | | | 393,611 | |
| | | | | | | | | | | | | | | | |
| Oregon: 0.31% | | | | | | | | | | | | | |
Oregon University Series D (GO) | | | 2.03 | | | | 8-1-2020 | | | | 350,000 | | | | 349,115 | |
| | | | | | | | | | | | | | | | |
| Texas: 0.77% | | | | | | | | | | | | | |
Clear Creek TX Independent School District Taxable Refunding Series B (GO) | | | 3.40 | | | | 2-15-2022 | | | | 375,000 | | | | 397,781 | |
Harris County TX Taxable Refunding Permanent Improvement Series B (GO) | | | 2.12 | | | | 10-1-2021 | | | | 500,000 | | | | 485,050 | |
| | | | |
| | | | | | | | | | | | | | | 882,831 | |
| | | | | | | | | | | | | | | | |
| Washington: 0.95% | | | | | | | | | | | | | |
King County WA Build America Bonds Recovery Zone Economic Development Taxable Series C (GO) | | | 5.03 | | | | 12-1-2023 | | | | 230,000 | | | | 262,552 | |
King County WA School District #210 Federal Way Build America Bonds (GO) | | | 4.90 | | | | 12-1-2022 | | | | 400,000 | | | | 441,260 | |
Washington Build America Bonds (GO) | | | 5.09 | | | | 8-1-2033 | | | | 325,000 | | | | 379,792 | |
| | | | |
| | | | | | | | | | | | | | | 1,083,604 | |
| | | | | | | | | | | | | | | | |
| West Virginia: 0.48% | | | | | | | | | | | | | |
Ohio County WV Special District Excise Tax Series A (Tax Revenue) | | | 8.25 | | | | 3-1-2035 | | | | 500,000 | | | | 550,930 | |
| | | | | | | | | | | | | | | | |
| | | | |
| Wisconsin: 0.29% | | | | | | | | | | | | | | | | |
Milwaukee County WI Taxable Pension Promissory Notes Series A (GO) | | | 6.84 | | | | 12-1-2028 | | | | 90,000 | | | | 112,780 | |
Wisconsin Housing & EDA Home Ownership Revenue Series F (Housing Revenue) | | | 5.73 | | | | 9-1-2037 | | | | 210,000 | | | | 214,032 | |
| | | | |
| | | | | | | | | | | | | | | 326,812 | |
| | | | | | | | | | | | | | | | |
| | | | |
Total Municipal Obligations (Cost $9,999,575) | | | | | | | | | | | | | | | 10,645,042 | |
| | | | | | | | | | | | | | | | |
| | | | |
Non-Agency Mortgage Backed Securities: 13.23% | | | | | | | | | | | | | | | | |
Bear Stearns Commercial Mortgage Securities Trust Series 2007-PW17 Class A1A ± | | | 5.65 | | | | 6-11-2050 | | | | 506,838 | | | | 555,949 | |
Commercial Mortgage Pass-Through Certificate Trust Series 2010-C1 Class A3 144A | | | 4.21 | | | | 7-10-2046 | | | | 700,000 | | | | 763,248 | |
Commercial Mortgage Pass-Through Certificate Trust Series 2013-CR12 Class ASB | | | 3.62 | | | | 10-10-2046 | | | | 550,000 | | | | 579,074 | |
Credit Suisse First Boston Commercial Mortgage Trust Series 2004-AR5 Class 10A1 ± | | | 2.54 | | | | 6-25-2034 | | | | 693,786 | | | | 706,801 | |
Credit Suisse First Boston Commercial Mortgage Trust Series 2007-C1 Class AAB | | | 5.34 | | | | 2-15-2040 | | | | 545,226 | | | | 564,576 | |
GS Mortgage Securities Trust Series 2011-GC3 Class A4 144A | | | 4.75 | | | | 3-10-2044 | | | | 500,000 | | | | 557,620 | |
GS Mortgage Securities Trust Series 2011-GC5 Class A4 | | | 3.71 | | | | 8-10-2044 | | | | 545,000 | | | | 581,859 | |
GS Mortgage Securities Trust Series 2012-GCJ7 Class A4 | | | 3.38 | | | | 5-10-2045 | | | | 560,000 | | | | 583,346 | |
GS Mortgage Securities Trust Series 2013-GC10 Class AAB | | | 2.56 | | | | 2-10-2046 | | | | 212,500 | | | | 212,570 | |
GS Mortgage Securities Trust Series 2013-GC12 Class AAB | | | 2.68 | | | | 6-10-2046 | | | | 212,500 | | | | 213,301 | |
JPMorgan Chase Commercial Mortgage Securities Trust Series 2006-LDP7 Class ASB ± | | | 6.06 | | | | 4-15-2045 | | | | 483,954 | | | | 491,649 | |
JPMorgan Chase Commercial Mortgage Securities Trust Series 2010-C2 Class A3 144A | | | 4.07 | | | | 11-15-2043 | | | | 570,000 | | | | 614,217 | |
JPMorgan Chase Commercial Mortgage Securities Trust Series 2011-C4 Class A4 144A | | | 4.39 | | | | 7-15-2046 | | | | 510,000 | | | | 561,634 | |
JPMorgan Chase Commercial Mortgage Securities Trust Series 2011-C5 Class A3 | | | 4.17 | | | | 8-15-2046 | | | | 530,000 | | | | 576,071 | |
JPMorgan Chase Commercial Mortgage Securities Trust Series 2013-C12 Class ASB | | | 3.16 | | | | 7-15-2045 | | | | 550,000 | | | | 570,397 | |
Mississippi Higher Education Assistance Corporation Series 2014-1 Class A1 ± | | | 0.84 | | | | 10-25-2035 | | | | 764,475 | | | | 764,504 | |
Morgan Stanley Bank of America Merrill Lynch Trust Series 2014-C15 Class ASB | | | 3.65 | | | | 4-15-2047 | | | | 550,000 | | | | 579,418 | |
Morgan Stanley Capital I Trust Series 2011-C2 Class A4 144A | | | 4.66 | | | | 6-15-2044 | | | | 500,000 | | | | 558,052 | |
Morgan Stanley Capital I Trust Series 2011-C3 Class A4 | | | 4.12 | | | | 7-15-2049 | | | | 530,000 | | | | 575,336 | |
The accompanying notes are an integral part of these financial statements.
| | | | |
| 90 | | Wells Fargo Advantage Allocation Funds | | Portfolio of investments—November 30, 2014 (unaudited) |
MANAGED FIXED INCOME PORTFOLIO
| | | | | | | | | | | | | | | | |
| Security name | | Interest rate | | | Maturity date | | | Principal | | | Value | |
| | | | |
Non-Agency Mortgage Backed Securities (continued) | | | | | | | | | | | | | | | | |
Nomura Asset Acceptance Corporation Series 2004-R2 Class A1 ±144A | | | 6.50 | % | | | 10-25-2034 | | | $ | 1,153,177 | | | $ | 1,170,541 | |
Sequoia Mortgage Trust Series 10 Class 1A ± | | | 0.96 | | | | 10-20-2027 | | | | 371,155 | | | | 362,339 | |
Small Business Administration Series 2014-10B Class 1 | | | 3.02 | | | | 9-10-2024 | | | | 1,140,000 | | | | 1,165,495 | |
South Carolina Student Loan Corporation Series 2014-1 Class B ± | | | 1.66 | | | | 8-1-2035 | | | | 500,000 | | | | 467,905 | |
Structured Asset Securities Corporation Series 2007-RM1 Class A1 ±144A | | | 0.43 | | | | 5-25-2047 | | | | 2,181,074 | | | | 1,341,360 | |
| | | | |
Total Non-Agency Mortgage Backed Securities (Cost $15,818,848) | | | | | | | | | | | | | | | 15,117,262 | |
| | | | | | | | | | | | | | | | |
| | | | |
U.S. Treasury Securities: 5.02% | | | | | | | | | | | | | | | | |
U.S. Treasury Bond | | | 3.13 | | | | 8-15-2044 | | | | 550,000 | | | | 574,535 | |
U.S. Treasury Bond | | | 3.63 | | | | 2-15-2044 | | | | 500,000 | | | | 572,227 | |
U.S. Treasury Bond | | | 3.88 | | | | 8-15-2040 | | | | 375,000 | | | | 447,539 | |
U.S. Treasury Bond | | | 4.25 | | | | 11-15-2040 | | | | 2,105,000 | | | | 2,664,305 | |
U.S. Treasury Bond | | | 4.50 | | | | 2-15-2036 | | | | 1,134,000 | | | | 1,474,732 | |
| | | | |
Total U.S. Treasury Securities (Cost $4,637,473) | | | | | | | | | | | | | | | 5,733,338 | |
| | | | | | | | | | | | | | | | |
| | | | |
Yankee Corporate Bonds and Notes: 5.67% | | | | | | | | | | | | | | | | |
| | | | |
Consumer Discretionary: 0.32% | | | | | | | | | | | | | | | | |
| | | | |
| Media: 0.32% | | | | | | | | | | | | | | | | |
Pearson Dollar Finance Two plc 144A | | | 6.25 | | | | 5-6-2018 | | | | 325,000 | | | | 365,898 | |
| | | | | | | | | | | | | | | | |
| | | | |
Energy: 2.46% | | | | | | | | | | | | | | | | |
| | | | |
| Energy Equipment & Services: 0.78% | | | | | | | | | | | | | | | | |
Ensco plc | | | 4.50 | | | | 10-1-2024 | | | | 80,000 | | | | 80,420 | |
Ensco plc | | | 4.70 | | | | 3-15-2021 | | | | 200,000 | | | | 210,163 | |
Schlumberger Norge AS 144A | | | 4.20 | | | | 1-15-2021 | | | | 380,000 | | | | 415,231 | |
Weatherford International Limited | | | 4.50 | | | | 4-15-2022 | | | | 190,000 | | | | 188,139 | |
| | | | |
| | | | | | | | | | | | | | | 893,953 | |
| | | | | | | | | | | | | | | | |
| | | | |
| Oil, Gas & Consumable Fuels: 1.68% | | | | | | | | | | | | | | | | |
BP Capital Markets plc | | | 3.81 | | | | 2-10-2024 | | | | 110,000 | | | | 113,188 | |
BP Capital Markets plc | | | 4.50 | | | | 10-1-2020 | | | | 350,000 | | | | 381,776 | |
Petroleos Mexicanos | | | 2.29 | | | | 2-15-2024 | | | | 261,250 | | | | 263,383 | |
Petroleos Mexicanos | | | 2.83 | | | | 2-15-2024 | | | | 546,250 | | | | 563,850 | |
Petroleos Mexicanos | | | 6.38 | | | | 1-23-2045 | | | | 250,000 | | | | 288,038 | |
Statoil ASA | | | 3.25 | | | | 11-10-2024 | | | | 310,000 | | | | 312,057 | |
| | | | |
| | | | | | | | | | | | | | | 1,922,292 | |
| | | | | | | | | | | | | | | | |
| | | | |
Financials: 1.22% | | | | | | | | | | | | | | | | |
| | | | |
| Banks: 0.29% | | | | | | | | | | | | | | | | |
RaboBank Nederland | | | 4.50 | | | | 1-11-2021 | | | | 300,000 | | | | 332,736 | |
| | | | | | | | | | | | | | | | |
| | | | |
| Diversified Financial Services: 0.93% | | | | | | | | | | | | | | | | |
Shell International Finance BV | | | 3.40 | | | | 8-12-2023 | | | | 370,000 | | | | 385,189 | |
Total Capital International SA | | | 3.70 | | | | 1-15-2024 | | | | 200,000 | | | | 207,803 | |
Tyco Electronics Group SA | | | 3.50 | | | | 2-3-2022 | | | | 450,000 | | | | 465,200 | |
| | | | |
| | | | | | | | | | | | | | | 1,058,192 | |
| | | | | | | | | | | | | | | | |
The accompanying notes are an integral part of these financial statements.
| | | | | | |
| Portfolio of investments—November 30, 2014 (unaudited) | | Wells Fargo Advantage Allocation Funds | | | 91 | |
MANAGED FIXED INCOME PORTFOLIO
| | | | | | | | | | | | | | | | |
| Security name | | Interest rate | | | Maturity date | | | Principal | | | Value | |
| | | | |
Industrials: 0.45% | | | | | | | | | | | | | | | | |
| | | | |
| Aerospace & Defense: 0.45% | | | | | | | | | | | | | | | | |
BAE Systems plc 144A | | | 4.75 | % | | | 10-11-2021 | | | $ | 470,000 | | | $ | 517,195 | |
| | | | | | | | | | | | | | | | |
| | | | |
Information Technology: 0.33% | | | | | | | | | | | | | | | | |
| | | | |
| Semiconductors & Semiconductor Equipment: 0.33% | | | | | | | | | | | | | | | | |
TSMC Global Limited 144A | | | 1.63 | | | | 4-3-2018 | | | | 380,000 | | | | 377,123 | |
| | | | | | | | | | | | | | | | |
| | | | |
Materials: 0.55% | | | | | | | | | | | | | | | | |
| | | | |
| Metals & Mining: 0.55% | | | | | | | | | | | | | | | | |
Rio Tinto Finance (USA) Limited | | | 3.75 | | | | 9-20-2021 | | | | 370,000 | | | | 384,792 | |
Teck Resources Limited | | | 3.00 | | | | 3-1-2019 | | | | 240,000 | | | | 239,993 | |
| | | | |
| | | | | | | | | | | | | | | 624,785 | |
| | | | | | | | | | | | | | | | |
| | | | |
Telecommunication Services: 0.34% | | | | | | | | | | | | | | | | |
| | | | |
| Wireless Telecommunication Services: 0.34% | | | | | | | | | | | | | | | | |
Rogers Communications Incorporated | | | 4.10 | | | | 10-1-2023 | | | | 370,000 | | | | 391,251 | |
| | | | | | | | | | | | | | | | |
| | | | |
Total Yankee Corporate Bonds and Notes (Cost $6,213,795) | | | | | | | | | | | | | | | 6,483,425 | |
| | | | | | | | | | | | | | | | |
| | | | |
Yankee Government Bonds: 0.43% | | | | | | | | | | | | | | | | |
Hashemite Kingdom of Jordan | | | 2.50 | | | | 10-30-2020 | | | | 475,000 | | | | 487,449 | |
| | | | | | | | | | | | | | | | |
| | | | |
Total Yankee Government Bonds (Cost $475,000) | | | | | | | | | | | | | | | 487,449 | |
| | | | | | | | | | | | | | | | |
| | | | |
| | | Yield | | | | | | Shares | | | | |
| Short-Term Investments: 2.21% | | | | | | | | | | | | | | | | |
| | | | |
| Investment Companies: 2.21% | | | | | | | | | | | | | | | | |
Wells Fargo Advantage Cash Investment Money Market Fund, Select Class (l)(u)## | | | 0.08 | | | | | | | | 2,531,162 | | | | 2,531,162 | |
| | | | | | | | | | | | | | | | |
| | | | |
Total Short-Term Investments (Cost $2,531,162) | | | | | | | | | | | | | | | 2,531,162 | |
| | | | | | | | | | | | | | | | |
| | | | | | | | |
| Total investments in securities (Cost $108,794,730) * | | | 99.41 | % | | | 113,579,541 | |
Other assets and liabilities, net | | | 0.59 | | | | 679,284 | |
| | | | | | | | |
| Total net assets | | | 100.00 | % | | $ | 114,258,825 | |
| | | | | | | | |
| ± | Variable rate investment. The rate shown is the rate in effect at period end. |
| 144A | The security may be resold in transactions exempt from registration, normally to qualified institutional buyers, pursuant to Rule 144A under the Securities Act of 1933. |
| ¤ | The security is issued in zero coupon form with no periodic interest payments. |
| %% | The security is issued on a when-issued basis. |
| (l) | The security represents an affiliate of the Portfolio as defined in the Investment Company Act of 1940. |
| (u) | The rate represents the 7-day annualized yield at period end. |
| ## | All or a portion of this security is segregated for when-issued securities. |
| * | Cost for federal income tax purposes is $108,794,730 and unrealized gains (losses) consists of: |
| | | | |
Gross unrealized gains | | $ | 6,272,712 | |
Gross unrealized losses | | | (1,487,901 | ) |
| | | | |
Net unrealized gains | | $ | 4,784,811 | |
The accompanying notes are an integral part of these financial statements.
| | | | |
| 92 | | Wells Fargo Advantage Allocation Funds | | Portfolio of investments—November 30, 2014 (unaudited) |
REAL RETURN PORTFOLIO
| | | | | | | | | | | | | | | | |
| Security name | | Interest rate | | | Maturity date | | | Principal | | | Value | |
| | | | |
U.S. Treasury Securities: 99.58% | | | | | | | | | | | | | | | | |
TIPS | | | 0.13 | % | | | 4-15-2016 | | | $ | 2,081,216 | | | $ | 2,095,849 | |
TIPS | | | 0.13 | | | | 4-15-2017 | | | | 2,378,869 | | | | 2,409,906 | |
TIPS | | | 0.13 | | | | 4-15-2018 | | | | 453,068 | | | | 457,847 | |
TIPS | | | 0.13 | | | | 4-15-2019 | | | | 863,439 | | | | 868,093 | |
TIPS | | | 0.13 | | | | 1-15-2022 | | | | 2,692,224 | | | | 2,663,199 | |
TIPS | | | 0.13 | | | | 7-15-2022 | | | | 2,748,084 | | | | 2,721,892 | |
TIPS | | | 0.13 | | | | 1-15-2023 | | | | 1,448,850 | | | | 1,422,477 | |
TIPS | | | 0.13 | | | | 7-15-2024 | | | | 877,135 | | | | 855,343 | |
TIPS | | | 0.38 | | | | 7-15-2023 | | | | 1,135,308 | | | | 1,139,388 | |
TIPS | | | 0.63 | | | | 7-15-2021 | | | | 2,302,276 | | | | 2,372,783 | |
TIPS | | | 0.63 | | | | 1-15-2024 | | | | 1,025,221 | | | | 1,044,284 | |
TIPS | | | 0.63 | | | | 2-15-2043 | | | | 740,232 | | | | 685,467 | |
TIPS | | | 0.75 | | | | 2-15-2042 | | | | 995,454 | | | | 955,091 | |
TIPS | | | 1.13 | | | | 1-15-2021 | | | | 1,768,163 | | | | 1,870,246 | |
TIPS | | | 1.25 | | | | 7-15-2020 | | | | 1,653,516 | | | | 1,767,454 | |
TIPS | | | 1.38 | | | | 7-15-2018 | | | | 1,335,610 | | | | 1,420,547 | |
TIPS | | | 1.38 | | | | 1-15-2020 | | | | 1,260,313 | | | | 1,346,368 | |
TIPS | | | 1.38 | | | | 2-15-2044 | | | | 801,728 | | | | 895,054 | |
TIPS | | | 1.63 | | | | 1-15-2018 | | | | 613,537 | | | | 651,404 | |
TIPS | | | 1.75 | | | | 1-15-2028 | | | | 886,220 | | | | 1,011,606 | |
TIPS | | | 1.88 | | | | 7-15-2019 | | | | 1,137,076 | | | | 1,242,610 | |
TIPS | | | 2.00 | | | | 1-15-2016 | | | | 947,408 | | | | 972,943 | |
TIPS | | | 2.00 | | | | 1-15-2026 | | | | 995,378 | | | | 1,154,249 | |
TIPS | | | 2.13 | | | | 1-15-2019 | | | | 1,202,874 | | | | 1,314,892 | |
TIPS | | | 2.13 | | | | 2-15-2040 | | | | 390,947 | | | | 501,970 | |
TIPS | | | 2.13 | | | | 2-15-2041 | | | | 592,371 | | | | 766,056 | |
TIPS | | | 2.38 | | | | 1-15-2017 | | | | 944,240 | | | | 1,004,141 | |
TIPS | | | 2.38 | | | | 1-15-2025 | | | | 1,755,223 | | | | 2,086,658 | |
TIPS | | | 2.38 | | | | 1-15-2027 | | | | 849,816 | | | | 1,027,348 | |
TIPS | | | 2.50 | | | | 7-15-2016 | | | | 925,217 | | | | 975,742 | |
TIPS | | | 2.50 | | | | 1-15-2029 | | | | 803,764 | | | | 1,005,019 | |
TIPS | | | 2.63 | | | | 7-15-2017 | | | | 597,199 | | | | 648,754 | |
TIPS | | | 3.38 | | | | 4-15-2032 | | | | 348,657 | | | | 497,463 | |
TIPS | | | 3.63 | | | | 4-15-2028 | | | | 743,183 | | | | 1,030,470 | |
TIPS | | | 3.88 | | | | 4-15-2029 | | | | 680,513 | | | | 981,746 | |
| | | | |
Total U.S. Treasury Securities (Cost $42,000,296) | | | | | | | | | | | | | | | 43,864,359 | |
| | | | | | | | | | | | | | | | |
The accompanying notes are an integral part of these financial statements.
| | | | | | |
| Portfolio of investments—November 30, 2014 (unaudited) | | Wells Fargo Advantage Allocation Funds | | | 93 | |
REAL RETURN PORTFOLIO
| | | | | | | | | | | | | | |
| Security name | | Yield | | | | | Shares | | | Value | |
| | | | |
Short-Term Investments: 0.12% | | | | | | | | | | | | | | |
| | | | |
| Investment Companies: 0.12% | | | | | | | | | | | | | | |
Wells Fargo Advantage Government Money Market Fund, Institutional Class (l)(u) | | | 0.01 | % | | | | | 51,224 | | | $ | 51,224 | |
| | | | | | | | | | | | | | |
| | | | |
Total Short-Term Investments (Cost $51,224) | | | | | | | | | | | | | 51,224 | |
| | | | | | | | | | | | | | |
| | | | | | | | |
| Total investments in securities (Cost $42,051,520) * | | | 99.70 | % | | | 43,915,583 | |
Other assets and liabilities, net | | | 0.30 | | | | 131,758 | |
| | | | | | | | |
| Total net assets | | | 100.00 | % | | $ | 44,047,341 | |
| | | | | | | | |
| (l) | The security represents an affiliate of the Portfolio as defined in the Investment Company Act of 1940. |
| (u) | The rate represents the 7-day annualized yield at period end. |
| * | Cost for federal income tax purposes is $42,051,520 and unrealized gains (losses) consists of: |
| | | | |
Gross unrealized gains | | $ | 2,401,906 | |
Gross unrealized losses | | | (537,843 | ) |
| | | | |
Net unrealized gains | | $ | 1,864,063 | |
The accompanying notes are an integral part of these financial statements.
| | | | |
| 94 | | Wells Fargo Advantage Allocation Funds | | Portfolio of investments—November 30, 2014 (unaudited) |
STABLE INCOME PORTFOLIO
| | | | | | | | | | | | | | | | |
| Security name | | Interest rate | | | Maturity date | | | Principal | | | Value | |
| | | | |
Agency Securities: 35.29% | | | | | | | | | | | | | | | | |
FHLMC | | | 6.00 | % | | | 7-1-2017 | | | $ | 24,828 | | | $ | 25,779 | |
FHLMC | | | 7.50 | | | | 7-1-2017 | | | | 25,705 | | | | 26,550 | |
FHLMC Series T-54 Class 4A ± | | | 3.03 | | | | 2-25-2043 | | | | 511,839 | | | | 542,918 | |
FHLMC Series T-57 Class 1A2 | | | 7.00 | | | | 7-25-2043 | | | | 604,102 | | | | 702,538 | |
FHLMC Series T-63 Class 1A1 ± | | | 1.31 | | | | 2-25-2045 | | | | 439,402 | | | | 452,894 | |
FHLMC Structured Pass-Through Securities Series T-54 Class 3A | | | 7.00 | | | | 2-25-2043 | | | | 451,408 | | | | 552,758 | |
FHLMC Structured Pass-Through Securities Series T-55 Class 1A2 | | | 7.00 | | | | 3-25-2043 | | | | 673,248 | | | | 753,438 | |
FHLMC Structured Pass-Through Securities Series T-58 Class 4A | | | 7.50 | | | | 9-25-2043 | | | | 742,372 | | | | 884,473 | |
FNMA ± | | | 1.32 | | | | 10-1-2034 | | | | 310,528 | | | | 317,929 | |
FNMA ± | | | 1.32 | | | | 4-1-2044 | | | | 225,801 | | | | 230,649 | |
FNMA ± | | | 1.32 | | | | 10-1-2044 | | | | 268,429 | | | | 274,864 | |
FNMA ± | | | 1.36 | | | | 4-1-2037 | | | | 271,511 | | | | 284,359 | |
FNMA ± | | | 1.75 | | | | 9-1-2033 | | | | 194,295 | | | | 202,044 | |
FNMA ± | | | 1.78 | | | | 10-1-2033 | | | | 451,723 | | | | 474,237 | |
FNMA ± | | | 1.92 | | | | 4-1-2034 | | | | 393,035 | | | | 415,382 | |
FNMA ± | | | 1.93 | | | | 6-1-2033 | | | | 364,141 | | | | 389,973 | |
FNMA ± | | | 1.95 | | | | 8-1-2035 | | | | 323,810 | | | | 341,744 | |
FNMA ± | | | 2.01 | | | | 12-1-2033 | | | | 290,081 | | | | 309,497 | |
FNMA ± | | | 2.03 | | | | 1-1-2036 | | | | 199,988 | | | | 212,620 | |
FNMA ± | | | 2.04 | | | | 6-1-2033 | | | | 274,651 | | | | 286,296 | |
FNMA ± | | | 2.08 | | | | 7-1-2035 | | | | 230,352 | | | | 246,887 | |
FNMA ± | | | 2.20 | | | | 7-1-2017 | | | | 7,941 | | | | 7,990 | |
FNMA | | | 5.50 | | | | 2-1-2017 | | | | 66,206 | | | | 70,250 | |
FNMA | | | 6.50 | | | | 12-1-2015 | | | | 74 | | | | 74 | |
FNMA Series 2003-W4 Class 3A ± | | | 6.59 | | | | 10-25-2042 | | | | 319,695 | | | | 365,341 | |
FNMA Series 2004-W2 Class 2A2 | | | 7.00 | | | | 2-25-2044 | | | | 238,347 | | | | 276,261 | |
FNMA Series 2007-88 Class HC ± | | | 2.31 | | | | 9-25-2037 | | | | 304,817 | | | | 316,268 | |
| | | | |
Total Agency Securities (Cost $8,376,288) | | | | | | | | | | | | | | | 8,964,013 | |
| | | | | | | | | | | | | | | | |
| | | | |
Asset-Backed Securities: 20.72% | | | | | | | | | | | | | | | | |
Ally Auto Receivables Trust Series 2013-2 Class A3 | | | 0.79 | | | | 1-15-2018 | | | | 115,000 | | | | 115,125 | |
Ally Auto Receivables Trust Series 2014-SN1 Class A3 | | | 0.75 | | | | 2-21-2017 | | | | 110,000 | | | | 109,948 | |
Ally Auto Receivables Trust Series 2014-SN2 Class A2B ± | | | 0.46 | | | | 3-20-2017 | | | | 125,000 | | | | 125,003 | |
American Express Credit Account Master Trust Series 2014-4 Class A | | | 1.43 | | | | 6-15-2020 | | | | 130,000 | | | | 130,401 | |
AmeriCredit Automobile Receivables Trust Series 2013-5 Class A3 | | | 0.90 | | | | 9-10-2018 | | | | 116,000 | | | | 116,134 | |
AmeriCredit Automobile Receivables Trust Series 2014-1 Class A3 | | | 0.90 | | | | 2-8-2019 | | | | 110,000 | | | | 109,930 | |
AmeriCredit Automobile Receivables Trust Series 2014-4 Class A3 | | | 1.27 | | | | 7-8-2019 | | | | 125,000 | | | | 125,153 | |
Bank of The West Auto Trust Series 2014-1 Class A3 144A | | | 1.09 | | | | 3-15-2019 | | | | 125,000 | | | | 125,210 | |
BMW Vehicle Lease Trust Series 2014-1 Class A3 | | | 0.73 | | | | 2-21-2017 | | | | 110,000 | | | | 110,025 | |
Capital Auto Receivables Asset Trust Series 2014-1 Class A1A | | | 0.68 | | | | 5-20-2016 | | | | 110,000 | | | | 110,083 | |
Capital One Multi-Asset Execution Trust Series 2014-A2 Class A2 | | | 1.26 | | | | 1-15-2020 | | | | 100,000 | | | | 100,394 | |
CarMax Auto Owner Trust Series 2014-1 Class A3 | | | 0.79 | | | | 10-15-2018 | | | | 110,000 | | | | 109,892 | |
Chase Issuance Trust Series 2014-A6 Class A6 | | | 1.26 | | | | 7-15-2019 | | | | 120,000 | | | | 120,138 | |
Chrysler Capital Auto Receivables Trust Series 2014-AA Class A3 144A | | | 0.83 | | | | 9-17-2018 | | | | 100,000 | | | | 100,047 | |
CNH Equipment Trust Series 2014-A Class A3 | | | 0.84 | | | | 5-15-2019 | | | | 100,000 | | | | 99,926 | |
College Loan Corporation Trust Series 2004-1 Class A4 ± | | | 0.42 | | | | 4-25-2024 | | | | 110,000 | | | | 109,323 | |
Fifth Third Auto Trust Series 2014-1 Class A3 | | | 0.68 | | | | 4-16-2018 | | | | 100,000 | | | | 99,983 | |
Fifth Third Auto Trust Series 2014-2 Class A3 | | | 0.89 | | | | 11-15-2018 | | | | 130,000 | | | | 130,064 | |
Ford Credit Auto Lease Trust Series 2014-A Class A3 | | | 0.68 | | | | 4-15-2017 | | | | 100,000 | | | | 99,999 | |
Ford Credit Auto Owner Trust Series 2013-B Class A3 | | | 0.76 | | | | 9-15-2016 | | | | 114,000 | | | | 114,123 | |
The accompanying notes are an integral part of these financial statements.
| | | | | | |
| Portfolio of investments—November 30, 2014 (unaudited) | | Wells Fargo Advantage Allocation Funds | | | 95 | |
STABLE INCOME PORTFOLIO
| | | | | | | | | | | | | | | | |
| Security name | | Interest rate | | | Maturity date | | | Principal | | | Value | |
| | | | |
Asset-Backed Securities (continued) | | | | | | | | | | | | | | | | |
Ford Credit Auto Owner Trust Series 2014-A Class A3 | | | 0.79 | % | | | 5-15-2018 | | | $ | 220,000 | | | $ | 220,309 | |
Ford Credit Auto Owner Trust Series 2014-B A3 | | | 0.90 | | | | 10-15-2018 | | | | 120,000 | | | | 120,184 | |
Ford Credit Auto Owner Trust Series 2014-C Class A3 | | | 1.06 | | | | 5-15-2019 | | | | 250,000 | | | | 250,190 | |
GE Equipment LLC Series 2013-2 Class A2 | | | 0.61 | | | | 6-24-2016 | | | | 70,492 | | | | 70,549 | |
GE Equipment LLC Series 2013-2 Class A3 | | | 0.92 | | | | 9-25-2017 | | | | 120,000 | | | | 120,413 | |
GE Equipment Small Ticket LLC Series 2014-1A Class A3 144A | | | 0.95 | | | | 9-25-2017 | | | | 110,000 | | | | 110,298 | |
GM Financial Automobile Lease Series 2014-1A Class A3 144A | | | 1.01 | | | | 5-22-2017 | | | | 120,000 | | | | 120,402 | |
GSAMP Trust Series 2005-SEA2 Class A1 144A± | | | 0.50 | | | | 1-25-2045 | | | | 264,185 | | | | 258,451 | |
Honda Auto Receivables Owner Trust Series 2013-4 Class A3 | | | 0.69 | | | | 9-18-2017 | | | | 110,000 | | | | 110,102 | |
Honda Auto Receivables Owner Trust Series 2014-1 Class A3 | | | 0.67 | | | | 11-21-2017 | | | | 100,000 | | | | 99,921 | |
Honda Auto Receivables Owner Trust Series 2014-4 Class A3 | | | 0.99 | | | | 9-17-2018 | | | | 100,000 | | | | 99,982 | |
Household Home Equity Loan Trust Series 2006-1 Class A1 ± | | | 0.32 | | | | 1-20-2036 | | | | 418,395 | | | | 415,900 | |
Hyundai Auto Receivables Trust Series 2013-C Class A3 | | | 1.01 | | | | 2-15-2018 | | | | 125,000 | | | | 125,551 | |
Hyundai Auto Receivables Trust Series 2014-A Class A3 | | | 0.79 | | | | 7-16-2018 | | | | 100,000 | | | | 100,057 | |
M&T Bank Auto Receivables Trust Series 2013-1A Class A3 144A | | | 1.06 | | | | 11-15-2017 | | | | 130,000 | | | | 130,638 | |
Mercedes-Benz Auto Lease Trust Series 2014-A Class A3 | | | 0.68 | | | | 12-15-2016 | | | | 115,000 | | | | 115,086 | |
Nissan Auto Receivables Owner Trust Series 2014-A Class A3 | | | 0.72 | | | | 8-15-2018 | | | | 100,000 | | | | 99,956 | |
Toyota Auto Receivables Owner Trust Series 2013-B Class A3 | | | 0.89 | | | | 7-17-2017 | | | | 125,000 | | | | 125,264 | |
Toyota Auto Receivables Owner Trust Series 2014-A Class A3 | | | 0.67 | | | | 12-15-2017 | | | | 100,000 | | | | 100,048 | |
Toyota Auto Receivables Owner Trust Series 2014-B Class A3 | | | 0.76 | | | | 3-15-2018 | | | | 110,000 | | | | 110,061 | |
Volkswagen Auto Lease Trust Series 2014-A Class A3 | | | 0.80 | | | | 4-20-2017 | | | | 100,000 | | | | 100,104 | |
| | | | |
Total Asset-Backed Securities (Cost $5,266,829) | | | | | | | | | | | | | | | 5,264,367 | |
| | | | | | | | | | | | | | | | |
| | | | |
Corporate Bonds and Notes: 23.15% | | | | | | | | | | | | | | | | |
| | | | |
Consumer Discretionary: 2.47% | | | | | | | | | | | | | | | | |
| | | | |
| Automobiles: 0.96% | | | | | | | | | | | | | | | | |
BMW Bank North America | | | 0.70 | | | | 7-18-2016 | | | | 245,000 | | | | 244,191 | |
| | | | | | | | | | | | | | | | |
| | | | |
| Diversified Consumer Services: 0.41% | | | | | | | | | | | | | | | | |
Stanford University | | | 4.25 | | | | 5-1-2016 | | | | 100,000 | | | | 104,854 | |
| | | | | | | | | | | | | | | | |
| | | | |
| Specialty Retail: 1.10% | | | | | | | | | | | | | | | | |
Home Depot Incorporated | | | 5.40 | | | | 3-1-2016 | | | | 110,000 | | | | 116,567 | |
Lowe’s Companies Incorporated | | | 1.63 | | | | 4-15-2017 | | | | 160,000 | | | | 161,660 | |
| | | | |
| | | | | | | | | | | | | | | 278,227 | |
| | | | | | | | | | | | | | | | |
| | | | |
Consumer Staples: 3.73% | | | | | | | | | | | | | | | | |
| | | | |
| Beverages: 1.19% | | | | | | | | | | | | | | | | |
Anheuser-Busch Companies Incorporated | | | 5.00 | | | | 1-15-2015 | | | | 80,000 | | | | 80,340 | |
Brown-Forman Corporation | | | 2.50 | | | | 1-15-2016 | | | | 120,000 | | | | 122,462 | |
Coca-Cola Company | | | 0.75 | | | | 3-13-2015 | | | | 100,000 | | | | 100,149 | |
| | | | |
| | | | | | | | | | | | | | | 302,951 | |
| | | | | | | | | | | | | | | | |
| | | | |
| Food & Staples Retailing: 0.32% | | | | | | | | | | | | | | | | |
CVS Health Corporation | | | 3.25 | | | | 5-18-2015 | | | | 80,000 | | | | 81,023 | |
| | | | | | | | | | | | | | | | |
The accompanying notes are an integral part of these financial statements.
| | | | |
| 96 | | Wells Fargo Advantage Allocation Funds | | Portfolio of investments—November 30, 2014 (unaudited) |
STABLE INCOME PORTFOLIO
| | | | | | | | | | | | | | | | |
| Security name | | Interest rate | | | Maturity date | | | Principal | | | Value | |
| | | | |
| Food Products: 1.75% | | | | | | | | | | | | | | | | |
General Mills Incorporated | | | 5.20 | % | | | 3-17-2015 | | | $ | 150,000 | | | $ | 152,039 | |
Ingredion Incorporated | | | 3.20 | | | | 11-1-2015 | | | | 91,000 | | | | 92,825 | |
Kellogg Company | | | 4.45 | | | | 5-30-2016 | | | | 94,000 | | | | 98,900 | |
Kraft Foods Group Incorporated | | | 1.63 | | | | 6-4-2015 | | | | 100,000 | | | | 100,505 | |
| | | | |
| | | | | | | | | | | | | | | 444,269 | |
| | | | | | | | | | | | | | | | |
| | | | |
| Household Products: 0.47% | | | | | | | | | | | | | | | | |
Procter & Gamble Company | | | 4.85 | | | | 12-15-2015 | | | | 115,000 | | | | 120,144 | |
| | | | | | | | | | | | | | | | |
| | | | |
Energy: 0.83% | | | | | | | | | | | | | | | | |
| | | | |
| Oil, Gas & Consumable Fuels: 0.83% | | | | | | | | | | | | | | | | |
Duke Energy Carolinas LLC | | | 5.30 | | | | 10-1-2015 | | | | 125,000 | | | | 129,920 | |
Phillips 66 | | | 1.95 | | | | 3-5-2015 | | | | 80,000 | | | | 80,299 | |
| | | | |
| | | | | | | | | | | | | | | 210,219 | |
| | | | | | | | | | | | | | | | |
| | | | |
Financials: 8.77% | | | | | | | | | | | | | | | | |
| | | | |
| Banks: 3.43% | | | | | | | | | | | | | | | | |
Ally Bank | | | 0.90 | | | | 9-18-2015 | | | | 74,000 | | | | 74,192 | |
Bank of America Corporation | | | 1.25 | | | | 1-11-2016 | | | | 70,000 | | | | 70,278 | |
Bank of America Corporation | | | 4.50 | | | | 4-1-2015 | | | | 80,000 | | | | 81,045 | |
Branch Banking & Trust Company ± | | | 0.55 | | | | 9-13-2016 | | | | 250,000 | | | | 249,476 | |
Citigroup Incorporated | | | 4.59 | | | | 12-15-2015 | | | | 90,000 | | | | 93,350 | |
Citigroup Incorporated | | | 4.75 | | | | 5-19-2015 | | | | 40,000 | | | | 40,766 | |
HSBC USA Incorporated | | | 2.38 | | | | 2-13-2015 | | | | 100,000 | | | | 100,396 | |
KeyBank NA | | | 4.95 | | | | 9-15-2015 | | | | 157,000 | | | | 162,293 | |
| | | | |
| | | | | | | | | | | | | | | 871,796 | |
| | | | | | | | | | | | | | | | |
| | | | |
| Capital Markets: 1.36% | | | | | | | | | | | | | | | | |
Bank of New York Mellon Corporation | | | 2.50 | | | | 1-15-2016 | | | | 115,000 | | | | 117,554 | |
Goldman Sachs Group Incorporated | | | 5.35 | | | | 1-15-2016 | | | | 90,000 | | | | 94,446 | |
Morgan Stanley | | | 3.45 | | | | 11-2-2015 | | | | 92,000 | | | | 94,213 | |
State Street Corporation | | | 2.88 | | | | 3-7-2016 | | | | 37,000 | | | | 38,059 | |
| | | | |
| | | | | | | | | | | | | | | 344,272 | |
| | | | | | | | | | | | | | | | |
| | | | |
| Consumer Finance: 2.17% | | | | | | | | | | | | | | | | |
American Express Credit Corporation | | | 2.75 | | | | 9-15-2015 | | | | 77,000 | | | | 78,369 | |
American Honda Finance Corporation | | | 1.13 | | | | 10-7-2016 | | | | 50,000 | | | | 50,414 | |
Discover Bank | | | 0.85 | | | | 9-25-2015 | | | | 125,000 | | | | 125,270 | |
Sallie Mae Bank | | | 0.85 | | | | 10-30-2015 | | | | 175,000 | | | | 175,361 | |
Toyota Motor Credit Corporation | | | 2.05 | | | | 1-12-2017 | | | | 120,000 | | | | 122,949 | |
| | | | |
| | | | | | | | | | | | | | | 552,363 | |
| | | | | | | | | | | | | | | | |
| | | | |
| Diversified Financial Services: 0.20% | | | | | | | | | | | | | | | | |
General Electric Capital Corporation ± | | | 0.88 | | | | 7-12-2016 | | | | 50,000 | | | | 50,403 | |
| | | | | | | | | | | | | | | | |
| | | | |
| Insurance: 0.41% | | | | | | | | | | | | | | | | |
MetLife Global Funding 144A | | | 3.13 | | | | 1-11-2016 | | | | 100,000 | | | | 102,932 | |
| | | | | | | | | | | | | | | | |
The accompanying notes are an integral part of these financial statements.
| | | | | | |
| Portfolio of investments—November 30, 2014 (unaudited) | | Wells Fargo Advantage Allocation Funds | | | 97 | |
STABLE INCOME PORTFOLIO
| | | | | | | | | | | | | | | | |
| Security name | | Interest rate | | | Maturity date | | | Principal | | | Value | |
| | | | |
| REITs: 1.20% | | | | | | | | | | | | | | | | |
AvalonBay Communities Incorporated | | | 5.70 | % | | | 3-15-2017 | | | $ | 80,000 | | | $ | 88,039 | |
Boston Properties LP | | | 5.00 | | | | 6-1-2015 | | | | 70,000 | | | | 71,523 | |
Boston Properties LP | | | 5.63 | | | | 4-15-2015 | | | | 45,000 | | | | 45,851 | |
Vornado Realty Trust | | | 4.25 | | | | 4-1-2015 | | | | 100,000 | | | | 100,276 | |
| | | | |
| | | | | | | | | | | | | | | 305,689 | |
| | | | | | | | | | | | | | | | |
| | | | |
Health Care: 1.06% | | | | | | | | | | | | | | | | |
| | | | |
| Life Sciences Tools & Services: 0.70% | | | | | | | | | | | | | | | | |
Thermo Fisher Scientific Incorporated | | | 5.00 | | | | 6-1-2015 | | | | 175,000 | | | | 178,690 | |
| | | | | | | | | | | | | | | | |
| | | | |
| Pharmaceuticals: 0.36% | | | | | | | | | | | | | | | | |
AbbVie Incorporated | | | 1.20 | | | | 11-6-2015 | | | | 90,000 | | | | 90,326 | |
| | | | | | | | | | | | | | | | |
| | | | |
Industrials: 2.44% | | | | | | | | | | | | | | | | |
| | | | |
| Aerospace & Defense: 0.43% | | | | | | | | | | | | | | | | |
United Technologies Corporation | | | 4.88 | | | | 5-1-2015 | | | | 108,000 | | | | 110,027 | |
| | | | | | | | | | | | | | | | |
| | | | |
| Commercial Services & Supplies: 0.81% | | | | | | | | | | | | | | | | |
Cintas Corporation No. 2 | | | 2.85 | | | | 6-1-2016 | | | | 80,000 | | | | 82,307 | |
Cooper US Incorporated | | | 2.38 | | | | 1-15-2016 | | | | 120,000 | | | | 122,079 | |
| | | | |
| | | | | | | | | | | | | | | 204,386 | |
| | | | | | | | | | | | | | | | |
| | | | |
| Electrical Equipment: 0.12% | | | | | | | | | | | | | | | | |
ABB Treasury Center USA Incorporated 144A | | | 2.50 | | | | 6-15-2016 | | | | 30,000 | | | | 30,752 | |
| | | | | | | | | | | | | | | | |
| | | | |
| Industrial Conglomerates: 0.24% | | | | | | | | | | | | | | | | |
General Electric Company | | | 0.85 | | | | 10-9-2015 | | | | 60,000 | | | | 60,263 | |
| | | | | | | | | | | | | | | | |
| | | | |
| Machinery: 0.40% | | | | | | | | | | | | | | | | |
Caterpillar Incorporated | | | 4.63 | | | | 6-1-2015 | | | | 100,000 | | | | 102,114 | |
| | | | | | | | | | | | | | | | |
| | | | |
| Road & Rail: 0.44% | | | | | | | | | | | | | | | | |
Norfolk Southern Corporation | | | 5.75 | | | | 1-15-2016 | | | | 106,000 | | | | 111,850 | |
| | | | | | | | | | | | | | | | |
| | | | |
Information Technology: 0.35% | | | | | | | | | | | | | | | | |
| | | | |
| Software: 0.35% | | | | | | | | | | | | | | | | |
Oracle Corporation ± | | | 0.43 | | | | 7-7-2017 | | | | 90,000 | | | | 90,046 | |
| | | | | | | | | | | | | | | | |
| | | | |
Materials: 1.21% | | | | | | | | | | | | | | | | |
| | | | |
| Chemicals: 1.21% | | | | | | | | | | | | | | | | |
Ecolab Incorporated | | | 2.38 | | | | 12-8-2014 | | | | 65,000 | | | | 65,020 | |
Ecolab Incorporated | | | 4.88 | | | | 2-15-2015 | | | | 125,000 | | | | 126,076 | |
Sherwin-Williams Company | | | 3.13 | | | | 12-15-2014 | | | | 115,000 | | | | 115,111 | |
| | | | |
| | | | | | | | | | | | | | | 306,207 | |
| | | | | | | | | | | | | | | | |
The accompanying notes are an integral part of these financial statements.
| | | | |
| 98 | | Wells Fargo Advantage Allocation Funds | | Portfolio of investments—November 30, 2014 (unaudited) |
STABLE INCOME PORTFOLIO
| | | | | | | | | | | | | | | | |
| Security name | | Interest rate | | | Maturity date | | | Principal | | | Value | |
| | | | |
Utilities: 2.29% | | | | | | | | | | | | | | | | |
| | | | |
| Electric Utilities: 1.30% | | | | | | | | | | | | | | | | |
Kentucky Utilities Company | | | 1.63 | % | | | 11-1-2015 | | | $ | 110,000 | | | $ | 111,030 | |
Sierra Pacific Power Company | | | 6.00 | | | | 5-15-2016 | | | | 120,000 | | | | 128,972 | |
Southern California Edison Company | | | 1.13 | | | | 5-1-2017 | | | | 90,000 | | | | 89,993 | |
| | | | |
| | | | | | | | | | | | | | | 329,995 | |
| | | | | | | | | | | | | | | | |
| | | | |
| Gas Utilities: 0.58% | | | | | | | | | | | | | | | | |
Questar Corporation | | | 2.75 | | | | 2-1-2016 | | | | 144,000 | | | | 147,504 | |
| | | | | | | | | | | | | | | | |
| | | | |
| Multi-Utilities: 0.41% | | | | | | | | | | | | | | | | |
San Diego Gas & Electric Company | | | 5.30 | | | | 11-15-2015 | | | | 100,000 | | | | 104,306 | |
| | | | | | | | | | | | | | | | |
| | | | |
Total Corporate Bonds and Notes (Cost $5,868,947) | | | | | | | | | | | | | | | 5,879,799 | |
| | | | | | | | | | | | | | | | |
| | | | |
Municipal Obligations: 1.43% | | | | | | | | | | | | | | | | |
| | | | |
| Arizona: 0.28% | | | | | | | | | | | | | | | | |
Arizona School Facilities Board Certificate of Participation Series A-3 (Miscellaneous Revenue) | | | 0.95 | | | | 9-1-2016 | | | | 70,000 | | | | 70,212 | |
| | | | | | | | | | | | | | | | |
| | | | |
| Colorado: 0.40% | | | | | | | | | | | | | | | | |
Colorado Build America Bonds Building Excellent Schools Series E (Miscellaneous Revenue) | | | 3.73 | | | | 3-15-2015 | | | | 100,000 | | | | 101,051 | |
| | | | | | | | | | | | | | | | |
| | | | |
| Maine: 0.75% | | | | | | | | | | | | | | | | |
Lewiston ME Series C (GO) | | | 3.00 | | | | 4-1-2015 | | | | 190,000 | | | | 191,843 | |
| | | | | | | | | | | | | | | | |
| | | | |
Total Municipal Obligations (Cost $362,045) | | | | | | | | | | | | | | | 363,106 | |
| | | | | | | | | | | | | | | | |
| | | | |
Non-Agency Mortgage Backed Securities: 4.48% | | | | | | | | | | | | | | | | |
Bear Stearns Commercial Mortgage Securities Incorporated Series 2005-PWR8 Class A4 | | | 4.67 | | | | 6-11-2041 | | | | 99,410 | | | | 100,176 | |
Bear Stearns Commercial Mortgage Securities Trust Series 2007-PW17 Class A1A ± | | | 5.65 | | | | 6-11-2050 | | | | 87,852 | | | | 96,365 | |
CIT Education Loan Trust Series 2005-1 Class A3 ± | | | 0.35 | | | | 3-15-2026 | | | | 112,539 | | | | 111,562 | |
CNH Equipment Trust Series 2014-B Class A3 | | | 0.91 | | | | 5-15-2019 | | | | 125,000 | | | | 125,042 | |
GE Equipment Transportation LLC Series 2014-1 Class A3 | | | 0.97 | | | | 4-23-2018 | | | | 120,000 | | | | 120,177 | |
John Deere Owner Trust Series 2014-A Class A3 | | | 0.92 | | | | 4-16-2018 | | | | 110,000 | | | | 110,165 | |
JP Morgan Chase Commercial Mortgage Securities Trust Series 2007-LDPX Class A1A | | | 5.44 | | | | 1-15-2049 | | | | 106,290 | | | | 114,708 | |
SLMA Series 2012-7 Class A1 ± | | | 0.32 | | | | 2-27-2017 | | | | 19,860 | | | | 19,847 | |
SLMA Series 2014-1 Class A1 ± | | | 0.44 | | | | 5-28-2019 | | | | 74,390 | | | | 74,361 | |
Structured Asset Securities Corporation Series 2006-RF3 Class 1A1 144A | | | 6.00 | | | | 10-25-2036 | | | | 165,302 | | | | 165,766 | |
Volvo Financial Equipment LLC Series 2014-1A Class A3 144A | | | 0.82 | | | | 4-16-2018 | | | | 100,000 | | | | 100,020 | |
| | | | |
Total Non-Agency Mortgage Backed Securities (Cost $1,142,042) | | | | | | | | | | | | | | | 1,138,189 | |
| | | | | | | | | | | | | | | | |
| | | | |
Yankee Corporate Bonds and Notes: 5.61% | | | | | | | | | | | | | | | | |
| | | | |
Consumer Staples: 0.43% | | | | | | | | | | | | | | | | |
| | | | |
| Beverages: 0.43% | | | | | | | | | | | | | | | | |
SABMiller plc 144A | | | 6.50 | | | | 7-1-2016 | | | | 100,000 | | | | 109,479 | |
| | | | | | | | | | | | | | | | |
The accompanying notes are an integral part of these financial statements.
| | | | | | |
| Portfolio of investments—November 30, 2014 (unaudited) | | Wells Fargo Advantage Allocation Funds | | | 99 | |
STABLE INCOME PORTFOLIO
| | | | | | | | | | | | | | | | |
| Security name | | Interest rate | | | Maturity date | | | Principal | | | Value | |
| | | | |
Energy: 1.69% | | | | | | | | | | | | | | | | |
| | | | |
| Oil, Gas & Consumable Fuels: 1.69% | | | | | | | | | | | | | | | | |
BP Capital Markets plc ± | | | 0.56 | % | | | 11-6-2015 | | | $ | 100,000 | | | $ | 100,149 | |
Schlumberger SA 144A | | | 2.65 | | | | 1-15-2016 | | | | 100,000 | | | | 102,274 | |
Shell International | | | 3.10 | | | | 6-28-2015 | | | | 73,000 | | | | 74,149 | |
Total Capital SA | | | 2.30 | | | | 3-15-2016 | | | | 150,000 | | | | 153,297 | |
| | | | |
| | | | | | | | | | | | | | | 429,869 | |
| | | | | | | | | | | | | | | | |
| | | | |
Financials: 1.97% | | | | | | | | | | | | | | | | |
| | | | |
| Banks: 1.14% | | | | | | | | | | | | | | | | |
Barclays Bank plc | | | 2.75 | | | | 2-23-2015 | | | | 110,000 | | | | 110,540 | |
BNP Paribas | | | 3.60 | | | | 2-23-2016 | | | | 75,000 | | | | 77,503 | |
Royal Bank of Canada | | | 0.80 | | | | 10-30-2015 | | | | 100,000 | | | | 100,362 | |
| | | | |
| | | | | | | | | | | | | | | 288,405 | |
| | | | | | | | | | | | | | | | |
| | | | |
| Diversified Financial Services: 0.83% | | | | | | | | | | | | | | | | |
ConocoPhillips Canada Funding Company | | | 5.63 | | | | 10-15-2016 | | | | 100,000 | | | | 109,111 | |
Deutsche Bank AG (London) | | | 3.25 | | | | 1-11-2016 | | | | 100,000 | | | | 102,710 | |
| | | | |
| | | | | | | | | | | | | | | 211,821 | |
| | | | | | | | | | | | | | | | |
| | | | |
Health Care: 0.32% | | | | | | | | | | | | | | | | |
| | | | |
| Health Care Equipment & Supplies: 0.32% | | | | | | | | | | | | | | | | |
Covidien International Finance SA | | | 1.35 | | | | 5-29-2015 | | | | 80,000 | | | | 80,306 | |
| | | | | | | | | | | | | | | | |
| | | | |
Industrials: 0.67% | | | | | | | | | | | | | | | | |
| | | | |
| Machinery: 0.31% | | | | | | | | | | | | | | | | |
Pentair Finance SA | | | 1.35 | | | | 12-1-2015 | | | | 80,000 | | | | 80,298 | |
| | | | | | | | | | | | | | | | |
| | | | |
| Road & Rail: 0.36% | | | | | | | | | | | | | | | | |
Canadian National Railway Company | | | 1.45 | | | | 12-15-2016 | | | | 90,000 | | | | 90,953 | |
| | | | | | | | | | | | | | | | |
| | | | |
Materials: 0.53% | | | | | | | | | | | | | | | | |
| | | | |
| Metals & Mining: 0.53% | | | | | | | | | | | | | | | | |
Rio Tinto Finance USA Limited | | | 1.88 | | | | 11-2-2015 | | | | 132,000 | | | | 133,365 | |
| | | | | | | | | | | | | | | | |
| | | | |
Total Yankee Corporate Bonds and Notes (Cost $1,421,701) | | | | | | | | | | | | | | | 1,424,496 | |
| | | | | | | | | | | | | | | | |
The accompanying notes are an integral part of these financial statements.
| | | | |
| 100 | | Wells Fargo Advantage Allocation Funds | | Portfolio of investments—November 30, 2014 (unaudited) |
STABLE INCOME PORTFOLIO
| | | | | | | | | | | | | | |
| Security name | | Yield | | | | | Shares | | | Value | |
| | | | |
Short-Term Investments: 9.76% | | | | | | | | | | | | | | |
| | | | |
| Investment Companies: 9.76% | | | | | | | | | | | | | | |
Wells Fargo Advantage Cash Investment Money Market Fund, Select Class (l)(u) | | | 0.08 | % | | | | | 2,480,589 | | | | 2,480,589 | |
| | | | | | | | | | | | | | |
| | | | |
Total Short-Term Investments (Cost $2,480,589) | | | | | | | | | | | | | 2,480,589 | |
| | | | | | | | | | | | | | |
| | | | | | | | |
| Total investments in securities (Cost $24,918,441) * | | | 100.44 | % | | | 25,514,559 | |
Other assets and liabilities, net | | | (0.44 | ) | | | (110,643 | ) |
| | | | | | | | |
| Total net assets | | | 100.00 | % | | $ | 25,403,916 | |
| | | | | | | | |
| ± | Variable rate investment. The rate shown is the rate in effect at period end. |
| 144A | The security may be resold in transactions exempt from registration, normally to qualified institutional buyers, pursuant to Rule 144A under the Securities Act of 1933. |
| (l) | The security represents an affiliate of the Portfolio as defined in the Investment Company Act of 1940. |
| (u) | The rate represents the 7-day annualized yield at period end. |
| * | Cost for federal income tax purposes is $24,918,930 and unrealized gains (losses) consists of: |
| | | | |
Gross unrealized gains | | $ | 613,252 | |
Gross unrealized losses | | | (17,623 | ) |
| | | | |
Net unrealized gains | | $ | 595,629 | |
The accompanying notes are an integral part of these financial statements.
This page is intentionally left blank.
| | | | |
| 102 | | Wells Fargo Advantage Allocation Funds | | Statements of assets and liabilities—November 30, 2014 (unaudited) |
| | | | | | | | |
| | | C&B Large Cap
Value Portfolio | | | Diversified Large
Cap Growth
Portfolio | |
| | |
Assets | | | | | | | | |
Investments | | | | | | | | |
In unffiliated securities (including securities on loan), at value (see cost below) | | $ | 310,964,050 | | | $ | 133,173,819 | |
In affiliated securities, at value (see cost below) | | | 24,831,887 | | | | 3,251,523 | |
| | | | |
Total investments, at value (see cost below) | | | 335,795,937 | | | | 136,425,342 | |
Cash | | | 21,207 | | | | 0 | |
Foreign currency, at value (see cost below) | | | 0 | | �� | | 0 | |
Receivable for investments sold | | | 1,943,425 | | | | 340,761 | |
Receivable for dividends | | | 604,712 | | | | 114,298 | |
Receivable for securities lending income | | | 1,086 | | | | 532 | |
Prepaid expenses and other assets | | | 2,561 | | | | 2,947 | |
| | | | |
Total assets | | | 338,368,928 | | | | 136,883,880 | |
| | | | |
| | |
Liabilities | | | | | | | | |
Payable for investments purchased | | | 0 | | | | 655,678 | |
Payable upon receipt of securities loaned | | | 0 | | | | 1,815,925 | |
Payable for daily variation margin on open futures contracts | | | 0 | | | | 0 | |
Advisory fee payable | | | 178,278 | | | | 60,737 | |
Professional fees payable | | | 16,958 | | | | 17,739 | |
Accrued expenses and other liabilities | | | 8,716 | | | | 7,928 | |
| | | | |
Total liabilities | | | 203,952 | | | | 2,558,007 | |
| | | | |
Total net assets | | $ | 338,164,976 | | | $ | 134,325,873 | |
| | | | |
| | |
Investments in unaffiliated securities, at cost | | $ | 215,386,586 | | | $ | 87,975,922 | |
| | | | |
Investments in affiliated securities, at cost | | $ | 24,831,887 | | | $ | 3,251,523 | |
| | | | |
Total investments, at cost | | $ | 240,218,473 | | | $ | 91,227,445 | |
| | | | |
Securities on loan, at value | | $ | 0 | | | $ | 1,778,336 | |
| | | | |
Foreign currency, at cost | | $ | 0 | | | $ | 0 | |
| | | | |
The accompanying notes are an integral part of these financial statements.
| | | | | | |
| Statements of assets and liabilities—November 30, 2014 (unaudited) | | Wells Fargo Advantage Allocation Funds | | | 103 | |
| | | | | | | | | | | | | | | | | | | | | | | | | | |
Emerging Growth
Portfolio | | | Index Portfolio | | | International
Growth Portfolio | | | International Value
Portfolio | | | Large Company
Value Portfolio | | | Small Company
Growth Portfolio | | | Small Company
Value Portfolio | |
| | | | | | |
| | | | | | | | | | | | | | | | | | | | | | | | | | |
| | | | | | | | | | | | | | | | | | | | | | | | | | |
| $ | 1,114,960,030 | | | $ | 2,810,788,830 | | | $ | 155,769,579 | | | $ | 477,975,923 | | | $ | 87,737,524 | | | $ | 450,161,995 | | | $ | 196,319,410 | |
| | 136,874,464 | | | | 90,992,556 | | | | 3,267,843 | | | | 20,812,181 | | | | 2,138,692 | | | | 65,232,939 | | | | 13,778,987 | |
| | |
| | 1,251,834,494 | | | | 2,901,781,386 | | | | 159,037,422 | | | | 498,788,104 | | | | 89,876,216 | | | | 515,394,934 | | | | 210,098,397 | |
| | 0 | | | | 28,990 | | | | 0 | | | | 0 | | | | 3,689 | | | | 393,687 | | | | 0 | |
| | 0 | | | | 0 | | | | 55,063 | | | | 4,178,048 | | | | 0 | | | | 0 | | | | 0 | |
| | 0 | | | | 166,343 | | | | 764,583 | | | | 573,001 | | | | 284,855 | | | | 1,585,820 | | | | 22,974 | |
| | 91,511 | | | | 6,383,242 | | | | 122,568 | | | | 1,791,356 | | | | 176,754 | | | | 123,201 | | | | 102,705 | |
| | 67,854 | | | | 8,277 | | | | 5,238 | | | | 8,917 | | | | 861 | | | | 47,786 | | | | 2,475 | |
| | 8,347 | | | | 0 | | | | 6,623 | | | | 9,115 | | | | 3,923 | | | | 6,970 | | | | 3,672 | |
| | |
| | 1,252,002,206 | | | | 2,908,368,238 | | | | 159,991,497 | | | | 505,348,541 | | | | 90,346,298 | | | | 517,552,398 | | | | 210,230,223 | |
| | |
| | | | | | |
| | | | | | | | | | | | | | | | | | | | | | | | | | |
| | 263,144 | | | | 6,816,649 | | | | 771,940 | | | | 402,008 | | | | 1,068,145 | | | | 556,489 | | | | 0 | |
| | 130,887,098 | | | | 15,878,700 | | | | 1,787,826 | | | | 14,194,341 | | | | 404,950 | | | | 48,391,400 | | | | 6,184,225 | |
| | 0 | | | | 107,505 | | | | 0 | | | | 0 | | | | 0 | | | | 0 | | | | 0 | |
| | 725,530 | | | | 196,742 | | | | 107,687 | | | | 340,113 | | | | 47,352 | | | | 296,191 | | | | 135,488 | |
| | 18,223 | | | | 21,955 | | | | 20,091 | | | | 11,622 | | | | 18,872 | | | | 17,994 | | | | 17,459 | |
| | 19,275 | | | | 192,651 | | | | 20,547 | | | | 7,079 | | | | 4,261 | | | | 7,180 | | | | 8,598 | |
| | |
| | 131,913,270 | | | | 23,214,202 | | | | 2,708,091 | | | | 14,955,163 | | | | 1,543,580 | | | | 49,269,254 | | | | 6,345,770 | |
| | |
| $ | 1,120,088,936 | | | $ | 2,885,154,036 | | | $ | 157,283,406 | | | $ | 490,393,378 | | | $ | 88,802,718 | | | $ | 468,283,144 | | | $ | 203,884,453 | |
| | |
| | | | | | |
| $ | 797,241,970 | | | $ | 1,406,154,669 | | | $ | 120,672,186 | | | $ | 474,823,132 | | | $ | 69,483,953 | | | $ | 377,232,425 | | | $ | 153,876,536 | |
| | |
| $ | 136,874,464 | | | $ | 71,256,768 | | | $ | 3,267,843 | | | $ | 20,812,181 | | | $ | 2,138,692 | | | $ | 65,232,939 | | | $ | 13,778,987 | |
| | |
| $ | 934,116,434 | | | $ | 1,477,411,437 | | | $ | 123,940,029 | | | $ | 495,635,313 | | | $ | 71,622,645 | | | $ | 442,465,364 | | | $ | 167,655,523 | |
| | |
| $ | 127,774,235 | | | $ | 15,509,047 | | | $ | 1,708,610 | | | $ | 13,451,572 | | | $ | 394,849 | | | $ | 47,226,460 | | | $ | 6,024,011 | |
| | |
| $ | 0 | | | $ | 0 | | | $ | 55,510 | | | $ | 4,477,747 | | | $ | 0 | | | $ | 0 | | | $ | 0 | |
| | |
The accompanying notes are an integral part of these financial statements.
| | | | |
| 104 | | Wells Fargo Advantage Allocation Funds | | Statements of assets and liabilities—November 30, 2014 (unaudited) |
| | | | | | | | |
| | | Core Bond
Portfolio | | | Managed Fixed
Income Portfolio | |
| | |
Assets | | | | | | | | |
Investments | | | | | | | | |
In unaffiliated securities (including securities on loan), at value (see cost below) | | $ | 3,173,850,096 | | | $ | 111,048,379 | |
In affiliated securities, at value (see cost below) | | | 164,332,510 | | | | 2,531,162 | |
| | | | |
Total investments, at value (see cost below) | | | 3,338,182,606 | | | | 113,579,541 | |
Cash | | | 717,939 | | | | 0 | |
Segregated cash | | | 0 | | | | 0 | |
Receivable for investments sold | | | 459,991,077 | | | | 143,250 | |
Principal paydown receivable | | | 118,453 | | | | 0 | |
Receivable for interest | | | 12,074,876 | | | | 828,436 | |
Receivable for securities lending income | | | 380 | | | | 0 | |
Prepaid expenses and other assets | | | 5,061 | | | | 3,341 | |
| | | | |
Total assets | | | 3,811,090,392 | | | | 114,554,568 | |
| | | | |
| | |
Liabilities | | | | | | | | |
Payable for investments purchased | | | 820,351,809 | | | | 238,505 | |
Payable upon receipt of securities loaned | | | 747,555 | | | | 0 | |
Payable for daily variation margin on open futures contracts | | | 0 | | | | 0 | |
Advisory fee payable | | | 827,141 | | | | 28,780 | |
Shareholder report expenses payable | | | 4,027 | | | | 2,220 | |
Custodian and accounting fees payable | | | 88,929 | | | | 3,857 | |
Professional fees payable | | | 27,208 | | | | 22,381 | |
| | | | |
Total liabilities | | | 822,046,669 | | | | 295,743 | |
| | | | |
Total net assets | | $ | 2,989,043,723 | | | $ | 114,258,825 | |
| | | | |
| | |
Investments in unaffiliated securities, at cost | | $ | 3,116,708,589 | | | $ | 106,263,568 | |
| | | | |
Investments in affiliated securities, at cost | | $ | 164,332,510 | | | $ | 2,531,162 | |
| | | | |
Total investments, at cost | | $ | 3,281,041,099 | | | $ | 108,794,730 | |
| | | | |
Securities on loan, at value | | $ | 731,946 | | | $ | 0 | |
| | | | |
The accompanying notes are an integral part of these financial statements.
| | | | | | |
| Statements of assets and liabilities—November 30, 2014 (unaudited) | | Wells Fargo Advantage Allocation Funds | | | 105 | |
| | | | | | |
Real Return
Portfolio | | | Stable Income
Portfolio | |
| |
| | | | | | |
| | | | | | |
| $ | 43,864,359 | | | $ | 23,033,970 | |
| | 51,224 | | | | 2,480,589 | |
| | |
| | 43,915,583 | | | | 25,514,559 | |
| | 0 | | | | 0 | |
| | 0 | | | | 18,000 | |
| | 0 | | | | 0 | |
| | 0 | | | | 0 | |
| | 160,282 | | | | 92,288 | |
| | 0 | | | | 0 | |
| | 2,497 | | | | 5,914 | |
| | |
| | 44,078,362 | | | | 25,630,761 | |
| | |
| |
| | | | | | |
| | 0 | | | | 195,554 | |
| | 0 | | | | 0 | |
| | 0 | | | | 4,063 | |
| | 9,762 | | | | 1,474 | |
| | 1,990 | | | | 2,267 | |
| | 2,838 | | | | 3,782 | |
| | 16,431 | | | | 19,705 | |
| | |
| | 31,021 | | | | 226,845 | |
| | |
| $ | 44,047,341 | | | $ | 25,403,916 | |
| | |
| |
| $ | 42,000,296 | | | $ | 22,437,852 | |
| | |
| $ | 51,224 | | | $ | 2,480,589 | |
| | |
| $ | 42,051,520 | | | $ | 24,918,441 | |
| | |
| $ | 0 | | | $ | 0 | |
| | |
The accompanying notes are an integral part of these financial statements.
| | | | |
| 106 | | Wells Fargo Advantage Allocation Funds | | Statements of operations—six months ended November 30, 2014 (unaudited) |
| | | | | | | | |
| | | C&B Large Cap Value Portfolio | | | Diversified Large
Cap Growth Portfolio | |
| | |
Investment income | | | | | | | | |
Dividends * | | $ | 2,952,791 | | | $ | 564,374 | |
Income from affiliated securities | | | 5,107 | | | | 497 | |
Securities lending income, net | | | 2,949 | | | | 9,176 | |
Interest | | | 0 | | | | 0 | |
| | | | |
Total investment income | | | 2,960,847 | | | | 574,047 | |
| | | | |
| | |
Expenses | | | | | | | | |
Advisory fee | | | 1,046,467 | | | | 438,979 | |
Custody and accounting fees | | | 11,970 | | | | 12,455 | |
Professional fees | | | 21,960 | | | | 24,024 | |
Shareholder report expenses | | | 726 | | | | 690 | |
Trustees’ fees and expenses | | | 5,547 | | | | 6,445 | |
Other fees and expenses | | | 4,677 | | | | 2,848 | |
| | | | |
Total expenses | | | 1,091,347 | | | | 485,441 | |
Less: Fee waivers and/or expense reimbursements | | | 0 | | | | (65,304 | ) |
| | | | |
Net expenses | | | 1,091,347 | | | | 420,137 | |
| | | | |
Net investment income (loss) | | | 1,869,500 | | | | 153,910 | |
| | | | |
| | |
REALIZED AND UNREALIZED GAINS (LOSSES) ON INVESTMENTS | | | | | | | | |
| | |
Net realized gains on: | | | | | | | | |
Unaffiliated securities | | | 23,094,390 | | | | 7,393,125 | |
Affiliated securities | | | 0 | | | | 0 | |
Futures transactions | | | 0 | | | | 0 | |
| | | | |
Net realized gains on investments | | | 23,094,390 | | | | 7,393,125 | |
| | | | |
Net change in unrealized gains (losses) on: | | | | | | | | |
Unaffiliated securities | | | (4,132,467 | ) | | | 3,667,923 | |
Affiliated securities | | | 0 | | | | 0 | |
Futures transactions | | | 0 | | | | 0 | |
| | | | |
Net change in unrealized gains (losses) on investments | | | (4,132,467 | ) | | | 3,667,923 | |
| | | | |
Net realized and unrealized gains (losses) on investments | | | 18,961,923 | | | | 11,061,048 | |
| | | | |
Net increase (decrease) in net assets resulting from operations | | $ | 20,831,423 | | | $ | 11,214,958 | |
| | | | |
| | |
* Net of foreign dividend withholding taxes in the amount of | | | $20,746 | | | | $651 | |
The accompanying notes are an integral part of these financial statements.
| | | | | | |
| Statements of operations—six months ended November 30, 2014 (unaudited) | | Wells Fargo Advantage Allocation Funds | | | 107 | |
| | | | | | | | | | | | | | | | | | | | | | | | | | |
Emerging Growth
Portfolio | | | Index Portfolio | | |
International Growth Portfolio | | | International Value Portfolio | | | Large Company Value Portfolio | | | Small Company Growth Portfolio | | | Small Company
Value Portfolio | |
| | | | | | |
| | | | | | | | | | | | | | | | | | | | | | | | | | |
| $ | 624,501 | | | $ | 28,243,948 | | | $ | 879,653 | | | $ | 6,450,877 | | | $ | 757,243 | | | $ | 788,155 | | | $ | 1,396,484 | |
| | 5,890 | | | | 534,595 | | | | 915 | | | | 1,849 | | | | 566 | | | | 6,680 | | | | 2,202 | |
| | 333,659 | | | | 44,926 | | | | 18,769 | | | | 155,455 | | | | 6,389 | | | | 246,662 | | | | 23,906 | |
| | 0 | | | | 278 | | | | 28 | | | | 2,789 | | | | 0 | | | | 0 | | | | 0 | |
| | |
| | 964,050 | | | | 28,823,747 | | | | 899,365 | | | | 6,610,970 | | | | 764,198 | | | | 1,041,497 | | | | 1,422,592 | |
| | |
| | | | | | |
| | | | | | | | | | | | | | | | | | | | | | | | | | |
| | 4,330,904 | | | | 1,174,627 | | | | 649,796 | | | | 2,131,768 | | | | 292,151 | | | | 1,588,944 | | | | 817,710 | |
| | 33,307 | | | | 79,054 | | | | 54,322 | | | | 69,747 | | | | 6,499 | | | | 16,838 | | | | 11,082 | |
| | 23,784 | | | | 27,282 | | | | 26,265 | | | | 28,075 | | | | 24,128 | | | | 23,114 | | | | 22,002 | |
| | 2,391 | | | | 4,099 | | | | 1,867 | | | | 1,884 | | | | 639 | | | | 1,411 | | | | 1,760 | |
| | 6,092 | | | | 6,093 | | | | 6,366 | | | | 6,372 | | | | 6,556 | | | | 6,095 | | | | 6,252 | |
| | 10,481 | | | | 200,397 | | | | 11,053 | | | | 25,291 | | | | 3,231 | | | | 3,666 | | | | 3,021 | |
| | |
| | 4,406,959 | | | | 1,491,552 | | | | 749,669 | | | | 2,263,137 | | | | 333,204 | | | | 1,640,068 | | | | 861,827 | |
| | 0 | | | | 0 | | | | 0 | | | | 0 | | | | (1,326 | ) | | | 0 | | | | 0 | |
| | |
| | 4,406,959 | | | | 1,491,552 | | | | 749,669 | | | | 2,263,137 | | | | 331,878 | | | | 1,640,068 | | | | 861,827 | |
| | |
| | (3,442,909 | ) | | | 27,332,195 | | | | 149,696 | | | | 4,347,833 | | | | 432,320 | | | | (598,571 | ) | | | 560,765 | |
| | |
| | | | | | |
| | | | | | | | | | | | | | | | | | | | | | | | | | |
| | | | | | |
| | | | | | | | | | | | | | | | | | | | | | | | | | |
| | 48,390,077 | | | | 52,004,846 | | | | 2,894,828 | | | | 4,321,304 | | | | 3,929,387 | | | | 9,808,746 | | | | 8,398,624 | |
| | 0 | | | | 834,634 | | | | 0 | | | | 0 | | | | 0 | | | | 0 | | | | 0 | |
| | 0 | | | | 1,606,123 | | | | 0 | | | | 0 | | | | 0 | | | | 0 | | | | 0 | |
| | |
| | 48,390,077 | | | | 54,445,603 | | | | 2,894,828 | | | | 4,321,304 | | | | 3,929,387 | | | | 9,808,746 | | | | 8,398,624 | |
| | |
| | | | | | | | | | | | | | | | | | | | | | | | | | |
| | 80,834,486 | | | | 147,070,069 | | | | 289,174 | | | | (41,305,695 | ) | | | (649,802 | ) | | | 12,332,831 | | | | (7,937,428 | ) |
| | 0 | | | | 1,958,013 | | | | 0 | | | | 0 | | | | 0 | | | | 0 | | | | 0 | |
| | 0 | | | | 752,525 | | | | 0 | | | | 0 | | | | 0 | | | | 0 | | | | 0 | |
| | |
| | 80,834,486 | | | | 149,780,607 | | | | 289,174 | | | | (41,305,695 | ) | | | (649,802 | ) | | | 12,332,831 | | | | (7,937,428 | ) |
| | |
| | 129,224,563 | | | | 204,226,210 | | | | 3,184,002 | | | | (36,984,391 | ) | | | 3,279,585 | | | | 22,141,577 | | | | 461,196 | |
| | |
| $ | 125,781,654 | | | $ | 231,558,405 | | | $ | 3,333,698 | | | $ | (32,636,558 | ) | | $ | 3,711,905 | | | $ | 21,543,006 | | | $ | 1,021,961 | |
| | |
| | | | | | |
| | $0 | | | | $8,312 | | | | $123,755 | | | | $662,904 | | | | $13,441 | | | | $4,747 | | | | $0 | |
The accompanying notes are an integral part of these financial statements.
| | | | |
| 108 | | Wells Fargo Advantage Allocation Funds | | Statements of operations—six months ended November 30, 2014 (unaudited) |
| | | | | | | | |
| | | Core Bond
Portfolio | | | Managed Fixed
Income Portfolio | |
| | |
Investment income | | | | | | | | |
Interest ** | | $ | 33,167,125 | | | $ | 2,051,454 | |
Securities lending income, net | | | 138,443 | | | | 968 | |
Income from affiliated securities | | | 40,846 | | | | 629 | |
| | | | |
Total investment income | | | 33,346,414 | | | | 2,053,051 | |
| | | | |
| | |
Expenses | | | | | | | | |
Advisory fee | | | 5,273,560 | | | | 226,815 | |
Custody and accounting fees | | | 85,556 | | | | 6,205 | |
Professional fees | | | 32,629 | | | | 27,702 | |
Shareholder report expenses | | | 3,758 | | | | 1,776 | |
Trustees’ fees and expenses | | | 6,095 | | | | 6,095 | |
Other fees and expenses | | | 32,258 | | | | 2,268 | |
| | | | |
Total expenses | | | 5,433,856 | | | | 270,861 | |
Less: Fee waivers and/or expense reimbursements | | | (358,908 | ) | | | (50,397 | ) |
| | | | |
Net expenses | | | 5,074,948 | | | | 220,464 | |
| | | | |
Net investment income | | | 28,271,466 | | | | 1,832,587 | |
| | | | |
| | |
REALIZED AND UNREALIZED GAINS (LOSSES) ON INVESTMENTS | | | | | | | | |
| | |
Net realized gains (losses) on: | | | | | | | | |
Unaffiliated securities | | | 25,152,081 | | | | 521,601 | |
Futures transactions | | | 0 | | | | 0 | |
TBA sale commitments | | | (2,043 | ) | | | 0 | |
| | | | |
Net realized gain (losses) on investments | | | 25,150,038 | | | | 521,601 | |
| | | | |
| | |
Net change in unrealized gains (losses) on: | | | | | | | | |
Unaffiliated securities | | | 8,723,076 | | | | 484,836 | |
Futures transactions | | | 0 | | | | 0 | |
| | | | |
Net change in unrealized gains (losses) on investments | | | 8,723,076 | | | | 484,836 | |
| | | | |
Net realized and unrealized gains (losses) on investments | | | 33,873,114 | | | | 1,006,437 | |
| | | | |
Net increase (decrease) in net assets resulting from operations | | $ | 62,144,580 | | | $ | 2,839,024 | |
| | | | |
| | |
** Net of foreign interest withholding taxes in the amount of | | | $0 | | | | $1,249 | |
The accompanying notes are an integral part of these financial statements.
| | | | | | |
| Statements of operations—six months ended November 30, 2014 (unaudited) | | Wells Fargo Advantage Allocation Funds | | | 109 | |
| | | | | | |
Real Return
Portfolio | | | Stable Income
Portfolio | |
| |
| | | | | | |
| $ | 460,129 | | | $ | 206,194 | |
| | 0 | | | | 0 | |
| | 13 | | | | 677 | |
| | |
| | 460,142 | | | | 206,871 | |
| | |
| |
| | | | | | |
| | 91,084 | | | | 37,690 | |
| | 4,812 | | | | 5,398 | |
| | 22,364 | | | | 24,978 | |
| | 1,207 | | | | 1,294 | |
| | 6,370 | | | | 6,355 | |
| | 2,492 | | | | 4,038 | |
| | |
| | 128,329 | | | | 79,753 | |
| | (28,455 | ) | | | (28,809 | ) |
| | |
| | 99,874 | | | | 50,944 | |
| | |
| | 360,268 | | | | 155,927 | |
| | |
| |
| | | | | | |
| |
| | | | | | |
| | 180,621 | | | | 1,731 | |
| | (1,641 | ) | | | (14,336 | ) |
| | 0 | | | | 0 | |
| | |
| | 178,980 | | | | (12,605 | ) |
| | |
| |
| | | | | | |
| | (826,904 | ) | | | (37,085 | ) |
| | 0 | | | | (13,126 | ) |
| | |
| | (826,904 | ) | | | (50,211 | ) |
| | |
| | (647,924 | ) | | | (62,816 | ) |
| | |
| $ | (287,656 | ) | | $ | 93,111 | |
| | |
| |
| | $0 | | | | $0 | |
The accompanying notes are an integral part of these financial statements.
| | | | |
| 110 | | Wells Fargo Advantage Allocation Funds | | Statements of changes in net assets |
| | | | | | | | |
| | | C&B Large Cap Value Portfolio | |
| | | Six months ended
November 30, 2014
(unaudited) | | | Year ended
May 31, 2014 | |
| | |
Operations | | | | | | | | |
Net investment income | | $ | 1,869,500 | | | $ | 4,519,408 | |
Net realized gains on investments | | | 23,094,390 | | | | 41,555,935 | |
Net change in unrealized gains (losses) on investments | | | (4,132,467 | ) | | | 9,188,214 | |
| | | | |
Net increase in net assets resulting from operations | | | 20,831,423 | | | | 55,263,557 | |
| | | | |
| | |
Capital share transactions | | | | | | | | |
Transactions in investors’ beneficial interests | | | | | | | | |
Contributions | | | 21,003,541 | | | | 24,307,963 | |
Withdrawals | | | (20,618,443 | ) | | | (109,777,604 | ) |
| | | | |
Net increase (decrease) in net assets resulting from capital share transactions | | | 385,098 | | | | (85,469,641 | ) |
| | | | |
Total increase (decrease) in net assets | | | 21,216,521 | | | | (30,206,084 | ) |
| | | | |
| | |
Net assets | | | | | | | | |
Beginning of period | | | 316,948,455 | | | | 347,154,539 | |
| | | | |
End of period | | $ | 338,164,976 | | | $ | 316,948,455 | |
| | | | |
The accompanying notes are an integral part of these financial statements.
| | | | | | |
| Statements of changes in net assets | | Wells Fargo Advantage Allocation Funds | | | 111 | |
| | | | | | | | |
| | | Diversified Large Cap Growth Portfolio | |
| | | Six months ended November 30, 2014 (unaudited) | | | Year ended
May 31, 2014 | |
| | |
Operations | | | | | | | | |
Net investment income | | $ | 153,910 | | | $ | 217,848 | |
Net realized gains on investments | | | 7,393,125 | | | | 17,206,881 | |
Net change in unrealized gains (losses) on investments | | | 3,667,923 | | | | 12,006,669 | |
| | | | |
Net increase in net assets resulting from operations | | | 11,214,958 | | | | 29,431,398 | |
| | | | |
| | |
Capital share transactions | | | | | | | | |
Transactions in investors’ beneficial interests | | | | | | | | |
Contributions | | | 257,917 | | | | 4,540,444 | |
Withdrawals | | | (20,595,346 | ) | | | (38,368,891 | ) |
| | | | |
Net decrease in net assets resulting from capital share transactions | | | (20,337,429 | ) | | | (33,828,447 | ) |
| | | | |
Total decrease in net assets | | | (9,122,471 | ) | | | (4,397,049 | ) |
| | | | |
| | |
Net assets | | | | | | | | |
Beginning of period | | | 143,448,344 | | | | 147,845,393 | |
| | | | |
End of period | | $ | 134,325,873 | | | $ | 143,448,344 | |
| | | | |
The accompanying notes are an integral part of these financial statements.
| | | | |
| 112 | | Wells Fargo Advantage Allocation Funds | | Statements of changes in net assets |
| | | | | | | | |
| | | Emerging Growth Portfolio | |
| | | Six months ended
November 30, 2014
(unaudited) | | | Year ended
May 31, 2014 | |
| | |
Operations | | | | | | | | |
Net investment loss | | $ | (3,442,909 | ) | | $ | (7,250,579 | ) |
Net realized gains on investments | | | 48,390,077 | | | | 126,561,844 | |
Net change in unrealized gains (losses) on investments | | | 80,834,486 | | | | 2,831,625 | |
| | | | |
Net increase in net assets resulting from operations | | | 125,781,654 | | | | 122,142,890 | |
| | | | |
| | |
Capital share transactions | | | | | | | | |
Transactions in investors’ beneficial interests | | | | | | | | |
Contributions | | | 22,755,111 | | | | 100,196,552 | |
Withdrawals | | | (124,646,482 | ) | | | (172,012,866 | ) |
| | | | |
Net decrease in net assets resulting from capital share transactions | | | (101,891,371 | ) | | | (71,816,314 | ) |
| | | | |
Total increase in net assets | | | 23,890,283 | | | | 50,326,576 | |
| | | | |
| | |
Net assets | | | | | | | | |
Beginning of period | | | 1,096,198,653 | | | | 1,045,872,077 | |
| | | | |
End of period | | $ | 1,120,088,936 | | | $ | 1,096,198,653 | |
| | | | |
The accompanying notes are an integral part of these financial statements.
| | | | | | |
| Statements of changes in net assets | | Wells Fargo Advantage Allocation Funds | | | 113 | |
| | | | | | | | |
| | | Index Portfolio | |
| | | Six months ended
November 30, 2014
(unaudited) | | | Year ended May 31, 2014 | |
| | |
Operations | | | | | | | | |
Net investment income | | $ | 27,332,195 | | | $ | 54,636,691 | |
Net realized gains on investments | | | 54,445,603 | | | | 10,828,401 | |
Net change in unrealized gains (losses) on investments | | | 149,780,607 | | | | 446,135,782 | |
| | | | |
Net increase in net assets resulting from operations | | | 231,558,405 | | | | 511,600,874 | |
| | | | |
| | |
Capital share transactions | | | | | | | | |
Transactions in investors’ beneficial interests | | | | | | | | |
Contributions | | | 68,698,638 | | | | 110,111,813 | |
Withdrawals | | | (252,454,175 | ) | | | (397,250,633 | ) |
| | | | |
Net decrease in net assets resulting from capital share transactions | | | (183,755,537 | ) | | | (287,138,820 | ) |
| | | | |
Total increase in net assets | | | 47,802,868 | | | | 224,462,054 | |
| | | | |
| | |
Net assets | | | | | | | | |
Beginning of period | | | 2,837,351,168 | | | | 2,612,889,114 | |
| | | | |
End of period | | $ | 2,885,154,036 | | | $ | 2,837,351,168 | |
| | | | |
The accompanying notes are an integral part of these financial statements.
| | | | |
| 114 | | Wells Fargo Advantage Allocation Funds | | Statements of changes in net assets |
| | | | | | | | |
| | | International Growth Portfolio | |
| | | Six months ended
November 30, 2014
(unaudited) | | | Year ended May 31, 2014 | |
| | |
Operations | | | | | | | | |
Net investment income | | $ | 149,696 | | | $ | 1,665,920 | |
Net realized gains on investments | | | 2,894,828 | | | | 7,645,552 | |
Net change in unrealized gains (losses) on investments | | | 289,174 | | | | 13,428,833 | |
| | | | |
Net increase in net assets resulting from operations | | | 3,333,698 | | | | 22,740,305 | |
| | | | |
| | |
Capital share transactions | | | | | | | | |
Transactions in investors’ beneficial interests | | | | | | | | |
Contributions | | | 4,575,581 | | | | 13,505,034 | |
Withdrawals | | | (6,734,073 | ) | | | (18,531,879 | ) |
| | | | |
Net decrease in net assets resulting from capital share transactions | | | (2,158,492 | ) | | | (5,026,845 | ) |
| | | | |
Total increase in net assets | | | 1,175,206 | | | | 17,713,460 | |
| | | | |
| | |
Net assets | | | | | | | | |
Beginning of period | | | 156,108,200 | | | | 138,394,740 | |
| | | | |
End of period | | $ | 157,283,406 | | | $ | 156,108,200 | |
| | | | |
The accompanying notes are an integral part of these financial statements.
| | | | | | |
| Statements of changes in net assets | | Wells Fargo Advantage Allocation Funds | | | 115 | |
| | | | | | | | |
| | | International Value Portfolio | |
| | | Six months ended
November 30, 2014
(unaudited) | | | Year ended May 31, 2014 | |
| | |
Operations | | | | | | | | |
Net investment income | | $ | 4,347,833 | | | $ | 14,388,396 | |
Net realized gains on investments | | | 4,321,304 | | | | 8,585,816 | |
Net change in unrealized gains (losses) on investments | | | (41,305,695 | ) | | | 54,753,421 | |
| | | | |
Net increase (decrease) in net assets resulting from operations | | | (32,636,558 | ) | | | 77,727,633 | |
| | | | |
| | |
Capital share transactions | | | | | | | | |
Transactions in investors’ beneficial interests | | | | | | | | |
Contributions | | | 17,007,628 | | | | 31,602,874 | |
Withdrawals | | | (6,213,028 | ) | | | (19,826,023 | ) |
| | | | |
Net increase in net assets resulting from capital share transactions | | | 10,794,600 | | | | 11,776,851 | |
| | | | |
Total increase (decrease) in net assets | | | (21,841,958 | ) | | | 89,504,484 | |
| | | | |
| | |
Net assets | | | | | | | | |
Beginning of period | | | 512,235,336 | | | | 422,730,852 | |
| | | | |
End of period | | $ | 490,393,378 | | | $ | 512,235,336 | |
| | | | |
The accompanying notes are an integral part of these financial statements.
| | | | |
| 116 | | Wells Fargo Advantage Allocation Funds | | Statements of changes in net assets |
| | | | | | | | |
| | | Large Company Value Portfolio | |
| | | Six months ended
November 30, 2014
(unaudited) | | | Year ended
May 31, 2014 | |
| | |
Operations | | | | | | | | |
Net investment income | | $ | 432,320 | | | $ | 971,468 | |
Net realized gains on investments | | | 3,929,387 | | | | 9,554,727 | |
Net change in unrealized gains (losses) on investments | | | (649,802 | ) | | | 7,711,461 | |
| | | | |
Net increase in net assets resulting from operations | | | 3,711,905 | | | | 18,237,656 | |
| | | | |
| | |
Capital share transactions | | | | | | | | |
Transactions in investors’ beneficial interests | | | | | | | | |
Contributions | | | 742,073 | | | | 1,607,068 | |
Withdrawals | | | (11,701,655 | ) | | | (22,199,921 | ) |
| | | | |
Net decrease in net assets resulting from capital share transactions | | | (10,959,582 | ) | | | (20,592,853 | ) |
| | | | |
Total decrease in net assets | | | (7,247,677 | ) | | | (2,355,197 | ) |
| | | | |
| | |
Net assets | | | | | | | | |
Beginning of period | | | 96,050,395 | | | | 98,405,592 | |
| | | | |
End of period | | $ | 88,802,718 | | | $ | 96,050,395 | |
| | | | |
The accompanying notes are an integral part of these financial statements.
| | | | | | |
| Statements of changes in net assets | | Wells Fargo Advantage Allocation Funds | | | 117 | |
| | | | | | | | |
| | | Small Company Growth Portfolio | |
| | | Six months ended
November 30, 2014
(unaudited) | | | Year ended
May 31, 2014 | |
| | |
Operations | | | | | | | | |
Net investment loss | | $ | (598,571 | ) | | $ | (977,131 | ) |
Net realized gains on investments | | | 9,808,746 | | | | 25,678,045 | |
Net change in unrealized gains (losses) on investments | | | 12,332,831 | | | | 21,247,400 | |
| | | | |
Net increase in net assets resulting from operations | | | 21,543,006 | | | | 45,948,314 | |
| | | | |
| | |
Capital share transactions | | | | | | | | |
Transactions in investors’ beneficial interests | | | | | | | | |
Contributions | | | 118,459,319 | | | | 152,768,112 | |
Withdrawals | | | (27,634,709 | ) | | | (39,286,894 | ) |
| | | | |
Net increase in net assets resulting from capital share transactions | | | 90,824,610 | | | | 113,481,218 | |
| | | | |
Total increase in net assets | | | 112,367,616 | | | | 159,429,532 | |
| | | | |
| | |
Net assets | | | | | | | | |
Beginning of period | | | 355,915,528 | | | | 196,485,996 | |
| | | | |
End of period | | $ | 468,283,144 | | | $ | 355,915,528 | |
| | | | |
The accompanying notes are an integral part of these financial statements.
| | | | |
| 118 | | Wells Fargo Advantage Allocation Funds | | Statements of changes in net assets |
| | | | | | | | |
| | | Small Company Value Portfolio | |
| | | Six months ended
November 30, 2014
(unaudited) | | | Year ended
May 31, 2014 | |
| | |
Operations | | | | | | | | |
Net investment income | | $ | 560,765 | | | $ | 1,830,396 | |
Net realized gains on investments | | | 8,398,624 | | | | 23,264,792 | |
Net change in unrealized gains (losses) on investments | | | (7,937,428 | ) | | | 9,025,443 | |
| | | | |
Net increase in net assets resulting from operations | | | 1,021,961 | | | | 34,120,631 | |
| | | | |
| | |
Capital share transactions | | | | | | | | |
Transactions in investors’ beneficial interests | | | | | | | | |
Contributions | | | 12,926,173 | | | | 18,725,149 | |
Withdrawals | | | (16,411,190 | ) | | | (50,335,526 | ) |
| | | | |
Net decrease in net assets resulting from capital share transactions | | | (3,485,017 | ) | | | (31,610,377 | ) |
| | | | |
Total increase (decrease) in net assets | | | (2,463,056 | ) | | | 2,510,254 | |
| | | | |
| | |
Net assets | | | | | | | | |
Beginning of period | | | 206,347,509 | | | | 203,837,255 | |
| | | | |
End of period | | $ | 203,884,453 | | | $ | 206,347,509 | |
| | | | |
The accompanying notes are an integral part of these financial statements.
| | | | | | |
| Statements of changes in net assets | | Wells Fargo Advantage Allocation Funds | | | 119 | |
| | | | | | | | |
| | | Core Bond Portfolio | |
| | | Six months ended
November 30, 2014
(unaudited) | | | Year ended
May 31, 2014 | |
| | |
Operations | | | | | | | | |
Net investment income | | $ | 28,271,466 | | | $ | 57,008,763 | |
Net realized gains (losses) on investments | | | 25,150,038 | | | | (25,731,456 | ) |
Net change in unrealized gains (losses) on investments | | | 8,723,076 | | | | 45,003,848 | |
| | | | |
Net increase in net assets resulting from operations | | | 62,144,580 | | | | 76,281,155 | |
| | | | |
| | |
Capital share transactions | | | | | | | | |
Transactions in investors’ beneficial interests | | | | | | | | |
Contributions | | | 304,034,567 | | | | 222,957,263 | |
Withdrawals | | | (273,677,183 | ) | | | (751,133,453 | ) |
| | | | |
Net increase (decrease) in net assets resulting from capital share transactions | | | 30,357,384 | | | | (528,176,190 | ) |
| | | | |
Total increase (decrease) in net assets | | | 92,501,964 | | | | (451,895,035 | ) |
| | | | |
| | |
Net assets | | | | | | | | |
Beginning of period | | | 2,896,541,759 | | | | 3,348,436,794 | |
| | | | |
End of period | | $ | 2,989,043,723 | | | $ | 2,896,541,759 | |
| | | | |
The accompanying notes are an integral part of these financial statements.
| | | | |
| 120 | | Wells Fargo Advantage Allocation Funds | | Statements of changes in net assets |
| | | | | | | | |
| | | Managed Fixed Income Portfolio | |
| | | Six months ended
November 30, 2014
(unaudited) | | | Year ended
May 31, 2014 | |
| | |
Operations | | | | | | | | |
Net investment income | | $ | 1,832,587 | | | $ | 3,708,418 | |
Net realized gains (losses) on investments | | | 521,601 | | | | (2,367,336 | ) |
Net change in unrealized gains (losses) on investments | | | 484,836 | | | | 2,165,201 | |
| | | | |
Net increase in net assets resulting from operations | | | 2,839,024 | | | | 3,506,283 | |
| | | | |
| | |
Capital share transactions | | | | | | | | |
Transactions in investors’ beneficial interests | | | | | | | | |
Contributions | | | 6,617,707 | | | | 21,095,774 | |
Withdrawals | | | (7,695,914 | ) | | | (21,367,204 | ) |
| | | | |
Net decrease in net assets resulting from capital share transactions | | | (1,078,207 | ) | | | (271,430 | ) |
| | | | |
Total increase in net assets | | | 1,760,817 | | | | 3,234,853 | |
| | | | |
| | |
Net assets | | | | | | | | |
Beginning of period | | | 112,498,008 | | | | 109,263,155 | |
| | | | |
End of period | | $ | 114,258,825 | | | $ | 112,498,008 | |
| | | | |
The accompanying notes are an integral part of these financial statements.
| | | | | | |
| Statements of changes in net assets | | Wells Fargo Advantage Allocation Funds | | | 121 | |
| | | | | | | | |
| | | Real Return Portfolio | |
| | | Six months ended
November 30, 2014
(unaudited) | | | Year ended
May 31, 2014 | |
| | |
Operations | | | | | | | | |
Net investment income | | $ | 360,268 | | | $ | 781,968 | |
Net realized gains on investments | | | 178,980 | | | | 518,616 | |
Net change in unrealized gains (losses) on investments | | | (826,904 | ) | | | (2,086,498 | ) |
| | | | |
Net decrease in net assets resulting from operations | | | (287,656 | ) | | | (785,914 | ) |
| | | | |
| | |
Capital share transactions | | | | | | | | |
Transactions in investors’ beneficial interests | | | | | | | | |
Contributions | | | 2,260,422 | | | | 5,773,010 | |
Withdrawals | | | (5,125,842 | ) | | | (24,418,897 | ) |
| | | | |
Net decrease in net assets resulting from capital share transactions | | | (2,865,420 | ) | | | (18,645,887 | ) |
| | | | |
Total decrease in net assets | | | (3,153,076 | ) | | | (19,431,801 | ) |
| | | | |
| | |
Net assets | | | | | | | | |
Beginning of period | | | 47,200,417 | | | | 66,632,218 | |
| | | | |
End of period | | $ | 44,047,341 | | | $ | 47,200,417 | |
| | | | |
The accompanying notes are an integral part of these financial statements.
| | | | |
| 122 | | Wells Fargo Advantage Allocation Funds | | Statements of changes in net assets |
| | | | | | | | |
| | | Stable Income Portfolio | |
| | | Six months ended
November 30, 2014
(unaudited) | | | Year ended
May 31, 2014 | |
| | |
Operations | | | | | | | | |
Net investment income | | $ | 155,927 | | | $ | 346,645 | |
Net realized losses on investments | | | (12,605 | ) | | | (3,556 | ) |
Net change in unrealized gains (losses) on investments | | | (50,211 | ) | | | 20,195 | |
| | | | |
Net increase in net assets resulting from operations | | | 93,111 | | | | 363,284 | |
| | | | |
| | |
Capital share transactions | | | | | | | | |
Transactions in investors’ beneficial interests | | | | | | | | |
Contributions | | | 1,119,538 | | | | 4,319,001 | |
Withdrawals | | | (617,267 | ) | | | (3,937,958 | ) |
| | | | |
Net increase in net assets resulting from capital share transactions | | | 502,271 | | | | 381,043 | |
| | | | |
Total increase in net assets | | | 595,382 | | | | 744,327 | |
| | | | |
| | |
Net assets | | | | | | | | |
Beginning of period | | | 24,808,534 | | | | 24,064,207 | |
| | | | |
End of period | | $ | 25,403,916 | | | $ | 24,808,534 | |
| | | | |
The accompanying notes are an integral part of these financial statements.
| | | | | | |
| Financial highlights | | Wells Fargo Advantage Allocation Funds | | | 123 | |
| | | | | | | | | | | | | | | | | | | | |
| | | Ratio to average net assets (annualized) | | | Total
return1 | | | Portfolio
turnover
rate | |
| | | Net investment income (loss) | | | Gross expenses | | | Net expenses | | | |
| | | | | |
C&B Large Cap Value Portfolio | | | | | | | | | | | | | | | | | | | | |
Six months ended November 30, 2014 (unaudited) | | | 1.16 | % | | | 0.68 | % | | | 0.68 | % | | | 6.60 | % | | | 17 | % |
Year ended May 31, 2014 | | | 1.35 | % | | | 0.68 | % | | | 0.68 | % | | | 17.80 | % | | | 22 | % |
Year ended May 31, 2013 | | | 1.73 | % | | | 0.68 | % | | | 0.68 | % | | | 29.30 | % | | | 18 | % |
Year ended May 31, 2012 | | | 1.81 | % | | | 0.68 | % | | | 0.68 | % | | | (4.61 | )% | | | 21 | % |
Year ended May 31, 20112 | | | 1.27 | % | | | 0.67 | % | | | 0.67 | % | | | 18.08 | % | | | 17 | % |
Year ended September 30, 2010 | | | 1.40 | % | | | 0.70 | % | | | 0.68 | % | | | 7.49 | % | | | 13 | % |
Year ended September 30, 2009 | | | 2.19 | % | | | 0.73 | % | | | 0.64 | % | | | (5.53 | )% | | | 28 | % |
| | | | | |
Diversified Large Cap Growth Portfolio | | | | | | | | | | | | | | | | | | | | |
Six months ended November 30, 2014 (unaudited) | | | 0.23 | % | | | 0.72 | % | | | 0.62 | % | | | 8.68 | % | | | 23 | % |
Year ended May 31, 2014 | | | 0.15 | % | | | 0.72 | % | | | 0.62 | % | | | 21.70 | % | | | 54 | % |
Year ended May 31, 2013 | | | 0.51 | % | | | 0.71 | % | | | 0.62 | % | | | 20.30 | % | | | 56 | % |
Year ended May 31, 2012 | | | 0.24 | % | | | 0.71 | % | | | 0.62 | % | | | 1.26 | % | | | 79 | % |
Year ended May 31, 20112,3 | | | 0.40 | % | | | 0.69 | % | | | 0.62 | % | | | 22.78 | % | | | 101 | % |
Year ended September 30, 20103 | | | 0.66 | % | | | 0.70 | % | | | 0.62 | % | | | 7.51 | % | | | 11 | % |
Year ended September 30, 20093 | | | 0.97 | % | | | 0.70 | % | | | 0.62 | % | | | 3.31 | % | | | 13 | % |
| | | | | |
Emerging Growth Portfolio | | | | | | | | | | | | | | | | | | | | |
Six months ended November 30, 2014 (unaudited) | | | (0.62 | )% | | | 0.80 | % | | | 0.80 | % | | | 11.98 | % | | | 26 | % |
Year ended May 31, 2014 | | | (0.62 | )% | | | 0.80 | % | | | 0.80 | % | | | 11.92 | % | | | 63 | % |
Year ended May 31, 2013 | | | (0.47 | )% | | | 0.80 | % | | | 0.80 | % | | | 20.53 | % | | | 65 | % |
Year ended May 31, 2012 | | | (0.57 | )% | | | 0.80 | % | | | 0.80 | % | | | (4.83 | )% | | | 75 | % |
Year ended May 31, 20112 | | | (0.77 | )% | | | 0.94 | % | | | 0.91 | % | | | 37.91 | % | | | 59 | % |
Year ended September 30, 2010 | | | (0.66 | )% | | | 1.02 | % | | | 0.94 | % | | | 20.49 | % | | | 97 | % |
Year ended September 30, 2009 | | | (0.53 | )% | | | 0.94 | % | | | 0.91 | % | | | (5.70 | )% | | | 147 | % |
| | | | | |
Index Portfolio | | | | | | | | | | | | | | | | | | | | |
Six months ended November 30, 2014 (unaudited) | | | 1.95 | % | | | 0.11 | % | | | 0.11 | % | | | 8.52 | % | | | 2 | % |
Year ended May 31, 2014 | | | 1.99 | % | | | 0.10 | % | | | 0.10 | % | | | 20.33 | % | | | 5 | % |
Year ended May 31, 2013 | | | 2.20 | % | | | 0.09 | % | | | 0.09 | % | | | 27.22 | % | | | 4 | % |
Year ended May 31, 2012 | | | 2.09 | % | | | 0.10 | % | | | 0.10 | % | | | (0.52 | )% | | | 9 | % |
Year ended May 31, 20112 | | | 1.93 | % | | | 0.10 | % | | | 0.10 | % | | | 19.39 | % | | | 3 | % |
Year ended September 30, 2010 | | | 2.01 | % | | | 0.10 | % | | | 0.10 | % | | | 9.97 | % | | | 22 | % |
Year ended September 30, 2009 | | | 2.61 | % | | | 0.12 | % | | | 0.10 | % | | | (7.00 | )% | | | 10 | % |
| | | | | |
International Growth Portfolio | | | | | | | | | | | | | | | | | | | | |
Six months ended November 30, 2014 (unaudited) | | | 0.20 | % | | | 0.98 | % | | | 0.98 | % | | | 2.09 | % | | | 25 | % |
Year ended May 31, 2014 | | | 1.13 | % | | | 1.00 | % | | | 1.00 | % | | | 16.45 | % | | | 46 | % |
Year ended May 31, 2013 | | | 1.63 | % | | | 1.04 | % | | | 1.04 | % | | | 30.34 | % | | | 46 | % |
Year ended May 31, 2012 | | | 2.04 | % | | | 0.97 | % | | | 0.90 | % | | | (9.44 | )% | | | 69 | % |
Year ended May 31, 20112 | | | 1.62 | % | | | 1.10 | % | | | 1.10 | % | | | 14.50 | % | | | 53 | % |
Year ended September 30, 2010 | | | 0.89 | % | | | 1.42 | % | | | 1.20 | % | | | 3.25 | % | | | 89 | % |
Year ended September 30, 2009 | | | 1.71 | % | | | 1.14 | % | | | 1.11 | % | | | 6.23 | % | | | 95 | % |
| | | | | |
International Value Portfolio | | | | | | | | | | | | | | | | | | | | |
Six months ended November 30, 2014 (unaudited) | | | 1.73 | % | | | 0.90 | % | | | 0.90 | % | | | (6.43 | )% | | | 7 | % |
Year ended May 31, 2014 | | | 3.09 | % | | | 0.91 | % | | | 0.91 | % | | | 18.22 | % | | | 11 | % |
Year ended May��31, 2013 | | | 3.04 | % | | | 0.91 | % | | | 0.91 | % | | | 29.45 | % | | | 16 | % |
Year ended May 31, 2012 | | | 3.44 | % | | | 0.91 | % | | | 0.85 | % | | | (21.07 | )% | | | 9 | % |
Year ended May 31, 20112 | | | 3.14 | % | | | 0.94 | % | | | 0.94 | % | | | 14.00 | % | | | 16 | % |
Year ended September 30, 2010 | | | 2.41 | % | | | 1.20 | % | | | 1.06 | % | | | 0.92 | % | | | 27 | % |
Year ended September 30, 2009 | | | 2.72 | % | | | 1.08 | % | | | 1.03 | % | | | 5.26 | % | | | 41 | % |
Please see footnotes on page 125.
The accompanying notes are an integral part of these financial statements.
| | | | |
| 124 | | Wells Fargo Advantage Allocation Funds | | Financial highlights |
| | | | | | | | | | | | | | | | | | | | |
| | | Ratio to average net assets (annualized) | | | Total
return1 | | | Portfolio
turnover
rate | |
| | | Net investment income (loss) | | | Gross expenses | | | Net expenses | | | |
| | | | | |
Large Company Value Portfolio | | | | | | | | | | | | | | | | | | | | |
Six months ended November 30, 2014 (unaudited) | | | 0.96 | % | | | 0.74 | % | | | 0.74 | % | | | 4.19 | % | | | 39 | % |
Year ended May 31, 2014 | | | 0.99 | % | | | 0.73 | % | | | 0.73 | % | | | 20.26 | % | | | 62 | % |
Year ended May 31, 2013 | | | 1.49 | % | | | 0.78 | % | | | 0.74 | % | | | 28.91 | % | | | 95 | % |
Year ended May 31, 2012 | | | 1.67 | % | | | 0.77 | % | | | 0.74 | % | | | (6.06 | )% | | | 104 | % |
Year ended May 31, 20112 | | | 1.58 | % | | | 0.78 | % | | | 0.74 | % | | | 21.46 | % | | | 38 | % |
Year ended September 30, 2010 | | | 1.73 | % | | | 0.73 | % | | | 0.72 | % | | | 7.02 | % | | | 46 | % |
Year ended September 30, 2009 | | | 2.69 | % | | | 0.75 | % | | | 0.69 | % | | | (9.66 | )% | | | 11 | % |
| | | | | |
Small Company Growth Portfolio | | | | | | | | | | | | | | | | | | | | |
Six months ended November 30, 2014 (unaudited) | | | (0.30 | )% | | | 0.83 | % | | | 0.83 | % | | | 5.46 | % | | | 30 | % |
Year ended May 31, 2014 | | | (0.37 | )% | | | 0.83 | % | | | 0.83 | % | | | 23.47 | % | | | 77 | % |
Year ended May 31, 2013 | | | (0.02 | )% | | | 0.86 | % | | | 0.86 | % | | | 31.39 | % | | | 109 | % |
Year ended May 31, 2012 | | | (0.12 | )% | | | 0.83 | % | | | 0.83 | % | | | (10.75 | )% | | | 107 | % |
Year ended May 31, 20112 | | | (0.42 | )% | | | 0.83 | % | | | 0.83 | % | | | 39.64 | % | | | 70 | % |
Year ended September 30, 2010 | | | (0.48 | )% | | | 0.87 | % | | | 0.86 | % | | | 15.25 | % | | | 129 | % |
Year ended September 30, 2009 | | | (0.53 | )% | | | 0.89 | % | | | 0.87 | % | | | 1.75 | % | | | 169 | % |
| | | | | |
Small Company Value Portfolio | | | | | | | | | | | | | | | | | | | | |
Six months ended November 30, 2014 (unaudited) | | | 0.55 | % | | | 0.84 | % | | | 0.84 | % | | | 0.38 | % | | | 24 | % |
Year ended May 31, 2014 | | | 0.89 | % | | | 0.85 | % | | | 0.85 | % | | | 18.09 | % | | | 47 | % |
Year ended May 31, 2013 | | | 0.58 | % | | | 0.85 | % | | | 0.85 | % | | | 30.76 | % | | | 57 | % |
Year ended May 31, 2012 | | | 0.69 | % | | | 0.84 | % | | | 0.84 | % | | | (7.17 | )% | | | 60 | % |
Year ended May 31, 20112 | | | 1.60 | % | | | 0.84 | % | | | 0.84 | % | | | 26.72 | % | | | 47 | % |
Year ended September 30, 2010 | | | 0.31 | % | | | 0.89 | % | | | 0.89 | % | | | 16.38 | % | | | 60 | % |
Year ended September 30, 2009 | | | 1.16 | % | | | 0.90 | % | | | 0.88 | % | | | (6.28 | )% | | | 99 | % |
| | | | | |
Core Bond Portfolio | | | | | | | | | | | | | | | | | | | | |
Six months ended November 30, 2014 (unaudited) | | | 1.95 | % | | | 0.37 | % | | | 0.35 | % | | | 2.13 | % | | | 286 | % |
Year ended May 31, 2014 | | | 1.94 | % | | | 0.37 | % | | | 0.35 | % | | | 2.90 | % | | | 646 | % |
Year ended May 31, 2013 | | | 1.75 | % | | | 0.37 | % | | | 0.35 | % | | | 2.61 | % | | | 547 | % |
Year ended May 31, 2012 | | | 2.33 | % | | | 0.37 | % | | | 0.35 | % | | | 8.20 | % | | | 803 | % |
Year ended May 31, 2011 | | | 2.99 | % | | | 0.37 | % | | | 0.35 | % | | | 7.02 | % | | | 789 | % |
Year ended May 31, 2010 | | | 3.78 | % | | | 0.38 | % | | | 0.34 | % | | | 10.87 | % | | | 638 | % |
| | | | | |
Managed Fixed Income Portfolio | | | | | | | | | | | | | | | | | | | | |
Six months ended November 30, 2014 (unaudited) | | | 3.23 | % | | | 0.48 | % | | | 0.39 | % | | | 2.50 | % | | | 13 | % |
Year ended May 31, 2014 | | | 3.33 | % | | | 0.48 | % | | | 0.39 | % | | | 3.07 | % | | | 35 | % |
Year ended May 31, 2013 | | | 3.42 | % | | | 0.47 | % | | | 0.39 | % | | | 4.81 | % | | | 49 | % |
Year ended May 31, 2012 | | | 3.83 | % | | | 0.46 | % | | | 0.39 | % | | | 6.97 | % | | | 51 | % |
Year ended May 31, 2011 | | | 3.97 | % | | | 0.45 | % | | | 0.39 | % | | | 8.84 | % | | | 104 | % |
Year ended May 31, 2010 | | | 3.64 | % | | | 0.42 | % | | | 0.38 | % | | | 14.58 | % | | | 59 | % |
| | | | | |
Real Return Portfolio | | | | | | | | | | | | | | | | | | | | |
Six months ended November 30, 2014 (unaudited) | | | 1.58 | % | | | 0.56 | % | | | 0.44 | % | | | (0.65 | )% | | | 3 | % |
Year ended May 31, 2014 | | | 1.45 | % | | | 0.53 | % | | | 0.44 | % | | | (0.26 | )% | | | 9 | % |
Year ended May 31, 2013 | | | 1.52 | % | | | 0.50 | % | | | 0.44 | % | | | (1.86 | )% | | | 15 | % |
Year ended May 31, 2012 | | | 3.00 | % | | | 0.48 | % | | | 0.44 | % | | | 12.62 | % | | | 23 | % |
Year ended May 31, 2011 | | | 3.25 | % | | | 0.44 | % | | | 0.43 | % | | | 8.19 | % | | | 19 | % |
Year ended May 31, 2010 | | | 3.53 | % | | | 0.45 | % | | | 0.44 | % | | | 8.28 | % | | | 31 | % |
Please see footnotes on page 125.
The accompanying notes are an integral part of these financial statements.
| | | | | | |
| Financial highlights | | Wells Fargo Advantage Allocation Funds | | | 125 | |
| | | | | | | | | | | | | | | | | | | | |
| | | Ratio to average net assets (annualized) | | | Total
return1 | | | Portfolio
turnover
rate | |
| | | Net investment income | | | Gross expenses | | | Net expenses | | | |
| | | | | |
Stable Income Portfolio | | | | | | | | | | | | | | | | | | | | |
Six months ended November 30, 2014 (unaudited) | | | 1.24 | % | | | 0.63 | % | | | 0.41 | % | | | 0.39 | % | | | 13 | % |
Year ended May 31, 2014 | | | 1.41 | % | | | 0.66 | % | | | 0.41 | % | | | 1.52 | % | | | 33 | % |
Year ended May 31, 2013 | | | 1.50 | % | | | 0.58 | % | | | 0.41 | % | | | 2.78 | % | | | 20 | % |
Year ended May 31, 2012 | | | 1.76 | % | | | 0.59 | % | | | 0.41 | % | | | 1.71 | % | | | 11 | % |
Year ended May 31, 2011 | | | 2.02 | % | | | 0.54 | % | | | 0.40 | % | | | 2.97 | % | | | 14 | % |
Year ended May 31, 2010 | | | 1.90 | % | | | 0.43 | % | | | 0.40 | % | | | 9.94 | % | | | 10 | % |
| 1. | Returns for periods of less than one year are not annualized. |
| 2. | For the eight months ended May 31, 2011. The Portfolio changed its fiscal year end from September 30 to May 31, effective May 31, 2011. |
| 3. | After the close of business on January 28, 2011, the Diversified Large Cap Growth Portfolio acquired the net assets of Wells Fargo Advantage Disciplined Growth Portfolio, Wells Fargo Advantage Large Cap Appreciation Portfolio, and Wells Fargo Advantage Large Company Growth Portfolio. Wells Fargo Advantage Large Company Growth Portfolio became the accounting and performance survivor in the transaction. The information for the periods prior to January 31, 2011 is that of the Wells Fargo Advantage Large Company Growth Portfolio. |
The accompanying notes are an integral part of these financial statements.
| | | | |
| 126 | | Wells Fargo Advantage Allocation Funds | | Notes to financial statements (unaudited) |
1. ORGANIZATION
Wells Fargo Master Trust (the “Trust”), a Delaware statutory trust organized on March 10, 1999, is an open-end management investment company registered under the Investment Company Act of 1940, as amended (the “1940 Act”). These financial statements report on the following portfolios: the Wells Fargo Advantage C&B Large Cap Value Portfolio (“C&B Large Cap Value Portfolio”), the Wells Fargo Advantage Diversified Large Cap Growth Portfolio (“Diversified Large Cap Growth Portfolio”), the Wells Fargo Advantage Emerging Growth Portfolio (“Emerging Growth Portfolio”), the Wells Fargo Advantage Index Portfolio (“Index Portfolio”), the Wells Fargo Advantage International Growth Portfolio (“International Growth Portfolio”), the Wells Fargo Advantage International Value Portfolio (“International Value Portfolio”), the Wells Fargo Advantage Large Company Value Portfolio (“Large Company Value Portfolio”), the Wells Fargo Advantage Small Company Growth Portfolio (“Small Company Growth Portfolio”), the Wells Fargo Advantage Small Company Value Portfolio (“Small Company Value Portfolio”), the Wells Fargo Advantage Core Bond Portfolio (“Core Bond Portfolio”), the Wells Fargo Advantage Managed Fixed Income Portfolio (“Managed Fixed Income Portfolio”), the Wells Fargo Advantage Real Return Portfolio (“Real Return Portfolio”) (formerly, Wells Fargo Advantage Inflation-Protected Bond Portfolio), and the Wells Fargo Advantage Stable Income Portfolio (“Stable Income Portfolio”) (each, a “Portfolio”, collectively, the “Portfolios”). Each Portfolio is a diversified series of the Trust.
The Portfolios, which are master portfolios in a master/feeder structure, offer their shares to multiple feeder funds and other affiliated master portfolios rather than directly to the public.
2. SIGNIFICANT ACCOUNTING POLICIES
The following significant accounting policies, which are consistently followed in the preparation of the financial statements of each Portfolio, are in conformity with U.S. generally accepted accounting principles which require management to make estimates and assumptions that affect the reported amounts of assets and liabilities, disclosure of contingent assets and liabilities at the date of the financial statements, and the reported amounts of revenues and expenses during the reporting period. Actual results could differ from those estimates.
Securities valuation
All investments are valued each business day as of the close of regular trading on the New York Stock Exchange (generally 4 p.m. Eastern Time).
Equity securities and futures that are listed on a foreign or domestic exchange or market are valued at the official closing price or, if none, the last sales price. If no sale occurs on the primary exchange or market for the security that day, the prior day’s price will be deemed “stale” and fair values will be determined in accordance with the Portfolios’ Valuation Procedures.
The values of securities denominated in foreign currencies are translated into U.S. dollars at rates provided by an independent foreign currency pricing source at a time each business day specified by the Management Valuation Team of Wells Fargo Funds Management, LLC (“Funds Management”).
Many securities markets and exchanges outside the U.S. close prior to the close of the New York Stock Exchange and therefore may not fully reflect trading or events that occur after the close of the principal exchange in which the foreign securities are traded, but before the close of the New York Stock Exchange. If such trading or events are expected to materially affect the value of such securities, then fair value pricing procedures approved by the Board of Trustees of the Portfolios are applied. These procedures take into account multiple factors including movements in U.S. securities markets after foreign exchanges close. Foreign securities that are fair valued under these procedures are categorized as Level 2 and the application of these procedures may result in transfers between Level 1 and Level 2. Depending on market activity, such fair valuations may be frequent. Such fair value pricing may result in net asset values that are higher or lower than net asset values based on the last reported sales price or latest quoted bid price. On November 30, 2014, such fair value pricing was not used in pricing foreign securities.
Fixed income securities acquired with maturities exceeding 60 days are valued based on evaluated bid prices provided by an independent pricing service which may utilize both transaction data and market information such as yield, quality, coupon rate, maturity, type of issue, trading characteristics and other market data. If prices are not available from the independent pricing service or prices received are deemed not representative of market value, values will be obtained from an independent broker-dealer.
Short-term securities, with maturities of 60 days or less at time of purchase, generally are valued at amortized cost which approximates fair value. The amortized cost method involves valuing a security at its cost, plus accretion of discount or minus amortization of premium over the period until maturity.
| | | | | | |
| Notes to financial statements (unaudited) | | Wells Fargo Advantage Allocation Funds | | | 127 | |
Investments in registered open-end investment companies are valued at net asset value. Non-registered investment vehicles are fair valued at net asset value.
Investments which are not valued using any of the methods discussed above are valued at their fair value, as determined in good faith by the Board of Trustees. The Board of Trustees has established a Valuation Committee comprised of the Trustees and has delegated to it the authority to take any actions regarding the valuation of portfolio securities that the Valuation Committee deems necessary or appropriate, including determining the fair value of portfolio securities, unless the determination has been delegated to the Management Valuation Team. The Board of Trustees retains the authority to make or ratify any valuation decisions or approve any changes to the Valuation Procedures as it deems appropriate. On a quarterly basis, the Board of Trustees receives reports on any valuation actions taken by the Valuation Committee or the Management Valuation Team which may include items for ratification.
Valuations of fair valued securities are compared to the next actual sales price when available, or other appropriate market values, to assess the continued appropriateness of the fair valuation methodologies used. These securities are fair valued on a day-to-day basis, taking into consideration changes to appropriate market information and any significant changes to the inputs considered in the valuation process until there is a readily available price provided on an exchange or by an independent pricing service. Valuations received from an independent pricing service or independent broker-dealer quotes are periodically validated by comparisons to most recent trades and valuations provided by other independent pricing services in addition to the review of prices by the adviser and/or subadviser. Unobservable inputs used in determining fair valuations are identified based on the type of security, taking into consideration factors utilized by market participants in valuing the investment, knowledge about the issuer and the current market environment.
Foreign currency translation
The accounting records of the Portfolios are maintained in U.S. dollars. The value of other assets and liabilities denominated in foreign currencies are translated into U.S. dollars at rates provided by an independent foreign currency pricing source at a time each business day specified by the Management Valuation Team. Purchases and sales of securities, and income and expenses are converted at the rate of exchange on the respective dates of such transactions. Net realized foreign exchange gains or losses arise from sales of foreign currencies, currency gains or losses realized between the trade and settlement dates on securities transactions, and the difference between the amounts of dividends, interest and foreign withholding taxes recorded and the U.S. dollar equivalent of the amounts actually paid or received. Net unrealized foreign exchange gains and losses arise from changes in the fair value of assets and liabilities other than investments in securities resulting from changes in exchange rates. The changes in net assets arising from changes in exchange rates and the changes in net assets resulting from changes in market prices of securities are not separately presented. Such changes are included in net realized and unrealized gains or losses from investments.
Security loans
The Portfolios may lend their securities from time to time in order to earn additional income in the form of fees or interest on securities received as collateral or the investment of any cash received as collateral. The Portfolios continue to receive interest or dividends on the securities loaned. The Portfolios receive collateral in the form of cash or securities with a value at least equal to the value of the securities on loan. The value of the loaned securities is determined at the close of each business day and any additional required collateral is delivered to the Portfolios on the next business day. In a securities lending transaction, the net asset value of the Portfolios will be affected by an increase or decrease in the value of the securities loaned and by an increase or decrease in the value of the instrument in which collateral is invested. The amount of securities lending activity undertaken by the Portfolios fluctuate from time to time, In the event of default or bankruptcy by the borrower, the Portfolios may be prevented from recovering the loaned securities or gaining access to the collateral or may experience delays or costs in doing so. In addition, the investment of any cash collateral received may lose all or part of its value. The Portfolios have the right under the lending agreement to recover the securities from the borrower on demand.
The Portfolios lend their securities through an unaffiliated securities lending agent. Cash collateral received in connection with its securities lending transactions is invested in Securities Lending Cash Investments, LLC (the “Securities Lending Fund”). The Securities Lending Fund is exempt from registration under Section 3(c)(7) of the 1940 Act and is managed by Funds Management and is sub-advised by Wells Capital Management Incorporated (“WellsCap”). Funds Management receives an advisory fee starting at 0.05% and declining to 0.01% as the average daily net assets of the Securities Lending Fund increase. All of the fees received by Funds Management are paid to WellsCap for its services as subadviser. The Securities Lending Fund seeks to provide a positive return compared to the daily Fed Funds Open rate by investing in high-quality, U.S. dollar-denominated short-term money market instruments. Securities Lending Fund investments are fair valued based upon the amortized cost valuation technique. Income earned from investment in the Securities Lending Fund is included in securities lending income on the Statements of Operations.
| | | | |
| 128 | | Wells Fargo Advantage Allocation Funds | | Notes to financial statements (unaudited) |
When-issued transactions
The Portfolios may purchase securities on a forward commitment or when-issued basis. A Portfolio records a when-issued transaction on the trade date and will segregate assets in an amount at least equal in value to the Portfolio’s commitment to purchase when-issued securities. Securities purchased on a when-issued basis are marked-to-market daily and the Portfolio begins earning interest on the settlement date. Losses may arise due to changes in the market value of the underlying securities or if the counterparty does not perform under the contract.
Futures contracts
The Portfolios are subject to interest rate risk or equity price risk in the normal course of pursuing their investment objectives. A Portfolio may buy and sell futures contracts in order to gain exposure to, or protect against, changes in security values and interest rates. The primary risks associated with the use of futures contracts are the imperfect correlation between changes in market values of securities held by the Portfolio and the prices of futures contracts, and the possibility of an illiquid market.
The aggregate principal amounts of the contracts are not recorded in the financial statements. Fluctuations in the value of the contracts are recorded in the Statements of Assets and Liabilities as an asset or liability and in the Statements of Operations as unrealized gains or losses until the contracts are closed, at which point they are recorded as net realized gains or losses on futures contracts. With futures contracts, there is minimal counterparty risk to the Portfolio since futures are exchange traded and the exchange’s clearinghouse, as counterparty to all exchange traded futures, guarantees the futures against default.
TBA sale commitments
The Portfolios may enter into To Be Announced (“TBA”) sale commitments to hedge their portfolio positions or to sell mortgage-backed securities it owns under delayed delivery arrangements. Proceeds of TBA sale commitments are not received until the contractual settlement date. During the time a TBA sale commitment is outstanding, equivalent deliverable securities or offsetting TBA purchase commitments, which are deliverable on or before the sale commitment date, are held as “cover” for the transaction. Unsettled TBA sale commitments are valued at the current market value of the underlying securities, generally according to the procedures described under “Securities valuation”. The contract is marked-to-market daily and the change in market value is recorded by the Portfolio as an unrealized gain or loss. If the TBA sale commitment is closed through the acquisition of an offsetting purchase commitment, the Portfolio realizes a gain or loss. If the Portfolio delivers securities under the commitment, the Portfolio realizes a gain or a loss from the sale of the securities based upon the unit price established at the date the commitment was entered into.
Inflation-indexed bonds and TIPS
The Portfolios may invest in inflation-indexed bonds, including Treasury inflation-protected securities (TIPS). Inflation-indexed bonds are fixed income securities whose principal value is periodically adjusted according to the rate of inflation. If the index measuring inflation falls, the principal value of inflation-indexed bonds (other than municipal inflation indexed bonds and certain corporate inflation-indexed bonds) will be adjusted downward, and consequently the interest payable on these securities (calculated with respect to a smaller principal amount) will be reduced. Repayment of the original bond principal upon maturity (as adjusted for inflation) is guaranteed in the case of U.S. Treasury inflation-indexed bonds. For bonds that do not provide a similar guarantee, the adjusted principal value of the bond repaid at maturity may be less than the original principal. The value of inflation-indexed bonds is expected to change in response to changes in real interest rates. Real interest rates are tied to the relationship between nominal interest rates and the rate of inflation. If nominal interest rates increase at a faster rate than inflation, real interest rates may rise, leading to a decrease in value of inflation-indexed bonds. Inflation-indexed bonds, including TIPS, decline in value when real interest rates rise. In certain interest rate environments, such as when real interest rates are rising faster than nominal interest rates, inflation-indexed bonds may experience greater losses than other fixed income securities with similar durations.
Mortgage dollar roll transactions
The Portfolios may engage in mortgage dollar roll transactions through TBA mortgage-backed securities issued by Government National Mortgage Association (GNMA), Federal National Mortgage Association (FNMA) and Federal Home Loan Mortgage Corporation (FHLMC). In a mortgage dollar roll transaction, a Portfolio sells a mortgage-backed security to a financial institution, such as a bank or broker-dealer and simultaneously agrees to repurchase a substantially similar security from the institution at a later date at an agreed upon price. The mortgage-backed securities that are repurchased will bear the same interest rate as those sold, but generally will be collateralized by different pools of mortgages with different pre-payment histories. During the roll period, a Portfolio foregoes principal and interest paid on the securities. A Portfolio is compensated by the difference between the current sales price and the forward price for the future purchase as well as by the earnings on the cash proceeds of the initial sale. Mortgage dollar rolls may be renewed without physical delivery of the securities subject to the contract. The Portfolios account for TBA dollar roll transactions as purchases and sales.
| | | | | | |
| Notes to financial statements (unaudited) | | Wells Fargo Advantage Allocation Funds | | | 129 | |
Security transactions and income recognition
Securities transactions are recorded on a trade date basis. Realized gains or losses are recorded on the basis of identified cost.
Dividend income is recognized on the ex-dividend date, except for certain dividends from foreign securities which are recorded as soon as the custodian verifies the ex-dividend date.
Interest income is accrued daily and bond discounts are accreted and premiums are amortized daily based on the effective interest method. To the extent debt obligations are placed on non-accrual status, any related interest income may be reduced by writing off interest receivables when the collection of all or a portion of interest has become doubtful based on consistently applied procedures. If the issuer subsequently resumes interest payments or when the collectability of interest is reasonably assured, the debt obligation is removed from non-accrual status.
Income from foreign securities is recorded net of foreign taxes withheld where recovery of such taxes is not assured.
Federal and other taxes
Each Portfolio is treated as a separate entity for federal income tax purposes. The Portfolios are not required to pay federal income taxes on their net investment income and net capital gain as they are treated as partnerships for federal income tax purposes. All interest, dividends, gains and losses of a Portfolio are deemed to have been “passed through” to the interestholders in proportion to their holdings of the Portfolio regardless of whether such interest, dividends and gains have been distributed by the Portfolio.
Each Portfolio’s income tax returns and all financial records supporting those returns for the prior three fiscal years are subject to examination by the federal revenue authority. Management has analyzed each Portfolio’s tax positions taken on federal, state, and foreign tax returns for all open tax years and does not believe that there are any uncertain tax positions that require recognition of a tax liability.
3. FAIR VALUATION MEASUREMENTS
Fair value measurements of investments are determined within a framework that has established a fair value hierarchy based upon the various data inputs utilized in determining the value of each Portfolio’s investments. The three-level hierarchy gives the highest priority to unadjusted quoted prices in active markets for identical assets or liabilities (Level 1) and the lowest priority to significant unobservable inputs (Level 3). Each Portfolio’s investments are classified within the fair value hierarchy based on the lowest level of input that is significant to the fair value measurement. The inputs are summarized into three broad levels as follows:
| n | | Level 1 – quoted prices in active markets for identical securities |
| n | | Level 2 – other significant observable inputs (including quoted prices for similar securities, interest rates, prepayment speeds, credit risk, use of amortized cost, etc.) |
| n | | Level 3 – significant unobservable inputs (including the Portfolio’s own assumptions in determining the fair value of investments) |
The inputs or methodologies used for valuing investments in securities are not necessarily an indication of the risk associated with investing in those securities.
| | | | |
| 130 | | Wells Fargo Advantage Allocation Funds | | Notes to financial statements (unaudited) |
The following is a summary of the inputs used in valuing each Portfolio’s assets and liabilities as of November 30, 2014:
| | | | | | | | | | | | | | | | |
| | | Quoted prices
(Level 1) | | | Other significant
observable inputs
(Level 2) | | | Significant
unobservable inputs
(Level 3) | | | Total | |
C&B Large Cap Value Portfolio | | | | | | | | | | | | | | | | |
Assets | | | | | | | | | | | | | | | | |
Investments in: | | | | | | | | | | | | | | | | |
| | | | |
Common stocks | | | | | | | | | | | | | | | | |
Consumer discretionary | | $ | 42,500,097 | | | $ | 0 | | | $ | 0 | | | $ | 42,500,097 | |
Consumer staples | | | 35,992,489 | | | | 0 | | | | 0 | | | | 35,992,489 | |
Energy | | | 29,407,489 | | | | 0 | | | | 0 | | | | 29,407,489 | |
Financials | | | 80,741,873 | | | | 0 | | | | 0 | | | | 80,741,873 | |
Health care | | | 46,642,321 | | | | 0 | | | | 0 | | | | 46,642,321 | |
Industrials | | | 31,949,489 | | | | 0 | | | | 0 | | | | 31,949,489 | |
Information technology | | | 22,448,373 | | | | 0 | | | | 0 | | | | 22,448,373 | |
Materials | | | 19,774,604 | | | | 0 | | | | 0 | | | | 19,774,604 | |
| | | | |
Preferred stocks | | | | | | | | | | | | | | | | |
Consumer staples | | | 1,507,315 | | | | 0 | | | | 0 | | | | 1,507,315 | |
| | | | |
Short-term investments | | | | | | | | | | | | | | | | |
Investment companies | | | 24,831,887 | | | | 0 | | | | 0 | | | | 24,831,887 | |
Total assets | | $ | 335,795,937 | | | $ | 0 | | | $ | 0 | | | $ | 335,795,937 | |
Diversified Large Cap Growth Portfolio | | | | | | | | | | | | | | | | |
Assets | | | | | | | | | | | | | | | | |
Investments in: | | | | | | | | | | | | | | | | |
| | | | |
Common stocks | | | | | | | | | | | | | | | | |
Consumer discretionary | | $ | 34,369,514 | | | $ | 0 | | | $ | 0 | | | $ | 34,369,514 | |
Consumer staples | | | 5,286,554 | | | | 0 | | | | 0 | | | | 5,286,554 | |
Energy | | | 5,898,125 | | | | 0 | | | | 0 | | | | 5,898,125 | |
Financials | | | 8,492,110 | | | | 0 | | | | 0 | | | | 8,492,110 | |
Health care | | | 21,264,089 | | | | 0 | | | | 0 | | | | 21,264,089 | |
Industrials | | | 15,002,610 | | | | 0 | | | | 0 | | | | 15,002,610 | |
Information technology | | | 37,159,209 | | | | 0 | | | | 0 | | | | 37,159,209 | |
Materials | | | 4,201,052 | | | | 0 | | �� | | 0 | | | | 4,201,052 | |
Telecommunication | | | 1,500,556 | | | | 0 | | | | 0 | | | | 1,500,556 | |
| | | | |
Short-term investments | | | | | | | | | | | | | | | | |
Investment companies | | | 1,435,598 | | | | 1,815,925 | | | | 0 | | | | 3,251,523 | |
Total assets | | $ | 134,609,417 | | | $ | 1,815,925 | | | $ | 0 | | | $ | 136,425,342 | |
Emerging Growth Portfolio | | | | | | | | | | | | | | | | |
Assets | | | | | | | | | | | | | | | | |
Investments in: | | | | | | | | | | | | | | | | |
| | | | |
Common stocks | | | | | | | | | | | | | | | | |
Consumer discretionary | | $ | 142,492,106 | | | $ | 0 | | | $ | 0 | | | $ | 142,492,106 | |
Consumer staples | | | 16,499,666 | | | | 0 | | | | 0 | | | | 16,499,666 | |
Energy | | | 32,516,507 | | | | 0 | | | | 0 | | | | 32,516,507 | |
Financials | | | 86,291,617 | | | | 0 | | | | 0 | | | | 86,291,617 | |
Health care | | | 348,224,013 | | | | 0 | | | | 0 | | | | 348,224,013 | |
Industrials | | | 118,632,477 | | | | 0 | | | | 0 | | | | 118,632,477 | |
Information technology | | | 364,694,144 | | | | 0 | | | | 0 | | | | 364,694,144 | |
Materials | | | 5,609,500 | | | | 0 | | | | 0 | | | | 5,609,500 | |
| | | | |
Short-term investments | | | | | | | | | | | | | | | | |
Investment companies | | | 5,987,366 | | | | 130,887,098 | | | | 0 | | | | 136,874,464 | |
Total assets | | $ | 1,120,947,396 | | | $ | 130,887,098 | | | $ | 0 | | | $ | 1,251,834,494 | |
| | | | | | |
| Notes to financial statements (unaudited) | | Wells Fargo Advantage Allocation Funds | | | 131 | |
| | | | | | | | | | | | | | | | |
| | | Quoted prices
(Level 1) | | | Other significant
observable inputs
(Level 2) | | | Significant
unobservable inputs
(Level 3) | | | Total | |
Index Portfolio | | | | | | | | | | | | | | | | |
Assets | | | | | | | | | | | | | | | | |
Investments in: | | | | | | | | | | | | | | | | |
| | | | |
Common stocks | | | | | | | | | | | | | | | | |
Consumer discretionary | | $ | 340,482,207 | | | $ | 0 | | | $ | 0 | | | $ | 340,482,207 | |
Consumer staples | | | 281,549,124 | | | | 0 | | | | 0 | | | | 281,549,124 | |
Energy | | | 238,844,080 | | | | 0 | | | | 0 | | | | 238,844,080 | |
Financials | | | 464,060,319 | | | | 0 | | | | 0 | | | | 464,060,319 | |
Health care | | | 408,205,947 | | | | 0 | | | | 0 | | | | 408,205,947 | |
Industrials | | | 297,747,015 | | | | 0 | | | | 0 | | | | 297,747,015 | |
Information technology | | | 568,771,683 | | | | 0 | | | | 0 | | | | 568,771,683 | |
Materials | | | 91,523,247 | | | | 0 | | | | 0 | | | | 91,523,247 | |
Telecommunication services | | | 68,620,168 | | | | 0 | | | | 0 | | | | 68,620,168 | |
Utilities | | | 88,365,228 | | | | 0 | | | | 0 | | | | 88,365,228 | |
| | | | |
Short-term investments | | | | | | | | | | | | | | | | |
Investment companies | | | 35,068,768 | | | | 15,878,700 | | | | 0 | | | | 50,947,468 | |
U.S. Treasury securities | | | 179,998 | | | | 2,484,902 | | | | 0 | | | | 2,664,900 | |
Total assets | | $ | 2,883,417,784 | | | $ | 18,363,602 | | | $ | 0 | | | $ | 2,901,781,386 | |
Liabilities | | | | | | | | | | | | | | | | |
Futures contracts | | $ | 107,505 | | | $ | 0 | | | $ | 0 | | | $ | 107,505 | |
Total liabilities | | $ | 107,505 | | | $ | 0 | | | $ | 0 | | | $ | 107,505 | |
International Growth Portfolio | | | | | | | | | | | | | | | | |
Assets | | | | | | | | | | | | | | | | |
Investments in: | | | | | | | | | | | | | | | | |
| | | | |
Common stocks | | | | | | | | | | | | | | | | |
Belgium | | $ | 6,246,315 | | | $ | 0 | | | $ | 0 | | | $ | 6,246,315 | |
Brazil | | | 276,338 | | | | 0 | | | | 0 | | | | 276,338 | |
China | | | 16,433,660 | | | | 0 | | | | 0 | | | | 16,433,660 | |
Denmark | | | 300,679 | | | | 0 | | | | 0 | | | | 300,679 | |
France | | | 9,048,967 | | | | 0 | | | | 0 | | | | 9,048,967 | |
Germany | | | 18,619,765 | | | | 0 | | | | 0 | | | | 18,619,765 | |
Hong Kong | | | 10,056,539 | | | | 0 | | | | 0 | | | | 10,056,539 | |
Ireland | | | 5,639,335 | | | | 0 | | | | 0 | | | | 5,639,335 | |
Japan | | | 23,280,134 | | | | 0 | | | | 0 | | | | 23,280,134 | |
Mexico | | | 4,797,608 | | | | 0 | | | | 0 | | | | 4,797,608 | |
Netherlands | | | 6,996,537 | | | | 0 | | | | 0 | | | | 6,996,537 | |
South Korea | | | 591,785 | | | | 0 | | | | 0 | | | | 591,785 | |
Spain | | | 3,097,829 | | | | 0 | | | | 0 | | | | 3,097,829 | |
Sweden | | | 1,306,046 | | | | 0 | | | | 0 | | | | 1,306,046 | |
Switzerland | | | 13,918,128 | | | | 0 | | | | 0 | | | | 13,918,128 | |
United Kingdom | | | 28,442,832 | | | | 28,926 | | | | 0 | | | | 28,471,758 | |
United States | | | 3,364,188 | | | | 0 | | | | 0 | | | | 3,364,188 | |
| | | | |
Participation notes | | | | | | | | | | | | | | | | |
United Kingdom | | | 0 | | | | 1,232,086 | | | | 0 | | | | 1,232,086 | |
| | | | |
Preferred stocks | | | | | | | | | | | | | | | | |
Germany | | | 2,091,882 | | | | 0 | | | | 0 | | | | 2,091,882 | |
| | | | |
Short-term investments | | | | | | | | | | | | | | | | |
Investment companies | | | 1,480,017 | | | | 1,787,826 | | | | 0 | | | | 3,267,843 | |
Total assets | | $ | 155,988,584 | | | $ | 3,048,838 | | | $ | 0 | | | $ | 159,037,422 | |
| | | | |
| 132 | | Wells Fargo Advantage Allocation Funds | | Notes to financial statements (unaudited) |
| | | | | | | | | | | | | | | | |
| | | Quoted prices
(Level 1) | | | Other significant
observable inputs
(Level 2) | | | Significant
unobservable inputs
(Level 3) | | | Total | |
International Value Portfolio | | | | | | | | | | | | | | | | |
Assets | | | | | | | | | | | | | | | | |
Investments in: | | | | | | | | | | | | | | | | |
| | | | |
Common stocks | | | | | | | | | | | | | | | | |
Australia | | $ | 27,014,669 | | | $ | 0 | | | $ | 0 | | | $ | 27,014,669 | |
Austria | | | 6,371,621 | | | | 0 | | | | 0 | | | | 6,371,621 | |
Belgium | | | 2,882,203 | | | | 0 | | | | 0 | | | | 2,882,203 | |
Brazil | | | 4,834,284 | | | | 0 | | | | 0 | | | | 4,834,284 | |
Canada | | | 14,282,460 | | | | 0 | | | | 0 | | | | 14,282,460 | |
China | | | 12,063,480 | | | | 0 | | | | 0 | | | | 12,063,480 | |
Czech Republic | | | 1,602,829 | | | | 0 | | | | 0 | | | | 1,602,829 | |
Finland | | | 4,607,457 | | | | 0 | | | | 0 | | | | 4,607,457 | |
France | | | 41,171,510 | | | | 0 | | | | 0 | | | | 41,171,510 | |
Germany | | | 38,576,589 | | | | 0 | | | | 0 | | | | 38,576,589 | |
Hong Kong | | | 9,299,596 | | | | 0 | | | | 0 | | | | 9,299,596 | |
Hungary | | | 59,155 | | | | 0 | | | | 0 | | | | 59,155 | |
India | | | 7,659,525 | | | | 0 | | | | 0 | | | | 7,659,525 | |
Ireland | | | 3,026,529 | | | | 0 | | | | 0 | | | | 3,026,529 | |
Israel | | | 5,629,578 | | | | 0 | | | | 0 | | | | 5,629,578 | |
Italy | | | 6,388,885 | | | | 0 | | | | 0 | | | | 6,388,885 | |
Japan | | | 97,017,609 | | | | 0 | | | | 0 | | | | 97,017,609 | |
Liechtenstein | | | 634,823 | | | | 0 | | | | 0 | | | | 634,823 | |
Netherlands | | | 13,757,049 | | | | 0 | | | | 0 | | | | 13,757,049 | |
Norway | | | 8,113,989 | | | | 0 | | | | 0 | | | | 8,113,989 | |
Poland | | | 2,963,675 | | | | 0 | | | | 0 | | | | 2,963,675 | |
Russia | | | 5,216,958 | | | | 0 | | | | 0 | | | | 5,216,958 | |
Singapore | | | 5,534,728 | | | | 0 | | | | 0 | | | | 5,534,728 | |
South Africa | | | 3,224,974 | | | | 0 | | | | 0 | | | | 3,224,974 | |
South Korea | | | 12,332,599 | | | | 0 | | | | 0 | | | | 12,332,599 | |
Spain | | | 7,495,983 | | | | 0 | | | | 0 | | | | 7,495,983 | |
Sweden | | | 10,895,637 | | | | 0 | | | | 0 | | | | 10,895,637 | |
Switzerland | | | 24,816,570 | | | | 0 | | | | 0 | | | | 24,816,570 | |
Taiwan | | | 2,401,260 | | | | 0 | | | | 0 | | | | 2,401,260 | |
Thailand | | | 3,878,063 | | | | 0 | | | | 0 | | | | 3,878,063 | |
United Kingdom | | | 89,590,278 | | | | 0 | | | | 0 | | | | 89,590,278 | |
| | | | |
Preferred stocks | | | | | | | | | | | | | | | | |
Brazil | | | 4,607,364 | | | | 0 | | | | 0 | | | | 4,607,364 | |
| | | | |
Rights | | | | | | | | | | | | | | | | |
Spain | | | 0 | | | | 23,994 | | | | 0 | | | | 23,994 | |
| | | | |
Short-term investments | | | | | | | | | | | | | | | | |
Investment companies | | | 6,617,840 | | | | 14,194,341 | | | | 0 | | | | 20,812,181 | |
Total assets | | $ | 484,569,769 | | | $ | 14,218,335 | | | $ | 0 | | | $ | 498,788,104 | |
| | | | | | |
| Notes to financial statements (unaudited) | | Wells Fargo Advantage Allocation Funds | | | 133 | |
| | | | | | | | | | | | | | | | |
| | | Quoted prices
(Level 1) | | | Other significant
observable inputs
(Level 2) | | | Significant
unobservable inputs
(Level 3) | | | Total | |
Large Company Value Portfolio | | | | | | | | | | | | | | | | |
Assets | | | | | | | | | | | | | | | | |
Investments in: | | | | | | | | | | | | | | | | |
| | | | |
Common stocks | | | | | | | | | | | | | | | | |
Consumer discretionary | | $ | 7,755,163 | | | $ | 0 | | | $ | 0 | | | $ | 7,755,163 | |
Consumer staples | | | 4,276,180 | | | | 0 | | | | 0 | | | | 4,276,180 | |
Energy | | | 8,038,409 | | | | 0 | | | | 0 | | | | 8,038,409 | |
Financials | | | 26,069,684 | | | | 0 | | | | 0 | | | | 26,069,684 | |
Health care | | | 12,037,660 | | | | 0 | | | | 0 | | | | 12,037,660 | |
Industrials | | | 10,215,162 | | | | 0 | | | | 0 | | | | 10,215,162 | |
Information technology | | | 11,300,967 | | | | 0 | | | | 0 | | | | 11,300,967 | |
Materials | | | 3,218,719 | | | | 0 | | | | 0 | | | | 3,218,719 | |
Telecommunication services | | | 1,714,924 | | | | | | | | | | | | 1,714,924 | |
Utilities | | | 3,110,656 | | | | 0 | | | | 0 | | | | 3,110,656 | |
| | | | |
Short-term investments | | | | | | | | | | | | | | | | |
Investment companies | | | 1,733,742 | | | | 404,950 | | | | 0 | | | | 2,138,692 | |
Total assets | | $ | 89,471,266 | | | $ | 404,950 | | | $ | 0 | | | $ | 89,876,216 | |
Small Company Growth Portfolio | | | | | | | | | | | | | | | | |
Assets | | | | | | | | | | | | | | | | |
Investments in: | | | | | | | | | | | | | | | | |
| | | | |
Common stocks | | | | | | | | | | | | | | | | |
Consumer discretionary | | $ | 60,694,683 | | | $ | 0 | | | $ | 0 | | | $ | 60,694,683 | |
Consumer staples | | | 7,018,745 | | | | 0 | | | | 0 | | | | 7,018,745 | |
Energy | | | 19,010,001 | | | | 0 | | | | 0 | | | | 19,010,001 | |
Financials | | | 46,837,094 | | | | 0 | | | | 0 | | | | 46,837,094 | |
Health care | | | 118,858,478 | | | | 0 | | | | 0 | | | | 118,858,478 | |
Industrials | | | 63,945,047 | | | | 0 | | | | 0 | | | | 63,945,047 | |
Information technology | | | 113,413,281 | | | | 0 | | | | 0 | | | | 113,413,281 | |
Materials | | | 20,384,666 | | | | 0 | | | | 0 | | | | 20,384,666 | |
| | | | |
Short-term investments | | | | | | | | | | | | | | | | |
Investment companies | | | 16,841,539 | | | | 48,391,400 | | | | 0 | | | | 65,232,939 | |
Total assets | | $ | 467,003,534 | | | $ | 48,391,400 | | | $ | 0 | | | $ | 515,394,934 | |
Small Company Value Portfolio | | | | | | | | | | | | | | | | |
Assets | | | | | | | | | | | | | | | | |
Investments in: | | | | | | | | | | | | | | | | |
| | | | |
Common stocks | | | | | | | | | | | | | | | | |
Consumer discretionary | | $ | 33,234,619 | | | $ | 0 | | | $ | 0 | | | $ | 33,234,619 | |
Consumer staples | | | 1,603,080 | | | | 0 | | | | 0 | | | | 1,603,080 | |
Energy | | | 6,035,692 | | | | 0 | | | | 0 | | | | 6,035,692 | |
Financials | | | 79,811,863 | | | | 0 | | | | 0 | | | | 79,811,863 | |
Health care | | | 11,463,635 | | | | 0 | | | | 0 | | | | 11,463,635 | |
Industrials | | | 19,923,097 | | | | 0 | | | | 0 | | | | 19,923,097 | |
Information technology | | | 24,288,952 | | | | 0 | | | | 0 | | | | 24,288,952 | |
Materials | | | 9,005,561 | | | | 0 | | | | 0 | | | | 9,005,561 | |
Telecommunication services | | | 1,019,045 | | | | 0 | | | | 0 | | | | 1,019,045 | |
Utilities | | | 9,927,665 | | | | 0 | | | | 0 | | | | 9,927,665 | |
| | | | |
Warrants | | | | | | | | | | | | | | | | |
Health care | | | 0 | | | | 6,201 | | | | 0 | | | | 6,201 | |
| | | | |
Short-term investments | | | | | | | | | | | | | | | | |
Investment companies | | | 7,594,762 | | | | 6,184,225 | | | | 0 | | | | 13,778,987 | |
Total assets | | $ | 203,907,971 | | | $ | 6,190,426 | | | $ | 0 | | | $ | 210,098,397 | |
| | | | |
| 134 | | Wells Fargo Advantage Allocation Funds | | Notes to financial statements (unaudited) |
| | | | | | | | | | | | | | | | |
| | | Quoted prices (Level 1) | | | Other significant
observable inputs
(Level 2) | | | Significant
unobservable inputs
(Level 3) | | | Total | |
Core Bond Portfolio | | | | | | | | | | | | | | | | |
Assets | | | | | | | | | | | | | | | | |
Investments in: | | | | | | | | | | | | | | | | |
| | | | |
Agency securities | | $ | 0 | | | $ | 873,674,600 | | | $ | 0 | | | $ | 873,674,600 | |
| | | | |
Asset-backed securities | | | 0 | | | | 457,486,853 | | | | 0 | | | | 457,486,853 | |
| | | | |
Corporate bonds and notes | | | 0 | | | | 565,267,267 | | | | 0 | | | | 565,267,267 | |
| | | | |
Municipal obligations | | | 0 | | | | 29,423,778 | | | | 0 | | | | 29,423,778 | |
| | | | |
Non-agency mortgage backed securities | | | 0 | | | | 154,101,015 | | | | 0 | | | | 154,101,015 | |
| | | | |
U.S. Treasury securities | | | 895,570,651 | | | | 0 | | | | 0 | | | | 895,570,651 | |
| | | | |
Yankee corporate bonds and notes | | | 0 | | | | 155,633,437 | | | | 0 | | | | 155,633,437 | |
| | | | |
Yankee government bonds | | | 0 | | | | 42,692,495 | | | | 0 | | | | 42,692,495 | |
| | | | |
Short-term investments | | | | | | | | | | | | | | | | |
Investment companies | | | 163,584,955 | | | | 747,555 | | | | 0 | | | | 164,332,510 | |
Total assets | | $ | 1,059,155,606 | | | $ | 2,279,027,000 | | | $ | 0 | | | $ | 3,338,182,606 | |
Managed Fixed Income Portfolio | | | | | | | | | | | | | | | | |
Assets | | | | | | | | | | | | | | | | |
Investments in: | | | | | | | | | | | | | | | | |
| | | | |
Agency securities | | $ | 0 | | | $ | 33,650,829 | | | $ | 0 | | | $ | 33,650,829 | |
| | | | |
Asset-backed securities | | | 0 | | | | 4,006,621 | | | | 0 | | | | 4,006,621 | |
| | | | |
Corporate bonds and notes | | | 0 | | | | 34,924,413 | | | | 0 | | | | 34,924,413 | |
| | | | |
Municipal obligations | | | 0 | | | | 10,645,042 | | | | 0 | | | | 10,645,042 | |
| | | | |
Non-agency mortgage backed securities | | | 0 | | | | 13,775,902 | | | | 1,341,360 | | | | 15,117,262 | |
| | | | |
U.S. Treasury securities | | | 5,733,338 | | | | 0 | | | | 0 | | | | 5,733,338 | |
| | | | |
Yankee corporate bonds and notes | | | 0 | | | | 6,483,425 | | | | 0 | | | | 6,483,425 | |
| | | | |
Yankee government bonds | | | 0 | | | | 487,449 | | | | 0 | | | | 487,449 | |
| | | | |
Short-term investments | | | | | | | | | | | | | | | | |
Investment companies | | | 2,531,162 | | | | 0 | | | | 0 | | | | 2,531,162 | |
Total assets | | $ | 8,264,500 | | | $ | 103,973,681 | | | $ | 1,341,360 | | | $ | 113,579,541 | |
Real Return Portfolio | | | | | | | | | | | | | | | | |
Assets | | | | | | | | | | | | | | | | |
Investments in: | | | | | | | | | | | | | | | | |
U.S. Treasury securities | | $ | 43,864,359 | | | $ | 0 | | | $ | 0 | | | $ | 43,864,359 | |
| | | | |
Short-term investments | | | | | | | | | | | | | | | | |
Investment companies | | | 51,224 | | | | 0 | | | | 0 | | | | 51,224 | |
Total assets | | $ | 43,915,583 | | | $ | 0 | | | $ | 0 | | | $ | 43,915,583 | |
| | | | | | |
| Notes to financial statements (unaudited) | | Wells Fargo Advantage Allocation Funds | | | 135 | |
| | | | | | | | | | | | | | | | |
| | | Quoted prices (Level 1) | | | Other significant
observable inputs
(Level 2) | | | Significant
unobservable inputs
(Level 3) | | | Total | |
Stable Income Portfolio | | | | | | | | | | | | | | | | |
Assets | | | | | | | | | | | | | | | | |
Investments in: | | | | | | | | | | | | | | | | |
Agency securities | | $ | 0 | | | $ | 8,964,013 | | | $ | 0 | | | $ | 8,964,013 | |
| | | | |
Asset-backed securities | | | 0 | | | | 5,264,367 | | | | 0 | | | | 5,264,367 | |
| | | | |
Corporate bonds and notes | | | 0 | | | | 5,879,799 | | | | 0 | | | | 5,879,799 | |
| | | | |
Municipal obligations | | | 0 | | | | 363,106 | | | | 0 | | | | 363,106 | |
| | | | |
Non-agency mortgage backed securities | | | 0 | | | | 1,138,189 | | | | 0 | | | | 1,138,189 | |
| | | | |
Yankee corporate bonds and notes | | | 0 | | | | 1,424,496 | | | | 0 | | | | 1,424,496 | |
| | | | |
Short-term investments | | | | | | | | | | | | | | | | |
Investment companies | | | 2,480,589 | | | | 0 | | | | 0 | | | | 2,480,589 | |
Total assets | | $ | 2,480,589 | | | $ | 23,033,970 | | | $ | 0 | | | $ | 25,514,559 | |
Liabilities | | | | | | | | | | | | | | | | |
Futures contracts | | $ | 4,063 | | | $ | 0 | | | $ | 0 | | | $ | 4,063 | |
Total liabilities | | $ | 4,063 | | | $ | 0 | | | $ | 0 | | | $ | 4,063 | |
Futures contracts are reported at their variation margin at measurement date, which represents the amount due from the Portfolio at that date. All other assets and liabilities are reported at their market value at measurement date.
Transfers in and transfers out are recognized at the end of the reporting period. At November 30, 2014, the Portfolios did not have any transfers into/out of Level 1 or Level 2.
The following is a reconciliation of assets in which significant unobservable inputs (Level 3) were used in determining fair value:
| | | | |
| Managed Fixed Income Portfolio | | Non-agency
mortgage
backed
securities | |
| |
Balance as of May 31, 2014 | | $ | 1,400,534 | |
Accrued discounts (premiums) | | | 0 | |
Realized gains (losses) | | | 0 | |
Change in unrealized gains (losses) | | | 57,216 | |
Purchases | | | 0 | |
Sales | | | (116,390 | ) |
Transfers into Level 3 | | | 0 | |
Transfers out of Level 3 | | | 0 | |
Balance as of November 30, 2014 | | $ | 1,341,360 | |
Change in unrealized gains (losses) relating to securities still held at November 30, 2014. | | $ | 11,778 | |
The investment type categorized above was valued using an indicative broker quote. The indicative broker quote is considered a Level 3 input. Quantitative unobservable inputs used by the brokers are often proprietary and not provided to the Portfolio and therefore the disclosure that would address these inputs is not included above.
| | | | |
| 136 | | Wells Fargo Advantage Allocation Funds | | Notes to financial statements (unaudited) |
4. TRANSACTIONS WITH AFFILIATES AND OTHER EXPENSES
Advisory fees
The Trust has entered into an advisory contract with Funds Management, an indirect wholly owned subsidiary of Wells Fargo & Company (“Wells Fargo”). The adviser is responsible for implementing investment policies and guidelines and for supervising the subadvisers, who are responsible for day-to-day portfolio management of the Porfolios. Pursuant to the contract, Funds Management is entitled to receive an annual advisory fee which is calculated based on the average daily net assets of each Porfolio.
Funds Management has retained the services of certain subadvisers to provide daily portfolio management for the Portfolios. Funds Management has engaged WellsCap (an affiliate of Funds Management and an indirect wholly owned subsidiary of Wells Fargo), Peregrine Capital Management, Inc. (an affiliate of Funds Management and a direct wholly owned subsidiary of Wells Fargo), Artisan Partners Limited Partnership, Cooke & Bieler, L.P., Galliard Capital Management, Inc. (an affiliate of Funds Management and an indirect wholly owned subsidiary of Wells Fargo), Golden Capital Management, LLC (an affiliate of Funds Management), LSV Asset Management and Phocas Financial Corporation as subadvisers.
The fees for sub-advisory services are borne by Funds Management. The subadvisers are each entitled to receive from Funds Management an annual subadvisory fee which is calculated based on the average daily net assets of each subadviser’s portion of the Portfolio.
The annual advisory and subadvisory fee rates for each Portfolio are as follows:
| | | | | | | | | | | | | | | | | | | | | | |
| | | Advisory fee | | | Effective rate for
the six months ended November 30, 2014 | | | Subadviser | | Subadvisory Fee | |
| | | starting at | | | declining to | | | | | starting at | | | declining to | |
C&B Large Cap Value Portfolio | | | 0.65 | %1 | | | 0.475 | %1 | | | 0.65 | %1 | | Cooke & Bieler, L.P. | | | 0.45 | % | | | 0.30 | % |
Diversified Large Cap Growth Portfolio | | | 0.65 | %1 | | | 0.475 | %1 | | | 0.65 | %1 | | WellsCap | | | 0.30 | % | | | 0.20 | % |
Emerging Growth Portfolio | | | 0.80 | % | | | 0.68 | % | | | 0.78 | % | | WellsCap | | | 0.55 | % | | | 0.40 | % |
Index Portfolio | | | 0.10 | % | | | 0.05 | % | | | 0.08 | % | | Golden Capital Management, LLC | | | 0.05 | % | | | 0.02 | % |
International Growth Portfolio | | | 0.85 | % | | | 0.70 | % | | | 0.85 | % | | Artisan Partners Limited Partnership | | | 0.80 | % | | | 0.50 | % |
International Value Portfolio | | | 0.85 | % | | | 0.70 | % | | | 0.85 | % | | LSV Asset Management | | | 0.35 | % | | | 0.30 | % |
Large Company Value Portfolio | | | 0.65 | %1 | | | 0.475 | %1 | | | 0.65 | %1 | | Phocas Financial Corporation | | | 0.29 | % | | | 0.20 | % |
Small Company Growth Portfolio | | | 0.80 | % | | | 0.68 | % | | | 0.80 | % | | Peregrine Capital Management, Inc. | | | 0.50 | % | | | 0.45 | % |
Small Company Value Portfolio | | | 0.80 | % | | | 0.68 | % | | | 0.80 | % | | Peregrine Capital Management, Inc. | | | 0.45 | % | | | 0.40 | % |
Core Bond Portfolio | | | 0.40 | % | | | 0.30 | % | | | 0.36 | % | | WellsCap | | | 0.20 | % | | | 0.10 | % |
Managed Fixed Income Portfolio | | | 0.40 | % | | | 0.30 | % | | | 0.40 | % | | Galliard Capital Management, Inc. | | | 0.20 | % | | | 0.10 | % |
Real Return Portfolio | | | 0.40 | % | | | 0.30 | % | | | 0.40 | % | | WellsCap | | | 0.20 | % | | | 0.10 | % |
Stable Income Portfolio | | | 0.30 | % | | | 0.225 | % | | | 0.30 | % | | Galliard Capital Management, Inc. | | | 0.15 | % | | | 0.05 | % |
| 1. | Prior to October 1, 2014, Funds Management received an annual advisory fee which started at 0.65% and declined to 0.55% as the average daily net assets of the Portfolio increased. |
Funds Management has voluntarily waived and/or reimbursed advisory fees to the extent necessary to maintain certain net operating expense ratios for the Portfolios.
| | | | | | |
| Notes to financial statements (unaudited) | | Wells Fargo Advantage Allocation Funds | | | 137 | |
5. INVESTMENT PORTFOLIO TRANSACTIONS
Purchases and sales of investments, excluding short-term securities, for the six months ended November 30, 2014 were as follows:
| | | | | | | | | | | | | | | | |
| | | Purchases at cost | | | Sales proceeds | |
| | | U.S. government | | | Non-U.S. government | | | U.S. government | | | Non-U.S. government | |
C&B Large Cap Value Portfolio | | $ | 0 | | | $ | 50,922,608 | | | $ | 0 | | | $ | 58,360,404 | |
Diversified Large Cap Growth Portfolio | | | 0 | | | | 30,576,822 | | | | 0 | | | | 41,819,044 | |
Emerging Growth Portfolio | | | 0 | | | | 289,640,396 | | | | 0 | | | | 366,303,121 | |
Index Portfolio | | | 0 | | | | 56,116,557 | | | | 0 | | | | 219,537,688 | |
International Growth Portfolio | | | 0 | | | | 37,678,197 | | | | 0 | | | | 39,067,441 | |
International Value Portfolio | | | 0 | | | | 52,587,974 | | | | 0 | | | | 35,289,731 | |
Large Company Value Portfolio | | | 0 | | | | 34,795,753 | | | | 0 | | | | 42,038,264 | |
Small Company Growth Portfolio | | | 0 | | | | 207,779,771 | | | | 0 | | | | 117,145,296 | |
Small Company Value Portfolio | | | 0 | | | | 47,146,848 | | | | 0 | | | | 54,932,659 | |
Core Bond Portfolio | | | 7,725,789,756 | | | | 1,311,708,402 | | | | 7,714,390,320 | | | | 1,209,803,078 | |
Managed Fixed Income Portfolio | | | 3,178,344 | | | | 15,854,177 | | | | 10,545,300 | | | | 4,198,013 | |
Real Return Portfolio | | | 1,433,360 | | | | 0 | | | | 4,059,988 | | | | 0 | |
Stable Income Portfolio | | | 0 | | | | 3,995,303 | | | | 0 | | | | 2,959,500 | |
6. DERIVATIVE TRANSACTIONS
During the six months ended November 30, 2014, Index Portfolio entered into futures contracts to gain market exposure. During the six months ended November 30, 2014, Real Return Portfolio and Stable Income Portfolio entered into futures contracts to speculate on interest rates and to help manage the duration of each portfolio.
At November 30, 2014, the Portfolios had long and short futures contracts outstanding as follows:
| | | | | | | | | | | | | | | | | | | | | | |
| | | Expiration date | | | Counterparty | | | Contracts | | | Type | | Contract value at
November 30, 2014 | | | Unrealized gains (losses) | |
Index Portfolio | | | 12/18/2014 | | | | Jefferies Bache | | | | 71 Long | | | S&P 500 Index | | $ | 36,676,825 | | | $ | 1,535,370 | |
Stable Income Portfolio | | | 3/31/2015 | | | | JPMorgan | | | | 20 Short | | | 5 Year U.S. Treasury Notes | | | 2,389,844 | | | | (10,353 | ) |
At November 30, 2014, Real Return Portfolio did not have any open futures contracts.
At November 30, 2014, Stable Income Portfolio had segregated $18,000 as cash collateral for open futures contracts.
The Portfolios had average notional amounts in futures contracts during the six months ended November 30, 2014 as follows:
| | | | | | | | |
| | | Long contracts | | | Short contracts | |
Index Portfolio | | $ | 56,300,311 | | | $ | 0 | |
Real Return Portfolio | | | 0 | | | | 58,023 | |
Stable Income Portfolio | | | 0 | | | | 2,405,457 | |
The payable for daily variation margin on open futures contracts reflected in the Statements of Assets and Liabilities only represents the current day’s variation margin. The realized gains or losses and change in unrealized gains or losses on derivative instruments are reflected in the Statements of Operations.
For certain types of derivative transactions, the Portfolios have entered into International Swaps and Derivatives Association, Inc. master agreements (“ISDA Master Agreements”) or similar agreements with approved counterparties. The ISDA Master Agreements or similar agreements may have requirements to deliver/deposit securities or cash to/with
| | | | |
| 138 | | Wells Fargo Advantage Allocation Funds | | Notes to financial statements (unaudited) |
an exchange or broker-dealer as collateral and allows the Portfolio to offset, with each counterparty, certain derivative financial instrument’s assets and/or liabilities with collateral held or pledged. Collateral requirements differ by type of derivative. Collateral or margin requirements are set by the broker or exchange clearing house for exchange traded derivatives while collateral terms are contract specific for over-the-counter traded derivatives. Cash collateral that has been pledged to cover obligations of the Portfolios under ISDA Master Agreements or similar agreements, if any, will be reported separately in the Statements of Assets and Liabilities. Securities pledged as collateral, if any, for the same purpose are noted in the Portfolio of Investments or Summary Portfolio of Investments. With respect to balance sheet offsetting, absent an event of default by the counterparty or a termination of the agreement, the reported amounts of financial assets and financial liabilities in the Statements of Assets and Liabilities are not offset across transactions between the Portfolio and the applicable counterparty. A reconciliation of the gross amounts on the Statements of Assets and Liabilities to the net amounts by derivative type, including any collateral exposure, is as follows:
| | | | | | | | | | | | | | | | | | | | |
| | | Derivative type | | Counterparty | | Gross amounts of liabilities in the Statements of Assets and Liabilities | | | Amounts subject to netting agreements | | | Collateral pledged 1 | | | Net amount of liabilities | |
| Index Portfolio | | Futures – variation margin | | Jefferies Bache | | $ | 107,505 | | | $ | 0 | | | $ | (107,505 | ) | | $ | 0 | |
| Stable Income Portfolio | | Futures – variation margin | | JPMorgan | | | 4,063 | | | | 0 | | | | (4,063 | ) | | | 0 | |
| 1. | Collateral pledged within this table is limited to the collateral for the net transaction with the counterparty. |
7. CONCENTRATION RISK
Concentration risks result from exposure to a limited number of sectors, countries or geographical regions. Portfolios that invest a substantial portion of their assets in a sector may be more affected by changes in that sector than would be a fund whose investments are not heavily weighted in any sector. Portfolios that focus their investments in particular countries or geographic regions may be particularly susceptible to economic and political events affecting those countries or regions. The Portfolio of Investments or Summary Portfolio of Investments includes information on each Portfolio’s holdings, including sector, country and/or geographical composition, as relevant.
8. INDEMNIFICATION
Under the Trust’s organizational documents, the officers and Trustees are indemnified against certain liabilities that may arise out of performance of their duties to the Trust. Additionally, in the normal course of business, the Trust may enter into contracts with service providers that contain a variety of indemnification clauses. The Trust’s maximum exposure under these arrangements is dependent on future claims that may be made against the Portfolios and, therefore, cannot be estimated.
| | | | | | |
| Other information (unaudited) | | Wells Fargo Advantage Allocation Funds | | | 139 | |
PROXY VOTING INFORMATION
A description of the policies and procedures used to determine how to vote proxies relating to portfolio securities is available without charge, upon request, by calling 1-800-222-8222, visiting our website at wellsfargoadvantagefunds.com, or visiting the SEC website at sec.gov. Information regarding how the proxies related to portfolio securities were voted during the most recent 12-month period ended June 30 is available without charge on the website at wellsfargoadvantagefunds.com or by visiting the SEC website at sec.gov.
PORTFOLIO HOLDINGS INFORMATION
The complete portfolio holdings are publicly available on the website (wellsfargoadvantagefunds.com) on a one-month delayed basis. In addition, top ten holdings information (excluding derivative positions) is publicly available on the website on a monthly, seven-day or more delayed basis. Each Fund and Portfolio files its complete schedule of portfolio holdings with the SEC for the first and third quarters of each fiscal year on Form N-Q, which is available by visiting the SEC website at sec.gov. In addition, each Form N-Q may be reviewed and copied at the SEC’s Public Reference Room in Washington, DC, and at regional offices in New York City, at 233 Broadway, and in Chicago, at 175 West Jackson Boulevard, Suite 900. Information about the Public Reference Room may be obtained by calling 1-800-SEC-0330.
| | | | |
| 140 | | Wells Fargo Advantage Allocation Funds | | Other information (unaudited) |
BOARD OF TRUSTEES AND OFFICERS
Each of the Trustees and Officers1 listed in the table below acts in identical capacities for each fund in the Wells Fargo Advantage family of funds, which consists of 133 mutual funds comprising the Wells Fargo Funds Trust, Wells Fargo Variable Trust, Wells Fargo Master Trust and four closed-end funds (collectively the “Fund Complex”). This table should be read in conjunction with the Prospectus and the Statement of Additional Information2. The mailing address of each Trustee and Officer is 525 Market Street, 12th Floor, San Francisco, CA 94105. Each Trustee and Officer serves an indefinite term, however, each Trustee serves such term until reaching the mandatory retirement age established by the Trustees.
Independent Trustees
| | | | | | |
Name and year of birth | | Position held and length of service* | | Principal occupations during past five years or longer | | Other directorships during past five years |
Peter G. Gordon (Born 1942) | | Trustee, since 1998; Chairman, since 2005 | | Co-Founder, Retired Chairman, President and CEO of Crystal Geyser Water Company. Trustee Emeritus, Colby College. | | Asset Allocation Trust |
Isaiah Harris, Jr. (Born 1952) | | Trustee, since 2009 | | Retired. Prior thereto, President and CEO of BellSouth Advertising and Publishing Corp. from 2005 to 2007, President and CEO of BellSouth Enterprises from 2004 to 2005 and President of BellSouth Consumer Services from 2000 to 2003. Emeritus member of the Iowa State University Foundation Board of Governors. Emeritus Member of the Advisory Board of Iowa State University School of Business. Advisory Board Member, Palm Harbor Academy. Mr. Harris is a certified public accountant. | | CIGNA Corporation; Asset Allocation Trust |
Judith M. Johnson (Born 1949) | | Trustee, since 2008; Audit Committee Chairman, since 2008 | | Retired. Prior thereto, Chief Executive Officer and Chief Investment Officer of Minneapolis Employees Retirement Fund from 1996 to 2008. Ms. Johnson is an attorney, certified public accountant and a certified managerial accountant. | | Asset Allocation Trust |
Leroy Keith, Jr. (Born 1939) | | Trustee, since 2010** | | Chairman, Bloc Global Services (development and construction). Trustee of the Evergreen Funds complex (and its predecessors) from 1983 to 2010. Former Managing Director, Almanac Capital Management (commodities firm), former Partner, Stonington Partners, Inc. (private equity fund), former Director, Obagi Medical Products Co. and former Director, Lincoln Educational Services. | | Trustee, Virtus Fund Complex (consisting of 50 portfolios as of 12/16/2013); Asset Allocation Trust |
David F. Larcker (Born 1950) | | Trustee, since 2009 | | James Irvin Miller Professor of Accounting at the Graduate School of Business, Stanford University, Morgan Stanley Director of the Center for Leadership Development and Research and Senior Faculty of The Rock Center for Corporate Governance since 2006. From 2005 to 2008, Professor of Accounting at the Graduate School of Business, Stanford University. Prior thereto, Ernst & Young Professor of Accounting at The Wharton School, University of Pennsylvania from 1985 to 2005. | | Asset Allocation Trust |
Olivia S. Mitchell (Born 1953) | | Trustee, since 2006 | | International Foundation of Employee Benefit Plans Professor, Wharton School of the University of Pennsylvania since 1993. Director of Wharton’s Pension Research Council and Boettner Center on Pensions & Retirement Research, and Research Associate at the National Bureau of Economic Research. Previously, Cornell University Professor from 1978 to 1993. | | Asset Allocation Trust |
Timothy J. Penny (Born 1951) | | Trustee, since 1996 | | President and CEO of Southern Minnesota Initiative Foundation, a non-profit organization, since 2007 and Senior Fellow at the Humphrey Institute Policy Forum at the University of Minnesota since 1995. Member of the Board of Trustees of NorthStar Education Finance, Inc., a non-profit organization, since 2007. | | Asset Allocation Trust |
| | | | | | |
| Other information (unaudited) | | Wells Fargo Advantage Allocation Funds | | | 141 | |
| | | | | | |
Name and year of birth | | Position held and length of service* | | Principal occupations during past five years or longer | | Other directorships during past five years |
Michael S. Scofield (Born 1943) | | Trustee, since 2010 | | Served on the Investment Company Institute’s Board of Governors and Executive Committee from 2008-2011 as well the Governing Council of the Independent Directors Council from 2006-2011 and the Independent Directors Council Executive Committee from 2008-2011. Chairman of the IDC from 2008-2010. Institutional Investor (Fund Directions) Trustee of Year in 2007. Trustee of the Evergreen Funds complex (and its predecessors) from 1984 to 2010. Chairman of the Evergreen Funds from 2000-2010. Former Trustee of the Mentor Funds. Retired Attorney, Law Offices of Michael S. Scofield. | | Asset Allocation Trust |
Donald C. Willeke (Born 1940) | | Trustee, since 1996 | | Principal of the law firm of Willeke & Daniels. General Counsel of the Minneapolis Employees Retirement Fund from 1984 until its consolidation into the Minnesota Public Employees Retirement Association on June 30, 2010. Director and Vice Chair of The Tree Trust (non-profit corporation). Director of the American Chestnut Foundation (non-profit corporation). | | Asset Allocation Trust |
| * | Length of service dates reflect the Trustee’s commencement of service with the Trust’s predecessor entities, where applicable. |
| ** | Leroy Keith, Jr. retired as a Trustee effective December 31, 2014. |
Officers
| | | | | | |
Name and year of birth | | Position held and length of service | | Principal occupations during past five years or longer | | |
Karla M. Rabusch (Born 1959) | | President, since 2003 | | Executive Vice President of Wells Fargo Bank, N.A. and President of Wells Fargo Funds Management, LLC since 2003. | | |
Jeremy DePalma1 (Born 1974) | | Treasurer, since 2012 | | Senior Vice President of Wells Fargo Funds Management, LLC since 2009. Senior Vice President of Evergreen Investment Management Company, LLC from 2008 to 2010. Vice President, Evergreen Investment Services, Inc. from 2004 to 2007. Head of the Fund Reporting and Control Team within Fund Administration from 2005 to 2010. | | |
Nancy Wiser1 (Born 1967) | | Treasurer, since 2012 | | Executive Vice President of Wells Fargo Funds Management, LLC since 2011. Chief Operating Officer and Chief Compliance Officer at LightBox Capital Management LLC, from 2008 to 2011. Owned and operated a consulting business providing services to various hedge funds including acting as Chief Operating Officer and Chief Compliance Officer for a hedge fund from 2007 to 2008. Chief Operating Officer and Chief Compliance Officer of GMN Capital LLC from 2006 to 2007. | | |
C. David Messman (Born 1960) | | Secretary, since 2000; Chief Legal Officer, since 2003 | | Assistant General Counsel of Wells Fargo Bank, N.A. since 2013 and Vice President and Managing Counsel of Wells Fargo Bank N.A. from 1996 to 2013. Senior Vice President and Secretary of Wells Fargo Funds Management, LLC since 2001. | | |
Debra Ann Early (Born 1964) | | Chief Compliance Officer, since 2007 | | Senior Vice President and Chief Compliance Officer of Wells Fargo Funds Management, LLC since 2007. Chief Compliance Officer of Parnassus Investments from 2005 to 2007. Chief Financial Officer of Parnassus Investments from 2004 to 2007. | | |
David Berardi (Born 1975) | | Assistant Treasurer, since 2009 | | Vice President of Wells Fargo Funds Management, LLC since 2009. Vice President of Evergreen Investment Management Company, LLC from 2008 to 2010. Assistant Vice President of Evergreen Investment Services, Inc. from 2004 to 2008. Manager of Fund Reporting and Control for Evergreen Investment Management Company, LLC from 2004 to 2010. | | |
| 1. | Jeremy DePalma acts as Treasurer of Growth Balanced Fund, Moderate Balanced Fund, International Growth Portfolio, and International Value Portfolio and Assistant Treasurer of the remaining funds in this shareholder report. In addition, Jeremy DePalma acts as Treasurer of 56 other funds and Assistant Treasurer of 62 other funds in the Fund Complex. Nancy Wiser serves as Treasurer of the remaining funds in this shareholder report as well as 62 other funds in the Fund Complex. |
| 2. | The Statement of Additional Information includes additional information about the Trustees and is available, without charge, upon request, by calling 1-800-222-8222 or by visiting the website at wellsfargoadvantagefunds.com. |
| | | | |
| 142 | | Wells Fargo Advantage Allocation Funds | | List of abbreviations |
The following is a list of common abbreviations for terms and entities that may have appeared in this report.
| ACA | — ACA Financial Guaranty Corporation |
| ADR | — American depositary receipt |
| ADS | — American depositary shares |
| AGC | — Assured Guaranty Corporation |
| AGM | — Assured Guaranty Municipal |
| Ambac | — Ambac Financial Group Incorporated |
| AMT | — Alternative minimum tax |
| BAN | — Bond anticipation notes |
| BHAC | — Berkshire Hathaway Assurance Corporation |
| CAB | — Capital appreciation bond |
| CCAB | — Convertible capital appreciation bond |
| CDA | — Community Development Authority |
| CDO | — Collateralized debt obligation |
| DRIVER | — Derivative inverse tax-exempt receipts |
| DW&P | — Department of Water & Power |
| DWR | — Department of Water Resources |
| ECFA | — Educational & Cultural Facilities Authority |
| EDA | — Economic Development Authority |
| EDFA | — Economic Development Finance Authority |
| ETF | — Exchange-traded fund |
| FDIC | — Federal Deposit Insurance Corporation |
| FFCB | — Federal Farm Credit Banks |
| FGIC | — Financial Guaranty Insurance Corporation |
| FHA | — Federal Housing Administration |
| FHLB | — Federal Home Loan Bank |
| FHLMC | — Federal Home Loan Mortgage Corporation |
| FICO | — The Financing Corporation |
| FNMA | — Federal National Mortgage Association |
| GDR | — Global depositary receipt |
| GNMA | — Government National Mortgage Association |
| HCFR | — Healthcare facilities revenue |
| HEFA | — Health & Educational Facilities Authority |
| HEFAR | — Higher education facilities authority revenue |
| HFA | — Housing Finance Authority |
| HFFA | — Health Facilities Financing Authority |
| HUD | — Department of Housing and Urban Development |
| IDA | — Industrial Development Authority |
| IDAG | — Industrial Development Agency |
| KRW | — Republic of Korea won |
| LIBOR | — London Interbank Offered Rate |
| LLC | — Limited liability company |
| LLLP | — Limited liability limited partnership |
| LLP | — Limited liability partnership |
| MBIA | — Municipal Bond Insurance Association |
| MFHR | — Multifamily housing revenue |
| MSTR | — Municipal securities trust receipts |
| MUD | — Municipal Utility District |
| National | — National Public Finance Guarantee Corporation |
| PCFA | — Pollution Control Financing Authority |
| PCL | — Public Company Limited |
| PCR | — Pollution control revenue |
| PFA | — Public Finance Authority |
| PFFA | — Public Facilities Financing Authority |
| PFOTER | — Puttable floating option tax-exempt receipts |
| plc | — Public limited company |
| PUTTER | — Puttable tax-exempt receipts |
| R&D | — Research & development |
| Radian | — Radian Asset Assurance |
| RAN | — Revenue anticipation notes |
| RDA | — Redevelopment Authority |
| RDFA | — Redevelopment Finance Authority |
| REIT | — Real estate investment trust |
| ROC | — Reset option certificates |
| SAVRS | — Select auction variable rate securities |
| SBA | — Small Business Authority |
| SFHR | — Single-family housing revenue |
| SFMR | — Single-family mortgage revenue |
| SPA | — Standby purchase agreement |
| SPDR | — Standard & Poor’s Depositary Receipts |
| STRIPS | — Separate trading of registered interest and |
| TAN | — Tax anticipation notes |
| TIPS | — Treasury inflation-protected securities |
| TRAN | — Tax revenue anticipation notes |
| TTFA | — Transportation Trust Fund Authority |
| TVA | — Tennessee Valley Authority |
This page is intentionally left blank.
This page is intentionally left blank.


For more information
More information about Wells Fargo Advantage Funds is available free upon request. To obtain literature, please write, email, visit the Fund’s website, or call:
Wells Fargo Advantage Funds
P.O. Box 8266
Boston, MA 02266-8266
Email: wfaf@wellsfargo.com
Website: wellsfargoadvantagefunds.com
Individual investors: 1-800-222-8222
Retail investment professionals: 1-888-877-9275
Institutional investment professionals: 1-866-765-0778
This report and the financial statements contained herein are submitted for the general information of the shareholders of Wells Fargo Advantage Funds. If this report is used for promotional purposes, distribution of the report must be accompanied or preceded by a current prospectus. Before investing, please consider the investment objectives, risks, charges, and expenses of the investment. For a current prospectus and, if available, a summary prospectus, containing this information, call 1-800-222-8222 or visit the Fund’s website at wellsfargoadvantagefunds.com. Read the prospectus carefully before you invest or send money.
Wells Fargo Funds Management, LLC, a wholly owned subsidiary of Wells Fargo & Company, provides investment advisory and administrative services for Wells Fargo Advantage Funds. Other affiliates of Wells Fargo & Company provide subadvisory and other services for the Funds. The Funds are distributed by Wells Fargo Funds Distributor, LLC, Member FINRA/SIPC, an affiliate of Wells Fargo & Company.
NOT FDIC INSURED ¡ NO BANK GUARANTEE ¡ MAY LOSE VALUE
© 2014 Wells Fargo Funds Management, LLC. All rights reserved.
| | |
 | | 229720 01-15 SAAFNLD/SAR109 11-14 |

Wells Fargo Advantage Equity Gateway Funds

Semi-Annual Report
November 30, 2014
| n | | Wells Fargo Advantage C&B Large Cap Value Fund |
| n | | Wells Fargo Advantage Diversified Equity Fund |
| n | | Wells Fargo Advantage Emerging Growth Fund |
| n | | Wells Fargo Advantage Index Fund |
| n | | Wells Fargo Advantage International Value Fund |
| n | | Wells Fargo Advantage Small Company Growth Fund |
| n | | Wells Fargo Advantage Small Company Value Fund |

Reduce clutter. Save trees.
Sign up for electronic delivery of prospectuses and shareholder reports at wellsfargo.com/advantagedelivery
Contents
The views expressed and any forward-looking statements are as of November 30, 2014, unless otherwise noted, and are those of the Fund managers and/or Wells Fargo Funds Management, LLC. Discussions of individual securities, or the markets generally, or any Wells Fargo Advantage Fund are not intended as individual recommendations. Future events or results may vary significantly from those expressed in any forward-looking statements; the views expressed are subject to change at any time in response to changing circumstances in the market. Wells Fargo Funds Management, LLC and the Funds disclaim any obligation to publicly update or revise any views expressed or forward-looking statements.
NOT FDIC INSURED ¡ NO BANK GUARANTEE ¡ MAY LOSE VALUE
| | | | |
| 2 | | Wells Fargo Advantage Equity Gateway Funds | | Letter to shareholders (unaudited) |

Karla M. Rabusch
President
Wells Fargo Advantage Funds
Throughout the reporting period, the Federal Open Market Committee (FOMC), which is the U.S. Federal Reserve’s (Fed’s) monetary policymaking body, kept its key interest rate near zero.
Dear Valued Shareholder:
We are pleased to offer you this semi-annual report for the Wells Fargo Advantage Equity Gateway Funds for the six-month period that ended November 30, 2014. The period was marked by heightened geopolitical uncertainty as the U.S. and Europe continued to confront Russia over Ukraine and as the U.S. and its allies confronted Islamic militants (formerly known as ISIS) in Syria and Iraq. The U.S. stock market outperformed most international markets; the S&P 500 Index1, a proxy for U.S. large-cap stocks, ended the period with an 8.58% gain, while the MSCI EAFE Index (Net)2, a proxy for international developed markets, ended the period with a 5.07% loss.
Major central banks continued to provide liquidity to the markets.
Throughout the reporting period, the Federal Open Market Committee (FOMC), which is the U.S. Federal Reserve’s (Fed’s) monetary policymaking body, kept its key interest rate near zero. This tended to support global markets given the Fed’s role in providing investor liquidity. Throughout most of the reporting period, the FOMC reduced (or tapered) its bond-buying program by $10 billion per month; the FOMC brought the program to an end in late October 2014. Although the FOMC kept its key interest rate near zero, its guidance led investors to expect an interest-rate hike sometime in 2015.
In June 2014, the European Central Bank (ECB) announced a variety of measures aimed at encouraging lending, including making funds available to banks at low interest rates and imposing a negative interest rate on bank deposits held at the central bank. In September 2014, the ECB cut its key rate to a historic low of 0.05% and increased its negative interest rate. In Japan, the Bank of Japan (BOJ) maintained an aggressive monetary program aimed at combating deflation by doubling the bank’s asset base over two years. In late October 2014, the BOJ deepened its commitment to monetary easing by increasing its asset purchases.
The U.S. market rose against the backdrop of a challenging geopolitical situation and slowing global growth.
Geopolitical events were major negatives throughout the reporting period. The ongoing standoff between the West (the U.S., Europe, and their allies) and Russia over Ukraine began in late 2013 and continued throughout the reporting period. As of November 2014, most investors believed that the situation would not result in a war. However, economic sanctions from the West against Russia and from Russia against the West contributed to slower growth in Europe, a key Russian trading partner. In the Middle East, the advance of Islamic militants in Syria and Iraq led to airstrikes by the U.S. and its allies and fears of a prolonged regional war.
Market volatility increased toward the end of the reporting period as renewed fears of slowing global growth took hold and investors began to price in expectations that the FOMC was finally looking to raise short-tem interest rates. Economic news out of Europe was modestly positive during the period. The 28 countries in the European Union did report stronger growth in the third quarter of 2014 than in the second quarter, but the growth rates (less than 1.5% annualized)
| 1. | The S&P 500 Index consists of 500 stocks chosen for market size, liquidity, and industry group representation. It is a market-value-weighted index with each stock’s weight in the index proportionate to its market value. You cannot invest directly in an index. |
| 2. | The Morgan Stanley Capital International Europe, Australasia, and Far East (MSCI EAFE) Index (Net) is an unmanaged group of securities widely regarded by investors to be representations of the stock markets of Europe, Australasia, and the Far East. Calculations for EAFE use net dividends, which reflect the deduction of withholding taxes. You cannot invest directly in an index. Source: MSCI. MSCI makes no express or implied warranties or representations and shall have no liability whatsoever with respect to any MSCI data contained herein. The MSCI data may not be further redistributed or used as a basis for other indexes or any securities or financial products. This report is not approved, reviewed, or produced by MSCI. |
| | | | | | |
| Letter to shareholders (unaudited) | | Wells Fargo Advantage Equity Gateway Funds | | | 3 | |
remained below those of the U.S. Modest European growth combined with expectations of higher U.S. interest rates to send the euro lower during the quarter, pressuring European returns for U.S. dollar–denominated investors. Returns in Asia were dampened by a sluggish Japanese economy as well as a late-period decline in the yen. Among countries in the MSCI EAFE Index (Net), most of the major markets (such as Japan, Germany, and France), ended the period with losses. By contrast, U.S. economic news remained favorable; gross domestic product annualized growth was at least 3.5% in the second and third quarters of 2014, pushing the U.S. stock market to a solid gain.
Don’t let short-term uncertainty derail long-term investment goals.
Periods of uncertainty can present challenges, but experience has taught us that maintaining long-term investment goals can be an effective way to plan for the future. To help you create a sound strategy based on your personal goals and risk tolerance, Wells Fargo Advantage Funds offers more than 100 mutual funds and other investments spanning a wide range of asset classes and investment styles. Although diversification cannot guarantee an investment profit or prevent losses, we believe it can be an effective way to manage investment risk and potentially smooth out overall portfolio performance. We encourage investors to know their investments and to understand that appropriate levels of risk-taking may unlock opportunities.
Thank you for choosing to invest with Wells Fargo Advantage Funds. We appreciate your confidence in us and remain committed to helping you meet your financial needs. For current information about your fund investments, contact your investment professional, visit our website at wellsfargoadvantagefunds.com, or call us directly at 1-800-222-8222. We are available 24 hours a day, 7 days a week.
Sincerely,

Karla M. Rabusch
President
Wells Fargo Advantage Funds
Modest European growth combined with expectations of higher U.S. interest rates to send the euro lower during the quarter, pressuring European returns for U.S. dollar-denominated investors.
| | | | |
| 4 | | Wells Fargo Advantage Equity Gateway Funds | | Performance highlights (unaudited) |
Wells Fargo Advantage C&B Large Cap Value Fund1
Investment objective
The Fund seeks maximum long-term total return (current income and capital appreciation), consistent with minimizing risk to principal.
Adviser
Wells Fargo Funds Management, LLC
Subadviser for the master portfolio
Cooke & Bieler, L.P.
Portfolio managers
Steve Lyons, CFA
Michael M. Myers, CFA
Edward W. O’Connor, CFA
R. James O’Neil, CFA
Mehul Trivedi, CFA
William Weber, CFA
Andrew Armstrong, CFA2
Average annual total returns3 (%) as of November 30, 2014
| | | | | | | | | | | | | | | | | | | | | | | | | | | | | | | | | | |
| | | | | Including sales charge | | | Excluding sales charge | | | Expense ratios4 (%) | |
| | | Inception date | | 1 year | | | 5 year | | | 10 year | | | 1 year | | | 5 year | | | 10 year | | | Gross | | | Net5 | |
| Class A (CBEAX) | | 7-26-2004 | | | 5.56 | | | | 12.09 | | | | 5.91 | | | | 11.99 | | | | 13.42 | | | | 6.54 | | | | 1.31 | | | | 1.15 | |
| Class B (CBEBX)* | | 7-26-2004 | | | 6.15 | | | | 12.32 | | | | 5.99 | | | | 11.15 | | | | 12.57 | | | | 5.99 | | | | 2.06 | | | | 1.90 | |
| Class C (CBECX) | | 7-26-2004 | | | 10.20 | | | | 12.59 | | | | 5.75 | | | | 11.20 | | | | 12.59 | | | | 5.75 | | | | 2.06 | | | | 1.90 | |
| Administrator Class (CBLLX) | | 7-26-2004 | | | – | | | | – | | | | – | | | | 12.20 | | | | 13.63 | | | | 6.75 | | | | 1.15 | | | | 0.95 | |
| Institutional Class (CBLSX) | | 7-26-2004 | | | – | | | | – | | | | – | | | | 12.46 | | | | 13.92 | | | | 7.04 | | | | 0.88 | | | | 0.70 | |
| Investor Class (CBEQX) | | 5-15-1990 | | | – | | | | – | | | | – | | | | 12.01 | | | | 13.41 | | | | 6.52 | | | | 1.37 | | | | 1.20 | |
| Russell 1000® Value Index6 | | – | | | – | | | | – | | | | – | | | | 15.62 | | | | 15.69 | | | | 7.59 | | | | – | | | | – | |
| * | | Class B shares are closed to investment, except in connection with the reinvestment of any distributions and permitted exchanges. |
Figures quoted represent past performance, which is no guarantee of future results, and do not reflect taxes that a shareholder may pay on fund distributions or the redemption of fund shares. Investment return and principal value of an investment will fluctuate so that an investor’s shares, when redeemed, may be worth more or less than their original cost. Performance shown without sales charges would be lower if sales charges were reflected. Current performance may be lower or higher than the performance data quoted, which assumes the reinvestment of dividends and capital gains. Current month-end performance is available on the Fund’s website, wellsfargoadvantagefunds.com.
Index returns do not include transaction costs associated with buying and selling securities, any mutual fund fees or expenses, or any taxes. It is not possible to invest directly in an index.
For Class A shares, the maximum front-end sales charge is 5.75%. For Class B shares, the maximum contingent deferred sales charge is 5.00%. For Class C shares, the maximum contingent deferred sales charge is 1.00%. Performance including a contingent deferred sales charge assumes the sales charge for the corresponding time period. Administrator Class, Institutional Class, and Investor Class shares are sold without a front-end sales charge or contingent deferred sales charge.
Stock values fluctuate in response to the activities of individual companies and general market and economic conditions. Consult the Fund’s prospectus for additional information on these and other risks.
Please see footnotes on page 5.
| | | | | | |
| Performance highlights (unaudited) | | Wells Fargo Advantage Equity Gateway Funds | | | 5 | |
Wells Fargo Advantage C&B Large Cap Value Fund (continued)
| | | | |
| Ten largest long-term holdings7 (%) as of November 30, 2014 | |
State Street Corporation | | | 3.40 | |
Crown Holdings Incorporated | | | 2.83 | |
JPMorgan Chase & Company | | | 2.70 | |
Omnicom Group Incorporated | | | 2.53 | |
Carnival Corporation | | | 2.38 | |
The Progressive Corporation | | | 2.33 | |
United Parcel Service Incorporated Class B | | | 2.33 | |
Laboratory Corporation of America Holdings | | | 2.26 | |
Johnson & Johnson | | | 2.20 | |
Philip Morris International | | | 2.19 | |
|
| Sector distribution8 as of November 30, 2014 |
|

|
| 1. | The Fund is a gateway feeder fund that invests all of its assets in a single affiliated master portfolio of the Wells Fargo Master Trust with a substantially similar investment objective and substantially similar investment strategies. References to the investment activities of the Fund are intended to refer to the investment activities of the affiliated master portfolio in which it invests. |
| 2. | Effective February 1, 2015, Andrew Armstrong became co-portfolio manager of the Fund. |
| 3. | Effective June 20, 2008, Class D was renamed Investor Class and modified to assume the features and attributes of the Investor Class. |
| 4. | Reflects the expense ratios as stated in the most recent prospectuses. The expense ratios shown are subject to change and may differ from the annualized expense ratios shown in the financial highlights of this report. |
| 5. | The Adviser has committed through September 30, 2015, to waive fees and/or reimburse expenses to the extent necessary to cap the Fund’s Total Annual Fund Operating Expenses After Fee Waiver, excluding certain expenses, at the amounts shown. After this time, the cap may be increased or the commitment to maintain the cap may be terminated only with the approval of the Board of Trustees. Brokerage commissions, stamp duty fees, interest, taxes, acquired fund fees and expenses, and extraordinary expenses are excluded from the cap. Fees from the affiliated master portfolio are included in the cap. Without this cap, the Fund’s returns would have been lower. |
| 6. | The Russell 1000® Value Index measures the performance of those Russell 1000 companies with lower price-to-book ratios and lower forecasted growth values. You cannot invest directly in an index. |
| 7. | The ten largest equity holdings are calculated based on the value of the securities of the affiliated master portfolio allocable to the Fund divided by the total net assets of the Fund. Holdings are subject to change and may have changed since the date specified. |
| 8. | Sector distribution is subject to change and represents the sector distribution of the affiliated master portfolio which is calculated based on the total long-term investments of the affiliated master portfolio. |
| | | | |
| 6 | | Wells Fargo Advantage Equity Gateway Funds | | Performance highlights (unaudited) |
Wells Fargo Advantage Diversified Equity Fund1
Investment objective
The Fund seeks long-term capital appreciation.
Adviser
Wells Fargo Funds Management, LLC
Subadvisers for the master portfolios
Artisan Partners Limited Partnership
Cooke & Bieler, L.P.
Golden Capital Management, LLC
LSV Asset Management
Peregrine Capital Management, Inc.
Phocas Financial Corporation
Wells Capital Management Incorporated
Portfolio managers
Thomas C. Biwer, CFA
Erik Sens, CFA
Aldo Ceccarelli, CFA
Average annual total returns (%) as of November 30, 2014
| | | | | | | | | | | | | | | | | | | | | | | | | | | | | | | | | | |
| | | | | Including sales charge | | | Excluding sales charge | | | Expense ratios2 (%) | |
| | | Inception date | | 1 year | | | 5 year | | | 10 year | | | 1 year | | | 5 year | | | 10 year | | | Gross | | | Net3 | |
| Class A (NVDAX) | | 5-2-1996 | | | 3.55 | | | | 12.10 | | | | 5.88 | | | | 9.87 | | | | 13.43 | | | | 6.51 | | | | 1.43 | | | | 1.25 | |
| Class B (NVDBX)* | | 5-6-1996 | | | 4.05 | | | | 12.33 | | | | 5.94 | | | | 9.05 | | | | 12.58 | | | | 5.94 | | | | 2.18 | | | | 2.00 | |
| Class C (WFDEX) | | 10-1-1998 | | | 8.07 | | | | 12.59 | | | | 5.71 | | | | 9.07 | | | | 12.59 | | | | 5.71 | | | | 2.18 | | | | 2.00 | |
| Administrator Class (NVDEX) | | 11-11-1994 | | | – | | | | – | | | | – | | | | 10.18 | | | | 13.72 | | | | 6.77 | | | | 1.27 | | | | 1.00 | |
| Diversified Equity Composite Index4 | | – | | | – | | | | – | | | | – | | | | 12.79 | | | | 14.77 | | | | 7.84 | | | | – | | | | – | |
| MSCI EAFE Index (Net)5 | | – | | | – | | | | – | | | | – | | | | (0.02 | ) | | | 6.38 | | | | 5.25 | | | | – | | | | – | |
| Russell 1000® Growth Index6 | | – | | | – | | | | – | | | | – | | | | 17.50 | | | | 16.77 | | | | 9.02 | | | | – | | | | – | |
| Russell 1000® Value Index7 | | – | | | – | | | | – | | | | – | | | | 15.62 | | | | 15.69 | | | | 7.59 | | | | – | | | | – | |
| Russell 2000 Index8 | | – | | | – | | | | – | | | | – | | | | 3.99 | | | | 16.69 | | | | 7.78 | | | | – | | | | – | |
| S&P 500 Index9 | | – | | | – | | | | – | | | | – | | | | 16.86 | | | | 15.96 | | | | 8.06 | | | | – | | | | – | |
| * | | Class B shares are closed to investment, except in connection with the reinvestment of any distributions and permitted exchanges. |
Figures quoted represent past performance, which is no guarantee of future results, and do not reflect taxes that a shareholder may pay on fund distributions or the redemption of fund shares. Investment return and principal value of an investment will fluctuate so that an investor’s shares, when redeemed, may be worth more or less than their original cost. Performance shown without sales charges would be lower if sales charges were reflected. Current performance may be lower or higher than the performance data quoted, which assumes the reinvestment of dividends and capital gains. Current month-end performance is available on the Fund’s website, wellsfargoadvantagefunds.com.
Index returns do not include transaction costs associated with buying and selling securities, any mutual fund fees or expenses, or any taxes. It is not possible to invest directly in an index.
For Class A shares, the maximum front-end sales charge is 5.75%. For Class B shares, the maximum contingent deferred sales charge is 5.00%. For Class C shares, the maximum contingent deferred sales charge is 1.00%. Performance including a contingent deferred sales charge assumes the sales charge for the corresponding time period. Administrator Class shares are sold without a front-end sales charge or contingent deferred sales charge.
Stock values fluctuate in response to the activities of individual companies and general market and economic conditions. The use of derivatives may reduce returns and/or increase volatility. Certain investment strategies tend to increase the total risk of an investment (relative to the broader market). The Fund is exposed to foreign investment risk and smaller-company securities risk. Consult the Fund’s prospectus for additional information on these and other risks.
Please see footnotes on page 7.
| | | | | | |
| Performance highlights (unaudited) | | Wells Fargo Advantage Equity Gateway Funds | | | 7 | |
Wells Fargo Advantage Diversified Equity Fund (continued)
| | | | |
| Ten largest long-term holdings10 (%) as of November 30, 2014 | |
Apple Incorporated | | | 2.18 | |
Facebook, Incorporated | | | 0.97 | |
JPMorgan Chase & Company | | | 0.97 | |
Exxon Mobil Corporation | | | 0.94 | |
Johnson & Johnson | | | 0.80 | |
Bank of America Corporation | | | 0.77 | |
American Express Company | | | 0.76 | |
Google Incorporated Class C | | | 0.72 | |
Visa Incorporated | | | 0.72 | |
The Procter & Gamble Company | | | 0.71 | |
|
| Sector distribution11 as of November 30, 2014 |
|
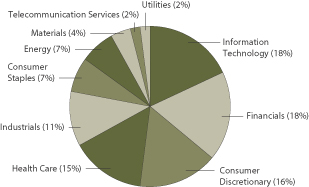 |
| 1. | The Fund is a gateway blended fund that invests all of its assets in two or more affiliated master portfolios of the Wells Fargo Master Trust in varying proportions. References to the investment activities of the Fund are intended to refer to the investment activities of the affiliated master portfolios in which it invests. |
| 2. | Reflects the expense ratios as stated in the most recent prospectuses. The expense ratios shown are subject to change and may differ from the annualized expense ratios shown in the financial highlights of this report. |
| 3. | The Adviser has committed through September 30, 2015, to waive fees and/or reimburse expenses to the extent necessary to cap the Fund’s Total Annual Fund Operating Expenses After Fee Waiver, excluding certain expenses, at the amounts shown. After this time, the cap may be increased or the commitment to maintain the cap may be terminated only with the approval of the Board of Trustees. Brokerage commissions, stamp duty fees, interest, taxes, acquired fund fees and expenses, and extraordinary expenses are excluded from the cap. Fees from the affiliated master portfolios are included in the cap. Without this cap, the Fund’s returns would have been lower. |
| 4. | Source: Wells Fargo Funds Management, LLC. The Diversified Equity Composite Index is weighted 25% in the Russell 1000® Value Index, 25% in the S&P 500 Index, 25% in the Russell 1000® Growth Index, 15% in the MSCI EAFE Index (Net), and 10% in the Russell 2000® Index. You cannot invest directly in an index. |
| 5. | The Morgan Stanley Capital International Europe, Australasia, and Far East (MSCI EAFE) Index (Net) is an unmanaged group of securities widely regarded by investors to be representations of the stock markets of Europe, Australasia, and the Far East. Calculations for EAFE use net dividends, which reflect the deduction of withholding taxes. You cannot invest directly in an index. Source: MSCI. MSCI makes no express or implied warranties or representations and shall have no liability whatsoever with respect to any MSCI data contained herein. The MSCI data may not be further redistributed or used as a basis for other indexes or any securities or financial products. This report is not approved, reviewed, or produced by MSCI. |
| 6. | The Russell 1000® Growth Index measures the performance of those Russell 1000 companies with higher price-to-book ratios and higher forecasted growth values. You cannot invest directly in an index. |
| 7. | The Russell 1000® Value Index measures the performance of those Russell 1000 companies with lower price-to-book ratios and lower forecasted growth values. You cannot invest directly in an index. |
| 8. | The Russell 2000® Index measures the performance of the 2,000 smallest companies in the Russell 3000® Index, which represents approximately 8% of the total market capitalization of the Russell 3000 Index. You cannot invest directly in an index. |
| 9. | The S&P 500 Index consists of 500 stocks chosen for market size, liquidity, and industry group representation. It is a market-value weighted index with each stock’s weight in the index proportionate to its market value. You cannot invest directly in an index. |
| 10. | The ten largest equity holdings are calculated based on the value of the securities of the affiliated master portfolios allocable to the Fund divided by the total net assets of the Fund. Holdings are subject to change and may have changed since the date specified. |
| 11. | Sector distribution is subject to change and represents the sector distribution of the affiliated master portfolios which is calculated based on the total long-term investments of the affiliated master portfolios. |
| | | | |
| 8 | | Wells Fargo Advantage Equity Gateway Funds | | Performance highlights (unaudited) |
Wells Fargo Advantage Emerging Growth Fund1
The Fund is closed to new investors2.
Investment objective
The Fund seeks long-term capital appreciation.
Adviser
Wells Fargo Funds Management, LLC
Subadviser for the master portfolio
Wells Capital Management Incorporated
Portfolio managers
Thomas C. Ognar, CFA
Joseph M. Eberhardy, CFA, CPA
Bruce C. Olson, CFA
Average annual total returns3 (%) as of November 30, 2014
| | | | | | | | | | | | | | | | | | | | | | | | | | | | | | | | | | |
| | | | | Including sales charge | | | Excluding sales charge | | | Expense ratios4 (%) | |
| | | Inception date | | 1 year | | | 5 year | | | Since
inception | | | 1 year | | | 5 year | | | Since
inception | | | Gross | | | Net5 | |
| Class A (WEMAX) | | 3-31-2008 | | | (7.65 | ) | | | 17.20 | | | | 7.45 | | | | (2.01 | ) | | | 18.59 | | | | 8.27 | | | | 1.39 | | | | 1.37 | |
| Class C (WEMCX) | | 3-31-2008 | | | (3.74 | ) | | | 17.73 | | | | 7.48 | | | | (2.74 | ) | | | 17.73 | | | | 7.48 | | | | 2.14 | | | | 2.12 | |
| Administrator Class (WFGDX) | | 1-31-2007 | | | – | | | | – | | | | – | | | | (1.87 | ) | | | 18.84 | | | | 8.51 | | | | 1.23 | | | | 1.20 | |
| Institutional Class (WEMIX) | | 3-31-2008 | | | – | | | | – | | | | – | | | | (1.60 | ) | | | 19.19 | | | | 8.77 | | | | 0.96 | | | | 0.90 | |
| Investor Class (WFGTX) | | 1-31-2007 | | | – | | | | – | | | | – | | | | (2.14 | ) | | | 18.55 | | | | 8.24 | | | | 1.45 | | | | 1.40 | |
| Russell 2000® Growth Index6 | | – | | | – | | | | – | | | | – | | | | 4.66 | | | | 18.04 | | | | 8.05 | | | | – | | | | – | |
Figures quoted represent past performance, which is no guarantee of future results, and do not reflect taxes that a shareholder may pay on fund distributions or the redemption of fund shares. Investment return and principal value of an investment will fluctuate so that an investor’s shares, when redeemed, may be worth more or less than their original cost. Performance shown without sales charges would be lower if sales charges were reflected. Current performance may be lower or higher than the performance data quoted, which assumes the reinvestment of dividends and capital gains. Current month-end performance is available on the Fund’s website, wellsfargoadvantagefunds.com.
Index returns do not include transaction costs associated with buying and selling securities, any mutual fund fees or expenses, or any taxes. It is not possible to invest directly in an index.
For Class A shares, the maximum front-end sales charge is 5.75%. For Class C shares, the maximum contingent deferred sales charge is 1.00%. Performance including a contingent deferred sales charge assumes the sales charge for the corresponding time period. Administrator Class, Institutional Class, and Investor Class shares are sold without a front-end sales charge or contingent deferred sales charge.
Stock values fluctuate in response to the activities of individual companies and general market and economic conditions. Smaller-company stocks tend to be more volatile and less liquid than those of larger companies. Certain investment strategies tend to increase the total risk of an investment (relative to the broader market). The Fund is exposed to foreign investment risk. Consult the Fund’s prospectus for additional information on these and other risks.
Please see footnotes on page 9.
| | | | | | |
| Performance highlights (unaudited) | | Wells Fargo Advantage Equity Gateway Funds | | | 9 | |
Wells Fargo Advantage Emerging Growth Fund (continued)
| | | | |
| Ten largest long-term holdings7 (%) as of November 30, 2014 | |
Acadia Healthcare Company Incorporated | | | 3.53% | |
MarketAxess Holdings Incorporated | | | 3.50% | |
Envestnet Incorporated | | | 3.41% | |
Akorn Incorporated | | | 3.26% | |
Proofpoint Incorporated | | | 3.14% | |
SPS Commerce Incorporated | | | 2.80% | |
ExamWorks Group Incorporated | | | 2.65% | |
Fiesta Restaurant Group Incorporated | | | 2.51% | |
PRA Group Incorporated | | | 2.49% | |
Spectranetics Corporation | | | 2.45% | |
|
| Sector distribution8 as of November 30, 2014 |
|
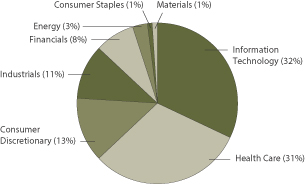 |
| 1. | The Fund is a gateway feeder fund that invests all of its assets in a single affiliated master portfolio of the Wells Fargo Master Trust with a substantially similar investment objective and substantially similar investment strategies. References to the investment activities of the Fund are intended to refer to the investment activities of the affiliated master portfolio in which it invests. |
| 2. | Please see the Fund’s current Statement of Additional Information for further details. |
| 3. | Historical performance shown for Class A shares prior to their inception reflects the performance of Investor Class shares, and includes the higher expenses applicable to Investor Class shares. If these expenses had not been included, returns would be higher. Historical performance shown for Class C shares prior to their inception reflects the performance of Investor Class shares, adjusted to reflect the higher expenses applicable to Class C shares. Historical performance shown for Institutional Class shares prior to their inception reflects the performance of Administrator Class shares, and includes the higher expenses applicable to Administrator Class shares. If these expenses had not been included, returns would be higher. |
| 4. | Reflects the expense ratios as stated in the most recent prospectuses. The expense ratios shown are subject to change and may differ from the annualized expense ratios shown in the financial highlights of this report. |
| 5. | The Adviser has committed through September 30, 2015, to waive fees and/or reimburse expenses to the extent necessary to cap the Fund’s Total Annual Fund Operating Expenses After Fee Waiver, excluding certain expenses, at the amounts shown. After this time, the cap may be increased or the commitment to maintain the cap may be terminated only with the approval of the Board of Trustees. Brokerage commissions, stamp duty fees, interest, taxes, acquired fund fees and expenses, and extraordinary expenses are excluded from the cap. Fees from the affiliated master portfolio are included in the cap. Without this cap, the Fund’s returns would have been lower. |
| 6. | The Russell 2000® Growth Index measures the performance of those Russell 2000 companies with higher price-to-book ratios and higher forecasted growth values. You cannot invest directly in an index. |
| 7. | The ten largest equity holdings are calculated based on the value of the securities of the affiliated master portfolio allocable to the Fund divided by the total net assets of the Fund. Holdings are subject to change and may have changed since the date specified. |
| 8. | Sector distribution is subject to change and represents the sector distribution of the affiliated master portfolio which is calculated based on the total long-term investments of the affiliated master portfolio. |
| | | | |
| 10 | | Wells Fargo Advantage Equity Gateway Funds | | Performance highlights (unaudited) |
Wells Fargo Advantage Index Fund1
Investment objective
The Fund seeks to replicate the total return of S&P 500 Index, before fees and expenses.
Adviser
Wells Fargo Funds Management, LLC
Subadviser for the master portfolio
Golden Capital Management, LLC
Portfolio managers
John R. Campbell, CFA
Justin Carr, CFA
David Neal, CFA
Average annual total returns2 (%) as of November 30, 2014.
| | | | | | | | | | | | | | | | | | | | | | | | | | | | | | | | | | |
| | | | | Including sales charge | | | Excluding sales charge | | | Expense ratios3 (%) | |
| | | Inception date | | 1 year | | | 5 year | | | 10 year | | | 1 year | | | 5 year | | | 10 year | | | Gross | | | Net4 | |
| Class A (WFILX)* | | 11-4-1998 | | | 9.51 | | | | 13.98 | | | | 6.86 | | | | 16.20 | | | | 15.34 | | | | 7.50 | | | | 0.67 | | | | 0.56 | |
| Class B (WFIMX)* | | 11-3-1998 | | | 10.33 | | | | 14.24 | | | | 6.93 | | | | 15.33 | | | | 14.48 | | | | 6.93 | | | | 1.42 | | | | 1.31 | |
| Class C (WFINX)* | | 4-30-1999 | | | 14.33 | | | | 14.48 | | | | 6.69 | | | | 15.33 | | | | 14.48 | | | | 6.69 | | | | 1.42 | | | | 1.31 | |
| Administrator Class (WFIOX) | | 2-14-1985 | | | – | | | | – | | | | – | | | | 16.56 | | | | 15.69 | | | | 7.80 | | | | 0.36 | | | | 0.25 | |
| Investor Class (WFIRX) | | 7-16-2010 | | | – | | | | – | | | | – | | | | 16.33 | | | | 15.42 | | | | 7.56 | | | | 0.73 | | | | 0.45 | |
| S&P 500 Index5 | | – | | | – | | | | – | | | | – | | | | 16.86 | | | | 15.96 | | | | 8.06 | | | | – | | | | – | |
| * | | Class A, B, and C shares are closed to new investors. Please see the Fund’s current Statement of Additional Information for further details. |
Figures quoted represent past performance, which is no guarantee of future results, and do not reflect taxes that a shareholder may pay on fund distributions or the redemption of fund shares. Investment return and principal value of an investment will fluctuate so that an investor’s shares, when redeemed, may be worth more or less than their original cost. Performance shown without sales charges would be lower if sales charges were reflected. Current performance may be lower or higher than the performance data quoted, which assumes the reinvestment of dividends and capital gains. Current month-end performance is available on the Fund’s website, wellsfargoadvantagefunds.com.
Index returns do not include transaction costs associated with buying and selling securities, any mutual fund fees or expenses, or any taxes. It is not possible to invest directly in an index.
For Class A shares, the maximum front-end sales charge is 5.75%. For Class B shares, the maximum contingent deferred sales charge is 5.00%. For Class C shares, the maximum contingent deferred sales charge is 1.00%. Performance including a contingent deferred sales charge assumes the sales charge for the corresponding time period. Administrator Class and Investor Class shares are sold without a front-end sales charge or contingent deferred sales charge.
Stock values fluctuate in response to the activities of individual companies and general market and economic conditions. The use of derivatives may reduce returns and/or increase volatility. Consult the Fund’s prospectus for additional information on these and other risks.
Please see footnotes on page 11.
| | | | | | |
| Performance highlights (unaudited) | | Wells Fargo Advantage Equity Gateway Funds | | | 11 | |
Wells Fargo Advantage Index Fund (continued)
| | | | |
| Ten largest long-term holdings6 (%) as of November 30, 2014 | |
Apple Incorporated | | | 4.01 | |
Microsoft Corporation | | | 2.22 | |
Exxon Mobil Corporation | | | 2.17 | |
Johnson & Johnson | | | 1.72 | |
Berkshire Hathaway Incorporated Class B | | | 1.52 | |
General Electric Company | | | 1.50 | |
Wells Fargo & Company | | | 1.46 | |
The Procter & Gamble Company | | | 1.38 | |
JPMorgan Chase & Company | | | 1.27 | |
Verizon Communications Incorporated | | | 1.18 | |
|
| Sector distribution7 as of November 30, 2014 |
|
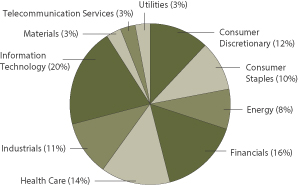 |
| 1. | The Fund is a gateway feeder fund that invests all of its assets in a single affiliated master portfolio of the Wells Fargo Master Trust with a substantially similar investment objective and substantially similar investment strategies. References to the investment activities of the Fund are intended to refer to the investment activities of the affiliated master portfolio in which it invests. |
| 2. | Historical performance shown for Investor Class shares prior to their inception reflects the performance of Administrator Class shares, adjusted to reflect the higher expenses applicable to Investor Class shares. Historical performance shown for all classes of the Fund prior to July 19, 2010, is based on the performance of the Fund’s predecessor, Evergreen Equity Index Fund. |
| 3. | Reflects the expense ratios as stated in the most recent prospectuses. The expense ratios shown are subject to change and may differ from the annualized expense ratios shown in the financial highlights of this report. |
| 4. | The Adviser has committed through September 30, 2015, to waive fees and/or reimburse expenses to the extent necessary to cap the Fund’s Total Annual Fund Operating Expenses After Fee Waiver, excluding certain expenses, at the amounts shown. After this time, the cap may be increased or the commitment to maintain the cap may be terminated only with the approval of the Board of Trustees. Brokerage commissions, stamp duty fees, interest, taxes, acquired fund fees and expenses, and extraordinary expenses are excluded from the cap. Fees from the affiliated master portfolio are included in the cap. Without this cap, the Fund’s returns would have been lower. |
| 5. | The S&P 500 Index consists of 500 stocks chosen for market size, liquidity, and industry group representation. It is a market-value-weighted index with each stock’s weight in the index proportionate to its market value. You cannot invest directly in an index. |
| 6. | The ten largest equity holdings are calculated based on the value of the securities of the affiliated master portfolio allocable to the Fund divided by the total net assets of the Fund. Holdings are subject to change and may have changed since the date specified. |
| 7. | Sector distribution is subject to change and represents the sector distribution of the affiliated master portfolio which is calculated based on the total long-term investments of the affiliated master portfolio. |
| | | | |
| 12 | | Wells Fargo Advantage Equity Gateway Funds | | Performance highlights (unaudited) |
Wells Fargo Advantage International Value Fund1
Investment objective
The Fund seeks long-term capital appreciation.
Adviser
Wells Fargo Funds Management, LLC
Subadviser for the master portfolio
LSV Asset Management
Portfolio managers
Josef Lakonishok
Puneed Mansharamani, CFA
Menno Vermeulen, CFA
Average annual total returns2 (%) as of November 30, 2014
| | | | | | | | | | | | | | | | | | | | | | | | | | | | | | | | | | |
| | | | | Including sales charge | | | Excluding sales charge | | | Expense ratios3 (%) | |
| | | Inception date | | 1 year | | | 5 year | | | 10 year | | | 1 year | | | 5 year | | | 10 year | | | Gross | | | Net4 | |
| Class A (WFFAX) | | 10-31-2003 | | | (8.05 | ) | | | 3.69 | | | | 2.96 | | | | (2.44 | ) | | | 4.93 | | | | 3.57 | | | | 1.51 | | | | 1.50 | |
| Class B (WFVBX)* | | 4-8-2005 | | | (8.09 | ) | | | 3.82 | | | | 3.01 | | | | (3.09 | ) | | | 4.16 | | | | 3.01 | | | | 2.26 | | | | 2.25 | |
| Class C (WFVCX) | | 4-8-2005 | | | (4.13 | ) | | | 4.14 | | | | 2.78 | | | | (3.13 | ) | | | 4.14 | | | | 2.78 | | | | 2.26 | | | | 2.25 | |
| Administrator Class (WFVDX) | | 4-8-2005 | | | – | | | | – | | | | – | | | | (2.21 | ) | | | 5.17 | | | | 3.79 | | | | 1.35 | | | | 1.25 | |
| Institutional Class (WFVIX) | | 8-31-2006 | | | – | | | | – | | | | – | | | | (2.03 | ) | | | 5.40 | | | | 3.96 | | | | 1.08 | | | | 1.05 | |
| MSCI EAFE Value Index (Net)5 | | – | | | – | | | | – | | | | – | | | | (0.70 | ) | | | 5.34 | | | | 4.72 | | | | – | | | | – | |
| * | | Class B shares are closed to investment, except in connection with the reinvestment of any distributions and permitted exchanges. |
Figures quoted represent past performance, which is no guarantee of future results, and do not reflect taxes that a shareholder may pay on fund distributions or the redemption of fund shares. Investment return and principal value of an investment will fluctuate so that an investor’s shares, when redeemed, may be worth more or less than their original cost. Performance shown without sales charges would be lower if sales charges were reflected. Current performance may be lower or higher than the performance data quoted, which assumes the reinvestment of dividends and capital gains. Current month-end performance is available on the Fund’s website, wellsfargoadvantagefunds.com.
Index returns do not include transaction costs associated with buying and selling securities, any mutual fund fees or expenses, or any taxes. It is not possible to invest directly in an index.
For Class A shares, the maximum front-end sales charge is 5.75%. For Class B shares, the maximum contingent deferred sales charge is 5.00%. For Class C shares, the maximum contingent deferred sales charge is 1.00%. Performance including a contingent deferred sales charge assumes the sales charge for the corresponding time period. Administrator Class and Institutional Class shares are sold without a front-end sales charge or contingent deferred sales charge.
Stock values fluctuate in response to the activities of individual companies and general market and economic conditions. Foreign investments are especially volatile and can rise or fall dramatically due to differences in the political and economic conditions of the host country. These risks are generally intensified in emerging markets. The use of derivatives may reduce returns and/or increase volatility. Certain investment strategies tend to increase the total risk of an investment (relative to the broader market). The Fund is exposed to smaller company securities risk. Consult the Fund’s prospectus for additional information on these and other risks.
Please see footnotes on page 13.
| | | | | | |
| Performance highlights (unaudited) | | Wells Fargo Advantage Equity Gateway Funds | | | 13 | |
Wells Fargo Advantage International Value Fund (continued)
| | | | |
| Ten largest long-term holdings6 (%) as of November 30, 2014 | |
Royal Dutch Shell plc Class B | | | 2.28 | |
Magna International Incorporated Class A | | | 1.44 | |
AstraZeneca plc | | | 1.37 | |
Nippon Telegraph & Telephone Corporation | | | 1.27 | |
Allianz AG | | | 1.25 | |
Sanofi-Aventis SA | | | 1.21 | |
Daimler AG | | | 1.19 | |
SK Telecom Company Limited | | | 1.15 | |
BP plc | | | 1.13 | |
Resona Holdings Incorporated | | | 1.11 | |
|
| Sector distribution7 as of November 30, 2014 |
|
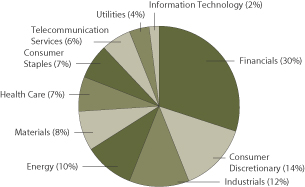 |
| 1. | The Fund is a gateway feeder fund that invests all of its assets in a single affiliated master portfolio of the Wells Fargo Master Trust with a substantially similar investment objective and substantially similar investment strategies. References to the investment activities of the Fund are intended to refer to the investment activities of the affiliated master portfolio in which it invests. |
| 2. | Historical performance shown for Class B and Class C shares prior to their inception reflects the performance of Class A shares, adjusted to reflect the higher expenses applicable to Class B and C shares. Historical performance shown for Institutional Class shares prior to their inception reflects the performance of Administrator Class shares, and includes the higher expenses applicable to Administrator Class shares. If these expenses had not been included, returns would be higher. Historical performance shown for Administrator Class shares prior to their inception reflects the performance of Class A shares, and includes the higher expenses applicable to Class A shares. If these expenses had not been included, returns would be higher. |
| 3. | Reflects the expense ratios as stated in the most recent prospectuses. The expense ratios shown are subject to change and may differ from the annualized expense ratios shown in the financial highlights of this report. |
| 4. | The Adviser has committed through September 30, 2015, to waive fees and/or reimburse expenses to the extent necessary to cap the Fund’s Total Annual Fund Operating Expenses After Fee Waiver, excluding certain expenses, at the amounts shown. After this time, the cap may be increased or the commitment to maintain the cap may be terminated only with the approval of the Board of Trustees. Brokerage commissions, stamp duty fees, interest, taxes, acquired fund fees and expenses, and extraordinary expenses are excluded from the cap. Fees from the affiliated master portfolio are included in the cap. Without this cap, the Fund’s returns would have been lower. |
| 5. | The Morgan Stanley Capital International Europe, Australasia, and Far East Value Index (Net) (MSCI EAFE Value Index (Net)) is an unmanaged market capitalization index designed to measure the performance of value securities within developed equity markets, excluding the United States and Canada. Source: MSCI. MSCI makes no express or implied warranties or representations and shall have no liability whatsoever with respect to any MSCI data contained herein. The MSCI data may not be further redistributed or used as a basis for other indexes or any securities or financial products. This report is not approved, reviewed, or produced by MSCI. You cannot invest directly in an index. |
| 6. | The ten largest equity holdings are calculated based on the value of the securities of the affiliated master portfolio allocable to the Fund divided by the total net assets of the Fund. Holdings are subject to change and may have changed since the date specified. |
| 7. | Sector distribution is subject to change and represents the sector distribution of the affiliated master portfolio which is calculated based on the total long-term investments of the affiliated master portfolio. |
| | | | |
| 14 | | Wells Fargo Advantage Equity Gateway Funds | | Performance highlights (unaudited) |
Wells Fargo Advantage Small Company Growth Fund1
Investment objective
The Fund seeks long-term capital appreciation.
Adviser
Wells Fargo Funds Management, LLC
Subadviser for the master portfolio
Peregrine Capital Management, Inc.
Portfolio managers
William A. Grierson, CFA
Daniel J. Hagen, CFA
Robert B. Mersky, CFA
James P. Ross, CFA
Paul E. von Kuster, CFA
Average annual total returns2 (%) as of November 30, 2014
| | | | | | | | | | | | | | | | | | | | | | | | | | | | | | | | | | |
| | | | | Including sales charge | | | Excluding sales charge | | | Expense ratios3 (%) | |
| | | Inception date | | 1 year | | | 5 year | | | 10 year | | | 1 year | | | 5 year | | | 10 year | | | Gross | | | Net4 | |
| Class A (WFSAX) | | 1-30-2004 | | | 1.19 | | | | 18.46 | | | | 7.86 | | | | 7.37 | | | | 19.87 | | | | 8.50 | | | | 1.45 | | | | 1.40 | |
| Class B (WFSBX)* | | 1-30-2004 | | | 1.54 | | | | 18.78 | | | | 7.92 | | | | 6.54 | | | | 18.98 | | | | 7.92 | | | | 2.20 | | | | 2.15 | |
| Class C (WSMCX) | | 1-30-2004 | | | 5.54 | | | | 19.00 | | | | 7.70 | | | | 6.54 | | | | 19.00 | | | | 7.70 | | | | 2.20 | | | | 2.15 | |
| Class R6 (WBHWJ) | | 10-31-2014 | | | – | | | | – | | | | – | | | | 7.85 | | | | 20.46 | | | | 8.94 | | | | 0.97 | | | | 0.90 | |
| Administrator Class (NVSCX) | | 11-11-1994 | | | – | | | | – | | | | – | | | | 7.58 | | | | 20.17 | | | | 8.77 | | | | 1.29 | �� | | | 1.20 | |
| Institutional Class (WSCGX) | | 3-31-2008 | | | – | | | | – | | | | – | | | | 7.85 | | | | 20.46 | | | | 8.94 | | | | 1.02 | | | | 0.95 | |
| Russell 2000® Growth Index5 | | – | | | – | | | | – | | | | – | | | | 4.66 | | | | 18.04 | | | | 8.61 | | | | – | | | | – | |
| * | | Class B shares are closed to investment, except in connection with the reinvestment of any distributions and permitted exchanges. |
Figures quoted represent past performance, which is no guarantee of future results, and do not reflect taxes that a shareholder may pay on fund distributions or the redemption of fund shares. Investment return and principal value of an investment will fluctuate so that an investor’s shares, when redeemed, may be worth more or less than their original cost. Performance shown without sales charges would be lower if sales charges were reflected. Current performance may be lower or higher than the performance data quoted, which assumes the reinvestment of dividends and capital gains. Current month-end performance is available on the Fund’s website, wellsfargoadvantagefunds.com.
Index returns do not include transaction costs associated with buying and selling securities, any mutual fund fees or expenses, or any taxes. It is not possible to invest directly in an index.
For Class A shares, the maximum front-end sales charge is 5.75%. For Class B shares, the maximum contingent deferred sales charge is 5.00%. For Class C shares, the maximum contingent deferred sales charge is 1.00%. Performance including a contingent deferred sales charge assumes the sales charge for the corresponding time period. Class R6, Administrator Class and Institutional Class shares are sold without a front-end sales charge or contingent deferred sales charge.
Stock values fluctuate in response to the activities of individual companies and general market and economic conditions. Smaller-company stocks tend to be more volatile and less liquid than those of larger companies. Certain investment strategies tend to increase the total risk of an investment (relative to the broader market). The Fund is exposed to foreign investment risk. Consult the Fund’s prospectus for additional information on these and other risks.
Please see footnotes on page 15.
| | | | | | |
| Performance highlights (unaudited) | | Wells Fargo Advantage Equity Gateway Funds | | | 15 | |
Wells Fargo Advantage Small Company Growth Fund (continued)
| | | | |
| Ten largest long-term holdings6 (%) as of November 30, 2014 | |
Cepheid Incorporated | | | 1.61 | |
SS&C Technologies Holdings | | | 1.48 | |
HealthEquity Incorporated | | | 1.30 | |
Evercore Partners Incorporated Class A | | | 1.29 | |
ICON plc ADR | | | 1.27 | |
AMN Healthcare Services Incorporated | | | 1.21 | |
Cadence Design Systems Incorporated | | | 1.17 | |
On Assignment Incorporated | | | 1.15 | |
Spansion Incorporated Class A | | | 1.15 | |
Essent Group Limited | | | 1.13 | |
|
| Sector distribution7 as of November 30, 2014 |
|
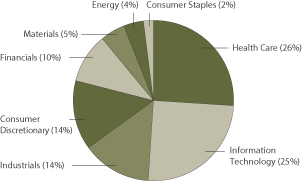 |
| 1. | The Fund is a gateway feeder fund that invests all of its assets in a single affiliated master portfolio of the Wells Fargo Master Trust with a substantially similar investment objective and substantially similar investment strategies. References to the investment activities of the Fund are intended to refer to the investment activities of the affiliated master portfolio in which it invests. |
| 2. | Historical performance shown for Institutional Class shares prior to their inception reflects the performance of Administrator Class shares, and includes the higher expenses applicable to Administrator Class shares. If these expenses had not been included, returns would be higher. Historical performance shown for Class R6 shares prior to their inception reflects the performance of Institutional Class shares, and includes the higher expenses applicable to Institutional Class shares. If these expenses had not been included, returns would be higher. |
| 3. | Reflects the expense ratios as stated in the most recent prospectuses. The expense ratios shown are subject to change and may differ from the annualized expense ratios shown in the financial highlights of this report. |
| 4. | The Adviser has committed through September 30, 2016, to waive fees and/or reimburse expenses to the extent necessary to cap the Fund’s Total Annual Fund Operating Expenses After Fee Waiver, excluding certain expenses, at the amounts shown. After this time, the cap may be increased or the commitment to maintain the cap may be terminated only with the approval of the Board of Trustees. Brokerage commissions, stamp duty fees, interest, taxes, acquired fund fees and expenses, and extraordinary expenses are excluded from the cap. Fees from the affiliated master portfolio are included in the cap. Without this cap, the Fund’s returns would have been lower. |
| 5. | The Russell 2000® Growth Index measures the performance shown of those Russell 2000 companies with higher price-to-book ratios and higher forecasted growth values. You cannot invest directly in an index. |
| 6. | The ten largest equity holdings are calculated based on the value of the securities of the affiliated master portfolio allocable to the Fund divided by the total net assets of the Fund. Holdings are subject to change and may have changed since the date specified. |
| 7. | Sector distribution is subject to change and represents the sector distribution of the affiliated master portfolio which is calculated based on the total long-term investments of the affiliated master portfolio. |
| | | | |
| 16 | | Wells Fargo Advantage Equity Gateway Funds | | Performance highlights (unaudited) |
Wells Fargo Advantage Small Company Value Fund1
Investment objective
The Fund seeks long-term capital appreciation.
Adviser
Wells Fargo Funds Management, LLC
Subadviser for the master portfolio
Peregrine Capital Management, Inc.
Portfolio managers
Jason R. Ballsrud, CFA
Tasso H. Coin, Jr., CFA
Douglas G. Pugh, CFA
Average annual total returns2 (%) as of November 30, 2014
| | | | | | | | | | | | | | | | | | | | | | | | | | | | | | | | | | |
| | | | | Including sales charge | | | Excluding sales charge | | | Expense ratios3 (%) | |
| | | Inception date | | 1 year | | | 5 year | | | 10 year | | | 1 year | | | 5 year | | | 10 year | | | Gross | | | Net4 | |
| Class A (SCVAX) | | 1-31-2002 | | | (3.89 | ) | | | 14.65 | | | | 5.91 | | | | 1.98 | | | | 16.02 | | | | 6.54 | | | | 1.56 | | | | 1.40 | |
| Class B (SCVBX)* | | 1-31-2002 | | | (3.56 | ) | | | 14.96 | | | | 6.01 | | | | 1.44 | | | | 15.19 | | | | 6.01 | | | | 2.31 | | | | 2.15 | |
| Class C (SCVFX) | | 8-30-2002 | | | 0.22 | | | | 15.14 | | | | 5.77 | | | | 1.22 | | | | 15.14 | | | | 5.77 | | | | 2.31 | | | | 2.15 | |
| Administrator Class (SCVIX) | | 1-31-2002 | | | – | | | | – | | | | – | | | | 2.19 | | | | 16.30 | | | | 6.83 | | | | 1.40 | | | | 1.20 | |
| Institutional Class (SCVNX) | | 7-30-2010 | | | – | | | | – | | | | – | | | | 2.38 | | | | 16.50 | | | | 6.92 | | | | 1.13 | | | | 1.00 | |
| Russell 2000® Value Index5 | | – | | | – | | | | – | | | | – | | | | 3.36 | | | | 15.31 | | | | 6.85 | | | | – | | | | – | |
| * | | Class B shares are closed to investment, except in connection with the reinvestment of any distributions and permitted exchanges. |
Figures quoted represent past performance, which is no guarantee of future results, and do not reflect taxes that a shareholder may pay on fund distributions or the redemption of fund shares. Investment return and principal value of an investment will fluctuate so that an investor’s shares, when redeemed, may be worth more or less than their original cost. Performance shown without sales charges would be lower if sales charges were reflected. Current performance may be lower or higher than the performance data quoted, which assumes the reinvestment of dividends and capital gains. Current month-end performance is available on the Fund’s website, wellsfargoadvantagefunds.com.
Index returns do not include transaction costs associated with buying and selling securities, any mutual fund fees or expenses, or any taxes. It is not possible to invest directly in an index.
For Class A shares, the maximum front-end sales charge is 5.75%. For Class B shares, the maximum contingent deferred sales charge is 5.00%. For Class C shares, the maximum contingent deferred sales charge is 1.00%. Performance including a contingent deferred sales charge assumes the sales charge for the corresponding time period. Administrator Class and Institutional Class shares are sold without a front-end sales charge or contingent deferred sales charge.
Stock values fluctuate in response to the activities of individual companies and general market and economic conditions. Smaller-company stocks tend to be more volatile and less liquid than those of larger companies. Certain investment strategies tend to increase the total risk of an investment (relative to the broader market). The Fund is exposed to foreign investment risk. Consult the Fund’s prospectus for additional information on these and other risks.
Please see footnotes on page 17.
| | | | | | |
| Performance highlights (unaudited) | | Wells Fargo Advantage Equity Gateway Funds | | | 17 | |
Wells Fargo Advantage Small Company Value Fund (continued)
| | | | |
| Ten largest long-term holdings6 (%) as of November 30, 2014 | |
Western Alliance Bancorp | | | 1.69 | |
Health Net Incorporated | | | 1.62 | |
WellCare Health Plans Incorporated | | | 1.48 | |
PrivateBancorp Incorporated | | | 1.46 | |
DSW Incorporated Class A | | | 1.43 | |
ARRIS Group Incorporated | | | 1.40 | |
Education Realty Trust Incorporated | | | 1.40 | |
American Axle & Manufacturing Holdings Incorporated | | | 1.37 | |
Alere Incorporated | | | 1.34 | |
BancorpSouth Incorporated | | | 1.33 | |
| | |
| Sector distribution7 as of November 30, 2014 |
|
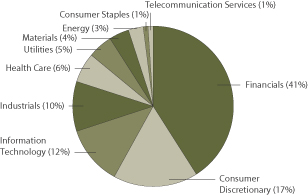 |
| 1. | The Fund is a gateway feeder fund that invests all of its assets in a single affiliated master portfolio of the Wells Fargo Master Trust with a substantially similar investment objective and substantially similar investment strategies. References to the investment activities of the Fund are intended to refer to the investment activities of the affiliated master portfolio in which it invests. |
| 2. | Historical performance shown for Institutional Class shares prior to their inception reflects the performance of Administrator Class shares and includes the higher expenses applicable to Administrator Class shares. If these expenses had not been included, returns would be higher. |
| 3. | Reflects the expense ratios as stated in the most recent prospectuses. The expense ratios shown are subject to change and may differ from the annualized expense ratios shown in the financial highlights of this report. |
| 4. | The Adviser has committed through September 30, 2015, to waive fees and/or reimburse expenses to the extent necessary to cap the Fund’s Total Annual Fund Operating Expenses After Fee Waiver, excluding certain expenses, at the amounts shown. After this time, the cap may be increased or the commitment to maintain the cap may be terminated only with the approval of the Board of Trustees. Brokerage commissions, stamp duty fees, interest, taxes, acquired fund fees and expenses, and extraordinary expenses are excluded from the cap. Fees from the affiliated master portfolio are included in the cap. Without this cap, the Fund’s returns would have been lower. |
| 5. | The Russell 2000® Value Index measures the performance of those Russell 2000 companies with lower price-to-book ratios and lower forecasted growth values. You cannot invest directly in an index. |
| 6. | The ten largest equity holdings are calculated based on the value of the securities of the affiliated master portfolio allocable to the Fund divided by the total net assets of the Fund. Holdings are subject to change and may have changed since the date specified. |
| 7. | Sector distribution is subject to change and represents the sector distribution of the affiliated master portfolio which is calculated based on the total long-term investments of the affiliated master portfolio. |
| | | | |
| 18 | | Wells Fargo Advantage Equity Gateway Funds | | Fund expenses (unaudited) |
As a shareholder of the Fund, you incur two types of costs: (1) transaction costs, including sales charges (loads) on purchase payments and contingent deferred sales charges (if any) on redemptions and (2) ongoing costs, including management fees, distribution (12b-1) and/or shareholder service fees, and other Fund expenses. This example is intended to help you understand your ongoing costs (in dollars) of investing in the Fund and to compare these costs with the ongoing costs of investing in other mutual funds.
The example is based on an investment of $1,000 invested at the beginning of the six-month period and held for the entire period from June 1, 2014 to November 30, 2014.
Actual expenses
The “Actual” line of the table below provides information about actual account values and actual expenses. You may use the information in this line, together with the amount you invested, to estimate the expenses that you paid over the period. Simply divide your account value by $1,000 (for example, an $8,600 account value divided by $1,000 = 8.6), then multiply the result by the number in the “Actual” line under the heading entitled “Expenses paid during period” for your applicable class of shares to estimate the expenses you paid on your account during this period.
Hypothetical example for comparison purposes
The “Hypothetical” line of the table below provides information about hypothetical account values and hypothetical expenses based on the Fund’s actual expense ratio and an assumed rate of return of 5% per year before expenses, which is not the Fund’s actual return. The hypothetical account values and expenses may not be used to estimate the actual ending account balance or expenses you paid for the period. You may use this information to compare the ongoing costs of investing in the Fund and other funds. To do so, compare this 5% hypothetical example with the 5% hypothetical examples that appear in the shareholder reports of the other funds.
Please note that the expenses shown in the table are meant to highlight your ongoing costs only and do not reflect any transactional costs, such as sales charges (loads) and contingent deferred sales charges. Therefore, the “Hypothetical” line of the table is useful in comparing ongoing costs only and will not help you determine the relative total costs of owning different funds. In addition, if these transactional costs were included, your costs would have been higher.
| | | | | | | | | | | | | | | | |
| Wells Fargo Advantage C&B Large Cap Value Fund | | Beginning
account value
6-1-2014 | | | Ending
account value
11-30-2014 | | | Expenses
paid during
the period¹ | | | Net annualized
expense ratio | |
Class A | | | | | | | | | | | | | | | | |
Actual | | $ | 1,000.00 | | | $ | 1,063.39 | | | $ | 5.95 | | | | 1.15 | % |
Hypothetical (5% return before expenses) | | $ | 1,000.00 | | | $ | 1,019.30 | | | $ | 5.82 | | | | 1.15 | % |
Class B | | | | | | | | | | | | | | | | |
Actual | | $ | 1,000.00 | | | $ | 1,059.31 | | | $ | 9.81 | | | | 1.90 | % |
Hypothetical (5% return before expenses) | | $ | 1,000.00 | | | $ | 1,015.54 | | | $ | 9.60 | | | | 1.90 | % |
Class C | | | | | | | | | | | | | | | | |
Actual | | $ | 1,000.00 | | | $ | 1,059.41 | | | $ | 9.81 | | | | 1.90 | % |
Hypothetical (5% return before expenses) | | $ | 1,000.00 | | | $ | 1,015.54 | | | $ | 9.60 | | | | 1.90 | % |
Administrator Class | | | | | | | | | | | | | | | | |
Actual | | $ | 1,000.00 | | | $ | 1,064.17 | | | $ | 4.92 | | | | 0.95 | % |
Hypothetical (5% return before expenses) | | $ | 1,000.00 | | | $ | 1,020.31 | | | $ | 4.81 | | | | 0.95 | % |
Institutional Class | | | | | | | | | | | | | | | | |
Actual | | $ | 1,000.00 | | | $ | 1,064.78 | | | $ | 3.62 | | | | 0.70 | % |
Hypothetical (5% return before expenses) | | $ | 1,000.00 | | | $ | 1,021.56 | | | $ | 3.55 | | | | 0.70 | % |
Investor Class | | | | | | | | | | | | | | | | |
Actual | | $ | 1,000.00 | | | $ | 1,063.33 | | | $ | 6.21 | | | | 1.20 | % |
Hypothetical (5% return before expenses) | | $ | 1,000.00 | | | $ | 1,019.05 | | | $ | 6.07 | | | | 1.20 | % |
Please see footnote on page 20.
| | | | | | |
| Fund expenses (unaudited) | | Wells Fargo Advantage Equity Gateway Funds | | | 19 | |
| | | | | | | | | | | | | | | | |
| Wells Fargo Advantage Diversified Equity Fund | | Beginning
account value
6-1-2014 | | | Ending
account value
11-30-2014 | | | Expenses
paid during
the period¹ | | | Net annualized
expense ratio | |
Class A | | | | | | | | | | | | | | | | |
Actual | | $ | 1,000.00 | | | $ | 1,052.78 | | | $ | 6.43 | | | | 1.25 | % |
Hypothetical (5% return before expenses) | | $ | 1,000.00 | | | $ | 1,018.80 | | | $ | 6.33 | | | | 1.25 | % |
Class B | | | | | | | | | | | | | | | | |
Actual | | $ | 1,000.00 | | | $ | 1,049.01 | | | $ | 10.27 | | | | 2.00 | % |
Hypothetical (5% return before expenses) | | $ | 1,000.00 | | | $ | 1,015.04 | | | $ | 10.10 | | | | 2.00 | % |
Class C | | | | | | | | | | | | | | | | |
Actual | | $ | 1,000.00 | | | $ | 1,048.88 | | | $ | 10.27 | | | | 2.00 | % |
Hypothetical (5% return before expenses) | | $ | 1,000.00 | | | $ | 1,015.04 | | | $ | 10.10 | | | | 2.00 | % |
Administrator Class | | | | | | | | | | | | | | | | |
Actual | | $ | 1,000.00 | | | $ | 1,054.19 | | | $ | 5.15 | | | | 1.00 | % |
Hypothetical (5% return before expenses) | | $ | 1,000.00 | | | $ | 1,020.05 | | | $ | 5.06 | | | | 1.00 | % |
| Wells Fargo Advantage Emerging Growth Fund | | | | | | | | | | | | |
Class A | | | | | | | | | | | | | | | | |
Actual | | $ | 1,000.00 | | | $ | 1,116.36 | | | $ | 7.27 | | | | 1.37 | % |
Hypothetical (5% return before expenses) | | $ | 1,000.00 | | | $ | 1,018.20 | | | $ | 6.93 | | | | 1.37 | % |
Class C | | | | | | | | | | | | | | | | |
Actual | | $ | 1,000.00 | | | $ | 1,112.39 | | | $ | 11.23 | | | | 2.12 | % |
Hypothetical (5% return before expenses) | | $ | 1,000.00 | | | $ | 1,014.44 | | | $ | 10.71 | | | | 2.12 | % |
Administrator Class | | | | | | | | | | | | | | | | |
Actual | | $ | 1,000.00 | | | $ | 1,117.33 | | | $ | 6.37 | | | | 1.20 | % |
Hypothetical (5% return before expenses) | | $ | 1,000.00 | | | $ | 1,019.05 | | | $ | 6.07 | | | | 1.20 | % |
Institutional Class | | | | | | | | | | | | | | | | |
Actual | | $ | 1,000.00 | | | $ | 1,119.13 | | | $ | 4.78 | | | | 0.90 | % |
Hypothetical (5% return before expenses) | | $ | 1,000.00 | | | $ | 1,020.56 | | | $ | 4.56 | | | | 0.90 | % |
Investor Class | | | | | | | | | | | | | | | | |
Actual | | $ | 1,000.00 | | | $ | 1,115.62 | | | $ | 7.53 | | | | 1.42 | % |
Hypothetical (5% return before expenses) | | $ | 1,000.00 | | | $ | 1,017.95 | | | $ | 7.18 | | | | 1.42 | % |
| Wells Fargo Advantage Index Fund | | | | | | | | | | | | |
Class A | | | | | | | | | | | | | | | | |
Actual | | $ | 1,000.00 | | | $ | 1,082.72 | | | $ | 2.92 | | | | 0.56 | % |
Hypothetical (5% return before expenses) | | $ | 1,000.00 | | | $ | 1,022.26 | | | $ | 2.84 | | | | 0.56 | % |
Class B | | | | | | | | | | | | | | | | |
Actual | | $ | 1,000.00 | | | $ | 1,078.74 | | | $ | 6.83 | | | | 1.31 | % |
Hypothetical (5% return before expenses) | | $ | 1,000.00 | | | $ | 1,018.50 | | | $ | 6.63 | | | | 1.31 | % |
Class C | | | | | | | | | | | | | | | | |
Actual | | $ | 1,000.00 | | | $ | 1,078.72 | | | $ | 6.83 | | | | 1.31 | % |
Hypothetical (5% return before expenses) | | $ | 1,000.00 | | | $ | 1,018.50 | | | $ | 6.63 | | | | 1.31 | % |
Administrator Class | | | | | | | | | | | | | | | | |
Actual | | $ | 1,000.00 | | | $ | 1,084.56 | | | $ | 1.31 | | | | 0.25 | % |
Hypothetical (5% return before expenses) | | $ | 1,000.00 | | | $ | 1,023.82 | | | $ | 1.27 | | | | 0.25 | % |
Investor Class | | | | | | | | | | | | | | | | |
Actual | | $ | 1,000.00 | | | $ | 1,083.44 | | | $ | 2.35 | | | | 0.45 | % |
Hypothetical (5% return before expenses) | | $ | 1,000.00 | | | $ | 1,022.81 | | | $ | 2.28 | | | | 0.45 | % |
Please see footnote on page 20.
| | | | |
| 20 | | Wells Fargo Advantage Equity Gateway Funds | | Fund expenses (unaudited) |
| | | | | | | | | | | | | | | | |
| Wells Fargo Advantage International Value Fund | | Beginning
account value
6-1-2014 | | | Ending
account value
11-30-2014 | | | Expenses
paid during
the period¹ | | | Net annualized
expense ratio | |
Class A | | | | | | | | | | | | | | | | |
Actual | | $ | 1,000.00 | | | $ | 933.33 | | | $ | 7.22 | | | | 1.49 | % |
Hypothetical (5% return before expenses) | | $ | 1,000.00 | | | $ | 1,017.60 | | | $ | 7.54 | | | | 1.49 | % |
Class B | | | | | | | | | | | | | | | | |
Actual | | $ | 1,000.00 | | | $ | 930.41 | | | $ | 10.50 | | | | 2.17 | % |
Hypothetical (5% return before expenses) | | $ | 1,000.00 | | | $ | 1,014.19 | | | $ | 10.96 | | | | 2.17 | % |
Class C | | | | | | | | | | | | | | | | |
Actual | | $ | 1,000.00 | | | $ | 929.42 | | | $ | 10.83 | | | | 2.24 | % |
Hypothetical (5% return before expenses) | | $ | 1,000.00 | | | $ | 1,013.84 | | | $ | 11.31 | | | | 2.24 | % |
Administrator Class | | | | | | | | | | | | | | | | |
Actual | | $ | 1,000.00 | | | $ | 934.20 | | | $ | 6.06 | | | | 1.25 | % |
Hypothetical (5% return before expenses) | | $ | 1,000.00 | | | $ | 1,018.80 | | | $ | 6.33 | | | | 1.25 | % |
Institutional Class | | | | | | | | | | | | | | | | |
Actual | | $ | 1,000.00 | | | $ | 934.98 | | | $ | 5.09 | | | | 1.05 | % |
Hypothetical (5% return before expenses) | | $ | 1,000.00 | | | $ | 1,019.80 | | | $ | 5.32 | | | | 1.05 | % |
| Wells Fargo Advantage Small Company Growth Fund | | | | | | | | | | |
Class A | | | | | | | | | | | | | | | | |
Actual | | $ | 1,000.00 | | | $ | 1,051.98 | | | $ | 7.20 | | | | 1.40 | % |
Hypothetical (5% return before expenses) | | $ | 1,000.00 | | | $ | 1,018.05 | | | $ | 7.08 | | | | 1.40 | % |
Class B | | | | | | | | | | | | | | | | |
Actual | | $ | 1,000.00 | | | $ | 1,047.94 | | | $ | 11.04 | | | | 2.15 | % |
Hypothetical (5% return before expenses) | | $ | 1,000.00 | | | $ | 1,014.29 | | | $ | 10.86 | | | | 2.15 | % |
Class C | | | | | | | | | | | | | | | | |
Actual | | $ | 1,000.00 | | | $ | 1,047.91 | | | $ | 11.04 | | | | 2.15 | % |
Hypothetical (5% return before expenses) | | $ | 1,000.00 | | | $ | 1,014.29 | | | $ | 10.86 | | | | 2.15 | % |
Class R6 | | | | | | | | | | | | | | | | |
Actual | | $ | 1,000.00 | | | $ | 1,054.45 | | | $ | 4.58 | | | | 0.89 | % |
Hypothetical (5% return before expenses) | | $ | 1,000.00 | | | $ | 1,020.61 | | | $ | 4.51 | | | | 0.89 | % |
Administrator Class | | | | | | | | | | | | | | | | |
Actual | | $ | 1,000.00 | | | $ | 1,052.90 | | | $ | 6.18 | | | | 1.20 | % |
Hypothetical (5% return before expenses) | | $ | 1,000.00 | | | $ | 1,019.05 | | | $ | 6.07 | | | | 1.20 | % |
Institutional Class | | | | | | | | | | | | | | | | |
Actual | | $ | 1,000.00 | | | $ | 1,054.45 | | | $ | 4.89 | | | | 0.95 | % |
Hypothetical (5% return before expenses) | | $ | 1,000.00 | | | $ | 1,020.31 | | | $ | 4.81 | | | | 0.95 | % |
| Wells Fargo Advantage Small Company Value Fund | | | | | | | | | | | | |
Class A | | | | | | | | | | | | | | | | |
Actual | | $ | 1,000.00 | | | $ | 1,001.00 | | | $ | 7.02 | | | | 1.40 | % |
Hypothetical (5% return before expenses) | | $ | 1,000.00 | | | $ | 1,018.05 | | | $ | 7.08 | | | | 1.40 | % |
Class B | | | | | | | | | | | | | | | | |
Actual | | $ | 1,000.00 | | | $ | 997.28 | | | $ | 10.76 | | | | 2.15 | % |
Hypothetical (5% return before expenses) | | $ | 1,000.00 | | | $ | 1,014.29 | | | $ | 10.86 | | | | 2.15 | % |
Class C | | | | | | | | | | | | | | | | |
Actual | | $ | 1,000.00 | | | $ | 997.26 | | | $ | 10.76 | | | | 2.15 | % |
Hypothetical (5% return before expenses) | | $ | 1,000.00 | | | $ | 1,014.29 | | | $ | 10.86 | | | | 2.15 | % |
Administrator Class | | | | | | | | | | | | | | | | |
Actual | | $ | 1,000.00 | | | $ | 1,001.95 | | | $ | 6.02 | | | | 1.20 | % |
Hypothetical (5% return before expenses) | | $ | 1,000.00 | | | $ | 1,019.05 | | | $ | 6.07 | | | | 1.20 | % |
Institutional Class | | | | | | | | | | | | | | | | |
Actual | | $ | 1,000.00 | | | $ | 1,002.92 | | | $ | 5.02 | | | | 1.00 | % |
Hypothetical (5% return before expenses) | | $ | 1,000.00 | | | $ | 1,020.05 | | | $ | 5.06 | | | | 1.00 | % |
| 1. | Expenses paid is equal to the annualized expense ratio of each class multiplied by the average account value over the period, multiplied by the number of days in the most recent fiscal half-year divided by the number of days in the fiscal year (to reflect the one-half-year period). |
| | | | | | |
| Portfolio of investments—November 30, 2014 (unaudited) | | Wells Fargo Advantage Equity Gateway Funds | | | 21 | |
C&B LARGE CAP VALUE FUND
| | | | | | | | | | |
| Security name | | | | | | | | Value | |
| | | | |
Investment Companies: 100.09% | | | | | | | | | | |
| | | | |
| Affiliated Master Portfolios: 100.09% | | | | | | | | | | |
Wells Fargo Advantage C&B Large Cap Value Portfolio | | | | | | | | $ | 293,348,438 | |
| | | | | | | | | | |
| | | | |
Total Investment Companies (Cost $211,375,792) | | | | | | | | | 293,348,438 | |
| | | | | | | | | | |
| | | | | | | | |
| Total investments in securities (Cost $211,375,792) * | | | 100.09 | % | | | 293,348,438 | |
Other assets and liabilities, net | | | (0.09 | ) | | | (250,351 | ) |
| | | | | | | | |
| Total net assets | | | 100.00 | % | | $ | 293,098,087 | |
| | | | | | | | |
| * | Cost for federal income tax purposes is $218,368,909 and unrealized gains (losses) consists of: |
| | | | |
Gross unrealized gains | | $ | 74,979,529 | |
Gross unrealized losses | | | 0 | |
| | | | |
Net unrealized gains | | $ | 74,979,529 | |
DIVERSIFIED EQUITY FUND
| | | | | | | | | | |
| Security name | | | | | | | | Value | |
| | | | |
Investment Companies: 100.04% | | | | | | | | | | |
| | | | |
| Affiliated Master Portfolios: 100.04% | | | | | | | | | | |
Wells Fargo Advantage C&B Large Cap Value Portfolio | | | | | | | | $ | 24,998,363 | |
Wells Fargo Advantage Diversified Large Cap Growth Portfolio | | | | | | | | | 74,891,421 | |
Wells Fargo Advantage Emerging Growth Portfolio | | | | | | | | | 7,423,761 | |
Wells Fargo Advantage Index Portfolio | | | | | | | | | 74,822,041 | |
Wells Fargo Advantage International Growth Portfolio | | | | | | | | | 22,652,763 | |
Wells Fargo Advantage International Value Portfolio | | | | | | | | | 21,353,728 | |
Wells Fargo Advantage Large Company Value Portfolio | | | | | | | | | 49,531,339 | |
Wells Fargo Advantage Small Company Growth Portfolio | | | | | | | | | 7,417,895 | |
Wells Fargo Advantage Small Company Value Portfolio | | | | | | | | | 14,715,430 | |
| | | | |
Total Investment Companies (Cost $220,839,687) | | | | | | | | | 297,806,741 | |
| | | | | | | | | | |
| | | | | | | | |
| Total investments in securities (Cost $220,839,687) * | | | 100.04 | % | | | 297,806,741 | |
Other assets and liabilities, net | | | (0.04 | ) | | | (119,459 | ) |
| | | | | | | | |
| Total net assets | | | 100.00 | % | | $ | 297,687,282 | |
| | | | | | | | |
| * | Cost for federal income tax purposes is $228,358,891 and unrealized gains (losses) consists of: |
| | | | |
Gross unrealized gains | | $ | 69,447,850 | |
Gross unrealized losses | | | 0 | |
| | | | |
Net unrealized gains | | $ | 69,447,850 | |
The accompanying notes are an integral part of these financial statements.
| | | | |
| 22 | | Wells Fargo Advantage Equity Gateway Funds | | Portfolio of investments—November 30, 2014 (unaudited) |
EMERGING GROWTH FUND
| | | | | | | | | | |
| Security name | | | | | | | | Value | |
| | | | |
Investment Companies: 100.02% | | | | | | | | | | |
| | | | |
| Affiliated Master Portfolios: 100.02% | | | | | | | | | | |
Wells Fargo Advantage Emerging Growth Portfolio | | | | | | | | $ | 1,035,438,250 | |
| | | | | | | | | | |
| | | | |
Total Investment Companies (Cost $753,368,470) | | | | | | | | | 1,035,438,250 | |
| | | | | | | | | | |
| | | | | | | | |
| Total investments in securities (Cost $753,368,470) * | | | 100.02 | % | | | 1,035,438,250 | |
Other assets and liabilities, net | | | (0.02 | ) | | | (192,687 | ) |
| | | | | | | | |
| Total net assets | | | 100.00 | % | | $ | 1,035,245,563 | |
| | | | | | | | |
| * | Cost for federal income tax purposes is $753,368,470 and unrealized gains (losses) consists of: |
| | | | |
Gross unrealized gains | | $ | 282,069,780 | |
Gross unrealized losses | | | 0 | |
| | | | |
Net unrealized gains | | $ | 282,069,780 | |
INDEX FUND
| | | | | | | | | | |
| Security name | | | | | | | | Value | |
| | | | |
Investment Companies: 100.01% | | | | | | | | | | |
| | | | |
| Affiliated Master Portfolios: 100.01% | | | | | | | | | | |
Wells Fargo Advantage Index Portfolio | | | | | | | | $ | 2,750,983,436 | |
| | | | | | | | | | |
| | | | |
Total Investment Companies (Cost $1,187,104,443) | | | | | | | | | 2,750,983,436 | |
| | | | | | | | | | |
| | | | | | | | |
| Total investments in securities (Cost $1,187,104,443) * | | | 100.01 | % | | | 2,750,983,436 | |
Other assets and liabilities, net | | | (0.01 | ) | | | (154,969 | ) |
| | | | | | | | |
| Total net assets | | | 100.00 | % | | $ | 2,750,828,467 | |
| | | | | | | | |
| * | Cost for federal income tax $1,251,092,178 and unrealized gains (losses) consists of: |
| | | | |
Gross unrealized gains | | $ | 1,499,891,258 | |
Gross unrealized losses | | | 0 | |
| | | | |
Net unrealized gains | | $ | 1,499,891,258 | |
The accompanying notes are an integral part of these financial statements.
| | | | | | |
| Portfolio of investments—November 30, 2014 (unaudited) | | Wells Fargo Advantage Equity Gateway Funds | | | 23 | |
INTERNATIONAL VALUE FUND
| | | | | | | | | | |
| Security name | | | | | | | | Value | |
| | | | |
Investment Companies: 99.76% | | | | | | | | | | |
| | | | |
| Affiliated Master Portfolios: 99.76% | | | | | | | | | | |
Wells Fargo Advantage International Value Portfolio | | | | | | | | $ | 452,112,524 | |
| | | | | | | | | | |
| | | | |
Total Investment Companies (Cost $449,372,369) | | | | | | | | | 452,112,524 | |
| | | | | | | | | | |
| | | | | | | | |
| Total investments in securities (Cost $449,372,369) * | | | 99.76 | % | | | 452,112,524 | |
Other assets and liabilities, net | | | 0.24 | | | | 1,072,024 | |
| | | | | | | | |
| Total net assets | | | 100.00 | % | | $ | 453,184,548 | |
| | | | | | | | |
| * | Cost for federal income tax purposes is $449,843,745 and unrealized gains (losses) consists of: |
| | | | |
Gross unrealized gains | | $ | 2,268,779 | |
Gross unrealized losses | | | 0 | |
| | | | |
Net unrealized gains | | $ | 2,268,779 | |
SMALL COMPANY GROWTH FUND
| | | | | | | | | | |
| Security name | | | | | | | | Value | |
| | | | |
Investment Companies: 99.88% | | | | | | | | | | |
| | | | |
| Affiliated Master Portfolios: 99.88% | | | | | | | | | | |
Wells Fargo Advantage Small Company Growth Portfolio | | | | | | | | $ | 455,019,528 | |
| | | | | | | | | | |
| | | | |
Total Investment Companies (Cost $428,067,741) | | | | | | | | | 455,019,528 | |
| | | | | | | | | | |
| | | | | | | | |
| Total investments in securities (Cost $428,067,741) * | | | 99.88 | % | | | 455,019,528 | |
Other assets and liabilities, net | | | 0.12 | | | | 560,632 | |
| | | | | | | | |
| Total net assets | | | 100.00 | % | | $ | 455,580,160 | |
| | | | | | | | |
| * | Cost for federal income tax purposes is $427,654,365 and unrealized gains (losses) consists of: |
| | | | |
Gross unrealized gains | | $ | 27,365,163 | |
Gross unrealized losses | | | 0 | |
| | | | |
Net unrealized gains | | $ | 27,365,163 | |
The accompanying notes are an integral part of these financial statements.
| | | | |
| 24 | | Wells Fargo Advantage Equity Gateway Funds | | Portfolio of investments—November 30, 2014 (unaudited) |
SMALL COMPANY VALUE FUND
| | | | | | | | | | |
| Security name | | | | | | | | Value | |
| | | | |
Investment Companies: 100.08% | | | | | | | | | | |
| | | | |
| Affiliated Master Portfolios: 100.08% | | | | | | | | | | |
Wells Fargo Advantage Small Company Value Portfolio | | | | | | | | $ | 108,038,258 | |
| | | | | | | | | | |
| | | | |
Total Investment Companies (Cost $89,344,400) | | | | | | | | | 108,038,258 | |
| | | | | | | | | | |
| | | | | | | | |
| Total investments in securities (Cost $89,344,400) * | | | 100.08 | % | | | 108,038,258 | |
Other assets and liabilities, net | | | (0.08 | ) | | | (82,541 | ) |
| | | | | | | | |
| Total net assets | | | 100.00 | % | | $ | 107,955,717 | |
| | | | | | | | |
| * | Cost for federal income tax purposes is $94,557,495 and unrealized gains (losses) consists of: |
| | | | |
Gross unrealized gains | | $ | 13,480,763 | |
Gross unrealized losses | | | 0 | |
| | | | |
Net unrealized gains | | $ | 13,480,763 | |
The accompanying notes are an integral part of these financial statements.
This page is intentionally left blank.
| | | | |
| 26 | | Wells Fargo Advantage Equity Gateway Funds | | Statements of assets and liabilities—November 30, 2014 (unaudited) |
| | | | | | | | |
| | | C&B Large Cap Value Fund | | | Diversified Equity Fund | |
|
Assets | |
Investments in affiliated Master Portfolio(s), at value (see cost below) | | $ | 293,348,438 | | | $ | 297,806,741 | |
Receivable for Fund shares sold | | | 69,841 | | | | 106,896 | |
Prepaid expenses and other assets | | | 30,964 | | | | 26,720 | |
| | | | |
Total assets | | | 293,449,243 | | | | 297,940,357 | |
| | | | |
|
Liabilities | |
Payable for Fund shares redeemed | | | 259,450 | | | | 102,841 | |
Advisory fee payable | | | N/A | | | | 247 | |
Distribution fees payable | | | 4,877 | | | | 2,762 | |
Administration fees payable | | | 13,136 | | | | 48,199 | |
Shareholder report expenses payable | | | 26,694 | | | | 23,797 | |
Shareholder servicing fees payable | | | 33,247 | | | | 61,376 | |
Professional fees payable | | | 9,935 | | | | 9,139 | |
Accrued expenses and other liabilities | | | 3,817 | | | | 4,714 | |
| | | | |
Total liabilities | | | 351,156 | | | | 253,075 | |
| | | | |
Total net assets | | $ | 293,098,087 | | | $ | 297,687,282 | |
| | | | |
|
NET ASSETS CONSIST OF | |
Paid-in capital | | $ | 234,401,263 | | | $ | 196,598,959 | |
Undistributed (accumulated) net investment income (loss) | | | 2,368,778 | | | | 1,070,089 | |
Accumulated net realized gains (losses) on investments | | | (25,644,600 | ) | | | 23,051,180 | |
Net unrealized gains on investments | | | 81,972,646 | | | | 76,967,054 | |
| | | | |
Total net assets | | $ | 293,098,087 | | | $ | 297,687,282 | |
| | | | |
|
COMPUTATION OF NET ASSET VALUE AND OFFERING PRICE PER SHARE | |
Net assets – Class A | | $ | 27,167,451 | | | $ | 82,233,217 | |
Shares outstanding – Class A1 | | | 2,130,635 | | | | 2,382,622 | |
Net asset value per share – Class A | | | $12.75 | | | | $34.51 | |
Maximum offering price per share – Class A2 | | | $13.53 | | | | $36.62 | |
Net assets – Class B | | $ | 394,061 | | | $ | 334,127 | |
Shares outstanding – Class B1 | | | 30,649 | | | | 10,547 | |
Net asset value per share – Class B | | | $12.86 | | | | $31.68 | |
Net assets – Class C | | $ | 7,691,037 | | | $ | 4,127,243 | |
Shares outstanding – Class C1 | | | 607,612 | | | | 127,386 | |
Net asset value per share – Class C | | | $12.66 | | | | $32.40 | |
Net assets – Class R6 | | | N/A | | | | N/A | |
Shares outstanding – Class R61 | | | N/A | | | | N/A | |
Net asset value per share – Class R6 | | | N/A | | | | N/A | |
Net assets – Administrator Class | | $ | 58,147,278 | | | $ | 210,992,695 | |
Shares outstanding – Administrator Class1 | | | 4,553,857 | | | | 6,093,191 | |
Net asset value per share – Administrator Class | | | $12.77 | | | | $34.63 | |
Net assets – Institutional Class | | $ | 129,336,200 | | | | N/A | |
Shares outstanding – Institutional Class1 | | | 10,085,855 | | | | N/A | |
Net asset value per share – Institutional Class | | | $12.82 | | | | N/A | |
Net assets – Investor Class | | $ | 70,362,060 | | | | N/A | |
Shares outstanding – Investor Class1 | | | 5,516,261 | | | | N/A | |
Net asset value per share – Investor Class | | | $12.76 | | | | N/A | |
| | |
Investments in affiliated Master Portfolio(s), at cost | | $ | 211,375,792 | | | $ | 220,839,687 | |
| | | | |
| 1. | Each Fund has an unlimited number of authorized shares. |
| 2. | Maximum offering price is computed as 100/94.25 of net asset value. On investments of $50,000 or more, the offering price is reduced. |
The accompanying notes are an integral part of these financial statements.
| | | | | | |
| Statements of assets and liabilities—November 30, 2014 (unaudited) | | Wells Fargo Advantage Equity Gateway Funds | | | 27 | |
| | | | | | | | | | | | | | | | | | |
Emerging
Growth Fund | | | Index Fund | | | International
Value Fund | | | Small Company
Growth Fund | | | Small Company
Value Fund | |
|
| | |
| $ | 1,035,438,250 | | | $ | 2,750,983,436 | | | $ | 452,112,524 | | | $ | 455,019,528 | | | $ | 108,038,258 | |
| | 469,444 | | | | 2,599,001 | | | | 1,840,763 | | | | 846,703 | | | | 50,386 | |
| | 26,894 | | | | 61,593 | | | | 22,001 | | | | 45,208 | | | | 25,804 | |
| | |
| | 1,035,934,588 | | | | 2,753,644,030 | | | | 453,975,288 | | | | 455,911,439 | | | | 108,114,448 | |
| | |
| | | | |
| | | | | | | | | | | | | | | | | | |
| | 428,713 | | | | 2,210,036 | | | | 641,279 | | | | 224,862 | | | | 99,416 | |
| | N/A | | | | N/A | | | | N/A | | | | N/A | | | | N/A | |
| | 3,044 | | | | 51,757 | | | | 556 | | | | 5,473 | | | | 1,522 | |
| | 106,537 | | | | 139,444 | | | | 25,753 | | | | 45,818 | | | | 6,035 | |
| | 56,767 | | | | 49,781 | | | | 17,658 | | | | 7,108 | | | | 22,687 | |
| | 70,547 | | | | 314,626 | | | | 91,693 | | | | 35,241 | | | | 18,908 | |
| | 9,936 | | | | 8,940 | | | | 9,622 | | | | 8,873 | | | | 9,152 | |
| | 13,481 | | | | 40,979 | | | | 4,179 | | | | 3,904 | | | | 1,011 | |
| | |
| | 689,025 | | | | 2,815,563 | | | | 790,740 | | | | 331,279 | | | | 158,731 | |
| | |
| $ | 1,035,245,563 | | | $ | 2,750,828,467 | | | $ | 453,184,548 | | | $ | 455,580,160 | | | $ | 107,955,717 | |
| | |
| | | | |
| | | | | | | | | | | | | | | | | | |
| $ | 683,377,764 | | | $ | 1,172,793,497 | | | $ | 483,636,555 | | | $ | 408,248,899 | | | $ | 179,364,885 | |
| | (4,435,665 | ) | | | 40,797,033 | | | | 12,309,835 | | | | (990,843 | ) | | | 81,014 | |
| | 74,233,684 | | | | (26,641,056 | ) | | | (45,501,997 | ) | | | 21,370,317 | | | | (90,184,040 | ) |
| | 282,069,780 | | | | 1,563,878,993 | | | | 2,740,155 | | | | 26,951,787 | | | | 18,693,858 | |
| | |
| $ | 1,035,245,563 | | | $ | 2,750,828,467 | | | $ | 453,184,548 | | | $ | 455,580,160 | | | $ | 107,955,717 | |
| | |
| | | | |
| | | | | | | | | | | | | | | | | | |
| $ | 128,427,798 | | | $ | 455,412,105 | | | $ | 5,652,428 | | | $ | 41,587,903 | | | $ | 25,386,384 | |
| | 7,873,565 | | | | 6,769,030 | | | | 391,737 | | | | 1,002,455 | | | | 1,263,272 | |
| | $16.31 | | | | $67.28 | | | | $14.43 | | | | $41.49 | | | | $20.10 | |
| | $17.31 | | | | $71.38 | | | | $15.31 | | | | $44.02 | | | | $21.33 | |
| | N/A | | | $ | 2,884,274 | | | $ | 10,160 | | | $ | 80,003 | | | $ | 31,252 | |
| | N/A | | | | 42,446 | | | | 703 | | | | 2,128 | | | | 1,705 | |
| | N/A | | | | $67.95 | | | | $14.45 | | | | $37.60 | | | | $18.33 | |
| $ | 4,928,303 | | | $ | 82,229,603 | | | $ | 872,043 | | | $ | 9,130,643 | | | $ | 2,414,499 | |
| | 319,266 | | | | 1,222,267 | | | | 61,850 | | | | 239,892 | | | | 132,538 | |
| | $15.44 | | | | $67.28 | | | | $14.10 | | | | $38.06 | | | | $18.22 | |
| | N/A | | | | N/A | | | | N/A | | | $ | 25,233 | | | | N/A | |
| | N/A | | | | N/A | | | | N/A | | | | 582 | | | | N/A | |
| | N/A | | | | N/A | | | | N/A | | | | $43.38 | | | | N/A | |
| $ | 164,462,364 | | | $ | 1,990,686,606 | | | $ | 443,211,011 | | | $ | 128,744,319 | | | $ | 64,502,887 | |
| | 9,927,424 | | | | 29,341,369 | | | | 30,887,485 | | | | 3,008,955 | | | | 3,142,478 | |
| | $16.57 | | | | $67.85 | | | | $14.35 | | | | $42.79 | | | | $20.53 | |
| $ | 695,805,716 | | | | N/A | | | $ | 3,438,906 | | | $ | 276,012,059 | | | $ | 15,620,695 | |
| | 41,154,482 | | | | N/A | | | | 238,941 | | | | 6,363,184 | | | | 757,315 | |
| | $16.91 | | | | N/A | | | | $14.39 | | | | $43.38 | | | | $20.63 | |
| $ | 41,621,382 | | | $ | 219,615,879 | | | | N/A | | | | N/A | | | | N/A | |
| | 2,567,154 | | | | 3,252,690 | | | | N/A | | | | N/A | | | | N/A | |
| | $16.21 | | | | $67.52 | | | | N/A | | | | N/A | | | | N/A | |
| | | | |
| $ | 753,368,470 | | | $ | 1,187,104,443 | | | $ | 449,372,369 | | | $ | 428,067,741 | | | $ | 89,344,400 | |
| | |
The accompanying notes are an integral part of these financial statements.
| | | | |
| 28 | | Wells Fargo Advantage Equity Gateway Funds | | Statements of operations—six months ended November 30, 2014 (unaudited) |
| | | | | | | | |
| | | C&B Large Cap
Value Fund | | | Diversified
Equity Fund | |
| | |
Investment income | | | | | | | | |
Dividends allocated from affiliated Master Portfolio(s)* | | $ | 2,544,997 | | | $ | 2,336,036 | |
Securities lending income allocated from affiliated Master Portfolio(s) | | | 2,540 | | | | 29,042 | |
Interest allocated from affiliated Master Portfolio(s) | | | 0 | | | | 139 | |
Expenses allocated from affiliated Master Portfolio(s) | | | (939,069 | ) | | | (938,681 | ) |
Waivers allocated from affiliated Master Portfolio(s) | | | 0 | | | | 38,210 | |
| | | | |
Total investment income | | | 1,608,468 | | | | 1,464,746 | |
| | | | |
| | |
Expenses | | | | | | | | |
Advisory fee | | | N/A | | | | 385,297 | |
Administration fees | | | | | | | | |
Fund level | | | 69,271 | | | | 77,059 | |
Class A | | | 35,214 | | | | 106,057 | |
Class B | | | 538 | | | | 700 | |
Class C | | | 9,566 | | | | 5,497 | |
Class R6 | | | N/A | | | | N/A | |
Administrator Class | | | 27,255 | | | | 110,944 | |
Institutional Class | | | 46,735 | | | | N/A | |
Investor Class | | | 113,402 | | | | N/A | |
Shareholder servicing fees | | | | | | | | |
Class A | | | 33,860 | | | | 101,978 | |
Class B | | | 518 | | | | 674 | |
Class C | | | 9,198 | | | | 5,285 | |
Administrator Class | | | 68,137 | | | | 276,850 | |
Investor Class | | | 88,595 | | | | N/A | |
Distribution fees | | | | | | | | |
Class B | | | 1,553 | | | | 2,020 | |
Class C | | | 27,595 | | | | 15,856 | |
Custody and accounting fees | | | 5,654 | | | | 6,756 | |
Professional fees | | | 13,837 | | | | 14,271 | |
Registration fees | | | 28,130 | | | | 19,485 | |
Shareholder report expenses | | | 15,297 | | | | 10,438 | |
Trustees’ fees and expenses | | | 6,095 | | | | 5,058 | |
Other fees and expenses | | | 5,703 | | | | 5,538 | |
| | | | |
Total expenses | | | 606,153 | | | | 1,149,763 | |
Less: Fee waivers and/or expense reimbursements | | | (222,515 | ) | | | (383,234 | ) |
| | | | |
Net expenses | | | 383,638 | | | | 766,529 | |
| | | | |
Net investment income (loss) | | | 1,224,830 | | | | 698,217 | |
| | | | |
| | |
REALIZED AND UNREALIZED GAINS (LOSSES) ON INVESTMENTS | | | | | | | | |
Net realized gains on securities transaction allocated from Master Portfolio(s) | | | 19,666,924 | | | | 14,033,250 | |
Net change in unrealized gains (losses) on securities transactions allocated from Master Portfolio(s) | | | (3,258,371 | ) | | | 918,429 | |
| | | | |
Net realized and unrealized gains (losses) on investments | | | 16,408,553 | | | | 14,951,679 | |
| | | | |
Net increase (decrease) in net assets resulting from operations | | $ | 17,633,383 | | | $ | 15,649,896 | |
| | | | |
| | |
* Net of foreign dividend withholding taxes allocated from affiliated Master Portfolio(s) in the amount of | | | $17,883 | | | | $59,143 | |
| 1. | Class commenced operations on October 31, 2014. |
The accompanying notes are an integral part of these financial statements.
| | | | | | |
| Statements of operations—six months ended November 30, 2014 (unaudited) | | Wells Fargo Advantage Equity Gateway Funds | | | 29 | |
| | | | | | | | | | | | | | | | | | |
Emerging
Growth Fund | | | Index Fund | | | International
Value Fund | | | Small Company
Growth Fund | | | Small Company
Value Fund | |
| | | | |
| | | | | | | | | | | | | | | | | | |
| $ | 583,272 | | | $ | 27,391,416 | | | $ | 5,942,750 | | | $ | 768,742 | | | $ | 745,567 | |
| | 308,722 | | | | 42,776 | | | | 143,132 | | | | 238,376 | | | | 12,729 | |
| | 0 | | | | 264 | | | | 2,568 | | | | 0 | | | | 0 | |
| | (4,077,425 | ) | | | (1,419,565 | ) | | | (2,084,291 | ) | | | (1,584,995 | ) | | | (459,371 | ) |
| | 0 | | | | 0 | | | | 0 | | | | 0 | | | | 0 | |
| | |
| | (3,185,431 | ) | | | 26,014,891 | | | | 4,004,159 | | | | (577,877 | ) | | | 298,925 | |
| | |
| | | | |
| | | | | | | | | | | | | | | | | | |
| | N/A | | | | N/A | | | | N/A | | | | N/A | | | | N/A | |
| | | | | | | | | | | | | | | | | | |
| | 255,654 | | | | 666,392 | | | | 115,750 | | | | 96,371 | | | | 27,262 | |
| | 170,931 | | | | 569,110 | | | | 8,256 | | | | 44,206 | | | | 33,349 | |
| | N/A | | | | 4,005 | | | | 17 | | | | 126 | | | | 59 | |
| | 6,336 | | | | 102,739 | | | | 1,181 | | | | 9,730 | | | | 3,137 | |
| | N/A | | | | N/A | | | | N/A | | | | 1 | 1 | | | N/A | |
| | 93,997 | | | | 971,942 | | | | 226,476 | | | | 59,679 | | | | 33,285 | |
| | 263,096 | | | | N/A | | | | 1,111 | | | | 89,814 | | | | 5,747 | |
| | 64,835 | | | | 322,874 | | | | N/A | | | | N/A | | | | N/A | |
| | | | | | | | | | | | | | | | | | |
| | 164,357 | | | | 547,221 | | | | 7,938 | | | | 42,506 | | | | 32,067 | |
| | N/A | | | | 3,851 | | | | 17 | | | | 121 | | | | 57 | |
| | 6,092 | | | | 98,787 | | | | 1,136 | | | | 9,356 | | | | 3,016 | |
| | 221,206 | | | | 967,560 | | | | 566,190 | | | | 147,302 | | | | 82,691 | |
| | 50,653 | | | | 250,020 | | | | N/A | | | | N/A | | | | N/A | |
| | | | | | | | | | | | | | | | | | |
| | N/A | | | | 11,552 | | | | 51 | | | | 363 | | | | 169 | |
| | 18,277 | | | | 296,362 | | | | 3,407 | | | | 28,068 | | | | 9,049 | |
| | 19,633 | | | | 50,939 | | | | 8,681 | | | | 7,805 | | | | 2,622 | |
| | 13,834 | | | | 14,831 | | | | 13,528 | | | | 14,567 | | | | 15,387 | |
| | 28,661 | | | | 27,076 | | | | 21,802 | | | | 23,416 | | | | 27,278 | |
| | 67,995 | | | | 80,187 | | | | 15,059 | | | | 11,650 | | | | 3,531 | |
| | 6,095 | | | | 6,554 | | | | 6,270 | | | | 5,959 | | | | 5,794 | |
| | 10,993 | | | | 31,269 | | | | 6,420 | | | | 4,175 | | | | 4,137 | |
| | |
| | 1,462,645 | | | | 5,023,271 | | | | 1,003,290 | | | | 595,215 | | | | 288,637 | |
| | (212,411 | ) | | | (1,795,341 | ) | | | (184,408 | ) | | | (78,270 | ) | | | (70,755 | ) |
| | |
| | 1,250,234 | | | | 3,227,930 | | | | 818,882 | | | | 516,945 | | | | 217,882 | |
| | |
| | (4,435,665 | ) | | | 22,786,961 | | | | 3,185,277 | | | | (1,094,822 | ) | | | 81,043 | |
| | |
| | | | |
| | | | | | | | | | | | | | | | | | |
| | 43,667,490 | | | | 51,338,602 | | | | 3,607,918 | | | | 8,806,626 | | | | 3,919,620 | |
| | 75,860,780 | | | | 143,273,859 | | | | (37,676,432 | ) | | | 12,587,784 | | | | (3,648,029 | ) |
| | |
| | 119,528,270 | | | | 194,612,461 | | | | (34,068,514 | ) | | | 21,394,410 | | | | 271,591 | |
| | |
| $ | 115,092,605 | | | $ | 217,399,422 | | | $ | (30,883,237 | ) | | $ | 20,299,588 | | | $ | 352,634 | |
| | |
| | | | |
| | $0 | | | | $7,921 | | | | $610,393 | | | | $4,581 | | | | $0 | |
The accompanying notes are an integral part of these financial statements.
| | | | |
| 30 | | Wells Fargo Advantage Equity Gateway Funds | | Statements of changes in net assets |
| | | | | | | | | | | | | | | | |
| | | C&B Large Cap Value Fund | |
| | | Six months ended
November 30, 2014
(unaudited) | | | Year ended
May 31, 2014 | |
| | | |
Operations | | | | | | | | | | | | |
Net investment income | | | | | | $ | 1,224,830 | | | | | | | $ | 3,085,612 | |
Net realized gains on investments | | | | | | | 19,666,924 | | | | | | | | 35,351,897 | |
Net change in unrealized gains (losses) on investments | | | | | | | (3,258,371 | ) | | | | | | | 7,968,120 | |
| | | | |
Net increase in net assets resulting from operations | | | | | | | 17,633,383 | | | | | | | | 46,405,629 | |
| | | | |
| | | |
Distributions to shareholders from | | | | | | | | | | | | |
Net investment income | | | | | | | | | | | | | | | | |
Class A | | | | | | | 0 | | | | | | | | (262,151 | ) |
Class C | | | | | | | 0 | | | | | | | | (14,618 | ) |
Administrator Class | | | | | | | 0 | | | | | | | | (590,027 | ) |
Institutional Class | | | | | | | 0 | | | | | | | | (1,663,247 | ) |
Investor Class | | | | | | | 0 | | | | | | | | (662,095 | ) |
| | | | |
Total distributions to shareholders | | | | | | | 0 | | | | | | | | (3,192,138 | ) |
| | | | |
| | | | |
Capital share transactions | | | Shares | | | | | | | | Shares | | | | | |
Proceeds from shares sold | | | | | | | | | | | | | | | | |
Class A | | | 46,253 | | | | 561,169 | | | | 539,769 | | | | 5,918,250 | |
Class B | | | 2,340 | | | | 28,086 | | | | 27,597 | | | | 307,204 | |
Class C | | | 35,659 | | | | 434,761 | | | | 120,833 | | | | 1,338,476 | |
Administrator Class | | | 637,763 | | | | 7,812,237 | | | | 1,141,117 | | | | 12,475,754 | |
Institutional Class | | | 1,968,521 | | | | 24,007,153 | | | | 1,511,868 | | | | 16,424,182 | |
Investor Class | | | 203,890 | | | | 2,474,658 | | | | 1,286,940 | | | | 14,007,996 | |
| | | | |
| | | | | | | 35,318,064 | | | | | | | | 50,471,862 | |
| | | | |
Reinvestment of distributions | | | | | | | | | | | | | | | | |
Class A | | | 0 | | | | 0 | | | | 19,896 | | | | 226,619 | |
Class C | | | 0 | | | | 0 | | | | 1,206 | | | | 13,739 | |
Administrator Class | | | 0 | | | | 0 | | | | 49,911 | | | | 567,989 | |
Institutional Class | | | 0 | | | | 0 | | | | 53,948 | | | | 615,550 | |
Investor Class | | | 0 | | | | 0 | | | | 56,227 | | | | 640,989 | |
| | | | |
| | | | | | | 0 | | | | | | | | 2,064,886 | |
| | | | |
Payment for shares redeemed | | | | | | | | | | | | | | | | |
Class A | | | (378,390 | ) | | | (4,619,537 | ) | | | (380,906 | ) | | | (4,228,956 | ) |
Class B | | | (10,318 | ) | | | (126,979 | ) | | | (100,896 | ) | | | (1,115,949 | ) |
Class C | | | (35,740 | ) | | | (423,676 | ) | | | (79,887 | ) | | | (901,364 | ) |
Administrator Class | | | (574,764 | ) | | | (7,022,868 | ) | | | (3,555,863 | ) | | | (38,222,271 | ) |
Institutional Class | | | (587,183 | ) | | | (7,159,551 | ) | | | (5,422,972 | ) | | | (60,984,643 | ) |
Investor Class | | | (760,612 | ) | | | (9,293,265 | ) | | | (1,692,398 | ) | | | (19,118,521 | ) |
| | | | |
| | | | | | | (28,645,876 | ) | | | | | | | (124,571,704 | ) |
| | | | |
Net increase (decrease) in net assets resulting from capital share transactions | | | | | | | 6,672,188 | | | | | | | | (72,034,956 | ) |
| | | | |
Total increase (decrease) in net assets | | | | | | | 24,305,571 | | | | | | | | (28,821,465 | ) |
| | | | |
| | |
Net assets | | | | | | | | |
Beginning of period | | | | | | | 268,792,516 | | | | | | | | 297,613,981 | |
| | | | |
End of period | | | | | | $ | 293,098,087 | | | | | | | $ | 268,792,516 | |
| | | | |
Undistributed net investment income | | | | | | $ | 2,368,778 | | | | | | | $ | 1,143,948 | |
| | | | |
The accompanying notes are an integral part of these financial statements.
| | | | | | |
| Statements of changes in net assets | | Wells Fargo Advantage Equity Gateway Funds | | | 31 | |
| | | | | | | | | | | | | | | | |
| | | Diversified Equity Fund | |
| | | Six months ended
November 30, 2014
(unaudited) | | | Year ended
May 31, 2014 | |
| | | |
Operations | | | | | | | | | | | | |
Net investment income | | | | | | $ | 698,217 | | | | | | | $ | 2,326,713 | |
Net realized gains on investments | | | | | | | 14,033,250 | | | | | | | | 27,396,245 | |
Net change in unrealized gains (losses) on investments | | | | | | | 918,429 | | | | | | | | 34,417,583 | |
| | | | |
Net increase in net assets resulting from operations | | | | | | | 15,649,896 | | | | | | | | 64,140,541 | |
| | | | |
| | | | |
Distributions to shareholders from | | | | | | | | | | | | | | | | |
Net investment income | | | | | | | | | | | | | | | | |
Class A | | | | | | | 0 | | | | | | | | (440,132 | ) |
Class C | | | | | | | 0 | | | | | | | | (1,965 | ) |
Administrator Class | | | | | | | 0 | | | | | | | | (2,165,310 | ) |
Net realized gains | | | | | | | | | | | | | | | | |
Class A | | | | | | | 0 | | | | | | | | (7,873,191 | ) |
Class B | | | | | | | 0 | | | | | | | | (140,781 | ) |
Class C | | | | | | | 0 | | | | | | | | (467,437 | ) |
Administrator Class | | | | | | | 0 | | | | | | | | (27,105,195 | ) |
| | | | |
Total distributions to shareholders | | | | | | | 0 | | | | | | | | (38,194,011 | ) |
| | | | |
| | | | |
Capital share transactions | | | Shares | | | | | | | | Shares | | | | | |
Proceeds from shares sold | | | | | | | | | | | | | | | | |
Class A | | | 29,727 | | | | 992,908 | | | | 82,239 | | | | 2,633,182 | |
Class B | | | 622 | | | | 19,348 | | | | 594 | | | | 17,175 | |
Class C | | | 4,685 | | | | 147,404 | | | | 63,161 | | | | 1,932,663 | |
Administrator Class | | | 210,229 | | | | 7,032,566 | | | | 712,239 | | | | 22,940,594 | |
| | | | |
| | | | | | | 8,192,226 | | | | | | | | 27,523,614 | |
| | | | |
Reinvestment of distributions | | | | | | | | | | | | | | | | |
Class A | | | 0 | | | | 0 | | | | 266,289 | | | | 8,270,615 | |
Class B | | | 0 | | | | 0 | | | | 4,929 | | | | 140,741 | |
Class C | | | 0 | | | | 0 | | | | 15,582 | | | | 455,178 | |
Administrator Class | | | 0 | | | | 0 | | | | 927,563 | | | | 28,904,030 | |
| | | | |
| | | | | | | 0 | | | | | | | | 37,770,564 | |
| | | | |
Payment for shares redeemed | | | | | | | | | | | | | | | | |
Class A | | | (154,499 | ) | | | (5,184,021 | ) | | | (308,926 | ) | | | (9,931,146 | ) |
Class B | | | (16,757 | ) | | | (515,041 | ) | | | (49,913 | ) | | | (1,478,236 | ) |
Class C | | | (16,265 | ) | | | (515,585 | ) | | | (31,320 | ) | | | (936,132 | ) |
Administrator Class | | | (985,337 | ) | | | (32,807,717 | ) | | | (4,218,625 | ) | | | (136,373,544 | ) |
| | | | |
| | | | | | | (39,022,364 | ) | | | | | | | (148,719,058 | ) |
| | | | |
Net decrease in net assets resulting from capital share transactions | | | | | | | (30,830,138 | ) | | | | | | | (83,424,880 | ) |
| | | | |
Total decrease in net assets | | | | | | | (15,180,242 | ) | | | | | | | (57,478,350 | ) |
| | | | |
| | |
Net assets | | | | | | | | |
Beginning of period | | | | | | | 312,867,524 | | | | | | | | 370,345,874 | |
| | | | |
End of period | | | | | | $ | 297,687,282 | | | | | | | $ | 312,867,524 | |
| | | | |
Undistributed net investment income | | | | | | $ | 1,070,089 | | | | | | | $ | 371,872 | |
| | | | |
The accompanying notes are an integral part of these financial statements.
| | | | |
| 32 | | Wells Fargo Advantage Equity Gateway Funds | | Statements of changes in net assets |
| | | | | | | | | | | | | | | | |
| | | Emerging Growth Fund | |
| | | Six months ended
November 30, 2014
(unaudited) | | | Year ended
May 31, 2014 | |
| | | |
Operations | | | | | | | | | | | | |
Net investment loss | | | | | | $ | (4,435,665 | ) | | | | | | $ | (9,470,683 | ) |
Net realized gains on investments | | | | | | | 43,667,490 | | | | | | | | 114,899,461 | |
Net change in unrealized gains (losses) on investments | | | | | | | 75,860,780 | | | | | | | | 1,297,278 | |
| | | | |
Net increase in net assets resulting from operations | | | | | | | 115,092,605 | | | | | | | | 106,726,056 | |
| | | | |
| | | | |
Distributions to shareholders from | | | | | | | | | | | | | | | | |
Net realized gains | | | | | | | | | | | | | | | | |
Class A | | | | | | | 0 | | | | | | | | (10,269,921 | ) |
Class C | | | | | | | 0 | | | | | | | | (411,599 | ) |
Administrator Class | | | | | | | 0 | | | | | | | | (15,150,119 | ) |
Institutional Class | | | | | | | 0 | | | | | | | | (45,309,414 | ) |
Investor Class | | | | | | | 0 | | | | | | | | (3,128,448 | ) |
| | | | |
Total distributions to shareholders | | | | | | | 0 | | | | | | | | (74,269,501 | ) |
| | | | |
| | | | |
Capital share transactions | | | Shares | | | | | | | | Shares | | | | | |
Proceeds from shares sold | | | | | | | | | | | | | | | | |
Class A | | | 306,406 | | | | 4,715,069 | | | | 1,215,007 | | | | 19,971,182 | |
Class C | | | 2,261 | | | | 33,591 | | | | 23,255 | | | | 375,134 | |
Administrator Class | | | 1,274,902 | | | | 20,198,589 | | | | 3,399,985 | | | | 55,969,854 | |
Institutional Class | | | 5,613,688 | | | | 91,169,988 | | | | 11,734,781 | | | | 194,573,267 | |
Investor Class | | | 48,271 | | | | 741,693 | | | | 213,599 | | | | 3,417,746 | |
| | | | |
| | | | | | | 116,858,930 | | | | | | | | 274,307,183 | |
| | | | |
Reinvestment of distributions | | | | | | | | | | | | | | | | |
Class A | | | 0 | | | | 0 | | | | 632,730 | | | | 10,066,729 | |
Class C | | | 0 | | | | 0 | | | | 24,564 | | | | 372,642 | |
Administrator Class | | | 0 | | | | 0 | | | | 692,543 | | | | 11,177,638 | |
Institutional Class | | | 0 | | | | 0 | | | | 2,659,177 | | | | 43,663,690 | |
Investor Class | | | 0 | | | | 0 | | | | 190,725 | | | | 3,019,173 | |
| | | | |
| | | | | | | 0 | | | | | | | | 68,299,872 | |
| | | | |
Payment for shares redeemed | | | | | | | | | | | | | | | | |
Class A | | | (1,359,621 | ) | | | (21,086,065 | ) | | | (1,788,965 | ) | | | (28,888,800 | ) |
Class C | | | (30,028 | ) | | | (442,385 | ) | | | (60,896 | ) | | | (933,953 | ) |
Administrator Class | | | (4,170,064 | ) | | | (66,993,958 | ) | | | (5,288,525 | ) | | | (86,388,323 | ) |
Institutional Class | | | (7,522,892 | ) | | | (120,615,317 | ) | | | (11,284,697 | ) | | | (184,012,808 | ) |
Investor Class | | | (212,737 | ) | | | (3,244,466 | ) | | | (366,218 | ) | | | (5,904,037 | ) |
| | | | |
| | | | | | | (212,382,191 | ) | | | | | | | (306,127,921 | ) |
| | | | |
Net increase (decrease) in net assets resulting from capital share transactions | | | | | | | (95,523,261 | ) | | | | | | | 36,479,134 | |
| | | | |
Total increase in net assets | | | | | | | 19,569,344 | | | | | | | | 68,935,689 | |
| | | | |
| | |
Net assets | | | | | | | | |
Beginning of period | | | | | | | 1,015,676,219 | | | | | | | | 946,740,530 | |
| | | | |
End of period | | | | | | $ | 1,035,245,563 | | | | | | | $ | 1,015,676,219 | |
| | | | |
Accumulated net investment loss | | | | | | $ | (4,435,665 | ) | | | | | | $ | 0 | |
| | | | |
The accompanying notes are an integral part of these financial statements.
| | | | | | |
| Statements of changes in net assets | | Wells Fargo Advantage Equity Gateway Funds | | | 33 | |
| | | | | | | | | | | | | | | | |
| | | Index Fund | |
| | | Six months ended
November 30, 2014
(unaudited) | | | Year ended
May 31, 2014 | |
| | | |
Operations | | | | | | | | | | | | |
Net investment income | | | | | | $ | 22,786,961 | | | | | | | $ | 45,212,227 | |
Net realized gains on investments | | | | | | | 51,338,602 | | | | | | | | 10,096,457 | |
Net change in unrealized gains (losses) on investments | | | | | | | 143,273,859 | | | | | | | | 422,527,154 | |
| | | | |
Net increase in net assets resulting from operations | | | | | | | 217,399,422 | | | | | | | | 477,835,838 | |
| | | | |
| | | | |
Distributions to shareholders from | | | | | | | | | | | | | | | | |
Net investment income | | | | | | | | | | | | | | | | |
Class A | | | | | | | 0 | | | | | | | | (6,235,208 | ) |
Class B | | | | | | | 0 | | | | | | | | (16,846 | ) |
Class C | | | | | | | 0 | | | | | | | | (571,085 | ) |
Administrator Class | | | | | | | 0 | | | | | | | | (34,265,268 | ) |
Investor Class | | | | | | | 0 | | | | | | | | (2,683,486 | ) |
Net realized gains | | | | | | | | | | | | | | | | |
Class A | | | | | | | 0 | | | | | | | | (10,825,854 | ) |
Class B | | | | | | | 0 | | | | | | | | (106,025 | ) |
Class C | | | | | | | 0 | | | | | | | | (1,912,197 | ) |
Administrator Class | | | | | | | 0 | | | | | | | | (49,270,181 | ) |
Investor Class | | | | | | | 0 | | | | | | | | (4,280,430 | ) |
| | | | |
Total distributions to shareholders | | | | | | | 0 | | | | | | | | (110,166,580 | ) |
| | | | |
| | | | |
Capital share transactions | | | Shares | | | | | | | | Shares | | | | | |
Proceeds from shares sold | | | | | | | | | | | | | | | | |
Class A | | | 219,647 | | | | 14,034,701 | | | | 339,026 | | | | 19,453,975 | |
Class B | | | 34 | | | | 2,290 | | | | 658 | | | | 37,922 | |
Class C | | | 28,569 | | | | 1,839,001 | | | | 63,483 | | | | 3,642,434 | |
Administrator Class | | | 2,654,600 | | | | 170,941,154 | | | | 5,517,119 | | | | 320,679,308 | |
Investor Class | | | 407,069 | | | | 26,125,962 | | | | 642,862 | | | | 37,499,496 | |
| | | | |
| | | | | | | 212,943,108 | | | | | | | | 381,313,135 | |
| | | | |
Reinvestment of distributions | | | | | | | | | | | | | | | | |
Class A | | | 0 | | | | 0 | | | | 287,123 | | | | 16,660,487 | |
Class B | | | 0 | | | | 0 | | | | 1,950 | | | | 114,023 | |
Class C | | | 0 | | | | 0 | | | | 25,553 | | | | 1,485,257 | |
Administrator Class | | | 0 | | | | 0 | | | | 1,385,299 | | | | 80,961,179 | |
Investor Class | | | 0 | | | | 0 | | | | 117,761 | | | | 6,855,338 | |
| | | | |
| | | | | | | 0 | | | | | | | | 106,076,284 | |
| | | | |
Payment for shares redeemed | | | | | | | | | | | | | | | | |
Class A | | | (410,408 | ) | | | (26,320,865 | ) | | | (1,213,639 | ) | | | (70,493,693 | ) |
Class B | | | (11,753 | ) | | | (762,703 | ) | | | (48,381 | ) | | | (2,792,462 | ) |
Class C | | | (58,884 | ) | | | (3,741,509 | ) | | | (133,347 | ) | | | (7,774,402 | ) |
Administrator Class | | | (5,039,207 | ) | | | (324,472,381 | ) | | | (8,899,266 | ) | | | (522,844,104 | ) |
Investor Class | | | (221,535 | ) | | | (14,191,699 | ) | | | (456,474 | ) | | | (26,647,819 | ) |
| | | | |
| | | | | | | (369,489,157 | ) | | | | | | | (630,552,480 | ) |
| | | | |
Net decrease in net assets resulting from capital share transactions | | | | | | | (156,546,049 | ) | | | | | | | (143,163,061 | ) |
| | | | |
Total increase in net assets | | | | | | | 60,853,373 | | | | | | | | 224,506,197 | |
| | | | |
| | |
Net assets | | | | | | | | |
Beginning of period | | | | | | | 2,689,975,094 | | | | | | | | 2,465,468,897 | |
| | | | |
End of period | | | | | | $ | 2,750,828,467 | | | | | | | $ | 2,689,975,094 | |
| | | | |
Undistributed net investment income | | | | | | $ | 40,797,033 | | | | | | | $ | 18,010,072 | |
| | | | |
The accompanying notes are an integral part of these financial statements.
| | | | |
| 34 | | Wells Fargo Advantage Equity Gateway Funds | | Statements of changes in net assets |
| | | | | | | | | | | | | | | | |
| | | International Value Fund | |
| | | Six months ended
November 30, 2014
(unaudited) | | | Year ended
May 31, 2014 | |
| | | |
Operations | | | | | | | | | | | | |
Net investment income | | | | | | $ | 3,185,277 | | | | | | | $ | 11,615,770 | |
Net realized gains on investments | | | | | | | 3,607,918 | | | | | | | | 7,858,906 | |
Net change in unrealized gains (losses) on investments | | | | | | | (37,676,432 | ) | | | | | | | 49,298,877 | |
| | | | |
Net increase (decrease) in net assets resulting from operations | | | | | | | (30,883,237 | ) | | | | | | | 68,773,553 | |
| | | | |
| | | | |
Distributions to shareholders from | | | | | | | | | | | | | | | | |
Net investment income | | | | | | | | | | | | | | | | |
Class A | | | | | | | 0 | | | | | | | | (122,245 | ) |
Class B | | | | | | | 0 | | | | | | | | (524 | ) |
Class C | | | | | | | 0 | | | | | | | | (11,877 | ) |
Administrator Class | | | | | | | 0 | | | | | | | | (9,065,141 | ) |
Institutional Class | | | | | | | 0 | | | | | | | | (53,689 | ) |
| | | | |
Total distributions to shareholders | | | | | | | 0 | | | | | | | | (9,253,476 | ) |
| | | | |
| | | | |
Capital share transactions | | | Shares | | | | | | | | Shares | | | | | |
Proceeds from shares sold | | | | | | | | | | | | | | | | |
Class A | | | 42,657 | | | | 656,610 | | | | 106,713 | | | | 1,564,140 | |
Class C | | | 7,080 | | | | 101,948 | | | | 20,601 | | | | 292,432 | |
Administrator Class | | | 2,936,092 | | | | 43,853,169 | | | | 6,250,245 | | | | 90,362,606 | |
Institutional Class | | | 96,818 | | | | 1,453,162 | | | | 16,594 | | | | 234,997 | |
| | | | |
| | | | | | | 46,064,889 | | | | | | | | 92,454,175 | |
| | | | |
Reinvestment of distributions | | | | | | | | | | | | | | | | |
Class A | | | 0 | | | | 0 | | | | 8,117 | | | | 121,351 | |
Class B | | | 0 | | | | 0 | | | | 34 | | | | 507 | |
Class C | | | 0 | | | | 0 | | | | 759 | | | | 11,169 | |
Administrator Class | | | 0 | | | | 0 | | | | 609,788 | | | | 9,049,258 | |
Institutional Class | | | 0 | | | | 0 | | | | 3,616 | | | | 53,689 | |
| | | | |
| | | | | | | 0 | | | | | | | | 9,235,974 | |
| | | | |
Payment for shares redeemed | | | | | | | | | | | | | | | | |
Class A | | | (86,146 | ) | | | (1,322,056 | ) | | | (121,473 | ) | | | (1,768,905 | ) |
Class B | | | (907 | ) | | | (14,040 | ) | | | (3,623 | ) | | | (53,008 | ) |
Class C | | | (5,910 | ) | | | (83,832 | ) | | | (5,801 | ) | | | (84,651 | ) |
Administrator Class | | | (1,982,513 | ) | | | (29,856,675 | ) | | | (4,884,668 | ) | | | (70,393,442 | ) |
Institutional Class | | | (11,287 | ) | | | (164,708 | ) | | | (12,330 | ) | | | (179,985 | ) |
| | | | |
| | | | | | | (31,441,311 | ) | | | | | | | (72,479,991 | ) |
| | | | |
Net increase in net assets resulting from capital share transactions | | | | | | | 14,623,578 | | | | | | | | 29,210,158 | |
| | | | |
Total increase (decrease) in net assets | | | | | | | (16,259,659 | ) | | | | | | | 88,730,235 | |
| | | | |
| | |
Net assets | | | | | | | | |
Beginning of period | | | | | | | 469,444,207 | | | | | | | | 380,713,972 | |
| | | | |
End of period | | | | | | $ | 453,184,548 | | | | | | | $ | 469,444,207 | |
| | | | |
Undistributed net investment income | | | | | | $ | 12,309,835 | | | | | | | $ | 9,124,558 | |
| | | | |
The accompanying notes are an integral part of these financial statements.
| | | | | | |
| Statements of changes in net assets | | Wells Fargo Advantage Equity Gateway Funds | | | 35 | |
| | | | | | | | | | | | | | | | |
| | | Small Company Growth Fund | |
| | | Six months ended
November 30, 2014
(unaudited) | | | Year ended
May 31, 2014 | |
| | | |
Operations | | | | | | | | | | | | |
Net investment loss | | | | | | $ | (1,094,822 | ) | | | | | | $ | (1,631,254 | ) |
Net realized gains on investments | | | | | | | 8,806,626 | | | | | | | | 23,430,072 | |
Net change in unrealized gains (losses) on investments | | | | | | | 12,587,784 | | | | | | | | 20,251,053 | |
| | | | |
Net increase in net assets resulting from operations | | | | | | | 20,299,588 | | | | | | | | 42,049,871 | |
| | | | |
| | | | |
Distributions to shareholders from | | | | | | | | | | | | | | | | |
Net realized gains | | | | | | | | | | | | | | | | |
Class A | | | | | | | 0 | | | | | | | | (1,341,163 | ) |
Class B | | | | | | | 0 | | | | | | | | (11,323 | ) |
Class C | | | | | | | 0 | | | | | | | | (312,608 | ) |
Administrator Class | | | | | | | 0 | | | | | | | | (5,754,681 | ) |
Institutional Class | | | | | | | 0 | | | | | | | | (5,740,954 | ) |
| | | | |
Total distributions to shareholders | | | | | | | 0 | | | | | | | | (13,160,729 | ) |
| | | | |
| | | | |
Capital share transactions | | | Shares | | | | | | | | Shares | | | | | |
Proceeds from shares sold | | | | | | | | | | | | | | | | |
Class A | | | 455,927 | | | | 18,761,163 | | | | 616,853 | | | | 24,225,370 | |
Class B | | | 0 | | | | 0 | | | | 1,668 | | | | 57,600 | |
Class C | | | 76,838 | | | | 2,850,969 | | | | 125,263 | | | | 4,506,947 | |
Class R6 | | | 582 | 1 | | | 25,000 | 1 | | | N/A | | | | N/A | |
Administrator Class | | | 1,036,304 | | | | 42,929,337 | | | | 830,660 | | | | 33,624,291 | |
Institutional Class | | | 2,282,667 | | | | 97,808,788 | | | | 2,899,490 | | | | 118,117,387 | |
| | | | |
| | | | | | | 162,375,257 | | | | | | | | 180,531,595 | |
| | | | |
Reinvestment of distributions | | | | | | | | | | | | | | | | |
Class A | | | 0 | | | | 0 | | | | 33,483 | | | | 1,250,264 | |
Class B | | | 0 | | | | 0 | | | | 231 | | | | 7,891 | |
Class C | | | 0 | | | | 0 | | | | 7,675 | | | | 264,852 | |
Administrator Class | | | 0 | | | | 0 | | | | 145,665 | | | | 5,599,351 | |
Institutional Class | | | 0 | | | | 0 | | | | 88,199 | | | | 3,429,182 | |
| | | | |
| | | | | | | 0 | | | | | | | | 10,551,540 | |
| | | | |
Payment for shares redeemed | | | | | | | | | | | | | | | | |
Class A | | | (223,353 | ) | | | (9,088,515 | ) | | | (153,841 | ) | | | (6,046,560 | ) |
Class B | | | (697 | ) | | | (25,914 | ) | | | (4,268 | ) | | | (151,436 | ) |
Class C | | | (17,185 | ) | | | (645,467 | ) | | | (28,111 | ) | | | (1,003,269 | ) |
Administrator Class | | | (942,407 | ) | | | (40,074,931 | ) | | | (863,715 | ) | | | (34,001,532 | ) |
Institutional Class | | | (454,334 | ) | | | (19,307,322 | ) | | | (464,741 | ) | | | (18,430,611 | ) |
| | | | |
| | | | | | | (69,142,149 | ) | | | | | | | (59,633,408 | ) |
| | | | |
Net increase in net assets resulting from capital share transactions | | | | | | | 93,233,108 | | | | | | | | 131,449,727 | |
| | | | |
Total increase in net assets | | | | | | | 113,532,696 | | | | | | | | 160,338,869 | |
| | | | |
| | |
Net assets | | | | | | | | |
Beginning of period | | | | | | | 342,047,464 | | | | | | | | 181,708,595 | |
| | | | |
End of period | | | | | | $ | 455,580,160 | | | | | | | $ | 342,047,464 | |
| | | | |
Undistributed (accumulated) net investment income (loss) | | | | | | $ | (990,843 | ) | | | | | | $ | 103,979 | |
| | | | |
| 1. | Class commenced operations on October 31, 2014. |
The accompanying notes are an integral part of these financial statements.
| | | | |
| 36 | | Wells Fargo Advantage Equity Gateway Funds | | Statements of changes in net assets |
| | | | | | | | | | | | | | | | |
| | | Small Company Value Fund | |
| | | Six months ended
November 30, 2014
(unaudited) | | | Year ended
May 31, 2014 | |
| | | |
Operations | | | | | | | | | | | | |
Net investment income | | | | | | $ | 81,043 | | | | | | | $ | 516,488 | |
Net realized gains on investments | | | | | | | 3,919,620 | | | | | | | | 11,117,270 | |
Net change in unrealized gains (losses) on investments | | | | | | | (3,648,029 | ) | | | | | | | 4,928,346 | |
| | | | |
Net increase in net assets resulting from operations | | | | | | | 352,634 | | | | | | | | 16,562,104 | |
| | | | |
| | | | |
Capital share transactions | | | Shares | | | | | | | | Shares | | | | | |
Proceeds from shares sold | | | | | | | | | | | | | | | | |
Class A | | | 85,541 | | | | 1,717,759 | | | | 399,805 | | | | 7,560,140 | |
Class B | | | 179 | | | | 3,340 | | | | 221 | | | | 3,721 | |
Class C | | | 20,622 | | | | 380,920 | | | | 27,128 | | | | 471,889 | |
Administrator Class | | | 226,946 | | | | 4,587,766 | | | | 521,057 | | | | 10,002,931 | |
Institutional Class | | | 346,067 | | | | 6,978,239 | | | | 201,879 | | | | 3,915,493 | |
| | | | |
| | | | | | | 13,668,024 | | | | | | | | 21,954,174 | |
| | | | |
Payment for shares redeemed | | | | | | | | | | | | | | | | |
Class A | | | (142,736 | ) | | | (2,855,945 | ) | | | (345,399 | ) | | | (6,653,511 | ) |
Class B | | | (1,645 | ) | | | (29,508 | ) | | | (9,591 | ) | | | (165,161 | ) |
Class C | | | (8,027 | ) | | | (144,287 | ) | | | (22,889 | ) | | | (399,317 | ) |
Administrator Class | | | (420,408 | ) | | | (8,592,909 | ) | | | (661,856 | ) | | | (12,850,144 | ) |
Institutional Class | | | (170,522 | ) | | | (3,533,725 | ) | | | (89,190 | ) | | | (1,754,912 | ) |
| | | | |
| | | | | | | (15,156,374 | ) | | | | | | | (21,823,045 | ) |
| | | | |
Net increase (decrease) in net assets resulting from capital share transactions | | | | | | | (1,488,350 | ) | | | | | | | 131,129 | |
| | | | |
Total increase (decrease) in net assets | | | | | | | (1,135,716 | ) | | | | | | | 16,693,233 | |
| | | | |
| | |
Net assets | | | | | | | | |
Beginning of period | | | | | | | 109,091,433 | | | | | | | | 92,398,200 | |
| | | | |
End of period | | | | | | $ | 107,955,717 | | | | | | | $ | 109,091,433 | |
| | | | |
Undistributed (overdistributed) net investment income | | | | | | $ | 81,014 | | | | | | | $ | (29 | ) |
| | | | |
The accompanying notes are an integral part of these financial statements.
This page is intentionally left blank.
| | | | |
| 38 | | Wells Fargo Advantage Equity Gateway Funds | | Financial highlights |
| | | | | | | | | | | | | | | | | | | | | | | | |
| C&B Large Cap Value Fund | | Beginning
net asset
value per
share | | | Net
investment
income (loss)1 | | | Net realized
and unrealized
gains (losses)
on investments | | | Distributions
from net
investment
income | | | Distributions
from net
realized gains | | | Ending
net asset
value per
share | |
Class A | | | | | | | | | | | | | | | | | | | | | | | | |
Six months ended November 30, 2014 (unaudited) | | $ | 11.99 | | | | 0.04 | 5 | | | 0.72 | | | | 0.00 | | | | 0.00 | | | $ | 12.75 | |
Year ended May 31, 2014 | | $ | 10.32 | | | | 0.09 | | | | 1.68 | | | | (0.10 | ) | | | 0.00 | | | $ | 11.99 | |
Year ended May 31, 2013 | | $ | 8.13 | | | | 0.12 | | | | 2.20 | | | | (0.13 | ) | | | 0.00 | | | $ | 10.32 | |
Year ended May 31, 2012 | | $ | 8.70 | | | | 0.12 | | | | (0.58 | ) | | | (0.11 | ) | | | 0.00 | | | $ | 8.13 | |
Year ended May 31, 20114 | | $ | 7.48 | | | | 0.06 | | | | 1.26 | | | | (0.10 | ) | | | 0.00 | | | $ | 8.70 | |
Year ended September 30, 2010 | | $ | 7.06 | | | | 0.08 | | | | 0.42 | | | | (0.08 | ) | | | 0.00 | | | $ | 7.48 | |
Year ended September 30, 2009 | | $ | 7.69 | | | | 0.10 | 5 | | | (0.60 | ) | | | (0.13 | ) | | | (0.00 | )6 | | $ | 7.06 | |
Class B | | | | | | | | | | | | | | | | | | | | | | | | |
Six months ended November 30, 2014 (unaudited) | | $ | 12.14 | | | | (0.00 | )5,6 | | | 0.72 | | | | 0.00 | | | | 0.00 | | | $ | 12.86 | |
Year ended May 31, 2014 | | $ | 10.43 | | | | 0.02 | 5 | | | 1.69 | | | | 0.00 | | | | 0.00 | | | $ | 12.14 | |
Year ended May 31, 2013 | | $ | 8.16 | | | | 0.05 | 5 | | | 2.22 | | | | 0.00 | | | | 0.00 | | | $ | 10.43 | |
Year ended May 31, 2012 | | $ | 8.68 | | | | 0.05 | 5 | | | (0.56 | ) | | | (0.01 | ) | | | 0.00 | | | $ | 8.16 | |
Year ended May 31, 20114 | | $ | 7.44 | | | | 0.01 | | | | 1.26 | | | | (0.03 | ) | | | 0.00 | | | $ | 8.68 | |
Year ended September 30, 2010 | | $ | 7.02 | | | | 0.03 | | | | 0.42 | | | | (0.03 | ) | | | 0.00 | | | $ | 7.44 | |
Year ended September 30, 2009 | | $ | 7.61 | | | | 0.05 | 5 | | | (0.58 | ) | | | (0.06 | ) | | | (0.00 | )6 | | $ | 7.02 | |
Class C | | | | | | | | | | | | | | | | | | | | | | | | |
Six months ended November 30, 2014 (unaudited) | | $ | 11.95 | | | | (0.00 | )6 | | | 0.71 | | | | 0.00 | | | | 0.00 | | | $ | 12.66 | |
Year ended May 31, 2014 | | $ | 10.29 | | | | 0.01 | | | | 1.67 | | | | (0.02 | ) | | | 0.00 | | | $ | 11.95 | |
Year ended May 31, 2013 | | $ | 8.11 | | | | 0.04 | | | | 2.20 | | | | (0.06 | ) | | | 0.00 | | | $ | 10.29 | |
Year ended May 31, 2012 | | $ | 8.66 | | | | 0.05 | | | | (0.56 | ) | | | (0.04 | ) | | | 0.00 | | | $ | 8.11 | |
Year ended May 31, 20114 | | $ | 7.43 | | | | 0.00 | 6 | | | 1.27 | | | | (0.04 | ) | | | 0.00 | | | $ | 8.66 | |
Year ended September 30, 2010 | | $ | 7.02 | | | | 0.02 | | | | 0.42 | | | | (0.03 | ) | | | 0.00 | | | $ | 7.43 | |
Year ended September 30, 2009 | | $ | 7.60 | | | | 0.05 | 5 | | | (0.57 | ) | | | (0.06 | ) | | | (0.00 | )6 | | $ | 7.02 | |
Administrator Class | | | | | | | | | | | | | | | | | | | | | | | | |
Six months ended November 30, 2014 (unaudited) | | $ | 12.00 | | | | 0.05 | | | | 0.72 | | | | 0.00 | | | | 0.00 | | | $ | 12.77 | |
Year ended May 31, 2014 | | $ | 10.32 | | | | 0.12 | 5 | | | 1.68 | | | | (0.12 | ) | | | 0.00 | | | $ | 12.00 | |
Year ended May 31, 2013 | | $ | 8.13 | | | | 0.13 | 5 | | | 2.21 | | | | (0.15 | ) | | | 0.00 | | | $ | 10.32 | |
Year ended May 31, 2012 | | $ | 8.69 | | | | 0.13 | 5 | | | (0.56 | ) | | | (0.13 | ) | | | 0.00 | | | $ | 8.13 | |
Year ended May 31, 20114 | | $ | 7.47 | | | | 0.05 | 5 | | | 1.28 | | | | (0.11 | ) | | | 0.00 | | | $ | 8.69 | |
Year ended September 30, 2010 | | $ | 7.06 | | | | 0.08 | 5 | | | 0.42 | | | | (0.09 | ) | | | 0.00 | | | $ | 7.47 | |
Year ended September 30, 2009 | | $ | 7.70 | | | | 0.11 | 5 | | | (0.60 | ) | | | (0.15 | ) | | | (0.00 | )6 | | $ | 7.06 | |
Institutional Class | | | | | | | | | | | | | | | | | | | | | | | | |
Six months ended November 30, 2014 (unaudited) | | $ | 12.03 | | | | 0.07 | | | | 0.72 | | | | 0.00 | | | | 0.00 | | | $ | 12.82 | |
Year ended May 31, 2014 | | $ | 10.35 | | | | 0.14 | | | | 1.69 | | | | (0.15 | ) | | | 0.00 | | | $ | 12.03 | |
Year ended May 31, 2013 | | $ | 8.16 | | | | 0.17 | | | | 2.19 | | | | (0.17 | ) | | | 0.00 | | | $ | 10.35 | |
Year ended May 31, 2012 | | $ | 8.73 | | | | 0.14 | | | | (0.56 | ) | | | (0.15 | ) | | | 0.00 | | | $ | 8.16 | |
Year ended May 31, 20114 | | $ | 7.51 | | | | 0.07 | | | | 1.28 | | | | (0.13 | ) | | | 0.00 | | | $ | 8.73 | |
Year ended September 30, 2010 | | $ | 7.09 | | | | 0.11 | 5 | | | 0.42 | | | | (0.11 | ) | | | 0.00 | | | $ | 7.51 | |
Year ended September 30, 2009 | | $ | 7.75 | | | | 0.12 | 5 | | | (0.61 | ) | | | (0.17 | ) | | | (0.00 | )6 | | $ | 7.09 | |
Investor Class | | | | | | | | | | | | | | | | | | | | | | | | |
Six months ended November 30, 2014 (unaudited) | | $ | 12.00 | | | | 0.03 | | | | 0.73 | | | | 0.00 | | | | 0.00 | | | $ | 12.76 | |
Year ended May 31, 2014 | | $ | 10.33 | | | | 0.08 | | | | 1.69 | | | | (0.10 | ) | | | 0.00 | | | $ | 12.00 | |
Year ended May 31, 2013 | | $ | 8.14 | | | | 0.10 | | | | 2.21 | | | | (0.12 | ) | | | 0.00 | | | $ | 10.33 | |
Year ended May 31, 2012 | | $ | 8.70 | | | | 0.10 | | | | (0.56 | ) | | | (0.10 | ) | | | 0.00 | | | $ | 8.14 | |
Year ended May 31, 20114 | | $ | 7.46 | | | | 0.04 | | | | 1.28 | | | | (0.08 | ) | | | 0.00 | | | $ | 8.70 | |
Year ended September 30, 2010 | | $ | 7.04 | | | | 0.06 | | | | 0.44 | | | | (0.08 | ) | | | 0.00 | | | $ | 7.46 | |
Year ended September 30, 2009 | | $ | 7.68 | | | | 0.09 | 5 | | | (0.59 | ) | | | (0.14 | ) | | | (0.00 | )6 | | $ | 7.04 | |
| 1. | Includes net expenses allocated from the affiliated Master Portfolio in which the Fund invests. |
| 2. | Total return calculations do not include any sales charges. Returns for periods of less than one year are not annualized. |
| 3. | Portfolio turnover rate is calculated by multiplying the Fund’s investment percentage in the affiliated Master Portfolio by the affiliated Master Portfolio’s portfolio turnover rate. |
| 4. | For the eight months ended May 31, 2011. The Fund changed its fiscal year end from September 30 to May 31, effective May 31, 2011. |
| 5. | Calculated based upon average shares outstanding |
| 6. | Amount is less than $0.005. |
The accompanying notes are an integral part of these financial statements.
| | | | | | |
| Financial highlights | | Wells Fargo Advantage Equity Gateway Funds | | | 39 | |
| | | | | | | | | | | | | | | | | | | | | | |
| Ratio to average net assets (annualized) | | | Total
return2 | | | Portfolio
turnover
rate3 | | | Net assets at
end of period
(000s omitted) | |
Net investment
income (loss)1 | | | Gross
expenses1 | | | Net
expenses1 | | | | |
| | | | | | | | | | | | | | | | | | | | | | |
| | 0.69 | % | | | 1.29 | % | | | 1.15 | % | | | 6.34 | % | | | 17 | % | | $ | 27,167 | |
| | 0.86 | % | | | 1.31 | % | | | 1.15 | % | | | 17.25 | % | | | 22 | % | | $ | 29,537 | |
| | 1.25 | % | | | 1.30 | % | | | 1.15 | % | | | 28.82 | % | | | 18 | % | | $ | 23,571 | |
| | 1.33 | % | | | 1.30 | % | | | 1.15 | % | | | (5.23 | )% | | | 21 | % | | $ | 21,380 | |
| | 0.78 | % | | | 1.31 | % | | | 1.15 | % | | | 17.73 | % | | | 17 | % | | $ | 25,912 | |
| | 0.96 | % | | | 1.32 | % | | | 1.15 | % | | | 7.14 | % | | | 13 | % | | $ | 31,038 | |
| | 1.66 | % | | | 1.30 | % | | | 1.15 | % | | | (6.05 | )% | | | 28 | % | | $ | 33,784 | |
| | | | | | | | | | | | | | | | | | | | | | |
| | (0.08 | )% | | | 2.04 | % | | | 1.90 | % | | | 5.93 | % | | | 17 | % | | $ | 394 | |
| | 0.17 | % | | | 2.06 | % | | | 1.90 | % | | | 16.40 | % | | | 22 | % | | $ | 469 | |
| | 0.57 | % | | | 2.03 | % | | | 1.89 | % | | | 27.82 | % | | | 18 | % | | $ | 1,167 | |
| | 0.61 | % | | | 2.05 | % | | | 1.90 | % | | | (5.84 | )% | | | 21 | % | | $ | 2,418 | |
| | 0.04 | % | | | 2.06 | % | | | 1.90 | % | | | 17.15 | % | | | 17 | % | | $ | 6,607 | |
| | 0.20 | % | | | 2.07 | % | | | 1.90 | % | | | 6.36 | % | | | 13 | % | | $ | 6,951 | |
| | 0.91 | % | | | 2.04 | % | | | 1.90 | % | | | (6.73 | )% | | | 28 | % | | $ | 8,773 | |
| | | | | | | | | | | | | | | | | | | | | | |
| | (0.06 | )% | | | 2.04 | % | | | 1.90 | % | | | 5.94 | % | | | 17 | % | | $ | 7,691 | |
| | 0.11 | % | | | 2.06 | % | | | 1.90 | % | | | 16.39 | % | | | 22 | % | | $ | 7,262 | |
| | 0.51 | % | | | 2.05 | % | | | 1.90 | % | | | 27.76 | % | | | 18 | % | | $ | 5,818 | |
| | 0.58 | % | | | 2.05 | % | | | 1.90 | % | | | (5.81 | )% | | | 21 | % | | $ | 5,524 | |
| | 0.05 | % | | | 2.07 | % | | | 1.90 | % | | | 17.15 | % | | | 17 | % | | $ | 7,046 | |
| | 0.21 | % | | | 2.07 | % | | | 1.90 | % | | | 6.29 | % | | | 13 | % | | $ | 6,607 | |
| | 0.90 | % | | | 2.04 | % | | | 1.90 | % | | | (6.62 | )% | | | 28 | % | | $ | 6,852 | |
| | | | | | | | | | | | | | | | | | | | | | |
| | 0.89 | % | | | 1.13 | % | | | 0.95 | % | | | 6.42 | % | | | 17 | % | | $ | 58,147 | |
| | 1.08 | % | | | 1.14 | % | | | 0.95 | % | | | 17.49 | % | | | 22 | % | | $ | 53,884 | |
| | 1.48 | % | | | 1.13 | % | | | 0.95 | % | | | 29.09 | % | | | 18 | % | | $ | 70,727 | |
| | 1.54 | % | | | 1.13 | % | | | 0.95 | % | | | (4.90 | )% | | | 21 | % | | $ | 81,999 | |
| | 1.00 | % | | | 1.15 | % | | | 0.95 | % | | | 17.74 | % | | | 17 | % | | $ | 120,613 | |
| | 1.13 | % | | | 1.13 | % | | | 0.95 | % | | | 7.33 | % | | | 13 | % | | $ | 114,664 | |
| | 1.89 | % | | | 1.11 | % | | | 0.95 | % | | | (5.83 | )% | | | 28 | % | | $ | 222,489 | |
| | | | | | | | | | | | | | | | | | | | | | |
| | 1.14 | % | | | 0.86 | % | | | 0.70 | % | | | 6.48 | % | | | 17 | % | | $ | 129,336 | |
| | 1.34 | % | | | 0.88 | % | | | 0.70 | % | | | 17.86 | % | | | 22 | % | | $ | 104,758 | |
| | 1.68 | % | | | 0.87 | % | | | 0.70 | % | | | 29.32 | % | | | 18 | % | | $ | 130,015 | |
| | 1.78 | % | | | 0.87 | % | | | 0.70 | % | | | (4.72 | )% | | | 21 | % | | $ | 96,653 | |
| | 1.25 | % | | | 0.88 | % | | | 0.70 | % | | | 18.16 | % | | | 17 | % | | $ | 110,061 | |
| | 1.48 | % | | | 0.88 | % | | | 0.70 | % | | | 7.51 | % | | | 13 | % | | $ | 95,466 | |
| | 2.11 | % | | | 0.85 | % | | | 0.70 | % | | | (5.62 | )% | | | 28 | % | | $ | 26,582 | |
| | | | | | | | | | | | | | | | | | | | | | |
| | 0.64 | % | | | 1.35 | % | | | 1.20 | % | | | 6.33 | % | | | 17 | % | | $ | 70,362 | |
| | 0.81 | % | | | 1.37 | % | | | 1.20 | % | | | 17.17 | % | | | 22 | % | | $ | 72,882 | |
| | 1.21 | % | | | 1.36 | % | | | 1.20 | % | | | 28.68 | % | | | 18 | % | | $ | 66,315 | |
| | 1.29 | % | | | 1.37 | % | | | 1.20 | % | | | (5.17 | )% | | | 21 | % | | $ | 64,007 | |
| | 0.75 | % | | | 1.39 | % | | | 1.20 | % | | | 17.77 | % | | | 17 | % | | $ | 86,624 | |
| | 0.87 | % | | | 1.41 | % | | | 1.20 | % | | | 7.15 | % | | | 13 | % | | $ | 85,256 | |
| | 1.62 | % | | | 1.40 | % | | | 1.20 | % | | | (6.06 | )% | | | 28 | % | | $ | 199,654 | |
The accompanying notes are an integral part of these financial statements.
| | | | |
| 40 | | Wells Fargo Advantage Equity Gateway Funds | | Financial highlights |
| | | | | | | | | | | | | | | | | | | | | | | | |
| Diversified Equity Fund | | Beginning
net asset
value per
share | | | Net
investment
income
(loss)1 | | | Net realized
and unrealized
gains (losses)
on investments | | | Distributions
from net
investment
income | | | Distributions
from net
realized gains | | | Ending
net asset
value per
share | |
Class A | | | | | | | | | | | | | | | | | | | | | | | | |
Six months ended November 30, 2014 (unaudited) | | $ | 32.78 | | | | 0.02 | | | | 1.71 | | | | 0.00 | | | | 0.00 | | | $ | 34.51 | |
Year ended May 31, 2014 | | $ | 30.65 | | | | 0.16 | | | | 5.48 | | | | (0.17 | ) | | | (3.34 | ) | | $ | 32.78 | |
Year ended May 31, 2013 | | $ | 26.08 | | | | 0.23 | 4 | | | 6.14 | | | | (0.24 | ) | | | (1.56 | ) | | $ | 30.65 | |
Year ended May 31, 2012 | | $ | 29.71 | | | | 0.15 | | | | (2.01 | ) | | | (0.18 | ) | | | (1.59 | ) | | $ | 26.08 | |
Year ended May 31, 20115 | | $ | 24.89 | | | | 0.12 | | | | 4.85 | | | | (0.15 | ) | | | 0.00 | | | $ | 29.71 | |
Year ended September 30, 2010 | | $ | 23.41 | | | | 0.18 | | | | 1.66 | | | | (0.36 | ) | | | 0.00 | | | $ | 24.89 | |
Year ended September 30, 2009 | | $ | 27.70 | | | | 0.23 | 4 | | | (2.30 | ) | | | (0.26 | ) | | | (1.96 | ) | | $ | 23.41 | |
Class B | | | | | | | | | | | | | | | | | | | | | | | | |
Six months ended November 30, 2014 (unaudited) | | $ | 30.20 | | | | (0.08 | )4 | | | 1.56 | | | | 0.00 | | | | 0.00 | | | $ | 31.68 | |
Year ended May 31, 2014 | | $ | 28.54 | | | | (0.10 | )4 | | | 5.10 | | | | 0.00 | | | | (3.34 | ) | | $ | 30.20 | |
Year ended May 31, 2013 | | $ | 24.36 | | | | 0.01 | 4 | | | 5.73 | | | | 0.00 | | | | (1.56 | ) | | $ | 28.54 | |
Year ended May 31, 2012 | | $ | 27.87 | | | | (0.01 | )4 | | | (1.91 | ) | | | 0.00 | | | | (1.59 | ) | | $ | 24.36 | |
Year ended May 31, 20115 | | $ | 23.35 | | | | (0.05 | )4 | | | 4.57 | | | | 0.00 | | | | 0.00 | | | $ | 27.87 | |
Year ended September 30, 2010 | | $ | 21.96 | | | | (0.01 | )4 | | | 1.57 | | | | (0.17 | ) | | | 0.00 | | | $ | 23.35 | |
Year ended September 30, 2009 | | $ | 26.00 | | | | 0.08 | 4 | | | (2.16 | ) | | | 0.00 | | | | (1.96 | ) | | $ | 21.96 | |
Class C | | | | | | | | | | | | | | | | | | | | | | | | |
Six months ended November 30, 2014 (unaudited) | | $ | 30.88 | | | | (0.07 | )4 | | | 1.59 | | | | 0.00 | | | | 0.00 | | | $ | 32.40 | |
Year ended May 31, 2014 | | $ | 29.13 | | | | (0.08 | )4 | | | 5.18 | | | | (0.01 | ) | | | (3.34 | ) | | $ | 30.88 | |
Year ended May 31, 2013 | | $ | 24.88 | | | | 0.02 | 4 | | | 5.84 | | | | (0.05 | ) | | | (1.56 | ) | | $ | 29.13 | |
Year ended May 31, 2012 | | $ | 28.43 | | | | (0.59 | ) | | | (1.37 | ) | | | 0.00 | | | | (1.59 | ) | | $ | 24.88 | |
Year ended May 31, 20115 | | $ | 23.81 | | | | (0.04 | )4 | | | 4.66 | | | | 0.00 | | | | 0.00 | | | $ | 28.43 | |
Year ended September 30, 2010 | | $ | 22.43 | | | | (0.01 | )4 | | | 1.60 | | | | (0.21 | ) | | | 0.00 | | | $ | 23.81 | |
Year ended September 30, 2009 | | $ | 26.53 | | | | 0.08 | 4 | | | (2.20 | ) | | | (0.02 | ) | | | (1.96 | ) | | $ | 22.43 | |
Administrator Class | | | | | | | | | | | | | | | | | | | | | | | | |
Six months ended November 30, 2014 (unaudited) | | $ | 32.84 | | | | 0.09 | 4 | | | 1.70 | | | | 0.00 | | | | 0.00 | | | $ | 34.63 | |
Year ended May 31, 2014 | | $ | 30.70 | | | | 0.23 | 4 | | | 5.49 | | | | (0.24 | ) | | | (3.34 | ) | | $ | 32.84 | |
Year ended May 31, 2013 | | $ | 26.12 | | | | 0.30 | 4 | | | 6.15 | | | | (0.31 | ) | | | (1.56 | ) | | $ | 30.70 | |
Year ended May 31, 2012 | | $ | 29.78 | | | | 0.33 | | | | (2.13 | ) | | | (0.27 | ) | | | (1.59 | ) | | $ | 26.12 | |
Year ended May 31, 20115 | | $ | 24.98 | | | | 0.14 | 4 | | | 4.89 | | | | (0.23 | ) | | | 0.00 | | | $ | 29.78 | |
Year ended September 30, 2010 | | $ | 23.47 | | | | 0.20 | 4 | | | 1.70 | | | | (0.39 | ) | | | 0.00 | | | $ | 24.98 | |
Year ended September 30, 2009 | | $ | 27.79 | | | | 0.28 | 4 | | | (2.32 | ) | | | (0.32 | ) | | | (1.96 | ) | | $ | 23.47 | |
| 1. | Includes net expenses allocated from the affiliated Master Portfolios in which the Fund invests. |
| 2. | Total return calculations do not include any sales charges. Returns for periods of less than one year are not annualized. |
| 3. | Portfolio turnover rate is calculated by aggregating the results of multiplying the Fund’s investment percentage in the respective affiliated Master Portfolio by the corresponding affiliated Master Portfolio’s portfolio turnover rate. |
| 4. | Calculated based upon average shares outstanding |
| 5. | For the eight months ended May 31, 2011. The Fund changed its fiscal year end from September 30 to May 31, effective May 31, 2011. |
The accompanying notes are an integral part of these financial statements.
| | | | | | |
| Financial highlights | | Wells Fargo Advantage Equity Gateway Funds | | | 41 | |
| | | | | | | | | | | | | | | | | | | | | | |
| Ratio to average net assets (annualized) | | | Total
return2 | | | Portfolio
turnover
rate3 | | | Net assets at
end of period
(000s omitted) | |
Net investment
income (loss)1 | | | Gross
expenses1 | | | Net
expenses1 | | | | |
| | | | | | | | | | | | | | | | | | | | | | |
| | 0.29 | % | | | 1.43 | % | | | 1.25 | % | | | 5.28 | % | | | 19 | % | | $ | 82,233 | |
| | 0.48 | % | | | 1.43 | % | | | 1.25 | % | | | 19.10 | % | | | 37 | % | | $ | 82,186 | |
| | 0.81 | % | | | 1.43 | % | | | 1.25 | % | | | 25.42 | % | | | 44 | % | | $ | 75,640 | |
| | 0.74 | % | | | 1.41 | % | | | 1.25 | % | | | (5.91 | )% | | | 57 | % | | $ | 75,751 | |
| | 0.59 | % | | | 1.40 | % | | | 1.25 | % | | | 20.04 | % | | | 48 | % | | $ | 95,532 | |
| | 0.71 | % | | | 1.48 | % | | | 1.25 | % | | | 7.90 | % | | | 44 | % | | $ | 85,735 | |
| | 1.16 | % | | | 1.43 | % | | | 1.25 | % | | | (5.33 | )% | | | 48 | % | | $ | 85,504 | |
| | | | | | | | | | | | | | | | | | | | | | |
| | (0.50 | )% | | | 2.18 | % | | | 2.00 | % | | | 4.90 | % | | | 19 | % | | $ | 334 | |
| | (0.34 | )% | | | 2.18 | % | | | 2.00 | % | | | 18.20 | % | | | 37 | % | | $ | 806 | |
| | 0.04 | % | | | 2.18 | % | | | 2.00 | % | | | 24.48 | % | | | 44 | % | | $ | 2,029 | |
| | (0.05 | )% | | | 2.16 | % | | | 2.00 | % | | | (6.61 | )% | | | 57 | % | | $ | 2,922 | |
| | (0.20 | )% | | | 2.15 | % | | | 2.00 | % | | | 19.36 | % | | | 48 | % | | $ | 5,754 | |
| | (0.04 | )% | | | 2.23 | % | | | 2.00 | % | | | 7.15 | % | | | 44 | % | | $ | 7,825 | |
| | 0.43 | % | | | 2.18 | % | | | 1.99 | % | | | (6.03 | )% | | | 48 | % | | $ | 10,839 | |
| | | | | | | | | | | | | | | | | | | | | | |
| | (0.46 | )% | | | 2.18 | % | | | 2.00 | % | | | 4.89 | % | | | 19 | % | | $ | 4,127 | |
| | (0.25 | )% | | | 2.19 | % | | | 2.00 | % | | | 18.23 | % | | | 37 | % | | $ | 4,292 | |
| | 0.07 | % | | | 2.18 | % | | | 2.00 | % | | | 24.50 | % | | | 44 | % | | $ | 2,667 | |
| | (0.02 | )% | | | 2.16 | % | | | 2.00 | % | | | (6.62 | )% | | | 57 | % | | $ | 2,499 | |
| | (0.17 | )% | | | 2.15 | % | | | 2.00 | % | | | 19.40 | % | | | 48 | % | | $ | 3,383 | |
| | (0.05 | )% | | | 2.23 | % | | | 2.00 | % | | | 7.10 | % | | | 44 | % | | $ | 3,280 | |
| | 0.41 | % | | | 2.17 | % | | | 2.00 | % | | | (6.02 | )% | | | 48 | % | | $ | 2,958 | |
| | | | | | | | | | | | | | | | | | | | | | |
| | 0.53 | % | | | 1.27 | % | | | 1.00 | % | | | 5.42 | % | | | 19 | % | | $ | 210,993 | |
| | 0.71 | % | | | 1.27 | % | | | 1.00 | % | | | 19.40 | % | | | 37 | % | | $ | 225,584 | |
| | 1.06 | % | | | 1.27 | % | | | 1.00 | % | | | 25.75 | % | | | 44 | % | | $ | 290,011 | |
| | 0.99 | % | | | 1.25 | % | | | 1.00 | % | | | (5.67 | )% | | | 57 | % | | $ | 293,895 | |
| | 0.84 | % | | | 1.24 | % | | | 1.00 | % | | | 20.22 | % | | | 48 | % | | $ | 386,429 | |
| | 0.83 | % | | | 1.29 | % | | | 1.00 | % | | | 8.18 | % | | | 44 | % | | $ | 359,109 | |
| | 1.41 | % | | | 1.25 | % | | | 1.00 | % | | | (5.09 | )% | | | 48 | % | | $ | 596,298 | |
The accompanying notes are an integral part of these financial statements.
| | | | |
| 42 | | Wells Fargo Advantage Equity Gateway Funds | | Financial highlights |
| | | | | | | | | | | | | | | | | | | | |
| Emerging Growth Fund | | Beginning
net asset
value per
share | | | Net
investment
loss1 | | | Net realized
and unrealized
gains (losses)
on investments | | | Distributions
from net
realized
gains | | | Ending
net asset
value per
share | |
Class A | | | | | | | | | | | | | | | | | | | | |
Six months ended November 30, 2014 (unaudited) | | $ | 14.61 | | | | (0.09 | )4 | | | 1.79 | | | | 0.00 | | | $ | 16.31 | |
Year ended May 31, 2014 | | $ | 14.10 | | | | (0.19 | ) | | | 1.88 | | | | (1.18 | ) | | $ | 14.61 | |
Year ended May 31, 2013 | | $ | 12.44 | | | | (0.15 | ) | | | 2.49 | | | | (0.68 | ) | | $ | 14.10 | |
Year ended May 31, 2012 | | $ | 13.12 | | | | (0.14 | )4 | | | (0.54 | ) | | | 0.00 | | | $ | 12.44 | |
Year ended May 31, 20115 | | $ | 9.50 | | | | (0.11 | )4 | | | 3.73 | | | | 0.00 | | | $ | 13.12 | |
Year ended September 30, 2010 | | $ | 7.93 | | | | (0.12 | ) | | | 1.69 | | | | 0.00 | | | $ | 9.50 | |
Year ended September 30, 2009 | | $ | 8.51 | | | | (0.07 | )4 | | | (0.51 | ) | | | 0.00 | | | $ | 7.93 | |
Class C | | | | | | | | | | | | | | | | | | | | |
Six months ended November 30, 2014 (unaudited) | | $ | 13.88 | | | | (0.14 | )4 | | | 1.70 | | | | 0.00 | | | $ | 15.44 | |
Year ended May 31, 2014 | | $ | 13.55 | | | | (0.33 | ) | | | 1.83 | | | | (1.18 | ) | | $ | 13.88 | |
Year ended May 31, 2013 | | $ | 12.06 | | | | (0.22 | ) | | | 2.44 | | | | (0.68 | ) | | $ | 13.55 | |
Year ended May 31, 2012 | | $ | 12.81 | | | | (0.23 | )4 | | | (0.52 | ) | | | 0.00 | | | $ | 12.06 | |
Year ended May 31, 20115 | | $ | 9.32 | | | | (0.16 | )4 | | | 3.65 | | | | 0.00 | | | $ | 12.81 | |
Year ended September 30, 2010 | | $ | 7.85 | | | | (0.16 | )4 | | | 1.63 | | | | 0.00 | | | $ | 9.32 | |
Year ended September 30, 2009 | | $ | 8.48 | | | | (0.12 | )4 | | | (0.51 | ) | | | 0.00 | | | $ | 7.85 | |
Administrator Class | | | | | | | | | | | | | | | | | | | | |
Six months ended November 30, 2014 (unaudited) | | $ | 14.83 | | | | (0.08 | )4 | | | 1.82 | | | | 0.00 | | | $ | 16.57 | |
Year ended May 31, 2014 | | $ | 14.28 | | | | (0.17 | )4 | | | 1.90 | | | | (1.18 | ) | | $ | 14.83 | |
Year ended May 31, 2013 | | $ | 12.56 | | | | (0.12 | ) | | | 2.52 | | | | (0.68 | ) | | $ | 14.28 | |
Year ended May 31, 2012 | | $ | 13.22 | | | | (0.12 | )4 | | | (0.54 | ) | | | 0.00 | | | $ | 12.56 | |
Year ended May 31, 20115 | | $ | 9.56 | | | | (0.09 | )4 | | | 3.75 | | | | 0.00 | | | $ | 13.22 | |
Year ended September 30, 2010 | | $ | 8.08 | | | | (0.01 | ) | | | 1.49 | | | | 0.00 | | | $ | 9.56 | |
Year ended September 30, 2009 | | $ | 8.53 | | | | (0.05 | )4 | | | (0.40 | ) | | | 0.00 | | | $ | 8.08 | |
Institutional Class | | | | | | | | | | | | | | | | | | | | |
Six months ended November 30, 2014 (unaudited) | | $ | 15.11 | | | | (0.05 | ) | | | 1.85 | | | | 0.00 | | | $ | 16.91 | |
Year ended May 31, 2014 | | $ | 14.49 | | | | (0.11 | ) | | | 1.91 | | | | (1.18 | ) | | $ | 15.11 | |
Year ended May 31, 2013 | | $ | 12.70 | | | | (0.08 | ) | | | 2.55 | | | | (0.68 | ) | | $ | 14.49 | |
Year ended May 31, 2012 | | $ | 13.33 | | | | (0.08 | )4 | | | (0.55 | ) | | | 0.00 | | | $ | 12.70 | |
Year ended May 31, 20115 | | $ | 9.62 | | | | (0.07 | )4 | | | 3.78 | | | | 0.00 | | | $ | 13.33 | |
Year ended September 30, 2010 | | $ | 8.00 | | | | (0.07 | ) | | | 1.69 | | | | 0.00 | | | $ | 9.62 | |
Year ended September 30, 2009 | | $ | 8.53 | | | | (0.04 | )4 | | | (0.49 | ) | | | 0.00 | | | $ | 8.00 | |
Investor Class | | | | | | | | | | | | | | | | | | | | |
Six months ended November 30, 2014 (unaudited) | | $ | 14.53 | | | | (0.11 | ) | | | 1.79 | | | | 0.00 | | | $ | 16.21 | |
Year ended May 31, 2014 | | $ | 14.04 | | | | (0.20 | ) | | | 1.87 | | | | (1.18 | ) | | $ | 14.53 | |
Year ended May 31, 2013 | | $ | 12.39 | | | | (0.16 | ) | | | 2.49 | | | | (0.68 | ) | | $ | 14.04 | |
Year ended May 31, 2012 | | $ | 13.07 | | | | (0.15 | )4 | | | (0.53 | ) | | | 0.00 | | | $ | 12.39 | |
Year ended May 31, 20115 | | $ | 9.47 | | | | (0.11 | )4 | | | 3.71 | | | | 0.00 | | | $ | 13.07 | |
Year ended September 30, 2010 | | $ | 7.91 | | | | (0.09 | ) | | | 1.65 | | | | 0.00 | | | $ | 9.47 | |
Year ended September 30, 2009 | | $ | 8.49 | | | | (0.07 | )4 | | | (0.51 | ) | | | 0.00 | | | $ | 7.91 | |
| 1. | Includes net expenses allocated from the affiliated Master Portfolio in which the Fund invests. |
| 2. | Total return calculations do not include any sales charges. Returns for periods of less than one year are not annualized. |
| 3. | Portfolio turnover rate is calculated by multiplying the Fund’s investment percentage in the affiliated Master Portfolio by the affiliated Master Portfolio’s portfolio turnover rate. |
| 4. | Calculated based upon average shares outstanding |
| 5. | For the eight months ended May 31, 2011. The Fund changed its fiscal year end from September 30 to May 31, effective May 31, 2011. |
The accompanying notes are an integral part of these financial statements.
| | | | | | |
| Financial highlights | | Wells Fargo Advantage Equity Gateway Funds | | | 43 | |
| | | | | | | | | | | | | | | | | | | | | | |
| Ratio to average net assets (annualized) | | | Total
return2 | | | Portfolio
turnover
rate3 | | | Net assets at
end of period
(000s omitted) | |
Net investment
loss1 | | | Gross
expenses1 | | | Net
expenses1 | | | | |
| | | | | | | | | | | | | | | | | | | | | | |
| | (1.20 | )% | | | 1.39 | % | | | 1.37 | % | | | 11.64 | % | | | 26 | % | | $ | 128,428 | |
| | (1.20 | )% | | | 1.39 | % | | | 1.37 | % | | | 11.30 | % | | | 63 | % | | $ | 130,403 | |
| | (1.04 | )% | | | 1.40 | % | | | 1.37 | % | | | 19.89 | % | | | 65 | % | | $ | 125,070 | |
| | (1.13 | )% | | | 1.41 | % | | | 1.37 | % | | | (5.18 | )% | | | 75 | % | | $ | 125,113 | |
| | (1.32 | )% | | | 3.03 | % | | | 1.45 | % | | | 38.11 | % | | | 59 | % | | $ | 3,425 | |
| | (1.17 | )% | | | 4.65 | % | | | 1.46 | % | | | 19.80 | % | | | 97 | % | | $ | 142 | |
| | (1.09 | )% | | | 8.23 | % | | | 1.45 | % | | | (6.82 | )% | | | 147 | % | | $ | 44 | |
| | | | | | | | | | | | | | | | | | | | | | |
| | (1.95 | )% | | | 2.14 | % | | | 2.12 | % | | | 11.24 | % | | | 26 | % | | $ | 4,928 | |
| | (1.95 | )% | | | 2.14 | % | | | 2.12 | % | | | 10.40 | % | | | 63 | % | | $ | 4,816 | |
| | (1.79 | )% | | | 2.15 | % | | | 2.12 | % | | | 19.09 | % | | | 65 | % | | $ | 4,878 | |
| | (1.89 | )% | | | 2.17 | % | | | 2.12 | % | | | (5.85 | )% | | | 75 | % | | $ | 5,114 | |
| | (2.05 | )% | | | 3.83 | % | | | 2.20 | % | | | 37.30 | % | | | 59 | % | | $ | 516 | |
| | (1.93 | )% | | | 5.40 | % | | | 2.22 | % | | | 18.85 | % | | | 97 | % | | $ | 58 | |
| | (1.84 | )% | | | 7.93 | % | | | 2.20 | % | | | (7.43 | )% | | | 147 | % | | $ | 8 | |
| | | | | | | | | | | | | | | | | | | | | | |
| | (1.03 | )% | | | 1.21 | % | | | 1.20 | % | | | 11.73 | % | | | 26 | % | | $ | 164,462 | |
| | (1.03 | )% | | | 1.22 | % | | | 1.20 | % | | | 11.45 | % | | | 63 | % | | $ | 190,126 | |
| | (0.87 | )% | | | 1.23 | % | | | 1.20 | % | | | 20.19 | % | | | 65 | % | | $ | 200,140 | |
| | (0.95 | )% | | | 1.22 | % | | | 1.19 | % | | | (4.99 | )% | | | 75 | % | | $ | 185,744 | |
| | (1.08 | )% | | | 2.41 | % | | | 1.20 | % | | | 38.28 | % | | | 59 | % | | $ | 1,915 | |
| | (0.78 | )% | | | 4.54 | % | | | 1.20 | % | | | 19.95 | % | | | 97 | % | | $ | 51 | |
| | (0.79 | )% | | | 6.89 | % | | | 1.20 | % | | | (5.28 | )% | | | 147 | % | | $ | 17 | |
| | | | | | | | | | | | | | | | | | | | | | |
| | (0.72 | )% | | | 0.96 | % | | | 0.90 | % | | | 11.91 | % | | | 26 | % | | $ | 695,806 | |
| | (0.73 | )% | | | 0.96 | % | | | 0.90 | % | | | 11.77 | % | | | 63 | % | | $ | 650,650 | |
| | (0.57 | )% | | | 0.97 | % | | | 0.90 | % | | | 20.52 | % | | | 65 | % | | $ | 578,841 | |
| | (0.67 | )% | | | 0.98 | % | | | 0.90 | % | | | (4.73 | )% | | | 75 | % | | $ | 526,865 | |
| | (0.82 | )% | | | 1.98 | % | | | 0.95 | % | | | 38.57 | % | | | 59 | % | | $ | 8,170 | |
| | (0.67 | )% | | | 4.32 | % | | | 0.95 | % | | | 20.40 | % | | | 97 | % | | $ | 10 | |
| | (0.58 | )% | | | 6.74 | % | | | 0.95 | % | | | (6.33 | )% | | | 147 | % | | $ | 8 | |
| | | | | | | | | | | | | | | | | | | | | | |
| | (1.25 | )% | | | 1.45 | % | | | 1.42 | % | | | 11.56 | % | | | 26 | % | | $ | 41,621 | |
| | (1.26 | )% | | | 1.45 | % | | | 1.43 | % | | | 11.21 | % | | | 63 | % | | $ | 39,681 | |
| | (1.10 | )% | | | 1.46 | % | | | 1.43 | % | | | 19.89 | % | | | 65 | % | | $ | 37,812 | |
| | (1.21 | )% | | | 1.52 | % | | | 1.45 | % | | | (5.20 | )% | | | 75 | % | | $ | 36,715 | |
| | (1.35 | )% | | | 3.20 | % | | | 1.49 | % | | | 38.01 | % | | | 59 | % | | $ | 15,626 | |
| | (1.22 | )% | | | 4.85 | % | | | 1.50 | % | | | 19.72 | % | | | 97 | % | | $ | 3,705 | |
| | (1.11 | )% | | | 7.23 | % | | | 1.49 | % | | | (6.83 | )% | | | 147 | % | | $ | 2,862 | |
The accompanying notes are an integral part of these financial statements.
| | | | |
| 44 | | Wells Fargo Advantage Equity Gateway Funds | | Financial highlights |
| | | | | | | | | | | | | | | | | | | | | | | | |
| Index Fund | | Beginning
net asset
value per
share | | | Net
investment
income1 | | | Net realized
and unrealized
gains (losses)
on investments | | | Distributions
from net
investment
income | | | Distributions
from net
realized gains | | | Ending
net asset
value per
share | |
Class A | | | | | | | | | | | | | | | | | | | | | | | | |
Six months ended November 30, 2014 (unaudited) | | $ | 62.14 | | | | 0.50 | | | | 4.64 | | | | 0.00 | | | | 0.00 | | | $ | 67.28 | |
Year ended May 31, 2014 | | $ | 54.00 | | | | 0.90 | | | | 9.59 | | | | (0.85 | ) | | | (1.50 | ) | | $ | 62.14 | |
Year ended May 31, 2013 | | $ | 44.25 | | | | 0.86 | | | | 10.66 | | | | (0.83 | ) | | | (0.94 | ) | | $ | 54.00 | |
Year ended May 31, 2012 | | $ | 47.17 | | | | 0.73 | | | | (1.35 | ) | | | (0.65 | ) | | | (1.65 | ) | | $ | 44.25 | |
Year ended May 31, 20114 | | $ | 40.42 | | | | 0.56 | | | | 8.77 | | | | (0.70 | ) | | | (1.88 | ) | | $ | 47.17 | |
Year ended July 31, 20105 | | $ | 41.72 | | | | 0.64 | | | | 4.89 | | | | (0.63 | ) | | | (6.20 | ) | | $ | 40.42 | |
Year ended July 31, 20095 | | $ | 56.53 | | | | 0.91 | | | | (12.80 | ) | | | (0.91 | ) | | | (2.01 | ) | | $ | 41.72 | |
Class B | | | | | | | | | | | | | | | | | | | | | | | | |
Six months ended November 30, 2014 (unaudited) | | $ | 62.99 | | | | 0.24 | 6 | | | 4.72 | | | | 0.00 | | | | 0.00 | | | $ | 67.95 | |
Year ended May 31, 2014 | | $ | 54.57 | | | | 0.45 | 6 | | | 9.70 | | | | (0.23 | ) | | | (1.50 | ) | | $ | 62.99 | |
Year ended May 31, 2013 | | $ | 44.53 | | | | 0.47 | 6 | | | 10.78 | | | | (0.27 | ) | | | (0.94 | ) | | $ | 54.57 | |
Year ended May 31, 2012 | | $ | 47.23 | | | | 0.38 | 6 | | | (1.29 | ) | | | (0.14 | ) | | | (1.65 | ) | | $ | 44.53 | |
Year ended May 31, 20114 | | $ | 40.32 | | | | 0.29 | 6 | | | 8.76 | | | | (0.26 | ) | | | (1.88 | ) | | $ | 47.23 | |
Year ended July 31, 20105 | | $ | 41.63 | | | | 0.28 | | | | 4.88 | | | | (0.27 | ) | | | (6.20 | ) | | $ | 40.32 | |
Year ended July 31, 20095 | | $ | 56.42 | | | | 0.63 | 6 | | | (12.82 | ) | | | (0.59 | ) | | | (2.01 | ) | | $ | 41.63 | |
Class C | | | | | | | | | | | | | | | | | | | | | | | | |
Six months ended November 30, 2014 (unaudited) | | $ | 62.37 | | | | 0.26 | | | | 4.65 | | | | 0.00 | | | | 0.00 | | | $ | 67.28 | |
Year ended May 31, 2014 | | $ | 54.22 | | | | 0.47 | | | | 9.62 | | | | (0.44 | ) | | | (1.50 | ) | | $ | 62.37 | |
Year ended May 31, 2013 | | $ | 44.41 | | | | 0.48 | 6 | | | 10.71 | | | | (0.44 | ) | | | (0.94 | ) | | $ | 54.22 | |
Year ended May 31, 2012 | | $ | 47.27 | | | | 0.39 | 6 | | | (1.31 | ) | | | (0.29 | ) | | | (1.65 | ) | | $ | 44.41 | |
Year ended May 31, 20114 | | $ | 40.32 | | | | 0.27 | | | | 8.78 | | | | (0.22 | ) | | | (1.88 | ) | | $ | 47.27 | |
Year ended July 31, 20105 | | $ | 41.62 | | | | 0.30 | | | | 4.88 | | | | (0.28 | ) | | | (6.20 | ) | | $ | 40.32 | |
Year ended July 31, 20095 | | $ | 56.36 | | | | 0.59 | | | | (12.76 | ) | | | (0.56 | ) | | | (2.01 | ) | | $ | 41.62 | |
Administrator Class | | | | | | | | | | | | | | | | | | | | | | | | |
Six months ended November 30, 2014 (unaudited) | | $ | 62.56 | | | | 0.64 | | | | 4.65 | | | | 0.00 | | | | 0.00 | | | $ | 67.85 | |
Year ended May 31, 2014 | | $ | 54.34 | | | | 1.08 | | | | 9.66 | | | | (1.02 | ) | | | (1.50 | ) | | $ | 62.56 | |
Year ended May 31, 2013 | | $ | 44.52 | | | | 1.02 | | | | 10.71 | | | | (0.97 | ) | | | (0.94 | ) | | $ | 54.34 | |
Year ended May 31, 2012 | | $ | 47.45 | | | | 0.83 | | | | (1.32 | ) | | | (0.79 | ) | | | (1.65 | ) | | $ | 44.52 | |
Year ended May 31, 20114 | | $ | 40.56 | | | | 0.67 | | | | 8.82 | | | | (0.72 | ) | | | (1.88 | ) | | $ | 47.45 | |
Year ended July 31, 20105 | | $ | 41.88 | | | | 0.87 | 6 | | | 4.76 | | | | (0.75 | ) | | | (6.20 | ) | | $ | 40.56 | |
Year ended July 31, 20095 | | $ | 56.88 | | | | 1.02 | 6 | | | (12.90 | ) | | | (1.11 | ) | | | (2.01 | ) | | $ | 41.88 | |
Investor Class | | | | | | | | | | | | | | | | | | | | | | | | |
Six months ended November 30, 2014 (unaudited) | | $ | 62.32 | | | | 0.52 | 6 | | | 4.68 | | | | 0.00 | | | | 0.00 | | | $ | 67.52 | |
Year ended May 31, 2014 | | $ | 54.16 | | | | 0.91 | | | | 9.66 | | | | (0.91 | ) | | | (1.50 | ) | | $ | 62.32 | |
Year ended May 31, 2013 | | $ | 44.38 | | | | 0.90 | | | | 10.70 | | | | (0.88 | ) | | | (0.94 | ) | | $ | 54.16 | |
Year ended May 31, 2012 | | $ | 47.30 | | | | 0.77 | | | | (1.33 | ) | | | (0.71 | ) | | | (1.65 | ) | | $ | 44.38 | |
Year ended May 31, 20114 | | $ | 40.48 | | | | 0.60 | | | | 8.80 | | | | (0.70 | ) | | | (1.88 | ) | | $ | 47.30 | |
Year ended July 31, 20107,8 | | $ | 39.19 | | | | 0.03 | | | | 1.26 | | | | 0.00 | | | | 0.00 | | | $ | 40.48 | |
| 1. | Includes net expenses allocated from the affiliated Master Portfolio in which the Fund invests. |
| 2. | Total return calculations do not include any sales charges. Returns for periods of less than one year are not annualized. |
| 3. | Portfolio turnover rate is calculated by multiplying the Fund’s investment percentage in the affiliated Master Portfolio by the affiliated Master Portfolio’s portfolio turnover rate. |
| 4. | For the ten months ended May 31, 2011. The Fund changed its fiscal year end from July 31 to May 31, effective May 31, 2011. |
| 5. | At the close of business on July 16, 2010, the Fund acquired the net assets of Evergreen Equity Index Fund which became the accounting and performance survivor in the transaction. The information for the periods prior to July 19, 2010 is that of Evergreen Equity Index Fund. The per share information has been adjusted to give effect to this transaction. |
| 6. | Calculated based upon average shares outstanding |
| 7. | For the period from July 16, 2010 (commencement of class operations) to July 31, 2010 |
| 8. | Investor Class of Evergreen Equity Index Fund, the accounting and performance survivor, did not exist prior to the reorganization. As a result, accounting and performance information for Investor Class commenced operation on July 16, 2010. |
The accompanying notes are an integral part of these financial statements.
| | | | | | |
| Financial highlights | | Wells Fargo Advantage Equity Gateway Funds | | | 45 | |
| | | | | | | | | | | | | | | | | | | | | | |
| Ratio to average net assets (annualized) | | | Total
return2 | | | Portfolio
turnover
rate3 | | | Net assets at
end of period
(000s omitted) | |
Net investment
income1 | | | Gross
expenses1 | | | Net
expenses1 | | | | |
| | | | | | | | | | | | | | | | | | | | | | |
| | 1.50 | % | | | 0.68 | % | | | 0.56 | % | | | 8.27 | % | | | 2 | % | | $ | 455,412 | |
| | 1.53 | % | | | 0.67 | % | | | 0.56 | % | | | 19.77 | % | | | 5 | % | | $ | 432,448 | |
| | 1.72 | % | | | 0.67 | % | | | 0.56 | % | | | 26.63 | % | | | 4 | % | | $ | 407,533 | |
| | 1.63 | % | | | 0.68 | % | | | 0.56 | % | | | (0.95 | )% | | | 9 | % | | $ | 347,412 | |
| | 1.53 | % | | | 0.67 | % | | | 0.56 | % | | | 23.66 | % | | | 3 | % | | $ | 388,113 | |
| | 1.49 | % | | | 1.00 | % | | | 0.60 | % | | | 13.29 | % | | | 7 | % | | $ | 358,953 | |
| | 2.22 | % | | | 1.05 | % | | | 0.52 | % | | | (20.30 | )% | | | 6 | % | | $ | 172,687 | |
| | | | | | | | | | | | | | | | | | | | | | |
| | 0.74 | % | | | 1.43 | % | | | 1.31 | % | | | 7.87 | % | | | 2 | % | | $ | 2,884 | |
| | 0.77 | % | | | 1.42 | % | | | 1.31 | % | | | 18.86 | % | | | 5 | % | | $ | 3,412 | |
| | 0.95 | % | | | 1.42 | % | | | 1.31 | % | | | 25.66 | % | | | 4 | % | | $ | 5,453 | |
| | 0.85 | % | | | 1.43 | % | | | 1.31 | % | | | (1.68 | )% | | | 9 | % | | $ | 8,869 | |
| | 0.78 | % | | | 1.42 | % | | | 1.31 | % | | | 22.90 | % | | | 3 | % | | $ | 19,894 | |
| | 0.69 | % | | | 1.76 | % | | | 1.35 | % | | | 12.44 | % | | | 7 | % | | $ | 26,295 | |
| | 1.51 | % | | | 1.79 | % | | | 1.26 | % | | | (20.91 | )% | | | 6 | % | | $ | 28,008 | |
| | | | | | | | | | | | | | | | | | | | | | |
| | 0.75 | % | | | 1.43 | % | | | 1.31 | % | | | 7.87 | % | | | 2 | % | | $ | 82,230 | |
| | 0.78 | % | | | 1.42 | % | | | 1.31 | % | | | 18.89 | % | | | 5 | % | | $ | 78,118 | |
| | 0.97 | % | | | 1.42 | % | | | 1.31 | % | | | 25.67 | % | | | 4 | % | | $ | 70,322 | |
| | 0.87 | % | | | 1.43 | % | | | 1.31 | % | | | (1.67 | )% | | | 9 | % | | $ | 65,245 | |
| | 0.78 | % | | | 1.42 | % | | | 1.31 | % | | | 22.89 | % | | | 3 | % | | $ | 80,981 | |
| | 0.68 | % | | | 1.76 | % | | | 1.35 | % | | | 12.44 | % | | | 7 | % | | $ | 81,848 | |
| | 1.48 | % | | | 1.80 | % | | | 1.27 | % | | | (20.91 | )% | | | 6 | % | | $ | 89,159 | |
| | | | | | | | | | | | | | | | | | | | | | |
| | 1.81 | % | | | 0.37 | % | | | 0.25 | % | | | 8.46 | % | | | 2 | % | | $ | 1,990,687 | |
| | 1.84 | % | | | 0.36 | % | | | 0.25 | % | | | 20.13 | % | | | 5 | % | | $ | 1,984,845 | |
| | 2.03 | % | | | 0.36 | % | | | 0.25 | % | | | 27.02 | % | | | 4 | % | | $ | 1,832,524 | |
| | 1.94 | % | | | 0.37 | % | | | 0.25 | % | | | (0.63 | )% | | | 9 | % | | $ | 1,682,905 | |
| | 1.84 | % | | | 0.37 | % | | | 0.25 | % | | | 23.98 | % | | | 3 | % | | $ | 1,709,455 | |
| | 1.94 | % | | | 0.63 | % | | | 0.31 | % | | | 13.55 | % | | | 7 | % | | $ | 1,404,098 | |
| | 2.49 | % | | | 0.80 | % | | | 0.27 | % | | | (20.09 | )% | | | 6 | % | | $ | 115,745 | |
| | | | | | | | | | | | | | | | | | | | | | |
| | 1.62 | % | | | 0.74 | % | | | 0.45 | % | | | 8.34 | % | | | 2 | % | | $ | 219,616 | |
| | 1.64 | % | | | 0.73 | % | | | 0.45 | % | | | 19.88 | % | | | 5 | % | | $ | 191,153 | |
| | 1.83 | % | | | 0.73 | % | | | 0.45 | % | | | 26.77 | % | | | 4 | % | | $ | 149,637 | |
| | 1.74 | % | | | 0.75 | % | | | 0.45 | % | | | (0.82 | )% | | | 9 | % | | $ | 118,982 | |
| | 1.64 | % | | | 0.74 | % | | | 0.45 | % | | | 23.78 | % | | | 3 | % | | $ | 131,141 | |
| | 2.13 | % | | | 0.79 | % | | | 0.45 | % | | | 3.29 | % | | | 7 | % | | $ | 111,126 | |
The accompanying notes are an integral part of these financial statements.
| | | | |
| 46 | | Wells Fargo Advantage Equity Gateway Funds | | Financial highlights |
| | | | | | | | | | | | | | | | | | | | |
| International Value Fund | | Beginning
net asset
value per
share | | | Net
investment
income1 | | | Net realized
and unrealized
gains (losses)
on investments | | | Distributions
from net
investment
income | | | Ending
net asset
value per
share | |
Class A | | | | | | | | | | | | | | | | | | | | |
Six months ended November 30, 2014 (unaudited) | | $ | 15.45 | | | | 0.08 | 4 | | | (1.10 | ) | | | 0.00 | | | $ | 14.43 | |
Year ended May 31, 2014 | | $ | 13.40 | | | | 0.36 | | | | 1.97 | | | | (0.28 | ) | | $ | 15.45 | |
Year ended May 31, 2013 | | $ | 10.64 | | | | 0.31 | | | | 2.71 | | | | (0.26 | ) | | $ | 13.40 | |
Year ended May 31, 2012 | | $ | 14.03 | | | | 0.34 | | | | (3.36 | ) | | | (0.37 | ) | | $ | 10.64 | |
Year ended May 31, 20115 | | $ | 12.58 | | | | 0.22 | 4 | | | 1.46 | | | | (0.23 | ) | | $ | 14.03 | |
Year ended September 30, 2010 | | $ | 12.67 | | | | 0.23 | 4 | | | (0.17 | ) | | | (0.15 | ) | | $ | 12.58 | |
Year ended September 30, 2009 | | $ | 12.66 | | | | 0.23 | 4 | | | 0.22 | | | | (0.44 | ) | | $ | 12.67 | |
Class B | | | | | | | | | | | | | | | | | | | | |
Six months ended November 30, 2014 (unaudited) | | $ | 15.52 | | | | 0.03 | 4 | | | (1.10 | ) | | | 0.00 | | | $ | 14.45 | |
Year ended May 31, 2014 | | $ | 13.43 | | | | 0.13 | 4 | | | 2.09 | | | | (0.13 | ) | | $ | 15.52 | |
Year ended May 31, 2013 | | $ | 10.60 | | | | 0.17 | 4 | | | 2.76 | | | | (0.10 | ) | | $ | 13.43 | |
Year ended May 31, 2012 | | $ | 13.94 | | | | 0.21 | 4 | | | (3.29 | ) | | | (0.26 | ) | | $ | 10.60 | |
Year ended May 31, 20115 | | $ | 12.42 | | | | 0.11 | 4 | | | 1.49 | | | | (0.08 | ) | | $ | 13.94 | |
Year ended September 30, 2010 | | $ | 12.57 | | | | 0.12 | 4 | | | (0.14 | ) | | | (0.13 | ) | | $ | 12.42 | |
Year ended September 30, 2009 | | $ | 12.42 | | | | 0.14 | 4 | | | 0.25 | | | | (0.24 | ) | | $ | 12.57 | |
Class C | | | | | | | | | | | | | | | | | | | | |
Six months ended November 30, 2014 (unaudited) | | $ | 15.16 | | | | 0.02 | | | | (1.08 | ) | | | 0.00 | | | $ | 14.10 | |
Year ended May 31, 2014 | | $ | 13.18 | | | | 0.19 | | | | 2.00 | | | | (0.21 | ) | | $ | 15.16 | |
Year ended May 31, 2013 | | $ | 10.47 | | | | 0.19 | | | | 2.70 | | | | (0.18 | ) | | $ | 13.18 | |
Year ended May 31, 2012 | | $ | 13.79 | | | | 0.23 | 4 | | | (3.28 | ) | | | (0.27 | ) | | $ | 10.47 | |
Year ended May 31, 20115 | | $ | 12.33 | | | | 0.15 | 4 | | | 1.44 | | | | (0.13 | ) | | $ | 13.79 | |
Year ended September 30, 2010 | | $ | 12.51 | | | | 0.15 | | | | (0.18 | ) | | | (0.15 | ) | | $ | 12.33 | |
Year ended September 30, 2009 | | $ | 12.44 | | | | 0.15 | 4 | | | 0.23 | | | | (0.31 | ) | | $ | 12.51 | |
Administrator Class | | | | | | | | | | | | | | | | | | | | |
Six months ended November 30, 2014 (unaudited) | | $ | 15.35 | | | | 0.09 | | | | (1.09 | ) | | | 0.00 | | | $ | 14.35 | |
Year ended May 31, 2014 | | $ | 13.31 | | | | 0.38 | | | | 1.98 | | | | (0.32 | ) | | $ | 15.35 | |
Year ended May 31, 2013 | | $ | 10.57 | | | | 0.33 | 4 | | | 2.70 | | | | (0.29 | ) | | $ | 13.31 | |
Year ended May 31, 2012 | | $ | 13.95 | | | | 0.35 | | | | (3.33 | ) | | | (0.40 | ) | | $ | 10.57 | |
Year ended May 31, 20115 | | $ | 12.52 | | | | 0.24 | 4 | | | 1.46 | | | | (0.27 | ) | | $ | 13.95 | |
Year ended September 30, 2010 | | $ | 12.68 | | | | 0.25 | | | | (0.15 | ) | | | (0.26 | ) | | $ | 12.52 | |
Year ended September 30, 2009 | | $ | 12.69 | | | | 0.25 | 4 | | | 0.20 | | | | (0.46 | ) | | $ | 12.68 | |
Institutional Class | | | | | | | | | | | | | | | | | | | | |
Six months ended November 30, 2014 (unaudited) | | $ | 15.38 | | | | 0.12 | 4 | | | (1.11 | ) | | | 0.00 | | | $ | 14.39 | |
Year ended May 31, 2014 | | $ | 13.34 | | | | 0.41 | | | | 1.98 | | | | (0.35 | ) | | $ | 15.38 | |
Year ended May 31, 2013 | | $ | 10.58 | | | | 0.35 | | | | 2.73 | | | | (0.32 | ) | | $ | 13.34 | |
Year ended May 31, 2012 | | $ | 13.98 | | | | 0.36 | | | | (3.33 | ) | | | (0.43 | ) | | $ | 10.58 | |
Year ended May 31, 20115 | | $ | 12.58 | | | | 0.28 | | | | 1.44 | | | | (0.32 | ) | | $ | 13.98 | |
Year ended September 30, 2010 | | $ | 12.71 | | | | 0.32 | | | | (0.20 | ) | | | (0.25 | ) | | $ | 12.58 | |
Year ended September 30, 2009 | | $ | 12.72 | | | | 0.28 | 4 | | | 0.20 | | | | (0.49 | ) | | $ | 12.71 | |
| 1. | Includes net expenses allocated from the affiliated Master Portfolio in which the Fund invests. |
| 2. | Total return calculations do not include any sales charges. Returns for periods of less than one year are not annualized. |
| 3. | Portfolio turnover rate is calculated by multiplying the Fund’s investment percentage in the affiliated Master Portfolio by the affiliated Master Portfolio’s portfolio turnover rate. |
| 4. | Calculated based upon average shares outstanding |
| 5. | For the eight months ended May 31, 2011. The Fund changed its fiscal year end from September 30 to May 31, effective May 31, 2011. |
The accompanying notes are an integral part of these financial statements.
| | | | | | |
| Financial highlights | | Wells Fargo Advantage Equity Gateway Funds | | | 47 | |
| | | | | | | | | | | | | | | | | | | | | | |
| Ratio to average net assets (annualized) | | | Total
return2 | | | Portfolio
turnover
rate3 | | | Net assets at
end of period
(000s omitted) | |
Net investment
income1 | | | Gross
expenses1 | | | Net
expenses1 | | | | |
| | | | | | | | | | | | | | | | | | | | | | |
| | 1.12 | % | | | 1.49 | % | | | 1.49 | % | | | (6.67 | )% | | | 7 | % | | $ | 5,652 | |
| | 2.45 | % | | | 1.51 | % | | | 1.50 | % | | | 17.48 | % | | | 11 | % | | $ | 6,725 | |
| | 2.35 | % | | | 1.51 | % | | | 1.50 | % | | | 28.58 | % | | | 16 | % | | $ | 5,922 | |
| | 2.81 | % | | | 1.46 | % | | | 1.46 | % | | | (21.53 | )% | | | 9 | % | | $ | 4,742 | |
| | 2.41 | % | | | 1.55 | % | | | 1.47 | % | | | 13.55 | % | | | 16 | % | | $ | 6,213 | |
| | 1.92 | % | | | 1.69 | % | | | 1.46 | % | | | 0.52 | % | | | 27 | % | | $ | 6,792 | |
| | 2.28 | % | | | 1.68 | % | | | 1.50 | % | | | 4.82 | % | | | 41 | % | | $ | 8,769 | |
| | | | | | | | | | | | | | | | | | | | | | |
| | 0.34 | % | | | 2.17 | % | | | 2.17 | % | | | (6.96 | )% | | | 7 | % | | $ | 10 | |
| | 0.94 | % | | | 2.26 | % | | | 2.25 | % | | | 16.57 | % | | | 11 | % | | $ | 25 | |
| | 1.34 | % | | | 2.26 | % | | | 2.25 | % | | | 27.69 | % | | | 16 | % | | $ | 70 | |
| | 1.79 | % | | | 2.21 | % | | | 2.21 | % | | | (22.15 | )% | | | 9 | % | | $ | 110 | |
| | 1.28 | % | | | 2.32 | % | | | 2.22 | % | | | 12.97 | % | | | 16 | % | | $ | 194 | |
| | 0.99 | % | | | 2.44 | % | | | 2.21 | % | | | (0.16 | )% | | | 27 | % | | $ | 339 | |
| | 1.39 | % | | | 2.44 | % | | | 2.25 | % | | | 3.82 | % | | | 41 | % | | $ | 581 | |
| | | | | | | | | | | | | | | | | | | | | | |
| | 0.39 | % | | | 2.24 | % | | | 2.24 | % | | | (7.06 | )% | | | 7 | % | | $ | 872 | |
| | 1.88 | % | | | 2.26 | % | | | 2.25 | % | | | 16.64 | % | | | 11 | % | | $ | 920 | |
| | 1.67 | % | | | 2.26 | % | | | 2.25 | % | | | 27.67 | % | | | 16 | % | | $ | 595 | |
| | 1.96 | % | | | 2.21 | % | | | 2.21 | % | | | (22.14 | )% | | | 9 | % | | $ | 441 | |
| | 1.75 | % | | | 2.30 | % | | | 2.22 | % | | | 13.00 | % | | | 16 | % | | $ | 665 | |
| | 1.11 | % | | | 2.45 | % | | | 2.21 | % | | | (0.21 | )% | | | 27 | % | | $ | 665 | |
| | 1.56 | % | | | 2.43 | % | | | 2.25 | % | | | 3.90 | % | | | 41 | % | | $ | 791 | |
| | | | | | | | | | | | | | | | | | | | | | |
| | 1.38 | % | | | 1.33 | % | | | 1.25 | % | | | (6.58 | )% | | | 7 | % | | $ | 443,211 | |
| | 2.76 | % | | | 1.34 | % | | | 1.25 | % | | | 17.81 | % | | | 11 | % | | $ | 459,415 | |
| | 2.67 | % | | | 1.34 | % | | | 1.25 | % | | | 28.90 | % | | | 16 | % | | $ | 372,187 | |
| | 3.04 | % | | | 1.29 | % | | | 1.25 | % | | | (21.37 | )% | | | 9 | % | | $ | 259,969 | |
| | 2.84 | % | | | 1.38 | % | | | 1.25 | % | | | 13.73 | % | | | 16 | % | | $ | 313,423 | |
| | 2.26 | % | | | 1.53 | % | | | 1.21 | % | | | 0.80 | % | | | 27 | % | | $ | 259,768 | |
| | 2.50 | % | | | 1.50 | % | | | 1.25 | % | | | 4.89 | % | | | 41 | % | | $ | 231,537 | |
| | | | | | | | | | | | | | | | | | | | | | |
| | 1.62 | % | | | 1.06 | % | | | 1.05 | % | | | (6.50 | )% | | | 7 | % | | $ | 3,439 | |
| | 2.91 | % | | | 1.08 | % | | | 1.05 | % | | | 18.07 | % | | | 11 | % | | $ | 2,359 | |
| | 2.81 | % | | | 1.08 | % | | | 1.05 | % | | | 29.20 | % | | | 16 | % | | $ | 1,941 | |
| | 3.20 | % | | | 1.03 | % | | | 1.03 | % | | | (21.26 | )% | | | 9 | % | | $ | 1,505 | |
| | 3.04 | % | | | 1.11 | % | | | 1.03 | % | | | 13.92 | % | | | 16 | % | | $ | 1,797 | |
| | 2.51 | % | | | 1.08 | % | | | 1.01 | % | | | 1.01 | % | | | 27 | % | | $ | 1,518 | |
| | 2.79 | % | | | 1.23 | % | | | 1.05 | % | | | 5.15 | % | | | 41 | % | | $ | 1,766 | |
The accompanying notes are an integral part of these financial statements.
| | | | |
| 48 | | Wells Fargo Advantage Equity Gateway Funds | | Financial highlights |
| | | | | | | | | | | | | | | | | | | | | | | | |
| Small Company Growth Fund | | Beginning
net asset
value per
share | | | Net
investment
income (loss)1 | | | Net realized
and unrealized
gains (losses)
on investments | | | Distributions
from net
investment
income | | | Distributions
from net
realized gains | | | Ending
net asset
value per
share | |
Class A | | | | | | | | | | | | | | | | | | | | | | | | |
Six months ended November 30, 2014 (unaudited) | | $ | 39.44 | | | | (0.18 | )4 | | | 2.23 | | | | 0.00 | | | | 0.00 | | | $ | 41.49 | |
Year ended May 31, 2014 | | $ | 34.23 | | | | (0.37 | )4 | | | 7.98 | | | | 0.00 | | | | (2.40 | ) | | $ | 39.44 | |
Year ended May 31, 2013 | | $ | 26.21 | | | | (0.15 | ) | | | 8.17 | | | | 0.00 | | | | 0.00 | | | $ | 34.23 | |
Year ended May 31, 2012 | | $ | 29.53 | | | | (0.18 | )4 | | | (3.14 | ) | | | 0.00 | | | | 0.00 | | | $ | 26.21 | |
Year ended May 31, 20115 | | $ | 21.23 | | | | (0.15 | ) | | | 8.45 | | | | 0.00 | | | | 0.00 | | | $ | 29.53 | |
Year ended September 30, 2010 | | $ | 18.56 | | | | (0.21 | )4 | | | 2.88 | | | | 0.00 | | | | 0.00 | | | $ | 21.23 | |
Year ended September 30, 2009 | | $ | 18.38 | | | | (0.17 | )4 | | | 0.35 | | | | 0.00 | | | | 0.00 | | | $ | 18.56 | |
Class B | | | | | | | | | | | | | | | | | | | | | | | | |
Six months ended November 30, 2014 (unaudited) | | $ | 35.88 | | | | (0.30 | )4 | | | 2.02 | | | | 0.00 | | | | 0.00 | | | $ | 37.60 | |
Year ended May 31, 2014 | | $ | 31.55 | | | | (0.60 | )4 | | | 7.33 | | | | 0.00 | | | | (2.40 | ) | | $ | 35.88 | |
Year ended May 31, 2013 | | $ | 24.35 | | | | (0.36 | )4 | | | 7.56 | | | | 0.00 | | | | 0.00 | | | $ | 31.55 | |
Year ended May 31, 2012 | | $ | 27.63 | | | | (0.37 | )4 | | | (2.91 | ) | | | 0.00 | | | | 0.00 | | | $ | 24.35 | |
Year ended May 31, 20115 | | $ | 19.97 | | | | (0.29 | )4 | | | 7.95 | | | | 0.00 | | | | 0.00 | | | $ | 27.63 | |
Year ended September 30, 2010 | | $ | 17.58 | | | | (0.34 | )4 | | | 2.73 | | | | 0.00 | | | | 0.00 | | | $ | 19.97 | |
Year ended September 30, 2009 | | $ | 17.55 | | | | (0.25 | )4 | | | 0.28 | | | | 0.00 | | | | 0.00 | | | $ | 17.58 | |
Class C | | | | | | | | | | | | | | | | | | | | | | | | |
Six months ended November 30, 2014 (unaudited) | | $ | 36.32 | | | | (0.30 | )4 | | | 2.04 | | | | 0.00 | | | | 0.00 | | | $ | 38.06 | |
Year ended May 31, 2014 | | $ | 31.91 | | | | (0.62 | )4 | | | 7.43 | | | | 0.00 | | | | (2.40 | ) | | $ | 36.32 | |
Year ended May 31, 2013 | | $ | 24.62 | | | | (0.37 | )4 | | | 7.66 | | | | 0.00 | | | | 0.00 | | | $ | 31.91 | |
Year ended May 31, 2012 | | $ | 27.95 | | | | (0.36 | )4 | | | (2.97 | ) | | | 0.00 | | | | 0.00 | | | $ | 24.62 | |
Year ended May 31, 20115 | | $ | 20.19 | | | | (0.30 | )4 | | | 8.06 | | | | 0.00 | | | | 0.00 | | | $ | 27.95 | |
Year ended September 30, 2010 | | $ | 17.77 | | | | (0.34 | )4 | | | 2.76 | | | | 0.00 | | | | 0.00 | | | $ | 20.19 | |
Year ended September 30, 2009 | | $ | 17.73 | | | | (0.26 | )4 | | | 0.30 | | | | 0.00 | | | | 0.00 | | | $ | 17.77 | |
Class R6 | | | | | | | | | | | | | | | | | | | | | | | | |
Period ended November 30, 2014 (unaudited)6 | | $ | 42.98 | | | | 0.00 | 7 | | | 0.40 | | | | 0.00 | | | | 0.00 | | | $ | 43.38 | |
Administrator Class | | | | | | | | | | | | | | | | | | | | | | | | |
Six months ended November 30, 2014 (unaudited) | | $ | 40.64 | | | | (0.13 | ) | | | 2.28 | | | | 0.00 | | | | 0.00 | | | $ | 42.79 | |
Year ended May 31, 2014 | | $ | 35.13 | | | | (0.26 | ) | | | 8.17 | | | | 0.00 | | | | (2.40 | ) | | $ | 40.64 | |
Year ended May 31, 2013 | | $ | 26.90 | | | | (0.09 | )4 | | | 8.38 | | | | (0.06 | ) | | | 0.00 | | | $ | 35.13 | |
Year ended May 31, 2012 | | $ | 30.22 | | | | (0.13 | )4 | | | (3.19 | ) | | | 0.00 | | | | 0.00 | | | $ | 26.90 | |
Year ended May 31, 20115 | | $ | 21.70 | | | | (0.14 | )4 | | | 8.66 | | | | 0.00 | | | | 0.00 | | | $ | 30.22 | |
Year ended September 30, 2010 | | $ | 18.90 | | | | (0.16 | )4 | | | 2.96 | | | | 0.00 | | | | 0.00 | | | $ | 21.70 | |
Year ended September 30, 2009 | | $ | 18.68 | | | | (0.12 | )4 | | | 0.34 | | | | 0.00 | | | | 0.00 | | | $ | 18.90 | |
Institutional Class | | | | | | | | | | | | | | | | | | | | | | | | |
Six months ended November 30, 2014 (unaudited) | | $ | 41.14 | | | | (0.09 | )4 | | | 2.33 | | | | 0.00 | | | | 0.00 | | | $ | 43.38 | |
Year ended May 31, 2014 | | $ | 35.46 | | | | (0.20 | )4 | | | 8.28 | | | | 0.00 | | | | (2.40 | ) | | $ | 41.14 | |
Year ended May 31, 2013 | | $ | 27.15 | | | | (0.06 | )4 | | | 8.51 | | | | (0.14 | ) | | | 0.00 | | | $ | 35.46 | |
Year ended May 31, 2012 | | $ | 30.44 | | | | (0.07 | )4 | | | (3.22 | ) | | | 0.00 | | | | 0.00 | | | $ | 27.15 | |
Year ended May 31, 20115 | | $ | 21.81 | | | | (0.12 | )4 | | | 8.75 | | | | 0.00 | | | | 0.00 | | | $ | 30.44 | |
Year ended September 30, 2010 | | $ | 18.94 | | | | (0.05 | )4 | | | 2.92 | | | | 0.00 | | | | 0.00 | | | $ | 21.81 | |
Year ended September 30, 2009 | | $ | 18.70 | | | | (0.08 | )4 | | | 0.32 | | | | 0.00 | | | | 0.00 | | | $ | 18.94 | |
| 1. | Includes net expenses allocated from the affiliated Master Portfolio in which the Fund invests. |
| 2. | Total return calculations do not include any sales charges. Returns for periods of less than one year are not annualized. |
| 3. | Portfolio turnover rate is calculated by multiplying the Fund’s investment percentage in the affiliated Master Portfolio by the affiliated Master Portfolio’s portfolio turnover rate. |
| 4. | Calculated based upon average shares outstanding |
| 5. | For the eight months ended May 31, 2011. The Fund changed its fiscal year end from September 30 to May 31, effective May 31, 2011. |
| 6. | Class commenced operations on October 31, 2014. |
| 7. | Amount is less than $0.005. |
The accompanying notes are an integral part of these financial statements.
| | | | | | |
| Financial highlights | | Wells Fargo Advantage Equity Gateway Funds | | | 49 | |
| | | | | | | | | | | | | | | | | | | | | | |
| Ratio to average net assets (annualized) | | | Total
return2 | | | Portfolio
turnover
rate3 | | | Net assets at
end of period
(000s omitted) | |
Net investment
income (loss)1 | | | Gross
expenses1 | | | Net
expenses1 | | | | |
| | | | | | | | | | | | | | | | | | | | | | |
| | (0.88 | )% | | | 1.42 | % | | | 1.40 | % | | | 5.20 | % | | | 30 | % | | $ | 41,588 | |
| | (0.96 | )% | | | 1.45 | % | | | 1.41 | % | | | 22.63 | % | | | 77 | % | | $ | 30,364 | |
| | (0.58 | )% | | | 1.53 | % | | | 1.45 | % | | | 30.55 | % | | | 109 | % | | $ | 9,357 | |
| | (0.70 | )% | | | 1.46 | % | | | 1.44 | % | | | (11.18 | )% | | | 107 | % | | $ | 6,450 | |
| | (1.04 | )% | | | 1.45 | % | | | 1.44 | % | | | 39.11 | % | | | 70 | % | | $ | 7,201 | |
| | (1.05 | )% | | | 1.50 | % | | | 1.45 | % | | | 14.39 | % | | | 129 | % | | $ | 4,042 | |
| | (1.13 | )% | | | 1.54 | % | | | 1.44 | % | | | 0.92 | % | | | 169 | % | | $ | 2,408 | |
| | | | | | | | | | | | | | | | | | | | | | |
| | (1.65 | )% | | | 2.16 | % | | | 2.15 | % | | | 4.79 | % | | | 30 | % | | $ | 80 | |
| | (1.71 | )% | | | 2.20 | % | | | 2.16 | % | | | 21.74 | % | | | 77 | % | | $ | 101 | |
| | (1.33 | )% | | | 2.28 | % | | | 2.20 | % | | | 29.57 | % | | | 109 | % | | $ | 164 | |
| | (1.48 | )% | | | 2.21 | % | | | 2.19 | % | | | (11.87 | )% | | | 107 | % | | $ | 193 | |
| | (1.78 | )% | | | 2.19 | % | | | 2.19 | % | | | 38.43 | % | | | 70 | % | | $ | 380 | |
| | (1.83 | )% | | | 2.24 | % | | | 2.20 | % | | | 13.54 | % | | | 129 | % | | $ | 251 | |
| | (1.85 | )% | | | 2.29 | % | | | 2.19 | % | | | 0.17 | % | | | 169 | % | | $ | 312 | |
| | | | | | | | | | | | | | | | | | | | | | |
| | (1.63 | )% | | | 2.17 | % | | | 2.15 | % | | | 4.79 | % | | | 30 | % | | $ | 9,131 | |
| | (1.71 | )% | | | 2.20 | % | | | 2.16 | % | | | 21.75 | % | | | 77 | % | | $ | 6,546 | |
| | (1.31 | )% | | | 2.28 | % | | | 2.20 | % | | | 29.56 | % | | | 109 | % | | $ | 2,406 | |
| | (1.45 | )% | | | 2.22 | % | | | 2.19 | % | | | (11.85 | )% | | | 107 | % | | $ | 1,628 | |
| | (1.80 | )% | | | 2.20 | % | | | 2.19 | % | | | 38.39 | % | | | 70 | % | | $ | 1,736 | |
| | (1.81 | )% | | | 2.24 | % | | | 2.20 | % | | | 13.62 | % | | | 129 | % | | $ | 820 | |
| | (1.87 | )% | | | 2.29 | % | | | 2.19 | % | | | 0.23 | % | | | 169 | % | | $ | 605 | |
| | | | | | | | | | | | | | | | | | | | | | |
| | 0.05 | % | | | 0.91 | % | | | 0.89 | % | | | 0.93 | % | | | 30 | % | | $ | 25 | |
| | | | | | | | | | | | | | | | | | | | | | |
| | (0.68 | )% | | | 1.25 | % | | | 1.20 | % | | | 5.29 | % | | | 30 | % | | $ | 128,744 | |
| | (0.74 | )% | | | 1.29 | % | | | 1.20 | % | | | 22.92 | % | | | 77 | % | | $ | 118,456 | |
| | (0.30 | )% | | | 1.37 | % | | | 1.20 | % | | | 30.89 | % | | | 109 | % | | $ | 98,445 | |
| | (0.48 | )% | | | 1.30 | % | | | 1.20 | % | | | (10.99 | )% | | | 107 | % | | $ | 97,776 | |
| | (0.78 | )% | | | 1.28 | % | | | 1.20 | % | | | 39.33 | % | | | 70 | % | | $ | 177,938 | |
| | (0.82 | )% | | | 1.32 | % | | | 1.20 | % | | | 14.76 | % | | | 129 | % | | $ | 237,761 | |
| | (0.85 | )% | | | 1.35 | % | | | 1.19 | % | | | 1.18 | % | | | 169 | % | | $ | 229,380 | |
| | | | | | | | | | | | | | | | | | | | | | |
| | (0.43 | )% | | | 0.99 | % | | | 0.95 | % | | | 5.44 | % | | | 30 | % | | $ | 276,012 | |
| | (0.49 | )% | | | 1.02 | % | | | 0.95 | % | | | 23.19 | % | | | 77 | % | | $ | 186,581 | |
| | (0.19 | )% | | | 1.10 | % | | | 0.95 | % | | | 31.25 | % | | | 109 | % | | $ | 71,336 | |
| | (0.27 | )% | | | 1.03 | % | | | 0.95 | % | | | (10.78 | )% | | | 107 | % | | $ | 9,692 | |
| | (0.61 | )% | | | 1.01 | % | | | 0.95 | % | | | 39.59 | % | | | 70 | % | | $ | 91,704 | |
| | (0.25 | )% | | | 1.05 | % | | | 0.95 | % | | | 14.98 | % | | | 129 | % | | $ | 1,175 | |
| | (0.57 | )% | | | 1.09 | % | | | 0.95 | % | | | 1.39 | % | | | 169 | % | | $ | 9 | |
The accompanying notes are an integral part of these financial statements.
| | | | |
| 50 | | Wells Fargo Advantage Equity Gateway Funds | | Financial highlights |
| | | | | | | | | | | | | | | | | | | | |
| Small Company Value Fund | | Beginning
net asset
value per
share | | | Net
investment
income (loss)1 | | | Net realized
and unrealized
gains (losses)
on investments | | | Distributions
from net
investment
income | | | Ending
net asset
value per
share | |
Class A | | | | | | | | | | | | | | | | | | | | |
Six months ended November 30, 2014 (unaudited) | | $ | 20.08 | | | | (0.00 | )4 | | | 0.02 | | | | 0.00 | | | $ | 20.10 | |
Year ended May 31, 2014 | | $ | 17.10 | | | | 0.06 | | | | 2.92 | | | | 0.00 | | | $ | 20.08 | |
Year ended May 31, 2013 | | $ | 13.17 | | | | 0.00 | 5 | | | 3.93 | | | | 0.00 | | | $ | 17.10 | |
Year ended May 31, 2012 | | $ | 14.36 | | | | 0.03 | | | | (1.11 | ) | | | (0.11 | ) | | $ | 13.17 | |
Year ended May 31, 20116 | | $ | 11.38 | | | | 0.11 | | | | 2.87 | | | | 0.00 | | | $ | 14.36 | |
Year ended September 30, 2010 | | $ | 9.84 | | | | (0.02 | ) | | | 1.56 | | | | 0.00 | | | $ | 11.38 | |
Year ended September 30, 2009 | | $ | 10.55 | | | | 0.04 | 5 | | | (0.71 | ) | | | (0.04 | ) | | $ | 9.84 | |
Class B | | | | | | | | | | | | | | | | | | | | |
Six months ended November 30, 2014 (unaudited) | | $ | 18.38 | | | | (0.07 | )5 | | | 0.02 | | | | 0.00 | | | $ | 18.33 | |
Year ended May 31, 2014 | | $ | 15.74 | | | | (0.05 | )5 | | | 2.69 | | | | 0.00 | | | $ | 18.38 | |
Year ended May 31, 2013 | | $ | 12.21 | | | | (0.10 | )5 | | | 3.63 | | | | 0.00 | | | $ | 15.74 | |
Year ended May 31, 2012 | | $ | 13.30 | | | | (0.08 | )5 | | | (1.01 | ) | | | 0.00 | | | $ | 12.21 | |
Year ended May 31, 20116 | | $ | 10.59 | | | | 0.04 | 5 | | | 2.67 | | | | 0.00 | | | $ | 13.30 | |
Year ended September 30, 2010 | | $ | 9.20 | | | | (0.10 | )5 | | | 1.49 | | | | 0.00 | | | $ | 10.59 | |
Year ended September 30, 2009 | | $ | 9.89 | | | | (0.01 | )5 | | | (0.68 | ) | | | 0.00 | | | $ | 9.20 | |
Class C | | | | | | | | | | | | | | | | | | | | |
Six months ended November 30, 2014 (unaudited) | | $ | 18.27 | | | | (0.07 | )5 | | | 0.02 | | | | 0.00 | | | $ | 18.22 | |
Year ended May 31, 2014 | | $ | 15.68 | | | | (0.07 | )5 | | | 2.66 | | | | 0.00 | | | $ | 18.27 | |
Year ended May 31, 2013 | | $ | 12.16 | | | | (0.10 | )5 | | | 3.62 | | | | 0.00 | | | $ | 15.68 | |
Year ended May 31, 2012 | | $ | 13.30 | | | | (0.08 | )5 | | | (1.02 | ) | | | (0.04 | ) | | $ | 12.16 | |
Year ended May 31, 20116 | | $ | 10.59 | | | | 0.02 | 5 | | | 2.69 | | | | 0.00 | | | $ | 13.30 | |
Year ended September 30, 2010 | | $ | 9.20 | | | | (0.09 | )5 | | | 1.48 | | | | 0.00 | | | $ | 10.59 | |
Year ended September 30, 2009 | | $ | 9.89 | | | | (0.02 | )5 | | | (0.67 | ) | | | 0.00 | | | $ | 9.20 | |
Administrator Class | | | | | | | | | | | | | | | | | | | | |
Six months ended November 30, 2014 (unaudited) | | $ | 20.49 | | | | 0.02 | 5 | | | 0.02 | | | | 0.00 | | | $ | 20.53 | |
Year ended May 31, 2014 | | $ | 17.42 | | | | 0.12 | | | | 2.95 | | | | 0.00 | | | $ | 20.49 | |
Year ended May 31, 2013 | | $ | 13.39 | | | | 0.03 | 5 | | | 4.01 | | | | (0.01 | ) | | $ | 17.42 | |
Year ended May 31, 2012 | | $ | 14.60 | | | | 0.06 | | | | (1.13 | ) | | | (0.14 | ) | | $ | 13.39 | |
Year ended May 31, 20116 | | $ | 11.55 | | | | 0.12 | 5 | | | 2.93 | | | | 0.00 | | | $ | 14.60 | |
Year ended September 30, 2010 | | $ | 9.94 | | | | (0.02 | ) | | | 1.63 | | | | 0.00 | | | $ | 11.55 | |
Year ended September 30, 2009 | | $ | 10.69 | | | | 0.06 | 5 | | | (0.74 | ) | | | (0.07 | ) | | $ | 9.94 | |
Institutional Class | | | | | | | | | | | | | | | | | | | | |
Six months ended November 30, 2014 (unaudited) | | $ | 20.57 | | | | 0.03 | | | | 0.03 | | | | 0.00 | | | $ | 20.63 | |
Year ended May 31, 2014 | | $ | 17.45 | | | | 0.13 | | | | 2.99 | | | | 0.00 | | | $ | 20.57 | |
Year ended May 31, 2013 | | $ | 13.41 | | | | 0.06 | 5 | | | 4.03 | | | | (0.05 | ) | | $ | 17.45 | |
Year ended May 31, 2012 | | $ | 14.63 | | | | 0.11 | | | | (1.17 | ) | | | (0.16 | ) | | $ | 13.41 | |
Year ended May 31, 20116 | | $ | 11.55 | | | | 0.13 | 5 | | | 2.95 | | | | 0.00 | | | $ | 14.63 | |
Year ended September 30, 20107 | | $ | 11.26 | | | | 0.02 | | | | 0.27 | | | | 0.00 | | | $ | 11.55 | |
| 1. | Includes net expenses allocated from the affiliated Master Portfolio in which the Fund invests. |
| 2. | Total return calculations do not include any sales charges. Returns for periods of less than one year are not annualized. |
| 3. | Portfolio turnover rate is calculated by multiplying the Fund’s investment percentage in the affiliated Master Portfolio by the affiliated Master Portfolio’s portfolio turnover rate. |
| 4. | Amount is less than $0.005. |
| 5. | Calculated based upon average shares outstanding |
| 6. | For the eight months ended May 31, 2011. The Fund changed its fiscal year end from September 30 to May 31, effective May 31, 2011. |
| 7. | For the period from July 30, 2010 (commencement of class operations) to September 30, 2010 |
The accompanying notes are an integral part of these financial statements.
| | | | | | |
| Financial highlights | | Wells Fargo Advantage Equity Gateway Funds | | | 51 | |
| | | | | | | | | | | | | | | | | | | | | | |
| Ratio to average net assets (annualized) | | | Total
return2 | | | Portfolio
turnover
rate3 | | | Net assets at
end of period
(000s omitted) | |
Net investment
income (loss)1 | | | Gross
expenses1 | | | Net
expenses1 | | | | |
| | | | | | | | | | | | | | | | | | | | | | |
| | (0.01 | )% | | | 1.51 | % | | | 1.40 | % | | | 0.10 | % | | | 24 | % | | $ | 25,386 | |
| | 0.33 | % | | | 1.56 | % | | | 1.42 | % | | | 17.43 | % | | | 47 | % | | $ | 26,517 | |
| | (0.02 | )% | | | 1.57 | % | | | 1.45 | % | | | 29.84 | % | | | 57 | % | | $ | 21,652 | |
| | 0.08 | % | | | 1.50 | % | | | 1.45 | % | | | (7.44 | )% | | | 60 | % | | $ | 18,605 | |
| | 1.07 | % | | | 1.49 | % | | | 1.42 | % | | | 26.19 | % | | | 47 | % | | $ | 26,222 | |
| | (0.21 | )% | | | 1.65 | % | | | 1.45 | % | | | 15.53 | % | | | 60 | % | | $ | 22,492 | |
| | 0.55 | % | | | 1.55 | % | | | 1.45 | % | | | (6.14 | )% | | | 99 | % | | $ | 20,202 | |
| | | | | | | | | | | | | | | | | | | | | | |
| | (0.77 | )% | | | 2.25 | % | | | 2.15 | % | | | (0.27 | )% | | | 24 | % | | $ | 31 | |
| | (0.29 | )% | | | 2.15 | % | | | 2.02 | % | | | 16.77 | % | | | 47 | % | | $ | 58 | |
| | (0.75 | )% | | | 2.31 | % | | | 2.20 | % | | | 28.91 | % | | | 57 | % | | $ | 197 | |
| | (0.67 | )% | | | 2.25 | % | | | 2.20 | % | | | (8.20 | )% | | | 60 | % | | $ | 500 | |
| | 0.45 | % | | | 2.25 | % | | | 2.17 | % | | | 25.59 | % | | | 47 | % | | $ | 1,340 | |
| | (0.99 | )% | | | 2.40 | % | | | 2.20 | % | | | 14.98 | % | | | 60 | % | | $ | 2,079 | |
| | (0.20 | )% | | | 2.30 | % | | | 2.20 | % | | | (6.88 | )% | | | 99 | % | | $ | 2,792 | |
| | | | | | | | | | | | | | | | | | | | | | |
| | (0.76 | )% | | | 2.26 | % | | | 2.15 | % | | | (0.27 | )% | | | 24 | % | | $ | 2,414 | |
| | (0.42 | )% | | | 2.31 | % | | | 2.17 | % | | | 16.52 | % | | | 47 | % | | $ | 2,192 | |
| | (0.76 | )% | | | 2.32 | % | | | 2.20 | % | | | 28.95 | % | | | 57 | % | | $ | 1,814 | |
| | (0.68 | )% | | | 2.25 | % | | | 2.20 | % | | | (8.20 | )% | | | 60 | % | | $ | 1,557 | |
| | 0.29 | % | | | 2.24 | % | | | 2.17 | % | | | 25.59 | % | | | 47 | % | | $ | 2,150 | |
| | (0.94 | )% | | | 2.40 | % | | | 2.20 | % | | | 14.98 | % | | | 60 | % | | $ | 1,763 | |
| | (0.26 | )% | | | 2.30 | % | | | 2.20 | % | | | (6.88 | )% | | | 99 | % | | $ | 1,437 | |
| | | | | | | | | | | | | | | | | | | | | | |
| | 0.19 | % | | | 1.35 | % | | | 1.20 | % | | | 0.20 | % | | | 24 | % | | $ | 64,503 | |
| | 0.55 | % | | | 1.39 | % | | | 1.20 | % | | | 17.62 | % | | | 47 | % | | $ | 68,358 | |
| | 0.23 | % | | | 1.40 | % | | | 1.20 | % | | | 30.21 | % | | | 57 | % | | $ | 60,550 | |
| | 0.32 | % | | | 1.33 | % | | | 1.20 | % | | | (7.24 | )% | | | 60 | % | | $ | 60,333 | |
| | 1.34 | % | | | 1.33 | % | | | 1.20 | % | | | 26.41 | % | | | 47 | % | | $ | 70,022 | |
| | (0.05 | )% | | | 1.47 | % | | | 1.20 | % | | | 16.20 | % | | | 60 | % | | $ | 60,081 | |
| | 0.85 | % | | | 1.37 | % | | | 1.20 | % | | | (6.06 | )% | | | 99 | % | | $ | 124,072 | |
| | | | | | | | | | | | | | | | | | | | | | |
| | 0.41 | % | | | 1.08 | % | | | 1.00 | % | | | 0.29 | % | | | 24 | % | | $ | 15,621 | |
| | 0.75 | % | | | 1.13 | % | | | 1.00 | % | | | 17.88 | % | | | 47 | % | | $ | 11,967 | |
| | 0.40 | % | | | 1.14 | % | | | 1.00 | % | | | 30.54 | % | | | 57 | % | | $ | 8,185 | |
| | 0.59 | % | | | 1.05 | % | | | 1.00 | % | | | (7.14 | )% | | | 60 | % | | $ | 62 | |
| | 1.42 | % | | | 1.02 | % | | | 0.96 | % | | | 26.67 | % | | | 47 | % | | $ | 16 | |
| | 1.02 | % | | | 1.15 | % | | | 1.00 | % | | | 2.58 | % | | | 60 | % | | $ | 10 | |
The accompanying notes are an integral part of these financial statements.
| | | | |
| 52 | | Wells Fargo Advantage Equity Gateway Funds | | Notes to financial statements (unaudited) |
1. ORGANIZATION
Wells Fargo Funds Trust (the “Trust”), a Delaware statutory trust organized on March 10, 1999, is an open-end management investment company registered under the Investment Company Act of 1940, as amended (the “1940 Act”). These financial statements report on the following funds: the Wells Fargo Advantage C&B Large Cap Value Fund (“C&B Large Cap Value Fund”), the Wells Fargo Advantage Diversified Equity Fund (“Diversified Equity Fund”), the Wells Fargo Advantage Emerging Growth Fund (“Emerging Growth Fund”), the Wells Fargo Advantage Index Fund (“Index Fund”), the Wells Fargo Advantage International Value Fund (“International Value Fund”), the Wells Fargo Advantage Small Company Growth Fund (“Small Company Growth Fund”), and the Wells Fargo Advantage Small Company Value Fund (“Small Company Value Fund”) (each, a “Fund”, collectively, the “Funds”). Each Fund is a diversified series of the Trust.
Each Fund seeks to achieve its investment objective by investing all investable assets in one or more separate diversified portfolios (each, an “affiliated Master Portfolio”, collectively, the “affiliated Master Portfolios”) of Wells Fargo Master Trust, a registered open-end management investment company. Each affiliated Master Portfolio directly acquires portfolio securities, and a Fund investing in an affiliated Master Portfolio acquires an indirect interest in those securities. Each Fund accounts for its investment in the affiliated Master Portfolios as partnership investments and records on a daily basis its share of the affiliated Master Portfolio’s income, expense and realized and unrealized gains and losses. The financial statements of the affiliated Master Portfolios for the six months ended November 30, 2014 are included in this report and should be read in conjunction with each Fund’s financial statements. As of November 30, 2014, the Funds own the following percentages of the affiliated Master Portfolios:
| | | | | | | | | | | | | | | | | | | | | | | | | | | | |
| | | C&B
Large Cap
Value
Fund | | | Diversified
Equity
Fund | | | Emerging
Growth
Fund | | | Index
Fund | | | International
Value Fund | | | Small
Company
Growth
Fund | | | Small
Company
Value
Fund | |
Wells Fargo Advantage C&B Large Cap Value Portfolio | | | 87 | % | | | 7 | % | | | N/A | | | | N/A | | | | N/A | | | | N/A | | | | N/A | |
Wells Fargo Advantage Diversified Large Cap Growth Portfolio | | | N/A | | | | 56 | % | | | N/A | | | | N/A | | | | N/A | | | | N/A | | | | N/A | |
Wells Fargo Advantage Emerging Growth Portfolio | | | N/A | | | | 1 | % | | | 92 | % | | | N/A | | | | N/A | | | | N/A | | | | N/A | |
Wells Fargo Advantage Index Portfolio | | | N/A | | | | 3 | % | | | NA | | | | 95 | % | | | N/A | | | | N/A | | | | N/A | |
Wells Fargo Advantage International Growth Portfolio | | | N/A | | | | 14 | % | | | NA | | | | N/A | | | | N/A | | | | N/A | | | | N/A | |
Wells Fargo Advantage International Value Portfolio | | | N/A | | | | 4 | % | | | NA | | | | N/A | | | | 92 | % | | | N/A | | | | N/A | |
Wells Fargo Advantage Large Company Value Portfolio | | | N/A | | | | 56 | % | | | NA | | | | N/A | | | | N/A | | | | N/A | | | | N/A | |
Wells Fargo Advantage Small Company Growth Portfolio | | | N/A | | | | 2 | % | | | NA | | | | N/A | | | | N/A | | | | 97 | % | | | N/A | |
Wells Fargo Advantage Small Company Value Portfolio | | | N/A | | | | 7 | % | | | NA | | | | N/A | | | | N/A | | | | N/A | | | | 53 | % |
2. SIGNIFICANT ACCOUNTING POLICIES
The following significant accounting policies, which are consistently followed in the preparation of the financial statements of each Fund, are in conformity with U.S. generally accepted accounting principles which require management to make estimates and assumptions that affect the reported amounts of assets and liabilities, disclosure of contingent assets and liabilities at the date of the financial statements, and the reported amounts of revenues and expenses during the reporting period. Actual results could differ from those estimates.
Securities valuation
All investments are valued each business day as of the close of regular trading on the New York Stock Exchange (generally 4 p.m. Eastern Time).
Investments in the affiliated Master Portfolios are valued daily based on each Fund’s proportionate share of each affiliated Master Portfolio’s net assets, which are also valued daily. Securities held in the affiliated Master Portfolios are valued as discussed in the Notes to Financial Statements of the affiliated Master Portfolios, which are included elsewhere in this report.
Security transactions and income
Securities transactions are recorded on a trade date basis in each affiliated Master Portfolio. Realized gains or losses in each affiliated Master Portfolio are recorded on the basis of identified cost.
| | | | | | |
| Notes to financial statements (unaudited) | | Wells Fargo Advantage Equity Gateway Funds | | | 53 | |
Interest income is accrued daily and bond discounts are accreted and premiums are amortized daily based on the effective interest method by each affiliated Master Portfolio. To the extent debt obligations are placed on non-accrual status, any related interest income may be reduced by writing off interest receivables when the collection of all or a portion of interest has become doubtful based on consistently applied procedures. If the issuer subsequently resumes interest payments or when the collectability of interest is reasonably assured, the debt obligation is removed from non-accrual status.
Dividend income in each affiliated Master Portfolio is recognized on the ex-dividend date, except for certain dividends from foreign securities, which are recorded as soon as the custodian verifies the ex-dividend date. Dividend income from foreign securities in each affiliated Master Portfolio is recorded net of foreign taxes withheld where recovery of such taxes is not assured.
Each Fund records daily its proportionate share of each affiliated Master Portfolio’s interest and dividend income and realized and unrealized gains or losses.
Distributions to shareholders
Distributions to shareholders from net investment income and net realized gains, if any, are recorded on the ex-dividend date. Such distributions are determined in conformity with federal income tax regulations, which may differ in amount or character from net investment income and realized gains recognized for purposes of U.S. generally accepted accounting principles.
Federal and other taxes
Each Fund is treated as a separate entity for federal income tax purposes. Each Fund intends to continue to qualify as a regulated investment company by distributing substantially all of its investment company taxable income and any net realized capital gains (after reduction for capital loss carryforwards) sufficient to relieve it from all, or substantially all, federal income taxes. Accordingly, no provision for federal income taxes was required.
Each Fund’s income and federal excise tax returns and all financial records supporting those returns for the prior three fiscal years are subject to examination by the federal and Delaware revenue authorities. Management has analyzed each Fund’s tax positions taken on federal, state, and foreign tax returns for all open tax years and does not believe that there are any uncertain tax positions that require recognition of a tax liability.
At May 31, 2014, capital loss carryforwards available to offset future net realized capital gains were as follows through the indicated expiration dates:
| | | | | | | | | | | | | | | | | | | | |
| | | | | | No expiration | |
| | | 2016 | | | 2017 | | | 2018 | | | 2019 | | | Long-term | |
C&B Large Cap Value Fund | | $ | 0 | | | $ | 0 | | | $ | 22,021,530 | | | $ | 16,296,879 | | | $ | 0 | |
Index Fund | | | 0 | | | | 0 | | | | 0 | | | | 0 | | | | 6,764,069 | |
International Value Fund | | | 0 | | | | 4,362,398 | | | | 39,532,291 | | | | 4,561,591 | | | | 0 | |
Small Company Growth Fund | | | 546,818 | | | | 273,409 | | | | 0 | | | | 0 | | | | 0 | |
Small Company Value Fund | | | 0 | | | | 8,477,676 | | | | 80,412,918 | | | | 0 | | | | 0 | |
At May 31, 2014, deferred post-October capital losses which were recognized on the first day of the current fiscal year were as follows:
| | | | |
| | | Deferred post-October capital loss | |
Index Fund | | $ | 7,250,891 | |
Class allocations
The separate classes of shares offered by each Fund differ principally in applicable sales charges, distribution, shareholder servicing, and administration fees. Class specific expenses are charged directly to that share class. Investment income, common expenses, and realized and unrealized gains (losses) on investments are allocated daily to each class of shares based on the relative proportion of net assets of each class.
| | | | |
| 54 | | Wells Fargo Advantage Equity Gateway Funds | | Notes to financial statements (unaudited) |
3. FAIR VALUATION MEASUREMENTS
Fair value measurements of investments are determined within a framework that has established a fair value hierarchy based upon the various data inputs utilized in determining the value of each Fund’s investments. The three-level hierarchy gives the highest priority to unadjusted quoted prices in active markets for identical assets or liabilities (Level 1) and the lowest priority to significant unobservable inputs (Level 3). Each Fund’s investments are classified within the fair value hierarchy based on the lowest level of input that is significant to the fair value measurement. The inputs are summarized into three broad levels as follows:
| n | | Level 1 – quoted prices in active markets for identical securities |
| n | | Level 2 – other significant observable inputs (including quoted prices for similar securities, interest rates, prepayment speeds, credit risk, use of amortized cost, etc.) |
| n | | Level 3 – significant unobservable inputs (including the Fund’s own assumptions in determining the fair value of investments) |
The inputs or methodologies used for valuing investments in securities are not necessarily an indication of the risk associated with investing in those securities.
At November 30, 2014, each Fund’s investments in an affiliated Master Portfolio carried at fair value were designated as Level 2 inputs. Further details on the investments of the affiliated Master Portfolios can be found in the Portfolio of Investments or Summary Portfolio of Investments of each affiliated Master Portfolio which is contained elsewhere in this report.
Transfers in and transfers out are recognized at the end of the reporting period. For the six months ended November 30, 2014, the Funds did not have any transfers into/out of Level 1, Level 2, or Level 3.
4. TRANSACTIONS WITH AFFILIATES
Advisory fees
The Trust has entered into an advisory contract with Wells Fargo Funds Management, LLC (“Funds Management”), an indirect wholly owned subsidiary of Wells Fargo & Company (“Wells Fargo”). The adviser is responsible for implementing investment policies and guidelines of the Funds.
For each Fund that invests all of its assets in a single affiliated Master Portfolio, Funds Management does not currently receive an advisory fee. For Diversified Equity Fund which invests in multiple affiliated Master Portfolios, Funds Management is entitled to receive an annual advisory fee for providing such advisory services, including the determination of the asset allocations of its investments in the various affiliated Master Portfolios. Funds Management receives an annual advisory fee starting at 0.25% and declining to 0.19% as the average daily net assets of Diversified Equity Fund increase. For the six months ended November 30, 2014, the advisory fee for Diversified Equity Fund was equivalent to an annual rate of 0.25% of its average daily net assets.
Funds Management also serves as the adviser to each affiliated Master Portfolio and is entitled to receive a fee from each affiliated Master Portfolio for those services.
Administration fees
The Trust has entered into an administration agreement with Funds Management. Under this agreement, for providing administrative services, which includes paying fees and expenses for services provided by the transfer agent, sub-transfer agents, omnibus account servicers and record-keepers, Funds Management is entitled to receive from each Fund an annual fund level administration fee starting at 0.05% and declining to 0.03% as the average daily net assets of each Fund increase and a class level administration fee which is calculated based on the average daily net assets of each class as follows:
| | | | |
| | | Class level
administration fee | |
Class A, Class B, Class C | | | 0.26 | % |
Class R6 | | | 0.03 | |
Administrator Class | | | 0.10 | |
Institutional Class | | | 0.08 | |
Investor Class | | | 0.32 | |
| | | | | | |
| Notes to financial statements (unaudited) | | Wells Fargo Advantage Equity Gateway Funds | | | 55 | |
Funds Management has contractually waived and/or reimbursed advisory and administration fees to the extent necessary to maintain certain net operating expense ratios for the Funds. Waiver of fees and/or reimbursement of expenses by Funds Management were made first from fund level expenses on a proportionate basis and then from class specific expenses. Funds Management has committed to waive fees and/or reimburse expenses to the extent necessary to cap each Fund’s expenses as follows:
| | | | | | | | | | | | | | | | | | | | | | | | | | | | | | | | |
| | | Expiration date | | | Class A | | | Class B | | | Class C | | | Class R6 | | | Administrator Class | | | Institutional Class | | | Investor Class | |
C&B Large Cap Value Fund | | | September 30, 2015 | | | | 1.15 | % | | | 1.90 | % | | | 1.90 | % | | | N/A | | | | 0.95 | % | | | 0.70 | % | | | 1.20 | % |
Diversified Equity Fund | | | September 30, 2015 | | | | 1.25 | | | | 2.00 | | | | 2.00 | | | | N/A | | | | 1.00 | | | | N/A | | | | N/A | |
Emerging Growth Fund | | | September 30, 2015 | | | | 1.37 | | | | N/A | | | | 2.12 | | | | N/A | | | | 1.20 | | | | 0.90 | | | | 1.40 | 1 |
Index Fund | | | September 30, 2015 | | | | 0.56 | | | | 1.31 | | | | 1.31 | | | | N/A | | | | 0.25 | | | | N/A | | | | 0.45 | |
International Value Fund | | | September 30, 2015 | | | | 1.50 | | | | 2.25 | | | | 2.25 | | | | N/A | | | | 1.25 | | | | 1.05 | | | | N/A | |
Small Company Growth Fund | | | September 30, 2016 | | | | 1.40 | | | | 2.15 | | | | 2.15 | | | | 0.90 | % | | | 1.20 | | | | 0.95 | | | | N/A | |
Small Company Value Fund | | | September 30, 2015 | | | | 1.40 | | | | 2.15 | | | | 2.15 | | | | N/A | | | | 1.20 | | | | 1.00 | | | | N/A | |
| 1. | Prior to October 1, 2014, the expense cap for Investor Class of Emerging Growth Fund was 1.43%. |
After the expiration date, each expense cap may be increased or the commitment to maintain the cap may be terminated only with the approval of the Board of Trustees.
Distribution fees
The Trust has adopted a Distribution Plan for Class B and Class C shares of the Fund pursuant to Rule 12b-1 under the 1940 Act. Distribution fees are charged to Class B and Class C shares and paid to Wells Fargo Funds Distributor, LLC (“Funds Distributor”), the principal underwriter, at an annual rate of 0.75% of the average daily net assets of Class B and Class C shares.
In addition, Funds Distributor is entitled to receive the front-end sales charge from the purchase of Class A shares and a contingent deferred sales charge on the redemption of certain shares. Funds Distributor is also entitled to receive the contingent deferred sales charges from redemptions of Class B and Class C shares. For the six months ended November 30, 2014, Funds Distributor received the following amounts in front-end sales charges and contingent deferred sales charges.
| | | | | | | | |
| | | Front-end
sales charges | | | Contingent deferred
sales charges | |
| | | Class A | | | Class C | |
C&B Large Cap Value Fund | | $ | 1,229 | | | $ | 120 | |
Diversified Equity Fund | | | 2,163 | | | | 11 | |
Emerging Growth Fund | | | 1,073 | | | | 0 | |
Index Fund | | | 6,544 | | | | 20 | |
International Value Fund | | | 645 | | | | 0 | |
Small Company Growth Fund | | | 16,456 | | | | 101 | |
Small Company Value Fund | | | 236 | | | | 0 | |
Shareholder servicing fees
The Trust has entered into contracts with one or more shareholder servicing agents, whereby Class A, Class B, Class C, Administrator Class, and Investor Class of each applicable Fund is charged a fee at an annual rate of 0.25% of the average daily net assets of each respective class. Administrator Class of the Index Fund is charged a fee at an annual rate of 0.10% of its average daily net assets.
A portion of these total shareholder servicing fees were paid to affiliates of Wells Fargo.
| | | | |
| 56 | | Wells Fargo Advantage Equity Gateway Funds | | Notes to financial statements (unaudited) |
5. INVESTMENT PORTFOLIO TRANSACTIONS
Purchases and sales of investments, excluding U.S. Government obligations (if any) and short-term securities, for the six months ended November 30, 2014, were as follows:
| | | | | | | | |
| | | Purchases at cost* | | | Sales proceeds* | |
C&B Large Cap Value Fund | | $ | 44,174,004 | | | $ | 50,626,093 | |
Diversified Equity Fund | | | 58,005,702 | | | | 72,182,382 | |
Emerging Growth Fund | | | 267,750,832 | | | | 338,619,775 | |
Index Fund | | | 53,506,924 | | | | 209,328,353 | |
International Value Fund | | | 48,482,877 | | | | 32,534,960 | |
Small Company Growth Fund | | | 201,894,633 | | | | 113,827,282 | |
Small Company Value Fund | | | 24,983,088 | | | | 29,108,785 | |
| * | The Funds seek to achieve their investment objective by investing some or all of their investable assets in one or more affiliated Master Portfolios. Purchases and sales related to these investments have been calculated by aggregating the results of multiplying each Fund’s ownership percentage of the respective affiliated Master Portfolio by the corresponding affiliated Master Portfolio’s purchases and sales. |
6. BANK BORROWINGS
The Trust (excluding Diversified Equity Fund, the money market funds and certain other funds in the Trust) and Wells Fargo Variable Trust are parties to a $150,000,000 revolving credit agreement. Diversified Equity Fund and certain other funds in the Trust are parties to a $25,000,000 revolving credit agreement. Under each agreement, the Funds are permitted to use bank borrowings for temporary or emergency purposes, such as to fund shareholder redemption requests. Interest under each credit agreement is charged to each Fund based on a borrowing rate equal to the higher of the Federal Funds rate in effect on that day plus 1.25% or the overnight LIBOR rate in effect on that day plus 1.25%. In addition, the applicable Funds pay an annual commitment fee equal to 0.10% under the $150,000,000 credit agreement and an annual commitment fee equal to 0.15% under the $25,000,000 credit agreement. The annual commitment fee applied on the unused balance for each credit agreement is allocated to each participating fund. For the six months ended November 30, 2014, the Funds paid the following amounts in commitment fees:
| | | | |
| | | Commitment fee | |
C&B Large Cap Value Fund | | $ | 205 | |
Diversified Equity Fund | | | 397 | |
Emerging Growth Fund | | | 781 | |
Index Fund | | | 1,988 | |
International Value Fund | | | 435 | |
Small Company Growth Fund | | | 321 | |
Small Company Value Fund | | | 103 | |
For the six months ended November 30, 2014, there were no borrowings by the Funds under the agreement.
7. CONCENTRATION RISK
Concentration risks result from exposure to a limited number of sectors. Through their investments in affiliated Master Portfolio(s), Funds that invest a substantial portion of their assets in a sector may be more affected by changes in that sector than would be a fund whose investments are not heavily weighted in any sector.
8. INDEMNIFICATION
Under the Trust’s organizational documents, the officers and directors are indemnified against certain liabilities that may arise out of performance of their duties to the Trust. Additionally, in the normal course of business, the Trust may enter
| | | | | | |
| Notes to financial statements (unaudited) | | Wells Fargo Advantage Equity Gateway Funds | | | 57 | |
into contracts with service providers that contain a variety of indemnification clauses. The Trust’s maximum exposure under these arrangements is dependent on future claims that may be made against the Funds and, therefore, cannot be estimated.
9. SUBSEQUENT DISTRIBUTIONS
On December 9, 2014, the following Funds declared distributions from capital gains to shareholders of record on December 8, 2014. The per share amounts payable on December 10, 2014 were as follows:
| | | | | | | | | | | | | | | | |
| | | Diversified Equity Fund | | | Emerging Growth Fund | | | Index Fund | | | Small Company Growth Fund | |
Short-term capital gains | | | | | | | | | | | | | | | | |
Class A | | $ | 0.62441 | | | $ | 0.17753 | | | $ | 0.16948 | | | $ | 0.17260 | |
Class B | | | 0.62441 | | | | N/A | | | | 0.16948 | | | | 0.17260 | |
Class C | | | 0.62441 | | | | 0.17753 | | | | 0.16948 | | | | 0.17260 | |
Class R6 | | | N/A | | | | N/A | | | | N/A | | | | 0.17260 | |
Administrator Class | | | 0.62441 | | | | 0.17753 | | | | 0.16948 | | | | 0.17260 | |
Institutional Class | | | N/A | | | | 0.17753 | | | | N/A | | | | 0.17260 | |
Investor Class | | | N/A | | | | 0.17753 | | | | 0.16948 | | | | N/A | |
Long-term capital gains | | | | | | | | | | | | | | | | |
Class A | | $ | 2.56631 | | | $ | 1.02559 | | | $ | 0.60538 | | | $ | 1.74439 | |
Class B | | | 2.56631 | | | | N/A | | | | 0.60538 | | | | 1.74439 | |
Class C | | | 2.56631 | | | | 1.02559 | | | | 0.60538 | | | | 1.74439 | |
Class R6 | | | N/A | | | | N/A | | | | N/A | | | | 1.74439 | |
Administrator Class | | | 2.56631 | | | | 1.02559 | | | | 0.60538 | | | | 1.74439 | |
Institutional Class | | | N/A | | | | 1.02559 | | | | N/A | | | | 1.74439 | |
Investor Class | | | N/A | | | | 1.02559 | | | | 0.60538 | | | | N/A | |
On December 19, 2014, the following Funds declared distributions from net investment income to shareholders of record on December 18, 2014. The per share amounts payable on December 22, 2014 were as follows
| | | | | | | | | | | | |
| | | C&B Large Cap Value Fund | | | Diversified Equity Fund | | | Index Fund | |
Net investment income | | | | | | | | | | | | |
Class A | | $ | 0.09048 | | | $ | 0.14978 | | | $ | 0.96445 | |
Class B | | | 0.00000 | | | | 0.00000 | | | | 0.29265 | |
Class C | | | 0.00718 | | | | 0.00000 | | | | 0.48972 | |
Administrator Class | | | 0.11902 | | | | 0.22591 | | | | 1.16106 | |
Institutional Class | | | 0.14864 | | | | N/A | | | | N/A | |
Investor Class | | | 0.08450 | | | | N/A | | | | 1.05084 | |
On December 30, 2014, the following Fund declared distributions from net investment income to shareholders of record on December 29, 2014. The per share amounts payable on December 31, 2014 were as follows
| | | | |
| | | International
Value Fund | |
Net investment income | | | | |
Class A | | $ | 0.33012 | |
Class B | | | 0.00000 | |
Class C | | | 0.24013 | |
Administrator Class | | | 0.37816 | |
Institutional Class | | | 0.40873 | |
These distributions are not reflected in the accompanying financial statements. The final determination of the source of all distributions is subject to change and made after the tax year-end of each Fund.
| | | | |
| 58 | | Wells Fargo Advantage Equity Gateway Funds | | Portfolio of investments—November 30, 2014 (unaudited) |
C&B LARGE CAP VALUE PORTFOLIO
| | | | | | | | | | | | |
| Security name | | | | | | Shares | | | Value | |
| | | | |
Common Stocks: 91.51% | | | | | | | | | | | | |
| | | | |
Consumer Discretionary: 12.57% | | | | | | | | | | | | |
| | | | |
| Hotels, Restaurants & Leisure: 5.01% | | | | | | | | | | | | |
Carnival Corporation | | | | | | | 210,400 | | | $ | 9,291,264 | |
McDonald’s Corporation | | | | | | | 79,000 | | | | 7,647,990 | |
| | | | |
| | | | | | | | | | | 16,939,254 | |
| | | | | | | | | | | | |
| | | | |
| Media: 5.16% | | | | | | | | | | | | |
Omnicom Group Incorporated | | | | | | | 127,500 | | | | 9,851,925 | |
Twenty-First Century Fox Incorporated | | | | | | | 206,700 | | | | 7,606,560 | |
| | | | |
| | | | | | | | | | | 17,458,485 | |
| | | | | | | | | | | | |
| | | | |
| Multiline Retail: 2.40% | | | | | | | | | | | | |
Kohl’s Corporation | | | | | | | 135,900 | | | | 8,102,358 | |
| | | | | | | | | | | | |
| | | | |
Consumer Staples: 10.64% | | | | | | | | | | | | |
| | | | |
| Beverages: 1.34% | | | | | | | | | | | | |
Diageo plc ADR | | | | | | | 36,800 | | | | 4,533,760 | |
| | | | | | | | | | | | |
| | | | |
| Food Products: 2.07% | | | | | | | | | | | | |
Unilever NV ADR | | | | | | | 172,600 | | | | 7,014,464 | |
| | | | | | | | | | | | |
| | | | |
| Household Products: 4.70% | | | | | | | | | | | | |
Colgate-Palmolive Company | | | | | | | 67,800 | | | | 4,718,202 | |
Henkel AG & Company KGaA ADR | | | | | | | 51,200 | | | | 5,067,776 | |
The Procter & Gamble Company | | | | | | | 67,600 | | | | 6,113,068 | |
| | | | |
| | | | | | | | | | | 15,899,046 | |
| | | | | | | | | | | | |
| | | | |
| Tobacco: 2.53% | | | | | | | | | | | | |
Philip Morris International | | | | | | | 98,300 | | | | 8,545,219 | |
| | | | | | | | | | | | |
| | | | |
Energy: 8.69% | | | | | | | | | | | | |
| | | | |
| Oil, Gas & Consumable Fuels: 8.69% | | | | | | | | | | | | |
Chevron Corporation | | | | | | | 60,440 | | | | 6,580,103 | |
Devon Energy Corporation | | | | | | | 117,300 | | | | 6,917,181 | |
Exxon Mobil Corporation | | | | | | | 85,350 | | | | 7,727,589 | |
Noble Energy Incorporated | | | | | | | 75,600 | | | | 3,718,008 | |
World Fuel Services Corporation | | | | | | | 98,600 | | | | 4,464,608 | |
| | | | |
| | | | | | | | | | | 29,407,489 | |
| | | | | | | | | | | | |
| | | | |
Financials: 23.88% | | | | | | | | | | | | |
| | | | |
| Banks: 7.12% | | | | | | | | | | | | |
Bank of America Corporation | | | | | | | 334,100 | | | | 5,693,064 | |
JPMorgan Chase & Company | | | | | | | 174,800 | | | | 10,515,968 | |
PNC Financial Services Group Incorporated | | | | | | | 90,000 | | | | 7,872,300 | |
| | | | |
| | | | | | | | | | | 24,081,332 | |
| | | | | | | | | | | | |
The accompanying notes are an integral part of these financial statements.
| | | | | | |
| Portfolio of investments—November 30, 2014 (unaudited) | | Wells Fargo Advantage Equity Gateway Funds | | | 59 | |
C&B LARGE CAP VALUE PORTFOLIO
| | | | | | | | | | | | |
| Security name | | | | | | Shares | | | Value | |
| | | | |
| Capital Markets: 3.92% | | | | | | | | | | | | |
State Street Corporation | | | | | | | 172,700 | | | $ | 13,251,271 | |
| | | | | | | | | | | | |
| | | | |
| Consumer Finance: 2.23% | | | | | | | | | | | | |
American Express Company | | | | | | | 81,400 | | | | 7,522,988 | |
| | | | | | | | | | | | |
| | | | |
| Diversified Financial Services: 1.52% | | | | | | | | | | | | |
Berkshire Hathaway Incorporated Class B † | | | | | | | 34,600 | | | | 5,144,674 | |
| | | | | | | | | | | | |
| | | | |
| Insurance: 9.09% | | | | | | | | | | | | |
Axis Capital Holdings Limited | | | | | | | 33,700 | | | | 1,686,685 | |
FNF Group | | | | | | | 233,900 | | | | 7,578,360 | |
RenaissanceRe Holdings Limited | | | | | | | 79,200 | | | | 7,755,264 | |
The Progressive Corporation | | | | | | | 333,600 | | | | 9,087,264 | |
Willis Group Holdings plc | | | | | | | 108,500 | | | | 4,634,035 | |
| | | | |
| | | | | | | | | | | 30,741,608 | |
| | | | | | | | | | | | |
| | | | |
Health Care: 13.79% | | | | | | | | | | | | |
| | | | |
| Health Care Equipment & Supplies: 4.49% | | | | | | | | | | | | |
Baxter International Incorporated | | | | | | | 98,900 | | | | 7,219,700 | |
Becton Dickinson & Company | | | | | | | 56,700 | | | | 7,956,711 | |
| | | | |
| | | | | | | | | | | 15,176,411 | |
| | | | | | | | | | | | |
| | | | |
| Health Care Providers & Services: 6.76% | | | | | | | | | | | | |
Cardinal Health Incorporated | | | | | | | 81,300 | | | | 6,682,047 | |
Laboratory Corporation of America Holdings † | | | | | | | 84,300 | | | | 8,821,152 | |
UnitedHealth Group Incorporated | | | | | | | 74,700 | | | | 7,367,661 | |
| | | | |
| | | | | | | | | | | 22,870,860 | |
| | | | | | | | | | | | |
| | | | |
| Pharmaceuticals: 2.54% | | | | | | | | | | | | |
Johnson & Johnson | | | | | | | 79,400 | | | | 8,595,050 | |
| | | | | | | | | | | | |
| | | | |
Industrials: 9.45% | | | | | | | | | | | | |
| | | | |
| Air Freight & Logistics: 2.68% | | | | | | | | | | | | |
United Parcel Service Incorporated Class B | | | | | | | 82,600 | | | | 9,079,392 | |
| | | | | | | | | | | | |
| | | | |
| Electrical Equipment: 1.09% | | | | | | | | | | | | |
Eaton Corporation plc | | | | | | | 54,100 | | | | 3,669,603 | |
| | | | | | | | | | | | |
| | | | |
| Industrial Conglomerates: 2.52% | | | | | | | | | | | | |
3M Company | | | | | | | 53,200 | | | | 8,516,788 | |
| | | | | | | | | | | | |
| | | | |
| Machinery: 3.16% | | | | | | | | | | | | |
Illinois Tool Works Incorporated | | | | | | | 28,000 | | | | 2,658,040 | |
Parker Hannifin Corporation | | | | | | | 62,200 | | | | 8,025,666 | |
| | | | |
| | | | | | | | | | | 10,683,706 | |
| | | | | | | | | | | | |
| | | | |
Information Technology: 6.64% | | | | | | | | | | | | |
| | | | |
| Communications Equipment: 2.09% | | | | | | | | | | | | |
QUALCOMM Incorporated | | | | | | | 97,000 | | | | 7,071,300 | |
| | | | | | | | | | | | |
The accompanying notes are an integral part of these financial statements.
| | | | |
| 60 | | Wells Fargo Advantage Equity Gateway Funds | | Portfolio of investments—November 30, 2014 (unaudited) |
C&B LARGE CAP VALUE PORTFOLIO
| | | | | | | | | | | | | | | | |
| Security name | | | | | | | | | Shares | | | Value | |
| | | | | |
| IT Services: 4.55% | | | | | | | | | | | | | | | | |
Fiserv Incorporated † | | | | | | | | | | | 99,700 | | | $ | 7,127,553 | |
The Western Union Company | | | | | | | | | | | 444,000 | | | | 8,249,520 | |
| | | | | |
| | | | | | | | | | | | | | | 15,377,073 | |
| | | | | | | | | | | | | | | | |
| | | | | |
Materials: 5.85% | | | | | | | | | | | | | | | | |
| | | | | |
| Containers & Packaging: 5.85% | | | | | | | | | | | | | | | | |
Ball Corporation | | | | | | | | | | | 69,500 | | | | 4,661,365 | |
Crown Holdings Incorporated † | | | | | | | | | | | 222,800 | | | | 11,028,600 | |
Rock-Tenn Company Class A | | | | | | | | | | | 71,900 | | | | 4,084,639 | |
| | | | | |
| | | | | | | | | | | | | | | 19,774,604 | |
| | | | | | | | | | | | | | | | |
| | | | | |
Total Common Stocks (Cost $214,789,569) | | | | | | | | | | | | | | | 309,456,735 | |
| | | | | | | | | | | | | | | | |
| | | | | |
| | | Dividend yield | | | | | | | | | | | |
| | | | | |
Preferred Stocks: 0.45% | | | | | | | | | | | | | | | | |
| | | | | |
Consumer Staples: 0.45% | | | | | | | | | | | | | | | | |
| | | | | |
| Household Products: 0.45% | | | | | | | | | | | | | | | | |
Henkel AG & Company KGaA ADR ± | | | 1.51 | % | | | | | | | 13,600 | | | | 1,507,315 | |
| | | | | | | | | | | | | | | | |
| | | | | |
Total Preferred Stocks (Cost $597,017) | | | | | | | | | | | | | | | 1,507,315 | |
| | | | | | | | | | | | | | | | |
| | | | | |
| | | Yield | | | | | | | | | | | |
| | | | | |
Short-Term Investments: 7.34% | | | | | | | | | | | | | | | | |
| | | | | |
| Investment Companies: 7.34% | | | | | | | | | | | | | | | | |
Wells Fargo Advantage Cash Investment Money Market Fund, Select Class (l)(u) | | | 0.08 | | | | | | | | 24,831,887 | | | | 24,831,887 | |
| | | | | | | | | | | | | | | | |
| | | | | |
Total Short-Term Investments (Cost $24,831,887) | | | | | | | | | | | | | | | 24,831,887 | |
| | | | | | | | | | | | | | | | |
| | | | | | | | |
| Total investments in securities (Cost $240,218,473) * | | | 99.30 | % | | | 335,795,937 | |
Other assets and liabilities, net | | | 0.70 | | | | 2,369,039 | |
| | | | | | | | |
| Total net assets | | | 100.00 | % | | $ | 338,164,976 | |
| | | | | | | | |
| † | Non-income-earning security |
| ± | Variable rate investment. The rate shown is the rate in effect at period end. |
| (l) | The security represents an affiliate of the Portfolio as defined in the Investment Company Act of 1940. |
| (u) | The rate represents the 7-day annualized yield at period end. |
| * | Cost for federal income tax purposes is $249,058,432 and unrealized gains (losses) consists of: |
| | | | |
Gross unrealized gains | | $ | 96,955,131 | |
Gross unrealized losses | | | (10,217,626 | ) |
| | | | |
Net unrealized gains | | $ | 86,737,505 | |
The accompanying notes are an integral part of these financial statements.
| | | | | | |
| Portfolio of investments—November 30, 2014 (unaudited) | | Wells Fargo Advantage Equity Gateway Funds | | | 61 | |
DIVERSIFIED LARGE CAP GROWTH PORTFOLIO
| | | | | | | | | | | | |
| Security name | | | | | | Shares | | | Value | |
| | | | |
Common Stocks: 99.14% | | | | | | | | | | | | |
| | | | |
Consumer Discretionary: 25.59% | | | | | | | | | | | | |
| | | | |
| Auto Components: 1.17% | | | | | | | | | | | | |
BorgWarner Incorporated | | | | | | | 2,560 | | | $ | 144,794 | |
Delphi Automotive plc | | | | | | | 19,530 | | | | 1,424,714 | |
| | | | |
| | | | | | | | | | | 1,569,508 | |
| | | | | | | | | | | | |
| | | | |
| Distributors: 0.52% | | | | | | | | | | | | |
LKQ Corporation † | | | | | | | 23,900 | | | | 694,295 | |
| | | | | | | | | | | | |
| | | | |
| Hotels, Restaurants & Leisure: 4.78% | | | | | | | | | | | | |
Chipotle Mexican Grill Incorporated † | | | | | | | 3,130 | | | | 2,077,131 | |
Hilton Worldwide Holdings Incorporated † | | | | | | | 7,368 | | | | 193,189 | |
Las Vegas Sands Corporation | | | | | | | 13,660 | | | | 870,005 | |
Marriott International Incorporated Class A | | | | | | | 8,700 | | | | 685,473 | |
Starbucks Corporation | | | | | | | 21,214 | | | | 1,722,789 | |
Wynn Resorts Limited | | | | | | | 4,860 | | | | 868,045 | |
| | | | |
| | | | | | | | | | | 6,416,632 | |
| | | | | | | | | | | | |
| | | | |
| Internet & Catalog Retail: 2.92% | | | | | | | | | | | | |
Amazon.com Incorporated † | | | | | | | 7,460 | | | | 2,526,254 | |
Netflix Incorporated † | | | | | | | 280 | | | | 97,045 | |
The Priceline Group Incorporated † | | | | | | | 1,120 | | | | 1,299,413 | |
| | | | |
| | | | | | | | | | | 3,922,712 | |
| | | | | | | | | | | | |
| | | | |
| Media: 5.94% | | | | | | | | | | | | |
CBS Corporation Class B | | | | | | | 14,780 | | | | 811,126 | |
Comcast Corporation Class A | | | | | | | 36,450 | | | | 2,079,108 | |
Liberty Global plc Class C † | | | | | | | 31,320 | | | | 1,563,494 | |
The Walt Disney Company | | | | | | | 15,900 | | | | 1,470,909 | |
Time Warner Incorporated | | | | | | | 10,610 | | | | 903,123 | |
Twenty-First Century Fox Incorporated | | | | | | | 31,320 | | | | 1,152,576 | |
| | | | |
| | | | | | | | | | | 7,980,336 | |
| | | | | | | | | | | | |
| | | | |
| Multiline Retail: 2.08% | | | | | | | | | | | | |
Dollar Tree Incorporated † | | | | | | | 31,610 | | | | 2,160,860 | |
Nordstrom Incorporated | | | | | | | 8,340 | | | | 636,842 | |
| | | | |
| | | | | | | | | | | 2,797,702 | |
| | | | | | | | | | | | |
| | | | |
| Specialty Retail: 4.53% | | | | | | | | | | | | |
Cabela’s Incorporated †« | | | | | | | 3,680 | | | | 199,603 | |
CarMax Incorporated † | | | | | | | 30,120 | | | | 1,716,238 | |
O’Reilly Automotive Incorporated † | | | | | | | 4,590 | | | | 838,777 | |
TJX Companies Incorporated | | | | | | | 26,500 | | | | 1,753,240 | |
Tractor Supply Company | | | | | | | 20,440 | | | | 1,572,449 | |
| | | | |
| | | | | | | | | | | 6,080,307 | |
| | | | | | | | | | | | |
The accompanying notes are an integral part of these financial statements.
| | | | |
| 62 | | Wells Fargo Advantage Equity Gateway Funds | | Portfolio of investments—November 30, 2014 (unaudited) |
DIVERSIFIED LARGE CAP GROWTH PORTFOLIO
| | | | | | | | | | | | |
| Security name | | | | | | Shares | | | Value | |
| | | | |
| Textiles, Apparel & Luxury Goods: 3.65% | | | | | | | | | | | | |
Nike Incorporated Class B | | | | | | | 25,020 | | | $ | 2,484,236 | |
Under Armour Incorporated Class A † | | | | | | | 19,520 | | | | 1,415,005 | |
VF Corporation | | | | | | | 13,420 | | | | 1,008,781 | |
| | | | |
| | | | | | | | | | | 4,908,022 | |
| | | | | | | | | | | | |
| | | | |
Consumer Staples: 3.93% | | | | | | | | | | | | |
| | | | |
| Beverages: 0.95% | | | | | | | | | | | | |
Constellation Brands Incorporated Class A † | | | | | | | 10,240 | | | | 987,136 | |
The Coca-Cola Company | | | | | | | 6,650 | | | | 298,120 | |
| | | | |
| | | | | | | | | | | 1,285,256 | |
| | | | | | | | | | | | |
| | | | |
| Food & Staples Retailing: 1.93% | | | | | | | | | | | | |
Costco Wholesale Corporation | | | | | | | 11,450 | | | | 1,627,274 | |
CVS Health Corporation | | | | | | | 4,200 | | | | 383,712 | |
Sprouts Farmers Market Incorporated † | | | | | | | 15,228 | | | | 484,098 | |
Walgreen Company | | | | | | | 1,370 | | | | 93,996 | |
| | | | |
| | | | | | | | | | | 2,589,080 | |
| | | | | | | | | | | | |
| | | | |
| Household Products: 0.42% | | | | | | | | | | | | |
Colgate-Palmolive Company | | | | | | | 8,180 | | | | 569,246 | |
| | | | | | | | | | | | |
| | | | |
| Personal Products: 0.63% | | | | | | | | | | | | |
Estee Lauder Companies Incorporated Class A | | | | | | | 11,370 | | | | 842,972 | |
| | | | | | | | | | | | |
| | | | |
Energy: 4.39% | | | | | | | | | | | | |
| | | | |
| Energy Equipment & Services: 1.10% | | | | | | | | | | | | |
Halliburton Company | | | | | | | 14,080 | | | | 594,176 | |
Schlumberger Limited | | | | | | | 10,280 | | | | 883,566 | |
| | | | |
| | | | | | | | | | | 1,477,742 | |
| | | | | | | | | | | | |
| | | | |
| Oil, Gas & Consumable Fuels: 3.29% | | | | | | | | | | | | |
Antero Resources Corporation † | | | | | | | 13,592 | | | | 637,737 | |
Concho Resources Incorporated † | | | | | | | 14,460 | | | | 1,377,315 | |
Continental Resources Incorporated †« | | | | | | | 2,250 | | | | 92,205 | |
EOG Resources Incorporated | | | | | | | 4,830 | | | | 418,858 | |
Memorial Resource Development Corporation † | | | | | | | 5,877 | | | | 126,943 | |
Pioneer Natural Resources Company | | | | | | | 11,610 | | | | 1,662,900 | |
Whiting Petroleum Corporation † | | | | | | | 2,500 | | | | 104,425 | |
| | | | |
| | | | | | | | | | | 4,420,383 | |
| | | | | | | | | | | | |
| | | | |
Financials: 6.32% | | | | | | | | | | | | |
| | | | |
| Capital Markets: 2.71% | | | | | | | | | | | | |
Affiliated Managers Group Incorporated † | | | | | | | 4,660 | | | | 948,729 | |
Ameriprise Financial Incorporated | | | | | | | 5,890 | | | | 776,125 | |
Northern Trust Corporation | | | | | | | 4,410 | | | | 298,689 | |
TD Ameritrade Holding Corporation | | | | | | | 46,710 | | | | 1,616,633 | |
| | | | |
| | | | | | | | | | | 3,640,176 | |
| | | | | | | | | | | | |
The accompanying notes are an integral part of these financial statements.
| | | | | | |
| Portfolio of investments—November 30, 2014 (unaudited) | | Wells Fargo Advantage Equity Gateway Funds | | | 63 | |
DIVERSIFIED LARGE CAP GROWTH PORTFOLIO
| | | | | | | | | | | | |
| Security name | | | | | | Shares | | | Value | |
| | | | |
| Consumer Finance: 2.11% | | | | | | | | | | | | |
American Express Company | | | | | | | 16,470 | | | $ | 1,522,157 | |
Discover Financial Services | | | | | | | 20,110 | | | | 1,318,211 | |
| | | | |
| | | | | | | | | | | 2,840,368 | |
| | | | | | | | | | | | |
| | | | |
| Diversified Financial Services: 1.05% | | | | | | | | | | | | |
IntercontinentalExchange Group Incorporated | | | | | | | 6,220 | | | | 1,405,658 | |
| | | | | | | | | | | | |
| | | | |
| REITs: 0.45% | | | | | | | | | | | | |
American Tower Corporation | | | | | | | 5,770 | | | | 605,908 | |
| | | | | | | | | | | | |
| | | | |
Health Care: 15.83% | | | | | | | | | | | | |
| | | | |
| Biotechnology: 8.39% | | | | | | | | | | | | |
Alexion Pharmaceuticals Incorporated † | | | | | | | 13,850 | | | | 2,699,365 | |
Biogen Idec Incorporated † | | | | | | | 8,310 | | | | 2,556,904 | |
BioMarin Pharmaceutical Incorporated † | | | | | | | 2,030 | | | | 182,132 | |
Celgene Corporation † | | | | | | | 23,560 | | | | 2,678,536 | |
Gilead Sciences Incorporated † | | | | | | | 13,230 | | | | 1,327,234 | |
Medivation Incorporated † | | | | | | | 2,610 | | | | 302,473 | |
Regeneron Pharmaceuticals Incorporated † | | | | | | | 3,660 | | | | 1,522,963 | |
| | | | |
| | | | | | | | | | | 11,269,607 | |
| | | | | | | | | | | | |
| | | | |
| Health Care Equipment & Supplies: 0.89% | | | | | | | | | | | | |
Covidien plc | | | | | | | 11,820 | | | | 1,193,820 | |
| | | | | | | | | | | | |
| | | | |
| Health Care Providers & Services: 1.92% | | | | | | | | | | | | |
AmerisourceBergen Corporation | | | | | | | 11,463 | | | | 1,043,706 | |
Envision Healthcare Holdings Incorporated † | | | | | | | 7,057 | | | | 249,536 | |
McKesson Corporation | | | | | | | 6,110 | | | | 1,287,744 | |
| | | | |
| | | | | | | | | | | 2,580,986 | |
| | | | | | | | | | | | |
| | | | |
| Health Care Technology: 1.04% | | | | | | | | | | | | |
Cerner Corporation † | | | | | | | 21,690 | | | | 1,396,836 | |
| | | | | | | | | | | | |
| | | | |
| Life Sciences Tools & Services: 0.52% | | | | | | | | | | | | |
Mettler-Toledo International Incorporated † | | | | | | | 1,570 | | | | 460,418 | |
Quintiles Transnational Holdings Incorporated † | | | | | | | 4,054 | | | | 234,402 | |
| | | | |
| | | | | | | | | | | 694,820 | |
| | | | | | | | | | | | |
| | | | |
| Pharmaceuticals: 3.07% | | | | | | | | | | | | |
AbbVie Incorporated | | | | | | | 18,060 | | | | 1,249,752 | |
Jazz Pharmaceuticals plc † | | | | | | | 360 | | | | 63,752 | |
Merck & Company Incorporated | | | | | | | 9,070 | | | | 547,828 | |
Perrigo Company plc | | | | | | | 14,150 | | | | 2,266,688 | |
| | | | |
| | | | | | | | | | | 4,128,020 | |
| | | | | | | | | | | | |
The accompanying notes are an integral part of these financial statements.
| | | | |
| 64 | | Wells Fargo Advantage Equity Gateway Funds | | Portfolio of investments—November 30, 2014 (unaudited) |
DIVERSIFIED LARGE CAP GROWTH PORTFOLIO
| | | | | | | | | | | | |
| Security name | | | | | | Shares | | | Value | |
| | | | |
Industrials: 11.17% | | | | | | | | | | | | |
| | | | |
| Aerospace & Defense: 1.39% | | | | | | | | | | | | |
Precision Castparts Corporation | | | | | | | 2,370 | | | $ | 563,823 | |
The Boeing Company | | | | | | | 4,630 | | | | 622,087 | |
United Technologies Corporation | | | | | | | 6,170 | | | | 679,194 | |
| | | | |
| | | | | | | | | | | 1,865,104 | |
| | | | | | | | | | | | |
| | | | |
| Air Freight & Logistics: 0.81% | | | | | | | | | | | | |
United Parcel Service Incorporated Class B | | | | | | | 9,900 | | | | 1,088,208 | |
| | | | | | | | | | | | |
| | | | |
| Airlines: 1.16% | | | | | | | | | | | | |
Delta Air Lines Incorporated | | | | | | | 18,630 | | | | 869,462 | |
Southwest Airlines Company | | | | | | | 16,440 | | | | 687,521 | |
| | | | |
| | | | | | | | | | | 1,556,983 | |
| | | | | | | | | | | | |
| | | | |
| Commercial Services & Supplies: 0.35% | | | | | | | | | | | | |
Tyco International plc | | | | | | | 10,900 | | | | 467,610 | |
| | | | | | | | | | | | |
| | | | |
| Electrical Equipment: 0.25% | | | | | | | | | | | | |
Rockwell Automation Incorporated | | | | | | | 2,920 | | | | 336,997 | |
| | | | | | | | | | | | |
| | | | |
| Industrial Conglomerates: 0.90% | | | | | | | | | | | | |
3M Company | | | | | | | 3,220 | | | | 515,490 | |
Danaher Corporation | | | | | | | 8,280 | | | | 691,877 | |
| | | | |
| | | | | | | | | | | 1,207,367 | |
| | | | | | | | | | | | |
| | | | |
| Machinery: 1.03% | | | | | | | | | | | | |
Cummins Incorporated | | | | | | | 6,416 | | | | 934,298 | |
Flowserve Corporation | | | | | | | 4,110 | | | | 241,956 | |
Pentair plc | | | | | | | 3,220 | | | | 208,366 | |
| | | | |
| | | | | | | | | | | 1,384,620 | |
| | | | | | | | | | | | |
| | | | |
| Road & Rail: 4.61% | | | | | | | | | | | | |
Canadian Pacific Railway Limited | | | | | | | 4,540 | | | | 876,946 | |
CSX Corporation | | | | | | | 16,990 | | | | 619,965 | |
Genesee & Wyoming Incorporated Class A † | | | | | | | 3,330 | | | | 328,305 | |
Kansas City Southern | | | | | | | 6,890 | | | | 819,497 | |
Norfolk Southern Corporation | | | | | | | 10,510 | | �� | | 1,173,336 | |
Union Pacific Corporation | | | | | | | 20,390 | | | | 2,380,940 | |
| | | | |
| | | | | | | | | | | 6,198,989 | |
| | | | | | | | | | | | |
| | | | |
| Trading Companies & Distributors: 0.67% | | | | | | | | | | | | |
W.W. Grainger Incorporated | | | | | | | 3,650 | | | | 896,732 | |
| | | | | | | | | | | | |
| | | | |
Information Technology: 27.66% | | | | | | | | | | | | |
| | | | |
| Communications Equipment: 1.81% | | | | | | | | | | | | |
Cisco Systems Incorporated | | | | | | | 12,120 | | | | 334,997 | |
F5 Networks Incorporated † | | | | | | | 2,500 | | | | 322,975 | |
Palo Alto Networks Incorporated † | | | | | | | 5,772 | | | | 709,956 | |
QUALCOMM Incorporated | | | | | | | 14,541 | | | | 1,060,039 | |
| | | | |
| | | | | | | | | | | 2,427,967 | |
| | | | | | | | | | | | |
The accompanying notes are an integral part of these financial statements.
| | | | | | |
| Portfolio of investments—November 30, 2014 (unaudited) | | Wells Fargo Advantage Equity Gateway Funds | | | 65 | |
DIVERSIFIED LARGE CAP GROWTH PORTFOLIO
| | | | | | | | | | | | |
| Security name | | | | | | Shares | | | Value | |
| | | | |
| Electronic Equipment, Instruments & Components: 0.72% | | | | | | | | | | | | |
TE Connectivity Limited | | | | | | | 15,040 | | | $ | 965,568 | |
| | | | | | | | | | | | |
| | | | |
| Internet Software & Services: 8.36% | | | | | | | | | | | | |
Akamai Technologies Incorporated † | | | | | | | 14,560 | | | | 940,722 | |
Alibaba Group Holding Limited ADR † | | | | | | | 3,770 | | | | 420,883 | |
Facebook Incorporated Class A † | | | | | | | 51,660 | | | | 4,013,982 | |
Google Incorporated Class A † | | | | | | | 4,644 | | | | 2,549,928 | |
Google Incorporated Class C † | | | | | | | 5,014 | | | | 2,716,736 | |
Pandora Media Incorporated † | | | | | | | 26,150 | | | | 514,109 | |
Twitter Incorporated † | | | | | | | 1,750 | | | | 73,045 | |
| | | | |
| | | | | | | | | | | 11,229,405 | |
| | | | | | | | | | | | |
| | | | |
| IT Services: 5.34% | | | | | | | | | | | | |
Accenture plc | | | | | | | 9,420 | | | | 813,229 | |
Alliance Data Systems Corporation † | | | | | | | 5,170 | | | | 1,477,948 | |
MasterCard Incorporated Class A | | | | | | | 22,600 | | | | 1,972,754 | |
Visa Incorporated Class A | | | | | | | 11,260 | | | | 2,907,219 | |
| | | | |
| | | | | | | | | | | 7,171,150 | |
| | | | | | | | | | | | |
| | | | |
| Semiconductors & Semiconductor Equipment: 3.07% | | | | | | | | | | | | |
ARM Holdings plc ADR | | | | | | | 14,120 | | | | 604,901 | |
Microchip Technology Incorporated « | | | | | | | 34,870 | | | | 1,574,381 | |
Micron Technology Incorporated † | | | | | | | 32,950 | | | | 1,184,553 | |
Texas Instruments Incorporated | | | | | | | 14,110 | | | | 767,866 | |
| | | | |
| | | | | | | | | | | 4,131,701 | |
| | | | | | | | | | | | |
| | | | |
| Software: 4.09% | | | | | | | | | | | | |
Adobe Systems Incorporated † | | | | | | | 8,430 | | | | 621,122 | |
Microsoft Corporation | | | | | | | 19,150 | | | | 915,562 | |
Salesforce.com Incorporated † | | | | | | | 34,114 | | | | 2,042,405 | |
ServiceNow Incorporated † | | | | | | | 21,000 | | | | 1,343,160 | |
Splunk Incorporated † | | | | | | | 6,460 | | | | 433,466 | |
Tableau Software Incorporated Class A † | | | | | | | 1,650 | | | | 138,402 | |
| | | | |
| | | | | | | | | | | 5,494,117 | |
| | | | | | | | | | | | |
| | | | |
| Technology Hardware, Storage & Peripherals: 4.27% | | | | | | | | | | | | |
Apple Incorporated | | | | | | | 41,207 | | | | 4,900,749 | |
Western Digital Corporation | | | | | | | 8,120 | | | | 838,552 | |
| | | | |
| | | | | | | | | | | 5,739,301 | |
| | | | | | | | | | | | |
| | | | |
Materials: 3.13% | | | | | | | | | | | | |
| | | | |
| Chemicals: 3.13% | | | | | | | | | | | | |
Airgas Incorporated | | | | | | | 1,480 | | | | 171,132 | |
Ecolab Incorporated | | | | | | | 6,230 | | | | 678,754 | |
Monsanto Company | | | | | | | 13,740 | | | | 1,647,563 | |
Praxair Incorporated | | | | | | | 13,270 | | | | 1,703,603 | |
| | | | |
| | | | | | | | | | | 4,201,052 | |
| | | | | | | | | | | | |
The accompanying notes are an integral part of these financial statements.
| | | | |
| 66 | | Wells Fargo Advantage Equity Gateway Funds | | Portfolio of investments—November 30, 2014 (unaudited) |
DIVERSIFIED LARGE CAP GROWTH PORTFOLIO
| | | | | | | | | | | | | | | | |
| Security name | | | | | | | | | Shares | | | Value | |
| | | | | |
Telecommunication Services: 1.12% | | | | | | | | | | | | | | | | |
| | | | | |
| Wireless Telecommunication Services: 1.12% | | | | | | | | | | | | | | | | |
SBA Communications Corporation Class A † | | | | | | | | | | | 12,333 | | | $ | 1,500,556 | |
| | | | | | | | | | | | | | | | |
| | | | | |
Total Common Stocks (Cost $87,975,922) | | | | | | | | | | | | | | | 133,173,819 | |
| | | | | | | | | | | | | | | | |
| | | | | |
| | | Yield | | | | | | | | | | | |
| | | | | |
Short-Term Investments: 2.42% | | | | | | | | | | | | | | | | |
| | | | | |
| Investment Companies: 2.42% | | | | | | | | | | | | | | | | |
Securities Lending Cash Investments, LLC (r)(l)(u) | | | 0.12 | % | | | | | | | 1,815,925 | | | | 1,815,925 | |
Wells Fargo Advantage Cash Investment Money Market Fund, Select Class (l)(u) | | | 0.08 | | | | | | | | 1,435,598 | | | | 1,435,598 | |
| | | | | |
Total Short-Term Investments (Cost $3,251,523) | | | | | | | | | | | | | | | 3,251,523 | |
| | | | | | | | | | | | | | | | |
| | | | | | | | |
| Total investments in securities (Cost $91,227,445) * | | | 101.56 | % | | | 136,425,342 | |
Other assets and liabilities, net | | | (1.56 | ) | | | (2,099,469 | ) |
| | | | | | | | |
| Total net assets | | | 100.00 | % | | $ | 134,325,873 | |
| | | | | | | | |
| † | Non-income-earning security |
| « | All or a portion of this security is on loan. |
| (r) | The investment is a non-registered investment vehicle purchased with cash collateral received from securities on loan. |
| (l) | The security represents an affiliate of the Portfolio as defined in the Investment Company Act of 1940. |
| (u) | The rate represents the 7-day annualized yield at period end. |
| * | Cost for federal income tax purposes is $91,565,195 and unrealized gains (losses) consists of: |
| | | | |
Gross unrealized gains | | $ | 46,274,226 | |
Gross unrealized losses | | | (1,414,079 | ) |
| | | | |
Net unrealized gains | | $ | 44,860,147 | |
The accompanying notes are an integral part of these financial statements.
| | | | | | |
| Portfolio of investments—November 30, 2014 (unaudited) | | Wells Fargo Advantage Equity Gateway Funds | | | 67 | |
EMERGING GROWTH PORTFOLIO
| | | | | | | | | | | | |
| Security name | | | | | | Shares | | | Value | |
| | | | |
Common Stocks: 99.54% | | | | | | | | | | | | |
| | | | |
Consumer Discretionary: 12.72% | | | | | | | | | | | | |
| | | | |
| Auto Components: 2.66% | | | | | | | | | | | | |
Gentherm Incorporated † | | | | | | | 534,700 | | | $ | 20,152,843 | |
Motorcar Parts of America Incorporated † | | | | | | | 285,572 | | | | 9,638,055 | |
| | | | |
| | | | | | | | | | | 29,790,898 | |
| | | | | | | | | | | | |
| | | | |
| Diversified Consumer Services: 2.00% | | | | | | | | | | | | |
Grand Canyon Education Incorporated † | | | | | | | 385,600 | | | | 17,610,352 | |
LifeLock Incorporated † | | | | | | | 289,700 | | | | 4,782,947 | |
| | | | |
| | | | | | | | | | | 22,393,299 | |
| | | | | | | | | | | | |
| | | | |
| Hotels, Restaurants & Leisure: 3.79% | | | | | | | | | | | | |
Fiesta Restaurant Group Incorporated † | | | | | | | 464,155 | | | | 26,020,529 | |
Jack In the Box Incorporated | | | | | | | 63,000 | | | | 4,693,500 | |
The Habit Restaurants Incorporated Class A † | | | | | | | 105,453 | | | | 3,418,786 | |
Zoe’s Kitchen Incorporated «† | | | | | | | 262,630 | | | | 8,306,987 | |
| | | | |
| | | | | | | | | | | 42,439,802 | |
| | | | | | | | | | | | |
| | | | |
| Internet & Catalog Retail: 0.15% | | | | | | | | | | | | |
RetailMeNot Incorporated Ǡ | | | | | | | 116,307 | | | | 1,712,621 | |
| | | | | | | | | | | | |
| | | | |
| Media: 1.10% | | | | | | | | | | | | |
IMAX Corporation † | | | | | | | 391,510 | | | | 12,285,584 | |
| | | | | | | | | | | | |
| | | | |
| Specialty Retail: 1.67% | | | | | | | | | | | | |
Boot Barn Holdings Incorporated † | | | | | | | 176,379 | | | | 3,809,786 | |
Five Below Incorporated Ǡ | | | | | | | 320,697 | | | | 14,963,722 | |
| | | | |
| | | | | | | | | | | 18,773,508 | |
| | | | | | | | | | | | |
| | | | |
| Textiles, Apparel & Luxury Goods: 1.35% | | | | | | | | | | | | |
G-III Apparel Group Limited † | | | | | | | 170,600 | | | | 15,096,394 | |
| | | | | | | | | | | | |
| | | | |
Consumer Staples: 1.47% | | | | | | | | | | | | |
| | | | |
| Food & Staples Retailing: 1.47% | | | | | | | | | | | | |
Diplomat Pharmacy Incorporated † | | | | | | | 137,726 | | | | 3,699,320 | |
United Natural Foods Incorporated † | | | | | | | 170,240 | | | | 12,800,346 | |
| | | | |
| | | | | | | | | | | 16,499,666 | |
| | | | | | | | | | | | |
| | | | |
Energy: 2.90% | | | | | | | | | | | | |
| | | | |
| Energy Equipment & Services: 0.05% | | | | | | | | | | | | |
RigNet Incorporated † | | | | | | | 12,800 | | | | 524,160 | |
| | | | | | | | | | | | |
| | | | |
| Oil, Gas & Consumable Fuels: 2.85% | | | | | | | | | | | | |
Bonanza Creek Energy Incorporated † | | | | | | | 172,500 | | | | 4,695,450 | |
Diamondback Energy Incorporated † | | | | | | | 154,957 | | | | 8,739,575 | |
Oasis Petroleum Incorporated † | | | | | | | 173,600 | | | | 3,190,768 | |
Parsley Energy Incorporated Class A † | | | | | | | 462,048 | | | | 5,840,287 | |
RSP Permian Incorporated Ǡ | | | | | | | 437,788 | | | | 9,526,267 | |
| | | | |
| | | | | | | | | | | 31,992,347 | |
| | | | | | | | | | | | |
The accompanying notes are an integral part of these financial statements.
| | | | |
| 68 | | Wells Fargo Advantage Equity Gateway Funds | | Portfolio of investments—November 30, 2014 (unaudited) |
EMERGING GROWTH PORTFOLIO
| | | | | | | | | | | | |
| Security name | | | | | | Shares | | | Value | |
| | | | |
Financials: 7.71% | | | | | | | | | | | | |
| | | | |
| Capital Markets: 1.60% | | | | | | | | | | | | |
Financial Engines Incorporated « | | | | | | | 547,630 | | | $ | 17,896,548 | |
| | | | | | | | | | | | |
| | | | |
| Consumer Finance: 2.87% | | | | | | | | | | | | |
Encore Capital Group Incorporated Ǡ | | | | | | | 149,600 | | | | 6,419,336 | |
PRA Group Incorporated † | | | | | | | 439,800 | | | | 25,737,096 | |
| | | | |
| | | | | | | | | | | 32,156,432 | |
| | | | | | | | | | | | |
| | | | |
| Diversified Financial Services: 3.24% | | | | | | | | | | | | |
MarketAxess Holdings Incorporated | | | | | | | 552,671 | | | | 36,238,637 | |
| | | | | | | | | | | | |
| | | | |
Health Care: 31.09% | | | | | | | | | | | | |
| | | | |
| Biotechnology: 3.36% | | | | | | | | | | | | |
Exact Sciences Corporation Ǡ | | | | | | | 177,453 | | | | 4,404,383 | |
Hyperion Therapeutics Incorporated † | | | | | | | 239,823 | | | | 4,913,973 | |
Ligand Pharmaceuticals Incorporated † | | | | | | | 65,100 | | | | 3,505,635 | |
NPS Pharmaceuticals Incorporated † | | | | | | | 434,100 | | | | 14,403,438 | |
PTC Therapeutics Incorporated † | | | | | | | 207,700 | | | | 9,294,575 | |
Repligen Corporation † | | | | | | | 48,600 | | | | 1,111,482 | |
| | | | |
| | | | | | | | | | | 37,633,486 | |
| | | | | | | | | | | | |
| | | | |
| Health Care Equipment & Supplies: 10.59% | | | | | | | | | | | | |
Align Technology Incorporated † | | | | | | | 94,200 | | | | 5,359,980 | |
Cardiovascular Systems Incorporated † | | | | | | | 584,558 | | | | 17,922,548 | |
Cynosure Incorporated Class A † | | | | | | | 616,678 | | | | 17,001,812 | |
DexCom Incorporated † | | | | | | | 439,900 | | | | 22,637,254 | |
Endologix Incorporated † | | | | | | | 618,094 | | | | 7,930,146 | |
Insulet Corporation † | | | | | | | 164,300 | | | | 7,654,737 | |
NxStage Medical Incorporated † | | | | | | | 372,460 | | | | 6,436,109 | |
Oxford Immunotec Global plc † | | | | | | | 264,771 | | | | 3,463,205 | |
Spectranetics Corporation Ǡ | | | | | | | 773,614 | | | | 25,397,748 | |
Tandem Diabetes Care Incorporated Ǡ | | | | | | | 337,737 | | | | 4,772,224 | |
| | | | |
| | | | | | | | | | | 118,575,763 | |
| | | | | | | | | | | | |
| | | | |
| Health Care Providers & Services: 9.84% | | | | | | | | | | | | |
AAC Holdings Incorporated Ǡ | | | | | | | 229,581 | | | | 6,625,708 | |
Acadia Healthcare Company Incorporated † | | | | | | | 588,960 | | | | 36,521,409 | |
Adeptus Health Incorporated Class A † | | | | | | | 231,601 | | | | 7,049,934 | |
ExamWorks Group Incorporated † | | | | | | | 697,028 | | | | 27,428,052 | |
HealthEquity Incorporated † | | | | | | | 217,602 | | | | 5,403,058 | |
MWI Veterinary Supply Incorporated † | | | | | | | 98,300 | | | | 16,064,186 | |
Team Health Holdings Incorporated † | | | | | | | 195,300 | | | | 11,163,348 | |
| | | | |
| | | | | | | | | | | 110,255,695 | |
| | | | | | | | | | | | |
| | | | |
| Health Care Technology: 0.95% | | | | | | | | | | | | |
Medidata Solutions Incorporated † | | | | | | | 248,400 | | | | 10,609,164 | |
| | | | | | | | | | | | |
The accompanying notes are an integral part of these financial statements.
| | | | | | |
| Portfolio of investments—November 30, 2014 (unaudited) | | Wells Fargo Advantage Equity Gateway Funds | | | 69 | |
EMERGING GROWTH PORTFOLIO
| | | | | | | | | | | | |
| Security name | | | | | | Shares | | | Value | |
| | | | |
| Life Sciences Tools & Services: 1.22% | | | | | | | | | | | | |
ICON plc ADR † | | | | | | | 187,800 | | | $ | 10,430,412 | |
INC Research Holdings Incorporated Class A † | | | | | | | 132,129 | | | | 3,222,626 | |
| | | | |
| | | | | | | | | | | 13,653,038 | |
| | | | | | | | | | | | |
| | | | |
| Pharmaceuticals: 5.13% | | | | | | | | | | | | |
Akorn Incorporated Ǡ | | | | | | | 841,434 | | | | 33,716,260 | |
ANI Pharmaceuticals Incorporated † | | | | | | | 200,200 | | | | 10,832,822 | |
BioDelivery Sciences International Incorporated † | | | | | | | 427,600 | | | | 6,563,660 | |
Intersect ENT Incorporated † | | | | | | | 309,475 | | | | 5,353,918 | |
Lannett Company Incorporated † | | | | | | | 20,969 | | | | 1,030,207 | |
| | | | |
| | | | | | | | | | | 57,496,867 | |
| | | | | | | | | | | | |
| | | | |
Industrials: 10.59% | | | | | | | | | | | | |
| | | | |
| Aerospace & Defense: 1.01% | | | | | | | | | | | | |
TASER International Incorporated Ǡ | | | | | | | 528,100 | | | | 11,343,588 | |
| | | | | | | | | | | | |
| | | | |
| Electrical Equipment: 1.69% | | | | | | | | | | | | |
Power Solutions International Incorporated Ǡ | | | | | | | 289,199 | | | | 18,985,914 | |
| | | | | | | | | | | | |
| | | | |
| Machinery: 1.54% | | | | | | | | | | | | |
Proto Labs Incorporated † | | | | | | | 97,855 | | | | 6,350,790 | |
The Middleby Corporation † | | | | | | | 113,450 | | | | 10,850,358 | |
| | | | |
| | | | | | | | | | | 17,201,148 | |
| | | | | | | | | | | | |
| | | | |
| Professional Services: 3.97% | | | | | | | | | | | | |
Corporate Executive Board Company | | | | | | | 76,046 | | | | 5,567,328 | |
On Assignment Incorporated † | | | | | | | 670,113 | | | | 20,592,572 | |
Paylocity Holding Corporation Ǡ | | | | | | | 251,133 | | | | 7,305,459 | |
Wageworks Incorporated † | | | | | | | 188,750 | | | | 11,026,775 | |
| | | | |
| | | | | | | | | | | 44,492,134 | |
| | | | | | | | | | | | |
| | | | |
| Road & Rail: 1.13% | | | | | | | | | | | | |
Saia Incorporated † | | | | | | | 227,900 | | | | 12,641,613 | |
| | | | | | | | | | | | |
| | | | |
| Trading Companies & Distributors: 1.25% | | | | | | | | | | | | |
DXP Enterprises Incorporated † | | | | | | | 51,516 | | | | 3,027,080 | |
H&E Equipment Services Incorporated | | | | | | | 312,600 | | | | 10,941,000 | |
| | | | |
| | | | | | | | | | | 13,968,080 | |
| | | | | | | | | | | | |
| | | | |
Information Technology: 32.56% | | | | | | | | | | | | |
| | | | |
| Electronic Equipment, Instruments & Components: 1.62% | | | | | | | | | | | | |
Cognex Corporation † | | | | | | | 254,700 | | | | 10,368,837 | |
Universal Display Corporation Ǡ | | | | | | | 278,300 | | | | 7,720,042 | |
| | | | |
| | | | | | | | | | | 18,088,879 | |
| | | | | | | | | | | | |
| | | | |
| Internet Software & Services: 12.58% | | | | | | | | | | | | |
Borderfree Incorporated † | | | | | | | 680,539 | | | | 6,812,195 | |
ChannelAdvisor Corporation Ǡ | | | | | | | 381,500 | | | | 6,714,400 | |
DealerTrack Holdings Incorporated † | | | | | | | 362,900 | | | | 17,114,364 | |
Demandware Incorporated † | | | | | | | 371,500 | | | | 20,804,000 | |
The accompanying notes are an integral part of these financial statements.
| | | | |
| 70 | | Wells Fargo Advantage Equity Gateway Funds | | Portfolio of investments—November 30, 2014 (unaudited) |
EMERGING GROWTH PORTFOLIO
| | | | | | | | | | | | | | | | |
| Security name | | | | | | | | | Shares | | | Value | |
| | | | | |
| Internet Software & Services (continued) | | | | | | | | | | | | | | | | |
Envestnet Incorporated † | | | | | | | | | | | 689,492 | | | $ | 35,267,516 | |
HomeAway Incorporated † | | | | | | | | | | | 585,845 | | | | 18,372,099 | |
Q2 Holdings Incorporated † | | | | | | | | | | | 367,249 | | | | 6,827,159 | |
SPS Commerce Incorporated † | | | | | | | | | | | 497,432 | | | | 28,990,337 | |
| | | | | |
| | | | | | | | | | | | | | | 140,902,070 | |
| | | | | | | | | | | | | | | | |
| | | | | |
| IT Services: 2.85% | | | | | | | | | | | | | | | | |
iGATE Corporation † | | | | | | | | | | | 184,500 | | | | 6,817,275 | |
InterXion Holding NV † | | | | | | | | | | | 286,400 | | | | 7,981,968 | |
Maximus Incorporated | | | | | | | | | | | 185,200 | | | | 9,702,628 | |
Wex Incorporated † | | | | | | | | | | | 65,821 | | | | 7,443,039 | |
| | | | | |
| | | | | | | | | | | | | | | 31,944,910 | |
| | | | | | | | | | | | | | | | |
| | | | | |
| Semiconductors & Semiconductor Equipment: 2.31% | | | | | | | | | | | | | | | | |
Cavium Incorporated † | | | | | | | | | | | 203,900 | | | | 11,540,740 | |
Veeco Instruments Incorporated † | | | | | | | | | | | 383,900 | | | | 14,361,699 | |
| | | | | |
| | | | | | | | | | | | | | | 25,902,439 | |
| | | | | | | | | | | | | | | | |
| | | | | |
| Software: 13.20% | | | | | | | | | | | | | | | | |
Aspen Technology Incorporated † | | | | | | | | | | | 81,700 | | | | 3,083,358 | |
Callidus Software Incorporated † | | | | | | | | | | | 785,950 | | | | 12,551,622 | |
Fleetmatics Group plc Ǡ | | | | | | | | | | | 626,720 | | | | 22,054,277 | |
Guidewire Software Incorporated † | | | | | | | | | | | 243,801 | | | | 12,304,636 | |
HubSpot Incorporated † | | | | | | | | | | | 96,803 | | | | 3,425,858 | |
MobileIron Incorporated Ǡ | | | | | | | | | | | 840,888 | | | | 7,795,032 | |
Proofpoint Incorporated † | | | | | | | | | | | 749,140 | | | | 32,527,659 | |
PROS Holdings Incorporated † | | | | | | | | | | | 439,422 | | | | 12,567,469 | |
Synchronoss Technologies Incorporated † | | | | | | | | | | | 367,801 | | | | 15,752,917 | |
Tyler Technologies Incorporated † | | | | | | | | | | | 104,425 | | | | 11,338,467 | |
Ultimate Software Group Incorporated † | | | | | | | | | | | 98,170 | | | | 14,454,551 | |
| | | | | |
| | | | | | | | | | | | | | | 147,855,846 | |
| | | | | | | | | | | | | | | | |
| | | | | |
Materials: 0.50% | | | | | | | | | | | | | | | | |
| | | | | |
| Chemicals: 0.50% | | | | | | | | | | | | | | | | |
Balchem Corporation | | | | | | | | | | | 86,300 | | | | 5,609,500 | |
| | | | | | | | | | | | | | | | |
| | | | | |
Total Common Stocks (Cost $797,241,970) | | | | | | | | | | | | | | | 1,114,960,030 | |
| | | | | | | | | | | | | | | | |
| | | | | |
| | | Yield | | | | | | | | | | | |
| | | | | |
Short-Term Investments: 12.22% | | | | | | | | | | | | | | | | |
| | | | | |
| Investment Companies: 12.22% | | | | | | | | | | | | | | | | |
Securities Lending Cash Investments, LLC (l)(u)(r) | | | 0.12 | % | | | | | | | 130,887,098 | | | | 130,887,098 | |
Wells Fargo Advantage Cash Investment Money Market Fund, Select Class (l)(u) | | | 0.08 | | | | | | | | 5,987,366 | | | | 5,987,366 | |
| | | | | |
Total Short-Term Investments (Cost $136,874,464) | | | | | | | | | | | | | | | 136,874,464 | |
| | | | | | | | | | | | | | | | |
| | | | | | | | |
| Total investments in securities (Cost $934,116,434) * | | | 111.76 | % | | | 1,251,834,494 | |
Other assets and liabilities, net | | | (11.76 | ) | | | (131,745,558 | ) |
| | | | | | | | |
| Total net assets | | | 100.00 | % | | $ | 1,120,088,936 | |
| | | | | | | | |
The accompanying notes are an integral part of these financial statements.
| | | | | | |
| Portfolio of investments—November 30, 2014 (unaudited) | | Wells Fargo Advantage Equity Gateway Funds | | | 71 | |
EMERGING GROWTH PORTFOLIO
| † | Non-income-earning security |
| « | All or a portion of this security is on loan. |
| (l) | The security represents an affiliate of the Portfolio as defined in the Investment Company Act of 1940. |
| (u) | The rate represents the 7-day annualized yield at period end. |
| (r) | The investment is a non-registered investment vehicle purchased with cash collateral received from securities on loan. |
| * | Cost for federal income tax purposes is $936,487,448 and unrealized gains (losses) consists of: |
| | | | |
Gross unrealized gains | | $ | 344,568,180 | |
Gross unrealized losses | | | (29,221,134 | ) |
| | | | |
Net unrealized gains | | $ | 315,347,046 | |
The accompanying notes are an integral part of these financial statements.
| | | | |
| 72 | | Wells Fargo Advantage Equity Gateway Funds | | Summary portfolio of investments—November 30, 2014 (unaudited) |
INDEX PORTFOLIO
The Summary Portfolio of Investments shows the 50 largest portfolio holdings in unaffiliated issuers and any holdings exceeding 1% of the total net assets as of the report date. The remaining securities held are grouped as “Other securities” in each category. You can request a complete schedule of portfolio holdings as of the report date, free of charge, by accessing the following website: http://a584.g.akamai.net/f/584/1326/1d/www.wellsfargoadvantagefunds.com/pdf/semi/holdings/index.pdf or by calling Wells Fargo Advantage Funds at 1-800-222-8222. This complete schedule, filed on Form N-CSRS, is also available on the SEC’s website at sec.gov.
| | | | | | | | | | | | | | | | |
| Security name | | | | | | Shares | | | Value | | | Percent of
net assets | |
| | | | | |
Common Stocks: 98.72% | | | | | | | | | | | | | | | | |
| | | | | |
Consumer Discretionary: 11.80% | | | | | | | | | | | | | | | | |
| | | | | |
| Auto Components: 0.41% | | | | | | | | | | | | | | | | |
Other securities | | | | | | | | | | $ | 11,700,990 | | | | 0.41 | % |
| | | | | | | | | | | | | | | | |
| | | | | |
| Automobiles: 0.65% | | | | | | | | | | | | | | | | |
Other securities | | | | | | | | | | | 18,756,441 | | | | 0.65 | |
| | | | | | | | | | | | | | | | |
| | | | | |
| Distributors: 0.08% | | | | | | | | | | | | | | | | |
Other securities | | | | | | | | | | | 2,434,550 | | | | 0.08 | |
| | | | | | | | | | | | | | | | |
| | | | | |
| Diversified Consumer Services: 0.05% | | | | | | | | | | | | | | | | |
Other securities | | | | | | | | | | | 1,431,853 | | | | 0.05 | |
| | | | | | | | | | | | | | | | |
| | | | | |
| Hotels, Restaurants & Leisure: 1.58% | | | | | | | | | | | | | | | | |
McDonald’s Corporation | | | | | | | 151,931 | | | | 14,708,440 | | | | 0.51 | |
Other securities | | | | | | | | | | | 30,817,521 | | | | 1.07 | |
| | | | | |
| | | | | | | | | | | 45,525,961 | | | | 1.58 | |
| | | | | | | | | | | | | | | | |
| | | | | |
| Household Durables: 0.42% | | | | | | | | | | | | | | | | |
Other securities | | | | | | | | | | | 12,109,918 | | | | 0.42 | |
| | | | | | | | | | | | | | | | |
| | | | | |
| Internet & Catalog Retail: 1.22% | | | | | | | | | | | | | | | | |
Amazon.com Incorporated † | | | | | | | 58,621 | | | | 19,851,415 | | | | 0.69 | |
Other securities | | | | | | | | | | | 15,241,491 | | | | 0.53 | |
| | | | | |
| | | | | | | | | | | 35,092,906 | | | | 1.22 | |
| | | | | | | | | | | | | | | | |
| | | | | |
| Leisure Products: 0.09% | | | | | | | | | | | | | | | | |
Other securities | | | | | | | | | | | 2,700,223 | | | | 0.09 | |
| | | | | | | | | | | | | | | | |
| | | | | |
| Media: 3.47% | | | | | | | | | | | | | | | | |
Comcast Corporation Class A | | | | | | | 400,450 | | | | 22,841,668 | | | | 0.79 | |
The Walt Disney Company | | | | | | | 244,348 | | | | 22,604,633 | | | | 0.78 | |
Other securities | | | | | | | | | | | 54,635,756 | | | | 1.90 | |
| | | | | |
| | | | | | | | | | | 100,082,057 | | | | 3.47 | |
| | | | | | | | | | | | | | | | |
| | | | | |
| Multiline Retail: 0.72% | | | | | | | | | | | | | | | | |
Other securities | | | | | | | | | | | 20,853,280 | | | | 0.72 | |
| | | | | | | | | | | | | | | | |
| | | | | |
| Specialty Retail: 2.25% | | | | | | | | | | | | | | | | |
Home Depot Incorporated | | | | | | | 208,251 | | | | 20,700,149 | | | | 0.72 | |
Other securities | | | | | | | | | | | 44,236,594 | | | | 1.53 | |
| | | | | |
| | | | | | | | | | | 64,936,743 | | | | 2.25 | |
| | | | | | | | | | | | | | | | |
The accompanying notes are an integral part of these financial statements.
| | | | | | |
| Summary portfolio of investments—November 30, 2014 (unaudited) | | Wells Fargo Advantage Equity Gateway Funds | | | 73 | |
INDEX PORTFOLIO
| | | | | | | | | | | | | | | | |
| Security name | | | | | | Shares | | | Value | | | Percent of
net assets | |
| | | | | |
| Textiles, Apparel & Luxury Goods: 0.86% | | | | | | | | | | | | | | | | |
Other securities | | | | | | | | | | $ | 24,857,285 | | | | 0.86 | % |
| | | | | | | | | | | | | | | | |
| | | | | |
Consumer Staples: 9.76% | | | | | | | | | | | | | | | | |
| | | | | |
| Beverages: 2.21% | | | | | | | | | | | | | | | | |
PepsiCo Incorporated | | | | | | | 233,141 | | | | 23,337,414 | | | | 0.81 | |
The Coca-Cola Company | | | | | | | 610,759 | | | | 27,380,326 | | | | 0.95 | |
Other securities | | | | | | | | | | | 13,041,583 | | | | 0.45 | |
| | | | | |
| | | | | | | | | | | 63,759,323 | | | | 2.21 | |
| | | | | | | | | | | | | | | | |
| | | | | |
| Food & Staples Retailing: 2.39% | | | | | | | | | | | | | | | | |
CVS Health Corporation | | | | | | | 179,194 | | | | 16,371,164 | | | | 0.57 | |
Wal-Mart Stores Incorporated | | | | | | | 244,319 | | | | 21,387,685 | | | | 0.74 | |
Other securities | | | | | | | | | | | 31,144,786 | | | | 1.08 | |
| | | | | |
| | | | | | | | | | | 68,903,635 | | | | 2.39 | |
| | | | | | | | | | | | | | | | |
| | | | | |
| Food Products: 1.62% | | | | | | | | | | | | | | | | |
Other securities | | | | | | | | | | | 46,651,671 | | | | 1.62 | |
| | | | | | | | | | | | | | | | |
| | | | | |
| Household Products: 1.94% | | | | | | | | | | | | | | | | |
The Procter & Gamble Company | | | | | | | 418,947 | | | | 37,885,377 | | | | 1.31 | |
Other securities | | | | | | | | | | | 18,015,315 | | | | 0.63 | |
| | | | | |
| | | | | | | | | | | 55,900,692 | | | | 1.94 | |
| | | | | | | | | | | | | | | | |
| | | | | |
| Personal Products: 0.11% | | | | | | | | | | | | | | | | |
Other securities | | | | | | | | | | | 3,238,424 | | | | 0.11 | |
| | | | | | | | | | | | | | | | |
| | | | | |
| Tobacco: 1.49% | | | | | | | | | | | | | | | | |
Altria Group Incorporated | | | | | | | 306,893 | | | | 15,424,442 | | | | 0.53 | |
Philip Morris International | | | | | | | 241,704 | | | | 21,011,329 | | | | 0.73 | |
Other securities | | | | | | | | | | | 6,659,608 | | | | 0.23 | |
| | | | | |
| | | | | | | | | | | 43,095,379 | | | | 1.49 | |
| | | | | | | | | | | | | | | | |
| | | | | |
Energy: 8.28% | | | | | | | | | | | | | | | | |
| | | | | |
| Energy Equipment & Services: 1.37% | | | | | | | | | | | | | | | | |
Schlumberger Limited | | | | | | | 200,594 | | | | 17,241,054 | | | | 0.60 | |
Other securities | | | | | | | | | | | 22,293,272 | | | | 0.77 | |
| | | | | |
| | | | | | | | | | | 39,534,326 | | | | 1.37 | |
| | | | | | | | | | | | | | | | |
| | | | | |
| Oil, Gas & Consumable Fuels: 6.91% | | | | | | | | | | | | | | | | |
Chevron Corporation | | | | | | | 293,816 | | | | 31,987,748 | | | | 1.11 | |
ConocoPhillips Company | | | | | | | 190,248 | | | | 12,569,685 | | | | 0.44 | |
Exxon Mobil Corporation | | | | | | | 659,864 | | | | 59,744,087 | | | | 2.07 | |
Other securities | | | | | | | | | | | 95,008,234 | | | | 3.29 | |
| | | | | |
| | | | | | | | | | | 199,309,754 | | | | 6.91 | |
| | | | | | | | | | | | | | | | |
The accompanying notes are an integral part of these financial statements.
| | | | |
| 74 | | Wells Fargo Advantage Equity Gateway Funds | | Summary portfolio of investments—November 30, 2014 (unaudited) |
INDEX PORTFOLIO
| | | | | | | | | | | | | | | | |
| Security name | | | | | | Shares | | | Value | | | Percent of
net assets | |
| | | | | |
Financials: 16.09% | | | | | | | | | | | | | | | | |
| | | | | |
| Banks: 5.82% | | | | | | | | | | | | | | | | |
Bank of America Corporation | | | | | | | 1,627,090 | | | $ | 27,725,614 | | | | 0.96 | % |
Citigroup Incorporated | | | | | | | 469,098 | | | | 25,317,219 | | | | 0.88 | |
JPMorgan Chase & Company | | | | | | | 581,972 | | | | 35,011,436 | | | | 1.21 | |
Wells Fargo & Company (l) | | | | | | | 735,042 | | | | 40,045,088 | | | | 1.39 | |
Other securities | | | | | | | | | | | 39,664,343 | | | | 1.38 | |
| | | | | |
| | | | | | | | | | | 167,763,700 | | | | 5.82 | |
| | | | | | | | | | | | | | | | |
| | | | | |
| Capital Markets: 2.21% | | | | | | | | | | | | | | | | |
Other securities | | | | | | | | | | | 63,718,879 | | | | 2.21 | |
| | | | | | | | | | | | | | | | |
| | | | | |
| Consumer Finance: 0.91% | | | | | | | | | | | | | | | | |
American Express Company | | | | | | | 139,262 | | | | 12,870,594 | | | | 0.45 | |
Other securities | | | | | | | | | | | 13,271,058 | | | | 0.46 | |
| | | | | |
| | | | | | | | | | | 26,141,652 | | | | 0.91 | |
| | | | | | | | | | | | | | | | |
| | | | | |
| Diversified Financial Services: 2.04% | | | | | | | | | | | | | | | | |
Berkshire Hathaway Incorporated Class B † | | | | | | | 282,071 | | | | 41,941,137 | | | | 1.45 | |
Other securities | | | | | | | | | | | 16,880,589 | | | | 0.59 | |
| | | | | |
| | | | | | | | | | | 58,821,726 | | | | 2.04 | |
| | | | | | | | | | | | | | | | |
| | | | | |
| Insurance: 2.73% | | | | | | | | | | | | | | | | |
Other securities | | | | | | | | | | | 78,852,821 | | | | 2.73 | |
| | | | | | | | | | | | | | | | |
| | | | | |
| Real Estate Management & Development: 0.05% | | | | | | | | | | | | | | | | |
Other securities | | | | | | | | | | | 1,456,421 | | | | 0.05 | |
| | | | | | | | | | | | | | | | |
| | | | | |
| REITs: 2.28% | | | | | | | | | | | | | | | | |
Other securities | | | | | | | | | | | 65,866,613 | | | | 2.28 | |
| | | | | | | | | | | | | | | | |
| | | | | |
| Thrifts & Mortgage Finance: 0.05% | | | | | | | | | | | | | | | | |
Other securities | | | | | | | | | | | 1,438,507 | | | | 0.05 | |
| | | | | | | | | | | | | | | | |
| | | | | |
Health Care: 14.15% | | | | | | | | | | | | | | | | |
| | | | | |
| Biotechnology: 2.89% | | | | | | | | | | | | | | | | |
Amgen Incorporated | | | | | | | 117,532 | | | | 19,429,215 | | | | 0.67 | |
Celgene Corporation † | | | | | | | 123,706 | | | | 14,064,135 | | | | 0.49 | |
Gilead Sciences Incorporated † | | | | | | | 233,896 | | | | 23,464,447 | | | | 0.81 | |
Other securities | | | | | | | | | | | 26,300,040 | | | | 0.92 | |
| | | | | |
| | | | | | | | | | | 83,257,837 | | | | 2.89 | |
| | | | | | | | | | | | | | | | |
| | | | | |
| Health Care Equipment & Supplies: 2.19% | | | | | | | | | | | | | | | | |
Other securities | | | | | | | | | | | 63,179,808 | | | | 2.19 | |
| | | | | | | | | | | | | | | | |
| | | | | |
| Health Care Providers & Services: 2.24% | | | | | | | | | | | | | | | | |
UnitedHealth Group Incorporated | | | | | | | 150,337 | | | | 14,827,738 | | | | 0.51 | |
Other securities | | | | | | | | | | | 49,852,543 | | | | 1.73 | |
| | | | | |
| | | | | | | | | | | 64,680,281 | | | | 2.24 | |
| | | | | | | | | | | | | | | | |
The accompanying notes are an integral part of these financial statements.
| | | | | | |
| Summary portfolio of investments—November 30, 2014 (unaudited) | | Wells Fargo Advantage Equity Gateway Funds | | | 75 | |
INDEX PORTFOLIO
| | | | | | | | | | | | | | | | |
| Security name | | | | | | Shares | | | Value | | | Percent of
net assets | |
| | | | | |
| Health Care Technology: 0.11% | | | | | | | | | | | | | | | | |
Other securities | | | | | | | | | | $ | 3,024,610 | | | | 0.11 | % |
| | | | | | | | | | | | | | | | |
| | | | | |
| Life Sciences Tools & Services: 0.43% | | | | | | | | | | | | | | | | |
Other securities | | | | | | | | | | | 12,486,464 | | | | 0.43 | |
| | | | | | | | | | | | | | | | |
| | | | | |
| Pharmaceuticals: 6.29% | | | | | | | | | | | | | | | | |
Abbvie Incorporated | | | | | | | 246,279 | | | | 17,042,507 | | | | 0.59 | |
Bristol-Myers Squibb Company | | | | | | | 256,523 | | | | 15,147,683 | | | | 0.53 | |
Johnson & Johnson | | | | | | | 436,375 | | | | 47,237,594 | | | | 1.64 | |
Merck & Company Incorporated | | | | | | | 446,331 | | | | 26,958,392 | | | | 0.93 | |
Pfizer Incorporated | | | | | | | 981,104 | | | | 30,561,390 | | | | 1.06 | |
Other securities | | | | | | | | | | | 44,629,381 | | | | 1.54 | |
| | | | | |
| | | | | | | | | | | 181,576,947 | | | | 6.29 | |
| | | | | | | | | | | | | | | | |
| | | | | |
Industrials: 10.32% | | | | | | | | | | | | | | | | |
| | | | | |
| Aerospace & Defense: 2.63% | | | | | | | | | | | | | | | | |
Boeing Company | | | | | | | 103,694 | | | | 13,932,326 | | | | 0.48 | |
United Technologies Corporation | | | | | | | 131,638 | | | | 14,490,711 | | | | 0.50 | |
Other securities | | | | | | | | | | | 47,401,640 | | | | 1.65 | |
| | | | | |
| | | | | | | | | | | 75,824,677 | | | | 2.63 | |
| | | | | | | | | | | | | | | | |
| | | | | |
| Air Freight & Logistics: 0.78% | | | | | | | | | | | | | | | | |
Other securities | | | | | | | | | | | 22,373,609 | | | | 0.78 | |
| | | | | | | | | | | | | | | | |
| | | | | |
| Airlines: 0.37% | | | | | | | | | | | | | | | | |
Other securities | | | | | | | | | | | 10,520,786 | | | | 0.37 | |
| | | | | | | | | | | | | | | | |
| | | | | |
| Building Products: 0.07% | | | | | | | | | | | | | | | | |
Other securities | | | | | | | | | | | 2,135,237 | | | | 0.07 | |
| | | | | | | | | | | | | | | | |
| | | | | |
| Commercial Services & Supplies: 0.46% | | | | | | | | | | | | | | | | |
Other securities | | | | | | | | | | | 13,187,947 | | | | 0.46 | |
| | | | | | | | | | | | | | | | |
| | | | | |
| Construction & Engineering: 0.12% | | | | | | | | | | | | | | | | |
Other securities | | | | | | | | | | | 3,490,225 | | | | 0.12 | |
| | | | | | | | | | | | | | | | |
| | | | | |
| Electrical Equipment: 0.56% | | | | | | | | | | | | | | | | |
Other securities | | | | | | | | | | | 16,278,770 | | | | 0.56 | |
| | | | | | | | | | | | | | | | |
| | | | | |
| Industrial Conglomerates: 2.34% | | | | | | | | | | | | | | | | |
3M Company | | | | | | | 100,258 | | | | 16,050,303 | | | | 0.56 | |
General Electric Company | | | | | | | 1,552,517 | | | | 41,126,175 | | | | 1.43 | |
Other securities | | | | | | | | | | | 10,324,201 | | | | 0.35 | |
| | | | | |
| | | | | | | | | | | 67,500,679 | | | | 2.34 | |
| | | | | | | | | | | | | | | | |
| | | | | |
| Machinery: 1.56% | | | | | | | | | | | | | | | | |
Other securities | | | | | | | | | | | 45,123,333 | | | | 1.56 | |
| | | | | | | | | | | | | | | | |
| | | | | |
| Professional Services: 0.19% | | | | | | | | | | | | | | | | |
Other securities | | | | | | | | | | | 5,387,604 | | | | 0.19 | |
| | | | | | | | | | | | | | | | |
The accompanying notes are an integral part of these financial statements.
| | | | |
| 76 | | Wells Fargo Advantage Equity Gateway Funds | | Summary portfolio of investments—November 30, 2014 (unaudited) |
INDEX PORTFOLIO
| | | | | | | | | | | | | | | | |
| Security name | | | | | | Shares | | | Value | | | Percent of
net assets | |
| | | | | |
| Road & Rail: 1.04% | | | | | | | | | | | | | | | | |
Union Pacific Corporation | | | | | | | 138,856 | | | $ | 16,214,215 | | | | 0.56 | % |
Other securities | | | | | | | | | | | 13,804,879 | | | | 0.48 | |
| | | | | |
| | | | | | | | | | | 30,019,094 | | | | 1.04 | |
| | | | | | | | | | | | | | | | |
| | | | | |
| Trading Companies & Distributors: 0.20% | | | | | | | | | | | | | | | | |
Other securities | | | | | | | | | | | 5,905,054 | | | | 0.20 | |
| | | | | | | | | | | | | | | | |
| | | | | |
Information Technology: 19.71% | | | | | | | | | | | | | | | | |
| | | | | |
| Communications Equipment: 1.63% | | | | | | | | | | | | | | | | |
Cisco Systems Incorporated | | | | | | | 788,985 | | | | 21,807,545 | | | | 0.76 | |
QUALCOMM Incorporated | | | | | | | 259,326 | | | | 18,904,865 | | | | 0.65 | |
Other securities | | | | | | | | | | | 6,264,587 | | | | 0.22 | |
| | | | | |
| | | | | | | | | | | 46,976,997 | | | | 1.63 | |
| | | | | | | | | | | | | | | | |
| | | | | |
| Electronic Equipment, Instruments & Components: 0.40% | | | | | | | | | | | | | | | | |
Other securities | | | | | | | | | | | 11,562,764 | | | | 0.40 | |
| | | | | | | | | | | | | | | | |
| | | | | |
| Internet Software & Services: 3.22% | | | | | | | | | | | | | | | | |
Facebook Incorporated Class A † | | | | | | | 322,352 | | | | 25,046,750 | | | | 0.87 | |
Google Incorporated Class A † | | | | | | | 43,957 | | | | 24,135,910 | | | | 0.84 | |
Google Incorporated Class C † | | | | | | | 43,954 | | | | 23,815,596 | | | | 0.82 | |
Other securities | | | | | | | | | | | 19,823,577 | | | | 0.69 | |
| | | | | |
| | | | | | | | | | | 92,821,833 | | | | 3.22 | |
| | | | | | | | | | | | | | | | |
| | | | | |
| IT Services: 3.25% | | | | | | | | | | | | | | | | |
International Business Machines Corporation | | | | | | | 143,550 | | | | 23,279,504 | | | | 0.81 | |
MasterCard Incorporated | | | | | | | 152,294 | | | | 13,293,743 | | | | 0.46 | |
Visa Incorporated Class A | | | | | | | 76,169 | | | | 19,666,074 | | | | 0.68 | |
Other securities | | | | | | | | | | | 37,579,995 | | | | 1.30 | |
| | | | | |
| | | | | | | | | | | 93,819,316 | | | | 3.25 | |
| | | | | | | | | | | | | | | | |
| | | | | |
| Semiconductors & Semiconductor Equipment: 2.45% | | | | | | | | | | | | | | | | |
Intel Corporation | | | | | | | 766,054 | | | | 28,535,512 | | | | 0.99 | |
Other securities | | | | | | | | | | | 42,234,165 | | | | 1.46 | |
| | | | | |
| | | | | | | | | | | 70,769,677 | | | | 2.45 | |
| | | | | | | | | | | | | | | | |
| | | | | |
| Software: 3.79% | | | | | | | | | | | | | | | | |
Microsoft Corporation | | | | | | | 1,274,928 | | | | 60,954,308 | | | | 2.11 | |
Oracle Corporation | | | | | | | 503,183 | | | | 21,339,991 | | | | 0.74 | |
Other securities | | | | | | | | | | | 26,985,129 | | | | 0.94 | |
| | | | | |
| | | | | | | | | | | 109,279,428 | | | | 3.79 | |
| | | | | | | | | | | | | | | | |
| | | | | |
| Technology Hardware, Storage & Peripherals: 4.97% | | | | | | | | | | | | | | | | |
Apple Incorporated | | | | | | | 926,486 | | | | 110,186,980 | | | | 3.82 | |
Other securities | | | | | | | | | | | 33,354,688 | | | | 1.15 | |
| | | | | |
| | | | | | | | | | | 143,541,668 | | | | 4.97 | |
| | | | | | | | | | | | | | | | |
The accompanying notes are an integral part of these financial statements.
| | | | | | |
| Summary portfolio of investments—November 30, 2014 (unaudited) | | Wells Fargo Advantage Equity Gateway Funds | | | 77 | |
INDEX PORTFOLIO
| | | | | | | | | | | | | | | | | | |
| Security name | | | | | | | Shares | | | Value | | | Percent of
net assets | |
| | | | | |
Materials: 3.17% | | | | | | | | | | | | | | | | | | |
| | | | | |
| Chemicals: 2.34% | | | | | | | | | | | | | | | | | | |
Other securities | | | | | | | | | | | | $ | 67,498,229 | | | | 2.34 | % |
| | | | | | | | | | | | | | | | | | |
| | | | | |
| Construction Materials: 0.09% | | | | | | | | | | | | | | | | | | |
Other securities | | | | | | | | | | | | | 2,482,357 | | | | 0.09 | |
| | | | | | | | | | | | | | | | | | |
| | | | | |
| Containers & Packaging: 0.20% | | | | | | | | | | | | | | | | | | |
Other securities | | | | | | | | | | | | | 5,890,602 | | | | 0.20 | |
| | | | | | | | | | | | | | | | | | |
| | | | | |
| Metals & Mining: 0.42% | | | | | | | | | | | | | | | | | | |
Other securities | | | | | | | | | | | | | 12,096,064 | | | | 0.42 | |
| | | | | | | | | | | | | | | | | | |
| | | | | |
| Paper & Forest Products: 0.12% | | | | | | | | | | | | | | | | | | |
Other securities | | | | | | | | | | | | | 3,555,995 | | | | 0.12 | |
| | | | | | | | | | | | | | | | | | |
| | | | | |
Telecommunication Services: 2.38% | | | | | | | | | | | | | | | | | | |
| | | | | |
| Diversified Telecommunication Services: 2.38% | | | | | | | | | | | | | | | | | | |
AT&T Incorporated | | | | | | | | | 802,415 | | | | 28,389,443 | | | | 0.98 | |
Verizon Communications Incorporated | | | | | | | | | 641,380 | | | | 32,447,414 | | | | 1.13 | |
Other securities | | | | | | | | | | | | | 7,783,311 | | | | 0.27 | |
| | | | | |
| | | | | | | | | | | | | 68,620,168 | | | | 2.38 | |
| | | | | | | | | | | | | | | | | | |
| | | | | |
Utilities: 3.06% | | | | | | | | | | | | | | | | | | |
| | | | | |
| Electric Utilities: 1.75% | | | | | | | | | | | | | | | | | | |
Other securities | | | | | | | | | | | | | 50,499,192 | | | | 1.75 | |
| | | | | | | | | | | | | | | | | | |
| | | | | |
| Gas Utilities: 0.03% | | | | | | | | | | | | | | | | | | |
Other securities | | | | | | | | | | | | | 967,055 | | | | 0.03 | |
| | | | | | | | | | | | | | | | | | |
| | | | | |
| Independent Power & Renewable Electricity Producers: 0.11% | | | | | | | | | | | | | | | | | | |
Other securities | | | | | | | | | | | | | 3,061,443 | | | | 0.11 | |
| | | | | | | | | | | | | | | | | | |
| | | | | |
| Multi-Utilities: 1.17% | | | | | | | | | | | | | | | | | | |
Other securities | | | | | | | | | | | | | 33,837,538 | | | | 1.17 | |
| | | | | | | | | | | | | | | | | | |
| | | | | |
Total Common Stocks (Cost $1,423,799,062) | | | | | | | | | | | | | 2,848,169,018 | | | | 98.72 | |
| | | | | | | | | | | | | | | | | | |
| | | | | |
| | | Yield | | | | | | | | | | | | |
| Short-Term Investments: 1.86% | | | | | | | | | | | | | | | | | | |
| | | | | |
| Investment Companies: 1.77% | | | | | | | | | | | | | | | | | | |
Securities Lending Cash Investments, LLC (l)(r)(u) | | | 0.12 | % | | | | | 15,878,700 | | | | 15,878,700 | | | | 0.55 | |
Wells Fargo Advantage Cash Investment Money Market Fund, Select Class (l)(u) | | | 0.08 | | | | | | 35,068,768 | | | | 35,068,768 | | | | 1.22 | |
| | | | | |
| | | | | | | | | | | | | 50,947,468 | | | | 1.77 | |
| | | | | | | | | | | | | | | | | | |
The accompanying notes are an integral part of these financial statements.
| | | | |
| 78 | | Wells Fargo Advantage Equity Gateway Funds | | Summary portfolio of investments—November 30, 2014 (unaudited) |
INDEX PORTFOLIO
| | | | | | | | | | | | | | | | | | | | |
| Security name | | Yield | | | Maturity date | | | Principal | | | Value | | | Percent of
net assets | |
| | | | | |
| U.S. Treasury Securities: 0.09% | | | | | | | | | | | | | | | | | | | | |
U.S. Treasury Bill (z)# | | | 0.01 | % | | | 1-8-2015 | | | $ | 1,900,000 | | | $ | 1,899,975 | | | | 0.06 | % |
U.S. Treasury Bill (z)# | | | 0.02 | | | | 12-18-2014 | | | | 180,000 | | | | 179,998 | | | | 0.01 | |
U.S. Treasury Bill (z)# | | | 0.02 | | | | 3-5-2015 | | | | 360,000 | | | | 359,981 | | | | 0.01 | |
U.S. Treasury Bill (z)# | | | 0.06 | | | | 4-23-2015 | | | | 225,000 | | | | 224,946 | | | | 0.01 | |
| | | | | |
| | | | | | | | | | | | | | | 2,664,900 | | | | 0.09 | |
| | | | | | | | | | | | | | | | | | | | |
| | | | | |
Total Short-Term Investments (Cost $53,612,375) | | | | | | | | | | | | | | | 53,612,368 | | | | 1.86 | |
| | | | | | | | | | | | | | | | | | | | |
| | | | |
| Total investments in securities (Cost $1,477,411,437) * | | | | | | | | | | | | 2,901,781,386 | | | | 100.58 | % |
Other assets and liabilities, net | | | | | | | | | | | | | | | (16,627,350 | ) | | | (0.58 | ) |
| | | | | | | | | | | | | | | | | | | | |
| Total net assets | | | | | | | | | | | | | | $ | 2,885,154,036 | | | | 100.00 | % |
| | | | | | | | | | | | | | | | | | | | |
| † | Non-income-earning security |
| (l) | The security represents an affiliate of the Portfolio as defined in the Investment Company Act of 1940. |
| (u) | The rate represents the 7-day annualized yield at period end. |
| (r) | The investment is a non-registered investment vehicle purchased with cash collateral received from securities on loan. |
| (z) | Zero coupon security. The rate represents the current yield to maturity. |
| # | All or a portion of this security is segregated as collateral for investments in derivative instruments. |
| * | Cost for federal income tax purposes is $1,556,651,323 and unrealized gains (losses) consists of: |
| | | | |
Gross unrealized gains | | $ | 1,443,250,527 | |
Gross unrealized losses | | | (98,120,464 | ) |
| | | | |
Net unrealized gains | | $ | 1,345,130,063 | |
The accompanying notes are an integral part of these financial statements.
| | | | | | |
| Portfolio of investments—November 30, 2014 (unaudited) | | Wells Fargo Advantage Equity Gateway Funds | | | 79 | |
INTERNATIONAL GROWTH PORTFOLIO
| | | | | | | | | | | | |
| Security name | | | | | | Shares | | | Value | |
| | | | |
Common Stocks: 96.93% | | | | | | | | | | | | |
| | | | |
| Belgium: 3.97% | | | | | | | | | | | | |
Anheuser-Busch InBev NV (Consumer Staples, Beverages) | | | | | | | 28,940 | | | $ | 3,401,507 | |
Telenet Group Holding NV (Consumer Discretionary, Media) † | | | | | | | 22,489 | | | | 1,286,381 | |
UCB SA (Health Care, Pharmaceuticals) | | | | | | | 19,855 | | | | 1,558,427 | |
| | | | |
| | | | | | | | | | | 6,246,315 | |
| | | | | | | | | | | | |
| | | | |
| Brazil: 0.18% | | | | | | | | | | | | |
Ambev SA ADR (Consumer Staples, Beverages) | | | | | | | 42,189 | | | | 276,338 | |
| | | | | | | | | | | | |
| | | | |
| China: 10.45% | | | | | | | | | | | | |
Alibaba Group Holding Limited ADR (Information Technology, Internet Software & Services) † | | | | | | | 4,262 | | | | 475,810 | |
Baidu Incorporated ADR (Information Technology, Internet Software & Services) † | | | | | | | 37,490 | | | | 9,189,174 | |
China Mobile Limited (Telecommunication Services, Wireless Telecommunication Services) | | | | | | | 233,000 | | | | 2,870,849 | |
Industrial & Commercial Bank of China Limited Class H (Financials, Banks) | | | | | | | 1,541,000 | | | | 1,045,231 | |
Tencent Holdings Limited (Information Technology, Internet Software & Services) | | | | | | | 178,400 | | | | 2,852,596 | |
| | | | |
| | | | | | | | | | | 16,433,660 | |
| | | | | | | | | | | | |
| | | | |
| Denmark: 0.19% | | | | | | | | | | | | |
Rockwool International AS B Shares (Industrials, Building Products) | | | | | | | 2,420 | | | | 300,679 | |
| | | | | | | | | | | | |
| | | | |
| France: 5.75% | | | | | | | | | | | | |
France Telecom SA (Telecommunication Services, Diversified Telecommunication Services) | | | | | | | 57,178 | | | | 1,007,791 | |
L’Oreal SA (Consumer Staples, Personal Products) | | | | | | | 6,608 | | | | 1,128,104 | |
LVMH Moet Hennessy Louis Vuitton SA (Consumer Discretionary, Textiles, Apparel & Luxury Goods) « | | | | | | | 6,670 | | | | 1,199,275 | |
Pernod-Ricard SA (Consumer Staples, Beverages) | | | | | | | 2,016 | | | | 239,086 | |
Publicis Groupe SA (Consumer Discretionary, Media) | | | | | | | 102 | | | | 7,496 | |
Schneider Electric SA (Industrials, Electrical Equipment) | | | | | | | 19,776 | | | | 1,614,237 | |
Technip SA (Energy, Energy Equipment & Services) | | | | | | | 8,423 | | | | 548,142 | |
Vinci SA (Industrials, Construction & Engineering) | | | | | | | 13,889 | | | | 751,338 | |
Zodiac Aerospace SA (Industrials, Aerospace & Defense) | | | | | | | 77,004 | | | | 2,553,498 | |
| | | | |
| | | | | | | | | | | 9,048,967 | |
| | | | | | | | | | | | |
| | | | |
| Germany: 11.84% | | | | | | | | | | | | |
Allianz AG (Financials, Insurance) | | | | | | | 8,365 | | | | 1,441,066 | |
Bayer AG (Health Care, Pharmaceuticals) | | | | | | | 45,409 | | | | 6,833,965 | |
Beiersdorf AG (Consumer Staples, Personal Products) | | | | | | | 23,029 | | | | 2,051,123 | |
Deutsche Post AG (Industrials, Air Freight & Logistics) | | | | | | | 69,999 | | | | 2,326,869 | |
Linde AG (Materials, Chemicals) | | | | | | | 27,948 | | | | 5,277,210 | |
MTU Aero Engines AG (Industrials, Aerospace & Defense) | | | | | | | 7,732 | | | | 689,532 | |
| | | | |
| | | | | | | | | | | 18,619,765 | |
| | | | | | | | | | | | |
| | | | |
| Hong Kong: 6.39% | | | | | | | | | | | | |
AIA Group Limited (Financials, Insurance) | | | | | | | 950,800 | | | | 5,492,765 | |
Beijing Enterprises Holdings Limited (Industrials, Industrial Conglomerates) | | | | | | | 284,500 | | | | 2,270,893 | |
Sands China Limited (Consumer Discretionary, Hotels, Restaurants & Leisure) | | | | | | | 382,800 | | | | 2,292,881 | |
| | | | |
| | | | | | | | | | | 10,056,539 | |
| | | | | | | | | | | | |
The accompanying notes are an integral part of these financial statements.
| | | | |
| 80 | | Wells Fargo Advantage Equity Gateway Funds | | Portfolio of investments—November 30, 2014 (unaudited) |
INTERNATIONAL GROWTH PORTFOLIO
| | | | | | | | | | | | |
| Security name | | | | | | Shares | | | Value | |
| | | | |
| Ireland: 3.59% | | | | | | | | | | | | |
Covidien plc (Health Care, Health Care Equipment & Supplies) | | | | | | | 55,835 | | | $ | 5,639,335 | |
| | | | | | | | | | | | |
| | | | |
| Japan: 14.80% | | | | | | | | | | | | |
Ishikawajima-Harima Heavy Industries Company Limited (Industrials, Machinery) | | | | | | | 701,000 | | | | 3,544,282 | |
JS Group Corporation (Industrials, Building Products) | | | | | | | 60,000 | | | | 1,276,144 | |
Kawasaki Heavy Industries Limited (Industrials, Machinery) | | | | | | | 78,116 | | | | 343,613 | |
KDDI Corporation (Telecommunication Services, Wireless Telecommunication Services) | | | | | | | 35,800 | | | | 2,293,951 | |
NGK Insulators Limited (Industrials, Machinery) | | | | | | | 130,000 | | | | 2,886,576 | |
Olympus Corporation (Health Care, Health Care Equipment & Supplies) † | | | | | | | 113,400 | | | | 4,128,154 | |
Ono Pharmaceutical Company Limited (Health Care, Pharmaceuticals) | | | | | | | 12,200 | | | | 1,044,510 | |
SoftBank Corporation (Telecommunication Services, Wireless Telecommunication Services) | | | | | | | 39,269 | | | | 2,635,030 | |
Toyota Motor Corporation (Consumer Discretionary, Automobiles) | | | | | | | 83,200 | | | | 5,127,874 | |
| | | | |
| | | | | | | | | | | 23,280,134 | |
| | | | | | | | | | | | |
| | | | |
| Mexico: 3.05% | | | | | | | | | | | | |
Grupo Televisa SAB ADR (Consumer Discretionary, Media) | | | | | | | 128,450 | | | | 4,797,608 | |
| | | | | | | | | | | | |
| | | | |
| Netherlands: 4.45% | | | | | | | | | | | | |
ASML Holdings NV (Information Technology, Semiconductors & Semiconductor Equipment) | | | | | | | 46,681 | | | | 4,933,172 | |
Nielsen Holdings NV (Industrials, Professional Services) « | | | | | | | 7,161 | | | | 299,115 | |
Unilever NV (Consumer Staples, Food Products) « | | | | | | | 43,287 | | | | 1,764,250 | |
| | | | |
| | | | | | | | | | | 6,996,537 | |
| | | | | | | | | | | | |
| | | | |
| South Korea: 0.38% | | | | | | | | | | | | |
Naver Corporation (Information Technology, Internet Software & Services) | | | | | | | 844 | | | | 575,896 | |
Orion Corporation (Consumer Staples, Food Products) | | | | | | | 18 | | | | 15,889 | |
| | | | |
| | | | | | | | | | | 591,785 | |
| | | | | | | | | | | | |
| | | | |
| Spain: 1.97% | | | | | | | | | | | | |
Grifols SA (Health Care, Biotechnology) | | | | | | | 20,597 | | | | 918,153 | |
Grifols SA ADR (Health Care, Biotechnology) | | | | | | | 18,313 | | | | 681,976 | |
Telefonica SA (Telecommunication Services, Diversified Telecommunication Services) | | | | | | | 93,451 | | | | 1,497,700 | |
| | | | |
| | | | | | | | | | | 3,097,829 | |
| | | | | | | | | | | | |
| | | | |
| Sweden: 0.83% | | | | | | | | | | | | |
Swedbank AB (Financials, Banks) | | | | | | | 49,780 | | | | 1,306,046 | |
| | | | | | | | | | | | |
| | | | |
| Switzerland: 8.85% | | | | | | | | | | | | |
Actelion Limited (Health Care, Biotechnology) | | | | | | | 17,281 | | | | 2,056,005 | |
Nestle SA (Consumer Staples, Food Products) | | | | | | | 57,662 | | | | 4,331,740 | |
Roche Holdings AG (Health Care, Pharmaceuticals) | | | | | | | 15,380 | | | | 4,608,824 | |
Swatch Group AG Class B (Consumer Discretionary, Textiles, Apparel & Luxury Goods) | | | | | | | 1,238 | | | | 612,110 | |
Syngenta AG (Materials, Chemicals) | | | | | | | 2,906 | | | | 957,784 | |
Zurich Financial Services AG (Financials, Insurance) | | | | | | | 4,311 | | | | 1,351,665 | |
| | | | |
| | | | | | | | | | | 13,918,128 | |
| | | | | | | | | | | | |
| | | | |
| United Kingdom: 18.10% | | | | | | | | | | | | |
Babcock International Group plc (Industrials, Commercial Services & Supplies) | | | | | | | 47,400 | | | | 842,899 | |
BT Group plc (Telecommunication Services, Diversified Telecommunication Services) | | | | | | | 266,746 | | | | 1,711,318 | |
The accompanying notes are an integral part of these financial statements.
| | | | | | |
| Portfolio of investments—November 30, 2014 (unaudited) | | Wells Fargo Advantage Equity Gateway Funds | | | 81 | |
INTERNATIONAL GROWTH PORTFOLIO
| | | | | | | | | | | | | | | | |
| Security name | | | | | | | | | Shares | | | Value | |
| | | | | |
| United Kingdom (continued) | | | | | | | | | | | | | | | | |
Croda International plc (Materials, Chemicals) | | | | | | | | | | | 52,433 | | | $ | 2,012,409 | |
Diageo plc (Consumer Staples, Beverages) | | | | | | | | | | | 4,956 | | | | 153,551 | |
Intercontinental Hotels Group plc (Consumer Discretionary, Hotels, Restaurants & Leisure) | | | | | | | | | | | 36,646 | | | | 1,553,219 | |
Johnson Matthey plc (Materials, Chemicals) | | | | | | | | | | | 62,393 | | | | 3,245,600 | |
Liberty Global plc Class A (Consumer Discretionary, Media) | | | | | | | | | | | 53,969 | | | | 2,805,848 | |
Liberty Global plc Class C (Consumer Discretionary, Media) † | | | | | | | | | | | 90,152 | | | | 4,500,388 | |
Lloyds Banking Group plc (Financials, Banks) † | | | | | | | | | | | 982,846 | | | | 1,235,117 | |
Prudential plc (Financials, Insurance) | | | | | | | | | | | 78,205 | | | | 1,893,400 | |
Rolls-Royce Holdings plc (Industrials, Aerospace & Defense) | | | | | | | | | | | 158,153 | | | | 2,083,935 | |
Rolls-Royce Holdings plc Class C Preference Shares (Industrials, Aerospace & Defense) †(a) | | | | | | | | | | | 18,495,180 | | | | 28,926 | |
SABMiller plc (Consumer Staples, Beverages) | | | | | | | | | | | 59,469 | | | | 3,314,860 | |
Saga plc (Financials, Diversified Financial Services) †« | | | | | | | | | | | 55,063 | | | | 132,450 | |
Smiths Group plc (Industrials, Industrial Conglomerates) | | | | | | | | | | | 26,695 | | | | 483,059 | |
WPP plc (Consumer Discretionary, Media) | | | | | | | | | | | 118,085 | | | | 2,474,779 | |
| | | | | |
| | | | | | | | | | | | | | | 28,471,758 | |
| | | | | | | | | | | | | | | | |
| | | | | |
| United States: 2.14% | | | | | | | | | | | | | | | | |
Cognizant Technology Solutions Corporation Class A (Information Technology, IT Services) † | | | | | | | | | | | 33,777 | | | | 1,823,620 | |
Schlumberger Limited (Energy, Energy Equipment & Services) | | | | | | | | | | | 17,924 | | | | 1,540,568 | |
| | | | | |
| | | | | | | | | | | | | | | 3,364,188 | |
| | | | | | | | | | | | | | | | |
| | | | | |
Total Common Stocks (Cost $118,310,333) | | | | | | | | | | | | | | | 152,445,611 | |
| | | | | | | | | | | | | | | | |
| | | | | |
Participation Notes: 0.78% | | | | | | | | | | | | | | | | |
| | | | | |
| United Kingdom: 0.78% | | | | | | | | | | | | | | | | |
HSBC Bank plc (Ryanair Holdings plc) (Industrials, Airlines) | | | | | | | | | | | 115,900 | | | | 1,232,086 | |
| | | | | | | | | | | | | | | | |
| | | | | |
Total Participation Notes (Cost $969,118) | | | | | | | | | | | | | | | 1,232,086 | |
| | | | | | | | | | | | | | | | |
| | | | | |
| | | Dividend yield | | | | | | | | | | | |
| | | | | |
Preferred Stocks: 1.33% | | | | | | | | | | | | | | | | |
| | | | | |
| Germany: 1.33% | | | | | | | | | | | | | | | | |
Henkel AG & Company KGaA (Consumer Staples, Household Products) ± | | | 1.51 | % | | | | | | | 18,843 | | | | 2,091,882 | |
| | | | | | | | | | | | | | | | |
| | | | | |
Total Preferred Stocks (Cost $1,392,735) | | | | | | | | | | | | | | | 2,091,882 | |
| | | | | | | | | | | | | | | | |
| | | | | |
| | | Yield | | | | | | | | | | | |
| Short-Term Investments: 2.08% | | | | | | | | | | | | | | | | |
| | | | | |
| Investment Companies: 2.08% | | | | | | | | | | | | | | | | |
Securities Lending Cash Investments, LLC (l)(u)(r) | | | 0.12 | | | | | | | | 1,787,826 | | | | 1,787,826 | |
Wells Fargo Advantage Cash Investment Money Market Fund, Select Class (l)(u) | | | 0.08 | | | | | | | | 1,480,017 | | | | 1,480,017 | |
| | | | | |
Total Short-Term Investments (Cost $3,267,843) | | | | | | | | | | | | | | | 3,267,843 | |
| | | | | | | | | | | | | | | | |
| | | | | | | | |
| Total investments in securities (Cost $123,940,029) * | | | 101.12 | % | | | 159,037,422 | |
Other assets and liabilities, net | | | (1.12 | ) | | | (1,754,016 | ) |
| | | | | | | | |
| Total net assets | | | 100.00 | % | | $ | 157,283,406 | |
| | | | | | | | |
The accompanying notes are an integral part of these financial statements.
| | | | |
| 82 | | Wells Fargo Advantage Equity Gateway Funds | | Portfolio of investments—November 30, 2014 (unaudited) |
INTERNATIONAL GROWTH PORTFOLIO
| † | Non-income-earning security |
| « | All or a portion of this security is on loan. |
| (a) | The security is fair valued in accordance with procedures approved by the Board of Trustees. |
| ± | Variable rate investment. The rate shown is the rate in effect at period end. |
| (l) | The security represents an affiliate of the Portfolio as defined in the Investment Company Act of 1940. |
| (u) | The rate represents the 7-day annualized yield at period end. |
| (r) | The investment is a non-registered investment vehicle purchased with cash collateral received from securities on loan. |
| * | Cost for federal income tax purposes is $124,190,209 and unrealized gains (losses) consists of: |
| | | | |
Gross unrealized gains | | $ | 37,566,124 | |
Gross unrealized losses | | | (2,718,911 | ) |
| | | | |
Net unrealized gains | | $ | 34,847,213 | |
The following table shows the percent of total long-term investments by sector as of November 30, 2014:
| | | | |
Health Care | | | 17.64 | % |
Consumer Discretionary | | | 17.12 | |
Industrials | | | 15.10 | |
Information Technology | | | 12.74 | |
Consumer Staples | | | 12.05 | |
Financials | | | 8.92 | |
Telecommunication Services | | | 7.71 | |
Materials | | | 7.38 | |
Energy | | | 1.34 | |
| | | | |
| | | 100.00 | % |
| | | | |
The accompanying notes are an integral part of these financial statements.
| | | | | | |
| Portfolio of investments—November 30, 2014 (unaudited) | | Wells Fargo Advantage Equity Gateway Funds | | | 83 | |
INTERNATIONAL VALUE PORTFOLIO
| | | | | | | | | | | | |
| Security name | | | | | | Shares | | | Value | |
| | | | |
Common Stocks: 96.52% | | | | | | | | | | | | |
| | | | |
| Australia: 5.51% | | | | | | | | | | | | |
Arrium Limited (Materials, Metals & Mining) | | | | | | | 3,063,400 | | | $ | 625,892 | |
Bendigo Bank Limited (Financials, Banks) | | | | | | | 272,500 | | | | 2,962,375 | |
Boart Longyear Group Limited (Industrials, Construction & Engineering) †« | | | | | | | 199,991 | | | | 31,497 | |
Cabcharge Australia Limited (Industrials, Commercial Services & Supplies) | | | | | | | 207,386 | | | | 842,133 | |
Challenger Financial Services Group Limited (Financials, Diversified Financial Services) | | | | | | | 475,400 | | | | 2,569,896 | |
Downer EDI Limited (Industrials, Commercial Services & Supplies) | | | | | | | 518,900 | | | | 1,899,480 | |
Fortescue Metals Group Limited (Materials, Metals & Mining) « | | | | | | | 394,700 | | | | 987,864 | |
Independence Group NL (Materials, Metals & Mining) | | | | | | | 404,400 | | | | 1,445,916 | |
Lend Lease Corporation Limited (Financials, Real Estate Management & Development) | | | | | | | 350,500 | | | | 4,574,175 | |
Metcash Limited (Consumer Staples, Food & Staples Retailing) « | | | | | | | 785,500 | | | | 1,745,297 | |
Mincor Resources NL (Materials, Metals & Mining) (i) | | | | | | | 570,994 | | | | 277,070 | |
Mineral Resources Limited (Materials, Metals & Mining) | | | | | | | 144,300 | | | | 937,289 | |
Myer Holdings Limited (Consumer Discretionary, Multiline Retail) « | | | | | | | 577,400 | | | | 796,296 | |
Panoramic Resources Limited (Materials, Metals & Mining) | | | | | | | 368,800 | | | | 128,723 | |
Primary Health Care Limited (Health Care, Health Care Providers & Services) | | | | | | | 339,000 | | | | 1,356,376 | |
Rio Tinto Limited (Materials, Metals & Mining) | | | | | | | 66,800 | | | | 3,360,830 | |
Seven Network Limited (Industrials, Trading Companies & Distributors) | | | | | | | 165,800 | | | | 842,639 | |
Toll Holdings Limited (Industrials, Air Freight & Logistics) | | | | | | | 283,600 | | | | 1,361,658 | |
United Construction Group Limited (Industrials, Construction & Engineering) | | | | | | | 152,800 | | | | 269,263 | |
| | | | |
| | | | | | | | | | | 27,014,669 | |
| | | | | | | | | | | | |
| | | | |
| Austria: 1.30% | | | | | | | | | | | | |
OMV AG (Energy, Oil, Gas & Consumable Fuels) | | | | | | | 41,100 | | | | 1,189,533 | |
Raiffeisen Bank International AG (Financials, Banks) | | | | | | | 81,200 | | | | 1,681,258 | |
RHI AG (Materials, Construction Materials) (i) | | | | | | | 64,721 | | | | 1,518,437 | |
Voestalpine AG (Materials, Metals & Mining) | | | | | | | 47,700 | | | | 1,982,393 | |
| | | | |
| | | | | | | | | | | 6,371,621 | |
| | | | | | | | | | | | |
| | | | |
| Belgium: 0.59% | | | | | | | | | | | | |
Delhaize Group SA (Consumer Staples, Food & Staples Retailing) | | | | | | | 39,400 | | | | 2,882,203 | |
| | | | | | | | | | | | |
| | | | |
| Brazil: 0.99% | | | | | | | | | | | | |
Banco do Brasil SA (Financials, Banks) | | | | | | | 196,000 | | | | 2,261,965 | |
Companhia de Saneamento Basico do Estado de Sao Paulo (Utilities, Water Utilities) | | | | | | | 253,200 | | | | 1,885,537 | |
Companhia de Saneamento de Minas Gerais SA (Utilities, Water Utilities) | | | | | | | 72,400 | | | | 686,782 | |
| | | | |
| | | | | | | | | | | 4,834,284 | |
| | | | | | | | | | | | |
| | | | |
| Canada: 2.91% | | | | | | | | | | | | |
Magna International Incorporated Class A (Consumer Discretionary, Auto Components) | | | | | | | 65,800 | | | | 7,091,950 | |
Metro Incorporated (Consumer Staples, Food & Staples Retailing) | | | | | | | 48,400 | | | | 3,802,102 | |
WestJet Airlines Limited (Industrials, Airlines) | | | | | | | 120,000 | | | | 3,388,408 | |
| | | | |
| | | | | | | | | | | 14,282,460 | |
| | | | | | | | | | | | |
| | | | |
| China: 2.46% | | | | | | | | | | | | |
China BlueChemical Limited (Materials, Chemicals) | | | | | | | 1,984,000 | | | | 718,905 | |
China Communications Services Corporation Limited (Telecommunication Services, Diversified Telecommunication Services) | | | | | | | 2,836,000 | | | | 1,382,362 | |
China Petroleum & Chemical Corporation (Energy, Oil, Gas & Consumable Fuels) | | | | | | | 6,116,500 | | | | 5,008,417 | |
The accompanying notes are an integral part of these financial statements.
| | | | |
| 84 | | Wells Fargo Advantage Equity Gateway Funds | | Portfolio of investments—November 30, 2014 (unaudited) |
INTERNATIONAL VALUE PORTFOLIO
| | | | | | | | | | | | |
| Security name | | | | | | Shares | | | Value | |
| | | | |
| China (continued) | | | | | | | | | | | | |
China Railway Construction Corporation Limited (Industrials, Construction & Engineering) | | | | | | | 1,747,500 | | | $ | 2,007,792 | |
Dongfeng Motor Group Company Limited (Consumer Discretionary, Automobiles) | | | | | | | 1,730,000 | | | | 2,632,400 | |
Shanghai Pharmaceuticals Holding Company Limited (Health Care, Pharmaceuticals) | | | | | | | 131,600 | | | | 313,604 | |
| | | | |
| | | | | | | | | | | 12,063,480 | |
| | | | | | | | | | | | |
| | | | |
| Czech Republic: 0.33% | | | | | | | | | | | | |
CEZ AS (Utilities, Electric Utilities) | | | | | | | 57,500 | | | | 1,602,829 | |
| | | | | | | | | | | | |
| | | | |
| Finland: 0.94% | | | | | | | | | | | | |
Kesko Oyj (Consumer Staples, Food & Staples Retailing) | | | | | | | 63,800 | | | | 2,485,585 | |
TietoEnator Oyj (Information Technology, IT Services) | | | | | | | 82,700 | | | | 2,121,872 | |
| | | | |
| | | | | | | | | | | 4,607,457 | |
| | | | | | | | | | | | |
| | | | |
| France: 8.40% | | | | | | | | | | | | |
Alstom SA (Industrials, Machinery) † | | | | | | | 83,800 | | | | 2,932,659 | |
AXA SA (Financials, Insurance) | | | | | | | 132,200 | | | | 3,193,698 | |
BNP Paribas SA (Financials, Banks) | | | | | | | 49,100 | | | | 3,150,064 | |
Compagnie Generale des Etablissements Michelin SCA Class B (Consumer Discretionary, Auto Components) | | | | | | | 24,000 | | | | 2,208,383 | |
Credit Agricole SA (Financials, Banks) | | | | | | | 219,328 | | | | 3,085,245 | |
Electricite de France SA (Utilities, Electric Utilities) | | | | | | | 122,100 | | | | 3,657,690 | |
Renault SA (Consumer Discretionary, Automobiles) | | | | | | | 40,500 | | | | 3,251,429 | |
Sanofi-Aventis SA (Health Care, Pharmaceuticals) | | | | | | | 61,400 | | | | 5,948,503 | |
SCOR SE (Financials, Insurance) | | | | | | | 109,700 | | | | 3,424,776 | |
Societe Generale SA (Financials, Banks) | | | | | | | 39,000 | | | | 1,935,769 | |
Thales SA (Industrials, Aerospace & Defense) | | | | | | | 59,100 | | | | 3,137,871 | |
Total SA (Energy, Oil, Gas & Consumable Fuels) | | | | | | | 93,700 | | | | 5,245,423 | |
| | | | |
| | | | | | | | | | | 41,171,510 | |
| | | | | | | | | | | | |
| | | | |
| Germany: 7.87% | | | | | | | | | | | | |
Allianz AG (Financials, Insurance) | | | | | | | 35,700 | | | | 6,150,156 | |
BASF SE (Materials, Chemicals) | | | | | | | 46,500 | | | | 4,224,353 | |
Bayerische Motoren Werke AG (Consumer Discretionary, Automobiles) | | | | | | | 26,100 | | | | 2,986,188 | |
Daimler AG (Consumer Discretionary, Automobiles) | | | | | | | 69,300 | | | | 5,846,391 | |
Deutsche Bank AG (Financials, Capital Markets) | | | | | | | 41,200 | | | | 1,347,504 | |
E.ON SE (Utilities, Multi-Utilities) | | | | | | | 87,200 | | | | 1,546,709 | |
Gildemeister AG (Industrials, Machinery) | | | | | | | 58,200 | | | | 1,542,870 | |
Hannover Rueckversicherung AG (Financials, Insurance) | | | | | | | 31,000 | | | | 2,768,019 | |
Muenchener Rueckversicherungs Gesellschaft AG (Financials, Insurance) | | | | | | | 19,700 | | | | 4,060,529 | |
Norddeutsche Affinerie AG (Materials, Metals & Mining) | | | | | | | 25,900 | | | | 1,428,317 | |
Stada Arzneimittel AG (Health Care, Pharmaceuticals) | | | | | | | 43,300 | | | | 1,560,312 | |
Volkswagen AG (Consumer Discretionary, Automobiles) | | | | | | | 22,600 | | | | 5,115,241 | |
| | | | |
| | | | | | | | | | | 38,576,589 | |
| | | | | | | | | | | | |
| | | | |
| Hong Kong: 1.90% | | | | | | | | | | | | |
China Resources Cement Holdings Limited (Materials, Construction Materials) | | | | | | | 743,000 | | | | 509,711 | |
Kingboard Laminates Holdings Limited (Information Technology, Electronic Equipment, Instruments & Components) | | | | | | | 2,204,000 | | | | 898,095 | |
Shenzhen International Holdings Limited (Industrials, Transportation Infrastructure) | | | | | | | 1,158,500 | | | | 1,738,893 | |
Skyworth Digital Holdings Limited (Consumer Discretionary, Household Durables) | | | | | | | 3,680,000 | | | | 2,054,752 | |
Wheelock & Company Limited (Financials, Real Estate Management & Development) | | | | | | | 379,000 | | | | 1,906,021 | |
Yue Yuen Industrial Holdings Limited (Consumer Discretionary, Textiles, Apparel & Luxury Goods) | | | | | | | 611,500 | | | | 2,192,124 | |
| | | | |
| | | | | | | | | | | 9,299,596 | |
| | | | | | | | | | | | |
The accompanying notes are an integral part of these financial statements.
| | | | | | |
| Portfolio of investments—November 30, 2014 (unaudited) | | Wells Fargo Advantage Equity Gateway Funds | | | 85 | |
INTERNATIONAL VALUE PORTFOLIO
| | | | | | | | | | | | |
| Security name | | | | | | Shares | | | Value | |
| | | | |
| Hungary: 0.01% | | | | | | | | | | | | |
Richter Gedeon (Health Care, Pharmaceuticals) | | | | | | | 3,800 | | | $ | 59,155 | |
| | | | | | | | | | | | |
| | | | |
| India: 1.56% | | | | | | | | | | | | |
Gail Limited (Utilities, Gas Utilities) (i) | | | | | | | 41,200 | | | | 1,957,000 | |
Tata Motors Limited ADR (Consumer Discretionary, Automobiles) (i) | | | | | | | 83,800 | | | | 3,826,308 | |
Tata Steel Limited GDR (Industrials, Machinery) | | | | | | | 245,900 | | | | 1,876,217 | |
| | | | |
| | | | | | | | | | | 7,659,525 | |
| | | | | | | | | | | | |
| | | | |
| Ireland: 0.62% | | | | | | | | | | | | |
Irish Life & Permanent Group Holdings plc (Financials, Insurance) † | | | | | | | 111,500 | | | | 8,324 | |
Smurfit Kappa Group plc (Materials, Containers & Packaging) | | | | | | | 130,200 | | | | 3,018,205 | |
| | | | |
| | | | | | | | | | | 3,026,529 | |
| | | | | | | | | | | | |
| | | | |
| Israel: 1.15% | | | | | | | | | | | | |
Bank Hapoalim Limited (Financials, Banks) | | | | | | | 542,900 | | | | 2,705,965 | |
Teva Pharmaceutical Industries Limited (Health Care, Pharmaceuticals) | | | | | | | 51,404 | | | | 2,923,613 | |
| | | | |
| | | | | | | | | | | 5,629,578 | |
| | | | | | | | | | | | |
| | | | |
| Italy: 1.30% | | | | | | | | | | | | |
Enel SpA (Utilities, Electric Utilities) | | | | | | | 688,400 | | | | 3,323,514 | |
ENI SpA (Energy, Oil, Gas & Consumable Fuels) | | | | | | | 153,300 | | | | 3,065,371 | |
| | | | |
| | | | | | | | | | | 6,388,885 | |
| | | | | | | | | | | | |
| | | | |
| Japan: 19.78% | | | | | | | | | | | | |
Adeka Corporation (Materials, Chemicals) | | | | | | | 203,200 | | | | 2,448,605 | |
Aisin Seiki Company Limited (Consumer Discretionary, Auto Components) | | | | | | | 46,400 | | | | 1,659,796 | |
Anritsu Corporation (Information Technology, Electronic Equipment, Instruments & Components) | | | | | | | 69,000 | | | | 479,110 | |
Aoyama Trading Company Limited (Consumer Discretionary, Specialty Retail) | | | | | | | 73,100 | | | | 1,586,800 | |
Aozora Bank Limited (Financials, Banks) | | | | | | | 588,000 | | | | 1,912,598 | |
Calsonic Kansei Corporation (Consumer Discretionary, Auto Components) | | | | | | | 326,000 | | | | 1,788,371 | |
Chiba Bank Limited (Financials, Banks) | | | | | | | 329,000 | | | | 2,187,419 | |
CKD Corporation (Industrials, Machinery) | | | | | | | 10,200 | | | | 85,437 | |
DCM Japan Holdings Company Limited (Consumer Discretionary, Specialty Retail) | | | | | | | 143,100 | | | | 911,634 | |
Denki Kagaku Kogyo Kabushiki Kaisha (Materials, Chemicals) | | | | | | | 682,000 | | | | 2,327,547 | |
Eizo Nanao Corporation (Information Technology, Technology Hardware, Storage & Peripherals) | | | | | | | 63,300 | | | | 1,153,770 | |
Fukuoka Financial Group Incorporated (Financials, Banks) | | | | | | | 357,000 | | | | 1,946,398 | |
Itochu Corporation (Industrials, Trading Companies & Distributors) | | | | | | | 200,700 | | | | 2,310,240 | |
JX Holdings Incorporated (Energy, Oil, Gas & Consumable Fuels) | | | | | | | 408,000 | | | | 1,518,267 | |
Kaken Pharmaceutical Company Limited (Health Care, Pharmaceuticals) | | | | | | | 41,000 | | | | 870,650 | |
KDDI Corporation (Telecommunication Services, Wireless Telecommunication Services) | | | | | | | 67,800 | | | | 4,344,411 | |
Kyorin Company Limited (Health Care, Pharmaceuticals) | | | | | | | 99,000 | | | | 1,927,109 | |
Maeda Road Construction Company Limited (Industrials, Construction & Engineering) | | | | | | | 148,000 | | | | 2,096,469 | |
Marubeni Corporation (Industrials, Trading Companies & Distributors) | | | | | | | 516,000 | | | | 3,253,752 | |
Miraca Holdings Incorporated (Health Care, Health Care Providers & Services) | | | | | | | 25,100 | | | | 952,857 | |
Mitsubishi Corporation (Industrials, Trading Companies & Distributors) | | | | | | | 35,500 | | | | 671,589 | |
Mitsubishi UFJ Financial Group Incorporated (Financials, Banks) | | | | | | | 657,100 | | | | 3,800,737 | |
Mitsui & Company Limited (Industrials, Trading Companies & Distributors) | | | | | | | 260,300 | | | | 3,591,820 | |
Mizuho Financial Group Incorporated (Financials, Banks) | | | | | | | 2,244,400 | | | | 3,867,699 | |
Namura Shipbuilding Company Limited (Industrials, Machinery) | | | | | | | 108,800 | | | | 1,271,641 | |
The accompanying notes are an integral part of these financial statements.
| | | | |
| 86 | | Wells Fargo Advantage Equity Gateway Funds | | Portfolio of investments—November 30, 2014 (unaudited) |
INTERNATIONAL VALUE PORTFOLIO
| | | | | | | | | | | | |
| Security name | | | | | | Shares | | | Value | |
| | | | |
| Japan (continued) | | | | | | | | | | | | |
Nippon Telegraph & Telephone Corporation (Telecommunication Services, Diversified Telecommunication Services) | | | | | | | 117,000 | | | $ | 6,261,625 | |
Nissan Motor Company Limited (Consumer Discretionary, Automobiles) | | | | | | | 367,800 | | | | 3,435,631 | |
NTT DoCoMo Incorporated (Telecommunication Services, Wireless Telecommunication Services) | | | | | | | 180,000 | | | | 2,808,376 | |
Otsuka Holdings Company Limited (Health Care, Pharmaceuticals) | | | | | | | 123,100 | | | | 3,892,582 | |
Rengo Company Limited (Materials, Containers & Packaging) | | | | | | | 189,000 | | | | 761,288 | |
Resona Holdings Incorporated (Financials, Banks) | | | | | | | 1,013,300 | | | | 5,471,666 | |
Saizeriya Company Limited (Consumer Discretionary, Hotels, Restaurants & Leisure) | | | | | | | 84,000 | | | | 1,123,350 | |
Sankyu Incorporated (Industrials, Road & Rail) | | | | | | | 370,000 | | | | 1,446,701 | |
Sojitz Corporation (Industrials, Trading Companies & Distributors) | | | | | | | 678,000 | | | | 971,265 | |
Sumitomo Corporation (Industrials, Trading Companies & Distributors) | | | | | | | 285,000 | | | | 3,040,448 | |
Sumitomo Metal Mining Company Limited (Materials, Metals & Mining) | | | | | | | 109,000 | | | | 1,668,939 | |
Sumitomo Mitsui Financial Group Incorporated (Financials, Banks) | | | | | | | 100,400 | | | | 3,786,045 | |
The Keiyo Bank Limited (Financials, Banks) | | | | | | | 62,000 | | | | 344,299 | |
Toshiba TEC Corporation (Information Technology, Technology Hardware, Storage & Peripherals) | | | | | | | 234,000 | | | | 1,660,302 | |
Toyo Tire & Rubber Company Limited (Consumer Discretionary, Auto Components) | | | | | | | 162,500 | | | | 3,327,505 | |
Tsumura & Company (Health Care, Pharmaceuticals) | | | | | | | 79,300 | | | | 1,783,532 | |
Tsuruha Holdings Incorporated (Consumer Staples, Food & Staples Retailing) | | | | | | | 16,800 | | | | 948,513 | |
West Japan Railway Company (Industrials, Road & Rail) | | | | | | | 54,200 | | | | 2,587,825 | |
Yokohama Rubber Company Limited (Consumer Discretionary, Auto Components) | | | | | | | 297,000 | | | | 2,732,991 | |
| | | | |
| | | | | | | | | | | 97,017,609 | |
| | | | | | | | | | | | |
| | | | |
| Liechtenstein: 0.13% | | | | | | | | | | | | |
Verwaltungs-und Privat-Bank AG (Financials, Capital Markets) (i) | | | | | | | 7,800 | | | | 634,823 | |
| | | | | | | | | | | | |
| | | | |
| Netherlands: 2.80% | | | | | | | | | | | | |
Aegon NV (Financials, Insurance) | | | | | | | 334,000 | | | | 2,623,658 | |
ING Groep NV (Financials, Banks) † | | | | | | | 237,100 | | | | 3,475,376 | |
Koninklijke Ahold NV (Consumer Staples, Food & Staples Retailing) | | | | | | | 263,630 | | | | 4,659,733 | |
Nutreco NV (Consumer Staples, Food Products) | | | | | | | 52,400 | | | | 2,998,282 | |
| | | | |
| | | | | | | | | | | 13,757,049 | |
| | | | | | | | | | | | |
| | | | |
| Norway: 1.65% | | | | | | | | | | | | |
Atea ASA (Information Technology, IT Services) | | | | | | | 84,900 | | | | 881,012 | |
DnB Nor ASA (Financials, Banks) | | | | | | | 148,800 | | | | 2,464,224 | |
Marine Harvest ASA (Consumer Staples, Food Products) | | | | | | | 94,300 | | | | 1,333,786 | |
Statoil ASA (Energy, Oil, Gas & Consumable Fuels) | | | | | | | 61,700 | | | | 1,162,124 | |
Yara International ASA (Materials, Chemicals) | | | | | | | 53,600 | | | | 2,272,843 | |
| | | | |
| | | | | | | | | | | 8,113,989 | |
| | | | | | | | | | | | |
| | | | |
| Poland: 0.60% | | | | | | | | | | | | |
Asseco Poland SA (Information Technology, Software) | | | | | | | 101,800 | | | | 1,629,236 | |
KGHM Polska Miedz SA (Materials, Metals & Mining) | | | | | | | 36,500 | | | | 1,334,439 | |
| | | | |
| | | | | | | | | | | 2,963,675 | |
| | | | | | | | | | | | |
| | | | |
| Russia: 1.06% | | | | | | | | | | | | |
Gazprom Neft Sponsored ADR (Energy, Oil, Gas & Consumable Fuels) (i) | | | | | | | 150,014 | | | | 2,439,228 | |
Gazprom Neft Sponsored ADR (Energy, Oil, Gas & Consumable Fuels) | | | | | | | 886 | | | | 14,430 | |
LUKOIL ADR (Energy, Oil, Gas & Consumable Fuels) | | | | | | | 60,400 | | | | 2,763,300 | |
| | | | |
| | | | | | | | | | | 5,216,958 | |
| | | | | | | | | | | | |
The accompanying notes are an integral part of these financial statements.
| | | | | | |
| Portfolio of investments—November 30, 2014 (unaudited) | | Wells Fargo Advantage Equity Gateway Funds | | | 87 | |
INTERNATIONAL VALUE PORTFOLIO
| | | | | | | | | | | | |
| Security name | | | | | | Shares | | | Value | |
| | | | |
| Singapore: 1.13% | | | | | | | | | | | | |
DBS Group Holdings Limited (Financials, Banks) | | | | | | | 227,000 | | | $ | 3,453,856 | |
United Overseas Bank Limited (Financials, Banks) | | | | | | | 113,000 | | | | 2,080,872 | |
| | | | |
| | | | | | | | | | | 5,534,728 | |
| | | | | | | | | | | | |
| | | | |
| South Africa: 0.66% | | | | | | | | | | | | |
Barclays Africa Group Limited (Financials, Banks) | | | | | | | 200,300 | | | | 3,224,974 | |
| | | | | | | | | | | | |
| | | | |
| South Korea: 2.51% | | | | | | | | | | | | |
E-MART Company Limited (Consumer Staples, Food & Staples Retailing) | | | | | | | 8,500 | | | | 1,687,802 | |
GS Retail Company Limited (Consumer Staples, Food & Staples Retailing) | | | | | | | 13,449 | | | | 307,107 | |
Industrial Bank of Korea (Financials, Banks) | | | | | | | 192,500 | | | | 2,614,852 | |
Kwangju Bank (Financials, Banks) † | | | | | | | 13,510 | | | | 120,108 | |
Kyongnam Bank (Financials, Banks) † | | | | | | | 20,645 | | | | 237,577 | |
SK Telecom Company Limited (Telecommunication Services, Wireless Telecommunication Services) | | | | | | | 22,300 | | | | 5,645,697 | |
Woori Bank (Financials, Banks) † | | | | | | | 178,044 | | | | 1,719,456 | |
| | | | |
| | | | | | | | | | | 12,332,599 | |
| | | | | | | | | | | | |
| | | | |
| Spain: 1.53% | | | | | | | | | | | | |
Banco Santander Central Hispano SA (Financials, Banks) | | | | | | | 429,681 | | | | 3,875,691 | |
Repsol YPF SA (Energy, Oil, Gas & Consumable Fuels) | | | | | | | 123,800 | | | | 2,780,499 | |
Telefonica SA (Telecommunication Services, Diversified Telecommunication Services) | | | | | | | 52,400 | | | | 839,793 | |
| | | | |
| | | | | | | | | | | 7,495,983 | |
| | | | | | | | | | | | |
| | | | |
| Sweden: 2.22% | | | | | | | | | | | | |
Boliden AB (Materials, Metals & Mining) | | | | | | | 169,300 | | | | 2,861,293 | |
Nordea Bank AB (Financials, Banks) | | | | | | | 177,300 | | | | 2,215,269 | |
Saab AB (Industrials, Aerospace & Defense) | | | | | | | 113,500 | | | | 3,169,651 | |
Skandinaviska Enskilda Banken AB Class A (Financials, Banks) | | | | | | | 144,900 | | | | 1,914,430 | |
Teliasonera AB (Telecommunication Services, Diversified Telecommunication Services) | | | | | | | 103,000 | | | | 734,994 | |
| | | | |
| | | | | | | | | | | 10,895,637 | |
| | | | | | | | | | | | |
| | | | |
| Switzerland: 5.06% | | | | | | | | | | | | |
Baloise Holding AG (Financials, Insurance) | | | | | | | 28,800 | | | | 3,763,458 | |
Credit Suisse Group AG (Financials, Capital Markets) | | | | | | | 184,595 | | | | 4,935,276 | |
GAM Holding AG (Financials, Capital Markets) | | | | | | | 79,700 | | | | 1,411,204 | |
Georg Fischer AG (Industrials, Machinery) | | | | | | | 3,000 | | | | 1,837,432 | |
Novartis AG (Health Care, Pharmaceuticals) | | | | | | | 34,700 | | | | 3,359,513 | |
Swiss Reinsurance AG (Financials, Insurance) | | | | | | | 48,500 | | | | 4,148,175 | |
Zurich Financial Services AG (Financials, Insurance) | | | | | | | 17,100 | | | | 5,361,512 | |
| | | | |
| | | | | | | | | | | 24,816,570 | |
| | | | | | | | | | | | |
| | | | |
| Taiwan: 0.49% | | | | | | | | | | | | |
Pegatron Corporation (Information Technology, Technology Hardware, Storage & Peripherals) | | | | | | | 1,035,000 | | | | 2,401,260 | |
| | | | | | | | | | | | |
| | | | |
| Thailand: 0.79% | | | | | | | | | | | | |
Bangchak Petroleum plc (Energy, Oil, Gas & Consumable Fuels) | | | | | | | 2,188,900 | | | | 2,366,559 | |
Thanachart Capital plc (Financials, Banks) | | | | | | | 1,481,500 | | | | 1,511,504 | |
| | | | |
| | | | | | | | | | | 3,878,063 | |
| | | | | | | | | | | | |
The accompanying notes are an integral part of these financial statements.
| | | | |
| 88 | | Wells Fargo Advantage Equity Gateway Funds | | Portfolio of investments—November 30, 2014 (unaudited) |
INTERNATIONAL VALUE PORTFOLIO
| | | | | | | | | | | | | | | | |
| Security name | | | | | | | | | Shares | | | Value | |
| | | | | |
| United Kingdom: 18.27% | | | | | | | | | | | | | | | | |
3i Group plc (Financials, Capital Markets) | | | | | | | | | | | 316,400 | | | $ | 2,197,133 | |
Alent plc (Materials, Chemicals) | | | | | | | | | | | 111,265 | | | | 592,011 | |
AMEC plc (Energy, Energy Equipment & Services) | | | | | | | | | | | 83,300 | | | | 1,217,478 | |
Amlin plc (Financials, Insurance) | | | | | | | | | | | 279,000 | | | | 1,942,657 | |
Anglo American plc (Materials, Metals & Mining) | | | | | | | | | | | 107,000 | | | | 2,211,504 | |
AstraZeneca plc (Health Care, Pharmaceuticals) | | | | | | | | | | | 89,800 | | | | 6,713,378 | |
Aviva plc (Financials, Insurance) | | | | | | | | | | | 314,900 | | | | 2,501,919 | |
BAE Systems plc (Industrials, Aerospace & Defense) | | | | | | | | | | | 684,100 | | | | 5,147,446 | |
Barclays plc (Financials, Banks) | | | | | | | | | | | 715,000 | | | | 2,741,415 | |
Barratt Developments plc (Consumer Discretionary, Household Durables) | | | | | | | | | | | 236,200 | | | | 1,700,426 | |
BP plc (Energy, Oil, Gas & Consumable Fuels) | | | | | | | | | | | 844,300 | | | | 5,548,680 | |
BT Group plc (Telecommunication Services, Diversified Telecommunication Services) | | | | | | | | | | | 727,900 | | | | 4,669,864 | |
Carillion plc (Industrials, Construction & Engineering) | | | | | | | | | | | 261,500 | | | | 1,421,636 | |
Centrica plc (Utilities, Multi-Utilities) | | | | | | | | | | | 898,500 | | | | 3,999,354 | |
Chemring Group plc (Industrials, Aerospace & Defense) | | | | | | | | | | | 247,200 | | | | 913,392 | |
Debenhams plc (Consumer Discretionary, Multiline Retail) | | | | | | | | | | | 1,238,200 | | | | 1,394,313 | |
Firstgroup plc (Industrials, Road & Rail) † | | | | | | | | | | | 254,700 | | | | 450,137 | |
GlaxoSmithKline plc (Health Care, Pharmaceuticals) | | | | | | | | | | | 75,900 | | | | 1,762,808 | |
Home Retail Group plc (Consumer Discretionary, Internet & Catalog Retail) | | | | | | | | | | | 290,000 | | | | 908,935 | |
J Sainsbury plc (Consumer Staples, Food & Staples Retailing) « | | | | | | | | | | | 907,900 | | | | 3,314,177 | |
Kesa Electricals plc (Consumer Discretionary, Specialty Retail) (i) | | | | | | | | | | | 547,900 | | | | 571,991 | |
Lloyds Banking Group plc (Financials, Banks) † | | | | | | | | | | | 1,749,400 | | | | 2,198,426 | |
Marston’s plc (Consumer Discretionary, Hotels, Restaurants & Leisure) | | | | | | | | | | | 558,800 | | | | 1,264,625 | |
Mondi plc (Materials, Paper & Forest Products) | | | | | | | | | | | 127,600 | | | | 2,185,253 | |
Old Mutual plc (Financials, Insurance) | | | | | | | | | | | 982,800 | | | | 3,078,811 | |
Pace plc (Consumer Discretionary, Household Durables) | | | | | | | | | | | 308,800 | | | | 1,736,736 | |
Petrofac Limited (Energy, Energy Equipment & Services) | | | | | | | | | | | 84,300 | | | | 1,087,723 | |
Premier Foods plc (Consumer Staples, Food Products) † | | | | | | | | | | | 73,926 | | | | 42,780 | |
Royal Dutch Shell plc Class A (Energy, Oil, Gas & Consumable Fuels) | | | | | | | | | | | 14,300 | | | | 477,666 | |
Royal Dutch Shell plc Class B (Energy, Oil, Gas & Consumable Fuels) | | | | | | | | | | | 322,700 | | | | 11,219,547 | |
Standard Chartered plc (Financials, Banks) | | | | | | | | | | | 253,000 | | | | 3,708,031 | |
Tate & Lyle plc (Consumer Staples, Food Products) | | | | | | | | | | | 158,800 | | | | 1,498,872 | |
Tesco plc (Consumer Staples, Food & Staples Retailing) | | | | | | | | | | | 1,033,600 | | | | 3,014,059 | |
Tullett Prebon plc (Financials, Capital Markets) | | | | | | | | | | | 279,500 | | | | 1,102,462 | |
Vesuvius plc (Industrials, Machinery) | | | | | | | | | | | 145,400 | | | | 946,690 | |
WH Smith plc (Consumer Discretionary, Specialty Retail) | | | | | | | | | | | 111,900 | | | | 2,210,397 | |
William Morrison Supermarkets plc (Consumer Staples, Food & Staples Retailing) | | | | | | | | | | | 679,700 | | | | 1,897,546 | |
| | | | | |
| | | | | | | | | | | | | | | 89,590,278 | |
| | | | | | | | | | | | | | | | |
| | | | | |
Total Common Stocks (Cost $467,306,073) | | | | | | | | | | | | | | | 473,344,565 | |
| | | | | | | | | | | | | | | | |
| | | | | |
| | | Dividend yield | | | | | | | | | | | |
| | | | | |
Preferred Stocks: 0.94% | | | | | | | | | | | | | | | | |
| | | | | |
| Brazil: 0.94% | | | | | | | | | | | | | | | | |
Banco do Estado do Rio Grande do Sul SA (Financials, Banks) ± | | | 5.03 | % | | | | | | | 349,800 | | | | 2,004,819 | |
Companhia Energetica de Minas Gerais SA (Utilities, Electric Utilities) ± | | | 12.06 | | | | | | | | 109,056 | | | | 599,099 | |
Companhia Vale Do Rio Doce Class A (Materials, Metals & Mining) ± | | | 8.32 | | | | | | | | 257,700 | | | | 2,003,446 | |
| | | | | |
Total Preferred Stocks (Cost $7,494,241) | | | | | | | | | | | | | | | 4,607,364 | |
| | | | | | | | | | | | | | | | |
The accompanying notes are an integral part of these financial statements.
| | | | | | |
| Portfolio of investments—November 30, 2014 (unaudited) | | Wells Fargo Advantage Equity Gateway Funds | | | 89 | |
INTERNATIONAL VALUE PORTFOLIO
| | | | | | | | | | | | | | | | | | |
| Security name | | | | | Expiration date | | | | | Shares | | | Value | |
| | | | | |
Rights: 0.01% | | | | | | | | | | | | | | | | | | |
| | | | | |
| Spain: 0.01% | | | | | | | | | | | | | | | | | | |
Telefonica SA † | | | | | | | 2-27-2015 | | | | | | 52,400 | | | $ | 23,994 | |
| | | | | | | | | | | | | | | | | | |
| | | | | |
Total Rights (Cost $22,818) | | | | | | | | | | | | | | | | | 23,994 | |
| | | | | | | | | | | | | | | | | | |
| | | | | |
| | | Yield | | | | | | | | | | | | |
| | | | | |
Short-Term Investments: 4.24% | | | | | | | | | | | | | | | | | | |
| | | | | |
| Investment Companies: 4.24% | | | | | | | | | | | | | | | | | | |
Securities Lending Cash Investments, LLC (l)(u)(r) | | | 0.12 | % | | | | | | | | | 14,194,341 | | | | 14,194,341 | |
Wells Fargo Advantage Cash Investment Money Market Fund, Select Class (l)(u) | | | 0.08 | | | | | | | | | | 6,617,840 | | | | 6,617,840 | |
| | | | | |
Total Short-Term Investments (Cost $20,812,181) | | | | | | | | | | | | | | | | | 20,812,181 | |
| | | | | | | | | | | | | | | | | | |
| | | | | | | | |
| Total investments in securities (Cost $495,635,313) * | | | 101.71 | % | | | 498,788,104 | |
Other assets and liabilities, net | | | (1.71 | ) | | | (8,394,726 | ) |
| | | | | | | | |
| Total net assets | | | 100.00 | % | | $ | 490,393,378 | |
| | | | | | | | |
| † | Non-income-earning security |
| « | All or a portion of this security is on loan. |
| ± | Variable rate investment. The interest rate shown is the rate in effect at period end. |
| (l) | The security represents an affiliate of the Portfolio as defined in the Investment Company Act of 1940. |
| (u) | The rate represents the 7-day annualized yield at period end. |
| (r) | The investment is a non-registered investment vehicle purchased with cash collateral received from securities on loan. |
| * | Cost for federal income tax purposes is $452,438,425 and unrealized gains (losses) consists of: |
| | | | |
Gross unrealized gains | | $ | 159,488,851 | |
Gross unrealized losses | | | (113,139,172 | ) |
| | | | |
Net unrealized gains | | $ | 46,349,679 | |
The following table shows the percent of total long-term investments by sector as of November 30, 2014:
| | | | |
Financials | | | 30.21 | % |
Consumer Discretionary | | | 13.47 | |
Industrials | | | 11.94 | |
Energy | | | 9.86 | |
Materials | | | 8.75 | |
Health Care | | | 6.99 | |
Consumer Staples | | | 6.82 | |
Telecommunication Services | | | 5.58 | |
Utilities | | | 4.03 | |
Information Technology | | | 2.35 | |
| | | | |
| | | 100.00 | % |
| | | | |
The accompanying notes are an integral part of these financial statements.
| | | | |
| 90 | | Wells Fargo Advantage Equity Gateway Funds | | Portfolio of investments—November 30, 2014 (unaudited) |
LARGE COMPANY VALUE PORTFOLIO
| | | | | | | | | | | | |
| Security name | | | | | | Shares | | | Value | |
| | | | |
Common Stocks: 98.80% | | | | | | | | | | | | |
| | | | |
Consumer Discretionary: 8.73% | | | | | | | | | | | | |
| | | | |
| Automobiles: 1.02% | | | | | | | | | | | | |
Ford Motor Company | | | | | | | 57,585 | | | $ | 905,812 | |
| | | | | | | | | | | | |
| | | | |
| Hotels, Restaurants & Leisure: 2.27% | | | | | | | | | | | | |
Las Vegas Sands Corporation | | | | | | | 10,359 | | | | 659,765 | |
Norwegian Cruise Line Holdings Limited † | | | | | | | 30,830 | | | | 1,353,129 | |
| | | | |
| | | | | | | | | | | 2,012,894 | |
| | | | | | | | | | | | |
| | | | |
| Household Durables: 1.88% | | | | | | | | | | | | |
Newell Rubbermaid Incorporated | | | | | | | 28,697 | | | | 1,041,986 | |
Toll Brothers Incorporated † | | | | | | | 17,999 | | | | 629,785 | |
| | | | |
| | | | | | | | | | | 1,671,771 | |
| | | | | | | | | | | | |
| | | | |
| Media: 2.52% | | | | | | | | | | | | |
Gannett Company Incorporated | | | | | | | 12,760 | | | | 415,338 | |
The Walt Disney Company | | | | | | | 4,950 | | | | 457,925 | |
Viacom Incorporated Class B | | | | | | | 18,073 | | | | 1,366,861 | |
| | | | |
| | | | | | | | | | | 2,240,124 | |
| | | | | | | | | | | | |
| | | | |
| Textiles, Apparel & Luxury Goods: 1.04% | | | | | | | | | | | | |
PVH Corporation | | | | | | | 7,272 | | | | 924,562 | |
| | | | | | | | | | | | |
| | | | |
Consumer Staples: 4.82% | | | | | | | | | | | | |
| | | | |
| Food & Staples Retailing: 2.96% | | | | | | | | | | | | |
CVS Health Corporation | | | | | | | 28,745 | | | | 2,626,143 | |
| | | | | | | | | | | | |
| | | | |
| Household Products: 1.40% | | | | | | | | | | | | |
The Procter & Gamble Company | | | | | | | 13,758 | | | | 1,244,136 | |
| | | | | | | | | | | | |
| | | | |
| Personal Products: 0.46% | | | | | | | | | | | | |
Herbalife Limited « | | | | | | | 9,385 | | | | 405,901 | |
| | | | | | | | | | | | |
| | | | |
Energy: 9.05% | | | | | | | | | | | | |
| | | | |
| Energy Equipment & Services: 1.00% | | | | | | | | | | | | |
Baker Hughes Incorporated | | | | | | | 15,574 | | | | 887,718 | |
| | | | | | | | | | | | |
| | | | |
| Oil, Gas & Consumable Fuels: 8.05% | | | | | | | | | | | | |
Chevron Corporation | | | | | | | 9,775 | | | | 1,064,204 | |
ConocoPhillips Company | | | | | | | 14,775 | | | | 976,184 | |
Exxon Mobil Corporation | | | | | | | 13,508 | | | | 1,223,014 | |
Marathon Oil Corporation | | | | | | | 42,007 | | | | 1,214,842 | |
Noble Energy Incorporated | | | | | | | 15,968 | | | | 785,306 | |
Valero Energy Corporation | | | | | | | 28,154 | | | | 1,368,566 | |
Whiting Petroleum Corporation † | | | | | | | 12,415 | | | | 518,575 | |
| | | | |
| | | | | | | | | | | 7,150,691 | |
| | | | | | | | | | | | |
The accompanying notes are an integral part of these financial statements.
| | | | | | |
| Portfolio of investments—November 30, 2014 (unaudited) | | Wells Fargo Advantage Equity Gateway Funds | | | 91 | |
LARGE COMPANY VALUE PORTFOLIO
| | | | | | | | | | | | |
| Security name | | | | | | Shares | | | Value | |
| | | | |
Financials: 29.36% | | | | | | | | | | | | |
| | | | |
| Banks: 12.28% | | | | | | | | | | | | |
Bank of America Corporation | | | | | | | 121,134 | | | $ | 2,064,123 | |
BOK Financial Corporation | | | | | | | 20,039 | | | | 1,291,514 | |
Citigroup Incorporated | | | | | | | 41,091 | | | | 2,217,681 | |
First Republic Bank | | | | | | | 29,589 | | | | 1,524,721 | |
JPMorgan Chase & Company | | | | | | | 35,754 | | | | 2,150,961 | |
KeyCorp | | | | | | | 122,684 | | | | 1,656,234 | |
| | | | |
| | | | | | | | | | | 10,905,234 | |
| | | | | | | | | | | | |
| | | | |
| Capital Markets: 2.28% | | | | | | | | | | | | |
Ameriprise Financial Incorporated | | | | | | | 7,966 | | | | 1,049,680 | |
Goldman Sachs Group Incorporated | | | | | | | 5,193 | | | | 978,413 | |
| | | | |
| | | | | | | | | | | 2,028,093 | |
| | | | | | | | | | | | |
| | | | |
| Consumer Finance: 1.05% | | | | | | | | | | | | |
American Express Company | | | | | | | 10,096 | | | | 933,072 | |
| | | | | | | | | | | | |
| | | | |
| Insurance: 8.85% | | | | | | | | | | | | |
ACE Limited | | | | | | | 7,968 | | | | 911,061 | |
American International Group Incorporated | | | | | | | 42,022 | | | | 2,302,806 | |
Endurance Specialty Holdings Limited | | | | | | | 19,620 | | | | 1,157,188 | |
MetLife Incorporated | | | | | | | 30,141 | | | | 1,676,141 | |
The Hartford Financial Services Group Incorporated | | | | | | | 43,741 | | | | 1,806,503 | |
| | | | |
| | | | | | | | | | | 7,853,699 | |
| | | | | | | | | | | | |
| | | | |
| REITs: 4.90% | | | | | | | | | | | | |
Alexandria Real Estate Equities Incorporated | | | | | | | 11,116 | | | | 955,087 | |
American Campus Communities Incorporated | | | | | | | 23,430 | | | | 937,200 | |
American Tower Corporation | | | | | | | 13,983 | | | | 1,468,355 | |
LaSalle Hotel Properties | | | | | | | 24,497 | | | | 988,944 | |
| | | | |
| | | | | | | | | | | 4,349,586 | |
| | | | | | | | | | | | |
| | | | |
Health Care: 13.56% | | | | | | | | | | | | |
| | | | |
| Biotechnology: 0.88% | | | | | | | | | | | | |
Gilead Sciences Incorporated † | | | | | | | 7,831 | | | | 785,606 | |
| | | | | | | | | | | | |
| | | | |
| Health Care Equipment & Supplies: 2.97% | | | | | | | | | | | | |
Medtronic Incorporated | | | | | | | 14,952 | | | | 1,104,504 | |
Stryker Corporation | | | | | | | 16,469 | | | | 1,530,135 | |
| | | | |
| | | | | | | | | | | 2,634,639 | |
| | | | | | | | | | | | |
| | | | |
| Health Care Providers & Services: 2.96% | | | | | | | | | | | | |
Cigna Corporation | | | | | | | 16,419 | | | | 1,689,351 | |
HCA Holdings Incorporated † | | | | | | | 13,462 | | | | 938,167 | |
| | | | |
| | | | | | | | | | | 2,627,518 | |
| | | | | | | | | | | | |
| | | | |
| Pharmaceuticals: 6.75% | | | | | | | | | | | | |
Johnson & Johnson | | | | | | | 8,586 | | | | 929,435 | |
Merck & Company Incorporated | | | | | | | 32,684 | | | | 1,974,114 | |
The accompanying notes are an integral part of these financial statements.
| | | | |
| 92 | | Wells Fargo Advantage Equity Gateway Funds | | Portfolio of investments—November 30, 2014 (unaudited) |
LARGE COMPANY VALUE PORTFOLIO
| | | | | | | | | | | | |
| Security name | | | | | | Shares | | | Value | |
| | | | |
| Pharmaceuticals (continued) | | | | | | | | | | | | |
Novartis AG ADR | | | | | | | 16,667 | | | $ | 1,610,866 | |
Pfizer Incorporated | | | | | | | 47,367 | | | | 1,475,482 | |
| | | | |
| | | | | | | | | | | 5,989,897 | |
| | | | | | | | | | | | |
| | | | |
Industrials: 11.50% | | | | | | | | | | | | |
| | | | |
| Aerospace & Defense: 0.94% | | | | | | | | | | | | |
Triumph Group Incorporated | | | | | | | 12,351 | | | | 840,609 | |
| | | | | | | | | | | | |
| | | | |
| Airlines: 1.30% | | | | | | | | | | | | |
United Continental Holdings Incorporated † | | | | | | | 18,839 | | | | 1,153,512 | |
| | | | | | | | | | | | |
| | | | |
| Commercial Services & Supplies: 1.04% | | | | | | | | | | | | |
West Corporation | | | | | | | 29,715 | | | | 928,297 | |
| | | | | | | | | | | | |
| | | | |
| Construction & Engineering: 0.85% | | | | | | | | | | | | |
Quanta Services Incorporated † | | | | | | | 24,711 | | | | 753,686 | |
| | | | | | | | | | | | |
| | | | |
| Electrical Equipment: 0.72% | | | | | | | | | | | | |
Eaton Corporation plc | | | | | | | 9,411 | | | | 638,348 | |
| | | | | | | | | | | | |
| | | | |
| Industrial Conglomerates: 1.45% | | | | | | | | | | | | |
General Electric Company | | | | | | | 48,541 | | | | 1,285,851 | |
| | | | | | | | | | | | |
| | | | |
| Machinery: 3.97% | | | | | | | | | | | | |
Crane Company | | | | | | | 10,314 | | | | 608,835 | |
Dover Corporation | | | | | | | 11,299 | | | | 869,910 | |
Stanley Black & Decker Incorporated | | | | | | | 15,350 | | | | 1,449,654 | |
The Timken Company | | | | | | | 13,991 | | | | 598,675 | |
| | | | |
| | | | | | | | | | | 3,527,074 | |
| | | | | | | | | | | | |
| | | | |
| Road & Rail: 0.51% | | | | | | | | | | | | |
AMERCO | | | | | | | 1,622 | | | | 451,240 | |
| | | | | | | | | | | | |
| | | | |
| Trading Companies & Distributors: 0.72% | | | | | | | | | | | | |
WESCO International Incorporated † | | | | | | | 7,726 | | | | 636,545 | |
| | | | | | | | | | | | |
| | | | |
Information Technology: 12.73% | | | | | | | | | | | | |
| | | | |
| Electronic Equipment, Instruments & Components: 1.82% | | | | | | | | | | | | |
Synnex Corporation | | | | | | | 15,724 | | | | 1,123,323 | |
TE Connectivity Limited | | | | | | | 7,718 | | | | 495,496 | |
| | | | |
| | | | | | | | | | | 1,618,819 | |
| | | | | | | | | | | | |
| | | | |
| Internet Software & Services: 2.12% | | | | | | | | | | | | |
AOL Incorporated † | | | | | | | 17,068 | | | | 787,859 | |
Yahoo! Incorporated † | | | | | | | 21,125 | | | | 1,093,008 | |
| | | | |
| | | | | | | | | | | 1,880,867 | |
| | | | | | | | | | | | |
| | | | |
| IT Services: 0.53% | | | | | | | | | | | | |
Teradata Corporation † | | | | | | | 10,346 | | | | 467,018 | |
| | | | | | | | | | | | |
The accompanying notes are an integral part of these financial statements.
| | | | | | |
| Portfolio of investments—November 30, 2014 (unaudited) | | Wells Fargo Advantage Equity Gateway Funds | | | 93 | |
LARGE COMPANY VALUE PORTFOLIO
| | | | | | | | | | | | | | | | |
| Security name | | | | | | | | | Shares | | | Value | |
| | | | | |
| Semiconductors & Semiconductor Equipment: 2.04% | | | | | | | | | | | | | | | | |
Skyworks Solutions Incorporated | | | | | | | | | | | 26,834 | | | $ | 1,810,490 | |
| | | | | | | | | | | | | | | | |
| | | | | |
| Technology Hardware, Storage & Peripherals: 6.22% | | | | | | | | | | | | | | | | |
Apple Incorporated | | | | | | | | | | | 13,430 | | | | 1,597,230 | |
EMC Corporation | | | | | | | | | | | 48,172 | | | | 1,462,020 | |
Hewlett-Packard Company | | | | | | | | | | | 23,512 | | | | 918,379 | |
NCR Corporation † | | | | | | | | | | | 35,415 | | | | 1,050,055 | |
Seagate Technology plc | | | | | | | | | | | 7,504 | | | | 496,089 | |
| | | | | |
| | | | | | | | | | | | | | | 5,523,773 | |
| | | | | | | | | | | | | | | | |
| | | | | |
Materials: 3.62% | | | | | | | | | | | | | | | | |
| | | | | |
| Chemicals: 1.90% | | | | | | | | | | | | | | | | |
Cabot Corporation | | | | | | | | | | | 13,440 | | | | 578,995 | |
Huntsman Corporation | | | | | | | | | | | 43,520 | | | | 1,110,630 | |
| | | | | |
| | | | | | | | | | | | | | | 1,689,625 | |
| | | | | | | | | | | | | | | | |
| | | | | |
| Containers & Packaging: 1.07% | | | | | | | | | | | | | | | | |
Crown Holdings Incorporated † | | | | | | | | | | | 19,245 | | | | 952,628 | |
| | | | | | | | | | | | | | | | |
| | | | | |
| Paper & Forest Products: 0.65% | | | | | | | | | | | | | | | | |
International Paper Company | | | | | | | | | | | 10,711 | | | | 576,466 | |
| | | | | | | | | | | | | | | | |
| | | | | |
Telecommunication Services: 1.93% | | | | | | | | | | | | | | | | |
| | | | | |
| Diversified Telecommunication Services: 1.93% | | | | | | | | | | | | | | | | |
CenturyLink Incorporated | | | | | | | | | | | 17,637 | | | | 719,060 | |
Verizon Communications Incorporated | | | | | | | | | | | 19,685 | | | | 995,864 | |
| | | | | |
| | | | | | | | | | | | | | | 1,714,924 | |
| | | | | | | | | | | | | | | | |
| | | | | |
Utilities: 3.50% | | | | | | | | | | | | | | | | |
| | | | | |
| Electric Utilities: 2.60% | | | | | | | | | | | | | | | | |
Duke Energy Corporation | | | | | | | | | | | 13,268 | | | | 1,073,381 | |
The Southern Company | | | | | | | | | | | 26,004 | | | | 1,233,370 | |
| | | | | |
| | | | | | | | | | | | | | | 2,306,751 | |
| | | | | | | | | | | | | | | | |
| | | | | |
| Independent Power & Renewable Electricity Producers: 0.90% | | | | | | | | | | | | | | | | |
AES Corporation | | | | | | | | | | | 57,960 | | | | 803,905 | |
| | | | | | | | | | | | | | | | |
| | | | | |
Total Common Stocks (Cost $69,483,953) | | | | | | | | | | | | | | | 87,737,524 | |
| | | | | | | | | | | | | | | | |
| | | Yield | | | | | | | | | | | |
| | | | | |
Short-Term Investments: 2.41% | | | | | | | | | | | | | | | | |
| | | | | |
| Investment Companies: 2.41% | | | | | | | | | | | | | | | | |
Securities Lending Cash Investments, LLC (l)(r)(u) | | | 0.12 | % | | | | | | | 404,950 | | | | 404,950 | |
Wells Fargo Advantage Cash Investment Money Market Fund, Select Class (l)(u) | | | 0.08 | | | | | | | | 1,733,742 | | | | 1,733,742 | |
| | | | | |
Total Short-Term Investments (Cost $2,138,692) | | | | | | | | | | | | | | | 2,138,692 | |
| | | | | | | | | | | | | | | | |
| | | | | | | | |
| Total investments in securities (Cost $71,622,645) * | | | 101.21 | % | | | 89,876,216 | |
Other assets and liabilities, net | | | (1.21 | ) | | | (1,073,498 | ) |
| | | | | | | | |
| Total net assets | | | 100.00 | % | | $ | 88,802,718 | |
| | | | | | | | |
The accompanying notes are an integral part of these financial statements.
| | | | |
| 94 | | Wells Fargo Advantage Equity Gateway Funds | | Portfolio of investments—November 30, 2014 (unaudited) |
LARGE COMPANY VALUE PORTFOLIO
| † | Non-income-earning security |
| « | All or a portion of this security is on loan. |
| (l) | The security represents an affiliate of the Portfolio as defined in the Investment Company Act of 1940. |
| (r) | The investment is a non-registered investment vehicle purchased with cash collateral received from securities on loan. |
| (u) | The rate represents the 7-day annualized yield at period end. |
| * | Cost for federal income tax purposes is $72,235,908 and unrealized gains (losses) consists of: |
| | | | |
Gross unrealized gains | | $ | 19,528,368 | |
Gross unrealized losses | | | (1,888,060 | ) |
| | | | |
Net unrealized gains | | $ | 17,640,308 | |
The accompanying notes are an integral part of these financial statements.
| | | | | | |
| Portfolio of investments—November 30, 2014 (unaudited) | | Wells Fargo Advantage Equity Gateway Funds | | | 95 | |
SMALL COMPANY GROWTH PORTFOLIO
| | | | | | | | | | | | |
| Security name | | | | | | Shares | | | Value | |
| | | | |
Common Stocks: 96.13% | | | | | | | | | | | | |
| | | | |
Consumer Discretionary: 12.96% | | | | | | | | | | | | |
| | | | |
| Auto Components: 0.66% | | | | | | | | | | | | |
Modine Manufacturing Company † | | | | | | | 253,128 | | | $ | 3,080,566 | |
| | | | | | | | | | | | |
| | | | |
| Diversified Consumer Services: 1.38% | | | | | | | | | | | | |
2U Incorporated Ǡ | | | | | | | 159,562 | | | | 2,884,881 | |
Nord Anglia Education Incorporated † | | | | | | | 216,620 | | | | 3,585,061 | |
| | | | |
| | | | | | | | | | | 6,469,942 | |
| | | | | | | | | | | | |
| | | | |
| Hotels, Restaurants & Leisure: 2.58% | | | | | | | | | | | | |
Brinker International Incorporated | | | | | | | 79,275 | | | | 4,465,561 | |
Del Frisco’s Restaurant Group Incorporated † | | | | | | | 150,506 | | | | 3,344,243 | |
Krispy Kreme Doughnuts Incorporated † | | | | | | | 208,310 | | | | 4,241,192 | |
| | | | |
| | | | | | | | | | | 12,050,996 | |
| | | | | | | | | | | | |
| | | | |
| Household Durables: 0.18% | | | | | | | | | | | | |
LGI Homes Incorporated Ǡ | | | | | | | 53,415 | | | | 853,572 | |
| | | | | | | | | | | | |
| | | | |
| Leisure Products: 0.56% | | | | | | | | | | | | |
Malibu Boats Incorporated † | | | | | | | 140,100 | | | | 2,622,672 | |
| | | | | | | | | | | | |
| | | | |
| Media: 1.89% | | | | | | | | | | | | |
IMAX Corporation † | | | | | | | 150,976 | | | | 4,737,627 | |
Lions Gate Entertainment Corporation | | | | | | | 121,409 | | | | 4,115,765 | |
| | | | |
| | | | | | | | | | | 8,853,392 | |
| | | | | | | | | | | | |
| | | | |
| Multiline Retail: 0.78% | | | | | | | | | | | | |
Burlington Stores Incorporated † | | | | | | | 81,990 | | | | 3,662,493 | |
| | | | | | | | | | | | |
| | | | |
| Specialty Retail: 2.99% | | | | | | | | | | | | |
Chico’s FAS Incorporated | | | | | | | 160,897 | | | | 2,553,435 | |
Christopher & Banks Corporation † | | | | | | | 366,393 | | | | 2,652,685 | |
Dick’s Sporting Goods Incorporated | | | | | | | 84,239 | | | | 4,263,336 | |
Monro Muffler Brake Incorporated | | | | | | | 82,763 | | | | 4,534,585 | |
| | | | |
| | | | | | | | | | | 14,004,041 | |
| | | | | | | | | | | | |
| | | | |
| Textiles, Apparel & Luxury Goods: 1.94% | | | | | | | | | | | | |
Movado Group Incorporated | | | | | | | 62,290 | | | | 1,789,592 | |
Skechers U.S.A. Incorporated Class A † | | | | | | | 71,058 | | | | 4,363,672 | |
Tumi Holdings Incorporated † | | | | | | | 134,479 | | | | 2,943,745 | |
| | | | |
| | | | | | | | | | | 9,097,009 | |
| | | | | | | | | | | | |
| | | | |
Consumer Staples: 1.50% | | | | | | | | | | | | |
| | | | |
| Food Products: 1.50% | | | | | | | | | | | | |
Darling Ingredients Incorporated † | | | | | | | 164,827 | | | | 3,065,782 | |
Whitewave Foods Company † | | | | | | | 107,916 | | | | 3,952,963 | |
| | | | |
| | | | | | | | | | | 7,018,745 | |
| | | | | | | | | | | | |
The accompanying notes are an integral part of these financial statements.
| | | | |
| 96 | | Wells Fargo Advantage Equity Gateway Funds | | Portfolio of investments—November 30, 2014 (unaudited) |
SMALL COMPANY GROWTH PORTFOLIO
| | | | | | | | | | | | |
| Security name | | | | | | Shares | | | Value | |
| | | | |
Energy: 4.06% | | | | | | | | | | | | |
| | | | |
| Energy Equipment & Services: 1.42% | | | | | | | | | | | | |
C&J Energy Services Incorporated † | | | | | | | 130,160 | | | $ | 1,971,924 | |
Hornbeck Offshore Services Incorporated † | | | | | | | 92,340 | | | | 2,450,704 | |
Natural Gas Services Group Incoporated † | | | | | | | 95,515 | | | | 2,212,128 | |
| | | | |
| | | | | | | | | | | 6,634,756 | |
| | | | | | | | | | | | |
| | | | |
| Oil, Gas & Consumable Fuels: 2.64% | | | | | | | | | | | | |
Delek US Holdings Incorporated | | | | | | | 96,975 | | | | 2,899,553 | |
Diamondback Energy Incorporated † | | | | | | | 37,139 | | | | 2,094,640 | |
GasLog Limited « | | | | | | | 131,063 | | | | 2,311,951 | |
Oasis Petroleum Incorporated † | | | | | | | 98,311 | | | | 1,806,956 | |
Ring Energy Incorporated Ǡ | | | | | | | 147,350 | | | | 1,408,666 | |
Sanchez Energy Corporation Ǡ | | | | | | | 164,170 | | | | 1,853,479 | |
| | | | |
| | | | | | | | | | | 12,375,245 | |
| | | | | | | | | | | | |
| | | | |
Financials: 10.00% | | | | | | | | | | | | |
| | | | |
| Banks: 2.96% | | | | | | | | | | | | |
PacWest Bancorp | | | | | | | 70,629 | | | | 3,284,249 | |
ServisFirst Bancshares Incorporated | | | | | | | 70,980 | | | | 2,242,968 | |
Signature Bank † | | | | | | | 30,593 | | | | 3,710,013 | |
SVB Financial Group † | | | | | | | 43,932 | | | | 4,619,450 | |
| | | | |
| | | | | | | | | | | 13,856,680 | |
| | | | | | | | | | | | |
| | | | |
| Capital Markets: 3.95% | | | | | | | | | | | | |
Evercore Partners Incorporated Class A | | | | | | | 120,264 | | | | 6,073,332 | |
LPL Financial Holdings Incorporated | | | | | | | 106,901 | | | | 4,561,466 | |
Stifel Financial Corporation † | | | | | | | 93,428 | | | | 4,534,061 | |
Virtus Investment Partners Incorporated | | | | | | | 21,604 | | | | 3,327,016 | |
| | | | |
| | | | | | | | | | | 18,495,875 | |
| | | | | | | | | | | | |
| | | | |
| Insurance: 1.11% | | | | | | | | | | | | |
Argo Group International Holdings Limited | | | | | | | 91,920 | | | | 5,187,965 | |
| | | | | | | | | | | | |
| | | | |
| REITs: 0.85% | | | | | | | | | | | | |
QTS Realty Trust Incorporated Class A « | | | | | | | 123,255 | | | | 4,008,253 | |
| | | | | | | | | | | | |
| | | | |
| Thrifts & Mortgage Finance: 1.13% | | | | | | | | | | | | |
Essent Group Limited † | | | | | | | 209,854 | | | | 5,288,321 | |
| | | | | | | | | | | | |
| | | | |
Health Care: 25.38% | | | | | | | | | | | | |
| | | | |
| Biotechnology: 7.62% | | | | | | | | | | | | |
Alnylam Pharmaceuticals Incorporated † | | | | | | | 41,892 | | | | 4,212,241 | |
AMAG Pharmaceuticals Incorporated † | | | | | | | 73,960 | | | | 2,751,312 | |
Celldex Therapeutics Incorporated Ǡ | | | | | | | 154,590 | | | | 3,135,085 | |
Cepheid Incorporated † | | | | | | | 137,380 | | | | 7,566,890 | |
Exact Sciences Corporation † | | | | | | | 183,912 | | | | 4,564,696 | |
Intrexon Corporation Ǡ | | | | | | | 85,827 | | | | 2,276,990 | |
NPS Pharmaceuticals Incorporated † | | | | | | | 98,790 | | | | 3,277,852 | |
The accompanying notes are an integral part of these financial statements.
| | | | | | |
| Portfolio of investments—November 30, 2014 (unaudited) | | Wells Fargo Advantage Equity Gateway Funds | | | 97 | |
SMALL COMPANY GROWTH PORTFOLIO
| | | | | | | | | | | | |
| Security name | | | | | | Shares | | | Value | |
| | | | |
| Biotechnology (continued) | | | | | | | | | | | | |
Portola Pharmaceuticals Incorporated † | | | | | | | 97,815 | | | $ | 2,750,558 | |
Tesaro Incorporated Ǡ | | | | | | | 97,421 | | | | 3,361,999 | |
Tetraphase Pharmaceuticals † | | | | | | | 67,198 | | | | 1,774,027 | |
| | | | |
| | | | | | | | | | | 35,671,650 | |
| | | | | | | | | | | | |
| | | | |
| Health Care Equipment & Supplies: 7.29% | | | | | | | | | | | | |
Accuray Incorporated Ǡ | | | | | | | 384,328 | | | | 2,648,020 | |
Analogic Corporation | | | | | | | 46,130 | | | | 3,360,109 | |
Atricure Incorporated † | | | | | | | 186,830 | | | | 3,499,326 | |
Cerus Corporation Ǡ | | | | | | | 599,269 | | | | 2,714,689 | |
DexCom Incorporated † | | | | | | | 86,876 | | | | 4,470,639 | |
Endologix Incorporated † | | | | | | | 341,722 | | | | 4,384,293 | |
Inogen Incorporated † | | | | | | | 128,430 | | | | 3,119,565 | |
Insulet Corporation † | | | | | | | 73,149 | | | | 3,408,012 | |
Nevro Corporation † | | | | | | | 48,221 | | | | 1,301,485 | |
Spectranetics Corporation † | | | | | | | 148,384 | | | | 4,871,447 | |
Veracyte Incorporated Ǡ | | | | | | | 56,380 | | | | 367,598 | |
| | | | |
| | | | | | | | | | | 34,145,183 | |
| | | | | | | | | | | | |
| | | | |
| Health Care Providers & Services: 5.90% | | | | | | | | | | | | |
Adeptus Health Incorporated Class A Ǡ | | | | | | | 123,230 | | | | 3,751,121 | |
AMN Healthcare Services Incorporated † | | | | | | | 333,469 | | | | 5,708,989 | |
Capital Senior Living Corporation † | | | | | | | 142,590 | | | | 3,628,916 | |
Ensign Group Incorporated | | | | | | | 84,645 | | | | 3,336,706 | |
HealthEquity Incorporated † | | | | | | | 246,210 | | | | 6,113,394 | |
LifePoint Hospitals Incorporated † | | | | | | | 73,716 | | | | 5,100,410 | |
| | | | |
| | | | | | | | | | | 27,639,536 | |
| | | | | | | | | | | | |
| | | | |
| Health Care Technology: 0.70% | | | | | | | | | | | | |
Imprivata Incorporated † | | | | | | | 70,190 | | | | 1,039,514 | |
Medidata Solutions Incorporated † | | | | | | | 52,122 | | | | 2,226,131 | |
| | | | |
| | | | | | | | | | | 3,265,645 | |
| | | | | | | | | | | | |
| | | | |
| Life Sciences Tools & Services: 1.28% | | | | | | | | | | | | |
ICON plc ADR † | | | | | | | 107,632 | | | | 5,977,881 | |
| | | | | | | | | | | | |
| | | | |
| Pharmaceuticals: 2.59% | | | | | | | | | | | | |
Akorn Incorporated † | | | | | | | 124,781 | | | | 4,999,975 | |
Cempra Holdings Incorporated Ǡ | | | | | | | 154,960 | | | | 2,229,874 | |
Pacira Pharmaceuticals Incorporated † | | | | | | | 32,418 | | | | 3,045,023 | |
Pernix Therapeutics Holdings Incorporated † | | | | | | | 181,650 | | | | 1,883,711 | |
| | | | |
| | | | | | | | | | | 12,158,583 | |
| | | | | | | | | | | | |
| | | | |
Industrials: 13.66% | | | | | | | | | | | | |
| | | | |
| Aerospace & Defense: 1.66% | | | | | | | | | | | | |
Astronics Corporation | | | | | | | 82,778 | | | | 4,057,778 | |
Esterline Technologies Corporation † | | | | | | | 31,301 | | | | 3,719,498 | |
| | | | |
| | | | | | | | | | | 7,777,276 | |
| | | | | | | | | | | | |
The accompanying notes are an integral part of these financial statements.
| | | | |
| 98 | | Wells Fargo Advantage Equity Gateway Funds | | Portfolio of investments—November 30, 2014 (unaudited) |
SMALL COMPANY GROWTH PORTFOLIO
| | | | | | | | | | | | |
| Security name | | | | | | Shares | | | Value | |
| | | | |
| Air Freight & Logistics: 0.96% | | | | | | | | | | | | |
Hub Group Incorporated Class A † | | | | | | | 118,989 | | | $ | 4,476,366 | |
| | | | | | | | | | | | |
| | | | |
| Building Products: 2.79% | | | | | | | | | | | | |
A.O. Smith Corporation | | | | | | | 93,439 | | | | 5,039,165 | |
NCI Building Systems Incorporated † | | | | | | | 228,674 | | | | 4,267,057 | |
PGT Incorporated † | | | | | | | 399,440 | | | | 3,758,730 | |
| | | | |
| | | | | | | | | | | 13,064,952 | |
| | | | | | | | | | | | |
| | | | |
| Commercial Services & Supplies: 2.95% | | | | | | | | | | | | |
Copart Incorporated † | | | | | | | 126,200 | | | | 4,586,108 | |
Kar Auction Services Incorporated | | | | | | | 140,880 | | | | 4,881,492 | |
TrueBlue Incorporated † | | | | | | | 189,500 | | | | 4,349,025 | |
| | | | |
| | | | | | | | | | | 13,816,625 | |
| | | | | | | | | | | | |
| | | | |
| Machinery: 0.98% | | | | | | | | | | | | |
Wabash National Corporation † | | | | | | | 425,898 | | | | 4,595,439 | |
| | | | | | | | | | | | |
| | | | |
| Professional Services: 1.54% | | | | | | | | | | | | |
On Assignment Incorporated † | | | | | | | 175,604 | | | | 5,396,311 | |
RPX Corporation † | | | | | | | 137,685 | | | | 1,806,427 | |
| | | | |
| | | | | | | | | | | 7,202,738 | |
| | | | | | | | | | | | |
| | | | |
| Road & Rail: 2.28% | | | | | | | | | | | | |
Genesee & Wyoming Incorporated Class A † | | | | | | | 36,187 | | | | 3,567,676 | |
Roadrunner Transportation Systems Incorporated † | | | | | | | 126,907 | | | | 2,856,677 | |
Swift Transportation Company † | | | | | | | 146,206 | | | | 4,250,208 | |
| | | | |
| | | | | | | | | | | 10,674,561 | |
| | | | | | | | | | | | |
| | | | |
| Trading Companies & Distributors: 0.50% | | | | | | | | | | | | |
MSC Industrial Direct Company | | | | | | | 30,090 | | | | 2,337,090 | |
| | | | | | | | | | | | |
| | | | |
Information Technology: 24.22% | | | | | | | | | | | | |
| | | | |
| Communications Equipment: 2.41% | | | | | | | | | | | | |
Infinera Corporation † | | | | | | | 255,452 | | | | 3,481,811 | |
Palo Alto Networks Incorporated † | | | | | | | 38,013 | | | | 4,675,599 | |
Riverbed Technology Incorporated † | | | | | | | 151,647 | | | | 3,135,302 | |
| | | | |
| | | | | | | | | | | 11,292,712 | |
| | | | | | | | | | | | |
| | | | |
| Electronic Equipment, Instruments & Components: 1.05% | | | | | | | | | | | | |
OSI Systems Incorporated † | | | | | | | 69,616 | | | | 4,912,801 | |
| | | | | | | | | | | | |
| | | | |
| Internet Software & Services: 5.00% | | | | | | | | | | | | |
Benefitfocus Incorporated Ǡ | | | | | | | 96,160 | | | | 2,604,974 | |
Cornerstone OnDemand Incorporated Ǡ | | | | | | | 124,730 | | | | 3,962,672 | |
Everyday Health Incorporated Ǡ | | | | | | | 205,800 | | | | 2,663,052 | |
Marketo Incorporated Ǡ | | | | | | | 126,480 | | | | 4,042,301 | |
Pandora Media Incorporated † | | | | | | | 161,360 | | | | 3,172,338 | |
TrueCar Incorporated Ǡ | | | | | | | 225,860 | | | | 4,327,478 | |
Zillow Incorporated Class A † | | | | | | | 22,431 | | | | 2,654,933 | |
| | | | |
| | | | | | | | | | | 23,427,748 | |
| | | | | | | | | | | | |
The accompanying notes are an integral part of these financial statements.
| | | | | | |
| Portfolio of investments—November 30, 2014 (unaudited) | | Wells Fargo Advantage Equity Gateway Funds | | | 99 | |
SMALL COMPANY GROWTH PORTFOLIO
| | | | | | | | | | | | |
| Security name | | | | | | Shares | | | Value | |
| | | | |
| IT Services: 3.31% | | | | | | | | | | | | |
EVERTEC Incorporated | | | | | | | 169,099 | | | $ | 3,726,942 | |
InterXion Holding NV † | | | | | | | 122,524 | | | | 3,414,744 | |
Maximus Incorporated | | | | | | | 78,110 | | | | 4,092,183 | |
Vantiv Incorporated Class A † | | | | | | | 126,080 | | | | 4,253,939 | |
| | | | |
| | | | | | | | | | | 15,487,808 | |
| | | | | | | | | | | | |
| | | | |
| Semiconductors & Semiconductor Equipment: 5.94% | | | | | | | | | | | | |
Applied Micro Circuits Corporation † | | | | | | | 369,397 | | | | 2,183,136 | |
Exar Corporation † | | | | | | | 242,611 | | | | 2,215,038 | |
Microsemi Corporation † | | | | | | | 133,838 | | | | 3,640,394 | |
Nanometrics Incorporated † | | | | | | | 169,769 | | | | 2,519,372 | |
Semtech Corporation † | | | | | | | 125,453 | | | | 3,194,033 | |
Spansion Incorporated Class A † | | | | | | | 230,065 | | | | 5,376,619 | |
Synaptics Incorporated † | | | | | | | 53,852 | | | | 3,392,137 | |
Teradyne Incorporated | | | | | | | 265,927 | | | | 5,278,651 | |
| | | | |
| | | | | | | | | | | 27,799,380 | |
| | | | | | | | | | | | |
| | | | |
| Software: 6.51% | | | | | | | | | | | | |
Bottomline Technologies Incorporated † | | | | | | | 120,610 | | | | 2,957,357 | |
Cadence Design Systems Incorporated † | | | | | | | 289,902 | | | | 5,470,451 | |
PTC Incorporated † | | | | | | | 126,776 | | | | 4,953,138 | |
Qlik Technologies Incorporated † | | | | | | | 155,053 | | | | 4,780,284 | |
SS&C Technologies Holdings | | | | | | | 137,313 | | | | 6,941,172 | |
Synchronoss Technologies Incorporated † | | | | | | | 58,060 | | | | 2,486,710 | |
Ultimate Software Group Incorporated † | | | | | | | 19,721 | | | | 2,903,720 | |
| | | | |
| | | | | | | | | | | 30,492,832 | |
| | | | | | | | | | | | |
| | | | |
Materials: 4.35% | | | | | | | | | | | | |
| | | | |
| Chemicals: 2.05% | | | | | | | | | | | | |
Calgon Carbon Corporation † | | | | | | | 198,459 | | | | 4,050,548 | |
Flotek Industries Incorporated † | | | | | | | 142,017 | | | | 2,766,491 | |
Methanex Corporation | | | | | | | 54,136 | | | | 2,796,666 | |
| | | | |
| | | | | | | | | | | 9,613,705 | |
| | | | | | | | | | | | |
| | | | |
| Metals & Mining: 1.41% | | | | | | | | | | | | |
Constellium NV Class A † | | | | | | | 184,859 | | | | 2,911,529 | |
Steel Dynamics Incorporated | | | | | | | 163,941 | | | | 3,695,230 | |
| | | | |
| | | | | | | | | | | 6,606,759 | |
| | | | | | | | | | | | |
| | | | |
| Paper & Forest Products: 0.89% | | | | | | | | | | | | |
Boise Cascade Company † | | | | | | | 116,677 | | | | 4,164,202 | |
| | | | | | | | | | | | |
| | | | |
Total Common Stocks (Cost $377,232,425) | | | | | | | | | | | 450,161,995 | |
| | | | | | | | | | | | |
The accompanying notes are an integral part of these financial statements.
| | | | |
| 100 | | Wells Fargo Advantage Equity Gateway Funds | | Portfolio of investments—November 30, 2014 (unaudited) |
SMALL COMPANY GROWTH PORTFOLIO
| | | | | | | | | | | | | | |
| Security name | | Yield | | | | | Shares | | | Value | |
| | | | |
Short-Term Investments: 13.93% | | | | | | | | | | | | | | |
| | | | |
| Investment Companies: 13.93% | | | | | | | | | | | | | | |
Securities Lending Cash Investments, LLC (l)(r)(u) | | | 0.12 | % | | | | | 48,391,400 | | | $ | 48,391,400 | |
Wells Fargo Advantage Cash Investment Money Market Fund, Select Class (l)(u) | | | 0.08 | | | | | | 16,841,539 | | | | 16,841,539 | |
| | | | |
Total Short-Term Investments (Cost $65,232,939) | | | | | | | | | | | | | 65,232,939 | |
| | | | | | | | | | | | | | |
| | | | | | | | |
| Total investments in securities (Cost $442,465,364) * | | | 110.06 | % | | | 515,394,934 | |
Other assets and liabilities, net | | | (10.06 | ) | | | (47,111,790 | ) |
| | | | | | | | |
| Total net assets | | | 100.00 | % | | $ | 468,283,144 | |
| | | | | | | | |
| † | Non-income-earning security |
| « | All or a portion of this security is on loan. |
| (l) | The security represents an affiliate of the Portfolio as defined in the Investment Company Act of 1940. |
| (r) | The investment is a non-registered investment vehicle purchased with cash collateral received from securities on loan. |
| (u) | The rate represents the 7-day annualized yield at period end. |
| * | Cost for federal income tax purposes is $444,521,024 and unrealized gains (losses) consists of: |
| | | | |
Gross unrealized gains | | $ | 90,430,733 | |
Gross unrealized losses | | | (19,556,823 | ) |
| | | | |
Net unrealized gains | | $ | 70,873,910 | |
The accompanying notes are an integral part of these financial statements.
| | | | | | |
| Portfolio of investments—November 30, 2014 (unaudited) | | Wells Fargo Advantage Equity Gateway Funds | | | 101 | |
SMALL COMPANY VALUE PORTFOLIO
| | | | | | | | | | | | |
| Security name | | | | | | Shares | | | Value | |
| | | | |
Common Stocks: 96.29% | | | | | | | | | | | | |
| | | | |
Consumer Discretionary: 16.30% | | | | | | | | | | | | |
| | | | |
| Auto Components: 2.35% | | | | | | | | | | | | |
American Axle & Manufacturing Holdings Incorporated † | | | | | | | 130,919 | | | $ | 2,793,811 | |
Dana Holding Corporation | | | | | | | 94,200 | | | | 1,997,040 | |
| | | | |
| | | | | | | | | | | 4,790,851 | |
| | | | | | | | | | | | |
| | | | |
| Automobiles: 0.76% | | | | | | | | | �� | | | |
Thor Industries Incorporated | | | | | | | 26,450 | | | | 1,554,202 | |
| | | | | | | | | | | | |
| | | | |
| Distributors: 1.29% | | | | | | | | | | | | |
Core Mark Holding Company Incorporated | | | | | | | 43,818 | | | | 2,633,900 | |
| | | | | | | | | | | | |
| | | | |
| Diversified Consumer Services: 2.11% | | | | | | | | | | | | |
Apollo Group Incorporated Class A † | | | | | | | 38,092 | | | | 1,189,232 | |
Houghton Mifflin Harcourt Company † | | | | | | | 72,176 | | | | 1,387,223 | |
Steiner Leisure Limited † | | | | | | | 39,089 | | | | 1,730,470 | |
| | | | |
| | | | | | | | | | | 4,306,925 | |
| | | | | | | | | | | | |
| | | | |
| Hotels, Restaurants & Leisure: 1.11% | | | | | | | | | | | | |
ClubCorp Holdings Incorporated | | | | | | | 114,994 | | | | 2,266,532 | |
| | | | | | | | | | | | |
| | | | |
| Household Durables: 0.59% | | | | | | | | | | | | |
The Ryland Group Incorporated | | | | | | | 30,688 | | | | 1,200,821 | |
| | | | | | | | | | | | |
| | | | |
| Media: 1.14% | | | | | | | | | | | | |
Scholastic Corporation | | | | | | | 65,393 | | | | 2,321,452 | |
| | | | | | | | | | | | |
| | | | |
| Specialty Retail: 3.64% | | | | | | | | | | | | |
Asbury Automotive Group Incorporated † | | | | | | | 24,709 | | | | 1,870,718 | |
DSW Incorporated Class A | | | | | | | 82,288 | | | | 2,919,578 | |
Francescas Holdings Corporation † | | | | | | | 100,030 | | | | 1,268,380 | |
Rent-A-Center Incorporated | | | | | | | 39,399 | | | | 1,359,266 | |
| | | | |
| | | | | | | | | | | 7,417,942 | |
| | | | | | | | | | | | |
| | | | |
| Textiles, Apparel & Luxury Goods: 3.31% | | | | | | | | | | | | |
G-III Apparel Group Limited † | | | | | | | 26,169 | | | | 2,315,695 | |
Oxford Industries Incorporated | | | | | | | 31,997 | | | | 2,119,161 | |
Vera Bradley Incorporated †« | | | | | | | 100,354 | | | | 2,307,138 | |
| | | | |
| | | | | | | | | | | 6,741,994 | |
| | | | | | | | | | | | |
| | | | |
Consumer Staples: 0.79% | | | | | | | | | | | | |
| | | | |
| Food Products: 0.79% | | | | | | | | | | | | |
Post Holdings Incorporated † | | | | | | | 40,077 | | | | 1,603,080 | |
| | | | | | | | | | | | |
| | | | |
Energy: 2.96% | | | | | | | | | | | | |
| | | | |
| Oil, Gas & Consumable Fuels: 2.96% | | | | | | | | | | | | |
Carrizo Oil & Gas Incorporated † | | | | | | | 38,500 | | | | 1,519,210 | |
Laredo Petroleum Holdings Incorporated †« | | | | | | | 94,761 | | | | 990,252 | |
The accompanying notes are an integral part of these financial statements.
| | | | |
| 102 | | Wells Fargo Advantage Equity Gateway Funds | | Portfolio of investments—November 30, 2014 (unaudited) |
SMALL COMPANY VALUE PORTFOLIO
| | | | | | | | | | | | |
| Security name | | | | | | Shares | | | Value | |
| | | | |
| Oil, Gas & Consumable Fuels (continued) | | | | | | | | | | | | |
PDC Energy Incorporated † | | | | | | | 40,100 | | | $ | 1,183,351 | |
Rex Energy Corporation †« | | | | | | | 164,810 | | | | 1,156,966 | |
Sanchez Energy Corporation †« | | | | | | | 105,041 | | | | 1,185,913 | |
| | | | |
| | | | | | | | | | | 6,035,692 | |
| | | | | | | | | | | | |
| | | | |
Financials: 39.15% | | | | | | | | | | | | |
| | | | |
| Banks: 17.73% | | | | | | | | | | | | |
BancorpSouth Incorporated | | | | | | | 124,092 | | | | 2,716,374 | |
BankUnited Incorporated | | | | | | | 63,450 | | | | 1,916,190 | |
City National Corporation | | | | | | | 30,254 | | | | 2,335,306 | |
Columbia Banking System Incorporated | | | | | | | 55,735 | | | | 1,531,040 | |
Great Western Bancorp Incorporated † | | | | | | | 97,140 | | | | 2,172,050 | |
IBERIABANK Corporation | | | | | | | 39,117 | | | | 2,555,122 | |
Independent Bank Group Incorporated | | | | | | | 46,923 | | | | 2,012,997 | |
Investors Bancorp Incorporated | | | | | | | 219,394 | | | | 2,371,649 | |
MB Financial Incorporated | | | | | | | 57,448 | | | | 1,809,612 | |
National Bank Holdings Corporation Class A | | | | | | | 111,725 | | | | 2,148,472 | |
Old National Bancorp | | | | | | | 123,274 | | | | 1,750,491 | |
PrivateBancorp Incorporated | | | | | | | 94,397 | | | | 2,968,786 | |
Square 1 Financial Incorporated † | | | | | | | 22,840 | | | | 488,319 | |
ViewPoint Financial Group Incorporated | | | | | | | 76,636 | | | | 1,827,002 | |
Webster Financial Corporation | | | | | | | 67,837 | | | | 2,134,830 | |
Western Alliance Bancorp † | | | | | | | 129,978 | | | | 3,435,319 | |
Wintrust Financial Corporation | | | | | | | 44,177 | | | | 1,974,270 | |
| | | | |
| | | | | | | | | | | 36,147,829 | |
| | | | | | | | | | | | |
| | | | |
| Capital Markets: 1.05% | | | | | | | | | | | | |
Stifel Financial Corporation † | | | | | | | 43,993 | | | | 2,134,980 | |
| | | | | | | | | | | | |
| | | | |
| Insurance: 7.81% | | | | | | | | | | | | |
American Equity Investment Life Holding Company | | | | | | | 74,008 | | | | 1,998,216 | |
AmTrust Financial Services Incorporated | | | | | | | 39,156 | | | | 2,009,486 | |
CNO Financial Group Incorporated | | | | | | | 120,410 | | | | 2,087,909 | |
Employers Holdings Incorporated | | | | | | | 93,624 | | | | 1,898,695 | |
OneBeacon Insurance Group Limited | | | | | | | 99,656 | | | | 1,586,524 | |
Primerica Incorporated | | | | | | | 48,663 | | | | 2,551,401 | |
Selective Insurance Group Incorporated | | | | | | | 73,926 | | | | 1,978,999 | |
Symetra Financial Corporation | | | | | | | 79,964 | | | | 1,811,984 | |
| | | | |
| | | | | | | | | | | 15,923,214 | |
| | | | | | | | | | | | |
| | | | |
| Real Estate Management & Development: 0.78% | | | | | | | | | | | | |
Alexander & Baldwin Incorporated | | | | | | | 41,981 | | | | 1,598,636 | |
| | | | | | | | | | | | |
| | | | |
| REITs: 11.78% | | | | | | | | | | | | |
CareTrust REIT Incorporated † | | | | | | | 100,624 | | | | 1,627,090 | |
Cousins Properties Incorporated | | | | | | | 174,260 | | | | 2,132,942 | |
Education Realty Trust Incorporated | | | | | | | 245,042 | | | | 2,852,289 | |
Gramercy Property Trust Incorporated « | | | | | | | 308,200 | | | | 1,818,380 | |
Parkway Properties Incorporated | | | | | | | 103,997 | | | | 2,025,862 | |
The accompanying notes are an integral part of these financial statements.
| | | | | | |
| Portfolio of investments—November 30, 2014 (unaudited) | | Wells Fargo Advantage Equity Gateway Funds | | | 103 | |
SMALL COMPANY VALUE PORTFOLIO
| | | | | | | | | | | | |
| Security name | | | | | | Shares | | | Value | |
| | | | |
| REITs (continued) | | | | | | | | | | | | |
Pebblebrook Hotel Trust | | | | | | | 61,092 | | | $ | 2,637,342 | |
Physicians Realty Trust | | | | | | | 134,300 | | | | 2,076,278 | |
Ramco-Gershenson Properties Trust | | | | | | | 117,121 | | | | 2,096,466 | |
Sabra Health Care REIT Incorporated | | | | | | | 82,541 | | | | 2,336,736 | |
STAG Industrial Incorporated | | | | | | | 90,459 | | | | 2,156,543 | |
Sunstone Hotel Investors Incorporated | | | | | | | 140,367 | | | | 2,247,276 | |
| | | | |
| | | | | | | | | | | 24,007,204 | |
| | | | | | | | | | | | |
| | | | |
Health Care: 5.62% | | | | | | | | | | | | |
| | | | |
| Health Care Equipment & Supplies: 1.34% | | | | | | | | | | | | |
Alere Incorporated † | | | | | | | 68,497 | | | | 2,732,345 | |
| | | | | | | | | | | | |
| | | | |
| Health Care Providers & Services: 4.28% | | | | | | | | | | | | |
Ensign Group Incorporated | | | | | | | 61,144 | | | | 2,410,296 | |
Health Net Incorporated † | | | | | | | 64,163 | | | | 3,296,695 | |
WellCare Health Plans Incorporated † | | | | | | | 41,013 | | | | 3,024,299 | |
| | | | |
| | | | | | | | | | | 8,731,290 | |
| | | | | | | | | | | | |
| | | | |
Industrials: 9.77% | | | | | | | | | | | | |
| | | | |
| Air Freight & Logistics: 1.09% | | | | | | | | | | | | |
Atlas Air Worldwide Holdings Incorporated † | | | | | | | 48,655 | | | | 2,221,101 | |
| | | | | | | | | | | | |
| | | | |
| Commercial Services & Supplies: 3.04% | | | | | | | | | | | | |
ACCO Brands Corporation † | | | | | | | 255,684 | | | | 2,239,792 | |
Quad Graphics Incorporated | | | | | | | 89,777 | | | | 1,949,059 | |
United Stationers Incorporated | | | | | | | 49,119 | | | | 2,016,826 | |
| | | | |
| | | | | | | | | | | 6,205,677 | |
| | | | | | | | | | | | |
| | | | |
| Construction & Engineering: 0.97% | | | | | | | | | | | | |
Tutor Perini Corporation † | | | | | | | 78,095 | | | | 1,971,899 | |
| | | | | | | | | | | | |
| | | | |
| Machinery: 0.97% | | | | | | | | | | | | |
Briggs & Stratton Corporation | | | | | | | 67,031 | | | | 1,343,972 | |
Global Brass & Copper Holdings Incorporated | | | | | | | 51,986 | | | | 636,829 | |
| | | | |
| | | | | | | | | | | 1,980,801 | |
| | | | | | | | | | | | |
| | | | |
| Professional Services: 1.65% | | | | | | | | | | | | |
FTI Consulting Incorporated † | | | | | | | 66,881 | | | | 2,592,976 | |
Hill International Incorporated † | | | | | | | 211,016 | | | | 770,208 | |
| | | | |
| | | | | | | | | | | 3,363,184 | |
| | | | | | | | | | | | |
| | | | |
| Road & Rail: 1.36% | | | | | | | | | | | | |
Quality Distribution Incorporated † | | | | | | | 133,277 | | | | 1,608,653 | |
Universal Truckload Services | | | | | | | 42,306 | | | | 1,161,723 | |
| | | | |
| | | | | | | | | | | 2,770,376 | |
| | | | | | | | | | | | |
| | | | |
| Trading Companies & Distributors: 0.69% | | | | | | | | | | | | |
TAL International Group Incorporated « | | | | | | | 31,909 | | | | 1,410,059 | |
| | | | | | | | | | | | |
The accompanying notes are an integral part of these financial statements.
| | | | |
| 104 | | Wells Fargo Advantage Equity Gateway Funds | | Portfolio of investments—November 30, 2014 (unaudited) |
SMALL COMPANY VALUE PORTFOLIO
| | | | | | | | | | | | |
| Security name | | | | | | Shares | | | Value | |
| | | | |
Information Technology: 11.91% | | | | | | | | | | | | |
| | | | |
| Communications Equipment: 2.05% | | | | | | | | | | | | |
ARRIS Group Incorporated † | | | | | | | 95,933 | | | $ | 2,855,925 | |
Extreme Networks Incorporated † | | | | | | | 367,680 | | | | 1,331,002 | |
| | | | |
| | | | | | | | | | | 4,186,927 | |
| | | | | | | | | | | | |
| | | | |
| Electronic Equipment, Instruments & Components: 5.04% | | | | | | | | | | | | |
Celestica Incorporated † | | | | | | | 184,936 | | | | 1,989,911 | |
Itron Incorporated † | | | | | | | 46,834 | | | | 1,892,094 | |
Plexus Corporation † | | | | | | | 52,721 | | | | 2,056,646 | |
Sanmina Corporation † | | | | | | | 95,180 | | | | 2,341,428 | |
Tech Data Corporation † | | | | | | | 31,958 | | | | 1,991,942 | |
| | | | |
| | | | | | | | | | | 10,272,021 | |
| | | | | | | | | | | | |
| | | | |
| Semiconductors & Semiconductor Equipment: 2.14% | | | | | | | | | | | | |
Advanced Energy Industries Incorporated † | | | | | | | 114,315 | | | | 2,335,455 | |
Photronics Incorporated † | | | | | | | 113,925 | | | | 1,027,604 | |
Xcerra Corporation † | | | | | | | 124,511 | | | | 997,333 | |
| | | | |
| | | | | | | | | | | 4,360,392 | |
| | | | | | | | | | | | |
| | | | |
| Software: 1.53% | | | | | | | | | | | | |
EPIQ Systems Incorporated | | | | | | | 97,481 | | | | 1,495,359 | |
Mentor Graphics Corporation | | | | | | | 73,693 | | | | 1,636,722 | |
| | | | |
| | | | | | | | | | | 3,132,081 | |
| | | | | | | | | | | | |
| | | | |
| Technology Hardware, Storage & Peripherals: 1.15% | | | | | | | | | | | | |
QLogic Corporation † | | | | | | | 202,559 | | | | 2,337,531 | |
| | | | | | | | | | | | |
| | | | |
Materials: 4.42% | | | | | | | | | | | | |
| | | | |
| Chemicals: 1.37% | | | | | | | | | | | | |
Chemtura Corporation † | | | | | | | 85,113 | | | | 1,983,133 | |
Zep Incorporated | | | | | | | 59,452 | | | | 809,142 | |
| | | | |
| | | | | | | | | | | 2,792,275 | |
| | | | | | | | | | | | |
| | | | |
| Metals & Mining: 3.05% | | | | | | | | | | | | |
Commercial Metals Company | | | | | | | 110,219 | | | | 1,800,978 | |
Horsehead Holding Corporation † | | | | | | | 153,518 | | | | 2,397,951 | |
Suncoke Energy Incorporated | | | | | | | 99,083 | | | | 2,014,357 | |
| | | | |
| | | | | | | | | | | 6,213,286 | |
| | | | | | | | | | | | |
| | | | |
Telecommunication Services: 0.50% | | | | | | | | | | | | |
| | | | |
| Diversified Telecommunication Services: 0.50% | | | | | | | | | | | | |
ORBCOMM Incorporated † | | | | | | | 157,260 | | | | 1,019,045 | |
| | | | | | | | | | | | |
| | | | |
Utilities: 4.87% | | | | | | | | | | | | |
| | | | |
| Electric Utilities: 4.87% | | | | | | | | | | | | |
El Paso Electric Company | | | | | | | 60,431 | | | | 2,286,104 | |
PNM Resources Incorporated | | | | | | | 82,597 | | | | 2,392,009 | |
The accompanying notes are an integral part of these financial statements.
| | | | | | |
| Portfolio of investments—November 30, 2014 (unaudited) | | Wells Fargo Advantage Equity Gateway Funds | | | 105 | |
SMALL COMPANY VALUE PORTFOLIO
| | | | | | | | | | | | | | | | |
| Security name | | | | | | | | Shares | | | Value | |
| | | | |
| Electric Utilities (continued) | | | | | | | | | | | | | | | | |
Portland General Electric Company | | | | | | | | | | | 73,294 | | | $ | 2,702,350 | |
UIL Holdings Corporation | | | | | | | | | | | 64,000 | | | | 2,547,202 | |
| | | | |
| | | | | | | | | | | | | | | 9,927,665 | |
| | | | | | | | | | | | | | | | |
| | | | |
Total Common Stocks (Cost $153,876,536) | | | | | | | | | | | | | | | 196,313,209 | |
| | | | | | | | | | | | | | | | |
| | | | |
| | | | | | Expiration date | | | | | | | |
| | | | |
Warrants: 0.00% | | | | | | | | | | | | | | | | |
| | | | |
Health Care: 0.00% | | | | | | | | | | | | | | | | |
| | | | |
| Health Care Equipment & Supplies: 0.00% | | | | | | | | | | | | | | | | |
EnteroMedics Incorporated †(a) | | | | | | | 5-14-2016 | | | | 9,104 | | | | 6,201 | |
| | | | | | | | | | | | | | | | |
| | | | |
Total Warrants (Cost $0) | | | | | | | | | | | | | | | 6,201 | |
| | | | | | | | | | | | | | | | |
| | | | |
| | | Yield | | | | | | | | | | |
| Short-Term Investments: 6.76% | | | | | | | | | | | | | | | | |
| | | | |
| Investment Companies: 6.76% | | | | | | | | | | | | | | | | |
Securities Lending Cash Investments, LLC (u)(l)(r) | | | 0.12 | % | | | | | | | 6,184,225 | | | | 6,184,225 | |
Wells Fargo Advantage Cash Investment Money Market Fund, Select Class (u)(l) | | | 0.08 | | | | | | | | 7,594,762 | | | | 7,594,762 | |
| | | | |
Total Short-Term Investments (Cost $13,778,987) | | | | | | | | | | | | | | | 13,778,987 | |
| | | | | | | | | | | | | | | | |
| | | | | | | | |
| Total investments in securities (Cost $167,655,523) * | | | 103.05 | % | | | 210,098,397 | |
Other assets and liabilities, net | | | (3.05 | ) | | | (6,213,944 | ) |
| | | | | | | | |
| Total net assets | | | 100.00 | % | | $ | 203,884,453 | |
| | | | | | | | |
| † | Non-income-earning security |
| « | All or a portion of this security is on loan. |
| (a) | The security is fair valued in accordance with procedures approved by the Board of Trustees. |
| (u) | The rate represents the 7-day annualized yield at period end. |
| (l) | The security represents an affiliate of the Portfolio as defined in the Investment Company Act of 1940. |
| (r) | The investment is a non-registered investment vehicle purchased with cash collateral received from securities on loan. |
| * | Cost for federal income tax purposes is $168,006,920 and unrealized gains (losses) consists of: |
| | | | |
Gross unrealized gains | | $ | 48,781,875 | |
Gross unrealized losses | | | (6,690,398 | ) |
| | | | |
Net unrealized gains | | $ | 42,091,477 | |
The accompanying notes are an integral part of these financial statements.
| | | | |
| 106 | | Wells Fargo Advantage Equity Gateway Funds | | Statements of assets and liabilities—November 30, 2014 (unaudited) |
| | | | | | | | |
| | | C&B Large Cap
Value Portfolio | | | Diversified Large
Cap Growth
Portfolio | |
| | |
Assets | | | | | | | | |
Investments | | | | | | | | |
In unffiliated securities (including securities on loan), at value (see cost below) | | $ | 310,964,050 | | | $ | 133,173,819 | |
In affiliated securities, at value (see cost below) | | | 24,831,887 | | | | 3,251,523 | |
| | | | |
Total investments, at value (see cost below) | | | 335,795,937 | | | | 136,425,342 | |
Cash | | | 21,207 | | | | 0 | |
Foreign currency, at value (see cost below) | | | 0 | | | | 0 | |
Receivable for investments sold | | | 1,943,425 | | | | 340,761 | |
Receivable for dividends | | | 604,712 | | | | 114,298 | |
Receivable for securities lending income | | | 1,086 | | | | 532 | |
Prepaid expenses and other assets | | | 2,561 | | | | 2,947 | |
| | | | |
Total assets | | | 338,368,928 | | | | 136,883,880 | |
| | | | |
| | |
Liabilities | | | | | | | | |
Payable for investments purchased | | | 0 | | | | 655,678 | |
Payable upon receipt of securities loaned | | | 0 | | | | 1,815,925 | |
Payable for daily variation margin on open futures contracts | | | 0 | | | | 0 | |
Advisory fee payable | | | 178,278 | | | | 60,737 | |
Professional fees payable | | | 16,958 | | | | 17,739 | |
Accrued expenses and other liabilities | | | 8,716 | | | | 7,928 | |
| | | | |
Total liabilities | | | 203,952 | | | | 2,558,007 | |
| | | | |
Total net assets | | $ | 338,164,976 | | | $ | 134,325,873 | |
| | | | |
| | |
Investments in unaffiliated securities, at cost | | $ | 215,386,586 | | | $ | 87,975,922 | |
| | | | |
Investments in affiliated securities, at cost | | $ | 24,831,887 | | | $ | 3,251,523 | |
| | | | |
Total investments, at cost | | $ | 240,218,473 | | | $ | 91,227,445 | |
| | | | |
Securities on loan, at value | | $ | 0 | | | $ | 1,778,336 | |
| | | | |
Foreign currency, at cost | | $ | 0 | | | $ | 0 | |
| | | | |
The accompanying notes are an integral part of these financial statements.
| | | | | | |
| Statements of assets and liabilities—November 30, 2014 (unaudited) | | Wells Fargo Advantage Equity Gateway Funds | | | 107 | |
| | | | | | | | | | | | | | | | | | | | | | | | | | |
Emerging Growth
Portfolio | | | Index Portfolio | | | International
Growth Portfolio | | | International Value
Portfolio | | | Large Company
Value Portfolio | | | Small Company
Growth Portfolio | | | Small Company
Value Portfolio | |
| | | | | | |
| | | | | | | | | | | | | | | | | | | | | | | | | | |
| | | | | | | | | | | | | | | | | | | | | | | | | | |
| $ | 1,114,960,030 | | | $ | 2,810,788,830 | | | $ | 155,769,579 | | | $ | 477,975,923 | | | $ | 87,737,524 | | | $ | 450,161,995 | | | $ | 196,319,410 | |
| | 136,874,464 | | | | 90,992,556 | | | | 3,267,843 | | | | 20,812,181 | | | | 2,138,692 | | | | 65,232,939 | | | | 13,778,987 | |
| | |
| | 1,251,834,494 | | | | 2,901,781,386 | | | | 159,037,422 | | | | 498,788,104 | | | | 89,876,216 | | | | 515,394,934 | | | | 210,098,397 | |
| | 0 | | | | 28,990 | | | | 0 | | | | 0 | | | | 3,689 | | | | 393,687 | | | | 0 | |
| | 0 | | | | 0 | | | | 55,063 | | | | 4,178,048 | | | | 0 | | | | 0 | | | | 0 | |
| | 0 | | | | 166,343 | | | | 764,583 | | | | 573,001 | | | | 284,855 | | | | 1,585,820 | | | | 22,974 | |
| | 91,511 | | | | 6,383,242 | | | | 122,568 | | | | 1,791,356 | | | | 176,754 | | | | 123,201 | | | | 102,705 | |
| | 67,854 | | | | 8,277 | | | | 5,238 | | | | 8,917 | | | | 861 | | | | 47,786 | | | | 2,475 | |
| | 8,347 | | | | 0 | | | | 6,623 | | | | 9,115 | | | | 3,923 | | | | 6,970 | | | | 3,672 | |
| | |
| | 1,252,002,206 | | | | 2,908,368,238 | | | | 159,991,497 | | | | 505,348,541 | | | | 90,346,298 | | | | 517,552,398 | | | | 210,230,223 | |
| | |
| | | | | | |
| | | | | | | | | | | | | | | | | | | | | | | | | | |
| | 263,144 | | | | 6,816,649 | | | | 771,940 | | | | 402,008 | | | | 1,068,145 | | | | 556,489 | | | | 0 | |
| | 130,887,098 | | | | 15,878,700 | | | | 1,787,826 | | | | 14,194,341 | | | | 404,950 | | | | 48,391,400 | | | | 6,184,225 | |
| | 0 | | | | 107,505 | | | | 0 | | | | 0 | | | | 0 | | | | 0 | | | | 0 | |
| | 725,530 | | | | 196,742 | | | | 107,687 | | | | 340,113 | | | | 47,352 | | | | 296,191 | | | | 135,488 | |
| | 18,223 | | | | 21,955 | | | | 20,091 | | | | 11,622 | | | | 18,872 | | | | 17,994 | | | | 17,459 | |
| | 19,275 | | | | 192,651 | | | | 20,547 | | | | 7,079 | | | | 4,261 | | | | 7,180 | | | | 8,598 | |
| | |
| | 131,913,270 | | | | 23,214,202 | | | | 2,708,091 | | | | 14,955,163 | | | | 1,543,580 | | | | 49,269,254 | | | | 6,345,770 | |
| | |
| $ | 1,120,088,936 | | | $ | 2,885,154,036 | | | $ | 157,283,406 | | | $ | 490,393,378 | | | $ | 88,802,718 | | | $ | 468,283,144 | | | $ | 203,884,453 | |
| | |
| | | | | | |
| $ | 797,241,970 | | | $ | 1,406,154,669 | | | $ | 120,672,186 | | | $ | 474,823,132 | | | $ | 69,483,953 | | | $ | 377,232,425 | | | $ | 153,876,536 | |
| | |
| $ | 136,874,464 | | | $ | 71,256,768 | | | $ | 3,267,843 | | | $ | 20,812,181 | | | $ | 2,138,692 | | | $ | 65,232,939 | | | $ | 13,778,987 | |
| | |
| $ | 934,116,434 | | | $ | 1,477,411,437 | | | $ | 123,940,029 | | | $ | 495,635,313 | | | $ | 71,622,645 | | | $ | 442,465,364 | | | $ | 167,655,523 | |
| | |
| $ | 127,774,235 | | | $ | 15,509,047 | | | $ | 1,708,610 | | | $ | 13,451,572 | | | $ | 394,849 | | | $ | 47,226,460 | | | $ | 6,024,011 | |
| | |
| $ | 0 | | | $ | 0 | | | $ | 55,510 | | | $ | 4,477,747 | | | $ | 0 | | | $ | 0 | | | $ | 0 | |
| | |
The accompanying notes are an integral part of these financial statements.
| | | | |
| 108 | | Wells Fargo Advantage Equity Gateway Funds | | Statements of operations—six months ended November 30, 2014 (unaudited) |
| | | | | | | | |
| | | C&B Large Cap Value Portfolio | | | Diversified Large
Cap Growth Portfolio | |
| | |
Investment income | | | | | | | | |
Dividends * | | $ | 2,952,791 | | | $ | 564,374 | |
Income from affiliated securities | | | 5,107 | | | | 497 | |
Securities lending income, net | | | 2,949 | | | | 9,176 | |
Interest | | | 0 | | | | 0 | |
| | | | |
Total investment income | | | 2,960,847 | | | | 574,047 | |
| | | | |
| | |
Expenses | | | | | | | | |
Advisory fee | | | 1,046,467 | | | | 438,979 | |
Custody and accounting fees | | | 11,970 | | | | 12,455 | |
Professional fees | | | 21,960 | | | | 24,024 | |
Shareholder report expenses | | | 726 | | | | 690 | |
Trustees’ fees and expenses | | | 5,547 | | | | 6,445 | |
Other fees and expenses | | | 4,677 | | | | 2,848 | |
| | | | |
Total expenses | | | 1,091,347 | | | | 485,441 | |
Less: Fee waivers and/or expense reimbursements | | | 0 | | | | (65,304 | ) |
| | | | |
Net expenses | | | 1,091,347 | | | | 420,137 | |
| | | | |
Net investment income (loss) | | | 1,869,500 | | | | 153,910 | |
| | | | |
| | |
REALIZED AND UNREALIZED GAINS (LOSSES) ON INVESTMENTS | | | | | | | | |
| | |
Net realized gains on: | | | | | | | | |
Unaffiliated securities | | | 23,094,390 | | | | 7,393,125 | |
Affiliated securities | | | 0 | | | | 0 | |
Futures transactions | | | 0 | | | | 0 | |
| | | | |
Net realized gains on investments | | | 23,094,390 | | | | 7,393,125 | |
| | | | |
Net change in unrealized gains (losses) on: | | | | | | | | |
Unaffiliated securities | | | (4,132,467 | ) | | | 3,667,923 | |
Affiliated securities | | | 0 | | | | 0 | |
Futures transactions | | | 0 | | | | 0 | |
| | | | |
Net change in unrealized gains (losses) on investments | | | (4,132,467 | ) | | | 3,667,923 | |
| | | | |
Net realized and unrealized gains (losses) on investments | | | 18,961,923 | | | | 11,061,048 | |
| | | | |
Net increase (decrease) in net assets resulting from operations | | $ | 20,831,423 | | | $ | 11,214,958 | |
| | | | |
| | |
* Net of foreign dividend withholding taxes in the amount of | | | $20,746 | | | | $651 | |
The accompanying notes are an integral part of these financial statements.
| | | | | | |
| Statements of operations—six months ended November 30, 2014 (unaudited) | | Wells Fargo Advantage Equity Gateway Funds | | | 109 | |
| | | | | | | | | | | | | | | | | | | | | | | | | | |
Emerging Growth
Portfolio | | | Index Portfolio | | |
International Growth Portfolio | | | International Value Portfolio | | | Large Company Value Portfolio | | | Small Company Growth Portfolio | | | Small Company
Value Portfolio | |
| | | | | | |
| | | | | | | | | | | | | | | | | | | | | | | | | | |
| $ | 624,501 | | | $ | 28,243,948 | | | $ | 879,653 | | | $ | 6,450,877 | | | $ | 757,243 | | | $ | 788,155 | | | $ | 1,396,484 | |
| | 5,890 | | | | 534,595 | | | | 915 | | | | 1,849 | | | | 566 | | | | 6,680 | | | | 2,202 | |
| | 333,659 | | | | 44,926 | | | | 18,769 | | | | 155,455 | | | | 6,389 | | | | 246,662 | | | | 23,906 | |
| | 0 | | | | 278 | | | | 28 | | | | 2,789 | | | | 0 | | | | 0 | | | | 0 | |
| | |
| | 964,050 | | | | 28,823,747 | | | | 899,365 | | | | 6,610,970 | | | | 764,198 | | | | 1,041,497 | | | | 1,422,592 | |
| | |
| | | | | | |
| | | | | | | | | | | | | | | | | | | | | | | | | | |
| | 4,330,904 | | | | 1,174,627 | | | | 649,796 | | | | 2,131,768 | | | | 292,151 | | | | 1,588,944 | | | | 817,710 | |
| | 33,307 | | | | 79,054 | | | | 54,322 | | | | 69,747 | | | | 6,499 | | | | 16,838 | | | | 11,082 | |
| | 23,784 | | | | 27,282 | | | | 26,265 | | | | 28,075 | | | | 24,128 | | | | 23,114 | | | | 22,002 | |
| | 2,391 | | | | 4,099 | | | | 1,867 | | | | 1,884 | | | | 639 | | | | 1,411 | | | | 1,760 | |
| | 6,092 | | | | 6,093 | | | | 6,366 | | | | 6,372 | | | | 6,556 | | | | 6,095 | | | | 6,252 | |
| | 10,481 | | | | 200,397 | | | | 11,053 | | | | 25,291 | | | | 3,231 | | | | 3,666 | | | | 3,021 | |
| | |
| | 4,406,959 | | | | 1,491,552 | | | | 749,669 | | | | 2,263,137 | | | | 333,204 | | | | 1,640,068 | | | | 861,827 | |
| | 0 | | | | 0 | | | | 0 | | | | 0 | | | | (1,326 | ) | | | 0 | | | | 0 | |
| | |
| | 4,406,959 | | | | 1,491,552 | | | | 749,669 | | | | 2,263,137 | | | | 331,878 | | | | 1,640,068 | | | | 861,827 | |
| | |
| | (3,442,909 | ) | | | 27,332,195 | | | | 149,696 | | | | 4,347,833 | | | | 432,320 | | | | (598,571 | ) | | | 560,765 | |
| | |
| | | | | | |
| | | | | | | | | | | | | | | | | | | | | | | | | | |
| | | | | | |
| | | | | | | | | | | | | | | | | | | | | | | | | | |
| | 48,390,077 | | | | 52,004,846 | | | | 2,894,828 | | | | 4,321,304 | | | | 3,929,387 | | | | 9,808,746 | | | | 8,398,624 | |
| | 0 | | | | 834,634 | | | | 0 | | | | 0 | | | | 0 | | | | 0 | | | | 0 | |
| | 0 | | | | 1,606,123 | | | | 0 | | | | 0 | | | | 0 | | | | 0 | | | | 0 | |
| | |
| | 48,390,077 | | | | 54,445,603 | | | | 2,894,828 | | | | 4,321,304 | | | | 3,929,387 | | | | 9,808,746 | | | | 8,398,624 | |
| | |
| | | | | | | | | | | | | | | | | | | | | | | | | | |
| | 80,834,486 | | | | 147,070,069 | | | | 289,174 | | | | (41,305,695 | ) | | | (649,802 | ) | | | 12,332,831 | | | | (7,937,428 | ) |
| | 0 | | | | 1,958,013 | | | | 0 | | | | 0 | | | | 0 | | | | 0 | | | | 0 | |
| | 0 | | | | 752,525 | | | | 0 | | | | 0 | | | | 0 | | | | 0 | | | | 0 | |
| | |
| | 80,834,486 | | | | 149,780,607 | | | | 289,174 | | | | (41,305,695 | ) | | | (649,802 | ) | | | 12,332,831 | | | | (7,937,428 | ) |
| | |
| | 129,224,563 | | | | 204,226,210 | | | | 3,184,002 | | | | (36,984,391 | ) | | | 3,279,585 | | | | 22,141,577 | | | | 461,196 | |
| | |
| $ | 125,781,654 | | | $ | 231,558,405 | | | $ | 3,333,698 | | | $ | (32,636,558 | ) | | $ | 3,711,905 | | | $ | 21,543,006 | | | $ | 1,021,961 | |
| | |
| | | | | | |
| | $0 | | | | $8,312 | | | | $123,755 | | | | $662,904 | | | | $13,441 | | | | $4,747 | | | | $0 | |
The accompanying notes are an integral part of these financial statements.
| | | | |
| 110 | | Wells Fargo Advantage Equity Gateway Funds | | Statements of changes in net assets |
| | | | | | | | |
| | | C&B Large Cap Value Portfolio | |
| | | Six months ended
November 30, 2014
(unaudited) | | | Year ended
May 31, 2014 | |
| | |
Operations | | | | | | | | |
Net investment income | | $ | 1,869,500 | | | $ | 4,519,408 | |
Net realized gains on investments | | | 23,094,390 | | | | 41,555,935 | |
Net change in unrealized gains (losses) on investments | | | (4,132,467 | ) | | | 9,188,214 | |
| | | | |
Net increase in net assets resulting from operations | | | 20,831,423 | | | | 55,263,557 | |
| | | | |
| | |
Capital share transactions | | | | | | | | |
Transactions in investors’ beneficial interests | | | | | | | | |
Contributions | | | 21,003,541 | | | | 24,307,963 | |
Withdrawals | | | (20,618,443 | ) | | | (109,777,604 | ) |
| | | | |
Net increase (decrease) in net assets resulting from capital share transactions | | | 385,098 | | | | (85,469,641 | ) |
| | | | |
Total increase (decrease) in net assets | | | 21,216,521 | | | | (30,206,084 | ) |
| | | | |
| | |
Net assets | | | | | | | | |
Beginning of period | | | 316,948,455 | | | | 347,154,539 | |
| | | | |
End of period | | $ | 338,164,976 | | | $ | 316,948,455 | |
| | | | |
The accompanying notes are an integral part of these financial statements.
| | | | | | |
| Statements of changes in net assets | | Wells Fargo Advantage Equity Gateway Funds | | | 111 | |
| | | | | | | | |
| | | Diversified Large Cap Growth Portfolio | |
| | | Six months ended November 30, 2014 (unaudited) | | | Year ended
May 31, 2014 | |
| | |
Operations | | | | | | | | |
Net investment income | | $ | 153,910 | | | $ | 217,848 | |
Net realized gains on investments | | | 7,393,125 | | | | 17,206,881 | |
Net change in unrealized gains (losses) on investments | | | 3,667,923 | | | | 12,006,669 | |
| | | | |
Net increase in net assets resulting from operations | | | 11,214,958 | | | | 29,431,398 | |
| | | | |
| | |
Capital share transactions | | | | | | | | |
Transactions in investors’ beneficial interests | | | | | | | | |
Contributions | | | 257,917 | | | | 4,540,444 | |
Withdrawals | | | (20,595,346 | ) | | | (38,368,891 | ) |
| | | | |
Net decrease in net assets resulting from capital share transactions | | | (20,337,429 | ) | | | (33,828,447 | ) |
| | | | |
Total decrease in net assets | | | (9,122,471 | ) | | | (4,397,049 | ) |
| | | | |
| | |
Net assets | | | | | | | | |
Beginning of period | | | 143,448,344 | | | | 147,845,393 | |
| | | | �� |
End of period | | $ | 134,325,873 | | | $ | 143,448,344 | |
| | | | |
The accompanying notes are an integral part of these financial statements.
| | | | |
| 112 | | Wells Fargo Advantage Equity Gateway Funds | | Statements of changes in net assets |
| | | | | | | | |
| | | Emerging Growth Portfolio | |
| | | Six months ended
November 30, 2014
(unaudited) | | | Year ended
May 31, 2014 | |
| | |
Operations | | | | | | | | |
Net investment loss | | $ | (3,442,909 | ) | | $ | (7,250,579 | ) |
Net realized gains on investments | | | 48,390,077 | | | | 126,561,844 | |
Net change in unrealized gains (losses) on investments | | | 80,834,486 | | | | 2,831,625 | |
| | | | |
Net increase in net assets resulting from operations | | | 125,781,654 | | | | 122,142,890 | |
| | | | |
| | |
Capital share transactions | | | | | | | | |
Transactions in investors’ beneficial interests | | | | | | | | |
Contributions | | | 22,755,111 | | | | 100,196,552 | |
Withdrawals | | | (124,646,482 | ) | | | (172,012,866 | ) |
| | | | |
Net decrease in net assets resulting from capital share transactions | | | (101,891,371 | ) | | | (71,816,314 | ) |
| | | | |
Total increase in net assets | | | 23,890,283 | | | | 50,326,576 | |
| | | | |
| | |
Net assets | | | | | | | | |
Beginning of period | | | 1,096,198,653 | | | | 1,045,872,077 | |
| | | | |
End of period | | $ | 1,120,088,936 | | | $ | 1,096,198,653 | |
| | | | |
The accompanying notes are an integral part of these financial statements.
| | | | | | |
| Statements of changes in net assets | | Wells Fargo Advantage Equity Gateway Funds | | | 113 | |
| | | | | | | | |
| | | Index Portfolio | |
| | | Six months ended
November 30, 2014
(unaudited) | | | Year ended May 31, 2014 | |
| | |
Operations | | | | | | | | |
Net investment income | | $ | 27,332,195 | | | $ | 54,636,691 | |
Net realized gains on investments | | | 54,445,603 | | | | 10,828,401 | |
Net change in unrealized gains (losses) on investments | | | 149,780,607 | | | | 446,135,782 | |
| | | | |
Net increase in net assets resulting from operations | | | 231,558,405 | | | | 511,600,874 | |
| | | | |
| | |
Capital share transactions | | | | | | | | |
Transactions in investors’ beneficial interests | | | | | | | | |
Contributions | | | 68,698,638 | | | | 110,111,813 | |
Withdrawals | | | (252,454,175 | ) | | | (397,250,633 | ) |
| | | | |
Net decrease in net assets resulting from capital share transactions | | | (183,755,537 | ) | | | (287,138,820 | ) |
| | | | |
Total increase in net assets | | | 47,802,868 | | | | 224,462,054 | |
| | | | |
| | |
Net assets | | | | | | | | |
Beginning of period | | | 2,837,351,168 | | | | 2,612,889,114 | |
| | | | |
End of period | | $ | 2,885,154,036 | | | $ | 2,837,351,168 | |
| | | | |
The accompanying notes are an integral part of these financial statements.
| | | | |
| 114 | | Wells Fargo Advantage Equity Gateway Funds | | Statements of changes in net assets |
| | | | | | | | |
| | | International Growth Portfolio | |
| | | Six months ended
November 30, 2014
(unaudited) | | | Year ended May 31, 2014 | |
| | |
Operations | | | | | | | | |
Net investment income | | $ | 149,696 | | | $ | 1,665,920 | |
Net realized gains on investments | | | 2,894,828 | | | | 7,645,552 | |
Net change in unrealized gains (losses) on investments | | | 289,174 | | | | 13,428,833 | |
| | | | |
Net increase in net assets resulting from operations | | | 3,333,698 | | | | 22,740,305 | |
| | | | |
| | |
Capital share transactions | | | | | | | | |
Transactions in investors’ beneficial interests | | | | | | | | |
Contributions | | | 4,575,581 | | | | 13,505,034 | |
Withdrawals | | | (6,734,073 | ) | | | (18,531,879 | ) |
| | | | |
Net decrease in net assets resulting from capital share transactions | | | (2,158,492 | ) | | | (5,026,845 | ) |
| | | | |
Total increase in net assets | | | 1,175,206 | | | | 17,713,460 | |
| | | | |
| | |
Net assets | | | | | | | | |
Beginning of period | | | 156,108,200 | | | | 138,394,740 | |
| | | | |
End of period | | $ | 157,283,406 | | | $ | 156,108,200 | |
| | | | |
The accompanying notes are an integral part of these financial statements.
| | | | | | |
| Statements of changes in net assets | | Wells Fargo Advantage Equity Gateway Funds | | | 115 | |
| | | | | | | | |
| | | International Value Portfolio | |
| | | Six months ended
November 30, 2014
(unaudited) | | | Year ended May 31, 2014 | |
| | |
Operations | | | | | | | | |
Net investment income | | $ | 4,347,833 | | | $ | 14,388,396 | |
Net realized gains on investments | | | 4,321,304 | | | | 8,585,816 | |
Net change in unrealized gains (losses) on investments | | | (41,305,695 | ) | | | 54,753,421 | |
| | | | |
Net increase (decrease) in net assets resulting from operations | | | (32,636,558 | ) | | | 77,727,633 | |
| | | | |
| | |
Capital share transactions | | | | | | | | |
Transactions in investors’ beneficial interests | | | | | | | | |
Contributions | | | 17,007,628 | | | | 31,602,874 | |
Withdrawals | | | (6,213,028 | ) | | | (19,826,023 | ) |
| | | | |
Net increase in net assets resulting from capital share transactions | | | 10,794,600 | | | | 11,776,851 | |
| | | | |
Total increase (decrease) in net assets | | | (21,841,958 | ) | | | 89,504,484 | |
| | | | |
| | |
Net assets | | | | | | | | |
Beginning of period | | | 512,235,336 | | | | 422,730,852 | |
| | | | |
End of period | | $ | 490,393,378 | | | $ | 512,235,336 | |
| | | | |
The accompanying notes are an integral part of these financial statements.
| | | | |
| 116 | | Wells Fargo Advantage Equity Gateway Funds | | Statements of changes in net assets |
| | | | | | | | |
| | | Large Company Value Portfolio | |
| | | Six months ended
November 30, 2014
(unaudited) | | | Year ended
May 31, 2014 | |
| | |
Operations | | | | | | | | |
Net investment income | | $ | 432,320 | | | $ | 971,468 | |
Net realized gains on investments | | | 3,929,387 | | | | 9,554,727 | |
Net change in unrealized gains (losses) on investments | | | (649,802 | ) | | | 7,711,461 | |
| | | | |
Net increase in net assets resulting from operations | | | 3,711,905 | | | | 18,237,656 | |
| | | | |
| | |
Capital share transactions | | | | | | | | |
Transactions in investors’ beneficial interests | | | | | | | | |
Contributions | | | 742,073 | | | | 1,607,068 | |
Withdrawals | | | (11,701,655 | ) | | | (22,199,921 | ) |
| | | | |
Net decrease in net assets resulting from capital share transactions | | | (10,959,582 | ) | | | (20,592,853 | ) |
| | | | |
Total decrease in net assets | | | (7,247,677 | ) | | | (2,355,197 | ) |
| | | | |
| | |
Net assets | | | | | | | | |
Beginning of period | | | 96,050,395 | | | | 98,405,592 | |
| | | | |
End of period | | $ | 88,802,718 | | | $ | 96,050,395 | |
| | | | |
The accompanying notes are an integral part of these financial statements.
| | | | | | |
| Statements of changes in net assets | | Wells Fargo Advantage Equity Gateway Funds | | | 117 | |
| | | | | | | | |
| | | Small Company Growth Portfolio | |
| | | Six months ended
November 30, 2014
(unaudited) | | | Year ended
May 31, 2014 | |
| | |
Operations | | | | | | | | |
Net investment loss | | $ | (598,571 | ) | | $ | (977,131 | ) |
Net realized gains on investments | | | 9,808,746 | | | | 25,678,045 | |
Net change in unrealized gains (losses) on investments | | | 12,332,831 | | | | 21,247,400 | |
| | | | |
Net increase in net assets resulting from operations | | | 21,543,006 | | | | 45,948,314 | |
| | | | |
| | |
Capital share transactions | | | | | | | | |
Transactions in investors’ beneficial interests | | | | | | | | |
Contributions | | | 118,459,319 | | | | 152,768,112 | |
Withdrawals | | | (27,634,709 | ) | | | (39,286,894 | ) |
| | | | |
Net increase in net assets resulting from capital share transactions | | | 90,824,610 | | | | 113,481,218 | |
| | | | |
Total increase in net assets | | | 112,367,616 | | | | 159,429,532 | |
| | | | |
| | |
Net assets | | | | | | | | |
Beginning of period | | | 355,915,528 | | | | 196,485,996 | |
| | | | |
End of period | | $ | 468,283,144 | | | $ | 355,915,528 | |
| | | | |
The accompanying notes are an integral part of these financial statements.
| | | | |
| 118 | | Wells Fargo Advantage Equity Gateway Funds | | Statements of changes in net assets |
| | | | | | | | |
| | | Small Company Value Portfolio | |
| | | Six months ended
November 30, 2014
(unaudited) | | | Year ended
May 31, 2014 | |
| | |
Operations | | | | | | | | |
Net investment income | | $ | 560,765 | | | $ | 1,830,396 | |
Net realized gains on investments | | | 8,398,624 | | | | 23,264,792 | |
Net change in unrealized gains (losses) on investments | | | (7,937,428 | ) | | | 9,025,443 | |
| | | | |
Net increase in net assets resulting from operations | | | 1,021,961 | | | | 34,120,631 | |
| | | | |
| | |
Capital share transactions | | | | | | | | |
Transactions in investors’ beneficial interests | | | | | | | | |
Contributions | | | 12,926,173 | | | | 18,725,149 | |
Withdrawals | | | (16,411,190 | ) | | | (50,335,526 | ) |
| | | | |
Net decrease in net assets resulting from capital share transactions | | | (3,485,017 | ) | | | (31,610,377 | ) |
| | | | |
Total increase (decrease) in net assets | | | (2,463,056 | ) | | | 2,510,254 | |
| | | | |
| | |
Net assets | | | | | | | | |
Beginning of period | | | 206,347,509 | | | | 203,837,255 | |
| | | | |
End of period | | $ | 203,884,453 | | | $ | 206,347,509 | |
| | | | |
The accompanying notes are an integral part of these financial statements.
| | | | | | |
| Financial highlights | | Wells Fargo Advantage Equity Gateway Funds | | | 119 | |
| | | | | | | | | | | | | | | | | | | | |
| | | Ratio to average net assets (annualized) | | | Total
return1 | | | Portfolio
turnover
rate | |
| | | Net investment income (loss) | | | Gross expenses | | | Net expenses | | | |
| | | | | |
C&B Large Cap Value Portfolio | | | | | | | | | | | | | | | | | | | | |
Six months ended November 30, 2014 (unaudited) | | | 1.16 | % | | | 0.68 | % | | | 0.68 | % | | | 6.60 | % | | | 17 | % |
Year ended May 31, 2014 | | | 1.35 | % | | | 0.68 | % | | | 0.68 | % | | | 17.80 | % | | | 22 | % |
Year ended May 31, 2013 | | | 1.73 | % | | | 0.68 | % | | | 0.68 | % | | | 29.30 | % | | | 18 | % |
Year ended May 31, 2012 | | | 1.81 | % | | | 0.68 | % | | | 0.68 | % | | | (4.61 | )% | | | 21 | % |
Year ended May 31, 20112 | | | 1.27 | % | | | 0.67 | % | | | 0.67 | % | | | 18.08 | % | | | 17 | % |
Year ended September 30, 2010 | | | 1.40 | % | | | 0.70 | % | | | 0.68 | % | | | 7.49 | % | | | 13 | % |
Year ended September 30, 2009 | | | 2.19 | % | | | 0.73 | % | | | 0.64 | % | | | (5.53 | )% | | | 28 | % |
| | | | | |
Diversified Large Cap Growth Portfolio | | | | | | | | | | | | | | | | | | | | |
Six months ended November 30, 2014 (unaudited) | | | 0.23 | % | | | 0.72 | % | | | 0.62 | % | | | 8.68 | % | | | 23 | % |
Year ended May 31, 2014 | | | 0.15 | % | | | 0.72 | % | | | 0.62 | % | | | 21.70 | % | | | 54 | % |
Year ended May 31, 2013 | | | 0.51 | % | | | 0.71 | % | | | 0.62 | % | | | 20.30 | % | | | 56 | % |
Year ended May 31, 2012 | | | 0.24 | % | | | 0.71 | % | | | 0.62 | % | | | 1.26 | % | | | 79 | % |
Year ended May 31, 20112,3 | | | 0.40 | % | | | 0.69 | % | | | 0.62 | % | | | 22.78 | % | | | 101 | % |
Year ended September 30, 20103 | | | 0.66 | % | | | 0.70 | % | | | 0.62 | % | | | 7.51 | % | | | 11 | % |
Year ended September 30, 20093 | | | 0.97 | % | | | 0.70 | % | | | 0.62 | % | | | 3.31 | % | | | 13 | % |
| | | | | |
Emerging Growth Portfolio | | | | | | | | | | | | | | | | | | | | |
Six months ended November 30, 2014 (unaudited) | | | (0.62 | )% | | | 0.80 | % | | | 0.80 | % | | | 11.98 | % | | | 26 | % |
Year ended May 31, 2014 | | | (0.62 | )% | | | 0.80 | % | | | 0.80 | % | | | 11.92 | % | | | 63 | % |
Year ended May 31, 2013 | | | (0.47 | )% | | | 0.80 | % | | | 0.80 | % | | | 20.53 | % | | | 65 | % |
Year ended May 31, 2012 | | | (0.57 | )% | | | 0.80 | % | | | 0.80 | % | | | (4.83 | )% | | | 75 | % |
Year ended May 31, 20112 | | | (0.77 | )% | | | 0.94 | % | | | 0.91 | % | | | 37.91 | % | | | 59 | % |
Year ended September 30, 2010 | | | (0.66 | )% | | | 1.02 | % | | | 0.94 | % | | | 20.49 | % | | | 97 | % |
Year ended September 30, 2009 | | | (0.53 | )% | | | 0.94 | % | | | 0.91 | % | | | (5.70 | )% | | | 147 | % |
| | | | | |
Index Portfolio | | | | | | | | | | | | | | | | | | | | |
Six months ended November 30, 2014 (unaudited) | | | 1.95 | % | | | 0.11 | % | | | 0.11 | % | | | 8.52 | % | | | 2 | % |
Year ended May 31, 2014 | | | 1.99 | % | | | 0.10 | % | | | 0.10 | % | | | 20.33 | % | | | 5 | % |
Year ended May 31, 2013 | | | 2.20 | % | | | 0.09 | % | | | 0.09 | % | | | 27.22 | % | | | 4 | % |
Year ended May 31, 2012 | | | 2.09 | % | | | 0.10 | % | | | 0.10 | % | | | (0.52 | )% | | | 9 | % |
Year ended May 31, 20112 | | | 1.93 | % | | | 0.10 | % | | | 0.10 | % | | | 19.39 | % | | | 3 | % |
Year ended September 30, 2010 | | | 2.01 | % | | | 0.10 | % | | | 0.10 | % | | | 9.97 | % | | | 22 | % |
Year ended September 30, 2009 | | | 2.61 | % | | | 0.12 | % | | | 0.10 | % | | | (7.00 | )% | | | 10 | % |
| | | | | |
International Growth Portfolio | | | | | | | | | | | | | | | | | | | | |
Six months ended November 30, 2014 (unaudited) | | | 0.20 | % | | | 0.98 | % | | | 0.98 | % | | | 2.09 | % | | | 25 | % |
Year ended May 31, 2014 | | | 1.13 | % | | | 1.00 | % | | | 1.00 | % | | | 16.45 | % | | | 46 | % |
Year ended May 31, 2013 | | | 1.63 | % | | | 1.04 | % | | | 1.04 | % | | | 30.34 | % | | | 46 | % |
Year ended May 31, 2012 | | | 2.04 | % | | | 0.97 | % | | | 0.90 | % | | | (9.44 | )% | | | 69 | % |
Year ended May 31, 20112 | | | 1.62 | % | | | 1.10 | % | | | 1.10 | % | | | 14.50 | % | | | 53 | % |
Year ended September 30, 2010 | | | 0.89 | % | | | 1.42 | % | | | 1.20 | % | | | 3.25 | % | | | 89 | % |
Year ended September 30, 2009 | | | 1.71 | % | | | 1.14 | % | | | 1.11 | % | | | 6.23 | % | | | 95 | % |
| | | | | |
International Value Portfolio | | | | | | | | | | | | | | | | | | | | |
Six months ended November 30, 2014 (unaudited) | | | 1.73 | % | | | 0.90 | % | | | 0.90 | % | | | (6.43 | )% | | | 7 | % |
Year ended May 31, 2014 | | | 3.09 | % | | | 0.91 | % | | | 0.91 | % | | | 18.22 | % | | | 11 | % |
Year ended May 31, 2013 | | | 3.04 | % | | | 0.91 | % | | | 0.91 | % | | | 29.45 | % | | | 16 | % |
Year ended May 31, 2012 | | | 3.44 | % | | | 0.91 | % | | | 0.85 | % | | | (21.07 | )% | | | 9 | % |
Year ended May 31, 20112 | | | 3.14 | % | | | 0.94 | % | | | 0.94 | % | | | 14.00 | % | | | 16 | % |
Year ended September 30, 2010 | | | 2.41 | % | | | 1.20 | % | | | 1.06 | % | | | 0.92 | % | | | 27 | % |
Year ended September 30, 2009 | | | 2.72 | % | | | 1.08 | % | | | 1.03 | % | | | 5.26 | % | | | 41 | % |
Please see footnotes on page 120.
The accompanying notes are an integral part of these financial statements.
| | | | |
| 120 | | Wells Fargo Advantage Equity Gateway Funds | | Financial highlights |
| | | | | | | | | | | | | | | | | | | | |
| | | Ratio to average net assets (annualized) | | | Total
return1 | | | Portfolio
turnover
rate | |
| | | Net investment income (loss) | | | Gross expenses | | | Net expenses | | | |
| | | | | |
Large Company Value Portfolio | | | | | | | | | | | | | | | | | | | | |
Six months ended November 30, 2014 (unaudited) | | | 0.96 | % | | | 0.74 | % | | | 0.74 | % | | | 4.19 | % | | | 39 | % |
Year ended May 31, 2014 | | | 0.99 | % | | | 0.73 | % | | | 0.73 | % | | | 20.26 | % | | | 62 | % |
Year ended May 31, 2013 | | | 1.49 | % | | | 0.78 | % | | | 0.74 | % | | | 28.91 | % | | | 95 | % |
Year ended May 31, 2012 | | | 1.67 | % | | | 0.77 | % | | | 0.74 | % | | | (6.06 | )% | | | 104 | % |
Year ended May 31, 20112 | | | 1.58 | % | | | 0.78 | % | | | 0.74 | % | | | 21.46 | % | | | 38 | % |
Year ended September 30, 2010 | | | 1.73 | % | | | 0.73 | % | | | 0.72 | % | | | 7.02 | % | | | 46 | % |
Year ended September 30, 2009 | | | 2.69 | % | | | 0.75 | % | | | 0.69 | % | | | (9.66 | )% | | | 11 | % |
| | | | | |
Small Company Growth Portfolio | | | | | | | | | | | | | | | | | | | | |
Six months ended November 30, 2014 (unaudited) | | | (0.30 | )% | | | 0.83 | % | | | 0.83 | % | | | 5.46 | % | | | 30 | % |
Year ended May 31, 2014 | | | (0.37 | )% | | | 0.83 | % | | | 0.83 | % | | | 23.47 | % | | | 77 | % |
Year ended May 31, 2013 | | | (0.02 | )% | | | 0.86 | % | | | 0.86 | % | | | 31.39 | % | | | 109 | % |
Year ended May 31, 2012 | | | (0.12 | )% | | | 0.83 | % | | | 0.83 | % | | | (10.75 | )% | | | 107 | % |
Year ended May 31, 20112 | | | (0.42 | )% | | | 0.83 | % | | | 0.83 | % | | | 39.64 | % | | | 70 | % |
Year ended September 30, 2010 | | | (0.48 | )% | | | 0.87 | % | | | 0.86 | % | | | 15.25 | % | | | 129 | % |
Year ended September 30, 2009 | | | (0.53 | )% | | | 0.89 | % | | | 0.87 | % | | | 1.75 | % | | | 169 | % |
| | | | | |
Small Company Value Portfolio | | | | | | | | | | | | | | | | | | | | |
Six months ended November 30, 2014 (unaudited) | | | 0.55 | % | | | 0.84 | % | | | 0.84 | % | | | 0.38 | % | | | 24 | % |
Year ended May 31, 2014 | | | 0.89 | % | | | 0.85 | % | | | 0.85 | % | | | 18.09 | % | | | 47 | % |
Year ended May 31, 2013 | | | 0.58 | % | | | 0.85 | % | | | 0.85 | % | | | 30.76 | % | | | 57 | % |
Year ended May 31, 2012 | | | 0.69 | % | | | 0.84 | % | | | 0.84 | % | | | (7.17 | )% | | | 60 | % |
Year ended May 31, 20112 | | | 1.60 | % | | | 0.84 | % | | | 0.84 | % | | | 26.72 | % | | | 47 | % |
Year ended September 30, 2010 | | | 0.31 | % | | | 0.89 | % | | | 0.89 | % | | | 16.38 | % | | | 60 | % |
Year ended September 30, 2009 | | | 1.16 | % | | | 0.90 | % | | | 0.88 | % | | | (6.28 | )% | | | 99 | % |
| 1. | Returns for periods of less than one year are not annualized. |
| 2. | For the eight months ended May 31, 2011. The Portfolio changed its fiscal year end from September 30 to May 31, effective May 31, 2011. |
| 3. | After the close of business on January 28, 2011, the Diversified Large Cap Growth Portfolio acquired the net assets of Wells Fargo Advantage Disciplined Growth Portfolio, Wells Fargo Advantage Large Cap Appreciation Portfolio, and Wells Fargo Advantage Large Company Growth Portfolio. Wells Fargo Advantage Large Company Growth Portfolio became the accounting and performance survivor in the transaction. The information for the periods prior to January 31, 2011 is that of the Wells Fargo Advantage Large Company Growth Portfolio. |
The accompanying notes are an integral part of these financial statements.
| | | | | | |
| Notes to financial statements (unaudited) | | Wells Fargo Advantage Equity Gateway Funds | | | 121 | |
1. ORGANIZATION
Wells Fargo Master Trust (the “Trust”), a Delaware statutory trust organized on March 10, 1999, is an open-end management investment company registered under the Investment Company Act of 1940, as amended (the “1940 Act”). These financial statements report on the following portfolios: the Wells Fargo Advantage C&B Large Cap Value Portfolio (“C&B Large Cap Value Portfolio”), the Wells Fargo Advantage Diversified Large Cap Growth Portfolio (“Diversified Large Cap Growth Portfolio”), the Wells Fargo Advantage Emerging Growth Portfolio (“Emerging Growth Portfolio”), the Wells Fargo Advantage Index Portfolio (“Index Portfolio”), the Wells Fargo Advantage International Growth Portfolio (“International Growth Portfolio”), the Wells Fargo Advantage International Value Portfolio (“International Value Portfolio”), the Wells Fargo Advantage Large Company Value Portfolio (“Large Company Value Portfolio”), the Wells Fargo Advantage Small Company Growth Portfolio (“Small Company Growth Portfolio”), the Wells Fargo Advantage Small Company Value Portfolio (“Small Company Value Portfolio”) (each, a “Portfolio”, collectively, the “Portfolios”). Each Portfolio is a diversified series of the Trust.
The Portfolios, which are master portfolios in a master/feeder structure, offer their shares to multiple feeder funds and other affiliated master portfolios rather than directly to the public.
2. SIGNIFICANT ACCOUNTING POLICIES
The following significant accounting policies, which are consistently followed in the preparation of the financial statements of each Portfolio, are in conformity with U.S. generally accepted accounting principles which require management to make estimates and assumptions that affect the reported amounts of assets and liabilities, disclosure of contingent assets and liabilities at the date of the financial statements, and the reported amounts of revenues and expenses during the reporting period. Actual results could differ from those estimates.
Securities valuation
All investments are valued each business day as of the close of regular trading on the New York Stock Exchange (generally 4 p.m. Eastern Time).
Equity securities and futures that are listed on a foreign or domestic exchange or market are valued at the official closing price or, if none, the last sales price. If no sale occurs on the primary exchange or market for the security that day, the prior day’s price will be deemed “stale” and fair values will be determined in accordance with the Portfolios’ Valuation Procedures.
The values of securities denominated in foreign currencies are translated into U.S. dollars at rates provided by an independent foreign currency pricing source at a time each business day specified by the Management Valuation Team of Wells Fargo Funds Management, LLC (“Funds Management”).
Many securities markets and exchanges outside the U.S. close prior to the close of the New York Stock Exchange and therefore may not fully reflect trading or events that occur after the close of the principal exchange in which the foreign securities are traded, but before the close of the New York Stock Exchange. If such trading or events are expected to materially affect the value of such securities, then fair value pricing procedures approved by the Board of Trustees of the Portfolios are applied. These procedures take into account multiple factors including movements in U.S. securities markets after foreign exchanges close. Foreign securities that are fair valued under these procedures are categorized as Level 2 and the application of these procedures may result in transfers between Level 1 and Level 2. Depending on market activity, such fair valuations may be frequent. Such fair value pricing may result in net asset values that are higher or lower than net asset values based on the last reported sales price or latest quoted bid price. On November 30, 2014, such fair value pricing was not used in pricing foreign securities.
Short-term securities, with maturities of 60 days or less at time of purchase, generally are valued at amortized cost which approximates fair value. The amortized cost method involves valuing a security at its cost, plus accretion of discount or minus amortization of premium over the period until maturity.
Investments in registered open-end investment companies are valued at net asset value. Non-registered investment vehicles are fair valued at net asset value.
Investments which are not valued using any of the methods discussed above are valued at their fair value, as determined in good faith by the Board of Trustees. The Board of Trustees has established a Valuation Committee comprised of the Trustees and has delegated to it the authority to take any actions regarding the valuation of portfolio securities that the Valuation Committee deems necessary or appropriate, including determining the fair value of portfolio securities, unless the determination has been delegated to the Management Valuation Team. The Board of Trustees retains the authority to
| | | | |
| 122 | | Wells Fargo Advantage Equity Gateway Funds | | Notes to financial statements (unaudited) |
make or ratify any valuation decisions or approve any changes to the Valuation Procedures as it deems appropriate. On a quarterly basis, the Board of Trustees receives reports on any valuation actions taken by the Valuation Committee or the Management Valuation Team which may include items for ratification.
Valuations of fair valued securities are compared to the next actual sales price when available, or other appropriate market values, to assess the continued appropriateness of the fair valuation methodologies used. These securities are fair valued on a day-to-day basis, taking into consideration changes to appropriate market information and any significant changes to the inputs considered in the valuation process until there is a readily available price provided on an exchange or by an independent pricing service. Valuations received from an independent pricing service or independent broker-dealer quotes are periodically validated by comparisons to most recent trades and valuations provided by other independent pricing services in addition to the review of prices by the adviser and/or subadviser. Unobservable inputs used in determining fair valuations are identified based on the type of security, taking into consideration factors utilized by market participants in valuing the investment, knowledge about the issuer and the current market environment.
Foreign currency translation
The accounting records of the Portfolios are maintained in U.S. dollars. The value of other assets and liabilities denominated in foreign currencies are translated into U.S. dollars at rates provided by an independent foreign currency pricing source at a time each business day specified by the Management Valuation Team. Purchases and sales of securities, and income and expenses are converted at the rate of exchange on the respective dates of such transactions. Net realized foreign exchange gains or losses arise from sales of foreign currencies, currency gains or losses realized between the trade and settlement dates on securities transactions, and the difference between the amounts of dividends, interest and foreign withholding taxes recorded and the U.S. dollar equivalent of the amounts actually paid or received. Net unrealized foreign exchange gains and losses arise from changes in the fair value of assets and liabilities other than investments in securities resulting from changes in exchange rates. The changes in net assets arising from changes in exchange rates and the changes in net assets resulting from changes in market prices of securities are not separately presented. Such changes are included in net realized and unrealized gains or losses from investments.
Security loans
The Portfolios may lend their securities from time to time in order to earn additional income in the form of fees or interest on securities received as collateral or the investment of any cash received as collateral. The Portfolios continue to receive interest or dividends on the securities loaned. The Portfolios receive collateral in the form of cash or securities with a value at least equal to the value of the securities on loan. The value of the loaned securities is determined at the close of each business day and any additional required collateral is delivered to the Portfolios on the next business day. In a securities lending transaction, the net asset value of the Portfolios will be affected by an increase or decrease in the value of the securities loaned and by an increase or decrease in the value of the instrument in which collateral is invested. The amount of securities lending activity undertaken by the Portfolios fluctuate from time to time, In the event of default or bankruptcy by the borrower, the Portfolios may be prevented from recovering the loaned securities or gaining access to the collateral or may experience delays or costs in doing so. In addition, the investment of any cash collateral received may lose all or part of its value. The Portfolios have the right under the lending agreement to recover the securities from the borrower on demand.
The Portfolios lend their securities through an unaffiliated securities lending agent. Cash collateral received in connection with its securities lending transactions is invested in Securities Lending Cash Investments, LLC (the “Securities Lending Fund”). The Securities Lending Fund is exempt from registration under Section 3(c)(7) of the 1940 Act and is managed by Funds Management and is sub-advised by Wells Capital Management Incorporated (“WellsCap”). Funds Management receives an advisory fee starting at 0.05% and declining to 0.01% as the average daily net assets of the Securities Lending Fund increase. All of the fees received by Funds Management are paid to WellsCap for its services as subadviser. The Securities Lending Fund seeks to provide a positive return compared to the daily Fed Funds Open rate by investing in high-quality, U.S. dollar-denominated short-term money market instruments. Securities Lending Fund investments are fair valued based upon the amortized cost valuation technique. Income earned from investment in the Securities Lending Fund is included in securities lending income on the Statements of Operations.
Futures contracts
The Portfolios are subject to interest rate risk or equity price risk in the normal course of pursuing their investment objectives. A Portfolio may buy and sell futures contracts in order to gain exposure to, or protect against, changes in security values and interest rates. The primary risks associated with the use of futures contracts are the imperfect correlation between changes in market values of securities held by the Portfolio and the prices of futures contracts, and the possibility of an illiquid market.
| | | | | | |
| Notes to financial statements (unaudited) | | Wells Fargo Advantage Equity Gateway Funds | | | 123 | |
The aggregate principal amounts of the contracts are not recorded in the financial statements. Fluctuations in the value of the contracts are recorded in the Statements of Assets and Liabilities as an asset or liability and in the Statements of Operations as unrealized gains or losses until the contracts are closed, at which point they are recorded as net realized gains or losses on futures contracts. With futures contracts, there is minimal counterparty risk to the Portfolio since futures are exchange traded and the exchange’s clearinghouse, as counterparty to all exchange traded futures, guarantees the futures against default.
Security transactions and income recognition
Securities transactions are recorded on a trade date basis. Realized gains or losses are recorded on the basis of identified cost.
Dividend income is recognized on the ex-dividend date, except for certain dividends from foreign securities, which are recorded as soon as the custodian verifies the ex-dividend date. Dividend income from foreign securities is recorded net of foreign taxes withheld where recovery of such taxes is not assured.
Interest income is accrued daily and bond discounts are accreted and premiums are amortized daily based on the effective interest method. To the extent debt obligations are placed on non-accrual status, any related interest income may be reduced by writing off interest receivables when the collection of all or a portion of interest has become doubtful based on consistently applied procedures. If the issuer subsequently resumes interest payments or when the collectability of interest is reasonably assured, the debt obligation is removed from non-accrual status.
Federal and other taxes
Each Portfolio is treated as a separate entity for federal income tax purposes. The Portfolios are not required to pay federal income taxes on their net investment income and net capital gain as they are treated as partnerships for federal income tax purposes. All interest, dividends, gains and losses of a Portfolio are deemed to have been “passed through” to the interestholders in proportion to their holdings of the Portfolio regardless of whether such interest, dividends and gains have been distributed by the Portfolio.
Each Portfolio’s income tax returns and all financial records supporting those returns for the prior three fiscal years are subject to examination by the federal revenue authority. Management has analyzed each Portfolio’s tax positions taken on federal, state, and foreign tax returns for all open tax years and does not believe that there are any uncertain tax positions that require recognition of a tax liability.
3. FAIR VALUATION MEASUREMENTS
Fair value measurements of investments are determined within a framework that has established a fair value hierarchy based upon the various data inputs utilized in determining the value of each Portfolio’s investments. The three-level hierarchy gives the highest priority to unadjusted quoted prices in active markets for identical assets or liabilities (Level 1) and the lowest priority to significant unobservable inputs (Level 3). Each Portfolio’s investments are classified within the fair value hierarchy based on the lowest level of input that is significant to the fair value measurement. The inputs are summarized into three broad levels as follows:
| n | | Level 1 – quoted prices in active markets for identical securities |
| n | | Level 2 – other significant observable inputs (including quoted prices for similar securities, interest rates, prepayment speeds, credit risk, use of amortized cost, etc.) |
| n | | Level 3 – significant unobservable inputs (including the Portfolio’s own assumptions in determining the fair value of investments) |
The inputs or methodologies used for valuing investments in securities are not necessarily an indication of the risk associated with investing in those securities.
| | | | |
| 124 | | Wells Fargo Advantage Equity Gateway Funds | | Notes to financial statements (unaudited) |
The following is a summary of the inputs used in valuing the Portfolio’s assets and liabilities as of November 30, 2014:
| | | | | | | | | | | | | | | | |
| | | Quoted prices
(Level 1) | | | Other significant
observable inputs
(Level 2) | | | Significant
unobservable inputs
(Level 3) | | | Total | |
C&B Large Cap Value Portfolio | | | | | | | | | | | | | | | | |
Assets | | | | | | | | | | | | | | | | |
Investments in: | | | | | | | | | | | | | | | | |
| | | | |
Common stocks | | | | | | | | | | | | | | | | |
Consumer discretionary | | $ | 42,500,097 | | | $ | 0 | | | $ | 0 | | | $ | 42,500,097 | |
Consumer staples | | | 35,992,489 | | | | 0 | | | | 0 | | | | 35,992,489 | |
Energy | | | 29,407,489 | | | | 0 | | | | 0 | | | | 29,407,489 | |
Financials | | | 80,741,873 | | | | 0 | | | | 0 | | | | 80,741,873 | |
Health care | | | 46,642,321 | | | | 0 | | | | 0 | | | | 46,642,321 | |
Industrials | | | 31,949,489 | | | | 0 | | | | 0 | | | | 31,949,489 | |
Information technology | | | 22,448,373 | | | | 0 | | | | 0 | | | | 22,448,373 | |
Materials | | | 19,774,604 | | | | 0 | | | | 0 | | | | 19,774,604 | |
| | | | |
Preferred stocks | | | | | | | | | | | | | | | | |
Consumer staples | | | 1,507,315 | | | | 0 | | | | 0 | | | | 1,507,315 | |
| | | | |
Short-term investments | | | | | | | | | | | | | | | | |
Investment companies | | | 24,831,887 | | | | 0 | | | | 0 | | | | 24,831,887 | |
Total assets | | $ | 335,795,937 | | | $ | 0 | | | $ | 0 | | | $ | 335,795,937 | |
Diversified Large Cap Growth Portfolio | | | | | | | | | | | | | | | | |
Assets | | | | | | | | | | | | | | | | |
Investments in: | | | | | | | | | | | | | | | | |
| | | | |
Common stocks | | | | | | | | | | | | | | | | |
Consumer discretionary | | $ | 34,369,514 | | | $ | 0 | | | $ | 0 | | | $ | 34,369,514 | |
Consumer staples | | | 5,286,554 | | | | 0 | | | | 0 | | | | 5,286,554 | |
Energy | | | 5,898,125 | | | | 0 | | | | 0 | | | | 5,898,125 | |
Financials | | | 8,492,110 | | | | 0 | | | | 0 | | | | 8,492,110 | |
Health care | | | 21,264,089 | | | | 0 | | | | 0 | | | | 21,264,089 | |
Industrials | | | 15,002,610 | | | | 0 | | | | 0 | | | | 15,002,610 | |
Information technology | | | 37,159,209 | | | | 0 | | | | 0 | | | | 37,159,209 | |
Materials | | | 4,201,052 | | | | 0 | | | | 0 | | | | 4,201,052 | |
Telecommunication | | | 1,500,556 | | | | 0 | | | | 0 | | | | 1,500,556 | |
| | | | |
Short-term investments | | | | | | | | | | | | | | | | |
Investment companies | | | 1,435,598 | | | | 1,815,925 | | | | 0 | | | | 3,251,523 | |
Total assets | | $ | 134,609,417 | | | $ | 1,815,925 | | | $ | 0 | | | $ | 136,425,342 | |
Emerging Growth Portfolio | | | | | | | | | | | | | | | | |
Assets | | | | | | | | | | | | | | | | |
Investments in: | | | | | | | | | | | | | | | | |
| | | | |
Common stocks | | | | | | | | | | | | | | | | |
Consumer discretionary | | $ | 142,492,106 | | | $ | 0 | | | $ | 0 | | | $ | 142,492,106 | |
Consumer staples | | | 16,499,666 | | | | 0 | | | | 0 | | | | 16,499,666 | |
Energy | | | 32,516,507 | | | | 0 | | | | 0 | | | | 32,516,507 | |
Financials | | | 86,291,617 | | | | 0 | | | | 0 | | | | 86,291,617 | |
Health care | | | 348,224,013 | | | | 0 | | | | 0 | | | | 348,224,013 | |
Industrials | | | 118,632,477 | | | | 0 | | | | 0 | | | | 118,632,477 | |
Information technology | | | 364,694,144 | | | | 0 | | | | 0 | | | | 364,694,144 | |
Materials | | | 5,609,500 | | | | 0 | | | | 0 | | | | 5,609,500 | |
| | | | |
Short-term investments | | | | | | | | | | | | | | | | |
Investment companies | | | 5,987,366 | | | | 130,887,098 | | | | 0 | | | | 136,874,464 | |
Total assets | | $ | 1,120,947,396 | | | $ | 130,887,098 | | | $ | 0 | | | $ | 1,251,834,494 | |
| | | | | | |
| Notes to financial statements (unaudited) | | Wells Fargo Advantage Equity Gateway Funds | | | 125 | |
| | | | | | | | | | | | | | | | |
| | | Quoted prices
(Level 1) | | | Other significant
observable inputs
(Level 2) | | | Significant
unobservable inputs
(Level 3) | | | Total | |
Index Portfolio | | | | | | | | | | | | | | | | |
Assets | | | | | | | | | | | | | | | | |
Investments in: | | | | | | | | | | | | | | | | |
| | | | |
Common stocks | | | | | | | | | | | | | | | | |
Consumer discretionary | | $ | 340,482,207 | | | $ | 0 | | | $ | 0 | | | $ | 340,482,207 | |
Consumer staples | | | 281,549,124 | | | | 0 | | | | 0 | | | | 281,549,124 | |
Energy | | | 238,844,080 | | | | 0 | | | | 0 | | | | 238,844,080 | |
Financials | | | 464,060,319 | | | | 0 | | | | 0 | | | | 464,060,319 | |
Health care | | | 408,205,947 | | | | 0 | | | | 0 | | | | 408,205,947 | |
Industrials | | | 297,747,015 | | | | 0 | | | | 0 | | | | 297,747,015 | |
Information technology | | | 568,771,683 | | | | 0 | | | | 0 | | | | 568,771,683 | |
Materials | | | 91,523,247 | | | | 0 | | | | 0 | | | | 91,523,247 | |
Telecommunication services | | | 68,620,168 | | | | 0 | | | | 0 | | | | 68,620,168 | |
Utilities | | | 88,365,228 | | | | 0 | | | | 0 | | | | 88,365,228 | |
| | | | |
Short-term investments | | | | | | | | | | | | | | | | |
Investment companies | | | 35,068,768 | | | | 15,878,700 | | | | 0 | | | | 50,947,468 | |
U.S. Treasury securities | | | 179,998 | | | | 2,484,902 | | | | 0 | | | | 2,664,900 | |
Total assets | | $ | 2,883,417,784 | | | $ | 18,363,602 | | | $ | 0 | | | $ | 2,901,781,386 | |
Liabilities | | | | | | | | | | | | | | | | |
| | | | |
Futures contracts | | $ | 107,505 | | | $ | 0 | | | $ | 0 | | | $ | 107,505 | |
Total liabilities | | $ | 107,505 | | | $ | 0 | | | $ | 0 | | | $ | 107,505 | |
International Growth Portfolio | | | | | | | | | | | | | | | | |
Assets | | | | | | | | | | | | | | | | |
Investments in: | | | | | | | | | | | | | | | | |
| | | | |
Common stocks | | | | | | | | | | | | | | | | |
Belgium | | $ | 6,246,315 | | | $ | 0 | | | $ | 0 | | | $ | 6,246,315 | |
Brazil | | | 276,338 | | | | 0 | | | | 0 | | | | 276,338 | |
China | | | 16,433,660 | | | | 0 | | | | 0 | | | | 16,433,660 | |
Denmark | | | 300,679 | | | | 0 | | | | 0 | | | | 300,679 | |
France | | | 9,048,967 | | | | 0 | | | | 0 | | | | 9,048,967 | |
Germany | | | 18,619,765 | | | | 0 | | | | 0 | | | | 18,619,765 | |
Hong Kong | | | 10,056,539 | | | | 0 | | | | 0 | | | | 10,056,539 | |
Ireland | | | 5,639,335 | | | | 0 | | | | 0 | | | | 5,639,335 | |
Japan | | | 23,280,134 | | | | 0 | | | | 0 | | | | 23,280,134 | |
Mexico | | | 4,797,608 | | | | 0 | | | | 0 | | | | 4,797,608 | |
Netherlands | | | 6,996,537 | | | | 0 | | | | 0 | | | | 6,996,537 | |
South Korea | | | 591,785 | | | | 0 | | | | 0 | | | | 591,785 | |
Spain | | | 3,097,829 | | | | 0 | | | | 0 | | | | 3,097,829 | |
Sweden | | | 1,306,046 | | | | 0 | | | | 0 | | | | 1,306,046 | |
Switzerland | | | 13,918,128 | | | | 0 | | | | 0 | | | | 13,918,128 | |
United Kingdom | | | 28,442,832 | | | | 28,926 | | | | 0 | | | | 28,471,758 | |
United States | | | 3,364,188 | | | | 0 | | | | 0 | | | | 3,364,188 | |
| | | | |
Participation notes | | | | | | | | | | | | | | | | |
United Kingdom | | | 0 | | | | 1,232,086 | | | | 0 | | | | 1,232,086 | |
| | | | |
Preferred stocks | | | | | | | | | | | | | | | | |
Germany | | | 2,091,882 | | | | 0 | | | | 0 | | | | 2,091,882 | |
| | | | |
Short-term investments | | | | | | | | | | | | | | | | |
Investment companies | | | 1,480,017 | | | | 1,787,826 | | | | 0 | | | | 3,267,843 | |
Total assets | | $ | 155,988,584 | | | $ | 3,048,838 | | | $ | 0 | | | $ | 159,037,422 | |
| | | | |
| 126 | | Wells Fargo Advantage Equity Gateway Funds | | Notes to financial statements (unaudited) |
| | | | | | | | | | | | | | | | |
| | | Quoted prices
(Level 1) | | | Other significant
observable inputs
(Level 2) | | | Significant
unobservable inputs
(Level 3) | | | Total | |
International Value Portfolio | | | | | | | | | | | | | | | | |
Assets | | | | | | | | | | | | | | | | |
Investments in: | | | | | | | | | | | | | | | | |
| | | | |
Common stocks | | | | | | | | | | | | | | | | |
Australia | | $ | 27,014,669 | | | $ | 0 | | | $ | 0 | | | $ | 27,014,669 | |
Austria | | | 6,371,621 | | | | 0 | | | | 0 | | | | 6,371,621 | |
Belgium | | | 2,882,203 | | | | 0 | | | | 0 | | | | 2,882,203 | |
Brazil | | | 4,834,284 | | | | 0 | | | | 0 | | | | 4,834,284 | |
Canada | | | 14,282,460 | | | | 0 | | | | 0 | | | | 14,282,460 | |
China | | | 12,063,480 | | | | 0 | | | | 0 | | | | 12,063,480 | |
Czech Republic | | | 1,602,829 | | | | 0 | | | | 0 | | | | 1,602,829 | |
Finland | | | 4,607,457 | | | | 0 | | | | 0 | | | | 4,607,457 | |
France | | | 41,171,510 | | | | 0 | | | | 0 | | | | 41,171,510 | |
Germany | | | 38,576,589 | | | | 0 | | | | 0 | | | | 38,576,589 | |
Hong Kong | | | 9,299,596 | | | | 0 | | | | 0 | | | | 9,299,596 | |
Hungary | | | 59,155 | | | | 0 | | | | 0 | | | | 59,155 | |
India | | | 7,659,525 | | | | 0 | | | | 0 | | | | 7,659,525 | |
Ireland | | | 3,026,529 | | | | 0 | | | | 0 | | | | 3,026,529 | |
Israel | | | 5,629,578 | | | | 0 | | | | 0 | | | | 5,629,578 | |
Italy | | | 6,388,885 | | | | 0 | | | | 0 | | | | 6,388,885 | |
Japan | | | 97,017,609 | | | | 0 | | | | 0 | | | | 97,017,609 | |
Liechtenstein | | | 634,823 | | | | 0 | | | | 0 | | | | 634,823 | |
Netherlands | | | 13,757,049 | | | | 0 | | | | 0 | | | | 13,757,049 | |
Norway | | | 8,113,989 | | | | 0 | | | | 0 | | | | 8,113,989 | |
Poland | | | 2,963,675 | | | | 0 | | | | 0 | | | | 2,963,675 | |
Russia | | | 5,216,958 | | | | 0 | | | | 0 | | | | 5,216,958 | |
Singapore | | | 5,534,728 | | | | 0 | | | | 0 | | | | 5,534,728 | |
South Africa | | | 3,224,974 | | | | 0 | | | | 0 | | | | 3,224,974 | |
South Korea | | | 12,332,599 | | | | 0 | | | | 0 | | | | 12,332,599 | |
Spain | | | 7,495,983 | | | | 0 | | | | 0 | | | | 7,495,983 | |
Sweden | | | 10,895,637 | | | | 0 | | | | 0 | | | | 10,895,637 | |
Switzerland | | | 24,816,570 | | | | 0 | | | | 0 | | | | 24,816,570 | |
Taiwan | | | 2,401,260 | | | | 0 | | | | 0 | | | | 2,401,260 | |
Thailand | | | 3,878,063 | | | | 0 | | | | 0 | | | | 3,878,063 | |
United Kingdom | | | 89,590,278 | | | | 0 | | | | 0 | | | | 89,590,278 | |
| | | | |
Preferred stocks | | | | | | | | | | | | | | | | |
Brazil | | | 4,607,364 | | | | 0 | | | | 0 | | | | 4,607,364 | |
| | | | |
Rights | | | | | | | | | | | | | | | | |
Spain | | | 0 | | | | 23,994 | | | | 0 | | | | 23,994 | |
| | | | |
Short-term investments | | | | | | | | | | | | | | | | |
Investment companies | | | 6,617,840 | | | | 14,194,341 | | | | 0 | | | | 20,812,181 | |
Total assets | | $ | 484,569,769 | | | $ | 14,218,335 | | | $ | 0 | | | $ | 498,788,104 | |
| | | | | | |
| Notes to financial statements (unaudited) | | Wells Fargo Advantage Equity Gateway Funds | | | 127 | |
| | | | | | | | | | | | | | | | |
| | | Quoted prices
(Level 1) | | | Other significant
observable inputs
(Level 2) | | | Significant
unobservable inputs
(Level 3) | | | Total | |
Large Company Value Portfolio | | | | | | | | | | | | | | | | |
Assets | | | | | | | | | | | | | | | | |
Investments in: | | | | | | | | | | | | | | | | |
| | | | |
Common stocks | | | | | | | | | | | | | | | | |
Consumer discretionary | | $ | 7,755,163 | | | $ | 0 | | | $ | 0 | | | $ | 7,755,163 | |
Consumer staples | | | 4,276,180 | | | | 0 | | | | 0 | | | | 4,276,180 | |
Energy | | | 8,038,409 | | | | 0 | | | | 0 | | | | 8,038,409 | |
Financials | | | 26,069,684 | | | | 0 | | | | 0 | | | | 26,069,684 | |
Health care | | | 12,037,660 | | | | 0 | | | | 0 | | | | 12,037,660 | |
Industrials | | | 10,215,162 | | | | 0 | | | | 0 | | | | 10,215,162 | |
Information technology | | | 11,300,967 | | | | 0 | | | | 0 | | | | 11,300,967 | |
Materials | | | 3,218,719 | | | | 0 | | | | 0 | | | | 3,218,719 | |
Telecommunication services | | | 1,714,924 | | | | | | | | | | | | 1,714,924 | |
Utilities | | | 3,110,656 | | | | 0 | | | | 0 | | | | 3,110,656 | |
| | | | |
Short-term investments | | | | | | | | | | | | | | | | |
Investment companies | | | 1,733,742 | | | | 404,950 | | | | 0 | | | | 2,138,692 | |
Total assets | | $ | 89,471,266 | | | $ | 404,950 | | | $ | 0 | | | $ | 89,876,216 | |
Small Company Growth Portfolio | | | | | | | | | | | | | | | | |
Assets | | | | | | | | | | | | | | | | |
Investments in: | | | | | | | | | | | | | | | | |
| | | | |
Common stocks | | | | | | | | | | | | | | | | |
Consumer discretionary | | $ | 60,694,683 | | | $ | 0 | | | $ | 0 | | | $ | 60,694,683 | |
Consumer staples | | | 7,018,745 | | | | 0 | | | | 0 | | | | 7,018,745 | |
Energy | | | 19,010,001 | | | | 0 | | | | 0 | | | | 19,010,001 | |
Financials | | | 46,837,094 | | | | 0 | | | | 0 | | | | 46,837,094 | |
Health care | | | 118,858,478 | | | | 0 | | | | 0 | | | | 118,858,478 | |
Industrials | | | 63,945,047 | | | | 0 | | | | 0 | | | | 63,945,047 | |
Information technology | | | 113,413,281 | | | | 0 | | | | 0 | | | | 113,413,281 | |
Materials | | | 20,384,666 | | | | 0 | | | | 0 | | | | 20,384,666 | |
| | | | |
Short-term investments | | | | | | | | | | | | | | | | |
Investment companies | | | 16,841,539 | | | | 48,391,400 | | | | 0 | | | | 65,232,939 | |
Total assets | | $ | 467,003,534 | | | $ | 48,391,400 | | | $ | 0 | | | $ | 515,394,934 | |
Small Company Value Portfolio | | | | | | | | | | | | | | | | |
Assets | | | | | | | | | | | | | | | | |
Investments in: | | | | | | | | | | | | | | | | |
| | | | |
Common stocks | | | | | | | | | | | | | | | | |
Consumer discretionary | | $ | 33,234,619 | | | $ | 0 | | | $ | 0 | | | $ | 33,234,619 | |
Consumer staples | | | 1,603,080 | | | | 0 | | | | 0 | | | | 1,603,080 | |
Energy | | | 6,035,692 | | | | 0 | | | | 0 | | | | 6,035,692 | |
Financials | | | 79,811,863 | | | | 0 | | | | 0 | | | | 79,811,863 | |
Health care | | | 11,463,635 | | | | 0 | | | | 0 | | | | 11,463,635 | |
Industrials | | | 19,923,097 | | | | 0 | | | | 0 | | | | 19,923,097 | |
Information technology | | | 24,288,952 | | | | 0 | | | | 0 | | | | 24,288,952 | |
Materials | | | 9,005,561 | | | | 0 | | | | 0 | | | | 9,005,561 | |
Telecommunication services | | | 1,019,045 | | | | 0 | | | | 0 | | | | 1,019,045 | |
Utilities | | | 9,927,665 | | | | 0 | | | | 0 | | | | 9,927,665 | |
| | | | |
Warrants | | | | | | | | | | | | | | | | |
Health care | | | 0 | | | | 6,201 | | | | 0 | | | | 6,201 | |
| | | | |
Short-term investments | | | | | | | | | | | | | | | | |
Investment companies | | | 7,594,762 | | | | 6,184,225 | | | | 0 | | | | 13,778,987 | |
Total assets | | $ | 203,907,971 | | | $ | 6,190,426 | | | $ | 0 | | | $ | 210,098,397 | |
| | | | |
| 128 | | Wells Fargo Advantage Equity Gateway Funds | | Notes to financial statements (unaudited) |
Futures contracts are reported at their variation margin at measurement date, which represents the amount due from the Portfolio at that date. All other assets and liabilities are reported at their market value at measurement date.
Transfers in and transfers out are recognized at the end of the reporting period. At November 30, 2014, the Portfolios did not have any transfers into/out of Level 1, Level 2, or Level 3.
4. TRANSACTIONS WITH AFFILIATES AND OTHER EXPENSES
Advisory fees
The Trust has entered into an advisory contract with Funds Management, an indirect wholly owned subsidiary of Wells Fargo & Company (“Wells Fargo”). The adviser is responsible for implementing investment policies and guidelines and for supervising the subadvisers, who are responsible for day-to-day portfolio management of the Porfolios. Pursuant to the contract, Funds Management is entitled to receive an annual advisory fee which is calculated based on the average daily net assets of each Porfolio.
Funds Management has retained the services of certain subadvisers to provide daily portfolio management for the Portfolios. Funds Management has engaged WellsCap (an affiliate of Funds Management and an indirect wholly owned subsidiary of Wells Fargo), Peregrine Capital Management, Inc. (an affiliate of Funds Management and an indirect wholly owned subsidiary of Wells Fargo), Artisan Partners Limited Partnership, Cooke & Bieler, L.P., Galliard Capital Management, Inc. (an affiliate of Funds Management and an indirect wholly owned subsidiary of Wells Fargo), Golden Capital Management, LLC (an affiliate of Funds Management), LSV Asset Management and Phocas Financial Corporation as subadvisers.
The fees for sub-advisory services are borne by Funds Management. The subadvisers are each entitled to receive from Funds Management an annual subadvisory fee which is calculated based on the average daily net assets of each subadviser’s portion of the Portfolio.
The annual advisory and subadvisory fee rates for each Portfolio are as follows:
| | | | | | | | | | | | | | | | | | | | |
| | | Advisory Fee | | | Effective rate for
the six months ended November 30, 2014 | | | Subadviser | | Subadvisory Fee | |
| | | starting at | | | declining to | | | | | starting at | | declining to | |
C&B Large Cap Value Portfolio | | | 0.65 | %1 | | | 0.475 | %1 | | | 0.65 | %1 | | Cooke & Bieler, L.P. | | 0.45% | | | 0.30 | % |
Diversified Large Cap Growth Portfolio | | | 0.65 | %1 | | | 0.475 | %1 | | | 0.65 | %1 | | WellsCap | | 0.30% | | | 0.20 | % |
Emerging Growth Portfolio | | | 0.80 | % | | | 0.68 | % | | | 0.78 | % | | WellsCap | | 0.55% | | | 0.40 | % |
Index Portfolio | | | 0.10 | % | | | 0.05 | % | | | 0.08 | % | | Golden Capital Management, LLC | | 0.05% | | | 0.02 | % |
International Growth Portfolio | | | 0.85 | % | | | 0.70 | % | | | 0.85 | % | | Artisan Partners Limited Partnership | | 0.80% | | | 0.50 | % |
International Value Portfolio | | | 0.85 | % | | | 0.70 | % | | | 0.85 | % | | LSV Asset Management | | 0.35% | | | 0.30 | % |
Large Company Value Portfolio | | | 0.65 | %1 | | | 0.475 | %1 | | | 0.65 | %1 | | Phocas Financial Corporation | | 0.29% | | | 0.20 | % |
Small Company Growth Portfolio | | | 0.80 | % | | | 0.68 | % | | | 0.80 | % | | Peregrine Capital Management, Inc. | | 0.50% | | | 0.45 | % |
Small Company Value Portfolio | | | 0.80 | % | | | 0.68 | % | | | 0.80 | % | | Peregrine Capital Management, Inc. | | 0.45% | | | 0.40 | % |
| 1. | Prior to July 1, 2014, Funds Management received an annual advisory fee which started at 0.65% and declined to 0.55% as the average daily net assets of the Portfolio increased. |
Funds Management has voluntarily waived and/or reimbursed advisory fees to the extent necessary to maintain certain net operating expense ratios for the Portfolios.
| | | | | | |
| Notes to financial statements (unaudited) | | Wells Fargo Advantage Equity Gateway Funds | | | 129 | |
5. INVESTMENT PORTFOLIO TRANSACTIONS
Purchases and sales of investments, excluding short-term securities, for the six months ended November 30, 2014 were as follows:
| | | | | | | | |
| | | Purchases at cost | | | Sales proceeds | |
C&B Large Cap Value Portfolio | | $ | 50,922,608 | | | $ | 58,360,404 | |
Diversified Large Cap Growth Portfolio | | | 30,576,822 | | | | 41,819,044 | |
Emerging Growth Portfolio | | | 289,640,396 | | | | 366,303,121 | |
Index Portfolio | | | 56,116,557 | | | | 219,537,688 | |
International Growth Portfolio | | | 37,678,197 | | | | 39,067,441 | |
International Value Portfolio | | | 52,587,974 | | | | 35,289,731 | |
Large Company Value Portfolio | | | 34,795,753 | | | | 42,038,264 | |
Small Company Growth Portfolio | | | 207,779,771 | | | | 117,145,296 | |
Small Company Value Portfolio | | | 47,146,848 | | | | 54,932,659 | |
6. DERIVATIVE TRANSACTIONS
During the six months ended November 30, 2014, Index Portfolio entered into futures contracts to gain market exposure.
At November 30, 2014, the Index Portfolio had long futures contracts outstanding as follows:
| | | | | | | | | | | | | | | | | | |
| Expiration date | | Counterparty | | Contracts | | | Type | | | Contract value at
November 30, 2014 | | | Unrealized
gains | |
| 12/18/2014 | | Jefferies Bache | | | 71 Long | | | | S&P 500 Index | | | $ | 36,676,825 | | | $ | 1,535,370 | |
Index Portfolio had an average notional amount of $56,300,311 in long futures contracts outstanding during the six months ended November 30, 2014.
The payable for daily variation margin on open futures contracts reflected in the Statements of Assets and Liabilities only represents the current day’s variation margin. The realized gains or losses and change in unrealized gains or losses on derivative instruments are reflected in the Statements of Operations.
For certain types of derivative transactions, the Portfolios have entered into International Swaps and Derivatives Association, Inc. master agreements (“ISDA Master Agreements”) or similar agreements with approved counterparties. The ISDA Master Agreements or similar agreements may have requirements to deliver/deposit securities or cash to/with an exchange or broker-dealer as collateral and allows the Portfolio to offset, with each counterparty, certain derivative financial instrument’s assets and/or liabilities with collateral held or pledged. Collateral requirements differ by type of derivative. Collateral or margin requirements are set by the broker or exchange clearing house for exchange traded derivatives while collateral terms are contract specific for over-the-counter traded derivatives. Cash collateral that has been pledged to cover obligations of the Portfolios under ISDA Master Agreements or similar agreements, if any, will be reported separately in the Statements of Assets and Liabilities. Securities pledged as collateral, if any, for the same purpose are noted in the Portfolio of Investments or Summary Portfolio of Investments. With respect to balance sheet offsetting, absent an event of default by the counterparty or a termination of the agreement, the reported amounts of financial assets and financial liabilities in the Statements of Assets and Liabilities are not offset across transactions between the Portfolio and the applicable counterparty. A reconciliation of the gross amounts on the Statements of Assets and Liabilities to the net amounts by derivative type, including any collateral exposure, is as follows:
| | | | | | | | | | | | | | | | | | | | |
| | | Derivative type | | Counterparty | | Gross amounts
of liabilities in the
Statements of
Assets and
Liabilities | | | Amounts
subject to
netting
agreements | | | Collateral
pledged 1 | | | Net amount
of liabilities | |
Index Portfolio | | Futures – variation margin | | Jefferies Bache | | $ | 107,505 | | | $ | 0 | | | $ | (107,505 | ) | | $ | 0 | |
| 1. | Collateral pledged within this table is limited to the collateral for the net transaction with the counterparty. |
| | | | |
| 130 | | Wells Fargo Advantage Equity Gateway Funds | | Notes to financial statements (unaudited) |
7. CONCENTRATION RISK
Concentration risks result from exposure to a limited number of sectors, countries or geographical regions. Portfolios that invest a substantial portion of their assets in a sector may be more affected by changes in that sector than would be a fund whose investments are not heavily weighted in any sector. Portfolios that focus their investments in particular countries or geographic regions may be particularly susceptible to economic and political events affecting those countries or regions. The Portfolio of Investments or Summary Portfolio of Investments includes information on each Portfolio’s holdings, including sector, country and/or geographical composition, as relevant.
8. INDEMNIFICATION
Under the Trust’s organizational documents, the officers and Trustees are indemnified against certain liabilities that may arise out of performance of their duties to the Trust. Additionally, in the normal course of business, the Trust may enter into contracts with service providers that contain a variety of indemnification clauses. The Trust’s maximum exposure under these arrangements is dependent on future claims that may be made against the Portfolios and, therefore, cannot be estimated.
| | | | | | |
| Other information (unaudited) | | Wells Fargo Advantage Equity Gateway Funds | | | 131 | |
TAX INFORMATION
Pursuant to Section 853 of the Internal Revenue Code, International Value Fund designated the following amounts as foreign taxes paid for the fiscal year ended May 31, 2014. These amounts may be less than the actual foreign taxes paid for financial statement purposes. Foreign taxes paid or withheld should be included in taxable income with an offsetting deduction from gross income or as a credit for taxes paid to foreign governments. None of the income was derived from ineligible foreign sources as defined under Section 901(j) of the Internal Revenue Code.
| | | | |
Creditable foreign taxes paid | | Per share amount | | Foreign income as % of ordinary income distributions |
| $596,506 | | $0.0195 | | 70.94% |
PROXY VOTING INFORMATION
A description of the policies and procedures used to determine how to vote proxies relating to portfolio securities is available without charge, upon request, by calling 1-800-222-8222, visiting our website at wellsfargoadvantagefunds.com, or visiting the SEC website at sec.gov. Information regarding how the proxies related to portfolio securities were voted during the most recent 12-month period ended June 30 is available without charge on the website at wellsfargoadvantagefunds.com or by visiting the SEC website at sec.gov.
PORTFOLIO HOLDINGS INFORMATION
The complete portfolio holdings are publicly available on the website(wellsfargoadvantagefunds.com) on a one-month delayed basis. In addition, top ten holdings information (excluding derivative positions) is publicly available on the website on a monthly, seven-day or more delayed basis. Each Fund and Portfolio files its complete schedule of portfolio holdings with the SEC for the first and third quarters of each fiscal year on Form N-Q, which is available by visiting the SEC website at sec.gov. In addition, each Form N-Q may be reviewed and copied at the SEC’s Public Reference Room in Washington, DC, and at regional offices in New York City, at 233 Broadway, and in Chicago, at 175 West Jackson Boulevard, Suite 900. Information about the Public Reference Room may be obtained by calling 1-800-SEC-0330.
| | | | |
| 132 | | Wells Fargo Advantage Equity Gateway Funds | | Other information (unaudited) |
BOARD OF TRUSTEES AND OFFICERS
Each of the Trustees and Officers1 listed in the table below acts in identical capacities for each fund in the Wells Fargo Advantage family of funds, which consists of 133 mutual funds comprising the Wells Fargo Funds Trust, Wells Fargo Variable Trust, Wells Fargo Master Trust and four closed-end funds (collectively the “Fund Complex”). This table should be read in conjunction with the Prospectus and the Statement of Additional Information2. The mailing address of each Trustee and Officer is 525 Market Street, 12th Floor, San Francisco, CA 94105. Each Trustee and Officer serves an indefinite term, however, each Trustee serves such term until reaching the mandatory retirement age established by the Trustees.
Independent Trustees
| | | | | | |
Name and
year of birth | | Position held and
length of service* | | Principal occupations during past five years or longer | | Other
directorships during
past five years |
| Peter G. Gordon (Born 1942) | | Trustee, since 1998; Chairman, since 2005 | | Co-Founder, Retired Chairman, President and CEO of Crystal Geyser Water Company. Trustee Emeritus, Colby College. | | Asset Allocation Trust |
| Isaiah Harris, Jr. (Born 1952) | | Trustee, since 2009 | | Retired. Prior thereto, President and CEO of BellSouth Advertising and Publishing Corp. from 2005 to 2007, President and CEO of BellSouth Enterprises from 2004 to 2005 and President of BellSouth Consumer Services from 2000 to 2003. Emeritus member of the Iowa State University Foundation Board of Governors. Emeritus Member of the Advisory Board of Iowa State University School of Business. Advisory Board Member, Palm Harbor Academy. Mr. Harris is a certified public accountant. | | CIGNA Corporation; Asset Allocation Trust |
| Judith M. Johnson (Born 1949) | | Trustee, since 2008;
Audit Committee Chairman, since 2008 | | Retired. Prior thereto, Chief Executive Officer and Chief Investment Officer of Minneapolis Employees Retirement Fund from 1996 to 2008. Ms. Johnson is an attorney, certified public accountant and a certified managerial accountant. | | Asset Allocation Trust |
| Leroy Keith, Jr. (Born 1939) | | Trustee, since 2010** | | Chairman, Bloc Global Services (development and construction). Trustee of the Evergreen Funds complex (and its predecessors) from 1983 to 2010. Former Managing Director, Almanac Capital Management (commodities firm), former Partner, Stonington Partners, Inc. (private equity fund), former Director, Obagi Medical Products Co. and former Director, Lincoln Educational Services. | | Trustee, Virtus Fund Complex (consisting of 50 portfolios as of 12/16/2013); Asset Allocation Trust |
| David F. Larcker (Born 1950) | | Trustee, since 2009 | | James Irvin Miller Professor of Accounting at the Graduate School of Business, Stanford University, Morgan Stanley Director of the Center for Leadership Development and Research and Senior Faculty of The Rock Center for Corporate Governance since 2006. From 2005 to 2008, Professor of Accounting at the Graduate School of Business, Stanford University. Prior thereto, Ernst & Young Professor of Accounting at The Wharton School, University of Pennsylvania from 1985 to 2005. | | Asset Allocation Trust |
| Olivia S. Mitchell (Born 1953) | | Trustee, since 2006 | | International Foundation of Employee Benefit Plans Professor, Wharton School of the University of Pennsylvania since 1993. Director of Wharton’s Pension Research Council and Boettner Center on Pensions & Retirement Research, and Research Associate at the National Bureau of Economic Research. Previously, Cornell University Professor from 1978 to 1993. | | Asset Allocation Trust |
| Timothy J. Penny (Born 1951) | | Trustee, since 1996 | | President and CEO of Southern Minnesota Initiative Foundation, a non-profit organization, since 2007 and Senior Fellow at the Humphrey Institute Policy Forum at the University of Minnesota since 1995. Member of the Board of Trustees of NorthStar Education Finance, Inc., a non-profit organization, since 2007. | | Asset Allocation Trust |
| Michael S. Scofield (Born 1943) | | Trustee, since 2010 | | Served on the Investment Company Institute’s Board of Governors and Executive Committee from 2008-2011 as well the Governing Council of the Independent Directors Council from 2006-2011 and the Independent Directors Council Executive Committee from 2008-2011. Chairman of the IDC from 2008-2010. Institutional Investor (Fund Directions) Trustee of Year in 2007. Trustee of the Evergreen Funds complex (and its predecessors) from 1984 to 2010. Chairman of the Evergreen Funds from 2000-2010. Former Trustee of the Mentor Funds. Retired Attorney, Law Offices of Michael S. Scofield. | | Asset Allocation Trust |
| | | | | | |
| Other information (unaudited) | | Wells Fargo Advantage Equity Gateway Funds | | | 133 | |
| | | | | | |
Name and
year of birth | | Position held and
length of service* | | Principal occupations during past five years or longer | | Other
directorships during
past five years |
| Donald C. Willeke (Born 1940) | | Trustee, since 1996 | | Principal of the law firm of Willeke & Daniels. General Counsel of the Minneapolis Employees Retirement Fund from 1984 until its consolidation into the Minnesota Public Employees Retirement Association on June 30, 2010. Director and Vice Chair of The Tree Trust (non-profit corporation). Director of the American Chestnut Foundation (non-profit corporation). | | Asset Allocation Trust |
| * | Length of service dates reflect the Trustee’s commencement of service with the Trust’s predecessor entities, where applicable. |
| ** | Leroy Keith, Jr. retired as a Trustee effective December 31, 2014. |
Officers
| | | | | | |
Name and
year of birth | | Position held and
length of service | | Principal occupations during past five years or longer | | |
| Karla M. Rabusch (Born 1959) | | President, since 2003 | | Executive Vice President of Wells Fargo Bank, N.A. and President of Wells Fargo Funds Management, LLC since 2003. | | |
| Nancy Wiser1 (Born 1967) | | Treasurer, since 2012 | | Executive Vice President of Wells Fargo Funds Management, LLC since 2011. Chief Operating Officer and Chief Compliance Officer at LightBox Capital Management LLC, from 2008 to 2011. Owned and operated a consulting business providing services to various hedge funds including acting as Chief Operating Officer and Chief Compliance Officer for a hedge fund from 2007 to 2008. Chief Operating Officer and Chief Compliance Officer of GMN Capital LLC from 2006 to 2007. | | |
| C. David Messman (Born 1960) | | Secretary, since 2000; Chief Legal Officer, since 2003 | | Assistant General Counsel of Wells Fargo Bank, N.A. since 2013 and Vice President and Managing Counsel of Wells Fargo Bank N.A. from 1996 to 2013. Senior Vice President and Secretary of Wells Fargo Funds Management, LLC since 2001. | | |
| Debra Ann Early (Born 1964) | | Chief Compliance Officer, since 2007 | | Senior Vice President and Chief Compliance Officer of Wells Fargo Funds Management, LLC since 2007. Chief Compliance Officer of Parnassus Investments from 2005 to 2007. Chief Financial Officer of Parnassus Investments from 2004 to 2007. | | |
| David Berardi (Born 1975) | | Assistant Treasurer, since 2009 | | Vice President of Wells Fargo Funds Management, LLC since 2009. Vice President of Evergreen Investment Management Company, LLC from 2008 to 2010. Assistant Vice President of Evergreen Investment Services, Inc. from 2004 to 2008. Manager of Fund Reporting and Control for Evergreen Investment Management Company, LLC from 2004 to 2010. | | |
| Jeremy DePalma1 (Born 1974) | | Assistant Treasurer, since 2009 | | Senior Vice President of Wells Fargo Funds Management, LLC since 2009. Senior Vice President of Evergreen Investment Management Company, LLC from 2008 to 2010. Vice President, Evergreen Investment Services, Inc. from 2004 to 2007. Head of the Fund Reporting and Control Team within Fund Administration from 2005 to 2010. | | |
| 1. | Jeremy DePalma acts as Treasurer of International Value Fund, International Growth Portfolio, and International Value Portfolio and Assistant Treasurer of the remaining funds in this shareholder report. In addition, Jeremy DePalma acts as Treasurer of 57 other funds and Assistant Treasurer of 60 other funds in the Fund Complex. Nancy Wiser serves as Treasurer of the remaining funds in this shareholder report as well as 60 other funds in the Fund Complex. |
| 2. | The Statement of Additional Information includes additional information about the Trustees and is available, without charge, upon request, by calling 1-800-222-8222 or by visiting the website at wellsfargoadvantagefunds.com. |
| | | | |
| 134 | | Wells Fargo Advantage Equity Gateway Funds | | List of abbreviations |
The following is a list of common abbreviations for terms and entities that may have appeared in this report.
| ACA | — ACA Financial Guaranty Corporation |
| ADR | — American depositary receipt |
| ADS | — American depositary shares |
| AGC | — Assured Guaranty Corporation |
| AGM | — Assured Guaranty Municipal |
| Ambac | — Ambac Financial Group Incorporated |
| AMT | — Alternative minimum tax |
| BAN | — Bond anticipation notes |
| BHAC | — Berkshire Hathaway Assurance Corporation |
| CAB | — Capital appreciation bond |
| CCAB | — Convertible capital appreciation bond |
| CDA | — Community Development Authority |
| CDO | — Collateralized debt obligation |
| DRIVER | — Derivative inverse tax-exempt receipts |
| DW&P | — Department of Water & Power |
| DWR | — Department of Water Resources |
| ECFA | — Educational & Cultural Facilities Authority |
| EDA | — Economic Development Authority |
| EDFA | — Economic Development Finance Authority |
| ETF | — Exchange-traded fund |
| FDIC | — Federal Deposit Insurance Corporation |
| FFCB | — Federal Farm Credit Banks |
| FGIC | — Financial Guaranty Insurance Corporation |
| FHA | — Federal Housing Administration |
| FHLB | — Federal Home Loan Bank |
| FHLMC | — Federal Home Loan Mortgage Corporation |
| FICO | — The Financing Corporation |
| FNMA | — Federal National Mortgage Association |
| GDR | — Global depositary receipt |
| GNMA | — Government National Mortgage Association |
| HCFR | — Healthcare facilities revenue |
| HEFA | — Health & Educational Facilities Authority |
| HEFAR | — Higher education facilities authority revenue |
| HFA | — Housing Finance Authority |
| HFFA | — Health Facilities Financing Authority |
| HUD | — Department of Housing and Urban Development |
| IDA | — Industrial Development Authority |
| IDAG | — Industrial Development Agency |
| KRW | — Republic of Korea won |
| LIBOR | — London Interbank Offered Rate |
| LLC | — Limited liability company |
| LLLP | — Limited liability limited partnership |
| LLP | — Limited liability partnership |
| MBIA | — Municipal Bond Insurance Association |
| MFHR | — Multifamily housing revenue |
| MSTR | — Municipal securities trust receipts |
| MUD | — Municipal Utility District |
| National | — National Public Finance Guarantee Corporation |
| PCFA | — Pollution Control Financing Authority |
| PCL | — Public Company Limited |
| PCR | — Pollution control revenue |
| PFA | — Public Finance Authority |
| PFFA | — Public Facilities Financing Authority |
| PFOTER | — Puttable floating option tax-exempt receipts |
| plc | — Public limited company |
| PUTTER | — Puttable tax-exempt receipts |
| R&D | — Research & development |
| Radian | — Radian Asset Assurance |
| RAN | — Revenue anticipation notes |
| RDA | — Redevelopment Authority |
| RDFA | — Redevelopment Finance Authority |
| REIT | — Real estate investment trust |
| ROC | — Reset option certificates |
| SAVRS | — Select auction variable rate securities |
| SBA | — Small Business Authority |
| SFHR | — Single-family housing revenue |
| SFMR | — Single-family mortgage revenue |
| SPA | — Standby purchase agreement |
| SPDR | — Standard & Poor’s Depositary Receipts |
| STRIPS | — Separate trading of registered interest and |
| TAN | — Tax anticipation notes |
| TIPS | — Treasury inflation-protected securities |
| TRAN | — Tax revenue anticipation notes |
| TTFA | — Transportation Trust Fund Authority |
| TVA | — Tennessee Valley Authority |
This page is intentionally left blank.
This page is intentionally left blank.


For more information
More information about Wells Fargo Advantage Funds is available free upon request. To obtain literature, please write, email, visit the Fund’s website, or call:
Wells Fargo Advantage Funds
P.O. Box 8266
Boston, MA 02266-8266
Email: wfaf@wellsfargo.com
Website: wellsfargoadvantagefunds.com
Individual investors: 1-800-222-8222
Retail investment professionals: 1-888-877-9275
Institutional investment professionals: 1-866-765-0778
This report and the financial statements contained herein are submitted for the general information of the shareholders of Wells Fargo Advantage Funds. If this report is used for promotional purposes, distribution of the report must be accompanied or preceded by a current prospectus. Before investing, please consider the investment objectives, risks, charges, and expenses of the investment. For a current prospectus and, if available, a summary prospectus, containing this information, call 1-800-222-8222 or visit the Fund’s website at wellsfargoadvantagefunds.com. Read the prospectus carefully before you invest or send money.
Wells Fargo Funds Management, LLC, a wholly owned subsidiary of Wells Fargo & Company, provides investment advisory and administrative services for Wells Fargo Advantage Funds. Other affiliates of Wells Fargo & Company provide subadvisory and other services for the Funds. The Funds are distributed by Wells Fargo Funds Distributor, LLC, Member FINRA/SIPC, an affiliate of Wells Fargo & Company.
NOT FDIC INSURED ¡ NO BANK GUARANTEE ¡ MAY LOSE VALUE
© 2014 Wells Fargo Funds Management, LLC. All rights reserved.
| | |
 | | 229721 01-15 SEGF/SAR111 11-14 |

Wells Fargo Advantage Income Funds

Semi-Annual Report
November 30, 2014
| n | | Wells Fargo Advantage Core Bond Fund |
| n | | Wells Fargo Advantage Real Return Fund (formerly, Wells Fargo Advantage Inflation-Protected Bond Fund) |

Reduce clutter. Save trees.
Sign up for electronic delivery of prospectuses and shareholder reports at wellsfargo.com/advantagedelivery
Contents
The views expressed and any forward-looking statements are as of November 30, 2014, unless otherwise noted, and are those of the Fund managers and/or Wells Fargo Funds Management, LLC. Discussions of individual securities, or the markets generally, or any Wells Fargo Advantage Fund are not intended as individual recommendations. Future events or results may vary significantly from those expressed in any forward-looking statements; the views expressed are subject to change at any time in response to changing circumstances in the market. Wells Fargo Funds Management, LLC and the Funds disclaim any obligation to publicly update or revise any views expressed or forward-looking statements.
NOT FDIC INSURED ¡ NO BANK GUARANTEE ¡ MAY LOSE VALUE
| | | | |
| 2 | | Wells Fargo Advantage Income Funds | | Letter to shareholders (unaudited) |

Karla M. Rabusch
President
Wells Fargo Advantage Funds
Major central banks continued to inject liquidity into global banks and markets through various accommodative monetary policies, including quantitative easing.
Dear Valued Shareholder:
We are pleased to offer you this semi-annual report for the Wells Fargo Advantage Income Funds for the six-month period that ended November 30, 2014. The period was marked by a strong U.S. dollar, low interest rates, and sluggish growth outside the U.S.
The U.S. was the fastest-growing developed country, which benefited U.S. companies. Most bond sectors gained modestly amid renewed confidence in economic growth that drove outperformance in credit-sensitive sectors as solid economic growth boosted company revenue and profits and kept default rates low. Investment-grade U.S. bonds (measured by the Barclays U.S. Aggregate Bond Index1), returned 1.91% during the period.
Major central banks continued to provide stimulus.
Major central banks continued to inject liquidity into global banks and markets through various accommodative monetary policies, including quantitative easing. In the U.S., the Federal Reserve (Fed) kept its key interest rate near zero in order to support the economy and the financial system. It tapered the size of its quantitative easing program each month until the program ended in October 2014 and also discussed changes to its forward guidance as it begins to normalize monetary policy.
Meanwhile, European markets continued to benefit from the European Central Bank’s (ECB’s) willingness to maintain low interest rates. In September 2014, the ECB cut its key rate to a historic low of 0.05%. In addition to its targeted longer-term refinancing operations that are designed to increase bank lending, the ECB released details of its asset-backed securities purchase program and the new covered bond purchase program, which are scheduled to begin in the fourth quarter of 2014. In Japan, the Bank of Japan maintained an aggressive monetary program aimed at combating deflation.
Economic growth was sluggish outside the U.S.
The Fed has a dual mandate to maximize employment and keep prices stable, and economic activity during the period showed improvement on both these fronts. The unemployment rate ticked lower to 5.8% as of November 2014. More than 1.5 million jobs were added to payrolls during the reporting period, averaging more than 250,000 per month. On the inflation front, the personal consumption expenditures price index rose from a deflationary danger zone toward the Fed’s longer-run objective of a 2% pace.
Elsewhere, economic data continued to show sluggish growth. The European Union’s gross domestic product was sluggish and the region’s unemployment rate was 11.5% at the end of the reporting period. Japan’s economy faltered in reaction to a sales-tax increase despite Prime Minister Abe’s economic plans to promote growth.
With the U.S. economy the furthest along its business cycle, the level of interest rates in the U.S. and Europe began to diverge—the 10-year U.S. Treasury yield was 2.20% at the end of November 2014 compared with 0.70% for 10-year German government yields, 150 basis points (100 basis points equals 1.00%) higher. This is largely attributed to the Fed being closer to eventually increasing interest rates
| 1. | The Barclays U.S. Aggregate Bond Index is a broad-based benchmark that measures the investment-grade, U.S. dollar-denominated, fixed-rate taxable bond market, including Treasuries, government-related and corporate securities, MBS (agency fixed-rate and hybrid ARM passthroughs), ABS, and CMBS. You cannot invest directly in an index. |
| | | | | | |
| Letter to shareholders (unaudited) | | Wells Fargo Advantage Income Funds | | | 3 | |
while the ECB potentially needs to further increase, rather than scale back, its amount of accommodation. Further, U.S. economic activity is healthier than Europe’s.
Don’t let short-term uncertainty derail long-term investment goals.
Periods of uncertainty can present challenges, but experience has taught us that maintaining long-term investment goals can be an effective way to plan for the future. To help you create a sound strategy based on your personal goals and risk tolerance, Wells Fargo Advantage Funds offers more than 100 mutual funds and other investments spanning a wide range of asset classes and investment styles. Although diversification cannot guarantee an investment profit or prevent losses, we believe it can be an effective way to manage investment risk and potentially smooth out overall portfolio performance. We encourage investors to know their investments and to understand that appropriate levels of risk-taking may unlock opportunities.
Thank you for choosing to invest with Wells Fargo Advantage Funds. We appreciate your confidence in us and remain committed to helping you meet your financial needs. For current information about your fund investments, contact your investment professional, visit our website at wellsfargoadvantagefunds.com, or call us directly at 1-800-222-8222. We are available 24 hours a day, 7 days a week.
Sincerely,

Karla M. Rabusch
President
Wells Fargo Advantage Funds
Periods of uncertainty can present challenges, but experience has taught us that maintaining long-term investment goals can be an effective way to plan for the future.
| | | | |
| 4 | | Wells Fargo Advantage Income Funds | | Performance highlights (unaudited) |
Wells Fargo Advantage Core Bond Fund1
Investment objective
The Fund seeks total return, consisting of income and capital appreciation.
Adviser
Wells Fargo Funds Management, LLC
Subadviser for the master portfolio
Wells Capital Management Incorporated
Portfolio managers
Troy Ludgood
Thomas O’Connor, CFA
Average annual total returns2 (%) as of November 30, 2014
| | | | | | | | | | | | | | | | | | | | | | | | | | | | | | | | | | |
| | | | | Including sales charge | | | Excluding sales charge | | | Expense ratios3 (%) | |
| | | Inception date | | 1 year | | | 5 year | | | 10 year | | | 1 year | | | 5 year | | | 10 year | | | Gross | | | Net4 | |
| Class A (MBFAX) | | 10-31-2001 | | | 0.54 | | | | 3.74 | | | | 4.65 | | | | 5.28 | | | | 4.70 | | | | 5.13 | | | | 0.86 | | | | 0.78 | |
| Class B (MBFBX)* | | 10-31-2001 | | | (0.49 | ) | | | 3.49 | | | | 4.54 | | | | 4.51 | | | | 3.83 | | | | 4.54 | | | | 1.61 | | | | 1.53 | |
| Class C (MBFCX) | | 10-31-2001 | | | 3.45 | | | | 3.83 | | | | 4.30 | | | | 4.45 | | | | 3.83 | | | | 4.30 | | | | 1.61 | | | | 1.53 | |
| Class R (WTRRX) | | 7-9-2010 | | | – | | | | – | | | | – | | | | 5.03 | | | | 4.36 | | | | 4.86 | | | | 1.11 | | | | 1.03 | |
| Class R4 (MBFRX) | | 11-30-2012 | | | – | | | | – | | | | – | | | | 5.48 | | | | 4.89 | | | | 5.42 | | | | 0.63 | | | | 0.52 | |
| Class R6 (WTRIX) | | 11-30-2012 | | | – | | | | – | | | | – | | | | 5.64 | | | | 5.02 | | | | 5.54 | | | | 0.48 | | | | 0.37 | |
| Administrator Class (MNTRX) | | 6-30-1997 | | | – | | | | – | | | | – | | | | 5.37 | | | | 4.73 | | | | 5.25 | | | | 0.80 | | | | 0.70 | |
| Institutional Class (MBFIX) | | 10-31-2001 | | | – | | | | – | | | | – | | | | 5.67 | | | | 5.00 | | | | 5.53 | | | | 0.53 | | | | 0.42 | |
| Investor Class (WTRZX) | | 4-8-2005 | | | – | | | | – | | | | – | | | | 5.26 | | | | 4.59 | | | | 5.05 | | | | 0.89 | | | | 0.79 | |
| Barclays U.S. Aggregate Bond Index5 | | – | | | – | | | | – | | | | – | | | | 5.27 | | | | 4.10 | | | | 4.79 | | | | – | | | | – | |
| * | | Class B shares are closed to investment, except in connection with the reinvestment of any distributions and permitted exchanges. |
Figures quoted represent past performance, which is no guarantee of future results, and do not reflect taxes that a shareholder may pay on fund distributions or the redemption of fund shares. Investment return and principal value of an investment will fluctuate so that an investor’s shares, when redeemed, may be worth more or less than their original cost. Performance shown without sales charges would be lower if sales charges were reflected. Current performance may be lower or higher than the performance data quoted, which assumes the reinvestment of dividends and capital gains. Current month-end performance is available on the Fund’s website, wellsfargoadvantagefunds.com.
Index returns do not include transaction costs associated with buying and selling securities, any mutual fund fees or expenses, or any taxes. It is not possible to invest directly in an index.
For Class A shares, the maximum front-end sales charge is 4.50%. For Class B shares, the maximum contingent deferred sales charge is 5.00%. For Class C shares, the maximum contingent deferred sales charge is 1.00%. Performance including a contingent deferred sales charge assumes the sales charge for the corresponding time period. Class R, Class R4, Class R6, Administrator Class, Institutional Class, and Investor Class shares are sold without a front-end sales charge or contingent deferred sales charge.
Bond values fluctuate in response to the financial condition of individual issuers, general market and economic conditions, and changes in interest rates. Changes in market conditions and government policies may lead to periods of heightened volatility in the bond market and reduced liquidity for certain bonds held by the Fund. In general, when interest rates rise, bond values fall and investors may lose principal value. Interest rate changes and their impact on the Fund and its share price can be sudden and unpredictable. The use of derivatives may reduce returns and/or increase volatility. Certain investment strategies tend to increase the total risk of an investment (relative to the broader market). The Fund is exposed to foreign investment risk and mortgage- and asset-backed securities risk. Consult the Fund’s prospectus for additional information on these and other risks.
Please see footnotes on page 5.
| | | | | | |
| Performance highlights (unaudited) | | Wells Fargo Advantage Income Funds | | | 5 | |
Wells Fargo Advantage Core Bond Fund (continued)
| | | | |
| Ten largest long-term holdings6 (%) as of November 30, 2014 | |
U.S. Treasury Note, 0.88%, 8-15-2017 | | | 4.65 | |
U.S. Treasury Note, 0.88%, 10-15-2017 | | | 4.62 | |
GNMA, 3.50%, 1-21-2045 | | | 2.35 | |
U.S. Treasury Note, 0.63%, 9-30-2017 | | | 1.85 | |
U.S. Treasury Note, 3.13%, 4-30-2017 | | | 1.71 | |
GNMA, 4.00%, 1-21-2045 | | | 1.59 | |
U.S. Treasury Note, 1.63%, 8-31-2019 | | | 1.52 | |
U.S. Treasury Note, 2.50%, 5-15-2024 | | | 1.40 | |
FNMA, 4.50%, 1-14-2045 | | | 1.34 | |
GNMA, 3.00%, 1-21-2045 | | | 1.19 | |
| | |
| Portfolio allocation7 as of November 30, 2014 |
|

|
| 1. | The Fund is a gateway feeder fund that invests all of its assets in a single affiliated master portfolio of the Wells Fargo Master Trust (the “Master Trust”) with a substantially similar investment objective and substantially similar investment strategies. References to the investment activities of the Fund are intended to refer to the investment activities of the affiliated master portfolio in which it invests. See Notes to Financial Statements for a discussion of the Master Trust. |
| 2. | Historical performance shown for Class R and Investor Class shares prior to their inception reflects the performance of Administrator Class shares, adjusted to reflect the higher expenses applicable to Class R and Investor Class shares. Effective June 20, 2008, Class Z was renamed Investor Class and modified to assume the features and attributes of the Investor Class. Historical performance shown for Class R4 shares prior to their inception reflects the performance of Institutional Class shares, adjusted to reflect the higher expenses applicable to Class R4 shares. Historical performance shown for Class R6 shares prior to their inception reflects the performance of Institutional Class shares and includes the higher expenses applicable to Institutional Class shares. If these expenses had not been included, returns would be higher. |
| 3. | Reflects the expense ratios as stated in the most recent prospectuses. The expense ratios shown are subject to change and may differ from the annualized expense ratios shown in the financial highlights of this report. |
| 4. | The Adviser has committed through September 30, 2015, to waive fees and/or reimburse expenses to the extent necessary to cap the Fund’s Total Annual Fund Operating Expenses After Fee Waiver, excluding certain expenses, at the amounts shown. After this time, the cap may be increased or the commitment to maintain the cap may be terminated only with the approval of the Board of Trustees. Brokerage commissions, stamp duty fees, interest, taxes, acquired fund fees and expenses, and extraordinary expenses are excluded from the cap. Fees from the affiliated master portfolio are included in the cap. Without this cap, the Fund’s returns would have been lower. |
| 5. | The Barclays U.S. Aggregate Bond Index is a broad-based benchmark that measures the investment-grade, U.S. dollar-denominated, fixed-rate taxable bond market, including Treasuries, government-related and corporate securities, MBS (agency fixed-rate and hybrid ARM passthroughs), ABS, and CMBS. You cannot invest directly in an index. |
| 6. | The ten largest long-term holdings are calculated based on the value of the securities of the affiliated master portfolio allocable to the Fund divided by the total net assets of the Fund. Holdings are subject to change and may have changed since the date specified. |
| 7. | Portfolio allocation is subject to change and represents the portfolio allocation of the affiliated master portfolio which is calculated based on the total long-term investments of the affiliated master portfolio. |
| | | | |
| 6 | | Wells Fargo Advantage Income Funds | | Performance highlights (unaudited) |
Wells Fargo Advantage Real Return Fund1
Investment objective
The Fund seeks returns that exceed the rate of inflation over the long-term.
Adviser
Wells Fargo Funds Management, LLC
Subadviser for the master portfolio
Wells Capital Management Incorporated
Portfolio managers
Kandarp R. Acharya, CFA, FRM2
Michael Bradshaw, CFA2
Michael J. Bray, CFA
Christian L. Chan, CFA2
Jeffrey Everett, CFA2
Ann M. Miletti2
Jay N. Mueller, CFA
Thomas M. Price, CFA2
Dale Winner, CFA2
Average annual total returns (%) as of November 30, 2014
| | | | | | | | | | | | | | | | | | | | | | | | | | | | | | | | | | |
| | | | | Including sales charge | | | Excluding sales charge | | | Expense ratios3 (%) | |
| | | Inception date | | 1 year | | | 5 year | | | 10 year | | | 1 year | | | 5 year | | | 10 year | | | Gross | | | Net4 | |
| Class A (IPBAX) | | 2-28-2003 | | | (1.95 | ) | | | 2.18 | | | | 3.38 | | | | 2.67 | | | | 3.13 | | | | 3.86 | | | | 1.29 | | | | 0.85 | |
| Class B (IPBBX)* | | 2-28-2003 | | | (3.10 | ) | | | 2.08 | | | | 3.33 | | | | 1.90 | | | | 2.45 | | | | 3.33 | | | | 2.04 | | | | 1.60 | |
| Class C (IPBCX) | | 2-28-2003 | | | 0.88 | | | | 2.42 | | | | 3.10 | | | | 1.88 | | | | 2.42 | | | | 3.10 | | | | 2.04 | | | | 1.60 | |
| Administrator Class (IPBIX) | | 2-28-2003 | | | – | | | | – | | | | – | | | | 2.92 | | | | 3.43 | | | | 4.13 | | | | 1.23 | | | | 0.60 | |
| Barclays U.S. Treasury Inflation-Protected Securities Index5 | | – | | | – | | | | – | | | | – | | | | 3.29 | | | | 3.89 | | | | 4.67 | | | | – | | | | – | |
| Consumer Price Index6 | | – | | | – | | | | – | | | | – | | | | 1.32 | | | | 1.77 | | | | 2.14 | | | | – | | | | – | |
| * | | Class B shares are closed to investment, except in connection with the reinvestment of any distributions and permitted exchanges. |
Figures quoted represent past performance, which is no guarantee of future results, and do not reflect taxes that a shareholder may pay on fund distributions or the redemption of fund shares. Investment return and principal value of an investment will fluctuate so that an investor’s shares, when redeemed, may be worth more or less than their original cost. Performance shown without sales charges would be lower if sales charges were reflected. Current performance may be lower or higher than the performance data quoted, which assumes the reinvestment of dividends and capital gains. Current month-end performance is available on the Fund’s website, wellsfargoadvantagefunds.com.
Index returns do not include transaction costs associated with buying and selling securities, any mutual fund fees or expenses, or any taxes. It is not possible to invest directly in an index.
For Class A shares, the maximum front-end sales charge is 4.50%. For Class B shares, the maximum contingent deferred sales charge is 5.00%. For Class C shares, the maximum contingent deferred sales charge is 1.00%. Performance including a contingent deferred sales charge assumes the sales charge for the corresponding time period. Administrator Class shares are sold without a front-end sales charge or contingent deferred sales charge.
Bond values fluctuate in response to the financial condition of individual issuers, general market and economic conditions, and changes in interest rates. Changes in market conditions and government policies may lead to periods of heightened volatility in the bond market and reduced liquidity for certain bonds held by the Fund. In general, when interest rates rise, bond values fall and investors may lose principal value. Interest rate changes and their impact on the Fund and its share price can be sudden and unpredictable. Stock values fluctuate in response to the activities of individual companies and general market and economic conditions. High-yield securities have a greater risk of default and tend to be more volatile than higher-rated debt securities. Loans are subject to risks similar to those associated with other below-investment-grade bond investments, such as credit risk (for example, risk of issuer default), below-investment-grade bond risk (for example, risk of greater volatility in value), and risk that the loan may become illiquid or difficult to price. Foreign investments are especially volatile and can rise or fall dramatically due to differences in the political and economic conditions of the host country. These risks are generally intensified in emerging markets. Smaller-company stocks tend to be more volatile and less liquid than those of larger companies. Consult the Fund’s prospectus for additional information on these and other risks.
Please see footnotes on page 7.
| | | | | | |
| Performance highlights (unaudited) | | Wells Fargo Advantage Income Funds | | | 7 | |
Wells Fargo Advantage Real Return Fund (continued)
| | | | |
| Ten largest long-term holdings7 (%) as of November 30, 2014 | |
TIPS, 0.13%, 7-15-2022 | | | 3.89 | |
TIPS, 0.13%, 1-15-2022 | | | 3.81 | |
TIPS, 0.13%, 4-15-2017 | | | 3.44 | |
TIPS, 0.63%, 7-15-2021 | | | 3.39 | |
TIPS, 0.13%, 4-15-2016 | | | 3.00 | |
TIPS, 2.38%, 1-15-2025 | | | 2.98 | |
TIPS, 1.13%, 1-15-2021 | | | 2.68 | |
TIPS, 1.25%, 7-15-2020 | | | 2.52 | |
TIPS, 0.13%, 1-15-2023 | | | 2.03 | |
TIPS, 1.38%, 7-15-2018 | | | 2.03 | |
| | |
| Effective maturity distribution8 as of November 30, 2014 |
|
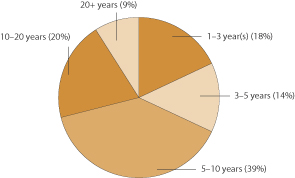
|
| 1. | The Fund is a gateway feeder fund that invests all of its assets in a single affiliated master portfolio of the Wells Fargo Master Trust (the “Master Trust”) with a substantially similar investment objective and substantially similar investment strategies. References to the investment activities of the Fund are intended to refer to the investment activities of the affiliated master portfolio in which it invests. See Notes to Financial Statements for a discussion of the Master Trust. |
| 2. | Effective December 1, 2014, Kandarp Acharya, Michael Bradshaw, Christian Chan, Jeffrey Everett, Ann Miletti, Thomas Price, and Dale Winner became co-portfolio managers of the Fund. |
| 3. | Reflects the expense ratios as stated in the most recent prospectuses. The expense ratios shown are subject to change and may differ from the annualized expense ratios shown in the financial highlights of this report. |
| 4. | The Adviser has committed through September 30, 2015, to waive fees and/or reimburse expenses to the extent necessary to cap the Fund’s Total Annual Fund Operating Expenses After Fee Waiver, excluding certain expenses, at the amounts shown. After this time, the cap may be increased or the commitment to maintain the cap may be terminated only with the approval of the Board of Trustees. Brokerage commissions, stamp duty fees, interest, taxes, acquired fund fees and expenses, and extraordinary expenses are excluded from the cap. Fees from the affiliated master portfolio are included in the cap. Without this cap, the Fund’s returns would have been lower. |
| 5. | The Barclays U.S. Treasury Inflation-Protected Securities Index is an index of inflation-indexed linked U.S. Treasury securities. You cannot invest directly in an index. |
| 6. | The Consumer Price Index for All Urban Consumers in U.S. All Items (Consumer Price Index) is published monthly by the U.S. government as an indicator of changes in price levels (or inflation) paid by urban consumers for a representative basket of goods and services. You cannot invest directly in an index. |
| 7. | The ten largest long-term holdings are calculated based on the value of the securities of the affiliated master portfolio allocable to the Fund divided by the total net assets of the Fund. Holdings are subject to change and may have changed since the date specified. |
| 8. | Effective maturity represents the effective maturity of the affiliated master portfolio and is calculated based on the total long-term investments of the affiliated master portfolio. It is subject to change and may have changed since the date specified. |
| | | | |
| 8 | | Wells Fargo Advantage Income Funds | | Fund expenses (unaudited) |
As a shareholder of the Fund, you incur two types of costs: (1) transaction costs, including sales charges (loads) on purchase payments and contingent deferred sales charges (if any) on redemptions and (2) ongoing costs, including management fees, distribution (12b-1) and/or shareholder service fees, and other Fund expenses. This example is intended to help you understand your ongoing costs (in dollars) of investing in the Fund and to compare these costs with the ongoing costs of investing in other mutual funds.
The example is based on an investment of $1,000 invested at the beginning of the six-month period and held for the entire period from June 1, 2014 to November 30, 2014.
Actual expenses
The “Actual” line of the table below provides information about actual account values and actual expenses. You may use the information in this line, together with the amount you invested, to estimate the expenses that you paid over the period. Simply divide your account value by $1,000 (for example, an $8,600 account value divided by $1,000 = 8.6), then multiply the result by the number in the “Actual” line under the heading entitled “Expenses paid during period” for your applicable class of shares to estimate the expenses you paid on your account during this period.
Hypothetical example for comparison purposes
The “Hypothetical” line of the table below provides information about hypothetical account values and hypothetical expenses based on the Fund’s actual expense ratio and an assumed rate of return of 5% per year before expenses, which is not the Fund’s actual return. The hypothetical account values and expenses may not be used to estimate the actual ending account balance or expenses you paid for the period. You may use this information to compare the ongoing costs of investing in the Fund and other funds. To do so, compare this 5% hypothetical example with the 5% hypothetical examples that appear in the shareholder reports of the other funds.
Please note that the expenses shown in the table are meant to highlight your ongoing costs only and do not reflect any transactional costs, such as sales charges (loads) and contingent deferred sales charges. Therefore, the “Hypothetical” line of the table is useful in comparing ongoing costs only and will not help you determine the relative total costs of owning different funds. In addition, if these transactional costs were included, your costs would have been higher.
| | | | | | | | | | | | | | | | |
| Wells Fargo Advantage Core Bond Fund | | Beginning
account value
6-1-2014 | | | Ending
account value
11-30-2014 | | | Expenses
paid during
the period¹ | | | Net annualized
expense ratio | |
Class A | | | | | | | | | | | | | | | | |
Actual | | $ | 1,000.00 | | | $ | 1,019.64 | | | $ | 3.95 | | | | 0.78 | % |
Hypothetical (5% return before expenses) | | $ | 1,000.00 | | | $ | 1,021.16 | | | $ | 3.95 | | | | 0.78 | % |
Class B | | | | | | | | | | | | | | | | |
Actual | | $ | 1,000.00 | | | $ | 1,015.86 | | | $ | 7.73 | | | | 1.53 | % |
Hypothetical (5% return before expenses) | | $ | 1,000.00 | | | $ | 1,017.40 | | | $ | 7.74 | | | | 1.53 | % |
Class C | | | | | | | | | | | | | | | | |
Actual | | $ | 1,000.00 | | | $ | 1,015.15 | | | $ | 7.73 | | | | 1.53 | % |
Hypothetical (5% return before expenses) | | $ | 1,000.00 | | | $ | 1,017.40 | | | $ | 7.74 | | | | 1.53 | % |
Class R | | | | | | | | | | | | | | | | |
Actual | | $ | 1,000.00 | | | $ | 1,018.65 | | | $ | 5.21 | | | | 1.03 | % |
Hypothetical (5% return before expenses) | | $ | 1,000.00 | | | $ | 1,019.90 | | | $ | 5.22 | | | | 1.03 | % |
Class R4 | | | | | | | | | | | | | | | | |
Actual | | $ | 1,000.00 | | | $ | 1,020.47 | | | $ | 2.63 | | | | 0.52 | % |
Hypothetical (5% return before expenses) | | $ | 1,000.00 | | | $ | 1,022.46 | | | $ | 2.64 | | | | 0.52 | % |
Class R6 | | | | | | | | | | | | | | | | |
Actual | | $ | 1,000.00 | | | $ | 1,021.24 | | | $ | 1.87 | | | | 0.37 | % |
Hypothetical (5% return before expenses) | | $ | 1,000.00 | | | $ | 1,023.21 | | | $ | 1.88 | | | | 0.37 | % |
Administrator Class | | | | | | | | | | | | | | | | |
Actual | | $ | 1,000.00 | | | $ | 1,020.33 | | | $ | 3.55 | | | | 0.70 | % |
Hypothetical (5% return before expenses) | | $ | 1,000.00 | | | $ | 1,021.56 | | | $ | 3.55 | | | | 0.70 | % |
Please see footnotes on page 9.
| | | | | | |
| Fund expenses (unaudited) | | Wells Fargo Advantage Income Funds | | | 9 | |
| | | | | | | | | | | | | | | | |
| Wells Fargo Advantage Core Bond Fund (continued) | | Beginning
account value
6-1-2014 | | | Ending
account value
11-30-2014 | | | Expenses
paid during
the period¹ | | | Net annualized
expense ratio | |
Institutional Class | | | | | | | | | | | | | | | | |
Actual | | $ | 1,000.00 | | | $ | 1,020.97 | | | $ | 2.13 | | | | 0.42 | % |
Hypothetical (5% return before expenses) | | $ | 1,000.00 | | | $ | 1,022.96 | | | $ | 2.13 | | | | 0.42 | % |
Investor Class | | | | | | | | | | | | | | | | |
Actual | | $ | 1,000.00 | | | $ | 1,019.81 | | | $ | 4.05 | | | | 0.80 | % |
Hypothetical (5% return before expenses) | | $ | 1,000.00 | | | $ | 1,021.06 | | | $ | 4.05 | | | | 0.80 | % |
| Wells Fargo Advantage Real Return Fund | | | | | | | | | | | | |
Class A | | | | | | | | | | | | | | | | |
Actual | | $ | 1,000.00 | | | $ | 991.33 | | | $ | 4.24 | | | | 0.85 | % |
Hypothetical (5% return before expenses) | | $ | 1,000.00 | | | $ | 1,020.81 | | | $ | 4.31 | | | | 0.85 | % |
Class B | | | | | | | | | | | | | | | | |
Actual | | $ | 1,000.00 | | | $ | 988.40 | | | $ | 7.98 | | | | 1.60 | % |
Hypothetical (5% return before expenses) | | $ | 1,000.00 | | | $ | 1,017.05 | | | $ | 8.09 | | | | 1.60 | % |
Class C | | | | | | | | | | | | | | | | |
Actual | | $ | 1,000.00 | | | $ | 987.50 | | | $ | 7.97 | | | | 1.60 | % |
Hypothetical (5% return before expenses) | | $ | 1,000.00 | | | $ | 1,017.05 | | | $ | 8.09 | | | | 1.60 | % |
Administrator Class | | | | | | | | | | | | | | | | |
Actual | | $ | 1,000.00 | | | $ | 992.64 | | | $ | 3.00 | | | | 0.60 | % |
Hypothetical (5% return before expenses) | | $ | 1,000.00 | | | $ | 1,022.06 | | | $ | 3.04 | | | | 0.60 | % |
| 1. | Expenses paid is equal to the annualized expense ratio of each class multiplied by the average account value over the period, multiplied by the number of days in the most recent fiscal half-year divided by the number of days in the fiscal year (to reflect the one-half-year period). |
| | | | |
| 10 | | Wells Fargo Advantage Income Funds | | Portfolio of investments—November 30, 2014 (unaudited) |
CORE BOND FUND
| | | | | | | | | | |
| Security name | | | | | | | | Value | |
| | | | |
Investment Companies: 100.08% | | | | | | | | | | |
| | | | |
| Affiliated Master Portfolios: 100.08% | | | | | | | | | | |
Wells Fargo Advantage Core Bond Portfolio | | | | | | | | $ | 2,525,570,561 | |
| | | | | | | | | | |
| | | | |
Total Investment Companies (Cost $2,481,532,251) | | | | | | | | | 2,525,570,561 | |
| | | | | | | | | | |
| | | | | | | | |
| Total investments in securities (Cost $2,481,532,251) * | | | 100.08 | % | | | 2,525,570,561 | |
Other assets and liabilities, net | | | (0.08 | ) | | | (2,122,875 | ) |
| | | | | | | | |
| Total net assets | | | 100.00 | % | | $ | 2,523,447,686 | |
| | | | | | | | |
| * | Cost for federal income tax purposes is $2,483,873,625 and unrealized gains (losses) consists of: |
| | | | | | | | |
| | Gross unrealized gains | | $ | 41,696,936 | | | |
| | Gross unrealized losses | | | 0 | | | |
| | | | | | | | |
| | Net unrealized gains | | $ | 41,696,936 | | | |
REAL RETURN FUND
| | | | | | | | | | |
| Security name | | | | | | | | Value | |
| | | | |
Investment Companies: 100.01% | | | | | | | | | | |
| | | | |
| Affiliated Master Portfolios: 100.01% | | | | | | | | | | |
Wells Fargo Advantage Real Return Portfolio | | | | | | | | $ | 27,729,451 | |
| | | | | | | | | | |
| | | | |
Total Investment Companies (Cost $26,993,735) | | | | | | | | | 27,729,451 | |
| | | | | | | | | | |
| | | | | | | | |
| Total investments in securities (Cost $26,993,735) * | | | 100.01 | % | | | 27,729,451 | |
Other assets and liabilities, net | | | (0.01 | ) | | | (2,206 | ) |
| | | | | | | | |
| Total net assets | | | 100.00 | % | | $ | 27,727,245 | |
| | | | | | | | |
| * | Cost for federal income tax purposes is $26,874,698 and unrealized gains (losses) consists of: |
| | | | | | | | |
| | Gross unrealized gains | | $ | 854,753 | | | |
| | Gross unrealized losses | | | 0 | | | |
| | | | | | | | |
| | Net unrealized gains | | $ | 854,753 | | | |
The accompanying notes are an integral part of these financial statements.
| | | | | | |
| Statements of assets and liabilities—November 30, 2014 (unaudited) | | Wells Fargo Advantage Income Funds | | | 11 | |
| | | | | | | | |
| | | Core Bond Fund | | | Real Return Fund | |
| | |
Assets | | | | | | | | |
Investment in affiliated Master Portfolio, at value (see cost below) | | $ | 2,525,570,561 | | | $ | 27,729,451 | |
Receivable for Fund shares sold | | | 3,102,828 | | | | 17,241 | |
Receivable from administrator | | | 0 | | | | 5,321 | |
Prepaid expenses and other assets | | | 81,031 | | | | 18,504 | |
| | | | |
Total assets | | | 2,528,754,420 | | | | 27,770,517 | |
| | | | |
| | |
Liabilities | | | | | | | | |
Dividends payable | | | 461,823 | | | | 0 | |
Payable for Fund shares redeemed | | | 4,328,305 | | | | 12,020 | |
Distribution fees payable | | | 52,535 | | | | 5,281 | |
Administration fees payable | | | 159,999 | | | | 0 | |
Shareholder report expenses payable | | | 0 | | | | 9,111 | |
Custodian and accounting fees payable | | | 22,116 | | | | 2,422 | |
Shareholder servicing fees payable | | | 208,487 | | | | 5,738 | |
Professional fees payable | | | 9,412 | | | | 8,700 | |
Accrued expenses and other liabilities | | | 64,057 | | | | 0 | |
| | | | |
Total liabilities | | | 5,306,734 | | | | 43,272 | |
| | | | |
Total net assets | | $ | 2,523,447,686 | | | $ | 27,727,245 | |
| | | | |
| | |
NET ASSETS CONSIST OF | | | | | | | | |
Paid-in capital | | $ | 2,558,139,600 | | | $ | 26,632,925 | |
Undistributed net investment income | | | 2,091,464 | | | | 24,561 | |
Accumulated net realized gains (losses) on investments | | | (80,821,688 | ) | | | 334,043 | |
Net unrealized gains on investments | | | 44,038,310 | | | | 735,716 | |
| | | | |
Total net assets | | $ | 2,523,447,686 | | | $ | 27,727,245 | |
| | | | |
| | |
COMPUTATION OF NET ASSET VALUE AND OFFERING PRICE PER SHARE1 | | | | | | | | |
Net assets – Class A | | $ | 434,091,055 | | | $ | 13,458,315 | |
Shares outstanding – Class A1 | | | 33,069,774 | | | | 1,353,667 | |
Net asset value per share – Class A | | | $13.13 | | | | $9.94 | |
Maximum offering price per share – Class A2 | | | $13.75 | | | | $10.41 | |
Net assets – Class B | | $ | 1,899,821 | | | $ | 144,826 | |
Shares outstanding – Class B1 | | | 145,180 | | | | 14,738 | |
Net asset value per share – Class B | | | $13.09 | | | | $9.83 | |
Net assets – Class C | | $ | 77,591,307 | | | $ | 8,396,072 | |
Shares outstanding – Class C1 | | | 5,967,873 | | | | 853,986 | |
Net asset value per share – Class C | | | $13.00 | | | | $9.83 | |
Net assets – Class R | | $ | 17,774,194 | | | | N/A | |
Shares outstanding – Class R1 | | | 1,386,974 | | | | N/A | |
Net asset value per share – Class R | | | $12.82 | | | | N/A | |
Net assets – Class R4 | | $ | 729,187 | | | | N/A | |
Share outstanding – Class R41 | | | 56,974 | | | | N/A | |
Net asset value per share – Class R4 | | | $12.80 | | | | N/A | |
Net assets – Class R6 | | $ | 358,375,346 | | | | N/A | |
Shares outstanding – Class R61 | | | 27,994,669 | | | | N/A | |
Net asset value per share – Class R6 | | | $12.80 | | | | N/A | |
Net assets – Administrator Class | | $ | 398,726,343 | | | $ | 5,728,032 | |
Shares outstanding – Administrator Class1 | | | 31,111,383 | | | | 572,543 | |
Net asset value per share – Administrator Class | | | $12.82 | | | | $10.00 | |
Net assets – Institutional Class | | $ | 1,158,987,403 | | | | N/A | |
Shares outstanding – Institutional Class1 | | | 90,562,882 | | | | N/A | |
Net asset value per share – Institutional Class | | | $12.80 | | | | N/A | |
Net assets – Investor Class | | $ | 75,273,030 | | | | N/A | |
Shares outstanding – Investor Class1 | | | 5,873,496 | | | | N/A | |
Net asset value per share – Investor Class | | | $12.82 | | | | N/A | |
| | |
Investments in affiliated Master Portfolio, at cost | | $ | 2,481,532,251 | | | $ | 26,993,735 | |
| | | | |
| 1. | Each Fund has an unlimited number of authorized shares. |
| 2. | Maximum offering price is computed as 100/95.50 of net asset value. On investments of $50,000 or more, the offering price is reduced. |
The accompanying notes are an integral part of these financial statements.
| | | | |
| 12 | | Wells Fargo Advantage Income Funds | | Statements of operations—six months ended November 30, 2014 (unaudited) |
| | | | | | | | |
| | | Core Bond Fund | | | Real Return Fund | |
| | |
Investment income | | | | | | | | |
Interest allocated from affiliated Master Portfolio | | $ | 28,091,763 | | | $ | 298,713 | |
Securities lending income allocated from affiliated Master Portfolio | | | 117,530 | | | | 0 | |
Expenses allocated from affiliated Master Portfolio | | | (4,597,395 | ) | | | (82,643 | ) |
Waivers allocated from affiliated Master Portfolio | | | 303,660 | | | | 18,321 | |
| | | | |
Total investment income | | | 23,915,558 | | | | 234,391 | |
| | | | |
| | |
Expenses | | | | | | | | |
Administration fees | | | | | | | | |
Fund level | | | 614,513 | | | | 7,324 | |
Class A | | | 334,711 | | | | 11,486 | |
Class B | | | 1,795 | | | | 136 | |
Class C | | | 62,733 | | | | 6,955 | |
Class R | | | 14,339 | | | | N/A | |
Class R4 | | | 49 | | | | N/A | |
Class R6 | | | 46,840 | | | | N/A | |
Administrator Class | | | 204,670 | | | | 3,038 | |
Institutional Class | | | 458,359 | | | | N/A | |
Investor Class | | | 69,779 | | | | N/A | |
Shareholder servicing fees | | | | | | | | |
Class A | | | 522,986 | | | | 17,947 | |
Class B | | | 2,805 | | | | 213 | |
Class C | | | 98,020 | | | | 10,867 | |
Class R | | | 22,405 | | | | N/A | |
Class R4 | | | 61 | | | | N/A | |
Administrator Class | | | 511,676 | | | | 7,596 | |
Investor Class | | | 91,536 | | | | N/A | |
Distribution fees | | | | | | | | |
Class B | | | 8,416 | | | | 639 | |
Class C | | | 294,060 | | | | 32,601 | |
Class R | | | 22,405 | | | | N/A | |
Custody and accounting fees | | | 47,048 | | | | 1,232 | |
Professional fees | | | 15,339 | | | | 15,793 | |
Registration fees | | | 48,317 | | | | 17,930 | |
Shareholder report expenses | | | 66,637 | | | | 6,576 | |
Trustees’ fees and expenses | | | 6,243 | | | | 5,414 | |
Other fees and expenses | | | 36,724 | | | | 3,491 | |
| | | | |
Total expenses | | | 3,602,466 | | | | 149,238 | |
Less: Fee waivers and/or expense reimbursements | | | (843,037 | ) | | | (63,398 | ) |
| | | | |
Net expenses | | | 2,759,429 | | | | 85,840 | |
| | | | |
Net investment income | | | 21,156,129 | | | | 148,551 | |
| | | | |
| | |
REALIZED AND UNREALIZED GAINS (LOSSES) ON INVESTMENTS | | | | | | | | |
Net realized gains on securities transaction allocated from affiliated Master Portfolio | | | 21,606,787 | | | | 117,802 | |
Net change in unrealized gains (losses) on securities transactions allocated from affiliated Master Portfolio | | | 6,771,544 | | | | (541,182 | ) |
| | | | |
Net realized and unrealized gains (losses) on investments | | | 28,378,331 | | | | (423,380 | ) |
| | | | |
Net increase (decrease) in net assets resulting from operations | | $ | 49,534,460 | | | $ | (274,829 | ) |
| | | | |
The accompanying notes are an integral part of these financial statements.
| | | | | | |
| Statements of changes in net assets | | Wells Fargo Advantage Income Funds | | | 13 | |
| | | | | | | | | | | | | | | | |
| | | Core Bond Fund | |
| | | Six months ended
November 30, 2014 (unaudited) | | | Year ended
May 31, 2014 | |
| | | | |
Operations | | | | | | | | | | | | | | | | |
Net investment income | | | | | | $ | 21,156,129 | | | | | | | $ | 43,855,821 | |
Net realized gains (losses) on investments | | | | | | | 21,606,787 | | | | | | | | (22,845,613 | ) |
Net change in unrealized gains (losses) on investments | | | | | | | 6,771,544 | | | | | | | | 38,815,973 | |
| | | | |
Net increase in net assets resulting from operations | | | | | | | 49,534,460 | | | | | | | | 59,826,181 | |
| | | | |
| | | | |
Distributions to shareholders from | | | | | | | | | | | | | | | | |
Net investment income | | | | | | | | | | | | | | | | |
Class A | | | | | | | (3,306,960 | ) | | | | | | | (5,865,007 | ) |
Class B | | | | | | | (9,387 | ) | | | | | | | (44,647 | ) |
Class C | | | | | | | (327,023 | ) | | | | | | | (785,155 | ) |
Class R | | | | | | | (119,343 | ) | | | | | | | (228,016 | ) |
Class R4 | | | | | | | (1,062 | ) | | | | | | | (198 | ) |
Class R6 | | | | | | | (3,108,266 | ) | | | | | | | (4,993,318 | ) |
Administrator Class | | | | | | | (3,403,211 | ) | | | | | | | (7,410,590 | ) |
Institutional Class | | | | | | | (11,133,285 | ) | | | | | | | (24,972,274 | ) |
Investor Class | | | | | | | (573,289 | ) | | | | | | | (1,215,426 | ) |
Net realized gains | | | | | | | | | | | | | | | | |
Class A | | | | | | | 0 | | | | | | | | (4,026,801 | ) |
Class B | | | | | | | 0 | | | | | | | | (66,870 | ) |
Class C | | | | | | | 0 | | | | | | | | (1,061,860 | ) |
Class R | | | | | | | 0 | | | | | | | | (200,189 | ) |
Class R4 | | | | | | | 0 | | | | | | | | (116 | ) |
Class R6 | | | | | | | 0 | | | | | | | | (3,379,798 | ) |
Administrator Class | | | | | | | 0 | | | | | | | | (5,298,095 | ) |
Institutional Class | | | | | | | 0 | | | | | | | | (14,862,491 | ) |
Investor Class | | | | | | | 0 | | | | | | | | (890,215 | ) |
| | | | |
Total distributions to shareholders | | | | | | | (21,981,826 | ) | | | | | | | (75,301,066 | ) |
| | | | |
| | | | |
Capital share transactions | | | Shares | | | | | | | | Shares | | | | | |
Proceeds from shares sold | | | | | | | | | | | | | | | | |
Class A | | | 7,930,447 | | | | 103,045,125 | | | | 13,263,129 | | | | 169,361,027 | |
Class B | | | 2,752 | | | | 35,701 | | | | 8,113 | | | | 103,477 | |
Class C | | | 547,124 | | | | 7,044,803 | | | | 1,073,877 | | | | 13,574,972 | |
Class R | | | 378,671 | | | | 4,796,433 | | | | 565,045 | | | | 7,030,979 | |
Class R4 | | | 55,546 | | | | 705,990 | | | | 539 | | | | 6,747 | |
Class R6 | | | 5,530,822 | | | | 70,247,443 | | | | 9,810,178 | | | | 123,007,279 | |
Administrator Class | | | 3,436,592 | | | | 43,566,673 | | | | 6,606,938 | | | | 82,398,290 | |
Institutional Class | | | 16,579,470 | | | | 209,963,882 | | | | 23,963,448 | | | | 298,197,431 | |
Investor Class | | | 647,199 | | | | 8,216,389 | | | | 913,005 | | | | 11,375,149 | |
| | | | |
| | | | | | | 447,622,439 | | | | | | | | 705,055,351 | |
| | | | |
Reinvestment of distributions | | | | | | | | | | | | | | | | |
Class A | | | 224,531 | | | | 2,920,312 | | | | 676,177 | | | | 8,599,787 | |
Class B | | | 690 | | | | 8,937 | | | | 8,486 | | | | 107,269 | |
Class C | | | 11,065 | | | | 142,528 | | | | 67,017 | | | | 842,297 | |
Class R | | | 3,819 | | | | 48,497 | | | | 12,067 | | | | 149,720 | |
Class R4 | | | 83 | | | | 1,062 | | | | 25 | | | | 314 | |
Class R6 | | | 244,991 | | | | 3,108,034 | | | | 674,798 | | | | 8,373,053 | |
Administrator Class | | | 262,396 | | | | 3,331,973 | | | | 1,002,318 | | | | 12,441,990 | |
Institutional Class | | | 690,512 | | | | 8,756,432 | | | | 2,632,495 | | | | 32,642,786 | |
Investor Class | | | 44,464 | | | | 564,671 | | | | 166,663 | | | | 2,068,605 | |
| | | | |
| | | | | | | 18,882,446 | | | | | | | | 65,225,821 | |
| | | | |
The accompanying notes are an integral part of these financial statements.
| | | | |
| 14 | | Wells Fargo Advantage Income Funds | | Statements of changes in net assets |
| | | | | | | | | | | | | | | | |
| | | Core Bond Fund | |
| | | Six months ended
November 30, 2014 (unaudited) | | | Year ended
May 31, 2014 | |
| | | | |
| | | Shares | | | | | | Shares | | | | |
| | | | |
Capital share transactions (continued) | | | | | | | | | | | | | | | | |
Payment for shares redeemed | | | | | | | | | | | | | | | | |
Class A | | | (5,727,663 | ) | | $ | (74,406,888 | ) | | | (14,705,448 | ) | | $ | (187,743,147 | ) |
Class B | | | (70,154 | ) | | | (907,514 | ) | | | (437,063 | ) | | | (5,557,754 | ) |
Class C | | | (904,482 | ) | | | (11,636,104 | ) | | | (3,887,358 | ) | | | (49,099,264 | ) |
Class R | | | (342,943 | ) | | | (4,346,504 | ) | | | (767,381 | ) | | | (9,537,802 | ) |
Class R6 | | | (763,967 | ) | | | (9,707,967 | ) | | | (3,660,800 | ) | | | (45,426,055 | ) |
Administrator Class | | | (5,126,687 | ) | | | (65,072,071 | ) | | | (16,446,447 | ) | | | (204,932,981 | ) |
Institutional Class | | | (22,210,347 | ) | | | (281,145,332 | ) | | | (49,657,817 | ) | | | (618,682,076 | ) |
Investor Class | | | (651,605 | ) | | | (8,265,777 | ) | | | (2,791,733 | ) | | | (34,783,987 | ) |
| | | | |
| | | | | | | (455,488,157 | ) | | | | | | | (1,155,763,066 | ) |
| | | | |
Net increase (decrease) in net assets resulting from capital share transactions | | | | | | | 11,016,728 | | | | | | | | (385,481,894 | ) |
| | | | |
Total increase (decrease) in net assets | | | | | | | 38,569,362 | | | | | | | | (400,956,779 | ) |
| | | | |
| | | | |
Net assets | | | | | | | | | | | | | | | | |
Beginning of period | | | | | | | 2,484,878,324 | | | | | | | | 2,885,835,103 | |
| | | | |
End of period | | | | | | $ | 2,523,447,686 | | | | | | | $ | 2,484,878,324 | |
| | | | |
Undistributed net investment income | | | | | | $ | 2,091,464 | | | | | | | $ | 2,917,161 | |
| | | | |
The accompanying notes are an integral part of these financial statements.
| | | | | | |
| Statements of changes in net assets | | Wells Fargo Advantage Income Funds | | | 15 | |
| | | | | | | | | | | | | | | | |
| | | Real Return Fund | |
| | | Six months ended
November 30, 2014 (unaudited) | | | Year ended
May 31, 2014 | |
| | | | |
Operations | | | | | | | | | | | | | | | | |
Net investment income | | | | | | $ | 148,551 | | | | | | | $ | 314,559 | |
Net realized gains on investments | | | | | | | 117,802 | | | | | | | | 354,033 | |
Net change in unrealized gains (losses) on investments | | | | | | | (541,182 | ) | | | | | | | (1,670,381 | ) |
| | | | |
Net decrease in net assets resulting from operations | | | | | | | (274,829 | ) | | | | | | | (1,001,789 | ) |
| | | | |
| | | | |
Distributions to shareholders from | | | | | | | | | | | | | | | | |
Net investment income | | | | | | | | | | | | | | | | |
Class A | | | | | | | (118,898 | ) | | | | | | | (145,734 | ) |
Class B | | | | | | | (784 | ) | | | | | | | (732 | ) |
Class C | | | | | | | (40,049 | ) | | | | | | | (34,860 | ) |
Administrator Class | | | | | | | (57,817 | ) | | | | | | | (66,798 | ) |
Net realized gains | | | | | | | | | | | | | | | | |
Class A | | | | | | | 0 | | | | | | | | (1,033,020 | ) |
Class B | | | | | | | 0 | | | | | | | | (16,137 | ) |
Class C | | | | | | | 0 | | | | | | | | (543,733 | ) |
Administrator Class | | | | | | | 0 | | | | | | | | (360,444 | ) |
| | | | |
Total distributions to shareholders | | | | | | | (217,548 | ) | | | | | | | (2,201,458 | ) |
| | | | |
| | | | |
Capital share transactions | | | Shares | | | | | | | | Shares | | | | | |
Proceeds from shares sold | | | | | | | | | | | | | | | | |
Class A | | | 60,629 | | | | 609,085 | | | | 178,876 | | | | 1,836,646 | |
Class B | | | 333 | | | | 3,340 | | | | 4 | | | | 45 | |
Class C | | | 23,021 | | | | 229,137 | | | | 37,390 | | | | 375,848 | |
Administrator Class | | | 40,719 | | | | 411,583 | | | | 177,114 | | | | 1,837,587 | |
| | | | |
| | | | | | | 1,253,145 | | | | | | | | 4,050,126 | |
| | | | |
Reinvestment of distributions | | | | | | | | | | | | | | | | |
Class A | | | 10,688 | | | | 107,299 | | | | 113,457 | | | | 1,108,536 | |
Class B | | | 79 | | | | 784 | | | | 1,747 | | | | 16,821 | |
Class C | | | 3,497 | | | | 34,778 | | | | 51,174 | | | | 493,438 | |
Administrator Class | | | 5,423 | | | | 54,757 | | | | 40,551 | | | | 399,342 | |
| | | | |
| | | | | | | 197,618 | | | | | | | | 2,018,137 | |
| | | | |
Payment for shares redeemed | | | | | | | | | | | | | | | | |
Class A | | | (242,401 | ) | | | (2,432,332 | ) | | | (1,376,278 | ) | | | (14,085,793 | ) |
Class B | | | (4,678 | ) | | | (46,131 | ) | | | (35,894 | ) | | | (363,974 | ) |
Class C | | | (82,204 | ) | | | (815,268 | ) | | | (458,984 | ) | | | (4,651,170 | ) |
Administrator Class | | | (94,872 | ) | | | (958,374 | ) | | | (355,136 | ) | | | (3,657,748 | ) |
| | | | |
| | | | | | | (4,252,105 | ) | | | | | | | (22,758,685 | ) |
| | | | |
Net decrease in net assets resulting from capital share transactions | | | | | | | (2,801,342 | ) | | | | | | | (16,690,422 | ) |
| | | | |
Total decrease in net assets | | | | | | | (3,293,719 | ) | | | | | | | (19,893,669 | ) |
| | | | |
| | | | |
Net assets | | | | | | | | | | | | | | | | |
Beginning of period | | | | | | | 31,020,964 | | | | | | | | 50,914,633 | |
| | | | |
End of period | | | | | | $ | 27,727,245 | | | | | | | $ | 31,020,964 | |
| | | | |
Undistributed net investment income | | | | | | $ | 24,561 | | | | | | | $ | 93,558 | |
| | | | |
The accompanying notes are an integral part of these financial statements.
| | | | |
| 16 | | Wells Fargo Advantage Income Funds | | Financial highlights |
| | | | | | | | | | | | | | | | | | | | | | | | |
| Core Bond Fund | | Beginning
net asset
value per
share | | | Net
investment
income1 | | | Net realized
and unrealized
gains (losses)
on investments | | | Distributions
from net
investment
income | | | Distributions
from net
realized gains | | | Ending
net asset
value per
share | |
Class A | | | | | | | | | | | | | | | | | | | | | | | | |
Six months ended November 30, 2014 (unaudited) | | $ | 12.98 | | | | 0.10 | | | | 0.15 | | | | (0.10 | ) | | | 0.00 | | | $ | 13.13 | |
Year ended May 31, 2014 | | $ | 13.02 | | | | 0.19 | | | | 0.12 | | | | (0.20 | ) | | | (0.15 | ) | | $ | 12.98 | |
Year ended May 31, 2013 | | $ | 13.46 | | | | 0.18 | | | | 0.12 | | | | (0.18 | ) | | | (0.56 | ) | | $ | 13.02 | |
Year ended May 31, 2012 | | $ | 13.05 | | | | 0.26 | | | | 0.72 | | | | (0.26 | ) | | | (0.31 | ) | | $ | 13.46 | |
Year ended May 31, 2011 | | $ | 13.25 | | | | 0.31 | | | | 0.52 | | | | (0.33 | ) | | | (0.70 | ) | | $ | 13.05 | |
Year ended May 31, 2010 | | $ | 12.52 | | | | 0.36 | | | | 0.96 | | | | (0.47 | ) | | | (0.12 | ) | | $ | 13.25 | |
Class B | | | | | | | | | | | | | | | | | | | | | | | | |
Six months ended November 30, 2014 (unaudited) | | $ | 12.94 | | | | 0.05 | 4 | | | 0.15 | | | | (0.05 | ) | | | 0.00 | | | $ | 13.09 | |
Year ended May 31, 2014 | | $ | 12.98 | | | | 0.10 | 4 | | | 0.12 | | | | (0.11 | ) | | | (0.15 | ) | | $ | 12.94 | |
Year ended May 31, 2013 | | $ | 13.43 | | | | 0.08 | 4 | | | 0.10 | | | | (0.07 | ) | | | (0.56 | ) | | $ | 12.98 | |
Year ended May 31, 2012 | | $ | 13.01 | | | | 0.16 | | | | 0.73 | | | | (0.16 | ) | | | (0.31 | ) | | $ | 13.43 | |
Year ended May 31, 2011 | | $ | 13.22 | | | | 0.20 | | | | 0.52 | | | | (0.23 | ) | | | (0.70 | ) | | $ | 13.01 | |
Year ended May 31, 2010 | | $ | 12.53 | | | | 0.34 | | | | 0.84 | | | | (0.37 | ) | | | (0.12 | ) | | $ | 13.22 | |
Class C | | | | | | | | | | | | | | | | | | | | | | | | |
Six months ended November 30, 2014 (unaudited) | | $ | 12.86 | | | | 0.05 | | | | 0.14 | | | | (0.05 | ) | | | 0.00 | | | $ | 13.00 | |
Year ended May 31, 2014 | | $ | 12.90 | | | | 0.10 | | | | 0.12 | | | | (0.11 | ) | | | (0.15 | ) | | $ | 12.86 | |
Year ended May 31, 2013 | | $ | 13.34 | | | | 0.07 | | | | 0.12 | | | | (0.07 | ) | | | (0.56 | ) | | $ | 12.90 | |
Year ended May 31, 2012 | | $ | 12.93 | | | | 0.16 | | | | 0.72 | | | | (0.16 | ) | | | (0.31 | ) | | $ | 13.34 | |
Year ended May 31, 2011 | | $ | 13.14 | | | | 0.22 | | | | 0.50 | | | | (0.23 | ) | | | (0.70 | ) | | $ | 12.93 | |
Year ended May 31, 2010 | | $ | 12.46 | | | | 0.34 | | | | 0.83 | | | | (0.37 | ) | | | (0.12 | ) | | $ | 13.14 | |
Class R | | | | | | | | | | | | | | | | | | | | | | | | |
Six months ended November 30, 2014 (unaudited) | | $ | 12.67 | | | | 0.08 | 4 | | | 0.15 | | | | (0.08 | ) | | | 0.00 | | | $ | 12.82 | |
Year ended May 31, 2014 | | $ | 12.71 | | | | 0.16 | 4 | | | 0.12 | | | | (0.17 | ) | | | (0.15 | ) | | $ | 12.67 | |
Year ended May 31, 2013 | | $ | 13.16 | | | | 0.14 | 4 | | | 0.11 | | | | (0.14 | ) | | | (0.56 | ) | | $ | 12.71 | |
Year ended May 31, 2012 | | $ | 12.76 | | | | 0.22 | | | | 0.71 | | | | (0.22 | ) | | | (0.31 | ) | | $ | 13.16 | |
Year ended May 31, 20115 | | $ | 12.78 | | | | 0.25 | | | | 0.33 | | | | (0.25 | ) | | | (0.35 | ) | | $ | 12.76 | |
Class R4 | | | | | | | | | | | | | | | | | | | | | | | | |
Six months ended November 30, 2014 (unaudited) | | $ | 12.66 | | | | 0.11 | | | | 0.15 | | | | (0.12 | ) | | | 0.00 | | | $ | 12.80 | |
Year ended May 31, 2014 | | $ | 12.70 | | | | 0.22 | | | | 0.12 | | | | (0.23 | ) | | | (0.15 | ) | | $ | 12.66 | |
Year ended May 31, 20136 | | $ | 13.46 | | | | 0.10 | 4 | | | (0.21 | ) | | | (0.09 | ) | | | (0.56 | ) | | $ | 12.70 | |
Class R6 | | | | | | | | | | | | | | | | | | | | | | | | |
Six months ended November 30, 2014 (unaudited) | | $ | 12.66 | | | | 0.12 | | | | 0.15 | | | | (0.13 | ) | | | 0.00 | | | $ | 12.80 | |
Year ended May 31, 2014 | | $ | 12.70 | | | | 0.24 | | | | 0.12 | | | | (0.25 | ) | | | (0.15 | ) | | $ | 12.66 | |
Year ended May 31, 20136 | | $ | 13.46 | | | | 0.11 | 4 | | | (0.21 | ) | | | (0.10 | ) | | | (0.56 | ) | | $ | 12.70 | |
Administrator Class | | | | | | | | | | | | | | | | | | | | | | | | |
Six months ended November 30, 2014 (unaudited) | | $ | 12.67 | | | | 0.10 | | | | 0.16 | | | | (0.11 | ) | | | 0.00 | | | $ | 12.82 | |
Year ended May 31, 2014 | | $ | 12.71 | | | | 0.21 | | | | 0.11 | | | | (0.21 | ) | | | (0.15 | ) | | $ | 12.67 | |
Year ended May 31, 2013 | | $ | 13.16 | | | | 0.19 | | | | 0.10 | | | | (0.18 | ) | | | (0.56 | ) | | $ | 12.71 | |
Year ended May 31, 2012 | | $ | 12.76 | | | | 0.27 | | | | 0.71 | | | | (0.27 | ) | | | (0.31 | ) | | $ | 13.16 | |
Year ended May 31, 2011 | | $ | 12.98 | | | | 0.33 | | | | 0.49 | | | | (0.34 | ) | | | (0.70 | ) | | $ | 12.76 | |
Year ended May 31, 2010 | | $ | 12.31 | | | | 0.44 | | | | 0.83 | | | | (0.48 | ) | | | (0.12 | ) | | $ | 12.98 | |
Institutional Class | | | | | | | | | | | | | | | | | | | | | | | | |
Six months ended November 30, 2014 (unaudited) | | $ | 12.66 | | | | 0.12 | | | | 0.14 | | | | (0.12 | ) | | | 0.00 | | | $ | 12.80 | |
Year ended May 31, 2014 | | $ | 12.70 | | | | 0.23 | | | | 0.12 | | | | (0.24 | ) | | | (0.15 | ) | | $ | 12.66 | |
Year ended May 31, 2013 | | $ | 13.14 | | | | 0.22 | | | | 0.12 | | | | (0.22 | ) | | | (0.56 | ) | | $ | 12.70 | |
Year ended May 31, 2012 | | $ | 12.75 | | | | 0.31 | | | | 0.69 | | | | (0.30 | ) | | | (0.31 | ) | | $ | 13.14 | |
Year ended May 31, 2011 | | $ | 12.96 | | | | 0.36 | | | | 0.50 | | | | (0.37 | ) | | | (0.70 | ) | | $ | 12.75 | |
Year ended May 31, 2010 | | $ | 12.30 | | | | 0.50 | | | | 0.79 | | | | (0.51 | ) | | | (0.12 | ) | | $ | 12.96 | |
Investor Class | | | | | | | | | | | | | | | | | | | | | | | | |
Six months ended November 30, 2014 (unaudited) | | $ | 12.67 | | | | 0.09 | | | | 0.16 | | | | (0.10 | ) | | | 0.00 | | | $ | 12.82 | |
Year ended May 31, 2014 | | $ | 12.71 | | | | 0.19 | | | | 0.11 | | | | (0.19 | ) | | | (0.15 | ) | | $ | 12.67 | |
Year ended May 31, 2013 | | $ | 13.16 | | | | 0.16 | | | | 0.12 | | | | (0.17 | ) | | | (0.56 | ) | | $ | 12.71 | |
Year ended May 31, 2012 | | $ | 12.76 | | | | 0.24 | | | | 0.72 | | | | (0.25 | ) | | | (0.31 | ) | | $ | 13.16 | |
Year ended May 31, 2011 | | $ | 12.98 | | | | 0.30 | | | | 0.50 | | | | (0.32 | ) | | | (0.70 | ) | | $ | 12.76 | |
Year ended May 31, 2010 | | $ | 12.30 | | | | 0.45 | | | | 0.80 | | | | (0.45 | ) | | | (0.12 | ) | | $ | 12.98 | |
| 1. | Includes net expenses allocated from the affiliated Master Portfolio in which the Fund invests. |
| 2. | Total return calculations do not include any sales charges. Returns for periods of less than one year are not annualized. |
| 3. | Portfolio turnover rate is calculated by multiplying the Fund’s investment percentage in the affiliated Master Portfolio by the affiliated Master Portfolio’s portfolio turnover rate. |
| 4. | Calculated based upon average shares outstanding |
| 5. | For the period from July 9, 2010 (commencement of class operations) to May 31, 2011 |
| 6. | For the period from November 30, 2012 (commencement of class operations) to May 31, 2013 |
The accompanying notes are an integral part of these financial statements.
| | | | | | |
| Financial highlights | | Wells Fargo Advantage Income Funds | | | 17 | |
| | | | | | | | | | | | | | | | | | | | | | |
| Ratio to average net assets (annualized) | | | | | | Portfolio
turnover
rate3 | | | Net assets at
end of period
(000s omitted) | |
Net investment
income1 | | | Gross
expenses1 | | | Net
expenses1 | | | Total
return2 | | | |
| | | | | | | | | | | | | | | | | | | | | | |
| | 1.51 | % | | | 0.83 | % | | | 0.78 | % | | | 1.96 | % | | | 286 | % | | $ | 434,091 | |
| | 1.52 | % | | | 0.83 | % | | | 0.78 | % | | | 2.46 | % | | | 646 | % | | $ | 397,780 | |
| | 1.31 | % | | | 0.83 | % | | | 0.80 | % | | | 2.14 | % | | | 547 | % | | $ | 408,864 | |
| | 1.91 | % | | | 0.82 | % | | | 0.82 | % | | | 7.65 | % | | | 803 | % | | $ | 450,013 | |
| | 2.42 | % | | | 0.83 | % | | | 0.83 | % | | | 6.55 | % | | | 761 | % | | $ | 346,740 | |
| | 3.21 | % | | | 0.84 | % | | | 0.84 | % | | | 10.71 | % | | | 638 | % | | $ | 182,316 | |
| | | | | | | | | | | | | | | | | | | | | | |
| | 0.77 | % | | | 1.58 | % | | | 1.53 | % | | | 1.59 | % | | | 286 | % | | $ | 1,900 | |
| | 0.77 | % | | | 1.58 | % | | | 1.53 | % | | | 1.70 | % | | | 646 | % | | $ | 2,742 | |
| | 0.56 | % | | | 1.57 | % | | | 1.55 | % | | | 1.31 | % | | | 547 | % | | $ | 8,208 | |
| | 1.23 | % | | | 1.57 | % | | | 1.57 | % | | | 6.95 | % | | | 803 | % | | $ | 11,998 | |
| | 1.66 | % | | | 1.58 | % | | | 1.58 | % | | | 5.69 | % | | | 761 | % | | $ | 18,762 | |
| | 2.65 | % | | | 1.59 | % | | | 1.59 | % | | | 9.56 | % | | | 638 | % | | $ | 7,514 | |
| | | | | | | | | | | | | | | | | | | | | | |
| | 0.77 | % | | | 1.58 | % | | | 1.53 | % | | | 1.52 | % | | | 286 | % | | $ | 77,591 | |
| | 0.77 | % | | | 1.58 | % | | | 1.53 | % | | | 1.71 | % | | | 646 | % | | $ | 81,187 | |
| | 0.53 | % | | | 1.58 | % | | | 1.55 | % | | | 1.39 | % | | | 547 | % | | $ | 116,837 | |
| | 1.18 | % | | | 1.57 | % | | | 1.57 | % | | | 6.90 | % | | | 803 | % | | $ | 127,677 | |
| | 1.67 | % | | | 1.58 | % | | | 1.58 | % | | | 5.71 | % | | | 761 | % | | $ | 111,140 | |
| | 2.45 | % | | | 1.59 | % | | | 1.59 | % | | | 9.50 | % | | | 638 | % | | $ | 32,556 | |
| | | | | | | | | | | | | | | | | | | | | | |
| | 1.27 | % | | | 1.08 | % | | | 1.03 | % | | | 1.87 | % | | | 286 | % | | $ | 17,774 | |
| | 1.27 | % | | | 1.08 | % | | | 1.03 | % | | | 2.23 | % | | | 646 | % | | $ | 17,077 | |
| | 1.04 | % | | | 1.07 | % | | | 1.05 | % | | | 1.83 | % | | | 547 | % | | $ | 19,548 | |
| | 1.67 | % | | | 1.07 | % | | | 1.07 | % | | | 7.43 | % | | | 803 | % | | $ | 20,088 | |
| | 2.18 | % | | | 1.08 | % | | | 1.08 | % | | | 4.73 | % | | | 761 | % | | $ | 14,596 | |
| | | | | | | | | | | | | | | | | | | | | | |
| | 1.72 | % | | | 0.60 | % | | | 0.52 | % | | | 2.05 | % | | | 286 | % | | $ | 729 | |
| | 1.78 | % | | | 0.58 | % | | | 0.52 | % | | | 2.75 | % | | | 646 | % | | $ | 17 | |
| | 1.56 | % | | | 0.57 | % | | | 0.52 | % | | | (0.84 | )% | | | 547 | % | | $ | 10 | |
| | | | | | | | | | | | | | | | | | | | | | |
| | 1.92 | % | | | 0.45 | % | | | 0.37 | % | | | 2.12 | % | | | 286 | % | | $ | 358,375 | |
| | 1.94 | % | | | 0.45 | % | | | 0.37 | % | | | 2.91 | % | | | 646 | % | | $ | 290,977 | |
| | 1.72 | % | | | 0.45 | % | | | 0.37 | % | | | (0.77 | )% | | | 547 | % | | $ | 205,225 | |
| | | | | | | | | | | | | | | | | | | | | | |
| | 1.59 | % | | | 0.77 | % | | | 0.70 | % | | | 2.03 | % | | | 286 | % | | $ | 398,726 | |
| | 1.60 | % | | | 0.77 | % | | | 0.70 | % | | | 2.57 | % | | | 646 | % | | $ | 412,419 | |
| | 1.43 | % | | | 0.76 | % | | | 0.70 | % | | | 2.19 | % | | | 547 | % | | $ | 526,028 | |
| | 2.08 | % | | | 0.76 | % | | | 0.70 | % | | | 7.83 | % | | | 803 | % | | $ | 802,788 | |
| | 2.54 | % | | | 0.77 | % | | | 0.70 | % | | | 6.62 | % | | | 761 | % | | $ | 1,073,115 | |
| | 3.44 | % | | | 0.76 | % | | | 0.70 | % | | | 10.48 | % | | | 638 | % | | $ | 1,003,134 | |
| | | | | | | | | | | | | | | | | | | | | | |
| | 1.88 | % | | | 0.50 | % | | | 0.42 | % | | | 2.10 | % | | | 286 | % | | $ | 1,158,987 | |
| | 1.88 | % | | | 0.50 | % | | | 0.42 | % | | | 2.85 | % | | | 646 | % | | $ | 1,208,745 | |
| | 1.67 | % | | | 0.50 | % | | | 0.42 | % | | | 2.56 | % | | | 547 | % | | $ | 1,505,192 | |
| | 2.32 | % | | | 0.49 | % | | | 0.42 | % | | | 8.05 | % | | | 803 | % | | $ | 1,965,338 | |
| | 2.84 | % | | | 0.50 | % | | | 0.42 | % | | | 7.00 | % | | | 761 | % | | $ | 1,325,962 | |
| | 3.68 | % | | | 0.49 | % | | | 0.42 | % | | | 10.70 | % | | | 638 | % | | $ | 1,000,253 | |
| | | | | | | | | | | | | | | | | | | | | | |
| | 1.49 | % | | | 0.86 | % | | | 0.80 | % | | | 1.98 | % | | | 286 | % | | $ | 75,273 | |
| | 1.49 | % | | | 0.86 | % | | | 0.81 | % | | | 2.45 | % | | | 646 | % | | $ | 73,934 | |
| | 1.25 | % | | | 0.86 | % | | | 0.83 | % | | | 2.05 | % | | | 547 | % | | $ | 95,924 | |
| | 1.85 | % | | | 0.85 | % | | | 0.85 | % | | | 7.67 | % | | | 803 | % | | $ | 75,160 | |
| | 2.38 | % | | | 0.87 | % | | | 0.86 | % | | | 6.45 | % | | | 761 | % | | $ | 38,573 | |
| | 3.47 | % | | | 0.89 | % | | | 0.89 | % | | | 10.36 | % | | | 638 | % | | $ | 36,375 | |
The accompanying notes are an integral part of these financial statements.
| | | | |
| 18 | | Wells Fargo Advantage Income Funds | | Financial highlights |
| | | | | | | | | | | | | | | | | | | | | | | | |
| Real Return Fund | | Beginning
net asset
value per
share | | | Net investment
income1 | | | Net realized
and unrealized
gains (losses)
on investments | | | Distributions
from net
investment
income | | | Distributions
from net
realized gains | | | Ending
net asset
value per
share | |
Class A | | | | | | | | | | | | | | | | | | | | | | | | |
Six months ended November 30, 2014 (unaudited) | | $ | 10.11 | | | | 0.06 | 4 | | | (0.15 | ) | | | (0.08 | ) | | | 0.00 | | | $ | 9.94 | |
Year ended May 31, 2014 | | $ | 10.85 | | | | 0.10 | 4 | | | (0.21 | ) | | | (0.09 | ) | | | (0.54 | ) | | $ | 10.11 | |
Year ended May 31, 2013 | | $ | 11.66 | | | | 0.11 | | | | (0.36 | ) | | | (0.21 | ) | | | (0.35 | ) | | $ | 10.85 | |
Year ended May 31, 2012 | | $ | 10.84 | | | | 0.27 | | | | 1.01 | | | | (0.36 | ) | | | (0.10 | ) | | $ | 11.66 | |
Year ended May 31, 2011 | | $ | 10.29 | | | | 0.31 | | | | 0.47 | | | | (0.23 | ) | | | 0.00 | | | $ | 10.84 | |
Year ended May 31, 2010 | | $ | 9.76 | | | | 0.31 | 4 | | | 0.49 | | | | (0.27 | ) | | | 0.00 | | | $ | 10.29 | |
Class B | | | | | | | | | | | | | | | | | | | | | | | | |
Six months ended November 30, 2014 (unaudited) | | $ | 9.99 | | | | 0.02 | 4 | | | (0.14 | ) | | | (0.04 | ) | | | 0.00 | | | $ | 9.83 | |
Year ended May 31, 2014 | | $ | 10.75 | | | | 0.01 | 4 | | | (0.20 | ) | | | (0.03 | ) | | | (0.54 | ) | | $ | 9.99 | |
Year ended May 31, 2013 | | $ | 11.58 | | | | 0.03 | 4 | | | (0.36 | ) | | | (0.15 | ) | | | (0.35 | ) | | $ | 10.75 | |
Year ended May 31, 2012 | | $ | 10.76 | | | | 0.19 | 4 | | | 1.00 | | | | (0.27 | ) | | | (0.10 | ) | | $ | 11.58 | |
Year ended May 31, 2011 | | $ | 10.20 | | | | 0.19 | 4 | | | 0.53 | | | | (0.16 | ) | | | 0.00 | | | $ | 10.76 | |
Year ended May 31, 2010 | | $ | 9.71 | | | | 0.24 | 4 | | | 0.47 | | | | (0.22 | ) | | | 0.00 | | | $ | 10.20 | |
Class C | | | | | | | | | | | | | | | | | | | | | | | | |
Six months ended November 30, 2014 (unaudited) | | $ | 10.00 | | | | 0.02 | 4 | | | (0.15 | ) | | | (0.04 | ) | | | 0.00 | | | $ | 9.83 | |
Year ended May 31, 2014 | | $ | 10.76 | | | | 0.03 | 4 | | | (0.21 | ) | | | (0.04 | ) | | | (0.54 | ) | | $ | 10.00 | |
Year ended May 31, 2013 | | $ | 11.59 | | | | 0.04 | | | | (0.37 | ) | | | (0.15 | ) | | | (0.35 | ) | | $ | 10.76 | |
Year ended May 31, 2012 | | $ | 10.77 | | | | 0.19 | | | | 1.00 | | | | (0.27 | ) | | | (0.10 | ) | | $ | 11.59 | |
Year ended May 31, 2011 | | $ | 10.21 | | | | 0.24 | 4 | | | 0.48 | | | | (0.16 | ) | | | 0.00 | | | $ | 10.77 | |
Year ended May 31, 2010 | | $ | 9.72 | | | | 0.23 | 4 | | | 0.48 | | | | (0.22 | ) | | | 0.00 | | | $ | 10.21 | |
Administrator Class | | | | | | | | | | | | | | | | | | | | | | | | |
Six months ended November 30, 2014 (unaudited) | | $ | 10.17 | | | | 0.07 | 4 | | | (0.15 | ) | | | (0.09 | ) | | | 0.00 | | | $ | 10.00 | |
Year ended May 31, 2014 | | $ | 10.90 | | | | 0.13 | 4 | | | (0.22 | ) | | | (0.10 | ) | | | (0.54 | ) | | $ | 10.17 | |
Year ended May 31, 2013 | | $ | 11.71 | | | | 0.15 | 4 | | | (0.37 | ) | | | (0.24 | ) | | | (0.35 | ) | | $ | 10.90 | |
Year ended May 31, 2012 | | $ | 10.89 | | | | 0.39 | 4 | | | 0.92 | | | | (0.39 | ) | | | (0.10 | ) | | $ | 11.71 | |
Year ended May 31, 2011 | | $ | 10.30 | | | | 0.33 | | | | 0.51 | | | | (0.25 | ) | | | 0.00 | | | $ | 10.89 | |
Year ended May 31, 2010 | | $ | 9.75 | | | | 0.33 | 4 | | | 0.49 | | | | (0.27 | ) | | | 0.00 | | | $ | 10.30 | |
| 1. | Includes net expenses allocated from the affiliated Master Portfolio in which the Fund invests. |
| 2. | Total return calculations do not include any sales charges. |
| 3. | Portfolio turnover rate is calculated by multiplying the Fund’s investment percentage in the affiliated Master Portfolio by the affiliated Master Portfolio’s portfolio turnover rate. |
| 4. | Calculated based upon average shares outstanding |
The accompanying notes are an integral part of these financial statements.
| | | | | | |
| Financial highlights | | Wells Fargo Advantage Income Funds | | | 19 | |
| | | | | | | | | | | | | | | | | | | | | | |
| Ratio to average net assets (annualized) | | | Total
return2 | | | Portfolio
turnover
rate3 | | | Net assets at
end of period
(000s omitted) | |
Net investment
income1 | | | Gross
expenses1 | | | Net
expenses1 | | | | |
| | | | | | | | | | | | | | | | | | | | | | | |
| | 1.20 | % | | | 1.24 | % | | | 0.85 | % | | | (0.87 | )% | | | 3 | % | | $ | 13,458 | |
| | 0.96 | % | | | 1.20 | % | | | 0.85 | % | | | (0.76 | )% | | | 9 | % | | $ | 15,415 | |
| | 1.09 | % | | | 1.08 | % | | | 0.85 | % | | | (2.27 | )% | | | 15 | % | | $ | 28,298 | |
| | 2.42 | % | | | 1.11 | % | | | 0.85 | % | | | 12.02 | % | | | 23 | % | | $ | 36,935 | |
| | 2.90 | % | | | 1.04 | % | | | 0.85 | % | | | 7.59 | % | | | 19 | % | | $ | 30,581 | |
| | 3.09 | % | | | 0.98 | % | | | 0.85 | % | | | 8.23 | % | | | 31 | % | | $ | 30,086 | |
| | | | | | | | | | | | | | | | | | | | | | |
| | 0.49 | % | | | 1.99 | % | | | 1.60 | % | | | (1.16 | )% | | | 3 | % | | $ | 145 | |
| | 0.09 | % | | | 1.95 | % | | | 1.60 | % | | | (1.53 | )% | | | 9 | % | | $ | 190 | |
| | 0.29 | % | | | 1.83 | % | | | 1.60 | % | | | (3.02 | )% | | | 15 | % | | $ | 571 | |
| | 1.69 | % | | | 1.84 | % | | | 1.60 | % | | | 11.25 | % | | | 23 | % | | $ | 899 | |
| | 1.83 | % | | | 1.79 | % | | | 1.60 | % | | | 7.11 | % | | | 19 | % | | $ | 1,570 | |
| | 2.41 | % | | | 1.75 | % | | | 1.60 | % | | | 7.38 | % | | | 31 | % | | $ | 2,942 | |
| | | | | | | | | | | | | | | | | | | | | | |
| | 0.42 | % | | | 1.99 | % | | | 1.60 | % | | | (1.25 | )% | | | 3 | % | | $ | 8,396 | |
| | 0.29 | % | | | 1.95 | % | | | 1.60 | % | | | (1.46 | )% | | | 9 | % | | $ | 9,095 | |
| | 0.39 | % | | | 1.83 | % | | | 1.60 | % | | | (3.01 | )% | | | 15 | % | | $ | 13,774 | |
| | 1.68 | % | | | 1.86 | % | | | 1.60 | % | | | 11.24 | % | | | 23 | % | | $ | 15,631 | |
| | 2.27 | % | | | 1.79 | % | | | 1.60 | % | | | 7.11 | % | | | 19 | % | | $ | 14,074 | |
| | 2.32 | % | | | 1.75 | % | | | 1.60 | % | | | 7.36 | % | | | 31 | % | | $ | 12,412 | |
| | | | | | | | | | | | | | | | | | | | | | |
| | 1.45 | % | | | 1.18 | % | | | 0.60 | % | | | (0.74 | )% | | | 3 | % | | $ | 5,728 | |
| | 1.31 | % | | | 1.14 | % | | | 0.60 | % | | | (0.51 | )% | | | 9 | % | | $ | 6,320 | |
| | 1.34 | % | | | 1.02 | % | | | 0.60 | % | | | (2.08 | )% | | | 15 | % | | $ | 8,271 | |
| | 3.42 | % | | | 1.01 | % | | | 0.60 | % | | | 12.26 | % | | | 23 | % | | $ | 9,833 | |
| | 3.32 | % | | | 0.98 | % | | | 0.60 | % | | | 8.22 | % | | | 19 | % | | $ | 35,427 | |
| | 3.26 | % | | | 0.92 | % | | | 0.60 | % | | | 8.49 | % | | | 31 | % | | $ | 28,476 | |
The accompanying notes are an integral part of these financial statements.
| | | | |
| 20 | | Wells Fargo Advantage Income Funds | | Notes to financial statements (unaudited) |
1. ORGANIZATION
Wells Fargo Funds Trust (the “Trust”), a Delaware statutory trust organized on March 10, 1999, is an open-end management investment company registered under the Investment Company Act of 1940, as amended (the “1940 Act”). These financial statements report on the following funds: the Wells Fargo Advantage Core Bond Fund (“Core Bond Fund”) and the Wells Fargo Advantage Real Return Fund (“Real Return Fund”) (formerly, Wells Fargo Advantage Inflation-Protected Bond Fund) (each, a “Fund”, collectively, the “Funds”). Each Fund is a diversified series of the Trust.
Each Fund seeks to achieve its investment objective by investing all investable assets in a separate diversified portfolio (an “affiliated Master Portfolio”) of Wells Fargo Master Trust, a registered open-end management investment company. Each affiliated Master Portfolio directly acquires portfolio securities, and a Fund investing in an affiliated Master Portfolio acquires an indirect interest in those securities. Each Fund accounts for its investment in the affiliated Master Portfolio as a partnership investment and records on a daily basis its share of the affiliated Master Portfolio’s income, expense, and realized and unrealized gains and losses. The financial statements of each affiliated Master Portfolio for the six months ended November 30, 2014 are included in this report and should be read in conjunction with each Fund’s financial statements. As of November 30, 2014, Core Bond Fund owned 84% of Wells Fargo Advantage Core Bond Portfolio and Real Return Fund owned 63% of Wells Fargo Advantage Real Return Portfolio (formerly, Wells Fargo Advantage Inflation-Protected Bond Portfolio).
2. SIGNIFICANT ACCOUNTING POLICIES
The following significant accounting policies, which are consistently followed in the preparation of the financial statements of each Fund, are in conformity with U.S. generally accepted accounting principles which require management to make estimates and assumptions that affect the reported amounts of assets and liabilities, disclosure of contingent assets and liabilities at the date of the financial statements, and the reported amounts of revenues and expenses during the reporting period. Actual results could differ from those estimates.
Securities valuation
All investments are valued each business day as of the close of regular trading on the New York Stock Exchange (generally 4 p.m. Eastern Time).
Investments in the affiliated Master Portfolios are valued daily based on each Fund’s proportionate share of each affiliated Master Portfolio’s net assets, which are also valued daily. Securities held in the affiliated Master Portfolios are valued as discussed in the Notes to Financial Statements of the affiliated Master Portfolios, which are included elsewhere in this report.
Security transactions and income recognition
Securities transactions are recorded on a trade date basis in each affiliated Master Portfolio. Realized gains or losses in each affiliated Master Portfolio are recorded on the basis of identified cost.
Interest income is accrued daily and bond discounts are accreted and premiums are amortized daily based on the effective interest method by each affiliated Master Portfolio. To the extent debt obligations are placed on non-accrual status, any related interest income may be reduced by writing off interest receivables when the collection of all or a portion of interest has become doubtful based on consistently applied procedures. If the issuer subsequently resumes interest payments or when the collectability of interest is reasonably assured, the debt obligation is removed from non-accrual status.
Each Fund records daily its proportionate share of each affiliated Master Portfolio’s interest income and realized and unrealized gains or losses.
Distributions to shareholders
For Core Bond Fund, distributions to shareholders from net investment income are accrued daily and paid monthly. For Real Return Fund, distributions to shareholders from net investment income are recorded on the ex-dividend date. Distributions from net realized gains, if any, are recorded on the ex-dividend date. Such distributions are determined in conformity with federal income tax regulations, which may differ in amount or character from net investment income and realized gains recognized for purposes of U.S. generally accepted accounting principles.
Federal and other taxes
Each Fund is treated as a separate entity for federal income tax purposes. Each Fund intends to continue to qualify as a regulated investment company by distributing substantially all of its investment company taxable income and any net realized capital gains (after reduction for capital loss carryforwards) sufficient to relieve it from all, or substantially all, federal income taxes. Accordingly, no provision for federal income taxes was required.
| | | | | | |
| Notes to financial statements (unaudited) | | Wells Fargo Advantage Income Funds | | | 21 | |
Each Fund’s income and federal excise tax returns and all financial records supporting those returns for the prior three fiscal years are subject to examination by the federal and Delaware revenue authorities. Management has analyzed each Fund’s tax positions taken on federal, state, and foreign tax returns for all open tax years and does not believe that there are any uncertain tax positions that require recognition of a tax liability.
As of May 31, 2014, capital loss carryforwards available to offset future net realized capital gains were as follows through the indicated expiration dates:
| | | | | | | | | | | | |
| | | 2016 | | | 2017 | | | No expiration
Short-term | |
Core Bond Fund | | $ | 52,517,044 | | | $ | 17,505,682 | | | $ | 28,134,403 | |
As of May 31, 2014, Core Bond Fund had $2,116,257 of deferred post-October capital losses which were recognized on the first day of the current fiscal year.
Class allocations
The separate classes of shares offered by each Fund differ principally in applicable sales charges, distribution, shareholder servicing, and administration fees. Class specific expenses are charged directly to that share class. Investment income, common expenses, and realized and unrealized gains (losses) on investments are allocated daily to each class of shares based on the relative proportion of net assets of each class.
3. FAIR VALUATION MEASUREMENTS
Fair value measurements of investments are determined within a framework that has established a fair value hierarchy based upon the various data inputs utilized in determining the value of each Fund’s investments. The three-level hierarchy gives the highest priority to unadjusted quoted prices in active markets for identical assets or liabilities (Level 1) and the lowest priority to significant unobservable inputs (Level 3). Each Fund’s investments are classified within the fair value hierarchy based on the lowest level of input that is significant to the fair value measurement. The inputs are summarized into three broad levels as follows:
| n | | Level 1 – quoted prices in active markets for identical securities |
| n | | Level 2 – other significant observable inputs (including quoted prices for similar securities, interest rates, prepayment speeds, credit risk, use of amortized cost, etc.) |
| n | | Level 3 – significant unobservable inputs (including the Fund’s own assumptions in determining the fair value of investments) |
The inputs or methodologies used for valuing investments in securities are not necessarily an indication of the risk associated with investing in those securities.
At November 30, 2014, each Fund’s investments in an affiliated Master Portfolio carried at fair value were designated as Level 2 inputs.
Further details on the investments of the affiliated Master Portfolios can be found in the Portfolio of Investments or Summary Portfolio of Investments of each affiliated Master Portfolio which is contained elsewhere in this report.
Transfers in and transfers out are recognized at the end of the reporting period. At November 30, 2014, the Funds did not have any transfers into/out of Level 1, Level 2, or Level 3.
4. TRANSACTIONS WITH AFFILIATES
Advisory fees
The Trust has entered into an advisory contract with Wells Fargo Funds Management, LLC (“Funds Management”), an indirect wholly owned subsidiary of Wells Fargo & Company (“Wells Fargo”). The adviser is responsible for implementing the investment policies and guidelines of the Funds.
Since each Fund invests all of its assets in a single affiliated Master Portfolio, Funds Management does not currently receive an advisory fee.
Funds Management also serves as the adviser to each affiliated Master Portfolio and is entitled to receive a fee from each affiliated Master Portfolio for those services.
| | | | |
| 22 | | Wells Fargo Advantage Income Funds | | Notes to financial statements (unaudited) |
Administration fees
The Trust has entered into an administration agreement with Funds Management. Under this agreement, for providing administrative services, which includes paying fees and expenses for services provided by the transfer agent, sub-transfer agents, omnibus account servicers and record-keepers, Funds Management is entitled to receive from each Fund an annual fund level administration fee starting at 0.05% and declining to 0.03% as the average daily net assets of each Fund increase and a class level administration fee which is calculated based on the average daily net assets of each class as follows:
| | | | |
| | | Class level
administration fee | |
Class A, Class B, Class C, Class R | | | 0.16 | % |
Class R4, Institutional Class | | | 0.08 | |
Class R6 | | | 0.03 | |
Administrator Class | | | 0.10 | |
Investor Class | | | 0.19 | |
Funds Management has contractually waived and/or reimbursed administration fees to the extent necessary to maintain certain net operating expense ratios for the Funds. Waiver of fees and/or reimbursement of expenses by Funds Management were made first from fund level expenses on a proportionate basis and then from class specific expenses. Funds Management has committed through September 30, 2015 to waive fees and/or reimburse expenses to the extent necessary to cap each Fund’s expenses as follows:
| | | | | | | | | | | | | | | | | | | | | | | | | | | | | | | | | | | | |
| | | Class A | | | Class B | | | Class C | | | Class R | | | Class R4 | | | Class R6 | | | Administrator
Class | | | Institutional
Class | | | Investor
Class | |
Core Bond Fund | | | 0.78 | % | | | 1.53 | % | | | 1.53 | % | | | 1.03 | % | | | 0.52 | % | | | 0.37 | % | | | 0.70 | % | | | 0.42 | % | | | 0.79 | % |
Real Return Fund | | | 0.85 | % | | | 1.60 | % | | | 1.60 | % | | | N/A | | | | N/A | | | | N/A | | | | 0.60 | % | | | N/A | | | | N/A | |
After September 30, 2015, the cap may be increased or the commitment to maintain the cap may be terminated only with the approval of the Board of Trustees. Prior to October 1, 2014, the expense cap for Core Bond Fund was 0.81% for Investor Class.
Distribution fees
The Trust has adopted a Distribution Plan for Class B, Class C, and Class R shares of the applicable Funds pursuant to Rule 12b-1 under the 1940 Act. Distribution fees are charged to the Class B, Class C, and Class R shares and paid to Wells Fargo Funds Distributor, LLC (“Funds Distributor”), the principal underwriter of each Fund, at an annual rate of 0.75% of the average daily net assets of Class B and Class C shares and 0.25% of the average daily net assets of Class R shares.
In addition, Funds Distributor is entitled to receive the front-end sales charge from the purchase of Class A shares and a contingent deferred sales charge on the redemption of certain shares. Funds Distributor is also entitled to receive the contingent deferred sales charges from redemptions of Class B and Class C shares. For the six months ended November 30, 2014, Funds Distributor received the following amounts in front-end sales charges:
| | | | |
| | | Front-end
sales charges | |
| | | Class A | |
Core Bond Fund | | $ | 3,761 | |
Real Return Fund | | | 205 | |
Shareholder servicing fees
The Trust has entered into contracts with one or more shareholder servicing agents, whereby Class A, Class B, Class C, Class R, Administrator Class, and Investor Class of each applicable Fund is charged a fee at an annual rate of 0.25% of the average daily net assets of each respective class. Class R4 shares are charged a fee at an annual rate of 0.10% of its average daily net assets.
A portion of these total shareholder servicing fees were paid to affiliates of Wells Fargo.
| | | | | | |
| Notes to financial statements (unaudited) | | Wells Fargo Advantage Income Funds | | | 23 | |
5. INVESTMENT PORTFOLIO TRANSACTIONS
Purchases and sales of investments, excluding short-term securities, for the six months ended November 30, 2014 were as follows:
| | | | | | | | | | | | | | | | |
| | | Purchases at cost* | | | Sales proceeds* | |
| | | U.S.
government | | | Non-U.S.
government | | | U.S.
government | | | Non-U.S.
government | |
Core Bond Fund | | $ | 6,527,850,851 | | | $ | 1,108,318,642 | | | $ | 6,518,218,979 | | | $ | 1,022,214,467 | |
Real Return Fund | | | 902,366 | | | | 0 | | | | 2,555,949 | | | | 0 | |
| * | The Funds seek to achieve their investment objective by investing all of its investable assets in a single affiliated Master Portfolio. Purchases and sales have been calculated by multiplying each Fund’s ownership percentage of the affiliated Master Portfolio by the affiliated Master Portfolio’s purchases and sales. |
6. BANK BORROWINGS
The Trust (excluding the money market funds and certain other funds in the Trust) and Wells Fargo Variable Trust are parties to a $150,000,000 revolving credit agreement whereby the Funds are permitted to use bank borrowings for temporary or emergency purposes, such as to fund shareholder redemption requests. Interest under the credit agreement is charged to each Fund based on a borrowing rate equal to the higher of the Federal Funds rate in effect on that day plus 1.25% or the overnight LIBOR rate in effect on that day plus 1.25%. In addition, an annual commitment fee equal to 0.10% of the unused balance is allocated to each participating fund. For the six months ended November 30, 2014, the Funds paid the following amounts in commitment fees:
| | | | |
| | | Commitment fee | |
Core Bond Fund | | $ | 1,374 | |
Real Return Fund | | | 17 | |
For the six months ended November 30, 2014, there were no borrowings by the Funds under the agreement.
7. INDEMNIFICATION
Under the Trust’s organizational documents, the officers and Trustees are indemnified against certain liabilities that may arise out of performance of their duties to the Trust. Additionally, in the normal course of business, the Trust may enter into contracts with service providers that contain a variety of indemnification clauses. The Trust’s maximum exposure under these arrangements is dependent on future claims that may be made against the Funds and, therefore, cannot be estimated.
8. SUBSEQUENT DISTRIBUTIONS
On December 9, 2014, Real Return Fund declared distributions from long-term capital gains to shareholders of record on December 8, 2014. The per share amounts payable on December 10, 2014 were as follows:
| | | | |
| | | Long-term capital gains | |
Class A | | $ | 0.07839 | |
Class B | | | 0.07839 | |
Class C | | | 0.07839 | |
Administrator Class | | | 0.07839 | |
These distributions are not reflected in the accompanying financial statements. The final determination of the source of all distributions is subject to change and made after the Fund’s tax year-end.
| | | | |
| 24 | | Wells Fargo Advantage Income Funds | | Summary portfolio of investments—November 30, 2014 (unaudited) |
CORE BOND PORTFOLIO
The Summary Portfolio of Investments shows the 50 largest portfolio holdings in unaffiliated issuers and any holdings exceeding 1% of the total net assets as of the report date. The remaining securities held are grouped as “Other securities” in each category. You can request a complete schedule of portfolio holdings as of the report date, free of charge, by accessing the following website:
http://a584.g.akamai.net/f/584/1326/1d/www.wellsfargoadvantagefunds.com/pdf/semi/holdings/corebond.pdf or by calling Wells Fargo Advantage Funds at 1-800-222-8222. This complete schedule, filed on Form N-CSRS, is also available on the SEC’s website at sec.gov.
| | | | | | | | | | | | | | | | | | | | |
| Security name | | Interest rate | | | Maturity date | | | Principal | | | Value | | | Percent of
net assets | |
| | | | | |
Agency Securities: 29.23% | | | | | | | | | | | | | | | | | | | | |
FHLMC | | | 0.85-7.50 | % | | | 8-1-2017 to 1-15-2045 | | | $ | 176,335,247 | | | $ | 185,188,504 | | | | 6.21 | % |
FHLMC | | | 4.00 | | | | 11-15-2039 | | | | 9,514,843 | | | | 10,261,882 | | | | 0.34 | |
FHLMC | | | 5.00 | | | | 8-1-2039 | | | | 15,552,178 | | | | 17,550,342 | | | | 0.59 | |
FNMA | | | 0.00-7.50 | | | | 9-1-2016 to 12-11-2044 | | | | 249,631,627 | | | | 265,832,530 | | | | 8.89 | |
FNMA | | | 2.50 | | | | 11-1-2027 | | | | 14,796,323 | | | | 15,143,122 | | | | 0.51 | |
FNMA ± | | | 2.82 | | | | 11-1-2044 | | | | 10,766,329 | | | | 11,168,639 | | | | 0.37 | |
FNMA | | | 3.00 | | | | 10-25-2042 | | | | 17,211,045 | | | | 17,442,327 | | | | 0.58 | |
FNMA ± | | | 3.23 | | | | 4-1-2044 | | | | 14,871,672 | | | | 15,580,571 | | | | 0.52 | |
FNMA %% | | | 3.50 | | | | 1-14-2045 | | | | 20,700,000 | | | | 21,510,210 | | | | 0.72 | |
FNMA | | | 4.00 | | | | 3-1-2032 | | | | 18,152,985 | | | | 19,574,150 | | | | 0.65 | |
FNMA %% | | | 4.00 | | | | 1-14-2045 | | | | 33,400,000 | | | | 35,547,514 | | | | 1.19 | |
FNMA %% | | | 4.50 | | | | 1-14-2045 | | | | 37,100,000 | | | | 40,218,719 | | | | 1.35 | |
FNMA | | | 5.00 | | | | 7-1-2041 | | | | 10,584,486 | | | | 11,894,460 | | | | 0.40 | |
FNMA Series 2012-130 Class DC | | | 3.00 | | | | 12-25-2042 | | | | 18,092,447 | | | | 18,335,573 | | | | 0.61 | |
GNMA | | | 3.50-8.05 | | | | 7-15-2019 to 12-18-2044 | | | | 3,287,698 | | | | 3,455,883 | | | | 0.11 | |
GNMA %% | | | 3.00 | | | | 1-21-2045 | | | | 34,900,000 | | | | 35,639,581 | | | | 1.19 | |
GNMA %% | | | 3.50 | | | | 1-21-2045 | | | | 67,400,000 | | | | 70,587,020 | | | | 2.36 | |
GNMA %% | | | 4.00 | | | | 12-18-2044 | | | | 20,500,000 | | | | 21,987,851 | | | | 0.74 | |
GNMA %% | | | 4.00 | | | | 1-21-2045 | | | | 44,600,000 | | | | 47,704,571 | | | | 1.60 | |
Other securities | | | | | | | | | | | | | | | 9,051,151 | | | | 0.30 | |
| | | | | | | | | | | | | | | | | | | | |
| | | | | |
Total Agency Securities (Cost $864,562,687) | | | | | | | | | | | | | | | 873,674,600 | | | | 29.23 | |
| | | | | | | | | | | | | | | | | | | | |
| | | | | |
Asset-Backed Securities: 15.30% | | | | | | | | | | | | | | | | | | | | |
Ally Auto Receivables Trust | | | 0.63-2.23 | | | | 2-16-2016 to 1-15-2020 | | | | 13,585,541 | | | | 13,615,857 | | | | 0.45 | |
Ally Auto Receivables Trust Series 2014-1 Class A4 | | | 1.53 | | | | 4-15-2019 | | | | 17,815,000 | | | | 17,875,446 | | | | 0.60 | |
Capital Auto Receivables Asset Trust | | | 0.46-1.83 | | | | 6-20-2016 to 3-16-2020 | | | | 53,424,000 | | | | 53,681,611 | | | | 1.80 | |
Chase Issuance Trust | | | 0.52-1.58 | | | | 7-15-2020 to 8-16-2021 | | | | 20,081,000 | | | | 20,050,526 | | | | 0.67 | |
Chase Issuance Trust Series 2013-A9 Class A ± | | | 0.57 | | | | 11-16-2020 | | | | 13,959,000 | | | | 13,986,778 | | | | 0.47 | |
Citibank Credit Card Issuance Trust Series 2013-A7 Class A7 ± | | | 0.59 | | | | 9-10-2020 | | | | 14,099,000 | | | | 14,126,846 | | | | 0.47 | |
Citibank Credit Card Issuance Trust Series 2014-A3 Class A3 ± | | | 0.36 | | | | 5-9-2018 | | | | 15,918,000 | | | | 15,918,000 | | | | 0.53 | |
Citibank Credit Card Issuance Trust Series 2014-A6 Class A6 | | | 2.15 | | | | 7-15-2021 | | | | 32,537,000 | | | | 32,764,173 | | | | 1.10 | |
Ford Credit Auto Owner Trust Series 2014-1 Class A 144A | | | 2.26 | | | | 11-15-2025 | | | | 9,567,000 | | | | 9,664,689 | | | | 0.32 | |
SLM Student Loan Trust | | | 0.33-2.95 | | | | 1-25-2018 to 2-15-2046 | | | | 81,650,356 | | | | 81,304,077 | | | | 2.75 | |
Toyota Auto Receivables Owner Trust Series 2014-B Class A2 | | | 0.40 | | | | 12-15-2016 | | | | 9,637,000 | | | | 9,632,422 | | | | 0.32 | �� |
Other securities | | | | | | | | | | | | | | | 174,866,428 | | | | 5.82 | |
| | | | | | | | | | | | | | | | | | | | |
| | | | |
Total Asset-Backed Securities (Cost $456,083,939) | | | | | | | | | | | | 457,486,853 | | | | 15.30 | |
| | | | | | | | | | | | | | | | | | | | |
The accompanying notes are an integral part of these financial statements.
| | | | | | |
| Summary portfolio of investments—November 30, 2014 (unaudited) | | Wells Fargo Advantage Income Funds | | | 25 | |
CORE BOND PORTFOLIO
| | | | | | | | | | | | | | | | | | | | |
| Security name | | Interest rate | | | Maturity date | | | Principal | | | Value | | | Percent of
net assets | |
| | | | | |
Corporate Bonds and Notes: 18.91% | | | | | | | | | | | | | | | | | | | | |
| | | | | |
Consumer Discretionary: 1.47% | | | | | | | | | | | | | | | | | | | | |
| | | | | |
| Auto Components: 0.06% | | | | | | | | | | | | | | | | | | | | |
Other securities | | | | | | | | | | | | | | $ | 1,866,917 | | | | 0.06 | % |
| | | | | | | | | | | | | | | | | | | | |
| | | | | |
| Automobiles: 0.46% | | | | | | | | | | | | | | | | | | | | |
Other securities | | | | | | | | | | | | | | | 13,740,624 | | | | 0.46 | |
| | | | | | | | | | | | | | | | | | | | |
| | | | | |
| Hotels, Restaurants & Leisure: 0.08% | | | | | | | | | | | | | | | | | | | | |
Other securities | | | | | | | | | | | | | | | 2,213,359 | | | | 0.08 | |
| | | | | | | | | | | | | | | | | | | | |
| | | | | |
| Media: 0.69% | | | | | | | | | | | | | | | | | | | | |
Other securities | | | | | | | | | | | | | | | 20,431,905 | | | | 0.69 | |
| | | | | | | | | | | | | | | | | | | | |
| | | | | |
| Multiline Retail: 0.12% | | | | | | | | | | | | | | | | | | | | |
Other securities | | | | | | | | | | | | | | | 3,663,449 | | | | 0.12 | |
| | | | | | | | | | | | | | | | | | | | |
| | | | | |
| Specialty Retail: 0.06% | | | | | | | | | | | | | | | | | | | | |
Other securities | | | | | | | | | | | | | | | 1,872,573 | | | | 0.06 | |
| | | | | | | | | | | | | | | | | | | | |
| | | | | |
Consumer Staples: 1.15% | | | | | | | | | | | | | | | | | | | | |
| | | | | |
| Beverages: 0.32% | | | | | | | | | | | | | | | | | | | | |
Other securities | | | | | | | | | | | | | | | 9,711,190 | | | | 0.32 | |
| | | | | | | | | | | | | | | | | | | | |
| | | | | |
| Food Products: 0.54% | | | | | | | | | | | | | | | | | | | | |
Other securities | | | | | | | | | | | | | | | 16,091,974 | | | | 0.54 | |
| | | | | | | | | | | | | | | | | | | | |
| | | | | |
| Tobacco: 0.29% | | | | | | | | | | | | | | | | | | | | |
Other securities | | | | | | | | | | | | | | | 8,644,910 | | | | 0.29 | |
| | | | | | | | | | | | | | | | | | | | |
| | | | | |
Energy: 2.21% | | | | | | | | | | | | | | | | | | | | |
| | | | | |
| Energy Equipment & Services: 0.02% | | | | | | | | | | | | | | | | | | | | |
Other securities | | | | | | | | | | | | | | | 759,848 | | | | 0.02 | |
| | | | | | | | | | | | | | | | | | | | |
| | | | | |
| Oil, Gas & Consumable Fuels: 2.19% | | | | | | | | | | | | | | | | | | | | |
Other securities | | | | | | | | | | | | | | | 65,416,863 | | | | 2.19 | |
| | | | | | | | | | | | | | | | | | | | |
| | | | | |
Financials: 7.34% | | | | | | | | | | | | | | | | | | | | |
| | | | | |
| Banks: 2.87% | | | | | | | | | | | | | | | | | | | | |
Bank of America Corporation | | | 1.50 | % | | | 10-9-2015 | | | $ | 11,242,000 | | | | 11,309,171 | | | | 0.38 | |
Other securities | | | | | | | | | | | | | | | 74,333,179 | | | | 2.49 | |
| | | | | |
| | | | | | | | | | | | | | | 85,642,350 | | | | 2.87 | |
| | | | | | | | | | | | | | | | | | | | |
| | | | | |
| Capital Markets: 1.23% | | | | | | | | | | | | | | | | | | | | |
Other securities | | | | | | | | | | | | | | | 36,754,181 | | | | 1.23 | |
| | | | | | | | | | | | | | | | | | | | |
| | | | | |
| Consumer Finance: 1.03% | | | | | | | | | | | | | | | | | | | | |
Other securities | | | | | | | | | | | | | | | 30,924,184 | | | | 1.03 | |
| | | | | | | | | | | | | | | | | | | | |
The accompanying notes are an integral part of these financial statements.
| | | | |
| 26 | | Wells Fargo Advantage Income Funds | | Summary portfolio of investments—November 30, 2014 (unaudited) |
CORE BOND PORTFOLIO
| | | | | | | | | | | | | | |
| Security name | | | | | | | | Value | | | Percent of
net assets | |
| | | | | |
| Diversified Financial Services: 0.19% | | | | | | | | | | | | | | |
Other securities | | | | | | | | $ | 5,732,694 | | | | 0.19 | % |
| | | | | | | | | | | | | | |
| | | | | |
| Insurance: 0.92% | | | | | | | | | | | | | | |
Other securities | | | | | | | | | 27,633,687 | | | | 0.92 | |
| | | | | | | | | | | | | | |
| | | | | |
| REITs: 1.10% | | | | | | | | | | | | | | |
Other securities | | | | | | | | | 32,844,870 | | | | 1.10 | |
| | | | | | | | | | | | | | |
| | | | | |
Health Care: 1.54% | | | | | | | | | | | | | | |
| | | | | |
| Biotechnology: 0.58% | | | | | | | | | | | | | | |
Other securities | | | | | | | | | 17,252,876 | | | | 0.58 | |
| | | | | | | | | | | | | | |
| | | | | |
| Health Care Providers & Services: 0.32% | | | | | | | | | | | | | | |
Other securities | | | | | | | | | 9,584,490 | | | | 0.32 | |
| | | | | | | | | | | | | | |
| | | | | |
| Life Sciences Tools & Services: 0.25% | | | | | | | | | | | | | | |
Other securities | | | | | | | | | 7,547,238 | | | | 0.25 | |
| | | | | | | | | | | | | | |
| | | | | |
| Pharmaceuticals: 0.39% | | | | | | | | | | | | | | |
Other securities | | | | | | | | | 11,642,987 | | | | 0.39 | |
| | | | | | | | | | | | | | |
| | | | | |
Industrials: 0.72% | | | | | | | | | | | | | | |
| | | | | |
| Aerospace & Defense: 0.27% | | | | | | | | | | | | | | |
Other securities | | | | | | | | | 7,933,394 | | | | 0.27 | |
| | | | | | | | | | | | | | |
| | | | | |
| Machinery: 0.06% | | | | | | | | | | | | | | |
Other securities | | | | | | | | | 1,725,506 | | | | 0.06 | |
| | | | | | | | | | | | | | |
| | | | | |
| Road & Rail: 0.39% | | | | | | | | | | | | | | |
Other securities | | | | | | | | | 11,705,600 | | | | 0.39 | |
| | | | | | | | | | | | | | |
| | | | | |
Information Technology: 1.10% | | | | | | | | | | | | | | |
| | | | | |
| Electronic Equipment, Instruments & Components: 0.15% | | | | | | | | | | | | | | |
Other securities | | | | | | | | | 4,355,384 | | | | 0.15 | |
| | | | | | | | | | | | | | |
| | | | | |
| IT Services: 0.13% | | | | | | | | | | | | | | |
Other securities | | | | | | | | | 3,748,573 | | | | 0.13 | |
| | | | | | | | | | | | | | |
| | | | | |
| Semiconductors & Semiconductor Equipment: 0.02% | | | | | | | | | | | | | | |
Other securities | | | | | | | | | 725,092 | | | | 0.02 | |
| | | | | | | | | | | | | | |
| | | | | |
| Software: 0.32% | | | | | | | | | | | | | | |
Other securities | | | | | | | | | 9,646,263 | | | | 0.32 | |
| | | | | | | | | | | | | | |
| | | | | |
| Technology Hardware, Storage & Peripherals: 0.48% | | | | | | | | | | | | | | |
Other securities | | | | | | | | | 14,508,523 | | | | 0.48 | |
| | | | | | | | | | | | | | |
| | | | | |
Materials: 0.50% | | | | | | | | | | | | | | |
| | | | | |
| Chemicals: 0.33% | | | | | | | | | | | | | | |
Other securities | | | | | | | | | 9,930,161 | | | | 0.33 | |
| | | | | | | | | | | | | | |
The accompanying notes are an integral part of these financial statements.
| | | | | | |
| Summary portfolio of investments—November 30, 2014 (unaudited) | | Wells Fargo Advantage Income Funds | | | 27 | |
CORE BOND PORTFOLIO
| | | | | | | | | | | | | | | | | | | | |
| Security name | | Interest rate | | | Maturity date | | | Principal | | | Value | | | Percent of
net assets | |
| | | | | |
| Metals & Mining: 0.17% | | | | | | | | | | | | | | | | | | | | |
Other securities | | | | | | | | | | | | | | $ | 5,031,707 | | | | 0.17 | % |
| | | | | | | | | | | | | | | | | | | | |
| | | | | |
Telecommunication Services: 1.31% | | | | | | | | | | | | | | | | | | | | |
| | | | | |
| Diversified Telecommunication Services: 1.31% | | | | | | | | | | | | | | | | | | | | |
Verizon Communications Incorporated | | | 1.35-5.15 | % | | | 6-9-2017 to 11-1-2034 | | | $ | 32,724,000 | | | | 33,597,214 | | | | 1.13 | |
Other securities | | | | | | | | | | | | | | | 5,503,246 | | | | 0.18 | |
| | | | | |
| | | | | | | | | | | | | | | 39,100,460 | | | | 1.31 | |
| | | | | | | | | | | | | | | | | | | | |
| | | | | |
Utilities: 1.57% | | | | | | | | | | | | | | | | | | | | |
| | | | | |
| Electric Utilities: 0.89% | | | | | | | | | | | | | | | | | | | | |
Other securities | | | | | | | | | | | | | | | 26,556,052 | | | | 0.89 | |
| | | | | | | | | | | | | | | | | | | | |
| | | | | |
| Gas Utilities: 0.09% | | | | | | | | | | | | | | | | | | | | |
Other securities | | | | | | | | | | | | | | | 2,608,803 | | | | 0.09 | |
| | | | | | | | | | | | | | | | | | | | |
| | | | | |
| Multi-Utilities: 0.59% | | | | | | | | | | | | | | | | | | | | |
Other securities | | | | | | | | | | | | | | | 17,718,580 | | | | 0.59 | |
| | | | | | | | | | | | | | | | | | | | |
| | | | |
Total Corporate Bonds and Notes (Cost $550,940,409) | | | | | | | | | | | | 565,267,267 | | | | 18.91 | |
| | | | | | | | | | | | | | | | | | | | |
| | | | | |
Municipal Obligations: 0.98% | | | | | | | | | | | | | | | | | | | | |
| | | | | |
| California: 0.27% | | | | | | | | | | | | | | | | | | | | |
Other securities | | | | | | | | | | | | | | | 8,188,556 | | | | 0.27 | |
| | | | | | | | | | | | | | | | | | | | |
| | | | | |
| Illinois: 0.05% | | | | | | | | | | | | | | | | | | | | |
Other securities | | | | | | | | | | | | | | | 1,585,771 | | | | 0.05 | |
| | | | | | | | | | | | | | | | | | | | |
| | | | | |
| Nevada: 0.14% | | | | | | | | | | | | | | | | | | | | |
Other securities | | | | | | | | | | | | | | | 4,240,684 | | | | 0.14 | |
| | | | | | | | | | | | | | | | | | | | |
| | | | | |
| New Jersey: 0.18% | | | | | | | | | | | | | | | | | | | | |
Other securities | | | | | | | | | | | | | | | 5,407,466 | | | | 0.18 | |
| | | | | | | | | | | | | | | | | | | | |
| | | | | |
| New York: 0.14% | | | | | | | | | | | | | | | | | | | | |
Other securities | | | | | | | | | | | | | | | 4,024,594 | | | | 0.14 | |
| | | | | | | | | | | | | | | | | | | | |
| | | | | |
| Ohio: 0.04% | | | | | | | | | | | | | | | | | | | | |
Other securities | | | | | | | | | | | | | | | 1,212,740 | | | | 0.04 | |
| | | | | | | | | | | | | | | | | | | | |
| | | | | |
| Texas: 0.16% | | | | | | | | | | | | | | | | | | | | |
Other securities | | | | | | | | | | | | | | | 4,763,967 | | | | 0.16 | |
| | | | | | | | | | | | | | | | | | | | |
| | | | | |
Total Municipal Obligations (Cost $22,612,089) | | | | | | | | | | | | | | | 29,423,778 | | | | 0.98 | |
| | | | | | | | | | | | | | | | | | | | |
| | | | | |
Non-Agency Mortgage Backed Securities: 5.16% | | | | | | | | | | | | | | | | | | | | |
Commercial Mortgage Trust | | | 3.07-4.21 | | | | 12-10-2044 to 12-10-2047 | | | | 45,320,000 | | | | 47,520,293 | | | | 1.58 | |
Impact Funding LLC Series 2010-1 Class A1 144A | | | 5.31 | | | | 1-25-2051 | | | | 10,841,564 | | | | 12,449,324 | | | | 0.42 | |
Other securities | | | | | | | | | | | | | | | 94,131,398 | | | | 3.16 | |
| | | | | | | | | | | | | | | | | | | | |
| | | |
Total Non-Agency Mortgage Backed Securities (Cost $151,195,776) | | | | | | | | 154,101,015 | | | | 5.16 | |
| | | | | | | | | | | | | | | | | | | | |
The accompanying notes are an integral part of these financial statements.
| | | | |
| 28 | | Wells Fargo Advantage Income Funds | | Summary portfolio of investments—November 30, 2014 (unaudited) |
CORE BOND PORTFOLIO
| | | | | | | | | | | | | | | | | | | | |
| Security name | | Interest rate | | | Maturity date | | | Principal | | | Value | | | Percent of
net assets | |
| | | | | |
U.S. Treasury Securities: 29.96% | | | | | | | | | | | | | | | | | | | | |
U.S. Treasury Bond | | | 3.13-3.75 | % | | | 11-15-2041 to 11-15-2043 | | | $ | 7,802,000 | | | $ | 8,920,653 | | | | 0.30 | % |
U.S. Treasury Bond | | | 3.13 | | | | 2-15-2043 | | | | 20,513,000 | | | | 21,412,044 | | | | 0.72 | |
U.S. Treasury Bond | | | 3.13 | | | | 8-15-2044 | | | | 11,625,000 | | | | 12,143,580 | | | | 0.41 | |
U.S. Treasury Bond | | | 3.38 | | | | 5-15-2044 | | | | 13,915,000 | | | | 15,226,057 | | | | 0.51 | |
U.S. Treasury Bond | | | 3.63 | | | | 8-15-2043 | | | | 8,969,000 | | | | 10,260,393 | | | | 0.34 | |
U.S. Treasury Bond | | | 3.63 | | | | 2-15-2044 | | | | 15,814,000 | | | | 18,098,380 | | | | 0.60 | |
U.S. Treasury Note ## | | | 0.38 | | | | 10-31-2016 | | | | 9,873,000 | | | | 9,858,348 | | | | 0.33 | |
U.S. Treasury Note %% | | | 0.50 | | | | 11-30-2016 | | | | 19,946,000 | | | | 19,949,183 | | | | 0.67 | |
U.S. Treasury Note | | | 0.63-2.75 | | | | 8-31-2017 to 11-15-2024 | | | | 45,891,000 | | | | 46,638,190 | | | | 1.56 | |
U.S. Treasury Note | | | 0.63 | | | | 9-30-2017 | | | | 56,005,000 | | | | 55,663,706 | | | | 1.86 | |
U.S. Treasury Note ## | | | 0.88 | | | | 5-15-2017 | | | | 30,714,000 | | | | 30,853,165 | | | | 1.03 | |
U.S. Treasury Note | | | 0.88 | | | | 8-15-2017 | | | | 139,524,000 | | | | 139,829,279 | | | | 4.68 | |
U.S. Treasury Note ## | | | 0.88 | | | | 10-15-2017 | | | | 138,683,000 | | | | 138,845,536 | | | | 4.64 | |
U.S. Treasury Note | | | 1.00 | | | | 9-15-2017 | | | | 12,558,000 | | | | 12,629,618 | | | | 0.42 | |
U.S. Treasury Note | | | 1.50 | | | | 1-31-2019 | | | | 9,563,000 | | | | 9,638,462 | | | | 0.32 | |
U.S. Treasury Note | | | 1.50 | | | | 5-31-2019 | | | | 20,847,000 | | | | 20,941,458 | | | | 0.70 | |
U.S. Treasury Note | | | 1.50 | | | | 10-31-2019 | | | | 31,889,000 | | | | 31,918,912 | | | | 1.07 | |
U.S. Treasury Note | | | 1.63 | | | | 3-31-2019 | | | | 34,453,000 | | | | 34,840,596 | | | | 1.16 | |
U.S. Treasury Note | | | 1.63 | | | | 6-30-2019 | | | | 26,028,000 | | | | 26,282,189 | | | | 0.88 | |
U.S. Treasury Note | | | 1.63 | | | | 7-31-2019 | | | | 34,285,000 | | | | 34,593,016 | | | | 1.16 | |
U.S. Treasury Note | | | 1.63 | | | | 8-31-2019 | | | | 45,236,000 | | | | 45,607,071 | | | | 1.53 | |
U.S. Treasury Note %% | | | 1.63 | | | | 11-30-2019 | | | | 11,300,000 | | | | 11,292,093 | | | | 0.38 | |
U.S. Treasury Note | | | 1.75 | | | | 9-30-2019 | | | | 25,287,000 | | | | 25,622,837 | | | | 0.86 | |
U.S. Treasury Note | | | 2.00 | | | | 10-31-2021 | | | | 20,939,000 | | | | 21,099,309 | | | | 0.71 | |
U.S. Treasury Note | | | 2.50 | | | | 5-15-2024 | | | | 40,711,000 | | | | 41,941,856 | | | | 1.40 | |
U.S. Treasury Note | | | 3.13 | | | | 4-30-2017 | | | | 48,591,000 | | | | 51,464,720 | | | | 1.72 | |
| | | | | | | | | | | | | | | | | | | | |
| | | | |
Total U.S. Treasury Securities (Cost $878,685,604) | | | | | | | | | | | | 895,570,651 | | | | 29.96 | |
| | | | | | | | | | | | | | | | | | | | |
| | | | | |
Yankee Corporate Bonds and Notes: 5.21% | | | | | | | | | | | | | | | | | | | | |
| | | | | |
Consumer Discretionary: 0.34% | | | | | | | | | | | | | | | | | | | | |
| | | | | |
| Media: 0.17% | | | | | | | | | | | | | | | | | | | | |
Other securities | | | | | | | | | | | | | | | 4,937,892 | | | | 0.17 | |
| | | | | | | | | | | | | | | | | | | | |
| | | | | |
| Textiles, Apparel & Luxury Goods: 0.17% | | | | | | | | | | | | | | | | | | | | |
Other securities | | | | | | | | | | | | | | | 5,054,241 | | | | 0.17 | |
| | | | | | | | | | | | | | | | | | | | |
| | | | | |
Consumer Staples: 0.16% | | | | | | | | | | | | | | | | | | | | |
| | | | | |
| Beverages: 0.16% | | | | | | | | | | | | | | | | | | | | |
Other securities | | | | | | | | | | | | | | | 4,784,078 | | | | 0.16 | |
| | | | | | | | | | | | | | | | | | | | |
| | | | | |
Energy: 1.22% | | | | | | | | | | | | | | | | | | | | |
| | | | | |
| Oil, Gas & Consumable Fuels: 1.22% | | | | | | | | | | | | | | | | | | | | |
Other securities | | | | | | | | | | | | | | | 36,574,843 | | | | 1.22 | |
| | | | | | | | | | | | | | | | | | | | |
The accompanying notes are an integral part of these financial statements.
| | | | | | |
| Summary portfolio of investments—November 30, 2014 (unaudited) | | Wells Fargo Advantage Income Funds | | | 29 | |
CORE BOND PORTFOLIO
| | | | | | | | | | | | | | | | | | | | |
| Security name | | Interest rate | | | Maturity date | | | Principal | | | Value | | | Percent of
net assets | |
| | | | | |
Financials: 2.30% | | | | | | | | | | | | | | | | | | | | |
| | | | | |
| Banks: 1.88% | | | | | | | | | | | | | | | | | | | | |
Bank of Tokyo-Mitsubishi UFJ Limited 144A | | | 2.35 | % | | | 9-8-2019 | | | $ | 10,515,000 | | | $ | 10,531,298 | | | | 0.35 | % |
Other securities | | | | | | | | | | | | | | | 45,727,296 | | | | 1.53 | |
| | | | | |
| | | | | | | | | | | | | | | 56,258,594 | | | | 1.88 | |
| | | | | | | | | | | | | | | | | | | | |
| | | | | |
| Consumer Finance: 0.16% | | | | | | | | | | | | | | | | | | | | |
Other securities | | | | | | | | | | | | | | | 4,790,924 | | | | 0.16 | |
| | | | | | | | | | | | | | | | | | | | |
| | | | | |
| Diversified Financial Services: 0.26% | | | | | | | | | | | | | | | | | | | | |
Other securities | | | | | | | | | | | | | | | 7,608,191 | | | | 0.26 | |
| | | | | | | | | | | | | | | | | | | | |
| | | | | |
Health Care: 0.32% | | | | | | | | | | | | | | | | | | | | |
| | | | | |
| Pharmaceuticals: 0.32% | | | | | | | | | | | | | | | | | | | | |
Other securities | | | | | | | | | | | | | | | 9,694,119 | | | | 0.32 | |
| | | | | | | | | | | | | | | | | | | | |
| | | | | |
Information Technology: 0.37% | | | | | | | | | | | | | | | | | | | | |
| | | | | |
| Internet Software & Services: 0.37% | | | | | | | | | | | | | | | | | | | | |
Other securities | | | | | | | | | | | | | | | 11,104,517 | | | | 0.37 | |
| | | | | | | | | | | | | | | | | | | | |
| | | | | |
Materials: 0.17% | | | | | | | | | | | | | | | | | | | | |
| | | | | |
| Chemicals: 0.05% | | | | | | | | | | | | | | | | | | | | |
Other securities | | | | | | | | | | | | | | | 1,388,576 | | | | 0.05 | |
| | | | | | | | | | | | | | | | | | | | |
| | | | | |
| Metals & Mining: 0.12% | | | | | | | | | | | | | | | | | | | | |
Other securities | | | | | | | | | | | | | | | 3,633,585 | | | | 0.12 | |
| | | | | | | | | | | | | | | | | | | | |
| | | | | |
Telecommunication Services: 0.23% | | | | | | | | | | | | | | | | | | | | |
| | | | | |
| Diversified Telecommunication Services: 0.08% | | | | | | | | | | | | | | | | | | | | |
Other securities | | | | | | | | | | | | | | | 2,348,995 | | | | 0.08 | |
| | | | | | | | | | | | | | | | | | | | |
| | | | | |
| Wireless Telecommunication Services: 0.15% | | | | | | | | | | | | | | | | | | | | |
Other securities | | | | | | | | | | | | | | | 4,485,633 | | | | 0.15 | |
| | | | | | | | | | | | | | | | | | | | |
| | | | | |
Utilities: 0.10% | | | | | | | | | | | | | | | | | | | | |
| | | | | |
| Electric Utilities: 0.10% | | | | | | | | | | | | | | | | | | | | |
Other securities | | | | | | | | | | | | | | | 2,969,249 | | | | 0.10 | |
| | | | | | | | | | | | | | | | | | | | |
| | | | |
Total Yankee Corporate Bonds and Notes (Cost $152,240,431) | | | | | | | | | | | | 155,633,437 | | | | 5.21 | |
| | | | | | | | | | | | | | | | | | | | |
| | | | | |
Yankee Government Bonds: 1.43% | | | | | | | | | | | | | | | | | | | | |
Other securities | | | | | | | | | | | | | | | 42,692,495 | | | | 1.43 | |
| | | | | | | | | | | | | | | | | | | | |
| | | | | |
Total Yankee Government Bonds (Cost $40,387,654) | | | | | | | | | | | | | | | 42,692,495 | | | | 1.43 | |
| | | | | | | | | | | | | | | | | | | | |
The accompanying notes are an integral part of these financial statements.
| | | | |
| 30 | | Wells Fargo Advantage Income Funds | | Summary portfolio of investments—November 30, 2014 (unaudited) |
CORE BOND PORTFOLIO
| | | | | | | | | | | | | | | | | | |
| Security name | | Yield | | | | | Shares | | | Value | | | Percent of
net assets | |
| Short-Term Investments: 5.50% | | | | | | | | | | | | | | | | | | |
| | | | | |
| Investment Companies: 5.50% | | | | | | | | | | | | | | | | | | |
Securities Lending Cash Investments, LLC (l)(u)(r) | | | 0.12 | % | | | | | 747,555 | | | $ | 747,555 | | | | 0.03 | % |
Wells Fargo Advantage Cash Investment Money Market Fund, Select Class (l)(u)## | | | 0.08 | | | | | | 163,584,955 | | | | 163,584,955 | | | | 5.47 | |
| | | | | |
| | | | | | | | | | | | | 164,332,510 | | | | 5.50 | |
| | | | | | | | | | | | | | | | | | |
| | | | | |
Total Short-Term Investments (Cost $164,332,510) | | | | | | | | | | | | | 164,332,510 | | | | 5.50 | |
| | | | | | | | | | | | | | | | | | |
| | | | |
| Total investments in securities (Cost $3,281,041,099) * | | | | | | | | | | 3,338,182,606 | | | | 111.68 | % |
Other assets and liabilities, net | | | | | | | | | | | | | (349,138,883 | ) | | | (11.68 | ) |
| | | | | | | | | | | | | | | | | | |
| Total net assets | | | | | | | | | | | | $ | 2,989,043,723 | | | | 100.00 | % |
| | | | | | | | | | | | | | | | | | |
| ± | Variable rate investment. The rate shown is the rate in effect at period end. |
| %% | Security issued on a when-issued basis |
| 144A | The security may be resold in transactions exempt from registration, normally to qualified institutional buyers, pursuant to Rule 144A under the Securities Act of 1933. |
| ## | All or a portion of this security has been segregated for when-issued securities. |
| (l) | The security represents an affiliate of the Portfolio as defined in the Investment Company Act of 1940. |
| (u) | The rate represents the 7-day annualized yield at period end. |
| (r) | The investment is a non-registered investment vehicle purchased with cash collateral received from securities on loan. |
| * | Cost for federal income tax purposes is $3,286,132,910 and unrealized gains (losses) consists of: |
| | | | |
Gross unrealized gains | | $ | 60,627,009 | |
Gross unrealized losses | | | (8,577,313 | ) |
| | | | |
Net unrealized gains | | $ | 52,049,696 | |
The accompanying notes are an integral part of these financial statements.
| | | | | | |
| Portfolio of investments—November 30, 2014 (unaudited) | | Wells Fargo Advantage Income Funds | | | 31 | |
REAL RETURN PORTFOLIO
| | | | | | | | | | | | | | | | |
| Security name | | Interest rate | | | Maturity date | | | Principal | | | Value | |
| | | | |
U.S. Treasury Securities: 99.58% | | | | | | | | | | | | | | | | |
TIPS | | | 0.13 | % | | | 4-15-2016 | | | $ | 2,081,216 | | | $ | 2,095,849 | |
TIPS | | | 0.13 | | | | 4-15-2017 | | | | 2,378,869 | | | | 2,409,906 | |
TIPS | | | 0.13 | | | | 4-15-2018 | | | | 453,068 | | | | 457,847 | |
TIPS | | | 0.13 | | | | 4-15-2019 | | | | 863,439 | | | | 868,093 | |
TIPS | | | 0.13 | | | | 1-15-2022 | | | | 2,692,224 | | | | 2,663,199 | |
TIPS | | | 0.13 | | | | 7-15-2022 | | | | 2,748,084 | | | | 2,721,892 | |
TIPS | | | 0.13 | | | | 1-15-2023 | | | | 1,448,850 | | | | 1,422,477 | |
TIPS | | | 0.13 | | | | 7-15-2024 | | | | 877,135 | | | | 855,343 | |
TIPS | | | 0.38 | | | | 7-15-2023 | | | | 1,135,308 | | | | 1,139,388 | |
TIPS | | | 0.63 | | | | 7-15-2021 | | | | 2,302,276 | | | | 2,372,783 | |
TIPS | | | 0.63 | | | | 1-15-2024 | | | | 1,025,221 | | | | 1,044,284 | |
TIPS | | | 0.63 | | | | 2-15-2043 | | | | 740,232 | | | | 685,467 | |
TIPS | | | 0.75 | | | | 2-15-2042 | | | | 995,454 | | | | 955,091 | |
TIPS | | | 1.13 | | | | 1-15-2021 | | | | 1,768,163 | | | | 1,870,246 | |
TIPS | | | 1.25 | | | | 7-15-2020 | | | | 1,653,516 | | | | 1,767,454 | |
TIPS | | | 1.38 | | | | 7-15-2018 | | | | 1,335,610 | | | | 1,420,547 | |
TIPS | | | 1.38 | | | | 1-15-2020 | | | | 1,260,313 | | | | 1,346,368 | |
TIPS | | | 1.38 | | | | 2-15-2044 | | | | 801,728 | | | | 895,054 | |
TIPS | | | 1.63 | | | | 1-15-2018 | | | | 613,537 | | | | 651,404 | |
TIPS | | | 1.75 | | | | 1-15-2028 | | | | 886,220 | | | | 1,011,606 | |
TIPS | | | 1.88 | | | | 7-15-2019 | | | | 1,137,076 | | | | 1,242,610 | |
TIPS | | | 2.00 | | | | 1-15-2016 | | | | 947,408 | | | | 972,943 | |
TIPS | | | 2.00 | | | | 1-15-2026 | | | | 995,378 | | | | 1,154,249 | |
TIPS | | | 2.13 | | | | 1-15-2019 | | | | 1,202,874 | | | | 1,314,892 | |
TIPS | | | 2.13 | | | | 2-15-2040 | | | | 390,947 | | | | 501,970 | |
TIPS | | | 2.13 | | | | 2-15-2041 | | | | 592,371 | | | | 766,056 | |
TIPS | | | 2.38 | | | | 1-15-2017 | | | | 944,240 | | | | 1,004,141 | |
TIPS | | | 2.38 | | | | 1-15-2025 | | | | 1,755,223 | | | | 2,086,658 | |
TIPS | | | 2.38 | | | | 1-15-2027 | | | | 849,816 | | | | 1,027,348 | |
TIPS | | | 2.50 | | | | 7-15-2016 | | | | 925,217 | | | | 975,742 | |
TIPS | | | 2.50 | | | | 1-15-2029 | | | | 803,764 | | | | 1,005,019 | |
TIPS | | | 2.63 | | | | 7-15-2017 | | | | 597,199 | | | | 648,754 | |
TIPS | | | 3.38 | | | | 4-15-2032 | | | | 348,657 | | | | 497,463 | |
TIPS | | | 3.63 | | | | 4-15-2028 | | | | 743,183 | | | | 1,030,470 | |
TIPS | | | 3.88 | | | | 4-15-2029 | | | | 680,513 | | | | 981,746 | |
| | | | |
Total U.S. Treasury Securities (Cost $42,000,296) | | | | | | | | | | | | | | | 43,864,359 | |
| | | | | | | | | | | | | | | | |
The accompanying notes are an integral part of these financial statements.
| | | | |
| 32 | | Wells Fargo Advantage Income Funds | | Portfolio of investments—November 30, 2014 (unaudited) |
REAL RETURN PORTFOLIO
| | | | | | | | | | | | | | |
| Security name | | Yield | | | | | Shares | | | Value | |
| | | | |
Short-Term Investments: 0.12% | | | | | | | | | | | | | | |
| | | | |
| Investment Companies: 0.12% | | | | | | | | | | | | | | |
Wells Fargo Advantage Government Money Market Fund, Institutional Class (l)(u) | | | 0.01 | % | | | | | 51,224 | | | $ | 51,224 | |
| | | | | | | | | | | | | | |
| | | | |
Total Short-Term Investments (Cost $51,224) | | | | | | | | | | | | | 51,224 | |
| | | | | | | | | | | | | | |
| | | | | | | | |
| Total investments in securities (Cost $42,051,520) * | | | 99.70 | % | | | 43,915,583 | |
Other assets and liabilities, net | | | 0.30 | | | | 131,758 | |
| | | | | | | | |
| Total net assets | | | 100.00 | % | | $ | 44,047,341 | |
| | | | | | | | |
| (l) | The security represents an affiliate of the Portfolio as defined in the Investment Company Act of 1940. |
| (u) | The rate represents the 7-day annualized yield at period end. |
| * | Cost for federal income tax purposes is $42,051,520 and unrealized gains (losses) consists of: |
| | | | |
Gross unrealized gains | | $ | 2,401,906 | |
Gross unrealized losses | | | (537,843 | ) |
| | | | |
Net unrealized gains | | $ | 1,864,063 | |
The accompanying notes are an integral part of these financial statements.
| | | | | | |
| Statements of assets and liabilities—November 30, 2014 (unaudited) | | Wells Fargo Advantage Income Funds | | | 33 | |
| | | | | | | | |
| | | Core Bond
Portfolio | | | Real Return
Portfolio | |
| | |
Assets | | | | | | | | |
Investments | | | | | | | | |
In unaffiliated securities (including securities on loan), at value (see cost below) | | $ | 3,173,850,096 | | | $ | 43,864,359 | |
In affiliated securities, at value (see cost below) | | | 164,332,510 | | | | 51,224 | |
| | | | | | | | |
Total investments, at value (see cost below) | | | 3,338,182,606 | | | | 43,915,583 | |
Cash | | | 717,939 | | | | 0 | |
Receivable for investments sold | | | 459,991,077 | | | | 0 | |
Principal paydown receivable | | | 118,453 | | | | 0 | |
Receivable for interest | | | 12,074,876 | | | | 160,282 | |
Receivable for securities lending income | | | 380 | | | | 0 | |
Prepaid expenses and other assets | | | 5,061 | | | | 2,497 | |
| | | | | | | | |
Total assets | | | 3,811,090,392 | | | | 44,078,362 | |
| | | | | | | | |
| | |
Liabilities | | | | | | | | |
Payable for investments purchased | | | 820,351,809 | | | | 0 | |
Payable upon receipt of securities loaned | | | 747,555 | | | | 0 | |
Advisory fee payable | | | 827,141 | | | | 9,762 | |
Shareholder report expenses payable | | | 4,027 | | | | 1,990 | |
Custodian and accounting fees payable | | | 88,929 | | | | 2,838 | |
Professional fees payable | | | 27,208 | | | | 16,431 | |
| | | | | | | | |
Total liabilities | | | 822,046,669 | | | | 31,021 | |
| | | | | | | | |
Total net assets | | $ | 2,989,043,723 | | | $ | 44,047,341 | |
| | | | | | | | |
| | |
Investments in unaffiliated securities, at cost | | $ | 3,116,708,589 | | | $ | 42,000,296 | |
| | | | | | | | |
Investments in affiliated securities, at cost | | $ | 164,332,510 | | | $ | 51,224 | |
| | | | | | | | |
Total investments, at cost | | $ | 3,281,041,099 | | | $ | 42,051,520 | |
| | | | | | | | |
Securities on loan, at value | | $ | 731,946 | | | $ | 0 | |
| | | | |
The accompanying notes are an integral part of these financial statements.
| | | | |
| 34 | | Wells Fargo Advantage Income Funds | | Statements of operations—six months ended November 30, 2014 (unaudited) |
| | | | | | | | |
| | | Core Bond
Portfolio | | | Real Return
Portfolio | |
| | |
Investment income | | | | | | | | |
Interest | | $ | 33,167,125 | | | $ | 460,129 | |
Securities lending income, net | | | 138,443 | | | | 0 | |
Income from affiliated securities | | | 40,846 | | | | 13 | |
| | | | | | | | |
Total investment income | | | 33,346,414 | | | | 460,142 | |
| | | | | | | | |
| | |
Expenses | | | | | | | | |
Advisory fee | | | 5,273,560 | | | | 91,084 | |
Custody and accounting fees | | | 85,556 | | | | 4,812 | |
Professional fees | | | 32,629 | | | | 22,364 | |
Shareholder report expenses | | | 3,758 | | | | 1,207 | |
Trustees’ fees and expenses | | | 6,095 | | | | 6,370 | |
Other fees and expenses | | | 32,258 | | | | 2,492 | |
| | | | | | | | |
Total expenses | | | 5,433,856 | | | | 128,329 | |
Less: Fee waivers and/or expense reimbursements | | | (358,908 | ) | | | (28,455 | ) |
| | | | | | | | |
Net expenses | | | 5,074,948 | | | | 99,874 | |
| | | | | | | | |
Net investment income | | | 28,271,466 | | | | 360,268 | |
| | | | | | | | |
| | |
REALIZED AND UNREALIZED GAINS (LOSSES) ON INVESTMENTS | | | | | | | | |
| | |
Net realized gains (losses) on: | | | | | | | | |
Unaffiliated securities | | | 25,152,081 | | | | 180,621 | |
Futures transactions | | | 0 | | | | (1,641 | ) |
TBA sale commitments | | | (2,043 | ) | | | 0 | |
| | | | | | | | |
Net realized gain (losses) on investments | | | 25,150,038 | | | | 178,980 | |
Net change in unrealized gains (losses) on investments | | | 8,723,076 | | | | (826,904 | ) |
| | | | | | | | |
Net realized and unrealized gains (losses) on investments | | | 33,873,114 | | | | (647,924 | ) |
| | | | | | | | |
Net increase (decrease) in net assets resulting from operations | | $ | 62,144,580 | | | $ | (287,656 | ) |
| | | | | | | | |
The accompanying notes are an integral part of these financial statements.
| | | | | | |
| Statements of changes in net assets | | Wells Fargo Advantage Income Funds | | | 35 | |
| | | | | | | | |
| | | Core Bond Portfolio | |
| | | Six months ended
November 30, 2014
(unaudited) | | | Year ended
May 31, 2014 | |
| | |
Operations | | | | | | | | |
Net investment income | | $ | 28,271,466 | | | $ | 57,008,763 | |
Net realized gains (losses) on investments | | | 25,150,038 | | | | (25,731,456 | ) |
Net change in unrealized gains (losses) on investments | | | 8,723,076 | | | | 45,003,848 | |
| | | | |
Net increase in net assets resulting from operations | | | 62,144,580 | | | | 76,281,155 | |
| | | | |
| | |
Capital share transactions | | | | | | | | |
Transactions in investors’ beneficial interests | | | | | | | | |
Contributions | | | 304,034,567 | | | | 222,957,263 | |
Withdrawals | | | (273,677,183 | ) | | | (751,133,453 | ) |
| | | | |
Net increase (decrease) in net assets resulting from capital share transactions | | | 30,357,384 | | | | (528,176,190 | ) |
| | | | |
Total increase (decrease) in net assets | | | 92,501,964 | | | | (451,895,035 | ) |
| | | | |
| | |
Net assets | | | | | | | | |
Beginning of period | | | 2,896,541,759 | | | | 3,348,436,794 | |
| | | | |
End of period | | $ | 2,989,043,723 | | | $ | 2,896,541,759 | |
| | | | |
The accompanying notes are an integral part of these financial statements.
| | | | |
| 36 | | Wells Fargo Advantage Income Funds | | Statements of changes in net assets |
| | | | | | | | |
| | | Real Return Portfolio | |
| | | Six months ended
November 30, 2014
(unaudited) | | | Year ended
May 31, 2014 | |
| | |
Operations | | | | | | | | |
Net investment income | | $ | 360,268 | | | $ | 781,968 | |
Net realized gains on investments | | | 178,980 | | | | 518,616 | |
Net change in unrealized gains (losses) on investments | | | (826,904 | ) | | | (2,086,498 | ) |
| | | | |
Net decrease in net assets resulting from operations | | | (287,656 | ) | | | (785,914 | ) |
| | | | |
| | |
Capital share transactions | | | | | | | | |
Transactions in investors’ beneficial interests | | | | | | | | |
Contributions | | | 2,260,422 | | | | 5,773,010 | |
Withdrawals | | | (5,125,842 | ) | | | (24,418,897 | ) |
| | | | |
Net decrease in net assets resulting from capital share transactions | | | (2,865,420 | ) | | | (18,645,887 | ) |
| | | | |
Total decrease in net assets | | | (3,153,076 | ) | | | (19,431,801 | ) |
| | | | |
| | |
Net assets | | | | | | | | |
Beginning of period | | | 47,200,417 | | | | 66,632,218 | |
| | | | |
End of period | | $ | 44,047,341 | | | $ | 47,200,417 | |
| | | | |
The accompanying notes are an integral part of these financial statements.
| | | | | | |
| Financial highlights | | Wells Fargo Advantage Income Funds | | | 37 | |
| | | | | | | | | | | | | | | | | | | | |
| | | Ratio to average net assets (annualized) | | | | | | Portfolio turnover
rate | |
| | | Net investment income | | | Gross expenses | | | Net expenses | | | Total
return1 | | |
| | | | | |
Core Bond Portfolio | | | | | | | | | | | | | | | | | | | | |
Six months ended November 30, 2014 (unaudited) | | | 1.95 | % | | | 0.37 | % | | | 0.35 | % | | | 2.13 | % | | | 286 | % |
Year ended May 31, 2014 | | | 1.94 | % | | | 0.37 | % | | | 0.35 | % | | | 2.90 | % | | | 646 | % |
Year ended May 31, 2013 | | | 1.75 | % | | | 0.37 | % | | | 0.35 | % | | | 2.61 | % | | | 547 | % |
Year ended May 31, 2012 | | | 2.33 | % | | | 0.37 | % | | | 0.35 | % | | | 8.20 | % | | | 803 | % |
Year ended May 31, 2011 | | | 2.99 | % | | | 0.37 | % | | | 0.35 | % | | | 7.02 | % | | | 789 | % |
Year ended May 31, 2010 | | | 3.78 | % | | | 0.38 | % | | | 0.34 | % | | | 10.87 | % | | | 638 | % |
| | | | | |
Real Return Portfolio | | | | | | | | | | | | | | | | | | | | |
Six months ended November 30, 2014 (unaudited) | | | 1.58 | % | | | 0.56 | % | | | 0.44 | % | | | (0.65 | )% | | | 3 | % |
Year ended May 31, 2014 | | | 1.45 | % | | | 0.53 | % | | | 0.44 | % | | | (0.26 | )% | | | 9 | % |
Year ended May 31, 2013 | | | 1.52 | % | | | 0.50 | % | | | 0.44 | % | | | (1.86 | )% | | | 15 | % |
Year ended May 31, 2012 | | | 3.00 | % | | | 0.48 | % | | | 0.44 | % | | | 12.62 | % | | | 23 | % |
Year ended May 31, 2011 | | | 3.25 | % | | | 0.44 | % | | | 0.43 | % | | | 8.19 | % | | | 19 | % |
Year ended May 31, 2010 | | | 3.53 | % | | | 0.45 | % | | | 0.44 | % | | | 8.28 | % | | | 31 | % |
| 1. | Returns for periods of less than one year are not annualized. |
The accompanying notes are an integral part of these financial statements.
| | | | |
| 38 | | Wells Fargo Advantage Income Funds | | Notes to financial statements (unaudited) |
1. ORGANIZATION
Wells Fargo Master Trust (the “Trust”), a Delaware statutory trust organized on March 10, 1999, is an open-end management investment company registered under the Investment Company Act of 1940, as amended (the “1940 Act”). These financial statements report on the following portfolios: the Wells Fargo Advantage Core Bond Portfolio (“Core Bond Portfolio”) and the Wells Fargo Advantage Real Return Portfolio (“Real Return Portfolio”) (formerly, Wells Fargo Advantage Inflation-Protected Bond Portfolio) (each, a “Portfolio”, collectively, the “Portfolios”). Each Portfolio is a diversified series of the Trust.
The Portfolios, which are master portfolios in a master/feeder structure, offer their shares to multiple feeder funds and other affiliated master portfolios rather than directly to the public.
2. SIGNIFICANT ACCOUNTING POLICIES
The following significant accounting policies, which are consistently followed in the preparation of the financial statements of each Portfolio, are in conformity with U.S. generally accepted accounting principles which require management to make estimates and assumptions that affect the reported amounts of assets and liabilities, disclosure of contingent assets and liabilities at the date of the financial statements, and the reported amounts of revenues and expenses during the reporting period. Actual results could differ from those estimates.
Securities valuation
All investments are valued each business day as of the close of regular trading on the New York Stock Exchange (generally 4 p.m. Eastern Time).
Fixed income securities acquired with maturities exceeding 60 days are valued based on evaluated bid prices provided by an independent pricing service which may utilize both transaction data and market information such as yield, quality, coupon rate, maturity, type of issue, trading characteristics and other market data. If prices are not available from the independent pricing service or prices received are deemed not representative of market value, values will be obtained from an independent broker-dealer.
Futures that are listed on a foreign or domestic exchange or market are valued at the official closing price or, if none, the last sales price.
Investments in registered open-end investment companies are valued at net asset value. Non-registered investment vehicles are fair valued at net asset value.
Investments which are not valued using any of the methods discussed above are valued at their fair value, as determined in good faith by the Board of Trustees of the Portfolios. The Board of Trustees has established a Valuation Committee comprised of the Trustees and has delegated to it the authority to take any actions regarding the valuation of portfolio securities that the Valuation Committee deems necessary or appropriate, including determining the fair value of portfolio securities, unless the determination has been delegated to the Management Valuation Team of Wells Fargo Funds Management, LLC (“Funds Management”). The Board of Trustees retains the authority to make or ratify any valuation decisions or approve any changes to the Valuation Procedures as it deems appropriate. On a quarterly basis, the Board of Trustees receives reports on any valuation actions taken by the Valuation Committee or the Management Valuation Team which may include items for ratification.
Valuations of fair valued securities are compared to the next actual sales price when available, or other appropriate market values, to assess the continued appropriateness of the fair valuation methodologies used. These securities are fair valued on a day-to-day basis, taking into consideration changes to appropriate market information and any significant changes to the inputs considered in the valuation process until there is a readily available price provided on an exchange or by an independent pricing service. Valuations received from an independent pricing service or independent broker-dealer quotes are periodically validated by comparisons to most recent trades and valuations provided by other independent pricing services in addition to the review of prices by the adviser and/or subadviser. Unobservable inputs used in determining fair valuations are identified based on the type of security, taking into consideration factors utilized by market participants in valuing the investment, knowledge about the issuer and the current market environment.
Security loans
The Portfolios may lend their securities from time to time in order to earn additional income in the form of fees or interest on securities received as collateral or the investment of any cash received as collateral. The Portfolios continue to receive interest or dividends on the securities loaned. The Portfolios receive collateral in the form of cash or securities with a value at least equal to the value of the securities on loan. The value of the loaned securities is determined at the close of each business day and any additional required collateral is delivered to the Portfolios on the next business day. In a
| | | | | | |
| Notes to financial statements (unaudited) | | Wells Fargo Advantage Income Funds | | | 39 | |
securities lending transaction, the net asset value of the Portfolios will be affected by an increase or decrease in the value of the securities loaned and by an increase or decrease in the value of the instrument in which collateral is invested. The amount of securities lending activity undertaken by the Portfolios fluctuate from time to time, In the event of default or bankruptcy by the borrower, the Portfolios may be prevented from recovering the loaned securities or gaining access to the collateral or may experience delays or costs in doing so. In addition, the investment of any cash collateral received may lose all or part of its value. The Portfolios have the right under the lending agreement to recover the securities from the borrower on demand.
The Portfolios lend their securities through an unaffiliated securities lending agent. Cash collateral received in connection with its securities lending transactions is invested in Securities Lending Cash Investments, LLC (the “Securities Lending Fund”). The Securities Lending Fund is exempt from registration under Section 3(c)(7) of the 1940 Act and is managed by Funds Management and is sub-advised by Wells Capital Management Incorporated (“WellsCap”). Funds Management receives an advisory fee starting at 0.05% and declining to 0.01% as the average daily net assets of the Securities Lending Fund increase. All of the fees received by Funds Management are paid to WellsCap for its services as subadviser. The Securities Lending Fund seeks to provide a positive return compared to the daily Fed Funds Open rate by investing in high-quality, U.S. dollar-denominated short-term money market instruments. Securities Lending Fund investments are fair valued based upon the amortized cost valuation technique. Income earned from investment in the Securities Lending Fund is included in securities lending income on the Statements of Operations.
When-issued transactions
The Portfolios may purchase securities on a forward commitment or when-issued basis. A Portfolio records a when-issued transaction on the trade date and will segregate assets in an amount at least equal in value to the Portfolio’s commitment to purchase when-issued securities. Securities purchased on a when-issued basis are marked-to-market daily and the Portfolio begins earning interest on the settlement date. Losses may arise due to changes in the market value of the underlying securities or if the counterparty does not perform under the contract.
Futures contracts
Each Portfolio is subject to interest rate risk in the normal course of pursuing its investment objectives. A Portfolio may buy and sell futures contracts in order to gain exposure to, or protect against, changes in security values and interest rates. The primary risks associated with the use of futures contracts are the imperfect correlation between changes in market values of securities held by the Portfolios and the prices of futures contracts, and the possibility of an illiquid market.
The aggregate principal amounts of the contracts are not recorded in the financial statements. Fluctuations in the value of the contracts are recorded in the Statements of Assets and Liabilities as an asset or liability and in the Statements of Operations as unrealized gains or losses until the contracts are closed, at which point they are recorded as net realized gains or losses on futures contracts. With futures contracts, there is minimal counterparty risk to the Portfolio since futures are exchange traded and the exchange’s clearinghouse, as counterparty to all exchange traded futures, guarantees the futures against default.
TBA sale commitments
The Portfolios may enter into To Be Announced (“TBA”) sale commitments to hedge their portfolio positions or to sell mortgage-backed securities it owns under delayed delivery arrangements. Proceeds of TBA sale commitments are not received until the contractual settlement date. During the time a TBA sale commitment is outstanding, equivalent deliverable securities or offsetting TBA purchase commitments, which are deliverable on or before the sale commitment date, are held as “cover” for the transaction. Unsettled TBA sale commitments are valued at the current market value of the underlying securities, generally according to the procedures described under “Securities valuation”. The contract is marked-to-market daily and the change in market value is recorded by the Portfolio as an unrealized gain or loss. If the TBA sale commitment is closed through the acquisition of an offsetting purchase commitment, the Portfolio realizes a gain or loss. If the Portfolio delivers securities under the commitment, the Portfolio realizes a gain or a loss from the sale of the securities based upon the unit price established at the date the commitment was entered into.
Inflation-indexed bonds and TIPS
The Portfolios may invest in inflation-indexed bonds, including Treasury inflation-protected securities (TIPS). Inflation-indexed bonds are fixed income securities whose principal value is periodically adjusted according to the rate of inflation. If the index measuring inflation falls, the principal value of inflation-indexed bonds (other than municipal inflation indexed bonds and certain corporate inflation-indexed bonds) will be adjusted downward, and consequently the interest payable on these securities (calculated with respect to a smaller principal amount) will be reduced. Repayment of the original bond principal upon maturity (as adjusted for inflation) is guaranteed in the case of U.S. Treasury inflation-indexed bonds. For bonds that do not provide a similar guarantee, the adjusted principal value of the
| | | | |
| 40 | | Wells Fargo Advantage Income Funds | | Notes to financial statements (unaudited) |
bond repaid at maturity may be less than the original principal. The value of inflation-indexed bonds is expected to change in response to changes in real interest rates. Real interest rates are tied to the relationship between nominal interest rates and the rate of inflation. If nominal interest rates increase at a faster rate than inflation, real interest rates may rise, leading to a decrease in value of inflation-indexed bonds. Inflation-indexed bonds, including TIPS, decline in value when real interest rates rise. In certain interest rate environments, such as when real interest rates are rising faster than nominal interest rates, inflation-indexed bonds may experience greater losses than other fixed income securities with similar durations.
Mortgage dollar roll transactions
The Portfolios may engage in mortgage dollar roll transactions through TBA mortgage-backed securities issued by Government National Mortgage Association (GNMA), Federal National Mortgage Association (FNMA) and Federal Home Loan Mortgage Corporation (FHLMC). In a mortgage dollar roll transaction, a Portfolio sells a mortgage-backed security to a financial institution, such as a bank or broker-dealer and simultaneously agrees to repurchase a substantially similar security from the institution at a later date at an agreed upon price. The mortgage-backed securities that are repurchased will bear the same interest rate as those sold, but generally will be collateralized by different pools of mortgages with different pre-payment histories. During the roll period, a Portfolio foregoes principal and interest paid on the securities. A Portfolio is compensated by the difference between the current sales price and the forward price for the future purchase as well as by the earnings on the cash proceeds of the initial sale. Mortgage dollar rolls may be renewed without physical delivery of the securities subject to the contract. The Portfolios account for TBA dollar roll transactions as purchases and sales.
Security transactions and income recognition
Securities transactions are recorded on a trade date basis. Realized gains or losses are recorded on the basis of identified cost.
Interest income is accrued daily and bond discounts are accreted and premiums are amortized daily based on the effective interest method. To the extent debt obligations are placed on non-accrual status, any related interest income may be reduced by writing off interest receivables when the collection of all or a portion of interest has become doubtful based on consistently applied procedures. If the issuer subsequently resumes interest payments or when the collectability of interest is reasonably assured, the debt obligation is removed from non-accrual status.
Federal and other taxes
Each Portfolio is treated as a separate entity for federal income tax purposes. The Portfolios are not required to pay federal income taxes on their net investment income and net capital gain as they are treated as partnerships for federal income tax purposes. All interest, dividends, gains and losses of a Portfolio are deemed to have been “passed through” to the interest holders in proportion to their holdings of the Portfolio regardless of whether such interest, dividends and gains have been distributed by the Portfolio.
Each Portfolio’s income tax returns and all financial records supporting those returns for the prior three fiscal years are subject to examination by the federal revenue authority. Management has analyzed each Portfolio’s tax positions taken on federal, state, and foreign tax returns for all open tax years and does not believe that there are any uncertain tax positions that require recognition of a tax liability.
3. FAIR VALUATION MEASUREMENTS
Fair value measurements of investments are determined within a framework that has established a fair value hierarchy based upon the various data inputs utilized in determining the value of each Portfolio’s investments. The three-level hierarchy gives the highest priority to unadjusted quoted prices in active markets for identical assets or liabilities (Level 1) and the lowest priority to significant unobservable inputs (Level 3). Each Portfolio’s investments are classified within the fair value hierarchy based on the lowest level of input that is significant to the fair value measurement. The inputs are summarized into three broad levels as follows:
| n | | Level 1 – quoted prices in active markets for identical securities |
| n | | Level 2 – other significant observable inputs (including quoted prices for similar securities, interest rates, prepayment speeds, credit risk, use of amortized cost, etc.) |
| n | | Level 3 – significant unobservable inputs (including the Portfolio’s own assumptions in determining the fair value of investments) |
The inputs or methodologies used for valuing investments in securities are not necessarily an indication of the risk associated with investing in those securities.
| | | | | | |
| Notes to financial statements (unaudited) | | Wells Fargo Advantage Income Funds | | | 41 | |
The following is a summary of the inputs used in valuing the Portfolio’s assets and liabilities as of November 30, 2014:
| | | | | | | | | | | | | | | | |
| | | Quoted prices (Level 1) | | | Other significant
observable inputs
(Level 2) | | | Significant
unobservable inputs
(Level 3) | | | Total | |
Core Bond Portfolio | | | | | | | | | | | | | | | | |
Assets | | | | | | | | | | | | | | | | |
Investments in: | | | | | | | | | | | | | | | | |
| | | | |
Agency securities | | $ | 0 | | | $ | 873,674,600 | | | $ | 0 | | | $ | 873,674,600 | |
| | | | |
Asset-backed securities | | | 0 | | | | 457,486,853 | | | | 0 | | | | 457,486,853 | |
| | | | |
Corporate bonds and notes | | | 0 | | | | 565,267,267 | | | | 0 | | | | 565,267,267 | |
| | | | |
Municipal obligations | | | 0 | | | | 29,423,778 | | | | 0 | | | | 29,423,778 | |
| | | | |
Non-agency mortgage backed securities | | | 0 | | | | 154,101,015 | | | | 0 | | | | 154,101,015 | |
| | | | |
U.S. Treasury securities | | | 895,570,651 | | | | 0 | | | | 0 | | | | 895,570,651 | |
| | | | |
Yankee corporate bonds and notes | | | 0 | | | | 155,633,437 | | | | 0 | | | | 155,633,437 | |
| | | | |
Yankee government bonds | | | 0 | | | | 42,692,495 | | | | 0 | | | | 42,692,495 | |
| | | | |
Short-term investments | | | | | | | | | | | | | | | | |
Investment companies | | | 163,584,955 | | | | 747,555 | | | | 0 | | | | 164,332,510 | |
Total assets | | $ | 1,059,155,606 | | | $ | 2,279,027,000 | | | $ | 0 | | | $ | 3,338,182,606 | |
Real Return Portfolio | | | | | | | | | | | | | | | | |
Assets | | | | | | | | | | | | | | | | |
Investments in: | | | | | | | | | | | | | | | | |
| | | | |
U.S. Treasury securities | | $ | 43,864,359 | | | $ | 0 | | | $ | 0 | | | $ | 43,864,359 | |
| | | | |
Short-term investments | | | | | | | | | | | | | | | | |
Investment companies | | | 51,224 | | | | 0 | | | | 0 | | | | 51,224 | |
Total assets | | $ | 43,915,583 | | | $ | 0 | | | $ | 0 | | | $ | 43,915,583 | |
Transfers in and transfers out are recognized at the end of the reporting period. At November 30, 2014, the Portfolios did not have any transfers into/out of Level 1, Level 2, or Level 3.
4. TRANSACTIONS WITH AFFILIATES
Advisory fees
The Trust has entered into an advisory contract with Funds Management, an indirect wholly owned subsidiary of Wells Fargo & Company (“Wells Fargo”). The adviser is responsible for implementing investment policies and guidelines and for supervising the subadviser, who is responsible for day-to-day portfolio management of the Portfolios.
Funds Management is entitled to receive an annual advisory fee starting at 0.40% and declining to 0.30% as the average daily net assets of each Portfolio increase. For the six months ended November 30, 2014, the advisory fee for Core Bond Portfolio and Real Return Portfolio was equivalent to an annual rate of 0.36% and 0.40%, respectively, of each Portfolio’s average daily net assets.
Funds Management has retained the services of a subadviser to provide daily portfolio management to the Portfolios. The fees for subadvisory services are borne by Funds Management. WellsCap, an affiliate of Funds Management and an indirect wholly owned subsidiary of Wells Fargo, is the subadviser to each Portfolio and is entitled to receive a fee from Funds Management at an annual rate starting at 0.20% and declining to 0.10% as the average daily net assets of each Portfolio increase.
Funds Management has voluntarily waived and/or reimbursed advisory fees to the extent necessary to maintain certain net operating expense ratios for the Portfolios.
| | | | |
| 42 | | Wells Fargo Advantage Income Funds | | Notes to financial statements (unaudited) |
5. INVESTMENT PORTFOLIO TRANSACTIONS
Purchases and sales of investments, excluding short-term securities, for the six months ended November 30, 2014 were as follows:
| | | | | | | | | | | | | | | | |
| | | Purchases at cost | | | Sales proceeds | |
| | | U.S.
government | | | Non-U.S.
government | | | U.S. government | | | Non-U.S.
government | |
Core Bond Portfolio | | $ | 7,725,789,756 | | | $ | 1,311,708,402 | | | $ | 7,714,390,320 | | | $ | 1,209,803,078 | |
Real Return Portfolio | | | 1,433,360 | | | | 0 | | | | 4,059,988 | | | | 0 | |
6. DERIVATIVE TRANSACTIONS
During the six months ended November 30, 2014, Real Return Portfolio entered into futures contracts to speculate on interest rates and to help manage the duration of the portfolio.
At November 30, 2014, Real Return Portfolio did not have any open futures contracts. Real Return Portfolio had an average notional amount of $58,023 in short futures contracts outstanding during the six months ended November 30, 2014.
The realized gains or losses and change in unrealized gains or losses on derivative instruments are reflected in the Statements of Operations.
7. INDEMNIFICATION
Under the Trust’s organizational documents, the officers and Trustees are indemnified against certain liabilities that may arise out of performance of their duties to the Trust. Additionally, in the normal course of business, the Trust may enter into contracts with service providers that contain a variety of indemnification clauses. The Trust’s maximum exposure under these arrangements is dependent on future claims that may be made against the Portfolios and, therefore, cannot be estimated.
| | | | | | |
| Other information (unaudited) | | Wells Fargo Advantage Income Funds | | | 43 | |
PROXY VOTING INFORMATION
A description of the policies and procedures used to determine how to vote proxies relating to portfolio securities is available without charge, upon request, by calling 1-800-222-8222, visiting our website at wellsfargoadvantagefunds.com, or visiting the SEC website at sec.gov. Information regarding how the proxies related to portfolio securities were voted during the most recent 12-month period ended June 30 is available without charge on the website at wellsfargoadvantagefunds.com or by visiting the SEC website at sec.gov.
PORTFOLIO HOLDINGS INFORMATION
The complete portfolio holdings are publicly available on the website (wellsfargoadvantagefunds.com) on a one-month delayed basis. In addition, top ten holdings information (excluding derivative positions) is publicly available on the website on a monthly, seven-day or more delayed basis. Each Fund and Portfolio files its complete schedule of portfolio holdings with the SEC for the first and third quarters of each fiscal year on Form N-Q, which is available by visiting the SEC website at sec.gov. In addition, each Form N-Q may be reviewed and copied at the SEC’s Public Reference Room in Washington, DC, and at regional offices in New York City, at 233 Broadway, and in Chicago, at 175 West Jackson Boulevard, Suite 900. Information about the Public Reference Room may be obtained by calling 1-800-SEC-0330.
| | | | |
| 44 | | Wells Fargo Advantage Income Funds | | Other information (unaudited) |
BOARD OF TRUSTEES AND OFFICERS
Each of the Trustees and Officers1 listed in the table below acts in identical capacities for each fund in the Wells Fargo Advantage family of funds, which consists of 133 mutual funds comprising the Wells Fargo Funds Trust, Wells Fargo Variable Trust, Wells Fargo Master Trust and four closed-end funds (collectively the “Fund Complex”). This table should be read in conjunction with the Prospectus and the Statement of Additional Information2. The mailing address of each Trustee and Officer is 525 Market Street, 12th Floor, San Francisco, CA 94105. Each Trustee and Officer serves an indefinite term, however, each Trustee serves such term until reaching the mandatory retirement age established by the Trustees.
Independent Trustees
| | | | | | |
Name and year of birth | | Position held and length of service* | | Principal occupations during past five years or longer | | Other directorships during
past five years |
| Peter G. Gordon (Born 1942) | | Trustee, since 1998; Chairman, since 2005 | | Co-Founder, Retired Chairman, President and CEO of Crystal Geyser Water Company. Trustee Emeritus, Colby College. | | Asset Allocation Trust |
| Isaiah Harris, Jr. (Born 1952) | | Trustee, since 2009 | | Retired. Prior thereto, President and CEO of BellSouth Advertising and Publishing Corp. from 2005 to 2007, President and CEO of BellSouth Enterprises from 2004 to 2005 and President of BellSouth Consumer Services from 2000 to 2003. Emeritus member of the Iowa State University Foundation Board of Governors. Emeritus Member of the Advisory Board of Iowa State University School of Business. Advisory Board Member, Palm Harbor Academy. Mr. Harris is a certified public accountant. | | CIGNA Corporation; Asset Allocation Trust |
| Judith M. Johnson (Born 1949) | | Trustee, since 2008; Audit Committee Chairman, since 2008 | | Retired. Prior thereto, Chief Executive Officer and Chief Investment Officer of Minneapolis Employees Retirement Fund from 1996 to 2008. Ms. Johnson is an attorney, certified public accountant and a certified managerial accountant. | | Asset Allocation Trust |
| Leroy Keith, Jr. (Born 1939) | | Trustee, since 2010** | | Chairman, Bloc Global Services (development and construction). Trustee of the Evergreen Funds complex (and its predecessors) from 1983 to 2010. Former Managing Director, Almanac Capital Management (commodities firm), former Partner, Stonington Partners, Inc. (private equity fund), former Director, Obagi Medical Products Co. and former Director, Lincoln Educational Services. | | Trustee, Virtus Fund Complex (consisting of 50 portfolios as of 12/16/2013); Asset Allocation Trust |
| David F. Larcker (Born 1950) | | Trustee, since 2009 | | James Irvin Miller Professor of Accounting at the Graduate School of Business, Stanford University, Morgan Stanley Director of the Center for Leadership Development and Research and Senior Faculty of The Rock Center for Corporate Governance since 2006. From 2005 to 2008, Professor of Accounting at the Graduate School of Business, Stanford University. Prior thereto, Ernst & Young Professor of Accounting at The Wharton School, University of Pennsylvania from 1985 to 2005. | | Asset Allocation Trust |
| Olivia S. Mitchell (Born 1953) | | Trustee, since 2006 | | International Foundation of Employee Benefit Plans Professor, Wharton School of the University of Pennsylvania since 1993. Director of Wharton’s Pension Research Council and Boettner Center on Pensions & Retirement Research, and Research Associate at the National Bureau of Economic Research. Previously, Cornell University Professor from 1978 to 1993. | | Asset Allocation Trust |
| Timothy J. Penny (Born 1951) | | Trustee, since 1996 | | President and CEO of Southern Minnesota Initiative Foundation, a non-profit organization, since 2007 and Senior Fellow at the Humphrey Institute Policy Forum at the University of Minnesota since 1995. Member of the Board of Trustees of NorthStar Education Finance, Inc., a non-profit organization, since 2007. | | Asset Allocation Trust |
| Michael S. Scofield (Born 1943) | | Trustee, since 2010 | | Served on the Investment Company Institute’s Board of Governors and Executive Committee from 2008-2011 as well the Governing Council of the Independent Directors Council from 2006-2011 and the Independent Directors Council Executive Committee from 2008-2011. Chairman of the IDC from 2008-2010. Institutional Investor (Fund Directions) Trustee of Year in 2007. Trustee of the Evergreen Funds complex (and its predecessors) from 1984 to 2010. Chairman of the Evergreen Funds from 2000-2010. Former Trustee of the Mentor Funds. Retired Attorney, Law Offices of Michael S. Scofield. | | Asset Allocation Trust |
| | | | | | |
| Other information (unaudited) | | Wells Fargo Advantage Income Funds | | | 45 | |
| | | | | | |
Name and year of birth | | Position held and length of service* | | Principal occupations during past five years or longer | | Other directorships during
past five years |
| Donald C. Willeke (Born 1940) | | Trustee, since 1996 | | Principal of the law firm of Willeke & Daniels. General Counsel of the Minneapolis Employees Retirement Fund from 1984 until its consolidation into the Minnesota Public Employees Retirement Association on June 30, 2010. Director and Vice Chair of The Tree Trust (non-profit corporation). Director of the American Chestnut Foundation (non-profit corporation). | | Asset Allocation Trust |
| * | Length of service dates reflect the Trustee’s commencement of service with the Trust’s predecessor entities, where applicable. |
| ** | Leroy Keith, Jr. retired as a Trustee effective December 31, 2014. |
Officers
| | | | | | |
Name and
year of birth | | Position held and
length of service | | Principal occupations during past five years or longer | | |
Karla M. Rabusch
(Born 1959) | | President, since 2003 | | Executive Vice President of Wells Fargo Bank, N.A. and President of Wells Fargo Funds Management, LLC since 2003. | | |
Nancy Wiser1
(Born 1967) | | Treasurer, since 2012 | | Executive Vice President of Wells Fargo Funds Management, LLC since 2011. Chief Operating Officer and Chief Compliance Officer at LightBox Capital Management LLC, from 2008 to 2011. Owned and operated a consulting business providing services to various hedge funds including acting as Chief Operating Officer and Chief Compliance Officer for a hedge fund from 2007 to 2008. Chief Operating Officer and Chief Compliance Officer of GMN Capital LLC from 2006 to 2007. | | |
C. David Messman
(Born 1960) | | Secretary, since 2000; Chief Legal Officer, since 2003 | | Assistant General Counsel of Wells Fargo Bank, N.A. since 2013 and Vice President and Managing Counsel of Wells Fargo Bank N.A. from 1996 to 2013. Senior Vice President and Secretary of Wells Fargo Funds Management, LLC since 2001. | | |
Debra Ann Early
(Born 1964) | | Chief Compliance Officer, since 2007 | | Senior Vice President and Chief Compliance Officer of Wells Fargo Funds Management, LLC since 2007. Chief Compliance Officer of Parnassus Investments from 2005 to 2007. Chief Financial Officer of Parnassus Investments from 2004 to 2007. | | |
David Berardi
(Born 1975) | | Assistant Treasurer, since 2009 | | Vice President of Wells Fargo Funds Management, LLC since 2009. Vice President of Evergreen Investment Management Company, LLC from 2008 to 2010. Assistant Vice President of Evergreen Investment Services, Inc. from 2004 to 2008. Manager of Fund Reporting and Control for Evergreen Investment Management Company, LLC from 2004 to 2010. | | |
Jeremy DePalma1
(Born 1974) | | Assistant Treasurer, since 2009 | | Senior Vice President of Wells Fargo Funds Management, LLC since 2009. Senior Vice President of Evergreen Investment Management Company, LLC from 2008 to 2010. Vice President, Evergreen Investment Services, Inc. from 2004 to 2007. Head of the Fund Reporting and Control Team within Fund Administration from 2005 to 2010. | | |
| 1. | Nancy Wiser acts as Treasurer of 73 funds in the Fund Complex. Jeremy DePalma acts as Treasurer of 60 funds and Assistant Treasurer of 73 funds in the Fund Complex. |
| 2. | The Statement of Additional Information includes additional information about the Trustees and is available, without charge, upon request, by calling 1-800-222-8222 or by visiting the website at wellsfargoadvantagefunds.com. |
| | | | |
| 46 | | Wells Fargo Advantage Income Funds | | List of abbreviations |
The following is a list of common abbreviations for terms and entities that may have appeared in this report.
| ACA | — ACA Financial Guaranty Corporation |
| ADR | — American depositary receipt |
| ADS | — American depositary shares |
| AGC | — Assured Guaranty Corporation |
| AGM | — Assured Guaranty Municipal |
| Ambac | — Ambac Financial Group Incorporated |
| AMT | — Alternative minimum tax |
| BAN | — Bond anticipation notes |
| BHAC | — Berkshire Hathaway Assurance Corporation |
| CAB | — Capital appreciation bond |
| CCAB | — Convertible capital appreciation bond |
| CDA | — Community Development Authority |
| CDO | — Collateralized debt obligation |
| DRIVER | — Derivative inverse tax-exempt receipts |
| DW&P | — Department of Water & Power |
| DWR | — Department of Water Resources |
| ECFA | — Educational & Cultural Facilities Authority |
| EDA | — Economic Development Authority |
| EDFA | — Economic Development Finance Authority |
| ETF | — Exchange-traded fund |
| FDIC | — Federal Deposit Insurance Corporation |
| FFCB | — Federal Farm Credit Banks |
| FGIC | — Financial Guaranty Insurance Corporation |
| FHA | — Federal Housing Administration |
| FHLB | — Federal Home Loan Bank |
| FHLMC | — Federal Home Loan Mortgage Corporation |
| FICO | — The Financing Corporation |
| FNMA | — Federal National Mortgage Association |
| GDR | — Global depositary receipt |
| GNMA | — Government National Mortgage Association |
| HCFR | — Healthcare facilities revenue |
| HEFA | — Health & Educational Facilities Authority |
| HEFAR | — Higher education facilities authority revenue |
| HFA | — Housing Finance Authority |
| HFFA | — Health Facilities Financing Authority |
| HUD | — Department of Housing and Urban Development |
| IDA | — Industrial Development Authority |
| IDAG | — Industrial Development Agency |
| KRW | — Republic of Korea won |
| LIBOR | — London Interbank Offered Rate |
| LLC | — Limited liability company |
| LLLP | — Limited liability limited partnership |
| LLP | — Limited liability partnership |
| MBIA | — Municipal Bond Insurance Association |
| MFHR | — Multifamily housing revenue |
| MSTR | — Municipal securities trust receipts |
| MUD | — Municipal Utility District |
| National | — National Public Finance Guarantee Corporation |
| PCFA | — Pollution Control Financing Authority |
| PCL | — Public Company Limited |
| PCR | — Pollution control revenue |
| PFA | — Public Finance Authority |
| PFFA | — Public Facilities Financing Authority |
| PFOTER | — Puttable floating option tax-exempt receipts |
| plc | — Public limited company |
| PUTTER | — Puttable tax-exempt receipts |
| R&D | — Research & development |
| Radian | — Radian Asset Assurance |
| RAN | — Revenue anticipation notes |
| RDA | — Redevelopment Authority |
| RDFA | — Redevelopment Finance Authority |
| REIT | — Real estate investment trust |
| ROC | — Reset option certificates |
| SAVRS | — Select auction variable rate securities |
| SBA | — Small Business Authority |
| SFHR | — Single-family housing revenue |
| SFMR | — Single-family mortgage revenue |
| SPA | — Standby purchase agreement |
| SPDR | — Standard & Poor’s Depositary Receipts |
| STRIPS | — Separate trading of registered interest and |
| TAN | — Tax anticipation notes |
| TIPS | — Treasury inflation-protected securities |
| TRAN | — Tax revenue anticipation notes |
| TTFA | — Transportation Trust Fund Authority |
| TVA | — Tennessee Valley Authority |
This page is intentionally left blank.
This page is intentionally left blank.


For more information
More information about Wells Fargo Advantage Funds is available free upon request. To obtain literature, please write, email, visit the Fund’s website, or call:
Wells Fargo Advantage Funds
P.O. Box 8266
Boston, MA 02266-8266
Email: wfaf@wellsfargo.com
Website: wellsfargoadvantagefunds.com
Individual investors: 1-800-222-8222
Retail investment professionals: 1-888-877-9275
Institutional investment professionals: 1-866-765-0778
This report and the financial statements contained herein are submitted for the general information of the shareholders of Wells Fargo Advantage Funds. If this report is used for promotional purposes, distribution of the report must be accompanied or preceded by a current prospectus. Before investing, please consider the investment objectives, risks, charges, and expenses of the investment. For a current prospectus and, if available, a summary prospectus, containing this information, call 1-800-222-8222 or visit the Fund’s website at wellsfargoadvantagefunds.com. Read the prospectus carefully before you invest or send money.
Wells Fargo Funds Management, LLC, a wholly owned subsidiary of Wells Fargo & Company, provides investment advisory and administrative services for Wells Fargo Advantage Funds. Other affiliates of Wells Fargo & Company provide subadvisory and other services for the Funds. The Funds are distributed by Wells Fargo Funds Distributor, LLC, Member FINRA/SIPC, an affiliate of Wells Fargo & Company.
NOT FDIC INSURED ¡ NO BANK GUARANTEE ¡ MAY LOSE VALUE
© 2014 Wells Fargo Funds Management, LLC. All rights reserved.
| | |
 | | 229722 01-15 SILD/SAR103 11-14 |

Wells Fargo Advantage
WealthBuilder PortfoliosSM

Semi-Annual Report
November 30, 2014
| n | | Wells Fargo Advantage WealthBuilder Conservative Allocation PortfolioSM |
| n | | Wells Fargo Advantage WealthBuilder Moderate Balanced PortfolioSM |
| n | | Wells Fargo Advantage WealthBuilder Growth Balanced PortfolioSM |
| n | | Wells Fargo Advantage WealthBuilder Growth Allocation PortfolioSM |
| n | | Wells Fargo Advantage WealthBuilder Equity PortfolioSM |
| n | | Wells Fargo Advantage WealthBuilder Tactical Equity PortfolioSM |

Reduce clutter. Save trees.
Sign up for electronic delivery of prospectuses and shareholder reports at wellsfargo.com/advantagedelivery
Contents
The views expressed and any forward-looking statements are as of November 30, 2014, unless otherwise noted, and are those of the Fund managers and/or Wells Fargo Funds Management, LLC. Discussions of individual securities, or the markets generally, or any Wells Fargo Advantage Fund are not intended as individual recommendations. Future events or results may vary significantly from those expressed in any forward-looking statements; the views expressed are subject to change at any time in response to changing circumstances in the market. Wells Fargo Funds Management, LLC and the Funds disclaim any obligation to publicly update or revise any views expressed or forward-looking statements.
NOT FDIC INSURED ¡ NO BANK GUARANTEE ¡ MAY LOSE VALUE
| | | | |
| 2 | | Wells Fargo Advantage WealthBuilder Portfolios | | Letter to shareholders (unaudited) |

Karla M. Rabusch
President
Wells Fargo Advantage Funds
Major central banks continued to inject liquidity into global banks and markets through various accommodative monetary policies, including quantitative easing.
Dear Valued Shareholder:
We are pleased to offer you this semi-annual report for the Wells Fargo Advantage WealthBuilder Portfolios for the six-month period that ended November 30, 2014. The period was marked by continued accommodative monetary policy in developed countries, broader economic growth, and low inflation.
The U.S. stock market outperformed most international markets; the S&P 500 Index1, a proxy for U.S. large-cap stocks, ended the period with an 8.58% gain. The MSCI EAFE Index (Net)2, a proxy for international developed markets, ended the period with a 5.07% loss. The U.S. was the fastest-growing developed country, which benefited U.S. companies. In addition, a strong U.S. dollar held back the returns of non-U.S. investments in dollar terms. Most bond sectors gained modestly amid renewed confidence in economic growth that drove outperformance in credit-sensitive sectors as solid economic growth boosted company revenue and profits and kept default rates low. The Barclays U.S. Aggregate Bond Index3 returned 1.91% during the period.
Major central banks continued to provide stimulus.
Major central banks continued to inject liquidity into global banks and markets through various accommodative monetary policies, including quantitative easing. In the U.S., the Federal Reserve (Fed) kept its key interest rate near zero in order to support the economy and the financial system. It tapered the size of its quantitative easing program each month until the program ended in October 2014 and also discussed changes to its forward guidance as it begins to normalize monetary policy.
Meanwhile, European markets continued to benefit from the European Central Bank’s (ECB’s) willingness to maintain low interest rates. In September 2014, the ECB cut its key rate to a historic low of 0.05%. In addition to its targeted longer-term refinancing operations that are designed to increase bank lending, the ECB released details of its asset-backed securities purchase program and the new covered bond purchase program, which are scheduled to begin in the fourth quarter of 2014. In Japan, the Bank of Japan maintained an aggressive monetary program aimed at combating deflation.
Challenging geopolitical situations and concerns about slowing global growth remained.
Geopolitical events were major negatives throughout the reporting period. The ongoing standoff between the West (the U.S., Europe, and their allies) and Russia over Ukraine continued throughout the reporting period. As of November 2014, most investors believed that the situation would not result in a war. However, economic sanctions from the West against Russia and from Russia against the West contributed to slower growth in Europe, a key Russian trading partner. In the Middle East, the advance of Islamic militants in Syria and Iraq led to airstrikes by the U.S. and its allies and fears of a prolonged regional war.
| 1. | The S&P 500 Index consists of 500 stocks chosen for market size, liquidity, and industry group representation. It is a market-value-weighted index with each stock’s weight in the index proportionate to its market value. You cannot invest directly in an index. |
| 2. | The Morgan Stanley Capital International Europe, Australasia, and Far East (MSCI EAFE) Index (Net) is an unmanaged group of securities widely regarded by investors to be representations of the stock markets of Europe, Australasia, and the Far East. Calculations for EAFE use net dividends, which reflect the deduction of withholding taxes. You cannot invest directly in an index. Source: MSCI. MSCI makes no express or implied warranties or representations and shall have no liability whatsoever with respect to any MSCI data contained herein. The MSCI data may not be further redistributed or used as a basis for other indexes or any securities or financial products. This report is not approved, reviewed, or produced by MSCI. |
| 3. | The Barclays U.S. Aggregate Bond Index is a broad-based benchmark that measures the investment-grade, U.S. dollar-denominated, fixed-rate taxable bond market, including Treasuries, government-related and corporate securities, MBS (agency fixed-rate and hybrid ARM passthroughs), ABS, and CMBS. You cannot invest directly in an index. |
| | | | | | |
| Letter to shareholders (unaudited) | | Wells Fargo Advantage WealthBuilder Portfolios | | | 3 | |
Economic news out of Europe trended lower during the reporting period. Slower European growth and expectations of higher U.S. interest rates sent the euro lower, pressuring European returns for U.S. dollar-denominated investors. Returns in Asia were dampened by a sluggish Japanese economy as well as a late-period decline in the yen. Among countries in the MSCI EAFE Index (Net), most of the major markets (such as Japan, Germany, and France) ended the period with losses. By contrast, U.S. economic news remained favorable; gross domestic product grew at a 3.9% annualized gain, pushing the U.S. stock market to a solid gain. Meanwhile, 10-year U.S. Treasury yields trended lower over the period, reaching 2.20% by the end of November.
Don’t let short-term uncertainty derail long-term investment goals.
Periods of uncertainty can present challenges, but experience has taught us that maintaining long-term investment goals can be an effective way to plan for the future. To help you create a sound strategy based on your personal goals and risk tolerance, Wells Fargo Advantage Funds offers more than 100 mutual funds and other investments spanning a wide range of asset classes and investment styles. Although diversification cannot guarantee an investment profit or prevent losses, we believe it can be an effective way to manage investment risk and potentially smooth out overall portfolio performance. We encourage investors to know their investments and to understand that appropriate levels of risk-taking may unlock opportunities.
Thank you for choosing to invest with Wells Fargo Advantage Funds. We appreciate your confidence in us and remain committed to helping you meet your financial needs. For current information about your fund investments, contact your investment professional, visit our website at wellsfargoadvantagefunds.com, or call us directly at 1-800-222-8222. We are available 24 hours a day, 7 days a week.
Sincerely,

Karla M. Rabusch
President
Wells Fargo Advantage Funds
Periods of uncertainty can present challenges, but experience has taught us that maintaining long-term investment goals can be an effective way to plan for the future.
| | | | |
| 4 | | Wells Fargo Advantage WealthBuilder Portfolios | | Performance highlights (unaudited) |
Wells Fargo Advantage WealthBuilder Conservative Allocation Portfolio
Investment objective
The Portfolio seeks current income with a secondary emphasis on capital appreciation.
Adviser
Wells Fargo Funds Management, LLC
Subadviser
Wells Capital Management Incorporated
Portfolio managers
Kandarp Acharya, CFA, FRM
Christian L. Chan, CFA
Average annual total returns (%) as of November 30, 2014
| | | | | | | | | | | | | | | | | | | | | | | | | | | | | | | | | | |
| | | | | Including sales charge | | | Excluding sales charge | | | Expense ratios1 (%) | |
| | | Inception date | | 1 year | | | 5 year | | | 10 year | | | 1 year | | | 5 year | | | 10 year | | | Gross | | | Net2 | |
| Wells Fargo Advantage WealthBuilder Conservative Allocation Portfolio (WBCAX) | | 9-30-2004 | | | 1.70 | | | | 4.16 | | | | 3.64 | | | | 3.25 | | | | 4.48 | | | | 3.80 | | | | 2.08 | | | | 2.03 | |
| WealthBuilder Conservative Allocation Composite Index3 | | – | | | – | | | | – | | | | – | | | | 6.43 | | | | 6.02 | | | | 5.59 | | | | – | | | | – | |
| Barclays U.S. Aggregate Bond Index4 | | – | | | – | | | | – | | | | – | | | | 5.27 | | | | 4.10 | | | | 4.79 | | | | – | | | | – | |
MSCI ACWI ex USA (Net)5 | | – | | | – | | | | – | | | | – | | | | 0.61 | | | | 5.64 | | | | 5.96 | | | | – | | | | – | |
Russell 3000® Index6 | | – | | | – | | | | – | | | | – | | | | 15.53 | | | | 16.28 | | | | 8.32 | | | | – | | | | – | |
Figures quoted represent past performance, which is no guarantee of future results, and do not reflect taxes that a shareholder may pay on fund distributions or the redemption of fund shares. Investment return and principal value of an investment will fluctuate so that an investor’s shares, when redeemed, may be worth more or less than their original cost. Performance shown without sales charges would be lower if sales charges were reflected. Current performance may be lower or higher than the performance data quoted, which assumes the reinvestment of dividends and capital gains. Current month-end performance is available on the Portfolio’s website, wellsfargoadvantagefunds.com.
Index returns do not include transaction costs associated with buying and selling securities, any mutual fund fees or expenses, or any taxes. It is not possible to invest directly in an index.
For WealthBuilder Portfolio shares, the maximum front-end sales charge is 1.50%.
Balanced funds may invest in stocks and bonds. Stock values fluctuate in response to the activities of individual companies and general market and economic conditions. Bond values fluctuate in response to the financial condition of individual issuers, general market and economic conditions, and changes in interest rates. Changes in market conditions and government policies may lead to periods of heightened volatility in the bond market and reduced liquidity for certain bonds held by the Portfolio. In general, when interest rates rise, bond values fall and investors may lose principal value. Interest rate changes and their impact on the Portfolio and its share price can be sudden and unpredictable. The Portfolio will indirectly be exposed to all of the risks of an investment in the underlying funds and will indirectly bear expenses of the underlying funds. The use of derivatives may reduce returns and/or increase volatility. Certain investment strategies tend to increase the total risk of an investment (relative to the broader market). The Portfolio is exposed to alternative investment risk, foreign investment risk, high-yield securities risk, mortgage- and asset-backed securities risk, and smaller-company investment risk. Consult the Portfolio’s prospectus for additional information on these and other risks.
Please see footnotes on page 5.
| | | | | | |
| Performance highlights (unaudited) | | Wells Fargo Advantage WealthBuilder Portfolios | | | 5 | |
Wells Fargo Advantage WealthBuilder Conservative Allocation Portfolio (continued)
| | | | |
| Ten largest holdings7 (%) as of November 30, 2014 | |
Wells Fargo Advantage Core Bond Portfolio | | | 24.36 | |
Wells Fargo Advantage Short Duration Government Bond Fund Institutional Class | | | 20.53 | |
Wells Fargo Advantage Government Securities Fund Institutional Class | | | 18.74 | |
PIMCO High Yield Fund Institutional Class | | | 6.53 | |
Oppenheimer International Bond Fund Class Y | | | 4.67 | |
MFS Value Fund Class I | | | 2.92 | |
PIMCO CommodityRealReturn Strategy Fund Institutional Class | | | 2.53 | |
Voya Global Real Estate Fund Class I | | | 1.80 | |
Thornburg International Value Fund Institutional Class | | | 1.74 | |
T. Rowe Price Blue Chip Growth Fund Retail Class | | | 1.70 | |
|
| Current target allocation8 as of November 30, 2014 |
|
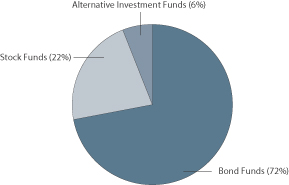 |
| 1. | Reflects the expense ratios as stated in the most recent prospectus, which include the impact of 0.53% in acquired fund fees and expenses. The expense ratios shown are subject to change and may differ from the annualized expense ratios shown in the financial highlights of this report, which do not include acquired fund fees and expenses. |
| 2. | The Adviser has committed through September 30, 2015, to waive fees and/or reimburse expenses to the extent necessary to cap the Portfolio’s Total Annual Fund Operating Expenses After Fee Waiver, excluding certain expenses, at 1.50%. After this time, the cap may be increased or the commitment to maintain the cap may be terminated only with the approval of the Board of Trustees. Brokerage commissions, stamp duty fees, interest, taxes, acquired fund fees and expenses, and extraordinary expenses are excluded from the cap. Without this cap, the Portfolio’s returns would have been lower. |
| 3. | Source: Wells Fargo Funds Management, LLC. The WealthBuilder Conservative Allocation Composite Index is weighted 80% in the Barclays U.S. Aggregate Bond Index, 14% in the Russell 3000® Index, and 6% in the MSCI ACWI ex USA Index (Net) (includes Treasury issues, agency issues, corporate bond issues, and mortgage-backed securities). You cannot invest directly in an index. |
| 4. | The Barclays U.S. Aggregate Bond Index is a broad-based benchmark that measures the investment-grade, U.S. dollar-denominated, fixed-rate taxable bond market, including Treasuries, government-related and corporate securities, MBS (agency fixed-rate and hybrid ARM passthroughs), ABS, and CMBS. You cannot invest directly in an index. |
| 5. | The Morgan Stanley Capital International All Country World Index ex USA (Net) (MSCI ACWI ex USA (Net)) is a free float-adjusted market capitalization weighted index that is designed to measure the equity market performance of developed and emerging markets. You cannot invest directly in an index. Source: MSCI. MSCI makes no express or implied warranties or representations and shall have no liability whatsoever with respect to any MSCI data contained herein. The MSCI data may not be further redistributed or used as a basis for other indexes or any securities or financial products. This report is not approved, reviewed, or produced by MSCI. |
| 6. | The Russell 3000® Index measures the performance of the 3,000 largest U.S. companies based on total market capitalization, which represents approximately 98% of the investable U.S. equity market. You cannot invest directly in an index. |
| 7. | The ten largest holdings are calculated based on the value of the holdings divided by total net assets of the Portfolio. Holdings are subject to change and may have changed since the date specified. |
| 8. | Current target allocation is subject to change and is calculated based on the total long-term investments of the Portfolio. The Portfolio’s use of futures contracts to implement a Tactical Asset Allocation (TAA) shift toward stocks or bonds is reflected in the allocation shown. |
| | | | |
| 6 | | Wells Fargo Advantage WealthBuilder Portfolios | | Performance highlights (unaudited) |
Wells Fargo Advantage WealthBuilder Moderate Balanced Portfolio
Investment objective
The Portfolio seeks a combination of current income and capital appreciation.
Adviser
Wells Fargo Funds Management, LLC
Subadviser
Wells Capital Management Incorporated
Portfolio managers
Kandarp Acharya, CFA, FRM
Christian L. Chan, CFA
Average annual total returns (%) as of November 30, 2014
| | | | | | | | | | | | | | | | | | | | | | | | | | | | | | | | | | |
| | | | | Including sales charge | | | Excluding sales charge | | | Expense ratios1 (%) | |
| | | Inception date | | 1 year | | | 5 year | | | 10 year | | | 1 year | | | 5 year | | | 10 year | | | Gross | | | Net2 | |
| Wells Fargo Advantage WealthBuilder Moderate Balanced Portfolio (WBBBX) | | 9-30-2004 | | | 2.91 | | | | 6.46 | | | | 4.32 | | | | 4.48 | | | | 6.78 | | | | 4.48 | | | | 2.14 | | | | 2.10 | |
| WealthBuilder Moderate Balanced Composite Index3 | | – | | | – | | | | – | | | | – | | | | 7.57 | | | | 7.89 | | | | 6.28 | | | | – | | | | – | |
| Barclays U.S. Aggregate Bond Index4 | | – | | | – | | | | – | | | | – | | | | 5.27 | | | | 4.10 | | | | 4.79 | | | | – | | | | – | |
| MSCI ACWI ex USA (Net)5 | | – | | | – | | | | – | | | | – | | | | 0.61 | | | | 5.64 | | | | 5.96 | | | | – | | | | – | |
| Russell 3000® Index6 | | – | | | – | | | | – | | | | – | | | | 15.53 | | | | 16.28 | | | | 8.32 | | | | – | | | | – | |
Figures quoted represent past performance, which is no guarantee of future results, and do not reflect taxes that a shareholder may pay on fund distributions or the redemption of fund shares. Investment return and principal value of an investment will fluctuate so that an investor’s shares, when redeemed, may be worth more or less than their original cost. Performance shown without sales charges would be lower if sales charges were reflected. Current performance may be lower or higher than the performance data quoted, which assumes the reinvestment of dividends and capital gains. Current month-end performance is available on the Portfolio’s website, wellsfargoadvantagefunds.com.
Index returns do not include transaction costs associated with buying and selling securities, any mutual fund fees or expenses, or any taxes. It is not possible to invest directly in an index.
For WealthBuilder Portfolio shares, the maximum front-end sales charge is 1.50%.
Balanced funds may invest in stocks and bonds. Stock values fluctuate in response to the activities of individual companies and general market and economic conditions. Bond values fluctuate in response to the financial condition of individual issuers, general market and economic conditions, and changes in interest rates. Changes in market conditions and government policies may lead to periods of heightened volatility in the bond market and reduced liquidity for certain bonds held by the Portfolio. In general, when interest rates rise, bond values fall and investors may lose principal value. Interest rate changes and their impact on the Portfolio and its share price can be sudden and unpredictable. The Portfolio will indirectly be exposed to all of the risks of an investment in the underlying funds and will indirectly bear expenses of the underlying funds. The use of derivatives may reduce returns and/or increase volatility. Certain investment strategies tend to increase the total risk of an investment (relative to the broader market). The Portfolio is exposed to alternative investment risk, foreign investment risk, high-yield securities risk, mortgage- and asset-backed securities risk, and smaller-company investment risk. Consult the Portfolio’s prospectus for additional information on these and other risks.
Please see footnotes on page 7.
| | | | | | |
| Performance highlights (unaudited) | | Wells Fargo Advantage WealthBuilder Portfolios | | | 7 | |
Wells Fargo Advantage WealthBuilder Moderate Balanced Portfolio (continued)
| | | | |
| Ten largest holdings7 (%) as of November 30, 2014 | |
Wells Fargo Advantage Core Bond Portfolio | | | 17.93 | |
Wells Fargo Advantage Government Securities Fund Institutional Class | | | 13.78 | |
Wells Fargo Advantage Short Duration Government Bond Fund Institutional Class | | | 12.8 | |
PIMCO High Yield Fund Institutional Class | | | 5.96 | |
MFS Value Fund Class I | | | 5.91 | |
Oppenheimer International Bond Fund Class Y | | | 4.59 | |
Thornburg International Value Fund Institutional Class | | | 3.54 | |
T. Rowe Price Blue Chip Growth Fund Retail Class | | | 3.44 | |
Oakmark Fund Class I | | | 2.94 | |
Invesco Growth and Income Fund Class R6 | | | 2.93 | |
|
| Current target allocation8 as of November 30, 2014 |
|
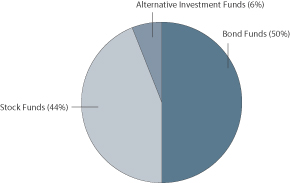 |
| 1. | Reflects the expense ratios as stated in the most recent prospectus, which include the impact of 0.60% in acquired fund fees and expenses. The expense ratios shown are subject to change and may differ from the annualized expense ratios shown in the financial highlights of this report, which do not include acquired fund fees and expenses. |
| 2. | The Adviser has committed through September 30, 2015, to waive fees and/or reimburse expenses to the extent necessary to cap the Portfolio’s Total Annual Fund Operating Expenses After Fee Waiver, excluding certain expenses, at 1.50%. After this time, the cap may be increased or the commitment to maintain the cap may be terminated only with the approval of the Board of Trustees. Brokerage commissions, stamp duty fees, interest, taxes, acquired fund fees and expenses, and extraordinary expenses are excluded from the cap. Without this cap, the Portfolio’s returns would have been lower. |
| 3. | Source: Wells Fargo Funds Management, LLC. The WealthBuilder Moderate Balanced Composite Index is weighted 60% in the Barclays U.S. Aggregate Bond Index, 28% in the Russell 3000® Index, and 12% in the MSCI ACWI ex USA (Net) (includes Treasury issues, agency issues, corporate bond issues, and mortgage-backed securities). You cannot invest directly in an index. |
| 4. | The Barclays U.S. Aggregate Bond Index is a broad-based benchmark that measures the investment-grade, U.S. dollar-denominated, fixed-rate taxable bond market, including Treasuries, government-related and corporate securities, MBS (agency fixed-rate and hybrid ARM passthroughs), ABS, and CMBS. You cannot invest directly in an index. |
| 5. | The Morgan Stanley Capital International All Country World Index ex USA (Net) (MSCI ACWI ex USA (Net)) is a free float-adjusted market capitalization weighted index that is designed to measure the equity market performance of developed and emerging markets. You cannot invest directly in an index. Source: MSCI. MSCI makes no express or implied warranties or representations and shall have no liability whatsoever with respect to any MSCI data contained herein. The MSCI data may not be further redistributed or used as a basis for other indexes or any securities or financial products. This report is not approved, reviewed, or produced by MSCI. |
| 6. | The Russell 3000® Index measures the performance of the 3,000 largest U.S. companies based on total market capitalization, which represents approximately 98% of the investable U.S. equity market. You cannot invest directly in an index. |
| 7. | The ten largest holdings are calculated based on the value of the holdings divided by total net assets of the Portfolio. Holdings are subject to change and may have changed since the date specified. |
| 8. | Current target allocation is subject to change and is calculated based on the total long-term investments of the Portfolio. The Portfolio’s use of futures contracts to implement a Tactical Asset Allocation (TAA) shift toward stocks or bonds is reflected in the allocation shown. |
| | | | |
| 8 | | Wells Fargo Advantage WealthBuilder Portfolios | | Performance highlights (unaudited) |
Wells Fargo Advantage WealthBuilder Growth Balanced Portfolio
Investment objective
The Portfolio seeks a combination of capital appreciation and current income.
Adviser
Wells Fargo Funds Management, LLC
Subadviser
Wells Capital Management Incorporated
Portfolio managers
Kandarp Acharya, CFA, FRM
Christian L. Chan, CFA
Average annual total returns (%) as of November 30, 2014
| | | | | | | | | | | | | | | | | | | | | | | | | | | | | | | | | | |
| | | | | Including sales charge | | | Excluding sales charge | | | Expense ratios1 (%) | |
| | | Inception date | | 1 year | | | 5 year | | | 10 year | | | 1 year | | | 5 year | | | 10 year | | | Gross | | | Net2 | |
| Wells Fargo Advantage WealthBuilder Growth Balanced Portfolio (WBGBX) | | 10-1-1997 | | | 4.11 | | | | 9.11 | | | | 4.79 | | | | 5.70 | | | | 9.44 | | | | 4.95 | | | | 2.21 | | | | 2.17 | |
| WealthBuilder Growth Balanced Composite Index3 | | – | | | – | | | | – | | | | – | | | | 8.70 | | | | 9.68 | | | | 6.86 | | | | – | | | | – | |
| Barclays U.S. Aggregate Bond Index4 | | – | | | – | | | | – | | | | – | | | | 5.27 | | | | 4.10 | | | | 4.79 | | | | – | | | | – | |
| MSCI ACWI ex USA (Net)5 | | – | | | – | | | | – | | | | – | | | | 0.61 | | | | 5.64 | | | | 5.96 | | | | – | | | | – | |
| Russell 3000® Index6 | | – | | | – | | | | – | | | | – | | | | 15.53 | | | | 16.28 | | | | 8.32 | | | | – | | | | – | |
Figures quoted represent past performance, which is no guarantee of future results, and do not reflect taxes that a shareholder may pay on fund distributions or the redemption of fund shares. Investment return and principal value of an investment will fluctuate so that an investor’s shares, when redeemed, may be worth more or less than their original cost. Performance shown without sales charges would be lower if sales charges were reflected. Current performance may be lower or higher than the performance data quoted, which assumes the reinvestment of dividends and capital gains. Current month-end performance is available on the Portfolio’s website, wellsfargoadvantagefunds.com.
Index returns do not include transaction costs associated with buying and selling securities, any mutual fund fees or expenses, or any taxes. It is not possible to invest directly in an index.
For WealthBuilder Portfolio shares, the maximum front-end sales charge is 1.50%.
Balanced funds may invest in stocks and bonds. Stock values fluctuate in response to the activities of individual companies and general market and economic conditions. Bond values fluctuate in response to the financial condition of individual issuers, general market and economic conditions, and changes in interest rates. Changes in market conditions and government policies may lead to periods of heightened volatility in the bond market and reduced liquidity for certain bonds held by the Portfolio. In general, when interest rates rise, bond values fall and investors may lose principal value. Interest rate changes and their impact on the Portfolio and its share price can be sudden and unpredictable. The Portfolio will indirectly be exposed to all of the risks of an investment in the underlying funds and will indirectly bear expenses of the underlying funds. The use of derivatives may reduce returns and/or increase volatility. Certain investment strategies tend to increase the total risk of an investment (relative to the broader market). The Portfolio is exposed to alternative investment risk, foreign investment risk, high-yield securities risk, mortgage- and asset-backed securities risk, and smaller-company investment risk. Consult the Portfolio’s prospectus for additional information on these and other risks.
Please see footnotes on page 9.
| | | | | | |
| Performance highlights (unaudited) | | Wells Fargo Advantage WealthBuilder Portfolios | | | 9 | |
Wells Fargo Advantage WealthBuilder Growth Balanced Portfolio (continued)
| | | | |
| Ten largest long-term holdings7 (%) as of November 30, 2014 | |
Wells Fargo Advantage Government Securities Fund Institutional Class | | | 12.54 | |
Wells Fargo Advantage Core Bond Portfolio | | | 11.60 | |
MFS Value Fund Class I | | | 9.16 | |
Thornburg International Value Fund Institutional Class | | | 5.44 | |
T. Rowe Price Blue Chip Growth Fund Retail Class | | | 5.37 | |
PIMCO High Yield Fund Institutional Class | | | 4.84 | |
Oppenheimer International Bond Fund Class Y | | | 4.83 | |
Oakmark Fund Class I | | | 4.54 | |
Invesco Growth and Income Fund Class R6 | | | 4.52 | |
American Century Growth Fund Institutional Class | | | 3.83 | |
| | |
| Current target allocation8 as of November 30, 2014 |
|
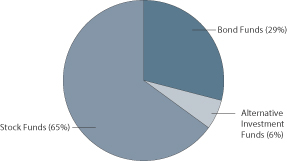 |
| 1. | Reflects the expense ratios as stated in the most recent prospectus, which include the impact of 0.67% in acquired fund fees and expenses. The expense ratios shown are subject to change and may differ from the annualized expense ratios shown in the financial highlights of this report, which do not include acquired fund fees and expenses. |
| 2. | The Adviser has committed through September 30, 2015, to waive fees and/or reimburse expenses to the extent necessary to cap the Portfolio’s Total Annual Fund Operating Expenses After Fee Waiver, excluding certain expenses, at 1.50%. After this time, the cap may be increased or the commitment to maintain the cap may be terminated only with the approval of the Board of Trustees. Brokerage commissions, stamp duty fees, interest, taxes, acquired fund fees and expenses, and extraordinary expenses are excluded from the cap. Without this cap, the Portfolio’s returns would have been lower. |
| 3. | Source: Wells Fargo Funds Management, LLC. The WealthBuilder Growth Balanced Composite Index is weighted 40% in the Barclays U.S. Aggregate Bond Index, 42% in the Russell 3000® Index, and 18% in the MSCI ACWI ex USA (Net) (includes Treasury issues, agency issues, corporate bond issues, and mortgage-backed securities). You cannot invest directly in an index. |
| 4. | The Barclays U.S. Aggregate Bond Index is a broad-based benchmark that measures the investment-grade, U.S. dollar-denominated, fixed-rate taxable bond market, including Treasuries, government-related and corporate securities, MBS (agency fixed-rate and hybrid ARM passthroughs), ABS, and CMBS. You cannot invest directly in an index. |
| 5. | The Morgan Stanley Capital International All Country World Index ex USA (Net) (MSCI ACWI ex USA (Net)) is a free float-adjusted market capitalization weighted index that is designed to measure the equity market performance of developed and emerging markets. You cannot invest directly in an index. Source: MSCI. MSCI makes no express or implied warranties or representations and shall have no liability whatsoever with respect to any MSCI data contained herein. The MSCI data may not be further redistributed or used as a basis for other indexes or any securities or financial products. This report is not approved, reviewed, or produced by MSCI. |
| 6. | The Russell 3000® Index measures the performance of the 3,000 largest U.S. companies based on total market capitalization, which represents approximately 98% of the investable U.S. equity market. You cannot invest directly in an index. |
| 7. | The ten largest long-term holdings are calculated based on the value of the holdings divided by total net assets of the Portfolio. Holdings are subject to change and may have changed since the date specified. |
| 8. | Current target allocation is subject to change and is calculated based on the total long-term investments of the Portfolio. The Portfolio’s use of futures contracts to implement a Tactical Asset Allocation (TAA) shift toward stocks or bonds is reflected in the allocation shown. |
| | | | |
| 10 | | Wells Fargo Advantage WealthBuilder Portfolios | | Performance highlights (unaudited) |
Wells Fargo Advantage WealthBuilder Growth Allocation Portfolio
Investment objective
The Portfolio seeks capital appreciation with a secondary emphasis on current income.
Adviser
Wells Fargo Funds Management, LLC
Subadviser
Wells Capital Management Incorporated
Portfolio managers
Kandarp Acharya, CFA, FRM
Christian L. Chan, CFA
Average annual total returns (%) as of November 30, 2014
| | | | | | | | | | | | | | | | | | | | | | | | | | | | | | | | | | |
| | | | | Including sales charge | | | Excluding sales charge | | | Expense ratios1 (%) | |
| | | Inception date | | 1 year | | | 5 year | | | 10 year | | | 1 year | | | 5 year | | | 10 year | | | Gross | | | Net2 | |
| Wells Fargo Advantage WealthBuilder Growth Allocation Portfolio (WBGGX) | | 9-30-2004 | | | 4.71 | | | | 10.28 | | | | 4.98 | | | | 6.31 | | | | 10.61 | | | | 5.14 | | | | 2.29 | | | | 2.22 | |
| WealthBuilder Growth Allocation Composite Index3 | | – | | | – | | | | – | | | | – | | | | 9.80 | | | | 11.41 | | | | 7.34 | | | | – | | | | – | |
| Barclays U.S. Aggregate Bond Index4 | | – | | | – | | | | – | | | | – | | | | 5.27 | | | | 4.10 | | | | 4.79 | | | | – | | | | – | |
| MSCI ACWI ex USA (Net)5 | | – | | | – | | | | – | | | | – | | | | 0.61 | | | | 5.64 | | | | 5.96 | | | | – | | | | – | |
| Russell 3000® Index6 | | – | | | – | | | | – | | | | – | | | | 15.53 | | | | 16.28 | | | | 8.32 | | | | – | | | | – | |
Figures quoted represent past performance, which is no guarantee of future results, and do not reflect taxes that a shareholder may pay on fund distributions or the redemption of fund shares. Investment return and principal value of an investment will fluctuate so that an investor’s shares, when redeemed, may be worth more or less than their original cost. Performance shown without sales charges would be lower if sales charges were reflected. Current performance may be lower or higher than the performance data quoted, which assumes the reinvestment of dividends and capital gains. Current month-end performance is available on the Portfolio’s website, wellsfargoadvantagefunds.com.
Index returns do not include transaction costs associated with buying and selling securities, any mutual fund fees or expenses, or any taxes. It is not possible to invest directly in an index.
For WealthBuilder Portfolio shares, the maximum front-end sales charge is 1.50%.
Balanced funds may invest in stocks and bonds. Stock values fluctuate in response to the activities of individual companies and general market and economic conditions. Bond values fluctuate in response to the financial condition of individual issuers, general market and economic conditions, and changes in interest rates. Changes in market conditions and government policies may lead to periods of heightened volatility in the bond market and reduced liquidity for certain bonds held by the Portfolio. In general, when interest rates rise, bond values fall and investors may lose principal value. Interest rate changes and their impact on the Portfolio and its share price can be sudden and unpredictable. The Portfolio will indirectly be exposed to all of the risks of an investment in the underlying funds and will indirectly bear expenses of the underlying funds. The use of derivatives may reduce returns and/or increase volatility. Certain investment strategies tend to increase the total risk of an investment (relative to the broader market). The Portfolio is exposed to alternative investment risk, foreign investment risk, high-yield securities risk, mortgage- and asset-backed securities risk, and smaller-company investment risk. Consult the Portfolio’s prospectus for additional information on these and other risks.
Please see footnotes on page 11.
| | | | | | |
| Performance highlights (unaudited) | | Wells Fargo Advantage WealthBuilder Portfolios | | | 11 | |
Wells Fargo Advantage WealthBuilder Growth Allocation Portfolio (continued)
| | | | |
| Ten largest holdings7 (%) as of November 30, 2014 | |
MFS Value Fund Class I | | | 11.78 | |
Thornburg International Value Fund Institutional Class | | | 7.00 | |
T. Rowe Price Blue Chip Growth Fund Retail Class | | | 6.98 | |
Wells Fargo Advantage Core Bond Portfolio | | | 5.84 | |
Wells Fargo Advantage Government Securities Fund Institutional Class | | | 5.84 | |
Oakmark Fund Class I | | | 5.83 | |
Invesco Growth and Income Fund Class R6 | | | 5.8 | |
American Century Growth Fund Institutional Class | | | 4.94 | |
Wells Fargo Advantage International Growth Portfolio | | | 4.64 | |
Wells Fargo Advantage Endeavor Select Fund Institutional Class | | | 3.95 | |
| | |
| Current target allocation8 as of November 30, 2014 |
|
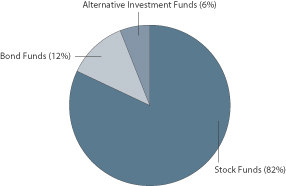 |
| 1. | Reflects the expense ratios as stated in the most recent prospectus, which include the impact of 0.72% in acquired fund fees and expenses. The expense ratios shown are subject to change and may differ from the annualized expense ratios shown in the financial highlights of this report, which do not include acquired fund fees and expenses. |
| 2. | The Adviser has committed through September 30, 2015, to waive fees and/or reimburse expenses to the extent necessary to cap the Portfolio’s Total Annual Fund Operating Expenses After Fee Waiver, excluding certain expenses, at 1.50%. After this time, the cap may be increased or the commitment to maintain the cap may be terminated only with the approval of the Board of Trustees. Brokerage commissions, stamp duty fees, interest, taxes, acquired fund fees and expenses, and extraordinary expenses are excluded from the cap. Without this cap, the Portfolio’s returns would have been lower. |
| 3. | Source: Wells Fargo Funds Management, LLC. The WealthBuilder Growth Allocation Composite Index is weighted 20% in the Barclays U.S. Aggregate Bond Index, 56% in the Russell 3000® Index, and 24% in the MSCI ACWI ex USA (Net) (includes Treasury issues, agency issues, corporate bond issues, and mortgage-backed securities). You cannot invest directly in an index. |
| 4. | The Barclays U.S. Aggregate Bond Index is a broad-based benchmark that measures the investment-grade, U.S. dollar-denominated, fixed-rate taxable bond market, including Treasuries, government-related and corporate securities, MBS (agency fixed-rate and hybrid ARM passthroughs), ABS, and CMBS. You cannot invest directly in an index. |
| 5. | The Morgan Stanley Capital International All Country World Index ex USA (Net) (MSCI ACWI ex USA (Net)) is a free float-adjusted market capitalization weighted index that is designed to measure the equity market performance of developed and emerging markets. You cannot invest directly in an index. Source: MSCI. MSCI makes no express or implied warranties or representations and shall have no liability whatsoever with respect to any MSCI data contained herein. The MSCI data may not be further redistributed or used as a basis for other indexes or any securities or financial products. This report is not approved, reviewed, or produced by MSCI. |
| 6. | The Russell 3000® Index measures the performance of the 3,000 largest U.S. companies based on total market capitalization, which represents approximately 98% of the investable U.S. equity market. You cannot invest directly in an index. |
| 7. | The ten largest holdings are calculated based on the value of the holdings divided by total net assets of the Portfolio. Holdings are subject to change and may have changed since the date specified. |
| 8. | Current target allocation is subject to change and is calculated based on the total long-term investments of the Portfolio. The Portfolio’s use of futures contracts to implement a Tactical Asset Allocation (TAA) shift toward stocks or bonds is reflected in the allocation shown. |
| | | | |
| 12 | | Wells Fargo Advantage WealthBuilder Portfolios | | Performance highlights (unaudited) |
Wells Fargo Advantage WealthBuilder Equity Portfolio
Investment objective
The Portfolio seeks long-term capital appreciation with no emphasis on income.
Adviser
Wells Fargo Funds Management, LLC
Subadviser
Wells Capital Management Incorporated
Portfolio managers
Kandarp Acharya, CFA, FRM
Christian L. Chan, CFA
Average annual total returns (%) as of November 30, 2014
| | | | | | | | | | | | | | | | | | | | | | | | | | | | | | | | | | |
| | | | | Including sales charge | | | Excluding sales charge | | | Expense ratios1 (%) | |
| | | Inception date | | 1 year | | | 5 year | | | 10 year | | | 1 year | | | 5 year | | | 10 year | | | Gross | | | Net2 | |
| Wells Fargo Advantage WealthBuilder Equity Portfolio (WBGIX) | | 10-1-1997 | | | 5.52 | | | | 10.75 | | | | 4.98 | | | | 7.13 | | | | 11.09 | | | | 5.13 | | | | 2.39 | | | | 2.28 | |
| WealthBuilder Equity Composite Index3 | | – | | | – | | | | – | | | | – | | | | 10.89 | | | | 13.06 | | | | 7.70 | | | | – | | | | – | |
| MSCI ACWI ex USA (Net)4 | | – | | | – | | | | – | | | | – | | | | 0.61 | | | | 5.64 | | | | 5.96 | | | | – | | | | – | |
| Russell 3000® Index5 | | – | | | – | | | | – | | | | – | | | | 15.53 | | | | 16.28 | | | | 8.32 | | | | – | | | | – | |
Figures quoted represent past performance, which is no guarantee of future results, and do not reflect taxes that a shareholder may pay on fund distributions or the redemption of fund shares. Investment return and principal value of an investment will fluctuate so that an investor’s shares, when redeemed, may be worth more or less than their original cost. Performance shown without sales charges would be lower if sales charges were reflected. Current performance may be lower or higher than the performance data quoted, which assumes the reinvestment of dividends and capital gains. Current month-end performance is available on the Portfolio’s website, wellsfargoadvantagefunds.com.
Index returns do not include transaction costs associated with buying and selling securities, any mutual fund fees or expenses, or any taxes. It is not possible to invest directly in an index.
For WealthBuilder Portfolio shares, the maximum front-end sales charge is 1.50%.
Stock values fluctuate in response to the activities of individual companies and general market and economic conditions. The Portfolio will indirectly be exposed to all of the risks of an investment in the underlying funds and will indirectly bear expenses of the underlying funds. The use of derivatives may reduce returns and/or increase volatility. Certain investment strategies tend to increase the total risk of an investment (relative to the broader market). The Portfolio is exposed to alternative investment risk, foreign investment risk and smaller-company investment risk. Consult the Portfolio’s prospectus for additional information on these and other risks.
Please see footnotes on page 13.
| | | | | | |
| Performance highlights (unaudited) | | Wells Fargo Advantage WealthBuilder Portfolios | | | 13 | |
Wells Fargo Advantage WealthBuilder Equity Portfolio (continued)
| | | | |
| Ten largest holdings6 (%) as of November 30, 2014 | |
MFS Value Fund Class I | | | 15.03 | |
T. Rowe Price Blue Chip Growth Fund Retail Class | | | 10.55 | |
Thornburg International Value Fund Institutional Class | | | 9.04 | |
American Century Growth Fund Institutional Class | | | 7.55 | |
Oakmark Fund Class I | | | 7.49 | |
Invesco Growth and Income Fund Class R6 | | | 7.45 | |
Wells Fargo Advantage Endeavor Select Fund Institutional Class | | | 6.10 | |
Wells Fargo Advantage International Growth Portfolio | | | 6.07 | |
Wells Fargo Advantage Large Cap Growth Fund Institutional Class | | | 6.00 | |
Dodge & Cox International Stock Fund | | | 2.99 | |
|
| Portfolio allocation7 as of November 30, 2014 |
|
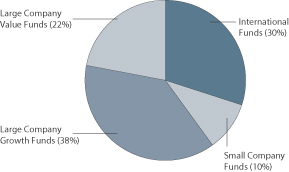 |
| 1. | Reflects the expense ratios as stated in the most recent prospectus, which include the impact of 0.78% in acquired fund fees and expenses. The expense ratios shown are subject to change and may differ from the annualized expense ratios shown in the financial highlights of this report, which do not include acquired fund fees and expenses. |
| 2. | The Adviser has committed through September 30, 2015, to waive fees and/or reimburse expenses to the extent necessary to cap the Portfolio’s Total Annual Fund Operating Expenses After Fee Waiver, excluding certain expenses, at 1.50%. After this time, the cap may be increased or the commitment to maintain the cap may be terminated only with the approval of the Board of Trustees. Brokerage commissions, stamp duty fees, interest, taxes, acquired fund fees and expenses, and extraordinary expenses are excluded from the cap. Without this cap, the Portfolio’s returns would have been lower. |
| 3. | Source: Wells Fargo Funds Management, LLC. The WealthBuilder Equity Composite Index is weighted 70% in the Russell 3000® Index and 30% in the MSCI ACWI ex USA (Net). You cannot invest directly in an index. |
| 4. | The Morgan Stanley Capital International All Country World Index ex USA (Net) (MSCI ACWI ex USA (Net)) is a free float-adjusted market capitalization weighted index that is designed to measure the equity market performance of developed and emerging markets. You cannot invest directly in an index. Source: MSCI. MSCI makes no express or implied warranties or representations and shall have no liability whatsoever with respect to any MSCI data contained herein. The MSCI data may not be further redistributed or used as a basis for other indexes or any securities or financial products. This report is not approved, reviewed, or produced by MSCI. |
| 5. | The Russell 3000® Index measures the performance of the 3,000 largest U.S. companies based on total market capitalization, which represents approximately 98% of the investable U.S. equity market. You cannot invest directly in an index. |
| 6. | The ten largest holdings are calculated based on the value of the holdings divided by total net assets of the Portfolio. Holdings are subject to change and may have changed since the date specified. |
| 7. | Portfolio allocation is subject to change and is calculated based on the total long-term investments of the Portfolio. |
| | | | |
| 14 | | Wells Fargo Advantage WealthBuilder Portfolios | | Performance highlights (unaudited) |
Wells Fargo Advantage WealthBuilder Tactical Equity Portfolio
Investment objective
The Portfolio seeks long-term capital appreciation with no emphasis on income.
Adviser
Wells Fargo Funds Management, LLC
Subadviser
Wells Capital Management Incorporated
Portfolio managers
Kandarp Acharya, CFA, FRM
Christian L. Chan, CFA
Average annual total returns (%) as of November 30, 2014
| | | | | | | | | | | | | | | | | | | | | | | | | | | | | | | | | | |
| | | | | Including sales charge | | | Excluding sales charge | | | Expense ratios1 (%) | |
| | | Inception date | | 1 year | | | 5 year | | | 10 year | | | 1 year | | | 5 year | | | 10 year | | | Gross | | | Net2 | |
| Wells Fargo Advantage WealthBuilder Tactical Equity Portfolio (WBGAX) | | 10-1-1997 | | | 4.90 | | | | 11.24 | | | | 5.60 | | | | 6.50 | | | | 11.57 | | | | 5.76 | | | | 2.32 | | | | 2.26 | |
| WealthBuilder Tactical Equity Composite Index3 | | – | | | – | | | | – | | | | – | | | | 10.89 | | | | 13.06 | | | | 7.70 | | | | – | | | | – | |
| MSCI ACWI ex USA (Net)4 | | – | | | – | | | | – | | | | – | | | | 0.61 | | | | 5.64 | | | | 5.96 | | | | – | | | | – | |
| Russell 3000® Index5 | | – | | | – | | | | – | | | | – | | | | 15.53 | | | | 16.28 | | | | 8.32 | | | | – | | | | – | |
Figures quoted represent past performance, which is no guarantee of future results, and do not reflect taxes that a shareholder may pay on fund distributions or the redemption of fund shares. Investment return and principal value of an investment will fluctuate so that an investor’s shares, when redeemed, may be worth more or less than their original cost. Performance shown without sales charges would be lower if sales charges were reflected. Current performance may be lower or higher than the performance data quoted, which assumes the reinvestment of dividends and capital gains. Current month-end performance is available on the Portfolio’s website, wellsfargoadvantagefunds.com.
Index returns do not include transaction costs associated with buying and selling securities, any mutual fund fees or expenses, or any taxes. It is not possible to invest directly in an index.
For WealthBuilder Portfolio shares, the maximum front-end sales charge is 1.50%.
Stock values fluctuate in response to the activities of individual companies and general market and economic conditions. The Portfolio will indirectly be exposed to all of the risks of an investment in the underlying funds and will indirectly bear expenses of the underlying funds. The use of derivatives may reduce returns and/or increase volatility. Certain investment strategies tend to increase the total risk of an investment (relative to the broader market). The Portfolio is exposed to alternative investment risk, foreign investment risk, and smaller-company investment risk. Consult the Portfolio’s prospectus for additional information on these and other risks.
Please see footnotes on page 15.
| | | | | | |
| Performance highlights (unaudited) | | Wells Fargo Advantage WealthBuilder Portfolios | | | 15 | |
Wells Fargo Advantage WealthBuilder Tactical Equity Portfolio (continued)
| | | | |
| Ten largest holdings6 (%) as of November 30, 2014 | |
MFS Value Fund Class I | | | 15.09 | |
Thornburg International Value Fund Institutional Class | | | 9.01 | |
T. Rowe Price Blue Chip Growth Fund Retail Class | | | 8.83 | |
Oakmark Fund Class I | | | 7.51 | |
Invesco Growth and Income Fund Class R6 | | | 7.47 | |
American Century Growth Fund Institutional Class | | | 6.33 | |
Wells Fargo Advantage International Growth Portfolio | | | 6.04 | |
Wells Fargo Advantage Endeavor Select Fund Institutional Class | | | 5.08 | |
Wells Fargo Advantage Large Cap Growth Fund Institutional Class | | | 5.02 | |
Wells Fargo Advantage Emerging Growth Portfolio | | | 3.75 | |
|
| Portfolio allocation7 as of November 30, 2014 |
|
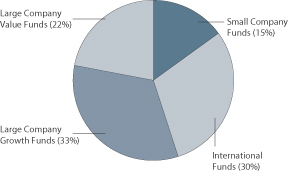 |
| 1. | Reflects the expense ratios as stated in the most recent prospectus, which include the impact of 0.76% in acquired fund fees and expenses. The expense ratios shown are subject to change and may differ from the annualized expense ratios shown in the financial highlights of this report, which do not include acquired fund fees and expenses. |
| 2. | The Adviser has committed through September 30, 2015, to waive fees and/or reimburse expenses to the extent necessary to cap the Portfolio’s Total Annual Fund Operating Expenses After Fee Waiver, excluding certain expenses, at 1.50%. After this time, the cap may be increased or the commitment to maintain the cap may be terminated only with the approval of the Board of Trustees. Brokerage commissions, stamp duty fees, interest, taxes, acquired fund fees and expenses, and extraordinary expenses are excluded from the cap. Without this cap, the Portfolio’s returns would have been lower. |
| 3. | Source: Wells Fargo Funds Management, LLC. The WealthBuilder Tactical Equity Composite Index is weighted 70% in the Russell 3000® Index, and 30% in the MSCI ACWI ex USA (Net). You cannot invest directly in an index. |
| 4. | The Morgan Stanley Capital International All Country World Index ex USA (Net) (MSCI ACWI ex USA (Net)) is a free float-adjusted market capitalization weighted index that is designed to measure the equity market performance of developed and emerging markets. You cannot invest directly in an index. Source: MSCI. MSCI makes no express or implied warranties or representations and shall have no liability whatsoever with respect to any MSCI data contained herein. The MSCI data may not be further redistributed or used as a basis for other indexes or any securities or financial products. This report is not approved, reviewed, or produced by MSCI. |
| 5. | The Russell 3000® Index measures the performance of the 3,000 largest U.S. companies based on total market capitalization, which represents approximately 98% of the investable U.S. equity market. You cannot invest directly in an index. |
| 6. | The ten largest holdings are calculated based on the value of the holdings divided by total net assets of the Portfolio. Holdings are subject to change and may have changed since the date specified. |
| 7. | Portfolio allocation is subject to change and is calculated based on the total long-term investments of the Portfolio. |
| | | | |
| 16 | | Wells Fargo Advantage WealthBuilder Portfolios | | Fund expenses (unaudited) |
As a shareholder of the Fund, you incur two types of costs: (1) transaction costs, including sales charges (loads) on purchase payments and contingent deferred sales charges (if any) on redemptions and (2) ongoing costs, including management fees, distribution (12b-1) and/or shareholder service fees, and other Fund expenses. This example is intended to help you understand your ongoing costs (in dollars) of investing in the Fund and to compare these costs with the ongoing costs of investing in other mutual funds.
The example is based on an investment of $1,000 invested at the beginning of the six-month period and held for the entire period from June 1, 2014 to November 30, 2014.
Actual expenses
The “Actual” line of the table below provides information about actual account values and actual expenses. You may use the information in this line, together with the amount you invested, to estimate the expenses that you paid over the period. Simply divide your account value by $1,000 (for example, an $8,600 account value divided by $1,000 = 8.6), then multiply the result by the number in the “Actual” line under the heading entitled “Expenses paid during period” for your applicable class of shares to estimate the expenses you paid on your account during this period.
Hypothetical example for comparison purposes
The “Hypothetical” line of the table below provides information about hypothetical account values and hypothetical expenses based on the Fund’s actual expense ratio and an assumed rate of return of 5% per year before expenses, which is not the Fund’s actual return. The hypothetical account values and expenses may not be used to estimate the actual ending account balance or expenses you paid for the period. You may use this information to compare the ongoing costs of investing in the Fund and other funds. To do so, compare this 5% hypothetical example with the 5% hypothetical examples that appear in the shareholder reports of the other funds.
Please note that the expenses shown in the table are meant to highlight your ongoing costs only and do not reflect any transactional costs, such as sales charges (loads) and contingent deferred sales charges. Therefore, the “Hypothetical” line of the table is useful in comparing ongoing costs only and will not help you determine the relative total costs of owning different funds. In addition, if these transactional costs were included, your costs would have been higher.
| | | | | | | | | | | | | | | | |
| | | Beginning
account value
6-1-2014 | | | Ending
account value
11-30-2014 | | | Expenses
paid during
the period¹ | | | Net annualized
expense ratio | |
Wells Fargo Advantage WealthBuilder Conservative Allocation Portfolio | | | | | | | | | | | | | | | | |
Actual | | $ | 1,000.00 | | | $ | 1,009.96 | | | $ | 7.56 | | | | 1.50 | % |
Hypothetical (5% return before expenses) | | $ | 1,000.00 | | | $ | 1,017.55 | | | $ | 7.59 | | | | 1.50 | % |
Wells Fargo Advantage WealthBuilder Moderate Balanced Portfolio | | | | | | | | | | | | | | | | |
Actual | | $ | 1,000.00 | | | $ | 1,017.20 | | | $ | 7.59 | | | | 1.50 | % |
Hypothetical (5% return before expenses) | | $ | 1,000.00 | | | $ | 1,017.55 | | | $ | 7.59 | | | | 1.50 | % |
Wells Fargo Advantage WealthBuilder Growth Balanced Portfolio | | | | | | | | | | | | | | | | |
Actual | | $ | 1,000.00 | | | $ | 1,023.58 | | | $ | 7.61 | | | | 1.50 | % |
Hypothetical (5% return before expenses) | | $ | 1,000.00 | | | $ | 1,017.55 | | | $ | 7.59 | | | | 1.50 | % |
Wells Fargo Advantage WealthBuilder Growth Allocation Portfolio | | | | | | | | | | | | | | | | |
Actual | | $ | 1,000.00 | | | $ | 1,028.42 | | | $ | 7.63 | | | | 1.50 | % |
Hypothetical (5% return before expenses) | | $ | 1,000.00 | | | $ | 1,017.55 | | | $ | 7.59 | | | | 1.50 | % |
Wells Fargo Advantage WealthBuilder Equity Portfolio | | | | | | | | | | | | | | | | |
Actual | | $ | 1,000.00 | | | $ | 1,036.84 | | | $ | 7.66 | | | | 1.50 | % |
Hypothetical (5% return before expenses) | | $ | 1,000.00 | | | $ | 1,017.55 | | | $ | 7.59 | | | | 1.50 | % |
Wells Fargo Advantage WealthBuilder Tactical Equity Portfolio | | | | | | | | | | | | | | | | |
Actual | | $ | 1,000.00 | | | $ | 1,033.76 | | | $ | 7.65 | | | | 1.50 | % |
Hypothetical (5% return before expenses) | | $ | 1,000.00 | | | $ | 1,017.55 | | | $ | 7.59 | | | | 1.50 | % |
| 1. | Expenses paid is equal to the annualized expense ratio multiplied by the average account value over the period, multiplied by the number of days in the most recent fiscal half-year divided by the number of days in the fiscal year (to reflect the one-half-year period). |
| | | | | | |
| Portfolio of investments—November 30, 2014 (unaudited) | | Wells Fargo Advantage WealthBuilder Portfolios | | | 17 | |
WEALTHBUILDER CONSERVATIVE ALLOCATION PORTFOLIO
| | | | | | | | | | | | |
| Security name | | | | | | Shares | | | Value | |
| | | | | | | | | | | | |
| | | | |
Investment Companies: 99.49% | | | | | | | | | | | | |
| | | | |
| Affiliated Master Portfolios: 26.96% | | | | | | | | | | | | |
Wells Fargo Advantage Core Bond Portfolio | | | | | | | | | | $ | 135,561,478 | |
Wells Fargo Advantage Emerging Growth Portfolio | | | | | | | | | | | 4,003,132 | |
Wells Fargo Advantage International Growth Portfolio | | | | | | | | | | | 6,520,915 | |
Wells Fargo Advantage Small Company Value Portfolio | | | | | | | | | | | 3,980,052 | |
| | | | |
| | | | | | | | | | | 150,065,577 | |
| | | | | | | | | | | | |
| | | | |
| Alternative Investment Funds: 3.55% | | | | | | | | | | | | |
AQR Managed Futures Strategy Fund Class I | | | | | | | 253,321 | | | | 2,854,924 | |
PIMCO CommodityRealReturn Strategy Fund Institutional Class | | | | | | | 2,841,669 | | | | 14,094,679 | |
The Arbitrage Fund Class I | | | | | | | 214,002 | | | | 2,773,471 | |
| | | | |
| | | | | | | | | | | 19,723,074 | |
| | | | | | | | | | | | |
| | | | |
| International Equity Funds: 4.63% | | | | | | | | | | | | |
DFA International Small Cap Value Portfolio Institutional Class | | | | | | | 110,101 | | | | 2,137,067 | |
Dodge & Cox International Stock Fund | | | | | | | 71,317 | | | | 3,224,240 | |
Oppenheimer Developing Markets Fund Class Y | | | | | | | 69,132 | | | | 2,658,121 | |
T. Rowe Price International Discovery Fund | | | | | | | 38,453 | | | | 2,155,297 | |
Templeton Institutional Foreign Equity Fund Primary Class | | | | | | | 147,712 | | | | 3,220,124 | |
Thornburg International Value Fund Institutional Class | | | | | | | 338,284 | | | | 9,712,138 | |
Wells Fargo Advantage Emerging Markets Equity Fund Institutional Class (l) | | | | | | | 119,946 | | | | 2,674,787 | |
| | | | |
| | | | | | | | | | | 25,781,774 | |
| | | | | | | | | | | | |
| | | | |
| International Fixed Income Funds: 4.67% | | | | | | | | | | | | |
Oppenheimer International Bond Fund Class Y | | | | | | | 4,324,311 | | | | 25,989,109 | |
| | | | | | | | | | | | |
| | | | |
| U.S. Equity Funds: 13.89% | | | | | | | | | | | | |
American Century Growth Fund Institutional Class | | | | | | | 182,810 | | | | 6,754,833 | |
Invesco Growth and Income Fund Class R6 | | | | | | | 272,566 | | | | 8,043,416 | |
MFS Value Fund Class I | | | | | | | 449,909 | | | | 16,228,202 | |
Oakmark Fund Class I | | | | | | | 113,550 | | | | 8,074,559 | |
Royce Pennsylvania Mutual Fund Investor Class | | | | | | | 274,917 | | | | 3,975,306 | |
T. Rowe Price Blue Chip Growth Fund Retail Class | | | | | | | 132,167 | | | | 9,456,570 | |
Voya Global Real Estate Fund Class I | | | | | | | 489,600 | | | | 10,002,520 | |
Wells Fargo Advantage Endeavor Select Fund Institutional Class (l) | | | | | | | 345,679 | | | | 5,427,154 | |
Wells Fargo Advantage Large Cap Growth Fund Institutional Class (l) | | | | | | | 110,001 | | | | 5,392,264 | |
Wells Fargo Advantage Small Cap Value Fund Institutional Class (l) | | | | | | | 112,521 | | | | 3,928,116 | |
| | | | |
| | | | | | | | | | | 77,282,940 | |
| | | | | | | | | | | | |
| | | | |
| U.S. Fixed Income Funds: 45.79% | | | | | | | | | | | | |
PIMCO High Yield Fund Institutional Class | | | | | | | 3,816,883 | | | | 36,336,726 | |
Wells Fargo Advantage Government Securities Fund Institutional Class (l) | | | | | | | 9,293,909 | | | | 104,277,657 | |
Wells Fargo Advantage Short Duration Government Bond Fund Institutional Class (l) | | | | | | | 11,301,747 | | | | 114,260,667 | |
| | | | |
| | | | | | | | | | | 254,875,050 | |
| | | | | | | | | | | | |
| | | | |
Total Investment Companies (Cost $513,557,096) | | | | | | | | | | | 553,717,524 | |
| | | | | | | | | | | | |
The accompanying notes are an integral part of these financial statements.
| | | | |
| 18 | | Wells Fargo Advantage WealthBuilder Portfolios | | Portfolio of investments—November 30, 2014 (unaudited) |
WEALTHBUILDER CONSERVATIVE ALLOCATION PORTFOLIO
| | | | | | | | | | | | | | | | |
| Security name | | Yield | | | | | | Shares | | | Value | |
| | | | | | | | | | | | | | | | |
| Short-Term Investments: 0.44% | | | | | | | | | | | | | | | | |
| | | | |
| Investment Companies: 0.17% | | | | | | | | | | | | | | | | |
Wells Fargo Advantage Cash Investment Money Market Fund, Select Class (l)(u) | | | 0.08 | % | | | | | | | 979,477 | | | $ | 979,477 | |
| | | | | | | | | | | | | | | | |
| | | | |
| | | | | | Maturity date | | | Principal | | | | |
| U.S. Treasury Securities: 0.27% | | | | | | | | | | | | | | | | |
U.S. Treasury Bill #(z) | | | 0.02 | | | | 12-4-2014 | | | $ | 490,000 | | | | 489,999 | |
U.S. Treasury Bill #(z) | | | 0.02 | | | | 12-11-2014 | | | | 1,010,000 | | | | 1,009,994 | |
| | | | |
| | | | | | | | | | | | | | | 1,499,993 | |
| | | | | | | | | | | | | | | | |
| | | | |
Total Short-Term Investments (Cost $2,479,472) | | | | | | | | | | | | | | | 2,479,470 | |
| | | | | | | | | | | | | | | | |
| | | | | | | | |
| Total investments in securities (Cost $516,036,568) * | | | 99.93 | % | | | 556,196,994 | |
Other assets and liabilities, net | | | 0.07 | | | | 383,160 | |
| | | | | | | | |
| Total net assets | | | 100.00 | % | | $ | 556,580,154 | |
| | | | | | | | |
| (l) | The security represents an affiliate of the Portfolio as defined in the Investment Company Act of 1940. |
| (u) | The rate represents the 7-day annualized yield at period end. |
| # | All or a portion of this security is segregated as collateral for investments in derivative instruments. |
| (z) | Zero coupon security. The rate represents the current yield to maturity. |
| * | Cost for federal income tax purposes is $522,502,365 and unrealized gains (losses) consists of: |
| | | | |
Gross unrealized gains | | $ | 45,390,361 | |
Gross unrealized losses | | | (11,695,732 | ) |
| | | | |
Net unrealized gains | | $ | 33,694,629 | |
The accompanying notes are an integral part of these financial statements.
| | | | | | |
| Portfolio of investments—November 30, 2014 (unaudited) | | Wells Fargo Advantage WealthBuilder Portfolios | | | 19 | |
WEALTHBUILDER MODERATE BALANCED PORTFOLIO
| | | | | | | | | | | | |
| Security name | | | | | | Shares | | | Value | |
| | | | | | | | | | | | |
| | | | |
Investment Companies: 99.50% | | | | | | | | | | | | |
| | | | |
| Affiliated Master Portfolios: 23.21% | | | | | | | | | | | | |
Wells Fargo Advantage Core Bond Portfolio | | | | | | | | | | $ | 158,041,780 | |
Wells Fargo Advantage Emerging Growth Portfolio | | | | | | | | | | | 12,831,236 | |
Wells Fargo Advantage International Growth Portfolio | | | | | | | | | | | 20,936,564 | |
Wells Fargo Advantage Small Company Value Portfolio | | | | | | | | | | | 12,745,212 | |
| | | | |
| | | | | | | | | | | 204,554,792 | |
| | | | | | | | | | | | |
| | | | |
| Alternative Investment Funds: 3.52% | | | | | | | | | | | | |
AQR Managed Futures Strategy Fund Class I | | | | | | | 407,117 | | | | 4,588,205 | |
PIMCO CommodityRealReturn Strategy Fund Institutional Class | | | | | | | 4,449,110 | | | | 22,067,587 | |
The Arbitrage Fund Class I | | | | | | | 338,026 | | | | 4,380,812 | |
| | | | |
| | | | | | | | | | | 31,036,604 | |
| | | | | | | | | | | | |
| | | | |
| International Equity Funds: 9.32% | | | | | | | | | | | | |
DFA International Small Cap Value Portfolio Institutional Class | | | | | | | 343,996 | | | | 6,676,961 | |
Dodge & Cox International Stock Fund | | | | | | | 228,258 | | | | 10,319,533 | |
Oppenheimer Developing Markets Fund Class Y | | | | | | | 219,726 | | | | 8,448,463 | |
T. Rowe Price International Discovery Fund | | | | | | | 121,242 | | | | 6,795,591 | |
Templeton Institutional Foreign Equity Fund Primary Class | | | | | | | 469,388 | | | | 10,232,652 | |
Thornburg International Value Fund Institutional Class | | | | | | | 1,086,830 | | | | 31,202,881 | |
Wells Fargo Advantage Emerging Markets Equity Fund Institutional Class (l) | | | | | | | 380,240 | | | | 8,479,349 | |
| | | | |
| | | | | | | | | | | 82,155,430 | |
| | | | | | | | | | | �� | |
| | | | |
| International Fixed Income Funds: 4.59% | | | | | | | | | | | | |
Oppenheimer International Bond Fund Class Y | | | | | | | 6,724,984 | | | | 40,417,155 | |
| | | | | | | | | | | | |
| | | | |
| U.S. Equity Funds: 26.33% | | | | | | | | | | | | |
American Century Growth Fund Institutional Class | | | | | | | 587,422 | | | | 21,705,230 | |
Invesco Growth and Income Fund Class R6 | | | | | | | 875,682 | | | | 25,841,376 | |
MFS Value Fund Class I | | | | | | | 1,443,101 | | | | 52,052,650 | |
Oakmark Fund Class I | | | | | | | 364,837 | | | | 25,943,545 | |
Royce Pennsylvania Mutual Fund Investor Class | | | | | | | 881,689 | | | | 12,749,219 | |
T. Rowe Price Blue Chip Growth Fund Retail Class | | | | | | | 424,300 | | | | 30,358,664 | |
Voya Global Real Estate Fund Class I | | | | | | | 784,191 | | | | 16,021,015 | |
Wells Fargo Advantage Endeavor Select Fund Institutional Class (l) | | | | | | | 1,111,241 | | | | 17,446,490 | |
Wells Fargo Advantage Large Cap Growth Fund Institutional Class (l) | | | | | | | 352,738 | | | | 17,291,208 | |
Wells Fargo Advantage Small Cap Value Fund Institutional Class (l) | | | | | | | 362,161 | | | | 12,643,038 | |
| | | | |
| | | | | | | | | | | 232,052,435 | |
| | | | | | | | | | | | |
| | | | |
| U.S. Fixed Income Funds: 32.53% | | | | | | | | | | | | |
PIMCO High Yield Fund Institutional Class | | | | | | | 5,514,102 | | | | 52,494,255 | |
Wells Fargo Advantage Government Securities Fund Institutional Class (l) | | | | | | | 10,823,461 | | | | 121,439,232 | |
Wells Fargo Advantage Short Duration Government Bond Fund Institutional Class (l) | | | | | | | 11,155,182 | | | | 112,778,890 | |
| | | | |
| | | | | | | | | | | 286,712,377 | |
| | | | | | | | | | | | |
| | | | |
Total Investment Companies (Cost $788,036,458) | | | | | | | | | | | 876,928,793 | |
| | | | | | | | | | | | |
The accompanying notes are an integral part of these financial statements.
| | | | |
| 20 | | Wells Fargo Advantage WealthBuilder Portfolios | | Portfolio of investments—November 30, 2014 (unaudited) |
WEALTHBUILDER MODERATE BALANCED PORTFOLIO
| | | | | | | | | | | | | | | | |
| Security name | | Yield | | | | | | Shares | | | Value | |
| | | | | | | | | | | | | | | | |
| Short-Term Investments: 0.57% | | | | | | | | | | | | | | | | |
| | | | |
| Investment Companies: 0.05% | | | | | | | | | | | | | | | | |
Wells Fargo Advantage Cash Investment Money Market Fund, Select Class (l)(u) | | | 0.08 | % | | | | | | | 476,264 | | | $ | 476,264 | |
| | | | | | | | | | | | | | | | |
| | | | |
| | | | | | Maturity date | | | Principal | | | | |
| U.S. Treasury Securities: 0.52% | | | | | | | | | | | | | | | | |
U.S. Treasury Bill #(z) | | | 0.02 | | | | 12-4-2014 | | | $ | ��1,540,000 | | | | 1,539,996 | |
U.S. Treasury Bill #(z) | | | 0.02 | | | | 12-11-2014 | | | | 3,020,000 | | | | 3,019,982 | |
| | | | |
| | | | | | | | | | | | | | | 4,559,978 | |
| | | | | | | | | | | | | | | | |
| | | | |
Total Short-Term Investments (Cost $5,036,248) | | | | | | | | | | | | | | | 5,036,242 | |
| | | | | | | | | | | | | | | | |
| | | | | | | | |
| Total investments in securities (Cost $793,072,706) * | | | 100.07 | % | | | 881,965,035 | |
Other assets and liabilities, net | | | (0.07 | ) | | | (581,962 | ) |
| | | | | | | | |
| Total net assets | | | 100.00 | % | | $ | 881,383,073 | |
| | | | | | | | |
| (l) | The security represents an affiliate of the Portfolio as defined in the Investment Company Act of 1940. |
| (u) | The rate represents the 7-day annualized yield at period end. |
| # | All or a portion of this security is segregated as collateral for investments in derivative instruments. |
| (z) | Zero coupon security. The rate represents the current yield to maturity. |
| * | Cost for federal income tax purposes is $801,732,009 and unrealized gains (losses) consists of: |
| | | | |
Gross unrealized gains | | $ | 99,393,816 | |
Gross unrealized losses | | | (19,160,790 | ) |
| | | | |
Net unrealized gains | | $ | 80,233,026 | |
The accompanying notes are an integral part of these financial statements.
| | | | | | |
| Portfolio of investments—November 30, 2014 (unaudited) | | Wells Fargo Advantage WealthBuilder Portfolios | | | 21 | |
WEALTHBUILDER GROWTH BALANCED PORTFOLIO
| | | | | | | | | | | | |
| Security name | | | | | | Shares | | | Value | |
| | | | | | | | | | | | |
| | | | |
Investment Companies: 99.27% | | | | | | | | | | | | |
| | | | |
| Affiliated Master Portfolios: 19.75% | | | | | | | | | | | | |
Wells Fargo Advantage Core Bond Portfolio | | | | | | | | | | $ | 112,385,185 | |
Wells Fargo Advantage Emerging Growth Portfolio | | | | | | | | | | | 22,231,825 | |
Wells Fargo Advantage International Growth Portfolio | | | | | | | | | | | 35,302,864 | |
Wells Fargo Advantage Small Company Value Portfolio | | | | | | | | | | | 21,529,467 | |
| | | | |
| | | | | | | | | | | 191,449,341 | |
| | | | | | | | | | | | |
| | | | |
| Alternative Investment Funds: 3.43% | | | | | | | | | | | | |
AQR Managed Futures Strategy Fund Class I | | | | | | | 456,806 | | | | 5,148,200 | |
PIMCO CommodityRealReturn Strategy Fund Institutional Class | | | | | | | 4,723,694 | | | | 23,429,521 | |
The Arbitrage Fund Class I | | | | | | | 361,760 | | | | 4,688,414 | |
| | | | |
| | | | | | | | | | | 33,266,135 | |
| | | | | | | | | | | | |
| | | | |
| International Equity Funds: 14.14% | | | | | | | | | | | | |
DFA International Small Cap Value Portfolio Institutional Class | | | | | | | 570,498 | | | | 11,073,376 | |
Dodge & Cox International Stock Fund | | | | | | | 378,680 | | | | 17,120,124 | |
Oppenheimer Developing Markets Fund Class Y | | | | | | | 362,171 | | | | 13,925,465 | |
T. Rowe Price International Discovery Fund | | | | | | | 200,999 | | | | 11,265,997 | |
Templeton Institutional Foreign Equity Fund Primary Class | | | | | | | 777,004 | | | | 16,938,695 | |
Thornburg International Value Fund Institutional Class | | | | | | | 1,836,865 | | | | 52,736,381 | |
Wells Fargo Advantage Emerging Markets Equity Fund Institutional Class (l) | | | | | | | 624,519 | | | | 13,926,775 | |
| | | | |
| | | | | | | | | | | 136,986,813 | |
| | | | | | | | | | | | |
| | | | |
| International Fixed Income Funds: 4.83% | | | | | | | | | | | | |
Oppenheimer International Bond Fund Class Y | | | | | | | 7,786,122 | | | | 46,794,594 | |
| | | | | | | | | | | | |
| | | | |
| U.S. Equity Funds: 39.75% | | | | | | | | | | | | |
American Century Growth Fund Institutional Class | | | | | | | 1,005,499 | | | | 37,153,205 | |
Invesco Growth and Income Fund Class R6 | | | | | | | 1,485,243 | | | | 43,829,508 | |
MFS Value Fund Class I | | | | | | | 2,461,957 | | | | 88,802,783 | |
Oakmark Fund Class I | | | | | | | 618,514 | | | | 43,982,544 | |
Royce Pennsylvania Mutual Fund Investor Class | | | | | | | 1,484,608 | | | | 21,467,432 | |
T. Rowe Price Blue Chip Growth Fund Retail Class | | | | | | | 727,046 | | | | 52,020,123 | |
Voya Global Real Estate Fund Class I | | | | | | | 860,037 | | | | 17,570,564 | |
Wells Fargo Advantage Endeavor Select Fund Institutional Class (l) | | | | | | | 1,897,493 | | | | 29,790,644 | |
Wells Fargo Advantage Large Cap Growth Fund Institutional Class (l) | | | | | | | 603,127 | | | | 29,565,261 | |
Wells Fargo Advantage Small Cap Value Fund Institutional Class (l) | | | | | | | 604,477 | | | | 21,102,295 | |
| | | | |
| | | | | | | | | | | 385,284,359 | |
| | | | | | | | | | | | |
| | | | |
| U.S. Fixed Income Funds: 17.37% | | | | | | | | | | | | |
PIMCO High Yield Fund Institutional Class | | | | | | | 4,923,048 | | | | 46,867,413 | |
Wells Fargo Advantage Government Securities Fund Institutional Class (l) | | | | | | | 10,828,819 | | | | 121,499,347 | |
| | | | |
| | | | | | | | | | | 168,366,760 | |
| | | | | | | | | | | | |
| | | | |
Total Investment Companies (Cost $815,421,588) | | | | | | | | | | | 962,148,002 | |
| | | | | | | | | | | | |
The accompanying notes are an integral part of these financial statements.
| | | | |
| 22 | | Wells Fargo Advantage WealthBuilder Portfolios | | Portfolio of investments—November 30, 2014 (unaudited) |
WEALTHBUILDER GROWTH BALANCED PORTFOLIO
| | | | | | | | | | | | | | | | |
| Security name | | Yield | | | | | | Shares | | | Value | |
| | | | | | | | | | | | | | | | |
| Short-Term Investments: 0.78% | | | | | | | | | | | | | | | | |
| | | | |
| Investment Companies: 0.28% | | | | | | | | | | | | | | | | |
Wells Fargo Advantage Cash Investment Money Market Fund, Select Class (l)(u) | | | 0.08 | % | | | | | | | 2,751,249 | | | $ | 2,751,249 | |
| | | | | | | | | | | | | | | | |
| | | | |
| | | | | | Maturity date | | | Principal | | | | |
| U.S. Treasury Securities: 0.50% | | | | | | | | | | | | | | | | |
U.S. Treasury Bill #(z) | | | 0.02 | | | | 12-4-2014 | | | $ | 1,585,000 | | | | 1,584,996 | |
U.S. Treasury Bill #(z) | | | 0.02 | | | | 12-11-2014 | | | | 3,250,000 | | | | 3,249,981 | |
| | | | |
| | | | | | | | | | | | | | | 4,834,977 | |
| | | | | | | | | | | | | | | | |
| | | | |
Total Short-Term Investments (Cost $7,586,231) | | | | | | | | | | | | | | | 7,586,226 | |
| | | | | | | | | | | | | | | | |
| | | | | | | | |
| Total investments in securities (Cost $823,007,819) * | | | 100.05 | % | | | 969,734,228 | |
Other assets and liabilities, net | | | (0.05 | ) | | | (516,843 | ) |
| | | | | | | | |
| Total net assets | | | 100.00 | % | | $ | 969,217,385 | |
| | | | | | | | |
| (l) | The security represents an affiliate of the Portfolio as defined in the Investment Company Act of 1940. |
| (u) | The rate represents the 7-day annualized yield at period end. |
| # | All or a portion of this security is segregated as collateral for investments in derivative instruments. |
| (z) | Zero coupon security. The rate represents the current yield to maturity. |
| * | Cost for federal income tax purposes is $845,195,142 and unrealized gains (losses) consists of: |
| | | | |
Gross unrealized gains | | $ | 155,342,113 | |
Gross unrealized losses | | | (30,803,027 | ) |
| | | | |
Net unrealized gains | | $ | 124,539,086 | |
The accompanying notes are an integral part of these financial statements.
| | | | | | |
| Portfolio of investments—November 30, 2014 (unaudited) | | Wells Fargo Advantage WealthBuilder Portfolios | | | 23 | |
WEALTHBUILDER GROWTH ALLOCATION PORTFOLIO
| | | | | | | | | | | | |
| Security name | | | | | | Shares | | | Value | |
| | | | | | | | | | | | |
| | | | |
Investment Companies: 99.36% | | | | | | | | | | | | |
| | | | |
| Affiliated Master Portfolios: 16.33% | | | | | | | | | | | | |
Wells Fargo Advantage Core Bond Portfolio | | | | | | | | | | $ | 24,845,312 | |
Wells Fargo Advantage Emerging Growth Portfolio | | | | | | | | | | | 12,742,404 | |
Wells Fargo Advantage International Growth Portfolio | | | | | | | | | | | 19,731,134 | |
Wells Fargo Advantage Small Company Value Portfolio | | | | | | | | | | | 12,097,626 | |
| | | | |
| | | | | | | | | | | 69,416,476 | |
| | | | | | | | | | | | |
| | | | |
| Alternative Investment Funds: 3.42% | | | | | | | | | | | | |
AQR Managed Futures Strategy Fund Class I | | | | | | | 201,204 | | | | 2,267,573 | |
PIMCO CommodityRealReturn Strategy Fund Institutional Class | | | | | | | 2,059,144 | | | | 10,213,355 | |
The Arbitrage Fund Class I | | | | | | | 159,136 | | | | 2,062,407 | |
| | | | |
| | | | | | | | | | | 14,543,335 | |
| | | | | | | | | | | | |
| | | | |
| International Equity Funds: 18.13% | | | | | | | | | | | | |
DFA International Small Cap Value Portfolio Institutional Class | | | | | | | 318,035 | | | | 6,173,061 | |
Dodge & Cox International Stock Fund | | | | | | | 211,646 | | | | 9,568,522 | |
Oppenheimer Developing Markets Fund Class Y | | | | | | | 206,158 | | | | 7,926,757 | |
T. Rowe Price International Discovery Fund | | | | | | | 113,067 | | | | 6,337,396 | |
Templeton Institutional Foreign Equity Fund Primary Class | | | | | | | 432,566 | | | | 9,429,946 | |
Thornburg International Value Fund Institutional Class | | | | | | | 1,035,940 | | | | 29,741,850 | |
Wells Fargo Advantage Emerging Markets Equity Fund Institutional Class (l) | | | | | | | 354,467 | | | | 7,904,606 | |
| | | | |
| | | | | | | | | | | 77,082,138 | |
| | | | | | | | | | | | |
| | | | |
| International Fixed Income Funds: 2.50% | | | | | | | | | | | | |
Oppenheimer International Bond Fund Class Y | | | | | | | 1,767,303 | | | | 10,621,492 | |
| | | | | | | | | | | | |
| | | | |
| U.S. Equity Funds: 50.63% | | | | | | | | | | | | |
American Century Growth Fund Institutional Class | | | | | | | 568,211 | | | | 20,995,397 | |
Invesco Growth and Income Fund Class R6 | | | | | | | 835,326 | | | | 24,650,481 | |
MFS Value Fund Class I | | | | | | | 1,388,519 | | | | 50,083,879 | |
Oakmark Fund Class I | | | | | | | 348,497 | | | | 24,781,591 | |
Royce Pennsylvania Mutual Fund Investor Class | | | | | | | 833,708 | | | | 12,055,420 | |
T. Rowe Price Blue Chip Growth Fund Retail Class | | | | | | | 414,612 | | | | 29,665,486 | |
Voya Global Real Estate Fund Class I | | | | | | | 374,587 | | | | 7,652,811 | |
Wells Fargo Advantage Endeavor Select Fund Institutional Class (l) | | | | | | | 1,069,006 | | | | 16,783,398 | |
Wells Fargo Advantage Large Cap Growth Fund Institutional Class (l) | | | | | | | 341,985 | | | | 16,764,125 | |
Wells Fargo Advantage Small Cap Value Fund Institutional Class (l) | | | | | | | 338,314 | | | | 11,810,545 | |
| | | | |
| | | | | | | | | | | 215,243,133 | |
| | | | | | | | | | | | |
| | | | |
| U.S. Fixed Income Funds: 8.35% | | | | | | | | | | | | |
PIMCO High Yield Fund Institutional Class | | | | | | | 1,117,747 | | | | 10,640,947 | |
Wells Fargo Advantage Government Securities Fund Institutional Class (l) | | | | | | | 2,213,432 | | | | 24,834,703 | |
| | | | |
| | | | | | | | | | | 35,475,650 | |
| | | | | | | | | | | | |
| | | | |
Total Investment Companies (Cost $349,547,445) | | | | | | | | | | | 422,382,224 | |
| | | | | | | | | | | | |
The accompanying notes are an integral part of these financial statements.
| | | | |
| 24 | | Wells Fargo Advantage WealthBuilder Portfolios | | Portfolio of investments—November 30, 2014 (unaudited) |
WEALTHBUILDER GROWTH ALLOCATION PORTFOLIO
| | | | | | | | | | | | | | | | |
| Security name | | Yield | | | | | | Shares | | | Value | |
| | | | | | | | | | | | | | | | |
| Short-Term Investments: 0.71% | | | | | | | | | | | | | | | | |
| | | | |
| Investment Companies: 0.23% | | | | | | | | | | | | | | | | |
Wells Fargo Advantage Cash Investment Money Market Fund, Select Class (l)(u) | | | 0.08 | % | | | | | | | 966,950 | | | $ | 966,950 | |
| | | | | | | | | | | | | | | | |
| | | | |
| | | | | | Maturity date | | | Principal | | | | |
| U.S. Treasury Securities : 0.48% | | | | | | | | | | | | | | | | |
U.S. Treasury Bill #(z) | | | 0.02 | | | | 12-4-2014 | | | $ | 655,000 | | | | 654,998 | |
U.S. Treasury Bill #(z) | | | 0.02 | | | | 12-11-2014 | | | | 1,380,000 | | | | 1,379,992 | |
| | | | |
| | | | | | | | | | | | | | | 2,034,990 | |
| | | | | | | | | | | | | | | | |
| | | | |
Total Short-Term Investments (Cost $3,001,943) | | | | | | | | | | | | | | | 3,001,940 | |
| | | | | | | | | | | | | | | | |
| | | | | | | | |
| Total investments in securities (Cost $352,549,388) * | | | 100.07 | % | | | 425,384,164 | |
Other assets and liabilities, net | | | (0.07 | ) | | | (301,905 | ) |
| | | | | | | | |
| Total net assets | | | 100.00 | % | | $ | 425,082,259 | |
| | | | | | | | |
| (l) | The security represents an affiliate of the Portfolio as defined in the Investment Company Act of 1940. |
| (u) | The rate represents the 7-day annualized yield at period end. |
| # | All or a portion of this security is segregated as collateral for investments in derivative instruments. |
| (z) | Zero coupon security. The rate represents the current yield to maturity. |
| * | Cost for federal income tax purposes is $360,059,707 and unrealized gains (losses) consists of: |
| | | | |
Gross unrealized gains | | $ | 76,778,608 | |
Gross unrealized losses | | | (11,454,151 | ) |
| | | | |
Net unrealized gains | | $ | 65,324,457 | |
The accompanying notes are an integral part of these financial statements.
| | | | | | |
| Portfolio of investments—November 30, 2014 (unaudited) | | Wells Fargo Advantage WealthBuilder Portfolios | | | 25 | |
WEALTHBUILDER EQUITY PORTFOLIO
| | | | | | | | | | | | | | |
| Security name | | | | | | | Shares | | | Value | |
| | | | | | | | | | | | | | |
| | | | |
Investment Companies: 99.90% | | | | | | | | | | | | | | |
| | | | |
| Affiliated Master Portfolios: 11.03% | | | | | | | | | | | | | | |
Wells Fargo Advantage Emerging Growth Portfolio | | | | | | | | | | | | $ | 3,469,370 | |
Wells Fargo Advantage International Growth Portfolio | | | | | | | | | | | | | 8,431,553 | |
Wells Fargo Advantage Small Company Value Portfolio | | | | | | | | | | | | | 3,410,445 | |
| | | | |
| | | | | | | | | | | | | 15,311,368 | |
| | | | | | | | | | | | | | |
| | | | |
| International Equity Funds: 23.81% | | | | | | | | | | | | | | |
DFA International Small Cap Value Portfolio Institutional Class | | | | | | | | | 139,904 | | | | 2,715,538 | |
Dodge & Cox International Stock Fund | | | | | | | | | 91,716 | | | | 4,146,499 | |
Oppenheimer Developing Markets Fund Class Y | | | | | | | | | 87,904 | | | | 3,379,917 | |
T. Rowe Price International Discovery Fund | | | | | | | | | 48,853 | | | | 2,738,239 | |
Templeton Institutional Foreign Equity Fund Primary Class | | | | | | | | | 189,310 | | | | 4,126,968 | |
Thornburg International Value Fund Institutional Class | | | | | | | | | 436,932 | | | | 12,544,320 | |
Wells Fargo Advantage Emerging Markets Equity Fund Institutional Class (l) | | | | | | | | | 152,252 | | | | 3,395,228 | |
| | | | |
| | | | | | | | | | | | | 33,046,709 | |
| | | | | | | | | | | | | | |
| | | | |
| U.S. Equity Funds: 65.06% | | | | | | | | | | | | | | |
American Century Growth Fund Institutional Class | | | | | | | | | 283,735 | | | | 10,484,013 | |
Invesco Growth and Income Fund Class R6 | | | | | | | | | 350,403 | | | | 10,340,404 | |
MFS Value Fund Class I | | | | | | | | | 578,352 | | | | 20,861,175 | |
Oakmark Fund Class I | | | | | | | | | 146,185 | | | | 10,395,232 | |
Royce Pennsylvania Mutual Fund Investor Class | | | | | | | | | 235,877 | | | | 3,410,783 | |
T. Rowe Price Blue Chip Growth Fund Retail Class | | | | | | | | | 204,672 | | | | 14,644,281 | |
Wells Fargo Advantage Endeavor Select Fund Institutional Class (l) | | | | | | | | | 539,130 | | | | 8,464,338 | |
Wells Fargo Advantage Large Cap Growth Fund Institutional Class (l) | | | | | | | | | 169,932 | | | | 8,330,059 | |
Wells Fargo Advantage Small Cap Value Fund Institutional Class (l) | | | | | | | | | 96,772 | | | | 3,378,298 | |
| | | | |
| | | | | | | | | | | | | 90,308,583 | |
| | | | | | | | | | | | | | |
| | | | |
Total Investment Companies (Cost $100,523,696) | | | | | | | | | | | | | 138,666,660 | |
| | | | | | | | | | | | | | |
| | | | |
| | | Yield | | | | | | | | | |
| Short-Term Investments: 0.29% | | | | | | | | | | | | | | |
| | | | |
| Investment Companies: 0.29% | | | | | | | | | | | | | | |
Wells Fargo Advantage Cash Investment Money Market Fund, Select Class (u)(l) | | | 0.08 | % | | | | | 394,733 | | | | 394,733 | |
| | | | | | | | | | | | | | |
| | | | |
Total Short-Term Investments (Cost $394,733) | | | | | | | | | | | | | 394,733 | |
| | | | | | | | | | | | | | |
| | | | | | | | |
| Total investments in securities (Cost $100,918,429) * | | | 100.19 | % | | | 139,061,393 | |
Other assets and liabilities, net | | | (0.19 | ) | | | (258,696 | ) |
| | | | | | | | |
| Total net assets | | | 100.00 | % | | $ | 138,802,697 | |
| | | | | | | | |
| (l) | The security represents an affiliate of the Portfolio as defined in the Investment Company Act of 1940. |
| (u) | The rate represents the 7-day annualized yield at period end. |
| * | Cost for federal income tax purposes is $101,131,999 and unrealized gains (losses) consists of: |
| | | | |
Gross unrealized gains | | $ | 38,671,618 | |
Gross unrealized losses | | | (742,224 | ) |
| | | | |
Net unrealized gains | | $ | 37,929,394 | |
The accompanying notes are an integral part of these financial statements.
| | | | |
| 26 | | Wells Fargo Advantage WealthBuilder Portfolios | | Portfolio of investments—November 30, 2014 (unaudited) |
WEALTHBUILDER TACTICAL EQUITY PORTFOLIO
| | | | | | | | | | | | | | |
| Security name | | | | | | | Shares | | | Value | |
| | | | | | | | | | | | | | |
| | | | |
Investment Companies: 99.64% | | | | | | | | | | | | | | |
| | | | |
| Affiliated Master Portfolios: 13.48% | | | | | | | | | | | | | | |
Wells Fargo Advantage Emerging Growth Portfolio | | | | | | | | | | | | $ | 16,063,993 | |
Wells Fargo Advantage International Growth Portfolio | | | | | | | | | | | | | 25,874,003 | |
Wells Fargo Advantage Small Company Value Portfolio | | | | | | | | | | | | | 15,794,968 | |
| | | | |
| | | | | | | | | | | | | 57,732,964 | |
| | | | | | | | | | | | | | |
| | | | |
| International Equity Funds: 23.51% | | | | | | | | | | | | | | |
DFA International Small Cap Value Portfolio Institutional Class | | | | | | | | | 422,060 | | | | 8,192,181 | |
Dodge & Cox International Stock Fund | | | | | | | | | 278,555 | | | | 12,593,450 | |
Oppenheimer Developing Markets Fund Class Y | | | | | | | | | 266,200 | | | | 10,235,405 | |
T. Rowe Price International Discovery Fund | | | | | | | | | 149,068 | | | | 8,355,245 | |
Templeton Institutional Foreign Equity Fund Primary Class | | | | | | | | | 572,894 | | | | 12,489,094 | |
Thornburg International Value Fund Institutional Class | | | | | | | | | 1,344,235 | | | | 38,592,987 | |
Wells Fargo Advantage Emerging Markets Equity Fund Institutional Class (l) | | | | | | | | | 460,165 | | | | 10,261,690 | |
| | | | |
| | | | | | | | | | | | | 100,720,052 | |
| | | | | | | | | | | | | | |
| | | | |
| U.S. Equity Funds: 62.65% | | | | | | | | | | | | | | |
American Century Growth Fund Institutional Class | | | | | | | | | 733,127 | | | | 27,089,030 | |
Invesco Growth and Income Fund Class R6 | | | | | | | | | 1,084,475 | | | | 32,002,861 | |
MFS Value Fund Class I | | | | | | | | | 1,792,127 | | | | 64,642,035 | |
Oakmark Fund Class I | | | | | | | | | 452,527 | | | | 32,179,211 | |
Royce Pennsylvania Mutual Fund Investor Class | | | | | | | | | 1,088,979 | | | | 15,746,640 | |
T. Rowe Price Blue Chip Growth Fund Retail Class | | | | | | | | | 528,425 | | | | 37,808,828 | |
Wells Fargo Advantage Endeavor Select Fund Institutional Class (l) | | | | | | | | | 1,384,699 | | | | 21,739,781 | |
Wells Fargo Advantage Large Cap Growth Fund Institutional Class (l) | | | | | | | | | 438,879 | | | | 21,513,863 | |
Wells Fargo Advantage Small Cap Value Fund Institutional Class (l) | | | | | | | | | 446,450 | | | | 15,585,565 | |
| | | | |
| | | | | | | | | | | | | 268,307,814 | |
| | | | | | | | | | | | | | |
| | | | |
Total Investment Companies (Cost $327,743,664) | | | | | | | | | | | | | 426,760,830 | |
| | | | | | | | | | | | | | |
| | | | |
| | | Yield | | | | | | | | | |
| Short-Term Investments: 0.33% | | | | | | | | | | | | | | |
| | | | |
| Investment Companies: 0.33% | | | | | | | | | | | | | | |
Wells Fargo Advantage Cash Investment Money Market Fund, Select Class (u)(l) | | | 0.08 | % | | | | | 1,401,701 | | | | 1,401,701 | |
| | | | | | | | | | | | | | |
| | | | |
Total Short-Term Investments (Cost $1,401,701) | | | | | | | | | | | | | 1,401,701 | |
| | | | | | | | | | | | | | |
| | | | | | | | |
| Total investments in securities (Cost $329,145,365) * | | | 99.97 | % | | | 428,162,531 | |
Other assets and liabilities, net | | | 0.03 | | | | 114,431 | |
| | | | | | | | |
| Total net assets | | | 100.00 | % | | $ | 428,276,962 | |
| | | | | | | | |
| (l) | The security represents an affiliate of the Portfolio as defined in the Investment Company Act of 1940. |
| (u) | The rate represents the 7-day annualized yield at period end. |
| * | Cost for federal income tax purposes is $337,170,494 and unrealized gains (losses) consists of: |
| | | | |
Gross unrealized gains | | $ | 99,017,166 | |
Gross unrealized losses | | | (8,025,129 | ) |
| | | | |
Net unrealized gains | | $ | 90,992,037 | |
The accompanying notes are an integral part of these financial statements.
This page is intentionally left blank.
| | | | |
| 28 | | Wells Fargo Advantage WealthBuilder Portfolios | | Statements of assets and liabilities—November 30, 2014 (unaudited) |
| | | | | | | | |
| | | WealthBuilder
Conservative
Allocation
Portfolio | | | WealthBuilder
Moderate
Balanced
Portfolio | |
| | |
Assets | | | | | | | | |
Investments | | | | | | | | |
In unaffiliated Underlying Funds and securities, at value (see cost below) | | $ | 169,191,295 | | | $ | 386,855,772 | |
In affiliated Underlying Funds, at value (see cost below) | | | 236,940,122 | | | | 290,554,471 | |
In affiliated Master Portfolios, at value (see cost below) | | | 150,065,577 | | | | 204,554,792 | |
| | | | |
Total investments, at value (see cost below) | | | 556,196,994 | | | | 881,965,035 | |
Cash | | | 0 | | | | 0 | |
Receivable for investments sold | | | 120,523 | | | | 804,436 | |
Receivable for Portfolio shares sold | | | 1,707,914 | | | | 2,026,086 | |
Receivable for dividends | | | 457,433 | | | | 578,250 | |
Prepaid expenses and other assets | | | 37,729 | | | | 57,817 | |
| | | | |
Total assets | | | 558,520,593 | | | | 885,431,624 | |
| | | | |
| | |
Liabilities | | | | | | | | |
Payable for investments purchased | | | 428,429 | | | | 541,205 | |
Payable for Portfolio shares redeemed | | | 706,171 | | | | 2,081,149 | |
Payable for daily variation margin on open futures contracts | | | 101,750 | | | | 319,375 | |
Advisory fee payable | | | 69,737 | | | | 111,868 | |
Distribution fee payable | | | 344,165 | | | | 542,336 | |
Administration fee payable | | | 142,255 | | | | 224,166 | |
Shareholder servicing fees payable | | | 114,722 | | | | 180,469 | |
Accrued expenses and other liabilities | | | 33,210 | | | | 47,983 | |
| | | | |
Total liabilities | | | 1,940,439 | | | | 4,048,551 | |
| | | | |
Total net assets | | $ | 556,580,154 | | | $ | 881,383,073 | |
| | | | |
| | |
NET ASSETS CONSIST OF | | | | | | | | |
Paid-in capital | | $ | 510,049,974 | | | $ | 770,724,026 | |
Undistributed (overdistributed) or (accumulated) net investment income (loss) | | | 54,686 | | | | (130,248 | ) |
Accumulated net realized gains (losses) on investments | | | 5,432,858 | | | | 19,087,964 | |
Net unrealized gains on investments | | | 41,042,636 | | | | 91,701,331 | |
| | | | |
Total net assets | | $ | 556,580,154 | | | $ | 881,383,073 | |
| | | | |
| | |
COMPUTATION OF NET ASSET VALUE AND OFFERING PRICE PER SHARE | | | | | | | | |
Net assets | | $ | 556,580,154 | | | $ | 881,383,073 | |
Shares outstanding1 | | | 50,525,628 | | | | 70,958,185 | |
Net asset value per share | | | $11.02 | | | | $12.42 | |
Maximum offering price per share2 | | | $11.19 | | | | $12.61 | |
| | |
Investments in unaffiliated Underlying Funds and securities, at cost | | $ | 142,394,564 | | | $ | 322,123,420 | |
| | | | |
Investments in affiliated Underlying Funds, at cost | | $ | 226,032,863 | | | $ | 269,177,853 | |
| | | | |
Investments in affiliated Master Portfolios, at cost | | $ | 147,609,141 | | | $ | 201,771,433 | |
| | | | |
Total investments, at cost | | $ | 516,036,568 | | | $ | 793,072,706 | |
| | | | |
| 1. | Each Portfolio has an unlimited number of authorized shares. |
| 2. | Maximum offering price is computed as 100/98.50 of net asset value. On investments of $50,000 or more, the offering price is reduced. |
The accompanying notes are an integral part of these financial statements.
| | | | | | |
| Statements of assets and liabilities—November 30, 2014 (unaudited) | | Wells Fargo Advantage WealthBuilder Portfolios | | | 29 | |
| | | | | | | | | | | | | | |
WealthBuilder
Growth
Balanced
Portfolio | | | WealthBuilder
Growth
Allocation
Portfolio | | | WealthBuilder
Equity
Portfolio | | | WealthBuilder
Tactical
Equity
Portfolio | |
| | | |
| | | | | | | | | | | | | | |
| | | | | | | | | | | | | | |
| $ | 559,649,316 | | | $ | 276,903,361 | | | $ | 99,787,369 | | | $ | 299,926,967 | |
| | 218,635,571 | | | | 79,064,327 | | | | 23,962,656 | | | | 70,502,600 | |
| | 191,449,341 | | | | 69,416,476 | | | | 15,311,368 | | | | 57,732,964 | |
| | |
| | 969,734,228 | | | | 425,384,164 | | | | 139,061,393 | | | | 428,162,531 | |
| | 0 | | | | 167,544 | | | | 0 | | | | 306,333 | |
| | 0 | | | | 0 | | | | 5,267 | | | | 291,966 | |
| | 1,909,323 | | | | 995,626 | | | | 119,446 | | | | 601,556 | |
| | 441,911 | | | | 95,995 | | | | 0 | | | | 0 | |
| | 49,526 | | | | 31,080 | | | | 18,782 | | | | 30,653 | |
| | |
| | 972,134,988 | | | | 426,674,409 | | | | 139,204,888 | | | | 429,393,039 | |
| | |
| | | |
| | | | | | | | | | | | | | |
| | 510,988 | | | | 257,073 | | | | 0 | | | | 0 | |
| | 851,581 | | | | 636,165 | | | | 219,259 | | | | 570,658 | |
| | 349,500 | | | | 151,250 | | | | 0 | | | | 0 | |
| | 125,910 | | | | 49,257 | | | | 10,600 | | | | 50,513 | |
| | 592,953 | | | | 258,419 | | | | 84,929 | | | | 261,416 | |
| | 245,087 | | | | 106,813 | | | | 35,104 | | | | 108,052 | |
| | 197,135 | | | | 86,140 | | | | 28,310 | | | | 87,138 | |
| | 44,449 | | | | 47,033 | | | | 23,989 | | | | 38,300 | |
| | |
| | 2,917,603 | | | | 1,592,150 | | | | 402,191 | | | | 1,116,077 | |
| | |
| $ | 969,217,385 | | | $ | 425,082,259 | | | $ | 138,802,697 | | | $ | 428,276,962 | |
| | |
| | | |
| | | | | | | | | | | | | | |
| $ | 808,762,102 | | | $ | 340,120,985 | | | $ | 115,740,884 | | | $ | 410,163,993 | |
| | (1,115,427 | ) | | | (1,077,864 | ) | | | (1,006,280 | ) | | | (3,212,721 | ) |
| | 11,900,215 | | | | 11,980,607 | | | | (14,074,871 | ) | | | (77,691,476 | ) |
| | 149,670,495 | | | | 74,058,531 | | | | 38,142,964 | | | | 99,017,166 | |
| | |
| $ | 969,217,385 | | | $ | 425,082,259 | | | $ | 138,802,697 | | | $ | 428,276,962 | |
| | |
| | | |
| | | | | | | | | | | | | | |
| $ | 969,217,385 | | | $ | 425,082,259 | | | $ | 138,802,697 | | | $ | 428,276,962 | |
| | 65,679,855 | | | | 27,972,289 | | | | 8,963,915 | | | | 22,926,571 | |
| | $14.76 | | | | $15.20 | | | | $15.48 | | | | $18.68 | |
| | $14.98 | | | | $15.43 | | | | $15.72 | | | | $18.96 | |
| | | |
| $ | 447,986,940 | | | $ | 220,091,744 | | | $ | 70,387,885 | | | $ | 222,003,633 | |
| | |
| $ | 185,587,416 | | | $ | 63,504,584 | | | $ | 16,102,062 | | | $ | 49,419,770 | |
| | |
| $ | 189,433,463 | | | $ | 68,953,060 | | | $ | 14,428,482 | | | $ | 57,721,962 | |
| | |
| $ | 823,007,819 | | | $ | 352,549,388 | | | $ | 100,918,429 | | | $ | 329,145,365 | |
| | |
The accompanying notes are an integral part of these financial statements.
| | | | |
| 30 | | Wells Fargo Advantage WealthBuilder Portfolios | | Statements of operations—six months ended November 30, 2014 (unaudited) |
| | | | | | | | |
| | | WealthBuilder
Conservative
Allocation
Portfolio | | | WealthBuilder
Moderate
Balanced Portfolio | |
| | |
Investment income | | | | | | | | |
Dividends from affiliated Underlying Funds | | $ | 1,511,004 | | | $ | 1,567,578 | |
Dividends from unaffiliated Underlying Funds | | | 1,992,294 | | | | 3,491,504 | |
Interest allocated from affiliated Master Portfolios | | | 1,502,982 | | | | 1,701,406 | |
Dividends allocated from affiliated Master Portfolios* | | | 67,858 | | | | 206,968 | |
Securities lending income allocated from affiliated Master Portfolios | | | 8,611 | | | | 14,578 | |
Interest | | | 123 | | | | 366 | |
Expenses allocated from affiliated Master Portfolios | | | (311,668 | ) | | | (480,800 | ) |
Waivers allocated from affiliated Master Portfolios | | | 16,204 | | | | 18,326 | |
| | | | |
Total investment income | | | 4,787,408 | | | | 6,519,926 | |
| | | | |
| | |
Expenses | | | | | | | | |
Advisory fee | | | 571,089 | | | | 873,392 | |
Administration fee | | | 885,188 | | | | 1,353,758 | |
Shareholder servicing fees | | | 712,966 | | | | 1,091,431 | |
Distribution fee | | | 2,141,583 | | | | 3,275,221 | |
Custody and accounting fees | | | 38,658 | | | | 41,572 | |
Professional fees | | | 14,737 | | | | 14,263 | |
Registration fees | | | 20,264 | | | | 37,752 | |
Shareholder report expenses | | | 17,281 | | | | 40,721 | |
Trustees’ fees and expenses | | | 6,596 | | | | 6,346 | |
Interest expense | | | 446 | | | | 0 | |
Other fees and expenses | | | 8,602 | | | | 15,993 | |
| | | | |
Total expenses | | | 4,417,410 | | | | 6,750,449 | |
Less: Fee waivers and/or expense reimbursements | | | (133,797 | ) | | | (200,007 | ) |
| | | | |
Net expenses | | | 4,283,613 | | | | 6,550,442 | |
| | | | |
Net investment income (loss) | | | 503,795 | | | | (30,516 | ) |
| | | | |
| | |
REALIZED AND UNREALIZED GAINS (LOSSES) ON INVESTMENTS | | | | | | | | |
| | |
Net realized gains (losses) on: | | | | | | | | |
Unaffiliated Underlying Funds | | | 4,930,625 | | | | 10,660,061 | |
Affiliated Underlying Funds | | | (1,163,042 | ) | | | (1,148,937 | ) |
Futures transactions | | | 904,752 | | | | 2,688,628 | |
Capital gain distributions from unaffiliated Underlying Funds | | | 813,952 | | | | 2,568,825 | |
Securities transactions allocated from affiliated Master Portfolios | | | 1,864,083 | | | | 2,893,606 | |
| | | | |
Net realized gains on investments | | | 7,350,370 | | | | 17,662,183 | |
| | | | |
| | |
Net change in unrealized gains (losses) on: | | | | | | | | |
Unaffiliated Underlying Funds | | | (6,722,894 | ) | | | (10,243,300 | ) |
Affiliated Underlying Funds | | | 3,406,611 | | | | 5,163,057 | |
Futures transactions | | | 356,491 | | | | 1,230,182 | |
Securities transactions allocated from affiliated Master Portfolios | | | 451,285 | | | | 987,762 | |
| | | | |
Net change in unrealized gains (losses) on investments | | | (2,508,507 | ) | | | (2,862,299 | ) |
| | | | |
Net realized and unrealized gains (losses) on investments | | | 4,841,863 | | | | 14,799,884 | |
| | | | |
Net increase in net assets resulting from operations | | $ | 5,345,658 | | | $ | 14,769,368 | |
| | | | |
| | |
* Net of foreign dividend withholding taxes allocated from affiliated Master Portfolios in the amount of | | | $5,390 | | | | $16,394 | |
The accompanying notes are an integral part of these financial statements.
| | | | | | |
| Statements of operations—six months ended November 30, 2014 (unaudited) | | Wells Fargo Advantage WealthBuilder Portfolios | | | 31 | |
| | | | | | | | | | | | | | |
WealthBuilder
Growth
Balanced
Portfolio | | | WealthBuilder
Growth
Allocation
Portfolio | | | WealthBuilder
Equity
Portfolio | | | WealthBuilder
Tactical Equity
Portfolio | |
| | | |
| | | | | | | | | | | | | | |
| $ | 721,900 | | | $ | 143,118 | | | $ | 106 | | | $ | 625 | |
| | 4,284,057 | | | | 1,653,944 | | | | 456,565 | | | | 1,418,935 | |
| | 1,278,992 | | | | 276,239 | | | | 0 | | | | 0 | |
| | 344,303 | | | | 192,885 | | | | 72,062 | | | | 261,713 | |
| | 18,415 | | | | 8,509 | | | | 2,427 | | | | 9,709 | |
| | 392 | | | | 166 | | | | 0 | | | | 0 | |
| | (547,540 | ) | | | (235,332 | ) | | | (67,808 | ) | | | (252,747 | ) |
| | 13,769 | | | | 2,950 | | | | 0 | | | | 0 | |
| | |
| | 6,114,288 | | | | 2,042,479 | | | | 463,352 | | | | 1,438,235 | |
| | |
| | | |
| | | | | | | | | | | | | | |
| | 948,023 | | | | 410,414 | | | | 136,398 | | | | 422,279 | |
| | 1,469,435 | | | | 636,141 | | | | 211,417 | | | | 654,532 | |
| | 1,184,091 | | | | 513,017 | | | | 170,108 | | | | 527,849 | |
| | 3,555,085 | | | | 1,539,052 | | | | 511,493 | | | | 1,583,546 | |
| | 42,553 | | | | 38,553 | | | | 16,753 | | | | 29,406 | |
| | 14,640 | | | | 14,245 | | | | 14,349 | | | | 14,245 | |
| | 35,394 | | | | 12,119 | | | | 13,089 | | | | 15,752 | |
| | 41,083 | | | | 21,256 | | | | 12,096 | | | | 23,101 | |
| | 6,745 | | | | 5,900 | | | | 5,890 | | | | 6,461 | |
| | 0 | | | | 0 | | | | 0 | | | | 244 | |
| | 9,954 | | | | 6,116 | | | | 4,025 | | | | 6,347 | |
| | |
| | 7,307,003 | | | | 3,196,813 | | | | 1,095,618 | | | | 3,283,762 | |
| | (196,834 | ) | | | (118,710 | ) | | | (72,632 | ) | | | (116,426 | ) |
| | |
| | 7,110,169 | | | | 3,078,103 | | | | 1,022,986 | | | | 3,167,336 | |
| | |
| | (995,881 | ) | | | (1,035,624 | ) | | | (559,634 | ) | | | (1,729,101 | ) |
| | |
| | | |
| | | | | | | | | | | | | | |
| | | |
| | | | | | | | | | | | | | |
| | 16,285,902 | | | | 7,822,004 | | | | 4,844,857 | | | | 12,831,387 | |
| | 114,774 | | | | 33,439 | | | | 71,561 | | | | 21,048 | |
| | 2,861,986 | | | | 1,229,020 | | | | 0 | | | | 0 | |
| | 4,306,275 | | | | 2,402,140 | | | | 1,027,889 | | | | 3,152,876 | |
| | 3,681,684 | | | | 1,502,160 | | | | 787,647 | | | | 2,121,696 | |
| | |
| | 27,250,621 | | | | 12,988,763 | | | | 6,731,954 | | | | 18,127,007 | |
| | |
| | | |
| | | | | | | | | | | | | | |
| | (11,960,016 | ) | | | (4,226,686 | ) | | | (2,021,489 | ) | | | (5,704,999 | ) |
| | 5,489,725 | | | | 2,441,265 | | | | 1,123,812 | | | | 2,708,666 | |
| | 1,242,189 | | | | 505,688 | | | | 0 | | | | 0 | |
| | 925,697 | | | | 611,789 | | | | (195,018 | ) | | | 236,462 | |
| | |
| | (4,302,405 | ) | | | (667,944 | ) | | | (1,092,695 | ) | | | (2,759,871 | ) |
| | |
| | 22,948,216 | | | | 12,320,819 | | | | 5,639,259 | | | | 15,367,136 | |
| | |
| $ | 21,952,335 | | | $ | 11,285,195 | | | $ | 5,079,625 | | | $ | 13,638,035 | |
| | |
| | | |
| | $27,094 | | | | $15,139 | | | | $6,633 | | | | $20,410 | |
The accompanying notes are an integral part of these financial statements.
| | | | |
| 32 | | Wells Fargo Advantage WealthBuilder Portfolios | | Statements of changes in net assets |
| | | | | | | | | | | | | | | | |
| | | WealthBuilder Conservative Allocation Portfolio | |
| | | Six months ended
November 30, 2014
(unaudited) | | | Year ended
May 31, 2014 | |
| | | | |
Operations | | | | | | | | | | | | | | | | |
Net investment income | | | | | | $ | 503,795 | | | | | | | $ | 1,922,305 | |
Net realized gains on investments | | | | | | | 7,350,370 | | | | | | | | 14,263,314 | |
Net change in unrealized gains (losses) on investments | | | | | | | (2,508,507 | ) | | | | | | | 8,392,129 | |
| | | | |
Net increase in net assets resulting from operations | | | | | | | 5,345,658 | | | | | | | | 24,577,748 | |
| | | | |
| | | | |
Distributions to shareholders from | | | | | | | | | | | | | | | | |
Net investment income | | | | | | | (454,457 | ) | | | | | | | (2,575,184 | ) |
Net realized gains | | | | | | | 0 | | | | | | | | (23,468,739 | ) |
| | | | |
Total distributions to shareholders | | | | | | | (454,457 | ) | | | | | | | (26,043,923 | ) |
| | | | |
| | | | |
Capital share transactions | | | Shares | | | | | | | | Shares | | | | | |
Proceeds from shares sold | | | 5,149,498 | | | | 56,272,791 | | | | 10,056,730 | | | | 109,055,405 | |
Reinvestment of distributions | | | 41,503 | | | | 452,581 | | | | 2,436,686 | | | | 25,988,027 | |
Payment for shares redeemed | | | (7,869,730 | ) | | | (85,973,019 | ) | | | (19,568,052 | ) | | | (212,617,956 | ) |
| | | | |
Net decrease in net assets resulting from capital share transactions | | | | | | | (29,247,647 | ) | | | | | | | (77,574,524 | ) |
| | | | |
Total decrease in net assets | | | | | | | (24,356,446 | ) | | | | | | | (79,040,699 | ) |
| | | | |
| | | | |
Net assets | | | | | | | | | | | | | | | | |
Beginning of period | | | | | | | 580,936,600 | | | | | | | | 659,977,299 | |
| | | | |
End of period | | | | | | $ | 556,580,154 | | | | | | | $ | 580,936,600 | |
| | | | |
Undistributed net investment income | | | | | | $ | 54,686 | | | | | | | $ | 5,348 | |
| | | | |
The accompanying notes are an integral part of these financial statements.
| | | | | | |
| Statements of changes in net assets | | Wells Fargo Advantage WealthBuilder Portfolios | | | 33 | |
| | | | | | | | | | | | | | | | |
| | | WealthBuilder Moderate Balanced Portfolio | |
| | | Six months ended
November 30, 2014
(unaudited) | | | Year ended
May 31, 2014 | |
| | | | |
Operations | | | | | | | | | | | | | | | | |
Net investment income (loss) | | | | | | $ | (30,516 | ) | | | | | | $ | 1,442,504 | |
Net realized gains on investments | | | | | | | 17,662,183 | | | | | | | | 33,305,747 | |
Net change in unrealized gains (losses) on investments | | | | | | | (2,862,299 | ) | | | | | | | 28,661,373 | |
| | | | |
Net increase in net assets resulting from operations | | | | | | | 14,769,368 | | | | | | | | 63,409,624 | |
| | | | |
| | | | |
Distributions to shareholders from | | | | | | | | | | | | | | | | |
Net investment income | | | | | | | 0 | | | | | | | | (2,786,020 | ) |
Net realized gains | | | | | | | 0 | | | | | | | | (47,081,373 | ) |
| | | | |
Total distributions to shareholders | | | | | | | 0 | | | | | | | | (49,867,393 | ) |
| | | | |
| | | | |
Capital share transactions | | | Shares | | | | | | | | Shares | | | | | |
Proceeds from shares sold | | | 6,927,218 | | | | 84,956,350 | | | | 15,090,262 | | | | 183,334,200 | |
Reinvestment of distributions | | | 0 | | | | 0 | | | | 4,212,471 | | | | 49,797,264 | |
Payment for shares redeemed | | | (6,990,169 | ) | | | (85,669,277 | ) | | | (14,712,825 | ) | | | (178,597,796 | ) |
| | | | |
Net increase (decrease) in net assets resulting from capital share transactions | | | | | | | (712,927 | ) | | | | | | | 54,533,668 | |
| | | | |
Total increase in net assets | | | | | | | 14,056,441 | | | | | | | | 68,075,899 | |
| | | | |
| | | | |
Net assets | | | | | | | | | | | | | | | | |
Beginning of period | | | | | | | 867,326,632 | | | | | | | | 799,250,733 | |
| | | | |
End of period | | | | | | $ | 881,383,073 | | | | | | | $ | 867,326,632 | |
| | | | |
Overdistributed/accumulated net investment income (loss) | | | | | | $ | (130,248 | ) | | | | | | $ | (99,732 | ) |
| | | | |
The accompanying notes are an integral part of these financial statements.
| | | | |
| 34 | | Wells Fargo Advantage WealthBuilder Portfolios | | Statements of changes in net assets |
| | | | | | | | | | | | | | | | |
| | | WealthBuilder Growth Balanced Portfolio | |
| | | Six months ended
November 30, 2014
(unaudited) | | | Year ended
May 31, 2014 | |
| | | | |
Operations | | | | | | | | | | | | | | | | |
Net investment income (loss) | | | | | | $ | (995,881 | ) | | | | | | $ | 314,386 | |
Net realized gains on investments | | | | | | | 27,250,621 | | | | | | | | 49,040,673 | |
Net change in unrealized gains (losses) on investments | | | | | | | (4,302,405 | ) | | | | | | | 47,732,300 | |
| | | | |
Net increase in net assets resulting from operations | | | | | | | 21,952,335 | | | | | | | | 97,087,359 | |
| | | | |
| |
Distributions to shareholders from | | | | |
Net investment income | | | | | | | 0 | | | | | | | | (2,254,368 | ) |
| | | | |
| | | | |
Capital share transactions | | | Shares | | | | | | | | Shares | | | | | |
Proceeds from shares sold | | | 5,491,525 | | | | 79,613,780 | | | | 13,489,194 | | | | 185,885,140 | |
Reinvestment of distributions | | | 0 | | | | 0 | | | | 159,741 | | | | 2,252,344 | |
Payment for shares redeemed | | | (4,756,711 | ) | | | (68,941,431 | ) | | | (9,808,510 | ) | | | (134,662,900 | ) |
| | | | |
Net increase in net assets resulting from capital share transactions | | | | | | | 10,672,349 | | | | | | | | 53,474,584 | |
| | | | |
Total increase in net assets | | | | | | | 32,624,684 | | | | | | | | 148,307,575 | |
| | | | |
| | | | |
Net assets | | | | | | | | | | | | | | | | |
Beginning of period | | | | | | | 936,592,701 | | | | | | | | 788,285,126 | |
| | | | |
End of period | | | | | | $ | 969,217,385 | | | | | | | $ | 936,592,701 | |
| | | | |
Overdistributed/accumulated net investment income (loss) | | | | | | $ | (1,115,427 | ) | | | | | | $ | (119,546 | ) |
| | | | |
The accompanying notes are an integral part of these financial statements.
| | | | | | |
| Statements of changes in net assets | | Wells Fargo Advantage WealthBuilder Portfolios | | | 35 | |
| | | | | | | | | | | | | | | | |
| | | WealthBuilder Growth Allocation Portfolio | |
| | | Six months ended
November 30, 2014
(unaudited) | | | Year ended
May 31, 2014 | |
| | | | |
Operations | | | | | | | | | | | | | | | | |
Net investment loss | | | | | | $ | (1,035,624 | ) | | | | | | $ | (702,253 | ) |
Net realized gains on investments | | | | | | | 12,988,763 | | | | | | | | 21,676,743 | |
Net change in unrealized gains (losses) on investments | | | | | | | (667,944 | ) | | | | | | | 26,671,747 | |
| | | | |
Net increase in net assets resulting from operations | | | | | | | 11,285,195 | | | | | | | | 47,646,237 | |
| | | | |
| | | | |
Distributions to shareholders from | | | | | | | | | | | | | | | | |
Net investment income | | | | | | | 0 | | | | | | | | (43,287 | ) |
Net realized gains | | | | | | | 0 | | | | | | | | (4,017,022 | ) |
| | | | |
Total distributions to shareholders | | | | | | | 0 | | | | | | | | (4,060,309 | ) |
| | | | |
| | | | |
Capital share transactions | | | Shares | | | | | | | | Shares | | | | | |
Proceeds from shares sold | | | 2,736,296 | | | | 40,812,851 | | | | 5,796,666 | | | | 82,027,261 | |
Reinvestment of distributions | | | 0 | | | | 0 | | | | 287,901 | | | | 4,051,991 | |
Payment for shares redeemed | | | (1,970,748 | ) | | | (29,253,449 | ) | | | (3,707,919 | ) | | | (52,150,247 | ) |
| | | | |
Net increase in net assets resulting from capital share transactions | | | | | | | 11,559,402 | | | | | | | | 33,929,005 | |
| | | | |
Total increase in net assets | | | | | | | 22,844,597 | | | | | | | | 77,514,933 | |
| | | | |
| | | | |
Net assets | | | | | | | | | | | | | | | | |
Beginning of period | | | | | | | 402,237,662 | | | | | | | | 324,722,729 | |
| | | | |
End of period | | | | | | $ | 425,082,259 | | | | | | | $ | 402,237,662 | |
| | | | |
Accumulated net investment loss | | | | | | $ | (1,077,864 | ) | | | | | | $ | (42,240 | ) |
| | | | |
The accompanying notes are an integral part of these financial statements.
| | | | |
| 36 | | Wells Fargo Advantage WealthBuilder Portfolios | | Statements of changes in net assets |
| | | | | | | | | | | | | | | | |
| | | WealthBuilder Equity Portfolio | |
| | | Six months ended
November 30, 2014
(unaudited) | | | Year ended
May 31, 2014 | |
| | | | |
Operations | | | | | | | | | | | | | | | | |
Net investment loss | | | | | | $ | (559,634 | ) | | | | | | $ | (698,344 | ) |
Net realized gains on investments | | | | | | | 6,731,954 | | | | | | | | 8,097,766 | |
Net change in unrealized gains (losses) on investments | | | | | | | (1,092,695 | ) | | | | | | | 12,397,639 | |
| | | | |
Net increase in net assets resulting from operations | | | | | | | 5,079,625 | | | | | | | | 19,797,061 | |
| | | | |
| | | | |
Capital share transactions | | | Shares | | | | | | | | Shares | | | | | |
Proceeds from shares sold | | | 563,298 | | | | 8,413,546 | | | | 1,836,620 | | | | 26,018,840 | |
Payment for shares redeemed | | | (850,054 | ) | | | (12,827,040 | ) | | | (2,094,333 | ) | | | (29,567,549 | ) |
| | | | |
Net decrease in net assets resulting from capital share transactions | | | | | | | (4,413,494 | ) | | | | | | | (3,548,709 | ) |
| | | | |
Total increase in net assets | | | | | | | 666,131 | | | | | | | | 16,248,352 | |
| | | | |
| | | | |
Net assets | | | | | | | | | | | | | | | | |
Beginning of period | | | | | | | 138,136,566 | | | | | | | | 121,888,214 | |
| | | | |
End of period | | | | | | $ | 138,802,697 | | | | | | | $ | 138,136,566 | |
| | | | |
Accumulated net investment loss | | | | | | $ | (1,006,280 | ) | | | | | | $ | (446,646 | ) |
| | | | |
The accompanying notes are an integral part of these financial statements.
| | | | | | |
| Statements of changes in net assets | | Wells Fargo Advantage WealthBuilder Portfolios | | | 37 | |
| | | | | | | | | | | | | | | | |
| | | WealthBuilder Tactical Equity Portfolio | |
| | | Six months ended November 30, 2014 (unaudited) | | | Year ended May 31, 2014 | |
| | | | |
Operations | | | | | | | | | | | | | | | | |
Net investment loss | | | | | | $ | (1,729,101 | ) | | | | | | $ | (1,766,475 | ) |
Net realized gains on investments | | | | | | | 18,127,007 | | | | | | | | 23,788,503 | |
Net change in unrealized gains (losses) on investments | | | | | | | (2,759,871 | ) | | | | | | | 35,395,782 | |
| | | | |
Net increase in net assets resulting from operations | | | | | | | 13,638,035 | | | | | | | | 57,417,810 | |
| | | | |
| | | | |
Capital share transactions | | | Shares | | | | | | | | Shares | | | | | |
Proceeds from shares sold | | | 1,915,960 | | | | 35,059,872 | | | | 4,165,113 | | | | 71,353,382 | |
Payment for shares redeemed | | | (2,336,352 | ) | | | (42,370,440 | ) | | | (4,611,575 | ) | | | (78,155,419 | ) |
| | | | |
Net decrease in net assets resulting from capital share transactions | | | | | | | (7,310,568 | ) | | | | | | | (6,802,037 | ) |
| | | | |
Total increase in net assets | | | | | | | 6,327,467 | | | | | | | | 50,615,773 | |
| | | | |
| | | | |
Net assets | | | | | | | | | | | | | | | | |
Beginning of period | | | | | | | 421,949,495 | | | | | | | | 371,333,722 | |
| | | | |
End of period | | | | | | $ | 428,276,962 | | | | | | | $ | 421,949,495 | |
| | | | |
Accumulated net investment loss | | | | | | $ | (3,212,721 | ) | | | | | | $ | (1,483,620 | ) |
| | | | |
The accompanying notes are an integral part of these financial statements.
| | | | |
| 38 | | Wells Fargo Advantage WealthBuilder Portfolios | | Financial highlights |
| | | | | | | | | | | | | | | | | | | | | | | | |
| | | Beginning
net asset
value per
share | | | Net
investment
income
(loss)1 | | | Net realized
and unrealized
gains (losses)
on investments | | | Distributions
from net
investment
income | | | Distributions
from net
realized gains | | | Ending
net asset
value per
share | |
WealthBuilder Conservative Allocation Portfolio | | | | | | | | | | | | | | | | | | | | | | | | |
Six months ended November 30, 2014 (unaudited) | | $ | 10.92 | | | | 0.01 | | | | 0.10 | | | | (0.01 | ) | | | 0.00 | | | $ | 11.02 | |
Year ended May 31, 2014 | | $ | 10.95 | | | | 0.03 | | | | 0.42 | | | | (0.05 | ) | | | (0.43 | ) | | $ | 10.92 | |
Year ended May 31, 2013 | | $ | 10.57 | | | | 0.06 | | | | 0.59 | | | | (0.08 | ) | | | (0.19 | ) | | $ | 10.95 | |
Year ended May 31, 2012 | | $ | 11.02 | | | | 0.16 | | | | (0.20 | ) | | | (0.21 | ) | | | (0.20 | ) | | $ | 10.57 | |
Year ended May 31, 2011 | | $ | 10.08 | | | | 0.18 | | | | 0.96 | | | | (0.20 | ) | | | 0.00 | | | $ | 11.02 | |
Year ended May 31, 2010 | | $ | 9.38 | | | | 0.21 | | | | 0.71 | | | | (0.22 | ) | | | 0.00 | | | $ | 10.08 | |
WealthBuilder Moderate Balanced Portfolio | | | | | | | | | | | | | | | | | | | | | | | | |
Six months ended November 30, 2014 (unaudited) | | $ | 12.21 | | | | (0.00 | )3 | | | 0.21 | | | | 0.00 | | | | 0.00 | | | $ | 12.42 | |
Year ended May 31, 2014 | | $ | 12.03 | | | | 0.02 | | | | 0.91 | | | | (0.04 | ) | | | (0.71 | ) | | $ | 12.21 | |
Year ended May 31, 2013 | | $ | 10.96 | | | | 0.04 | 4 | | | 1.21 | | | | (0.06 | ) | | | (0.12 | ) | | $ | 12.03 | |
Year ended May 31, 2012 | | $ | 11.50 | | | | 0.13 | 4 | | | (0.48 | ) | | | (0.19 | ) | | | (0.00 | )3 | | $ | 10.96 | |
Year ended May 31, 2011 | | $ | 10.01 | | | | 0.14 | | | | 1.54 | | | | (0.19 | ) | | | 0.00 | | | $ | 11.50 | |
Year ended May 31, 2010 | | $ | 9.01 | | | | 0.15 | | | | 1.00 | | | | (0.15 | ) | | | 0.00 | | | $ | 10.01 | |
WealthBuilder Growth Balanced Portfolio | | | | | | | | | | | | | | | | | | | | | | | | |
Six months ended November 30, 2014 (unaudited) | | $ | 14.42 | | | | (0.02 | ) | | | 0.36 | | | | 0.00 | | | | 0.00 | | | $ | 14.76 | |
Year ended May 31, 2014 | | $ | 12.90 | | | | 0.01 | | | | 1.55 | | | | (0.04 | ) | | | 0.00 | | | $ | 14.42 | |
Year ended May 31, 2013 | | $ | 10.97 | | | | 0.01 | | | | 1.95 | | | | (0.03 | ) | | | 0.00 | | | $ | 12.90 | |
Year ended May 31, 2012 | | $ | 11.82 | | | | 0.09 | | | | (0.82 | ) | | | (0.12 | ) | | | 0.00 | | | $ | 10.97 | |
Year ended May 31, 2011 | | $ | 9.60 | | | | 0.06 | | | | 2.26 | | | | (0.10 | ) | | | 0.00 | | | $ | 11.82 | |
Year ended May 31, 2010 | | $ | 8.30 | | | | 0.10 | | | | 1.29 | | | | (0.09 | ) | | | 0.00 | | | $ | 9.60 | |
WealthBuilder Growth Allocation Portfolio | | | | | | | | | | | | | | | | | | | | | | | | |
Six months ended November 30, 2014 (unaudited) | | $ | 14.78 | | | | (0.04 | ) | | | 0.46 | | | | 0.00 | | | | 0.00 | | | $ | 15.20 | |
Year ended May 31, 2014 | | $ | 13.08 | | | | (0.03 | ) | | | 1.89 | | | | (0.00 | )3 | | | (0.16 | ) | | $ | 14.78 | |
Year ended May 31, 2013 | | $ | 10.87 | | | | (0.01 | ) | | | 2.23 | | | | (0.01 | ) | | | 0.00 | | | $ | 13.08 | |
Year ended May 31, 2012 | | $ | 11.83 | | | | 0.05 | 4 | | | (0.94 | ) | | | (0.07 | ) | | | 0.00 | | | $ | 10.87 | |
Year ended May 31, 2011 | | $ | 9.34 | | | | 0.02 | | | | 2.53 | | | | (0.06 | ) | | | 0.00 | | | $ | 11.83 | |
Year ended May 31, 2010 | | $ | 7.98 | | | | 0.04 | | | | 1.36 | | | | (0.04 | ) | | | 0.00 | | | $ | 9.34 | |
WealthBuilder Equity Portfolio | | | | | | | | | | | | | | | | | | | | | | | | |
Six months ended November 30, 2014 (unaudited) | | $ | 14.93 | | | | (0.06 | ) | | | 0.61 | | | | 0.00 | | | | 0.00 | | | $ | 15.48 | |
Year ended May 31, 2014 | | $ | 12.82 | | | | (0.08 | ) | | | 2.19 | | | | 0.00 | | | | 0.00 | | | $ | 14.93 | |
Year ended May 31, 2013 | | $ | 10.34 | | | | (0.05 | ) | | | 2.53 | | | | 0.00 | | | | 0.00 | | | $ | 12.82 | |
Year ended May 31, 2012 | | $ | 11.45 | | | | (0.04 | ) | | | (1.07 | ) | | | 0.00 | | | | 0.00 | | | $ | 10.34 | |
Year ended May 31, 2011 | | $ | 9.10 | | | | (0.07 | ) | | | 2.42 | | | | 0.00 | | | | 0.00 | | | $ | 11.45 | |
Year ended May 31, 2010 | | $ | 7.72 | | | | (0.06 | ) | | | 1.44 | | | | 0.00 | | | | 0.00 | | | $ | 9.10 | |
WealthBuilder Tactical Equity Portfolio | | | | | | | | | | | | | | | | | | | | | | | | |
Six months ended November 30, 2014 (unaudited) | | $ | 18.07 | | | | (0.08 | ) | | | 0.69 | | | | 0.00 | | | | 0.00 | | | $ | 18.68 | |
Year ended May 31, 2014 | | $ | 15.61 | | | | (0.08 | ) | | | 2.54 | | | | 0.00 | | | | 0.00 | | | $ | 18.07 | |
Year ended May 31, 2013 | | $ | 13.12 | | | | (0.07 | ) | | | 2.58 | | | | (0.02 | ) | | | 0.00 | | | $ | 15.61 | |
Year ended May 31, 2012 | | $ | 13.89 | | | | (0.08 | )4 | | | (0.69 | ) | | | 0.00 | | | | 0.00 | | | $ | 13.12 | |
Year ended May 31, 2011 | | $ | 11.05 | | | | (0.10 | ) | | | 2.94 | | | | 0.00 | | | | 0.00 | | | $ | 13.89 | |
Year ended May 31, 2010 | | $ | 9.13 | | | | (0.06 | ) | | | 1.98 | | | | 0.00 | | | | 0.00 | | | $ | 11.05 | |
| 1. | Includes net expenses allocated from affiliated Master Portfolios in which the Portfolio invests. |
| 2. | Total return calculations do not include any sales charges. |
| 3. | Amount is less than $0.005. |
| 4. | Calculated based upon average shares outstanding |
The accompanying notes are an integral part of these financial statements.
| | | | | | |
| Financial highlights | | Wells Fargo Advantage WealthBuilder Portfolios | | | 39 | |
| | | | | | | | | | | | | | | | | | | | | | |
| Ratio to average net assets (annualized) | | | Total
return2 | | | Portfolio
turnover
rate | | | Net assets at
end of period
(000s omitted) | |
Net investment
income (loss)1 | | | Gross
expenses1 | | | Net
expenses1 | | | | |
| | | | | | | | | | | | | | | | | | | | | | |
| | 0.18 | % | | | 1.55 | % | | | 1.50 | % | | | 1.00 | % | | | 79 | % | | $ | 556,580 | |
| | 0.32 | % | | | 1.55 | % | | | 1.50 | % | | | 4.19 | % | | | 139 | % | | $ | 580,937 | |
| | 0.53 | % | | | 1.54 | % | | | 1.50 | % | | | 6.19 | % | | | 128 | % | | $ | 659,977 | |
| | 1.51 | % | | | 1.54 | % | | | 1.50 | % | | | (0.32 | )% | | | 176 | % | | $ | 662,092 | |
| | 1.75 | % | | | 1.58 | % | | | 1.50 | % | | | 11.42 | % | | | 168 | % | | $ | 630,085 | |
| | 2.18 | % | | | 1.56 | % | | | 1.50 | % | | | 9.87 | % | | | 157 | % | | $ | 442,245 | |
| | | | | | | | | | | | | | | | | | | | | | |
| | (0.01 | )% | | | 1.55 | % | | | 1.50 | % | | | 1.72 | % | | | 64 | % | | $ | 881,383 | |
| | 0.17 | % | | | 1.54 | % | | | 1.50 | % | | | 7.94 | % | | | 110 | % | | $ | 867,327 | |
| | 0.34 | % | | | 1.54 | % | | | 1.50 | % | | | 11.42 | % | | | 115 | % | | $ | 799,251 | |
| | 1.20 | % | | | 1.54 | % | | | 1.50 | % | | | (2.96 | )% | | | 145 | % | | $ | 709,801 | |
| | 1.24 | % | | | 1.55 | % | | | 1.50 | % | | | 16.96 | % | | | 142 | % | | $ | 691,145 | |
| | 1.62 | % | | | 1.57 | % | | | 1.50 | % | | | 12.81 | % | | | 130 | % | | $ | 472,947 | |
| | | | | | | | | | | | | | | | | | | | | | |
| | (0.21 | )% | | | 1.54 | % | | | 1.50 | % | | | 2.36 | % | | | 46 | % | | $ | 969,217 | |
| | 0.04 | % | | | 1.54 | % | | | 1.50 | % | | | 12.07 | % | | | 94 | % | | $ | 936,593 | |
| | 0.06 | % | | | 1.54 | % | | | 1.50 | % | | | 17.85 | % | | | 117 | % | | $ | 788,285 | |
| | 0.84 | % | | | 1.54 | % | | | 1.50 | % | | | (6.17 | )% | | | 131 | % | | $ | 689,816 | |
| | 0.59 | % | | | 1.54 | % | | | 1.50 | % | | | 24.27 | % | | | 140 | % | | $ | 785,283 | |
| | 1.12 | % | | | 1.56 | % | | | 1.50 | % | | | 16.75 | % | | | 120 | % | | $ | 590,907 | |
| | | | | | | | | | | | | | | | | | | | | | |
| | (0.50 | )% | | | 1.56 | % | | | 1.50 | % | | | 2.84 | % | | | 30 | % | | $ | 425,082 | |
| | (0.19 | )% | | | 1.57 | % | | | 1.50 | % | | | 14.28 | % | | | 60 | % | | $ | 402,238 | |
| | (0.13 | )% | | | 1.57 | % | | | 1.50 | % | | | 20.39 | % | | | 98 | % | | $ | 324,723 | |
| | 0.49 | % | | | 1.57 | % | | | 1.50 | % | | | (7.47 | )% | | | 96 | % | | $ | 276,657 | |
| | 0.16 | % | | | 1.57 | % | | | 1.50 | % | | | 27.33 | % | | | 110 | % | | $ | 313,206 | |
| | 0.47 | % | | | 1.60 | % | | | 1.50 | % | | | 17.51 | % | | | 97 | % | | $ | 219,357 | |
| | | | | | | | | | | | | | | | | | | | | | |
| | (0.82 | )% | | | 1.61 | % | | | 1.50 | % | | | 3.68 | % | | | 14 | % | | $ | 138,803 | |
| | (0.53 | )% | | | 1.61 | % | | | 1.50 | % | | | 16.46 | % | | | 26 | % | | $ | 138,137 | |
| | (0.38 | )% | | | 1.63 | % | | | 1.50 | % | | | 23.98 | % | | | 44 | % | | $ | 121,888 | |
| | (0.39 | )% | | | 1.60 | % | | | 1.50 | % | | | (9.69 | )% | | | 24 | % | | $ | 109,727 | |
| | (0.68 | )% | | | 1.60 | % | | | 1.50 | % | | | 25.82 | % | | | 52 | % | | $ | 141,425 | |
| | (0.68 | )% | | | 1.61 | % | | | 1.50 | % | | | 17.88 | % | | | 46 | % | | $ | 119,993 | |
| | | | | | | | | | | | | | | | | | | | | | |
| | (0.82 | )% | | | 1.56 | % | | | 1.50 | % | | | 3.38 | % | | | 17 | % | | $ | 428,277 | |
| | (0.45 | )% | | | 1.56 | % | | | 1.50 | % | | | 15.76 | % | | | 23 | % | | $ | 421,949 | |
| | (0.49 | )% | | | 1.56 | % | | | 1.50 | % | | | 19.16 | % | | | 67 | % | | $ | 371,334 | |
| | (0.58 | )% | | | 1.56 | % | | | 1.50 | % | | | (5.54 | )% | | | 31 | % | | $ | 346,832 | |
| | (0.81 | )% | | | 1.55 | % | | | 1.50 | % | | | 25.70 | % | | | 73 | % | | $ | 416,863 | |
| | (0.54 | )% | | | 1.57 | % | | | 1.50 | % | | | 21.03 | % | | | 89 | % | | $ | 356,382 | |
The accompanying notes are an integral part of these financial statements.
| | | | |
| 40 | | Wells Fargo Advantage WealthBuilder Portfolios | | Notes to financial statements (unaudited) |
1. ORGANIZATION
Wells Fargo Funds Trust (the “Trust”), a Delaware statutory trust organized on March 10, 1999, is an open-end management investment company registered under the Investment Company Act of 1940, as amended (the “1940 Act”). These financial statements report on the following funds: the Wells Fargo Advantage WealthBuilder Conservative Allocation Portfolio (“WealthBuilder Conservative Allocation Portfolio”), the Wells Fargo Advantage WealthBuilder Moderate Balanced Portfolio (“WealthBuilder Moderate Balanced Portfolio”), the Wells Fargo Advantage WealthBuilder Growth Balanced Portfolio (“WealthBuilder Growth Balanced Portfolio”), the Wells Fargo Advantage WealthBuilder Growth Allocation Portfolio (“WealthBuilder Growth Allocation Portfolio” ), the Wells Fargo Advantage WealthBuilder Equity Portfolio (“WealthBuilder Equity Portfolio” ), and the Wells Fargo Advantage WealthBuilder Tactical Equity Portfolio (“WealthBuilder Tactical Equity Portfolio”) (each, a “Portfolio”, collectively, the “Portfolios”). Each Portfolio is a diversified series of the Trust.
Each Portfolio is a fund-of-funds that may invest in various affiliated mutual funds, unaffiliated mutual funds, and exchange-traded funds (collectively, the “Underlying Funds”) to pursue its investment objective. The Underlying Funds incur separate expenses in seeking to achieve their investment objectives. The investment in affiliated funds may also include investments in one or more separate diversified portfolios (each, an “affiliated Master Portfolio”, collectively, the “affiliated Master Portfolios”) of Wells Fargo Master Trust, a registered open-end management investment company. Each affiliated Master Portfolio directly acquires portfolio securities, and a Portfolio investing in an affiliated Master Portfolio acquires an indirect interest in those securities. Each Portfolio accounts for its investment in the affiliated Master Portfolios as partnership investments and records on a daily basis its share of the affiliated Master Portfolio’s income, expense, and realized and unrealized gains and losses. The financial statements and financial highlights for the Underlying Funds are presented in separate financial statements and may be obtained by contacting Investor Services for the Wells Fargo Advantage Funds for information on the affiliated mutual funds or the servicing agent of the unaffiliated mutual funds.
As of November 31, 2014, the Portfolios own the following percentages of the affiliated Master Portfolios:
| | | | | | | | | | | | | | | | |
| | | Wells Fargo
Advantage Core
Bond Portfolio | | | Wells Fargo
Advantage
Emerging Growth
Portfolio | | | Wells Fargo
Advantage
International Growth
Portfolio | | | Wells Fargo
Advantage Small
Company Value
Portfolio | |
WealthBuilder Conservative Allocation Portfolio | | | 5% | | | | 0 | %* | | | 4% | | | | 2% | |
WealthBuilder Moderate Balanced Portfolio | | | 5% | | | | 1 | % | | | 13% | | | | 6% | |
WealthBuilder Growth Balanced Portfolio | | | 4% | | | | 2 | % | | | 22% | | | | 11% | |
WealthBuilder Growth Allocation Portfolio | | | 1% | | | | 1 | % | | | 13% | | | | 6% | |
WealthBuilder Equity Portfolio | | | N/A | | | | 0 | %* | | | 5% | | | | 2% | |
WealthBuilder Tactical Equity Portfolio | | | N/A | | | | 1 | % | | | 16% | | | | 8% | |
| * | The amount owned is less than 1%. |
2. SIGNIFICANT ACCOUNTING POLICIES
The following significant accounting policies, which are consistently followed in the preparation of the financial statements of each Portfolio, are in conformity with U.S. generally accepted accounting principles which require management to make estimates and assumptions that affect the reported amounts of assets and liabilities, disclosure of contingent assets and liabilities at the date of the financial statements, and the reported amounts of revenues and expenses during the reporting period. Actual results could differ from those estimates.
Securities valuation
All investments are valued each business day as of the close of regular trading on the New York Stock Exchange (generally 4 p.m. Eastern Time).
Investments in underlying open-end investment companies are valued at net asset per share as reported by the Underlying Funds as of the close of the regular trading on the New York Stock Exchange on each day the exchange is open for trading. Investments in affiliated Master Portfolios are valued daily based on each Portfolio’s proportionate share of each affiliated Master Portfolio’s net assets, which are also valued daily.
Futures that are listed on a foreign or domestic exchange or market are valued at the official closing price or, if none, the last sales price.
Short-term securities, with maturities of 60 days or less at time of purchase, generally are valued at amortized cost which approximates fair value. The amortized cost method involves valuing a security at its cost, plus accretion of discount or minus amortization of premium over the period until maturity.
| | | | | | |
| Notes to financial statements (unaudited) | | Wells Fargo Advantage WealthBuilder Portfolios | | | 41 | |
Futures contracts
Each Portfolio is subject to interest rate risk and equity price risk in the normal course of pursuing its investment objectives. A Portfolio may buy and sell futures contracts in order to effect tactical allocations changes in a Portfolio. The primary risks associated with the use of futures contracts are the imperfect correlation between changes in market values of securities held by the Portfolio and the prices of futures contracts, and the possibility of an illiquid market.
The aggregate principal amounts of the contracts are not recorded in the financial statements. Fluctuations in the value of the contracts are recorded in the Statements of Assets and Liabilities as an asset or liability and in the Statements of Operations as unrealized gains or losses until the contracts are closed, at which point they are recorded as net realized gains or losses on futures contracts. With futures contracts, there is minimal counterparty risk to the Portfolio since futures are exchange traded and the exchange’s clearinghouse, as counterparty to all exchange traded futures, guarantees the futures against default.
Security transactions and income recognition
Securities transactions are recorded on a trade date basis. Realized gains or losses are recorded on the basis of identified cost.
Income dividends and capital gain distributions from Underlying Funds are recorded on the ex-dividend date. Capital gain distributions from Underlying Funds are treated as realized gains.
Interest income is accrued daily and bond discounts are accreted and premiums are amortized daily based on the effective interest method by each Portfolio and each affiliated Master Portfolio. To the extent debt obligations are placed on non-accrual status, any related interest income may be reduced by writing off interest receivables when the collection of all or a portion of interest has become doubtful based on consistently applied procedures. If the issuer subsequently resumes interest payments or when the collectability of interest is reasonably assured, the debt obligation is removed from non-accrual status.
Each Portfolio records on a daily basis its proportionate share of each affiliated Master Portfolio’s interest and dividend income, in addition to expenses and realized and unrealized gains and losses.
Distributions to shareholders
Distributions to shareholders from net investment income and net realized gains, if any, are recorded on the ex-dividend date. Such distributions are determined in conformity with federal income tax regulations, which may differ in amount or character from net investment income and realized gains recognized for purposes of U.S. generally accepted accounting principles.
Federal and other taxes
Each Portfolio is treated as a separate entity for federal income tax purposes. Each Portfolio intends to continue to qualify as a regulated investment company by distributing substantially all of its investment company taxable income and any net realized capital gains (after reduction for capital loss carryforwards) sufficient to relieve it from all, or substantially all, federal income taxes. Accordingly, no provision for federal income taxes was required.
Each Portfolio’s income and federal excise tax returns and all financial records supporting those returns for the prior three fiscal years are subject to examination by the federal and Delaware revenue authorities. Management has analyzed each Portfolio’s tax positions taken on federal, state, and foreign tax returns for all open tax years and does not believe that there are any uncertain tax positions that require recognition of a tax liability.
At May 31, 2014, capital loss carryforwards available to offset future net realized capital gains were as follows through the indicated expiration date:
| | | | |
| | | 2018 | |
WealthBuilder Equity Portfolio | | $ | 20,146,330 | |
WealthBuilder Tactical Equity Portfolio | | | 90,019,467 | |
At May 31, 2014, late-year ordinary losses which were recognized on the first day of the current fiscal year were as follows:
| | | | |
| | | Late-year ordinary loss | |
WealthBuilder Moderate Balanced Portfolio | | $ | 115,264 | |
WealthBuilder Growth Balanced Portfolio | | | 196,345 | |
WealthBuilder Growth Allocation Portfolio | | | 61,716 | |
WealthBuilder Equity Portfolio | | | 446,918 | |
WealthBuilder Tactical Equity Portfolio | | | 1,579,251 | |
| | | | |
| 42 | | Wells Fargo Advantage WealthBuilder Portfolios | | Notes to financial statements (unaudited) |
3. FAIR VALUATION MEASUREMENTS
Fair value measurements of investments are determined within a framework that has established a fair value hierarchy based upon the various data inputs utilized in determining the value of each Portfolio’s investments. The three-level hierarchy gives the highest priority to unadjusted quoted prices in active markets for identical assets or liabilities (Level 1) and the lowest priority to significant unobservable inputs (Level 3). Each Portfolio’s investments are classified within the fair value hierarchy based on the lowest level of input that is significant to the fair value measurement. The inputs are summarized into three broad levels as follows:
| n | | Level 1 – quoted prices in active markets for identical securities |
| n | | Level 2 – other significant observable inputs (including quoted prices for similar securities, interest rates, prepayment speeds, credit risk, use of amortized cost, etc.) |
| n | | Level 3 – significant unobservable inputs (including the Portfolio’s own assumptions in determining the fair value of investments) |
The inputs or methodologies used for valuing investments in securities are not necessarily an indication of the risk associated with investing in those securities
The following is a summary of the inputs used in valuing the Portfolio’s assets and liabilities as of November 30, 2014:
| | | | | | | | | | | | | | | | |
| | | Quoted prices
(Level 1) | | | Other significant
observable inputs
(Level 2) | | | Significant
unobservable inputs
(Level 3) | | | Total | |
WealthBuilder Conservative Allocation Portfolio | | | | | | | | | | | | | | | | |
Assets | | | | | | | | | | | | | | | | |
Investments in: | | | | | | | | | | | | | | | | |
| | | | |
Investment companies | | $ | 403,651,947 | | | $ | 150,065,577 | | | $ | 0 | | | $ | 553,717,524 | |
| | | | |
Short-term investments | | | | | | | | | | | | | | | | |
Investment companies | | | 979,477 | | | | 0 | | | | 0 | | | | 979,477 | |
U.S. Treasury securities | | | 1,009,994 | | | | 489,999 | | | | 0 | | | | 1,499,993 | |
Total assets | | $ | 405,641,418 | | | $ | 150,555,576 | | | $ | 0 | | | $ | 556,196,994 | |
Liabilities | | | | | | | | | | | | | | | | |
| | | | |
Futures contracts | | $ | 101,750 | | | $ | 0 | | | $ | 0 | | | $ | 101,750 | |
Total liabilities | | $ | 101,750 | | | $ | 0 | | | $ | 0 | | | $ | 101,750 | |
WealthBuilder Moderate Balanced Portfolio | | | | | | | | | | | | | | | | |
Assets | | | | | | | | | | | | | | | | |
Investments in: | | | | | | | | | | | | | | | | |
| | | | |
Investment companies | | $ | 672,374,001 | | | $ | 204,554,792 | | | $ | 0 | | | $ | 876,928,793 | |
| | | | |
Short-term investments | | | | | | | | | | | | | | | | |
Investment companies | | | 476,264 | | | | 0 | | | | 0 | | | | 476,264 | |
U.S. Treasury securities | | | 3,019,982 | | | | 1,539,996 | | | | 0 | | | | 4,559,978 | |
Total assets | | $ | 675,870,247 | | | $ | 206,094,788 | | | $ | 0 | | | $ | 881,965,035 | |
Liabilities | | | | | | | | | | | | | | | | |
| | | | |
Futures contracts | | $ | 319,375 | | | $ | 0 | | | $ | 0 | | | $ | 319,375 | |
Total liabilities | | $ | 319,375 | | | $ | 0 | | | $ | 0 | | | $ | 319,375 | |
WealthBuilder Growth Balanced Portfolio | | | | | | | | | | | | | | | | |
Assets | | | | | | | | | | | | | | | | |
Investments in: | | | | | | | | | | | | | | | | |
| | | | |
Investment companies | | $ | 770,698,661 | | | $ | 191,449,341 | | | $ | 0 | | | $ | 962,148,002 | |
| | | | |
Short-term investments | | | | | | | | | | | | | | | | |
Investment companies | | | 2,751,249 | | | | 0 | | | | 0 | | | | 2,751,249 | |
U.S. Treasury securities | | | 3,249,981 | | | | 1,584,996 | | | | 0 | | | | 4,834,977 | |
Total assets | | $ | 776,699,891 | | | $ | 193,034,337 | | | $ | 0 | | | $ | 969,734,228 | |
Liabilities | | | | | | | | | | | | | | | | |
| | | | |
Futures contracts | | $ | 349,500 | | | $ | 0 | | | $ | 0 | | | $ | 349,500 | |
Total liabilities | | $ | 349,500 | | | $ | 0 | | | $ | 0 | | | $ | 349,500 | |
| | | | | | |
| Notes to financial statements (unaudited) | | Wells Fargo Advantage WealthBuilder Portfolios | | | 43 | |
| | | | | | | | | | | | | | | | |
| | | Quoted prices
(Level 1) | | | Other significant
observable inputs
(Level 2) | | | Significant
unobservable inputs
(Level 3) | | | Total | |
WealthBuilder Growth Allocation Portfolio | | | | | | | | | | | | | | | | |
Assets | | | | | | | | | | | | | | | | |
Investments in: | | | | | | | | | | | | | | | | |
| | | | |
Investment companies | | $ | 352,965,748 | | | $ | 69,416,476 | | | $ | 0 | | | $ | 422,382,224 | |
| | | | |
Short-term investments | | | | | | | | | | | | | | | | |
Investment companies | | | 966,950 | | | | 0 | | | | 0 | | | | 966,950 | |
U.S. Treasury securities | | | 1,379,992 | | | | 654,998 | | | | 0 | | | | 2,034,990 | |
Total assets | | $ | 355,312,690 | | | $ | 70,071,474 | | | $ | 0 | | | $ | 425,384,164 | |
Liabilities | | | | | | | | | | | | | | | | |
| | | | |
Futures contracts | | $ | 151,250 | | | $ | 0 | | | $ | 0 | | | $ | 151,250 | |
Total liabilities | | $ | 151,250 | | | $ | 0 | | | $ | 0 | | | $ | 151,250 | |
WealthBuilder Equity Portfolio | | | | | | | | | | | | | | | | |
Assets | | | | | | | | | | | | | | | | |
Investments in: | | | | | | | | | | | | | | | | |
| | | | |
Investment companies | | $ | 123,355,292 | | | $ | 15,311,368 | | | $ | 0 | | | $ | 138,666,660 | |
| | | | |
Short-term investments | | | | | | | | | | | | | | | | |
Investment companies | | | 394,733 | | | | 0 | | | | 0 | | | | 394,733 | |
Total assets | | $ | 123,750,025 | | | $ | 15,311,368 | | | $ | 0 | | | $ | 139,061,393 | |
WealthBuilder Tactical Equity Portfolio | | | | | | | | | | | | | | | | |
Assets | | | | | | | | | | | | | | | | |
Investments in: | | | | | | | | | | | | | | | | |
| | | | |
Investment companies | | $ | 369,027,866 | | | $ | 57,732,964 | | | $ | 0 | | | $ | 426,760,830 | |
| | | | |
Short-term investments | | | | | | | | | | | | | | | | |
Investment companies | | | 1,401,701 | | | | 0 | | | | 0 | | | | 1,401,701 | |
Total assets | | $ | 370,429,567 | | | $ | 57,732,964 | | | $ | 0 | | | $ | 428,162,531 | |
Futures contracts are reported at their variation margin at measurement date, which represents the amount due from the Portfolio at that date. All other assets and liabilities are reported at their market value at measurement date.
Transfers in and transfers out are recognized at the end of the reporting period. At November 30, 2014, the Portfolios did not have any transfers into/out of Level 1, Level 2, or Level 3.
4. TRANSACTIONS WITH AFFILIATES
Advisory fees
The Trust has entered into an advisory contract with Wells Fargo Funds Management, LLC (“Funds Management”), an indirect wholly owned subsidiary of Wells Fargo & Company (“Wells Fargo”). The adviser is responsible for implementing investment policies and guidelines and for supervising the subadviser, who is responsible for day-to-day portfolio management of the Portfolios.
Pursuant to the contract, Funds Management is entitled to receive an annual advisory fee starting at 0.20% and declining to 0.15% as the average daily net assets of each Portfolio increase. For the six months ended November 30, 2014, the advisory fee was equivalent to an annual rate of 0.20% of each Portfolio’s average daily net assets.
Funds Management also serves as the adviser to and is entitled to receive a fee from each affiliated Master Portfolio and affiliated Underlying Fund for those services.
Funds Management has retained the services of a subadviser to provide daily portfolio management to the Portfolios. The fee for subadvisory services is borne by Funds Management. Wells Capital Management Incorporated, an affiliate of Funds Management and an indirect wholly owned subsidiary of Wells Fargo, is the subadviser to each Portfolio and is paid an annual subadvisory fee of 0.15% of the average daily net assets of each Portfolio.
| | | | |
| 44 | | Wells Fargo Advantage WealthBuilder Portfolios | | Notes to financial statements (unaudited) |
Administration fee
The Trust has entered into an administration agreement with Funds Management. Under this agreement, for providing administrative services, which includes paying fees and expenses for services provided by the transfer agent, sub-transfer agents, omnibus account servicers, and record-keepers, Funds Management is entitled to receive from each Portfolio an annual fee starting at 0.31% and declining to 0.29% as the average daily net assets of each Portfolio increase. For the six months ended November 30, 2014, the administration fee for each Portfolio was equivalent to an annual rate of 0.31% of each Portfolio’s average daily net assets.
Funds Management has contractually waived and/or reimbursed advisory and administration fees to the extent necessary to maintain certain net operating expense ratios for the Portfolios. Funds Management has committed through September 30, 2015 to waive fees and/or reimburse expenses to the extent necessary to cap each Portfolio’s expenses at 1.50%. After this time, the cap may be increased or the commitment to maintain the cap may be terminated only with the approval of the Board of Trustees.
Distribution fee
The Trust has adopted a Distribution Plan for each Portfolio pursuant to Rule 12b-1 under the 1940 Act. Distribution fees are charged and paid to Wells Fargo Funds Distributor, LLC (“Funds Distributor”), the principal underwriter of each Portfolio, at an annual rate of 0.75% of each Portfolio’s average daily net assets.
In addition, Funds Distributor is entitled to receive the front-end sales charge from the purchase of shares and a contingent deferred sales charge on the redemption of certain shares. For the six months ended November 30, 2014, Funds Distributor received the following amounts in front-end sales charges.
| | | | |
| | | Front-end sales charges | |
WealthBuilder Conservative Allocation Portfolio | | $ | 7,522 | |
WealthBuilder Moderate Balanced Portfolio | | | 14,370 | |
WealthBuilder Growth Balanced Portfolio | | | 10,023 | |
WealthBuilder Growth Allocation Portfolio | | | 4,208 | |
WealthBuilder Equity Portfolio | | | 904 | |
WealthBuilder Tactical Equity Portfolio | | | 2,179 | |
Shareholder servicing fees
The Trust has entered into contracts with one or more shareholder servicing agents, whereby each Portfolio is charged a fee at an annual rate of 0.25% of its average daily net assets.
A portion of these total shareholder servicing fees were paid to affiliates of Wells Fargo.
5. INVESTMENT PORTFOLIO TRANSACTIONS
Purchases and sales of investments, excluding short-term securities, for the six months ended November 30, 2014 were as follows:
| | | | | | | | | | | | | | | | |
| | | Purchases at cost* | | | Sales proceeds* | |
| | | U.S.
government | | | Non-U.S.
government | | | U.S.
government | | | Non-U.S.
government | |
WealthBuilder Conservative Allocation Portfolio | | $ | 350,386,215 | | | $ | 107,918,901 | | | $ | 349,869,219 | | | $ | 157,095,910 | |
WealthBuilder Moderate Balanced Portfolio | | | 408,491,129 | | | | 153,287,779 | | | | 407,888,399 | | | | 179,088,112 | |
WealthBuilder Growth Balanced Portfolio | | | 290,482,372 | | | | 166,136,656 | | | | 290,053,764 | | | | 148,943,178 | |
WealthBuilder Growth Allocation Portfolio | | | 64,217,763 | | | | 71,399,071 | | | | 64,123,010 | | | | 58,324,513 | |
WealthBuilder Equity Portfolio | | | 0 | | | | 18,987,736 | | | | 0 | | | | 23,038,181 | |
WealthBuilder Tactical Equity Portfolio | | | 0 | | | | 73,033,493 | | | | 0 | | | | 80,054,083 | |
| * | The Portfolios seek to achieve their investment objective by investing some of their investable assets in affiliated Master Portfolios. Purchases and sales related to these investments have been calculated by aggregating the results of multiplying such Portfolio’s ownership percentage of the respective affiliated Master Portfolio by the corresponding affiliated Master Portfolio’s purchases and sales. Purchases and sales of the affiliated and unaffiliated Underlying Funds in which the Portfolios invest are actual aggregate purchases and sales of those investments. |
| | | | | | |
| Notes to financial statements (unaudited) | | Wells Fargo Advantage WealthBuilder Portfolios | | | 45 | |
6. INVESTMENTS IN AFFILIATES
A summary of each Portfolio’s transactions in shares of affiliated Underlying Funds (excluding short-term investments and affiliated Master Portfolios) during the six months ended November 30, 2014 were as follows:
| | | | | | | | | | | | | | | | | | | | | | | | |
| | | Shares,
beginning of period | | | Shares
purchases | | | Shares sold | | | Shares, end of period | | | Value, end of period | | | Dividend from
affiliated
Underlying Funds | |
WealthBuilder Conservative Allocation Portfolio | | | | | | | | | | | | | | | | | | | | | | | | |
Wells Fargo Advantage Emerging Markets Equity Fund Institutional Class | | | 124,956 | | | | 9,345 | | | | 14,355 | | | | 119,946 | | | $ | 2,674,787 | | | $ | 0 | |
Wells Fargo Advantage Endeavor Select Fund Institutional Class | | | 352,934 | | | | 49,209 | | | | 56,464 | | | | 345,679 | | | | 5,427,154 | | | | 0 | |
Wells Fargo Advantage Government Securities Fund Institutional Class | | | 9,842,243 | | | | 303,143 | | | | 851,477 | | | | 9,293,909 | | | | 104,277,657 | | | | 639,396 | |
Wells Fargo Advantage Large Cap Growth Fund Institutional Class | | | 113,706 | | | | 14,825 | | | | 18,530 | | | | 110,001 | | | | 5,392,264 | | | | 0 | |
Wells Fargo Advantage Short Duration Government Bond Fund Institutional Class | | | 16,122,120 | | | | 504,552 | | | | 5,324,925 | | | | 11,301,747 | | | | 114,260,667 | | | | 871,379 | |
Wells Fargo Advantage Small Cap Value Fund Institutional Class | | | 116,827 | | | | 11,860 | | | | 16,166 | | | | 112,521 | | | | 3,928,116 | | | | 0 | |
| | | | | | | | | | | | | | | | | | | $ | 235,960,645 | | | $ | 1,510,775 | |
WealthBuilder Moderate Balanced Portfolio | | | | | | | | | | | | | | | | | | | | | | | | |
Wells Fargo Advantage Emerging Markets Equity Fund Institutional Class | | | 377,318 | | | | 26,053 | | | | 23,131 | | | | 380,240 | | | $ | 8,479,349 | | | $ | 0 | |
Wells Fargo Advantage Endeavor Select Fund Institutional Class | | | 1,054,814 | | | | 123,289 | | | | 66,862 | | | | 1,111,241 | | | | 17,446,490 | | | | 0 | |
Wells Fargo Advantage Government Securities Fund Institutional Class | | | 10,790,243 | | | | 575,330 | | | | 542,112 | | | | 10,823,461 | | | | 121,439,232 | | | | 722,115 | |
Wells Fargo Advantage Large Cap Growth Fund Institutional Class | | | 337,208 | | | | 40,463 | | | | 24,933 | | | | 352,738 | | | | 17,291,208 | | | | 0 | |
Wells Fargo Advantage Short Duration Government Bond Fund Institutional Class | | | 15,700,980 | | | | 684,355 | | | | 5,230,153 | | | | 11,155,182 | | | | 112,778,890 | | | | 845,155 | |
Wells Fargo Advantage Small Cap Value Fund Institutional Class | | | 343,845 | | | | 23,143 | | | | 4,827 | | | | 362,161 | | | | 12,643,038 | | | | 0 | |
| | | | | | | | | | | | | | | | | | | $ | 290,078,207 | | | $ | 1,567,270 | |
WealthBuilder Growth Balanced Portfolio | | | | | | | | | | | | | | | | | | | | | | | | |
Wells Fargo Advantage Emerging Markets Equity Fund Institutional Class | | | 622,240 | | | | 18,863 | | | | 16,584 | | | | 624,519 | | | $ | 13,926,775 | | | $ | 0 | |
Wells Fargo Advantage Endeavor Select Fund Institutional Class | | | 1,744,997 | | | | 183,438 | | | | 30,942 | | | | 1,897,493 | | | | 29,790,644 | | | | 0 | |
Wells Fargo Advantage Government Securities Fund Institutional Class | | | 10,704,744 | | | | 874,400 | | | | 750,325 | | | | 10,828,819 | | | | 121,499,347 | | | | 721,049 | |
Wells Fargo Advantage Large Cap Growth Fund Institutional Class | | | 558,091 | | | | 62,604 | | | | 17,568 | | | | 603,127 | | | | 29,565,261 | | | | 0 | |
Wells Fargo Advantage Small Cap Value Fund Institutional Class | | | 571,925 | | | | 33,220 | | | | 668 | | | | 604,477 | | | | 21,102,295 | | | | 0 | |
| | | | | | | | | | | | | | | | | | | $ | 215,884,322 | | | $ | 721,049 | |
WealthBuilder Growth Allocation Portfolio | | | | | | | | | | | | | | | | | | | | | | | | |
Wells Fargo Advantage Emerging Markets Equity Fund Institutional Class | | | 353,801 | | | | 5,695 | | | | 5,029 | | | | 354,467 | | | $ | 7,904,606 | | | $ | 0 | |
Wells Fargo Advantage Endeavor Select Fund Institutional Class | | | 973,625 | | | | 98,007 | | | | 2,626 | | | | 1,069,006 | | | | 16,783,398 | | | | 0 | |
Wells Fargo Advantage Government Securities Fund Institutional Class | | | 2,095,468 | | | | 407,554 | | | | 289,590 | | | | 2,213,432 | | | | 24,834,703 | | | | 142,820 | |
Wells Fargo Advantage Large Cap Growth Fund Institutional Class | | | 310,007 | | | | 34,517 | | | | 2,539 | | | | 341,985 | | | | 16,764,125 | | | | 0 | |
Wells Fargo Advantage Small Cap Value Fund Institutional Class | | | 316,069 | | | | 22,245 | | | | 0 | | | | 338,314 | | | | 11,810,545 | | | | 0 | |
| | | | | | | | | | | | | | | | | | | $ | 78,097,377 | | | $ | 142,820 | |
| | | | |
| 46 | | Wells Fargo Advantage WealthBuilder Portfolios | | Notes to financial statements (unaudited) |
| | | | | | | | | | | | | | | | | | | | | | | | |
| | | Shares,
beginning of period | | | Shares
purchases | | | Shares sold | | | Shares, end of period | | | Value, end of period | | | Dividend from
affiliated
Underlying Funds | |
WealthBuilder Equity Portfolio | | | | | | | | | | | | | | | | | | | | | | | | |
Wells Fargo Advantage Emerging Markets Equity Fund Institutional Class | | | 151,324 | | | | 13,263 | | | | 12,335 | | | | 152,252 | | | $ | 3,395,228 | | | $ | 0 | |
Wells Fargo Advantage Endeavor Select Fund Institutional Class | | | 573,769 | | | | 6,131 | | | | 40,770 | | | | 539,130 | | | | 8,464,338 | | | | 0 | |
Wells Fargo Advantage Large Cap Growth Fund Institutional Class | | | 184,176 | | | | 1,260 | | | | 15,504 | | | | 169,932 | | | | 8,330,059 | | | | 0 | |
Wells Fargo Advantage Small Cap Value Fund Institutional Class | | | 95,232 | | | | 5,339 | | | | 3,799 | | | | 96,772 | | | | 3,378,298 | | | | 0 | |
| | | | | | | | | | | | | | | | | | | $ | 23,567,923 | | | $ | 0 | |
WealthBuilder Tactical Equity Portfolio | | | | | | | | | | | | | | | | | | | | | | | | |
Wells Fargo Advantage Emerging Markets Equity Fund Institutional Class | | | 464,763 | | | | 36,503 | | | | 41,101 | | | | 460,165 | | | $ | 10,261,690 | | | $ | 0 | |
Wells Fargo Advantage Endeavor Select Fund Institutional Class | | | 1,323,581 | | | | 152,717 | | | | 91,599 | | | | 1,384,699 | | | | 21,739,781 | | | | 0 | |
Wells Fargo Advantage Large Cap Growth Fund Institutional Class | | | 422,618 | | | | 51,886 | | | | 35,625 | | | | 438,879 | | | | 21,513,863 | | | | 0 | |
Wells Fargo Advantage Small Cap Value Fund Institutional Class | | | 428,042 | | | | 34,616 | | | | 16,208 | | | | 446,450 | | | | 15,585,565 | | | | 0 | |
| | | | | | | | | | | | | | | | | | | $ | 69,100,899 | | | $ | 0 | |
7. DERIVATIVE TRANSACTIONS
During the six months ended November 30, 2014, the Portfolios entered into futures contracts to gain market exposure to certain asset classes consistent with an active asset allocation strategy.
At November 30, 2014, the Portfolios had long and short futures contracts outstanding as follows:
| | | | | | | | | | | | | | | | |
| | | Expiration date | | Counterparty | | Contracts | | Type | | Contract value at
November 30, 2014 | | | Unrealized
gains (losses) | |
WealthBuilder Conservative Allocation Portfolio | | 12-18-2014 | | Goldman Sachs | | 27 Long | | S&P 500 Index | | $ | 13,947,525 | | | $ | 1,084,541 | |
| | | 3-20-2015 | | Goldman Sachs | | 98 Short | | U.S. Treasury Bonds | | | 13,977,250 | | | | (202,331 | ) |
WealthBuilder Moderate Balanced Portfolio | | 12-18-2014 | | Goldman Sachs | | 85 Long | | S&P 500 Index | | | 43,908,875 | | | | 3,442,835 | |
| | | 3-20-2015 | | Goldman Sachs | | 307 Short | | U.S. Treasury Bonds | | | 43,785,875 | | | | (633,833 | ) |
WealthBuilder Growth Balanced Portfolio | | 12-18-2014 | | Goldman Sachs | | 93 Long | | S&P 500 Index | | | 48,041,475 | | | | 3,637,792 | |
| | | 3-20-2015 | | Goldman Sachs | | 336 Short | | U.S. Treasury Bonds | | | 47,922,000 | | | | (693,706 | ) |
WealthBuilder Growth Allocation Portfolio | | 12-18-2014 | | Goldman Sachs | | 40 Long | | S&P 500 Index | | | 20,663,000 | | | | 1,525,187 | |
| | | 3-20-2015 | | Goldman Sachs | | 146 Short | | U.S. Treasury Bonds | | | 20,823,250 | | | | (301,432 | ) |
The Portfolios had average notional amounts in futures contracts outstanding during the six months ended November 30, 2014 as follows:
| | | | | | | | |
| | | Long contracts | | | Short contracts | |
WealthBuilder Conservative Allocation Portfolio | | $ | 14,866,818 | | | $ | 14,782,361 | |
WealthBuilder Moderate Balanced Portfolio | | | 47,055,597 | | | | 49,136,528 | |
WealthBuilder Growth Balanced Portfolio | | | 51,644,743 | | | | 54,572,417 | |
WealthBuilder Growth Allocation Portfolio | | | 22,565,863 | | | | 24,220,978 | |
| | | | | | |
| Notes to financial statements (unaudited) | | Wells Fargo Advantage WealthBuilder Portfolios | | | 47 | |
A summary of derivative instruments by primary risk exposure is outlined in the following tables.
The fair value of derivative instruments as of November 30, 2014 was as follows for WealthBuilder Conservative Allocation Portfolio:
| | | | | | | | | | | | |
| | | Asset derivatives | | | Liability derivatives | |
| | | Statements of Assets and
Liabilities location | | Fair value | | | Statements of Assets and
Liabilities location | | Fair value | |
Interest rate contracts | | Receivable for daily variation margin on open futures contracts | | $ | 0 | | | Payable for daily variation margin on open futures contracts | | $ | 40,500 | * |
Equity contracts | | Receivable for daily variation margin on open futures contracts | | | 0 | | | Payable for daily variation margin on open futures contracts | | | 61,250 | * |
| | | | | $ | 0 | | | | | $ | 101,750 | |
| * | Only the current day’s variation margin as of November 30, 2014 is reported separately on the Statements of Assets and Liabilities. |
The effect of derivative instruments on the Statements of Operations for the six months ended November 30, 2014 was as follows for WealthBuilder Conservative Allocation Portfolio:
| | | | | | | | |
| | | Amount of realized
gains (losses) on
derivatives | | | Change in unrealized
gains (losses) on
derivatives | |
Interest rate contracts | | $ | (518,227 | ) | | $ | (115,060 | ) |
Equity contracts | | | 1,422,979 | | | | 471,551 | |
| | | $ | 904,752 | | | $ | 356,491 | |
The fair value of derivative instruments as of November 30, 2014 was as follows for WealthBuilder Moderate Balanced Portfolio:
| | | | | | | | | | | | |
| | | Asset derivatives | | | Liability derivatives | |
| | | Statements of Assets and
Liabilities location | | Fair value | | | Statements of Assets and
Liabilities location | | Fair value | |
Interest rate contracts | | Receivable for daily variation margin on open futures contracts | | $ | 0 | | | Payable for daily variation margin on open futures contracts | | $ | 191,875 | * |
Equity contracts | | Receivable for daily variation margin on open futures contracts | | | 0 | | | Payable for daily variation margin on open futures contracts | | | 127,500 | * |
| | | | | $ | 0 | | | | | $ | 319,375 | |
| * | Only the current day’s variation margin as of November 30, 2014 is reported separately on the Statements of Assets and Liabilities. |
The effect of derivative instruments on the Statements of Operations for the six months ended November 30, 2014 was as follows for WealthBuilder Moderate Balanced Portfolio:
| | | | | | | | |
| | | Amount of realized
gains (losses) on
derivatives | | | Change in unrealized
gains (losses) on
derivatives | |
Interest rate contracts | | $ | (1,585,442 | ) | | $ | (373,683 | ) |
Equity contracts | | | 4,274,070 | | | | 1,603,865 | |
| | | $ | 2,688,628 | | | $ | 1,230,182 | |
| | | | |
| 48 | | Wells Fargo Advantage WealthBuilder Portfolios | | Notes to financial statements (unaudited) |
The fair value of derivative instruments as of November 30, 2014 was as follows for WealthBuilder Growth Balanced Portfolio:
| | | | | | | | | | | | |
| | | Asset derivatives | | | Liability derivatives | |
| | | Statements of Assets and
Liabilities location | | Fair value | | | Statements of Assets and
Liabilities location | | Fair value | |
Interest rate contracts | | Receivable for daily variation margin on open futures contracts | | $ | 0 | | | Payable for daily variation margin on open futures contracts | | $ | 210,000 | * |
Equity contracts | | Receivable for daily variation margin on open futures contracts | | | 0 | | | Payable for daily variation margin on open futures contracts | | | 139,500 | * |
| | | | | $ | 0 | | | | | $ | 349,500 | |
| * | Only the current day’s variation margin as of November 30, 2014 is reported separately on the Statements of Assets and Liabilities. |
The effect of derivative instruments on the Statements of Operations for the six months ended November 30, 2014 was as follows for WealthBuilder Growth Balanced Portfolio:
| | | | | | | | |
| | | Amount of realized
gains (losses) on
derivatives | | | Change in unrealized
gains (losses) on
derivatives | |
Interest rate contracts | | $ | (1,730,787 | ) | | $ | (413,602 | ) |
Equity contracts | | | 4,592,773 | | | | 1,655,791 | |
| | | $ | 2,861,986 | | | $ | 1,242,189 | |
The fair value of derivative instruments as of November 30, 2014 was as follows for WealthBuilder Growth Allocation Portfolio:
| | | | | | | | | | | | |
| | | Asset derivatives | | | Liability derivatives | |
| | | Statements of Assets and
Liabilities location | | Fair value | | | Statements of Assets and
Liabilities location | | Fair value | |
Interest rate contracts | | Receivable for daily variation margin on open futures contracts | | $ | 0 | | | Payable for daily variation margin on open futures contracts | | $ | 91,250 | * |
Equity contracts | | Receivable for daily variation margin on open futures contracts | | | 0 | | | Payable for daily variation margin on open futures contracts | | | 60,000 | * |
| | | | | $ | 0 | | | | | $ | 151,250 | |
| * | Only the current day’s variation margin as of November 30, 2014 is reported separately on the Statements of Assets and Liabilities. |
The effect of derivative instruments on the Statements of Operations for the six months ended November 30, 2014 was as follows for WealthBuilder Growth Allocation Portfolio:
| | | | | | | | |
| | | Amount of realized
gains (losses) on
derivatives | | | Change in unrealized
gains (losses) on
derivatives | |
Interest rate contracts | | $ | (752,379 | ) | | $ | (181,746 | ) |
Equity contracts | | | 1,981,399 | | | | 687,434 | |
| | | $ | 1,229,020 | | | $ | 505,688 | |
For certain types of derivative transactions, the Portfolios have entered into International Swaps and Derivatives Association, Inc. master agreements (“ISDA Master Agreements”) or similar agreements with approved counterparties. The ISDA Master Agreements or similar agreements may have requirements to deliver/deposit securities or cash to/with an exchange or broker-dealer as collateral and allows the Portfolio to offset, with each counterparty, certain derivative financial instrument’s assets and/or liabilities with collateral held or pledged. Collateral requirements differ by type of derivative. Collateral or margin requirements are set by the broker or exchange clearing house for exchange traded
| | | | | | |
| Notes to financial statements (unaudited) | | Wells Fargo Advantage WealthBuilder Portfolios | | | 49 | |
derivatives while collateral terms are contract specific for over-the-counter traded derivatives. Cash collateral that has been pledged to cover obligations of the Portfolio under ISDA Master Agreements or similar agreements, if any, will be reported separately in the Statements of Assets and Liabilities. Securities pledged as collateral, if any, for the same purpose are noted in the Portfolio of Investments. With respect to balance sheet offsetting, absent an event of default by the counterparty or a termination of the agreement, the reported amounts of financial assets and financial liabilities in the Statements of Assets and Liabilities are not offset across transactions between the Portfolio and the applicable counterparty. A reconciliation of the gross amounts on the Statements of Assets and Liabilities to the net amounts by derivative type, including any collateral exposure, is as follows
| | | | | | | | | | | | | | | | | | | | |
| | | Derivative type | | Counterparty | | Gross amounts
of liabilities in the
Statements of
Assets and
Liabilities | | | Amounts
subject to
netting
arrangements | | | Collateral
pledged1 | | | Net amount
of liabilites | |
WealthBuilder Conservative Allocation Portfolio | | Futures – variation margin | | Goldman Sachs | | $ | 101,750 | | | $ | 0 | | | $ | (101,750 | ) | | $ | 0 | |
WealthBuilder Moderate Balanced Portfolio | | Futures – variation margin | | Goldman Sachs | | | 319,375 | | | | 0 | | | | (319,375 | ) | | | 0 | |
WealthBuilder Growth Balanced Portfolio | | Futures – variation margin | | Goldman Sachs | | | 349,500 | | | | 0 | �� | | | (349,500 | ) | | | 0 | |
WealthBuilder Growth Allocation Portfolio | | Futures – variation margin | | Goldman Sachs | | | 151,250 | | | | 0 | | | | (151,250 | ) | | | 0 | |
| | 1. | Collateral pledged within this table is limited to the collateral for the net transaction with the counterparty. | |
8. BANK BORROWINGS
The Trust (excluding the money market funds and certain other funds in the Trust) and Wells Fargo Variable Trust are parties to a $150,000,000 revolving credit agreement whereby the Portfolios are permitted to use bank borrowings for temporary or emergency purposes, such as to fund shareholder redemption requests. Interest under the credit agreement is charged to each Portfolio based on a borrowing rate equal to the higher of the Federal Funds rate in effect on that day plus 1.25% or the overnight LIBOR rate in effect on that day plus 1.25%. In addition, an annual commitment fee equal to 0.10% of the unused balance is allocated to each participating Portfolio. For the six months ended November 30, 2014, the Portfolios paid the following amounts in commitment fees:
| | | | |
| | | Commitment fee | |
WealthBuilder Conservative Allocation Portfolio | | $ | 323 | |
WealthBuilder Moderate Balanced Portfolio | | | 485 | |
WealthBuilder Growth Balanced Portfolio | | | 697 | |
WealthBuilder Growth Allocation Portfolio | | | 300 | |
WealthBuilder Equity Portfolio | | | 103 | |
WealthBuilder Tactical Equity Portfolio | | | 314 | |
During the six months ended November 30, 2014, the Portfolios had the following borrowing activity:
| | | | | | | | | | | | |
| | | Average borrowings
outstanding (annualized) | | | Average interest rate
(annualized) | | | Interest paid | |
WealthBuilder Conservative Allocation Portfolio | | $ | 32,555 | | | | 1.37 | % | | $ | 446 | |
WealthBuilder Tactical Equity Portfolio | | | 17,810 | | | | 1.37 | % | | | 244 | |
9. INDEMNIFICATION
Under the Trust’s organizational documents, the officers and Trustees are indemnified against certain liabilities that may arise out of performance of their duties to the Trust. Additionally, in the normal course of business, the Trust may enter into contracts with service providers that contain a variety of indemnification clauses. The Trust’s maximum exposure under these arrangements is dependent on future claims that may be made against the Portfolios and, therefore, cannot be estimated.
| | | | |
| 50 | | Wells Fargo Advantage WealthBuilder Portfolios | | Notes to financial statements (unaudited) |
10. SUBSEQUENT DISTRIBUTIONS
On December 9, 2014, the Portfolios declared distributions from short-term capital gains and long-term capital gains to shareholders of record on December 8, 2014. The per share amounts payable on December 10, 2014 were as follows:
| | | | | | | | |
| | | Short-term capital gains | | | Long-term capital gains | |
WealthBuilder Conservative Allocation Portfolio | | $ | 0.07319 | | | $ | 0.16600 | |
WealthBuilder Moderate Balanced Portfolio | | | 0.04987 | | | | 0.31481 | |
WealthBuilder Growth Balanced Portfolio | | | 0.00000 | | | | 0.48234 | |
WealthBuilder Growth Allocation Portfolio | | | 0.00000 | | | | 0.61409 | |
On December 30, 2014, the Portfolios declared distributions from net investment income to shareholders of record on December 29, 2014. The per share amounts payable on December 31, 2014 were as follows:
| | | | |
| | | Net investment income | |
WealthBuilder Conservative Allocation Portfolio | | $ | 0.03160 | |
WealthBuilder Moderate Balanced Portfolio | | | 0.06575 | |
WealthBuilder Growth Balanced Portfolio | | | 0.10440 | |
WealthBuilder Growth Allocation Portfolio | | | 0.12419 | |
These distributions are not reflected in the accompanying financial statements. The final determination of the source of all distributions is subject to change and made after the tax year-end of each Portfolio.
| | | | | | |
| Other information (unaudited) | | Wells Fargo Advantage WealthBuilder Portfolios | | | 51 | |
PROXY VOTING INFORMATION
A description of the policies and procedures used to determine how to vote proxies relating to portfolio securities is available without charge, upon request, by calling 1-800-222-8222, visiting our website at wellsfargoadvantagefunds.com, or visiting the SEC website at sec.gov. Information regarding how the proxies related to portfolio securities were voted during the most recent 12-month period ended June 30 is available without charge on the website at wellsfargoadvantagefunds.com or by visiting the SEC website at sec.gov.
PORTFOLIO HOLDINGS INFORMATION
The complete portfolio holdings for each Portfolio are publicly available on the Portfolio’s website (wellsfargoadvantagefunds.com) on a one-month delayed basis. In addition, top ten holdings information (excluding derivative positions) for each Portfolio is publicly available on the website on a monthly, seven-day or more delayed basis. Each Portfolio files its complete schedule of portfolio holdings with the SEC for the first and third quarters of each fiscal year on Form N-Q, which is available by visiting the SEC website at sec.gov. In addition, each Portfolio’s Form N-Q may be reviewed and copied at the SEC’s Public Reference Room in Washington, DC, and at regional offices in New York City, at 233 Broadway, and in Chicago, at 175 West Jackson Boulevard, Suite 900. Information about the Public Reference Room may be obtained by calling 1-800-SEC-0330.
| | | | |
| 52 | | Wells Fargo Advantage WealthBuilder Portfolios | | Other information (unaudited) |
BOARD OF TRUSTEES AND OFFICERS
Each of the Trustees and Officers1 listed in the table below acts in identical capacities for each fund in the Wells Fargo Advantage family of funds, which consists of 133 mutual funds comprising the Wells Fargo Funds Trust, Wells Fargo Variable Trust, Wells Fargo Master Trust and four closed-end funds (collectively the “Fund Complex”). This table should be read in conjunction with the Prospectus and the Statement of Additional Information2. The mailing address of each Trustee and Officer is 525 Market Street, 12th Floor, San Francisco, CA 94105. Each Trustee and Officer serves an indefinite term, however, each Trustee serves such term until reaching the mandatory retirement age established by the Trustees.
Independent Trustees
| | | | | | |
Name and year of birth | | Position held and length of service* | | Principal occupations during past five years or longer | | Other directorships during past five years |
Peter G. Gordon (Born 1942) | | Trustee, since 1998; Chairman, since 2005 | | Co-Founder, Retired Chairman, President and CEO of Crystal Geyser Water Company. Trustee Emeritus, Colby College. | | Asset Allocation Trust |
Isaiah Harris, Jr. (Born 1952) | | Trustee, since 2009 | | Retired. Prior thereto, President and CEO of BellSouth Advertising and Publishing Corp. from 2005 to 2007, President and CEO of BellSouth Enterprises from 2004 to 2005 and President of BellSouth Consumer Services from 2000 to 2003. Emeritus member of the Iowa State University Foundation Board of Governors. Emeritus Member of the Advisory Board of Iowa State University School of Business. Advisory Board Member, Palm Harbor Academy. Mr. Harris is a certified public accountant. | | CIGNA Corporation; Asset Allocation Trust |
Judith M. Johnson (Born 1949) | | Trustee, since 2008; Audit Committee Chairman, since 2008 | | Retired. Prior thereto, Chief Executive Officer and Chief Investment Officer of Minneapolis Employees Retirement Fund from 1996 to 2008. Ms. Johnson is an attorney, certified public accountant and a certified managerial accountant. | | Asset Allocation Trust |
Leroy Keith, Jr. (Born 1939) | | Trustee, since 2010** | | Chairman, Bloc Global Services (development and construction). Trustee of the Evergreen Funds complex (and its predecessors) from 1983 to 2010. Former Managing Director, Almanac Capital Management (commodities firm), former Partner, Stonington Partners, Inc. (private equity fund), former Director, Obagi Medical Products Co. and former Director, Lincoln Educational Services. | | Trustee, Virtus Fund Complex (consisting of 50 portfolios as of 12/16/2013); Asset Allocation Trust |
David F. Larcker (Born 1950) | | Trustee, since 2009 | | James Irvin Miller Professor of Accounting at the Graduate School of Business, Stanford University, Morgan Stanley Director of the Center for Leadership Development and Research and Senior Faculty of The Rock Center for Corporate Governance since 2006. From 2005 to 2008, Professor of Accounting at the Graduate School of Business, Stanford University. Prior thereto, Ernst & Young Professor of Accounting at The Wharton School, University of Pennsylvania from 1985 to 2005. | | Asset Allocation Trust |
Olivia S. Mitchell (Born 1953) | | Trustee, since 2006 | | International Foundation of Employee Benefit Plans Professor, Wharton School of the University of Pennsylvania since 1993. Director of Wharton’s Pension Research Council and Boettner Center on Pensions & Retirement Research, and Research Associate at the National Bureau of Economic Research. Previously, Cornell University Professor from 1978 to 1993. | | Asset Allocation Trust |
Timothy J. Penny (Born 1951) | | Trustee, since 1996 | | President and CEO of Southern Minnesota Initiative Foundation, a non-profit organization, since 2007 and Senior Fellow at the Humphrey Institute Policy Forum at the University of Minnesota since 1995. Member of the Board of Trustees of NorthStar Education Finance, Inc., a non-profit organization,
since 2007. | | Asset Allocation Trust |
| | | | | | |
| Other information (unaudited) | | Wells Fargo Advantage WealthBuilder Portfolios | | | 53 | |
| | | | | | |
Name and year of birth | | Position held and length of service* | | Principal occupations during past five years or longer | | Other directorships during past five years |
Michael S. Scofield (Born 1943) | | Trustee, since 2010 | | Served on the Investment Company Institute’s Board of Governors and Executive Committee from 2008-2011 as well the Governing Council of the Independent Directors Council from 2006-2011 and the Independent Directors Council Executive Committee from 2008-2011. Chairman of the IDC from 2008-2010. Institutional Investor (Fund Directions) Trustee of Year in 2007. Trustee of the Evergreen Funds complex (and its predecessors) from 1984 to 2010. Chairman of the Evergreen Funds from 2000-2010. Former Trustee of the Mentor Funds. Retired Attorney, Law Offices of Michael S. Scofield. | | Asset Allocation Trust |
Donald C. Willeke (Born 1940) | | Trustee, since 1996 | | Principal of the law firm of Willeke & Daniels. General Counsel of the Minneapolis Employees Retirement Fund from 1984 until its consolidation into the Minnesota Public Employees Retirement Association on June 30, 2010. Director and Vice Chair of The Tree Trust (non-profit corporation). Director of the American Chestnut Foundation (non-profit corporation). | | Asset Allocation Trust |
| * | Length of service dates reflect the Trustee’s commencement of service with the Trust’s predecessor entities, where applicable. |
| ** | Leroy Keith, Jr. retired as a Trustee effective December 31, 2014. |
Officers
| | | | | | |
Name and year of birth | | Position held and length of service | | Principal occupations during past five years or longer | | |
Karla M. Rabusch (Born 1959) | | President, since 2003 | | Executive Vice President of Wells Fargo Bank, N.A. and President of Wells Fargo Funds Management, LLC since 2003. | | |
Jeremy DePalma1 (Born 1974) | | Treasurer, since 2012 | | Senior Vice President of Wells Fargo Funds Management, LLC since 2009. Senior Vice President of Evergreen Investment Management Company, LLC from 2008 to 2010. Vice President, Evergreen Investment Services, Inc. from 2004 to 2007. Head of the Fund Reporting and Control Team within Fund Administration from 2005 to 2010. | | |
C. David Messman (Born 1960) | | Secretary, since 2000; Chief Legal Officer, since 2003 | | Assistant General Counsel of Wells Fargo Bank, N.A. since 2013 and Vice President and Managing Counsel of Wells Fargo Bank N.A. from 1996 to 2013. Senior Vice President and Secretary of Wells Fargo Funds Management , LLC since 2001. | | |
Debra Ann Early (Born 1964) | | Chief Compliance Officer, since 2007 | | Senior Vice President and Chief Compliance Officer of Wells Fargo Funds Management, LLC since 2007. Chief Compliance Officer of Parnassus Investments from 2005 to 2007. Chief Financial Officer of Parnassus Investments from 2004 to 2007. | | |
David Berardi (Born 1975) | | Assistant Treasurer, since 2009 | | Vice President of Wells Fargo Funds Management, LLC since 2009. Vice President of Evergreen Investment Management Company, LLC from 2008 to 2010. Assistant Vice President of Evergreen Investment Services, Inc. from 2004 to 2008. Manager of Fund Reporting and Control for Evergreen Investment Management Company, LLC from 2004 to 2010. | | |
| 1. | Jeremy DePalma acts as Treasurer of 60 funds and Assistant Treasurer of 73 funds in the Fund Complex. |
| 2. | The Statement of Additional Information includes additional information about the Trustees and is available, without charge, upon request, by calling 1-800-222-8222 or by visiting the website at wellsfargoadvantagefunds.com. |
| | | | |
| 54 | | Wells Fargo Advantage WealthBuilder Portfolios | | List of abbreviations |
The following is a list of common abbreviations for terms and entities that may have appeared in this report.
| ACA | — ACA Financial Guaranty Corporation |
| ADR | — American depositary receipt |
| ADS | — American depositary shares |
| AGC | — Assured Guaranty Corporation |
| AGM | — Assured Guaranty Municipal |
| Ambac | — Ambac Financial Group Incorporated |
| AMT | — Alternative minimum tax |
| BAN | — Bond anticipation notes |
| BHAC | — Berkshire Hathaway Assurance Corporation |
| CAB | — Capital appreciation bond |
| CCAB | — Convertible capital appreciation bond |
| CDA | — Community Development Authority |
| CDO | — Collateralized debt obligation |
| DRIVER | — Derivative inverse tax-exempt receipts |
| DW&P | — Department of Water & Power |
| DWR | — Department of Water Resources |
| ECFA | — Educational & Cultural Facilities Authority |
| EDA | — Economic Development Authority |
| EDFA | — Economic Development Finance Authority |
| ETF | — Exchange-traded fund |
| FDIC | — Federal Deposit Insurance Corporation |
| FFCB | — Federal Farm Credit Banks |
| FGIC | — Financial Guaranty Insurance Corporation |
| FHA | — Federal Housing Administration |
| FHLB | — Federal Home Loan Bank |
| FHLMC | — Federal Home Loan Mortgage Corporation |
| FICO | — The Financing Corporation |
| FNMA | — Federal National Mortgage Association |
| GDR | — Global depositary receipt |
| GNMA | — Government National Mortgage Association |
| HCFR | — Healthcare facilities revenue |
| HEFA | — Health & Educational Facilities Authority |
| HEFAR | — Higher education facilities authority revenue |
| HFA | — Housing Finance Authority |
| HFFA | — Health Facilities Financing Authority |
| HUD | — Department of Housing and Urban Development |
| IDA | — Industrial Development Authority |
| IDAG | — Industrial Development Agency |
| KRW | — Republic of Korea won |
| LIBOR | — London Interbank Offered Rate |
| LLC | — Limited liability company |
| LLLP | — Limited liability limited partnership |
| LLP | — Limited liability partnership |
| MBIA | — Municipal Bond Insurance Association |
| MFHR | — Multifamily housing revenue |
| MSTR | — Municipal securities trust receipts |
| MUD | — Municipal Utility District |
| National | — National Public Finance Guarantee Corporation |
| PCFA | — Pollution Control Financing Authority |
| PCL | — Public Company Limited |
| PCR | — Pollution control revenue |
| PFA | — Public Finance Authority |
| PFFA | — Public Facilities Financing Authority |
| PFOTER | — Puttable floating option tax-exempt receipts |
| plc | — Public limited company |
| PUTTER | — Puttable tax-exempt receipts |
| R&D | — Research & development |
| Radian | — Radian Asset Assurance |
| RAN | — Revenue anticipation notes |
| RDA | — Redevelopment Authority |
| RDFA | — Redevelopment Finance Authority |
| REIT | — Real estate investment trust |
| ROC | — Reset option certificates |
| SAVRS | — Select auction variable rate securities |
| SBA | — Small Business Authority |
| SFHR | — Single-family housing revenue |
| SFMR | — Single-family mortgage revenue |
| SPA | — Standby purchase agreement |
| SPDR | — Standard & Poor’s Depositary Receipts |
| STRIPS | — Separate trading of registered interest and |
| TAN | — Tax anticipation notes |
| TIPS | — Treasury inflation-protected securities |
| TRAN | — Tax revenue anticipation notes |
| TTFA | — Transportation Trust Fund Authority |
| TVA | — Tennessee Valley Authority |
This page is intentionally left blank.
This page is intentionally left blank.


For more information
More information about Wells Fargo Advantage Funds is available free upon request. To obtain literature, please write, email, visit the Fund’s website, or call:
Wells Fargo Advantage Funds
P.O. Box 8266
Boston, MA 02266-8266
Email: wfaf@wellsfargo.com
Website: wellsfargoadvantagefunds.com
Individual investors: 1-800-222-8222
Retail investment professionals: 1-888-877-9275
Institutional investment professionals: 1-866-765-0778
This report and the financial statements contained herein are submitted for the general information of the shareholders of Wells Fargo Advantage Funds. If this report is used for promotional purposes, distribution of the report must be accompanied or preceded by a current prospectus. Before investing, please consider the investment objectives, risks, charges, and expenses of the investment. For a current prospectus and, if available, a summary prospectus, containing this information, call 1-800-222-8222 or visit the Fund’s website at wellsfargoadvantagefunds.com. Read the prospectus carefully before you invest or send money.
Wells Fargo Funds Management, LLC, a wholly owned subsidiary of Wells Fargo & Company, provides investment advisory and administrative services for Wells Fargo Advantage Funds. Other affiliates of Wells Fargo & Company provide subadvisory and other services for the Funds. The Funds are distributed by Wells Fargo Funds Distributor, LLC, Member FINRA/SIPC, an affiliate of Wells Fargo & Company.
NOT FDIC INSURED ¡ NO BANK GUARANTEE ¡ MAY LOSE VALUE
© 2014 Wells Fargo Funds Management, LLC. All rights reserved.
| | |
 | | 229723 01-15 SWBP/SAR102 11-14 |
Not applicable.
| ITEM 3. | AUDIT COMMITTEE FINANCIAL EXPERT |
Not applicable.
| ITEM 4. | PRINCIPAL ACCOUNTANT FEES AND SERVICES |
Not applicable.
| ITEM 5. | AUDIT COMMITTEE OF LISTED REGISTRANTS |
Not applicable.
A Portfolio of Investments for each Fund is included as part of the report to shareholders filed under Item 1 of this Form.
| ITEM 7. | DISCLOSURE OF PROXY VOTING POLICIES AND PROCEDURES FOR CLOSED-END MANAGEMENT INVESTMENT COMPANIES |
Not applicable.
| ITEM 8. | PORTFOLIO MANAGERS OF CLOSED-END MANAGEMENT INVESTMENT COMPANIES |
Not applicable.
| ITEM 9. | PURCHASES OF EQUITY SECURITIES BY CLOSED-END MANAGEMENT INVESTMENT COMPANY AND AFFILIATED PURCHASERS |
Not applicable.
| ITEM 10. | SUBMISSION OF MATTERS TO A VOTE OF SECURITY HOLDERS |
There have been no material changes to the procedures by which shareholders may recommend nominees to the registrant’s Board of Trustees that have been implemented since the registrant’s last provided disclosure in response to the requirements of this Item.
| ITEM 11. | CONTROLS AND PROCEDURES |
(a) The President and Treasurer have concluded that the Wells Fargo Funds Trust (the “Trust”) disclosure controls and procedures (as defined in Rule 30a-3(c) under the Investment Company Act of 1940) provide reasonable assurances that material information relating to the Trust is made known to them by the appropriate persons, based on their evaluation of these controls and procedures as of a date within 90 days of the filing of this report.
(b) There were no significant changes in the Trust’s internal controls over financial reporting (as defined in Rule 30a-3(d) under the Investment Company Act of 1940) that occurred during the second fiscal quarter of the period covered by this report that materially affected, or is reasonably likely to materially affect, the registrant’s internal control over financial reporting.
(a)(1) Not applicable.
(a)(2) Certification pursuant to Rule 30a-2(a) under the Investment Company Act of 1940 (17 CFR 270.30a-2(a)) is filed and attached hereto as Exhibit 99.CERT.
(a)(3) Not applicable.
(b) Certification pursuant to Rule 30a-2(b) under the Investment Company Act of 1940 (17 CFR 270.30a-2(b)) is filed and attached hereto as Exhibit 99.906CERT.
SIGNATURES
Pursuant to the requirements of the Securities Exchange Act of 1934 and the Investment Company Act of 1940, the registrant has duly caused this report to be signed on its behalf by the undersigned, thereunto duly authorized.
| | |
| Wells Fargo Funds Trust |
| |
| By: | | /s/ Karla M. Rabusch |
| | Karla M. Rabusch |
| | President |
| |
| Date: | | January 27, 2015 |
Pursuant to the requirements of the Securities Exchange Act of 1934 and the Investment Company Act of 1940, this report has been signed below by the following persons on behalf of the registrant and in the capacities and on the date indicated.
| | |
| Wells Fargo Funds Trust |
| |
| By: | | /s/ Karla M. Rabusch |
| | Karla M. Rabusch |
| | President |
| |
| Date: | | January 27, 2015 |
| | |
| By: | | /s/ Nancy Wiser |
| | Nancy Wiser |
| | Treasurer |
| |
| Date: | | January 27, 2015 |
| |
| By: | | /s/ Jeremy DePalma |
| | Jeremy DePalma |
| | Treasurer |
| |
| Date: | | January 27, 2015 |