
UNITED STATES
SECURITIES AND EXCHANGE COMMISSION
Washington, D.C. 20549
FORM N-CSRS
CERTIFIED SHAREHOLDER REPORT OF REGISTERED
MANAGEMENT INVESTMENT COMPANIES
Investment Company Act file number: 811-09253
Wells Fargo Funds Trust
(Exact name of registrant as specified in charter)
525 Market St., San Francisco, CA 94105
(Address of principal executive offices) (Zip code)
C. David Messman
Wells Fargo Funds Management, LLC
525 Market St., San Francisco, CA 94105
(Name and address of agent for service)
Registrant’s telephone number, including area code: 800-222-8222
Date of fiscal year end: The following 14 series of Wells Fargo Funds Trust have a June 30 fiscal year end:
Wells Fargo Advantage Global Long/Short Fund, Wells Fargo Advantage California Limited-Term Tax-Free Fund, Wells Fargo Advantage California Tax-Free Fund, Wells Fargo Advantage Colorado Tax-Free Fund, Wells Fargo Advantage High Yield Municipal Bond Fund, Wells Fargo Advantage Intermediate Tax/AMT-Free Fund, Wells Fargo Advantage Minnesota Tax-Free Fund, Wells Fargo Advantage Municipal Bond Fund, Wells Fargo Advantage North Carolina Tax-Free Fund, Wells Fargo Advantage Pennsylvania Tax-Free Fund, Wells Fargo Advantage Short-Term Municipal Bond Fund, Wells Fargo Advantage Strategic Municipal Bond Fund, Wells Fargo Advantage Ultra Short-Term Municipal Income Fund, and Wells Fargo Advantage Wisconsin Tax-Free Fund.
Date of reporting period: December 31, 2014
| ITEM 1. | REPORT TO STOCKHOLDERS |

Wells Fargo Advantage Global Long/Short Fund

Semi-Annual Report
December 31, 2014

Reduce clutter. Save trees.
Sign up for electronic delivery of prospectuses and shareholder reports at wellsfargo.com/advantagedelivery
Contents
The views expressed and any forward-looking statements are as of December 31, 2014, unless otherwise noted, and are those of the Fund managers and/or Wells Fargo Funds Management, LLC. Discussions of individual securities, or the markets generally, or any Wells Fargo Advantage Fund are not intended as individual recommendations. Future events or results may vary significantly from those expressed in any forward-looking statements; the views expressed are subject to change at any time in response to changing circumstances in the market. Wells Fargo Funds Management, LLC and the Fund disclaim any obligation to publicly update or revise any views expressed or forward-looking statements.
NOT FDIC INSURED ¡ NO BANK GUARANTEE ¡ MAY LOSE VALUE
| | | | |
| 2 | | Wells Fargo Advantage Global Long/Short Fund | | Letter to shareholders (unaudited) |

Karla M. Rabusch
President
Wells Fargo Advantage Funds
In December, the Federal Open Market Committee (FOMC), which is the U.S. Federal Reserve’s (Fed’s) monetary policymaking body, kept its key interest rate near zero.
Dear Valued Shareholder:
We are pleased to provide you with the first shareholder report for the Wells Fargo Advantage Global Long/Short Fund from the Fund’s inception on November 28, 2014, through December 31, 2014. The period was marked by lingering geopolitical uncertainty as the U.S. and Europe continued to confront Russia over Ukraine and as the U.S. and its allies confronted Islamic militants (formerly known as ISIS) in Syria and Iraq. The U.S. stock market outperformed most international markets. The S&P 500 Index1, a proxy for U.S. large-cap stocks, ended the period with a 0.42% loss. Meanwhile, the MSCI EAFE Index (Net)2, a proxy for international developed markets, ended with a 3.46% loss, and the MSCI Emerging Markets Index (Net)3, a proxy for emerging markets, posted a 4.61% loss.
Major central banks continued to provide liquidity to the markets.
In December, the Federal Open Market Committee (FOMC), which is the U.S. Federal Reserve’s (Fed’s) monetary policymaking body, kept its key interest rate near zero. This tended to support global markets given the Fed’s role in providing investor liquidity. The FOMC ended its quantitative easing program in late October 2014 (prior to the reporting period) and issued guidance that led investors to expect an interest-rate hike sometime in 2015.
The European Central Bank continued to employ a variety of measures aimed at encouraging lending, including making funds available to banks at low interest rates and imposing a negative interest rate on bank deposits held at the central bank, while the Bank of Japan maintained an aggressive monetary program aimed at combating deflation.
The U.S. market rose against the backdrop of a challenging geopolitical situation and slowing global growth.
Geopolitical events were major negatives during the month. The ongoing standoff between the West (the U.S., Europe, and their allies) and Russia over Ukraine began in early 2014 and continued throughout the remainder of the year. As of December 2014, it seemed unlikely that the situation would result in a war between Russia and the West, though a civil war raged in Ukraine. However, economic sanctions from the West against Russia and from Russia against the West contributed to slower growth in Europe, a key Russian trading partner. In the Middle East, the advance of Islamic militants in Syria and Iraq led to airstrikes by the U.S. and its allies.
| 1. | The S&P 500 Index consists of 500 stocks chosen for market size, liquidity, and industry group representation. It is a market-value-weighted index with each stock’s weight in the index proportionate to its market value. You cannot invest directly in an index. |
| 2. | The Morgan Stanley Capital International Europe, Australasia, and Far East (MSCI EAFE) Index (Net) is an unmanaged group of securities widely regarded by investors to be representations of the stock markets of Europe, Australasia, and the Far East. Calculations for EAFE use net dividends, which reflect the deduction of withholding taxes. You cannot invest directly in an index. Source: MSCI. MSCI makes no express or implied warranties or representations and shall have no liability whatsoever with respect to any MSCI data contained herein. The MSCI data may not be further redistributed or used as a basis for other indexes or any securities or financial products. This report is not approved, reviewed, or produced by MSCI. |
| 3. | The Morgan Stanley Capital International (MSCI) Emerging Markets Index (Net) is a free float-adjusted market-capitalization-weighted index designed to measure the equity market performance in the global emerging markets. The index is currently composed of 21 emerging markets country indexes. You cannot invest directly in an index. |
| | | | | | |
| Letter to shareholders (unaudited) | | Wells Fargo Advantage Global Long/Short Fund | | | 3 | |
Market volatility increased in December as renewed fears of slowing global growth took hold and investors began to price in expectations that the FOMC was finally looking to raise short-term interest rates. Slower European growth combined with expectations of higher U.S. interest rates to send the euro lower, pressuring European returns for U.S. dollar–denominated investors. Returns in Asia were dampened by a sluggish Japanese economy as well as softness in the yen. Among countries in the MSCI EAFE Index (Net), major markets such as Japan, Germany, and France ended the period with losses. Among emerging markets, hopes for an economic soft landing in China faded as the country produced lower-than-expected economic results. Russia also posted sharply negative returns as a result of its standoff with the West.
Don’t let short-term uncertainty derail long-term investment goals.
Periods of uncertainty can present challenges, but experience has taught us that maintaining long-term investment goals can be an effective way to plan for the future. To help you create a sound strategy based on your personal goals and risk tolerance, Wells Fargo Advantage Funds offers more than 100 mutual funds and other investments spanning a wide range of asset classes and investment styles. Although diversification cannot guarantee an investment profit or prevent losses, we believe it can be an effective way to manage investment risk and potentially smooth out overall portfolio performance. We encourage investors to know their investments and to understand that appropriate levels of risk-taking may unlock opportunities.
Thank you for choosing to invest with Wells Fargo Advantage Funds. We appreciate your confidence in us and remain committed to helping you meet your financial needs. For current information about your fund investments, contact your investment professional, visit our website at wellsfargoadvantagefunds.com, or call us directly at 1-800-222-8222. We are available 24 hours a day, 7 days a week.
Sincerely,

Karla M. Rabusch
President
Wells Fargo Advantage Funds
Slower European growth combined with expectations of higher U.S. interest rates to send the euro lower, pressuring European returns for U.S. dollar–denominated investors.
| | | | |
| 4 | | Wells Fargo Advantage Global Long/Short Fund | | Performance highlights (unaudited) |
Investment objective
The Fund seeks long-term capital appreciation
Adviser
Wells Fargo Funds Management, LLC
Subadviser
Wells Capital Management Incorporated
Portfolio managers
Jeffrey Everett, CFA
Dale A. Winner, CFA
Average annual total returns (%) as of December 31, 2014
| | | | | | | | | | | | | | | | | | |
| | | | | Including sales charge | | | Excluding sales charge | | | Expense ratios1 (%) | |
| | | Inception date | | Since inception | | | Since inception | | | Gross | | | Net2 | |
| Class A (WGLAX) | | 11-28-2014 | | | (6.13 | ) | | | (0.40 | ) | | | 3.21 | | | | 2.81 | |
| Class C (WGLCX) | | 11-28-2014 | | | (1.50 | ) | | | (0.50 | ) | | | 3.96 | | | | 3.56 | |
| Administrator Class (WGLDX) | | 11-28-2014 | | | – | | | | (0.40 | ) | | | 3.05 | | | | 2.71 | |
| Institutional Class (WGLSX) | | 11-28-2014 | | | – | | | | (0.40 | ) | | | 2.78 | | | | 2.51 | |
| Barclays U.S. Aggregate Bond Index3 | | – | | | – | | | | 0.09 | | | | – | | | | – | |
| Credit Suisse Liquid Alternatives Beta Index4 | | – | | | – | | | | (0.28 | ) | | | – | | | | – | |
Figures quoted represent past performance, which is no guarantee of future results, and do not reflect taxes that a shareholder may pay on fund distributions or the redemption of fund shares. Investment return and principal value of an investment will fluctuate so that an investor’s shares, when redeemed, may be worth more or less than their original cost. Performance shown without sales charges would be lower if sales charges were reflected. Current performance may be lower or higher than the performance data quoted, which assumes the reinvestment of dividends and capital gains. Current month-end performance is available on the Fund’s website, wellsfargoadvantagefunds.com.
Index returns do not include transaction costs associated with buying and selling securities, any mutual fund fees or expenses, or any taxes. It is not possible to invest directly in an index.
For Class A shares, the maximum front-end sales charge is 5.75%. For Class C shares, the maximum contingent deferred sales charge is 1.00%. Performance including a contingent deferred sales charge assumes the sales charge for the corresponding time period. Administrator Class and Institutional Class shares are sold without a front-end sales charge or contingent deferred sales charge.
Stock values fluctuate in response to the activities of individual companies and general market and economic conditions. Foreign investments are especially volatile and can rise or fall dramatically due to differences in the political and economic conditions of the host country. These risks are generally intensified in emerging markets. The use of derivatives may reduce returns and/or increase volatility. There are numerous risks associated with transactions in options on securities. Borrowing money to purchase securities or cover short positions magnifies losses and incurs expenses. Short selling is generally considered speculative, has the potential for unlimited loss, and may involve leverage. Certain investment strategies tend to increase the total risk of an investment (relative to the broader market). The Fund is exposed to smaller-company securities risk. Consult the Fund’s prospectus for additional information on these and other risks.
Please see footnotes on page 6.
| | | | | | |
| Performance highlights (unaudited) | | Wells Fargo Advantage Global Long/Short Fund | | | 5 | |
| | | | |
| Ten largest long positions5 (%) as of December 31, 2014 | |
Hitachi Limited | | | 2.52 | |
Invesco Limited | | | 2.35 | |
Akzo Nobel NV | | | 2.16 | |
ABB Limited | | | 2.11 | |
China Everbright Limited | | | 2.00 | |
Siemens AG | | | 1.93 | |
Vodafone Group plc | | | 1.91 | |
Mitsubishi UFJ Financial Group Incorporated | | | 1.90 | |
Nomura Holdings Incorporated | | | 1.87 | |
American International Group Incorporated | | | 1.84 | |
| | | | |
| Ten largest short positions5 (%) as of December 31, 2014 | |
iShares MSCI EAFE ETF | | | (4.01) | |
iShares MSCI EMU ETF | | | (1.51) | |
Nestle SA | | | (1.45) | |
Wisdomtree Investments Incorporated | | | (1.22) | |
Veolia Environnement Services | | | (1.18) | |
Kone Oyj | | | (1.17) | |
iShares MSCI Switzerland Capped ETF | | | (1.16) | |
Isetan Mitsukoshi Holdings Limited | | | (1.12) | |
Diageo plc | | | (1.11) | |
iShares MSCI Canada ETF | | | (1.07) | |
| | | | | | | | |
Sector allocation6 as of December 31, 2014 | |
| | | | Gross Exposure (%) | | | | Net Exposure (%) | |
Consumer Discretionary | | | 8 | | | | 1 | |
Consumer Staples | | | 8 | | | | (9) | |
Energy | | | 1 | | | | 2 | |
Financials | | | 31 | | | | 69 | |
Health Care | | | 5 | | | | 13 | |
Industrials | | | 16 | | | | 19 | |
Information Technology | | | 9 | | | | 24 | |
Materials | | | 3 | | | | 8 | |
Telecommunication Services | | | 5 | | | | 9 | |
Other | | | 14 | | | | (36) | |
| | | | 100 | | | | 100 | |
| | | | | | | | |
Country allocation6 as of December 31, 2014 | |
| | | | Gross Exposure (%) | | | | Net Exposure (%) | |
Canada | | | 2 | | | | 4 | |
China | | | 2 | | | | 6 | |
Finland | | | 2 | | | | (4) | |
France | | | 2 | | | | (5) | |
Germany | | | 6 | | | | 15 | |
Hong Kong | | | 5 | | | | 14 | |
Ireland | | | 2 | | | | 4 | |
Italy | | | 4 | | | | 12 | |
Japan | | | 21 | | | | 34 | |
Netherlands | | | 4 | | | | 4 | |
Switzerland | | | 8 | | | | 6 | |
United Kingdom | | | 10 | | | | 19 | |
United States | | | 29 | | | | (8) | |
Other | | | 3 | | | | (1) | |
| | | | 100 | | | | 100 | |
Please see footnotes on page 6.
| | | | |
| 6 | | Wells Fargo Advantage Global Long/Short Fund | | Performance highlights (unaudited) |
| 1. | Reflects the expense ratios as stated in the most recent prospectuses. The expense ratios shown are subject to change and may differ from the annualized expense ratios shown in the financial highlights of this report. |
| 2. | The Adviser has committed through October 31, 2016, to waive fees and/or reimburse expenses to the extent necessary to cap the Fund’s Total Annual Fund Operating Expenses After Fee Waiver, excluding certain expenses, at 1.75% for Class A, 2.50% for Class C, 1.65% for Administrator Class, and 1.45% for Institutional Class. After this time, the cap may be increased or the commitment to maintain the cap may be terminated only with the approval of the Board of Trustees. Brokerage commissions, stamp duty fees, interest, taxes, acquired fund fees and expenses, and extraordinary expenses are excluded from the cap. Without this cap, the Fund’s returns would have been lower. |
| 3. | The Barclays U.S. Aggregate Bond Index is a broad-based benchmark that measures the investment-grade, U.S. dollar-denominated, fixed-rate taxable bond market, including Treasuries, government-related and corporate securities, MBS (agency fixed-rate and hybrid ARM passthroughs), ABS, and CMBS. You cannot invest directly in an index. |
| 4. | The Credit Suisse Liquid Alternatives Beta Index reflects the returns of a dynamic basket of liquid, investable market factors selected and weighted in accordance with an algorithm that aims to approximate the returns of the universe of hedge fund managers, as represented by the Credit Suisse Hedge Fund Index. You cannot invest directly in an index. |
| 5. | The ten largest long and short positions are calculated based on the value of the securities divided by total net assets of the Fund. Holdings are subject to change and may have changed since the date specified. |
| 6. | Allocation is subject to change and is calculated based on the total long-term investments of the Fund. |
| | | | | | |
| Fund expenses (unaudited) | | Wells Fargo Advantage Global Long/Short Fund | | | 7 | |
As a shareholder of the Fund, you incur two types of costs: (1) transaction costs, including sales charges (loads) on purchase payments and contingent deferred sales charges (if any) on redemptions and (2) ongoing costs, including management fees, distribution (12b-1) and/or shareholder service fees, and other Fund expenses. This example is intended to help you understand your ongoing costs (in dollars) of investing in the Fund and to compare these costs with the ongoing costs of investing in other mutual funds.
The example is based on an investment of $1,000 invested at the beginning of the six-month period and held for the entire period from July 1, 2014 to December 31, 2014.
Actual expenses
The “Actual” line of the table below provides information about actual account values and actual expenses. You may use the information in this line, together with the amount you invested, to estimate the expenses that you paid over the period. Simply divide your account value by $1,000 (for example, an $8,600 account value divided by $1,000 = 8.6), then multiply the result by the number in the “Actual” line under the heading entitled “Expenses paid during period” for your applicable class of shares to estimate the expenses you paid on your account during this period.
Hypothetical example for comparison purposes
The “Hypothetical” line of the table below provides information about hypothetical account values and hypothetical expenses based on the Fund’s actual expense ratio and an assumed rate of return of 5% per year before expenses, which is not the Fund’s actual return. The hypothetical account values and expenses may not be used to estimate the actual ending account balance or expenses you paid for the period. You may use this information to compare the ongoing costs of investing in the Fund and other funds. To do so, compare this 5% hypothetical example with the 5% hypothetical examples that appear in the shareholder reports of the other funds.
Please note that the expenses shown in the table are meant to highlight your ongoing costs only and do not reflect any transactional costs, such as sales charges (loads) and contingent deferred sales charges. Therefore, the “Hypothetical” line of the table is useful in comparing ongoing costs only and will not help you determine the relative total costs of owning different funds. In addition, if these transactional costs were included, your costs would have been higher.
| | | | | | | | | | | | | | | | |
| | | Beginning
account value
7-1-2014 | | | Ending
account value
12-31-2014 | | | Expenses
paid during
the period¹ | | | Net annualized
expense ratio | |
Class A | | | | | | | | | | | | | | | | |
Actual | | $ | 1,000.00 | | | $ | 996.00 | | | $ | 13.48 | | | | 2.68 | % |
Hypothetical (5% return before expenses) | | $ | 1,000.00 | | | $ | 1,011.70 | | | $ | 13.59 | | | | 2.68 | % |
Class C | | | | | | | | | | | | | | | | |
Actual | | $ | 1,000.00 | | | $ | 995.00 | | | $ | 17.25 | | | | 3.43 | % |
Hypothetical (5% return before expenses) | | $ | 1,000.00 | | | $ | 1,007.91 | | | $ | 17.36 | | | | 3.43 | % |
Administrator Class | | | | | | | | | | | | | | | | |
Actual | | $ | 1,000.00 | | | $ | 996.00 | | | $ | 12.98 | | | | 2.58 | % |
Hypothetical (5% return before expenses) | | $ | 1,000.00 | | | $ | 1,012.20 | | | $ | 13.09 | | | | 2.58 | % |
Institutional Class | | | | | | | | | | | | | | | | |
Actual | | $ | 1,000.00 | | | $ | 996.00 | | | $ | 11.97 | | | | 2.38 | % |
Hypothetical (5% return before expenses) | | $ | 1,000.00 | | | $ | 1,013.21 | | | $ | 12.08 | | | | 2.38 | % |
| 1. | Expenses paid is equal to the annualized expense ratio of each class multiplied by the average account value over the period, multiplied by the number of days in the most recent fiscal half-year divided by the number of days in the fiscal year (to reflect the one-half-year period). |
| | | | |
| 8 | | Wells Fargo Advantage Global Long/Short Fund | | Portfolio of investments—December 31, 2014 (unaudited) |
| | | | | | | | | | | | |
| Security name | | | | | | Shares | | | Value | |
| | | | |
Common Stocks: 50.65% | | | | | | | | | | | | |
| | | | |
| Canada: 1.21% | | | | | | | | | | | | |
Valeant Pharmaceuticals International Incorporated (Health Care, Pharmaceuticals)† | | | | | | | 841 | | | $ | 120,356 | |
| | | | | | | | | | | | |
| | | | |
| China: 1.81% | | | | | | | | | | | | |
Dongfeng Motor Group Company Limited (Consumer Discretionary, Automobiles) | | | | | | | 44,000 | | | | 61,548 | |
Industrial & Commercial Bank of China Limited Class H (Financials, Banks) | | | | | | | 163,000 | | | | 119,021 | |
| | | | |
| | | | | | | | | | | 180,569 | |
| | | | | | | | | | | | |
| | | | |
| Germany: 4.34% | | | | | | | | | | | | |
Metro AG (Consumer Staples, Food & Staples Retailing) † | | | | | | | 3,734 | | | | 114,140 | |
Siemens AG (Industrials, Industrial Conglomerates) | | | | | | | 1,711 | | | | 191,981 | |
Volkswagen AG (Consumer Discretionary, Automobiles) | | | | | | | 568 | | | | 126,241 | |
| | | | |
| | | | | | | | | | | 432,362 | |
| | | | | | | | | | | | |
| | | | |
| Hong Kong: 3.90% | | | | | | | | | | | | |
China Everbright Limited (Financials, Capital Markets) | | | | | | | 84,000 | | | | 198,776 | |
China Mobile Limited (Telecommunication Services, Wireless Telecommunication Services) | | | | | | | 10,500 | | | | 122,984 | |
Value Partners Group Limited (Financials, Capital Markets) | | | | | | | 80,000 | | | | 66,761 | |
| | | | |
| | | | | | | | | | | 388,521 | |
| | | | | | | | | | | | |
| | | | |
| Ireland: 1.14% | | | | | | | | | | | | |
Endo International plc (Health Care, Pharmaceuticals) † | | | | | | | 1,567 | | | | 113,012 | |
| | | | | | | | | | | | |
| | | | |
| Italy: 3.27% | | | | | | | | | | | | |
Anima Holding SpA (Financials, Capital Markets) † | | | | | | | 11,948 | | | | 60,108 | |
ENI SpA (Energy, Oil, Gas & Consumable Fuels) | | | | | | | 3,560 | | | | 62,359 | |
Intesa Sanpaolo SpA (Financials, Banks) | | | | | | | 22,014 | | | | 63,860 | |
Prysmian SpA (Industrials, Electrical Equipment) | | | | | | | 7,659 | | | | 139,576 | |
| | | | |
| | | | | | | | | | | 325,903 | |
| | | | | | | | | | | | |
| | | | |
| Japan: 12.77% | | | | | | | | | | | | |
Daiwa House Industry Company Limited (Financials, Real Estate Management & Development) | | | | | | | 8,200 | | | | 154,908 | |
Hitachi Limited (Information Technology, Electronic Equipment, Instruments & Components) | | | | | | | 34,000 | | | | 250,946 | |
Mitsubishi UFJ Financial Group Incorporated (Financials, Banks) | | | | | | | 34,400 | | | | 189,001 | |
Mitsui Fudosan Company Limited (Financials, Real Estate Management & Development) | | | | | | | 6,000 | | | | 160,893 | |
Mitsui OSK Lines Limited (Industrials, Marine) | | | | | | | 31,000 | | | | 91,845 | |
Nomura Holdings Incorporated (Financials, Capital Markets) | | | | | | | 32,900 | | | | 186,182 | |
Toyota Motor Corporation (Consumer Discretionary, Automobiles) | | | | | | | 2,000 | | | | 124,635 | |
Yaskawa Electric Corporation (Information Technology, Electronic Equipment, Instruments & Components) | | | | | | | 8,900 | | | | 113,681 | |
| | | | |
| | | | | | | | | | | 1,272,091 | |
| | | | | | | | | | | | |
| | | | |
| Netherlands: 2.16% | | | | | | | | | | | | |
Akzo Nobel NV (Materials, Chemicals) | | | | | | | 3,112 | | | | 215,319 | |
| | | | | | | | | | | | |
| | | | |
| Norway: 0.62% | | | | | | | | | | | | |
Marine Harvest ASA (Consumer Staples, Food Products) | | | | | | | 4,460 | | | | 61,238 | |
| | | | | | | | | | | | |
| | | | |
| Switzerland: 3.86% | | | | | | | | | | | | |
ABB Limited (Industrials, Electrical Equipment) | | | | | | | 9,938 | | | | 210,633 | |
UBS AG (Financials, Capital Markets) | | | | | | | 3,309 | | | | 54,604 | |
The accompanying notes are an integral part of these financial statements.
| | | | | | |
| Portfolio of investments—December 31, 2014 (unaudited) | | Wells Fargo Advantage Global Long/Short Fund | | | 9 | |
| | | | | | | | | | | | | | | | |
| Security name | | | | | | | | Shares | | | Value | |
| | | | |
| Switzerland (continued) | | | | | | | | | | | | | | | | |
Zurich Financial Services AG (Financials, Insurance) | | | | | | | | | | | 382 | | | $ | 119,376 | |
| | | | |
| | | | | | | | | | | | | | | 384,613 | |
| | | | | | | | | | | | | | | | |
| | | | |
| United Kingdom: 6.06% | | | | | | | | | | | | | | | | |
Capita plc (Industrials, Professional Services) | | | | | | | | | | | 5,367 | | | | 89,992 | |
Man Group plc (Financials, Capital Markets) | | | | | | | | | | | 65,610 | | | | 163,262 | |
Smiths Group plc (Industrials, Industrial Conglomerates) | | | | | | | | | | | 5,567 | | | | 94,662 | |
Vodafone Group plc (Telecommunication Services, Wireless Telecommunication Services) | | | | | | | | | | | 55,390 | | | | 189,912 | |
Wolseley plc (Industrials, Trading Companies & Distributors) | | | | | | | | | | | 1,147 | | | | 65,576 | |
| | | | |
| | | | | | | | | | | | | | | 603,404 | |
| | | | | | | | | | | | | | | | |
| | | | |
| United States: 9.51% | | | | | | | | | | | | | | | | |
Agilent Technologies Incorporated (Health Care, Life Sciences Tools & Services) (b) | | | | | | | | | | | 1,574 | | | | 64,440 | |
American International Group Incorporated (Financials, Insurance) (b) | | | | | | | | | | | 3,278 | | | | 183,601 | |
Google Incorporated Class C (Information Technology, Internet Software & Services) †(b) | | | | | | | | | | | 263 | | | | 138,443 | |
Invesco Limited (Financials, Capital Markets) | | | | | | | | | | | 5,933 | | | | 234,472 | |
KKR & Company LP (Financials, Capital Markets) (b) | | | | | | | | | | | 4,417 | | | | 102,519 | |
Merck & Company Incorporated (Health Care, Pharmaceuticals) (b) | | | | | | | | | | | 1,087 | | | | 61,731 | |
QUALCOMM Incorporated (Information Technology, Communications Equipment) (b) | | | | | | | | | | | 2,185 | | | | 162,408 | |
| | | | |
| | | | | | | | | | | | | | | 947,614 | |
| | | | | | | | | | | | | | | | |
| | | | |
Total Common Stocks (Cost $5,160,342) | | | | | | | | | | | | | | | 5,045,002 | |
| | | | | | | | | | | | | | | | |
| | | | |
| | | | | | Expiration date | | | | | | | |
| Participation Notes: 0.58% | | | | | | | | | | | | | | | | |
| | | | |
| China: 0.58% | | | | | | | | | | | | | | | | |
HSBC Bank plc (Kweichow Moutai Company Limited) (Consumer Staples, Beverages) † | | | | | | | 9-2-2020 | | | | 1,900 | | | | 58,044 | |
| | | | | | | | | | | | | | | | |
| | | | |
Total Participation Notes (Cost $53,236) | | | | | | | | | | | | | | | 58,044 | |
| | | | | | | | | | | | | | | | |
| | | | |
| | | Strike price | | | | | | Contracts | | | | |
| Purchased Put Options: 0.00% | | | | | | | | | | | | | | | | |
S&P 500 Index | | | 190 USD | | | | 1-2-2015 | | | | 1,800 | | | | 18 | |
| | | | | | | | | | | | | | | | |
| | | | |
Total Purchased Put Options (Cost $658) | | | | | | | | | | | | | | | 18 | |
| | | | | | | | | | | | | | | | |
| | | | |
| | | Yield | | | | | | Shares | | | | |
| Short-Term Investments: 43.77% | | | | | | | | | | | | | | | | |
| | | | |
| Investment Companies: 43.77% | | | | | | | | | | | | | | | | |
Wells Fargo Advantage Cash Investment Money Market Fund, Select Class (l)(u) | | | 0.08 | % | | | | | | | 4,360,442 | | | | 4,360,442 | |
| | | | | | | | | | | | | | | | |
| | | | |
Total Short-Term Investments (Cost $4,360,442) | | | | | | | | | | | | | | | 4,360,442 | |
| | | | | | | | | | | | | | | | |
| | | | |
Securities Sold Short: (22.84%) | | | | | | | | | | | | | | | | |
| | | | |
Common Stocks: (12.66%) | | | | | | | | | | | | | | | | |
| | | | |
| Finland: (1.17%) | | | | | | | | | | | | | | | | |
Kone Oyj (Industrials, Machinery) | | | | | | | | | | | (2,571 | ) | | | (117,052 | ) |
| | | | | | | | | | | | | | | | |
The accompanying notes are an integral part of these financial statements.
| | | | |
| 10 | | Wells Fargo Advantage Global Long/Short Fund | | Portfolio of investments—December 31, 2014 (unaudited) |
| | | | | | | | | | | | |
| Security name | | | | | | Shares | | | Value | |
| | | | |
| France: (1.57%) | | | | | | | | | | | | |
Peugeot SA (Consumer Discretionary, Automobiles) † | | | | | | | (3,172 | ) | | $ | (38,865 | ) |
Veolia Environnement Services (Industrials, Commercial Services & Supplies) | | | | | | | (6,648 | ) | | | (117,755 | ) |
| | | | |
| | | | | | | | | | | (156,620 | ) |
| | | | | | | | | | | | |
| | | | |
| Japan: (3.11%) | | | | | | | | | | | | |
Familymart Company (Consumer Staples, Food & Staples Retailing) | | | | | | | (1,200 | ) | | | (45,197 | ) |
Isetan Mitsukoshi Holdings Limited (Consumer Discretionary, Multiline Retail) | | | | | | | (9,000 | ) | | | (111,368 | ) |
Kintetsu Corporation (Industrials, Road & Rail) | | | | | | | (3,000 | ) | | | (9,864 | ) |
McDonalds Holdings Company (Consumer Discretionary, Hotels, Restaurants & Leisure) | | | | | | | (3,900 | ) | | | (85,362 | ) |
Odakyu Electric Railway Company (Industrials, Road & Rail) | | | | | | | (2,000 | ) | | | (17,716 | ) |
Takashimaya Company Limited (Consumer Discretionary, Multiline Retail) | | | | | | | (5,000 | ) | | | (39,923 | ) |
| | | | |
| | | | | | | | | | | (309,430 | ) |
| | | | | | | | | | | | |
| | | | |
| Netherlands: (0.96%) | | | | | | | | | | | | |
Unilever NV (Consumer Staples, Household Products) | | | | | | | (2,437 | ) | | | (95,330 | ) |
| | | | | | | | | | | | |
| | | | |
| Philippines: (0.53%) | | | | | | | | | | | | |
Philippine Long Distance Telephone Company SP ADR (Telecommunication
Services, Diversified Telecommunication Services) | | | | | | | (828 | ) | | | (52,404 | ) |
| | | | | | | | | | | | |
| | | | |
| Switzerland: (2.25%) | | | | | | | | | | | | |
Nestle SA (Consumer Staples, Food Products) | | | | | | | (1,986 | ) | | | (144,781 | ) |
Schindler Holding AG (Industrials, Machinery) | | | | | | | (553 | ) | | | (79,833 | ) |
| | | | |
| | | | | | | | | | | (224,614 | ) |
| | | | | | | | | | | | |
| | | | |
| Thailand: (0.31%) | | | | | | | | | | | | |
Charoen Pokphand Foods PCL (Consumer Staples, Food & Staples Retailing) | | | | | | | (37,300 | ) | | | (30,894 | ) |
| | | | | | | | | | | | |
| | | | |
| United Kingdom: (1.11%) | | | | | | | | | | | | |
Diageo plc (Consumer Staples, Beverages) | | | | | | | (3,868 | ) | | | (110,807 | ) |
| | | | | | | | | | | | |
| | | | |
| United States: (1.65%) | | | | | | | | | | | | |
Blackrock Incorporated (Financials, Diversified Financial Services) | | | | | | | (68 | ) | | | (24,314 | ) |
Eaton Vance Corporation (Financials, Diversified Financial Services) | | | | | | | (451 | ) | | | (18,459 | ) |
Wisdomtree Investments Incorporated (Financials, Diversified Financial Services) | | | | | | | (7,762 | ) | | | (121,669 | ) |
| | | | |
| | | | | | | | | | | (164,442 | ) |
| | | | | | | | | | | | |
| | | | |
| | | | | | | | | | | (1,261,593 | ) |
| | | | | | | | | | | | |
| | | | |
Exchange-Traded Funds: (10.18%) | | | | | | | | | | | | |
| | | | |
| United States: (10.18%) | | | | | | | | | | | | |
iShares Europe ETF | | | | | | | (1,470 | ) | | | (62,519 | ) |
iShares MSCI Canada ETF | | | | | | | (3,707 | ) | | | (106,984 | ) |
iShares MSCI EAFE ETF | | | | | | | (6,562 | ) | | | (399,232 | ) |
iShares MSCI EMU ETF | | | | | | | (4,138 | ) | | | (150,334 | ) |
iShares MSCI Philippines ETF | | | | | | | (1,691 | ) | | | (64,596 | ) |
iShares MSCI Singapore ETF | | | | | | | (2,657 | ) | | | (34,754 | ) |
iShares MSCI Switzerland Capped ETF | | | | | | | (3,633 | ) | | | (115,130 | ) |
The accompanying notes are an integral part of these financial statements.
| | | | | | |
| Portfolio of investments—December 31, 2014 (unaudited) | | Wells Fargo Advantage Global Long/Short Fund | | | 11 | |
| | | | | | | | | | | | |
| Security name | | | | | | Shares | | | Value | |
| | | | |
| United States (continued) | | | | | | | | | | | | |
iShares MSCI Thailand Capped ETF | | | | | | | (719 | ) | | $ | (55,694 | ) |
PowerShares QQQ Trust ETF Series 1 | | | | | | | (238 | ) | | | (24,573 | ) |
| | | | |
| | | | | | | | | | | (1,013,816 | ) |
| | | | | | | | | | | | |
| | | | |
Total Securities Sold Short (Proceeds $(2,360,802)) | | | | | | | | | | | (2,275,409 | ) |
| | | | | | | | | | | | |
| | | | | | | | |
| Total investments in securities (excluding securities sold short) (Cost $9,574,678) * | | | 95.00 | % | | | 9,463,506 | |
| Total securities sold short | | | (22.84 | ) | | | (2,275,409 | ) |
Other assets and liabilities, net | | | 27.84 | | | | 2,773,833 | |
| | | | | | | | |
| Total net assets | | | 100.00 | % | | $ | 9,961,930 | |
| | | | | | | | |
| † | Non-income-earning security |
| (b) | All or a portion of this security is segregated as collateral for securities sold short. |
| (l) | The security represents an affiliate of the Fund as defined in the Investment Company Act of 1940. |
| (u) | The rate represents the 7-day annualized yield at period end. |
| * | Cost for federal income tax purposes is $9,574,678 and unrealized gains (losses) consists of: |
| | | | |
Gross unrealized gains | | $ | 42,309 | |
Gross unrealized losses | | | (153,481 | ) |
| | | | |
Net unrealized losses | | $ | (111,172 | ) |
The accompanying notes are an integral part of these financial statements.
| | | | |
| 12 | | Wells Fargo Advantage Global Long/Short Fund | | Statement of assets and liabilities—December 31, 2014 (unaudited) |
| | | | |
| | | | |
| |
Assets | | | | |
Investments | | | | |
In unaffiliated securities, at value (cost $5,214,236) | | $ | 5,103,064 | |
In affiliated securities, at value (cost $4,360,442) | | | 4,360,442 | |
| | | | |
Total investments, at value (cost $9,574,678) | | | 9,463,506 | |
Cash | | | 345,279 | |
Segregated cash for securities sold short | | | 2,672,110 | |
Segregated cash for written options | | | 33,233 | |
Receivable for dividends | | | 489 | |
Unrealized gains on forward foreign currency contracts | | | 16,163 | |
Receivable from adviser | | | 13,185 | |
Prepaid expenses and other assets | | | 62,978 | |
| | | | |
Total assets | | | 12,606,943 | |
| | | | |
| |
Liabilities | | | | |
Dividends payable on securities sold short | | | 1,690 | |
Payable for investments purchased | | | 345,279 | |
Written options, at value (premiums received $2,132) | | | 2,070 | |
Payable for securities sold short, at value (proceeds $2,360,802) | | | 2,275,409 | |
Distribution fee payable | | | 66 | |
Administration fees payable | | | 1,170 | |
Accrued expenses and other liabilities | | | 19,329 | |
| | | | |
Total liabilities | | | 2,645,013 | |
| | | | |
Total net assets | | $ | 9,961,930 | |
| | | | |
| |
NET ASSETS CONSIST OF | | | | |
Paid-in capital | | $ | 10,000,000 | |
Accumulated net investment loss | | | (19,553 | ) |
Accumulated net realized losses on investments | | | (8,963 | ) |
Net unrealized losses on investments | | | (9,554 | ) |
| | | | |
Total net assets | | $ | 9,961,930 | |
| | | | |
| |
COMPUTATION OF NET ASSET VALUE AND OFFERING PRICE PER SHARE | | | | |
Net assets – Class A | | $ | 99,594 | |
Shares outstanding – Class A1 | | | 10,000 | |
Net asset value per share – Class A | | | $9.96 | |
Maximum offering price per share – Class A2 | | | $10.57 | |
Net assets – Class C | | $ | 99,529 | |
Shares outstanding – Class C1 | | | 10,000 | |
Net asset value per share – Class C | | | $9.95 | |
Net assets – Administrator Class | | $ | 99,603 | |
Shares outstanding – Administrator Class1 | | | 10,000 | |
Net asset value per share – Administrator Class | | | $9.96 | |
Net assets – Institutional Class | | $ | 9,663,204 | |
Shares outstanding – Institutional Class1 | | | 970,000 | |
Net asset value per share – Institutional Class | | | $9.96 | |
| 1. | The Fund has an unlimited number of authorized shares. |
| 2. | Maximum offering price is computed as 100/94.25 of net asset value. On investments of $50,000 or more, the offering price is reduced. |
The accompanying notes are an integral part of these financial statements.
| | | | | | |
| Statement of operations—period ended December 31, 2014 (unaudited)1 | | Wells Fargo Advantage Global Long/Short Fund | | | 13 | |
| | | | |
| | | | |
| |
Investment income | | | | |
Dividends | | $ | 1,409 | |
| | | | |
| |
Expenses | | | | |
Advisory fee | | | 10,929 | |
Administration fees | | | | |
Fund level | | | 437 | |
Class A | | | 23 | |
Class C | | | 23 | |
Administrator Class | | | 9 | |
Institutional Class | | | 678 | |
Shareholder servicing fees | | | | |
Class A | | | 22 | |
Class C | | | 22 | |
Administrator Class | | | 21 | |
Distribution fee | | | | |
Class C | | | 66 | |
Custody and accounting fees | | | 1,353 | |
Professional fees | | | 11,887 | |
Registration fees | | | 5,283 | |
Shareholder report expenses | | | 4,227 | |
Trustees’ fees and expenses | | | 1,268 | |
Dividends on securities sold short | | | 8,147 | |
Prime broker fees | | | 2 | |
Other fees and expenses | | | 678 | |
| | | | |
Total expenses | | | 45,075 | |
Less: Fee waivers and/or expense reimbursements | | | (24,113 | ) |
| | | | |
Net expenses | | | 20,962 | |
| | | | |
Net investment loss | | | (19,553 | ) |
| | | | |
| |
REALIZED AND UNREALIZED GAINS (LOSSES) ON INVESTMENTS | | | | |
| |
Net realized gains (losses) on: | | | | |
Unaffiliated securities | | | (10,955 | ) |
Securities sold short | | | 1,992 | |
| | | | |
Net realized losses on investments | | | (8,963 | ) |
| | | | |
| |
Net change in unrealized gains (losses) on: | | | | |
Unaffiliated securities | | | (111,172 | ) |
Forward foreign currency contract transactions | | | 16,163 | |
Securities sold short | | | 85,393 | |
Written options | | | 62 | |
| | | | |
Net change in unrealized gains (losses) on investments | | | (9,554 | ) |
| | | | |
Net realized and unrealized gains (losses) on investments | | | (18,517 | ) |
| | | | |
Net decrease in net assets resulting from operations | | $ | (38,070 | ) |
| | | | |
| 1. | For the period from November 28, 2014 (commencement of operations) to December 31, 2014 |
The accompanying notes are an integral part of these financial statements.
| | | | |
| 14 | | Wells Fargo Advantage Global Long/Short Fund | | Statement of changes in net assets |
| | | | | | | | |
| | | Period ended
December 31, 2014
(unaudited)1 | |
| | |
Operations | | | | | | | | |
Net investment loss | | | | | | $ | (19,553 | ) |
Net realized losses on investments | | | | | | | (8,963 | ) |
Net change in unrealized gains (losses) on investments | | | | | | | (9,554 | ) |
| | | | |
Net decrease in net assets resulting from operations | | | | | | | (38,070 | ) |
| | | | |
| | |
Capital share transactions | | | Shares | | | | | |
Proceeds from shares sold | | | | | | | | |
Class A | | | 10,000 | | | | 100,000 | |
Class C | | | 10,000 | | | | 100,000 | |
Administrator Class | | | 10,000 | | | | 100,000 | |
Institutional Class | | | 970,000 | | | | 9,700,000 | |
| | | | |
| | | | | | | 10,000,000 | |
| | | | |
Net increase in net assets resulting from capital share transactions | | | | | | | 10,000,000 | |
| | | | |
Total increase in net assets | | | | | | | 9,961,930 | |
| | | | |
| | |
Net assets | | | | | | | | |
Beginning of period | | | | | | | 0 | |
| | | | |
End of period | | | | | | $ | 9,961,930 | |
| | | | |
Accumulated net investment loss | | | | | | $ | (19,553 | ) |
| | | | |
| 1. | For the period from November 28, 2014 (commencement of operations) to December 31, 2014 |
The accompanying notes are an integral part of these financial statements.
| | | | | | |
| Financial highlights | | Wells Fargo Advantage Global Long/Short Fund | | | 15 | |
(For a share outstanding throughout the period)
| | | | |
| CLASS A | | Period ended
December 31, 2014
(unaudited)1 | |
Net asset value, beginning of period | | | $10.00 | |
Net investment loss | | | (0.02 | ) |
Net realized and unrealized gains (losses) on investments | | | (0.02 | ) |
| | | | |
Total from investment operations | | | (0.04 | ) |
Net asset value, end of period | | | $9.96 | |
Total return2 | | | (0.40 | )% |
Ratios to average net assets (annualized) | | | | |
Gross expenses | | | 5.57 | %3 |
Net expenses | | | 2.68 | %3 |
Net investment loss | | | (2.52 | )% |
Supplemental data | | | | |
Portfolio turnover rate | | | 61 | % |
Net assets, end of period (000s omitted) | | | $100 | |
| 1. | For the period from November 28, 2014 (commencement of class operations) to December 31, 2014 |
| 2. | Total return calculations do not include any sales charges. Returns for periods of less than one year are not annualized. |
| 3. | Ratios include fees for the prime broker and expenses from dividends on securities sold short in the amount of 0.93%. |
The accompanying notes are an integral part of these financial statements.
| | | | |
| 16 | | Wells Fargo Advantage Global Long/Short Fund | | Financial highlights |
(For a share outstanding throughout the period)
| | | | |
| CLASS C | | Period ended
December 31, 2014
(unaudited)1 | |
Net asset value, beginning of period | | | $10.00 | |
Net investment loss | | | (0.03 | ) |
Net realized and unrealized gains (losses) on investments | | | (0.02 | ) |
| | | | |
Total from investment operations | | | (0.05 | ) |
Net asset value, end of period | | | $9.95 | |
Total return2 | | | (0.50 | )% |
Ratios to average net assets (annualized) | | | | |
Gross expenses | | | 6.32 | %3 |
Net expenses | | | 3.43 | %3 |
Net investment loss | | | (3.27 | )% |
Supplemental data | | | | |
Portfolio turnover rate | | | 61 | % |
Net assets, end of period (000s omitted) | | | $100 | |
| 1. | For the period from November 28, 2014 (commencement of class operations) to December 31, 2014 |
| 2. | Total return calculations do not include any sales charges. Returns for periods of less than one year are not annualized. |
| 3. | Ratios include fees for the prime broker and expenses from dividends on securities sold short in the amount of 0.93%. |
The accompanying notes are an integral part of these financial statements.
| | | | | | |
| Financial highlights | | Wells Fargo Advantage Global Long/Short Fund | | | 17 | |
(For a share outstanding throughout the period)
| | | | |
| ADMINISTRATOR CLASS | | Period ended
December 31, 2014
(unaudited)1 | |
Net asset value, beginning of period | | | $10.00 | |
Net investment loss | | | (0.02 | ) |
Net realized and unrealized gains (losses) on investments | | | (0.02 | ) |
| | | | |
Total from investment operations | | | (0.04 | ) |
Net asset value, end of period | | | $9.96 | |
Total return2 | | | (0.40 | )% |
Ratios to average net assets (annualized) | | | | |
Gross expenses | | | 5.41 | %3 |
Net expenses | | | 2.58 | %3 |
Net investment loss | | | (2.42 | )% |
Supplemental data | | | | |
Portfolio turnover rate | | | 61 | % |
Net assets, end of period (000s omitted) | | | $100 | |
| 1. | For the period from November 28, 2014 (commencement of class operations) to December 31, 2014 |
| 2. | Returns for periods of less than one year are not annualized. |
| 3. | Ratios include fees for the prime broker and expenses from dividends on securities sold short in the amount of 0.93%. |
The accompanying notes are an integral part of these financial statements.
| | | | |
| 18 | | Wells Fargo Advantage Global Long/Short Fund | | Financial highlights |
(For a share outstanding throughout the period)
| | | | |
| INSTITUTIONAL CLASS | | Period ended
December 31, 2014
(unaudited)1 | |
Net asset value, beginning of period | | | $10.00 | |
Net investment loss | | | (0.02 | ) |
Net realized and unrealized gains (losses) on investments | | | (0.02 | ) |
| | | | |
Total from investment operations | | | (0.04 | ) |
Net asset value, end of period | | | $9.96 | |
Total return2 | | | (0.40 | )% |
Ratios to average net assets (annualized) | | | | |
Gross expenses | | | 5.14 | %3 |
Net expenses | | | 2.38 | %3 |
Net investment loss | | | (2.22 | )% |
Supplemental data | | | | |
Portfolio turnover rate | | | 61 | % |
Net assets, end of period (000s omitted) | | | $9,663 | |
| 1. | For the period from November 28, 2014 (commencement of class operations) to December 31, 2014 |
| 2. | Returns for periods of less than one year are not annualized. |
| 3. | Ratios include fees for the prime broker and expenses from dividends on securities sold short in the amount of 0.93%. |
The accompanying notes are an integral part of these financial statements.
| | | | | | |
| Notes to financial statements (unaudited) | | Wells Fargo Advantage Global Long/Short Fund | | | 19 | |
1. ORGANIZATION
Wells Fargo Funds Trust (the “Trust”), a Delaware statutory trust organized on March 10, 1999, is an open-end management investment company registered under the Investment Company Act of 1940, as amended (the “1940 Act”). As an investment company, the Trust follows the accounting and reporting guidance in FASB Accounting Standards Codification 946. These financial statements report on the Wells Fargo Advantage Global Long/Short Fund (the “Fund”) which is a diversified series of the Trust.
2. SIGNIFICANT ACCOUNTING POLICIES
The following significant accounting policies, which are consistently followed in the preparation of the financial statements of the Fund, are in conformity with U.S. generally accepted accounting principles which require management to make estimates and assumptions that affect the reported amounts of assets and liabilities, disclosure of contingent assets and liabilities at the date of the financial statements, and the reported amounts of revenues and expenses during the reporting period. Actual results could differ from those estimates.
Securities valuation
All investments are valued each business day as of the close of regular trading on the New York Stock Exchange (generally 4 p.m. Eastern Time).
Equity securities and options that are listed on a foreign or domestic exchange or market are valued at the official closing price or, if none, the last sales price. If no sale occurs on the primary exchange or market for the security that day, the prior day’s price will be deemed “stale” and fair values will be determined in accordance with the Fund’s Valuation Procedures. Non-listed OTC options are valued at the evaluated price provided by an independent pricing service or an independent broker-dealer that the Management Valuation Team of Wells Fargo Funds Management, LLC (“Funds Management”) has determined is an acceptable source.
The values of securities denominated in foreign currencies are translated into U.S. dollars at rates provided by an independent foreign currency pricing source at a time each business day specified by the Management Valuation Team.
Many securities markets and exchanges outside the U.S. close prior to the close of the New York Stock Exchange and therefore may not fully reflect trading or events that occur after the close of the principal exchange in which the foreign securities are traded, but before the close of the New York Stock Exchange. If such trading or events are expected to materially affect the value of such securities, then fair value pricing procedures approved by the Board of Trustees of the Fund are applied. These procedures take into account multiple factors including movements in U.S. securities markets after foreign exchanges close. Foreign securities that are fair valued under these procedures are categorized as Level 2 and the application of these procedures may result in transfers between Level 1 and Level 2. Depending on market activity, such fair valuations may be frequent. Such fair value pricing may result in net asset values that are higher or lower than net asset values based on the last reported sales price or latest quoted bid price. On December 31, 2014 such fair value pricing was used in pricing foreign securities.
Investments in registered open-end investment companies are valued at net asset value.
Investments which are not valued using any of the methods discussed above are valued at their fair value, as determined in good faith by the Board of Trustees. The Board of Trustees has established a Valuation Committee comprised of the Trustees and has delegated to it the authority to take any actions regarding the valuation of portfolio securities that the Valuation Committee deems necessary or appropriate, including determining the fair value of portfolio securities, unless the determination has been delegated to the Management Valuation Team. The Board of Trustees retains the authority to make or ratify any valuation decisions or approve any changes to the Valuation Procedures as it deems appropriate. On a quarterly basis, the Board of Trustees receives reports on any valuation actions taken by the Valuation Committee or the Management Valuation Team which may include items for ratification.
Valuations of fair valued securities are compared to the next actual sales price when available, or other appropriate market values, to assess the continued appropriateness of the fair valuation methodologies used. These securities are fair valued on a day-to-day basis, taking into consideration changes to appropriate market information and any significant changes to the inputs considered in the valuation process until there is a readily available price provided on an exchange or by an independent pricing service. Valuations received from an independent pricing service or independent broker-dealer quotes are periodically validated by comparisons to most recent trades and valuations provided by other independent pricing services in addition to the review of prices by the adviser and/or subadviser. Unobservable inputs used in determining fair valuations are identified based on the type of security, taking into consideration factors utilized by market participants in valuing the investment, knowledge about the issuer and the current market environment.
| | | | |
| 20 | | Wells Fargo Advantage Global Long/Short Fund | | Notes to financial statements (unaudited) |
Foreign currency translation
The accounting records of the Fund are maintained in U.S. dollars. The values of other assets and liabilities denominated in foreign currencies are translated into U.S. dollars at rates provided by an independent foreign currency pricing source at a time each business day specified by the Management Valuation Team. Purchases and sales of securities, and income and expenses are converted at the rate of exchange on the respective dates of such transactions. Net realized foreign exchange gains or losses arise from sales of foreign currencies, currency gains or losses realized between the trade and settlement dates on securities transactions, and the difference between the amounts of dividends, interest and foreign withholding taxes recorded and the U.S. dollar equivalent of the amounts actually paid or received. Net unrealized foreign exchange gains and losses arise from changes in the fair value of assets and liabilities other than investments in securities resulting from changes in exchange rates. The changes in net assets arising from changes in exchange rates and the changes in net assets resulting from changes in market prices of securities are not separately presented. Such changes are included in net realized and unrealized gains or losses from investments.
Forward foreign currency contracts
The Fund is subject to foreign currency exchange rate risk in the normal course of pursuing its investment objectives. A forward foreign currency contract is an agreement between two parties to purchase or sell a specific currency for an agreed-upon price at a future date. The Fund enters into forward foreign currency contracts to facilitate transactions in foreign-denominated securities and to attempt to minimize the risk to the Fund from adverse changes in the relationship between currencies. Forward foreign currency contracts are recorded at the forward rate and marked-to-market daily. When the contracts are closed, realized gains and losses arising from such transactions are recorded as realized gains or losses on forward foreign currency contract transactions. The Fund could be exposed to risks if the counterparties to the contracts are unable to meet the terms of their contracts or if the value of the foreign currency changes unfavorably. The Fund’s maximum risk of loss from counterparty credit risk is the unrealized gains on the contracts. This risk may be mitigated if there is a master netting arrangement between the Fund and the counterparty.
Options
The Fund is subject to equity price risk in the normal course of pursuing its investment objectives. The Fund may write covered call options or secured put options on individual securities and/or indexes. When the Fund writes an option, an amount equal to the premium received is recorded as a liability and is subsequently adjusted to the current market value of the written option. Premiums received from written options that expire unexercised are recognized as realized gains on the expiration date. For exercised options, the difference between the premium received and the amount paid on effecting a closing purchase transaction, including brokerage commissions, is treated as a realized gain or loss. If a call option is exercised, the premium is added to the proceeds from the sale of the underlying security in calculating the realized gain or loss on the sale. If a put option is exercised, the premium reduces the cost of the security purchased. The Fund, as a writer of an option, bears the market risk of an unfavorable change in the price of the security and/or index underlying the written option.
The Fund may also purchase call or put options. The premium is included in the Statement of Assets and Liabilities as an investment, the value of which is subsequently adjusted based on the current market value of the option. Premiums paid for purchased options that expire are recognized as realized losses on the expiration date. Premiums paid for purchased options that are exercised or closed are added to the amount paid or offset against the proceeds received for the underlying security to determine the realized gain or loss. The risk of loss associated with purchased options is limited to the premium paid.
Options traded on an exchange are regulated and terms of the options are standardized. Purchased options traded over-the-counter expose the Fund to counterparty risk in the event the counterparty does not perform. This risk can be mitigated by having a master netting arrangement between the Fund and the counterparty and by having the counterparty post collateral to cover the Fund’s exposure to the counterparty.
Short sales
The Fund may sell a security it does not own in anticipation of a decline in the market value of that security (short sale). When the Fund makes a short sale, it must borrow the security sold short and deliver it to the buyer. The Fund is then obligated to replace the security borrowed by purchasing the security at the market price at the time of replacement.
The Fund records the proceeds as a liability which is marked-to-market daily based upon quotations from an independent pricing service or from brokers, which use prices provided by market makers, and any change in value is recorded as an unrealized gain or loss. Any interest or dividends accrued on such borrowed securities during the period of the loan are recorded as an expense on the Statement of Operations. To borrow the security, the Fund may be required to pay a premium, which would decrease the proceeds of the security sold. A gain, limited to the price at which the Fund
| | | | | | |
| Notes to financial statements (unaudited) | | Wells Fargo Advantage Global Long/Short Fund | | | 21 | |
sold the security short, or a loss, unlimited in size, will be recognized upon the closing of a short sale if the market price at the closing is less than or greater than, respectively, the proceeds originally received. Until the short sale is closed or the borrowed security is replaced, the Fund maintains a segregated account of cash or liquid securities, the dollar value of which is at least equal to the market value of the security at the time of the short sale.
Security transactions and income recognition
Securities transactions are recorded on a trade date basis. Realized gains or losses are recorded on the basis of identified cost.
Dividend income is recognized on the ex-dividend date, except for certain dividends from foreign securities, which are recorded as soon as the custodian verifies the ex-dividend date. Dividend income from foreign securities is recorded net of foreign taxes withheld where recovery of such taxes is not assured.
Distributions to shareholders
Distributions to shareholders from net investment income and net realized gains, if any, are recorded on the ex-dividend date. Such distributions are determined in conformity with federal income tax regulations, which may differ in amount or character from net investment income and realized gains recognized for purposes of U.S. generally accepted accounting principles.
Federal and other taxes
The Fund intends to qualify as a regulated investment company by distributing substantially all of its investment company taxable income and any net realized capital gains (after reduction for capital loss carryforwards) sufficient to relieve it from all, or substantially all, federal income taxes. Accordingly, no provision for federal income taxes was required.
The Fund’s income and federal excise tax returns and all financial records supporting those returns for the fiscal years since commencement of operations will be subject to examination by the federal and Delaware revenue authorities. The Fund is not subject to examination by federal and state tax authorities for tax years before 2014, the year the Fund commenced operations.
Class allocations
The separate classes of shares offered by the Fund differ principally in applicable sales charges, distribution, shareholder servicing, and administration fees. Class specific expenses are charged directly to that share class. Investment income, common expenses, and realized and unrealized gains (losses) on investments are allocated daily to each class of shares based on the relative proportion of net assets of each class.
3. FAIR VALUATION MEASUREMENTS
Fair value measurements of investments are determined within a framework that has established a fair value hierarchy based upon the various data inputs utilized in determining the value of the Fund’s investments. The three-level hierarchy gives the highest priority to unadjusted quoted prices in active markets for identical assets or liabilities (Level 1) and the lowest priority to significant unobservable inputs (Level 3). The Fund’s investments are classified within the fair value hierarchy based on the lowest level of input that is significant to the fair value measurement. The inputs are summarized into three broad levels as follows:
| n | | Level 1 – quoted prices in active markets for identical securities |
| n | | Level 2 – other significant observable inputs (including quoted prices for similar securities, interest rates, prepayment speeds, credit risk, use of amortized cost, etc.) |
| n | | Level 3 – significant unobservable inputs (including the Fund’s own assumptions in determining the fair value of investments) |
The inputs or methodologies used for valuing investments in securities are not necessarily an indication of the risk associated with investing in those securities.
| | | | |
| 22 | | Wells Fargo Advantage Global Long/Short Fund | | Notes to financial statements (unaudited) |
The following is a summary of the inputs used in valuing the Fund’s assets and liabilities as of December 31, 2014:
| | | | | | | | | | | | | | | | |
| | | Quoted prices (Level 1) | | | Other significant observable inputs (Level 2) | | | Significant unobservable inputs (Level 3) | | | Total | |
Assets | | | | | | | | | | | | | | | | |
Investments in: | | | | | | | | | | | | | | | | |
| | | | |
Common stocks | | | | | | | | | | | | | | | | |
Canada | | $ | 120,356 | | | $ | 0 | | | $ | 0 | | | $ | 120,356 | |
China | | | 0 | | | | 180,569 | | | | 0 | | | | 180,569 | |
Germany | | | 0 | | | | 432,362 | | | | 0 | | | | 432,362 | |
Hong Kong | | | 0 | | | | 388,521 | | | | 0 | | | | 388,521 | |
Ireland | | | 113,012 | | | | 0 | | | | 0 | | | | 113,012 | |
Italy | | | 0 | | | | 325,903 | | | | 0 | | | | 325,903 | |
Japan | | | 0 | | | | 1,272,091 | | | | 0 | | | | 1,272,091 | |
Netherlands | | | 0 | | | | 215,319 | | | | 0 | | | | 215,319 | |
Norway | | | 0 | | | | 61,238 | | | | 0 | | | | 61,238 | |
Switzerland | | | 0 | | | | 384,613 | | | | 0 | | | | 384,613 | |
United Kingdom | | | 0 | | | | 603,404 | | | | 0 | | | | 603,404 | |
United States | | | 947,614 | | | | 0 | | | | 0 | | | | 947,614 | |
| | | | |
Participation notes | | | | | | | | | | | | | | | | |
China | | | 0 | | | | 58,044 | | | | 0 | | | | 58,044 | |
| | | | |
Purchased put options | | | 0 | | | | 18 | | | | 0 | | | | 18 | |
| | | | |
Short-term investments | | | | | | | | | | | | | | | | |
Investment companies | | | 4,360,442 | | | | 0 | | | | 0 | | | | 4,360,442 | |
| | | 5,541,424 | | | | 3,922,082 | | | | 0 | | | | 9,463,506 | |
Forward foreign currency contracts | | | 0 | | | | 16,163 | | | | 0 | | | | 16,163 | |
Total assets | | $ | 5,541,424 | | | $ | 3,938,245 | | | $ | 0 | | | $ | 9,479,669 | |
Liabilities | | | | | | | | | | | | | | | | |
| | | | |
Securities sold short | | | | | | | | | | | | | | | | |
Finland | | | 0 | | | | 117,052 | | | | 0 | | | | 117,052 | |
France | | | 0 | | | | 156,620 | | | | 0 | | | | 156,620 | |
Japan | | | 0 | | | | 309,430 | | | | 0 | | | | 309,430 | |
Netherlands | | | 0 | | | | 95,330 | | | | 0 | | | | 95,330 | |
Philippines | | | 52,404 | | | | 0 | | | | 0 | | | | 52,404 | |
Switzerland | | | 0 | | | | 224,614 | | | | 0 | | | | 224,614 | |
Thailand | | | 30,894 | | | | 0 | | | | 0 | | | | 30,894 | |
United Kingdom | | | 0 | | | | 110,807 | | | | 0 | | | | 110,807 | |
United States | | | 164,442 | | | | 0 | | | | 0 | | | | 164,442 | |
| | | | |
Exchange-traded funds | | | | | | | | | | | | | | | | |
United States | | | 1,013,816 | | | | 0 | | | | 0 | | | | 1,013,816 | |
Written options | | | 0 | | | | 2,070 | | | | 0 | | | | 2,070 | |
Total liabilities | | $ | 1,261,556 | | | $ | 1,015,923 | | | $ | 0 | | | $ | 2,277,479 | |
Forward foreign currency contracts are reported at their unrealized gains (losses) at measurement date, which represents the change in the contract’s value from trade date. All other assets and liabilities are reported at their market value at measurement date.
The Fund recognizes transfers between levels at the end of the reporting period. At December 31, 2014, fair value pricing was used in pricing certain foreign securities. Common stocks valued at $3,864,020 and securities sold short valued at $1,013,853 were transferred from Level 1 to Level 2 within the fair value hierarchy. The Fund did not have any transfers into/out of Level 3.
| | | | | | |
| Notes to financial statements (unaudited) | | Wells Fargo Advantage Global Long/Short Fund | | | 23 | |
4. TRANSACTIONS WITH AFFILIATES
Advisory fee
The Trust has entered into an advisory contract with Funds Management, an indirect wholly owned subsidiary of Wells Fargo & Company (“Wells Fargo”). The adviser is responsible for implementing investment policies and guidelines and for supervising the subadviser, who is responsible for day-to-day portfolio management of the Fund.
Pursuant to the contract, Funds Management is entitled to receive an annual advisory fee starting at 1.25% and declining to 1.10% as the average daily net assets of the Fund increase. For the period from November 28, 2014 (commencement of operations) to December 31, 2014, the advisory fee was equivalent to an annual rate of 1.25% of the Fund’s average daily net assets.
Funds Management has retained the services of a subadviser to provide daily portfolio management to the Fund. The fee for subadvisory services is borne by Funds Management. Wells Capital Management Incorporated, an affiliate of Funds Management and an indirect wholly owned subsidiary of Wells Fargo, is the subadviser to the Fund and is entitled to receive a fee from Funds Management at an annual rate starting at 1.00% and declining to 0.90% as the average daily net assets of the Fund increase.
Administration fees
The Trust has entered into an administration agreement with Funds Management. Under this agreement, for providing administrative services, which includes paying fees and expenses for services provided by the transfer agent, sub-transfer agents, omnibus account servicers and record-keepers, Funds Management is entitled to receive from the Fund an annual fund level administration fee starting at 0.05% and declining to 0.03% as the average daily net assets of the Fund increase and a class level administration fee which is calculated based on the average daily net assets of each class as follows:
| | | | |
| | | Class level administration fee | |
Class A, Class C | | | 0.26 | % |
Administrator Class | | | 0.10 | |
Institutional Class | | | 0.08 | |
Funds Management has contractually waived and/or reimbursed advisory and administration fees to the extent necessary to maintain certain net operating expense ratios for the Fund. Waiver of fees and/or reimbursement of expenses by Funds Management were made first from fund level expenses on a proportionate basis and then from class specific expenses. Funds Management has committed through October 31, 2016 to waive fees and/or reimburse expenses to the extent necessary to cap the Fund’s expenses at 1.75% for Class A shares, 2.50% for Class C shares, 1.65% for Administrator Class shares, and 1.45% for Institutional Class shares. After this time, the cap may be increased or the commitment to maintain the cap may be terminated only with the approval of the Board of Trustees. Fees for the prime broker and expenses from dividends on short positions are excluded from the expense caps.
Distribution fee
The Trust has adopted a Distribution Plan for Class C shares of the Fund pursuant to Rule 12b-1 under the 1940 Act. A distribution fee is charged to Class C shares and paid to Wells Fargo Funds Distributor, LLC (“Funds Distributor”), the principal underwriter, at an annual rate of 0.75% of the average daily net assets of Class C shares.
In addition, Funds Distributor is entitled to receive the front-end sales charge from the purchase of Class A shares and a contingent deferred sales charge on the redemption of certain shares. Funds Distributor is also entitled to receive the contingent deferred sales charges from redemptions of Class C shares.
Shareholder servicing fees
The Trust has entered into contracts with one or more shareholder servicing agents, whereby Class A, Class C, and Administrator Class of the Fund is charged a fee at an annual rate of 0.25% of the average daily net assets of each respective class.
A portion of these total shareholder servicing fees were paid to affiliates of Wells Fargo.
| | | | |
| 24 | | Wells Fargo Advantage Global Long/Short Fund | | Notes to financial statements (unaudited) |
5. INVESTMENT PORTFOLIO TRANSACTIONS
Purchases and sales of investments, excluding U.S. government obligations (if any) and short-term securities, for the period from November 28, 2014 (commencement of operations) to December 31, 2014 were $6,095,194 and $3,241,070, respectively.
6. DERIVATIVE TRANSACTIONS
During the period from November 28, 2014 (commencement of operations) to December 31, 2014, the Fund entered into forward foreign currency contracts for economic hedging purposes.
At December 31, 2014, the Fund had forward foreign currency contracts outstanding as follows:
Forward foreign currency contracts to sell:
| | | | | | | | | | | | | | | | | | |
| Exchange date | | Counterparty | | Contracts to deliver | | | U.S. value at December 31, 2014 | | | In exchange for U.S. $ | | | Unrealized gains | |
| 3-4-2015 | | Morgan Stanley | | | 153,500 | GBP | | $ | 239,135 | | | $ | 240,097 | | | $ | 962 | |
| 3-4-2015 | | Morgan Stanley | | | 60,756,300 | JPY | | | 507,489 | | | | 510,284 | | | | 2,795 | |
| 3-4-2015 | | Morgan Stanley | | | 152,800 | GBP | | | 238,045 | | | | 239,707 | | | | 1,662 | |
| 3-4-2015 | | Morgan Stanley | | | 59,027,000 | JPY | | | 493,035 | | | | 493,286 | | | | 251 | |
| 3-4-2015 | | Morgan Stanley | | | 205,000 | EUR | | | 248,196 | | | | 252,414 | | | | 4,218 | |
| 3-4-2015 | | Morgan Stanley | | | 201,500 | EUR | | | 243,958 | | | | 250,233 | | | | 6,275 | |
The Fund had an average contract amount of $1,664,972 in forward foreign currency contracts to sell during the period from November 28, 2014 (commencement of operations) to December 31, 2014.
During the period from November 28, 2014 (commencement of operations) to December 31, 2014, the Fund entered into written options for economic hedging purposes and had written call option activities as follows:
| | | | | | | | |
| | | Number of contracts | | | Premiums received | |
Options outstanding at November 28, 2014 | | | 0 | | | $ | 0 | |
Options written | | | 9 | | | | 2,132 | |
Options expired | | | 0 | | | | 0 | |
Options closed | | | 0 | | | | 0 | |
Options exercised | | | 0 | | | | 0 | |
Options outstanding at December 31, 2014 | | | 9 | | | $ | 2,132 | |
Open call options written at December 31, 2014 were as follow for the Fund:
| | | | | | | | | | | | | | | | |
| Expiration date | | Counterparty | | | | Number of contracts | | | Strike price | | | Value | |
6-19-2015 | | Morgan Stanley | | SPDR S&P 500 ETF Trust | | | 9 | | | $ | 22 | | | $ | (2,070 | ) |
The Fund had an average of 8 written option contract during the period from November 28, 2014 (commencement of operations) to December 31, 2014. As of December 31, 2014, the Fund had segregated $33,233 as cash collateral for written options.
During the period from November 28, 2014 (commencement of operations) to December 31, 2014, the Fund entered into purchased options contracts for speculative purposes and had an average of 101 purchased options contracts.
| | | | | | |
| Notes to financial statements (unaudited) | | Wells Fargo Advantage Global Long/Short Fund | | | 25 | |
A summary of derivative instruments by primary risk exposure is outlined in the following tables.
The fair value of derivative instruments as of December 31, 2014 was as follows for the Fund:
| | | | | | | | | | | | |
| | | Asset derivatives | | | Liability derivatives | |
| | | Statement of Assets and Liabilities location | | Fair value | | | Statement of Assets and Liabilities location | | Fair value | |
Equity contracts | | Investments in unaffiliated securities, at value | | $ | 18 | * | | Payable for written options | | $ | 2,070 | |
Forward foreign currency contracts | | Unrealized gains on forward foreign currency contracts | | | 16,163 | | | | | | | |
| | | | | $ | 16,181 | | | | | $ | 2,070 | |
| * | Amount relates to purchased options |
The effect of derivative instruments on the Statement of Operations for the period from November 28, 2014 (commencement of operations) to December 31, 2014 was as follows for the Fund:
| | | | |
| | | Amount of realized losses on unaffiliated securities* | |
Equity contracts | | $ | (116 | ) |
| * | Amount relates to purchased options |
| | | | | | | | | | | | | | | | |
| | | Change in unrealized gains (losses) on derivatives | |
| | | Unaffiliated securities* | | | Forward currency contracts | | | Written options | | | Total | |
Equity contracts | | $ | (640 | ) | | $ | 0 | | | $ | 62 | | | $ | (578 | ) |
Forward foreign currency contracts | | | 0 | | | | 16,163 | | | | 0 | | | | 16,163 | |
| | | $ | (640 | ) | | $ | 16,163 | | | $ | 62 | | | $ | 15,585 | |
| * | Amount relates to purchased options |
For certain types of derivative transactions, the Fund has entered into International Swaps and Derivatives Association, Inc. master agreements (“ISDA Master Agreements”) or similar agreements with approved counterparties. The ISDA Master Agreements or similar agreements may have requirements to deliver/deposit securities or cash to/with an exchange or broker-dealer as collateral and allows the Fund to offset, with each counterparty, certain derivative financial instrument’s assets and/or liabilities with collateral held or pledged. Collateral requirements differ by type of derivative. Collateral or margin requirements are set by the broker or exchange clearing house for exchange traded derivatives while collateral terms are contract specific for over-the-counter traded derivatives. Cash collateral that has been pledged to cover obligations of the Fund under ISDA Master Agreements or similar agreements, if any, will be reported separately in the Statement of Assets and Liabilities. Securities pledged as collateral, if any, for the same purpose are noted in the Portfolio of Investments. With respect to balance sheet offsetting, absent an event of default by the counterparty or a termination of the agreement, the reported amounts of financial assets and financial liabilities in the Statement of Assets and Liabilities are not offset across transactions between the Fund and the applicable counterparty. A reconciliation of the gross amounts on the Statement of Assets and Liabilities to the net amounts by derivative type, including any collateral exposure, is as follows:
| | | | | | | | | | | | | | | | |
| Derivative type | | Counterparty | | Gross amounts of assets in the Statement of Assets and Liabilities | | Amounts subject to netting agreements | | | Collateral received | | | Net amount
of assets | |
Forward foreign currency contracts | | Morgan Stanley | | $16,163* | | $ | 0 | | | $ | 0 | | | $ | 16,163 | |
| * | Amount represents net unrealized gains. |
| | | | |
| 26 | | Wells Fargo Advantage Global Long/Short Fund | | Notes to financial statements (unaudited) |
| | | | | | | | | | | | | | | | |
| Derivative type | | Counterparty | | Gross amounts of liabilities in the Statement of Assets and Liabilities | | Amounts subject to netting agreements | | | Collateral pledged1 | | | Net amount of liabilities | |
Written options | | Morgan Stanley | | $2,070 | | $ | 0 | | | $ | (2,070 | ) | | $ | 0 | |
| | 1. | Collateral pledged within this table is limited to the collateral for the net transaction with the counterparty. | |
7. BORROWINGS
The Fund has a uncommitted credit facility to provide leverage for investment purposes or to meet unanticipated redemptions. The Fund’s borrowings under the Facility are generally charged interest at the London Interbank Offered Rate (LIBOR) plus 0.95%.
For the period from November 28, 2014 (commencement of operations) to December 31, 2014, there were no borrowings by the Fund under the agreement.
8. INDEMNIFICATION
Under the Trust’s organizational documents, the officers and Trustees are indemnified against certain liabilities that may arise out of performance of their duties to the Trust. Additionally, in the normal course of business, the Trust may enter into contracts with service providers that contain a variety of indemnification clauses. The Trust’s maximum exposure under these arrangements is dependent on future claims that may be made against the Fund and, therefore, cannot be estimated.
| | | | | | |
| Other information (unaudited) | | Wells Fargo Advantage Global Long/Short Fund | | | 27 | |
PROXY VOTING INFORMATION
A description of the policies and procedures that the Fund uses to determine how to vote proxies relating to portfolio securities is available without charge, upon request, by calling 1-800-222-8222, visiting our website at wellsfargoadvantagefunds.com, or visiting the SEC website at sec.gov. Information regarding how the Fund voted proxies relating to portfolio securities during the most recent 12-month period ended June 30 is available on the Fund’s website at wellsfargoadvantagefunds.com or by visiting the SEC website at sec.gov.
PORTFOLIO HOLDINGS INFORMATION
The complete portfolio holdings for the Fund are publicly available monthly on the Fund’s website (wellsfargoadvantagefunds.com), on a one-month delayed basis. In addition, top ten holdings information (excluding derivative positions) for the Fund is publicly available on the Fund’s website on a monthly, seven-day or more delayed basis. The Fund files its complete schedule of portfolio holdings with the SEC for the first and third quarters of each fiscal year on Form N-Q, which is available by visiting the SEC website at sec.gov. In addition, the Fund’s Form N-Q may be reviewed and copied at the SEC’s Public Reference Room in Washington, DC, and at regional offices in New York City, at 233 Broadway, and in Chicago, at 175 West Jackson Boulevard, Suite 900. Information about the Public Reference Room may be obtained by calling 1-800-SEC-0330.
| | | | |
| 28 | | Wells Fargo Advantage Global Long/Short Fund | | Other information (unaudited) |
BOARD OF TRUSTEES AND OFFICERS
Each of the Trustees and Officers1 listed in the table below acts in identical capacities for each fund in the Wells Fargo Advantage family of funds, which consists of 134 mutual funds comprising the Wells Fargo Funds Trust, Wells Fargo Variable Trust, Wells Fargo Master Trust and four closed-end funds (collectively the “Fund Complex”). This table should be read in conjunction with the Prospectus and the Statement of Additional Information2. The mailing address of each Trustee and Officer is 525 Market Street, 12th Floor, San Francisco, CA 94105. Each Trustee and Officer serves an indefinite term, however, each Trustee serves such term until reaching the mandatory retirement age established by the Trustees.
Independent Trustees
| | | | | | |
Name and
year of birth | | Position held and
length of service* | | Principal occupations during past five years or longer | | Other
directorships during
past five years |
| Peter G. Gordon (Born 1942) | | Trustee, since 1998; Chairman, since 2005 | | Co-Founder, Retired Chairman, President and CEO of Crystal Geyser Water Company. Trustee Emeritus, Colby College. | | Asset Allocation Trust |
| Isaiah Harris, Jr. (Born 1952) | | Trustee, since 2009 | | Retired. Prior thereto, President and CEO of BellSouth Advertising and Publishing Corp. from 2005 to 2007, President and CEO of BellSouth Enterprises from 2004 to 2005 and President of BellSouth Consumer Services from 2000 to 2003. Emeritus member of the Iowa State University Foundation Board of Governors. Emeritus Member of the Advisory Board of Iowa State University School of Business. Advisory Board Member, Palm Harbor Academy. Mr. Harris is a certified public accountant. | | CIGNA Corporation; Asset Allocation Trust |
| Judith M. Johnson (Born 1949) | | Trustee, since 2008; Audit Committee Chairman, since 2008 | | Retired. Prior thereto, Chief Executive Officer and Chief Investment Officer of Minneapolis Employees Retirement Fund from 1996 to 2008. Ms. Johnson is an attorney, certified public accountant and a certified managerial accountant. | | Asset Allocation Trust |
| Leroy Keith, Jr. (Born 1939) | | Trustee, since 2010*** | | Chairman, Bloc Global Services (development and construction). Trustee of the Evergreen Funds complex (and its predecessors) from 1983 to 2010. Former Managing Director, Almanac Capital Management (commodities firm), former Partner, Stonington Partners, Inc. (private equity fund), former Director, Obagi Medical Products Co. and former Director, Lincoln Educational Services. | | Trustee, Virtus Fund Complex (consisting of 50 portfolios as of 12/16/2013); Asset Allocation Trust |
| David F. Larcker (Born 1950) | | Trustee, since 2009 | | James Irvin Miller Professor of Accounting at the Graduate School of Business, Stanford University, Morgan Stanley Director of the Center for Leadership Development and Research and Senior Faculty of The Rock Center for Corporate Governance since 2006. From 2005 to 2008, Professor of Accounting at the Graduate School of Business, Stanford University. Prior thereto, Ernst & Young Professor of Accounting at The Wharton School, University of Pennsylvania from 1985 to 2005. | | Asset Allocation Trust |
| Olivia S. Mitchell (Born 1953) | | Trustee, since 2006 | | International Foundation of Employee Benefit Plans Professor, Wharton School of the University of Pennsylvania since 1993. Director of Wharton’s Pension Research Council and Boettner Center on Pensions & Retirement Research, and Research Associate at the National Bureau of Economic Research. Previously, Cornell University Professor from 1978 to 1993. | | Asset Allocation Trust |
| Timothy J. Penny (Born 1951) | | Trustee, since 1996 | | President and CEO of Southern Minnesota Initiative Foundation, a non-profit organization, since 2007 and Senior Fellow at the Humphrey Institute Policy Forum at the University of Minnesota since 1995. Member of the Board of Trustees of NorthStar Education Finance, Inc., a non-profit organization, since 2007. | | Asset Allocation Trust |
| | | | | | |
| Other information (unaudited) | | Wells Fargo Advantage Global Long/Short Fund | | | 29 | |
| | | | | | |
Name and
year of birth | | Position held and
length of service* | | Principal occupations during past five years or longer | | Other
directorships during
past five years |
| Michael S. Scofield (Born 1943) | | Trustee, since 2010 | | Served on the Investment Company Institute’s Board of Governors and Executive Committee from 2008-2011 as well the Governing Council of the Independent Directors Council from 2006-2011 and the Independent Directors Council Executive Committee from 2008-2011. Chairman of the IDC from 2008-2010. Institutional Investor (Fund Directions) Trustee of Year in 2007. Trustee of the Evergreen Funds complex (and its predecessors) from 1984 to 2010. Chairman of the Evergreen Funds from 2000-2010. Former Trustee of the Mentor Funds. Retired Attorney, Law Offices of Michael S. Scofield. | | Asset Allocation Trust |
| Donald C. Willeke (Born 1940) | | Trustee, since 1996 | | Principal of the law firm of Willeke & Daniels. General Counsel of the Minneapolis Employees Retirement Fund from 1984 until its consolidation into the Minnesota Public Employees Retirement Association on June 30, 2010. Director and Vice Chair of The Tree Trust (non-profit corporation). Director of the American Chestnut Foundation (non-profit corporation). | | Asset Allocation Trust |
| * | Length of service dates reflect the Trustee’s commencement of service with the Trust’s predecessor entities, where applicable. |
| ** | Leroy Keith, Jr. retired as a Trustee effective December 31, 2014. |
Officers
| | | | | | |
Name and
year of birth | | Position held and
length of service | | Principal occupations during past five years or longer | | |
| Karla M. Rabusch (Born 1959) | | President, since 2003 | | Executive Vice President of Wells Fargo Bank, N.A. and President of Wells Fargo Funds Management, LLC since 2003. | | |
| Jeremy DePalma1 (Born 1974) | | Treasurer, since 2012 | | Senior Vice President of Wells Fargo Funds Management, LLC since 2009. Senior Vice President of Evergreen Investment Management Company, LLC from 2008 to 2010. Vice President, Evergreen Investment Services, Inc. from 2004 to 2007. Head of the Fund Reporting and Control Team within Fund Administration from 2005 to 2010. | | |
| C. David Messman (Born 1960) | | Secretary, since 2000; Chief Legal Officer, since 2003 | | Assistant General Counsel of Wells Fargo Bank, N.A. since 2013 and Vice President and Managing Counsel of Wells Fargo Bank N.A. from 1996 to 2013. Senior Vice President and Secretary of Wells Fargo Funds Management, LLC since 2001. | | |
Debra Ann Early
(Born 1964) | | Chief Compliance Officer, since 2007 | | Senior Vice President of Wells Fargo Funds Management, LLC since 2007 and Chief Compliance Officer from 2007 to 2014. Chief Compliance Officer of Parnassus Investments from 2005 to 2007. Chief Financial Officer of Parnassus Investments from 2004 to 2007 and Senior Audit Manager of PricewaterhouseCoopers LLP from 1998 to 2004. | | |
David Berardi
(Born 1975) | | Assistant Treasurer, since 2009 | | Vice President of Wells Fargo Funds Management, LLC since 2009. Vice President of Evergreen Investment Management Company, LLC from 2008 to 2010. Assistant Vice President of Evergreen Investment Services, Inc. from 2004 to 2008. Manager of Fund Reporting and Control for Evergreen Investment Management Company, LLC from 2004 to 2010. | | |
| 1. | Jeremy DePalma acts as Treasurer of 61 funds and Assistant Treasurer of 73 funds in the Fund Complex. |
| 2. | The Statement of Additional Information includes additional information about the Trustees and is available, without charge, upon request, by calling 1-800-222-8222 or by visiting the website at wellsfargoadvantagefunds.com. |
| | | | |
| 30 | | Wells Fargo Advantage Global Long/Short Fund | | List of abbreviations |
The following is a list of common abbreviations for terms and entities that may have appeared in this report.
| ACA | — ACA Financial Guaranty Corporation |
| ADR | — American depositary receipt |
| ADS | — American depositary shares |
| AGC | — Assured Guaranty Corporation |
| AGM | — Assured Guaranty Municipal |
| Ambac | — Ambac Financial Group Incorporated |
| AMT | — Alternative minimum tax |
| BAN | — Bond anticipation notes |
| BHAC | — Berkshire Hathaway Assurance Corporation |
| CAB | — Capital appreciation bond |
| CCAB | — Convertible capital appreciation bond |
| CDA | — Community Development Authority |
| CDO | — Collateralized debt obligation |
| DRIVER | — Derivative inverse tax-exempt receipts |
| DW&P | — Department of Water & Power |
| DWR | — Department of Water Resources |
| ECFA | — Educational & Cultural Facilities Authority |
| EDA | — Economic Development Authority |
| EDFA | — Economic Development Finance Authority |
| ETF | — Exchange-traded fund |
| FDIC | — Federal Deposit Insurance Corporation |
| FFCB | — Federal Farm Credit Banks |
| FGIC | — Financial Guaranty Insurance Corporation |
| FHA | — Federal Housing Administration |
| FHLB | — Federal Home Loan Bank |
| FHLMC | — Federal Home Loan Mortgage Corporation |
| FICO | — The Financing Corporation |
| FNMA | — Federal National Mortgage Association |
| GDR | — Global depositary receipt |
| GNMA | — Government National Mortgage Association |
| HCFR | — Healthcare facilities revenue |
| HEFA | — Health & Educational Facilities Authority |
| HEFAR | — Higher education facilities authority revenue |
| HFA | — Housing Finance Authority |
| HFFA | — Health Facilities Financing Authority |
| HUD | — Department of Housing and Urban Development |
| IDA | — Industrial Development Authority |
| IDAG | — Industrial Development Agency |
| KRW | — Republic of Korea won |
| LIBOR | — London Interbank Offered Rate |
| LLC | — Limited liability company |
| LLLP | — Limited liability limited partnership |
| LLP | — Limited liability partnership |
| MBIA | — Municipal Bond Insurance Association |
| MFHR | — Multifamily housing revenue |
| MSTR | — Municipal securities trust receipts |
| MUD | — Municipal Utility District |
| National | — National Public Finance Guarantee Corporation |
| PCFA | — Pollution Control Financing Authority |
| PCL | — Public Company Limited |
| PCR | — Pollution control revenue |
| PFA | — Public Finance Authority |
| PFFA | — Public Facilities Financing Authority |
| PFOTER | — Puttable floating option tax-exempt receipts |
| plc | — Public limited company |
| PUTTER | — Puttable tax-exempt receipts |
| R&D | — Research & development |
| Radian | — Radian Asset Assurance |
| RAN | — Revenue anticipation notes |
| RDA | — Redevelopment Authority |
| RDFA | — Redevelopment Finance Authority |
| REIT | — Real estate investment trust |
| ROC | — Reset option certificates |
| SAVRS | — Select auction variable rate securities |
| SBA | — Small Business Authority |
| SFHR | — Single-family housing revenue |
| SFMR | — Single-family mortgage revenue |
| SPA | — Standby purchase agreement |
| SPDR | — Standard & Poor’s Depositary Receipts |
| STRIPS | — Separate trading of registered interest and |
| TAN | — Tax anticipation notes |
| TIPS | — Treasury inflation-protected securities |
| TRAN | — Tax revenue anticipation notes |
| TTFA | — Transportation Trust Fund Authority |
| TVA | — Tennessee Valley Authority |
This page is intentionally left blank.
This page is intentionally left blank.


For more information
More information about Wells Fargo Advantage Funds is available free upon request. To obtain literature, please write, email, visit the Fund’s website, or call:
Wells Fargo Advantage Funds
P.O. Box 8266
Boston, MA 02266-8266
Email: wfaf@wellsfargo.com
Website: wellsfargoadvantagefunds.com
Individual investors: 1-800-222-8222
Retail investment professionals: 1-888-877-9275
Institutional investment professionals: 1-866-765-0778
This report and the financial statements contained herein are submitted for the general information of the shareholders of Wells Fargo Advantage Funds. If this report is used for promotional purposes, distribution of the report must be accompanied or preceded by a current prospectus. Before investing, please consider the investment objectives, risks, charges, and expenses of the investment. For a current prospectus and, if available, a summary prospectus, containing this information, call 1-800-222-8222 or visit the Fund’s website at wellsfargoadvantagefunds.com. Read the prospectus carefully before you invest or send money.
Wells Fargo Funds Management, LLC, a wholly owned subsidiary of Wells Fargo & Company, provides investment advisory and administrative services for Wells Fargo Advantage Funds. Other affiliates of Wells Fargo & Company provide subadvisory and other services for the Funds. The Funds are distributed by Wells Fargo Funds Distributor, LLC, Member FINRA/SIPC, an affiliate of Wells Fargo & Company.
NOT FDIC INSURED ¡ NO BANK GUARANTEE ¡ MAY LOSE VALUE
© 2014 Wells Fargo Funds Management, LLC. All rights reserved.
| | |
 | | 230420 02-15 SA268/SAR268 12-14 |

Wells Fargo Advantage
California Limited-Term Tax-Free Fund

Semi-Annual Report
December 31, 2014

Reduce clutter. Save trees.
Sign up for electronic delivery of prospectuses and shareholder reports at wellsfargo.com/advantagedelivery
Contents
The views expressed and any forward-looking statements are as of December 31, 2014, unless otherwise noted, and are those of the Fund managers and/or Wells Fargo Funds Management, LLC. Discussions of individual securities, or the markets generally, or any Wells Fargo Advantage Fund are not intended as individual recommendations. Future events or results may vary significantly from those expressed in any forward-looking statements; the views expressed are subject to change at any time in response to changing circumstances in the market. Wells Fargo Funds Management, LLC and the Fund disclaim any obligation to publicly update or revise any views expressed or forward-looking statements.
NOT FDIC INSURED ¡ NO BANK GUARANTEE ¡ MAY LOSE VALUE
| | | | |
| 2 | | Wells Fargo Advantage California Limited-Term Tax-Free Fund | | Letter to shareholders (unaudited) |

Karla M. Rabusch
President
Wells Fargo Advantage Funds
Municipal bonds rose in the second half of 2014, helped by lower interest rates and strong demand for yield.
Dear Valued Shareholder:
We are pleased to provide you with this semi-annual report for the Wells Fargo Advantage California Limited-Term Tax-Free Fund for the six-month period that ended December 31, 2014. Municipal bonds rose in the second half of 2014, helped by lower interest rates and strong demand for yield. In fact, the longest-dated and weakest credits had the strongest returns. Municipal bond returns—as measured by the Barclays Municipal Bond Index1, the broadest measure for tracking investment-grade municipal bonds throughout the country—gained 2.88% for the six-month period that ended December 31, 2014.
Longer-maturity and lower-rated municipal bonds outperformed.
At the front end of the yield curve, municipal bond yields were extremely low because of the accommodative monetary policy. Throughout the reporting period, the U.S. Federal Reserve’s (Fed’s) monetary policymaking body kept its key interest rate near zero in order to support the economy and the financial system. Policymakers said they can be patient in normalizing monetary policy and that any increases in the target range for the federal funds rate will depend on incoming economic data. During the reporting period, the Fed reduced (or tapered) the size of its quantitative easing program each month until the program ended in October 2014, although it continues to reinvest principal and interest payments of the mortgage-backed securities and Treasury bonds it holds.
Longer-term yields declined during the second half of the year, with 10-year municipal yields declining from 2.33% as of June 30, 2014 to 2.10% as of December 31, 2014. For more perspective, the yield curve was steep on a historical basis at the beginning of the period and ended the period with the difference between 30-year and 2-year yields at 237 basis points (bps; 100 bps equals 1.00%), which was only slightly wider than its historical average. Because the yield curve was steep, longer-dated securities had higher yields. Given their longer maturities (as municipal yields fell further out the curve) and their more generous yields, longer-term bond returns outpaced shorter-term bonds.
Investors were also enticed to buy lower-rated securities for their higher yields. Over the six-month period that ended December 31, 2014, AAA-rated municipal bonds returned 2.04% while BBB-rated bonds returned 4.29%, according to the Barclays Municipal Bond Index. Credit conditions continued to improve, as evidenced by an 18th consecutive quarter of positive year-over-year gains in state and local municipal revenues. In addition to better fundamental credit conditions, technical factors of limited supply alongside strong investor demand also supported municipal bonds.
Puerto Rico’s struggle, the exit of two cities from bankruptcy, and pension issues topped credit news.
Puerto Rico was the asset class’s largest single credit story. Bonds from the commonwealth returned a meager 0.79% during the six-month period as population declines, a contracting economy, and a burdensome level of debt held back results. Meanwhile, the cities of Stockton, California, and Detroit, Michigan, exited bankruptcy by curbing retiree health care benefits and bondholder recoveries but largely avoiding concessions on pensions. While these recent bankruptcies have so far treated pensions better than bonded debt, no clear precedent has been established due to the difference in general obligation
| 1. | The Barclays Municipal Bond Index is an unmanaged index composed of long-term tax-exempt bonds with a minimum credit rating of Baa. You cannot invest directly in an index. |
| | | | | | |
| Letter to shareholders (unaudited) | | Wells Fargo Advantage California Limited-Term Tax-Free Fund | | | 3 | |
pledges and court-ordered versus negotiated concessions. Finally, underfunded pensions in Illinois, New Jersey, Pennsylvania, and Kansas gained attention for their negative fiscal effects and the political difficulties of finding a resolution.
Don’t let short-term uncertainty derail long-term investment goals.
Periods of uncertainty can present challenges, but experience has taught us that maintaining long-term investment goals can be an effective way to plan for the future. To help you create a sound strategy based on your personal goals and risk tolerance, Wells Fargo Advantage Funds offers more than 100 mutual funds and other investments spanning a wide range of asset classes and investment styles. Although diversification cannot guarantee an investment profit or prevent losses, we believe it can be an effective way to manage investment risk and potentially smooth out overall portfolio performance. We encourage investors to know their investments and to understand that appropriate levels of risk-taking may unlock opportunities.
Thank you for choosing to invest with Wells Fargo Advantage Funds. We appreciate your confidence in us and remain committed to helping you meet your financial needs. For current information about your fund investments, contact your investment professional, visit our website at wellsfargoadvantagefunds.com, or call us directly at 1-800-222-8222. We are available 24 hours a day, 7 days a week.
Sincerely,

Karla M. Rabusch
President
Wells Fargo Advantage Funds
Periods of uncertainty can present challenges, but experience has taught us that maintaining long-term investment goals can be an effective way to plan for the future.
| | | | |
| 4 | | Wells Fargo Advantage California Limited-Term Tax-Free Fund | | Performance highlights (unaudited) |
Investment objective
The Fund seeks current income exempt from federal income tax and California individual income tax, consistent with capital preservation.
Adviser
Wells Fargo Funds Management, LLC
Subadviser
Wells Capital Management Incorporated
Portfolio managers
Terry J. Goode Adrian Van Poppel
Average annual total returns1 (%) as of December 31, 2014
| | | | | | | | | | | | | | | | | | | | | | | | | | | | | | | | | | |
| | | | | Including sales charge | | | Excluding sales charge | | | Expense ratios2 (%) | |
| | | Inception date | | 1 year | | | 5 year | | | 10 year | | | 1 year | | | 5 year | | | 10 year | | | Gross | | | Net3 | |
| Class A (SFCIX) | | 11-18-1992 | | | 1.41 | | | | 2.56 | | | | 2.84 | | | | 3.50 | | | | 2.97 | | | | 3.05 | | | | 0.83 | | | | 0.80 | |
| Class C (SFCCX) | | 8-30-2002 | | | 1.83 | | | | 2.20 | | | | 2.29 | | | | 2.83 | | | | 2.20 | | | | 2.29 | | | | 1.58 | | | | 1.55 | |
| Administrator Class (SCTIX) | | 9-6-1996 | | | – | | | | – | | | | – | | | | 3.74 | | | | 3.17 | | | | 3.29 | | | | 0.77 | | | | 0.60 | |
| Institutional Class (SFCNX) | | 10-31-2014 | | | – | | | | – | | | | – | | | | 3.75 | | | | 3.18 | | | | 3.29 | | | | 0.50 | | | | 0.50 | |
| Barclays Municipal 1-5 Year Blend Index4 | | – | | | – | | | | – | | | | – | | | | 1.78 | | | | 2.23 | | | | 3.14 | | | | – | | | | – | |
| Barclays California Municipal 1-5 Year Blend Index5 | | – | | | – | | | | – | | | | – | | | | 1.78 | | | | 2.37 | | | | 3.20 | | | | – | | | | – | |
Figures quoted represent past performance, which is no guarantee of future results, and do not reflect taxes that a shareholder may pay on fund distributions or the redemption of fund shares. Investment return and principal value of an investment will fluctuate so that an investor’s shares, when redeemed, may be worth more or less than their original cost. Performance shown without sales charges would be lower if sales charges were reflected. Current performance may be lower or higher than the performance data quoted, which assumes the reinvestment of dividends and capital gains. Current month-end performance is available on the Fund’s website, wellsfargoadvantagefunds.com.
Index returns do not include transaction costs associated with buying and selling securities, any mutual fund fees or expenses, or any taxes. It is not possible to invest directly in an index.
For Class A shares, the maximum front-end sales charge is 2.00%. For Class C shares, the maximum contingent deferred sales charge is 1.00%. Performance including a contingent deferred sales charge assumes the sales charge for the corresponding time period. Administrator Class and Institutional Class shares are sold without a front-end sales charge or contingent deferred sales charge.
Bond values fluctuate in response to the financial condition of individual issuers, general market and economic conditions, and changes in interest rates. Changes in market conditions and government policies may lead to periods of heightened volatility in the bond market and reduced liquidity for certain bonds held by the Fund. In general, when interest rates rise, bond values fall and investors may lose principal value. Interest-rate changes and their impact on the Fund and its share price can be sudden and unpredictable. The use of derivatives may reduce returns and/or increase volatility. Certain investment strategies tend to increase the total risk of an investment (relative to the broader market). The Fund is exposed to California municipal securities risk and high-yield securities risk. Consult the Fund’s prospectus for additional information on these and other risks. A portion of the Fund’s income may be subject to federal, state, and/or local income taxes or the alternative minimum tax (AMT). Any capital gains distributions may be taxable.
Please see footnotes on page 5.
| | | | | | |
| Performance highlights (unaudited) | | Wells Fargo Advantage California Limited-Term Tax-Free Fund | | | 5 | |
|
| Credit quality distribution6 as of December 31, 2014 |
|
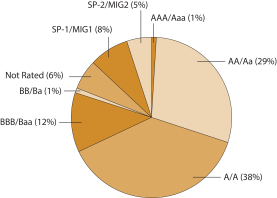 |
|
| Effective maturity distribution7 as of December 31, 2014 |
|
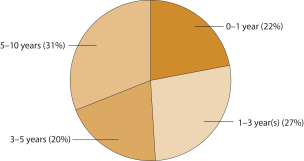 |
| 1. | Historical performance shown for the Institutional Class shares prior to their inception reflects the performance of the Administrator Class shares, and is not adjusted to reflect the Institutional Class expenses. If these expenses had been included, returns for the Institutional Class would be higher. |
| 2. | Reflects the expense ratios as stated in the most recent prospectuses. The expense ratios shown are subject to change and may differ from the annualized expense ratios shown in the financial highlights of this report. |
| 3. | The Adviser has committed through October 31, 2016, to waive fees and/or reimburse expenses to the extent necessary to cap the Fund’s Total Annual Fund Operating Expenses After Fee Waiver, excluding certain expenses, at the amounts shown. After this time, the cap may be increased or the commitment to maintain the cap may be terminated only with the approval of the Board of Trustees. Brokerage commissions, stamp duty fees, interest, taxes, acquired fund fees and expenses, and extraordinary expenses are excluded from the cap. Without this cap, the Fund’s returns would have been lower. |
| 4. | The Barclays Municipal 1-5 Year Blend Index is the 1-5 Year Blend Component of the Barclays Municipal Bond Index. You cannot invest directly in an index. |
| 5. | The Barclays California Municipal 1-5 Year Blend Index is the 1-5 Year Blend Component of the Barclays California Municipal Bond Index. You cannot invest directly in an index. |
| 6. | The credit quality distribution of portfolio holdings reflected in the chart is based on ratings from Standard & Poor’s, Moody’s Investors Service, and/or Fitch Ratings Ltd. Credit quality ratings apply to the underlying holdings of the Fund and not to the Fund itself. The percentages of the Fund’s portfolio with the ratings depicted in the chart are calculated based on the total market value of fixed income securities held by the Fund. If a security was rated by all three rating agencies, the middle rating was utilized. If rated by two of three rating agencies, the lower rating was utilized, and if rated by one of the rating agencies, that rating was utilized. Standard & Poor’s rates the creditworthiness of bonds, ranging from AAA (highest) to D (lowest). Ratings from A to CCC may be modified by the addition of a plus (+) or minus (-) sign to show relative standing within the rating categories. Standard & Poor’s rates the creditworthiness of short-term notes from SP-1 (highest) to SP-3 (lowest). Moody’s rates the creditworthiness of bonds, ranging from Aaa (highest) to C (lowest). Ratings Aa to B may be modified by the addition of a number 1 (highest) to 3 (lowest) to show relative standing within the ratings categories. Moody’s rates the creditworthiness of short-term U.S. tax-exempt municipal securities from MIG 1/VMIG 1 (highest) to SG (lowest). Fitch rates the creditworthiness of bonds, ranging from AAA (highest) to D (lowest). Credit quality and credit quality ratings are subject to change and may have changed since the date specified. |
| 7. | Effective maturity distribution is calculated based on the total long-term investments of the Fund. It is subject to change and may have changed since the date specified. |
| | | | |
| 6 | | Wells Fargo Advantage California Limited-Term Tax-Free Fund | | Fund expenses (unaudited) |
As a shareholder of the Fund, you incur two types of costs: (1) transaction costs, including sales charges (loads) on purchase payments and contingent deferred sales charges (if any) on redemptions and (2) ongoing costs, including management fees, distribution (12b-1) and/or shareholder service fees, and other Fund expenses. This example is intended to help you understand your ongoing costs (in dollars) of investing in the Fund and to compare these costs with the ongoing costs of investing in other mutual funds.
The example is based on an investment of $1,000 invested at the beginning of the six-month period and held for the entire period from July 1, 2014 to December 31, 2014.
Actual expenses
The “Actual” line of the table below provides information about actual account values and actual expenses. You may use the information in this line, together with the amount you invested, to estimate the expenses that you paid over the period. Simply divide your account value by $1,000 (for example, an $8,600 account value divided by $1,000 = 8.6), then multiply the result by the number in the “Actual” line under the heading entitled “Expenses paid during period” for your applicable class of shares to estimate the expenses you paid on your account during this period.
Hypothetical example for comparison purposes
The “Hypothetical” line of the table below provides information about hypothetical account values and hypothetical expenses based on the Fund’s actual expense ratio and an assumed rate of return of 5% per year before expenses, which is not the Fund’s actual return. The hypothetical account values and expenses may not be used to estimate the actual ending account balance or expenses you paid for the period. You may use this information to compare the ongoing costs of investing in the Fund and other funds. To do so, compare this 5% hypothetical example with the 5% hypothetical examples that appear in the shareholder reports of the other funds.
Please note that the expenses shown in the table are meant to highlight your ongoing costs only and do not reflect any transactional costs, such as sales charges (loads) and contingent deferred sales charges. Therefore, the “Hypothetical” line of the table is useful in comparing ongoing costs only and will not help you determine the relative total costs of owning different funds. In addition, if these transactional costs were included, your costs would have been higher.
| | | | | | | | | | | | | | | | |
| | | Beginning
account value
7-1-2014 | | | Ending
account value
12-31-2014 | | | Expenses
paid during
the period¹ | | | Net annualized
expense ratio | |
Class A | | | | | | | | | | | | | | | | |
Actual | | $ | 1,000.00 | | | $ | 1,010.12 | | | $ | 4.05 | | | | 0.80 | % |
Hypothetical (5% return before expenses) | | $ | 1,000.00 | | | $ | 1,021.17 | | | $ | 4.08 | | | | 0.80 | % |
Class C | | | | | | | | | | | | | | | | |
Actual | | $ | 1,000.00 | | | $ | 1,006.32 | | | $ | 7.84 | | | | 1.55 | % |
Hypothetical (5% return before expenses) | | $ | 1,000.00 | | | $ | 1,017.39 | | | $ | 7.88 | | | | 1.55 | % |
Administrator Class | | | | | | | | | | | | | | | | |
Actual | | $ | 1,000.00 | | | $ | 1,010.25 | | | $ | 3.04 | | | | 0.60 | % |
Hypothetical (5% return before expenses) | | $ | 1,000.00 | | | $ | 1,022.18 | | | $ | 3.06 | | | | 0.60 | % |
Institutional Class | | | | | | | | | | | | | | | | |
Actual | | $ | 1,000.00 | | | $ | 1,010.35 | | | $ | 2.53 | | | | 0.50 | % |
Hypothetical (5% return before expenses) | | $ | 1,000.00 | | | $ | 1,022.68 | | | $ | 2.55 | | | | 0.50 | % |
| 1. | Expenses paid is equal to the annualized expense ratio of each class multiplied by the average account value over the period, multiplied by the number of days in the most recent fiscal half-year divided by the number of days in the fiscal year (to reflect the one-half-year period). |
| | | | | | |
| Portfolio of investments—December 31, 2014 (unaudited) | | Wells Fargo Advantage California Limited-Term Tax-Free Fund | | | 7 | |
| | | | | | | | | | | | | | | | |
| Security name | | Interest rate | | | Maturity date | | | Principal | | | Value | |
| | | | | | | | | | | | | | | | |
| | | | |
Municipal Obligations: 96.69% | | | | | | | | | | | | | | | | |
| | | | |
| California: 92.59% | | | | | | | | | | | | | | | | |
ABAG Financial Authority For Nonprofit Corporations Children’s Hospital (Health Revenue) | | | 4.25 | % | | | 12-1-2016 | | | $ | 1,305,000 | | | $ | 1,398,608 | |
ABAG Financial Authority For Nonprofit Corporations Episcopal Senior Community (Health Revenue) | | | 2.50 | | | | 7-1-2019 | | | | 2,250,000 | | | | 2,250,315 | |
ABAG Financial Authority For Nonprofit Corporations Episcopal Senior Community (Housing Revenue) | | | 5.00 | | | | 7-1-2015 | | | | 995,000 | | | | 1,015,457 | |
ABAG Financial Authority For Nonprofit Corporations Episcopal Senior Community (Housing Revenue) | | | 5.00 | | | | 7-1-2016 | | | | 1,045,000 | | | | 1,103,050 | |
ABAG Financial Authority For Nonprofit Corporations Jackson Laboratory (Miscellaneous Revenue) | | | 5.00 | | | | 7-1-2019 | | | | 730,000 | | | | 832,237 | |
ABAG Financial Authority For Nonprofit Corporations O’Connor Woods (Health Revenue) | | | 4.00 | | | | 1-1-2019 | | | | 955,000 | | | | 1,049,698 | |
ABAG Financial Authority For Nonprofit Corporations Sharp Healthcare Series A (Health Revenue) | | | 5.00 | | | | 8-1-2019 | | | | 500,000 | | | | 580,875 | |
Acalanes CA Union High School District BAN (GO) | | | 5.00 | | | | 8-1-2017 | | | | 1,000,000 | | | | 1,105,580 | |
Adelanto CA School District CAB Series B (GO, National Insured) ¤ | | | 0.00 | | | | 9-1-2018 | | | | 2,345,000 | | | | 1,964,008 | |
Alameda CA Corridor Transportation Authority CAB Sub Lien Series A (Transportation Revenue, Ambac Insured) ¤ | | | 0.00 | | | | 10-1-2019 | | | | 3,000,000 | | | | 2,701,950 | |
Alameda County CA Certificate of Participation (Miscellaneous Revenue, Ambac Insured) | | | 5.63 | | | | 12-1-2015 | | | | 550,000 | | | | 576,246 | |
Alameda County CA Joint Powers Authority Multiple Capital Projects Series A (Miscellaneous Revenue) | | | 4.00 | | | | 12-1-2019 | | | | 1,000,000 | | | | 1,115,360 | |
Alameda County CA Joint Powers Authority Multiple Capital Projects Series A (Miscellaneous Revenue) | | | 5.00 | | | | 12-1-2021 | | | | 1,000,000 | | | | 1,197,270 | |
Alameda County CA Joint Powers Authority PUTTERs Series 2927Z (Miscellaneous Revenue, AGM Insured, JPMorgan Chase & Company LIQ) 144Aø | | | 0.03 | | | | 12-1-2015 | | | | 3,490,000 | | | | 3,490,000 | |
Albany CA Limited Obligation Improvement Bond Act of 1915 (Miscellaneous Revenue, Ambac Insured) | | | 4.75 | | | | 9-2-2019 | | | | 1,305,000 | | | | 1,313,156 | |
Alvord CA Unified School District BAN (GO) ¤ | | | 0.00 | | | | 5-1-2015 | | | | 5,000,000 | | | | 4,996,450 | |
Alvord CA Unified School District Election of 2007 Series B (GO, AGM Insured) ¤ | | | 0.00 | | | | 8-1-2016 | | | | 305,000 | | | | 301,181 | |
Alvord CA Unified School District Election of 2007 Series B (GO, AGM Insured) ¤ | | | 0.00 | | | | 8-1-2017 | | | | 155,000 | | | | 159,007 | |
Alvord CA Unified School District Election of 2007 Series B (GO, AGM Insured) ¤ | | | 0.00 | | | | 8-1-2018 | | | | 475,000 | | | | 506,132 | |
Alvord CA Unified School District Election of 2007 Series B (GO, AGM Insured) ¤ | | | 0.00 | | | | 8-1-2020 | | | | 1,605,000 | | | | 1,823,826 | |
Anaheim CA PFA CAB Sub Lien Public Improvements Project Series C (Miscellaneous Revenue, AGM Insured) ¤ | | | 0.00 | | | | 9-1-2018 | | | | 3,245,000 | | | | 3,093,199 | |
Anaheim CA PFA Refunding Bond Series A (Miscellaneous Revenue) | | | 5.00 | | | | 5-1-2017 | | | | 1,250,000 | | | | 1,363,300 | |
Anaheim CA Redevelopment Agency Merged Project Area Series A (Tax Revenue, AGM Insured) | | | 4.50 | | | | 2-1-2018 | | | | 875,000 | | | | 956,830 | |
Antelope Valley CA Health Care District Series A (Health Revenue, AGM Insured) | | | 5.20 | | | | 1-1-2017 | | | | 280,000 | | | | 281,145 | |
Bassett CA Unified School District Refunding Bond Series B (GO, Build America Mutual Assurance Company Insured) %% | | | 5.00 | | | | 8-1-2019 | | | | 420,000 | | | | 472,256 | |
Bassett CA Unified School District Refunding Bond Series B (GO, Build America Mutual Assurance Company Insured) %% | | | 5.00 | | | | 8-1-2021 | | | | 550,000 | | | | 632,803 | |
Bassett CA Unified School District Refunding Bond Series B (GO, Build America Mutual Assurance Company Insured) %% | | | 5.00 | | | | 8-1-2023 | | | | 725,000 | | | | 846,140 | |
Bay Area Toll Authority California San Francisco Bay Area Toll Bridge Series B (Transportation Revenue) ± | | | 1.50 | | | | 4-1-2047 | | | | 14,000,000 | | | | 14,132,020 | |
Bay Area Toll Authority California San Francisco Bay Area Toll Bridge Series C (Transportation Revenue) ± | | | 0.96 | | | | 4-1-2045 | | | | 5,000,000 | | | | 5,062,450 | |
Bay Area Toll Authority California San Francisco Bay Area Toll Bridge Series C (Transportation Revenue) ± | | | 1.88 | | | | 4-1-2047 | | | | 12,000,000 | | | | 12,176,640 | |
The accompanying notes are an integral part of these financial statements.
| | | | |
| 8 | | Wells Fargo Advantage California Limited-Term Tax-Free Fund | | Portfolio of investments—December 31, 2014 (unaudited) |
| | | | | | | | | | | | | | | | |
| Security name | | Interest rate | | | Maturity date | | | Principal | | | Value | |
| | | | | | | | | | | | | | | | |
| | | | |
| California (continued) | | | | | | | | | | | | | | | | |
Bay Area Toll Authority California San Francisco Bay Area Toll Bridge Series E (Transportation Revenue) ± | | | 2.00 | % | | | 4-1-2034 | | | $ | 5,000,000 | | | $ | 5,038,750 | |
Brentwood CA Infrastructure Financing Authority Sub Series A (Miscellaneous Revenue, AGM Insured) | | | 4.00 | | | | 9-2-2017 | | | | 3,825,000 | | | | 4,082,040 | |
Brentwood CA Infrastructure Financing Authority Sub Series B (Miscellaneous Revenue) | | | 3.00 | | | | 9-2-2017 | | | | 995,000 | | | | 1,033,676 | |
Brentwood CA Infrastructure Financing Authority Sub Series B (Miscellaneous Revenue) | | | 3.00 | | | | 9-2-2018 | | | | 1,030,000 | | | | 1,076,360 | |
Brentwood CA Infrastructure Financing Authority Sub Series B (Miscellaneous Revenue) | | | 4.00 | | | | 9-2-2021 | | | | 1,135,000 | | | | 1,224,926 | |
Cabrillo CA Unified School District CAB Series A (GO, Ambac Insured) ¤ | | | 0.00 | | | | 8-1-2015 | | | | 1,500,000 | | | | 1,495,980 | |
California (GO) ± | | | 3.00 | | | | 12-1-2032 | | | | 4,000,000 | | | | 4,277,800 | |
California (GO) ± | | | 4.00 | | | | 12-1-2027 | | | | 9,015,000 | | | | 9,663,179 | |
California (GO, Ambac Insured) | | | 5.00 | | | | 10-1-2016 | | | | 10,000 | | | | 10,040 | |
California (GO) | | | 5.00 | | | | 10-1-2021 | | | | 6,795,000 | | | | 8,198,643 | |
California (Miscellaneous Revenue) | | | 5.00 | | | | 9-1-2022 | | | | 2,240,000 | | | | 2,720,099 | |
California (GO) | | | 5.00 | | | | 11-1-2022 | | | | 2,500,000 | | | | 3,040,825 | |
California (Miscellaneous Revenue) | | | 5.00 | | | | 9-1-2023 | | | | 10,730,000 | | | | 13,164,530 | |
California (GO) | | | 5.00 | | | | 10-1-2023 | | | | 8,400,000 | | | | 10,320,660 | |
California (GO) | | | 5.25 | | | | 10-1-2022 | | | | 2,750,000 | | | | 3,391,383 | |
California Communities Transportation Total Road Improvement Certificate of Participation Series B (Tax Revenue) | | | 3.00 | | | | 6-1-2015 | | | | 360,000 | | | | 363,578 | |
California Communities Transportation Total Road Improvement Certificate of Participation Series B (Tax Revenue) | | | 3.00 | | | | 6-1-2016 | | | | 370,000 | | | | 381,008 | |
California Communities Transportation Total Road Improvement Certificate of Participation Series B (Tax Revenue) | | | 3.00 | | | | 6-1-2017 | | | | 380,000 | | | | 394,748 | |
California Communities Transportation Total Road Improvement Certificate of Participation Series B (Tax Revenue) | | | 4.00 | | | | 6-1-2018 | | | | 390,000 | | | | 419,511 | |
California Community College Financing Authority Shasta-Tehama-Trinity Joint District Series A (Miscellaneous Revenue) | | | 2.00 | | | | 5-1-2015 | | | | 230,000 | | | | 231,182 | |
California Community College Financing Authority Shasta-Tehama-Trinity Joint District Series A (Miscellaneous Revenue) | | | 2.00 | | | | 5-1-2016 | | | | 420,000 | | | | 427,216 | |
California Community College Financing Authority Shasta-Tehama-Trinity Joint District Series A (Miscellaneous Revenue) | | | 2.25 | | | | 5-1-2017 | | | | 435,000 | | | | 446,358 | |
California Department of Transportation Certificate of Participation Series A (Miscellaneous Revenue, National Insured) | | | 5.25 | | | | 3-1-2016 | | | | 115,000 | | | | 115,478 | |
California Department of Veterans Affairs Home Purchase Series A (Housing Revenue) | | | 3.50 | | | | 12-1-2021 | | | | 1,795,000 | | | | 1,969,977 | |
California DWR Central Valley Project Water System Series AM (Water & Sewer Revenue) | | | 5.00 | | | | 12-1-2017 | | | | 6,595,000 | | | | 7,412,912 | |
California Economic Recovery Series A (Tax Revenue) | | | 5.00 | | | | 7-1-2018 | | | | 3,800,000 | | | | 4,338,460 | |
California Health Facilities Financing Chinese Hospital Associates (Health Revenue) | | | 5.00 | | | | 6-1-2019 | | | | 200,000 | | | | 229,128 | |
California Health Facilities Financing Fellowship Homes Incorporated (Health Revenue) | | | 5.00 | | | | 9-1-2019 | | | | 1,135,000 | | | | 1,264,969 | |
California HFA AMT Home Mortgage Series E (Housing Revenue) | | | 5.00 | | | | 2-1-2042 | | | | 175,000 | | | | 181,741 | |
California HFA AMT Home Mortgage Series G (Housing Revenue) | | | 5.50 | | | | 8-1-2042 | | | | 740,000 | | | | 764,006 | |
California HFA AMT Home Mortgage Series H (Housing Revenue, FGIC Insured) | | | 5.75 | | | | 8-1-2030 | | | | 415,000 | | | | 432,974 | |
California HFA AMT Home Mortgage Series J (Housing Revenue) | | | 5.75 | | | | 8-1-2047 | | | | 205,000 | | | | 210,941 | |
California HFA CAB Home Mortgage Series B (Housing Revenue, FHA Insured) ¤ | | | 0.00 | | | | 8-1-2015 | | | | 5,000 | | | | 4,833 | |
California HFA Home Mortgage Series A (Housing Revenue, GNMA/FNMA Insured) | | | 3.75 | | | | 8-1-2020 | | | | 1,195,000 | | | | 1,291,365 | |
California HFA Home Mortgage Series D (Housing Revenue, FGIC Insured) | | | 4.30 | | | | 8-1-2015 | | | | 475,000 | | | | 482,253 | |
California HFFA Catholic Healthcare West Series A (Health Revenue) | | | 5.00 | | | | 3-1-2019 | | | | 700,000 | | | | 805,854 | |
The accompanying notes are an integral part of these financial statements.
| | | | | | |
| Portfolio of investments—December 31, 2014 (unaudited) | | Wells Fargo Advantage California Limited-Term Tax-Free Fund | | | 9 | |
| | | | | | | | | | | | | | | | |
| Security name | | Interest rate | | | Maturity date | | | Principal | | | Value | |
| | | | | | | | | | | | | | | | |
| | | | |
| California (continued) | | | | | | | | | | | | | | | | |
California HFFA Catholic Healthcare West Series A (Health Revenue) | | | 5.25 | % | | | 3-1-2023 | | | $ | 4,000,000 | | | $ | 4,744,760 | |
California HFFA Catholic Healthcare West Series L (Health Revenue) | | | 5.13 | | | | 7-1-2022 | | | | 265,000 | | | | 271,519 | |
California HFFA Memorial Health Services Series A (Health Revenue) | | | 5.00 | | | | 10-1-2023 | | | | 2,475,000 | | | | 2,965,743 | |
California HFFA St. Joseph Health System Series B (Health Revenue) | | | 5.00 | | | | 7-1-2043 | | | | 2,000,000 | | | | 2,229,480 | |
California HFFA St. Joseph Health System Series C (Health Revenue) | | | 5.00 | | | | 7-1-2034 | | | | 9,975,000 | | | | 12,050,399 | |
California Municipal Finance Authority Charter School Albert Einstein Academies Project Series A (Miscellaneous Revenue) | | | 6.00 | | | | 8-1-2023 | | | | 805,000 | | | | 888,945 | |
California Municipal Finance Authority Mobile Home Park Senior Affordable Housing Incorporated Projects Series A (Housing Revenue) | | | 5.00 | | | | 8-15-2019 | | | | 515,000 | | | | 585,550 | |
California Municipal Finance Authority Northbay Healthcare Series A (Health Revenue) ± | | | 2.14 | | | | 11-1-2027 | | | | 5,000,000 | | | | 5,011,450 | |
California Municipal Finance Authority Peppertree Senior Apartments Series A (Housing Revenue, FHLMC Insured, FHLMC LIQ) | | | 2.80 | | | | 6-1-2023 | | | | 2,500,000 | | | | 2,583,675 | |
California Municipal Finance Authority Village Grove Apartments Series A (Housing Revenue, FHLMC Insured, FHLMC LIQ) | | | 3.10 | | | | 12-1-2021 | | | | 1,000,000 | | | | 1,049,990 | |
California PCFA (Resource Recovery Revenue) ± | | | 5.25 | | | | 6-1-2023 | | | | 3,245,000 | | | | 3,534,584 | |
California PFOTER PT-2802 (GO, National Insured, Dexia Credit Local SPA) ø | | | 0.23 | | | | 2-1-2025 | | | | 6,110,000 | | | | 6,110,000 | |
California PFOTER Series DCL-010 (GO, Dexia Credit Local LOC, AGM Insured) 144Aø | | | 0.24 | | | | 8-1-2027 | | | | 6,000,000 | | | | 6,000,000 | |
California Public Works Board Capital Project Series G (Miscellaneous Revenue) | | | 5.00 | | | | 11-1-2020 | | | | 3,000,000 | | | | 3,550,500 | |
California Public Works Board Department of Corrections & Rehabilitation Series A (Miscellaneous Revenue) | | | 6.50 | | | | 9-1-2017 | | | | 1,210,000 | | | | 1,294,894 | |
California Public Works Board Department of Corrections & Rehabilitation Series C (Miscellaneous Revenue) | | | 4.00 | | | | 6-1-2018 | | | | 1,625,000 | | | | 1,785,258 | |
California Public Works Board Department of Corrections & Rehabilitation Series C (Miscellaneous Revenue) | | | 5.00 | | | | 10-1-2022 | | | | 1,500,000 | | | | 1,823,340 | |
California Public Works Board Department of Corrections & Rehabilitation Series D (Miscellaneous Revenue, AGM Insured) | | | 5.25 | | | | 6-1-2015 | | | | 260,000 | | | | 264,033 | |
California Public Works Board Department of Corrections & Rehabilitation Series E (Miscellaneous Revenue, National Insured) | | | 5.50 | | | | 6-1-2015 | | | | 180,000 | | | | 182,522 | |
California Public Works Board Department of General Services Series A (Miscellaneous Revenue, Ambac Insured) | | | 5.25 | | | | 12-1-2017 | | | | 2,000,000 | | | | 2,008,120 | |
California Public Works Board Judicial Council Projects Series B (Miscellaneous Revenue) | | | 5.00 | | | | 10-1-2022 | | | | 500,000 | | | | 607,780 | |
California Public Works Board Judicial Council Projects Series D (Miscellaneous Revenue) | | | 5.00 | | | | 12-1-2019 | | | | 1,000,000 | | | | 1,168,720 | |
California Public Works Board Series I (Miscellaneous Revenue) | | | 5.00 | | | | 11-1-2020 | | | | 1,250,000 | | | | 1,479,375 | |
California Refunding Bond (GO) | | | 5.25 | | | | 9-1-2022 | | | | 5,000,000 | | | | 6,160,150 | |
California School Cash Reserve Program Authority Series G (Miscellaneous Revenue) | | | 2.00 | | | | 2-27-2015 | | | | 2,000,000 | | | | 2,005,300 | |
California School Finance Authority Coastal Academy Project Series A (Education Revenue) | | | 5.00 | | | | 10-1-2022 | | | | 400,000 | | | | 436,428 | |
California Series E (GO) ± | | | 0.94 | | | | 12-1-2029 | | | | 5,000,000 | | | | 5,078,150 | |
California Statewide CDA (Tax Revenue) | | | 2.00 | | | | 9-2-2015 | | | | 2,000,000 | | | | 2,012,560 | |
California Statewide CDA (Health Revenue) | | | 4.00 | | | | 5-15-2017 | | | | 450,000 | | | | 480,839 | |
California Statewide CDA (Education Revenue) | | | 5.88 | | | | 7-1-2022 | | | | 2,190,000 | | | | 2,455,581 | |
California Statewide CDA American Baptist Homes West (Health Revenue) | | | 4.25 | | | | 10-1-2015 | | | | 615,000 | | | | 624,631 | |
California Statewide CDA American Baptist Homes West Series B-3 (Health Revenue) | | | 2.10 | | | | 10-1-2019 | | | | 2,930,000 | | | | 2,930,879 | |
California Statewide CDA California Baptist University Series A (Education Revenue) | | | 5.13 | | | | 11-1-2023 | | | | 715,000 | | | | 780,158 | |
California Statewide CDA California Baptist University Series B (Education Revenue) | | | 3.50 | | | | 11-1-2018 | | | | 975,000 | | | | 998,371 | |
California Statewide CDA Certificate of Participation (Health Revenue) | | | 4.00 | | | | 6-1-2015 | | | | 325,000 | | | | 329,891 | |
California Statewide CDA Eskaton Properties Incorporated Obligated Group (Health Revenue) | | | 4.00 | | | | 11-15-2015 | | | | 1,000,000 | | | | 1,026,130 | |
The accompanying notes are an integral part of these financial statements.
| | | | |
| 10 | | Wells Fargo Advantage California Limited-Term Tax-Free Fund | | Portfolio of investments—December 31, 2014 (unaudited) |
| | | | | | | | | | | | | | | | |
| Security name | | Interest rate | | | Maturity date | | | Principal | | | Value | |
| | | | | | | | | | | | | | | | |
| | | | |
| California (continued) | | | | | | | | | | | | | | | | |
California Statewide CDA Eskaton Properties Incorporated Obligated Group (Health Revenue) | | | 4.00 | % | | | 11-15-2016 | | | $ | 1,000,000 | | | $ | 1,047,920 | |
California Statewide CDA Health Facilities Catholic Series F (Health Revenue, AGM Insured) ±(m) | | | 0.65 | | | | 7-1-2040 | | | | 1,000,000 | | | | 1,000,000 | |
California Statewide CDA Henry Mayo Newhall Memorial Hospital Series A (Health Revenue, AGM Insured) | | | 5.00 | | | | 10-1-2021 | | | | 500,000 | | | | 573,415 | |
California Statewide CDA Henry Mayo Newhall Memorial Hospital Series A (Health Revenue, AGM Insured) | | | 5.00 | | | | 10-1-2022 | | | | 395,000 | | | | 453,223 | |
California Statewide CDA Henry Mayo Newhall Memorial Hospital Series A (Health Revenue, AGM Insured) | | | 5.00 | | | | 10-1-2023 | | | | 500,000 | | | | 574,980 | |
California Statewide CDA Kaiser Permanente Series E (Health Revenue) | | | 5.00 | | | | 4-1-2044 | | | | 4,000,000 | | | | 4,409,480 | |
California Statewide CDA MFHR ROC (Housing Revenue, Citibank NA LIQ) 144Aø | | | 0.54 | | | | 12-14-2016 | | | | 3,400,000 | | | | 3,400,000 | |
California Statewide CDA MFHR ROC (Housing Revenue, Citibank NA LIQ) 144Aø | | | 0.54 | | | | 9-6-2035 | | | | 5,400,000 | | | | 5,400,000 | |
California Statewide CDA Monterey Community Hospital (Health Revenue) | | | 3.25 | | | | 6-1-2016 | | | | 415,000 | | | | 430,446 | |
California Statewide CDA Pollution Control Southern California Edison Company Series A & B (Industrial Development Revenue) ± | | | 1.90 | | | | 4-1-2028 | | | | 3,415,000 | | | | 3,440,305 | |
California Statewide CDA Redwoods Project (Health Revenue) | | | 3.00 | | | | 11-15-2018 | | | | 400,000 | | | | 424,468 | |
California Statewide CDA Refunding Bond (Miscellaneous Revenue, AGM Insured) | | | 5.00 | | | | 11-15-2019 | | | | 250,000 | | | | 288,260 | |
California Statewide CDA Refunding Bond (Miscellaneous Revenue, AGM Insured) | | | 5.00 | | | | 11-15-2020 | | | | 210,000 | | | | 245,692 | |
California Statewide CDA Refunding Bond (Miscellaneous Revenue, AGM Insured) | | | 5.00 | | | | 11-15-2021 | | | | 200,000 | | | | 236,110 | |
California Statewide CDA Refunding Bond (Miscellaneous Revenue, AGM Insured) | | | 5.00 | | | | 11-15-2022 | | | | 200,000 | | | | 237,530 | |
California Statewide CDA Senior Living Health Facilities Los Angeles Jewish Home for the Aging Series B (Health Revenue) | | | 3.00 | | | | 8-1-2021 | | | | 5,200,000 | | | | 5,344,612 | |
California Statewide CDA Senior Living Health Facilities Los Angeles Jewish Home for the Aging Sub Series D (Health Revenue) | | | 4.75 | | | | 8-1-2020 | | | | 2,000,000 | | | | 2,010,340 | |
California Statewide CDA St. Joseph Hospital (Health Revenue, AGM Insured) | | | 4.50 | | | | 7-1-2018 | | | | 750,000 | | | | 795,825 | |
California Statewide CDA University of California Irvine East Campus Apartments Phase I (Housing Revenue) | | | 5.00 | | | | 5-15-2017 | | | | 1,000,000 | | | | 1,087,950 | |
California Statewide CDA University of California Irvine East Campus Apartments Phase II (Education Revenue) | | | 5.00 | | | | 5-15-2015 | | | | 1,500,000 | | | | 1,525,320 | |
California Statewide CDA University of California Irvine East Campus Apartments Phase II (Education Revenue) | | | 5.00 | | | | 5-15-2016 | | | | 380,000 | | | | 402,184 | |
California Statewide HFFA Casa Colina Obligated Group (Health Revenue) | | | 4.00 | | | | 4-1-2015 | | | | 400,000 | | | | 402,988 | |
California Statewide HFFA Casa Colina Obligated Group (Health Revenue) | | | 4.00 | | | | 4-1-2016 | | | | 400,000 | | | | 413,012 | |
California Statewide HFFA Casa Colina Obligated Group (Health Revenue) | | | 4.00 | | | | 4-1-2017 | | | | 400,000 | | | | 419,176 | |
California Statewide HFFA Casa Colina Obligated Group (Health Revenue) | | | 5.00 | | | | 4-1-2018 | | | | 400,000 | | | | 436,516 | |
Carlsbad CA Improvement Bond Act of 1915 (Miscellaneous Revenue) | | | 3.00 | | | | 9-2-2017 | | | | 415,000 | | | | 431,131 | |
Carlsbad CA Improvement Bond Act of 1915 (Miscellaneous Revenue) | | | 3.00 | | | | 9-2-2018 | | | | 300,000 | | | | 313,503 | |
Carlsbad CA Improvement Bond Act of 1915 (Miscellaneous Revenue) | | | 3.00 | | | | 9-2-2019 | | | | 540,000 | | | | 562,189 | |
Carson CA RDA Project Area #1 Series A (Tax Revenue, AGM Insured) | | | 5.00 | | | | 10-1-2020 | | | | 775,000 | | | | 898,954 | |
Carson CA RDA Project Area #1 Series A (Tax Revenue, AGM Insured) | | | 5.00 | | | | 10-1-2021 | | | | 855,000 | | | | 1,003,796 | |
Carson CA RDA Project Area #1 Series A (Tax Revenue, AGM Insured) | | | 5.00 | | | | 10-1-2022 | | | | 600,000 | | | | 710,634 | |
Cathedral City CA Redevelopment Agency Refunding Merged Redevelopment Project Series A (Tax Revenue) | | | 5.00 | | | | 8-1-2019 | | | | 1,165,000 | | | | 1,335,451 | |
Cathedral City CA Redevelopment Agency Refunding Merged Redevelopment Project Series A (Tax Revenue) | | | 5.00 | | | | 8-1-2020 | | | | 2,295,000 | | | | 2,666,629 | |
Cathedral City CA Redevelopment Agency Refunding Merged Redevelopment Project Series A (Tax Revenue) | | | 5.00 | | | | 8-1-2021 | | | | 2,425,000 | | | | 2,845,907 | |
Cathedral City CA Redevelopment Agency Refunding Merged Redevelopment Project Series A (Tax Revenue) | | | 5.00 | | | | 8-1-2022 | | | | 2,550,000 | | | | 3,020,424 | |
Cathedral City CA Redevelopment Agency Refunding Merged Redevelopment Project Series A (Tax Revenue) | | | 5.00 | | | | 8-1-2023 | | | | 1,735,000 | | | | 2,068,051 | |
The accompanying notes are an integral part of these financial statements.
| | | | | | |
| Portfolio of investments—December 31, 2014 (unaudited) | | Wells Fargo Advantage California Limited-Term Tax-Free Fund | | | 11 | |
| | | | | | | | | | | | | | | | |
| Security name | | Interest rate | | | Maturity date | | | Principal | | | Value | |
| | | | | | | | | | | | | | | | |
| | | | |
| California (continued) | | | | | | | | | | | | | | | | |
Cathedral City CA Redevelopment Agency Refunding Merged Redevelopment Project Series A (Tax Revenue, AGM Insured) | | | 5.00 | % | | | 8-1-2024 | | | $ | 1,770,000 | | | $ | 2,124,797 | |
Cathedral City CA Redevelopment Agency Refunding Merged Redevelopment Project Series B (Tax Revenue) | | | 4.00 | | | | 8-1-2017 | | | | 435,000 | | | | 468,191 | |
Centinela Valley CA Union High School District CAB Series A (GO, AGM Insured) ¤ | | | 0.00 | | | | 8-1-2015 | | | | 375,000 | | | | 372,960 | |
Central California Unified School District Refunding (GO, AGM Insured) | | | 4.00 | | | | 7-1-2020 | | | | 500,000 | | | | 562,665 | |
Central California Unified School District Refunding (GO, AGM Insured) | | | 5.00 | | | | 7-1-2021 | | | | 400,000 | | | | 478,740 | |
Central California Unified School District Refunding (GO, AGM Insured) | | | 5.00 | | | | 7-1-2022 | | | | 750,000 | | | | 908,910 | |
Centralia CA School District (GO, AGM Insured) | | | 4.00 | | | | 8-1-2018 | | | | 375,000 | | | | 406,099 | |
Chula Vista CA Certificate of Participation Refunding Bond Police Facility Project (Miscellaneous Revenue) | | | 4.50 | | | | 10-1-2018 | | | | 690,000 | | | | 768,660 | |
Chula Vista CA Certificate of Participation Refunding Bond Police Facility Project (Miscellaneous Revenue) | | | 5.00 | | | | 10-1-2021 | | | | 720,000 | | | | 846,907 | |
Clovis CA PFA (Water & Sewer Revenue, Ambac Insured) | | | 5.00 | | | | 8-1-2015 | | | | 375,000 | | | | 384,810 | |
Coachella Valley CA Unified School District (GO, Build America Mutual Assurance Company Insured) | | | 4.00 | | | | 8-1-2020 | | | | 2,455,000 | | | | 2,753,012 | |
Coachella Valley CA Unified School District (GO, Build America Mutual Assurance Company Insured) | | | 4.00 | | | | 8-1-2021 | | | | 2,230,000 | | | | 2,508,817 | |
Coachella Valley CA Unified School District (GO, Build America Mutual Assurance Company Insured) | | | 4.00 | | | | 8-1-2022 | | | | 1,000,000 | | | | 1,130,300 | |
Colton CA PFA Series A (Utilities Revenue) | | | 4.00 | | | | 4-1-2019 | | | | 415,000 | | | | 458,102 | |
Compton CA Community College District (GO) | | | 5.00 | | | | 7-1-2017 | | | | 1,225,000 | | | | 1,333,609 | |
Compton CA Series A (GO) | | | 2.75 | | | | 6-1-2015 | | | | 8,000,000 | | | | 7,998,400 | |
Compton CA Solid Waste Management Facilities (Resource Recovery Revenue) | | | 4.80 | | | | 8-1-2020 | | | | 135,000 | | | | 142,725 | |
Compton CA Unified School District Election of 2002 CAB Series D (GO, Ambac Insured) ¤ | | | 0.00 | | | | 6-1-2017 | | | | 3,075,000 | | | | 2,959,288 | |
Concord CA RDA Refunding Bond (Tax Revenue, Build America Mutual Assurance Company Insured) | | | 5.00 | | | | 3-1-2021 | | | | 820,000 | | | | 962,491 | |
Concord CA RDA Refunding Bond (Tax Revenue, Build America Mutual Assurance Company Insured) | | | 5.00 | | | | 3-1-2023 | | | | 950,000 | | | | 1,134,918 | |
Contra Costa County CA Transportation Authority Series A (Tax Revenue) ± | | | 0.47 | | | | 3-1-2034 | | | | 2,000,000 | | | | 2,001,520 | |
Contra Costa County CA Water District Refunding Notes Series C (Water & Sewer Revenue) | | | 3.00 | | | | 10-1-2019 | | | | 3,000,000 | | | | 3,239,250 | |
Corcoran CA Unified School District (Miscellaneous Revenue, AGM Insured) ± | | | 2.70 | | | | 12-1-2039 | | | | 4,500,000 | | | | 4,505,985 | |
Corona Norco CA Unified School District Junior Lien Series B (Tax Revenue) | | | 2.00 | | | | 9-1-2015 | | | | 220,000 | | | | 221,078 | |
Corona Norco CA Unified School District Junior Lien Series B (Tax Revenue) | | | 2.50 | | | | 9-1-2016 | | | | 445,000 | | | | 451,889 | |
Cotati-Rohnert Park CA Unified School District Series B (GO, AGM Insured) %% | | | 2.00 | | | | 8-1-2015 | | | | 335,000 | | | | 336,236 | |
Cotati-Rohnert Park CA Unified School District Series B (GO, AGM Insured) %% | | | 5.00 | | | | 8-1-2020 | | | | 2,275,000 | | | | 2,601,167 | |
Culver City CA Redevelopment Agency CAB Tax Allocation Series A (Tax Revenue) ¤ | | | 0.00 | | | | 11-1-2019 | | | | 2,575,000 | | | | 2,243,701 | |
Cypress CA Elementary School District (Miscellaneous Revenue) | | | 2.00 | | | | 5-1-2017 | | | | 335,000 | | | | 342,708 | |
Cypress CA Elementary School District (Miscellaneous Revenue) | | | 2.25 | | | | 5-1-2018 | | | | 455,000 | | | | 467,403 | |
Delano CA Certificate of Participation Delano Regional Medical Center (Health Revenue) | | | 4.00 | | | | 1-1-2017 | | | | 1,305,000 | | | | 1,360,893 | |
Delano CA Financing Authority Police Station Project Series A (Miscellaneous Revenue) | | | 4.00 | | | | 12-1-2016 | | | | 1,040,000 | | | | 1,094,496 | |
Dinuba CA RDA Successor Agency Merged City Project #2 (Tax Revenue, Build America Mutual Assurance Company Insured) | | | 4.00 | | | | 9-1-2019 | | | | 210,000 | | | | 230,813 | |
Dinuba CA RDA Successor Agency Merged City Project #2 (Tax Revenue, Build America Mutual Assurance Company Insured) | | | 5.00 | | | | 9-1-2021 | | | | 250,000 | | | | 293,740 | |
Dinuba CA RDA Successor Agency Merged City Project #2 (Tax Revenue, Build America Mutual Assurance Company Insured) | | | 5.00 | | | | 9-1-2022 | | | | 250,000 | | | | 296,608 | |
Dixon CA Unified School District (GO, AGM Insured) | | | 5.00 | | | | 8-1-2021 | | | | 1,210,000 | | | | 1,440,118 | |
The accompanying notes are an integral part of these financial statements.
| | | | |
| 12 | | Wells Fargo Advantage California Limited-Term Tax-Free Fund | | Portfolio of investments—December 31, 2014 (unaudited) |
| | | | | | | | | | | | | | | | |
| Security name | | Interest rate | | | Maturity date | | | Principal | | | Value | |
| | | | | | | | | | | | | | | | |
| | | | |
| California (continued) | | | | | | | | | | | | | | | | |
Dixon CA Unified School District (GO, AGM Insured) | | | 5.00 | % | | | 8-1-2022 | | | $ | 1,285,000 | | | $ | 1,546,806 | |
El Centro CA Financing Authority Series A (Water & Sewer Revenue, AGM Insured) | | | 2.50 | | | | 10-1-2016 | | | | 460,000 | | | | 472,503 | |
El Centro CA Financing Authority Series A (Water & Sewer Revenue, AGM Insured) | | | 2.50 | | | | 10-1-2017 | | | | 475,000 | | | | 489,169 | |
El Centro CA Financing Authority Series A (Water & Sewer Revenue, AGM Insured) | | | 2.50 | | | | 10-1-2018 | | | | 485,000 | | | | 498,939 | |
El Centro CA Financing Authority Series A (Water & Sewer Revenue, AGM Insured) | | | 5.00 | | | | 10-1-2023 | | | | 1,000,000 | | | | 1,207,350 | |
El Cerrito CA Redevelopment Agency Tax Allocation Series A (Tax Revenue, National Insured) | | | 5.00 | | | | 7-1-2019 | | | | 580,000 | | | | 580,928 | |
El Dorado CA Community Facilities District #19-1 (Tax Revenue) | | | 4.00 | | | | 9-1-2018 | | | | 1,000,000 | | | | 1,083,240 | |
El Dorado CA Community Facilities District #92-1 (Tax Revenue) | | | 4.00 | | | | 9-1-2017 | | | | 1,135,000 | | | | 1,214,927 | |
Encinitas CA Community Facilities District Ranch Public Improvements Project (Tax Revenue) | | | 4.00 | | | | 9-1-2017 | | | | 1,180,000 | | | | 1,268,453 | |
Escondido CA Union High School District CAB (GO, National Insured) ¤ | | | 0.00 | | | | 5-1-2016 | | | | 3,335,000 | | | | 3,286,309 | |
Fairfield CA RDA Successor Agency Refunding (Tax Revenue) | | | 5.00 | | | | 8-1-2020 | | | | 1,000,000 | | | | 1,172,580 | |
Fairfield CA RDA Successor Agency Refunding (Tax Revenue) | | | 5.00 | | | | 8-1-2021 | | | | 3,170,000 | | | | 3,747,954 | |
Fairfield CA RDA Successor Agency Refunding (Tax Revenue) | | | 5.00 | | | | 8-1-2022 | | | | 2,300,000 | | | | 2,741,922 | |
Fairfield CA RDA Successor Agency Refunding (Tax Revenue) | | | 5.00 | | | | 8-1-2023 | | | | 1,025,000 | | | | 1,229,641 | |
Florin CA Resource Conservation District Series A (Water & Sewer Revenue, National Insured) | | | 5.00 | | | | 9-1-2019 | | | | 1,000,000 | | | | 1,128,070 | |
Florin CA Resource Conservation District Series A (Water & Sewer Revenue, National Insured) | | | 5.00 | | | | 9-1-2020 | | | | 1,000,000 | | | | 1,139,780 | |
Florin CA Resource Conservation District Series A (Water & Sewer Revenue, National Insured) | | | 5.00 | | | | 9-1-2021 | | | | 1,250,000 | | | | 1,437,163 | |
Florin CA Resource Conservation District Series A (Water & Sewer Revenue, National Insured) | | | 5.00 | | | | 9-1-2022 | | | | 1,250,000 | | | | 1,441,925 | |
Florin CA Resource Conservation District Series A (Water & Sewer Revenue, National Insured) | | | 5.00 | | | | 9-1-2023 | | | | 600,000 | | | | 696,750 | |
Florin CA Resource Conservation District Series A (Water & Sewer Revenue, National Insured) | | | 5.00 | | | | 9-1-2024 | | | | 650,000 | | | | 756,178 | |
Fontana CA RDA Sierra Corridor Commercial Project (Tax Revenue, National Insured) | | | 4.50 | | | | 9-1-2015 | | | | 825,000 | | | | 847,019 | |
Foothill-Eastern CA Transportation Corridor Agency Series B1 (Transportation Revenue) | | | 5.00 | | | | 1-15-2053 | | | | 8,750,000 | | | | 9,489,813 | |
Fowler CA Unified School District School Facilities Improvement District #1 (GO, National Insured) | | | 5.20 | | | | 7-1-2020 | | | | 1,730,000 | | | | 1,891,028 | |
Fresno CA Unified School District Series C (GO, National Insured) | | | 5.80 | | | | 2-1-2015 | | | | 475,000 | | | | 477,119 | |
Fresno County CA Financing Authority Lease Series A (Miscellaneous Revenue, AGM Insured) | | | 3.00 | | | | 8-1-2019 | | | | 970,000 | | | | 1,025,057 | |
Fullerton CA Community Facilities District (Tax Revenue) | | | 3.50 | | | | 9-1-2017 | | | | 565,000 | | | | 597,408 | |
Fullerton CA Community Facilities District (Tax Revenue) | | | 4.00 | | | | 9-1-2018 | | | | 610,000 | | | | 660,776 | |
Fullerton CA Community Facilities District (Tax Revenue) | | | 4.00 | | | | 9-1-2019 | | | | 665,000 | | | | 727,158 | |
Fullerton CA School District Financing Authority Series A (Tax Revenue, AGM Insured) | | | 4.00 | | | | 9-1-2018 | | | | 400,000 | | | | 434,484 | |
Fullerton CA School District Financing Authority Series A (Tax Revenue, AGM Insured) | | | 3.00 | | | | 9-1-2017 | | | | 450,000 | | | | 471,263 | |
Garden Grove CA CDA Community Project (Tax Revenue, Build America Mutual Assurance Company Insured) | | | 4.00 | | | | 10-1-2021 | | | | 770,000 | | | | 868,714 | |
Garden Grove CA CDA Community Project (Tax Revenue, Build America Mutual Assurance Company Insured) | | | 5.00 | | | | 10-1-2022 | | | | 3,015,000 | | | | 3,619,357 | |
Golden West CA Schools Financing Authority 1999 CAB Series A (Miscellaneous Revenue, National Insured) | | | 5.75 | | | | 2-1-2015 | | | | 200,000 | | | | 200,856 | |
Golden West CA Schools Financing Authority 1999 CAB Series A (Miscellaneous Revenue, National Insured) | | | 5.75 | | | | 8-1-2015 | | | | 265,000 | | | | 272,900 | |
Goleta CA Water District Certificate of Participation Series A (Water & Sewer Revenue, AGM Insured) | | | 5.00 | | | | 12-1-2019 | | | | 125,000 | | | | 146,035 | |
The accompanying notes are an integral part of these financial statements.
| | | | | | |
| Portfolio of investments—December 31, 2014 (unaudited) | | Wells Fargo Advantage California Limited-Term Tax-Free Fund | | | 13 | |
| | | | | | | | | | | | | | | | |
| Security name | | Interest rate | | | Maturity date | | | Principal | | | Value | |
| | | | | | | | | | | | | | | | |
| | | | |
| California (continued) | | | | | | | | | | | | | | | | |
Goleta CA Water District Certificate of Participation Series A (Water & Sewer Revenue, AGM Insured) | | | 5.00 | % | | | 12-1-2020 | | | $ | 140,000 | | | $ | 165,882 | |
Hawthorne CA School District Election of 2008 Series A (GO, AGM Insured) ¤ | | | 0.00 | | | | 8-1-2015 | | | | 100,000 | | | | 99,456 | |
Hawthorne CA School District Election of 2008 Series A (GO, AGM Insured) ¤ | | | 0.00 | | | | 8-1-2016 | | | | 155,000 | | | | 151,616 | |
Hawthorne CA School District Election of 2008 Series A (GO, AGM Insured) ¤ | | | 0.00 | | | | 8-1-2017 | | | | 165,000 | | | | 157,851 | |
Hayward CA Unified School District Certificate of Participation (Miscellaneous Revenue, AGM Insured) | | | 3.00 | | | | 6-1-2016 | | | | 300,000 | | | | 309,441 | |
Hayward CA Unified School District Certificate of Participation (Miscellaneous Revenue, AGM Insured) | | | 3.00 | | | | 6-1-2017 | | | | 705,000 | | | | 737,402 | |
Hayward CA Unified School District Certificate of Participation (Miscellaneous Revenue, AGM Insured) | | | 3.00 | | | | 6-1-2018 | | | | 725,000 | | | | 759,844 | |
Hayward CA Unified School District Certificate of Participation (Miscellaneous Revenue, AGM Insured) | | | 3.00 | | | | 6-1-2019 | | | | 750,000 | | | | 787,658 | |
Hemet CA Unified School District Certificate of Participation (Miscellaneous Revenue) ø | | | 0.69 | | | | 10-1-2036 | | | | 5,000,000 | | | | 4,999,950 | |
Huntington Beach CA City School District Election of 2002 (GO) %% | | | 4.00 | | | | 8-1-2019 | | | | 2,875,000 | | | | 3,158,188 | |
Huntington Beach CA City School District Election of 2002 (GO) %% | | | 4.00 | | | | 8-1-2021 | | | | 505,000 | | | | 566,347 | |
Huntington Beach CA City School District Election of 2002 (GO) %% | | | 5.00 | | | | 8-1-2020 | | | | 3,150,000 | | | | 3,658,001 | |
Imperial Beach CA RDA Palm Avenue Commercial Redevelopment Project (Tax Revenue, Build America Mutual Assurance Company Insured) | | | 4.00 | | | | 6-1-2020 | | | | 775,000 | | | | 855,554 | |
Imperial CA PFA Wastewater Facility (Water & Sewer Revenue) | | | 4.00 | | | | 10-15-2016 | | | | 265,000 | | | | 279,101 | |
Industry CA PFA Tax Allocation Revenue Bond (Tax Revenue, National Insured) | | | 4.00 | | | | 5-1-2018 | | | | 1,000,000 | | | | 1,007,060 | |
Inglewood CA PFA (Miscellaneous Revenue) | | | 5.00 | | | | 8-1-2016 | | | | 1,000,000 | | | | 1,053,440 | |
Inglewood CA Unified School District (Tax Revenue, AGM Insured) | | | 5.00 | | | | 10-15-2015 | | | | 1,500,000 | | | | 1,552,215 | |
Inland Valley CA Development Agency Series B (Tax Revenue) ± | | | 4.25 | | | | 3-1-2041 | | | | 2,500,000 | | | | 2,517,125 | |
Inland Valley CA Development Agency Series C (Tax Revenue) ± | | | 4.50 | | | | 3-1-2041 | | | | 3,000,000 | | | | 3,146,400 | |
Irvine CA Limited Obligation Improvement Bonds Reassessment District #12-1 (Miscellaneous Revenue) | | | 4.00 | | | | 9-2-2018 | | | | 1,325,000 | | | | 1,445,403 | |
Irvine CA Public Facilities & Infrastructure Authority Series A (Miscellaneous Revenue) | | | 3.00 | | | | 9-2-2018 | | | | 1,195,000 | | | | 1,232,547 | |
Irwindale CA CDA City Industrial Development Project (Tax Revenue, AGM Insured) | | | 5.00 | | | | 7-15-2020 | | | | 320,000 | | | | 371,078 | |
Irwindale CA CDA City Industrial Development Project (Tax Revenue, AGM Insured) | | | 5.00 | | | | 7-15-2021 | | | | 340,000 | | | | 396,967 | |
Irwindale CA CDA City Industrial Development Project (Tax Revenue, AGM Insured) | | | 5.00 | | | | 7-15-2022 | | | | 365,000 | | | | 429,200 | |
Irwindale CA CDA City Industrial Development Project (Tax Revenue, AGM Insured) | | | 5.00 | | | | 7-15-2023 | | | | 375,000 | | | | 444,225 | |
JPMorgan Chase Putters Drivers Trust Series 4483Z California Statewide CDA Kaiser Permanente Series A (Health Revenue, JPMorgan Chase & Company LIQ) 144Aø | | | 0.19 | | | | 10-1-2020 | | | | 4,550,000 | | | | 4,550,000 | |
Jurupa CA PFA Series A (Tax Revenue) | | | 5.00 | | | | 9-1-2020 | | | | 550,000 | | | | 637,313 | |
Keyes CA Unified School District CAB (GO, National Insured) ¤ | | | 0.00 | | | | 8-1-2015 | | | | 150,000 | | | | 148,676 | |
Keyes CA Unified School District CAB (GO, National Insured) ¤ | | | 0.00 | | | | 8-1-2016 | | | | 155,000 | | | | 150,102 | |
La Habra CA School District Refunding Bond (GO) %% | | | 5.00 | | | | 8-1-2019 | | | | 950,000 | | | | 1,072,978 | |
La Habra CA School District Refunding Bond (GO) %% | | | 5.00 | | | | 8-1-2020 | | | | 1,045,000 | | | | 1,200,454 | |
La Habra CA School District Refunding Bond (GO) %% | | | 5.00 | | | | 8-1-2021 | | | | 805,000 | | | | 934,742 | |
La Quinta CA Redevelopment Agency Project Areas #1 & 2 Series A (Tax Revenue) | | | 5.00 | | | | 9-1-2019 | | | | 1,150,000 | | | | 1,317,475 | |
La Quinta CA Redevelopment Agency Project Areas #1 & 2 Series A (Tax Revenue) | | | 5.00 | | | | 9-1-2020 | | | | 1,045,000 | | | | 1,210,894 | |
La Quinta CA Redevelopment Agency Project Areas #1 & 2 Series A (Tax Revenue) | | | 5.00 | | | | 9-1-2021 | | | | 565,000 | | | | 675,209 | |
La Quinta CA Redevelopment Agency Project Areas #1 & 2 Series A (Tax Revenue) | | | 5.00 | | | | 9-1-2022 | | | | 615,000 | | | | 738,738 | |
Lake Elsinore CA PFFA (Tax Revenue, Ambac Insured) | | | 4.00 | | | | 9-1-2016 | | | | 1,830,000 | | | | 1,904,261 | |
Lake Elsinore CA School Financing Authority (Tax Revenue) | | | 3.00 | | | | 9-1-2016 | | | | 1,420,000 | | | | 1,449,948 | |
Lammersville CA Joint Unified School Community Facilities District #2002 (Tax Revenue) | | | 2.00 | | | | 9-1-2015 | | | | 750,000 | | | | 757,208 | |
Lancaster CA RDA Combined Project Areas (Tax Revenue) | | | 4.75 | | | | 8-1-2015 | | | | 585,000 | | | | 596,659 | |
Lee Lake CA Public Financing Authority Senior Lien Series A (Tax Revenue) | | | 4.00 | | | | 9-1-2017 | | | | 1,620,000 | | | | 1,734,080 | |
The accompanying notes are an integral part of these financial statements.
| | | | |
| 14 | | Wells Fargo Advantage California Limited-Term Tax-Free Fund | | Portfolio of investments—December 31, 2014 (unaudited) |
| | | | | | | | | | | | | | | | |
| Security name | | Interest rate | | | Maturity date | | | Principal | | | Value | |
| | | | | | | | | | | | | | | | |
| | | | |
| California (continued) | | | | | | | | | | | | | | | | |
Long Beach CA Bond Finance Authority Natural Gas Purchase Series A (Utilities Revenue) | | | 5.00 | % | | | 11-15-2015 | | | $ | 1,250,000 | | | $ | 1,293,638 | |
Long Beach CA Harbor AMT Series A (Airport Revenue, National Insured) | | | 5.00 | | | | 5-15-2016 | | | | 500,000 | | | | 508,700 | |
Los Alamitos CA Unified School District TRAN (GO) ¤ | | | 0.00 | | | | 9-1-2016 | | | | 1,000,000 | | | | 993,960 | |
Los Angeles CA CDA Earthquake Disaster Project Series D (Tax Revenue) | | | 5.00 | | | | 9-1-2015 | | | | 375,000 | | | | 386,258 | |
Los Angeles CA Community Facilities District #4 Playa Vista Phase 1 (Tax Revenue) | | | 5.00 | | | | 9-1-2020 | | | | 600,000 | | | | 698,046 | |
Los Angeles CA Community Facilities District #4 Playa Vista Phase 1 (Tax Revenue) | | | 5.00 | | | | 9-1-2021 | | | | 550,000 | | | | 648,846 | |
Los Angeles CA Convention & Exhibit Center Authority Series A (Miscellaneous Revenue) | | | 5.00 | | | | 8-15-2020 | | | | 2,000,000 | | | | 2,285,760 | |
Los Angeles CA Municipal Improvement Corporation Series A (Miscellaneous Revenue) | | | 3.00 | | | | 5-1-2022 | | | | 925,000 | | | | 983,913 | |
Los Angeles CA Municipal Improvement Corporation Series A (Miscellaneous Revenue) | | | 5.00 | | | | 3-1-2022 | | | | 5,000,000 | | | | 6,001,250 | |
Los Angeles CA Municipal Improvement Corporation Series A (Miscellaneous Revenue) | | | 5.00 | | | | 5-1-2023 | | | | 475,000 | | | | 576,166 | |
Los Angeles CA Municipal Improvement Corporation Series B (Miscellaneous Revenue) | | | 5.00 | | | | 5-1-2021 | | | | 300,000 | | | | 356,895 | |
Los Angeles CA Municipal Improvement Corporation Series B (Miscellaneous Revenue) | | | 5.00 | | | | 5-1-2022 | | | | 350,000 | | | | 421,113 | |
Los Angeles CA Municipal Improvement Corporation Series B (Miscellaneous Revenue) | | | 5.00 | | | | 5-1-2023 | | | | 350,000 | | | | 424,543 | |
Los Angeles CA Unified School District Certificate of Participation Headquarters Building Projects Series B (Miscellaneous Revenue) | | | 5.00 | | | | 10-1-2025 | | | | 1,875,000 | | | | 2,223,281 | |
Los Angeles CA Unified School District Certificate of Participation Multiple Properties Series A (Miscellaneous Revenue) | | | 5.00 | | | | 12-1-2015 | | | | 1,750,000 | | | | 1,827,105 | |
Los Angeles CA Unified School District Election of 2004 Series F (GO, FGIC Insured) | | | 5.00 | | | | 7-1-2020 | | | | 2,500,000 | | | | 2,672,600 | |
Los Angeles CA Unified School District Refunding Bond Series D (GO) | | | 5.00 | | | | 7-1-2023 | | | | 6,180,000 | | | | 7,628,221 | |
Los Angeles County CA Capital Asset Leasing Corporation Series B (Miscellaneous Revenue, Ambac Insured) | | | 6.00 | | | | 12-1-2015 | | | | 1,835,000 | | | | 1,926,860 | |
Los Angeles County CA Capital Asset Leasing Corporation Series B (Miscellaneous Revenue, Ambac Insured) | | | 6.00 | | | | 12-1-2016 | | | | 3,285,000 | | | | 3,604,466 | |
Los Angeles County CA Certificate of Participation CAB Disney Package Projects (Miscellaneous Revenue) ¤ | | | 0.00 | | | | 3-1-2017 | | | | 675,000 | | | | 660,528 | |
Los Angeles County CA Community Facilities District #5 Rowland Heights Area (Tax Revenue, AGM Insured) | | | 5.00 | | | | 9-1-2019 | | | | 750,000 | | | | 755,828 | |
Los Angeles County CA Metropolitan Transportation Authority Series A (Tax Revenue) | | | 5.00 | | | | 7-1-2017 | | | | 7,880,000 | | | | 8,745,303 | |
Los Angeles County CA Public Works Financing Authority Master Project Series A (Miscellaneous Revenue, National Insured) | | | 5.00 | | | | 12-1-2016 | | | | 1,715,000 | | | | 1,787,819 | |
Los Angeles County CA Public Works Financing Authority Master Project Series B (Miscellaneous Revenue, National Insured) | | | 5.00 | | | | 9-1-2018 | | | | 400,000 | | | | 431,216 | |
Los Angeles County CA Public Works Multiple Capital Projects (Miscellaneous Revenue) | | | 5.00 | | | | 8-1-2020 | | | | 500,000 | | | | 588,155 | |
Los Angeles County CA Redevelopment Refunding Authority Hollywood Redevelopment Project (Tax Revenue) | | | 5.00 | | | | 7-1-2019 | | | | 1,780,000 | | | | 2,056,843 | |
Los Angeles County CA Redevelopment Refunding Authority Series D (Tax Revenue) | | | 5.00 | | | | 9-1-2018 | | | | 2,570,000 | | | | 2,890,942 | |
Los Angeles County CA Redevelopment Refunding Authority Series D (Tax Revenue) | | | 5.00 | | | | 9-1-2019 | | | | 2,545,000 | | | | 2,915,628 | |
Los Angeles County CA Regional Financing Authority MonteCedro Incorporated Project (Health Revenue) | | | 3.00 | | | | 11-15-2021 | | | | 2,750,000 | | | | 2,794,248 | |
Los Angeles County CA Schools Regionalized Business Services Corporation Series A (Miscellaneous Revenue, AGM Insured) | | | 3.00 | | | | 9-1-2017 | | | | 595,000 | | | | 619,443 | |
Los Angeles County CA Schools Regionalized Business Services Corporation Series B (Miscellaneous Revenue, National Insured) | | | 5.00 | | | | 6-1-2016 | | | | 1,000,000 | | | | 1,056,970 | |
Los Angeles County CA Schools Regionalized Business Services Corporation Series B (Miscellaneous Revenue, National Insured) | | | 5.00 | | | | 6-1-2017 | | | | 1,010,000 | | | | 1,101,557 | |
Lynwood CA Unified School District BAN Series A (GO) | | | 5.00 | | | | 8-1-2017 | | | | 3,000,000 | | | | 3,282,510 | |
Mendocino County CA Certificate of Participation Series A (Miscellaneous Revenue, AGM Insured) | | | 3.25 | | | | 6-1-2018 | | | | 1,115,000 | | | | 1,189,025 | |
The accompanying notes are an integral part of these financial statements.
| | | | | | |
| Portfolio of investments—December 31, 2014 (unaudited) | | Wells Fargo Advantage California Limited-Term Tax-Free Fund | | | 15 | |
| | | | | | | | | | | | | | | | |
| Security name | | Interest rate | | | Maturity date | | | Principal | | | Value | |
| | | | | | | | | | | | | | | | |
| | | | |
| California (continued) | | | | | | | | | | | | | | | | |
Mendocino County CA Certificate of Participation Series A (Miscellaneous Revenue, AGM Insured) | | | 3.00 | % | | | 6-1-2015 | | | $ | 1,020,000 | | | $ | 1,031,771 | |
Mendocino County CA Certificate of Participation Series A (Miscellaneous Revenue, AGM Insured) | | | 3.00 | | | | 6-1-2017 | | | | 1,085,000 | | | | 1,142,104 | |
Merced CA Union High School CAB Series A (GO, National Insured) ¤ | | | 0.00 | | | | 8-1-2019 | | | | 2,190,000 | | | | 1,994,389 | |
Merrill Lynch PFOTER Series PT-4211 (GO, Dexia Credit Local SPA) 144Aø | | | 0.23 | | | | 2-1-2025 | | | | 12,860,000 | | | | 12,860,000 | |
Modesto CA Community Facilities District #2004-1 Village One #2 (Tax Revenue) | | | 4.00 | | | | 9-1-2018 | | | | 595,000 | | | | 640,416 | |
Modesto CA Community Facilities District #2004-1 Village One #2 (Tax Revenue) | | | 4.50 | | | | 9-1-2019 | | | | 605,000 | | | | 667,684 | |
Modesto CA Irrigation District Electric Refunding Bond Series A (Utilities Revenue) | | | 5.00 | | | | 7-1-2020 | | | | 500,000 | | | | 591,775 | |
Monrovia CA RDA Subordinated Central Project #1 (Tax Revenue) | | | 4.00 | | | | 8-1-2016 | | | | 725,000 | | | | 760,619 | |
Monrovia CA RDA Subordinated Central Project #1 (Tax Revenue) | | | 4.00 | | | | 8-1-2017 | | | | 755,000 | | | | 809,269 | |
Monrovia CA RDA Subordinated Central Project #1 (Tax Revenue) | | | 4.00 | | | | 8-1-2018 | | | | 785,000 | | | | 852,149 | |
Monrovia CA RDA Subordinated Central Project #1 (Tax Revenue) | | | 4.00 | | | | 8-1-2019 | | | | 815,000 | | | | 892,898 | |
Montclair CA PFA Public Facilities Projects (Miscellaneous Revenue, AGM Insured) | | | 4.00 | | | | 10-1-2017 | | | | 500,000 | | | | 539,865 | |
Murrieta CA PFA (Tax Revenue) | | | 5.00 | | | | 9-1-2017 | | | | 870,000 | | | | 950,388 | |
Natomas CA Unified School District (GO, AGM Insured) | | | 3.00 | | | | 9-1-2017 | | | | 955,000 | | | | 1,003,820 | |
Natomas CA Unified School District (GO, AGM Insured) | | | 3.00 | | | | 9-1-2018 | | | | 1,025,000 | | | | 1,084,522 | |
Natomas CA Unified School District (GO, AGM Insured) | | | 3.00 | | | | 9-1-2019 | | | | 1,000,000 | | | | 1,056,970 | |
Newhall CA School District (Miscellaneous Revenue) ¤ | | | 0.00 | | | | 8-1-2018 | | | | 15,680,000 | | | | 15,089,648 | |
Newhall CA School District BAN School Facilities Improvement (GO) ¤ | | | 0.00 | | | | 8-1-2017 | | | | 9,000,000 | | | | 8,838,990 | |
North City CA West School Facilities Financing Authority Series C (Tax Revenue, Ambac Insured) | | | 5.00 | | | | 9-1-2018 | | | | 1,125,000 | | | | 1,258,504 | |
Norwalk CA Community Facilities Financing Series A (Miscellaneous Revenue, AGM Insured) | | | 4.00 | | | | 6-1-2019 | | | | 280,000 | | | | 305,892 | |
Norwalk CA Community Facilities Financing Series A (Miscellaneous Revenue, AGM Insured) | | | 4.00 | | | | 6-1-2020 | | | | 350,000 | | | | 384,864 | |
Norwalk CA Community Facilities Financing Series B (Miscellaneous Revenue, AGM Insured) | | | 4.00 | | | | 6-1-2018 | | | | 610,000 | | | | 664,003 | |
Norwalk CA Community Facilities Financing Series B (Miscellaneous Revenue, AGM Insured) | | | 4.00 | | | | 6-1-2019 | | | | 625,000 | | | | 682,794 | |
Norwalk CA Community Facilities Financing Series B (Miscellaneous Revenue, AGM Insured) | | | 4.00 | | | | 6-1-2020 | | | | 650,000 | | | | 714,747 | |
Oak Valley CA Hospital District Refunding (GO) | | | 4.00 | | | | 7-1-2020 | | | | 500,000 | | | | 554,735 | |
Oak Valley CA Hospital District Refunding (GO) | | | 5.00 | | | | 7-1-2021 | | | | 950,000 | | | | 1,119,442 | |
Oak Valley CA Hospital District Refunding (GO) | | | 5.00 | | | | 7-1-2022 | | | | 750,000 | | | | 887,093 | |
Oak Valley CA Hospital District Refunding (GO) | | | 5.00 | | | | 7-1-2023 | | | | 755,000 | | | | 894,305 | |
Oakland CA Joint Powers Financing Authority Series A1 (Miscellaneous Revenue, AGM Insured) | | | 5.25 | | | | 1-1-2017 | | | | 1,885,000 | | | | 2,032,690 | |
Oakland CA Redevelopment Agency Refunding Sub Housing Set-Aside Series A (Tax Revenue, Ambac Insured) | | | 5.00 | | | | 9-1-2018 | | | | 2,000,000 | | | | 2,121,680 | |
Oakland CA Successor Agency Refunding Sub Lien Central District Redevelopment Project (Tax Revenue) | | | 4.00 | | | | 9-1-2018 | | | | 3,215,000 | | | | 3,513,031 | |
Oakland CA Unified School District (GO, National Insured) | | | 4.00 | | | | 8-1-2015 | | | | 185,000 | | | | 188,633 | |
Oakland CA Unified School District Alameda County Election of 2000 (GO, National Insured) | | | 5.00 | | | | 8-1-2015 | | | | 500,000 | | | | 512,725 | |
Oakland CA Unified School District Alameda County Election of 2000 (GO, National Insured) | | | 5.00 | | | | 8-1-2016 | | | | 530,000 | | | | 542,980 | |
Oakland CA Unified School District Alameda County Election of 2006 Series A (GO) | | | 3.00 | | | | 8-1-2015 | | | | 640,000 | | | | 647,923 | |
Oakland CA Unified School District Alameda County Election of 2006 Series A (GO) | | | 3.00 | | | | 8-1-2016 | | | | 540,000 | | | | 554,980 | |
Oakland CA Unified School District Alameda County Election of 2012 (GO) | | | 4.00 | | | | 8-1-2015 | | | | 3,725,000 | | | | 3,792,758 | |
Oakland CA Unified School District Alameda County Election of 2012 (GO) | | | 5.00 | | | | 8-1-2016 | | | | 3,425,000 | | | | 3,627,075 | |
The accompanying notes are an integral part of these financial statements.
| | | | |
| 16 | | Wells Fargo Advantage California Limited-Term Tax-Free Fund | | Portfolio of investments—December 31, 2014 (unaudited) |
| | | | | | | | | | | | | | | | |
| Security name | | Interest rate | | | Maturity date | | | Principal | | | Value | |
| | | | | | | | | | | | | | | | |
| | | | |
| California (continued) | | | | | | | | | | | | | | | | |
Oakland CA Unified School District Alameda County Election of 2012 (GO) | | | 5.00 | % | | | 8-1-2017 | | | $ | 2,250,000 | | | $ | 2,442,083 | |
Orange County CA Development Agency Santa Ana Heights Project (Tax Revenue) | | | 5.00 | | | | 9-1-2018 | | | | 200,000 | | | | 226,688 | |
Orange County CA Development Agency Santa Ana Heights Project (Tax Revenue) | | | 5.00 | | | | 9-1-2019 | | | | 1,085,000 | | | | 1,253,728 | |
Orange County CA Development Agency Santa Ana Heights Project (Tax Revenue) | | | 5.00 | | | | 3-1-2020 | | | | 1,110,000 | | | | 1,286,579 | |
Orange County CA Development Agency Santa Ana Heights Project (Tax Revenue) | | | 5.00 | | | | 9-1-2020 | | | | 1,140,000 | | | | 1,330,950 | |
Orange Cove CA Irrigation District (Water & Sewer Revenue) | | | 3.15 | | | | 2-1-2019 | | | | 660,000 | | | | 665,135 | |
Oxnard CA Financing Authority Refunding Bond (Water & Sewer Revenue, AGM Insured) | | | 5.00 | | | | 6-1-2021 | | | | 735,000 | | | | 856,451 | |
Oxnard CA Harbor District Series A (Airport Revenue) | | | 5.00 | | | | 8-1-2015 | | | | 1,960,000 | | | | 2,008,000 | |
Oxnard CA Harbor District Series A (Airport Revenue) | | | 5.00 | | | | 8-1-2018 | | | | 2,275,000 | | | | 2,531,779 | |
Pacifica CA Certificate of Participation City of Pacifica Financing Authority (Miscellaneous Revenue, Ambac Insured) | | | 4.50 | | | | 1-1-2016 | | | | 365,000 | | | | 378,647 | |
Palm Springs CA Financing Authority Convention Center Project Series A (Miscellaneous Revenue) | | | 3.00 | | | | 11-1-2017 | | | | 1,280,000 | | | | 1,342,246 | |
Palo Alto CA Improvement Bond Act of 1915 University Area Off-Street Parking Assessment District (Miscellaneous Revenue) | | | 2.50 | | | | 9-2-2015 | | | | 285,000 | | | | 288,380 | |
Palo Alto CA Improvement Bond Act of 1915 University Area Off-Street Parking Assessment District (Miscellaneous Revenue) | | | 2.50 | | | | 9-2-2016 | | | | 330,000 | | | | 337,923 | |
Palo Alto CA Improvement Bond Act of 1915 University Area Off-Street Parking Assessment District (Miscellaneous Revenue) | | | 3.00 | | | | 9-2-2018 | | | | 415,000 | | | | 432,633 | |
Palo Alto CA Improvement Bond Act of 1915 University Area Off-Street Parking Assessment District (Miscellaneous Revenue) | | | 4.00 | | | | 9-2-2021 | | | | 450,000 | | | | 492,750 | |
Palo Verde CA Unified School District FlexFund Program (Education Revenue) | | | 4.80 | | | | 9-1-2027 | | | | 806,106 | | | | 864,074 | |
Palomar CA Palomar County Election of 2006 Series B (GO) ¤ | | | 0.00 | | | | 8-1-2016 | | | | 250,000 | | | | 247,305 | |
Palomar CA Palomar County Election of 2006 Series B (GO) ¤ | | | 0.00 | | | | 8-1-2017 | | | | 880,000 | | | | 852,342 | |
Palomar Pomerado CA Health System CAB (GO, National Insured) ¤ | | | 0.00 | | | | 8-1-2017 | | | | 2,000,000 | | | | 1,934,160 | |
Patterson CA Joint Unified School District CAB Series A (GO, National Insured) ¤ | | | 0.00 | | | | 8-1-2015 | | | | 140,000 | | | | 139,159 | |
Perris CA Community Facilities District Refunding #01-2 Series A (Tax Revenue) | | | 2.00 | | | | 9-1-2015 | | | | 600,000 | | | | 602,940 | |
Perris CA Community Facilities District Refunding #01-2 Series A (Tax Revenue) | | | 2.00 | | | | 9-1-2016 | | | | 635,000 | | | | 640,525 | |
Perris CA Community Facilities District Refunding #01-2 Series A (Tax Revenue) | | | 2.00 | | | | 9-1-2017 | | | | 670,000 | | | | 671,112 | |
Pioneers CA Memorial Healthcare District (GO) | | | 4.00 | | | | 10-1-2015 | | | | 400,000 | | | | 408,816 | |
Pioneers CA Memorial Healthcare District (GO) | | | 4.00 | | | | 10-1-2017 | | | | 810,000 | | | | 859,264 | |
Pittsburg CA Successor Agency Los Medanos Community Development (Tax Revenue, AGM Insured) | | | 5.00 | | | | 8-1-2021 | | | | 1,885,000 | | | | 2,224,112 | |
Pittsburg CA Successor Agency Los Medanos Community Development (Tax Revenue, AGM Insured) | | | 5.00 | | | | 8-1-2022 | | | | 1,305,000 | | | | 1,551,736 | |
Pittsburg CA Successor Agency Los Medanos Community Development (Tax Revenue, AGM Insured) | | | 5.00 | | | | 8-1-2023 | | | | 780,000 | | | | 934,003 | |
Placentia CA Redevelopment Agency Project (Tax Revenue, Build America Mutual Assurance Company Insured) | | | 4.00 | | | | 8-1-2018 | | | | 555,000 | | | | 603,013 | |
Placentia CA Redevelopment Agency Project (Tax Revenue, Build America Mutual Assurance Company Insured) | | | 4.00 | | | | 8-1-2019 | | | | 580,000 | | | | 636,863 | |
Placentia CA Redevelopment Agency Project (Tax Revenue, Build America Mutual Assurance Company Insured) | | | 5.00 | | | | 8-1-2020 | | | | 600,000 | | | | 694,548 | |
Pleasant Valley CA Unified School District Ventura County PFOTER (GO, National Insured, Dexia Bank SPA) ø | | | 0.25 | | | | 8-1-2031 | | | | 4,120,000 | | | | 4,120,000 | |
Pomona CA Public Financing Authority Unrefunded Balance Merfed Redevelopment (Tax Revenue, Ambac Insured) | | | 5.25 | | | | 2-1-2018 | | | | 725,000 | | | | 727,284 | |
Pomona Valley CA Educational Joint Powers Authority Refunding Bond (Miscellaneous Revenue, Build America Mutual Assurance Company Insured) | | | 4.00 | | | | 8-1-2016 | | | | 805,000 | | | | 846,184 | |
Pomona Valley CA Educational Joint Powers Authority Refunding Bond (Miscellaneous Revenue, Build America Mutual Assurance Company Insured) | | | 4.00 | | | | 8-1-2017 | | | | 1,635,000 | | | | 1,755,042 | |
The accompanying notes are an integral part of these financial statements.
| | | | | | |
| Portfolio of investments—December 31, 2014 (unaudited) | | Wells Fargo Advantage California Limited-Term Tax-Free Fund | | | 17 | |
| | | | | | | | | | | | | | | | |
| Security name | | Interest rate | | | Maturity date | | | Principal | | | Value | |
| | | | | | | | | | | | | | | | |
| | | | |
| California (continued) | | | | | | | | | | | | | | | | |
Poway CA RDA Paguay Project Series A (Tax Revenue, National Insured) | | | 5.25 | % | | | 6-15-2017 | | | $ | 1,190,000 | | | $ | 1,194,891 | |
Poway CA Unified School District (Tax Revenue) | | | 3.00 | | | | 9-15-2017 | | | | 625,000 | | | | 652,913 | |
Poway CA Unified School District (Tax Revenue) | | | 3.00 | | | | 9-15-2018 | | | | 755,000 | | | | 791,210 | |
Poway CA Unified School District (Tax Revenue) | | | 4.00 | | | | 9-15-2020 | | | | 335,000 | | | | 368,889 | |
Poway CA Unified School District Community Facilities District #6 4S Ranch (Tax Revenue) | | | 4.00 | | | | 9-1-2017 | | | | 500,000 | | | | 535,210 | |
Poway CA Unified School District Community Facilities District #6 4S Ranch (Tax Revenue) | | | 4.00 | | | | 9-1-2018 | | | | 450,000 | | | | 487,458 | |
Poway CA Unified School District PFA (Tax Revenue, Build America Mutual Assurance Company Insured) | | | 4.00 | | | | 10-1-2020 | | | | 300,000 | | | | 332,469 | |
Poway CA Unified School District PFA (Tax Revenue, Build America Mutual Assurance Company Insured) | | | 4.00 | | | | 10-1-2021 | | | | 185,000 | | | | 205,655 | |
Poway CA Unified School District Series C (Tax Revenue) | | | 4.00 | | | | 9-15-2019 | | | | 475,000 | | | | 518,368 | |
Poway CA Unified School District Series C (Tax Revenue) | | | 4.00 | | | | 9-15-2020 | | | | 510,000 | | | | 557,976 | |
Rancho Cucamonga CA Redevelopment Agency Project Area (Tax Revenue, AGM Insured) | | | 5.00 | | | | 9-1-2021 | | | | 1,000,000 | | | | 1,192,990 | |
Rancho Cucamonga CA Redevelopment Agency Project Area (Tax Revenue, AGM Insured) | | | 5.00 | | | | 9-1-2023 | | | | 1,350,000 | | | | 1,642,775 | |
Rancho Santa Fe CA Community Services District Superior Lien Series A (Tax Revenue) | | | 3.13 | | | | 9-1-2015 | | | | 675,000 | | | | 686,529 | |
Rancho Santa Fe CA Community Services District Superior Lien Series A (Tax Revenue) | | | 3.50 | | | | 9-1-2016 | | | | 725,000 | | | | 756,385 | |
Redondo Beach CA Unified School District CAB Election of 2008 Series A (GO, AGM Insured) | | | 5.00 | | | | 8-1-2023 | | | | 500,000 | | | | 609,535 | |
Redondo Beach CA Unified School District CAB Election of 2008 Series E (GO) ¤ | | | 0.00 | | | | 8-1-2016 | | | | 225,000 | | | | 222,395 | |
Redondo Beach CA Unified School District CAB Election of 2008 Series E (GO) ¤ | | | 0.00 | | | | 8-1-2018 | | | | 345,000 | | | | 325,307 | |
Redondo Beach CA Unified School District CAB Election of 2008 Series E (GO) ¤ | | | 0.00 | | | | 8-1-2020 | | | | 460,000 | | | | 405,978 | |
Ridgecrest CA Redevelopment Agency Ridgecrest Project (Tax Revenue) | | | 3.75 | | | | 6-30-2015 | | | | 630,000 | | | | 640,338 | |
Riverside CA Community College District Election of 2004 Series D (GO) ¤ | | | 0.00 | | | | 8-1-2020 | | | | 535,000 | | | | 476,102 | |
Riverside CA PFA Local Measure A Certificate of Participation Riverside Pavement Rehabilitation Project (Tax Revenue, AGM Insured) | | | 5.00 | | | | 6-1-2023 | | | | 845,000 | | | | 996,475 | |
Riverside CA Unified School District Financing Authority Superior Lien Series A (Miscellaneous Revenue) | | | 4.00 | | | | 9-1-2018 | | | | 1,735,000 | | | | 1,879,421 | |
Riverside County CA Asset Leasing Corporation County Administrative Center Refunding Project (Miscellaneous Revenue) | | | 4.00 | | | | 11-1-2016 | | | | 640,000 | | | | 679,162 | |
Riverside County CA Asset Leasing Corporation County Administrative Center Refunding Project (Miscellaneous Revenue) | | | 4.00 | | | | 11-1-2017 | | | | 490,000 | | | | 531,283 | |
Riverside County CA Asset Leasing Corporation Riverside Hospital Project (Miscellaneous Revenue, National Insured) ¤ | | | 0.00 | | | | 6-1-2016 | | | | 2,395,000 | | | | 2,357,111 | |
Riverside County CA Asset Leasing Corporation Riverside Hospital Project (Miscellaneous Revenue, National Insured) ¤ | | | 0.00 | | | | 6-1-2019 | | | | 1,000,000 | | | | 909,070 | |
Riverside County CA PFA Indian Wells Refunding Project (Tax Revenue, AGM Insured) | | | 5.00 | | | | 9-1-2020 | | | | 1,610,000 | | | | 1,888,498 | |
Riverside County CA PFA Jurupa Valley Desert & Interstate 215 (Tax Revenue, National Insured) | | | 4.50 | | | | 10-1-2015 | | | | 130,000 | | | | 133,743 | |
Riverside County CA Public Financing County Facilities Projects (Miscellaneous Revenue) | | | 4.00 | | | | 5-1-2018 | | | | 810,000 | | | | 875,877 | |
Riverside County CA Public Financing County Facilities Projects (Miscellaneous Revenue) | | | 4.00 | | | | 5-1-2020 | | | | 795,000 | | | | 877,171 | |
Riverside County CA Public Financing County Facilities Projects (Miscellaneous Revenue) | | | 5.00 | | | | 5-1-2019 | | | | 840,000 | | | | 953,316 | |
Robla CA School District Series B (GO, National Insured) ¤ | | | 0.00 | | | | 8-1-2018 | | | | 560,000 | | | | 520,800 | |
Roseville CA Natural Gas Financing Authority (Utilities Revenue) | | | 5.00 | | | | 2-15-2015 | | | | 1,000,000 | | | | 1,004,900 | |
Sacramento CA City Schools Joint Powers Financing Authority Series A (Miscellaneous Revenue, Build America Mutual Assurance Company Insured) | | | 5.00 | | | | 3-1-2019 | | | | 1,050,000 | | | | 1,188,075 | |
The accompanying notes are an integral part of these financial statements.
| | | | |
| 18 | | Wells Fargo Advantage California Limited-Term Tax-Free Fund | | Portfolio of investments—December 31, 2014 (unaudited) |
| | | | | | | | | | | | | | | | |
| Security name | | Interest rate | | | Maturity date | | | Principal | | | Value | |
| | | | |
| California (continued) | | | | | | | | | | | | | | | | |
Sacramento CA City Schools Joint Powers Financing Authority Series A (Miscellaneous Revenue, Build America Mutual Assurance Company Insured) | | | 5.00 | % | | | 3-1-2020 | | | $ | 1,185,000 | | | $ | 1,358,994 | |
Sacramento CA City Schools Joint Powers Financing Authority Series A (Miscellaneous Revenue, Build America Mutual Assurance Company Insured) | | | 5.00 | | | | 3-1-2021 | | | | 830,000 | | | | 962,211 | |
Sacramento CA City Schools Joint Powers Financing Authority Series A (Miscellaneous Revenue, Build America Mutual Assurance Company Insured) | | | 5.00 | | | | 3-1-2022 | | | | 775,000 | | | | 907,510 | |
Sacramento CA City Schools Joint Powers Financing Authority Series A (Miscellaneous Revenue, Build America Mutual Assurance Company Insured) | | | 5.00 | | | | 3-1-2023 | | | | 815,000 | | | | 963,232 | |
Sacramento CA Regional Art Facilities Financing Authority Certificate of Participation (Miscellaneous Revenue, Ambac Insured) | | | 4.10 | | | | 9-1-2015 | | | | 150,000 | | | | 150,372 | |
Sacramento CA Regional Transportation District Farebox Revenue (Transportation Revenue) | | | 5.00 | | | | 3-1-2019 | | | | 500,000 | | | | 566,610 | |
Sacramento County CA Public Facilities Projects (Miscellaneous Revenue, Ambac Insured) | | | 4.50 | | | | 2-1-2016 | | | | 155,000 | | | | 162,003 | |
Sacramento County CA Public Facilities Projects (Miscellaneous Revenue, Ambac Insured) | | | 4.50 | | | | 2-1-2016 | | | | 285,000 | | | | 296,448 | |
San Bernardino County CA Certificate of Participation Arrowhead Project Series A (Miscellaneous Revenue) | | | 5.50 | | | | 8-1-2020 | | | | 1,000,000 | | | | 1,152,420 | |
San Bernardino County CA Certificate of Participation Justice Center Airport Improvements (Miscellaneous Revenue, National Insured) | | | 5.00 | | | | 7-1-2015 | | | | 1,075,000 | | | | 1,095,468 | |
San Bernardino County CA Certificate of Participation Justice Center Airport Improvements (Miscellaneous Revenue, National Insured) | | | 5.00 | | | | 7-1-2016 | | | | 430,000 | | | | 451,848 | |
San Bernardino County CA Certificate of Participation Medical Centre Financing Project (Miscellaneous Revenue, National Insured) | | | 5.50 | | | | 8-1-2017 | | | | 860,000 | | | | 911,196 | |
San Buenaventura CA Community Mental Health System (Health Revenue) | | | 6.00 | | | | 12-1-2019 | | | | 2,000,000 | | | | 2,359,240 | |
San Buenaventura CA Community Mental Health System (Health Revenue) | | | 6.50 | | | | 12-1-2021 | | | | 2,585,000 | | | | 3,236,549 | |
San Diego CA Community Facilities District 3 (Tax Revenue) | | | 5.00 | | | | 9-1-2016 | | | | 415,000 | | | | 440,888 | |
San Diego CA Community Facilities District 3 (Tax Revenue) | | | 5.00 | | | | 9-1-2018 | | | | 460,000 | | | | 512,104 | |
San Diego CA PFFA Ballpark Series A (Miscellaneous Revenue, Ambac Insured) | | | 5.00 | | | | 2-15-2016 | | | | 1,825,000 | | | | 1,920,229 | |
San Diego CA RDA Naval Training Center Series A (Tax Revenue) | | | 3.50 | | | | 9-1-2015 | | | | 365,000 | | | | 372,318 | |
San Diego CA RDA Naval Training Center Series A (Tax Revenue) | | | 4.00 | | | | 9-1-2016 | | | | 380,000 | | | | 400,064 | |
San Diego CA RDA Naval Training Center Series A (Tax Revenue) | | | 4.50 | | | | 9-1-2017 | | | | 345,000 | | | | 374,843 | |
San Diego CA RDA Tax Allocation Center Series A (Tax Revenue, AGM Insured) ¤ | | | 0.00 | | | | 9-1-2018 | | | | 635,000 | | | | 594,538 | |
San Diego CA RDA Tax Allocation Center Series A (Tax Revenue, Syncora Guarantee Incorporated Insured) | | | 5.25 | | | | 9-1-2015 | | | | 2,215,000 | | | | 2,223,749 | |
San Francisco CA City & County RDA Successor Agency CFD #6 Series A (Tax Revenue) | | | 3.00 | | | | 8-1-2016 | | | | 400,000 | | | | 412,360 | |
San Francisco CA City & County RDA Successor Agency CFD #6 Series A (Tax Revenue) | | | 3.00 | | | | 8-1-2017 | | | | 205,000 | | | | 213,370 | |
San Francisco CA City & County RDA Successor Agency CFD #6 Series A (Tax Revenue) | | | 4.00 | | | | 8-1-2017 | | | | 885,000 | | | | 944,171 | |
San Francisco CA City & County RDA Successor Agency CFD #6 Series A (Tax Revenue) | | | 5.00 | | | | 8-1-2018 | | | | 500,000 | | | | 561,355 | |
San Francisco CA City & County RDA Successor Agency CFD #6 Series A (Tax Revenue) | | | 5.00 | | | | 8-1-2019 | | | | 555,000 | | | | 632,511 | |
San Francisco CA City & County RDFA Mission Bay North Redevelopment Series C (Tax Revenue) | | | 4.50 | | | | 8-1-2016 | | | | 310,000 | | | | 328,101 | |
San Francisco CA City & County RDFA Mission Bay South Redevelopment Series A (Tax Revenue) | | | 5.00 | | | | 8-1-2018 | | | | 400,000 | | | | 447,316 | |
San Francisco CA City & County RDFA Mission Bay South Redevelopment Series A (Tax Revenue) | | | 5.00 | | | | 8-1-2020 | | | | 500,000 | | | | 574,230 | |
San Francisco CA City & County RDFA Mission Bay South Redevelopment Series A (Tax Revenue) | | | 5.00 | | | | 8-1-2022 | | | | 375,000 | | | | 433,991 | |
San Francisco CA City & County RDFA San Francisco Redevelopment Project Series B (Tax Revenue, National Insured) | | | 5.00 | | | | 8-1-2015 | | | | 910,000 | | | | 933,969 | |
San Francisco CA City & County RDFA San Francisco Redevelopment Project Series B (Tax Revenue, National Insured) | | | 5.25 | | | | 8-1-2018 | | | | 2,000,000 | | | | 2,023,680 | |
San Francisco CA City & County RDFA San Francisco Redevelopment Project Series C (Tax Revenue) | | | 5.00 | | | | 8-1-2021 | | | | 2,000,000 | | | | 2,370,060 | |
San Francisco CA City & County RDFA San Francisco Redevelopment Project Series C (Tax Revenue) | | | 5.00 | | | | 8-1-2022 | | | | 500,000 | | | | 596,840 | |
The accompanying notes are an integral part of these financial statements.
| | | | | | |
| Portfolio of investments—December 31, 2014 (unaudited) | | Wells Fargo Advantage California Limited-Term Tax-Free Fund | | | 19 | |
| | | | | | | | | | | | | | | | |
| Security name | | Interest rate | | | Maturity date | | | Principal | | | Value | |
| | | | | | | | | | | | | | | | |
| | | | |
| California (continued) | | | | | | | | | | | | | | | | |
San Gorgonio CA Memorial Healthcare Refunding (GO) | | | 5.00 | % | | | 8-1-2021 | | | $ | 275,000 | | | $ | 322,363 | |
San Gorgonio CA Memorial Healthcare Refunding (GO) | | | 5.00 | | | | 8-1-2022 | | | | 500,000 | | | | 588,060 | |
San Gorgonio CA Memorial Healthcare Refunding (GO) | | | 5.00 | | | | 8-1-2023 | | | | 1,000,000 | | | | 1,181,170 | |
San Joaquin Hills County CA Transportation Corridor Agency CAB Series A (Transportation Revenue, National Insured) ¤ | | | 0.00 | | | | 1-15-2015 | | | | 2,830,000 | | | | 2,829,236 | |
San Joaquin Hills County CA Transportation Corridor Agency CAB Series A (Transportation Revenue) | | | 5.00 | | | | 1-15-2017 | | | | 1,000,000 | | | | 1,086,040 | |
San Jose CA Airport Series A (Airport Revenue, Ambac Insured) | | | 5.50 | | | | 3-1-2018 | | | | 4,350,000 | | | | 4,911,237 | |
San Jose CA Airport Series A (Airport Revenue, AGM/Ambac Insured) | | | 5.50 | | | | 3-1-2019 | | | | 5,220,000 | | | | 5,709,271 | |
San Jose CA Airport Series B PUTTER (Airport Revenue, Ambac/AGM Insured, JPMorgan Chase & Company LIQ) 144Aø | | | 0.16 | | | | 9-1-2030 | | | | 900,000 | | | | 900,000 | |
San Jose CA Convention Center Expansion & Renovation Project (Tax Revenue) | | | 5.25 | | | | 5-1-2023 | | | | 1,465,000 | | | | 1,728,744 | |
San Jose CA Financing Authority Convention Center Project Series F (Miscellaneous Revenue, National Insured) | | | 5.00 | | | | 9-1-2015 | | | | 1,000,000 | | | | 1,007,620 | |
San Jose CA Libraries & Parks Project (GO) | | | 5.00 | | | | 9-1-2017 | | | | 715,000 | | | | 717,831 | |
San Jose CA Redevelopment Agency Series A (Tax Revenue, National Insured) | | | 4.36 | | | | 8-1-2016 | | | | 400,000 | | | | 401,280 | |
San Jose CA Redevelopment Agency Series A (Tax Revenue, National Insured) | | | 4.54 | | | | 8-1-2018 | | | | 1,035,000 | | | | 1,038,436 | |
San Jose CA Redevelopment Agency Series A (Tax Revenue, National Insured) | | | 5.00 | | | | 8-1-2017 | | | | 2,000,000 | | | | 2,053,740 | |
San Jose CA Redevelopment Agency Series A (Tax Revenue) | | | 6.13 | | | | 8-1-2015 | | | | 280,000 | | | | 287,073 | |
San Jose CA Redevelopment Agency Tax Allocation Merged Area Project (Tax Revenue, National Insured) | | | 4.50 | | | | 8-1-2015 | | | | 500,000 | | | | 501,625 | |
San Jose CA Redevelopment Agency Tax Allocation Merged Area Project Series A (Tax Revenue, National Insured) | | | 5.25 | | | | 8-1-2019 | | | | 1,125,000 | | | | 1,129,511 | |
San Jose CA Redevelopment Agency Tax Allocation Merged Area Project Series A-1 (Tax Revenue) | | | 5.00 | | | | 8-1-2022 | | | | 800,000 | | | | 899,168 | |
San Jose CA Redevelopment Agency Tax Allocation Merged Area Project Series D (Tax Revenue, Ambac Insured) | | | 5.00 | | | | 8-1-2021 | | | | 2,635,000 | | | | 2,879,765 | |
San Luis & Delta-Mendota CA Water Authority Delta Habitat Conservation & Conveyance Program Development Project Series A (Water & Sewer Revenue, Build America Mutual Assurance Company Insured) | | | 5.00 | | | | 3-1-2019 | | | | 100,000 | | | | 112,806 | |
San Luis & Delta-Mendota CA Water Authority Delta Habitat Conservation & Conveyance Program Development Project Series A (Water & Sewer Revenue, Build America Mutual Assurance Company Insured) | | | 5.00 | | | | 3-1-2020 | | | | 100,000 | | | | 114,683 | |
San Marcos CA PFA Series B (Tax Revenue) | | | 3.00 | | | | 9-1-2015 | | | | 430,000 | | | | 436,330 | |
San Marcos CA PFA Series B (Tax Revenue) | | | 3.00 | | | | 9-1-2016 | | | | 445,000 | | | | 458,719 | |
San Marcos CA PFA Series B (Tax Revenue) | | | 3.00 | | | | 9-1-2017 | | | | 455,000 | | | | 472,841 | |
San Marcos CA PFA Series B (Tax Revenue) | | | 4.00 | | | | 9-1-2018 | | | | 1,000,000 | | | | 1,083,240 | |
San Marcos CA Unified School District Community Facilities District #5 (Tax Revenue, Build America Mutual Assurance Company Insured) | | | 5.00 | | | | 9-1-2020 | | | | 220,000 | | | | 257,110 | |
San Marcos CA Unified School District Community Facilities District #5 (Tax Revenue, Build America Mutual Assurance Company Insured) | | | 5.00 | | | | 9-1-2021 | | | | 270,000 | | | | 318,524 | |
San Marcos CA Unified School District Community Facilities District #5 (Tax Revenue, Build America Mutual Assurance Company Insured) | | | 5.00 | | | | 9-1-2022 | | | | 250,000 | | | | 297,895 | |
San Mateo County CA Joint Power Authority Capital Projects Program (Miscellaneous Revenue, National Insured) | | | 6.50 | | | | 7-1-2015 | | | | 105,000 | | | | 107,905 | |
San Mateo County CA Transportation Authority Series A (Tax Revenue, National Insured) ¤ | | | 0.00 | | | | 12-1-2018 | | | | 270,000 | | | | 249,720 | |
San Mateo-Foster City CA School District (GO) %% | | | 5.00 | | | | 8-15-2020 | | | | 2,000,000 | | | | 2,321,480 | |
San Pablo CA Redevelopment Agency Series B (Tax Revenue, AGM Insured) | | | 5.00 | | | | 6-15-2021 | | | | 1,775,000 | | | | 2,087,862 | |
San Pablo CA Redevelopment Agency Series B (Tax Revenue, AGM Insured) | | | 5.00 | | | | 6-15-2022 | | | | 1,865,000 | | | | 2,213,177 | |
San Pablo CA Redevelopment Agency Series B (Tax Revenue, AGM Insured) | | | 5.00 | | | | 6-15-2023 | | | | 1,945,000 | | | | 2,318,284 | |
The accompanying notes are an integral part of these financial statements.
| | | | |
| 20 | | Wells Fargo Advantage California Limited-Term Tax-Free Fund | | Portfolio of investments—December 31, 2014 (unaudited) |
| | | | | | | | | | | | | | | | |
| Security name | | Interest rate | | | Maturity date | | | Principal | | | Value | |
| | | | | | | | | | | | | | | | |
| | | | |
| California (continued) | | | | | | | | | | | | | | | | |
Santa Ana CA Community Redevelopment Agency Merged Project Area Series A (Tax Revenue) | | | 5.25 | % | | | 9-1-2019 | | | $ | 1,000,000 | | | $ | 1,142,950 | |
Santa Ana CA Unified School District CAB Election of 2008 Series A (GO) ¤ | | | 0.00 | | | | 8-1-2020 | | | | 1,815,000 | | | | 1,609,832 | |
Santa Clara County CA Financing Authority Capital Projects Series A (Miscellaneous Revenue) | | | 4.00 | | | | 2-1-2024 | | | | 6,000,000 | | | | 6,681,420 | |
Santa Cruz County CA Capital Financing Public Facilities Project (Miscellaneous Revenue, AGM Insured) | | | 4.00 | | | | 8-1-2020 | | | | 150,000 | | | | 166,602 | |
Santa Cruz County CA Capital Financing Public Facilities Project (Miscellaneous Revenue, AGM Insured) | | | 5.00 | | | | 8-1-2021 | | | | 125,000 | | | | 146,864 | |
Santa Cruz County CA Capital Financing Public Facilities Project (Miscellaneous Revenue, AGM Insured) | | | 5.00 | | | | 8-1-2022 | | | | 165,000 | | | | 195,690 | |
Santa Cruz County CA Redevelopment Agency Live Oak Soquel Community Series A (Tax Revenue, National Insured) | | | 5.25 | | | | 9-1-2016 | | | | 495,000 | | | | 528,596 | |
Santa Cruz County CA Redevelopment Agency Live Oak Soquel Community Series A (Tax Revenue, National Insured) | | | 5.25 | | | | 9-1-2017 | | | | 495,000 | | | | 543,416 | |
Santa Cruz County CA Redevelopment Successor Agency Tax Allocation Refunding (Tax Revenue, Build America Mutual Assurance Company Insured) | | | 5.00 | | | | 9-1-2019 | | | | 625,000 | | | | 716,019 | |
Santa Cruz County CA Redevelopment Successor Agency Tax Allocation Refunding (Tax Revenue, Build America Mutual Assurance Company Insured) | | | 5.00 | | | | 9-1-2020 | | | | 1,000,000 | | | | 1,158,750 | |
Santa Fe Springs CA Community Development Commission Consolidated Redevelopment Project Series A (Tax Revenue, National Insured) | | | 5.00 | | | | 9-1-2017 | | | | 750,000 | | | | 824,685 | |
Santa Margarita CA Water District Community Facilities District #99-1 (Tax Revenue) | | | 5.00 | | | | 9-1-2021 | | | | 500,000 | | | | 591,685 | |
Sierra CA Joint Community College District School Facilities Improvement District #2 CAB Series B (GO, National Insured) ¤ | | | 0.00 | | | | 8-1-2015 | | | | 500,000 | | | | 499,120 | |
Signal Hill CA Redevelopment Project #1 (Tax Revenue) | | | 4.13 | | | | 10-1-2016 | | | | 550,000 | | | | 569,454 | |
Simi Valley CA Unified School District Certificate of Participation (Miscellaneous Revenue, Ambac Insured) | | | 5.25 | | | | 8-1-2017 | | | | 550,000 | | | | 584,001 | |
Solana Beach CA School District Special Tax PFA (Tax Revenue) | | | 3.00 | | | | 9-1-2016 | | | | 450,000 | | | | 466,070 | |
Solana Beach CA School District Special Tax PFA (Tax Revenue) | | | 4.00 | | | | 9-1-2018 | | | | 330,000 | | | | 357,469 | |
Solana Beach CA School District Special Tax PFA (Tax Revenue) | | | 4.00 | | | | 9-1-2019 | | | | 735,000 | | | | 803,700 | |
South Monterey County CA Joint Union High School District (GO) | | | 3.00 | | | | 8-1-2015 | | | | 1,315,000 | | | | 1,334,646 | |
South Monterey County CA Joint Union High School District (GO) | | | 3.00 | | | | 8-1-2016 | | | | 1,345,000 | | | | 1,392,680 | |
South Monterey County CA Joint Union High School District (GO) | | | 3.00 | | | | 8-1-2017 | | | | 1,485,000 | | | | 1,556,325 | |
South San Francisco CA Unified School District BAN Series D (GO) ¤ | | | 0.00 | | | | 5-15-2017 | | | | 3,000,000 | | | | 2,935,110 | |
South Western CA Community College District Refunding Bond (GO) %% | | | 5.00 | | | | 8-1-2019 | | | | 2,230,000 | | | | 2,537,138 | |
South Western CA Community College District Refunding Bond (GO) %% | | | 5.00 | | | | 8-1-2020 | | | | 1,250,000 | | | | 1,444,713 | |
South Western CA Community College District Refunding Bond (GO) %% | | | 5.00 | | | | 8-1-2021 | | | | 2,710,000 | | | | 3,168,532 | |
Southern California Public Power Authority Hydroelectric Power Project Series A (Utilities Revenue, AGM Insured) | | | 5.25 | | | | 10-1-2015 | | | | 500,000 | | | | 502,085 | |
Southern Mono Healthcare District (GO) | | | 3.00 | | | | 8-1-2015 | | | | 550,000 | | | | 556,732 | |
Southern Mono Healthcare District (GO) | | | 3.00 | | | | 8-1-2016 | | | | 615,000 | | | | 631,667 | |
Southern Mono Healthcare District (GO) | | | 3.00 | | | | 8-1-2017 | | | | 300,000 | | | | 309,669 | |
Southern Mono Healthcare District (GO) | | | 4.00 | | | | 8-1-2019 | | | | 845,000 | | | | 911,772 | |
Stanislaus County CA Schools Infrastructure Financing Agency (Tax Revenue, AGM Insured) | | | 5.00 | | | | 9-1-2021 | | | | 1,300,000 | | | | 1,537,185 | |
Stanton CA Redevelopment Agency Consolidated Project Series A (Tax Revenue, AGM Insured) | | | 4.00 | | | | 12-1-2017 | | | | 400,000 | | | | 431,120 | |
Stanton CA Redevelopment Agency Consolidated Project Series A (Tax Revenue, AGM Insured) | | | 4.00 | | | | 12-1-2018 | | | | 410,000 | | | | 446,716 | |
Successor Agency to the Morgan Hill CA Redevelopment Agency Series A (Tax Revenue) | | | 5.00 | | | | 9-1-2021 | | | | 1,055,000 | | | | 1,256,421 | |
The accompanying notes are an integral part of these financial statements.
| | | | | | |
| Portfolio of investments—December 31, 2014 (unaudited) | | Wells Fargo Advantage California Limited-Term Tax-Free Fund | | | 21 | |
| | | | | | | | | | | | | | | | |
| Security name | | Interest rate | | | Maturity date | | | Principal | | | Value | |
| | | | | | | | | | | | | | | | |
| | | | |
| California (continued) | | | | | | | | | | | | | | | | |
Successor Agency to the Rancho Mirage CA Redevelopment Agency Refunding Sub Lien Series A (Tax Revenue, Build America Mutual Assurance Company Insured) | | | 4.00 | % | | | 4-1-2017 | | | $ | 460,000 | | | $ | 489,564 | |
Successor Agency to the Rancho Mirage CA Redevelopment Agency Refunding Sub Lien Series A (Tax Revenue, Build America Mutual Assurance Company Insured) | | | 5.00 | | | | 4-1-2018 | | | | 400,000 | | | | 444,648 | |
Successor Agency to the Rancho Mirage CA Redevelopment Agency Refunding Sub Lien Series A (Tax Revenue, Build America Mutual Assurance Company Insured) | | | 5.00 | | | | 4-1-2019 | | | | 580,000 | | | | 657,256 | |
Successor Agency to the Rancho Mirage CA Redevelopment Agency Series A (Tax Revenue, Build America Mutual Assurance Company Insured) | | | 4.00 | | | | 4-1-2018 | | | | 750,000 | | | | 810,000 | |
Successor Agency to the Rancho Mirage CA Redevelopment Agency Series A (Tax Revenue, Build America Mutual Assurance Company Insured) | | | 5.00 | | | | 4-1-2018 | | | | 550,000 | | | | 611,391 | |
Successor Agency to the Rancho Mirage CA Redevelopment Agency Series A (Tax Revenue, Build America Mutual Assurance Company Insured) | | | 5.00 | | | | 4-1-2019 | | | | 1,450,000 | | | | 1,643,140 | |
Successor Agency to the Richmond CA Community Redevelopment Agency Series A (Tax Revenue, Build America Mutual Assurance Company Insured) | | | 4.50 | | | | 9-1-2025 | | | | 160,000 | | | | 180,624 | |
Successor Agency to the Richmond CA Community Redevelopment Agency Series A (Tax Revenue, Build America Mutual Assurance Company Insured) | | | 5.00 | | | | 9-1-2021 | | | | 310,000 | | | | 363,537 | |
Successor Agency to the Richmond CA Community Redevelopment Agency Series A (Tax Revenue, Build America Mutual Assurance Company Insured) | | | 5.00 | | | | 9-1-2022 | | | | 300,000 | | | | 355,005 | |
Successor Agency to the Richmond CA Community Redevelopment Agency Series A (Tax Revenue, Build America Mutual Assurance Company Insured) | | | 5.00 | | | | 9-1-2023 | | | | 265,000 | | | | 314,208 | |
Successor Agency to the Richmond CA Community Redevelopment Agency Series A (Tax Revenue, Build America Mutual Assurance Company Insured) | | | 5.00 | | | | 9-1-2025 | | | | 150,000 | | | | 175,739 | |
Successor Agency to the Riverside County CA Redevelopment Agency Desert Communities Project Area Series D (Tax Revenue) | | | 5.00 | | | | 10-1-2020 | | | | 405,000 | | | | 474,332 | |
Successor Agency to the Riverside County CA Redevelopment Agency Desert Communities Project Area Series D (Tax Revenue) | | | 5.00 | | | | 10-1-2021 | | | | 425,000 | | | | 502,469 | |
Successor Agency to the Riverside County CA Redevelopment Agency Desert Communities Project Area Series D (Tax Revenue) | | | 5.00 | | | | 10-1-2022 | | | | 445,000 | | | | 530,004 | |
Successor Agency to the Riverside County CA Redevelopment Agency Desert Communities Project Area Series D (Tax Revenue) | | | 5.00 | | | | 10-1-2023 | | | | 470,000 | | | | 564,573 | |
Successor Agency to the Riverside County CA Redevelopment Agency Desert Communities Project Area Series D (Tax Revenue, AGM Insured) | | | 5.00 | | | | 10-1-2024 | | | | 485,000 | | | | 587,801 | |
Successor Agency to the Riverside County CA Redevelopment Agency Project Area #1 Series A (Tax Revenue) | | | 5.00 | | | | 10-1-2020 | | | | 365,000 | | | | 427,484 | |
Successor Agency to the Riverside County CA Redevelopment Agency Project Area #1 Series A (Tax Revenue) | | | 5.00 | | | | 10-1-2021 | | | | 645,000 | | | | 762,571 | |
Successor Agency to the Riverside County CA Redevelopment Agency Project Area #1 Series A (Tax Revenue) | | | 5.00 | | | | 10-1-2022 | | | | 240,000 | | | | 285,845 | |
Successor Agency to the Riverside County CA Redevelopment Agency Project Area #1 Series A (Tax Revenue) | | | 5.00 | | | | 10-1-2023 | | | | 460,000 | | | | 552,561 | |
Successor Agency to the Riverside County CA Redevelopment Agency Project Area #1 Series A (Tax Revenue, AGM Insured) | | | 5.00 | | | | 10-1-2024 | | | | 490,000 | | | | 593,860 | |
Successor Agency to the Vacaville CA Redevelopment Agency Projects (Tax Revenue) | | | 5.00 | | | | 9-1-2020 | | | | 600,000 | | | | 695,250 | |
Successor Agency to the Vacaville CA Redevelopment Agency Projects (Tax Revenue) | | | 5.00 | | | | 9-1-2021 | | | | 600,000 | | | | 703,620 | |
Successor Agency to the Vacaville CA Redevelopment Agency Projects (Tax Revenue) | | | 5.00 | | | | 9-1-2022 | | | | 1,050,000 | | | | 1,242,518 | |
Sulphur Springs CA Unified School District BAN Series A (Miscellaneous Revenue) ¤ | | | 0.00 | | | | 1-1-2018 | | | | 2,750,000 | | | | 2,652,265 | |
Sulphur Springs CA Unified School District Community Facilities District #2002-1 Series A (Tax Revenue) | | | 3.00 | | | | 9-1-2016 | | | | 150,000 | | | | 155,442 | |
Sulphur Springs CA Unified School District Community Facilities District #2002-1 Series A (Tax Revenue) | | | 3.00 | | | | 9-1-2017 | | | | 300,000 | | | | 314,175 | |
The accompanying notes are an integral part of these financial statements.
| | | | |
| 22 | | Wells Fargo Advantage California Limited-Term Tax-Free Fund | | Portfolio of investments—December 31, 2014 (unaudited) |
| | | | | | | | | | | | | | | | |
| Security name | | Interest rate | | | Maturity date | | | Principal | | | Value | |
| | | | | | | | | | | | | | | | |
| | | | |
| California (continued) | | | | | | | | | | | | | | | | |
Sulphur Springs CA Unified School District Community Facilities District #2002-1 Series A (Tax Revenue) | | | 3.00 | % | | | 9-1-2018 | | | $ | 555,000 | | | $ | 583,150 | |
Sulphur Springs CA Unified School District Community Facilities District #2002-1 Series A (Tax Revenue) | | | 3.00 | | | | 9-1-2019 | | | | 595,000 | | | | 626,345 | |
Sweetwater CA Union High School District Public Financing Authority Refunding Bond (Miscellaneous Revenue, Build America Mutual Assurance Company Insured) | | | 5.00 | | | | 9-1-2018 | | | | 1,500,000 | | | | 1,697,265 | |
Sweetwater CA Union High School District Public Financing Authority Refunding Bond (Miscellaneous Revenue, Build America Mutual Assurance Company Insured) | | | 5.00 | | | | 9-1-2019 | | | | 1,000,000 | | | | 1,153,230 | |
Sweetwater CA Union High School District Refunding Bond (GO, Build America Mutual Assurance Company Insured) | | | 5.00 | | | | 8-1-2021 | | | | 620,000 | | | | 737,068 | |
Temecula CA PFA Crown Hill Community Facilities District #3-1 (Tax Revenue) | | | 3.00 | | | | 9-1-2016 | | | | 380,000 | | | | 393,057 | |
Temecula CA PFA Crown Hill Community Facilities District #3-1 (Tax Revenue) | | | 3.00 | | | | 9-1-2017 | | | | 395,000 | | | | 412,072 | |
Temecula CA PFA Crown Hill Community Facilities District #3-1 (Tax Revenue) | | | 3.00 | | | | 9-1-2018 | | | | 405,000 | | | | 423,772 | |
Temecula CA PFA Wolf Creek Community Facilities District #3-3 (Tax Revenue) | | | 3.00 | | | | 9-1-2018 | | | | 870,000 | | | | 896,622 | |
Temecula Valley CA Unified School District Community Facilities District #89-1 (Tax Revenue) | | | 3.00 | | | | 9-1-2016 | | | | 1,185,000 | | | | 1,226,522 | |
Temecula Valley CA Unified School District Community Facilities District #89-1 (Tax Revenue) | | | 3.00 | | | | 9-1-2017 | | | | 1,250,000 | | | | 1,305,375 | |
Torrance CA RDA Referendum Senior Lien Series C (Tax Revenue, National Insured) | | | 5.45 | | | | 9-1-2018 | | | | 1,095,000 | | | | 1,098,515 | |
Twin Rivers CA Unified School District Facility Bridge Funding Program (Miscellaneous Revenue, AGM Insured) ± | | | 3.20 | | | | 6-1-2027 | | | | 4,150,000 | | | | 4,153,611 | |
Twin Rivers CA Unified School District Series A (GO, Build America Mutual Assurance Company Insured) | | | 4.00 | | | | 8-1-2019 | | | | 385,000 | | | | 427,893 | |
Twin Rivers CA Unified School District Series A (GO, Build America Mutual Assurance Company Insured) | | | 5.00 | | | | 8-1-2020 | | | | 510,000 | | | | 598,903 | |
Union City CA Community Redevelopment Agency Sub Lien (Tax Revenue) | | | 4.00 | | | | 12-1-2015 | | | | 210,000 | | | | 216,676 | |
Union City CA Community Redevelopment Agency Sub Lien (Tax Revenue) | | | 4.38 | | | | 12-1-2016 | | | | 475,000 | | | | 506,588 | |
University of California Series AK (Education Revenue) | | | 5.00 | | | | 5-15-2048 | | | | 10,000,000 | | | | 12,289,600 | |
Upland CA Successor Agency Merged Project Tax Allocation (Tax Revenue, AGM Insured) | | | 5.00 | | | | 9-1-2023 | | | | 1,000,000 | | | | 1,194,540 | |
Vacaville CA Unified School District Series C (GO, Build America Mutual Assurance Company Insured) %% | | | 5.00 | | | | 8-1-2022 | | | | 675,000 | | | | 791,579 | |
Val Verde CA Unified School District (Tax Revenue, Build America Mutual Assurance Company Insured) | | | 4.00 | | | | 10-1-2020 | | | | 350,000 | | | | 387,079 | |
Val Verde CA Unified School District (Tax Revenue, Build America Mutual Assurance Company Insured) | | | 4.00 | | | | 10-1-2021 | | | | 375,000 | | | | 416,869 | |
Val Verde CA Unified School District (Tax Revenue, Build America Mutual Assurance Company Insured) | | | 5.00 | | | | 10-1-2022 | | | | 665,000 | | | | 787,619 | |
Val Verde CA Unified School District BAN (GO) | | | 3.00 | | | | 8-1-2018 | | | | 5,000,000 | | | | 5,162,000 | |
Vallejo CA Refunding Bond Series 2006 (Water & Sewer Revenue, National Insured) | | | 5.00 | | | | 5-1-2015 | | | | 500,000 | | | | 507,885 | |
Vallejo CA Refunding Bond Series 2006 (Water & Sewer Revenue, National Insured) | | | 5.00 | | | | 5-1-2019 | | | | 790,000 | | | | 829,737 | |
Vallejo CA Refunding Bond Series 2006 (Water & Sewer Revenue, National Insured) | | | 5.00 | | | | 5-1-2021 | | | | 1,500,000 | | | | 1,568,235 | |
Vallejo CA Unified School District Series A (GO, National Insured) | | | 5.60 | | | | 2-1-2016 | | | | 1,080,000 | | | | 1,134,972 | |
Vallejo CA Unified School District Series A (GO, National Insured) | | | 5.90 | | | | 2-1-2018 | | | | 2,065,000 | | | | 2,342,495 | |
Ventura County CA Public Financing Authority Series B (Miscellaneous Revenue) | | | 5.00 | | | | 11-1-2019 | | | | 375,000 | | | | 436,523 | |
Ventura County CA Public Financing Authority Series B (Miscellaneous Revenue) | | | 5.00 | | | | 11-1-2020 | | | | 250,000 | | | | 295,110 | |
Victor Valley CA Joint Unified School District CAB (GO, AGM Insured) ¤ | | | 0.00 | | | | 8-1-2015 | | | | 280,000 | | | | 279,580 | |
Visalia CA Certificate of Participation (Miscellaneous Revenue, AGM Insured) | | | 4.00 | | | | 12-1-2020 | | | | 250,000 | | | | 278,908 | |
Visalia CA Certificate of Participation (Miscellaneous Revenue, AGM Insured) | | | 4.00 | | | | 12-1-2021 | | | | 250,000 | | | | 279,473 | |
Visalia CA Certificate of Participation (Miscellaneous Revenue, AGM Insured) | | | 5.00 | | | | 12-1-2022 | | | | 335,000 | | | | 398,024 | |
Walnut CA Energy Center Authority Refunding Series A (Utilities Revenue) | | | 5.00 | | | | 1-1-2021 | | | | 500,000 | | | | 593,425 | |
The accompanying notes are an integral part of these financial statements.
| | | | | | |
| Portfolio of investments—December 31, 2014 (unaudited) | | Wells Fargo Advantage California Limited-Term Tax-Free Fund | | | 23 | |
| | | | | | | | | | | | | | | | |
| Security name | | Interest rate | | | Maturity date | | | Principal | | | Value | |
| | | | | | | | | | | | | | | | |
| | | | |
| California (continued) | | | | | | | | | | | | | | | | |
Walnut CA Improvement Agency Refunding Walnut Improvement Project (Tax Revenue, Build America Mutual Assurance Company Insured) | | | 4.00 | % | | | 3-1-2017 | | | $ | 850,000 | | | $ | 902,887 | |
Washington Township CA Health Care District (Health Revenue) | | | 5.00 | | | | 7-1-2018 | | | | 1,750,000 | | | | 1,756,615 | |
Washington Township CA Health Care District Series A (Health Revenue) | | | 5.00 | | | | 7-1-2017 | | | | 1,125,000 | | | | 1,217,216 | |
West Contra Costa CA Unified School District (GO, National Insured) ¤ | | | 0.00 | | | | 8-1-2015 | | | | 500,000 | | | | 498,660 | |
West Contra Costa CA Unified School District (GO, AGM Insured) | | | 5.00 | | | | 8-1-2016 | | | | 1,055,000 | | | | 1,132,416 | |
West Covina CA Unified School District (GO, AGM Insured) | | | 4.00 | | | | 8-1-2017 | | | | 325,000 | | | | 349,973 | |
West Covina CA Unified School District (GO, AGM Insured) | | | 4.00 | | | | 8-1-2018 | | | | 575,000 | | | | 628,820 | |
West Hollywood CA Community Development Department East Side Redevelopment Project Series A (Tax Revenue) | | | 5.00 | | | | 9-1-2015 | | | | 200,000 | | | | 206,004 | |
West Sacramento CA Flood Control Agency (Miscellaneous Revenue) | | | 2.25 | | | | 9-1-2016 | | | | 265,000 | | | | 272,221 | |
West Sacramento CA Flood Control Agency (Miscellaneous Revenue) | | | 2.25 | | | | 9-1-2017 | | | | 270,000 | | | | 279,407 | |
West Sacramento CA Flood Control Agency (Miscellaneous Revenue) | | | 2.50 | | | | 9-1-2018 | | | | 275,000 | | | | 286,234 | |
West Sacramento CA Flood Control Agency (Miscellaneous Revenue) | | | 2.75 | | | | 9-1-2019 | | | | 285,000 | | | | 299,452 | |
West Sacramento CA Flood Control Agency (Miscellaneous Revenue) | | | 5.00 | | | | 9-1-2020 | | | | 290,000 | | | | 338,575 | |
Western Riverside County CA Regional Wastewater Authority Series A-1 (Tax Revenue) | | | 4.00 | | | | 9-1-2016 | | | | 560,000 | | | | 588,862 | |
Western Riverside County CA Regional Wastewater Authority Series A-1 (Tax Revenue) | | | 4.00 | | | | 9-1-2017 | | | | 570,000 | | | | 610,139 | |
Western Riverside County CA Regional Wastewater Authority Series A-1 (Tax Revenue) | | | 4.00 | | | | 9-1-2019 | | | | 1,830,000 | | | | 2,001,050 | |
Windsor CA Redevelopment Successor Agency Windsor Redevelopment Project (Tax Revenue, Build America Mutual Assurance Company Insured) | | | 3.00 | | | | 9-1-2017 | | | | 615,000 | | | | 643,235 | |
| | | | |
| | | | | | | | | | | | | | | 841,541,795 | |
| | | | | | | | | | | | | | | | |
| | | | |
| Guam: 0.21% | | | | | | | | | | | | | | | | |
Guam Power Authority Series A (Utilities Revenue, AGM Insured) | | | 5.00 | | | | 10-1-2019 | | | | 1,640,000 | | | | 1,891,576 | |
| | | | | | | | | | | | | | | | |
| | | | |
| Illinois: 0.62% | | | | | | | | | | | | | | | | |
Chicago IL Refunding Bond (Tax Revenue, JPMorgan Chase & Company SPA) ø | | | 0.16 | | | | 1-1-2034 | | | | 5,615,000 | | | | 5,615,000 | |
| | | | | | | | | | | | | | | | |
| | | | |
| New York: 2.11% | | | | | | | | | | | | | | | | |
JPMorgan Chase PUTTER/DRIVERs Trust Series 3600Z New York Thruway Authority (Tax Revenue, JPMorgan Chase & Company LIQ) 144Aø | | | 0.16 | | | | 1-1-2016 | | | | 6,500,000 | | | | 6,500,000 | |
Nassau County NY Health Care Corporation RAN (Health Revenue) | | | 2.25 | | | | 1-15-2015 | | | | 1,000,000 | | | | 1,000,500 | |
New York NY Transitional Finance Authority Sub Series 2A (Tax Revenue, Dexia Credit Local LIQ) ø | | | 0.16 | | | | 11-1-2022 | | | | 4,500,000 | | | | 4,500,000 | |
New York NY Various Sub Series H-5 (GO, Dexia Credit Local LOC) ø | | | 0.16 | | | | 3-1-2034 | | | | 7,190,000 | | | | 7,190,000 | |
| | | | |
| | | | | | | | | | | | | | | 19,190,500 | |
| | | | | | | | | | | | | | | | |
| | | | |
| Puerto Rico: 1.10% | | | | | | | | | | | | | | | | |
Puerto Rico HFA Capital Funding Program (Housing Revenue, HUD Insured) | | | 5.00 | | | | 12-1-2016 | | | | 1,815,000 | | | | 1,820,699 | |
Puerto Rico HFA Subordinated Capital Fund Modernization Refunding Bond (Housing Revenue, HUD Insured) | | | 5.50 | | | | 12-1-2016 | | | | 2,440,000 | | | | 2,640,617 | |
Puerto Rico HFA Subordinated Capital Fund Modernization Refunding Bond (Housing Revenue, HUD Insured) | | | 5.50 | | | | 12-1-2017 | | | | 1,895,000 | | | | 2,119,160 | |
Puerto Rico HFA Subordinated Capital Fund Modernization Refunding Bond (Housing Revenue, HUD Insured) | | | 5.50 | | | | 12-1-2018 | | | | 1,250,000 | | | | 1,439,488 | |
Puerto Rico HFA Unrefunded Balance Capital Funding Program (Housing Revenue) | | | 5.00 | | | | 12-1-2019 | | | | 1,000,000 | | | | 1,002,800 | |
Puerto Rico Public Improvement Series A (GO, AGM Insured) | | | 5.00 | | | | 7-1-2015 | | | | 1,000,000 | | | | 1,002,008 | |
| | | | |
| | | | | | | | | | | | | | | 10,024,772 | |
| | | | | | | | | | | | | | | | |
| | | | |
| Wisconsin: 0.06% | | | | | | | | | | | | | | | | |
Wisconsin PFA Senior Living 50 Rose Villa Project Series B-3 (Health Revenue) | | | 3.75 | | | | 11-15-2019 | | | | 500,000 | | | | 506,725 | |
| | | | | | | | | | | | | | | | |
| | | | |
Total Municipal Obligations (Cost $857,608,365) | | | | | | | | | | | | | | | 878,770,368 | |
| | | | | | | | | | | | | | | | |
The accompanying notes are an integral part of these financial statements.
| | | | |
| 24 | | Wells Fargo Advantage California Limited-Term Tax-Free Fund | | Portfolio of investments—December 31, 2014 (unaudited) |
| | | | | | | | | | | | | | | | |
| Security name | | Interest rate | | | Maturity date | | | Principal | | | Value | |
| | | | | | | | | | | | | | | | |
| | | | |
Other: 0.27% | | | | | | | | | | | | | | | | |
Nuveen California AMT-Free Municipal Income Fund, Institutional MuniFund Term Preferred Shares 144Aø | | | 0.51 | % | | | 7-1-2018 | | | $ | 2,500,000 | | | $ | 2,498,000 | |
| | | | | | | | | | | | | | | | |
| | | | |
Total Other (Cost $2,500,000) | | | | | | | | | | | | | | | 2,498,000 | |
| | | | | | | | | | | | | | | | |
| | | | |
| | | Yield | | | | | | Shares | | | | |
| Short-Term Investments: 4.86% | | | | | | | | | | | | | | | | |
| | | | |
| Investment Companies: 4.86% | | | | | | | | | | | | | | | | |
Wells Fargo Advantage California Municipal Money Market Fund, Institutional Class (l)(u)## | | | 0.01 | | | | | | | | 44,135,521 | | | | 44,135,521 | |
| | | | | | | | | | | | | | | | |
| | | | |
Total Short-Term Investments (Cost $44,135,521) | | | | | | | | | | | | | | | 44,135,521 | |
| | | | | | | | | | | | | | | | |
| | | | | | | | |
| Total investments in securities (Cost $904,243,886) * | | | 101.82 | % | | | 925,403,889 | |
Other assets and liabilities, net | | | (1.82 | ) | | | (16,553,808 | ) |
| | | | | | | | |
| Total net assets | | | 100.00 | % | | $ | 908,850,081 | |
| | | | | | | | |
| ¤ | The security is issued in zero coupon form with no periodic interest payments. |
| 144A | The security may be resold in transactions exempt from registration, normally to qualified institutional buyers, pursuant to Rule 144A under the Securities Act of 1933. |
| ø | Variable rate demand notes are subject to a demand feature which reduces the effective maturity. The maturity date shown represents the final maturity date of the security. The interest rate is determined and reset by the issuer daily, weekly, or monthly depending upon the terms of the security. The rate shown is the rate in effect at period end. |
| %% | The security is issued on a when-issued basis. |
| ± | Variable rate investment. The rate shown is the rate in effect at period end. |
| (m) | The security is an auction-rate security which has an interest rate that resets at predetermined short-term intervals through a Dutch auction. The rate shown is the rate in effect at period end. |
| (l) | The security represents an affiliate of the Fund as defined in the Investment Company Act of 1940. |
| (u) | The rate represents the 7-day annualized yield at period end. |
| ## | All or a portion of this security is segregated for when-issued securities. |
| * | Cost for federal income tax purposes is $904,244,040 and unrealized gains (losses) consists of: |
| | | | |
Gross unrealized gains | | $ | 21,479,671 | |
Gross unrealized losses | | | (319,822 | ) |
| | | | |
Net unrealized gains | | $ | 21,159,849 | |
The accompanying notes are an integral part of these financial statements.
| | | | | | |
| Statement of assets and liabilities—December 31, 2014 (unaudited) | | Wells Fargo Advantage California Limited-Term Tax-Free Fund | | | 25 | |
| | | | |
| | | | |
| |
Assets | | | | |
Investments | | | | |
In unaffiliated securities, at value (cost $860,108,365) | | $ | 881,268,368 | |
In affiliated securities, at value (cost $44,135,521) | | | 44,135,521 | |
| | | | |
Total investments, at value (cost $904,243,886) | | | 925,403,889 | |
Receivable for investments sold | | | 610,593 | |
Receivable for Fund shares sold | | | 2,195,951 | |
Receivable for interest | | | 7,986,096 | |
Prepaid expenses and other assets | | | 62,334 | |
| | | | |
Total assets | | | 936,258,863 | |
| | | | |
| |
Liabilities | | | | |
Dividends payable | | | 589,992 | |
Payable for investments purchased | | | 25,644,776 | |
Payable for Fund shares redeemed | | | 626,957 | |
Advisory fee payable | | | 175,011 | |
Distribution fee payable | | | 22,476 | |
Administration fees payable | | | 128,790 | |
Accrued expenses and other liabilities | | | 220,780 | |
| | | | |
Total liabilities | | | 27,408,782 | |
| | | | |
Total net assets | | $ | 908,850,081 | |
| | | | |
| |
NET ASSETS CONSIST OF | | | | |
Paid-in capital | | $ | 888,117,869 | |
Undistributed net investment income | | | 371,767 | |
Accumulated net realized losses on investments | | | (799,558 | ) |
Net unrealized gains on investments | | | 21,160,003 | |
| | | | |
Total net assets | | $ | 908,850,081 | |
| | | | |
| |
COMPUTATION OF NET ASSET VALUE AND OFFERING PRICE PER SHARE | | | | |
Net assets – Class A | | $ | 208,234,272 | |
Shares outstanding – Class A1 | | | 19,118,952 | |
Net asset value per share – Class A | | | $10.89 | |
Maximum offering price per share – Class A2 | | | $11.11 | |
Net assets – Class C | | $ | 34,290,408 | |
Shares outstanding – Class C1 | | | 3,148,802 | |
Net asset value per share – Class C | | | $10.89 | |
Net assets – Administrator Class | | $ | 586,203,921 | |
Shares outstanding – Administrator Class1 | | | 54,668,227 | |
Net asset value per share – Administrator Class | | | $10.72 | |
Net assets – Institutional Class | | $ | 80,121,480 | |
Shares outstanding – Institutional Class1 | | | 7,472,254 | |
Net asset value per share – Institutional Class | | | $10.72 | |
| 1. | The Fund has an unlimited number of authorized shares. |
| 2. | Maximum offering price is computed as 100/98.00 of net asset value. On investments of $50,000 or more, the offering price is reduced. |
The accompanying notes are an integral part of these financial statements.
| | | | |
| 26 | | Wells Fargo Advantage California Limited-Term Tax-Free Fund | | Statement of operations—six months ended December 31, 2014 (unaudited) |
| | | | |
| | | | |
| |
Investment income | | | | |
Interest | | $ | 9,790,854 | |
Income from affiliated securities | | | 7,535 | |
| | | | |
Total investment income | | | 9,798,389 | |
| | | | |
| |
Expenses | | | | |
Advisory fee | | | 1,476,830 | |
Administration fees | | | | |
Fund level | | | 217,458 | |
Class A | | | 167,968 | |
Class C | | | 27,850 | |
Administrator Class | | | 303,388 | |
Institutional Class | | | 7,312 | 1 |
Shareholder servicing fees | | | | |
Class A | | | 262,449 | |
Class C | | | 43,516 | |
Administrator Class | | | 758,472 | |
Distribution fee | | | | |
Class C | | | 130,546 | |
Custody and accounting fees | | | 24,814 | |
Professional fees | | | 20,853 | |
Registration fees | | | 30,330 | |
Shareholder report expenses | | | 9,922 | |
Trustees’ fees and expenses | | | 6,035 | |
Other fees and expenses | | | 8,913 | |
| | | | |
Total expenses | | | 3,496,656 | |
Less: Fee waivers and/or expense reimbursements | | | (521,322 | ) |
| | | | |
Net expenses | | | 2,975,334 | |
| | | | |
Net investment income | | | 6,823,055 | |
| | | | |
| |
REALIZED AND UNREALIZED GAINS (LOSSES) ON INVESTMENTS | | | | |
Net realized gains on investments | | | 675,147 | |
Net change in unrealized gains (losses) on investments | | | 1,419,117 | |
| | | | |
Net realized and unrealized gains (losses) on investments | | | 2,094,264 | |
| | | | |
Net increase in net assets resulting from operations | | $ | 8,917,319 | |
| | | | |
| 1. | For the period from October 31, 2014 (commencement of class operations) to December 31, 2014 |
The accompanying notes are an integral part of these financial statements.
| | | | | | |
| Statement of changes in net assets | | Wells Fargo Advantage California Limited-Term Tax-Free Fund | | | 27 | |
| | | | | | | | | | | | | | | | |
| | | Six months ended December 31, 2014 (unaudited) | | | Year ended June 30, 2014 | |
| | | | |
Operations | | | | | | | | | | | | | | | | |
Net investment income | | | | | | $ | 6,823,055 | | | | | | | $ | 11,978,484 | |
Net realized gains (losses) on investments | | | | | | | 675,147 | | | | | | | | (193,048 | ) |
Net change in unrealized gains (losses) on investments | | | | | | | 1,419,117 | | | | | | | | 13,696,884 | |
| | | | |
Net increase in net assets resulting from operations | | | | | | | 8,917,319 | | | | | | | | 25,482,320 | |
| | | | |
| | | | |
Distributions to shareholders from | | | | | | | | | | | | | | | | |
Net investment income | | | | | | | | | | | | | | | | |
Class A | | | | | | | (1,522,036 | ) | | | | | | | (3,002,690 | ) |
Class C | | | | | | | (122,175 | ) | | | | | | | (326,986 | ) |
Administrator Class | | | | | | | (5,022,507 | ) | | | | | | | (8,648,808 | ) |
Institutional Class | | | | | | | (156,337 | )1 | | | | | | | N/A | |
| | | | |
Total distributions to shareholders | | | | | | | (6,823,055 | ) | | | | | | | (11,978,484 | ) |
| | | | |
| | | | |
Capital share transactions | | | Shares | | | | | | | | Shares | | | | | |
Proceeds from shares sold | | | | | | | | | | | | | | | | |
Class A | | | 4,290,121 | | | | 46,726,164 | | | | 10,555,859 | | | | 113,313,375 | |
Class C | | | 252,381 | | | | 2,750,281 | | | | 924,609 | | | | 9,918,506 | |
Administrator Class | | | 23,066,048 | | | | 247,388,230 | | | | 37,337,801 | | | | 394,931,236 | |
Institutional Class | | | 7,542,001 | 1 | | | 80,854,329 | 1 | | | N/A | | | | N/A | |
| | | | |
| | | | | | | 377,719,004 | | | | | | | | 518,163,117 | |
| | | | |
Reinvestment of distributions | | | | | | | | | | | | | | | | |
Class A | | | 121,744 | | | | 1,326,982 | | | | 262,989 | | | | 2,828,394 | |
Class C | | | 10,121 | | | | 110,267 | | | | 27,587 | | | | 296,457 | |
Administrator Class | | | 185,643 | | | | 1,992,072 | | | | 298,828 | | | | 3,164,687 | |
Institutional Class | | | 3 | 1 | | | 31 | 1 | | | N/A | | | | N/A | |
| | | | |
| | | | | | | 3,429,352 | | | | | | | | 6,289,538 | |
| | | | |
Payment for shares redeemed | | | | | | | | | | | | | | | | |
Class A | | | (4,006,259 | ) | | | (43,680,577 | ) | | | (6,779,748 | ) | | | (72,791,222 | ) |
Class C | | | (328,411 | ) | | | (3,577,483 | ) | | | (1,051,548 | ) | | | (11,271,347 | ) |
Administrator Class | | | (20,021,063 | ) | | | (214,768,020 | ) | | | (23,267,984 | ) | | | (246,059,102 | ) |
Institutional Class | | | (69,750 | )1 | | | (748,253 | )1 | | | N/A | | | | N/A | |
| | | | |
| | | | | | | (262,774,333 | ) | | | | | | | (330,121,671 | ) |
| | | | |
Net increase in net assets resulting from capital share transactions | | | | | | | 118,374,023 | | | | | | | | 194,330,984 | |
| | | | |
Total increase in net assets | | | | | | | 120,468,287 | | | | | | | | 207,834,820 | |
| | | | |
| | | | |
Net assets | | | | | | | | | | | | | | | | |
Beginning of period | | | | | | | 788,381,794 | | | | | | | | 580,546,974 | |
| | | | |
End of period | | | | | | $ | 908,850,081 | | | | | | | $ | 788,381,794 | |
| | | | |
Undistributed net investment income | | | | | | $ | 371,767 | | | | | | | $ | 371,767 | |
| | | | |
| 1. | For the period from October 31, 2014 (commencement of class operations) to December 31, 2014 |
The accompanying notes are an integral part of these financial statements.
| | | | |
| 28 | | Wells Fargo Advantage California Limited-Term Tax-Free Fund | | Financial highlights |
(For a share outstanding throughout each period)
| | | | | | | | | | | | | | | | | | | | | | | | |
| | | Six months ended
December 31, 2014
(unaudited) | | | Year ended June 30 | |
| CLASS A | | | 2014 | | | 2013 | | | 2012 | | | 2011 | | | 2010 | |
Net asset value, beginning of period | | | $10.86 | | | | $10.66 | | | | $10.70 | | | | $10.51 | | | | $10.51 | | | | $10.29 | |
Net investment income | | | 0.08 | | | | 0.18 | | | | 0.21 | | | | 0.27 | | | | 0.27 | | | | 0.28 | |
Net realized and unrealized gains (losses) on investments | | | 0.03 | | | | 0.20 | | | | (0.04 | ) | | | 0.19 | | | | 0.00 | | | | 0.23 | |
| | | | | | | | | | | | | | | | | | | | | | | | |
Total from investment operations | | | 0.11 | | | | 0.38 | | | | 0.17 | | | | 0.46 | | | | 0.27 | | | | 0.51 | |
Distributions to shareholders from | | | | | | | | | | | | | | | | | | | | | | | | |
Net investment income | | | (0.08 | ) | | | (0.18 | ) | | | (0.21 | ) | | | (0.27 | ) | | | (0.27 | ) | | | (0.29 | ) |
Net asset value, end of period | | | $10.89 | | | | $10.86 | | | | $10.66 | | | | $10.70 | | | | $10.51 | | | | $10.51 | |
Total return1 | | | 1.01 | % | | | 3.61 | % | | | 1.59 | % | | | 4.41 | % | | | 2.52 | % | | | 5.14 | % |
Ratios to average net assets (annualized) | | | | | | | | | | | | | | | | | | | | | | | | |
Gross expenses | | | 0.82 | % | | | 0.83 | % | | | 0.83 | % | | | 0.84 | % | | | 0.84 | % | | | 0.85 | % |
Net expenses | | | 0.80 | % | | | 0.80 | % | | | 0.80 | % | | | 0.80 | % | | | 0.80 | % | | | 0.85 | % |
Net investment income | | | 1.45 | % | | | 1.70 | % | | | 1.95 | % | | | 2.51 | % | | | 2.58 | % | | | 2.67 | % |
Supplemental data | | | | | | | | | | | | | | | | | | | | | | | | |
Portfolio turnover rate | | | 16 | % | | | 31 | % | | | 32 | % | | | 56 | % | | | 54 | % | | | 34 | % |
Net assets, end of period (000s omitted) | | | $208,234 | | | | $203,306 | | | | $156,366 | | | | $162,381 | | | | $126,570 | | | | $116,578 | |
| 1. | Total return calculations do not include any sales charges. Returns for periods of less than one year are not annualized. |
The accompanying notes are an integral part of these financial statements.
| | | | | | |
| Financial highlights | | Wells Fargo Advantage California Limited-Term Tax-Free Fund | | | 29 | |
(For a share outstanding throughout each period)
| | | | | | | | | | | | | | | | | | | | | | | | |
| | | Six months ended
December 31, 2014
(unaudited) | | | Year ended June 30 | |
| CLASS C | | | 2014 | | | 2013 | | | 2012 | | | 2011 | | | 2010 | |
Net asset value, beginning of period | | | $10.86 | | | | $10.65 | | | | $10.70 | | | | $10.51 | | | | $10.51 | | | | $10.29 | |
Net investment income | | | 0.04 | | | | 0.10 | | | | 0.13 | | | | 0.19 | | | | 0.19 | | | | 0.19 | |
Net realized and unrealized gains (losses) on investments | | | 0.03 | | | | 0.21 | | | | (0.05 | ) | | | 0.19 | | | | 0.00 | | | | 0.24 | |
| | | | | | | | | | | | | | | | | | | | | | | | |
Total from investment operations | | | 0.07 | | | | 0.31 | | | | 0.08 | | | | 0.38 | | | | 0.19 | | | | 0.43 | |
Distributions to shareholders from | | | | | | | | | | | | | | | | | | | | | | | | |
Net investment income | | | (0.04 | ) | | | (0.10 | ) | | | (0.13 | ) | | | (0.19 | ) | | | (0.19 | ) | | | (0.21 | ) |
Net asset value, end of period | | | $10.89 | | | | $10.86 | | | | $10.65 | | | | $10.70 | | | | $10.51 | | | | $10.51 | |
Total return1 | | | 0.63 | % | | | 2.94 | % | | | 0.73 | % | | | 3.63 | % | | | 1.85 | % | | | 4.25 | % |
Ratios to average net assets (annualized) | | | | | | | | | | | | | | | | | | | | | | | | |
Gross expenses | | | 1.57 | % | | | 1.58 | % | | | 1.58 | % | | | 1.59 | % | | | 1.60 | % | | | 1.61 | % |
Net expenses | | | 1.55 | % | | | 1.55 | % | | | 1.55 | % | | | 1.55 | % | | | 1.55 | % | | | 1.60 | % |
Net investment income | | | 0.70 | % | | | 0.95 | % | | | 1.19 | % | | | 1.77 | % | | | 1.82 | % | | | 1.85 | % |
Supplemental data | | | | | | | | | | | | | | | | | | | | | | | | |
Portfolio turnover rate | | | 16 | % | | | 31 | % | | | 32 | % | | | 56 | % | | | 54 | % | | | 34 | % |
Net assets, end of period (000s omitted) | | | $34,290 | | | | $34,920 | | | | $35,309 | | | | $33,414 | | | | $28,089 | | | | $29,501 | |
| 1. | Total return calculations do not include any sales charges. Returns for periods of less than one year are not annualized. |
The accompanying notes are an integral part of these financial statements.
| | | | |
| 30 | | Wells Fargo Advantage California Limited-Term Tax-Free Fund | | Financial highlights |
(For a share outstanding throughout each period)
| | | | | | | | | | | | | | | | | | | | | | | | |
| | | Six months ended
December 31, 2014
(unaudited) | | | Year ended June 30 | |
| ADMINISTRATOR CLASS | | | 2014 | | | 2013 | | | 2012 | | | 2011 | | | 2010 | |
Net asset value, beginning of period | | | $10.70 | | | | $10.49 | | | | $10.53 | | | | $10.34 | | | | $10.35 | | | | $10.13 | |
Net investment income | | | 0.09 | | | | 0.20 | | | | 0.23 | | | | 0.29 | | | | 0.29 | | | | 0.30 | |
Net realized and unrealized gains (losses) on investments | | | 0.02 | | | | 0.21 | | | | (0.04 | ) | | | 0.19 | | | | (0.01 | ) | | | 0.23 | |
| | | | | | | | | | | | | | | | | | | | | | | | |
Total from investment operations | | | 0.11 | | | | 0.41 | | | | 0.19 | | | | 0.48 | | | | 0.28 | | | | 0.53 | |
Distributions to shareholders from | | | | | | | | | | | | | | | | | | | | | | | | |
Net investment income | | | (0.09 | ) | | | (0.20 | ) | | | (0.23 | ) | | | (0.29 | ) | | | (0.29 | ) | | | (0.31 | ) |
Net asset value, end of period | | | $10.72 | | | | $10.70 | | | | $10.49 | | | | $10.53 | | | | $10.34 | | | | $10.35 | |
Total return1 | | | 1.02 | % | | | 3.95 | % | | | 1.79 | % | | | 4.65 | % | | | 2.72 | % | | | 5.34 | % |
Ratios to average net assets (annualized) | | | | | | | | | | | | | | | | | | | | | | | | |
Gross expenses | | | 0.76 | % | | | 0.77 | % | | | 0.77 | % | | | 0.77 | % | | | 0.79 | % | | | 0.79 | % |
Net expenses | | | 0.60 | % | | | 0.60 | % | | | 0.60 | % | | | 0.60 | % | | | 0.60 | % | | | 0.60 | % |
Net investment income | | | 1.66 | % | | | 1.90 | % | | | 2.14 | % | | | 2.72 | % | | | 2.77 | % | | | 2.91 | % |
Supplemental data | | | | | | | | | | | | | | | | | | | | | | | | |
Portfolio turnover rate | | | 16 | % | | | 31 | % | | | 32 | % | | | 56 | % | | | 54 | % | | | 34 | % |
Net assets, end of period (000s omitted) | | | $586,204 | | | | $550,156 | | | | $388,872 | | | | $269,980 | | | | $209,794 | | | | $184,246 | |
| 1. | Returns for periods of less than one year are not annualized. |
The accompanying notes are an integral part of these financial statements.
| | | | | | |
| Financial highlights | | Wells Fargo Advantage California Limited-Term Tax-Free Fund | | | 31 | |
(For a share outstanding throughout the period)
| | | | |
| | | Period ended
December 31, 2014 (unaudited)1 | |
| INSTITUTIONAL CLASS | |
Net asset value, beginning of period | | | $10.75 | |
Net investment income | | | 0.03 | |
Net realized and unrealized gains (losses) on investments | | | (0.03 | ) |
| | | | |
Total from investment operations | | | 0.00 | |
Distributions to shareholders from | | | | |
Net investment income | | | (0.03 | ) |
Net asset value, end of period | | | $10.72 | |
Total return2 | | | 0.00 | % |
Ratios to average net assets (annualized) | | | | |
Gross expenses | | | 0.50 | % |
Net expenses | | | 0.50 | % |
Net investment income | | | 1.71 | % |
Supplemental data | | | | |
Portfolio turnover rate | | | 16 | % |
Net assets, end of period (000s omitted) | | | $80,121 | |
| 1. | For the period from October 31, 2014 (commencement of class operations) to December 31, 2014 |
| 2. | Returns for periods of less than one year are not annualized. |
The accompanying notes are an integral part of these financial statements.
| | | | |
| 32 | | Wells Fargo Advantage California Limited-Term Tax-Free Fund | | Notes to financial statements (unaudited) |
1. ORGANIZATION
Wells Fargo Funds Trust (the “Trust”), a Delaware statutory trust organized on March 10, 1999, is an open-end management investment company registered under the Investment Company Act of 1940, as amended (the “1940 Act”). As an investment company, the Trust follows the accounting and reporting guidance in FASB Accounting Standards Codification 946. These financial statements report on the Wells Fargo Advantage California Limited-Term Tax-Free Fund (the “Fund”), a series of the Trust. Originally classified as non-diversified, the Fund now is classified as a diversified open-end management investment company.
2. SIGNIFICANT ACCOUNTING POLICIES
The following significant accounting policies, which are consistently followed in the preparation of the financial statements of the Fund, are in conformity with U.S. generally accepted accounting principles which require management to make estimates and assumptions that affect the reported amounts of assets and liabilities, disclosure of contingent assets and liabilities at the date of the financial statements, and the reported amounts of revenues and expenses during the reporting period. Actual results could differ from those estimates.
Securities valuation
All investments are valued each business day as of the close of regular trading on the New York Stock Exchange (generally 4 p.m. Eastern Time).
Fixed income securities acquired with maturities exceeding 60 days are valued based on evaluated bid prices provided by an independent pricing service which may utilize both transaction data and market information such as yield, quality, coupon rate, maturity, type of issue, trading characteristics and other market data. If prices are not available from the independent pricing service or prices received are deemed not representative of market value, prices will be obtained from an independent broker-dealer.
Short-term securities, with maturities of 60 days or less at time of purchase, generally are valued at amortized cost which approximates fair value. The amortized cost method involves valuing a security at its cost, plus accretion of discount or minus amortization of premium over the period until maturity.
Investments in registered open-end investment companies are valued at net asset value.
Investments which are not valued using any of the methods discussed above are valued at their fair value, as determined in good faith by the Board of Trustees of the Fund. The Board of Trustees has established a Valuation Committee comprised of the Trustees and has delegated to it the authority to take any actions regarding the valuation of portfolio securities that the Valuation Committee deems necessary or appropriate, including determining the fair value of portfolio securities, unless the determination has been delegated to the Management Valuation Team of Wells Fargo Funds Management, LLC (“Funds Management”). The Board of Trustees retains the authority to make or ratify any valuation decisions or approve any changes to the Valuation Procedures as it deems appropriate. On a quarterly basis, the Board of Trustees receives reports on any valuation actions taken by the Valuation Committee or the Management Valuation Team which may include items for ratification.
Valuations of fair valued securities are compared to the next actual sales price when available, or other appropriate market values, to assess the continued appropriateness of the fair valuation methodologies used. These securities are fair valued on a day-to-day basis, taking into consideration changes to appropriate market information and any significant changes to the inputs considered in the valuation process until there is a readily available price provided on an exchange or by an independent pricing service. Valuations received from an independent pricing service or independent broker-dealer quotes are periodically validated by comparisons to most recent trades and valuations provided by other independent pricing services in addition to the review of prices by the adviser and/or subadviser. Unobservable inputs used in determining fair valuations are identified based on the type of security, taking into consideration factors utilized by market participants in valuing the investment, knowledge about the issuer and the current market environment.
When-issued transactions
The Fund may purchase securities on a forward commitment or when-issued basis. The Fund records a when-issued transaction on the trade date and will segregate assets in an amount at least equal in value to the Fund’s commitment to purchase when-issued securities. Securities purchased on a when-issued basis are marked-to-market daily and the Fund begins earning interest on the settlement date. Losses may arise due to changes in the market value of the underlying securities or if the counterparty does not perform under the contract.
Security transactions and income recognition
Securities transactions are recorded on a trade date basis. Realized gains or losses are recorded on the basis of identified cost.
| | | | | | |
| Notes to financial statements (unaudited) | | Wells Fargo Advantage California Limited-Term Tax-Free Fund | | | 33 | |
Interest income is accrued daily and bond discounts are accreted and premiums are amortized daily based on the effective interest method. To the extent debt obligations are placed on non-accrual status, any related interest income may be reduced by writing off interest receivables when the collection of all or a portion of interest has become doubtful based on consistently applied procedures. If the issuer subsequently resumes interest payments or when the collectability of interest is reasonably assured, the debt obligation is removed from non-accrual status.
Distributions to shareholders
Distributions to shareholders from net investment income are accrued daily and paid monthly. Distributions from net realized gains, if any, are recorded on the ex-dividend date. Such distributions are determined in conformity with federal income tax regulations, which may differ in amount or character from net investment income and realized gains recognized for purposes of U.S. generally accepted accounting principles.
Federal and other taxes
The Fund intends to continue to qualify as a regulated investment company by distributing substantially all of its investment company taxable and tax-exempt income and any net realized capital gains (after reduction for capital loss carryforwards) sufficient to relieve it from all, or substantially all, federal income taxes. Accordingly, no provision for federal income taxes was required.
The Fund’s income and federal excise tax returns and all financial records supporting those returns for the prior three fiscal years are subject to examination by the federal and Delaware revenue authorities. Management has analyzed the Fund’s tax positions taken on federal, state, and foreign tax returns for all open tax years and does not believe that there are any uncertain tax positions that require recognition of a tax liability.
As of June 30, 2014, capital loss carryforwards available to offset future net realized capital gains were as follows through the indicated expiration dates:
| | | | | | |
| 2018 | | 2019 | | No expiration |
| | | Short-term | | Long-term |
| $1,039,204 | | $110,356 | | $45,113 | | $117,412 |
As of June 30, 2014, the Fund had $162,466 of current year deferred post-October capital losses which were recognized on the first day of the current fiscal year.
Class allocations
The separate classes of shares offered by the Fund differ principally in applicable sales charges, distribution, shareholder servicing, and administration fees. Class specific expenses are charged directly to that share class. Investment income, common expenses, and realized and unrealized gains (losses) on investments are allocated daily to each class of shares based on the relative proportion of net assets of each class.
3. FAIR VALUATION MEASUREMENTS
Fair value measurements of investments are determined within a framework that has established a fair value hierarchy based upon the various data inputs utilized in determining the value of the Fund’s investments. The three-level hierarchy gives the highest priority to unadjusted quoted prices in active markets for identical assets or liabilities (Level 1) and the lowest priority to significant unobservable inputs (Level 3). The Fund’s investments are classified within the fair value hierarchy based on the lowest level of input that is significant to the fair value measurement. The inputs are summarized into three broad levels as follows:
| n | | Level 1 – quoted prices in active markets for identical securities |
| n | | Level 2 – other significant observable inputs (including quoted prices for similar securities, interest rates, prepayment speeds, credit risk, use of amortized cost, etc.) |
| n | | Level 3 – significant unobservable inputs (including the Fund’s own assumptions in determining the fair value of investments) |
The inputs or methodologies used for valuing investments in securities are not necessarily an indication of the risk associated with investing in those securities.
| | | | |
| 34 | | Wells Fargo Advantage California Limited-Term Tax-Free Fund | | Notes to financial statements (unaudited) |
The following is a summary of the inputs used in valuing the Fund’s assets and liabilities as of December 31, 2014:
| | | | | | | | | | | | | | | | |
| | | Quoted prices
(Level 1) | | | Other significant
observable inputs
(Level 2) | | | Significant
unobservable inputs
(Level 3) | | | Total | |
Assets | | | | | | | | | | | | | | | | |
Investments in: | | | | | | | | | | | | | | | | |
| | | | |
Municipal obligations | | $ | 0 | | | $ | 878,770,368 | | | $ | 0 | | | $ | 878,770,368 | |
| | | | |
Other | | | 0 | | | | 2,498,000 | | | | 0 | | | | 2,498,000 | |
| | | | |
Short-term investments | | | | | | | | | | | | | | | | |
Investment companies | | | 44,135,521 | | | | 0 | | | | 0 | | | | 44,135,521 | |
Total assets | | $ | 44,135,521 | | | $ | 881,268,368 | | | $ | 0 | | | $ | 925,403,889 | |
Transfers in and transfers out are recognized at the end of the reporting period. At December 31, 2014, the Fund did not have any transfers into/out of Level 1, Level 2, or Level 3.
4. TRANSACTIONS WITH AFFILIATES
Advisory fee
The Trust has entered into an advisory contract with Funds Management, an indirect wholly owned subsidiary of Wells Fargo & Company (“Wells Fargo”). The adviser is responsible for implementing investment policies and guidelines and for supervising the subadviser, who is responsible for day-to-day portfolio management of the Fund.
Pursuant to the contract, Funds Management is entitled to receive an annual advisory fee starting at 0.35% and declining to 0.25% as the average daily net assets of the Fund increase. For the six months ended December 31, 2014, the advisory fee was equivalent to an annual rate of 0.34% of the Fund’s average daily net assets.
Funds Management has retained the services of a subadviser to provide daily portfolio management to the Fund. The fee for subadvisory services is borne by Funds Management. Wells Capital Management Incorporated, an affiliate of Funds Management and an indirect wholly owned subsidiary of Wells Fargo, is the subadviser to the Fund and is entitled to receive a fee from Funds Management at an annual rate starting at 0.15% and declining to 0.05% as the average daily net assets of the Fund increase.
Administration fees
The Trust has entered into an administration agreement with Funds Management. Under this agreement, for providing administrative services, which includes paying fees and expenses for services provided by the transfer agent, sub-transfer agents, omnibus account servicers and record-keepers, Funds Management is entitled to receive from the Fund an annual fund level administration fee starting at 0.05% and declining to 0.03% as the average daily net assets of the Fund increase and a class level administration fee which is calculated based on the average daily net assets of each class as follows:
| | | | |
| | | Class level
administration fee | |
Class A, Class C | | | 0.16 | % |
Administrator Class | | | 0.10 | |
Institutional Class | | | 0.08 | |
Funds Management has contractually waived and/or reimbursed advisory and administration fees to the extent necessary to maintain certain net operating expense ratios for the Fund. Waiver of fees and/or reimbursement of expenses by Funds Management were made first from fund level expenses on a proportionate basis and then from class specific expenses. Funds Management has committed through October 31, 2016 to waive fees and/or reimburse expenses to the extent necessary to cap the Fund’s expenses at 0.80% for Class A shares, 1.55% for Class C shares, 0.60% for Administrator Class shares, and 0.50% for Institutional Class shares. After this time, the cap may be increased or the commitment to maintain the cap may be terminated only with the approval of the Board of Trustees.
| | | | | | |
| Notes to financial statements (unaudited) | | Wells Fargo Advantage California Limited-Term Tax-Free Fund | | | 35 | |
Distribution fee
The Trust has adopted a Distribution Plan for Class C shares of the Fund pursuant to Rule 12b-1 under the 1940 Act. A distribution fee is charged to Class C shares and paid to Wells Fargo Funds Distributor, LLC (“Funds Distributor”), the principal underwriter, at an annual rate of 0.75% of the average daily net assets of Class C shares.
In addition, Funds Distributor is entitled to receive the front-end sales charge from the purchase of Class A shares and a contingent deferred sales charge on the redemption of certain shares. Funds Distributor is also entitled to receive the contingent deferred sales charges from redemptions of Class C shares. For the six months ended December 31, 2014, Funds Distributor received $2,723 from the sale of Class A shares.
Shareholder servicing fees
The Trust has entered into contracts with one or more shareholder servicing agents, whereby Class A, Class C, and Administrator Class of the Fund is charged a fee at an annual rate of 0.25% of the average daily net assets of each respective class.
A portion of these total shareholder servicing fees were paid to affiliates of Wells Fargo.
5. INVESTMENT PORTFOLIO TRANSACTIONS
Purchases and sales of investments, excluding U.S. government obligations (if any) and short-term securities, for the six months ended December 31, 2014 were $219,426,203 and $125,394,774, respectively.
6. BANK BORROWINGS
The Trust (excluding the money market funds and certain other funds in the Trust) and Wells Fargo Variable Trust are parties to a $150,000,000 revolving credit agreement, whereby the Fund is permitted to use bank borrowings for temporary or emergency purposes, such as to fund shareholder redemption requests. Interest under the credit agreement is charged to the Fund based on a borrowing rate equal to the higher of the Federal Funds rate in effect on that day plus 1.25% or the overnight LIBOR rate in effect on that day plus 1.25%. In addition, an annual commitment fee equal to 0.10% of the unused balance is allocated to each participating fund. For the six months ended December 31, 2014, the Fund paid $432 in commitment fees.
For the six months ended December 31, 2014, there were no borrowings by the Fund under the agreement.
7. CONCENTRATION RISK
The Fund invests a substantial portion of its assets in issuers of municipal debt securities located in a single state or territories of the U.S. Therefore, it may be more affected by economic and political developments in that state or region than would be a comparable general tax-exempt fund.
8. INDEMNIFICATION
Under the Trust’s organizational documents, the officers and Trustees are indemnified against certain liabilities that may arise out of performance of their duties to the Trust. Additionally, in the normal course of business, the Trust may enter into contracts with service providers that contain a variety of indemnification clauses. The Trust’s maximum exposure under these arrangements is dependent on future claims that may be made against the Fund and, therefore, cannot be estimated.
| | | | |
| 36 | | Wells Fargo Advantage California Limited-Term Tax-Free Fund | | Other information (unaudited) |
PROXY VOTING INFORMATION
A description of the policies and procedures that the Fund uses to determine how to vote proxies relating to portfolio securities is available without charge, upon request, by calling 1-800-222-8222, visiting our website at wellsfargoadvantagefunds.com, or visiting the SEC website at sec.gov. Information regarding how the Fund voted proxies relating to portfolio securities during the most recent 12-month period ended June 30 is available on the Fund’s website at wellsfargoadvantagefunds.com or by visiting the SEC website at sec.gov.
PORTFOLIO HOLDINGS INFORMATION
The complete portfolio holdings for the Fund are publicly available monthly on the Fund’s website (wellsfargoadvantagefunds.com), on a one-month delayed basis. In addition, top ten holdings information (excluding derivative positions) for the Fund is publicly available on the Fund’s website on a monthly, seven-day or more delayed basis. The Fund files its complete schedule of portfolio holdings with the SEC for the first and third quarters of each fiscal year on Form N-Q, which is available by visiting the SEC website at sec.gov. In addition, the Fund’s Form N-Q may be reviewed and copied at the SEC’s Public Reference Room in Washington, DC, and at regional offices in New York City, at 233 Broadway, and in Chicago, at 175 West Jackson Boulevard, Suite 900. Information about the Public Reference Room may be obtained by calling 1-800-SEC-0330.
| | | | | | |
| Other information (unaudited) | | Wells Fargo Advantage California Limited-Term Tax-Free Fund | | | 37 | |
BOARD OF TRUSTEES AND OFFICERS
Each of the Trustees and Officers1 listed in the table below acts in identical capacities for each fund in the Wells Fargo Advantage family of funds, which consists of 134 mutual funds comprising the Wells Fargo Funds Trust, Wells Fargo Variable Trust, Wells Fargo Master Trust and four closed-end funds (collectively the “Fund Complex”). This table should be read in conjunction with the Prospectus and the Statement of Additional Information2. The mailing address of each Trustee and Officer is 525 Market Street, 12th Floor, San Francisco, CA 94105. Each Trustee and Officer serves an indefinite term, however, each Trustee serves such term until reaching the mandatory retirement age established by the Trustees.
Independent Trustees
| | | | | | |
Name and
year of birth | | Position held and
length of service* | | Principal occupations during past five years or longer | | Other
directorships during
past five years |
Peter G. Gordon (Born 1942) | | Trustee, since 1998; Chairman, since 2005 | | Co-Founder, Retired Chairman, President and CEO of Crystal Geyser Water Company. Trustee Emeritus, Colby College. | | Asset Allocation Trust |
Isaiah Harris, Jr. (Born 1952) | | Trustee, since 2009 | | Retired. Prior thereto, President and CEO of BellSouth Advertising and Publishing Corp. from 2005 to 2007, President and CEO of BellSouth Enterprises from 2004 to 2005 and President of BellSouth Consumer Services from 2000 to 2003. Emeritus member of the Iowa State University Foundation Board of Governors. Emeritus Member of the Advisory Board of Iowa State University School of Business. Advisory Board Member, Palm Harbor Academy. Mr. Harris is a certified public accountant. | | CIGNA Corporation; Asset Allocation Trust |
Judith M. Johnson (Born 1949) | | Trustee, since 2008; Audit Committee Chairman, since 2008 | | Retired. Prior thereto, Chief Executive Officer and Chief Investment Officer of Minneapolis Employees Retirement Fund from 1996 to 2008. Ms. Johnson is an attorney, certified public accountant and a certified managerial accountant. | | Asset Allocation Trust |
Leroy Keith, Jr. (Born 1939) | | Trustee, since 2010** | | Chairman, Bloc Global Services (development and construction). Trustee of the Evergreen Funds complex (and its predecessors) from 1983 to 2010. Former Managing Director, Almanac Capital Management (commodities firm), former Partner, Stonington Partners, Inc. (private equity fund), former Director, Obagi Medical Products Co. and former Director, Lincoln Educational Services. | | Trustee, Virtus Fund Complex (consisting of 50 portfolios as of 12/16/2013); Asset Allocation Trust |
David F. Larcker (Born 1950) | | Trustee, since 2009 | | James Irvin Miller Professor of Accounting at the Graduate School of Business, Stanford University, Morgan Stanley Director of the Center for Leadership Development and Research and Senior Faculty of The Rock Center for Corporate Governance since 2006. From 2005 to 2008, Professor of Accounting at the Graduate School of Business, Stanford University. Prior thereto, Ernst & Young Professor of Accounting at The Wharton School, University of Pennsylvania from 1985 to 2005. | | Asset Allocation Trust |
Olivia S. Mitchell (Born 1953) | | Trustee, since 2006 | | International Foundation of Employee Benefit Plans Professor, Wharton School of the University of Pennsylvania since 1993. Director of Wharton’s Pension Research Council and Boettner Center on Pensions & Retirement Research, and Research Associate at the National Bureau of Economic Research. Previously, Cornell University Professor from 1978 to 1993. | | Asset Allocation Trust |
Timothy J. Penny (Born 1951) | | Trustee, since 1996 | | President and CEO of Southern Minnesota Initiative Foundation, a non-profit organization, since 2007 and Senior Fellow at the Humphrey Institute Policy Forum at the University of Minnesota since 1995. Member of the Board of Trustees of NorthStar Education Finance, Inc., a non-profit organization, since 2007. | | Asset Allocation Trust |
| | | | |
| 38 | | Wells Fargo Advantage California Limited-Term Tax-Free Fund | | Other information (unaudited) |
| | | | | | |
Name and
year of birth | | Position held and
length of service* | | Principal occupations during past five years or longer | | Other
directorships during
past five years |
Michael S. Scofield (Born 1943) | | Trustee, since 2010 | | Served on the Investment Company Institute’s Board of Governors and Executive Committee from 2008-2011 as well the Governing Council of the Independent Directors Council from 2006-2011 and the Independent Directors Council Executive Committee from 2008-2011. Chairman of the IDC from 2008-2010. Institutional Investor (Fund Directions) Trustee of Year in 2007. Trustee of the Evergreen Funds complex (and its predecessors) from 1984 to 2010. Chairman of the Evergreen Funds from 2000-2010. Former Trustee of the Mentor Funds. Retired Attorney, Law Offices of Michael S. Scofield. | | Asset Allocation Trust |
Donald C. Willeke (Born 1940) | | Trustee, since 1996 | | Principal of the law firm of Willeke & Daniels. General Counsel of the Minneapolis Employees Retirement Fund from 1984 until its consolidation into the Minnesota Public Employees Retirement Association on June 30, 2010. Director and Vice Chair of The Tree Trust (non-profit corporation). Director of the American Chestnut Foundation (non-profit corporation). | | Asset Allocation Trust |
| * | Length of service dates reflect the Trustee’s commencement of service with the Trust’s predecessor entities, where applicable. |
| ** | Leroy Keith, Jr. retired as a Trustee effective December 31, 2014. |
Officers
| | | | | | |
Name and
year of birth | | Position held and
length of service | | Principal occupations during past five years or longer | | |
Karla M. Rabusch (Born 1959) | | President, since 2003 | | Executive Vice President of Wells Fargo Bank, N.A. and President of Wells Fargo Funds Management, LLC since 2003. | | |
Nancy Wiser1
(Born 1967) | | Treasurer, since 2012 | | Executive Vice President of Wells Fargo Funds Management, LLC since 2011. Chief Operating Officer and Chief Compliance Officer at LightBox Capital Management LLC, from 2008 to 2011. Owned and operated a consulting business providing services to various hedge funds including acting as Chief Operating Officer and Chief Compliance Officer for a hedge fund from 2007 to 2008. Chief Operating Officer and Chief Compliance Officer of GMN Capital LLC from 2006 to 2007. | | |
C. David Messman (Born 1960) | | Secretary, since 2000; Chief Legal Officer, since 2003 | | Assistant General Counsel of Wells Fargo Bank, N.A. since 2013 and Vice President and Managing Counsel of Wells Fargo Bank N.A. from 1996 to 2013. Senior Vice President and Secretary of Wells Fargo Funds Management, LLC since 2001. | | |
Debra Ann Early
(Born 1964) | | Chief Compliance Officer, since 2007 | | Senior Vice President of Wells Fargo Funds Management, LLC since 2007 and Chief Compliance Officer from 2007 to 2014. Chief Compliance Officer of Parnassus Investments from 2005 to 2007. Chief Financial Officer of Parnassus Investments from 2004 to 2007 and Senior Audit Manager of PricewaterhouseCoopers LLP from 1998 to 2004. | | |
David Berardi
(Born 1975) | | Assistant Treasurer, since 2009 | | Vice President of Wells Fargo Funds Management, LLC since 2009. Vice President of Evergreen Investment Management Company, LLC from 2008 to 2010. Assistant Vice President of Evergreen Investment Services, Inc. from 2004 to 2008. Manager of Fund Reporting and Control for Evergreen Investment Management Company, LLC from 2004 to 2010. | | |
Jeremy DePalma1 (Born 1974) | | Assistant Treasurer, since 2009 | | Senior Vice President of Wells Fargo Funds Management, LLC since 2009. Senior Vice President of Evergreen Investment Management Company, LLC from 2008 to 2010. Vice President, Evergreen Investment Services, Inc. from 2004 to 2007. Head of the Fund Reporting and Control Team within Fund Administration from 2005 to 2010. | | |
| 1. | Nancy Wiser acts as Treasurer of 73 funds in the Fund Complex. Jeremy DePalma acts as Treasurer of 61 funds and Assistant Treasurer of 73 funds in the Fund Complex. |
| 2. | The Statement of Additional Information includes additional information about the Trustees and is available, without charge, upon request, by calling 1-800-222-8222 or by visiting the website at wellsfargoadvantagefunds.com. |
| | | | | | |
| List of abbreviations | | Wells Fargo Advantage California Limited-Term Tax-Free Fund | | | 39 | |
The following is a list of common abbreviations for terms and entities that may have appeared in this report.
| ACA | — ACA Financial Guaranty Corporation |
| ADR | — American depositary receipt |
| ADS | — American depositary shares |
| AGC | — Assured Guaranty Corporation |
| AGM | — Assured Guaranty Municipal |
| Ambac | — Ambac Financial Group Incorporated |
| AMT | — Alternative minimum tax |
| BAN | — Bond anticipation notes |
| BHAC | — Berkshire Hathaway Assurance Corporation |
| CAB | — Capital appreciation bond |
| CCAB | — Convertible capital appreciation bond |
| CDA | — Community Development Authority |
| CDO | — Collateralized debt obligation |
| DRIVER | — Derivative inverse tax-exempt receipts |
| DW&P | — Department of Water & Power |
| DWR | — Department of Water Resources |
| ECFA | — Educational & Cultural Facilities Authority |
| EDA | — Economic Development Authority |
| EDFA | — Economic Development Finance Authority |
| ETF | — Exchange-traded fund |
| FDIC | — Federal Deposit Insurance Corporation |
| FFCB | — Federal Farm Credit Banks |
| FGIC | — Financial Guaranty Insurance Corporation |
| FHA | — Federal Housing Administration |
| FHLB | — Federal Home Loan Bank |
| FHLMC | — Federal Home Loan Mortgage Corporation |
| FICO | — The Financing Corporation |
| FNMA | — Federal National Mortgage Association |
| GDR | — Global depositary receipt |
| GNMA | — Government National Mortgage Association |
| HCFR | — Healthcare facilities revenue |
| HEFA | — Health & Educational Facilities Authority |
| HEFAR | — Higher education facilities authority revenue |
| HFA | — Housing Finance Authority |
| HFFA | — Health Facilities Financing Authority |
| HUD | — Department of Housing and Urban Development |
| IDA | — Industrial Development Authority |
| IDAG | — Industrial Development Agency |
| KRW | — Republic of Korea won |
| LIBOR | — London Interbank Offered Rate |
| LLC | — Limited liability company |
| LLLP | — Limited liability limited partnership |
| LLP | — Limited liability partnership |
| MBIA | — Municipal Bond Insurance Association |
| MFHR | — Multifamily housing revenue |
| MSTR | — Municipal securities trust receipts |
| MUD | — Municipal Utility District |
| National | — National Public Finance Guarantee Corporation |
| PCFA | — Pollution Control Financing Authority |
| PCL | — Public Company Limited |
| PCR | — Pollution control revenue |
| PFA | — Public Finance Authority |
| PFFA | — Public Facilities Financing Authority |
| PFOTER | — Puttable floating option tax-exempt receipts |
| plc | — Public limited company |
| PUTTER | — Puttable tax-exempt receipts |
| R&D | — Research & development |
| Radian | — Radian Asset Assurance |
| RAN | — Revenue anticipation notes |
| RDA | — Redevelopment Authority |
| RDFA | — Redevelopment Finance Authority |
| REIT | — Real estate investment trust |
| ROC | — Reset option certificates |
| SAVRS | — Select auction variable rate securities |
| SBA | — Small Business Authority |
| SFHR | — Single-family housing revenue |
| SFMR | — Single-family mortgage revenue |
| SPA | — Standby purchase agreement |
| SPDR | — Standard & Poor’s Depositary Receipts |
| STRIPS | — Separate trading of registered interest and |
| TAN | — Tax anticipation notes |
| TIPS | — Treasury inflation-protected securities |
| TRAN | — Tax revenue anticipation notes |
| TTFA | — Transportation Trust Fund Authority |
| TVA | — Tennessee Valley Authority |
This page is intentionally left blank.


For more information
More information about Wells Fargo Advantage Funds is available free upon request. To obtain literature, please write, email, visit the Fund’s website, or call:
Wells Fargo Advantage Funds
P.O. Box 8266
Boston, MA 02266-8266
Email: wfaf@wellsfargo.com
Website: wellsfargoadvantagefunds.com
Individual investors: 1-800-222-8222
Retail investment professionals: 1-888-877-9275
Institutional investment professionals: 1-866-765-0778
This report and the financial statements contained herein are submitted for the general information of the shareholders of Wells Fargo Advantage Funds. If this report is used for promotional purposes, distribution of the report must be accompanied or preceded by a current prospectus. Before investing, please consider the investment objectives, risks, charges, and expenses of the investment. For a current prospectus and, if available, a summary prospectus, containing this information, call 1-800-222-8222 or visit the Fund’s website at wellsfargoadvantagefunds.com. Read the prospectus carefully before you invest or send money.
Wells Fargo Funds Management, LLC, a wholly owned subsidiary of Wells Fargo & Company, provides investment advisory and administrative services for Wells Fargo Advantage Funds. Other affiliates of Wells Fargo & Company provide subadvisory and other services for the Funds. The Funds are distributed by Wells Fargo Funds Distributor, LLC, Member FINRA/SIPC, an affiliate of Wells Fargo & Company.
NOT FDIC INSURED ¡ NO BANK GUARANTEE ¡ MAY LOSE VALUE
© 2014 Wells Fargo Funds Management, LLC. All rights reserved.
| | |
 | | 230421 02-15 SA248/SAR248 12-14 |

Wells Fargo Advantage California Tax-Free Fund

Semi-Annual Report
December 31, 2014

Reduce clutter. Save trees.
Sign up for electronic delivery of prospectuses and shareholder reports at wellsfargo.com/advantagedelivery
Contents
The views expressed and any forward-looking statements are as of December 31, 2014, unless otherwise noted, and are those of the Fund managers and/or Wells Fargo Funds Management, LLC. Discussions of individual securities, or the markets generally, or any Wells Fargo Advantage Fund are not intended as individual recommendations. Future events or results may vary significantly from those expressed in any forward-looking statements; the views expressed are subject to change at any time in response to changing circumstances in the market. Wells Fargo Funds Management, LLC and the Fund disclaim any obligation to publicly update or revise any views expressed or forward-looking statements.
NOT FDIC INSURED ¡ NO BANK GUARANTEE ¡ MAY LOSE VALUE
| | | | |
| 2 | | Wells Fargo Advantage California Tax-Free Fund | | Letter to shareholders (unaudited) |

Karla M. Rabusch
President
Wells Fargo Advantage Funds
Municipal bonds rose in the second half of 2014, helped by lower interest rates and strong demand for yield.
Dear Valued Shareholder:
We are pleased to provide you with this semi-annual report for the Wells Fargo Advantage California Tax-Free Fund for the six-month period that ended December 31, 2014. Municipal bonds rose in the second half of 2014, helped by lower interest rates and strong demand for yield. In fact, the longest-dated and weakest credits had the strongest returns. Municipal bond returns—as measured by the Barclays Municipal Bond Index1, the broadest measure for tracking investment-grade municipal bonds throughout the country—gained 2.88% for the six-month period that ended December 31, 2014.
Longer-maturity and lower-rated municipal bonds outperformed.
At the front end of the yield curve, municipal bond yields were extremely low because of the accommodative monetary policy. Throughout the reporting period, the U.S. Federal Reserve’s (Fed’s) monetary policymaking body kept its key interest rate near zero in order to support the economy and the financial system. Policymakers said they can be patient in normalizing monetary policy and that any increases in the target range for the federal funds rate will depend on incoming economic data. During the reporting period, the Fed reduced (or tapered) the size of its quantitative easing program each month until the program ended in October 2014, although it continues to reinvest principal and interest payments of the mortgage-backed securities and Treasury bonds it holds.
Longer-term yields declined during the second half of the year, with 10-year municipal yields declining from 2.33% as of June 30, 2014 to 2.10% as of December 31, 2014. For more perspective, the yield curve was steep on a historical basis at the beginning of the period and ended the period with the difference between 30-year and 2-year yields at 237 basis points (bps; 100 bps equals 1.00%), which was only slightly wider than its historical average. Because the yield curve was steep, longer-dated securities had higher yields. Given their longer maturities (as municipal yields fell further out the curve) and their more generous yields, longer-term bond returns outpaced shorter-term bonds.
Investors were also enticed to buy lower-rated securities for their higher yields. Over the six-month period that ended December 31, 2014, AAA-rated municipal bonds returned 2.04% while BBB-rated bonds returned 4.29%, according to the Barclays Municipal Bond Index. Credit conditions continued to improve, as evidenced by an 18th consecutive quarter of positive year-over-year gains in state and local municipal revenues. In addition to better fundamental credit conditions, technical factors of limited supply alongside strong investor demand also supported municipal bonds.
Puerto Rico’s struggle, the exit of two cities from bankruptcy, and pension issues topped credit news.
Puerto Rico was the asset class’s largest single credit story. Bonds from the commonwealth returned a meager 0.79% during the six-month period as population declines, a contracting economy, and a burdensome level of debt held back results. Meanwhile, the cities of Stockton, California, and Detroit, Michigan, exited bankruptcy by curbing retiree health care benefits and bondholder recoveries but largely avoiding concessions on pensions. While these recent bankruptcies have so far treated pensions better than bonded debt, no clear precedent has been established due to the difference in general obligation
| 1. | The Barclays Municipal Bond Index is an unmanaged index composed of long-term tax-exempt bonds with a minimum credit rating of Baa. You cannot invest directly in an index. |
| | | | | | |
| Letter to shareholders (unaudited) | | Wells Fargo Advantage California Tax-Free Fund | | | 3 | |
pledges and court-ordered versus negotiated concessions. Finally, underfunded pensions in Illinois, New Jersey, Pennsylvania, and Kansas gained attention for their negative fiscal effects and the political difficulties of finding a resolution.
Don’t let short-term uncertainty derail long-term investment goals.
Periods of uncertainty can present challenges, but experience has taught us that maintaining long-term investment goals can be an effective way to plan for the future. To help you create a sound strategy based on your personal goals and risk tolerance, Wells Fargo Advantage Funds offers more than 100 mutual funds and other investments spanning a wide range of asset classes and investment styles. Although diversification cannot guarantee an investment profit or prevent losses, we believe it can be an effective way to manage investment risk and potentially smooth out overall portfolio performance. We encourage investors to know their investments and to understand that appropriate levels of risk-taking may unlock opportunities.
Thank you for choosing to invest with Wells Fargo Advantage Funds. We appreciate your confidence in us and remain committed to helping you meet your financial needs. For current information about your fund investments, contact your investment professional, visit our website at wellsfargoadvantagefunds.com, or call us directly at 1-800-222-8222. We are available 24 hours a day, 7 days a week.
Sincerely,

Karla M. Rabusch
President
Wells Fargo Advantage Funds
Periods of uncertainty can present challenges, but experience has taught us that maintaining long-term investment goals can be an effective way to plan for the future.
| | | | |
| 4 | | Wells Fargo Advantage California Tax-Free Fund | | Performance highlights (unaudited) |
Investment objective
The Fund seeks current income exempt from federal income tax and California individual income tax.
Adviser
Wells Fargo Funds Management, LLC
Subadviser
Wells Capital Management Incorporated
Portfolio managers
Terry J. Goode
Robert J. Miller
Adrian Van Poppel
Average annual total returns1 (%) as of December 31, 2014
| | | | | | | | | | | | | | | | | | | | | | | | | | | | | | | | | | |
| | | | | Including sales charge | | | Excluding sales charge | | | Expense ratios2 (%) | |
| | | Inception date | | 1 year | | | 5 year | | | 10 year | | | 1 year | | | 5 year | | | 10 year | | | Gross | | | Net3 | |
| Class A (SCTAX) | | 10-6-1988 | | | 6.78 | | | | 5.59 | | | | 4.54 | | | | 11.78 | | | | 6.57 | | | | 5.02 | | | | 0.83 | | | | 0.75 | |
| Class B (SGCBX)* | | 12-15-1997 | | | 5.87 | | | | 5.44 | | | | 4.48 | | | | 10.87 | | | | 5.76 | | | | 4.48 | | | | 1.58 | | | | 1.50 | |
| Class C (SCTCX) | | 7-1-1993 | | | 9.88 | | | | 5.76 | | | | 4.21 | | | | 10.88 | | | | 5.76 | | | | 4.21 | | | | 1.58 | | | | 1.50 | |
| Administrator Class (SGCAX) | | 12-15-1997 | | | – | | | | – | | | | – | | | | 11.89 | | | | 6.76 | | | | 5.25 | | | | 0.77 | | | | 0.55 | |
| Institutional Class (SGTIX) | | 10-31-2014 | | | – | | | | – | | | | – | | | | 11.88 | | | | 6.76 | | | | 5.25 | | | | 0.50 | | | | 0.48 | |
| Barclays Municipal Bond Index4 | | – | | | – | | | | – | | | | – | | | | 9.05 | | | | 5.16 | | | | 4.74 | | | | – | | | | – | |
| Barclays California Municipal Bond Index5 | | – | | | – | | | | – | | | | – | | | | 9.96 | | | | 6.20 | | | | 5.04 | | | | – | | | | – | |
| * | | Class B shares are closed to investment, except in connection with the reinvestment of any distributions and permitted exchanges. |
Figures quoted represent past performance, which is no guarantee of future results, and do not reflect taxes that a shareholder may pay on fund distributions or the redemption of fund shares. Investment return and principal value of an investment will fluctuate so that an investor’s shares, when redeemed, may be worth more or less than their original cost. Performance shown without sales charges would be lower if sales charges were reflected. Current performance may be lower or higher than the performance data quoted, which assumes the reinvestment of dividends and capital gains. Current month-end performance is available on the Fund’s website, wellsfargoadvantagefunds.com.
Index returns do not include transaction costs associated with buying and selling securities, any mutual fund fees or expenses, or any taxes. It is not possible to invest directly in an index.
For Class A shares, the maximum front-end sales charge is 4.50%. For Class B shares, the maximum contingent deferred sales charge is 5.00%. For Class C shares, the maximum contingent deferred sales charge is 1.00%. Performance including a contingent deferred sales charge assumes the sales charge for the corresponding time period. Administrator Class and Institutional Class shares are sold without a front-end sales charge or contingent deferred sales charge.
Bond values fluctuate in response to the financial condition of individual issuers, general market and economic conditions, and changes in interest rates. Changes in market conditions and government policies may lead to periods of heightened volatility in the bond market and reduced liquidity for certain bonds held by the Fund. In general, when interest rates rise, bond values fall and investors may lose principal value. Interest-rate changes and their impact on the Fund and its share price can be sudden and unpredictable. The use of derivatives may reduce returns and/or increase volatility. Certain investment strategies tend to increase the total risk of an investment (relative to the broader market). The Fund is exposed to California municipal securities risk, high-yield securities risk, and nondiversification risk. Consult the Fund’s prospectus for additional information on these and other risks. A portion of the Fund’s income may be subject to federal, state, and/or local income taxes or the alternative minimum tax (AMT). Any capital gains distributions may be taxable.
Please see footnotes on page 5.
| | | | | | |
| Performance highlights (unaudited) | | Wells Fargo Advantage California Tax-Free Fund | | | 5 | |
|
| Credit quality distribution6 as of December 31, 2014 |
|
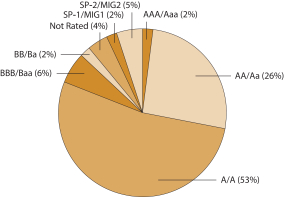 |
|
| Effective maturity distribution7 as of December 31, 2014 |
|
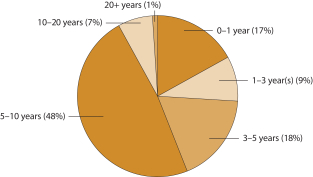 |
| 1. | Historical performance shown for the Institutional Class shares prior to their inception reflects the performance of the Administration Class shares, and is not adjusted to reflect the Institutional Class expenses. If these expenses had been included, returns for the Institutional Class would be higher. |
| 2. | Reflects the expense ratios as stated in the most recent prospectuses. The expense ratios shown are subject to change and may differ from the annualized expense ratios shown in the financial highlights of this report. |
| 3. | The Adviser has committed through October 31, 2016, to waive fees and/or reimburse expenses to the extent necessary to cap the Fund’s Total Annual Fund Operating Expenses After Fee Waiver, excluding certain expenses, at the amounts shown. After this time, the cap may be increased or the commitment to maintain the cap may be terminated only with the approval of the Board of Trustees. Brokerage commissions, stamp duty fees, interest, taxes, acquired fund fees and expenses, and extraordinary expenses are excluded from the cap. Without this cap, the Fund’s returns would have been lower. |
| 4. | The Barclays Municipal Bond Index is an unmanaged index composed of long-term tax-exempt bonds with a minimum credit rating of Baa. You cannot invest directly in an index. |
| 5. | The Barclays California Municipal Bond Index is the California component of the Barclays Municipal Bond Index. You cannot invest directly in an index. |
| 6. | The credit quality distribution of portfolio holdings reflected in the chart is based on ratings from Standard & Poor’s, Moody’s Investors Service, and/or Fitch Ratings Ltd. Credit quality ratings apply to the underlying holdings of the Fund and not to the Fund itself. The percentages of the Fund’s portfolio with the ratings depicted in the chart are calculated based on the total market value of fixed income securities held by the Fund. If a security was rated by all three rating agencies, the middle rating was utilized. If rated by two of three rating agencies, the lower rating was utilized, and if rated by one of the rating agencies, that rating was utilized. Standard & Poor’s rates the creditworthiness of bonds, ranging from AAA (highest) to D (lowest). Ratings from A to CCC may be modified by the addition of a plus (+) or minus (-) sign to show relative standing within the rating categories. Standard & Poor’s rates the creditworthiness of short-term notes from SP-1 (highest) to SP-3 (lowest). Moody’s rates the creditworthiness of bonds, ranging from Aaa (highest) to C (lowest). Ratings Aa to B may be modified by the addition of a number 1 (highest) to 3 (lowest) to show relative standing within the ratings categories. Moody’s rates the creditworthiness of short-term U.S. tax-exempt municipal securities from MIG 1/VMIG 1 (highest) to SG (lowest). Fitch rates the creditworthiness of bonds, ranging from AAA (highest) to D (lowest). Credit quality and credit quality ratings are subject to change and may have changed since the date specified. |
| 7. | Effective maturity distribution is calculated based on the total long-term investments of the Fund. It is subject to change and may have changed since the date specified. |
| | | | |
| 6 | | Wells Fargo Advantage California Tax-Free Fund | | Fund expenses (unaudited) |
As a shareholder of the Fund, you incur two types of costs: (1) transaction costs, including sales charges (loads) on purchase payments and contingent deferred sales charges (if any) on redemptions and (2) ongoing costs, including management fees, distribution (12b-1) and/or shareholder service fees, and other Fund expenses. This example is intended to help you understand your ongoing costs (in dollars) of investing in the Fund and to compare these costs with the ongoing costs of investing in other mutual funds.
The example is based on an investment of $1,000 invested at the beginning of the six-month period and held for the entire period from July 1, 2014 to December 31, 2014.
Actual expenses
The “Actual” line of the table below provides information about actual account values and actual expenses. You may use the information in this line, together with the amount you invested, to estimate the expenses that you paid over the period. Simply divide your account value by $1,000 (for example, an $8,600 account value divided by $1,000 = 8.6), then multiply the result by the number in the “Actual” line under the heading entitled “Expenses paid during period” for your applicable class of shares to estimate the expenses you paid on your account during this period.
Hypothetical example for comparison purposes
The “Hypothetical” line of the table below provides information about hypothetical account values and hypothetical expenses based on the Fund’s actual expense ratio and an assumed rate of return of 5% per year before expenses, which is not the Fund’s actual return. The hypothetical account values and expenses may not be used to estimate the actual ending account balance or expenses you paid for the period. You may use this information to compare the ongoing costs of investing in the Fund and other funds. To do so, compare this 5% hypothetical example with the 5% hypothetical examples that appear in the shareholder reports of the other funds.
Please note that the expenses shown in the table are meant to highlight your ongoing costs only and do not reflect any transactional costs, such as sales charges (loads) and contingent deferred sales charges. Therefore, the “Hypothetical” line of the table is useful in comparing ongoing costs only and will not help you determine the relative total costs of owning different funds. In addition, if these transactional costs were included, your costs would have been higher.
| | | | | | | | | | | | | | | | |
| | | Beginning account value 7-1-2014 | | | Ending account value 12-31-2014 | | | Expenses paid during the period1 | | | Net annualized expense ratio | |
Class A | | | | | | | | | | | | | | | | |
Actual | | $ | 1,000.00 | | | $ | 1,039.80 | | | $ | 3.86 | | | | 0.75 | % |
Hypothetical (5% return before expenses) | | $ | 1,000.00 | | | $ | 1,021.42 | | | $ | 3.82 | | | | 0.75 | % |
Class B | | | | | | | | | | | | | | | | |
Actual | | $ | 1,000.00 | | | $ | 1,035.42 | | | $ | 7.70 | | | | 1.50 | % |
Hypothetical (5% return before expenses) | | $ | 1,000.00 | | | $ | 1,017.64 | | | $ | 7.63 | | | | 1.50 | % |
Class C | | | | | | | | | | | | | | | | |
Actual | | $ | 1,000.00 | | | $ | 1,035.44 | | | $ | 7.70 | | | | 1.50 | % |
Hypothetical (5% return before expenses) | | $ | 1,000.00 | | | $ | 1,017.64 | | | $ | 7.63 | | | | 1.50 | % |
Administrator Class | | | | | | | | | | | | | | | | |
Actual | | $ | 1,000.00 | | | $ | 1,040.80 | | | $ | 2.83 | | | | 0.55 | % |
Hypothetical (5% return before expenses) | | $ | 1,000.00 | | | $ | 1,022.43 | | | $ | 2.80 | | | | 0.55 | % |
Institutional Class | | | | | | | | | | | | | | | | |
Actual | | $ | 1,000.00 | | | $ | 1,040.74 | | | $ | 2.47 | | | | 0.48 | % |
Hypothetical (5% return before expenses) | | $ | 1,000.00 | | | $ | 1,022.79 | | | $ | 2.45 | | | | 0.48 | % |
| 1. | Expenses paid is equal to the annualized expense ratio of each class multiplied by the average account value over the period, multiplied by the number of days in the most recent fiscal half-year divided by the number of days in the fiscal year (to reflect the one-half-year period). |
| | | | | | |
| Portfolio of investments—December 31, 2014 (unaudited) | | Wells Fargo Advantage California Tax-Free Fund | | | 7 | |
| | | | | | | | | | | | | | | | |
| Security name | | Interest rate | | | Maturity date | | | Principal | | | Value | |
| | | | |
Municipal Obligations: 97.63% | | | | | | | | | | | | | | | | |
| | | | |
| California: 94.04% | | | | | | | | | | | | | | | | |
ABC California Unified School District CAB Election of 1997 Series B (GO, National Insured) ¤ | | | 0.00 | % | | | 8-1-2018 | | | $ | 1,500,000 | | | $ | 1,432,680 | |
Alameda CA Community Improvement Commission Refunding Bond Sub Series A (Tax Revenue, Build America Mutual Assurance Company Insured) | | | 5.00 | | | | 9-1-2033 | | | | 775,000 | | | | 883,942 | |
Alameda CA Corridor Transportation Authority CAB Sub Lien Series A (Transportation Revenue, Ambac Insured) ¤ | | | 0.00 | | | | 10-1-2018 | | | | 3,895,000 | | | | 3,629,673 | |
Alameda CA Corridor Transportation Authority CAB Sub Lien Series A (Transportation Revenue, Ambac Insured) ¤ | | | 0.00 | | | | 10-1-2019 | | | | 3,000,000 | | | | 2,701,950 | |
Alameda CA Corridor Transportation Authority CAB Sub Lien Series A (Transportation Revenue, Ambac Insured) | | | 5.25 | | | | 10-1-2021 | | | | 3,000,000 | | | | 3,260,580 | |
Alameda CA Joint Powers Authority Multiple Capital Projects Series A (Miscellaneous Revenue) | | | 5.00 | | | | 12-1-2034 | | | | 1,005,000 | | | | 1,149,368 | |
Alhambra CA Unified School District Election of 2008 Series B (GO, AGM Insured) | | | 6.00 | | | | 8-1-2029 | | | | 4,100,000 | | | | 5,066,903 | |
Alisal CA Unified School District CAB Election of 2006 Series A (GO, AGM Insured) ¤ | | | 0.00 | | | | 8-1-2017 | | | | 1,105,000 | | | | 1,064,292 | |
Alvord CA Unified School District Election of 2012 Series A (GO, AGM Insured) | | | 5.25 | | | | 8-1-2037 | | | | 1,620,000 | | | | 1,860,943 | |
Anaheim CA PFA Anaheim Convention Center Expansion Project Series A (Miscellaneous Revenue) | | | 5.00 | | | | 5-1-2039 | | | | 3,000,000 | | | | 3,350,460 | |
Anaheim CA PFA CAB Sub Lien Public Improvements Project Series C (Miscellaneous Revenue, AGM Insured) ¤ | | | 0.00 | | | | 9-1-2018 | | | | 4,455,000 | | | | 4,246,595 | |
Anaheim CA PFA CAB Sub Lien Public Improvements Project Series C (Miscellaneous Revenue, AGM Insured) ¤ | | | 0.00 | | | | 9-1-2025 | | | | 10,000,000 | | | | 7,139,900 | |
Anaheim CA PFA Series A (Lease Revenue) | | | 5.00 | | | | 5-1-2046 | | | | 3,000,000 | | | | 3,302,610 | |
Antelope Valley CA Health Care District Series A (Health Revenue, AGM Insured) | | | 5.20 | | | | 1-1-2017 | | | | 945,000 | | | | 948,865 | |
Bassett CA Unified School District Refunding Bond Series B (GO, Build America Mutual Assurance Company Insured) %% | | | 5.00 | | | | 8-1-2027 | | | | 1,050,000 | | | | 1,216,446 | |
Bay Area CA Toll Authority Toll Bridge Revenue Series A (Transportation Revenue) ± | | | 1.29 | | | | 4-1-2036 | | | | 2,000,000 | | | | 2,046,420 | |
Bay Area CA Toll Authority Toll Bridge Revenue Series S-4 (Transportation Revenue) | | | 5.00 | | | | 4-1-2030 | | | | 2,000,000 | | | | 2,331,660 | |
Bay Area CA Water Supply & Conservation Agency Series A (Water & Sewer Revenue) | | | 5.00 | | | | 10-1-2034 | | | | 6,000,000 | | | | 6,970,920 | |
Belmont CA Community Facilities Special Tax District #2000-1 Library Project Series A (Tax Revenue, Ambac Insured) | | | 5.75 | | | | 8-1-2030 | | | | 3,190,000 | | | | 4,214,405 | |
Brea CA PFA Tax Allocation Series A (Housing Revenue) | | | 7.00 | | | | 9-1-2023 | | | | 1,000,000 | | | | 1,120,010 | |
Buena Park CA School District Election of 2014 Series A (GO) | | | 5.00 | | | | 8-1-2040 | | | | 2,500,000 | | | | 2,868,800 | |
Cabrillo CA Unified School District CAB Series A (GO, Ambac Insured) ¤ | | | 0.00 | | | | 8-1-2021 | | | | 1,500,000 | | | | 1,240,140 | |
California (GO) | | | 5.25 | | | | 8-1-2038 | | | | 1,925,000 | | | | 2,162,988 | |
California (GO) | | | 5.25 | | | | 11-1-2040 | | | | 3,000,000 | | | | 3,459,180 | |
California AMT Department of Veterans Affairs Series BZ (GO, National Insured) | | | 5.35 | | | | 12-1-2021 | | | | 5,000 | | | | 5,014 | |
California Association of Bay Area Governments Finance Authority for Nonprofit Corporations O’Connor Woods Project (Health Revenue) | | | 5.00 | | | | 1-1-2043 | | | | 5,000,000 | | | | 5,538,800 | |
California Association of Bay Area Governments Finance Authority for Nonprofit Corporations Odd Fellows Home Project Series A (Health Revenue) | | | 5.00 | | | | 4-1-2042 | | | | 1,100,000 | | | | 1,218,954 | |
California Department of Transportation Certificate of Participation Series A (Miscellaneous Revenue, National Insured) | | | 5.25 | | | | 3-1-2016 | | | | 1,425,000 | | | | 1,430,928 | |
California HFA AMT Home Mortgage Series E (Housing Revenue) | | | 5.00 | | | | 2-1-2042 | | | | 820,000 | | | | 851,586 | |
California HFA AMT Home Mortgage Series G (Housing Revenue) | | | 5.50 | | | | 8-1-2042 | | | | 1,975,000 | | | | 2,039,069 | |
California HFA AMT Home Mortgage Series H (Housing Revenue, FGIC Insured) | | | 5.75 | | | | 8-1-2030 | | | | 625,000 | | | | 652,069 | |
California HFA AMT Home Mortgage Series J (Housing Revenue) | | | 5.75 | | | | 8-1-2047 | | | | 170,000 | | | | 174,927 | |
California HFA AMT Home Mortgage Series K (Housing Revenue) | | | 5.30 | | | | 8-1-2023 | | | | 2,760,000 | | | | 2,853,812 | |
California HFA AMT Home Mortgage Series M (Housing Revenue) | | | 5.00 | | | | 8-1-2037 | | | | 540,000 | | | | 552,874 | |
California HFFA Catholic Healthcare West Series A (Health Revenue) | | | 5.25 | | | | 3-1-2023 | | | | 3,000,000 | | | | 3,558,570 | |
The accompanying notes are an integral part of these financial statements.
| | | | |
| 8 | | Wells Fargo Advantage California Tax-Free Fund | | Portfolio of investments—December 31, 2014 (unaudited) |
| | | | | | | | | | | | | | | | |
| Security name | | Interest rate | | | Maturity date | | | Principal | | | Value | |
| | | | |
| California (continued) | | | | | | | | | | | | | | | | |
California HFFA Catholic Healthcare West Series A (Health Revenue) | | | 6.00 | % | | | 7-1-2029 | | | $ | 4,000,000 | | | $ | 4,730,680 | |
California HFFA Prerefunded Bond Providence Health Services Series C (Health Revenue) | | | 6.50 | | | | 10-1-2038 | | | | 100,000 | | | | 120,416 | |
California HFFA Sutter Health Series D (Health Revenue) | | | 5.25 | | | | 8-15-2031 | | | | 3,100,000 | | | | 3,566,178 | |
California Infrastructure & Economic Development Bank Independent Systems Operator Series A (Utilities Revenue) | | | 6.25 | | | | 2-1-2039 | | | | 3,000,000 | | | | 3,015,300 | |
California Infrastructure & Economic Development King City Joint Union High School (Miscellaneous Revenue) | | | 5.75 | | | | 8-15-2029 | | | | 2,150,000 | | | | 2,523,068 | |
California Municipal Finance Authority Charter School Revenue Albert Einstein Academies Project Series A (Miscellaneous Revenue) | | | 6.75 | | | | 8-1-2033 | | | | 1,525,000 | | | | 1,732,690 | |
California Municipal Finance Authority Charter School Revenue Albert Einstein Academies Project Series A (Miscellaneous Revenue) | | | 7.13 | | | | 8-1-2043 | | | | 1,000,000 | | | | 1,151,680 | |
California Municipal Finance Authority Community Hospitals Central California (Health Revenue) | | | 5.00 | | | | 2-1-2020 | | | | 1,000,000 | | | | 1,069,710 | |
California PFOTER Series DCL-009 (GO, Dexia Credit Local LOC, AGM Insured) 144Aø | | | 0.24 | | | | 8-1-2027 | | | | 10,915,000 | | | | 10,915,000 | |
California PFOTER Series DCL-010 (GO, Dexia Credit Local LOC, AGM Insured) 144Aø | | | 0.24 | | | | 8-1-2027 | | | | 13,920,000 | | | | 13,920,000 | |
California PFOTER Series DCL-011 (GO, Dexia Credit Local LOC, AGM Insured) 144Aø | | | 0.24 | | | | 8-1-2027 | | | | 9,670,000 | | | | 9,670,000 | |
California Public Works Board California State University Projects Series B-1 (Miscellaneous Revenue) | | | 5.70 | | | | 3-1-2035 | | | | 2,210,000 | | | | 2,584,794 | |
California Public Works Board Department of General Services Butterfield Series A (Miscellaneous Revenue) | | | 5.25 | | | | 6-1-2024 | | | | 2,400,000 | | | | 2,448,648 | |
California Public Works Board Department of General Services East End Series A (Miscellaneous Revenue, Ambac Insured) | | | 5.00 | | | | 12-1-2027 | | | | 5,500,000 | | | | 5,533,495 | |
California Public Works Board Judicial Council Projects Series A (Miscellaneous Revenue) | | | 5.00 | | | | 3-1-2038 | | | | 7,000,000 | | | | 7,893,550 | |
California Public Works Board Judicial Council Projects Series D (Miscellaneous Revenue) | | | 5.25 | | | | 12-1-2025 | | | | 4,000,000 | | | | 4,842,960 | |
California Public Works Board Regents University of California Series G (Miscellaneous Revenue) | | | 5.00 | | | | 12-1-2030 | | | | 9,850,000 | | | | 11,988,140 | |
California Public Works Board University of California Research Project Series L (Education Revenue, National Insured) | | | 5.25 | | | | 11-1-2028 | | | | 4,225,000 | | | | 4,400,464 | |
California Public Works Board Various Capital Projects Series A (Miscellaneous Revenue) | | | 5.00 | | | | 4-1-2037 | | | | 4,925,000 | | | | 5,600,119 | |
California Public Works Board Various Capital Projects Series G (Miscellaneous Revenue) | | | 5.00 | | | | 11-1-2037 | | | | 23,000,000 | | | | 26,379,390 | |
California Public Works Board Various Capital Projects Series I (Miscellaneous Revenue) | | | 5.50 | | | | 11-1-2033 | | | | 2,000,000 | | | | 2,428,820 | |
California Refunding Bond (GO) | | | 5.00 | | | | 8-1-2025 | | | | 5,000,000 | | | | 5,442,750 | |
California Refunding Bond Series B (GO) ± | | | 1.19 | | | | 5-1-2020 | | | | 3,000,000 | | | | 3,069,210 | |
California Special District Association Finance Corporation Program Series MM (Miscellaneous Revenue) | | | 5.50 | | | | 6-1-2021 | | | | 820,000 | | | | 821,829 | |
California Statewide CDA Buck Institute for Research on Aging (Miscellaneous Revenue, AGM Insured) | | | 5.00 | | | | 11-15-2034 | | | | 2,500,000 | | | | 2,857,775 | |
California Statewide CDA Catholic Healthcare West Series A (Health Revenue) | | | 5.50 | | | | 7-1-2030 | | | | 2,980,000 | | | | 3,297,012 | |
California Statewide CDA Certificate of Participation Internet Group (Health Revenue) | | | 5.38 | | | | 4-1-2017 | | | | 420,000 | | | | 421,768 | |
California Statewide CDA Loma Linda University Medical Center Refunding Bond Series A (Health Revenue) | | | 5.25 | | | | 12-1-2044 | | | | 4,000,000 | | | | 4,324,160 | |
California Statewide CDA MFHR ROC RR-II-R-13105CE (Housing Revenue, Citibank NA LIQ) 144Aø | | | 0.54 | | | | 12-14-2016 | | | | 3,000,000 | | | | 3,000,000 | |
California Statewide CDA Pioneer Park Project Series T (Housing Revenue, GNMA/FHA Insured) | | | 6.10 | | | | 12-20-2035 | | | | 2,010,000 | | | | 2,013,337 | |
The accompanying notes are an integral part of these financial statements.
| | | | | | |
| Portfolio of investments—December 31, 2014 (unaudited) | | Wells Fargo Advantage California Tax-Free Fund | | | 9 | |
| | | | | | | | | | | | | | | | |
| Security name | | Interest rate | | | Maturity date | | | Principal | | | Value | |
| | | | |
| California (continued) | | | | | | | | | | | | | | | | |
California Statewide CDA Poway RFH Housing Incorporated Series A (Housing Revenue) | | | 5.25 | % | | | 11-15-2035 | | | $ | 1,500,000 | | | $ | 1,723,335 | |
California Statewide CDA Redwoods Projects (Health Revenue) | | | 5.13 | | | | 11-15-2035 | | | | 1,500,000 | | | | 1,701,600 | |
California Statewide CDA School Facility Alliance for College-Ready Public Schools (Education Revenue) | | | 6.75 | | | | 7-1-2031 | | | | 1,625,000 | | | | 1,878,061 | |
California Statewide CDA School Facility Aspire Public Schools (Education Revenue) | | | 5.00 | | | | 7-1-2020 | | | | 1,815,000 | | | | 1,882,845 | |
California Statewide CDA School Facility Aspire Public Schools (Education Revenue) | | | 5.20 | | | | 7-1-2020 | | | | 490,000 | | | | 511,903 | |
California Statewide CDA Senior Living Health Facilities Los Angeles Jewish Home for the Aging Sub Series D (Health Revenue) | | | 4.75 | | | | 8-1-2020 | | | | 1,000,000 | | | | 1,005,170 | |
California Statewide CDA St. Joseph Health System (Health Revenue, AGM Insured) | | | 5.25 | | | | 7-1-2021 | | | | 1,775,000 | | | | 2,015,548 | |
California Statewide CDA Water & Wastewater Pooled Financing Program Series B (Water & Sewer Revenue, AGM Insured) | | | 5.25 | | | | 10-1-2027 | | | | 1,040,000 | | | | 1,044,243 | |
California Various Purposes (GO) | | | 5.00 | | | | 10-1-2029 | | | | 7,000,000 | | | | 8,066,940 | |
California Various Purposes (GO) | | | 5.25 | | | | 4-1-2035 | | | | 12,640,000 | | | | 14,848,966 | |
California Various Purposes (GO) | | | 6.00 | | | | 4-1-2035 | | | | 2,140,000 | | | | 2,567,272 | |
California Various Purposes (GO) | | | 5.00 | | | | 9-1-2029 | | | | 1,475,000 | | | | 1,716,826 | |
California Various Purposes (GO) | | | 5.00 | | | | 9-1-2032 | | | | 5,100,000 | | | | 5,962,206 | |
California Various Purposes (GO) | | | 5.00 | | | | 6-1-2037 | | | | 4,215,000 | | | | 4,533,570 | |
California Various Purposes (GO) | | | 5.00 | | | | 2-1-2038 | | | | 5,000,000 | | | | 5,701,400 | |
California Various Purposes (GO) | | | 5.13 | | | | 4-1-2033 | | | | 6,835,000 | | | | 7,604,074 | |
California Various Purposes (GO) | | | 5.25 | | | | 9-1-2028 | | | | 5,000,000 | | | | 5,964,600 | |
California Various Purposes (GO) | | | 5.25 | | | | 10-1-2029 | | | | 800,000 | | | | 933,824 | |
California Various Purposes (GO) | | | 5.25 | | | | 3-1-2038 | | | | 2,300,000 | | | | 2,555,898 | |
California Various Purposes (GO) | | | 5.60 | | | | 3-1-2036 | | | | 8,715,000 | | | | 10,191,495 | |
California Various Purposes (GO) | | | 5.75 | | | | 4-1-2029 | | | | 1,600,000 | | | | 1,903,664 | |
California Various Purposes (GO) | | | 5.75 | | | | 4-1-2031 | | | | 3,380,000 | | | | 3,993,707 | |
California Various Purposes (GO) | | | 6.00 | | | | 4-1-2038 | | | | 23,465,000 | | | | 28,150,012 | |
Cathedral City CA Redevelopment Agency Successor Agency Tax Allocation Merged Redevelopment Project Area Series A (Tax Revenue, AGM Insured) | | | 5.00 | | | | 8-1-2032 | | | | 1,450,000 | | | | 1,669,081 | |
Cathedral City CA Redevelopment Agency Successor Agency Tax Allocation Merged Redevelopment Project Area Series A (Tax Revenue, AGM Insured) | | | 5.00 | | | | 8-1-2033 | | | | 880,000 | | | | 1,009,818 | |
Center California Unified School District CAB Series C (GO, National Insured) ¤ | | | 0.00 | | | | 9-1-2021 | | | | 5,000,000 | | | | 4,219,150 | |
Centinela Valley CA Union High School District Election of 2008 Series B (GO) | | | 6.00 | | | | 8-1-2036 | | | | 2,500,000 | | | | 3,097,950 | |
Centinela Valley CA Union High School District Election of 2008 Series C (GO) | | | 5.00 | | | | 8-1-2035 | | | | 2,000,000 | | | | 2,307,540 | |
Central Valley CA School District Financing Authority Series A (Miscellaneous Revenue, National Insured) | | | 6.45 | | | | 2-1-2018 | | | | 1,495,000 | | | | 1,600,771 | |
Cerritos CA Community College CAB Election of 2004 (GO) ¤ | | | 0.00 | | | | 8-1-2029 | | | | 1,750,000 | | | | 1,025,273 | |
Cerritos CA Community College CAB Election of 2004 (GO) ¤ | | | 0.00 | | | | 8-1-2033 | | | | 1,500,000 | | | | 712,020 | |
Chico CA PFA Redevelopment Project Area (Tax Revenue, National Insured) | | | 5.13 | | | | 4-1-2021 | | | | 3,000,000 | | | | 3,007,590 | |
College of the Sequoias Tulare Area Improvement District #3 California CAB Election of 2008 Series A (GO, AGM Insured) ¤ | | | 0.00 | | | | 8-1-2024 | | | | 1,000,000 | | | | 742,340 | |
Compton CA Community College CAB Election of 2002 Series C (GO) ¤ | | | 0.00 | | | | 8-1-2035 | | | | 3,445,000 | | | | 1,276,993 | |
Compton CA Community College RDA Project 2nd Lien Series A (Tax Revenue) | | | 5.00 | | | | 8-1-2020 | | | | 1,140,000 | | | | 1,229,809 | |
Compton CA Solid Waste Management Facilities (Resource Recovery Revenue) | | | 4.80 | | | | 8-1-2020 | | | | 180,000 | | | | 190,300 | |
Contra Costa County CA Community College District Election of 2006 (GO) | | | 5.00 | | | | 8-1-2038 | | | | 3,250,000 | | | | 3,735,940 | |
Contra Costa County CA Home GNMA Mortgage-Backed Securities Program (Housing Revenue, GNMA Insured) | | | 7.75 | | | | 5-1-2022 | | | | 190,000 | | | | 233,805 | |
Delano CA Union High School Election of 2010 Series B (GO, AGM Insured) | | | 5.75 | | | | 8-1-2035 | | | | 4,510,000 | | | | 5,457,506 | |
Dinuba CA Redevelopment Agency Merged City Redevelopment Project (Tax Revenue, Build America Mutual Assurance Company Insured) | | | 5.00 | | | | 9-1-2033 | | | | 1,500,000 | | | | 1,710,855 | |
The accompanying notes are an integral part of these financial statements.
| | | | |
| 10 | | Wells Fargo Advantage California Tax-Free Fund | | Portfolio of investments—December 31, 2014 (unaudited) |
| | | | | | | | | | | | | | | | |
| Security name | | Interest rate | | | Maturity date | | | Principal | | | Value | |
| | | | |
| California (continued) | | | | | | | | | | | | | | | | |
Duarte CA RDA CAB Sub-Merged Redevelopment Project (Tax Revenue) ¤ | | | 0.00 | % | | | 12-1-2016 | | | $ | 955,000 | | | $ | 899,142 | |
El Dorado CA Irrigation District Revenue Refunding Bond Series A (Water & Sewer Revenue, AGM Insured) | | | 5.25 | | | | 3-1-2039 | | | | 2,000,000 | | | | 2,356,480 | |
Emeryville CA PFA Assessment Distribution Refinancing (Miscellaneous Revenue) | | | 5.90 | | | | 9-2-2021 | | | | 1,750,000 | | | | 1,753,640 | |
Escondido CA Union High School CAB Election of 2008 Series A (GO, AGM Insured) ¤ | | | 0.00 | | | | 8-1-2027 | | | | 8,385,000 | | | | 5,436,499 | |
Florin CA Resource Conservation Refunding Second Senior Lien Series A (Water & Sewer Revenue, National Insured) | | | 5.00 | | | | 9-1-2032 | | | | 4,000,000 | | | | 4,453,560 | |
Fontana CA RDA Jurupa Hills Redevelopment Project Series A (Tax Revenue) | | | 5.50 | | | | 10-1-2017 | | | | 1,890,000 | | | | 1,910,072 | |
Fontana CA RDA Jurupa Hills Redevelopment Project Series A (Tax Revenue) | | | 5.60 | | | | 10-1-2027 | | | | 4,785,000 | | | | 4,812,083 | |
Foothill/Eastern Corridor CA Transportation Agency Sub Series B-3 (Transportation Revenue) ± | | | 5.50 | | | | 1-15-2053 | | | | 8,000,000 | | | | 9,264,400 | |
Garden Grove CA Unified School District Election of 2010 Series C (GO) | | | 5.25 | | | | 8-1-2037 | | | | 2,000,000 | | | | 2,338,260 | |
Gilroy CA Unified School District Election of 2008 Series A (GO, AGM Insured) | | | 6.00 | | | | 8-1-2027 | | | | 1,000,000 | | | | 1,185,870 | |
Golden West CA Schools Financing Authority CAB Series A (Miscellaneous Revenue, National Insured) ¤ | | | 0.00 | | | | 8-1-2015 | | | | 2,000,000 | | | | 1,990,920 | |
Inland Valley CA Development Agency Series A (Tax Revenue) | | | 5.25 | | | | 9-1-2037 | | | | 5,000,000 | | | | 5,752,800 | |
Inland Valley CA Development Agency Series C (Tax Revenue) ± | | | 4.50 | | | | 3-1-2041 | | | | 3,750,000 | | | | 3,933,000 | |
Jefferson CA Union High School CAB Election of 2006 Series D (GO) ¤ | | | 0.00 | | | | 8-1-2034 | | | | 9,905,000 | | | | 3,031,921 | |
Jefferson CA Union High School CAB Election of 2006 Series D (GO) ¤ | | | 0.00 | | | | 8-1-2036 | | | | 11,130,000 | | | | 2,926,634 | |
Jefferson CA Union High School CAB Election of 2006 Series D (GO) ¤ | | | 0.00 | | | | 8-1-2033 | | | | 8,865,000 | | | | 2,950,893 | |
Lafayette CA Redevelopment Agency Refunding Bond Lafayette Redevelopment Project (Tax Revenue, AGM Insured) | | | 5.00 | | | | 8-1-2033 | | | | 1,500,000 | | | | 1,727,970 | |
Lafayette CA Redevelopment Agency Refunding Bond Lafayette Redevelopment Project (Tax Revenue, AGM Insured) | | | 5.00 | | | | 8-1-2038 | | | | 1,635,000 | | | | 1,866,058 | |
Lancaster CA RDA Tax Allocation Combined Redevelopment Project Areas (Tax Revenue) | | | 6.50 | | | | 8-1-2029 | | | | 2,000,000 | | | | 2,372,400 | |
Lodi CA Unified School District School Facility Election of 2006 (GO, AGM Insured) | | | 5.00 | | | | 8-1-2030 | | | | 2,000,000 | | | | 2,167,960 | |
Long Beach CA Bond Financing Authority (Miscellaneous Revenue, Ambac Insured) | | | 6.00 | | | | 11-1-2017 | | | | 715,000 | | | | 750,342 | |
Long Beach CA Bond Financing Authority Redevelopment Housing & Gas Utilities Financing Series A-1 (Industrial Development Revenue, Ambac Insured) | | | 5.00 | | | | 8-1-2030 | | | | 5,000,000 | | | | 5,054,950 | |
Long Beach CA Unified School District CAB Election of 2008 Series A (GO) | | | 5.50 | | | | 8-1-2026 | | | | 2,530,000 | | | | 2,962,934 | |
Long Beach CA Unified School District CAB Election of 2008 Series B (GO) ¤ | | | 0.00 | | | | 8-1-2035 | | | | 2,000,000 | | | | 840,440 | |
Los Angeles CA Certificate of Participation Sonneblick del Rio Project (Miscellaneous Revenue, Ambac Insured) | | | 6.00 | | | | 11-1-2019 | | | | 2,000,000 | | | | 2,009,520 | |
Los Angeles CA Community Redevelopment Vermont Manchester Social Services Project (Miscellaneous Revenue, Ambac Insured) | | | 5.00 | | | | 9-1-2025 | | | | 2,310,000 | | | | 2,377,082 | |
Los Angeles CA Department of Airports Ontario International Series A (Airport Revenue, National Insured) | | | 5.00 | | | | 5-15-2024 | | | | 1,565,000 | | | | 1,653,438 | |
Los Angeles CA Department of Airports Ontario International Series A (Airport Revenue, National Insured) | | | 5.00 | | | | 5-15-2025 | | | | 3,425,000 | | | | 3,614,094 | |
Los Angeles CA DW&P Series A (Water & Sewer Revenue) | | | 5.00 | | | | 7-1-2039 | | | | 4,000,000 | | | | 4,653,440 | |
Los Angeles CA DW&P Series D (Utilities Revenue) | | | 5.00 | | | | 7-1-2044 | | | | 2,500,000 | | | | 2,883,850 | |
Los Angeles CA Harbor Department (Airport Revenue) | | | 7.60 | | | | 10-1-2018 | | | | 55,000 | | | | 63,055 | |
Lynwood CA Unified School District Election of 2012 Series A (GO, AGM Insured) | | | 5.00 | | | | 8-1-2033 | | | | 5,000 | | | | 5,651 | |
M-S-R California Energy Authority Gas Series B (Utilities Revenue) | | | 7.00 | | | | 11-1-2034 | | | | 4,000,000 | | | | 5,694,240 | |
M-S-R California Energy Authority Gas Series C (Utilities Revenue) | | | 6.13 | | | | 11-1-2029 | | | | 1,060,000 | | | | 1,355,570 | |
Merced CA Community College School Facilities Improvement Project District #1 (GO, National Insured) | | | 5.00 | | | | 8-1-2031 | | | | 1,635,000 | | | | 1,753,717 | |
Merced CA Irrigation District Water & Hydroelectric System Series A (Water & Sewer Revenue, AGM Insured) | | | 5.00 | | | | 10-1-2038 | | | | 4,000,000 | | | | 4,686,520 | |
Merced CA Union High School District CAB Series A (GO, National Insured) ¤ | | | 0.00 | | | | 8-1-2018 | | | | 2,135,000 | | | | 2,013,134 | |
The accompanying notes are an integral part of these financial statements.
| | | | | | |
| Portfolio of investments—December 31, 2014 (unaudited) | | Wells Fargo Advantage California Tax-Free Fund | | | 11 | |
| | | | | | | | | | | | | | | | |
| Security name | | Interest rate | | | Maturity date | | | Principal | | | Value | |
| | | | |
| California (continued) | | | | | | | | | | | | | | | | |
Merced CA Union High School District CAB Series C (GO) ¤ | | | 0.00 | % | | | 8-1-2032 | | | $ | 3,380,000 | | | $ | 1,658,600 | |
Montclair CA PFA Refunding Bond (Miscellaneous Revenue, AGM Insured) | | | 5.00 | | | | 10-1-2035 | | | | 2,400,000 | | | | 2,729,088 | |
Montebello CA Unified School District Election of 2004 (GO, National Insured) | | | 5.00 | | | | 8-1-2030 | | | | 3,175,000 | | | | 3,264,853 | |
Morongo Band of Mission Indians California Enterprise Casino Series B (Miscellaneous Revenue) 144A | | | 6.50 | | | | 3-1-2028 | | | | 2,100,000 | | | | 2,358,090 | |
Mount San Antonio CA Community College District CAB Election of 2008 Series A (GO) ¤ | | | 0.00 | | | | 8-1-2024 | | | | 1,610,000 | | | | 1,211,058 | |
Natomas CA Unified School District Series 1999 (GO, National Insured) | | | 5.95 | | | | 9-1-2021 | | | | 1,000,000 | | | | 1,116,460 | |
Northern California Gas Authority #1 LIBOR Series B (Utilities Revenue) ± | | | 0.88 | | | | 7-1-2027 | | | | 7,000,000 | | | | 6,432,930 | |
Northern California Power Agency Public Power Prerefunded Bond (Utilities Revenue, Ambac Insured) | | | 7.50 | | | | 7-1-2023 | | | | 50,000 | | | | 63,673 | |
Norwalk-La Mirada CA Unified School District CAB Election of 2002 Series D (GO, AGM Insured) ¤ | | | 0.00 | | | | 8-1-2023 | | | | 1,500,000 | | | | 1,177,035 | |
Oakland CA Unified School District Election of 2012 (GO) | | | 5.50 | | | | 8-1-2023 | | | | 500,000 | | | | 601,230 | |
Oakland CA Unified School District Election of 2012 (GO) | | | 6.63 | | | | 8-1-2038 | | | | 7,750,000 | | | | 9,541,723 | |
Ontario CA RDFA Ontario Redevelopment Project #1 (Tax Revenue, National Insured) | | | 6.00 | | | | 8-1-2015 | | | | 250,000 | | | | 254,228 | |
Pajaro Valley CA Unified School District Election of 2012 Series A (GO) | | | 5.00 | | | | 8-1-2038 | | | | 1,700,000 | | | | 1,922,581 | |
Palm Springs CA Palm Springs International Airport (Airport Revenue) | | | 6.00 | | | | 7-1-2018 | | | | 235,000 | | | | 239,331 | |
Palm Springs CA Palm Springs International Airport (Airport Revenue) | | | 6.40 | | | | 7-1-2023 | | | | 500,000 | | | | 509,200 | |
Palo Verde CA Unified School District FlexFund Program (Education Revenue) | | | 4.80 | | | | 9-1-2027 | | | | 1,531,016 | | | | 1,641,111 | |
Paramount CA Unified School District CAB Election of 2006 (GO) ¤ | | | 0.00 | | | | 8-1-2033 | | | | 2,500,000 | | | | 1,109,425 | |
Pasadena CA Old Pasadena Parking Facilities Project (Miscellaneous Revenue) | | | 6.25 | | | | 1-1-2018 | | | | 560,000 | | | | 602,090 | |
Perris CA PFA Series A (Tax Revenue, National Insured) | | | 5.25 | | | | 10-1-2020 | | | | 1,030,000 | | | | 1,032,925 | |
Perris CA PFA Series A (Tax Revenue) | | | 5.75 | | | | 10-1-2031 | | | | 2,045,000 | | | | 2,091,790 | |
Pico Rivera CA Water Authority Series A (Water & Sewer Revenue, National Insured) | | | 5.50 | | | | 5-1-2019 | | | | 2,000,000 | | | | 2,161,540 | |
Pico Rivera CA Water Authority Series A (Water & Sewer Revenue) | | | 6.25 | | | | 12-1-2032 | | | | 5,065,000 | | | | 5,073,762 | |
Pioneer CA Union Elementary School District Certificate of Participation (Miscellaneous Revenue, National Insured) | | | 5.00 | | | | 8-1-2029 | | | | 1,635,000 | | | | 1,757,200 | |
Pomona CA Unified School District Series A (GO, National Insured) | | | 6.55 | | | | 8-1-2029 | | | | 1,480,000 | | | | 1,971,138 | |
Port of Redwood City CA (Airport Revenue) | | | 5.13 | | | | 6-1-2030 | | | | 3,600,000 | | | | 3,616,632 | |
Poway CA Unified School District CAB Election of 2008 Improvement District 07-1-A (GO) ¤ | | | 0.00 | | | | 8-1-2024 | | | | 1,800,000 | | | | 1,353,978 | |
Rancho Cucamonga CA Redevelopment Agency Rancho Redevelopment Project Area (Tax Revenue, AGM Insured) | | | 5.00 | | | | 9-1-2032 | | | | 1,870,000 | | | | 2,157,980 | |
Redondo Beach CA Unified School Election of 2012 Series (GO, AGM Insured) | | | 5.00 | | | | 8-1-2039 | | | | 4,500,000 | | | | 5,147,865 | |
Redwood City CA RDA CAB Redevelopment Project Area 2-A (Tax Revenue, Ambac Insured) ¤ | | | 0.00 | | | | 7-15-2030 | | | | 3,505,000 | | | | 1,728,911 | |
Rialto CA Unified School District CAB Election of 2010 Series A (GO, AGM Insured) ¤ | | | 0.00 | | | | 8-1-2026 | | | | 3,320,000 | | | | 2,267,859 | |
Richmond CA Joint Powers Financing Authority Civic Center Project Series A (Miscellaneous Revenue, AGM Insured) | | | 5.88 | | | | 8-1-2037 | | | | 5,000,000 | | | | 5,736,300 | |
Richmond CA Joint Powers Financing Authority Point Potrero Series A (Miscellaneous Revenue) | | | 6.25 | | | | 7-1-2024 | | | | 7,500,000 | | | | 8,935,425 | |
Riverside County CA Asset Leasing Corporation Riverside County Hospital Project (Miscellaneous Revenue, National Insured) ¤ | | | 0.00 | | | | 6-1-2026 | | | | 10,000,000 | | | | 6,757,600 | |
Riverside County CA Palm Desert Financing Authority Series A (Miscellaneous Revenue) | | | 6.00 | | | | 5-1-2022 | | | | 4,105,000 | | | | 4,732,039 | |
Roseville CA Natural Gas Financing Authority (Utilities Revenue) | | | 5.00 | | | | 2-15-2025 | | | | 1,930,000 | | | | 2,233,724 | |
Sacramento County CA Airport System AMT Senior Series B (Airport Revenue, AGM Insured) | | | 5.75 | | | | 7-1-2024 | | | | 2,000,000 | | | | 2,241,620 | |
Sacramento County CA Certificate of Participation Animal Care & Youth Detention Program (Miscellaneous Revenue, Ambac Insured) | | | 5.00 | | | | 10-1-2025 | | | | 1,085,000 | | | | 1,190,918 | |
The accompanying notes are an integral part of these financial statements.
| | | | |
| 12 | | Wells Fargo Advantage California Tax-Free Fund | | Portfolio of investments—December 31, 2014 (unaudited) |
| | | | | | | | | | | | | | | | |
| Security name | | Interest rate | | | Maturity date | | | Principal | | | Value | |
| | | | |
| California (continued) | | | | | | | | | | | | | | | | |
Sacramento County CA City Financing Authority Series A (Miscellaneous Revenue, Ambac Insured) | | | 5.40 | % | | | 11-1-2020 | | | $ | 2,500,000 | | | $ | 2,768,225 | |
Sacramento County CA City School Joint Refunding Bond Series A (Miscellaneous Revenue, Build America Mutual Assurance Company Insured) | | | 5.00 | | | | 3-1-2040 | | | | 2,165,000 | | | | 2,389,099 | |
Sacramento County CA Unified School District Election of 2012 Series A (GO, Build America Mutual Assurance Company Insured) | | | 5.25 | | | | 8-1-2033 | | | | 1,000,000 | | | | 1,156,020 | |
San Bernardino County CA Certificate of Participation Arrowhead Project Series A (Miscellaneous Revenue) | | | 5.50 | | | | 8-1-2020 | | | | 6,000,000 | | | | 6,914,520 | |
San Bernardino County CA Certificate of Participation Medical Center Financing Project (Miscellaneous Revenue, National Insured) | | | 5.00 | | | | 8-1-2028 | | | | 5,815,000 | | | | 5,826,456 | |
San Buenaventura CA Public Facilities Financing Authority Water Revenue Series B (Water & Sewer Revenue) | | | 5.00 | | | | 7-1-2042 | | | | 4,000,000 | | | | 4,493,720 | |
San Diego CA Community College Election of 2002 (GO) | | | 5.00 | | | | 8-1-2031 | | | | 4,000,000 | | | | 4,700,560 | |
San Diego CA PFFA Ballpark Project Series A (Miscellaneous Revenue, Ambac Insured) | | | 5.25 | | | | 2-15-2026 | | | | 4,950,000 | | | | 5,366,642 | |
San Diego CA PFFA Ballpark Project Series A (Miscellaneous Revenue, Ambac Insured) | | | 5.25 | | | | 2-15-2032 | | | | 3,825,000 | | | | 4,110,039 | |
San Diego CA RDA CAB Tax Allocation Centre (Tax Revenue, AGM Insured) ¤ | | | 0.00 | | | | 9-1-2023 | | | | 885,000 | | | | 687,795 | |
San Diego CA RDA Centre City Sub Parking Series B (Transportation Revenue) | | | 5.30 | | | | 9-1-2020 | | | | 1,060,000 | | | | 1,061,961 | |
San Diego CA RDA Naval Training Center Series A (Tax Revenue) | | | 5.00 | | | | 9-1-2025 | | | | 575,000 | | | | 642,862 | |
San Francisco CA City & County Certificate of Participation Multiple Capital Improvement Projects Series A (Miscellaneous Revenue) | | | 5.20 | | | | 4-1-2026 | | | | 3,000,000 | | | | 3,416,610 | |
San Francisco CA City & County Redevelopment Agency Mission Bay North Redevelopment Project Series C (Tax Revenue) | | | 4.50 | | | | 8-1-2016 | | | | 250,000 | | | | 264,598 | |
San Francisco CA City & County Redevelopment Agency Mission Bay South Redevelopment Project Series A (Tax Revenue) | | | 5.00 | | | | 8-1-2043 | | | | 2,500,000 | | | | 2,772,925 | |
San Francisco CA Municipal Transportation (Transportation Revenue) | | | 5.00 | | | | 3-1-2039 | | | | 6,000,000 | | | | 6,924,060 | |
San Gorgonio CA Memorial Healthcare (GO) | | | 5.00 | | | | 8-1-2032 | | | | 1,750,000 | | | | 1,963,623 | |
San Gorgonio CA Memorial Healthcare (GO) | | | 5.50 | | | | 8-1-2028 | | | | 2,525,000 | | | | 2,984,979 | |
San Gorgonio CA Memorial Healthcare Election of 2006 Series B (GO) | | | 5.63 | | | | 8-1-2038 | | | | 5,000,000 | | | | 5,329,600 | |
San Gorgonio CA Memorial Healthcare Election of 2006 Series C (GO) | | | 7.10 | | | | 8-1-2033 | | | | 3,000,000 | | | | 3,498,930 | |
San Joaquin Delta CA Community College District Election of 2004
Series C (GO) | | | 5.00 | | | | 8-1-2032 | | | | 1,925,000 | | | | 2,268,131 | |
San Joaquin Delta CA Community College District Election of 2004
Series C (GO) | | | 5.00 | | | | 8-1-2033 | | | | 3,195,000 | | | | 3,746,968 | |
San Joaquin Delta CA Community College District Election of 2004
Series C (GO) | | | 5.00 | �� | | | 8-1-2034 | | | | 3,315,000 | | | | 3,869,566 | |
San Joaquin Hills County CA Transportation Corridor Agency CAB
Series A (Transportation Revenue, National Insured) ¤ | | | 0.00 | | | | 1-15-2015 | | | | 2,000,000 | | | | 1,999,460 | |
San Jose CA Airport Series B PUTTER (Airport Revenue, Ambac/AGM Insured, JPMorgan Chase & Company LIQ) 144Aø | | | 0.16 | | | | 9-1-2030 | | | | 8,000,000 | | | | 8,000,000 | |
San Jose CA Libraries & Parks Project (GO) | | | 5.13 | | | | 9-1-2031 | | | | 2,040,000 | | | | 2,048,262 | |
San Jose CA RDA Tax Allocation Refunding Bond Merged Area Redevelopment Project Series C (Tax Revenue, National Insured) | | | 5.00 | | | | 8-1-2025 | | | | 1,845,000 | | | | 1,982,840 | |
San Jose CA RDA Tax Allocation Refunding Bond Merged Area Redevelopment Project Series C (Tax Revenue, National Insured) | | | 5.00 | | | | 8-1-2026 | | | | 950,000 | | | | 1,020,975 | |
San Jose CA Unified School District CAB (Miscellaneous Revenue, AGM Insured) ¤ | | | 0.00 | | | | 1-1-2021 | | | | 1,205,000 | | | | 1,089,910 | |
San Jose CA Unified School District CAB (Miscellaneous Revenue, AGM Insured) ¤ | | | 0.00 | | | | 1-1-2026 | | | | 3,175,000 | | | | 2,436,844 | |
San Marcos CA Unified School District Special Tax Community Facilities District #4 (Tax Revenue, Build America Mutual Assurance Company Insured) | | | 5.00 | | | | 9-1-2034 | | | | 1,745,000 | | | | 1,998,060 | |
San Marcos CA Unified School District Special Tax Community Facilities District #5 (Tax Revenue, Build America Mutual Assurance Company Insured) | | | 5.00 | | | | 9-1-2028 | | | | 1,290,000 | | | | 1,514,512 | |
San Marcos CA Unified School District Special Tax Community Facilities District #5 (Tax Revenue, Build America Mutual Assurance Company Insured) | | | 5.00 | | | | 9-1-2029 | | | | 1,345,000 | | | | 1,574,148 | |
San Rafael City CA High School District CAB Election of 2002 Series B (GO, National Insured) ¤ | | | 0.00 | | | | 8-1-2023 | | | | 1,260,000 | | | | 1,001,347 | |
The accompanying notes are an integral part of these financial statements.
| | | | | | |
| Portfolio of investments—December 31, 2014 (unaudited) | | Wells Fargo Advantage California Tax-Free Fund | | | 13 | |
| | | | | | | | | | | | | | | | |
| Security name | | Interest rate | | | Maturity date | | | Principal | | | Value | |
| | | | |
| California (continued) | | | | | | | | | | | | | | | | |
Sanger CA Unified School District Refunding Bond (GO, National Insured) | | | 5.60 | % | | | 8-1-2023 | | | $ | 2,000,000 | | | $ | 2,256,700 | |
Santa Ana CA Community Redevelopment Merged Project Area Series A (Tax Revenue) | | | 6.00 | | | | 9-1-2022 | | | | 2,000,000 | | | | 2,382,120 | |
Santa Ana CA Unified School District CAB Election of 2008 Series B (GO, AGM Insured) ¤ | | | 0.00 | | | | 8-1-2038 | | | | 15,000,000 | | | | 5,540,550 | |
Santa Cruz County CA RDA Live Oak Soquel Community Improvement Project (Tax Revenue) | | | 6.63 | | | | 9-1-2029 | | | | 2,100,000 | | | | 2,465,400 | |
Santa Rosa CA High School District (GO) | | | 5.00 | | | | 8-1-2024 | | | | 1,005,000 | | | | 1,204,352 | |
Simi Valley CA Unified School District Capital Improvement Projects (Miscellaneous Revenue, Ambac Insured) | | | 5.25 | | | | 8-1-2022 | | | | 1,970,000 | | | | 2,109,890 | |
Sonoma Valley CA Community RDA The Springs Redevelopment Project (Tax Revenue, AGM Insured) | | | 6.50 | | | | 8-1-2028 | | | | 3,000,000 | | | | 3,014,880 | |
Sonoma Valley CA Unified School District CAB Election of 2010 Series A (GO) ¤ | | | 0.00 | | | | 8-1-2027 | | | | 1,020,000 | | | | 645,181 | |
South Pasadena CA Unified School District Series A (GO, FGIC Insured) | | | 5.55 | | | | 11-1-2020 | | | | 585,000 | | | | 663,390 | |
Southern California Public Power Authority Natural Gas Project #1 Series A (Utilities Revenue) | | | 5.25 | | | | 11-1-2025 | | | | 1,000,000 | | | | 1,189,410 | |
Southwest Community California Finance Authority Riverside County (Miscellaneous Revenue) | | | 6.38 | | | | 5-1-2033 | | | | 3,065,000 | | | | 3,527,049 | |
Stockton CA Unified School District Election of 2012 Series A (GO, AGM Insured) | | | 5.00 | | | | 8-1-2038 | | | | 1,025,000 | | | | 1,158,148 | |
Torrance CA Certificate of Participation (Miscellaneous Revenue) | | | 5.25 | | | | 6-1-2039 | | | | 5,385,000 | | | | 6,243,046 | |
Tracy CA Operating Partnership Joint Powers Authority Capital Improvement Projects (Miscellaneous Revenue, AGM Insured) | | | 6.25 | | | | 10-1-2033 | | | | 1,000,000 | | | | 1,161,030 | |
Tulare CA PFFA Capital Facilities Project (Miscellaneous Revenue, AGM Insured) | | | 5.25 | | | | 4-1-2027 | | | | 3,000,000 | | | | 3,392,880 | |
Turlock CA Irrigation District Revenue Refunding Bond Subordinated First Priority (Utilities Revenue) | | | 5.50 | | | | 1-1-2041 | | | | 2,000,000 | | | | 2,318,240 | |
Union City CA Community RDA (Tax Revenue, AGM Insured) | | | 5.25 | | | | 10-1-2033 | | | | 8,000,000 | | | | 9,211,600 | |
Union City CA Community RDA Series A (Tax Revenue, Ambac Insured) | | | 5.38 | | | | 10-1-2034 | | | | 3,685,000 | | | | 3,729,146 | |
University of California General Revenue Bonds Series AI (Education Revenue) | | | 5.00 | | | | 5-15-2038 | | | | 2,000,000 | | | | 2,300,520 | |
University of California Regents Medical Center Series J (Health Revenue) | | | 5.00 | | | | 5-15-2033 | | | | 2,265,000 | | | | 2,619,880 | |
University of California Regents Medical Center Series J (Health Revenue) | | | 5.25 | | | | 5-15-2038 | | | | 10,000,000 | | | | 11,735,400 | |
Vacaville CA Unified School District (Miscellaneous Revenue, AGM Insured) | | | 6.50 | | | | 12-1-2034 | | | | 1,260,000 | | | | 1,482,604 | |
Vallejo CA Unified School District Refunding Bond Series A (GO, National Insured) | | | 5.90 | | | | 2-1-2017 | | | | 1,000,000 | | | | 1,098,210 | |
Vallejo CA Water Revenue Refunding Bond (Water & Sewer Revenue) | | | 5.25 | | | | 5-1-2031 | | | | 1,000,000 | | | | 1,163,970 | |
Ventura County CA PFA Series A (Miscellaneous Revenue) | | | 5.00 | | | | 11-1-2038 | | | | 4,250,000 | | | | 4,832,930 | |
Vista CA Community Development Commission Vista Redevelopment Project Area (Tax Revenue) | | | 5.88 | | | | 9-1-2037 | | | | 2,500,000 | | | | 2,504,450 | |
Walnut CA Energy Center Authority Series A (Utilities Revenue) | | | 5.00 | | | | 1-1-2034 | | | | 3,115,000 | | | | 3,640,719 | |
Walnut CA Unified School District Series C (GO, FGIC Insured) | | | 5.75 | | | | 8-1-2015 | | | | 400,000 | | | | 402,904 | |
Washington Township CA Healthcare District Election of 2004
Series B (GO) | | | 5.50 | | | | 8-1-2038 | | | | 1,500,000 | | | | 1,813,065 | |
West Contra Costa CA Unified School District (GO, AGM Insured) | | | 5.25 | | | | 8-1-2024 | | | | 1,350,000 | | | | 1,628,451 | |
West Contra Costa CA Unified School District CAB Election of 2005 Series B (GO) | | | 6.00 | | | | 8-1-2027 | | | | 1,080,000 | | | | 1,462,547 | |
West Contra Costa CA Unified School District CAB Election of 2005 Series C-1 (GO, AGM Insured) ¤ | | | 0.00 | | | | 8-1-2021 | | | | 6,000,000 | | | | 5,122,380 | |
Wiseburn CA School District CAB (GO, AGM Insured) ¤ | | | 0.00 | | | | 8-1-2027 | | | | 1,525,000 | | | | 988,749 | |
Yorba Linda CA RDA CAB Series A (Tax Revenue, National
Insured) ¤ | | | 0.00 | | | | 9-1-2019 | | | | 2,010,000 | | | | 1,708,862 | |
| | | | |
| | | | | | | | | | | | | | | 790,660,527 | |
| | | | | | | | | | | | | | | | |
| | | | |
| Guam: 0.34% | | | | | | | | | | | | | | | | |
Guam Government Business Privilege Tax Series A (Tax Revenue) | | | 5.00 | | | | 1-1-2031 | | | | 1,000,000 | | | | 1,119,400 | |
Guam Government Waterworks Authority (Water & Sewer Revenue) | | | 5.25 | | | | 7-1-2033 | | | | 1,500,000 | | | | 1,706,925 | |
| | | | |
| | | | | | | | | | | | | | | 2,826,325 | |
| | | | | | | | | | | | | | | | |
The accompanying notes are an integral part of these financial statements.
| | | | |
| 14 | | Wells Fargo Advantage California Tax-Free Fund | | Portfolio of investments—December 31, 2014 (unaudited) |
| | | | | | | | | | | | | | | | |
| Security name | | Interest rate | | | Maturity date | | | Principal | | | Value | |
| | | | |
| Illinois: 1.42% | | | | | | | | | | | | | | | | |
Illinois (GO, AGM Insured) | | | 5.00 | % | | | 2-1-2027 | | | $ | 5,000,000 | | | $ | 5,581,850 | |
Illinois (Miscellaneous Revenue) | | | 5.50 | | | | 7-1-2027 | | | | 5,650,000 | | | | 6,403,597 | |
| | | | |
| | | | | | | | | | | | | | | 11,985,447 | |
| | | | | | | | | | | | | | | | |
| | | | |
| New York: 1.29% | | | | | | | | | | | | | | | | |
JPMorgan Chase PUTTER/DRIVERs Trust Series 3600Z New York Thruway Authority (Tax Revenue, JPMorgan Chase & Company LIQ) 144Aø | | | 0.16 | | | | 1-1-2016 | | | | 2,745,000 | | | | 2,745,000 | |
New York NY Transitional Finance Authority Sub Series 2A (Tax Revenue, Dexia Credit Local LIQ) ø | | | 0.16 | | | | 11-1-2022 | | | | 7,130,000 | | | | 7,130,000 | |
New York NY Transitional Finance Authority Sub Series A3 (Tax Revenue, Dexia Credit Local SPA) ø | | | 0.16 | | | | 8-1-2023 | | | | 1,000,000 | | | | 1,000,000 | |
| | | | |
| | | | | | | | | | | | | | | 10,875,000 | |
| | | | | | | | | | | | | | | | |
| | | | |
| Virgin Islands: 0.54% | | | | | | | | | | | | | | | | |
Virgin Islands PFA Matching Fund Loan Note Senior Lien (Tax Revenue, AGM Insured) | | | 5.00 | | | | 10-1-2029 | | | | 4,000,000 | | | | 4,557,640 | |
| | | | | | | | | | | | | | | | |
| | | | |
Total Municipal Obligations (Cost $738,315,800) | | | | | | | | | | | | | | | 820,904,939 | |
| | | | | | | | | | | | | | | | |
| | | | |
Other: 0.30% | | | | | | | | | | | | | | | | |
Nuveen California AMT-Free Municipal Income Fund, Institutional MuniFund Term Preferred Shares 144Aø | | | 0.51 | | | | 7-1-2018 | | | | 2,500,000 | | | | 2,498,000 | |
| | | | | | | | | | | | | | | | |
| | | | |
Total Other (Cost $2,500,000) | | | | | | | | | | | | | | | 2,498,000 | |
| | | | | | | | | | | | | | | | |
| | | | |
| | | Yield | | | | | | Shares | | | | |
| | | | |
Short-Term Investments: 0.97% | | | | | | | | | | | | | | | | |
| | | | |
| Investment Companies: 0.97% | | | | | | | | | | | | | | | | |
Wells Fargo Advantage California Municipal Money Market Fund, Institutional Class (l)(u)## | | | 0.01 | | | | | | | | 8,148,838 | | | | 8,148,838 | |
| | | | | | | | | | | | | | | | |
| | | | |
Total Short-Term Investments (Cost $8,148,838) | | | | | | | | | | | | | | | 8,148,838 | |
| | | | | | | | | | | | | | | | |
| | | | | | | | |
| Total investments in securities (Cost $748,964,638) * | | | 98.90 | % | | | 831,551,777 | |
Other assets and liabilities, net | | | 1.10 | | | | 9,243,767 | |
| | | | | | | | |
| Total net assets | | | 100.00 | % | | $ | 840,795,544 | |
| | | | | | | | |
| ¤ | The security is issued in zero coupon form with no periodic interest payments. |
| ± | Variable rate investment. The rate shown is the rate in effect at period end. |
| %% | The security is issued on a when-issued basis. |
| 144A | The security may be resold in transactions exempt from registration, normally to qualified institutional buyers, pursuant to Rule 144A under the Securities Act of 1933. |
| ø | Variable rate demand notes are subject to a demand feature which reduces the effective maturity. The maturity date shown represents the final maturity date of the security. The interest rate is determined and reset by the issuer daily, weekly, or monthly depending upon the terms of the security. The rate shown is the rate in effect at period end. |
| (l) | The security represents an affiliate of the Fund as defined in the Investment Company Act of 1940. |
| (u) | The rate represents the 7-day annualized yield at period end. |
| ## | All or a portion of this security is segregated for when-issued securities. |
| * | Cost for federal income tax purposes is $749,059,197 and unrealized gains (losses) consists of: |
| | | | |
Gross unrealized gains | | $ | 82,639,972 | |
Gross unrealized losses | | | (147,392 | ) |
| | | | |
Net unrealized gains | | $ | 82,492,580 | |
The accompanying notes are an integral part of these financial statements.
| | | | | | |
| Statement of assets and liabilities—December 31, 2014 (unaudited) | | Wells Fargo Advantage California Tax-Free Fund | | | 15 | |
| | | | |
| | | | |
| |
Assets | | | | |
Investments | | | | |
In unaffiliated securities, at value (cost $740,815,800) | | $ | 823,402,939 | |
In affiliated securities, at value (cost $8,148,838) | | | 8,148,838 | |
| | | | |
Total investments, at value (cost $748,964,638) | | | 831,551,777 | |
Receivable for investments sold | | | 600,000 | |
Receivable for Fund shares sold | | | 2,043,604 | |
Receivable for interest | | | 9,557,340 | |
Prepaid expenses and other assets | | | 66,747 | |
| | | | |
Total assets | | | 843,819,468 | |
| | | | |
| |
Liabilities | | | | |
Dividends payable | | | 580,731 | |
Payable for investments purchased | | | 1,182,563 | |
Payable for Fund shares redeemed | | | 707,926 | |
Advisory fee payable | | | 163,447 | |
Distribution fees payable | | | 32,084 | |
Administration fees payable | | | 137,576 | |
Shareholder servicing fees payable | | | 173,751 | |
Accrued expenses and other liabilities | | | 45,846 | |
| | | | |
Total liabilities | | | 3,023,924 | |
| | | | |
Total net assets | | $ | 840,795,544 | |
| | | | |
| |
NET ASSETS CONSIST OF | | | | |
Paid-in capital | | $ | 768,740,344 | |
Undistributed net investment income | | | 66,892 | |
Accumulated net realized losses on investments | | | (10,598,831 | ) |
Net unrealized gains on investments | | | 82,587,139 | |
| | | | |
Total net assets | | $ | 840,795,544 | |
| | | | |
| |
COMPUTATION OF NET ASSET VALUE AND OFFERING PRICE PER SHARE | | | | |
Net assets – Class A | | $ | 486,858,715 | |
Shares outstanding – Class A1 | | | 40,583,661 | |
Net asset value per share – Class A | | | $12.00 | |
Maximum offering price per share – Class A2 | | | $12.57 | |
Net assets – Class B | | $ | 252,039 | |
Shares outstanding – Class B1 | | | 20,592 | |
Net asset value per share – Class B | | | $12.24 | |
Net assets – Class C | | $ | 49,050,467 | |
Shares outstanding – Class C1 | | | 4,009,435 | |
Net asset value per share – Class C | | | $12.23 | |
Net assets – Administrator Class | | $ | 258,509,364 | |
Shares outstanding – Administrator Class1 | | | 21,505,375 | |
Net asset value per share – Administrator Class | | | $12.02 | |
Net assets – Institutional Class | | $ | 46,124,959 | |
Shares outstanding – Institutional Class1 | | | 3,838,210 | |
Net asset value per share – Institutional Class | | | $12.02 | |
| 1. | The Fund has an unlimited number of authorized shares. |
| 2. | Maximum offering price is computed as 100/95.50 of net asset value. On investments of $50,000 or more, the offering price is reduced. |
The accompanying notes are an integral part of these financial statements.
| | | | |
| 16 | | Wells Fargo Advantage California Tax-Free Fund | | Statement of operations—six months ended December 31, 2014 (unaudited) |
| | | | |
| | | | |
| |
Investment income | | | | |
Interest | | $ | 16,476,809 | |
Income from affiliated securities | | | 4,226 | |
| | | | |
Total investment income | | | 16,481,035 | |
| | | | |
| |
Expenses | | | | |
Advisory fee | | | 1,406,256 | |
Administration fees | | | | |
Fund level | | | 206,600 | |
Class A | | | 386,189 | |
Class B | | | 305 | |
Class C | | | 38,653 | |
Administrator Class | | | 141,727 | |
Institutional Class | | | 4,605 | 1 |
Shareholder servicing fees | | | | |
Class A | | | 603,421 | |
Class B | | | 476 | |
Class C | | | 60,396 | |
Administrator Class | | | 354,317 | |
Distribution fees | | | | |
Class B | | | 1,427 | |
Class C | | | 181,188 | |
Custody and accounting fees | | | 22,173 | |
Professional fees | | | 27,239 | |
Registration fees | | | 31,054 | |
Shareholder report expenses | | | 20,302 | |
Trustees’ fees and expenses | | | 6,418 | |
Other fees and expenses | | | 10,545 | |
| | | | |
Total expenses | | | 3,503,291 | |
Less: Fee waivers and/or expense reimbursements | | | (520,672 | ) |
| | | | |
Net expenses | | | 2,982,619 | |
| | | | |
Net investment income | | | 13,498,416 | |
| | | | |
| |
REALIZED AND UNREALIZED GAINS (LOSSES) ON INVESTMENTS | | | | |
Net realized gains on investments | | | 2,133,321 | |
Net change in unrealized gains (losses) on investments | | | 15,776,915 | |
| | | | |
Net realized and unrealized gains (losses) on investments | | | 17,910,236 | |
| | | | |
Net increase in net assets resulting from operations | | $ | 31,408,652 | |
| | | | |
| 1. | For the period from October 31, 2014 (commencement of class operations) to December 31, 2014 |
The accompanying notes are an integral part of these financial statements.
| | | | | | |
| Statement of changes in net assets | | Wells Fargo Advantage California Tax-Free Fund | | | 17 | |
| | | | | | | | | | | | | | | | |
| | | Six months ended
December 31, 2014 (unaudited) | | | Year ended June 30, 2014 | |
| | | | |
Operations | | | | | | | | | | | | | | | | |
Net investment income | | | | | | $ | 13,498,416 | | | | | | | $ | 27,474,942 | |
Net realized gains (losses) on investments | | | | | | | 2,133,321 | | | | | | | | (7,969,948 | ) |
Net change in unrealized gains (losses) on investments | | | | | | | 15,776,915 | | | | | | | | 40,840,249 | |
| | | | |
Net increase in net assets resulting from operations | | | | | | | 31,408,652 | | | | | | | | 60,345,243 | |
| | | | |
| | | | |
Distributions to shareholders from | | | | | | | | | | | | | | | | |
Net investment income | | | | | | | | | | | | | | | | |
Class A | | | | | | | (7,816,030 | ) | | | | | | | (17,478,188 | ) |
Class B | | | | | | | (4,745 | ) | | | | | | | (21,063 | ) |
Class C | | | | | | | (600,665 | ) | | | | | | | (1,264,985 | ) |
Administrator Class | | | | | | | (4,878,369 | ) | | | | | | | (8,710,527 | ) |
Institutional Class | | | | | | | (198,607 | )1 | | | | | | | N/A | |
| | | | |
Total distributions to shareholders | | | | | | | (13,498,416 | ) | | | | | | | (27,474,763 | ) |
| | | | |
| | | | |
Capital share transactions | | | Shares | | | | | | | | Shares | | | | | |
Proceeds from shares sold | | | | | | | | | | | | | | | | |
Class A | | | 2,818,050 | | | | 33,580,594 | | | | 4,229,217 | | | | 47,692,279 | |
Class C | | | 361,845 | | | | 4,380,070 | | | | 613,042 | | | | 7,120,326 | |
Administrator Class | | | 5,751,052 | | | | 68,640,059 | | | | 13,533,288 | | | | 153,783,924 | |
Institutional Class | | | 3,841,354 | 1 | | | 45,829,690 | 1 | | | N/A | | | | N/A | |
| | | | |
| | | | | | | 152,430,413 | | | | | | | | 208,596,529 | |
| | | | |
Reinvestment of distributions | | | | | | | | | | | | | | | | |
Class A | | | 595,509 | | | | 7,087,200 | | | | 1,400,779 | | | | 15,843,627 | |
Class B | | | 370 | | | | 4,484 | | | | 1,755 | | | | 20,186 | |
Class C | | | 44,310 | | | | 537,805 | | | | 100,196 | | | | 1,156,478 | |
Administrator Class | | | 230,833 | | | | 2,753,812 | | | | 392,568 | | | | 4,459,734 | |
Institutional Class | | | 10 | 1 | | | 115 | 1 | | | N/A | | | | N/A | |
| | | | |
| | | | | | | 10,383,416 | | | | | | | | 21,480,025 | |
| | | | |
Payment for shares redeemed | | | | | | | | | | | | | | | | |
Class A | | | (2,588,706 | ) | | | (30,726,704 | ) | | | (11,091,534 | ) | | | (124,365,269 | ) |
Class B | | | (21,701 | ) | | | (262,450 | ) | | | (44,341 | ) | | | (509,337 | ) |
Class C | | | (236,379 | ) | | | (2,867,281 | ) | | | (902,960 | ) | | | (10,308,439 | ) |
Administrator Class | | | (7,703,552 | ) | | | (91,907,597 | ) | | | (11,305,315 | ) | | | (127,059,923 | ) |
Institutional Class | | | (3,154 | )1 | | | (37,793 | )1 | | | N/A | | | | N/A | |
| | | | |
| | | | | | | (125,801,825 | ) | | | | | | | (262,242,968 | ) |
| | | | |
Net increase (decrease) in net assets resulting from capital share transactions | | | | | | | 37,012,004 | | | | | | | | (32,166,414 | ) |
| | | | |
Total increase in net assets | | | | | | | 54,922,240 | | | | | | | | 704,066 | |
| | | | |
| | | | |
Net assets | | | | | | | | | | | | | | | | |
Beginning of period | | | | | | | 785,873,304 | | | | | | | | 785,169,238 | |
| | | | |
End of period | | | | | | $ | 840,795,544 | | | | | | | $ | 785,873,304 | |
| | | | |
Undistributed net investment income | | | | | | $ | 66,892 | | | | | | | $ | 66,892 | |
| | | | |
| 1. | For the period from October 31, 2014 (commencement of class operations) to December 31, 2014 |
The accompanying notes are an integral part of these financial statements.
| | | | |
| 18 | | Wells Fargo Advantage California Tax-Free Fund | | Financial highlights |
(For a share outstanding throughout each period)
| | | | | | | | | | | | | | | | | | | | | | | | |
| | | Six months ended
December 31, 2014 (unaudited) | | | Year ended June 30 | |
| CLASS A | | | 2014 | | | 2013 | | | 2012 | | | 2011 | | | 2010 | |
Net asset value, beginning of period | | | $11.73 | | | | $11.21 | | | | $11.37 | | | | $10.53 | | | | $10.69 | | | | $10.14 | |
Net investment income | | | 0.19 | | | | 0.42 | | | | 0.40 | | | | 0.45 | | | | 0.46 | | | | 0.46 | 1 |
Net realized and unrealized gains (losses) on investments | | | 0.27 | | | | 0.52 | | | | (0.16 | ) | | | 0.84 | | | | (0.16 | ) | | | 0.55 | |
| | | | | | | | | | | | | | | | | | | | | | | | |
Total from investment operations | | | 0.46 | | | | 0.94 | | | | 0.24 | | | | 1.29 | | | | 0.30 | | | | 1.01 | |
Distributions to shareholders from | | | | | | | | | | | | | | | | | | | | | | | | |
Net investment income | | | (0.19 | ) | | | (0.42 | ) | | | (0.40 | ) | | | (0.45 | ) | | | (0.46 | ) | | | (0.46 | ) |
Net asset value, end of period | | | $12.00 | | | | $11.73 | | | | $11.21 | | | | $11.37 | | | | $10.53 | | | | $10.69 | |
Total return2 | | | 3.98 | % | | | 8.58 | % | | | 2.06 | % | | | 12.46 | % | | | 2.89 | % | | | 10.10 | % |
Ratios to average net assets (annualized) | | | | | | | | | | | | | | | | | | | | | | | | |
Gross expenses | | | 0.83 | % | | | 0.83 | % | | | 0.83 | % | | | 0.83 | % | | | 0.82 | % | | | 0.86 | % |
Net expenses | | | 0.75 | % | | | 0.75 | % | | | 0.75 | % | | | 0.75 | % | | | 0.75 | % | | | 0.80 | % |
Net investment income | | | 3.24 | % | | | 3.71 | % | | | 3.46 | % | | | 4.08 | % | | | 4.36 | % | | | 4.35 | % |
Supplemental data | | | | | | | | | | | | | | | | | | | | | | | | |
Portfolio turnover rate | | | 13 | % | | | 41 | % | | | 23 | % | | | 41 | % | | | 23 | % | | | 31 | % |
Net assets, end of period (000s omitted) | | | $486,859 | | | | $466,411 | | | | $506,770 | | | | $512,957 | | | | $483,091 | | | | $372,415 | |
| 1. | Calculated based upon average shares outstanding |
| 2. | Total return calculations do not include any sales charges. Returns for periods of less than one year are not annualized. |
The accompanying notes are an integral part of these financial statements.
| | | | | | |
| Financial highlights | | Wells Fargo Advantage California Tax-Free Fund | | | 19 | |
(For a share outstanding throughout each period)
| | | | | | | | | | | | | | | | | | | | | | | | |
| | | Six months ended
December 31, 2014 (unaudited) | | | Year ended June 30 | |
| CLASS B | | | 2014 | | | 2013 | | | 2012 | | | 2011 | | | 2010 | |
Net asset value, beginning of period | | | $11.97 | | | | $11.44 | | | | $11.60 | | | | $10.74 | | | | $10.91 | | | | $10.35 | |
Net investment income | | | 0.15 | 1 | | | 0.34 | 1 | | | 0.32 | 1 | | | 0.38 | 1 | | | 0.39 | 1 | | | 0.39 | 1 |
Net realized and unrealized gains (losses) on investments | | | 0.27 | | | | 0.53 | | | | (0.16 | ) | | | 0.86 | | | | (0.17 | ) | | | 0.56 | |
| | | | | | | | | | | | | | | | | | | | | | | | |
Total from investment operations | | | 0.42 | | | | 0.87 | | | | 0.16 | | | | 1.24 | | | | 0.22 | | | | 0.95 | |
Distributions to shareholders from | | | | | | | | | | | | | | | | | | | | | | | | |
Net investment income | | | (0.15 | ) | | | (0.34 | ) | | | (0.32 | ) | | | (0.38 | ) | | | (0.39 | ) | | | (0.39 | ) |
Net asset value, end of period | | | $12.24 | | | | $11.97 | | | | $11.44 | | | | $11.60 | | | | $10.74 | | | | $10.91 | |
Total return2 | | | 3.54 | % | | | 7.76 | % | | | 1.33 | % | | | 11.66 | % | | | 2.06 | % | | | 9.26 | % |
Ratios to average net assets (annualized) | | | | | | | | | | | | | | | | | | | | | | | | |
Gross expenses | | | 1.58 | % | | | 1.58 | % | | | 1.58 | % | | | 1.58 | % | | | 1.56 | % | | | 1.62 | % |
Net expenses | | | 1.50 | % | | | 1.50 | % | | | 1.50 | % | | | 1.50 | % | | | 1.50 | % | | | 1.55 | % |
Net investment income | | | 2.49 | % | | | 2.97 | % | | | 2.72 | % | | | 3.37 | % | | | 3.57 | % | | | 3.63 | % |
Supplemental data | | | | | | | | | | | | | | | | | | | | | | | | |
Portfolio turnover rate | | | 13 | % | | | 41 | % | | | 23 | % | | | 41 | % | | | 23 | % | | | 31 | % |
Net assets, end of period (000s omitted) | | | $252 | | | | $502 | | | | $966 | | | | $1,618 | | | | $2,566 | | | | $4,286 | |
| 1. | Calculated based upon average shares outstanding |
| 2. | Total return calculations do not include any sales charges. Returns for periods of less than one year are not annualized. |
The accompanying notes are an integral part of these financial statements.
| | | | |
| 20 | | Wells Fargo Advantage California Tax-Free Fund | | Financial highlights |
(For a share outstanding throughout each period)
| | | | | | | | | | | | | | | | | | | | | | | | |
| | | Six months ended
December 31, 2014 (unaudited) | | | Year ended June 30 | |
| CLASS C | | | 2014 | | | 2013 | | | 2012 | | | 2011 | | | 2010 | |
Net asset value, beginning of period | | | $11.96 | | | | $11.43 | | | | $11.59 | | | | $10.74 | | | | $10.90 | | | | $10.35 | |
Net investment income | | | 0.15 | | | | 0.34 | | | | 0.32 | | | | 0.38 | | | | 0.39 | | | | 0.39 | 1 |
Net realized and unrealized gains (losses) on investments | | | 0.27 | | | | 0.53 | | | | (0.16 | ) | | | 0.85 | | | | (0.16 | ) | | | 0.55 | |
| | | | | | | | | | | | | | | | | | | | | | | | |
Total from investment operations | | | 0.42 | | | | 0.87 | | | | 0.16 | | | | 1.23 | | | | 0.23 | | | | 0.94 | |
Distributions to shareholders from | | | | | | | | | | | | | | | | | | | | | | | | |
Net investment income | | | (0.15 | ) | | | (0.34 | ) | | | (0.32 | ) | | | (0.38 | ) | | | (0.39 | ) | | | (0.39 | ) |
Net asset value, end of period | | | $12.23 | | | | $11.96 | | | | $11.43 | | | | $11.59 | | | | $10.74 | | | | $10.90 | |
Total return2 | | | 3.54 | % | | | 7.77 | % | | | 1.33 | % | | | 11.56 | % | | | 2.16 | % | | | 9.16 | % |
Ratios to average net assets (annualized) | | | | | | | | | | | | | | | | | | | | | | | | |
Gross expenses | | | 1.58 | % | | | 1.58 | % | | | 1.58 | % | | | 1.58 | % | | | 1.57 | % | | | 1.62 | % |
Net expenses | | | 1.50 | % | | | 1.50 | % | | | 1.50 | % | | | 1.50 | % | | | 1.50 | % | | | 1.55 | % |
Net investment income | | | 2.49 | % | | | 2.96 | % | | | 2.70 | % | | | 3.31 | % | | | 3.61 | % | | | 3.58 | % |
Supplemental data | | | | | | | | | | | | | | | | | | | | | | | | |
Portfolio turnover rate | | | 13 | % | | | 41 | % | | | 23 | % | | | 41 | % | | | 23 | % | | | 31 | % |
Net assets, end of period (000s omitted) | | | $49,050 | | | | $45,934 | | | | $46,050 | | | | $44,920 | | | | $33,772 | | | | $34,848 | |
| 1. | Calculated based upon average shares outstanding |
| 2. | Total return calculations do not include any sales charges. Returns for periods of less than one year are not annualized. |
The accompanying notes are an integral part of these financial statements.
| | | | | | |
| Financial highlights | | Wells Fargo Advantage California Tax-Free Fund | | | 21 | |
(For a share outstanding throughout each period)
| | | | | | | | | | | | | | | | | | | | | | | | |
| | | Six months ended
December 31, 2014 (unaudited) | | | Year ended June 30 | |
| ADMINISTRATOR CLASS | | | 2014 | | | 2013 | | | 2012 | | | 2011 | | | 2010 | |
Net asset value, beginning of period | | | $11.75 | | | | $11.23 | | | | $11.39 | | | | $10.55 | | | | $10.71 | | | | $10.16 | |
Net investment income | | | 0.21 | | | | 0.44 | | | | 0.43 | | | | 0.48 | | | | 0.48 | | | | 0.48 | |
Net realized and unrealized gains (losses) on investments | | | 0.27 | | | | 0.52 | | | | (0.16 | ) | | | 0.84 | | | | (0.16 | ) | | | 0.56 | |
| | | | | | | | | | | | | | | | | | | | | | | | |
Total from investment operations | | | 0.48 | | | | 0.96 | | | | 0.27 | | | | 1.32 | | | | 0.32 | | | | 1.04 | |
Distributions to shareholders from | | | | | | | | | | | | | | | | | | | | | | | | |
Net investment income | | | (0.21 | ) | | | (0.44 | ) | | | (0.43 | ) | | | (0.48 | ) | | | (0.48 | ) | | | (0.49 | ) |
Net asset value, end of period | | | $12.02 | | | | $11.75 | | | | $11.23 | | | | $11.39 | | | | $10.55 | | | | $10.71 | |
Total return1 | | | 4.08 | % | | | 8.79 | % | | | 2.27 | % | | | 12.67 | % | | | 3.10 | % | | | 10.35 | % |
Ratios to average net assets (annualized) | | | | | | | | | | | | | | | | | | | | | | | | |
Gross expenses | | | 0.77 | % | | | 0.77 | % | | | 0.77 | % | | | 0.76 | % | | | 0.75 | % | | | 0.78 | % |
Net expenses | | | 0.55 | % | | | 0.55 | % | | | 0.55 | % | | | 0.55 | % | | | 0.55 | % | | | 0.55 | % |
Net investment income | | | 3.44 | % | | | 3.91 | % | | | 3.65 | % | | | 4.26 | % | | | 4.54 | % | | | 4.53 | % |
Supplemental data | | | | | | | | | | | | | | | | | | | | | | | | |
Portfolio turnover rate | | | 13 | % | | | 41 | % | | | 23 | % | | | 41 | % | | | 23 | % | | | 31 | % |
Net assets, end of period (000s omitted) | | | $258,509 | | | | $273,026 | | | | $231,383 | | | | $179,670 | | | | $118,170 | | | | $172,814 | |
| 1. | Returns for periods of less than one year are not annualized. |
The accompanying notes are an integral part of these financial statements.
| | | | |
| 22 | | Wells Fargo Advantage California Tax-Free Fund | | Financial highlights |
(For a share outstanding throughout the period)
| | | | |
| INSTITUTIONAL CLASS | | Period ended
December 31, 20141
(unaudited) | |
Net asset value, beginning of period | | | $11.99 | |
Net investment income | | | 0.07 | |
Net realized and unrealized gains (losses) on investments | | | 0.03 | |
| | | | |
Total from investment operations | | | 0.10 | |
Distributions to shareholders from | | | | |
Net investment income | | | (0.07 | ) |
Net asset value, end of period | | | $12.02 | |
Total return2 | | | 0.81 | % |
Ratios to average net assets (annualized) | | | | |
Gross expenses | | | 0.50 | % |
Net expenses | | | 0.48 | % |
Net investment income | | | 3.45 | % |
Supplemental data | | | | |
Portfolio turnover rate | | | 13 | % |
Net assets, end of period (000s omitted) | | | $46,125 | |
| 1. | For the period from October 31, 2014 (commencement of class operations) to December 31, 2014 |
| 2. | Returns for periods of less than one year are not annualized. |
The accompanying notes are an integral part of these financial statements.
| | | | | | |
| Notes to financial statements (unaudited) | | Wells Fargo Advantage California Tax-Free Fund | | | 23 | |
1. ORGANIZATION
Wells Fargo Funds Trust (the “Trust”), a Delaware statutory trust organized on March 10, 1999, is an open-end management investment company registered under the Investment Company Act of 1940, as amended (the “1940 Act”). As an investment company, the Trust follows the accounting and reporting guidance in FASB Accounting Standards Codification 946. These financial statements report on the Wells Fargo Advantage California Tax-Free Fund (the “Fund”) which is a non-diversified series of the Trust.
2. SIGNIFICANT ACCOUNTING POLICIES
The following significant accounting policies, which are consistently followed in the preparation of the financial statements of the Fund, are in conformity with U.S. generally accepted accounting principles which require management to make estimates and assumptions that affect the reported amounts of assets and liabilities, disclosure of contingent assets and liabilities at the date of the financial statements, and the reported amounts of revenues and expenses during the reporting period. Actual results could differ from those estimates.
Securities valuation
All investments are valued each business day as of the close of regular trading on the New York Stock Exchange (generally 4 p.m. Eastern Time).
Fixed income securities acquired with maturities exceeding 60 days are valued based on evaluated bid prices provided by an independent pricing service which may utilize both transaction data and market information such as yield, quality, coupon rate, maturity, type of issue, trading characteristics and other market data. If prices are not available from the independent pricing service or prices received are deemed not representative of market value, prices will be obtained from an independent broker-dealer.
Short-term securities, with maturities of 60 days or less at time of purchase, generally are valued at amortized cost which approximates fair value. The amortized cost method involves valuing a security at its cost, plus accretion of discount or minus amortization of premium over the period until maturity.
Investments in registered open-end investment companies are valued at net asset value.
Investments which are not valued using any of the methods discussed above are valued at their fair value, as determined in good faith by the Board of Trustees of the Fund. The Board of Trustees has established a Valuation Committee comprised of the Trustees and has delegated to it the authority to take any actions regarding the valuation of portfolio securities that the Valuation Committee deems necessary or appropriate, including determining the fair value of portfolio securities, unless the determination has been delegated to the Management Valuation Team of Wells Fargo Funds Management, LLC (“Funds Management”). The Board of Trustees retains the authority to make or ratify any valuation decisions or approve any changes to the Valuation Procedures as it deems appropriate. On a quarterly basis, the Board of Trustees receives reports on any valuation actions taken by the Valuation Committee or the Management Valuation Team which may include items for ratification.
Valuations of fair valued securities are compared to the next actual sales price when available, or other appropriate market values, to assess the continued appropriateness of the fair valuation methodologies used. These securities are fair valued on a day-to-day basis, taking into consideration changes to appropriate market information and any significant changes to the inputs considered in the valuation process until there is a readily available price provided on an exchange or by an independent pricing service. Valuations received from an independent pricing service or independent broker-dealer quotes are periodically validated by comparisons to most recent trades and valuations provided by other independent pricing services in addition to the review of prices by the adviser and/or subadviser. Unobservable inputs used in determining fair valuations are identified based on the type of security, taking into consideration factors utilized by market participants in valuing the investment, knowledge about the issuer and the current market environment.
When-issued transactions
The Fund may purchase securities on a forward commitment or when-issued basis. The Fund records a when-issued transaction on the trade date and will segregate assets in an amount at least equal in value to the Fund’s commitment to purchase when-issued securities. Securities purchased on a when-issued basis are marked-to-market daily and the Fund begins earning interest on the settlement date. Losses may arise due to changes in the market value of the underlying securities or if the counterparty does not perform under the contract.
Security transactions and income recognition
Securities transactions are recorded on a trade date basis. Realized gains or losses are recorded on the basis of identified cost.
| | | | |
| 24 | | Wells Fargo Advantage California Tax-Free Fund | | Notes to financial statements (unaudited) |
Interest income is accrued daily and bond discounts are accreted and premiums are amortized daily based on the effective interest method. To the extent debt obligations are placed on non-accrual status, any related interest income may be reduced by writing off interest receivables when the collection of all or a portion of interest has become doubtful based on consistently applied procedures. If the issuer subsequently resumes interest payments or when the collectability of interest is reasonably assured, the debt obligation is removed from non-accrual status.
Distributions to shareholders
Distributions to shareholders from net investment income are accrued daily and paid monthly. Distributions from net realized gains, if any, are recorded on the ex-dividend date. Such distributions are determined in conformity with federal income tax regulations, which may differ in amount or character from net investment income and realized gains recognized for purposes of U.S. generally accepted accounting principles.
Federal and other taxes
The Fund intends to continue to qualify as a regulated investment company by distributing substantially all of its investment company taxable and tax-exempt income and any net realized capital gains (after reduction for capital loss carryforwards) sufficient to relieve it from all, or substantially all, federal income taxes. Accordingly, no provision for federal income taxes was required.
The Fund’s income and federal excise tax returns and all financial records supporting those returns for the prior three fiscal years are subject to examination by the federal and Delaware revenue authorities. Management has analyzed the Fund’s tax positions taken on federal, state, and foreign tax returns for all open tax years and does not believe that there are any uncertain tax positions that require recognition of a tax liability.
As of June 30, 2014, capital loss carryforwards available to offset future net realized capital gains were as follows through the indicated expiration date:
| | | | |
| | | No expiration |
| 2018 | | Short-term | | Long-term |
| $4,667,645 | | $7,857,297 | | $112,651 |
Class allocations
The separate classes of shares offered by the Fund differ principally in applicable sales charges, distribution, shareholder servicing, and administration fees. Class specific expenses are charged directly to that share class. Investment income, common expenses, and realized and unrealized gains (losses) on investments are allocated daily to each class of shares based on the relative proportion of net assets of each class.
3. FAIR VALUATION MEASUREMENTS
Fair value measurements of investments are determined within a framework that has established a fair value hierarchy based upon the various data inputs utilized in determining the value of the Fund’s investments. The three-level hierarchy gives the highest priority to unadjusted quoted prices in active markets for identical assets or liabilities (Level 1) and the lowest priority to significant unobservable inputs (Level 3). The Fund’s investments are classified within the fair value hierarchy based on the lowest level of input that is significant to the fair value measurement. The inputs are summarized into three broad levels as follows:
| n | | Level 1 – quoted prices in active markets for identical securities |
| n | | Level 2 – other significant observable inputs (including quoted prices for similar securities, interest rates, prepayment speeds, credit risk, use of amortized cost, etc.) |
| n | | Level 3 – significant unobservable inputs (including the Fund’s own assumptions in determining the fair value of investments) |
The inputs or methodologies used for valuing investments in securities are not necessarily an indication of the risk associated with investing in those securities.
| | | | | | |
| Notes to financial statements (unaudited) | | Wells Fargo Advantage California Tax-Free Fund | | | 25 | |
The following is a summary of the inputs used in valuing the Fund’s assets and liabilities as of December 31, 2014:
| | | | | | | | | | | | | | | | |
| | | Quoted prices
(Level 1) | | | Other significant
observable inputs
(Level 2) | | | Significant
unobservable inputs
(Level 3) | | | Total | |
Assets | | | | | | | | | | | | | | | | |
Investments in : | | | | | | | | | | | | | | | | |
| | | | |
Municipal obligations | | $ | 0 | | | $ | 820,904,939 | | | $ | 0 | | | $ | 820,904,939 | |
| | | | |
Other | | | 0 | | | | 2,498,000 | | | | 0 | | | | 2,498,000 | |
| | | | |
Short-term investments | | | | | | | | | | | | | | | | |
Investment companies | | | 8,148,838 | | | | 0 | | | | 0 | | | | 8,148,838 | |
Total assets | | $ | 8,148,838 | | | $ | 823,402,939 | | | $ | 0 | | | $ | 831,551,777 | |
Transfers in and transfers out are recognized at the end of the reporting period. At December 31, 2014, the Fund did not have any transfers into/out of Level 1, Level 2, or Level 3.
4. TRANSACTIONS WITH AFFILIATES
Advisory fee
The Trust has entered into an advisory contract with Funds Management, an indirect wholly owned subsidiary of Wells Fargo & Company (“Wells Fargo”). The adviser is responsible for implementing investment policies and guidelines and for supervising the subadviser, who is responsible for day-to-day portfolio management of the Fund.
Pursuant to the contract, Funds Management is entitled to receive an annual advisory fee starting at 0.35% and declining to 0.25% as the average daily net assets of the Fund increase. For the six months ended December 31, 2014, the advisory fee was equivalent to an annual rate of 0.34% of the Fund’s average daily net assets.
Funds Management has retained the services of a subadviser to provide daily portfolio management to the Fund. The fee for subadvisory services is borne by Funds Management. Wells Capital Management Incorporated, an affiliate of Funds Management and an indirect wholly owned subsidiary of Wells Fargo, is the subadviser to the Fund and is entitled to receive a fee from Funds Management at an annual rate starting at 0.20% and declining to 0.10% as the average daily net assets of the Fund increase.
Administration fees
The Trust has entered into an administration agreement with Funds Management. Under this agreement, for providing administrative services, which includes paying fees and expenses for services provided by the transfer agent, sub-transfer agents, omnibus account servicers and record-keepers, Funds Management is entitled to receive from the Fund an annual fund level administration fee starting at 0.05% and declining to 0.03% as the average daily net assets of the Fund increase and a class level administration fee which is calculated based on the average daily net assets of each class as follows:
| | | | |
| | | Class level
administration fee | |
Class A, Class B, Class C | | | 0.16 | % |
Administrator Class | | | 0.10 | |
Institutional Class | | | 0.08 | |
Funds Management has contractually waived and/or reimbursed advisory and administration fees to the extent necessary to maintain certain net operating expense ratios for the Fund. Waiver of fees and/or reimbursement of expenses by Funds Management were made first from fund level expenses on a proportionate basis and then from class specific expenses. Funds Management has committed through October 31, 2016 to waive fees and/or reimburse expenses to the extent necessary to cap the Fund’s expenses at 0.75% for Class A shares, 1.50% for Class B shares, 1.50% for Class C shares, 0.55% for Administrator Class shares, and 0.48% for Institutional Class shares. After this time, the cap may be increased or the commitment to maintain the cap may be terminated only with the approval of the Board of Trustees.
| | | | |
| 26 | | Wells Fargo Advantage California Tax-Free Fund | | Notes to financial statements (unaudited) |
Distribution fees
The Trust has adopted a Distribution Plan for Class B and Class C shares of the Fund pursuant to Rule 12b-1 under the 1940 Act. Distribution fees are charged to Class B and Class C shares and paid to Wells Fargo Funds Distributor, LLC (“Funds Distributor”), the principal underwriter, at an annual rate of 0.75% of the average daily net assets of Class B and Class C shares.
In addition, Funds Distributor is entitled to receive the front-end sales charge from the purchase of Class A shares and a contingent deferred sales charge on the redemption of certain shares. Funds Distributor is also entitled to receive the contingent deferred sales charges from redemptions of Class B and Class C shares. For the six months ended December 31, 2014, Funds Distributor received $13,031 from the sale of Class A shares.
Shareholder servicing fees
The Trust has entered into contracts with one or more shareholder servicing agents, whereby Class A, Class B, Class C, and Administrator Class of the Fund is charged a fee at an annual rate of 0.25% of the average daily net assets of each respective class.
A portion of these total shareholder servicing fees were paid to affiliates of Wells Fargo.
5. INVESTMENT PORTFOLIO TRANSACTIONS
Purchases and sales of investments, excluding U.S. government obligations (if any) and short-term securities, for the six months ended December 31, 2014 were $142,517,298 and $93,391,493 respectively.
6. BANK BORROWINGS
The Trust (excluding the money market funds and certain other funds in the Trust) and Wells Fargo Variable Trust are parties to a $150,000,000 revolving credit agreement, whereby the Fund is permitted to use bank borrowings for temporary or emergency purposes, such as to fund shareholder redemption requests. Interest under the credit agreement is charged to the Fund based on a borrowing rate equal to the higher of the Federal Funds rate in effect on that day plus 1.25% or the overnight LIBOR rate in effect on that day plus 1.25%. In addition, an annual commitment fee equal to 0.10% of the unused balance is allocated to each participating fund. For the six months ended December 31, 2014, the Fund paid $430 in commitment fees.
For the six months ended December 31, 2014, there were no borrowings by the Fund under the agreement.
7. CONCENTRATION RISK
The Fund invests a substantial portion of its assets in issuers of municipal debt securities located in a single state or territories of the U.S. Therefore, it may be more affected by economic and political developments in that state or region than would be a comparable general tax-exempt fund.
8. INDEMNIFICATION
Under the Trust’s organizational documents, the officers and Trustees are indemnified against certain liabilities that may arise out of performance of their duties to the Trust. Additionally, in the normal course of business, the Trust may enter into contracts with service providers that contain a variety of indemnification clauses. The Trust’s maximum exposure under these arrangements is dependent on future claims that may be made against the Fund and, therefore, cannot be estimated.
| | | | | | |
| Other information (unaudited) | | Wells Fargo Advantage California Tax-Free Fund | | | 27 | |
PROXY VOTING INFORMATION
A description of the policies and procedures that the Fund uses to determine how to vote proxies relating to portfolio securities is available without charge, upon request, by calling 1-800-222-8222, visiting our website at wellsfargoadvantagefunds.com, or visiting the SEC website at sec.gov. Information regarding how the Fund voted proxies relating to portfolio securities during the most recent 12-month period ended June 30 is available without charge on the Fund’s website at wellsfargoadvantagefunds.com or by visiting the SEC website at sec.gov.
PORTFOLIO HOLDINGS INFORMATION
The complete portfolio holdings for the Fund are publicly available monthly on the Fund’s website (wellsfargoadvantagefunds.com), on a one-month delayed basis. In addition, top ten holdings information (excluding derivative positions) for the Fund is publicly available on the Fund’s website on a monthly, seven-day or more delayed basis. The Fund files its complete schedule of portfolio holdings with the SEC for the first and third quarters of each fiscal year on Form N-Q, which is available by visiting the SEC website at sec.gov. In addition, the Fund’s Form N-Q may be reviewed and copied at the SEC’s Public Reference Room in Washington, DC, and at regional offices in New York City, at 233 Broadway, and in Chicago, at 175 West Jackson Boulevard, Suite 900. Information about the Public Reference Room may be obtained by calling 1-800-SEC-0330.
| | | | |
| 28 | | Wells Fargo Advantage California Tax-Free Fund | | Other information (unaudited) |
BOARD OF TRUSTEES AND OFFICERS
Each of the Trustees and Officers1 listed in the table below acts in identical capacities for each fund in the Wells Fargo Advantage family of funds, which consists of 134 mutual funds comprising the Wells Fargo Funds Trust, Wells Fargo Variable Trust, Wells Fargo Master Trust and four closed-end funds (collectively the “Fund Complex”). This table should be read in conjunction with the Prospectus and the Statement of Additional Information2. The mailing address of each Trustee and Officer is 525 Market Street, 12th Floor, San Francisco, CA 94105. Each Trustee and Officer serves an indefinite term, however, each Trustee serves such term until reaching the mandatory retirement age established by the Trustees.
Independent Trustees
| | | | | | |
Name and year of birth | | Position held and length of service* | | Principal occupations during past five years or longer | | Other
directorships during
past five years |
| Peter G. Gordon (Born 1942) | | Trustee, since 1998; Chairman, since 2005 | | Co-Founder, Retired Chairman, President and CEO of Crystal Geyser Water Company. Trustee Emeritus, Colby College. | | Asset Allocation Trust |
| Isaiah Harris, Jr. (Born 1952) | | Trustee, since 2009 | | Retired. Prior thereto, President and CEO of BellSouth Advertising and Publishing Corp. from 2005 to 2007, President and CEO of BellSouth Enterprises from 2004 to 2005 and President of BellSouth Consumer Services from 2000 to 2003. Emeritus member of the Iowa State University Foundation Board of Governors. Emeritus Member of the Advisory Board of Iowa State University School of Business. Advisory Board Member, Palm Harbor Academy. Mr. Harris is a certified public accountant. | | CIGNA Corporation; Asset Allocation Trust |
| Judith M. Johnson (Born 1949) | | Trustee, since 2008; Audit Committee Chairman, since 2008 | | Retired. Prior thereto, Chief Executive Officer and Chief Investment Officer of Minneapolis Employees Retirement Fund from 1996 to 2008. Ms. Johnson is an attorney, certified public accountant and a certified managerial accountant. | | Asset Allocation Trust |
| Leroy Keith, Jr. (Born 1939) | | Trustee, since 2010** | | Chairman, Bloc Global Services (development and construction). Trustee of the Evergreen Funds complex (and its predecessors) from 1983 to 2010. Former Managing Director, Almanac Capital Management (commodities firm), former Partner, Stonington Partners, Inc. (private equity fund), former Director, Obagi Medical Products Co. and former Director, Lincoln Educational Services. | | Trustee, Virtus Fund Complex (consisting of 50 portfolios as of 12/16/2013); Asset Allocation Trust |
| David F. Larcker (Born 1950) | | Trustee, since 2009 | | James Irvin Miller Professor of Accounting at the Graduate School of Business, Stanford University, Morgan Stanley Director of the Center for Leadership Development and Research and Senior Faculty of The Rock Center for Corporate Governance since 2006. From 2005 to 2008, Professor of Accounting at the Graduate School of Business, Stanford University. Prior thereto, Ernst & Young Professor of Accounting at The Wharton School, University of Pennsylvania from 1985 to 2005. | | Asset Allocation Trust |
| Olivia S. Mitchell (Born 1953) | | Trustee, since 2006 | | International Foundation of Employee Benefit Plans Professor, Wharton School of the University of Pennsylvania since 1993. Director of Wharton’s Pension Research Council and Boettner Center on Pensions & Retirement Research, and Research Associate at the National Bureau of Economic Research. Previously, Cornell University Professor from 1978 to 1993. | | Asset Allocation Trust |
| Timothy J. Penny (Born 1951) | | Trustee, since 1996 | | President and CEO of Southern Minnesota Initiative Foundation, a non-profit organization, since 2007 and Senior Fellow at the Humphrey Institute Policy Forum at the University of Minnesota since 1995. Member of the Board of Trustees of NorthStar Education Finance, Inc., a non-profit organization, since 2007. | | Asset Allocation Trust |
| | | | | | |
| Other information (unaudited) | | Wells Fargo Advantage California Tax-Free Fund | | | 29 | |
| | | | | | |
Name and year of birth | | Position held and length of service* | | Principal occupations during past five years or longer | | Other
directorships during
past five years |
| Michael S. Scofield (Born 1943) | | Trustee, since 2010 | | Served on the Investment Company Institute’s Board of Governors and Executive Committee from 2008-2011 as well the Governing Council of the Independent Directors Council from 2006-2011 and the Independent Directors Council Executive Committee from 2008-2011. Chairman of the IDC from 2008-2010. Institutional Investor (Fund Directions) Trustee of Year in 2007. Trustee of the Evergreen Funds complex (and its predecessors) from 1984 to 2010. Chairman of the Evergreen Funds from 2000-2010. Former Trustee of the Mentor Funds. Retired Attorney, Law Offices of Michael S. Scofield. | | Asset Allocation Trust |
| Donald C. Willeke (Born 1940) | | Trustee, since 1996 | | Principal of the law firm of Willeke & Daniels. General Counsel of the Minneapolis Employees Retirement Fund from 1984 until its consolidation into the Minnesota Public Employees Retirement Association on June 30, 2010. Director and Vice Chair of The Tree Trust (non-profit corporation). Director of the American Chestnut Foundation (non-profit corporation). | | Asset Allocation Trust |
| * | Length of service dates reflect the Trustee’s commencement of service with the Trust’s predecessor entities, where applicable. |
| ** | Leroy Keith, Jr. retired as a Trustee effective December 31, 2014. |
Officers
| | | | | | |
Name and year of birth | | Position held and
length of service | | Principal occupations during past five years or longer | | |
| Karla M. Rabusch (Born 1959) | | President, since 2003 | | Executive Vice President of Wells Fargo Bank, N.A. and President of Wells Fargo Funds Management, LLC since 2003. | | |
Nancy Wiser1 (Born 1967) | | Treasurer, since 2012 | | Executive Vice President of Wells Fargo Funds Management, LLC since 2011. Chief Operating Officer and Chief Compliance Officer at LightBox Capital Management LLC, from 2008 to 2011. Owned and operated a consulting business providing services to various hedge funds including acting as Chief Operating Officer and Chief Compliance Officer for a hedge fund from 2007 to 2008. Chief Operating Officer and Chief Compliance Officer of GMN Capital LLC from 2006 to 2007. | | |
| C. David Messman (Born 1960) | | Secretary, since 2000; Chief Legal Officer, since 2003 | | Assistant General Counsel of Wells Fargo Bank, N.A. since 2013 and Vice President and Managing Counsel of Wells Fargo Bank N.A. from 1996 to 2013. Senior Vice President and Secretary of Wells Fargo Funds Management , LLC since 2001. | | |
| Debra Ann Early (Born 1964) | | Chief Compliance Officer, since 2007 | | Senior Vice President of Wells Fargo Funds Management, LLC since 2007 and Chief Compliance Officer from 2007 to 2014. Chief Compliance Officer of Parnassus Investments from 2005 to 2007. Chief Financial Officer of Parnassus Investments from 2004 to 2007 and Senior Audit Manager of PricewaterhouseCoopers LLP from 1998 to 2004. | | |
| David Berardi (Born 1975) | | Assistant Treasurer, since 2009 | | Vice President of Wells Fargo Funds Management, LLC since 2009. Vice President of Evergreen Investment Management Company, LLC from 2008 to 2010. Assistant Vice President of Evergreen Investment Services, Inc. from 2004 to 2008. Manager of Fund Reporting and Control for Evergreen Investment Management Company, LLC from 2004 to 2010. | | |
| Jeremy DePalma1 (Born 1974) | | Assistant Treasurer, since 2009 | | Senior Vice President of Wells Fargo Funds Management, LLC since 2009. Senior Vice President of Evergreen Investment Management Company, LLC from 2008 to 2010. Vice President, Evergreen Investment Services, Inc. from 2004 to 2007. Head of the Fund Reporting and Control Team within Fund Administration from 2005 to 2010. | | |
| 1. | Nancy Wiser acts as Treasurer of 73 funds in the Fund Complex. Jeremy DePalma acts as Treasurer of 61 funds and Assistant Treasurer of 73 funds in the Fund Complex. |
| 2. | The Statement of Additional Information includes additional information about the Trustees and is available, without charge, upon request, by calling 1-800-222-8222 or by visiting the website at wellsfargoadvantagefunds.com. |
| | | | |
| 30 | | Wells Fargo Advantage California Tax-Free Fund | | List of abbreviations |
The following is a list of common abbreviations for terms and entities that may have appeared in this report.
| ACA | — ACA Financial Guaranty Corporation |
| ADR | — American depositary receipt |
| ADS | — American depositary shares |
| AGC | — Assured Guaranty Corporation |
| AGM | — Assured Guaranty Municipal |
| Ambac | — Ambac Financial Group Incorporated |
| AMT | — Alternative minimum tax |
| BAN | — Bond anticipation notes |
| BHAC | — Berkshire Hathaway Assurance Corporation |
| CAB | — Capital appreciation bond |
| CCAB | — Convertible capital appreciation bond |
| CDA | — Community Development Authority |
| CDO | — Collateralized debt obligation |
| DRIVER | — Derivative inverse tax-exempt receipts |
| DW&P | — Department of Water & Power |
| DWR | — Department of Water Resources |
| ECFA | — Educational & Cultural Facilities Authority |
| EDA | — Economic Development Authority |
| EDFA | — Economic Development Finance Authority |
| ETF | — Exchange-traded fund |
| FDIC | — Federal Deposit Insurance Corporation |
| FFCB | — Federal Farm Credit Banks |
| FGIC | — Financial Guaranty Insurance Corporation |
| FHA | — Federal Housing Administration |
| FHLB | — Federal Home Loan Bank |
| FHLMC | — Federal Home Loan Mortgage Corporation |
| FICO | — The Financing Corporation |
| FNMA | — Federal National Mortgage Association |
| GDR | — Global depositary receipt |
| GNMA | — Government National Mortgage Association |
| HCFR | — Healthcare facilities revenue |
| HEFA | — Health & Educational Facilities Authority |
| HEFAR | — Higher education facilities authority revenue |
| HFA | — Housing Finance Authority |
| HFFA | — Health Facilities Financing Authority |
| HUD | — Department of Housing and Urban Development |
| IDA | — Industrial Development Authority |
| IDAG | — Industrial Development Agency |
| KRW | — Republic of Korea won |
| LIBOR | — London Interbank Offered Rate |
| LLC | — Limited liability company |
| LLLP | — Limited liability limited partnership |
| LLP | — Limited liability partnership |
| MBIA | — Municipal Bond Insurance Association |
| MFHR | — Multifamily housing revenue |
| MSTR | — Municipal securities trust receipts |
| MUD | — Municipal Utility District |
| National | — National Public Finance Guarantee Corporation |
| PCFA | — Pollution Control Financing Authority |
| PCL | — Public Company Limited |
| PCR | — Pollution control revenue |
| PFA | — Public Finance Authority |
| PFFA | — Public Facilities Financing Authority |
| PFOTER | — Puttable floating option tax-exempt receipts |
| plc | — Public limited company |
| PUTTER | — Puttable tax-exempt receipts |
| R&D | — Research & development |
| Radian | — Radian Asset Assurance |
| RAN | — Revenue anticipation notes |
| RDA | — Redevelopment Authority |
| RDFA | — Redevelopment Finance Authority |
| REIT | — Real estate investment trust |
| ROC | — Reset option certificates |
| SAVRS | — Select auction variable rate securities |
| SBA | — Small Business Authority |
| SFHR | — Single-family housing revenue |
| SFMR | — Single-family mortgage revenue |
| SPA | — Standby purchase agreement |
| SPDR | — Standard & Poor’s Depositary Receipts |
| STRIPS | — Separate trading of registered interest and |
| TAN | — Tax anticipation notes |
| TIPS | — Treasury inflation-protected securities |
| TRAN | — Tax revenue anticipation notes |
| TTFA | — Transportation Trust Fund Authority |
| TVA | — Tennessee Valley Authority |
This page is intentionally left blank.
This page is intentionally left blank.


For more information
More information about Wells Fargo Advantage Funds is available free upon request. To obtain literature, please write, email, visit the Fund’s website, or call:
Wells Fargo Advantage Funds
P.O. Box 8266
Boston, MA 02266-8266
Email: wfaf@wellsfargo.com
Website: wellsfargoadvantagefunds.com
Individual investors: 1-800-222-8222
Retail investment professionals: 1-888-877-9275
Institutional investment professionals: 1-866-765-0778
This report and the financial statements contained herein are submitted for the general information of the shareholders of Wells Fargo Advantage Funds. If this report is used for promotional purposes, distribution of the report must be accompanied or preceded by a current prospectus. Before investing, please consider the investment objectives, risks, charges, and expenses of the investment. For a current prospectus and, if available, a summary prospectus, containing this information, call 1-800-222-8222 or visit the Fund’s website at wellsfargoadvantagefunds.com. Read the prospectus carefully before you invest or send money.
Wells Fargo Funds Management, LLC, a wholly owned subsidiary of Wells Fargo & Company, provides investment advisory and administrative services for Wells Fargo Advantage Funds. Other affiliates of Wells Fargo & Company provide subadvisory and other services for the Funds. The Funds are distributed by Wells Fargo Funds Distributor, LLC, Member FINRA/SIPC, an affiliate of Wells Fargo & Company.
NOT FDIC INSURED ¡ NO BANK GUARANTEE ¡ MAY LOSE VALUE
© 2014 Wells Fargo Funds Management, LLC. All rights reserved.
| | |
 | | 230422 02-15 SA249/SAR249 12-14 |

Wells Fargo Advantage Colorado Tax-Free Fund

Semi-Annual Report
December 31, 2014

Reduce clutter. Save trees.
Sign up for electronic delivery of prospectuses and shareholder reports at wellsfargo.com/advantagedelivery
Contents
The views expressed and any forward-looking statements are as of December 31, 2014, unless otherwise noted, and are those of the Fund managers and/or Wells Fargo Funds Management, LLC. Discussions of individual securities, or the markets generally, or any Wells Fargo Advantage Fund are not intended as individual recommendations. Future events or results may vary significantly from those expressed in any forward-looking statements; the views expressed are subject to change at any time in response to changing circumstances in the market. Wells Fargo Funds Management, LLC and the Fund disclaim any obligation to publicly update or revise any views expressed or forward-looking statements.
NOT FDIC INSURED ¡ NO BANK GUARANTEE ¡ MAY LOSE VALUE
| | | | |
| 2 | | Wells Fargo Advantage Colorado Tax-Free Fund | | Letter to shareholders (unaudited) |

Karla M. Rabusch
President
Wells Fargo Advantage Funds
Municipal bonds rose in the second half of 2014, helped by lower interest rates and strong demand for yield.
Dear Valued Shareholder:
We are pleased to provide you with this semi-annual report for the Wells Fargo Advantage Colorado Tax-Free Fund for the six-month period that ended December 31, 2014. Municipal bonds rose in the second half of 2014, helped by lower interest rates and strong demand for yield. In fact, the longest-dated and weakest credits had the strongest returns. Municipal bond returns—as measured by the Barclays Municipal Bond Index1, the broadest measure for tracking investment-grade municipal bonds throughout the country—gained 2.88% for the six-month period that ended December 31, 2014.
Longer-maturity and lower-rated municipal bonds outperformed.
At the front end of the yield curve, municipal bond yields were extremely low because of the accommodative monetary policy. Throughout the reporting period, the Federal Open Market Committee (FOMC)—the U.S. Federal Reserve’s (Fed’s) monetary policymaking body—kept its key interest rate near zero in order to support the economy and the financial system. Policymakers said they can be patient in normalizing monetary policy and that any increases in the target range for the federal funds rate will depend on incoming economic data. During the reporting period, the Fed reduced (or tapered) the size of its quantitative easing program each month until the program ended in October 2014, although it continues to reinvest principal and interest payments of the mortgage-backed securities and Treasury bonds it holds.
Longer-term yields declined during the second half of the year, with 10-year municipal yields declining from 2.33% as of June 30, 2014 to 2.10% as of December 31, 2014. For more perspective, the yield curve was steep on a historical basis at the beginning of the period and ended the period with the difference between 30-year and 2-year yields at 237 basis points (bps; 100 bps equals 1.00%), which was only slightly wider than its historical average. Because the yield curve was steep, longer-dated securities had higher yields. Given their longer maturities (as municipal yields fell further out the curve) and their more generous yields, longer-term bond returns outpaced shorter-term bonds.
Investors were also enticed to buy lower-rated securities for their higher yields. Over the six-month period that ended December 31, 2014, AAA-rated municipal bonds returned 2.04% while BBB-rated bonds returned 4.29%, according to the Barclays Municipal Bond Index. Credit conditions continued to improve, as evidenced by an 18th consecutive quarter of positive year-over-year gains in state and local municipal revenues. In addition to better fundamental credit conditions, technical factors of limited supply alongside strong investor demand also supported municipal bonds.
Puerto Rico’s struggle, the exit of two cities from bankruptcy, and pension issues topped credit news.
Puerto Rico was the asset class’s largest single credit story. Bonds from the commonwealth returned a meager 0.79% during the six-month period as population declines, a contracting economy, and a burdensome level of debt held back results. Meanwhile, the cities of Stockton, California, and Detroit, Michigan, exited bankruptcy by curbing retiree health care benefits and bondholder recoveries but largely avoiding concessions on pensions. While these recent bankruptcies have so far treated pensions better than bonded debt, no clear
| 1. | The Barclays Municipal Bond Index is an unmanaged index composed of long-term tax-exempt bonds with a minimum credit rating of Baa. You cannot invest directly in an index. |
| | | | | | |
| Letter to shareholders (unaudited) | | Wells Fargo Advantage Colorado Tax-Free Fund | | | 3 | |
precedent has been established due to the difference in general obligation pledges and court-ordered versus negotiated concessions. Finally, underfunded pensions in Illinois, New Jersey, Pennsylvania, and Kansas gained attention for their negative fiscal effects and the political difficulties of finding a resolution.
Don’t let short-term uncertainty derail long-term investment goals.
Periods of uncertainty can present challenges, but experience has taught us that maintaining long-term investment goals can be an effective way to plan for the future. To help you create a sound strategy based on your personal goals and risk tolerance, Wells Fargo Advantage Funds offers more than 100 mutual funds and other investments spanning a wide range of asset classes and investment styles. Although diversification cannot guarantee an investment profit or prevent losses, we believe it can be an effective way to manage investment risk and potentially smooth out overall portfolio performance. We encourage investors to know their investments and to understand that appropriate levels of risk-taking may unlock opportunities.
Thank you for choosing to invest with Wells Fargo Advantage Funds. We appreciate your confidence in us and remain committed to helping you meet your financial needs. For current information about your fund investments, contact your investment professional, visit our website at wellsfargoadvantagefunds.com, or call us directly at 1-800-222-8222. We are available 24 hours a day, 7 days a week.
Sincerely,

Karla M. Rabusch
President
Wells Fargo Advantage Funds
Periods of uncertainty can present challenges, but experience has taught us that maintaining long-term investment goals can be an effective way to plan for the future.
| | | | |
| 4 | | Wells Fargo Advantage Colorado Tax-Free Fund | | Performance highlights (unaudited) |
Investment objective
The Fund seeks current income exempt from federal income tax and Colorado individual income tax.
Adviser
Wells Fargo Funds Management, LLC
Subadviser
Wells Capital Management Incorporated
Portfolio managers
Terry J. Goode
Adrian Van Poppel
Average annual total returns1 (%) as of December 31, 2014
| | | | | | | | | | | | | | | | | | | | | | | | | | | | | | | | | | |
| | | | | Including sales charge | | | Excluding sales charge | | | Expense ratios2 (%) | |
| | | Inception date | | 1 year | | | 5 year | | | 10 year | | | 1 year | | | 5 year | | | 10 year | | | Gross | | | Net3 | |
| Class A (NWCOX) | | 7-31-1995 | | | 5.89 | | | | 4.23 | | | | 3.71 | | | | 10.87 | | | | 5.20 | | | | 4.19 | | | | 0.94 | | | | 0.85 | |
| Class B (NWCBX)* | | 8-2-1993 | | | 5.39 | | | | 4.14 | | | | 3.64 | | | | 10.39 | | | | 4.48 | | | | 3.64 | | | | 1.69 | | | | 1.60 | |
| Class C (WCOTX) | | 3-31-2008 | | | 9.04 | | | | 4.41 | | | | 3.40 | | | | 10.04 | | | | 4.41 | | | | 3.40 | | | | 1.69 | | | | 1.60 | |
| Administrator Class (NCOTX) | | 8-23-1993 | | | – | | | | – | | | | – | | | | 11.15 | | | | 5.46 | | | | 4.45 | | | | 0.88 | | | | 0.60 | |
| Barclays Municipal Bond Index4 | | – | | | – | | | | – | | | | – | | | | 9.05 | | | | 5.16 | | | | 4.74 | | | | – | | | | – | |
| Barclays Colorado Municipal Bond Index5 | | – | | | – | | | | – | | | | – | | | | 11.27 | | | | 5.96 | | | | 5.13 | | | | – | | | | – | |
| * | | Effective January 7, 2015, Class B shares are no longer offered by the Fund. |
Figures quoted represent past performance, which is no guarantee of future results, and do not reflect taxes that a shareholder may pay on fund distributions or the redemption of fund shares. Investment return and principal value of an investment will fluctuate so that an investor’s shares, when redeemed, may be worth more or less than their original cost. Performance shown without sales charges would be lower if sales charges were reflected. Current performance may be lower or higher than the performance data quoted, which assumes the reinvestment of dividends and capital gains. Current month-end performance is available on the Fund’s website, wellsfargoadvantagefunds.com.
Index returns do not include transaction costs associated with buying and selling securities, any mutual fund fees or expenses, or any taxes. It is not possible to invest directly in an index.
For Class A shares, the maximum front-end sales charge is 4.50%. For Class B shares, the maximum contingent deferred sales charge is 5.00%. For Class C shares, the maximum contingent deferred sales charge is 1.00%. Performance including a contingent deferred sales charge assumes the sales charge for the corresponding time period. Administrator Class shares are sold without a front-end sales charge or contingent deferred sales charge.
Bond values fluctuate in response to the financial condition of individual issuers, general market and economic conditions, and changes in interest rates. Changes in market conditions and government policies may lead to periods of heightened volatility in the bond market and reduced liquidity for certain bonds held by the Fund. In general, when interest rates rise, bond values fall and investors may lose principal value. Interest-rate changes and their impact on the Fund and its share price can be sudden and unpredictable. The use of derivatives may reduce returns and/or increase volatility. Certain investment strategies tend to increase the total risk of an investment (relative to the broader market). The Fund is exposed to California municipal securities risk, high-yield securities risk, and nondiversification risk. Consult the Fund’s prospectus for additional information on these and other risks. A portion of the Fund’s income may be subject to federal, state, and/or local income taxes or the alternative minimum tax (AMT). Any capital gains distributions may be taxable.
Please see footnotes on page 5.
| | | | | | |
| Performance highlights (unaudited) | | Wells Fargo Advantage Colorado Tax-Free Fund | | | 5 | |
|
| Credit quality distribution6 as of December 31, 2014 |
|
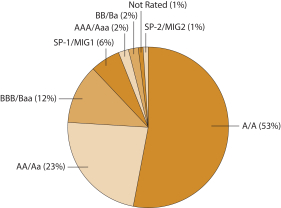 |
|
| Effective maturity distribution7 as of December 31, 2014 |
|
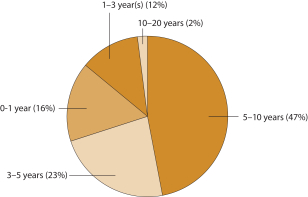 |
| 1. | Historical performance shown for Class C shares prior to their inception reflects the performance of Class A shares, adjusted to reflect the higher expenses applicable to Class C shares. |
| 2. | Reflects the expense ratios as stated in the most recent prospectuses. The expense ratios shown are subject to change and may differ from the annualized expense ratios shown in the financial highlights of this report. |
| 3. | The Adviser has committed through October 31, 2015, to waive fees and/or reimburse expenses to the extent necessary to cap the Fund’s Total Annual Fund Operating Expenses After Fee Waiver, excluding certain expenses, at the amounts shown. After this time, the cap may be increased or the commitment to maintain the cap may be terminated only with the approval of the Board of Trustees. Brokerage commissions, stamp duty fees, interest, taxes, acquired fund fees and expenses, and extraordinary expenses are excluded from the cap. Without this cap, the Fund’s returns would have been lower. |
| 4. | The Barclays Municipal Bond Index is an unmanaged index composed of long-term tax-exempt bonds with a minimum credit rating of Baa. you cannot invest directly in an index. |
| 5. | The Barclays Colorado Municipal Bond Index is the Colorado component of the Barclays Municipal Bond Index. you cannot invest directly in an index. |
| 6. | The credit quality distribution of portfolio holdings reflected in the chart is based on ratings from Standard & Poor’s, Moody’s Investors Service, and/or Fitch Ratings Ltd. Credit quality ratings apply to the underlying holdings of the Fund and not to the Fund itself. The percentages of the Fund’s portfolio with the ratings depicted in the chart are calculated based on the total market value of fixed income securities held by the Fund. If a security was rated by all three rating agencies, the middle rating was utilized. If rated by two of three rating agencies, the lower rating was utilized, and if rated by one of the rating agencies, that rating was utilized. Standard & Poor’s rates the creditworthiness of bonds, ranging from AAA (highest) to D (lowest). Ratings from A to CCC may be modified by the addition of a plus (+) or minus (-) sign to show relative standing within the rating categories. Standard & Poor’s rates the creditworthiness of short-term notes from SP-1 (highest) to SP-3 (lowest). Moody’s rates the creditworthiness of bonds, ranging from Aaa (highest) to C (lowest). Ratings Aa to B may be modified by the addition of a number 1 (highest) to 3 (lowest) to show relative standing within the ratings categories. Moody’s rates the creditworthiness of short-term U.S. tax-exempt municipal securities from MIG 1/VMIG 1 (highest) to SG (lowest). Fitch rates the creditworthiness of bonds, ranging from AAA (highest) to D (lowest). Credit quality and credit quality ratings are subject to change and may have changed since the date specified. |
| 7. | Effective maturity distribution is calculated based on the total long-term investments of the Fund. It is subject to change and may have changed since the date specified. |
| | | | |
| 6 | | Wells Fargo Advantage Colorado Tax-Free Fund | | Fund expenses (unaudited) |
As a shareholder of the Fund, you incur two types of costs: (1) transaction costs, including sales charges (loads) on purchase payments and contingent deferred sales charges (if any) on redemptions and (2) ongoing costs, including management fees, distribution (12b-1) and/or shareholder service fees, and other Fund expenses. This example is intended to help you understand your ongoing costs (in dollars) of investing in the Fund and to compare these costs with the ongoing costs of investing in other mutual funds.
The example is based on an investment of $1,000 invested at the beginning of the six-month period and held for the entire period from July 1, 2014 to December 31, 2014.
Actual expenses
The “Actual” line of the table below provides information about actual account values and actual expenses. You may use the information in this line, together with the amount you invested, to estimate the expenses that you paid over the period. Simply divide your account value by $1,000 (for example, an $8,600 account value divided by $1,000 = 8.6), then multiply the result by the number in the “Actual” line under the heading entitled “Expenses paid during period” for your applicable class of shares to estimate the expenses you paid on your account during this period.
Hypothetical example for comparison purposes
The “Hypothetical” line of the table below provides information about hypothetical account values and hypothetical expenses based on the Fund’s actual expense ratio and an assumed rate of return of 5% per year before expenses, which is not the Fund’s actual return. The hypothetical account values and expenses may not be used to estimate the actual ending account balance or expenses you paid for the period. You may use this information to compare the ongoing costs of investing in the Fund and other funds. To do so, compare this 5% hypothetical example with the 5% hypothetical
examples that appear in the shareholder reports of the other funds.
Please note that the expenses shown in the table are meant to highlight your ongoing costs only and do not reflect any transactional costs, such as sales charges (loads) and contingent deferred sales charges. Therefore, the “Hypothetical” line of the table is useful in comparing ongoing costs only and will not help you determine the relative total costs of owning different funds. In addition, if these transactional costs were included, your costs would have been higher.
| | | | | | | | | | | | | | | | |
| | | Beginning
account value
7-1-2014 | | | Ending
account value
12-31-2014 | | | Expenses
paid during
the period¹ | | | Net annualized
expense ratio | |
Class A | | | | | | | | | | | | | | | | |
Actual | | $ | 1,000.00 | | | $ | 1,037.86 | | | $ | 4.37 | | | | 0.85 | % |
Hypothetical (5% return before expenses) | | $ | 1,000.00 | | | $ | 1,020.92 | | | $ | 4.33 | | | | 0.85 | % |
Class B | | | | | | | | | | | | | | | | |
Actual | | $ | 1,000.00 | | | $ | 1,037.30 | | | $ | 8.16 | | | | 1.59 | % |
Hypothetical (5% return before expenses) | | $ | 1,000.00 | | | $ | 1,017.19 | | | $ | 8.08 | | | | 1.59 | % |
Class C | | | | | | | | | | | | | | | | |
Actual | | $ | 1,000.00 | | | $ | 1,033.93 | | | $ | 8.20 | | | | 1.60 | % |
Hypothetical (5% return before expenses) | | $ | 1,000.00 | | | $ | 1,017.14 | | | $ | 8.13 | | | | 1.60 | % |
Administrator Class | | | | | | | | | | | | | | | | |
Actual | | $ | 1,000.00 | | | $ | 1,039.16 | | | $ | 3.08 | | | | 0.60 | % |
Hypothetical (5% return before expenses) | | $ | 1,000.00 | | | $ | 1,022.18 | | | $ | 3.06 | | | | 0.60 | % |
| 1. | Expenses paid is equal to the annualized expense ratio of each class multiplied by the average account value over the period, multiplied by the number of days in the most recent fiscal half-year divided by the number of days in the fiscal year (to reflect the one-half-year period). |
| | | | | | |
| Portfolio of investments—December 31, 2014 (unaudited) | | Wells Fargo Advantage Colorado Tax-Free Fund | | | 7 | |
| | | | | | | | | | | | | | | | |
| Security name | | Interest rate | | | Maturity date | | | Principal | | | Value | |
| | | | |
Municipal Obligations: 93.46% | | | | | | | | | | | | | | | | |
| | | | |
| Arizona: 1.31% | | | | | | | | | | | | | | | | |
Phoenix AZ IDA Rowan University Project (Education Revenue) | | | 5.25 | % | | | 6-1-2034 | | | $ | 1,000,000 | | | $ | 1,125,230 | |
| | | | | | | | | | | | | | | | |
| | | | |
| California: 2.92% | | | | | | | | | | | | | | | | |
Inglewood CA Unified School District (Tax Revenue, AGM Insured) | | | 5.25 | | | | 10-15-2021 | | | | 1,000,000 | | | | 1,173,250 | |
Norco CA Redevelopment Agency Project Area #1 (Tax Revenue) | | | 6.00 | | | | 3-1-2036 | | | | 1,120,000 | | | | 1,326,069 | |
| | | | |
| | | | | | | | | | | | | | | 2,499,319 | |
| | | | | | | | | | | | | | | | |
| | | | |
| Colorado: 83.47% | | | | | | | | | | | | | | | | |
Arapahoe County CO Centennial 25 Metropolitan District (Tax Revenue) | | | 6.38 | | | | 12-1-2016 | | | | 135,000 | | | | 135,621 | |
Arapahoe County CO Water & Wastewater Authority (Water & Sewer Revenue, AGM Insured) | | | 5.00 | | | | 12-1-2033 | | | | 500,000 | | | | 544,570 | |
Aspen Valley CO Hospital Refunding District Bonds Series 2012 (Health Revenue) | | | 5.00 | | | | 10-15-2033 | | | | 600,000 | | | | 655,302 | |
Aurora CO Certificate of Participation Refunding Bonds Series 2009A (Miscellaneous Revenue) | | | 5.00 | | | | 12-1-2027 | | | | 2,000,000 | | | | 2,281,620 | |
Aurora CO E-470 Public Highway Authority Colorado CAB Series A (Miscellaneous Revenue, National Insured) ¤ | | | 0.00 | | | | 9-1-2034 | | | | 4,000,000 | | | | 1,779,880 | |
Aurora CO First Lien Water Improvement Bonds Series 2007A (Water & Sewer Revenue, Ambac Insured) | | | 5.00 | | | | 8-1-2039 | | | | 1,000,000 | | | | 1,085,190 | |
Canon City CO Finance Authority Certificate of Participation Series 2008 (Miscellaneous Revenue, AGM Insured) | | | 5.00 | | | | 12-1-2032 | | | | 150,000 | | | | 165,636 | |
Colorado Board of Governors State University System Enterprise Bonds Series 2013C (Education Revenue) | | | 5.25 | | | | 3-1-2033 | | | | 725,000 | | | | 844,059 | |
Colorado ECFA Alexander Dawson School LLC Project (Education Revenue) | | | 5.00 | | | | 2-15-2040 | | | | 2,000,000 | | | | 2,164,840 | |
Colorado ECFA Charter School American Academy Project (Education Revenue) | | | 7.25 | | | | 12-1-2028 | | | | 1,000,000 | | | | 1,151,970 | |
Colorado ECFA Charter School American Academy Project (Education Revenue) | | | 7.38 | | | | 12-1-2028 | | | | 1,000,000 | | | | 1,156,500 | |
Colorado ECFA Charter School Banning Lewis Ranch Academy Project (Education Revenue) 144A | | | 6.13 | | | | 12-15-2035 | | | | 430,000 | | | | 436,175 | |
Colorado ECFA Charter School Collegiate Project (Education Revenue, Syncora Guarantee Incorporated Insured) | | | 5.00 | | | | 6-15-2019 | | | | 1,040,000 | | | | 1,042,964 | |
Colorado ECFA Charter School Collegiate Project (Education Revenue, Syncora Guarantee Incorporated Insured) | | | 5.25 | | | | 6-15-2024 | | | | 1,140,000 | | | | 1,142,611 | |
Colorado ECFA Charter School District Montessori Charter School Project (Miscellaneous Revenue) | | | 5.00 | | | | 7-15-2037 | | | | 1,150,000 | | | | 1,241,276 | |
Colorado ECFA Charter School Pinnacle High School Project (Education Revenue) | | | 5.13 | | | | 12-1-2039 | | | | 500,000 | | | | 524,180 | |
Colorado ECFA Charter School Refunding and Improvement Bonds Skyview Academy Project Series 2014 (Education Revenue) 144A | | | 4.13 | | | | 7-1-2024 | | | | 500,000 | | | | 521,165 | |
Colorado ECFA Charter School Twin Peaks Charter (Education Revenue) | | | 6.75 | | | | 11-15-2028 | | | | 750,000 | | | | 903,150 | |
Colorado ECFA Cheyenne Mountain Charter School Series A (Education Revenue) | | | 5.25 | | | | 6-15-2029 | | | | 590,000 | | | | 614,509 | |
Colorado ECFA Refunding Bonds The University Corporation for Atmosphere Research Project Series 2010 (Education Revenue) | | | 5.00 | | | | 9-1-2032 | | | | 1,265,000 | | | | 1,401,987 | |
Colorado ECFA Refunding Bonds The University Corporation for Atmosphere Research Project Series B (Education Revenue) | | | 5.00 | | | | 9-1-2030 | | | | 1,770,000 | | | | 1,992,701 | |
Colorado ECFA Student Housing Campus Village Apartment (Miscellaneous Revenue) | | | 5.50 | | | | 6-1-2033 | | | | 1,735,000 | | | | 1,918,389 | |
Colorado ECFA University Laboratory School Refunding Bonds Series 2004 (Education Revenue, Syncora Guarantee Incorporated Insured) | | | 5.25 | | | | 6-1-2024 | | | | 1,355,000 | | | | 1,358,103 | |
Colorado Health Facilities Authority Adventist Health Sunbelt Series D (Health Revenue) ± | | | 5.25 | | | | 11-15-2027 | | | | 1,000,000 | | | | 1,081,340 | |
Colorado Health Facilities Authority Adventist Health Sunbelt Series D (Health Revenue) ± | | | 5.25 | | | | 11-15-2035 | | | | 1,000,000 | | | | 1,064,170 | |
Colorado Health Facilities Authority Catholic Health Initiatives Series B3 (Health Revenue) ± | | | 1.88 | | | | 7-1-2039 | | | | 2,000,000 | | | | 1,993,640 | |
The accompanying notes are an integral part of these financial statements.
| | | | |
| 8 | | Wells Fargo Advantage Colorado Tax-Free Fund | | Portfolio of investments—December 31, 2014 (unaudited) |
_
| | | | | | | | | | | | | | | | |
| Security name | | Interest rate | | | Maturity date | | | Principal | | | Value | |
| | | | |
| Colorado (continued) | | | | | | | | | | | | | | | | |
Colorado Health Facilities Authority Catholic Health Initiatives Series D1 (Health Revenue) | | | 6.25 | % | | | 10-1-2033 | | | $ | 1,000,000 | | | $ | 1,164,990 | |
Colorado Health Facilities Authority Deutsche Bank SPEARs/LIFERs Trust Series 1131 (Health Revenue, Deutsche Bank LIQ) 144Aø | | | 0.34 | | | | 12-1-2042 | | | | 2,185,000 | | | | 2,185,000 | |
Colorado Health Facilities Authority Hospital Parkview Medical Center Incorporation (Health Revenue) | | | 5.00 | | | | 9-1-2025 | | | | 900,000 | | | | 925,992 | |
Colorado Health Facilities Authority Sisters of Charity Leavenworth Health System Series 2013A (Health Revenue) | | | 5.50 | | | | 1-1-2035 | | | | 1,000,000 | | | | 1,194,170 | |
Colorado HFA SFMR Class I Series A (Housing Revenue, FHA/HUD Insured) | | | 5.50 | | | | 11-1-2029 | | | | 385,000 | | | | 398,448 | |
Colorado HFA Waste Management Incorporated Project (Miscellaneous Revenue) | | | 5.70 | | | | 7-1-2018 | | | | 500,000 | | | | 572,340 | |
Colorado High Performance Transportation Enterprise U.S. 36 and I-25 Managed Lanes (Transportation Revenue) | | | 5.75 | | | | 1-1-2044 | | | | 1,200,000 | | | | 1,292,328 | |
Colorado Partnership Prerefunded Balance University of Colorado Denver Health Science Center Fitzsimons Academic Series B (Miscellaneous Revenue, National Insured) | | | 5.00 | | | | 11-1-2030 | | | | 245,000 | | | | 254,815 | |
Colorado Partnership Unrefunded Balance University of Colorado Denver Health Science Center Fitzsimons Academic Series B (Miscellaneous Revenue, National Insured) | | | 5.00 | | | | 11-1-2030 | | | | 755,000 | | | | 785,245 | |
Colorado Regional Transportation District Certificate of Participation Series 2014A (Miscellaneous Revenue) | | | 5.00 | | | | 6-1-2044 | | | | 2,000,000 | | | | 2,241,800 | |
Colorado Regional Transportation District Certificate of Participation Tax-Exempt Bonds Series 2010A (Miscellaneous Revenue) | | | 5.38 | | | | 6-1-2031 | | | | 2,500,000 | | | | 2,852,225 | |
Colorado Regional Transportation District Certificate of Participation Transit Vehicles Series A (Miscellaneous Revenue, Ambac Insured) | | | 5.00 | | | | 12-1-2022 | | | | 1,000,000 | | | | 1,104,340 | |
Colorado Regional Transportation District Fastracks Project Bonds Series 2013A (Tax Revenue) | | | 5.00 | | | | 11-1-2031 | | | | 1,000,000 | | | | 1,169,840 | |
Colorado Springs CO Utilities System Improvement Bonds Series 2013 B-2 (Utilities Revenue) | | | 5.00 | | | | 11-15-2038 | | | | 3,000,000 | | | | 3,461,700 | |
Colorado Water Reserve Power Development Authority Clean Water Series A (Water & Sewer Revenue) | | | 4.50 | | | | 9-1-2024 | | | | 1,000,000 | | | | 1,026,760 | |
Commerce City CO Sales & Use Tax Bonds Series 2014 (Tax Revenue, AGM Insured) | | | 5.00 | | | | 8-1-2044 | | | | 1,250,000 | | | | 1,418,937 | |
Denver CO City & County Airport System Series A (Airport Revenue, Syncora Guarantee Incorporated Insured) | | | 5.00 | | | | 11-15-2022 | | | | 1,250,000 | | | | 1,300,662 | |
Denver CO City & County Department of Aviation Airport System Bonds Series 2012B (Airport Revenue) | | | 5.00 | | | | 11-15-2030 | | | | 2,000,000 | | | | 2,314,980 | |
Denver CO City & County Excise Tax Series A (Tax Revenue, AGM Insured) | | | 6.00 | | | | 9-1-2021 | | | | 2,000,000 | | | | 2,415,720 | |
Denver CO Convention Center (Tax Revenue, Syncora Guarantee Incorporated Insured) | | | 5.00 | | | | 12-1-2030 | | | | 1,205,000 | | | | 1,250,031 | |
El Paso County CO School District #49 (Miscellaneous Revenue, National Insured) | | | 5.00 | | | | 12-15-2027 | | | | 1,430,000 | | | | 1,574,301 | |
Fremont County CO Finance Corporation Certificate of Participation Series 2013 (Miscellaneous Revenue) | | | 5.25 | | | | 12-15-2038 | | | | 1,265,000 | | | | 1,389,134 | |
Garfield County CO Public Library District Lease Purchase Financing Program (Miscellaneous Revenue) | | | 5.00 | | | | 12-1-2026 | | | | 715,000 | | | | 783,440 | |
Glendale CO Certificate of Participation Series 2006 (Miscellaneous Revenue, Syncora Guarantee Incorporated Insured) | | | 5.00 | | | | 12-1-2025 | | | | 1,000,000 | | | | 1,070,990 | |
Longmont CO Certificates of ParticipationTax-Exempt Series 2014A and Taxable Series 2014B (Miscellaneous Revenue) | | | 5.00 | | | | 12-1-2034 | | | | 1,000,000 | | | | 1,133,670 | |
Park Meadows CO Business Improvement District (Tax Revenue) | | | 5.00 | | | | 12-1-2017 | | | | 155,000 | | | | 166,103 | |
Platte Valley CO Fire Protection District (Miscellaneous Revenue) | | | 5.00 | | | | 12-1-2036 | | | | 325,000 | | | | 345,264 | |
University of Colorado Enterprise System Series A (Education Revenue) | | | 5.00 | | | | 6-1-2026 | | | | 1,000,000 | | | | 1,174,760 | |
University of Colorado Enterprise Systems PFOTER Series 3840 (Education Revenue, National Insured, Dexia Credit Local LIQ) ø | | | 0.13 | | | | 6-1-2025 | | | | 2,980,000 | | | | 2,980,000 | |
University of Colorado Hospital Authority Series A (Health Revenue) | | | 6.00 | | | | 11-15-2029 | | | | 2,000,000 | | | | 2,361,420 | |
| | | | |
| | | | | | | | | | | | | | | 71,510,953 | |
| | | | | | | | | | | | | | | | |
The accompanying notes are an integral part of these financial statements.
| | | | | | |
| Portfolio of investments—December 31, 2014 (unaudited) | | Wells Fargo Advantage Colorado Tax-Free Fund | | | 9 | |
| | | | | | | | | | | | | | | | |
| Security name | | Interest rate | | | Maturity date | | | Principal | | | Value | |
| | | | |
| Guam: 1.95% | | | | | | | | | | | | | | | | |
Guam Government Business Privilege Tax Series A (Tax Revenue) | | | 5.00 | % | | | 1-1-2031 | | | $ | 1,000,000 | | | $ | 1,119,400 | |
Guam Government Limited Obligation Section 30 Series A (Miscellaneous Revenue) | | | 5.75 | | | | 12-1-2034 | | | | 500,000 | | | | 555,160 | |
| | | | |
| | | | | | | | | | | | | | | 1,674,560 | |
| | | | | | | | | | | | | | | | |
| | | | |
| Maryland: 0.56% | | | | | | | | | | | | | | | | |
Maryland Economic Development Corporation Salisbury University Project (Education Revenue) | | | 5.00 | | | | 6-1-2027 | | | | 235,000 | | | | 258,004 | |
Maryland Economic Development Corporation Salisbury University Project (Education Revenue) | | | 5.00 | | | | 6-1-2030 | | | | 200,000 | | | | 217,670 | |
| | | | |
| | | | | | | | | | | | | | | 475,674 | |
| | | | | | | | | | | | | | | | |
| | | | |
| Pennsylvania: 1.92% | | | | | | | | | | | | | | | | |
East Hempfield Township PA IDA Student Services Incorporated Student Housing Project of Millersville University (Education Revenue) | | | 5.00 | | | | 7-1-2029 | | | | 500,000 | | | | 549,985 | |
Pennsylvania Higher Education Facilities Authority Indiana University Student Housing Project Series A (Education Revenue) | | | 5.00 | | | | 7-1-2032 | | | | 1,000,000 | | | | 1,094,060 | |
| | | | |
| | | | | | | | | | | | | | | 1,644,045 | |
| | | | | | | | | | | | | | | | |
| | | | |
| Virgin Islands: 1.33% | | | | | | | | | | | | | | | | |
Virgin Islands PFA Matching Fund Loan Note Senior Lien (Tax Revenue, AGM Insured) | | | 5.00 | | | | 10-1-2029 | | | | 1,000,000 | | | | 1,139,410 | |
| | | | | | | | | | | | | | | | |
| | | | |
Total Municipal Obligations (Cost $73,923,076) | | | | | | | | | | | | | | | 80,069,191 | |
| | | | | | | | | | | | | | | | |
| | | | |
| | | Yield | | | | | | Shares | | | | |
| | | | |
Short-Term Investments: 5.78% | | | | | | | | | | | | | | | | |
| | | | |
| Investment Companies: 5.78% | | | | | | | | | | | | | | | | |
Wells Fargo Advantage National Tax-Free Money Market Fund, Institutional Class (l)(u) | | | 0.01 | | | | | | | | 4,949,996 | | | | 4,949,996 | |
| | | | | | | | | | | | | | | | |
| | | | |
Total Short-Term Investments (Cost $4,949,996) | | | | | | | | | | | | | | | 4,949,996 | |
| | | | | | | | | | | | | | | | |
| | | | | | | | |
| Total investments in securities (Cost $78,873,072) * | | | 99.24 | % | | | 85,019,187 | |
Other assets and liabilities, net | | | 0.76 | | | | 655,347 | |
| | | | | | | | |
| Total net assets | | | 100.00 | % | | $ | 85,674,534 | |
| | | | | | | | |
| ¤ | The security is issued in zero coupon form with no periodic interest payments. |
| 144A | The security may be resold in transactions exempt from registration, normally to qualified institutional buyers, pursuant to Rule 144A under the Securities Act of 1933. |
| ± | Variable rate investment. The rate shown is the rate in effect at period end. |
| ø | Variable rate demand notes are subject to a demand feature which reduces the effective maturity. The maturity date shown represents the final maturity date of the security. The interest rate is determined and reset by the issuer daily, weekly, or monthly depending upon the terms of the security. The rate shown is the rate in effect at period end. |
| (l) | The security represents an affiliate of the Fund as defined in the Investment Company Act of 1940. |
| (u) | The rate represents the 7-day annualized yield at period end. |
| * | Cost for federal income tax purposes is $78,872,788 and unrealized gains (losses) consists of: |
| | | | |
Gross unrealized gains | | $ | 6,170,271 | |
Gross unrealized losses | | | (23,872 | ) |
| | | | |
Net unrealized gains | | $ | 6,146,399 | |
The accompanying notes are an integral part of these financial statements.
| | | | |
| 10 | | Wells Fargo Advantage Colorado Tax-Free Fund | | Statement of assets and liabilities—December 31, 2014 (unaudited) |
| | | | |
| | | | |
| |
Assets | | | | |
Investments | | | | |
In unaffiliated securities, at value (cost $73,923,076) | | $ | 80,069,191 | |
In affiliated securities, at value (cost $4,949,996) | | | 4,949,996 | |
| | | | |
Total investments, at value (cost $78,873,072) | | | 85,019,187 | |
Cash | | | 13,781 | |
Receivable for Fund shares sold | | | 184,333 | |
Receivable for interest | | | 679,273 | |
Prepaid expenses and other assets | | | 9,780 | |
| | | | |
Total assets | | | 85,906,354 | |
| | | | |
| |
Liabilities | | | | |
Dividends payable | | | 96,270 | |
Payable for Fund shares redeemed | | | 53,349 | |
Advisory fee payable | | | 12,790 | |
Distribution fees payable | | | 2,398 | |
Administration fees payable | | | 13,103 | |
Shareholder report expenses payable | | | 18,390 | |
Shareholder servicing fees payable | | | 18,584 | |
Professional fees payable | | | 16,120 | |
Accrued expenses and other liabilities | | | 816 | |
| | | | |
Total liabilities | | | 231,820 | |
| | | | |
Total net assets | | $ | 85,674,534 | |
| | | | |
| |
NET ASSETS CONSIST OF | | | | |
Paid-in capital | | $ | 80,643,849 | |
Undistributed net investment income | | | 298,072 | |
Accumulated net realized losses on investments | | | (1,413,502 | ) |
Net unrealized gains on investments | | | 6,146,115 | |
| | | | |
Total net assets | | $ | 85,674,534 | |
| | | | |
| |
COMPUTATION OF NET ASSET VALUE AND OFFERING PRICE PER SHARE | | | | |
Net assets – Class A | | $ | 33,655,056 | |
Shares outstanding – Class A1 | | | 3,038,086 | |
Net asset value per share – Class A | | | $11.08 | |
Maximum offering price per share – Class A2 | | | $11.60 | |
Net assets – Class B | | $ | 418 | |
Shares outstanding – Class B1 | | | 38 | |
Net asset value per share – Class B | | | $11.12 | |
Net assets – Class C | | $ | 3,693,505 | |
Shares outstanding – Class C1 | | | 333,106 | |
Net asset value per share – Class C | | | $11.09 | |
Net assets – Administrator Class | | $ | 48,325,555 | |
Shares outstanding – Administrator Class1 | | | 4,362,313 | |
Net asset value per share – Administrator Class | | | $11.08 | |
| 1. | The Fund has an unlimited number of authorized shares. |
| 2. | Maximum offering price is computed as 100/95.50 of net asset value. On investments of $50,000 or more, the offering price is reduced. |
The accompanying notes are an integral part of these financial statements.
| | | | | | |
| Statement of operations—six months ended December 31, 2014 (unaudited) | | Wells Fargo Advantage Colorado Tax-Free Fund | | | 11 | |
| | | | |
| | | | |
| |
Investment income | | | | |
Interest | | $ | 1,732,738 | |
Income from affiliated securities | | | 314 | |
| | | | |
Total investment income | | | 1,733,052 | |
| | | | |
| |
Expenses | | | | |
Advisory fee | | | 149,037 | |
Administration fees | | | | |
Fund level | | | 21,291 | |
Class A | | | 27,753 | |
Class B | | | 6 | |
Class C | | | 2,798 | |
Administrator Class | | | 23,483 | |
Shareholder servicing fees | | | | |
Class A | | | 43,365 | |
Class B | | | 10 | |
Class C | | | 4,372 | |
Administrator Class | | | 58,709 | |
Distribution fees | | | | |
Class B | | | 30 | |
Class C | | | 13,115 | |
Custody and accounting fees | | | 5,063 | |
Professional fees | | | 21,045 | |
Registration fees | | | 4,853 | |
Shareholder report expenses | | | 6,471 | |
Trustees’ fees and expenses | | | 6,074 | |
Other fees and expenses | | | 4,240 | |
| | | | |
Total expenses | | | 391,715 | |
Less: Fee waivers and/or expense reimbursements | | | (75,331 | ) |
| | | | |
Net expenses | | | 316,384 | |
| | | | |
Net investment income | | | 1,416,668 | |
| | | | |
| |
REALIZED AND UNREALIZED GAINS (LOSSES) ON INVESTMENTS | | | | |
Net realized gains on investments | | | 272,327 | |
Net change in unrealized gains (losses) on investments | | | 1,490,308 | |
| | | | |
Net realized and unrealized gains (losses) on investments | | | 1,762,635 | |
| | | | |
Net increase in net assets resulting from operations | | $ | 3,179,303 | |
| | | | |
The accompanying notes are an integral part of these financial statements.
| | | | |
| 12 | | Wells Fargo Advantage Colorado Tax-Free Fund | | Statement of changes in net assets |
| | | | | | | | | | | | | | | | |
| | | Six months ended
December 31, 2014
(unaudited) | | | Year ended
June 30, 2014 | |
| | | | |
Operations | | | | | | | | | | | | | | | | |
Net investment income | | | | | | $ | 1,416,668 | | | | | | | $ | 2,900,803 | |
Net realized gains (losses) on investments | | | | | | | 272,327 | | | | | | | | (1,049,877 | ) |
Net change in unrealized gains (losses) on investments | | | | | | | 1,490,308 | | | | | | | | 3,718,522 | |
| | | | |
Net increase in net assets resulting from operations | | | | | | | 3,179,303 | | | | | | | | 5,569,448 | |
| | | | |
| | | | |
Distributions to shareholders from | | | | | | | | | | | | | | | | |
Net investment income | | | | | | | | | | | | | | | | |
Class A | | | | | | | (558,816 | ) | | | | | | | (1,250,056 | ) |
Class B | | | | | | | (102 | ) | | | | | | | (716 | ) |
Class C | | | | | | | (43,059 | ) | | | | | | | (96,231 | ) |
Administrator Class | | | | | | | (814,691 | ) | | | | | | | (1,553,821 | ) |
| | | | |
Total distributions to shareholders | | | | | | | (1,416,668 | ) | | | | | | | (2,900,824 | ) |
| | | | |
| | | | |
Capital share transactions | | | Shares | | | | | | | | Shares | | | | | |
Proceeds from shares sold | | | | | | | | | | | | | | | | |
Class A | | | 64,358 | | | | 704,872 | | | | 96,947 | | | | 1,014,701 | |
Class C | | | 43,345 | | | | 478,100 | | | | 41,291 | | | | 431,773 | |
Administrator Class | | | 625,789 | | | | 6,861,397 | | | | 684,942 | | | | 7,240,642 | |
| | | | |
| | | | | | | 8,044,369 | | | | | | | | 8,687,116 | |
| | | | |
Reinvestment of distributions | | | | | | | | | | | | | | | | |
Class A | | | 48,470 | | | | 532,595 | | | | 112,938 | | | | 1,187,298 | |
Class B | | | 9 | | | | 102 | | | | 68 | | | | 716 | |
Class C | | | 3,728 | | | | 41,000 | | | | 8,833 | | | | 92,938 | |
Administrator Class | | | 25,064 | | | | 275,477 | | | | 51,051 | | | | 536,696 | |
| | | | |
| | | | | | | 849,174 | | | | | | | | 1,817,648 | |
| | | | |
Payment for shares redeemed | | | | | | | | | | | | | | | | |
Class A | | | (309,175 | ) | | | (3,388,341 | ) | | | (1,378,292 | ) | | | (14,335,416 | ) |
Class B | | | (1,788 | ) | | | (19,622 | ) | | | (3,342 | ) | | | (34,776 | ) |
Class C | | | (53,682 | ) | | | (583,087 | ) | | | (136,308 | ) | | | (1,409,630 | ) |
Administrator Class | | | (369,499 | ) | | | (4,058,886 | ) | | | (1,390,335 | ) | | | (14,456,295 | ) |
| | | | |
| | | | | | | (8,049,936 | ) | | | | | | | (30,236,117 | ) |
| | | | |
Net increase (decrease) in net assets resulting from capital share transactions | | | | | | | 843,607 | | | | | | | | (19,731,353 | ) |
| | | | |
Total increase (decrease) in net assets | | | | | | | 2,606,242 | | | | | | | | (17,062,729 | ) |
| | | | |
| | | | |
Net assets | | | | | | | | | | | | | | | | |
Beginning of period | | | | | | | 83,068,292 | | | | | | | | 100,131,021 | |
| | | | |
End of period | | | | | | $ | 85,674,534 | | | | | | | $ | 83,068,292 | |
| | | | |
Undistributed net investment income | | | | | | $ | 298,072 | | | | | | | $ | 298,072 | |
| | | | |
The accompanying notes are an integral part of these financial statements.
| | | | | | |
| Financial highlights | | Wells Fargo Advantage Colorado Tax-Free Fund | | | 13 | |
(For a share outstanding throughout each period)
| | | | | | | | | | | | | | | | | | | | | | | | |
| | | Six months ended
December 31, 2014
(unaudited) | | | Year ended June 30 | |
| CLASS A | | | 2014 | | | 2013 | | | 2012 | | | 2011 | | | 2010 | |
Net asset value, beginning of period | | | $10.85 | | | | $10.46 | | | | $10.72 | | | | $10.15 | | | | $10.35 | | | | $9.90 | |
Net investment income | | | 0.18 | | | | 0.35 | 1 | | | 0.34 | | | | 0.38 | | | | 0.44 | | | | 0.41 | 1 |
Net realized and unrealized gains (losses) on investments | | | 0.23 | | | | 0.39 | | | | (0.26 | ) | | | 0.57 | | | | (0.21 | ) | | | 0.46 | |
| | | | | | | | | | | | | | | | | | | | | | | | |
Total from investment operations | | | 0.41 | | | | 0.74 | | | | 0.08 | | | | 0.95 | | | | 0.23 | | | | 0.87 | |
Distributions to shareholders from | | | | | | | | | | | | | | | | | | | | | | | | |
Net investment income | | | (0.18 | ) | | | (0.35 | ) | | | (0.34 | ) | | | (0.38 | ) | | | (0.43 | ) | | | (0.42 | ) |
Net asset value, end of period | | | $11.08 | | | | $10.85 | | | | $10.46 | | | | $10.72 | | | | $10.15 | | | | $10.35 | |
Total return2 | | | 3.79 | % | | | 7.26 | % | | | 0.65 | % | | | 9.51 | % | | | 2.34 | % | | | 8.90 | % |
Ratios to average net assets (annualized) | | | | | | | | | | | | | | | | | | | | | | | | |
Gross expenses | | | 0.92 | % | | | 0.94 | % | | | 0.91 | % | | | 0.91 | % | | | 0.89 | % | | | 0.89 | % |
Net expenses | | | 0.85 | % | | | 0.85 | % | | | 0.85 | % | | | 0.85 | % | | | 0.85 | % | | | 0.85 | % |
Net investment income | | | 3.22 | % | | | 3.35 | % | | | 3.10 | % | | | 3.64 | % | | | 4.25 | % | | | 3.95 | % |
Supplemental data | | | | | | | | | | | | | | | | | | | | | | | | |
Portfolio turnover rate | | | 11 | % | | | 33 | % | | | 36 | % | | | 41 | % | | | 22 | % | | | 15 | % |
Net assets, end of period (000s omitted) | | | $33,655 | | | | $35,088 | | | | $46,069 | | | | $53,185 | | | | $48,218 | | | | $69,351 | |
| 1. | Calculated based upon average shares outstanding. |
| 2. | Total return calculations do not include any sales charges. Returns for periods of less than one year are not annualized. |
The accompanying notes are an integral part of these financial statements.
| | | | |
| 14 | | Wells Fargo Advantage Colorado Tax-Free Fund | | Financial highlights |
(For a share outstanding throughout each period)
| | | | | | | | | | | | | | | | | | | | | | | | |
| | | Six months ended
December 31, 2014
(unaudited) | | | Year ended June 30 | |
| CLASS B | | | 2014 | | | 2013 | | | 2012 | | | 2011 | | | 2010 | |
Net asset value, beginning of period | | | $10.86 | | | | $10.48 | | | | $10.73 | | | | $10.16 | | | | $10.36 | | | | $9.92 | |
Net investment income | | | 0.14 | 1 | | | 0.27 | 1 | | | 0.26 | 1 | | | 0.31 | 1 | | | 0.36 | 1 | | | 0.33 | 1 |
Net realized and unrealized gains (losses) on investments | | | 0.26 | | | | 0.38 | | | | (0.25 | ) | | | 0.56 | | | | (0.20 | ) | | | 0.45 | |
| | | | | | | | | | | | | | | | | | | | | | | | |
Total from investment operations | | | 0.40 | | | | 0.65 | | | | 0.01 | | | | 0.87 | | | | 0.16 | | | | 0.78 | |
Distributions to shareholders from | | | | | | | | | | | | | | | | | | | | | | | | |
Net investment income | | | (0.14 | ) | | | (0.27 | ) | | | (0.26 | ) | | | (0.30 | ) | | | (0.36 | ) | | | (0.34 | ) |
Net asset value, end of period | | | $11.12 | | | | $10.86 | | | | $10.48 | | | | $10.73 | | | | $10.16 | | | | $10.36 | |
Total return2 | | | 3.73 | % | | | 6.35 | % | | | (0.01 | )% | | | 8.69 | % | | | 1.57 | % | | | 7.97 | % |
Ratios to average net assets (annualized) | | | | | | | | | | | | | | | | | | | | | | | | |
Gross expenses | | | 1.65 | % | | | 1.68 | % | | | 1.66 | % | | | 1.66 | % | | | 1.64 | % | | | 1.66 | % |
Net expenses | | | 1.59 | % | | | 1.60 | % | | | 1.60 | % | | | 1.60 | % | | | 1.60 | % | | | 1.60 | % |
Net investment income | | | 2.53 | % | | | 2.55 | % | | | 2.35 | % | | | 2.98 | % | | | 3.50 | % | | | 3.24 | % |
Supplemental data | | | | | | | | | | | | | | | | | | | | | | | | |
Portfolio turnover rate | | | 11 | % | | | 33 | % | | | 36 | % | | | 41 | % | | | 22 | % | | | 15 | % |
Net assets, end of period (000s omitted) | | | $0 | | | | $20 | | | | $53 | | | | $57 | | | | $101 | | | | $253 | |
| 1. | Calculated based upon average shares outstanding |
| 2. | Total return calculations do not include any sales charges. Returns for periods of less than one year are not annualized. |
The accompanying notes are an integral part of these financial statements.
| | | | | | |
| Financial highlights | | Wells Fargo Advantage Colorado Tax-Free Fund | | | 15 | |
(For a share outstanding throughout each period)
| | | | | | | | | | | | | | | | | | | | | | | | |
| | | Six months ended
December 31, 2014
(unaudited) | | | Year ended June 30 | |
| CLASS C | | | 2014 | | | 2013 | | | 2012 | | | 2011 | | | 2010 | |
Net asset value, beginning of period | | | $10.86 | | | | $10.47 | | | | $10.73 | | | | $10.16 | | | | $10.36 | | | | $9.91 | |
Net investment income | | | 0.14 | | | | 0.28 | | | | 0.26 | | | | 0.30 | | | | 0.36 | | | | 0.33 | 1 |
Net realized and unrealized gains (losses) on investments | | | 0.23 | | | | 0.38 | | | | (0.26 | ) | | | 0.57 | | | | (0.20 | ) | | | 0.46 | |
| | | | | | | | | | | | | | | | | | | | | | | | |
Total from investment operations | | | 0.37 | | | | 0.66 | | | | 0.00 | | | | 0.87 | | | | 0.16 | | | | 0.79 | |
Distributions to shareholders from | | | | | | | | | | | | | | | | | | | | | | | | |
Net investment income | | | (0.14 | ) | | | (0.27 | ) | | | (0.26 | ) | | | (0.30 | ) | | | (0.36 | ) | | | (0.34 | ) |
Net asset value, end of period | | | $11.09 | | | | $10.86 | | | | $10.47 | | | | $10.73 | | | | $10.16 | | | | $10.36 | |
Total return2 | | | 3.39 | % | | | 6.46 | % | | | (0.10 | )% | | | 8.69 | % | | | 1.57 | % | | | 8.08 | % |
Ratios to average net assets (annualized) | | | | | | | | | | | | | | | | | | | | | | | | |
Gross expenses | | | 1.67 | % | | | 1.69 | % | | | 1.67 | % | | | 1.66 | % | | | 1.64 | % | | | 1.65 | % |
Net expenses | | | 1.60 | % | | | 1.60 | % | | | 1.60 | % | | | 1.60 | % | | | 1.60 | % | | | 1.60 | % |
Net investment income | | | 2.46 | % | | | 2.60 | % | | | 2.34 | % | | | 2.89 | % | | | 3.50 | % | | | 3.17 | % |
Supplemental data | | | | | | | | | | | | | | | | | | | | | | | | |
Portfolio turnover rate | | | 11 | % | | | 33 | % | | | 36 | % | | | 41 | % | | | 22 | % | | | 15 | % |
Net assets, end of period (000s omitted) | | | $3,694 | | | | $3,689 | | | | $4,460 | | | | $4,012 | | | | $3,763 | | | | $3,920 | |
| 1. | Calculated based upon average shares outstanding |
| 2. | Total return calculations do not include any sales charges. Returns for periods of less than one year are not annualized. |
The accompanying notes are an integral part of these financial statements.
| | | | |
| 16 | | Wells Fargo Advantage Colorado Tax-Free Fund | | Financial highlights |
(For a share outstanding throughout each period)
| | | | | | | | | | | | | | | | | | | | | | | | |
| | | Six months ended
December 31, 2014
(unaudited) | | | Year ended June 30 | |
| ADMINISTRATOR CLASS | | | 2014 | | | 2013 | | | 2012 | | | 2011 | | | 2010 | |
Net asset value, beginning of period | | | $10.85 | | | | $10.46 | | | | $10.72 | | | | $10.15 | | | | $10.35 | | | | $9.90 | |
Net investment income | | | 0.19 | | | | 0.38 | | | | 0.36 | | | | 0.41 | | | | 0.46 | | | | 0.43 | 1 |
Net realized and unrealized gains (losses) on investments | | | 0.23 | | | | 0.39 | | | | (0.26 | ) | | | 0.57 | | | | (0.20 | ) | | | 0.47 | |
| | | | | | | | | | | | | | | | | | | | | | | | |
Total from investment operations | | | 0.42 | | | | 0.77 | | | | 0.10 | | | | 0.98 | | | | 0.26 | | | | 0.90 | |
Distributions to shareholders from | | | | | | | | | | | | | | | | | | | | | | | | |
Net investment income | | | (0.19 | ) | | | (0.38 | ) | | | (0.36 | ) | | | (0.41 | ) | | | (0.46 | ) | | | (0.45 | ) |
Net asset value, end of period | | | $11.08 | | | | $10.85 | | | | $10.46 | | | | $10.72 | | | | $10.15 | | | | $10.35 | |
Total return2 | | | 3.92 | % | | | 7.53 | % | | | 0.90 | % | | | 9.78 | % | | | 2.59 | % | | | 9.17 | % |
Ratios to average net assets (annualized) | | | | | | | | | | | | | | | | | | | | | | | | |
Gross expenses | | | 0.86 | % | | | 0.88 | % | | | 0.86 | % | | | 0.84 | % | | | 0.83 | % | | | 0.83 | % |
Net expenses | | | 0.60 | % | | | 0.60 | % | | | 0.60 | % | | | 0.60 | % | | | 0.60 | % | | | 0.60 | % |
Net investment income | | | 3.47 | % | | | 3.60 | % | | | 3.34 | % | | | 3.89 | % | | | 4.51 | % | | | 4.21 | % |
Supplemental data | | | | | | | | | | | | | | | | | | | | | | | | |
Portfolio turnover rate | | | 11 | % | | | 33 | % | | | 36 | % | | | 41 | % | | | 22 | % | | | 15 | % |
Net assets, end of period (000s omitted) | | | $48,326 | | | | $44,272 | | | | $49,549 | | | | $43,876 | | | | $39,021 | | | | $44,143 | |
| 1. | Calculated based upon average shares outstanding |
| 2. | Returns for periods of less than one year are not annualized. |
The accompanying notes are an integral part of these financial statements.
| | | | | | |
| Notes to financial statements (unaudited) | | Wells Fargo Advantage Colorado Tax-Free Fund | | | 17 | |
1. ORGANIZATION
Wells Fargo Funds Trust (the “Trust”), a Delaware statutory trust organized on March 10, 1999, is an open-end management investment company registered under the Investment Company Act of 1940, as amended (the “1940 Act”). As an investment company, the Trust follows the accounting and reporting guidance in FASB Accounting Standards Codification 946. These financial statements report on the Wells Fargo Advantage Colorado Tax-Free Fund (the “Fund”) which is a non-diversified series of the Trust.
2. SIGNIFICANT ACCOUNTING POLICIES
The following significant accounting policies, which are consistently followed in the preparation of the financial statements of the Fund, are in conformity with U.S. generally accepted accounting principles which require management to make estimates and assumptions that affect the reported amounts of assets and liabilities, disclosure of contingent assets and liabilities at the date of the financial statements, and the reported amounts of revenues and expenses during the reporting period. Actual results could differ from those estimates.
Securities valuation
All investments are valued each business day as of the close of regular trading on the New York Stock Exchange (generally 4 p.m. Eastern Time).
Fixed income securities acquired with maturities exceeding 60 days are valued based on evaluated bid prices provided by an independent pricing service which may utilize both transaction data and market information such as yield, quality, coupon rate, maturity, type of issue, trading characteristics and other market data. If prices are not available from the independent pricing service or prices received are deemed not representative of market value, prices will be obtained from an independent broker-dealer.
Short-term securities, with maturities of 60 days or less at time of purchase, generally are valued at amortized cost which approximates fair value. The amortized cost method involves valuing a security at its cost, plus accretion of discount or minus amortization of premium over the period until maturity.
Investments in registered open-end investment companies are valued at net asset value.
Investments which are not valued using any of the methods discussed above are valued at their fair value, as determined in good faith by the Board of Trustees of the Fund. The Board of Trustees has established a Valuation Committee comprised of the Trustees and has delegated to it the authority to take any actions regarding the valuation of portfolio securities that the Valuation Committee deems necessary or appropriate, including determining the fair value of portfolio securities, unless the determination has been delegated to the Management Valuation Team of Wells Fargo Funds Management, LLC (“Funds Management”). The Board of Trustees retains the authority to make or ratify any valuation decisions or approve any changes to the Valuation Procedures as it deems appropriate. On a quarterly basis, the Board of Trustees receives reports on any valuation actions taken by the Valuation Committee or the Management Valuation Team which may include items for ratification.
Valuations of fair valued securities are compared to the next actual sales price when available, or other appropriate market values, to assess the continued appropriateness of the fair valuation methodologies used. These securities are fair valued on a day-to-day basis, taking into consideration changes to appropriate market information and any significant changes to the inputs considered in the valuation process until there is a readily available price provided on an exchange or by an independent pricing service. Valuations received from an independent pricing service or independent broker-dealer quotes are periodically validated by comparisons to most recent trades and valuations provided by other independent pricing services in addition to the review of prices by the adviser and/or subadviser. Unobservable inputs used in determining fair valuations are identified based on the type of security, taking into consideration factors utilized by market participants in valuing the investment, knowledge about the issuer and the current market environment.
When-issued transactions
The Fund may purchase securities on a forward commitment or when-issued basis. The Fund records a when-issued transaction on the trade date and will segregate assets in an amount at least equal in value to the Fund’s commitment to purchase when-issued securities. Securities purchased on a when-issued basis are marked-to-market daily and the Fund begins earning interest on the settlement date. Losses may arise due to changes in the market value of the underlying securities or if the counterparty does not perform under the contract.
| | | | |
| 18 | | Wells Fargo Advantage Colorado Tax-Free Fund | | Notes to financial statements (unaudited) |
Security transactions and income recognition
Securities transactions are recorded on a trade date basis. Realized gains or losses are recorded on the basis of identified cost.
Interest income is accrued daily and bond discounts are accreted and premiums are amortized daily based on the effective interest method. To the extent debt obligations are placed on non-accrual status, any related interest income may be reduced by writing off interest receivables when the collection of all or a portion of interest has become doubtful based on consistently applied procedures. If the issuer subsequently resumes interest payments or when the collectability of interest is reasonably assured, the debt obligation is removed from non-accrual status.
Distributions to shareholders
Distributions to shareholders from net investment income are accrued daily and paid monthly. Distributions from net realized gains, if any, are recorded on the ex-dividend date. Such distributions are determined in conformity with federal income tax regulations, which may differ in amount or character from net investment income and realized gains recognized for purposes of U.S. generally accepted accounting principles.
Federal and other taxes
The Fund intends to continue to qualify as a regulated investment company by distributing substantially all of its investment company taxable and tax-exempt income and any net realized capital gains (after reduction for capital loss carryforwards) sufficient to relieve it from all, or substantially all, federal income taxes. Accordingly, no provision for federal income taxes was required.
The Fund’s income and federal excise tax returns and all financial records supporting those returns for the prior three fiscal years are subject to examination by the federal and Delaware revenue authorities. Management has analyzed the Fund’s tax positions taken on federal, state, and foreign tax returns for all open tax years and does not believe that there are any uncertain tax positions that require recognition of a tax liability.
As of June 30, 2014, capital loss carryforwards available to offset future net realized capital gains were as follows through the indicated expiration dates:
| | | | |
| | | No expiration |
| 2018 | | 2019 | | Short-term |
| $548,785 | | $57,793 | | $1,079,533 |
Class allocations
The separate classes of shares offered by the Fund differ principally in applicable sales charges, distribution, shareholder servicing, and administration fees. Class specific expenses are charged directly to that share class. Investment income, common expenses, and realized and unrealized gains (losses) on investments are allocated daily to each class of shares based on the relative proportion of net assets of each class.
3. FAIR VALUATION MEASUREMENTS
Fair value measurements of investments are determined within a framework that has established a fair value hierarchy based upon the various data inputs utilized in determining the value of the Fund’s investments. The three-level hierarchy gives the highest priority to unadjusted quoted prices in active markets for identical assets or liabilities (Level 1) and the lowest priority to significant unobservable inputs (Level 3). The Fund’s investments are classified within the fair value hierarchy based on the lowest level of input that is significant to the fair value measurement. The inputs are summarized into three broad levels as follows:
| n | | Level 1 – quoted prices in active markets for identical securities |
| n | | Level 2 – other significant observable inputs (including quoted prices for similar securities, interest rates, prepayment speeds, credit risk, use of amortized cost, etc.) |
| n | | Level 3 – significant unobservable inputs (including the Fund’s own assumptions in determining the fair value of investments) |
The inputs or methodologies used for valuing investments in securities are not necessarily an indication of the risk associated with investing in those securities.
| | | | | | |
| Notes to financial statements (unaudited) | | Wells Fargo Advantage Colorado Tax-Free Fund | | | 19 | |
The following is a summary of the inputs used in valuing the Fund’s assets and liabilities as of December 31, 2014:
| | | | | | | | | | | | | | | | |
| | | Quoted prices
(Level 1) | | | Other significant
observable inputs
(Level 2) | | | Significant
unobservable inputs
(Level 3) | | | Total | |
Assets | | | | | | | | | | | | | | | | |
Investments in : | | | | | | | | | | | | | | | | |
| | | | |
Municipal obligations | | $ | 0 | | | $ | 80,069,191 | | | $ | 0 | | | $ | 80,069,191 | |
| | | | |
Short-term investments | | | | | | | | | | | | | | | | |
Investment companies | | | 4,949,996 | | | | 0 | | | | 0 | | | | 4,949,996 | |
Total assets | | $ | 4,949,996 | | | $ | 80,069,191 | | | $ | 0 | | | $ | 85,019,187 | |
Transfers in and transfers out are recognized at the end of the reporting period. At December 31, 2014, the Fund did not have any transfers into/out of Level 1, Level 2, or Level 3.
4. TRANSACTIONS WITH AFFILIATES
Advisory fee
The Trust has entered into an advisory contract with Funds Management, an indirect wholly owned subsidiary of Wells Fargo & Company (“Wells Fargo”). The adviser is responsible for implementing investment policies and guidelines and for supervising the subadviser, who is responsible for day-to-day portfolio management of the Fund.
Pursuant to the contract, Funds Management is entitled to receive an annual advisory fee starting at 0.35% and declining to 0.25% as the average daily net assets of the Fund increase. For the six months ended December 31, 2014, the advisory fee was equivalent to an annual rate of 0.35% of the Fund’s average daily net assets.
Funds Management has retained the services of a subadviser to provide daily portfolio management to the Fund. The fee for subadvisory services is borne by Funds Management. Wells Capital Management Incorporated, an affiliate of Funds Management and an indirect wholly owned subsidiary of Wells Fargo, is the subadviser to the Fund and is entitled to receive a fee from Funds Management at an annual rate starting at 0.20% and declining to 0.10% as the average daily net assets of the Fund increase.
Administration fees
The Trust has entered into an administration agreement with Funds Management. Under this agreement, for providing administrative services, which includes paying fees and expenses for services provided by the transfer agent, sub-transfer agents, omnibus account servicers and record-keepers, Funds Management is entitled to receive from the Fund an annual fund level administration fee starting at 0.05% and declining to 0.03% as the average daily net assets of the Fund increase and a class level administration fee which is calculated based on the average daily net assets of each class as follows:
| | | | |
| | | Class level administration
fee | |
Class A, Class B, Class C | | | 0.16 | % |
Administrator Class | | | 0.10 | |
Funds Management has contractually waived and/or reimbursed advisory and administration fees to the extent necessary to maintain certain net operating expense ratios for the Fund. Waiver of fees and/or reimbursement of expenses by Funds Management were made first from fund level expenses on a proportionate basis and then from class specific expenses. Funds Management has committed through October 31, 2015 to waive fees and/or reimburse expenses to the extent necessary to cap the Fund’s expenses at 0.85% for Class A shares, 1.60% for Class B shares, 1.60% for Class C shares, and 0.60% for Administrator Class shares. After this time, the cap may be increased or the commitment to maintain the cap may be terminated only with the approval of the Board of Trustees.
Distribution fees
The Trust has adopted a Distribution Plan for Class B and Class C shares of the Fund pursuant to Rule 12b-1 under the 1940 Act. Distribution fees are charged to Class B and Class C shares and paid to Wells Fargo Funds Distributor, LLC (“Funds Distributor”), the principal underwriter, at an annual rate of 0.75% of the average daily net assets of Class B and Class C shares.
| | | | |
| 20 | | Wells Fargo Advantage Colorado Tax-Free Fund | | Notes to financial statements (unaudited) |
In addition, Funds Distributor is entitled to receive the front-end sales charge from the purchase of Class A shares and a contingent deferred sales charge on the redemption of certain shares. Funds Distributor is also entitled to receive the contingent deferred sales charges from redemptions of Class B and Class C shares. For the six months ended December 31, 2014, Funds Distributor received $583 from the sale of Class A shares.
Shareholder servicing fees
The Trust has entered into contracts with one or more shareholder servicing agents, whereby Class A, Class B, Class C, and Administrator Class of the Fund is charged a fee at an annual rate of 0.25% of the average daily net assets of each respective class.
A portion of these total shareholder servicing fees were paid to affiliates of Wells Fargo.
5. INVESTMENT PORTFOLIO TRANSACTIONS
Purchases and sales of investments, excluding U.S. government obligations (if any) and short-term securities, for the six months ended December 31, 2014 were $8,354,733 and $10,612,842, respectively.
6. BANK BORROWINGS
The Trust (excluding the money market funds and certain other funds in the Trust) and Wells Fargo Variable Trust are parties to a $150,000,000 revolving credit agreement, whereby the Fund is permitted to use bank borrowings for temporary or emergency purposes, such as to fund shareholder redemption requests. Interest under the credit agreement is charged to the Fund based on a borrowing rate equal to the higher of the Federal Funds rate in effect on that day plus 1.25% or the overnight LIBOR rate in effect on that day plus 1.25%. In addition, an annual commitment fee equal to 0.10% of the unused balance is allocated to each participating fund. For the six months ended December 31, 2014, the Fund paid $46 in commitment fees.
For the six months ended December 31, 2014, there were no borrowings by the Fund under the agreement.
7. CONCENTRATION RISK
The Fund invests a substantial portion of its assets in issuers of municipal debt securities located in a single state or territories of the U.S. Therefore, it may be more affected by economic and political developments in that state or region than would be a comparable general tax-exempt fund.
8. INDEMNIFICATION
Under the Trust’s organizational documents, the officers and Trustees are indemnified against certain liabilities that may arise out of performance of their duties to the Trust. Additionally, in the normal course of business, the Trust may enter into contracts with service providers that contain a variety of indemnification clauses. The Trust’s maximum exposure under these arrangements is dependent on future claims that may be made against the Fund and, therefore, cannot be estimated.
| | | | | | |
| Other information (unaudited) | | Wells Fargo Advantage Colorado Tax-Free Fund | | | 21 | |
PROXY VOTING INFORMATION
A description of the policies and procedures that the Fund uses to determine how to vote proxies relating to portfolio securities is available without charge, upon request, by calling 1-800-222-8222, visiting our website at wellsfargoadvantagefunds.com, or visiting the SEC website at sec.gov. Information regarding how the Fund voted proxies relating to portfolio securities during the most recent 12-month period ended June 30 is available on the Fund’s website at wellsfargoadvantagefunds.com or by visiting the SEC website at sec.gov.
PORTFOLIO HOLDINGS INFORMATION
The complete portfolio holdings for the Fund are publicly available monthly on the Fund’s website (wellsfargoadvantagefunds.com), on a one-month delayed basis. In addition, top ten holdings information (excluding derivative positions) for the Fund is publicly available on the Fund’s website on a monthly, seven-day or more delayed basis. The Fund files its complete schedule of portfolio holdings with the SEC for the first and third quarters of each fiscal year on Form N-Q, which is available by visiting the SEC website at sec.gov. In addition, the Fund’s Form N-Q may be reviewed and copied at the SEC’s Public Reference Room in Washington, DC, and at regional offices in New York City, at 233 Broadway, and in Chicago, at 175 West Jackson Boulevard, Suite 900. Information about the Public Reference Room may be obtained by calling 1-800-SEC-0330.
| | | | |
| 22 | | Wells Fargo Advantage Colorado Tax-Free Fund | | Other information (unaudited) |
BOARD OF TRUSTEES AND OFFICERS
Each of the Trustees and Officers1 listed in the table below acts in identical capacities for each fund in the Wells Fargo Advantage family of funds, which consists of 134 mutual funds comprising the Wells Fargo Funds Trust, Wells Fargo Variable Trust, Wells Fargo Master Trust and four closed-end funds (collectively the “Fund Complex”). This table should be read in conjunction with the Prospectus and the Statement of Additional Information2. The mailing address of each Trustee and Officer is 525 Market Street, 12th Floor, San Francisco, CA 94105. Each Trustee and Officer serves an indefinite term, however, each Trustee serves such term until reaching the mandatory retirement age established by the Trustees.
Independent Trustees
| | | | | | |
Name and year of birth | | Position held and length of service* | | Principal occupations during past five years or longer | | Other directorships during
past five years |
| Peter G. Gordon (Born 1942) | | Trustee, since 1998; Chairman, since 2005 | | Co-Founder, Retired Chairman, President and CEO of Crystal Geyser Water Company. Trustee Emeritus, Colby College. | | Asset Allocation Trust |
| Isaiah Harris, Jr. (Born 1952) | | Trustee, since 2009 | | Retired. Prior thereto, President and CEO of BellSouth Advertising and Publishing Corp. from 2005 to 2007, President and CEO of BellSouth Enterprises from 2004 to 2005 and President of BellSouth Consumer Services from 2000 to 2003. Emeritus member of the Iowa State University Foundation Board of Governors. Emeritus Member of the Advisory Board of Iowa State University School of Business. Advisory Board Member, Palm Harbor Academy. Mr. Harris is a certified public accountant. | | CIGNA Corporation; Asset Allocation Trust |
| Judith M. Johnson (Born 1949) | | Trustee, since 2008; Audit Committee Chairman, since 2008 | | Retired. Prior thereto, Chief Executive Officer and Chief Investment Officer of Minneapolis Employees Retirement Fund from 1996 to 2008. Ms. Johnson is an attorney, certified public accountant and a certified managerial accountant. | | Asset Allocation Trust |
| Leroy Keith, Jr. (Born 1939) | | Trustee, since 2010** | | Chairman, Bloc Global Services (development and construction). Trustee of the Evergreen Funds complex (and its predecessors) from 1983 to 2010. Former Managing Director, Almanac Capital Management (commodities firm), former Partner, Stonington Partners, Inc. (private equity fund), former Director, Obagi Medical Products Co. and former Director, Lincoln Educational Services. | | Trustee, Virtus Fund Complex (consisting of 50 portfolios as of 12/16/2013); Asset Allocation Trust |
| David F. Larcker (Born 1950) | | Trustee, since 2009 | | James Irvin Miller Professor of Accounting at the Graduate School of Business, Stanford University, Morgan Stanley Director of the Center for Leadership Development and Research and Senior Faculty of The Rock Center for Corporate Governance since 2006. From 2005 to 2008, Professor of Accounting at the Graduate School of Business, Stanford University. Prior thereto, Ernst & Young Professor of Accounting at The Wharton School, University of Pennsylvania from 1985 to 2005. | | Asset Allocation Trust |
| Olivia S. Mitchell (Born 1953) | | Trustee, since 2006 | | International Foundation of Employee Benefit Plans Professor, Wharton School of the University of Pennsylvania since 1993. Director of Wharton’s Pension Research Council and Boettner Center on Pensions & Retirement Research, and Research Associate at the National Bureau of Economic Research. Previously, Cornell University Professor from 1978 to 1993. | | Asset Allocation Trust |
| Timothy J. Penny (Born 1951) | | Trustee, since 1996 | | President and CEO of Southern Minnesota Initiative Foundation, a non-profit organization, since 2007 and Senior Fellow at the Humphrey Institute Policy Forum at the University of Minnesota since 1995. Member of the Board of Trustees of NorthStar Education Finance, Inc., a non-profit organization, since 2007. | | Asset Allocation Trust |
| | | | | | |
| Other information (unaudited) | | Wells Fargo Advantage Colorado Tax-Free Fund | | | 23 | |
| | | | | | |
Name and year of birth | | Position held and length of service* | | Principal occupations during past five years or longer | | Other directorships during
past five years |
| Michael S. Scofield (Born 1943) | | Trustee, since 2010 | | Served on the Investment Company Institute’s Board of Governors and Executive Committee from 2008-2011 as well the Governing Council of the Independent Directors Council from 2006-2011 and the Independent Directors Council Executive Committee from 2008-2011. Chairman of the IDC from 2008-2010. Institutional Investor (Fund Directions) Trustee of Year in 2007. Trustee of the Evergreen Funds complex (and its predecessors) from 1984 to 2010. Chairman of the Evergreen Funds from 2000-2010. Former Trustee of the Mentor Funds. Retired Attorney, Law Offices of Michael S. Scofield. | | Asset Allocation Trust |
| Donald C. Willeke (Born 1940) | | Trustee, since 1996 | | Principal of the law firm of Willeke & Daniels. General Counsel of the Minneapolis Employees Retirement Fund from 1984 until its consolidation into the Minnesota Public Employees Retirement Association on June 30, 2010. Director and Vice Chair of The Tree Trust (non-profit corporation). Director of the American Chestnut Foundation (non-profit corporation). | | Asset Allocation Trust |
| * | Length of service dates reflect the Trustee’s commencement of service with the Trust’s predecessor entities, where applicable. |
| ** | Leroy Keith, Jr. retired as a Trustee effective December 31, 2014. |
Officers
| | | | | | |
Name and year of birth | | Position held and
length of service | | Principal occupations during past five years or longer | | |
| Karla M. Rabusch (Born 1959) | | President, since 2003 | | Executive Vice President of Wells Fargo Bank, N.A. and President of Wells Fargo Funds Management, LLC since 2003. | | |
Nancy Wiser1
(Born 1967) | | Treasurer, since 2012 | | Executive Vice President of Wells Fargo Funds Management, LLC since 2011. Chief Operating Officer and Chief Compliance Officer at LightBox Capital Management LLC, from 2008 to 2011. Owned and operated a consulting business providing services to various hedge funds including acting as Chief Operating Officer and Chief Compliance Officer for a hedge fund from 2007 to 2008. Chief Operating Officer and Chief Compliance Officer of GMN Capital LLC from 2006 to 2007. | | |
| C. David Messman (Born 1960) | | Secretary, since 2000; Chief Legal Officer, since 2003 | | Assistant General Counsel of Wells Fargo Bank, N.A. since 2013 and Vice President and Managing Counsel of Wells Fargo Bank N.A. from 1996 to 2013. Senior Vice President and Secretary of Wells Fargo Funds Management , LLC since 2001. | | |
Debra Ann Early
(Born 1964) | | Chief Compliance Officer, since 2007 | | Senior Vice President of Wells Fargo Funds Management, LLC since 2007 and Chief Compliance Officer from 2007 to 2014. Chief Compliance Officer of Parnassus Investments from 2005 to 2007. Chief Financial Officer of Parnassus Investments from 2004 to 2007 and Senior Audit Manager of PricewaterhouseCoopers LLP from 1998 to 2004. | | |
David Berardi
(Born 1975) | | Assistant Treasurer, since 2009 | | Vice President of Wells Fargo Funds Management, LLC since 2009. Vice President of Evergreen Investment Management Company, LLC from 2008 to 2010. Assistant Vice President of Evergreen Investment Services, Inc. from 2004 to 2008. Manager of Fund Reporting and Control for Evergreen Investment Management Company, LLC from 2004 to 2010. | | |
| Jeremy DePalma1 (Born 1974) | | Assistant Treasurer, since 2009 | | Senior Vice President of Wells Fargo Funds Management, LLC since 2009. Senior Vice President of Evergreen Investment Management Company, LLC from 2008 to 2010. Vice President, Evergreen Investment Services, Inc. from 2004 to 2007. Head of the Fund Reporting and Control Team within Fund Administration from 2005 to 2010. | | |
| 1. | Nancy Wiser acts as Treasurer of 73 funds in the Fund Complex. Jeremy DePalma acts as Treasurer of 61 funds and Assistant Treasurer of 73 funds in the Fund Complex. |
| 2. | The Statement of Additional Information includes additional information about the Trustees and is available, without charge, upon request, by calling 1-800-222-8222 or by visiting the website at wellsfargoadvantagefunds.com. |
| | | | |
| 24 | | Wells Fargo Advantage Colorado Tax-Free Fund | | List of abbreviations |
The following is a list of common abbreviations for terms and entities that may have appeared in this report.
| ACA | — ACA Financial Guaranty Corporation |
| ADR | — American depositary receipt |
| ADS | — American depositary shares |
| AGC | — Assured Guaranty Corporation |
| AGM | — Assured Guaranty Municipal |
| Ambac | — Ambac Financial Group Incorporated |
| AMT | — Alternative minimum tax |
| BAN | — Bond anticipation notes |
| BHAC | — Berkshire Hathaway Assurance Corporation |
| CAB | — Capital appreciation bond |
| CCAB | — Convertible capital appreciation bond |
| CDA | — Community Development Authority |
| CDO | — Collateralized debt obligation |
| DRIVER | — Derivative inverse tax-exempt receipts |
| DW&P | — Department of Water & Power |
| DWR | — Department of Water Resources |
| ECFA | — Educational & Cultural Facilities Authority |
| EDA | — Economic Development Authority |
| EDFA | — Economic Development Finance Authority |
| ETF | — Exchange-traded fund |
| FDIC | — Federal Deposit Insurance Corporation |
| FFCB | — Federal Farm Credit Banks |
| FGIC | — Financial Guaranty Insurance Corporation |
| FHA | — Federal Housing Administration |
| FHLB | — Federal Home Loan Bank |
| FHLMC | — Federal Home Loan Mortgage Corporation |
| FICO | — The Financing Corporation |
| FNMA | — Federal National Mortgage Association |
| GDR | — Global depositary receipt |
| GNMA | — Government National Mortgage Association |
| HCFR | — Healthcare facilities revenue |
| HEFA | — Health & Educational Facilities Authority |
| HEFAR | — Higher education facilities authority revenue |
| HFA | — Housing Finance Authority |
| HFFA | — Health Facilities Financing Authority |
| HUD | — Department of Housing and Urban Development |
| IDA | — Industrial Development Authority |
| IDAG | — Industrial Development Agency |
| KRW | — Republic of Korea won |
| LIBOR | — London Interbank Offered Rate |
| LIFERs | — Long Inverse Floating Exempt Receipts |
| LLC | — Limited liability company |
| LLLP | — Limited liability limited partnership |
| LLP | — Limited liability partnership |
| MBIA | — Municipal Bond Insurance Association |
| MFHR | — Multifamily housing revenue |
| MSTR | — Municipal securities trust receipts |
| MUD | — Municipal Utility District |
| National | — National Public Finance Guarantee Corporation |
| PCFA | — Pollution Control Financing Authority |
| PCL | — Public Company Limited |
| PCR | — Pollution control revenue |
| PFA | — Public Finance Authority |
| PFFA | — Public Facilities Financing Authority |
| PFOTER | — Puttable floating option tax-exempt receipts |
| plc | — Public limited company |
| PUTTER | — Puttable tax-exempt receipts |
| R&D | — Research & development |
| Radian | — Radian Asset Assurance |
| RAN | — Revenue anticipation notes |
| RDA | — Redevelopment Authority |
| RDFA | — Redevelopment Finance Authority |
| REIT | — Real estate investment trust |
| ROC | — Reset option certificates |
| SAVRS | — Select auction variable rate securities |
| SBA | — Small Business Authority |
| SFHR | — Single-family housing revenue |
| SFMR | — Single-family mortgage revenue |
| SPA | — Standby purchase agreement |
| SPDR | — Standard & Poor’s Depositary Receipts |
| SPEARs | — Short Puttable Exempt Adjustable Receipts |
| STRIPS | — Separate trading of registered interest and |
| TAN | — Tax anticipation notes |
| TIPS | — Treasury inflation-protected securities |
| TRAN | — Tax revenue anticipation notes |
| TTFA | — Transportation Trust Fund Authority |
| TVA | — Tennessee Valley Authority |


For more information
More information about Wells Fargo Advantage Funds is available free upon request. To obtain literature, please write, email, visit the Fund’s website, or call:
Wells Fargo Advantage Funds
P.O. Box 8266
Boston, MA 02266-8266
Email: wfaf@wellsfargo.com
Website: wellsfargoadvantagefunds.com
Individual investors: 1-800-222-8222
Retail investment professionals: 1-888-877-9275
Institutional investment professionals: 1-866-765-0778
This report and the financial statements contained herein are submitted for the general information of the shareholders of Wells Fargo Advantage Funds. If this report is used for promotional purposes, distribution of the report must be accompanied or preceded by a current prospectus. Before investing, please consider the investment objectives, risks, charges, and expenses of the investment. For a current prospectus and, if available, a summary prospectus, containing this information, call 1-800-222-8222 or visit the Fund’s website at wellsfargoadvantagefunds.com. Read the prospectus carefully before you invest or send money.
Wells Fargo Funds Management, LLC, a wholly owned subsidiary of Wells Fargo & Company, provides investment advisory and administrative services for Wells Fargo Advantage Funds. Other affiliates of Wells Fargo & Company provide subadvisory and other services for the Funds. The Funds are distributed by Wells Fargo Funds Distributor, LLC, Member FINRA/SIPC, an affiliate of Wells Fargo & Company.
NOT FDIC INSURED ¡ NO BANK GUARANTEE ¡ MAY LOSE VALUE
© 2014 Wells Fargo Funds Management, LLC. All rights reserved.
| | |
 | | 230423 02-15 SA250/SAR250 12-14 |

Wells Fargo Advantage
High Yield Municipal Bond Fund

Semi-Annual Report
December 31, 2014

Reduce clutter. Save trees.
Sign up for electronic delivery of prospectuses and shareholder reports at wellsfargo.com/advantagedelivery
Contents
The views expressed and any forward-looking statements are as of December 31, 2014, unless otherwise noted, and are those of the Fund managers and/or Wells Fargo Funds Management, LLC. Discussions of individual securities, or the markets generally, or any Wells Fargo Advantage Fund are not intended as individual recommendations. Future events or results may vary significantly from those expressed in any forward-looking statements; the views expressed are subject to change at any time in response to changing circumstances in the market. Wells Fargo Funds Management, LLC and the Fund disclaim any obligation to publicly update or revise any views expressed or forward-looking statements.
NOT FDIC INSURED ¡ NO BANK GUARANTEE ¡ MAY LOSE VALUE
| | | | |
| 2 | | Wells Fargo Advantage High Yield Municipal Bond Fund | | Letter to shareholders (unaudited) |

Karla M. Rabusch
President
Wells Fargo Advantage Funds
Municipal bonds rose in the second half of 2014, helped by lower interest rates and strong demand for yield.
Dear Valued Shareholder:
We are pleased to provide you with this semi-annual report for the Wells Fargo Advantage High Yield Municipal Bond Fund for the six-month period that ended December 31, 2014. Municipal bonds rose in the second half of 2014, helped by lower interest rates and strong demand for yield. In fact, the longest-dated and weakest credits had the strongest returns. Municipal bond returns—as measured by the Barclays Municipal Bond Index1, the broadest measure for tracking investment-grade municipal bonds throughout the country—gained 2.88% for the six-month period that ended December 31, 2014.
Longer-maturity and lower-rated municipal bonds outperformed.
At the front end of the yield curve, municipal bond yields were extremely low because of the accommodative monetary policy. Throughout the reporting period, the U.S. Federal Reserve’s (Fed’s) monetary policymaking body kept its key interest rate near zero in order to support the economy and the financial system. Policymakers said they can be patient in normalizing monetary policy and that any increases in the target range for the federal funds rate will depend on incoming economic data. During the reporting period, the Fed reduced (or tapered) the size of its quantitative easing program each month until the program ended in October 2014, although it continues to reinvest principal and interest payments of the mortgage-backed securities and Treasury bonds it holds.
Longer-term yields declined during the second half of the year, with 10-year municipal yields declining from 2.33% as of June 30, 2014 to 2.10% as of December 31, 2014. For more perspective, the yield curve was steep on a historical basis at the beginning of the period and ended the period with the difference between 30-year and 2-year yields at 237 basis points (bps; 100 bps equals 1.00%), which was only slightly wider than its historical average. Because the yield curve was steep, longer-dated securities had higher yields. Given their longer maturities (as municipal yields fell further out the curve) and their more generous yields, longer-term bond returns outpaced shorter-term bonds.
Investors were also enticed to buy lower-rated securities for their higher yields. Over the six-month period that ended December 31, 2014, AAA-rated municipal bonds returned 2.04% while BBB-rated bonds returned 4.29%, according to the Barclays Municipal Bond Index. Credit conditions continued to improve, as evidenced by an 18th consecutive quarter of positive year-over-year gains in state and local municipal revenues. In addition to better fundamental credit conditions, technical factors of limited supply alongside strong investor demand also supported municipal bonds.
Puerto Rico’s struggle, the exit of two cities from bankruptcy, and pension issues topped credit news.
Puerto Rico was the asset class’s largest single credit story. Bonds from the commonwealth returned a meager 0.79% during the six-month period as population declines, a contracting economy, and a burdensome level of debt held back results. Meanwhile, the cities of Stockton, California, and Detroit, Michigan, exited bankruptcy by curbing retiree health care benefits and bondholder recoveries but largely avoiding concessions on pensions. While these recent bankruptcies have so far treated pensions better than bonded debt, no clear precedent has been established due to the difference in general obligation
| 1. | The Barclays Municipal Bond Index is an unmanaged index composed of long-term tax-exempt bonds with a minimum credit rating of Baa. You cannot invest directly in an index. |
| | | | | | |
| Letter to shareholders (unaudited) | | Wells Fargo Advantage High Yield Municipal Bond Fund | | | 3 | |
pledges and court-ordered versus negotiated concessions. Finally, underfunded pensions in Illinois, New Jersey, Pennsylvania, and Kansas gained attention for their negative fiscal effects and the political difficulties of finding a resolution.
Don’t let short-term uncertainty derail long-term investment goals.
Periods of uncertainty can present challenges, but experience has taught us that maintaining long-term investment goals can be an effective way to plan for the future. To help you create a sound strategy based on your personal goals and risk tolerance, Wells Fargo Advantage Funds offers more than 100 mutual funds and other investments spanning a wide range of asset classes and investment styles. Although diversification cannot guarantee an investment profit or prevent losses, we believe it can be an effective way to manage investment risk and potentially smooth out overall portfolio performance. We encourage investors to know their investments and to understand that appropriate levels of risk-taking may unlock opportunities.
Thank you for choosing to invest with Wells Fargo Advantage Funds. We appreciate your confidence in us and remain committed to helping you meet your financial needs. For current information about your fund investments, contact your investment professional, visit our website at wellsfargoadvantagefunds.com, or call us directly at 1-800-222-8222. We are available 24 hours a day, 7 days a week.
Sincerely,

Karla M. Rabusch
President
Wells Fargo Advantage Funds
Periods of uncertainty can present challenges, but experience has taught us that maintaining long-term investment goals can be an effective way to plan for the future.
| | | | |
| 4 | | Wells Fargo Advantage High Yield Municipal Bond Fund | | Performance highlights (unaudited) |
Investment objective
The Fund seeks high current income exempt from federal income tax, and capital appreciation.
Adviser
Wells Fargo Funds Management, LLC
Subadviser
Wells Capital Management Incorporated
Portfolio managers
Dennis Derby
Lyle J. Fitterer, CFA, CPA
Terry J. Goode
Average annual total returns (%) as of December 31, 2014
| | | | | | | | | | | | | | | | | | | | | | | | | | |
| | | | | Including sales charge | | | Excluding sales charge | | | Expense ratios1 (%) | |
| | | Inception date | | 1 year | | | Since inception | | | 1 year | | | Since inception | | | Gross | | | Net2 | |
| Class A (WHYMX) | | 1-31-2013 | | | 10.37 | | | | 4.36 | | | | 15.61 | | | | 6.89 | | | | 1.87 | | | | 0.86 | |
| Class C (WHYCX) | | 1-31-2013 | | | 13.74 | | | | 6.10 | | | | 14.74 | | | | 6.10 | | | | 2.62 | | | | 1.61 | |
| Administrator Class (WHYDX) | | 1-31-2013 | | | – | | | | – | | | | 15.61 | | | | 7.00 | | | | 1.81 | | | | 0.76 | |
| Institutional Class (WHYIX) | | 1-31-2013 | | | – | | | | – | | | | 15.90 | | | | 7.16 | | | | 1.54 | | | | 0.61 | |
| Barclays Municipal Bond Index3 | | – | | | – | | | | – | | | | 9.05 | | | | 3.00 | | | | – | | | | – | |
| Barclays High Yield Municipal Bond Index4 | | – | | | – | | | | – | | | | 13.84 | | | | 3.27 | | | | – | | | | – | |
Figures quoted represent past performance, which is no guarantee of future results, and do not reflect taxes that a shareholder may pay on fund distributions or the redemption of fund shares. Investment return and principal value of an investment will fluctuate so that an investor’s shares, when redeemed, may be worth more or less than their original cost. Performance shown without sales charges would be lower if sales charges were reflected. Current performance may be lower or higher than the performance data quoted, which assumes the reinvestment of dividends and capital gains. Current month-end performance is available on the Fund’s website, wellsfargoadvantagefunds.com.
Index returns do not include transaction costs associated with buying and selling securities, any mutual fund fees or expenses, or any taxes. It is not possible to invest directly in an index.
For Class A shares, the maximum front-end sales charge is 4.50%. For Class C shares, the maximum contingent deferred sales charge is 1.00%. Performance including a contingent deferred sales charge assumes the sales charge for the corresponding time period. Administrator Class and Institutional Class shares are sold without a front-end sales charge or contingent deferred sales charge.
Bond values fluctuate in response to the financial condition of individual issuers, general market and economic conditions, and changes in interest rates. Changes in market conditions and government policies may lead to periods of heightened volatility in the bond market and reduced liquidity for certain bonds held by the Fund. In general, when interest rates rise, bond values fall and investors may lose principal value. Interest-rate changes and their impact on the Fund and its share price can be sudden and unpredictable. High-yield securities have a greater risk of default and tend to be more volatile than higher-rated debt securities. The use of derivatives may reduce returns and/or increase volatility. Certain investment strategies tend to increase the total risk of an investment (relative to the broader market). The Fund is exposed to municipal securities risk. Consult the Fund’s prospectus for additional information on these and other risks. A portion of the Fund’s income may be subject to federal, state, and/or local income taxes or the Alternative Minimum Tax (AMT). Any capital gains distributions may be taxable.
Please see footnotes on page 5.
| | | | | | |
| Performance highlights (unaudited) | | Wells Fargo Advantage High Yield Municipal Bond Fund | | | 5 | |
|
| Credit quality distribution5 as of December 31, 2014 |
|
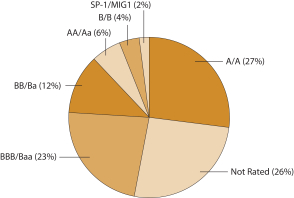 |
|
| Effective maturity distribution6 as of December 31, 2014 |
|
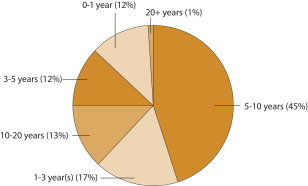 |
| 1. | Reflects the expense ratios as stated in the most recent prospectuses, which include the impact of 0.01% in acquired fund fees and expenses. The expense ratios shown are subject to change and may differ from the annualized expense ratios shown in the financial highlights of this report, which do not include acquired fund fees and expenses. |
| 2. | The Adviser has committed through October 31, 2015, to waive fees and/or reimburse expenses to the extent necessary to cap the Fund’s Total Annual Fund Operating Expenses After Fee Waiver, excluding certain expenses, at 0.85% for Class A, 1.60% for Class C, 0.75% for Administrator Class, and 0.60% for Institutional Class. After this time, the cap may be increased or the commitment to maintain the cap may be terminated only with the approval of the Board of Trustees. Brokerage commissions, stamp duty fees, interest, taxes, acquired fund fees and expenses, and extraordinary expenses are excluded from the cap. Without this cap, the Fund’s returns would have been lower. |
| 3. | The Barclays Municipal Bond Index is an unmanaged index composed of long-term tax-exempt bonds with a minimum credit rating of Baa. You cannot invest directly in an index. |
| 4. | The Barclays High Yield Municipal Bond Index is an index consisting of all domestic and Yankee bonds, rated below investment grade, with a minimum outstanding amount of $100 million and maturing over one year. You cannot invest directly in an index. |
| 5. | The credit quality distribution of portfolio holdings reflected in the chart is based on ratings from Standard & Poor’s, Moody’s Investors Service, and/or Fitch Ratings Ltd. Credit quality ratings apply to the underlying holdings of the Fund and not to the Fund itself. The percentages of the Fund’s portfolio with the ratings depicted in the chart are calculated based on the total market value of fixed income securities held by the Fund. If a security was rated by all three rating agencies, the middle rating was utilized. If rated by two of three rating agencies, the lower rating was utilized, and if rated by one of the rating agencies, that rating was utilized. Standard & Poor’s rates the creditworthiness of bonds on a scale of AAA (highest) to D (lowest). Ratings from A to CCC may be modified by the addition of a plus (+) or minus (-) sign to show relative standing within the rating categories. Standard & Poor’s rates the creditworthiness of short-term notes on a scale SP-1 (highest) to SP-3 (lowest). Moody’s rates the creditworthiness of bond on a scale of Aaa (highest) to C (lowest). Ratings Aa to B may be modified by the addition of a number 1 (highest) to 3 (lowest) to show relative standing within the ratings categories. Moody’s rates the creditworthiness of short-term U.S. tax-exempt municipal securities from MIG 1/VMIG 1 (highest) to SG (lowest). Fitch rates the creditworthiness of bonds, ranging from AAA (highest) to D (lowest). Credit quality and credit quality ratings are subject to change and may have changed since the date specified. |
| 6. | Effective maturity distribution is calculated based on the total long-term investments of the Fund. It is subject to change and may have changed since the date specified. |
| | | | |
| 6 | | Wells Fargo Advantage High Yield Municipal Bond Fund | | Fund expenses (unaudited) |
As a shareholder of the Fund, you incur two types of costs: (1) transaction costs, including sales charges (loads) on purchase payments and contingent deferred sales charges (if any) on redemptions and (2) ongoing costs, including management fees, distribution (12b-1) and/or shareholder service fees, and other Fund expenses. This example is intended to help you understand your ongoing costs (in dollars) of investing in the Fund and to compare these costs with the ongoing costs of investing in other mutual funds.
The example is based on an investment of $1,000 invested at the beginning of the six-month period and held for the entire period from July 1, 2014 to December 31, 2014.
Actual expenses
The “Actual” line of the table below provides information about actual account values and actual expenses. You may use the information in this line, together with the amount you invested, to estimate the expenses that you paid over the period. Simply divide your account value by $1,000 (for example, an $8,600 account value divided by $1,000 = 8.6), then multiply the result by the number in the “Actual” line under the heading entitled “Expenses paid during period” for your applicable class of shares to estimate the expenses you paid on your account during this period.
Hypothetical example for comparison purposes
The “Hypothetical” line of the table below provides information about hypothetical account values and hypothetical expenses based on the Fund’s actual expense ratio and an assumed rate of return of 5% per year before expenses, which is not the Fund’s actual return. The hypothetical account values and expenses may not be used to estimate the actual ending account balance or expenses you paid for the period. You may use this information to compare the ongoing costs of investing in the Fund and other funds. To do so, compare this 5% hypothetical example with the 5% hypothetical examples that appear in the shareholder reports of the other funds.
Please note that the expenses shown in the table are meant to highlight your ongoing costs only and do not reflect any transactional costs, such as sales charges (loads) and contingent deferred sales charges. Therefore, the “Hypothetical” line of the table is useful in comparing ongoing costs only and will not help you determine the relative total costs of owning different funds. In addition, if these transactional costs were included, your costs would have been higher.
| | | | | | | | | | | | | | | | |
| | | Beginning
account value
7-1-2014 | | | Ending
account value
12-31-2014 | | | Expenses
paid during
the period1 | | | Net annualized
expense ratio | |
Class A | | | | | | | | | | | | | | | | |
Actual | | $ | 1,000.00 | | | $ | 1,048.54 | | | $ | 4.39 | | | | 0.85 | % |
Hypothetical (5% return before expenses) | | $ | 1,000.00 | | | $ | 1,020.92 | | | $ | 4.33 | | | | 0.85 | % |
Class C | | | | | | | | | | | | | | | | |
Actual | | $ | 1,000.00 | | | $ | 1,044.58 | | | $ | 8.25 | | | | 1.60 | % |
Hypothetical (5% return before expenses) | | $ | 1,000.00 | | | $ | 1,017.14 | | | $ | 8.13 | | | | 1.60 | % |
Administrator Class | | | | | | | | | | | | | | | | |
Actual | | $ | 1,000.00 | | | $ | 1,048.06 | | | $ | 3.87 | | | | 0.75 | % |
Hypothetical (5% return before expenses) | | $ | 1,000.00 | | | $ | 1,021.42 | | | $ | 3.82 | | | | 0.75 | % |
Institutional Class | | | | | | | | | | | | | | | | |
Actual | | $ | 1,000.00 | | | $ | 1,049.87 | | | $ | 3.10 | | | | 0.60 | % |
Hypothetical (5% return before expenses) | | $ | 1,000.00 | | | $ | 1,022.18 | | | $ | 3.06 | | | | 0.60 | % |
| 1. | Expenses paid is equal to the annualized expense ratio of each class multiplied by the average account value over the period, multiplied by the number of days in the most recent fiscal half-year divided by the number of days in the fiscal year (to reflect the one-half-year period). |
| | | | | | |
| Portfolio of investments—December 31, 2014 (unaudited) | | Wells Fargo Advantage High Yield Municipal Bond Fund | | | 7 | |
| | | | | | | | | | | | | | | | |
| Security name | | Interest rate | | | Maturity date | | | Principal | | | Value | |
| | | | |
Municipal Obligations: 95.54% | | | | | | | | | | | | | | | | |
| | | | |
| Alabama: 2.41% | | | | | | | | | | | | | | | | |
Alabama State University General Tuition and Fee Revenue Bonds (Education Revenue, Syncora Guarantee Incorporated Insured) | | | 5.25 | % | | | 8-1-2032 | | | $ | 1,000,000 | | | $ | 1,029,190 | |
Jefferson County AL Sewer Revenue Warrants CAB Senior Lien Series B (Water & Sewer Revenue, AGM Insured) ¤ | | | 0.00 | | | | 10-1-2027 | | | | 920,000 | | | | 510,904 | |
Selma AL Industrial Development Board Revenue Gulf Opportunity Zone Series A (Industrial Development Revenue) | | | 6.25 | | | | 11-1-2033 | | | | 610,000 | | | | 711,693 | |
| | | | |
| | | | | | | | | | | | | | | 2,251,787 | |
| | | | | | | | | | | | | | | | |
| | | | |
| Arizona: 4.77% | | | | | | | | | | | | | | | | |
Florence AZ IDA Legacy Traditional School Project Queen Creek & Casa Grande Campuses (Education Revenue) | | | 5.00 | | | | 7-1-2023 | | | | 250,000 | | | | 265,643 | |
Phoenix AZ IDA Guam Facilities Foundation Incorporated Project (Education Revenue ) | | | 5.00 | | | | 2-1-2018 | | | | 1,000,000 | | | | 1,059,060 | |
Phoenix AZ IDA Legacy Traditional Schools Project Series A (Education Revenue) 144A | | | 6.50 | | | | 7-1-2034 | | | | 500,000 | | | | 565,055 | |
Phoenix AZ IDA Great Hearts Academies Project (Education Revenue) | | | 5.20 | | | | 7-1-2022 | | | | 200,000 | | | | 208,020 | |
Pima County AZ IDA New Plan Learning Series A (Education Revenue) | | | 8.13 | | | | 7-1-2041 | | | | 500,000 | | | | 502,895 | |
Pima County AZ IDA Refunding Bond Desert Heights Charter School Facility (Education Revenue) | | | 6.00 | | | | 5-1-2024 | | | | 665,000 | | | | 694,885 | |
Salt Verde AZ Financial Corporation (Utilities Revenue, Citibank NA Guaranty Agreement) | | | 5.00 | | | | 12-1-2032 | | | | 1,000,000 | | | | 1,154,880 | |
| | | | |
| | | | | | | | | | | | | | | 4,450,438 | |
| | | | | | | | | | | | | | | | |
| | | | |
| California: 7.06% | | | | | | | | | | | | | | | | |
Anaheim CA PFA Series A (Lease Revenue) | | | 5.00 | | | | 5-1-2046 | | | | 500,000 | | | | 550,435 | |
California CDA California Baptist University Series B (Education Revenue) 144A | | | 5.75 | | | | 11-1-2017 | | | | 130,000 | | | | 134,659 | |
California HFA Home Mortgage Series G (Housing Revenue) | | | 4.95 | | | | 8-1-2023 | | | | 750,000 | | | | 770,543 | |
California Municipal Finance Authority Charter School Revenue Albert Einstein Academies Project Series A (Miscellaneous Revenue) | | | 7.13 | | | | 8-1-2043 | | | | 250,000 | | | | 287,920 | |
California School Finance Authority View Park Elementary & Middle Schools Series A (Education Revenue) | | | 5.88 | | | | 10-1-2044 | | | | 1,000,000 | | | | 1,014,720 | |
California Statewide CDA Loma Linda University Medical Center Refunding Bond Series A (Health Revenue) | | | 5.25 | | | | 12-1-2044 | | | | 1,000,000 | | | | 1,081,040 | |
California Statewide CDA Senior Living Health Facilities Los Angeles Jewish Home for the Aging Sub Series D (Health Revenue, Jewish Home Foundation Guaranty Agreement) | | | 4.75 | | | | 8-1-2020 | | | | 1,000,000 | | | | 1,005,170 | |
California Student Education Loan Marketing Corporation Series IV-D-1 (Education Revenue) | | | 5.88 | | | | 1-1-2018 | | | | 500,000 | | | | 499,930 | |
Compton CA Community College RDA Project 2nd Lien Series A (Tax Revenue) | | | 5.00 | | | | 8-1-2020 | | | | 100,000 | | | | 107,878 | |
Compton CA Community College RDA Project 2nd Lien Series A (Tax Revenue) | | | 4.75 | | | | 8-1-2019 | | | | 225,000 | | | | 239,684 | |
San Gorgonio CA Memorial Healthcare District (GO) | | | 5.50 | | | | 8-1-2027 | | | | 750,000 | | | | 896,168 | |
| | | | |
| | | | | | | | | | | | | | | 6,588,147 | |
| | | | | | | | | | | | | | | | |
| | | | |
| Colorado: 2.51% | | | | | | | | | | | | | | | | |
Colorado E-470 Public Highway Authority CAB Series A (Miscellaneous Revenue, National Insured) ¤ | | | 0.00 | | | | 9-1-2027 | | | | 500,000 | | | | 326,215 | |
Colorado ECFA Refunding Bond Charter School Skyview Academy Project (Education Revenue) 144A | | | 5.13 | | | | 7-1-2034 | | | | 750,000 | | | | 789,765 | |
Colorado High Performance Transportation Enterprise U.S. 36 and I-25 Managed Lanes (Transportation Revenue) | | | 5.75 | | | | 1-1-2044 | | | | 500,000 | | | | 538,470 | |
The accompanying notes are an integral part of these financial statements.
| | | | |
| 8 | | Wells Fargo Advantage High Yield Municipal Bond Fund | | Portfolio of investments—December 31, 2014 (unaudited) |
| | | | | | | | | | | | | | | | |
| Security name | | Interest rate | | | Maturity date | | | Principal | | | Value | |
| | | | |
| Colorado (continued) | | | | | | | | | | | | | | | | |
Public Authority for Colorado Energy Natural Gas Purchase (Utilities Revenue, Merrill Lynch & Company Guaranty Agreement) | | | 6.50 | % | | | 11-15-2038 | | | $ | 500,000 | | | $ | 683,460 | |
| | | | |
| | | | | | | | | | | | | | | 2,337,910 | |
| | | | | | | | | | | | | | | | |
| | | | |
| District of Columbia: 0.47% | | | | | | | | | | | | | | | | |
District of Columbia Tobacco Settlement Financing Corporation (Tobacco Revenue) | | | 6.75 | | | | 5-15-2040 | | | | 435,000 | | | | 434,961 | |
| | | | | | | | | | | | | | | | |
| | | | |
| Florida: 3.04% | | | | | | | | | | | | | | | | |
Crossings At Fleming Island Florida Community Development District Refunding Senior Lien Series A-1 (Miscellaneous Revenue) | | | 4.00 | | | | 5-1-2024 | | | | 1,000,000 | | | | 1,006,940 | |
Florida Development Finance Corporation Educational Facilities Revenue Renaissance Charter School Project Series A (Education Revenue) | | | 8.50 | | | | 6-15-2044 | | | | 250,000 | | | | 284,388 | |
Holmes County FL Hospital Corporation Doctors Memorial Hospital Project (Health Revenue) | | | 6.00 | | | | 11-1-2038 | | | | 250,000 | | | | 251,568 | |
Seminole Tribe of Florida Special Obligation Series A (Miscellaneous Revenue) 144A | | | 5.50 | | | | 10-1-2024 | | | | 500,000 | | | | 542,800 | |
Village Community Development District 11 Florida Special Assessment (Miscellaneous Revenue) | | | 3.25 | | | | 5-1-2019 | | | | 750,000 | | | | 752,085 | |
| | | | |
| | | | | | | | | | | | | | | 2,837,781 | |
| | | | | | | | | | | | | | | | |
| | | | |
| Georgia: 1.97% | | | | | | | | | | | | | | | | |
Cobb County GA Development Authority Student Housing Refunding Junior Subordinated Kennesaw State University Real Estate Funding Series C (Housing Revenue) | | | 5.00 | | | | 7-15-2028 | | | | 800,000 | | | | 869,528 | |
Georgia Road & Tollway Authority Convertible CAB I-75 South Expressway Lanes Project Series B (Transportation Revenue) 144A± | | | 0.00 | | | | 6-1-2049 | | | | 1,000,000 | | | | 525,910 | |
Main Street Natural Gas Incorporated Georgia Gas Project Series A (Utilities Revenue) | | | 5.50 | | | | 9-15-2027 | | | | 360,000 | | | | 439,121 | |
| | | | |
| | | | | | | | | | | | | | | 1,834,559 | |
| | | | | | | | | | | | | | | | |
| | | | |
| Guam: 0.73% | | | | | | | | | | | | | | | | |
Guam Department of Education John F. Kennedy High School Project Series A Certificate of Participation (Education Revenue) | | | 5.50 | | | | 12-1-2015 | | | | 380,000 | | | | 386,338 | |
Guam International Airport Authority Series C (Airport Revenue) | | | 6.38 | | | | 10-1-2043 | | | | 260,000 | | | | 299,796 | |
| | | | |
| | | | | | | | | | | | | | | 686,134 | |
| | | | | | | | | | | | | | | | |
| | | | |
| Idaho: 0.50% | | | | | | | | | | | | | | | | |
Idaho Housing & Finance Association Idaho Arts Charter School Incorporated Project Series A (Education Revenue) | | | 6.50 | | | | 12-1-2038 | | | | 200,000 | | | | 211,634 | |
Idaho Housing & Finance Association Legacy Public Charter School Incorporated Project Series A (Education Revenue) | | | 6.25 | | | | 5-1-2043 | | | | 250,000 | | | | 254,518 | |
| | | | |
| | | | | | | | | | | | | | | 466,152 | |
| | | | | | | | | | | | | | | | |
| | | | |
| Illinois: 12.31% | | | | | | | | | | | | | | | | |
Chicago IL Board of Education CAB School Reform Series A (GO, National Insured) ¤ | | | 0.00 | | | | 12-1-2024 | | | | 1,000,000 | | | | 666,340 | |
Chicago IL Board of Education CAB School Reform Series B-1 (GO, National Insured) ¤ | | | 0.00 | | | | 12-1-2028 | | | | 1,000,000 | | | | 526,720 | |
Chicago IL Board of Education Series A (GO, National Insured) | | | 5.00 | | | | 12-1-2021 | | | | 250,000 | | | | 250,943 | |
Chicago IL O’Hare International Airport Revenue Series B (Airport Revenue) | | | 6.00 | | | | 1-1-2041 | | | | 150,000 | | | | 174,632 | |
Chicago IL Series A (GO) | | | 5.00 | | | | 1-1-2033 | | | | 310,000 | | | | 320,348 | |
Chicago IL Series A (GO) | | | 5.25 | | | | 1-1-2023 | | | | 500,000 | | | | 530,275 | |
Chicago IL Series C (GO) | | | 5.00 | | | | 1-1-2034 | | | | 700,000 | | | | 714,483 | |
The accompanying notes are an integral part of these financial statements.
| | | | | | |
| Portfolio of investments—December 31, 2014 (unaudited) | | Wells Fargo Advantage High Yield Municipal Bond Fund | | | 9 | |
| | | | | | | | | | | | | | | | |
| Security name | | Interest rate | | | Maturity date | | | Principal | | | Value | |
| | | | |
| Illinois (continued) | | | | | | | | | | | | | | | | |
Chicago IL Transit Authority Sales Tax Receipts Revenue Bonds (Tax Revenue, AGM Insured) | | | 5.00 | % | | | 12-1-2044 | | | $ | 1,000,000 | | | $ | 1,136,410 | |
Chicago IL Wastewater Transmission Refunding Bond Second Lien Series B (Water & Sewer Revenue, National Insured) | | | 5.00 | | | | 1-1-2030 | | | | 500,000 | | | | 529,465 | |
Chicago IL Water Revenue Second Lien Series A (Water & Sewer Revenue, Ambac Insured) | | | 5.00 | | | | 11-1-2032 | | | | 500,000 | | | | 528,075 | |
Cook County IL School District #144 Prairie Hills CAB Refunding Bond Series C (GO, AGM Insured) ¤ | | | 0.00 | | | | 12-1-2025 | | | | 1,080,000 | | | | 687,647 | |
Illinois (GO) | | | 5.50 | | | | 7-1-2025 | | | | 250,000 | | | | 286,885 | |
lIlinois (GO, Build America Mutual Assurance Company Insured) | | | 5.50 | | | | 7-1-2025 | | | | 525,000 | | | | 606,223 | |
Illinois Finance Authority Charter Schools Refunding Bond Series A (Education Revenue) | | | 6.88 | | | | 10-1-2031 | | | | 750,000 | | | | 856,755 | |
Illinois Finance Authority Educational Facility Senior Rogers Park Montessori School (Miscellaneous Revenue) | | | 6.00 | | | | 2-1-2034 | | | | 680,000 | | | | 706,969 | |
Illinois Series A (GO, AGM Insured) | | | 5.00 | | | | 4-1-2024 | | | | 500,000 | | | | 564,300 | |
Lake County IL Community Unit School District #187 North Chicago Series A (GO, AGM Insured) ¤ | | | 0.00 | | | | 1-1-2023 | | | | 590,000 | | | | 438,299 | |
McHenry County IL Community Unit School District #12 Johnsburg (GO, Build America Mutual Assurance Company Insured) %% | | | 5.00 | | | | 1-1-2033 | | | | 1,500,000 | | | | 1,652,535 | |
Sangamon County IL School District #186 Certificate of Participation Hay-Edwards Elementary School Project Series A (Miscellaneous Revenue, ACA Insured) | | | 5.88 | | | | 8-15-2018 | | | | 85,000 | | | | 81,521 | |
Sangamon County IL School District #186 Certificate of Participation Hay-Edwards Elementary School Project Series A (Miscellaneous Revenue, ACA Insured) | | | 6.13 | | | | 8-15-2023 | | | | 250,000 | | | | 227,135 | |
| | | | |
| | | | | | | | | | | | | | | 11,485,960 | |
| | | | | | | | | | | | | | | | |
| | | | |
| Indiana: 1.42% | | | | | | | | | | | | | | | | |
Indiana Finance Authority AMT-I-69 Development Partners LLC (Miscellaneous Revenue) | | | 5.25 | | | | 9-1-2040 | | | | 1,000,000 | | | | 1,100,610 | |
Valparaiso IN Pratt Paper LLC Project (Industrial Development Revenue) | | | 5.88 | | | | 1-1-2024 | | | | 200,000 | | | | 223,210 | |
| | | | |
| | | | | | | | | | | | | | | 1,323,820 | |
| | | | | | | | | | | | | | | | |
| | | | |
| Iowa: 1.07% | | | | | | | | | | | | | | | | |
Coralville IA Certificate of Participation Series D (Lease Revenue) | | | 5.25 | | | | 6-1-2026 | | | | 1,000,000 | | | | 997,570 | |
| | | | | | | | | | | | | | | | |
| | | | |
| Kansas: 0.54% | | | | | | | | | | | | | | | | |
Kansas Independent College Finance Authority RAN Ottawa University Series C (Education Revenue) | | | 4.60 | | | | 5-1-2015 | | | | 500,000 | | | | 501,310 | |
| | | | | | | | | | | | | | | | |
| | | | |
| Louisiana: 1.41% | | | | | | | | | | | | | | | | |
Louisiana Public Facilities Authority Dock & Impala Warehousing LLC Project (Miscellaneous Revenue) | | | 6.50 | | | | 7-1-2036 | | | | 250,000 | | | | 279,508 | |
Saint Tammany LA Public Trust Financing Authority Refunding Bond Christwood Project (Health Revenue) %% | | | 4.00 | | | | 11-15-2016 | | | | 500,000 | | | | 515,570 | |
Saint Tammany LA Public Trust Financing Authority Refunding Bond Christwood Project (Health Revenue) %% | | | 4.00 | | | | 11-15-2017 | | | | 500,000 | | | | 516,855 | |
| | | | |
| | | | | | | | | | | | | | | 1,311,933 | |
| | | | | | | | | | | | | | | | |
| | | | |
| Michigan: 10.44% | | | | | | | | | | | | | | | | |
Detroit MI Distribution of State Aid (GO) | | | 4.50 | | | | 11-1-2023 | | | | 275,000 | | | | 296,200 | |
Detroit MI Downtown Development Authority CAB (Tax Revenue) ¤ | | | 0.00 | | | | 7-1-2020 | | | | 285,000 | | | | 202,729 | |
Detroit MI Downtown Development Authority CAB (Tax Revenue) ¤ | | | 0.00 | | | | 7-1-2021 | | | | 170,000 | | | | 113,307 | |
Detroit MI Downtown Development Authority CAB (Tax Revenue) ¤ | | | 0.00 | | | | 7-1-2024 | | | | 20,000 | | | | 10,704 | |
The accompanying notes are an integral part of these financial statements.
| | | | |
| 10 | | Wells Fargo Advantage High Yield Municipal Bond Fund | | Portfolio of investments—December 31, 2014 (unaudited) |
| | | | | | | | | | | | | | | | |
| Security name | | Interest rate | | | Maturity date | | | Principal | | | Value | |
| | | | |
| Michigan (continued) | | | | | | | | | | | | | | | | |
Detroit MI Downtown Development Authority CAB (Tax Revenue) ¤ | | | 0.00 | % | | | 7-1-2025 | | | $ | 470,000 | | | $ | 234,323 | |
Michigan Finance Authority Limited Obligation Public School Academy Cesar Chavez Academy Project (Education Revenue) | | | 5.00 | | | | 2-1-2022 | | | | 250,000 | | | | 252,208 | |
Michigan Finance Authority Refunding Bond Local Government Loan Program Detroit Water & Sewer Series D4 (Water & Sewer Revenue) | | | 5.00 | | | | 7-1-2031 | | | | 1,015,000 | | | | 1,122,458 | |
Michigan Finance Authority Refunding Bond Local Government Loan Program Detroit Water & Sewer Series D6 (Water & Sewer Revenue, National Insured) | | | 5.00 | | | | 7-1-2036 | | | | 1,000,000 | | | | 1,097,450 | |
Michigan Finance Authority Refunding Notes Local Government Loan Program Public Lighting Authority Series B (Tax Revenue) | | | 5.00 | | | | 7-1-2044 | | | | 1,000,000 | | | | 1,073,490 | |
Michigan Finance Authority Refunding Notes Local Government Loan Program Series C (Miscellaneous Revenue) | | | 5.00 | | | | 11-1-2020 | | | | 1,000,000 | | | | 1,105,180 | |
Michigan Municipal Bond Authority CAB Local Government Loan Program Series G (Miscellaneous Revenue, Ambac Insured) ¤ | | | 0.00 | | | | 5-1-2017 | | | | 300,000 | | | | 283,977 | |
Michigan Municipal Bond Authority Local Government Loan Program Series C (Miscellaneous Revenue, Ambac Insured) | | | 4.75 | | | | 5-1-2027 | | | | 950,000 | | | | 961,448 | |
Michigan Public Educational Facilities Authority Chandler Park Academy (Miscellaneous Revenue) | | | 6.35 | | | | 11-1-2028 | | | | 225,000 | | | | 228,724 | |
Michigan Public Educational Facilities Authority Limited Obligation Bradford Academy Project (Education Revenue) 144A | | | 6.50 | | | | 9-1-2037 | | | | 200,000 | | | | 130,002 | |
Michigan Public Educational Facilities Authority Limited Obligation Crescent Academy (Education Revenue) | | | 7.00 | | | | 10-1-2036 | | | | 322,500 | | | | 328,282 | |
Michigan Strategic Fund Limited Obligation Events Center Project Series A (Tax Revenue) ± | | | 4.13 | | | | 7-1-2045 | | | | 1,000,000 | | | | 1,008,920 | |
Oakland County MI Economic Development Corporation The Academy of The Sacred Heart Project Series A (Education Revenue) | | | 6.50 | | | | 12-15-2036 | | | | 250,000 | | | | 255,745 | |
Wayne Charter County MI Building Improvement Series A (GO) | | | 6.75 | | | | 11-1-2039 | | | | 980,000 | | | | 1,030,372 | |
| | | | |
| | | | | | | | | | | | | | | 9,735,519 | |
| | | | | | | | | | | | | | | | |
| | | | |
| Minnesota: 0.81% | | | | | | | | | | | | | | | | |
Minneapolis MN Student Housing Refunding Bond Riverton Community Housing Project (Housing Revenue) | | | 4.70 | | | | 8-1-2026 | | | | 335,000 | | | | 344,414 | |
Minneapolis MN Student Housing Refunding Bond Riverton Community Housing Project (Housing Revenue) | | | 4.80 | | | | 8-1-2027 | | | | 400,000 | | | | 412,072 | |
| | | | |
| | | | | | | | | | | | | | | 756,486 | |
| | | | | | | | | | | | | | | | |
| | | | |
| Nevada: 0.16% | | | | | | | | | | | | | | | | |
Henderson NV RDA Series A (Tax Revenue, Ambac Insured) | | | 5.13 | | | | 10-1-2022 | | | | 150,000 | | | | 150,114 | |
| | | | | | | | | | | | | | | | |
| | | | |
| New Hampshire: 3.01% | | | | | | | | | | | | | | | | |
New Hampshire Business Finance Authority Casella Waste System Incorporated Project (Resource Recovery Revenue) 144A± | | | 4.00 | | | | 4-1-2029 | | | | 1,000,000 | | | | 1,005,980 | |
New Hampshire Business Finance Authority Refunding Bond Pennichuck Water Works Incorporated Project Series A (Water & Sewer Revenue) | | | 5.00 | | | | 1-1-2030 | | | | 1,615,000 | | | | 1,799,158 | |
| | | | |
| | | | | | | | | | | | | | | 2,805,138 | |
| | | | | | | | | | | | | | | | |
| | | | |
| New Jersey: 4.34% | | | | | | | | | | | | | | | | |
Camden County NJ Healthcare Redevelopment Revenue Cooper Health System Series A (Health Revenue) | | | 5.00 | | | | 2-15-2025 | | | | 250,000 | | | | 251,395 | |
Essex County NJ Improvement Authority Lease Newark Project Series A (Miscellaneous Revenue) | | | 6.25 | | | | 11-1-2030 | | | | 200,000 | | | | 227,538 | |
The accompanying notes are an integral part of these financial statements.
| | | | | | |
| Portfolio of investments—December 31, 2014 (unaudited) | | Wells Fargo Advantage High Yield Municipal Bond Fund | | | 11 | |
| | | | | | | | | | | | | | | | |
| Security name | | Interest rate | | | Maturity date | | | Principal | | | Value | |
| | | | |
| New Jersey (continued) | | | | | | | | | | | | | | | | |
Gloucester County NJ PCFA AMT Keystone Urban Renewal LP Logan Project Series A (Resource Recovery Revenue) | | | 5.00 | % | | | 12-1-2024 | | | $ | 500,000 | | | $ | 561,880 | |
New Jersey EDA Continental Airlines Incorporated Project (Industrial Development Revenue) | | | 5.25 | | | | 9-15-2029 | | | | 250,000 | | | | 266,105 | |
New Jersey EDA Special Facility Revenue Continental Airlines Incorporated Project (Industrial Development Revenue) | | | 4.88 | | | | 9-15-2019 | | | | 500,000 | | | | 526,305 | |
New Jersey TTFA Transportation System Series D (Transportation Revenue) | | | 5.00 | | | | 6-15-2032 | | | | 2,000,000 | | | | 2,218,360 | |
| | | | |
| | | | | | | | | | | | | | | 4,051,583 | |
| | | | | | | | | | | | | | | | |
| | | | |
| New York: 7.67% | | | | | | | | | | | | | | | | |
Build New York City Resource Corporation Refunding Bond Pratt Paper Incorporated Project (Industrial Development Revenue) 144A | | | 4.50 | | | | 1-1-2025 | | | | 1,000,000 | | | | 1,019,130 | |
Green Island NY Power Authority Power System (Utilities Revenue) | | | 6.00 | | | | 12-15-2020 | | | | 1,035,000 | | | | 1,051,798 | |
Hempstead Town NY Local Development Corporation The Academy Charter School Project Series A (Education Revenue) | | | 7.65 | | | | 2-1-2044 | | | | 1,000,000 | | | | 1,137,080 | |
Metropolitan Transportation New York Authority Series D (Transportation Revenue) | | | 5.25 | | | | 11-15-2044 | | | | 2,000,000 | | | | 2,328,080 | |
New York City NY Housing Development Corporation Mortgage Refunding Bond 8 Spruce Street Class F (Housing Revenue) | | | 4.50 | | | | 2-15-2048 | | | | 1,000,000 | | | | 1,016,770 | |
New York NY IDA (Industrial Development Revenue) ± | | | 7.63 | | | | 8-1-2025 | | | | 300,000 | | | | 329,169 | |
Westchester County NY Local Development Corporation Pace University Series A (Education Revenue) | | | 5.00 | | | | 5-1-2034 | | | | 250,000 | | | | 275,025 | |
| | | | |
| | | | | | | | | | | | | | | 7,157,052 | |
| | | | | | | | | | | | | | | | |
| | | | |
| Ohio: 2.86% | | | | | | | | | | | | | | | | |
Maple Heights OH City School District Certificate of Participation (Miscellaneous Revenue) | | | 6.00 | | | | 11-1-2028 | | | | 500,000 | | | | 546,890 | |
Ohio Air Quality Development Authority AMT Refunding Bond Pollution Control 1st Energy Series C (Industrial Development Revenue) ± | | | 3.95 | | | | 11-1-2032 | | | | 1,000,000 | | | | 1,032,500 | |
RiverSouth Authority Ohio Lazarus Building Redevelopment Series A (Lease Revenue) | | | 5.75 | | | | 12-1-2027 | | | | 1,000,000 | | | | 1,085,000 | |
| | | | |
| | | | | | | | | | | | | | | 2,664,390 | |
| | | | | | | | | | | | | | | | |
| | | | |
| Oklahoma: 0.68% | | | | | | | | | | | | | | | | |
Cherokee Nation Health Care System Series 2006 (Health Revenue, ACA Insured) 144A | | | 4.60 | | | | 12-1-2021 | | | | 615,000 | | | | 633,788 | |
| | | | | | | | | | | | | | | | |
| | | | |
| Oregon: 0.64% | | | | | | | | | | | | | | | | |
Multnomah County OR Hospital Facilities Authority Refunding Bond Mirabella South Waterfront Project Series A (Health Revenue) | | | 5.00 | | | | 10-1-2019 | | | | 555,000 | | | | 596,647 | |
| | | | | | | | | | | | | | | | |
| | | | |
| Pennsylvania: 3.68% | | | | | | | | | | | | | | | | |
Allegheny County PA IDA Propel Charter School Sunrise Project (Education Revenue) | | | 5.25 | | | | 7-15-2023 | | | | 190,000 | | | | 194,991 | |
Allegheny County PA RDA Pittsburgh Mills Project (Tax Revenue) | | | 5.60 | | | | 7-1-2023 | | | | 500,000 | | | | 509,090 | |
Chester County PA Health and Education Facilities Immaculata University Project (Education Revenue) | | | 5.50 | | | | 10-15-2025 | | | | 1,000,000 | | | | 1,029,350 | |
Dauphin County PA General Authority Office & Parking Riverfront Office Project (Miscellaneous Revenue) | | | 6.00 | | | | 1-1-2025 | | | | 180,000 | | | | 180,103 | |
East Hempfield Township PA IDA Student Services Incorporated Student Housing Project of Millersville University (Education Revenue) | | | 5.00 | | | | 7-1-2029 | | | | 500,000 | | | | 549,985 | |
Philadelphia PA IDA Tacony Academy Charter School Project (Education Revenue) | | | 6.88 | | | | 6-15-2033 | | | | 375,000 | | | | 416,100 | |
Philadelphia PA State Public School Building Authority School District Project (Education Revenue) | | | 5.00 | | | | 4-1-2028 | | | | 500,000 | | | | 555,750 | |
| | | | |
| | | | | | | | | | | | | | | 3,435,369 | |
| | | | | | | | | | | | | | | | |
The accompanying notes are an integral part of these financial statements.
| | | | |
| 12 | | Wells Fargo Advantage High Yield Municipal Bond Fund | | Portfolio of investments—December 31, 2014 (unaudited) |
| | | | | | | | | | | | | | | | |
| Security name | | Interest rate | | | Maturity date | | | Principal | | | Value | |
| | | | |
| Puerto Rico: 6.01% | | | | | | | | | | | | | | | | |
Commonwealth of Puerto Rico (Miscellaneous Revenue, AGM Insured) | | | 5.50 | % | | | 7-1-2015 | | | $ | 50,000 | | | $ | 50,809 | |
Commonwealth of Puerto Rico (Tax Revenue, National Insured) | | | 6.00 | | | | 7-1-2016 | | | | 150,000 | | | | 154,547 | |
Commonwealth of Puerto Rico CAB (Miscellaneous Revenue, National Insured) ¤ | | | 0.00 | | | | 7-1-2015 | | | | 215,000 | | | | 207,830 | |
Commonwealth of Puerto Rico Government Development Bank Refunding Bond (Miscellaneous Revenue, National Insured) ± | | | 4.75 | | | | 12-1-2015 | | | | 100,000 | | | | 100,342 | |
Commonwealth of Puerto Rico Public Improvement Refunding Bond Series A (Miscellaneous Revenue, National Insured) | | | 5.50 | | | | 7-1-2016 | | | | 125,000 | | | | 128,070 | |
Commonwealth of Puerto Rico Public Improvement Refunding Bond Series A (Miscellaneous Revenue, National Insured) | | | 5.50 | | | | 7-1-2016 | | | | 600,000 | | | | 614,736 | |
Puerto Rico Electric Power Authority Refunding Bond Series JJ (Utilities Revenue, National Insured) | | | 5.25 | | | | 7-1-2015 | | | | 275,000 | | | | 278,460 | |
Puerto Rico Electric Power Authority Refunding Bond Series KK (Utilities Revenue, AGM Insured) | | | 5.50 | | | | 7-1-2015 | | | | 50,000 | | | | 50,759 | |
Puerto Rico Electric Power Authority Refunding Bond Series KK (Utilities Revenue, National Insured) | | | 5.50 | | | | 7-1-2015 | | | | 580,000 | | | | 588,010 | |
Puerto Rico Electric Power Authority Refunding Bond Series KK (Utilities Revenue, National Insured) | | | 5.50 | | | | 7-1-2016 | | | | 350,000 | | | | 361,179 | |
Puerto Rico Electric Power Authority Refunding Bond Series MM (Utilities Revenue, National Insured) | | | 5.00 | | | | 7-1-2016 | | | | 50,000 | | | | 51,234 | |
Puerto Rico Electric Power Authority Refunding Bond Series UU (Utilities Revenue, AGM Insured) | | | 5.00 | | | | 7-1-2016 | | | | 730,000 | | | | 746,403 | |
Puerto Rico Highway & Transportation Authority Refunding Bond Series Z (Miscellaneous Revenue, National Insured) | | | 6.25 | | | | 7-1-2015 | | | | 200,000 | | | | 200,438 | |
Puerto Rico Highway & Transportation Authority Revenue (Tax Revenue, AGM Insured) | | | 5.50 | | | | 7-1-2015 | | | | 50,000 | | | | 50,752 | |
Puerto Rico Highway and Transportation Authority Series Y (Miscellaneous Revenue, AGM Insured) ± | | | 6.25 | | | | 7-1-2021 | | | | 1,000,000 | | | | 1,088,870 | |
Puerto Rico Industrial Tourist Educational Medical & Environmental Control Refunding Bond Inter American University Project (Education Revenue) | | | 5.00 | | | | 10-1-2016 | | | | 500,000 | | | | 516,035 | |
Puerto Rico Public Buildings Authority Government Facilities Series S (Lease Revenue, Commonwealth insured) | | | 5.88 | | | | 7-1-2039 | | | | 600,000 | | | | 414,096 | |
| | | | |
| | | | | | | | | | | | | | | 5,602,570 | |
| | | | | | | | | | | | | | | | |
| | | | |
| Rhode Island: 0.14% | | | | | | | | | | | | | | | | |
Rhode Island Tobacco Settlement Financing Corporation Series A (Tobacco Revenue) | | | 6.00 | | | | 6-1-2023 | | | | 135,000 | | | | 135,743 | |
| | | | | | | | | | | | | | | | |
| | | | |
| South Carolina: 1.97% | | | | | | | | | | | | | | | | |
Connector 2000 Association Incorporated SC CAB Series A (Transportation Revenue) ¤ | | | 0.00 | | | | 1-1-2017 | | | | 152,230 | | | | 115,649 | |
Jasper County SC School Project (Miscellaneous Revenue) | | | 4.00 | | | | 4-1-2020 | | | | 400,000 | | | | 417,752 | |
Jasper County SC School Project (Miscellaneous Revenue) | | | 4.00 | | | | 4-1-2021 | | | | 300,000 | | | | 313,971 | |
Lee County SC School Facilities Incorporated Series 2006 (Miscellaneous Revenue, Radian Insured) | | | 6.00 | | | | 12-1-2031 | | | | 215,000 | | | | 227,752 | |
South Carolina Jobs EDA York Preparatory Academy Project Series A (Education Revenue) | | | 5.75 | | | | 11-1-2023 | | | | 200,000 | | | | 208,992 | |
South Carolina Jobs EDA York Preparatory Academy Project Series A (Education Revenue) | | | 7.25 | | | | 11-1-2045 | | | | 500,000 | | | | 550,940 | |
| | | | |
| | | | | | | | | | | | | | | 1,835,056 | |
| | | | | | | | | | | | | | | | |
| | | | |
| Tennessee: 0.15% | | | | | | | | | | | | | | | | |
Tennessee Energy Acquisition Corporation Series A (Utilities Revenue) | | | 5.00 | | | | 2-1-2022 | | | | 120,000 | | | | 136,613 | |
| | | | | | | | | | | | | | | | |
| | | | |
| Texas: 5.19% | | | | | | | | | | | | | | | | |
Arlington TX Higher Education Finance Corporation Universal Academy Series A (Education Revenue) | | | 7.00 | | | | 3-1-2034 | | | | 320,000 | | | | 340,653 | |
The accompanying notes are an integral part of these financial statements.
| | | | | | |
| Portfolio of investments—December 31, 2014 (unaudited) | | Wells Fargo Advantage High Yield Municipal Bond Fund | | | 13 | |
| | | | | | | | | | | | | | | | |
| Security name | | Interest rate | | | Maturity date | | | Principal | | | Value | |
| | | | |
| Texas (continued) | | | | | | | | | | | | | | | | |
Dallas-Fort Worth TX International Airport Facilities Series 2001-A1 (Industrial Development Revenue) | | | 6.15 | % | | | 1-1-2016 | | | $ | 1,000,000 | | | $ | 1,013,650 | |
Hackberry TX Special Assessment Revenue Public Improvement District #3 Phase #13 (Water & Sewer Revenue) | | | 6.00 | | | | 9-1-2026 | | | | 225,000 | | | | 229,685 | |
Houston TX Airport System Refunding Bond United Airlines Incorporated Terminal E Project (Airport Revenue) | | | 4.50 | | | | 7-1-2020 | | | | 500,000 | | | | 531,505 | |
New Hope Cultural Education Facilities Finance Corporation Texas Retirement Facilities Wesleyan Homes Incorporated Project (Health Revenue) | | | 4.00 | | | | 1-1-2016 | | | | 220,000 | | | | 223,808 | |
New Hope Cultural Education Facilities Finance Corporation Texas Retirement Facilities Wesleyan Homes Incorporated Project (Health Revenue) | | | 4.00 | | | | 1-1-2017 | | | | 515,000 | | | | 527,242 | |
New Hope Cultural Education Facilities Finance Corporation Texas Retirement Facilities Wesleyan Homes Incorporated Project (Health Revenue) | | | 4.00 | | | | 1-1-2018 | | | | 535,000 | | | | 546,845 | |
Texas Gas Supply SA Energy Acquisition Public Facilities Corporation (Utilities Revenue) | | | 5.50 | | | | 8-1-2027 | | | | 190,000 | | | | 231,876 | |
Texas Municipal Gas Acquisition & Supply Corporation I Senior Lien Series A (Utilities Revenue) | | | 5.25 | | | | 12-15-2018 | | | | 120,000 | | | | 134,867 | |
Texas Municipal Gas Acquisition & Supply Corporation III (Utilities Revenue) | | | 5.00 | | | | 12-15-2028 | | | | 735,000 | | | | 815,277 | |
Texas Private Activity Surface Transportation Corporation Project NTE Mobility Partners Segments LLC (Transportation Revenue) | | | 7.00 | | | | 12-31-2038 | | | | 200,000 | | | | 248,626 | |
| | | | |
| | | | | | | | | | | | | | | 4,844,034 | |
| | | | | | | | | | | | | | | | |
| | | | |
| Vermont: 1.21% | | | | | | | | | | | | | | | | |
Burlington VT Airport Refunding Bond Series A (Airport Revenue, AGM Insured) | | | 5.00 | | | | 7-1-2030 | | | | 1,000,000 | | | | 1,124,650 | |
| | | | | | | | | | | | | | | | |
| | | | |
| Washington: 2.65% | | | | | | | | | | | | | | | | |
Skagit County WA Public Hospital District #1 Skagit Valley Hospital Project (Health Revenue) | | | 5.25 | | | | 12-1-2025 | | | | 250,000 | | | | 274,253 | |
Washington HCFR Catholic Health Series B (Health Revenue, JPMorgan Chase & Company SPA) ø | | | 0.12 | | | | 3-1-2032 | | | | 2,200,000 | | | | 2,200,000 | |
| | | | |
| | | | | | | | | | | | | | | 2,474,253 | |
| | | | | | | | | | | | | | | | |
| | | | |
| West Virginia: 0.31% | | | | | | | | | | | | | | | | |
West Virginia Hospital Finance Authority (Health Revenue) | | | 6.25 | | | | 10-1-2023 | | | | 270,000 | | | | 286,546 | |
| | | | | | | | | | | | | | | | |
| | | | |
| Wisconsin: 2.84% | | | | | | | | | | | | | | | | |
Wisconsin Center District Refunding Bond Junior Dedicated Series A (Tax Revenue) | | | 5.00 | | | | 12-15-2028 | | | | 1,000,000 | | | | 1,132,267 | |
Wisconsin HEFA (Health Revenue) | | | 6.88 | | | | 12-1-2023 | | | | 145,000 | | | | 145,235 | |
Wisconsin PFA Charter School Voyager Funding Incorporated Project Series A (Education Revenue) | | | 4.13 | | | | 10-1-2024 | | | | 325,000 | | | | 328,640 | |
Wisconsin PFA Coral Academy of Science Las Vegas Series A (Education Revenue) | | | 5.00 | | | | 7-1-2024 | | | | 500,000 | | | | 532,280 | |
Wisconsin PFA Senior Living 50 Rose Villa Project Series B-3 (Health Revenue) | | | 3.75 | | | | 11-15-2019 | | | | 500,000 | | | | 506,725 | |
| | | | |
| | | | | | | | | | | | | | | 2,645,147 | |
| | | | | | | | | | | | | | | | |
| | | | |
| Wyoming: 0.57% | | | | | | | | | | | | | | | | |
Sweetwater County WY Solid Waste Disposal Refunding Bond FMC Corporation Project (Industrial Development Revenue) | | | 5.60 | | | | 12-1-2035 | | | | 525,000 | | | | 536,267 | |
| | | | | | | | | | | | | | | | |
| | | | |
Total Municipal Obligations (Cost $86,690,050) | | | | | | | | | | | | | | | 89,115,427 | |
| | | | | | | | | | | | | | | | |
The accompanying notes are an integral part of these financial statements.
| | | | |
| 14 | | Wells Fargo Advantage High Yield Municipal Bond Fund | | Portfolio of investments—December 31, 2014 (unaudited) |
| | | | | | | | | | | | | | | | |
| Security name | | Yield | | | | | | Shares | | | Value | |
| | | | |
Short-Term Investments: 3.99% | | | | | | | | | | | | | | | | |
| | | | |
| Investment Companies: 3.91% | | | | | | | | | | | | | | | | |
Wells Fargo Advantage National Tax-Free Money Market Fund, Institutional Class ##(l)(u) | | | 0.01 | % | | | | | | | 3,652,189 | | | $ | 3,652,189 | |
| | | | | | | | | | | | | | | | |
| | | | |
| | | | | | Maturity date | | | Principal | | | | |
| | | | |
| U.S. Treasury Securities: 0.08% | | | | | | | | | | | | | | | | |
U.S. Treasury Bill #(z) | | | 0.02 | | | | 3-19-2015 | | | $ | 75,000 | | | | 74,997 | |
| | | | | | | | | | | | | | | | |
| | | | |
Total Short-Term Investments (Cost $3,727,185) | | | | | | | | | | | | | | | 3,727,186 | |
| | | | | | | | | | | | | | | | |
| | | | | | | | |
| Total investments in securities (Cost $90,417,235) * | | | 99.53 | % | | | 92,842,613 | |
Other assets and liabilities, net | | | 0.47 | | | | 434,678 | |
| | | | | | | | |
| Total net assets | | | 100.00 | % | | $ | 93,277,291 | |
| | | | | | | | |
| ¤ | The security is issued in zero coupon form with no periodic interest payments. |
| 144A | The security may be resold in transactions exempt from registration, normally to qualified institutional buyers, pursuant to Rule 144A under the Securities Act of 1933. |
| ± | Variable rate investment. The rate shown is the rate in effect at period end. |
| %% | The security is issued on a when-issued basis. |
| ø | Variable rate demand notes are subject to a demand feature which reduces the effective maturity. The maturity date shown represents the final maturity date of the security. The interest rate is determined and reset by the issuer daily, weekly, or monthly depending upon the terms of the security. The rate shown is the rate in effect at period end. |
| ## | All or a portion of this security is segregated for when-issued securities. |
| (l) | The security represents an affiliate of the Fund as defined in the Investment Company Act of 1940. |
| (u) | The rate represents the 7-day annualized yield at period end. |
| # | All or a portion of this security is segregated as collateral for investments in derivative instruments. |
| (z) | Zero coupon security. The rate represents the current yield to maturity. |
| * | Cost for federal income tax purposes is $90,417,235 and unrealized gains (losses) consists of: |
| | | | |
Gross unrealized gains | | $ | 2,445,491 | |
Gross unrealized losses | | | (20,113 | ) |
| | | | |
Net unrealized gains | | $ | 2,425,378 | |
The accompanying notes are an integral part of these financial statements.
| | | | | | |
| Statement of assets and liabilities—December 31, 2014 (unaudited) | | Wells Fargo Advantage High Yield Municipal Bond Fund | | | 15 | |
| | | | |
| | | | |
| |
Assets | | | | |
Investments | | | | |
In unaffiliated securities, at value (cost $86,765,046) | | $ | 89,190,424 | |
In affiliated securities, at value (cost $3,652,189) | | | 3,652,189 | |
| | | | |
Total investments, at value (cost $90,417,235) | | | 92,842,613 | |
Receivable for investments sold | | | 10,000 | |
Receivable for Fund shares sold | | | 2,220,947 | |
Receivable for interest | | | 1,047,940 | |
Prepaid expenses and other assets | | | 20,240 | |
| | | | |
Total assets | | | 96,141,740 | |
| | | | |
| |
Liabilities | | | | |
Dividends payable | | | 53,048 | |
Payable for investments purchased | | | 2,683,350 | |
Payable for Fund shares redeemed | | | 29,139 | |
Payable for daily variation margin on open futures contracts | | | 8,719 | |
Due to custodian bank | | | 8,719 | |
Advisory fee payable | | | 21,627 | |
Distribution fee payable | | | 2,812 | |
Administration fees payable | | | 11,786 | |
Accrued expenses and other liabilities | | | 45,249 | |
| | | | |
Total liabilities | | | 2,864,449 | |
| | | | |
Total net assets | | $ | 93,277,291 | |
| | | | |
| |
NET ASSETS CONSIST OF | | | | |
Paid-in capital | | $ | 90,746,744 | |
Overdistributed net investment income | | | (1,139 | ) |
Accumulated net realized gains on investments | | | 145,836 | |
Net unrealized gains on investments | | | 2,385,850 | |
| | | | |
Total net assets | | $ | 93,277,291 | |
| | | | |
| |
COMPUTATION OF NET ASSET VALUE AND OFFERING PRICE PER SHARE | | | | |
Net assets – Class A | | $ | 17,115,611 | |
Shares outstanding – Class A1 | | | 1,632,185 | |
Net asset value per share – Class A | | | $10.49 | |
Maximum offering price per share – Class A2 | | | $10.98 | |
Net assets – Class C | | $ | 4,577,429 | |
Shares outstanding – Class C1 | | | 436,475 | |
Net asset value per share – Class C | | | $10.49 | |
Net assets – Administrator Class | | $ | 15,831,129 | |
Shares outstanding – Administrator Class1 | | | 1,509,159 | |
Net asset value per share – Administrator Class | | | $10.49 | |
Net assets – Institutional Class | | $ | 55,753,122 | |
Shares outstanding – Institutional Class1 | | | 5,315,994 | |
Net asset value per share – Institutional Class | | | $10.49 | |
| 1. | The Fund has an unlimited number of authorized shares. |
| 2. | Maximum offering price is computed as 100/95.50 of net asset value. On investments of $50,000 or more, the offering price is reduced. |
The accompanying notes are an integral part of these financial statements.
| | | | |
| 16 | | Wells Fargo Advantage High Yield Municipal Bond Fund | | Statement of operations—six months ended December 31, 2014 (unaudited) |
| | | | |
| | | | |
| |
Investment income | | | | |
Interest | | $ | 1,411,632 | |
Income from affiliated securities | | | 1,806 | |
| | | | |
Total investment income | | | 1,413,438 | |
| | | | |
| |
Expenses | | | | |
Advisory fee | | | 158,690 | |
Administration fees | | | | |
Fund level | | | 17,632 | |
Class A | | | 10,849 | |
Class C | | | 2,780 | |
Administrator Class | | | 5,956 | |
Institutional Class | | | 16,633 | |
Shareholder servicing fees | | | | |
Class A | | | 16,951 | |
Class C | | | 4,343 | |
Administrator Class | | | 14,005 | |
Distribution fee | | | | |
Class C | | | 13,030 | |
Custody and accounting fees | | | 4,948 | |
Professional fees | | | 22,783 | |
Registration fees | | | 23,686 | |
Shareholder report expenses | | | 7,252 | |
Trustees’ fees and expenses | | | 6,279 | |
Other fees and expenses | | | 3,498 | |
| | | | |
Total expenses | | | 329,315 | |
Less: Fee waivers and/or expense reimbursements | | | (74,469 | ) |
| | | | |
Net expenses | | | 254,846 | |
| | | | |
Net investment income | | | 1,158,592 | |
| | | | |
| |
REALIZED AND UNREALIZED GAINS (LOSSES) ON INVESTMENTS | | | | |
Net realized gains on investments | | | 617,817 | |
| |
Net change in unrealized gains (losses) on: | | | | |
Unaffiliated securities | | | 1,453,457 | |
Futures transactions | | | (39,528 | ) |
| | | | |
Net change in unrealized gains (losses) on investments | | | 1,413,929 | |
| | | | |
Net realized and unrealized gains (losses) on investments | | | 2,031,746 | |
| | | | |
Net increase in net assets resulting from operations | | $ | 3,190,338 | |
| | | | |
The accompanying notes are an integral part of these financial statements.
| | | | | | |
| Statement of changes in net assets | | Wells Fargo Advantage High Yield Municipal Bond Fund | | | 17 | |
| | | | | | | | | | | | | | | | |
| | | Six months ended
December 31, 2014
(unaudited) | | | Year ended June 30, 2014 | |
| | | | |
Operations | | | | | | | | | | | | | | | | |
Net investment income | | | | | | $ | 1,158,592 | | | | | | | $ | 767,497 | |
Net realized gains on investments | | | | | | | 617,817 | | | | | | | | 245,987 | |
Net change in unrealized gains (losses) on investments | | | | | | | 1,413,929 | | | | | | | | 1,515,434 | |
| | | | |
Net increase in net assets resulting from operations | | | | | | | 3,190,338 | | | | | | | | 2,528,918 | |
| | | | |
| | | | |
Distributions to shareholders from | | | | | | | | | | | | | | | | |
Net investment income | | | | | | | | | | | | | | | | |
Class A | | | | | | | (214,030 | ) | | | | | | | (57,222 | ) |
Class C | | | | | | | (41,828 | ) | | | | | | | (23,934 | ) |
Administrator Class | | | | | | | (194,132 | ) | | | | | | | (63,330 | ) |
Institutional Class | | | | | | | (710,353 | ) | | | | | | | (623,013 | ) |
Net realized gains | | | | | | | | | | | | | | | | |
Class A | | | | | | | (132,615 | ) | | | | | | | (2,293 | ) |
Class C | | | | | | | (34,119 | ) | | | | | | | (1,054 | ) |
Administrator Class | | | | | | | (126,197 | ) | | | | | | | (3,220 | ) |
Institutional Class | | | | | | | (425,024 | ) | | | | | | | (23,729 | ) |
| | | | |
Total distributions to shareholders | | | | | | | (1,878,298 | ) | | | | | | | (797,795 | ) |
| | | | |
| | | | |
Capital share transactions | | | Shares | | | | | | | | Shares | | | | | |
Proceeds from shares sold | | | | | | | | | | | | | | | | |
Class A | | | 1,409,544 | | | | 14,549,870 | | | | 304,894 | | | | 3,080,206 | |
Class C | | | 208,947 | | | | 2,174,988 | | | | 174,391 | | | | 1,758,951 | |
Administrator Class | | | 1,265,267 | | | | 13,122,351 | | | | 262,863 | | | | 2,583,587 | |
Institutional Class | | | 2,209,105 | | | | 23,150,095 | | | | 2,116,210 | | | | 20,969,164 | |
| | | | |
| | | | | | | 52,997,304 | | | | | | | | 28,391,908 | |
| | | | |
Reinvestment of distributions | | | | | | | | | | | | | | | | |
Class A | | | 31,533 | | | | 329,899 | | | | 3,852 | | | | 37,921 | |
Class C | | | 6,157 | | | | 64,410 | | | | 2,345 | | | | 22,953 | |
Administrator Class | | | 24,194 | | | | 253,290 | | | | 6,786 | | | | 66,550 | |
Institutional Class | | | 81,032 | | | | 847,737 | | | | 55,535 | | | | 543,602 | |
| | | | |
| | | | | | | 1,495,336 | | | | | | | | 671,026 | |
| | | | |
Payment for shares redeemed | | | | | | | | | | | | | | | | |
Class A | | | (201,069 | ) | | | (2,079,834 | ) | | | (21,424 | ) | | | (218,363 | ) |
Class C | | | (5,201 | ) | | | (54,139 | ) | | | (682 | ) | | | (6,932 | ) |
Administrator Class | | | (100,264 | ) | | | (1,048,592 | ) | | | (331 | ) | | | (3,394 | ) |
Institutional Class | | | (7,342 | ) | | | (76,346 | ) | | | (6 | ) | | | (56 | ) |
| | | | |
| | | | | | | (3,258,911 | ) | | | | | | | (228,745 | ) |
| | | | |
Net increase in net assets resulting from capital share transactions | | | | | | | 51,233,729 | | | | | | | | 28,834,189 | |
| | | | |
Total increase in net assets | | | | | | | 52,545,769 | | | | | | | | 30,565,312 | |
| | | | |
| | | | |
Net assets | | | | | | | | | | | | | | | | |
Beginning of period | | | | | | | 40,731,522 | | | | | | | | 10,166,210 | |
| | | | |
End of period | | | | | | $ | 93,277,291 | | | | | | | $ | 40,731,522 | |
| | | | |
Undistributed (overdistributed) net investment income | | | | | | $ | (1,139 | ) | | | | | | $ | 612 | |
| | | | |
The accompanying notes are an integral part of these financial statements.
| | | | |
| 18 | | Wells Fargo Advantage High Yield Municipal Bond Fund | | Financial highlights |
(For a share outstanding throughout each period)
| | | | | | | | | | | | |
| | | Six months ended
December 31, 2014 (unaudited) | | | Year ended June 30 | |
| CLASS A | | | 2014 | | | 20131 | |
Net asset value, beginning of period | | | $10.25 | | | | $9.52 | | | | $10.00 | |
Net investment income | | | 0.17 | | | | 0.40 | | | | 0.13 | |
Net realized and unrealized gains (losses) on investments | | | 0.33 | | | | 0.75 | | | | (0.49 | ) |
| | | | | | | | | | | | |
Total from investment operations | | | 0.50 | | | | 1.15 | | | | (0.36 | ) |
Distributions to shareholders from | | | | | | | | | | | | |
Net investment income | | | (0.17 | ) | | | (0.40 | ) | | | (0.12 | ) |
Net realized gains | | | (0.09 | ) | | | (0.02 | ) | | | 0.00 | |
| | | | | | | | | | | | |
Total distributions to shareholders | | | (0.26 | ) | | | (0.42 | ) | | | (0.12 | ) |
Net asset value, end of period | | | $10.49 | | | | $10.25 | | | | $9.52 | |
Total return2 | | | 4.85 | % | | | 12.41 | % | | | (3.61 | )% |
Ratios to average net assets (annualized) | | | | | | | | | | | | |
Gross expenses | | | 1.10 | % | | | 1.90 | % | | | 3.45 | % |
Net expenses | | | 0.85 | % | | | 0.85 | % | | | 0.85 | % |
Net investment income | | | 3.15 | % | | | 3.98 | % | | | 3.21 | % |
Supplemental data | | | | | | | | | | | | |
Portfolio turnover rate | | | 24 | % | | | 65 | % | | | 69 | % |
Net assets, end of period (000s omitted) | | | $17,116 | | | | $4,022 | | | | $998 | |
| 1. | For the period from January 31, 2013 (commencement of class operations) to June 30, 2013 |
| 2. | Total return calculations do not include any sales charges. Returns for periods of less than one year are not annualized. |
The accompanying notes are an integral part of these financial statements.
| | | | | | |
| Financial highlights | | Wells Fargo Advantage High Yield Municipal Bond Fund | | | 19 | |
(For a share outstanding throughout each period)
| | | | | | | | | | | | |
| | | Six months ended
December 31, 2014 (unaudited) | | | Year ended June 30 | |
| CLASS C | | | 2014 | | | 20131 | |
Net asset value, beginning of period | | | $10.25 | | | | $9.52 | | | | $10.00 | |
Net investment income | | | 0.13 | | | | 0.33 | | | | 0.09 | |
Net realized and unrealized gains (losses) on investments | | | 0.33 | | | | 0.75 | | | | (0.48 | ) |
| | | | | | | | | | | | |
Total from investment operations | | | 0.46 | | | | 1.08 | | | | (0.39 | ) |
Distributions to shareholders from | | | | | | | | | | | | |
Net investment income | | | (0.13 | ) | | | (0.33 | ) | | | (0.09 | ) |
Net realized gains | | | (0.09 | ) | | | (0.02 | ) | | | 0.00 | |
| | | | | | | | | | | | |
Total distributions to shareholders | | | (0.22 | ) | | | (0.35 | ) | | | (0.09 | ) |
Net asset value, end of period | | | $10.49 | | | | $10.25 | | | | $9.52 | |
Total return2 | | | 4.46 | % | | | 11.58 | % | | | (3.89 | )% |
Ratios to average net assets (annualized) | | | | | | | | | | | | |
Gross expenses | | | 1.85 | % | | | 2.58 | % | | | 4.05 | % |
Net expenses | | | 1.60 | % | | | 1.60 | % | | | 1.60 | % |
Net investment income | | | 2.40 | % | | | 3.15 | % | | | 2.25 | % |
Supplemental data | | | | | | | | | | | | |
Portfolio turnover rate | | | 24 | % | | | 65 | % | | | 69 | % |
Net assets, end of period (000s omitted) | | | $4,577 | | | | $2,323 | | | | $481 | |
| 1. | For the period from January 31, 2013 (commencement of class operations) to June 30, 2013 |
| 2. | Total return calculations do not include any sales charges. Returns for periods of less than one year are not annualized. |
The accompanying notes are an integral part of these financial statements.
| | | | |
| 20 | | Wells Fargo Advantage High Yield Municipal Bond Fund | | Financial highlights |
(For a share outstanding throughout each period)
| | | | | | | | | | | | |
| | | Six months ended
December 31, 2014 (unaudited) | | | Year ended June 30 | |
| ADMINISTRATOR CLASS | | | 2014 | | | 20131 | |
Net asset value, beginning of period | | | $10.26 | | | | $9.52 | | | | $10.00 | |
Net investment income | | | 0.17 | | | | 0.41 | | | | 0.13 | |
Net realized and unrealized gains (losses) on investments | | | 0.32 | | | | 0.76 | | | | (0.48 | ) |
| | | | | | | | | | | | |
Total from investment operations | | | 0.49 | | | | 1.17 | | | | (0.35 | ) |
Distributions to shareholders from | | | | | | | | | | | | |
Net investment income | | | (0.17 | ) | | | (0.41 | ) | | | (0.13 | ) |
Net realized gains | | | (0.09 | ) | | | (0.02 | ) | | | 0.00 | |
| | | | | | | | | | | | |
Total distributions to shareholders | | | (0.26 | ) | | | (0.43 | ) | | | (0.13 | ) |
Net asset value, end of period | | | $10.49 | | | | $10.26 | | | | $9.52 | |
Total return2 | | | 4.81 | % | | | 12.63 | % | | | (3.57 | )% |
Ratios to average net assets (annualized) | | | | | | | | | | | | |
Gross expenses | | | 1.03 | % | | | 1.80 | % | | | 3.24 | % |
Net expenses | | | 0.75 | % | | | 0.75 | % | | | 0.75 | % |
Net investment income | | | 3.25 | % | | | 4.14 | % | | | 3.10 | % |
Supplemental data | | | | | | | | | | | | |
Portfolio turnover rate | | | 24 | % | | | 65 | % | | | 69 | % |
Net assets, end of period (000s omitted) | | | $15,831 | | | | $3,282 | | | | $482 | |
| 1. | For the period from January 31, 2013 (commencement of class operations) to June 30, 2013 |
| 2. | Returns for periods of less than one year are not annualized. |
The accompanying notes are an integral part of these financial statements.
| | | | | | |
| Financial highlights | | Wells Fargo Advantage High Yield Municipal Bond Fund | | | 21 | |
(For a share outstanding throughout each period)
| | | | | | | | | | | | |
| | | Six months ended
December 31, 2014 (unaudited) | | | Year ended June 30 | |
| INSTITUTIONAL CLASS | | | 2014 | | | 20131 | |
Net asset value, beginning of period | | | $10.25 | | | | $9.52 | | | | $10.00 | |
Net investment income | | | 0.18 | | | | 0.42 | | | | 0.13 | |
Net realized and unrealized gains (losses) on investments | | | 0.33 | | | | 0.75 | | | | (0.48 | ) |
| | | | | | | | | | | | |
Total from investment operations | | | 0.51 | | | | 1.17 | | | | (0.35 | ) |
Distributions to shareholders from | | | | | | | | | | | | |
Net investment income | | | (0.18 | ) | | | (0.42 | ) | | | (0.13 | ) |
Net realized gains | | | (0.09 | ) | | | (0.02 | ) | | | 0.00 | |
| | | | | | | | | | | | |
Total distributions to shareholders | | | (0.27 | ) | | | (0.44 | ) | | | (0.13 | ) |
Net asset value, end of period | | | $10.49 | | | | $10.25 | | | | $9.52 | |
Total return2 | | | 4.99 | % | | | 12.70 | % | | | (3.52 | )% |
Ratios to average net assets (annualized) | | | | | | | | | | | | |
Gross expenses | | | 0.78 | % | | | 1.53 | % | | | 2.97 | % |
Net expenses | | | 0.60 | % | | | 0.60 | % | | | 0.60 | % |
Net investment income | | | 3.41 | % | | | 4.26 | % | | | 3.25 | % |
Supplemental data | | | | | | | | | | | | |
Portfolio turnover rate | | | 24 | % | | | 65 | % | | | 69 | % |
Net assets, end of period (000s omitted) | | | $55,753 | | | | $31,105 | | | | $8,204 | |
| 1. | For the period from January 31, 2013 (commencement of class operations) to June 30, 2013 |
| 2. | Returns for periods of less than one year are not annualized. |
The accompanying notes are an integral part of these financial statements.
| | | | |
| 22 | | Wells Fargo Advantage High Yield Municipal Bond Fund | | Notes to financial statements (unaudited) |
1. ORGANIZATION
Wells Fargo Funds Trust (the “Trust”), a Delaware statutory trust organized on March 10, 1999, is an open-end management investment company registered under the Investment Company Act of 1940, as amended (the “1940 Act”). As an investment company, the Trust follows the accounting and reporting guidance in FASB Accounting Standards Codification 946. These financial statements report on the Wells Fargo Advantage High Yield Municipal Bond Fund (the “Fund”) which is a diversified series of the Trust.
2. SIGNIFICANT ACCOUNTING POLICIES
The following significant accounting policies, which are consistently followed in the preparation of the financial statements of the Fund, are in conformity with U.S. generally accepted accounting principles which require management to make estimates and assumptions that affect the reported amounts of assets and liabilities, disclosure of contingent assets and liabilities at the date of the financial statements, and the reported amounts of revenues and expenses during the reporting period. Actual results could differ from those estimates.
Securities valuation
All investments are valued each business day as of the close of regular trading on the New York Stock Exchange (generally 4 p.m. Eastern Time).
Fixed income securities acquired with maturities exceeding 60 days are valued based on evaluated bid prices provided by an independent pricing service which may utilize both transaction data and market information such as yield, quality, coupon rate, maturity, type of issue, trading characteristics and other market data. If prices are not available from the independent pricing service or prices received are deemed not representative of market value, prices will be obtained from an independent broker-dealer.
Short-term securities, with maturities of 60 days or less at time of purchase, generally are valued at amortized cost which approximates fair value. The amortized cost method involves valuing a security at its cost, plus accretion of discount or minus amortization of premium over the period until maturity.
Futures that are listed on a foreign or domestic exchange or market are valued at the official closing price or, if none, the last sales price.
Investments in registered open-end investment companies are valued at net asset value.
Investments which are not valued using any of the methods discussed above are valued at their fair value, as determined in good faith by the Board of Trustees of the Fund. The Board of Trustees has established a Valuation Committee comprised of the Trustees and has delegated to it the authority to take any actions regarding the valuation of portfolio securities that the Valuation Committee deems necessary or appropriate, including determining the fair value of portfolio securities, unless the determination has been delegated to the Management Valuation Team of Wells Fargo Funds Management, LLC (“Funds Management”). The Board of Trustees retains the authority to make or ratify any valuation decisions or approve any changes to the Valuation Procedures as it deems appropriate. On a quarterly basis, the Board of Trustees receives reports on any valuation actions taken by the Valuation Committee or the Management Valuation Team which may include items for ratification.
Valuations of fair valued securities are compared to the next actual sales price when available, or other appropriate market values, to assess the continued appropriateness of the fair valuation methodologies used. These securities are fair valued on a day-to-day basis, taking into consideration changes to appropriate market information and any significant changes to the inputs considered in the valuation process until there is a readily available price provided on an exchange or by an independent pricing service. Valuations received from an independent pricing service or independent broker-dealer quotes are periodically validated by comparisons to most recent trades and valuations provided by other independent pricing services in addition to the review of prices by the adviser and/or subadviser. Unobservable inputs used in determining fair valuations are identified based on the type of security, taking into consideration factors utilized by market participants in valuing the investment, knowledge about the issuer and the current market environment.
When-issued transactions
The Fund may purchase securities on a forward commitment or when-issued basis. The Fund records a when-issued transaction on the trade date and will segregate assets in an amount at least equal in value to the Fund’s commitment to purchase when-issued securities. Securities purchased on a when-issued basis are marked-to-market daily and the Fund begins earning interest on the settlement date. Losses may arise due to changes in the market value of the underlying securities or if the counterparty does not perform under the contract.
| | | | | | |
| Notes to financial statements (unaudited) | | Wells Fargo Advantage High Yield Municipal Bond Fund | | | 23 | |
Futures contracts
The Fund is subject to interest rate risk in the normal course of pursuing its investment objectives. The Fund may buy and sell futures contracts in order to gain exposure to, or protect against, changes in security values and interest rates. The primary risks associated with the use of futures contracts are the imperfect correlation between changes in market values of securities held by the Fund and the prices of futures contracts, and the possibility of an illiquid market.
The aggregate principal amounts of the contracts are not recorded in the financial statements. Fluctuations in the value of the contracts are recorded in the Statement of Assets and Liabilities as an asset or liability and in the Statement of Operations as unrealized gains or losses until the contracts are closed, at which point they are recorded as net realized gains or losses on futures contracts. With futures contracts, there is minimal counterparty risk to the Fund since futures are exchange traded and the exchange’s clearinghouse, as counterparty to all exchange traded futures, guarantees the futures against default.
Security transactions and income recognition
Securities transactions are recorded on a trade date basis. Realized gains or losses are recorded on the basis of identified cost.
Interest income is accrued daily and bond discounts are accreted and premiums are amortized daily based on the effective interest method. To the extent debt obligations are placed on non-accrual status, any related interest income may be reduced by writing off interest receivables when the collection of all or a portion of interest has become doubtful based on consistently applied procedures. If the issuer subsequently resumes interest payments or when the collectability of interest is reasonably assured, the debt obligation is removed from non-accrual status.
Distributions to shareholders
Distributions to shareholders from net investment income are accrued daily and paid monthly. Distributions from net realized gains, if any, are recorded on the ex-dividend date. Such distributions are determined in conformity with federal income tax regulations, which may differ in amount or character from net investment income and realized gains recognized for purposes of U.S. generally accepted accounting principles.
Federal and other taxes
The Fund intends to continue to qualify as a regulated investment company by distributing substantially all of its investment company taxable and tax-exempt income and any net realized capital gains (after reduction for capital loss carryforwards) sufficient to relieve it from all, or substantially all, federal income taxes. Accordingly, no provision for federal income taxes was required.
The Fund’s income and federal excise tax returns and all financial records supporting those returns for the prior three fiscal years are subject to examination by the federal and Delaware revenue authorities. Management has analyzed the Fund’s tax positions taken on federal, state, and foreign tax returns for all open tax years and does not believe that there are any uncertain tax positions that require recognition of a tax liability.
Class allocations
The separate classes of shares offered by the Fund differ principally in applicable sales charges, distribution, shareholder servicing, and administration fees. Class specific expenses are charged directly to that share class. Investment income, common expenses, and realized and unrealized gains (losses) on investments are allocated daily to each class of shares based on the relative proportion of net assets of each class.
3. FAIR VALUATION MEASUREMENTS
Fair value measurements of investments are determined within a framework that has established a fair value hierarchy based upon the various data inputs utilized in determining the value of the Fund’s investments. The three-level hierarchy gives the highest priority to unadjusted quoted prices in active markets for identical assets or liabilities (Level 1) and the lowest priority to significant unobservable inputs (Level 3). The Fund’s investments are classified within the fair value hierarchy based on the lowest level of input that is significant to the fair value measurement. The inputs are summarized into three broad levels as follows:
| n | | Level 1 – quoted prices in active markets for identical securities |
| n | | Level 2 – other significant observable inputs (including quoted prices for similar securities, interest rates, prepayment speeds, credit risk, use of amortized cost, etc.) |
| n | | Level 3 – significant unobservable inputs (including the Fund’s own assumptions in determining the fair value of investments) |
| | | | |
| 24 | | Wells Fargo Advantage High Yield Municipal Bond Fund | | Notes to financial statements (unaudited) |
The inputs or methodologies used for valuing investments in securities are not necessarily an indication of the risk associated with investing in those securities.
The following is a summary of the inputs used in valuing the Fund’s assets and liabilities as of December 31, 2014:
| | | | | | | | | | | | | | | | |
| | | Quoted prices
(Level 1) | | | Other significant
observable inputs
(Level 2) | | | Significant
unobservable inputs
(Level 3) | | | Total | |
Assets | | | | | | | | | | | | | | | | |
Investments in : | | | | | | | | | | | | | | | | |
| | | | |
Municipal obligations | | $ | 0 | | | $ | 89,115,427 | | | $ | 0 | | | $ | 89,115,427 | |
| | | | |
Short-term investments | | | | | | | | | | | | | | | | |
Investment companies | | | 3,652,189 | | | | 0 | | | | 0 | | | | 3,652,189 | |
U.S. Treasury securities | | | 74,997 | | | | 0 | | | | 0 | | | | 74,997 | |
Total assets | | $ | 3,727,186 | | | $ | 89,115,427 | | | $ | 0 | | | $ | 92,842,613 | |
Liabilities | | | | | | | | | | | | | | | | |
Futures contracts | | $ | 8,719 | | | $ | 0 | | | $ | 0 | | | $ | 8,719 | |
Total liabilities | | $ | 8,719 | | | $ | 0 | | | $ | 0 | | | $ | 8,719 | |
Futures contracts are reported at their variation margin at measurement date, which represents the amount due from the Fund at that date. All other assets and liabilities are reported at their market value at measurement date.
Transfers in and transfers out are recognized at the end of the reporting period. At December 31, 2014, the Fund did not have any transfers into/out of Level 1, Level 2, or Level 3.
4. TRANSACTIONS WITH AFFILIATES
Advisory fee
The Trust has entered into an advisory contract with Funds Management, an indirect wholly owned subsidiary of Wells Fargo & Company (“Wells Fargo”). The adviser is responsible for implementing investment policies and guidelines and for supervising the subadviser, who is responsible for day-to-day portfolio management of the Fund.
Pursuant to the contract, Funds Management is entitled to receive an annual advisory fee starting at 0.45% and declining to 0.35% as the average daily net assets of the Fund increase. For the six months ended December 31, 2014, the advisory fee was equivalent to an annual rate of 0.45% of the Fund’s average daily net assets.
Funds Management has retained the services of a subadviser to provide daily portfolio management to the Fund. The fee for subadvisory services is borne by Funds Management. Wells Capital Management Incorporated, an affiliate of Funds Management and an indirect wholly owned subsidiary of Wells Fargo, is the subadviser to the Fund and is entitled to receive a fee from Funds Management at an annual rate starting at 0.35% and declining to 0.20% as the average daily net assets of the Fund increase.
Administration fee
The Trust has entered into an administration agreement with Funds Management. Under this agreement, for providing administrative services, which includes paying fees and expenses for services provided by the transfer agent, sub-transfer agents, omnibus account servicers and record-keepers, Funds Management is entitled to receive from the Fund an annual fund level administration fee starting at 0.05% and declining to 0.03% as the average daily net assets of the Fund increase and a class level administration fee which is calculated based on the average daily net assets of each class as follows:
| | | | |
| | | Class level
administration fee | |
Class A, Class C | | | 0.16 | % |
Administrator Class | | | 0.10 | |
Institutional Class | | | 0.08 | |
| | | | | | |
| Notes to financial statements (unaudited) | | Wells Fargo Advantage High Yield Municipal Bond Fund | | | 25 | |
Funds Management has contractually waived and/or reimbursed advisory and administration fees to the extent necessary to maintain certain net operating expense ratios for the Fund. Waiver of fees and/or reimbursement of expenses by Funds Management were made first from fund level expenses on a proportionate basis and then from class specific expenses. Funds Management has committed through October 31, 2015 to waive fees and/or reimburse expenses to the extent necessary to cap the Fund’s expenses at 0.85% for Class A shares, 1.60% for Class C shares, 0.75% for Administrator Class shares, and 0.60% for Institutional Class shares. After this time, the cap may be increased or the commitment to maintain the cap may be terminated only with the approval of the Board of Trustees.
Distribution fee
The Trust has adopted a Distribution Plan for Class C shares of the Fund pursuant to Rule 12b-1 under the 1940 Act. A distribution fee is charged to Class C shares and paid to Wells Fargo Funds Distributor, LLC (“Funds Distributor”), the principal underwriter, at an annual rate of 0.75% of the average daily net assets of Class C shares.
In addition, Funds Distributor is entitled to receive the front-end sales charge from the purchase of Class A shares and a contingent deferred sales charge on the redemption of certain shares. Funds Distributor is also entitled to receive the contingent deferred sales charges from redemptions of Class C shares. For the six months ended December 31, 2014, Funds Distributor received $3,866 from the sale of Class A shares.
Shareholder servicing fees
The Trust has entered into contracts with one or more shareholder servicing agents, whereby Class A, Class C, and Administrator Class of the Fund is charged a fee at an annual rate of 0.25% of the average daily net assets of each respective class.
A portion of these total shareholder servicing fees were paid to affiliates of Wells Fargo.
5. INVESTMENT PORTFOLIO TRANSACTIONS
Purchases and sales of investments, excluding U.S. government obligations (if any) and short-term securities, for the six months ended December 31, 2014 were $67,593,211 and $15,059,873, respectively.
6. DERIVATIVE TRANSACTIONS
During the six months ended December 31, 2014, the Fund entered into futures contracts to take advantage of the differences between municipal and treasury yields and to help manage the duration of the portfolio.
At December 31, 2014, the Fund had short futures contracts outstanding as follows:
| | | | | | | | | | | | | | | | |
| Expiration date | | Counterparty | | Contracts | | Type | | | Contract value at
December 31, 2014 | | | Unrealized
losses | |
3-20-2015 | | JPMorgan | | 31 Short | | | U.S. Treasury Bonds | | | $ | 4,481,438 | | | $ | (39,528 | ) |
The Fund had an average notional amount of $550,968 in futures contracts during the six months ended December 31, 2014.
On December 31, 2014, the cumulative unrealized losses on futures contracts in the amount of $39,528 are reflected in net unrealized gains on investments on the Statement of Assets and Liabilities. The payable for daily variation margin on open futures contracts reflected in the Statement of Assets and Liabilities only represents the current day’s variation margin. The change in unrealized gains (losses) on futures contracts are reflected in the Statement of Operations.
For certain types of derivative transactions, the Fund has entered into International Swaps and Derivatives Association, Inc. master agreements (“ISDA Master Agreements”) or similar agreements with approved counterparties. The ISDA Master Agreements or similar agreements may have requirements to deliver/deposit securities or cash to/with an exchange or broker-dealer as collateral and allows the Fund to offset, with each counterparty, certain derivative financial instrument’s assets and/or liabilities with collateral held or pledged. Collateral requirements differ by type of derivative. Collateral or margin requirements are set by the broker or exchange clearing house for exchange traded derivatives while collateral terms are contract specific for over-the-counter traded derivatives. Cash collateral that has been pledged to cover obligations of the Fund under ISDA Master Agreements or similar agreements, if any, will be reported separately in the Statement of Assets and Liabilities. Securities pledged as collateral, if any, for the same purpose are noted in the Portfolio of Investments. With respect to balance sheet offsetting, absent an event of default by the counterparty or a termination of the agreement, the reported amounts of financial assets and financial liabilities in the Statement of Assets
| | | | |
| 26 | | Wells Fargo Advantage High Yield Municipal Bond Fund | | Notes to financial statements (unaudited) |
and Liabilities are not offset across transactions between the Fund and the applicable counterparty. A reconciliation of the gross amounts on the Statement of Assets and Liabilities to the net amounts by derivative type, including any collateral exposure, is as follows:
| | | | | | | | | | | | | | | | |
| Derivative type | | Counterparty | | Gross amounts
of liabilities in the
Statement of
Assets and
Liabilities | | Amounts
subject to
netting
agreements | | | Collateral
pledged1 | | | Net amount
of liabilities | |
Futures – variation margin | | JPMorgan | | $8,719 | | $ | 0 | | | $ | (8,719 | ) | | $ | 0 | |
| | 1 | Collateral pledged within this table is limited to the collateral for the net transaction with the counterparty. | |
7. BANK BORROWINGS
The Trust (excluding the money market funds and certain other funds in the Trust) and Wells Fargo Variable Trust are parties to a $150,000,000 revolving credit agreement, whereby the Fund is permitted to use bank borrowings for temporary or emergency purposes, such as to fund shareholder redemption requests. Interest under the credit agreement is charged to the Fund based on a borrowing rate equal to the higher of the Federal Funds rate in effect on that day plus 1.25% or the overnight LIBOR rate in effect on that day plus 1.25%. In addition, an annual commitment fee equal to 0.10% of the unused balance is allocated to each participating fund. For the six months ended December 31, 2014, the Fund paid $36 in commitment fees.
For the six months ended December 31, 2014, there were no borrowings by the Fund under the agreement.
8. INDEMNIFICATION
Under the Trust’s organizational documents, the officers and Trustees are indemnified against certain liabilities that may arise out of performance of their duties to the Trust. Additionally, in the normal course of business, the Trust may enter into contracts with service providers that contain a variety of indemnification clauses. The Trust’s maximum exposure under these arrangements is dependent on future claims that may be made against the Fund and, therefore, cannot be estimated.
| | | | | | |
| Other information (unaudited) | | Wells Fargo Advantage High Yield Municipal Bond Fund | | | 27 | |
PROXY VOTING INFORMATION
A description of the policies and procedures that the Fund uses to determine how to vote proxies relating to portfolio securities is available without charge, upon request, by calling 1-800-222-8222, visiting our website at wellsfargoadvantagefunds.com, or visiting the SEC website at sec.gov. Information regarding how the Fund voted proxies relating to portfolio securities during the most recent 12-month period ended June 30 is available on the Fund’s website at wellsfargoadvantagefunds.com or by visiting the SEC website at sec.gov.
PORTFOLIO HOLDINGS INFORMATION
The complete portfolio holdings for the Fund are publicly available monthly on the Fund’s website (wellsfargoadvantagefunds.com), on a one-month delayed basis. In addition, top ten holdings information (excluding derivative positions) for the Fund is publicly available on the Fund’s website on a monthly, seven-day or more delayed basis. The Fund files its complete schedule of portfolio holdings with the SEC for the first and third quarters of each fiscal year on Form N-Q, which is available by visiting the SEC website at sec.gov. In addition, the Fund’s Form N-Q may be reviewed and copied at the SEC’s Public Reference Room in Washington, DC, and at regional offices in New York City, at 233 Broadway, and in Chicago, at 175 West Jackson Boulevard, Suite 900. Information about the Public Reference Room may be obtained by calling 1-800-SEC-0330.
| | | | |
| 28 | | Wells Fargo Advantage High Yield Municipal Bond Fund | | Other information (unaudited) |
BOARD OF TRUSTEES AND OFFICERS
Each of the Trustees and Officers1 listed in the table below acts in identical capacities for each fund in the Wells Fargo Advantage family of funds, which consists of 134 mutual funds comprising the Wells Fargo Funds Trust, Wells Fargo Variable Trust, Wells Fargo Master Trust and four closed-end funds (collectively the “Fund Complex”). This table should be read in conjunction with the Prospectus and the Statement of Additional Information2. The mailing address of each Trustee and Officer is 525 Market Street, 12th Floor, San Francisco, CA 94105. Each Trustee and Officer serves an indefinite term, however, each Trustee serves such term until reaching the mandatory retirement age established by the Trustees.
Independent Trustees
| | | | | | |
Name and year of birth | | Position held and length of service* | | Principal occupations during past five years or longer | | Other directorships during
past five years |
| Peter G. Gordon (Born 1942) | | Trustee, since 1998; Chairman, since 2005 | | Co-Founder, Retired Chairman, President and CEO of Crystal Geyser Water Company. Trustee Emeritus, Colby College. | | Asset Allocation Trust |
| Isaiah Harris, Jr. (Born 1952) | | Trustee, since 2009 | | Retired. Prior thereto, President and CEO of BellSouth Advertising and Publishing Corp. from 2005 to 2007, President and CEO of BellSouth Enterprises from 2004 to 2005 and President of BellSouth Consumer Services from 2000 to 2003. Emeritus member of the Iowa State University Foundation Board of Governors. Emeritus Member of the Advisory Board of Iowa State University School of Business. Advisory Board Member, Palm Harbor Academy. Mr. Harris is a certified public accountant. | | CIGNA Corporation; Asset Allocation Trust |
| Judith M. Johnson (Born 1949) | | Trustee, since 2008;
Audit Committee Chairman, since 2008 | | Retired. Prior thereto, Chief Executive Officer and Chief Investment Officer of Minneapolis Employees Retirement Fund from 1996 to 2008. Ms. Johnson is an attorney, certified public accountant and a certified managerial accountant. | | Asset Allocation Trust |
| Leroy Keith, Jr. (Born 1939) | | Trustee, since 2010** | | Chairman, Bloc Global Services (development and construction). Trustee of the Evergreen Funds complex (and its predecessors) from 1983 to 2010. Former Managing Director, Almanac Capital Management (commodities firm), former Partner, Stonington Partners, Inc. (private equity fund), former Director, Obagi Medical Products Co. and former Director, Lincoln Educational Services. | | Trustee, Virtus Fund Complex (consisting of 50 portfolios as of 12/16/2013); Asset Allocation Trust |
| David F. Larcker (Born 1950) | | Trustee, since 2009 | | James Irvin Miller Professor of Accounting at the Graduate School of Business, Stanford University, Morgan Stanley Director of the Center for Leadership Development and Research and Senior Faculty of The Rock Center for Corporate Governance since 2006. From 2005 to 2008, Professor of Accounting at the Graduate School of Business, Stanford University. Prior thereto, Ernst & Young Professor of Accounting at The Wharton School, University of Pennsylvania from 1985 to 2005. | | Asset Allocation Trust |
| Olivia S. Mitchell (Born 1953) | | Trustee, since 2006 | | International Foundation of Employee Benefit Plans Professor, Wharton School of the University of Pennsylvania since 1993. Director of Wharton’s Pension Research Council and Boettner Center on Pensions & Retirement Research, and Research Associate at the National Bureau of Economic Research. Previously, Cornell University Professor from 1978 to 1993. | | Asset Allocation Trust |
| Timothy J. Penny (Born 1951) | | Trustee, since 1996 | | President and CEO of Southern Minnesota Initiative Foundation, a non-profit organization, since 2007 and Senior Fellow at the Humphrey Institute Policy Forum at the University of Minnesota since 1995. Member of the Board of Trustees of NorthStar Education Finance, Inc., a non-profit organization, since 2007. | | Asset Allocation Trust |
| | | | | | |
| Other information (unaudited) | | Wells Fargo Advantage High Yield Municipal Bond Fund | | | 29 | |
| | | | | | |
Name and year of birth | | Position held and length of service* | | Principal occupations during past five years or longer | | Other directorships during
past five years |
| | | | | | |
| Michael S. Scofield (Born 1943) | | Trustee, since 2010 | | Served on the Investment Company Institute’s Board of Governors and Executive Committee from 2008-2011 as well the Governing Council of the Independent Directors Council from 2006-2011 and the Independent Directors Council Executive Committee from 2008-2011. Chairman of the IDC from 2008-2010. Institutional Investor (Fund Directions) Trustee of Year in 2007. Trustee of the Evergreen Funds complex (and its predecessors) from 1984 to 2010. Chairman of the Evergreen Funds from 2000-2010. Former Trustee of the Mentor Funds. Retired Attorney, Law Offices of Michael S. Scofield. | | Asset Allocation Trust |
| Donald C. Willeke (Born 1940) | | Trustee, since 1996 | | Principal of the law firm of Willeke & Daniels. General Counsel of the Minneapolis Employees Retirement Fund from 1984 until its consolidation into the Minnesota Public Employees Retirement Association on June 30, 2010. Director and Vice Chair of The Tree Trust (non-profit corporation). Director of the American Chestnut Foundation (non-profit corporation). | | Asset Allocation Trust |
| * | Length of service dates reflect the Trustee’s commencement of service with the Trust’s predecessor entities, where applicable. |
| ** | Leroy Keith, Jr. retired as a Trustee effective December 31, 2014. |
Officers
| | | | | | |
Name and year of birth | | Position held and
length of service | | Principal occupations during past five years or longer | | |
Karla M. Rabusch (Born 1959) | | President, since 2003 | | Executive Vice President of Wells Fargo Bank, N.A. and President of Wells Fargo Funds Management, LLC since 2003. | | |
Nancy Wiser1 (Born 1967) | | Treasurer, since 2012 | | Executive Vice President of Wells Fargo Funds Management, LLC since 2011. Chief Operating Officer and Chief Compliance Officer at LightBox Capital Management LLC, from 2008 to 2011. Owned and operated a consulting business providing services to various hedge funds including acting as Chief Operating Officer and Chief Compliance Officer for a hedge fund from 2007 to 2008. Chief Operating Officer and Chief Compliance Officer of GMN Capital LLC from 2006 to 2007. | | |
C. David Messman (Born 1960) | | Secretary, since 2000; Chief Legal Officer, since 2003 | | Assistant General Counsel of Wells Fargo Bank, N.A. since 2013 and Vice President and Managing Counsel of Wells Fargo Bank N.A. from 1996 to 2013. Senior Vice President and Secretary of Wells Fargo Funds Management , LLC since 2001. | | |
Debra Ann Early (Born 1964) | | Chief Compliance Officer, since 2007 | | Senior Vice President of Wells Fargo Funds Management, LLC since 2007 and Chief Compliance Officer from 2007 to 2014. Chief Compliance Officer of Parnassus Investments from 2005 to 2007. Chief Financial Officer of Parnassus Investments from 2004 to 2007 and Senior Audit Manager of PricewaterhouseCoopers LLP from 1998 to 2004. | | |
David Berardi (Born 1975) | | Assistant Treasurer, since 2009 | | Vice President of Wells Fargo Funds Management, LLC since 2009. Vice President of Evergreen Investment Management Company, LLC from 2008 to 2010. Assistant Vice President of Evergreen Investment Services, Inc. from 2004 to 2008. Manager of Fund Reporting and Control for Evergreen Investment Management Company, LLC from 2004 to 2010. | | |
Jeremy DePalma1 (Born 1974) | | Assistant Treasurer, since 2009 | | Senior Vice President of Wells Fargo Funds Management, LLC since 2009. Senior Vice President of Evergreen Investment Management Company, LLC from 2008 to 2010. Vice President, Evergreen Investment Services, Inc. from 2004 to 2007. Head of the Fund Reporting and Control Team within Fund Administration from 2005 to 2010. | | |
| 1. | Nancy Wiser acts as Treasurer of 73 funds in the Fund Complex. Jeremy DePalma acts as Treasurer of 61 funds and Assistant Treasurer of 73 funds in the Fund Complex. |
| 2. | The Statement of Additional Information includes additional information about the Trustees and is available, without charge, upon request, by calling 1-800-222-8222 or by visiting the website at wellsfargoadvantagefunds.com. |
| | | | |
| 30 | | Wells Fargo Advantage High Yield Municipal Bond Fund | | List of abbreviations |
The following is a list of common abbreviations for terms and entities that may have appeared in this report.
| ACA | — ACA Financial Guaranty Corporation |
| ADR | — American depositary receipt |
| ADS | — American depositary shares |
| AGC | — Assured Guaranty Corporation |
| AGM | — Assured Guaranty Municipal |
| Ambac | — Ambac Financial Group Incorporated |
| AMT | — Alternative minimum tax |
| BAN | — Bond anticipation notes |
| BHAC | — Berkshire Hathaway Assurance Corporation |
| CAB | — Capital appreciation bond |
| CCAB | — Convertible capital appreciation bond |
| CDA | — Community Development Authority |
| CDO | — Collateralized debt obligation |
| DRIVER | — Derivative inverse tax-exempt receipts |
| DW&P | — Department of Water & Power |
| DWR | — Department of Water Resources |
| ECFA | — Educational & Cultural Facilities Authority |
| EDA | — Economic Development Authority |
| EDFA | — Economic Development Finance Authority |
| ETF | — Exchange-traded fund |
| FDIC | — Federal Deposit Insurance Corporation |
| FFCB | — Federal Farm Credit Banks |
| FGIC | — Financial Guaranty Insurance Corporation |
| FHA | — Federal Housing Administration |
| FHLB | — Federal Home Loan Bank |
| FHLMC | — Federal Home Loan Mortgage Corporation |
| FICO | — The Financing Corporation |
| FNMA | — Federal National Mortgage Association |
| GDR | — Global depositary receipt |
| GNMA | — Government National Mortgage Association |
| HCFR | — Healthcare facilities revenue |
| HEFA | — Health & Educational Facilities Authority |
| HEFAR | — Higher education facilities authority revenue |
| HFA | — Housing Finance Authority |
| HFFA | — Health Facilities Financing Authority |
| HUD | — Department of Housing and Urban Development |
| IDA | — Industrial Development Authority |
| IDAG | — Industrial Development Agency |
| KRW | — Republic of Korea won |
| LIBOR | — London Interbank Offered Rate |
| LLC | — Limited liability company |
| LLLP | — Limited liability limited partnership |
| LLP | — Limited liability partnership |
| MBIA | — Municipal Bond Insurance Association |
| MFHR | — Multifamily housing revenue |
| MSTR | — Municipal securities trust receipts |
| MUD | — Municipal Utility District |
| National | — National Public Finance Guarantee Corporation |
| PCFA | — Pollution Control Financing Authority |
| PCL | — Public Company Limited |
| PCR | — Pollution control revenue |
| PFA | — Public Finance Authority |
| PFFA | — Public Facilities Financing Authority |
| PFOTER | — Puttable floating option tax-exempt receipts |
| plc | — Public limited company |
| PUTTER | — Puttable tax-exempt receipts |
| R&D | — Research & development |
| Radian | — Radian Asset Assurance |
| RAN | — Revenue anticipation notes |
| RDA | — Redevelopment Authority |
| RDFA | — Redevelopment Finance Authority |
| REIT | — Real estate investment trust |
| ROC | — Reset option certificates |
| SAVRS | — Select auction variable rate securities |
| SBA | — Small Business Authority |
| SFHR | — Single-family housing revenue |
| SFMR | — Single-family mortgage revenue |
| SPA | — Standby purchase agreement |
| SPDR | — Standard & Poor’s Depositary Receipts |
| STRIPS | — Separate trading of registered interest and |
| TAN | — Tax anticipation notes |
| TIPS | — Treasury inflation-protected securities |
| TRAN | — Tax revenue anticipation notes |
| TTFA | — Transportation Trust Fund Authority |
| TVA | — Tennessee Valley Authority |
This page is intentionally left blank.
This page is intentionally left blank.


For more information
More information about Wells Fargo Advantage Funds is available free upon request. To obtain literature, please write, email, visit the Fund’s website, or call:
Wells Fargo Advantage Funds
P.O. Box 8266
Boston, MA 02266-8266
Email: wfaf@wellsfargo.com
Website: wellsfargoadvantagefunds.com
Individual investors: 1-800-222-8222
Retail investment professionals: 1-888-877-9275
Institutional investment professionals: 1-866-765-0778
This report and the financial statements contained herein are submitted for the general information of the shareholders of Wells Fargo Advantage Funds. If this report is used for promotional purposes, distribution of the report must be accompanied or preceded by a current prospectus. Before investing, please consider the investment objectives, risks, charges, and expenses of the investment. For a current prospectus and, if available, a summary prospectus, containing this information, call 1-800-222-8222 or visit the Fund’s website at wellsfargoadvantagefunds.com. Read the prospectus carefully before you invest or send money.
Wells Fargo Funds Management, LLC, a wholly owned subsidiary of Wells Fargo & Company, provides investment advisory and administrative services for Wells Fargo Advantage Funds. Other affiliates of Wells Fargo & Company provide subadvisory and other services for the Funds. The Funds are distributed by Wells Fargo Funds Distributor, LLC, Member FINRA/SIPC, an affiliate of Wells Fargo & Company.
NOT FDIC INSURED ¡ NO BANK GUARANTEE ¡ MAY LOSE VALUE
© 2014 Wells Fargo Funds Management, LLC. All rights reserved.
| | |
 | | 230424 02-15 SA264/SAR264 12-14 |

Wells Fargo Advantage
Intermediate Tax/AMT-Free Fund

Semi-Annual Report
December 31, 2014

Reduce clutter. Save trees.
Sign up for electronic delivery of prospectuses and shareholder reports at wellsfargo.com/advantagedelivery
Contents
The views expressed and any forward-looking statements are as of December 31, 2014, unless otherwise noted, and are those of the Fund managers and/or Wells Fargo Funds Management, LLC. Discussions of individual securities, or the markets generally, or any Wells Fargo Advantage Fund are not intended as individual recommendations. Future events or results may vary significantly from those expressed in any forward-looking statements; the views expressed are subject to change at any time in response to changing circumstances in the market. Wells Fargo Funds Management, LLC and the Fund disclaim any obligation to publicly update or revise any views expressed or forward-looking statements.
NOT FDIC INSURED ¡ NO BANK GUARANTEE ¡ MAY LOSE VALUE
| | | | |
| 2 | | Wells Fargo Advantage Intermediate Tax/AMT-Free Fund | | Letter to shareholders (unaudited) |

Karla M. Rabusch
President
Wells Fargo Advantage Funds
Municipal bonds rose in the second half of 2014, helped by lower interest rates and strong demand for yield.
Dear Valued Shareholder:
We are pleased to provide you with this semi-annual report for the Wells Fargo Advantage Intermediate Tax/AMT-Free Bond Fund for the six-month period that ended December 31, 2014. Municipal bonds rose in the second half of 2014, helped by lower interest rates and strong demand for yield. In fact, the longest-dated and weakest credits had the strongest returns. Municipal bond returns—as measured by the Barclays Municipal Bond Index1, the broadest measure for tracking investment-grade municipal bonds throughout the country—gained 2.88% for the six-month period that ended December 31, 2014.
Longer-maturity and lower-rated municipal bonds outperformed.
At the front end of the yield curve, municipal bond yields were extremely low because of the accommodative monetary policy. Throughout the reporting period, the U.S. Federal Reserve’s (Fed’s) monetary policymaking body kept its key interest rate near zero in order to support the economy and the financial system. Policymakers said they can be patient in normalizing monetary policy and that any increases in the target range for the federal funds rate will depend on incoming economic data. During the reporting period, the Fed reduced (or tapered) the size of its quantitative easing program each month until the program ended in October 2014, although it continues to reinvest principal and interest payments of the mortgage-backed securities and Treasury bonds it holds.
Longer-term yields declined during the second half of the year, with 10-year municipal yields declining from 2.33% as of June 30, 2014 to 2.10% as of December 31, 2014. For more perspective, the yield curve was steep on a historical basis at the beginning of the period and ended the period with the difference between 30-year and 2-year yields at 237 basis points (bps; 100 bps equals 1.00%), which was only slightly wider than its historical average. Because the yield curve was steep, longer-dated securities had higher yields. Given their longer maturities (as municipal yields fell further out the curve) and their more generous yields, longer-term bond returns outpaced shorter-term bonds.
Investors were also enticed to buy lower-rated securities for their higher yields. Over the six-month period that ended December 31, 2014, AAA-rated municipal bonds returned 2.04% while BBB-rated bonds returned 4.29%, according to the Barclays Municipal Bond Index. Credit conditions continued to improve, as evidenced by an 18th consecutive quarter of positive year-over-year gains in state and local municipal revenues. In addition to better fundamental credit conditions, technical factors of limited supply alongside strong investor demand also supported municipal bonds.
Puerto Rico’s struggle, the exit of two cities from bankruptcy, and pension issues topped credit news.
Puerto Rico was the asset class’s largest single credit story. Bonds from the commonwealth returned a meager 0.79% during the six-month period as population declines, a contracting economy, and a burdensome level of debt held back results. Meanwhile, the cities of Stockton, California, and Detroit, Michigan, exited bankruptcy by curbing retiree health care benefits and bondholder recoveries but largely avoiding concessions on pensions. While these recent bankruptcies have so far treated pensions better than bonded debt, no clear precedent has been established due to the difference in general obligation
| 1. | The Barclays Municipal Bond Index is an unmanaged index composed of long-term tax-exempt bonds with a minimum credit rating of Baa. You cannot invest directly in an index. |
| | | | | | |
| Letter to shareholders (unaudited) | | Wells Fargo Advantage Intermediate Tax/AMT-Free Fund | | | 3 | |
pledges and court-ordered versus negotiated concessions. Finally, underfunded pensions in Illinois, New Jersey, Pennsylvania, and Kansas gained attention for their negative fiscal effects and the political difficulties of finding a resolution.
Don’t let short-term uncertainty derail long-term investment goals.
Periods of uncertainty can present challenges, but experience has taught us that maintaining long-term investment goals can be an effective way to plan for the future. To help you create a sound strategy based on your personal goals and risk tolerance, Wells Fargo Advantage Funds offers more than 100 mutual funds and other investments spanning a wide range of asset classes and investment styles. Although diversification cannot guarantee an investment profit or prevent losses, we believe it can be an effective way to manage investment risk and potentially smooth out overall portfolio performance. We encourage investors to know their investments and to understand that appropriate levels of risk-taking may unlock opportunities.
Thank you for choosing to invest with Wells Fargo Advantage Funds. We appreciate your confidence in us and remain committed to helping you meet your financial needs. For current information about your fund investments, contact your investment professional, visit our website at wellsfargoadvantagefunds.com, or call us directly at 1-800-222-8222. We are available 24 hours a day, 7 days a week.
Sincerely,

Karla M. Rabusch
President
Wells Fargo Advantage Funds
Periods of uncertainty can present challenges, but experience has taught us that maintaining long-term investment goals can be an effective way to plan for the future.
| | | | |
| 4 | | Wells Fargo Advantage Intermediate Tax/AMT-Free Fund | | Performance highlights (unaudited) |
Investment objective
The Fund seeks current income exempt from federal income tax.
Adviser
Wells Fargo Funds Management, LLC
Subadviser
Wells Capital Management Incorporated
Portfolio managers
Lyle J. Fitterer, CFA, CPA
Robert J. Miller
Average annual total returns1 (%) as of December 31, 2014
| | | | | | | | | | | | | | | | | | | | | | | | | | | | | | | | | | |
| | | | | Including sales charge | | | Excluding sales charge | | | Expense ratios2 (%) | |
| | | Inception date | | 1 year | | | 5 year | | | 10 year | | | 1 year | | | 5 year | | | 10 year | | | Gross | | | Net3 | |
| Class A (WFTAX) | | 7-31-2007 | | | 4.08 | | | | 4.25 | | | | 4.08 | | | | 7.30 | | | | 4.89 | | | | 4.40 | | | | 0.81 | | | | 0.70 | |
| Class C (WFTFX) | | 7-31-2007 | | | 5.50 | | | | 4.11 | | | | 3.63 | | | | 6.50 | | | | 4.11 | | | | 3.63 | | | | 1.56 | | | | 1.45 | |
| Administrator Class (WFITX) | | 3-31-2008 | | | – | | | | – | | | | – | | | | 7.40 | | | | 4.99 | | | | 4.48 | | | | 0.75 | | | | 0.60 | |
| Institutional Class (WITIX) | | 3-31-2008 | | | – | | | | – | | | | – | | | | 7.50 | | | | 5.18 | | | | 4.61 | | | | 0.48 | | | | 0.42 | |
| Investor Class (SIMBX) | | 7-31-2001 | | | – | | | | – | | | | – | | | | 7.17 | | | | 4.84 | | | | 4.37 | | | | 0.84 | | | | 0.73 | |
| Barclays Municipal Bond 1-15 Year Blend Index4 | | – | | | – | | | | – | | | | – | | | | 6.36 | | | | 4.31 | | | | 4.35 | | | | – | | | | – | |
Figures quoted represent past performance, which is no guarantee of future results, and do not reflect taxes that a shareholder may pay on fund distributions or the redemption of fund shares. Investment return and principal value of an investment will fluctuate so that an investor’s shares, when redeemed, may be worth more or less than their original cost. Performance shown without sales charges would be lower if sales charges were reflected. Current performance may be lower or higher than the performance data quoted, which assumes the reinvestment of dividends and capital gains. Current month-end performance is available on the Fund’s website, wellsfargoadvantagefunds.com.
Index returns do not include transaction costs associated with buying and selling securities, any mutual fund fees or expenses, or any taxes. It is not possible to invest directly in an index.
For Class A shares, the maximum front-end sales charge is 3.00%. For Class C shares, the maximum contingent deferred sales charge is 1.00%. Performance including a contingent deferred sales charge assumes the sales charge for the corresponding time period. Administrator Class, Institutional Class, and Investor Class shares are sold without a front-end sales charge or contingent deferred sales charge.
Bond values fluctuate in response to the financial condition of individual issuers, general market and economic conditions, and changes in interest rates. Changes in market conditions and government policies may lead to periods of heightened volatility in the bond market and reduced liquidity for certain bonds held by the Fund. In general, when interest rates rise, bond values fall and investors may lose principal value. Interest-rate changes and their impact on the Fund and its share price can be sudden and unpredictable. The use of derivatives may reduce returns and/or increase volatility. Certain investment strategies tend to increase the total risk of an investment (relative to the broader market). The Fund is exposed to high-yield securities risk and municipal securities risk. Consult the Fund’s prospectus for additional information on these and other risks. A portion of the Fund’s income may be subject to federal, state, and/or local income taxes or the Alternative Minimum Tax (AMT). Any capital gains distributions may be taxable.
Please see footnotes on page 5.
| | | | | | |
| Performance highlights (unaudited) | | Wells Fargo Advantage Intermediate Tax/AMT-Free Fund | | | 5 | |
|
| Credit quality distribution5 as of December 31, 2014 |
|
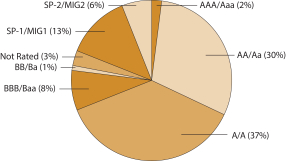 |
|
| Effective maturity distribution6 as of December 31, 2014 |
|
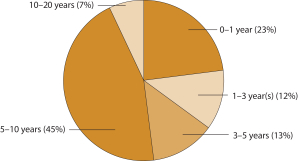 |
| 1. | Historical performance shown for Class A shares prior to their inception reflects the performance of Investor Class shares, and includes the higher expenses applicable to Investor Class shares (except during those periods in which expenses of Class A shares would have been higher than those of Investor Class shares, no such adjustment is reflected). Historical performance shown for Class C shares prior to their inception reflects the performance of Investor Class shares, adjusted to reflect the higher expenses applicable to Class C shares. Historical performance shown for Administrator Class and Institutional Class shares prior to their inception reflects the performance of Class A shares, and includes the higher expenses applicable to Class A shares. If these expenses had not been included, returns would be higher. |
| 2. | Reflects the expense ratios as stated in the most recent prospectuses. The expense ratios shown are subject to change and may differ from the annualized expense ratios shown in the financial highlights of this report. |
| 3. | The Adviser has committed through October 31, 2015, to waive fees and/or reimburse expenses to the extent necessary to cap the Fund’s Total Annual Fund Operating Expenses After Fee Waiver, excluding certain expenses, at the amounts shown. After this time, the cap may be increased or the commitment to maintain the cap may be terminated only with the approval of the Board of Trustees. Brokerage commissions, stamp duty fees, interest, taxes, acquired fund fees and expenses, and extraordinary expenses are excluded from the cap. Without this cap, the Fund’s returns would have been lower. |
| 4. | Barclays Municipal Bond 1-15 Year Blend Index is the 1-15 Year Blend component of the Barclays Municipal Bond Index. The Barclays Municipal Bond Index is an unmanaged index composed of tax-exempt bonds with maturities between six and eight years and a minimum credit rating of Baa. You cannot invest directly in an index. |
| 5. | The credit quality distribution of portfolio holdings reflected in the chart is based on ratings from Standard & Poor’s, Moody’s Investors Service, and/or Fitch Ratings Ltd. Credit quality ratings apply to the underlying holdings of the Fund and not to the Fund itself. The percentages of the Fund’s portfolio with the ratings depicted in the chart are calculated based on the total market value of fixed income securities held by the Fund. If a security was rated by all three rating agencies, the middle rating was utilized. If rated by two of three rating agencies, the lower rating was utilized, and if rated by one of the rating agencies, that rating was utilized. Standard & Poor’s rates the creditworthiness of bonds on a scale of AAA (highest) to D (lowest). Ratings from A to CCC may be modified by the addition of a plus (+) or minus (-) sign to show relative standing within the rating categories. Standard & Poor’s rates the creditworthiness of short-term notes on a scale SP-1 (highest) to SP-3 (lowest). Moody’s rates the creditworthiness of bond on a scale of Aaa (highest) to C (lowest). Ratings Aa to B may be modified by the addition of a number 1 (highest) to 3 (lowest) to show relative standing within the ratings categories. Moody’s rates the creditworthiness of short-term U.S. tax-exempt municipal securities from MIG 1/VMIG 1 (highest) to SG (lowest). Fitch rates the creditworthiness of bonds, ranging from AAA (highest) to D (lowest). Credit quality and credit quality ratings are subject to change and may have changed since the date specified. |
| 6. | Effective maturity distribution is calculated based on the total long-term investments of the Fund. It is subject to change and may have changed since the date specified. |
| | | | |
| 6 | | Wells Fargo Advantage Intermediate Tax/AMT-Free Fund | | Fund expenses (unaudited) |
As a shareholder of the Fund, you incur two types of costs: (1) transaction costs, including sales charges (loads) on purchase payments and contingent deferred sales charges (if any) on redemptions and (2) ongoing costs, including management fees, distribution (12b-1) and/or shareholder service fees, and other Fund expenses. This example is intended to help you understand your ongoing costs (in dollars) of investing in the Fund and to compare these costs with the ongoing costs of investing in other mutual funds.
The example is based on an investment of $1,000 invested at the beginning of the six-month period and held for the entire period from July 1, 2014 to December 31, 2014.
Actual expenses
The “Actual” line of the table below provides information about actual account values and actual expenses. You may use the information in this line, together with the amount you invested, to estimate the expenses that you paid over the period. Simply divide your account value by $1,000 (for example, an $8,600 account value divided by $1,000 = 8.6), then multiply the result by the number in the “Actual” line under the heading entitled “Expenses paid during period” for your applicable class of shares to estimate the expenses you paid on your account during this period.
Hypothetical example for comparison purposes
The “Hypothetical” line of the table below provides information about hypothetical account values and hypothetical expenses based on the Fund’s actual expense ratio and an assumed rate of return of 5% per year before expenses, which is not the Fund’s actual return. The hypothetical account values and expenses may not be used to estimate the actual ending account balance or expenses you paid for the period. You may use this information to compare the ongoing costs of investing in the Fund and other funds. To do so, compare this 5% hypothetical example with the 5% hypothetical examples that appear in the shareholder reports of the other funds.
Please note that the expenses shown in the table are meant to highlight your ongoing costs only and do not reflect any transactional costs, such as sales charges (loads) and contingent deferred sales charges. Therefore, the “Hypothetical” line of the table is useful in comparing ongoing costs only and will not help you determine the relative total costs of owning different funds. In addition, if these transactional costs were included, your costs would have been higher.
| | | | | | | | | | | | | | | | |
| | | Beginning
account value
7-1-2014 | | | Ending
account value
12-31-2014 | | | Expenses
paid during
the period1 | | | Net annualized
expense ratio | |
Class A | | | | | | | | | | | | | | | | |
Actual | | $ | 1,000.00 | | | $ | 1,023.46 | | | $ | 3.57 | | | | 0.70 | % |
Hypothetical (5% return before expenses) | | $ | 1,000.00 | | | $ | 1,021.68 | | | $ | 3.57 | | | | 0.70 | % |
Class C | | | | | | | | | | | | | | | | |
Actual | | $ | 1,000.00 | | | $ | 1,019.62 | | | $ | 7.38 | | | | 1.45 | % |
Hypothetical (5% return before expenses) | | $ | 1,000.00 | | | $ | 1,017.90 | | | $ | 7.38 | | | | 1.45 | % |
Administrator Class | | | | | | | | | | | | | | | | |
Actual | | $ | 1,000.00 | | | $ | 1,023.96 | | | $ | 3.06 | | | | 0.60 | % |
Hypothetical (5% return before expenses) | | $ | 1,000.00 | | | $ | 1,022.18 | | | $ | 3.06 | | | | 0.60 | % |
Institutional Class | | | | | | | | | | | | | | | | |
Actual | | $ | 1,000.00 | | | $ | 1,024.01 | | | $ | 2.14 | | | | 0.42 | % |
Hypothetical (5% return before expenses) | | $ | 1,000.00 | | | $ | 1,023.09 | | | $ | 2.14 | | | | 0.42 | % |
Investor Class | | | | | | | | | | | | | | | | |
Actual | | $ | 1,000.00 | | | $ | 1,022.43 | | | $ | 3.72 | | | | 0.73 | % |
Hypothetical (5% return before expenses) | | $ | 1,000.00 | | | $ | 1,021.53 | | | $ | 3.72 | | | | 0.73 | % |
| 1. | Expenses paid is equal to the annualized expense ratio of each class multiplied by the average account value over the period, multiplied by the number of days in the most recent fiscal half-year divided by the number of days in the fiscal year (to reflect the one-half-year period). |
| | | | | | |
| Summary portfolio of investments—December 31, 2014 (unaudited) | | Wells Fargo Advantage Intermediate Tax/AMT-Free Fund | | | 7 | |
The Summary Portfolio of Investments shows the 50 largest portfolio holdings in unaffiliated issuers and any holdings exceeding 1% of the total net assets as of the report date. The remaining securities held are grouped as “Other securities” in each category. You can request a complete schedule of portfolio holdings as of the report date, free of charge, by accessing the following website: http://a584.g.akamai.net/f/584/1326/1d/www.wellsfargoadvantagefunds.com/pdf/semi/holdings/intermediatetaxamtfree.pdf or by calling Wells Fargo Advantage Funds at 1-800-222-8222. This complete schedule, filed on the Form N-CSRS, is also available on the SEC’s website at sec.gov.
| | | | | | | | | | | | | | | | | | | | |
| Security name | | Interest rate | | | Maturity date | | | Principal | | | Value | | | Percent of
net assets | |
| | | | | |
Municipal Obligations: 98.15% | | | | | | | | | | | | | | | | | | | | |
| | | | | |
| Alabama: 0.89% | | | | | | | | | | | | | | | | | | | | |
Other securities | | | | | | | | | | | | | | $ | 19,931,408 | | | | 0.89 | % |
| | | | | | | | | | | | | | | | | | | | |
| | | | | |
| Alaska: 1.82% | | | | | | | | | | | | | | | | | | | | |
Alaska Housing Finance Corporation Series B (Housing Revenue, Landesbank Baden-Wuerttemberg SPA) ø | | | 0.14 | % | | | 12-1-2041 | | | $ | 20,700,000 | | | | 20,700,000 | | | | 0.92 | |
Alaska Housing Finance Corporation Series D (Housing Revenue, Landesbank Baden-Wuerttemberg SPA) ø | | | 0.14 | | | | 12-1-2041 | | | | 11,185,000 | | | | 11,185,000 | | | | 0.50 | |
Other securities | | | | | | | | | | | | | | | 9,018,684 | | | | 0.40 | |
| | | | | |
| | | | | | | | | | | | | | | 40,903,684 | | | | 1.82 | |
| | | | | | | | | | | | | | | | | | | | |
| | | | | |
| Arizona: 1.38% | | | | | | | | | | | | | | | | | | | | |
Other securities | | | | | | | | | | | | | | | 30,965,772 | | | | 1.38 | |
| | | | | | | | | | | | | | | | | | | | |
| | | | | |
| Arkansas: 0.71% | | | | | | | | | | | | | | | | | | | | |
Pulaski County AR HCFR Catholic Healthcare Series B (Health Revenue, U.S. Bank NA
SPA) ø | | | 0.10 | | | | 12-1-2028 | | | | 15,900,000 | | | | 15,900,000 | | | | 0.71 | |
| | | | | | | | | | | | | | | | | | | | |
| | | | | |
| California: 11.71% | | | | | | | | | | | | | | | | | | | | |
Bay Area CA Toll Authority Toll Bridge Revenue Series A (Transportation Revenue) ± | | | 1.29 | | | | 4-1-2036 | | | | 20,000,000 | | | | 20,464,200 | | | | 0.91 | |
California Public Works Board (Various
Revenue) µ | | | 5.00-6.25 | | | | 12-1-2019 to 4-1-2034 | | | | 9,275,000 | | | | 10,367,361 | | | | 0.46 | |
California Public Works Board Regents University of California Research Project Series G (Miscellaneous Revenue) | | | 5.00 | | | | 12-1-2030 | | | | 12,110,000 | | | | 14,738,718 | | | | 0.66 | |
California Various Purposes (GO) | | | 6.00 | | | | 4-1-2038 | | | | 8,055,000 | | | | 9,663,261 | | | | 0.43 | |
Deutsche Bank SPEARs/LIFERs Trust Series DBE 1377 (GO, AGM/FGIC Insured, Deutsche Bank LIQ) ±144A | | | 0.22 | | | | 8-1-2033 | | | | 10,000,000 | | | | 10,000,000 | | | | 0.44 | |
Northern California Gas Authority #1 LIBOR
Series B (Utilities Revenue) ± | | | 0.88 | | | | 7-1-2027 | | | | 11,000,000 | | | | 10,108,890 | | | | 0.45 | |
University of California Limited Project Series G (Health Revenue) | | | 5.25 | | | | 5-15-2030 | | | | 15,000,000 | | | | 17,923,050 | | | | 0.80 | |
University of California Series G (Education Revenue) | | | 5.00 | | | | 5-15-2037 | | | | 10,390,000 | | | | 11,732,908 | | | | 0.52 | |
Other securities | | | | | | | | | | | | | | | 158,561,065 | | | | 7.04 | |
| | | | | |
| | | | | | | | | | | | | | | 263,559,453 | | | | 11.71 | |
| | | | | | | | | | | | | | | | | | | | |
| | | | | |
| Colorado: 0.34% | | | | | | | | | | | | | | | | | | | | |
Other securities | | | | | | | | | | | | | | | 7,582,727 | | | | 0.34 | |
| | | | | | | | | | | | | | | | | | | | |
| | | | | |
| Connecticut: 1.15% | | | | | | | | | | | | | | | | | | | | |
Other securities | | | | | | | | | | | | | | | 25,901,295 | | | | 1.15 | |
| | | | | | | | | | | | | | | | | | | | |
| | | | | |
| District of Columbia: 0.65% | | | | | | | | | | | | | | | | | | | | |
Other securities | | | | | | | | | | | | | | | 14,735,285 | | | | 0.65 | |
| | | | | | | | | | | | | | | | | | | | |
The accompanying notes are an integral part of these financial statements.
| | | | |
| 8 | | Wells Fargo Advantage Intermediate Tax/AMT-Free Fund | | Summary portfolio of investments—December 31, 2014 (unaudited) |
| | | | | | | | | | | | | | | | | | | | |
| Security name | | Interest rate | | | Maturity date | | | Principal | | | Value | | | Percent of
net assets | |
| | | | | |
| Florida: 4.16% | | | | | | | | | | | | | | | | | | | | |
Palm Beach County FL PFOTER Series 4615 (Miscellaneous Revenue, Dexia Credit Local LIQ) ø | | | 0.31 | % | | | 8-1-2029 | | | $ | 10,000,000 | | | $ | 10,000,000 | | | | 0.44 | % |
Other securities | | | | | | | | | | | | | | | 83,660,699 | | | | 3.72 | |
| | | | | |
| | | | | | | | | | | | | | | 93,660,699 | | | | 4.16 | |
| | | | | | | | | | | | | | | | | | | | |
| | | | | |
| Georgia: 0.60% | | | | | | | | | | | | | | | | | | | | |
Other securities | | | | | | | | | | | | | | | 13,540,572 | | | | 0.60 | |
| | | | | | | | | | | | | | | | | | | | |
| | | | | |
| Guam: 0.47% | | | | | | | | | | | | | | | | | | | | |
Other securities | | | | | | | | | | | | | | | 10,678,951 | | | | 0.47 | |
| | | | | | | | | | | | | | | | | | | | |
| | | | | |
| Illinois: 22.19% | | | | | | | | | | | | | | | | | | | | |
Chicago IL Board of Education (GO) µ | | | 0.00-5.25 | | | | 12-1-2021 to 12-1-2031 | | | | 26,495,000 | | | | 24,569,269 | | | | 1.08 | |
Chicago IL Board of Education CAB School Reform Series B-1 (GO, National Insured) ¤ | | | 0.00 | | | | 12-1-2022 | | | | 20,000,000 | | | | 14,701,400 | | | | 0.65 | |
Chicago IL Board of Education Series A3 (GO) ± | | | 0.87 | | | | 3-1-2036 | | | | 10,000,000 | | | | 9,718,100 | | | | 0.43 | |
Chicago IL Board of Education Series C (GO) | | | 5.25 | | | | 12-1-2023 | | | | 9,980,000 | | | | 10,689,279 | | | | 0.47 | |
Chicago IL O’Hare International Airport (Airport Revenue) | | | 4.25-5.25 | | | | 1-1-2021 to 1-1-2033 | | | | 11,755,000 | | | | 13,326,806 | | | | 0.60 | |
Chicago IL O’Hare International Airport Senior Lien (Airport Revenue) | | | 5.25 | | | | 1-1-2032 | | | | 8,755,000 | | | | 10,146,870 | | | | 0.45 | |
Chicago IL (GO) µ | | | 4.00-5.65 | | | | 1-1-2019 to 1-1-2037 | | | | 25,715,000 | | | | 26,960,841 | | | | 1.21 | |
Chicago IL Series G (GO, Ambac Insured) | | | 5.00 | | | | 12-1-2024 | | | | 16,865,000 | | | | 17,614,649 | | | | 0.78 | |
Chicago IL Water Revenue Second Lien (Water & Sewer Revenue) | | | 5.00 | | | | 11-1-2022 to 11-1-2033 | | | | 13,885,000 | | | | 15,883,480 | | | | 0.70 | |
Chicago IL Water Revenue Second Lien Series A (Water & Sewer Revenue, Ambac Insured) | | | 5.00 | | | | 11-1-2032 | | | | 10,000,000 | | | | 10,561,500 | | | | 0.47 | |
Deutsche Bank SPEARs/LIFERs Trust Series DBE 1360 (GO, AGM Insured, Deutsche Bank LIQ) ø144A | | | 0.16 | | | | 2-1-2039 | | | | 15,995,000 | | | | 15,995,000 | | | | 0.71 | |
Illinois (Various Revenue) µ | | | 4.75-5.50 | | | | 9-1-2016 to 7-1-2026 | | | | 29,250,000 | | | | 32,250,744 | | | | 1.44 | |
Illinois (Tax Revenue) | | | 5.00 | | | | 6-15-2023 | | | | 16,050,000 | | | | 19,312,965 | | | | 0.86 | |
Illinois Regional Transportation Authority (Tax Revenue, National/FHA Insured) | | | 6.50 | | | | 7-1-2026 | | | | 7,815,000 | | | | 10,463,347 | | | | 0.46 | |
Illinois Toll Highway Authority (Transportation Revenue) µ | | | 5.00-5.25 | | | | 1-1-2024 to 1-1-2026 | | | | 8,150,000 | | | | 8,961,626 | | | | 0.40 | |
Illinois Toll Highway Authority Series A2 (Transportation Revenue, AGM Insured, Bank of America NA SPA) ø | | | 0.07 | | | | 1-1-2031 | | | | 34,385,000 | | | | 34,385,000 | | | | 1.53 | |
Metropolitan Pier & Exposition Authority Illinois Hospitality Facilities PFOTER Series 3554 (Miscellaneous Revenue, Dexia Credit Local LIQ) ø144A | | | 0.13 | | | | 7-1-2026 | | | | 12,890,000 | | | | 12,890,000 | | | | 0.57 | |
University of Illinois Utility Infrastructure Projects Series 2004 (Education Revenue, Bank of New York Mellon SPA) ø | | | 0.08 | | | | 8-15-2021 | | | | 13,775,000 | | | | 13,775,000 | | | | 0.61 | |
Other securities | | | | | | | | | | | | | | | 197,297,408 | | | | 8.77 | |
| | | | | |
| | | | | | | | | | | | | | | 499,503,284 | | | | 22.19 | |
| | | | | | | | | | | | | | | | | | | | |
| | | | | |
| Indiana: 2.08% | | | | | | | | | | | | | | | | | | | | |
Indiana HEFA Ascension Health Series B3 (Health Revenue) ± | | | 1.91 | | | | 11-15-2031 | | | | 15,000,000 | | | | 15,081,900 | | | | 0.67 | |
Other securities | | | | | | | | | | | | | | | 31,830,590 | | | | 1.41 | |
| | | | | |
| | | | | | | | | | | | | | | 46,912,490 | | | | 2.08 | |
| | | | | | | | | | | | | | | | | | | | |
The accompanying notes are an integral part of these financial statements.
| | | | | | |
| Summary portfolio of investments—December 31, 2014 (unaudited) | | Wells Fargo Advantage Intermediate Tax/AMT-Free Fund | | | 9 | |
| | | | | | | | | | | | | | | | | | | | |
| Security name | | Interest rate | | | Maturity date | | | Principal | | | Value | | | Percent of
net assets | |
| | | | | |
| Iowa: 0.41% | | | | | | | | | | | | | | | | | | | | |
Other securities | | | | | | | | | | | | | | $ | 9,292,059 | | | | 0.41 | % |
| | | | | | | | | | | | | | | | | | | | |
| | | | | |
| Kansas: 0.07% | | | | | | | | | | | | | | | | | | | | |
Other securities | | | | | | | | | | | | | | | 1,488,019 | | | | 0.07 | |
| | | | | | | | | | | | | | | | | | | | |
| | | | | |
| Kentucky: 0.86% | | | | | | | | | | | | | | | | | | | | |
Other securities | | | | | | | | | | | | | | | 19,469,373 | | | | 0.86 | |
| | | | | | | | | | | | | | | | | | | | |
| | | | | |
| Louisiana: 1.43% | | | | | | | | | | | | | | | | | | | | |
Other securities | | | | | | | | | | | | | | | 32,079,870 | | | | 1.43 | |
| | | | | | | | | | | | | | | | | | | | |
| | | | | |
| Maryland: 0.10% | | | | | | | | | | | | | | | | | | | | |
Other securities | | | | | | | | | | | | | | | 2,152,449 | | | | 0.10 | |
| | | | | | | | | | | | | | | | | | | | |
| | | | | |
| Massachusetts: 2.15% | | | | | | | | | | | | | | | | | | | | |
Massachusetts HEFA Various Partners Healthcare Series G-6 (Health Revenue) ± | | | 0.92 | % | | | 7-1-2038 | | | $ | 14,000,000 | | | | 14,007,280 | | | | 0.62 | |
Massachusetts Water Resources Authority Series DCL 005 (Water & Sewer Revenue, Dexia Credit Local LOC, AGM Insured) ø144A | | | 0.16 | | | | 8-1-2025 | | | | 15,700,000 | | | | 15,700,000 | | | | 0.70 | |
Other securities | | | | | | | | | | | | | | | 18,711,245 | | | | 0.83 | |
| | | | | |
| | | | | | | | | | | | | | | 48,418,525 | | | | 2.15 | |
| | | | | | | | | | | | | | | | | | | | |
| | | | | |
| Michigan: 5.55% | | | | | | | | | | | | | | | | | | | | |
Detroit MI City School District PFOTER-3556 (GO, FGIC/Qualified School Board Loan Fund Insured, Dexia Credit Local LIQ) ø144A | | | 0.48 | | | | 5-1-2025 | | | | 13,195,000 | | | | 13,195,000 | | | | 0.59 | |
Michigan Finance Authority Local Government Loan Program (Water & Sewer Revenue) | | | 5.00 | | | | 7-1-2030 | | | | 12,000,000 | | | | 13,321,200 | | | | 0.59 | |
Michigan PFOTER Series 4711 (GO, AGM/Qualified School Board Loan Fund Insured, Dexia Credit Local LIQ) ø144A | | | 0.48 | | | | 5-1-2029 | | | | 9,910,000 | | | | 9,910,000 | | | | 0.44 | |
Other securities | | | | | | | | | | | | | | | 88,507,403 | | | | 3.93 | |
| | | | | |
| | | | | | | | | | | | | | | 124,933,603 | | | | 5.55 | |
| | | | | | | | | | | | | | | | | | | | |
| | | | | |
| Minnesota: 0.96% | | | | | | | | | | | | | | | | | | | | |
Minnesota HEFAR Carleton College Series 5G (Education Revenue, JPMorgan Chase & Company SPA) ø | | | 0.07 | | | | 11-1-2029 | | | | 10,000,000 | | | | 10,000,000 | | | | 0.45 | |
Other securities | | | | | | | | | | | | | | | 11,674,459 | | | | 0.51 | |
| | | | | |
| | | | | | | | | | | | | | | 21,674,459 | | | | 0.96 | |
| | | | | | | | | | | | | | | | | | | | |
| | | | | |
| Mississippi: 0.58% | | | | | | | | | | | | | | | | | | | | |
Mississippi Development Bank Special Obligation Jackson Water & Sewer System Project Series A (Water & Sewer Revenue, AGM Insured) | | | 5.00 | | | | 9-1-2030 | | | | 10,000,000 | | | | 11,493,200 | | | | 0.51 | |
Other securities | | | | | | | | | | | | | | | 1,476,821 | | | | 0.07 | |
| | | | | |
| | | | | | | | | | | | | | | 12,970,021 | | | | 0.58 | |
| | | | | | | | | | | | | | | | | | | | |
| | | | | |
| Missouri: 0.49% | | | | | | | | | | | | | | | | | | | | |
Other securities | | | | | | | | | | | | | | | 11,100,320 | | | | 0.49 | |
| | | | | | | | | | | | | | | | | | | | |
| | | | | |
| Nebraska: 0.14% | | | | | | | | | | | | | | | | | | | | |
Other securities | | | | | | | | | | | | | | | 3,137,664 | | | | 0.14 | |
| | | | | | | | | | | | | | | | | | | | |
The accompanying notes are an integral part of these financial statements.
| | | | |
| 10 | | Wells Fargo Advantage Intermediate Tax/AMT-Free Fund | | Summary portfolio of investments—December 31, 2014 (unaudited) |
| | | | | | | | | | | | | | | | | | | | |
| Security name | | Interest rate | | | Maturity date | | | Principal | | | Value | | | Percent of
net assets | |
| | | | | |
| Nevada: 1.32% | | | | | | | | | | | | | | | | | | | | |
Other securities | | | | | | | | | | | | | | $ | 29,642,030 | | | | 1.32 | % |
| | | | | | | | | | | | | | | | | | | | |
| | | | | |
| New Hampshire: 0.12% | | | | | | | | | | | | | | | | | | | | |
Other securities | | | | | | | | | | | | | | | 2,703,398 | | | | 0.12 | |
| | | | | | | | | | | | | | | | | | | | |
| | | | | |
| New Jersey: 3.47% | | | | | | | | | | | | | | | | | | | | |
New Jersey EDA School Facilities Construction Project Series I (Miscellaneous Revenue) ± | | | 1.64 | % | | | 3-1-2028 | | | $ | 15,000,000 | | | | 14,965,950 | | | | 0.66 | |
New Jersey HEFAR Series A (Education Revenue) | | | 5.00 | | | | 6-1-2019 | | | | 9,810,000 | | | | 10,959,830 | | | | 0.49 | |
New Jersey TTFA (Various Revenue) µ | | | 5.00-5.50 | | | | 12-15-2020 to 6-15-2032 | | | | 14,805,000 | | | | 17,117,602 | | | | 0.76 | |
New Jersey TTFA Series A (Transportation Revenue, AGM Insured) | | | 5.50 | | | | 12-15-2022 | | | | 8,010,000 | | | | 9,603,429 | | | | 0.43 | |
Other securities | | | | | | | | | | | | | | | 25,421,031 | | | | 1.13 | |
| | | | | |
| | | | | | | | | | | | | | | 78,067,842 | | | | 3.47 | |
| | | | | | | | | | | | | | | | | | | | |
| | | | | |
| New Mexico: 0.37% | | | | | | | | | | | | | | | | | | | | |
Other securities | | | | | | | | | | | | | | | 8,413,768 | | | | 0.37 | |
| | | | | | | | | | | | | | | | | | | | |
| | | | | |
| New York: 9.37% | | | | | | | | | | | | | | | | | | | | |
Deutsche Bank SPEARs/LIFERs Trust Series DBE 1177 (Transportation Revenue, Deutsche Bank LIQ) ø144A | | | 0.20 | | | | 11-15-2038 | | | | 11,250,000 | | | | 11,250,000 | | | | 0.50 | |
New York Dormitory Authority Series C (Tax Revenue) | | | 5.00 | | | | 3-15-2036 | | | | 8,650,000 | | | | 10,047,321 | | | | 0.45 | |
New York NY Adjusted Fiscal 2008 Sub Series J5 (GO, Dexia Credit Local SPA) ø | | | 0.16 | | | | 8-1-2028 | | | | 10,000,000 | | | | 10,000,000 | | | | 0.44 | |
New York NY Municipal Water Finance Authority Series AA3 (Water & Sewer Revenue, Dexia Credit Local SPA) ø | | | 0.16 | | | | 6-15-2032 | | | | 15,000,000 | | | | 15,000,000 | | | | 0.67 | |
New York NY Sub Series J-4 (GO) ± | | | 0.59 | | | | 8-1-2025 | | | | 10,000,000 | | | | 9,991,200 | | | | 0.44 | |
New York Urban Development Corporation Certificate of Participation James A. Farley Post Office Building Refinancing (Miscellaneous Revenue) | | | 4.00 | | | | 2-1-2015 | | | | 9,960,000 | | | | 9,970,060 | | | | 0.44 | |
Port Authority New York & New Jersey (Airport Revenue) | | | 5.00 | | | | 12-1-2020 to 9-1-2031 | | | | 6,645,000 | | | | 7,725,458 | | | | 0.35 | |
Port Authority New York & New Jersey Series 184 (Airport Revenue) | | | 5.00 | | | | 9-1-2032 | | | | 11,000,000 | | | | 13,098,250 | | | | 0.58 | |
Port Authority New York & New Jersey Special Obligation (Airport Revenue) | | | 5.00 | | | | 9-1-2039 | | | | 25,040,000 | | | | 29,191,382 | | | | 1.30 | |
Other securities | | | | | | | | | | | | | | | 94,590,649 | | | | 4.20 | |
| | | | | |
| | | | | | | | | | | | | | | 210,864,320 | | | | 9.37 | |
| | | | | | | | | | | | | | | | | | | | |
| | | | | |
| North Carolina: 1.54% | | | | | | | | | | | | | | | | | | | | |
North Carolina Medical Care Commission Healthcare Facilities Series A (Health Revenue, JPMorgan Chase & Company SPA) ø | | | 0.06 | | | | 11-1-2034 | | | | 21,350,000 | | | | 21,350,000 | | | | 0.95 | |
Other securities | | | | | | | | | | | | | | | 13,404,005 | | | | 0.59 | |
| | | | | |
| | | | | | | | | | | | | | | 34,754,005 | | | | 1.54 | |
| | | | | | | | | | | | | | | | | | | | |
| | | | | |
| North Dakota: 0.05% | | | | | | | | | | | | | | | | | | | | |
Other securities | | | | | | | | | | | | | | | 1,083,519 | | | | 0.05 | |
| | | | | | | | | | | | | | | | | | | | |
The accompanying notes are an integral part of these financial statements.
| | | | | | |
| Summary portfolio of investments—December 31, 2014 (unaudited) | | Wells Fargo Advantage Intermediate Tax/AMT-Free Fund | | | 11 | |
| | | | | | | | | | | | | | | | | | | | |
| Security name | | Interest rate | | | Maturity date | | | Principal | | | Value | | | Percent of
net assets | |
| | | | | |
| Ohio: 2.02% | | | | | | | | | | | | | | | | | | | | |
Montgomery County OH Catholic Health Refunding Bond Series B-2 (Health Revenue, U.S. Bank NA SPA) ø | | | 0.10 | % | | | 3-1-2027 | | | $ | 10,000,000 | | | $ | 10,000,000 | | | | 0.44 | % |
Other securities | | | | | | | | | | | | | | | 35,437,493 | | | | 1.58 | |
| | | | | |
| | | | | | | | | | | | | | | 45,437,493 | | | | 2.02 | |
| | | | | | | | | | | | | | | | | | | | |
| | | | | |
| Oklahoma: 0.71% | | | | | | | | | | | | | | | | | | | | |
Other securities | | | | | | | | | | | | | | | 15,974,400 | | | | 0.71 | |
| | | | | | | | | | | | | | | | | | | | |
| | | | | |
| Oregon: 0.06% | | | | | | | | | | | | | | | | | | | | |
Other securities | | | | | | | | | | | | | | | 1,320,846 | | | | 0.06 | |
| | | | | | | | | | | | | | | | | | | | |
| | | | | |
| Pennsylvania: 5.79% | | | | | | | | | | | | | | | | | | | | |
Berks County PA Municipal Authority Reading Hospital & Medical Center Project Series B (Health Revenue) | | | 1.54 | | | | 11-1-2039 | | | | 10,000,000 | | | | 10,256,600 | | | | 0.46 | |
Other securities | | | | | | | | | | | | | | | 120,024,234 | | | | 5.33 | |
| | | | | |
| | | | | | | | | | | | | | | 130,280,834 | | | | 5.79 | |
| | | | | | | | | | | | | | | | | | | | |
| | | | | |
| Puerto Rico: 0.05% | | | | | | | | | | | | | | | | | | | | |
Other securities | | | | | | | | | | | | | | | 1,039,928 | | | | 0.05 | |
| | | | | | | | | | | | | | | | | | | | |
| | | | | |
| Rhode Island: 0.43% | | | | | | | | | | | | | | | | | | | | |
Other securities | | | | | | | | | | | | | | | 9,758,182 | | | | 0.43 | |
| | | | | | | | | | | | | | | | | | | | |
| | | | | |
| South Carolina: 0.37% | | | | | | | | | | | | | | | | | | | | |
Other securities | | | | | | | | | | | | | | | 8,301,973 | | | | 0.37 | |
| | | | | | | | | | | | | | | | | | | | |
| | | | | |
| South Dakota: 0.05% | | | | | | | | | | | | | | | | | | | | |
Other securities | | | | | | | | | | | | | | | 1,022,037 | | | | 0.05 | |
| | | | | | | | | | | | | | | | | | | | |
| | | | | |
| Tennessee: 1.96% | | | | | | | | | | | | | | | | | | | | |
Shelby County TN Health Educational & Housing Facilities Board Methodist Le Bonheur Series B (Health Revenue, AGM Insured, U.S. Bank NA SPA) ø | | | 0.05 | | | | 6-1-2042 | | | | 20,150,000 | | | | 20,150,000 | | | | 0.90 | |
Other securities | | | | | | | | | | | | | | | 23,869,073 | | | | 1.06 | |
| | | | | |
| | | | | | | | | | | | | | | 44,019,073 | | | | 1.96 | |
| | | | | | | | | | | | | | | | | | | | |
| | | | | |
| Texas: 6.00% | | | | | | | | | | | | | | | | | | | | |
North Texas Higher Education Authority Incoming Student Loan Series A-2 (Education Revenue) ± | | | 1.14 | | | | 7-1-2030 | | | | 9,880,000 | | | | 9,895,709 | | | | 0.44 | |
Port Arthur TX Navigation District Jefferson County Environmental Facilities Motiva Enterprises LLC Project Series A (Resource Recovery Revenue) ø | | | 0.20 | | | | 12-1-2039 | | | | 19,000,000 | | | | 19,000,000 | | | | 0.84 | |
Tarrant County TX Cultural Education Facilities Finance Corporation Texas Health Resources Series C (Health Revenue, JPMorgan Chase & Company SPA) ø | | | 0.14 | | | | 11-15-2033 | | | | 10,000,000 | | | | 10,000,000 | | | | 0.44 | |
Texas Municipal Gas Acquisition & Supply Corporation (Utilities Revenue) µ | | | 0.50-5.00 | | | | 9-15-2017 to 12-15-2023 | | | | 24,945,000 | | | | 28,032,148 | | | | 1.24 | |
The accompanying notes are an integral part of these financial statements.
| | | | |
| 12 | | Wells Fargo Advantage Intermediate Tax/AMT-Free Fund | | Summary portfolio of investments—December 31, 2014 (unaudited) |
| | | | | | | | | | | | | | | | | | | | |
| Security name | | Interest rate | | | Maturity date | | | Principal | | | Value | | | Percent of
net assets | |
| | | | | |
| Texas (continued) | | | | | | | | | | | | | | | | | | | | |
Other securities | | | | | | | | | | | | | | $ | 68,129,399 | | | | 3.04 | % |
| | | | | |
| | | | | | | | | | | | | | | 135,057,256 | | | | 6.00 | |
| | | | | | | | | | | | | | | | | | | | |
| | | | | |
| Utah: 0.02% | | | | | | | | | | | | | | | | | | | | |
Other securities | | | | | | | | | | | | | | | 442,444 | | | | 0.02 | |
| | | | | | | | | | | | | | | | | | | | |
| | | | | |
| Virgin Islands: 0.39% | | | | | | | | | | | | | | | | | | | | |
Other securities | | | | | | | | | | | | | | | 8,790,190 | | | | 0.39 | |
| | | | | | | | | | | | | | | | | | | | |
| | | | | |
| Virginia: 1.30% | | | | | | | | | | | | | | | | | | | | |
Virginia Public Building Authority Series C (Miscellaneous Revenue) | | | 4.00 | % | | | 8-1-2025 | | | $ | 20,255,000 | | | | 23,005,200 | | | | 1.02 | |
Other securities | | | | | | | | | | | | | | | 6,273,405 | | | | 0.28 | |
| | | | | |
| | | | | | | | | | | | | | | 29,278,605 | | | | 1.30 | |
| | | | | | | | | | | | | | | | | | | | |
| | | | | |
| Washington: 1.05% | | | | | | | | | | | | | | | | | | | | |
Other securities | | | | | | | | | | | | | | | 23,738,025 | | | | 1.05 | |
| | | | | | | | | | | | | | | | | | | | |
| | | | | |
| West Virginia: 0.05% | | | | | | | | | | | | | | | | | | | | |
Other securities | | | | | | | | | | | | | | | 1,236,543 | | | | 0.05 | |
| | | | | | | | | | | | | | | | | | | | |
| | | | | |
| Wisconsin: 0.77% | | | | | | | | | | | | | | | | | | | | |
Other securities | | | | | | | | | | | | | | | 17,281,666 | | | | 0.77 | |
| | | | | | | | | | | | | | | | | | | | |
| | | | | |
Total Municipal Obligations (Cost $2,109,122,269) | | | | | | | | | | | | | | | 2,209,000,359 | | | | 98.15 | |
| | | | | | | | | | | | | | | | | | | | |
| | | | | |
| | | Yield | | | | | | Shares | | | | | | | |
| Short-Term Investments: 1.11% | | | | | | | | | | | | | | | | | | | | |
| | | | | |
| Investment Companies: 1.10% | | | | | | | | | | | | | | | | | | | | |
Wells Fargo Advantage National Tax-Free Money Market Fund, Institutional Class (l)(u)## | | | 0.01 | | | | | | | | 24,714,237 | | | | 24,714,237 | | | | 1.10 | |
| | | | | | | | | | | | | | | | | | | | |
| | | | | |
| | | | | | | | | Principal | | | | | | | |
| U.S. Treasury Securities: 0.01% | | | | | | | | | | | | | | | | | | | | |
U.S. Treasury Bill (z)# | | | 0.02 | | | | 3-19-2015 | | | $ | 275,000 | | | | 274,990 | | | | 0.01 | |
| | | | | | | | | | | | | | | | | | | | |
| | | | | |
Total Short-Term Investments (Cost $24,989,221) | | | | | | | | | | | | | | | 24,989,227 | | | | 1.11 | |
| | | | | | | | | | | | | | | | | | | | |
| | | | | |
| Total investments in securities (Cost $2,134,111,490) * | | | | | | | | | | | | | | | 2,233,989,586 | | | | 99.26 | |
Other assets and liabilities, net | | | | | | | | | | | | | | | 16,669,587 | | | | 0.74 | |
| | | | | | | | | | | | | | | | | | | | |
| Total net assets | | | | | | | | | | | | | | $ | 2,250,659,173 | | | | 100.00 | % |
| | | | | | | | | | | | | | | | | | | | |
The accompanying notes are an integral part of these financial statements.
| | | | | | |
| Summary portfolio of investments—December 31, 2014 (unaudited) | | Wells Fargo Advantage Intermediate Tax/AMT-Free Fund | | | 13 | |
| ø | Variable rate demand notes are subject to a demand feature which reduces the effective maturity. The maturity date shown represents the final maturity date of the security. The interest rate is determined and reset by the issuer daily, weekly, or monthly depending upon the terms of the security. The rate shown is the rate in effect at period end. |
| ± | Variable rate investment. The rate shown is the rate in effect at period end. |
| µ | All or some of these obligations have credit enhancements or liquidity features that may, under certain circumstances, provide for repayment of principal and interest. |
| 144A | The security may be resold in transactions exempt from registration, normally to qualified institutional buyers, pursuant to Rule 144A under the Securities Act of 1933. |
| ¤ | The security is issued in zero coupon form with no periodic interest payments. |
| (l) | The security represents an affiliate of the Fund as defined in the Investment Company Act of 1940. |
| (u) | The rate represents the 7-day annualized yield at period end. |
| ## | All or a portion of this security is segregated for when-issued securities. |
| (z) | Zero coupon security. The rate represents the current yield to maturity. |
| # | All or a portion of this security is segregated as collateral for investments in derivative instruments. |
| * | Cost for federal income tax purposes is $2,134,108,781 and unrealized gains (losses) consists of: |
| | | | |
Gross unrealized gains | | $ | 101,774,065 | |
Gross unrealized losses | | | (1,893,260 | ) |
| | | | |
Net unrealized gains | | $ | 99,880,805 | |
The accompanying notes are an integral part of these financial statements.
| | | | |
| 14 | | Wells Fargo Advantage Intermediate Tax/AMT-Free Fund | | Statement of assets and liabilities—December 31, 2014 (unaudited) |
| | | | |
| | | | |
| |
Assets | | | | |
Investments | | | | |
In unaffiliated securities, at value (cost $2,109,397,253) | | $ | 2,209,275,349 | |
In affiliated securities, at value (cost $24,714,237) | | | 24,714,237 | |
| | | | |
Total investments, at value (cost $2,134,111,490) | | | 2,233,989,586 | |
Cash | | | 150,000 | |
Receivable for investments sold | | | 955,385 | |
Receivable for Fund shares sold | | | 9,295,427 | |
Receivable for interest | | | 19,721,316 | |
Prepaid expenses and other assets | | | 94,574 | |
| | | | |
Total assets | | | 2,264,206,288 | |
| | | | |
| |
Liabilities | | | | |
Dividends payable | | | 947,669 | |
Payable for investments purchased | | | 7,712,423 | |
Payable for Fund shares redeemed | | | 3,659,613 | |
Payable for daily variation margin on open futures contracts | | | 48,125 | |
Advisory fee payable | | | 436,666 | |
Distribution fee payable | | | 37,969 | |
Administration fees payable | | | 327,804 | |
Accrued expenses and other liabilities | | | 376,846 | |
| | | | |
Total liabilities | | | 13,547,115 | |
| | | | |
Total net assets | | $ | 2,250,659,173 | |
| | | | |
| |
NET ASSETS CONSIST OF | | | | |
Paid-in capital | | $ | 2,145,385,764 | |
Overdistributed net investment income | | | (54,778 | ) |
Accumulated net realized gains on investments | | | 5,696,290 | |
Net unrealized gains on investments | | | 99,631,897 | |
| | | | |
Total net assets | | $ | 2,250,659,173 | |
| | | | |
| |
COMPUTATION OF NET ASSET VALUE AND OFFERING PRICE PER SHARE | | | | |
Net assets – Class A | | $ | 215,436,229 | |
Shares outstanding – Class A1 | | | 18,462,417 | |
Net asset value per share – Class A | | | $11.67 | |
Maximum offering price per share – Class A2 | | | $12.03 | |
Net assets – Class C | | $ | 58,322,935 | |
Shares outstanding – Class C1 | | | 4,998,150 | |
Net asset value per share – Class C | | | $11.67 | |
Net assets – Administrator Class | | $ | 737,917,396 | |
Shares outstanding – Administrator Class1 | | | 63,200,641 | |
Net asset value per share – Administrator Class | | | $11.68 | |
Net assets – Institutional Class | | $ | 793,655,729 | |
Shares outstanding – Institutional Class1 | | | 67,925,291 | |
Net asset value per share – Institutional Class | | | $11.68 | |
Net assets – Investor Class | | $ | 445,326,884 | |
Shares outstanding – Investor Class1 | | | 38,180,988 | |
Net asset value per share – Investor Class | | | $11.66 | |
| 1. | The Fund has an unlimited number of authorized shares. |
| 2. | Maximum offering price is computed as 100/97.00 of net asset value. On investments of $50,000 or more, the offering price is reduced. |
The accompanying notes are an integral part of these financial statements.
| | | | | | |
| Statement of operations—six months ended December 31, 2014 (unaudited) | | Wells Fargo Advantage Intermediate Tax/AMT-Free Fund | | | 15 | |
| | | | |
| | | | |
| |
Investment income | | | | |
Interest | | $ | 31,379,796 | |
Income from affiliated securities | | | 11,377 | |
| | | | |
Total investment income | | | 31,391,173 | |
| | | | |
| |
Expenses | | | | |
Advisory fee | | | 3,425,555 | |
Administration fees | | | | |
Fund level | | | 539,248 | |
Class A | | | 175,011 | |
Class C | | | 46,293 | |
Administrator Class | | | 355,743 | |
Institutional Class | | | 288,829 | |
Investor Class | | | 424,462 | |
Shareholder servicing fees | | | | |
Class A | | | 273,455 | |
Class C | | | 72,333 | |
Administrator Class | | | 889,358 | |
Investor Class | | | 558,011 | |
Distribution fee | | | | |
Class C | | | 216,999 | |
Custody and accounting fees | | | 54,968 | |
Professional fees | | | 27,156 | |
Registration fees | | | 68,800 | |
Shareholder report expenses | | | 44,672 | |
Trustees’ fees and expenses | | | 6,619 | |
Other fees and expenses | | | 25,390 | |
| | | | |
Total expenses | | | 7,492,902 | |
Less: Fee waivers and/or expense reimbursements | | | (1,026,060 | ) |
| | | | |
Net expenses | | | 6,466,842 | |
| | | | |
Net investment income | | | 24,924,331 | |
| | | | |
| |
REALIZED AND UNREALIZED GAINS (LOSSES) ON INVESTMENTS | | | | |
| |
Net realized gains on: | | | | |
Unaffiliated securities | | | 12,125,519 | |
Futures transactions | | | 149,477 | |
| | | | |
Net realized gains on investments | | | 12,274,996 | |
| | | | |
| |
Net change in unrealized gains (losses) on: | | | | |
Unaffiliated securities | | | 13,284,660 | |
Futures transactions | | | (246,199 | ) |
| | | | |
Net change in unrealized gains (losses) on investments | | | 13,038,461 | |
| | | | |
Net realized and unrealized gains (losses) on investments | | | 25,313,457 | |
| | | | |
Net increase in net assets resulting from operations | | $ | 50,237,788 | |
| | | | |
The accompanying notes are an integral part of these financial statements.
| | | | |
| 16 | | Wells Fargo Advantage Intermediate Tax/AMT-Free Fund | | Statement of changes in net assets |
| | | | | | | | | | | | | | | | |
| | | Six months ended December 31, 2014 (unaudited) | | | Year ended June 30, 2014 | |
| | | | |
Operations | | | | | | | | | | | | | | | | |
Net investment income | | | | | | $ | 24,924,331 | | | | | | | $ | 52,935,966 | |
Net realized gains (losses) on investments | | | | | | | 12,274,996 | | | | | | | | (6,566,459 | ) |
Net change in unrealized gains (losses) on investments | | | | | | | 13,038,461 | | | | | | | | 57,189,271 | |
| | | | |
Net increase in net assets resulting from operations | | | | | | | 50,237,788 | | | | | | | | 103,558,778 | |
| | | | |
| | | | |
Distributions to shareholders from | | | | | | | | | | | | | | | | |
Net investment income | | | | | | | | | | | | | | | | |
Class A | | | | | | | (2,417,005 | ) | | | | | | | (6,806,683 | ) |
Class C | | | | | | | (422,878 | ) | | | | | | | (1,167,688 | ) |
Administrator Class | | | | | | | (8,213,984 | ) | | | | | | | (17,700,151 | ) |
Institutional Class | | | | | | | (9,003,070 | ) | | | | | | | (15,249,029 | ) |
Investor Class | | | | | | | (4,868,231 | ) | | | | | | | (12,014,191 | ) |
Net realized gains | | | | | | | | | | | | | | | | |
Class A | | | | | | | 0 | | | | | | | | (1,658,020 | ) |
Class C | | | | | | | 0 | | | | | | | | (385,963 | ) |
Administrator Class | | | | | | | 0 | | | | | | | | (4,201,690 | ) |
Institutional Class | | | | | | | 0 | | | | | | | | (3,100,604 | ) |
Investor Class | | | | | | | 0 | | | | | | | | (2,907,199 | ) |
| | | | |
Total distributions to shareholders | | | | | | | (24,925,168 | ) | | | | | | | (65,191,218 | ) |
| | | | |
| | | | |
Capital share transactions | | | Shares | | | | | | | | Shares | | | | | |
Proceeds from shares sold | | | | | | | | | | | | | | | | |
Class A | | | 2,529,096 | | | | 29,369,837 | | | | 8,123,203 | | | | 91,733,863 | |
Class C | | | 480,572 | | | | 5,588,256 | | | | 739,086 | | | | 8,370,039 | |
Administrator Class | | | 10,000,715 | | | | 116,161,461 | | | | 30,944,915 | | | | 348,684,118 | |
Institutional Class | | | 23,595,976 | | | | 273,924,829 | | | | 32,614,191 | | | | 368,486,884 | |
Investor Class | | | 3,538,001 | | | | 41,045,224 | | | | 9,497,829 | | | | 107,209,534 | |
| | | | |
| | | | | | | 466,089,607 | | | | | | | | 924,484,438 | |
| | | | |
Reinvestment of distributions | | | | | | | | | | | | | | | | |
Class A | | | 195,152 | | | | 2,267,634 | | | | 718,688 | | | | 8,105,839 | |
Class C | | | 31,618 | | | | 367,467 | | | | 121,913 | | | | 1,373,072 | |
Administrator Class | | | 659,278 | | | | 7,668,790 | | | | 1,837,811 | | | | 20,742,708 | |
Institutional Class | | | 425,759 | | | | 4,956,984 | | | | 602,370 | | | | 6,826,959 | |
Investor Class | | | 409,109 | | | | 4,752,764 | | | | 1,279,933 | | | | 14,431,623 | |
| | | | |
| | | | | | | 20,013,639 | | | | | | | | 51,480,201 | |
| | | | |
Payment for shares redeemed | | | | | | | | | | | | | | | | |
Class A | | | (7,226,669 | ) | | | (83,388,985 | ) | | | (11,511,229 | ) | | | (129,437,057 | ) |
Class C | | | (507,784 | ) | | | (5,891,627 | ) | | | (2,242,496 | ) | | | (25,241,602 | ) |
Administrator Class | | | (5,404,492 | ) | | | (62,796,111 | ) | | | (29,767,171 | ) | | | (335,954,909 | ) |
Institutional Class | | | (8,038,939 | ) | | | (93,557,745 | ) | | | (22,016,202 | ) | | | (249,004,231 | ) |
Investor Class | | | (4,850,633 | ) | | | (56,161,513 | ) | | | (18,219,592 | ) | | | (204,713,096 | ) |
| | | | |
| | | | | | | (301,795,981 | ) | | | | | | | (944,350,895 | ) |
| | | | |
Net increase in net assets resulting from capital share transactions | | | | | | | 184,307,265 | | | | | | | | 31,613,744 | |
| | | | |
Total increase in net assets | | | | | | | 209,619,885 | | | | | | | | 69,981,304 | |
| | | | |
| | | | |
Net assets | | | | | | | | | | | | | | | | |
Beginning of period | | | | | | | 2,041,039,288 | | | | | | | | 1,971,057,984 | |
| | | | |
End of period | | | | | | $ | 2,250,659,173 | | | | | | | $ | 2,041,039,288 | |
| | | | |
Overdistributed net investment income | | | | | | $ | (54,778 | ) | | | | | | $ | (53,941 | ) |
| | | | |
The accompanying notes are an integral part of these financial statements.
| | | | | | |
| Financial highlights | | Wells Fargo Advantage Intermediate Tax/AMT-Free Fund | | | 17 | |
(For a share outstanding throughout each period)
| | | | | | | | | | | | | | | | | | | | | | | | |
| | | Six months ended
December 31, 2014 (unaudited) | | | Year ended June 30 | |
| CLASS A | | | 2014 | | | 2013 | | | 2012 | | | 2011 | | | 2010 | |
Net asset value, beginning of period | | | $11.53 | | | | $11.31 | | | | $11.53 | | | | $10.94 | | | | $10.81 | | | | $10.21 | |
Net investment income | | | 0.13 | | | | 0.30 | | | | 0.28 | | | | 0.35 | | | | 0.36 | | | | 0.37 | |
Net realized and unrealized gains (losses) on investments | | | 0.14 | | | | 0.29 | | | | (0.18 | ) | | | 0.59 | | | | 0.13 | | | | 0.60 | |
| | | | | | | | | | | | | | | | | | | | | | | | |
Total from investment operations | | | 0.27 | | | | 0.59 | | | | 0.10 | | | | 0.94 | | | | 0.49 | | | | 0.97 | |
Distributions to shareholders from | | | | | | | | | | | | | | | | | | | | | | | | |
Net investment income | | | (0.13 | ) | | | (0.30 | ) | | | (0.28 | ) | | | (0.35 | ) | | | (0.36 | ) | | | (0.37 | ) |
Net realized gains | | | 0.00 | | | | (0.07 | ) | | | (0.04 | ) | | | (0.00 | )1 | | | 0.00 | | | | 0.00 | |
| | | | | | | | | | | | | | | | | | | | | | | | |
Total distributions to shareholders | | | (0.13 | ) | | | (0.37 | ) | | | (0.32 | ) | | | (0.35 | ) | | | (0.36 | ) | | | (0.37 | ) |
Net asset value, end of period | | | $11.67 | | | | $11.53 | | | | $11.31 | | | | $11.53 | | | | $10.94 | | | | $10.81 | |
Total return2 | | | 2.35 | % | | | 5.37 | % | | | 0.82 | % | | | 8.71 | % | | | 4.57 | % | | | 9.64 | % |
Ratios to average net assets (annualized) | | | | | | | | | | | | | | | | | | | | | | | | |
Gross expenses | | | 0.80 | % | | | 0.81 | % | | | 0.80 | % | | | 0.81 | % | | | 0.82 | % | | | 0.85 | % |
Net expenses | | | 0.70 | % | | | 0.70 | % | | | 0.70 | % | | | 0.70 | % | | | 0.70 | % | | | 0.70 | % |
Net investment income | | | 2.21 | % | | | 2.66 | % | | | 2.36 | % | | | 3.07 | % | | | 3.27 | % | | | 3.47 | % |
Supplemental data | | | | | | | | | | | | | | | | | | | | | | | | |
Portfolio turnover rate | | | 15 | % | | | 29 | % | | | 24 | % | | | 38 | % | | | 52 | % | | | 61 | % |
Net assets, end of period (000s omitted) | | | $215,436 | | | | $264,796 | | | | $289,931 | | | | $307,991 | | | | $239,853 | | | | $220,688 | |
| 1. | Amount is less than $0.005. |
| 2. | Total return calculations do not include any sales charges. Returns for periods of less than one year are not annualized. |
The accompanying notes are an integral part of these financial statements.
| | | | |
| 18 | | Wells Fargo Advantage Intermediate Tax/AMT-Free Fund | | Financial highlights |
(For a share outstanding throughout each period)
| | | | | | | | | | | | | | | | | | | | | | | | |
| | | Six months ended
December 31, 2014 (unaudited) | | | Year ended June 30 | |
| CLASS C | | | 2014 | | | 2013 | | | 2012 | | | 2011 | | | 2010 | |
Net asset value, beginning of period | | | $11.53 | | | | $11.31 | | | | $11.53 | | | | $10.94 | | | | $10.81 | | | | $10.21 | |
Net investment income | | | 0.09 | | | | 0.22 | | | | 0.19 | | | | 0.27 | | | | 0.28 | | | | 0.29 | |
Net realized and unrealized gains (losses) on investments | | | 0.14 | | | | 0.29 | | | | (0.18 | ) | | | 0.59 | | | | 0.13 | | | | 0.60 | |
| | | | | | | | | | | | | | | | | | | | | | | | |
Total from investment operations | | | 0.23 | | | | 0.51 | | | | 0.01 | | | | 0.86 | | | | 0.41 | | | | 0.89 | |
Distributions to shareholders from | | | | | | | | | | | | | | | | | | | | | | | | |
Net investment income | | | (0.09 | ) | | | (0.22 | ) | | | (0.19 | ) | | | (0.27 | ) | | | (0.28 | ) | | | (0.29 | ) |
Net realized gains | | | 0.00 | | | | (0.07 | ) | | | (0.04 | ) | | | (0.00 | )1 | | | 0.00 | | | | 0.00 | |
| | | | | | | | | | | | | | | | | | | | | | | | |
Total distributions to shareholders | | | (0.09 | ) | | | (0.29 | ) | | | (0.23 | ) | | | (0.27 | ) | | | (0.28 | ) | | | (0.29 | ) |
Net asset value, end of period | | | $11.67 | | | | $11.53 | | | | $11.31 | | | | $11.53 | | | | $10.94 | | | | $10.81 | |
Total return2 | | | 1.96 | % | | | 4.59 | % | | | 0.07 | % | | | 7.90 | % | | | 3.80 | % | | | 8.82 | % |
Ratios to average net assets (annualized) | | | | | | | | | | | | | | | | | | | | | | | | |
Gross expenses | | | 1.55 | % | | | 1.56 | % | | | 1.55 | % | | | 1.56 | % | | | 1.57 | % | | | 1.61 | % |
Net expenses | | | 1.45 | % | | | 1.45 | % | | | 1.45 | % | | | 1.45 | % | | | 1.45 | % | | | 1.45 | % |
Net investment income | | | 1.46 | % | | | 1.92 | % | | | 1.61 | % | | | 2.32 | % | | | 2.54 | % | | | 2.68 | % |
Supplemental data | | | | | | | | | | | | | | | | | | | | | | | | |
Portfolio turnover rate | | | 15 | % | | | 29 | % | | | 24 | % | | | 38 | % | | | 52 | % | | | 61 | % |
Net assets, end of period (000s omitted) | | | $58,323 | | | | $57,580 | | | | $72,106 | | | | $67,598 | | | | $50,157 | | | | $29,666 | |
| 1. | Amount is less than $0.005. |
| 2. | Total return calculations do not include any sales charges. Returns for periods of less than one year are not annualized. |
The accompanying notes are an integral part of these financial statements.
| | | | | | |
| Financial highlights | | Wells Fargo Advantage Intermediate Tax/AMT-Free Fund | | | 19 | |
(For a share outstanding throughout each period)
| | | | | | | | | | | | | | | | | | | | | | | | |
| | | Six months ended
December 31, 2014 (unaudited) | | | Year ended June 30 | |
| ADMINISTRATOR CLASS | | | 2014 | | | 2013 | | | 2012 | | | 2011 | | | 2010 | |
Net asset value, beginning of period | | | $11.54 | | | | $11.32 | | | | $11.54 | | | | $10.95 | | | | $10.82 | | | | $10.21 | |
Net investment income | | | 0.14 | | | | 0.31 | | | | 0.29 | | | | 0.36 | | | | 0.37 | | | | 0.38 | |
Net realized and unrealized gains (losses) on investments | | | 0.14 | | | | 0.29 | | | | (0.18 | ) | | | 0.59 | | | | 0.13 | | | | 0.62 | |
| | | | | | | | | | | | | | | | | | | | | | | | |
Total from investment operations | | | 0.28 | | | | 0.60 | | | | 0.11 | | | | 0.95 | | | | 0.50 | | | | 1.00 | |
Distributions to shareholders from | | | | | | | | | | | | | | | | | | | | | | | | |
Net investment income | | | (0.14 | ) | | | (0.31 | ) | | | (0.29 | ) | | | (0.36 | ) | | | (0.37 | ) | | | (0.39 | ) |
Net realized gains | | | 0.00 | | | | (0.07 | ) | | | (0.04 | ) | | | (0.00 | )1 | | | 0.00 | | | | 0.00 | |
| | | | | | | | | | | | | | | | | | | | | | | | |
Total distributions to shareholders | | | (0.14 | ) | | | (0.38 | ) | | | (0.33 | ) | | | (0.36 | ) | | | (0.37 | ) | | | (0.39 | ) |
Net asset value, end of period | | | $11.68 | | | | $11.54 | | | | $11.32 | | | | $11.54 | | | | $10.95 | | | | $10.82 | |
Total return2 | | | 2.40 | % | | | 5.47 | % | | | 0.92 | % | | | 8.81 | % | | | 4.68 | % | | | 9.85 | % |
Ratios to average net assets (annualized) | | | | | | | | | | | | | | | | | | | | | | | | |
Gross expenses | | | 0.74 | % | | | 0.75 | % | | | 0.74 | % | | | 0.75 | % | | | 0.76 | % | | | 0.77 | % |
Net expenses | | | 0.60 | % | | | 0.60 | % | | | 0.60 | % | | | 0.60 | % | | | 0.60 | % | | | 0.60 | % |
Net investment income | | | 2.31 | % | | | 2.76 | % | | | 2.46 | % | | | 3.18 | % | | | 3.39 | % | | | 3.51 | % |
Supplemental data | | | | | | | | | | | | | | | | | | | | | | | | |
Portfolio turnover rate | | | 15 | % | | | 29 | % | | | 24 | % | | | 38 | % | | | 52 | % | | | 61 | % |
Net assets, end of period (000s omitted) | | | $737,917 | | | | $668,517 | | | | $621,627 | | | | $494,528 | | | | $343,666 | | | | $139,551 | |
| 1. | Amount is less than $0.005. |
| 2. | Returns for periods of less than one year are not annualized. |
The accompanying notes are an integral part of these financial statements.
| | | | |
| 20 | | Wells Fargo Advantage Intermediate Tax/AMT-Free Fund | | Financial highlights |
(For a share outstanding throughout each period)
| | | | | | | | | | | | | | | | | | | | | | | | |
| | | Six months ended
December 31, 2014 (unaudited) | | | Year ended June 30 | |
| INSTITUTIONAL CLASS | | | 2014 | | | 2013 | | | 2012 | | | 2011 | | | 2010 | |
Net asset value, beginning of period | | | $11.55 | | | | $11.32 | | | | $11.54 | | | | $10.96 | | | | $10.82 | | | | $10.22 | |
Net investment income | | | 0.15 | | | | 0.33 | | | | 0.31 | | | | 0.38 | | | | 0.39 | | | | 0.39 | |
Net realized and unrealized gains (losses) on investments | | | 0.13 | | | | 0.30 | | | | (0.18 | ) | | | 0.58 | | | | 0.14 | | | | 0.61 | |
| | | | | | | | | | | | | | | | | | | | | | | | |
Total from investment operations | | | 0.28 | | | | 0.63 | | | | 0.13 | | | | 0.96 | | | | 0.53 | | | | 1.00 | |
Distributions to shareholders from | | | | | | | | | | | | | | | | | | | | | | | | |
Net investment income | | | (0.15 | ) | | | (0.33 | ) | | | (0.31 | ) | | | (0.38 | ) | | | (0.39 | ) | | | (0.40 | ) |
Net realized gains | | | 0.00 | | | | (0.07 | ) | | | (0.04 | ) | | | (0.00 | )1 | | | 0.00 | | | | 0.00 | |
| | | | | | | | | | | | | | | | | | | | | | | | |
Total distributions to shareholders | | | (0.15 | ) | | | (0.40 | ) | | | (0.35 | ) | | | (0.38 | ) | | | (0.39 | ) | | | (0.40 | ) |
Net asset value, end of period | | | $11.68 | | | | $11.55 | | | | $11.32 | | | | $11.54 | | | | $10.96 | | | | $10.82 | |
Total return2 | | | 2.40 | % | | | 5.75 | % | | | 1.10 | % | | | 8.91 | % | | | 4.86 | % | | | 10.05 | % |
Ratios to average net assets (annualized) | | | | | | | | | | | | | | | | | | | | | | | | |
Gross expenses | | | 0.47 | % | | | 0.48 | % | | | 0.48 | % | | | 0.49 | % | | | 0.49 | % | | | 0.51 | % |
Net expenses | | | 0.42 | % | | | 0.42 | % | | | 0.42 | % | | | 0.42 | % | | | 0.42 | % | | | 0.42 | % |
Net investment income | | | 2.49 | % | | | 2.94 | % | | | 2.65 | % | | | 3.32 | % | | | 3.55 | % | | | 3.69 | % |
Supplemental data | | | | | | | | | | | | | | | | | | | | | | | | |
Portfolio turnover rate | | | 15 | % | | | 29 | % | | | 24 | % | | | 38 | % | | | 52 | % | | | 61 | % |
Net assets, end of period (000s omitted) | | | $793,656 | | | | $599,686 | | | | $461,403 | | | | $326,772 | | | | $129,033 | | | | $109,593 | |
| 1. | Amount is less than $0.005. |
| 2. | Returns for periods of less than one year are not annualized. |
The accompanying notes are an integral part of these financial statements.
| | | | | | |
| Financial highlights | | Wells Fargo Advantage Intermediate Tax/AMT-Free Fund | | | 21 | |
(For a share outstanding throughout each period)
| | | | | | | | | | | | | | | | | | | | | | | | |
| | | Six months ended
December 31, 2014
(unaudited) | | | Year ended June 30 | |
| INVESTOR CLASS | | | 2014 | | | 2013 | | | 2012 | | | 2011 | | | 2010 | |
Net asset value, beginning of period | | | $11.53 | | | | $11.31 | | | | $11.52 | | | | $10.94 | | | | $10.81 | | | | $10.20 | |
Net investment income | | | 0.13 | | | | 0.30 | | | | 0.27 | | | | 0.35 | | | | 0.35 | | | | 0.37 | |
Net realized and unrealized gains (losses) on investments | | | 0.13 | | | | 0.29 | | | | (0.17 | ) | | | 0.58 | | | | 0.13 | | | | 0.61 | |
| | | | | | | | | | | | | | | | | | | | | | | | |
Total from investment operations | | | 0.26 | | | | 0.59 | | | | 0.10 | | | | 0.93 | | | | 0.48 | | | | 0.98 | |
Distributions to shareholders from | | | | | | | | | | | | | | | | | | | | | | | | |
Net investment income | | | (0.13 | ) | | | (0.30 | ) | | | (0.27 | ) | | | (0.35 | ) | | | (0.35 | ) | | | (0.37 | ) |
Net realized gains | | | 0.00 | | | | (0.07 | ) | | | (0.04 | ) | | | (0.00 | )1 | | | 0.00 | | | | 0.00 | |
| | | | | | | | | | | | | | | | | | | | | | | | |
Total distributions to shareholders | | | (0.13 | ) | | | (0.37 | ) | | | (0.31 | ) | | | (0.35 | ) | | | (0.35 | ) | | | (0.37 | ) |
Net asset value, end of period | | | $11.66 | | | | $11.53 | | | | $11.31 | | | | $11.52 | | | | $10.94 | | | | $10.81 | |
Total return2 | | | 2.24 | % | | | 5.34 | % | | | 0.88 | % | | | 8.58 | % | | | 4.54 | % | | | 9.70 | % |
Ratios to average net assets (annualized) | | | | | | | | | | | | | | | | | | | | | | | | |
Gross expenses | | | 0.83 | % | | | 0.84 | % | | | 0.83 | % | | | 0.84 | % | | | 0.85 | % | | | 0.91 | % |
Net expenses | | | 0.73 | % | | | 0.73 | % | �� | | 0.73 | % | | | 0.73 | % | | | 0.73 | % | | | 0.75 | % |
Net investment income | | | 2.18 | % | | | 2.63 | % | | | 2.33 | % | | | 3.06 | % | | | 3.24 | % | | | 3.44 | % |
Supplemental data | | | | | | | | | | | | | | | | | | | | | | | | |
Portfolio turnover rate | | | 15 | % | | | 29 | % | | | 24 | % | | | 38 | % | | | 52 | % | | | 61 | % |
Net assets, end of period (000s omitted) | | | $445,327 | | | | $450,460 | | | | $525,990 | | | | $425,044 | | | | $400,794 | | | | $461,890 | |
| 1. | Amount is less than $0.005. |
| 2. | Returns for periods of less than one year are not annualized. |
The accompanying notes are an integral part of these financial statements.
| | | | |
| 22 | | Wells Fargo Advantage Intermediate Tax/AMT-Free Fund | | Notes to financial statements (unaudited) |
1. ORGANIZATION
Wells Fargo Funds Trust (the “Trust”), a Delaware statutory trust organized on March 10, 1999, is an open-end management investment company registered under the Investment Company Act of 1940, as amended (the “1940 Act”). As an investment company, the Trust follows the accounting and reporting guidance in FASB Accounting Standards Codification 946. These financial statements report on the Wells Fargo Advantage Intermediate Tax/AMT-Free Fund (the “Fund”) which is a diversified series of the Trust.
2. SIGNIFICANT ACCOUNTING POLICIES
The following significant accounting policies, which are consistently followed in the preparation of the financial statements of the Fund, are in conformity with U.S. generally accepted accounting principles which require management to make estimates and assumptions that affect the reported amounts of assets and liabilities, disclosure of contingent assets and liabilities at the date of the financial statements, and the reported amounts of revenues and expenses during the reporting period. Actual results could differ from those estimates.
Securities valuation
All investments are valued each business day as of the close of regular trading on the New York Stock Exchange (generally 4 p.m. Eastern Time).
Fixed income securities acquired with maturities exceeding 60 days are valued based on evaluated bid prices provided by an independent pricing service which may utilize both transaction data and market information such as yield, quality, coupon rate, maturity, type of issue, trading characteristics and other market data. If prices are not available from the independent pricing service or prices received are deemed not representative of market value, prices will be obtained from an independent broker-dealer.
Futures that are listed on a foreign or domestic exchange or market are valued at the official closing price or, if none, the last sales price.
Short-term securities, with maturities of 60 days or less at time of purchase, generally are valued at amortized cost which approximates fair value. The amortized cost method involves valuing a security at its cost, plus accretion of discount or minus amortization of premium over the period until maturity.
Investments in registered open-end investment companies are valued at net asset value.
Investments which are not valued using any of the methods discussed above are valued at their fair value, as determined in good faith by the Board of Trustees of the Fund. The Board of Trustees has established a Valuation Committee comprised of the Trustees and has delegated to it the authority to take any actions regarding the valuation of portfolio securities that the Valuation Committee deems necessary or appropriate, including determining the fair value of portfolio securities, unless the determination has been delegated to the Management Valuation Team of Wells Fargo Funds Management, LLC (“Funds Management”). The Board of Trustees retains the authority to make or ratify any valuation decisions or approve any changes to the Valuation Procedures as it deems appropriate. On a quarterly basis, the Board of Trustees receives reports on any valuation actions taken by the Valuation Committee or the Management Valuation Team which may include items for ratification.
Valuations of fair valued securities are compared to the next actual sales price when available, or other appropriate market values, to assess the continued appropriateness of the fair valuation methodologies used. These securities are fair valued on a day-to-day basis, taking into consideration changes to appropriate market information and any significant changes to the inputs considered in the valuation process until there is a readily available price provided on an exchange or by an independent pricing service. Valuations received from an independent pricing service or independent broker-dealer quotes are periodically validated by comparisons to most recent trades and valuations provided by other independent pricing services in addition to the review of prices by the adviser and/or subadviser. Unobservable inputs used in determining fair valuations are identified based on the type of security, taking into consideration factors utilized by market participants in valuing the investment, knowledge about the issuer and the current market environment.
When-issued transactions
The Fund may purchase securities on a forward commitment or when-issued basis. The Fund records a when-issued transaction on the trade date and will segregate assets in an amount at least equal in value to the Fund’s commitment to purchase when-issued securities. Securities purchased on a when-issued basis are marked-to-market daily and the Fund begins earning interest on the settlement date. Losses may arise due to changes in the market value of the underlying securities or if the counterparty does not perform under the contract.
| | | | | | |
| Notes to financial statements (unaudited) | | Wells Fargo Advantage Intermediate Tax/AMT-Free Fund | | | 23 | |
Futures contracts
The Fund is subject to interest rate risk in the normal course of pursuing its investment objectives. The Fund may buy and sell futures contracts in order to gain exposure to, or protect against, changes in security values and interest rates. The primary risks associated with the use of futures contracts are the imperfect correlation between changes in market values of securities held by the Fund and the prices of futures contracts, and the possibility of an illiquid market.
The aggregate principal amounts of the contracts are not recorded in the financial statements. Fluctuations in the value of the contracts are recorded in the Statement of Assets and Liabilities as an asset or liability and in the Statement of Operations as unrealized gains or losses until the contracts are closed, at which point they are recorded as net realized gains or losses on futures contracts. With futures contracts, there is minimal counterparty risk to the Fund since futures are exchange traded and the exchange’s clearinghouse, as counterparty to all exchange traded futures, guarantees the futures against default.
Security transactions and income recognition
Securities transactions are recorded on a trade date basis. Realized gains or losses are recorded on the basis of identified cost.
Interest income is accrued daily and bond discounts are accreted and premiums are amortized daily based on the effective interest method. To the extent debt obligations are placed on non-accrual status, any related interest income may be reduced by writing off interest receivables when the collection of all or a portion of interest has become doubtful based on consistently applied procedures. If the issuer subsequently resumes interest payments or when the collectability of interest is reasonably assured, the debt obligation is removed from non-accrual status.
Distributions to shareholders
Distributions to shareholders from net investment income are accrued daily and paid monthly. Distributions from net realized gains, if any, are recorded on the ex-dividend date. Such distributions are determined in conformity with federal income tax regulations, which may differ in amount or character from net investment income and realized gains recognized for purposes of U.S. generally accepted accounting principles.
Federal and other taxes
The Fund intends to continue to qualify as a regulated investment company by distributing substantially all of its investment company taxable and tax-exempt income and any net realized capital gains (after reduction for capital loss carryforwards) sufficient to relieve it from all, or substantially all, federal income taxes. Accordingly, no provision for federal income taxes was required.
The Fund’s income and federal excise tax returns and all financial records supporting those returns for the prior three fiscal years are subject to examination by the federal and Delaware revenue authorities. Management has analyzed the Fund’s tax positions taken on federal, state, and foreign tax returns for all open tax years and does not believe that there are any uncertain tax positions that require recognition of a tax liability.
As of June 30, 2014, the Fund had capital loss carryforwards which consisted of $6,581,418 in short-term capital losses.
Class allocations
The separate classes of shares offered by the Fund differ principally in applicable sales charges, distribution, shareholder servicing, and administration fees. Class specific expenses are charged directly to that share class. Investment income, common expenses, and realized and unrealized gains (losses) on investments are allocated daily to each class of shares based on the relative proportion of net assets of each class.
3. FAIR VALUATION MEASUREMENTS
Fair value measurements of investments are determined within a framework that has established a fair value hierarchy based upon the various data inputs utilized in determining the value of the Fund’s investments. The three-level hierarchy gives the highest priority to unadjusted quoted prices in active markets for identical assets or liabilities (Level 1) and the lowest priority to significant unobservable inputs (Level 3). The Fund’s investments are classified within the fair value hierarchy based on the lowest level of input that is significant to the fair value measurement. The inputs are summarized into three broad levels as follows:
| | | | |
| 24 | | Wells Fargo Advantage Intermediate Tax/AMT-Free Fund | | Notes to financial statements (unaudited) |
| n | | Level 1 – quoted prices in active markets for identical securities |
| n | | Level 2 – other significant observable inputs (including quoted prices for similar securities, interest rates, prepayment speeds, credit risk, use of amortized cost, etc.) |
| n | | Level 3 – significant unobservable inputs (including the Fund’s own assumptions in determining the fair value of investments) |
The inputs or methodologies used for valuing investments in securities are not necessarily an indication of the risk associated with investing in those securities.
The following is a summary of the inputs used in valuing the Fund’s assets and liabilities as of December 31, 2014:
| | | | | | | | | | | | | | | | |
| | | Quoted prices
(Level 1) | | | Other significant
observable inputs
(Level 2) | | | Significant
unobservable inputs
(Level 3) | | | Total | |
Assets | | | | | | | | | | | | | | | | |
Investments in: | | | | | | | | | | | | | | | | |
| | | | |
Municipal obligations | | $ | 0 | | | $ | 2,206,429,859 | | | $ | 2,570,500 | | | $ | 2,209,000,359 | |
| | | | |
Short-term investments | | | | | | | | | | | | | | | | |
Investment companies | | | 24,714,237 | | | | 0 | | | | 0 | | | | 24,714,237 | |
U.S. Treasury securities | | | 274,990 | | | | 0 | | | | 0 | | | | 274,990 | |
Total assets | | $ | 24,989,227 | | | $ | 2,206,429,859 | | | $ | 2,570,500 | | | $ | 2,233,989,586 | |
Liabilities | | | | | | | | | | | | | | | | |
| | | | |
Futures contracts | | $ | 48,125 | | | $ | 0 | | | $ | 0 | | | $ | 48,125 | |
Total liabilities | | $ | 48,125 | | | $ | 0 | | | $ | 0 | | | $ | 48,125 | |
Futures contracts are reported at their variation margin at measurement date, which represents the amount due from the Fund at that date. All other assets and liabilities are reported at their market value at measurement date.
Transfers in and transfers out are recognized at the end of the reporting period. At December 31, 2014, the Fund did not have any transfers into/out of Level 1, Level 2, or Level 3.
4. TRANSACTIONS WITH AFFILIATES
Advisory fee
The Trust has entered into an advisory contract with Funds Management, an indirect wholly owned subsidiary of Wells Fargo & Company (“Wells Fargo”). The adviser is responsible for implementing investment policies and guidelines and for supervising the subadviser, who is responsible for day-to-day portfolio management of the Fund.
Pursuant to the contract, Funds Management is entitled to receive an annual advisory fee starting at 0.35% and declining to 0.25% as the average daily net assets of the Fund increase. For the six months ended December 31, 2014, the advisory fee was equivalent to an annual rate of 0.32% of the Fund’s average daily net assets.
Funds Management has retained the services of a subadviser to provide daily portfolio management to the Fund. The fee for subadvisory services is borne by Funds Management. Wells Capital Management Incorporated, an affiliate of Funds Management and an indirect wholly owned subsidiary of Wells Fargo, is the subadviser to the Fund and is entitled to receive a fee from Funds Management at an annual rate starting at 0.20% and declining to 0.10% as the average daily net assets of the Fund increase.
Administration fees
The Trust has entered into an administration agreement with Funds Management. Under this agreement, for providing administrative services, which includes paying fees and expenses for services provided by the transfer agent, sub-transfer agents, omnibus account servicers and record-keepers, Funds Management is entitled to receive from the Fund an annual fund level administration fee starting at 0.05% and declining to 0.03% as the average daily net assets of the Fund increase and a class level administration fee which is calculated based on the average daily net assets of each class as follows:
| | | | |
| | | Class level
administration fee | |
Class A, Class C | | | 0.16 | % |
Administrator Class | | | 0.10 | |
Institutional Class | | | 0.08 | |
Investor Class | | | 0.19 | |
| | | | | | |
| Notes to financial statements (unaudited) | | Wells Fargo Advantage Intermediate Tax/AMT-Free Fund | | | 25 | |
Funds Management has contractually waived and/or reimbursed advisory and administration fees to the extent necessary to maintain certain net operating expense ratios for the Fund. Waiver of fees and/or reimbursement of expenses by Funds Management were made first from fund level expenses on a proportionate basis and then from class specific expenses. Funds Management has committed through October 31, 2015 to waive fees and/or reimburse expenses to the extent necessary to cap the Fund’s expenses at 0.70% for Class A shares, 1.45% for Class C shares, 0.60% for Administrator Class shares, 0.42% for Institutional Class shares, and 0.73% for Investor Class shares. After this time, the cap may be increased or the commitment to maintain the cap may be terminated only with the approval of the Board of Trustees.
Distribution fee
The Trust has adopted a Distribution Plan for Class C shares of the Fund pursuant to Rule 12b-1 under the 1940 Act. A distribution fee is charged to Class C shares and paid to Wells Fargo Funds Distributor, LLC (“Funds Distributor”), the principal underwriter, at an annual rate of 0.75% of the average daily net assets of Class C shares.
In addition, Funds Distributor is entitled to receive the front-end sales charge from the purchase of Class A shares and a contingent deferred sales charge on the redemption of certain shares. Funds Distributor is also entitled to receive the contingent deferred sales charges from redemptions of Class C shares. For the six months ended December 31, 2014, Funds Distributor received $11,381 from the sale of Class A shares.
Shareholder servicing fees
The Trust has entered into contracts with one or more shareholder servicing agents, whereby Class A, Class C, Administrator Class, and Investor Class of the Fund is charged a fee at an annual rate of 0.25% of the average daily net assets of each respective class.
A portion of these total shareholder servicing fees were paid to affiliates of Wells Fargo.
5. INVESTMENT PORTFOLIO TRANSACTIONS
Purchases and sales of investments, excluding U.S. government obligations (if any) and short-term securities, for the six months ended December 31, 2014 were $430,661,428 and $263,891,135, respectively.
6. DERIVATIVE TRANSACTIONS
During the six months ended December 31, 2014, the Fund entered into futures contracts to take advantage of the differences between municipal and treasury yields and to help manage the duration of the portfolio.
At December 31, 2014, the Fund had short futures contracts outstanding as follows:
| | | | | | | | | | | | | | | | |
| Expiration date | | Counterparty | | Contracts | | Type | | | Contract value at
December 31, 2014 | | | Unrealized
losses | |
3-20-2015 | | JPMorgan | | 220 Short | | | 10-Year U.S. Treasury Notes | | | $ | 27,895,313 | | | $ | (246,199 | ) |
The Fund had an average notional amount of $12,289,212 in short futures contracts during the six months ended December 31, 2014.
On December 31, 2014, the cumulative unrealized losses on futures contracts in the amount of $246,199 are reflected in net unrealized gains on investments on the Statement of Assets and Liabilities. The payable for daily variation margin on open futures contracts reflected in the Statement of Assets and Liabilities only represents the current day’s variation margin. The realized gains and change in unrealized gains (losses) on futures contracts are reflected in the Statement of Operations.
For certain types of derivative transactions, the Fund has entered into International Swaps and Derivatives Association, Inc. master agreements (“ISDA Master Agreements”) or similar agreements with approved counterparties. The ISDA Master Agreements or similar agreements may have requirements to deliver/deposit securities or cash to/with an exchange or broker-dealer as collateral and allows the Fund to offset, with each counterparty, certain derivative financial instrument’s assets and/or liabilities with collateral held or pledged. Collateral requirements differ by type of derivative. Collateral or margin requirements are set by the broker or exchange clearing house for exchange traded derivatives while collateral terms are contract specific for over-the-counter traded derivatives. Cash collateral that has been pledged to cover obligations of the Fund under ISDA Master Agreements or similar agreements, if any, will be reported separately in the Statement of Assets and Liabilities. Securities pledged as collateral, if any, for the same purpose are noted in the
| | | | |
| 26 | | Wells Fargo Advantage Intermediate Tax/AMT-Free Fund | | Notes to financial statements (unaudited) |
Portfolio of Investments. With respect to balance sheet offsetting, absent an event of default by the counterparty or a termination of the agreement, the reported amounts of financial assets and financial liabilities in the Statement of Assets and Liabilities are not offset across transactions between the Fund and the applicable counterparty. A reconciliation of the gross amounts on the Statement of Assets and Liabilities to the net amounts by derivative type, including any collateral exposure, is as follows:
| | | | | | | | | | | | | | | | |
| Derivative type | | Counterparty | | Gross amounts
of liabilities in the
Statement of
Assets and
Liabilities | | Amounts
subject to
netting
agreements | | | Collateral
pledged1 | | | Net amount
of liabilities | |
Futures – variation margin | | JPMorgan | | $48,125 | | $ | 0 | | | $ | (48,125 | ) | | $ | 0 | |
| | 1 | Collateral pledged within this table is limited to the collateral for the net transaction with the counterparty. | |
7. BANK BORROWINGS
The Trust (excluding the money market funds and certain other funds in the Trust) and Wells Fargo Variable Trust are parties to a $150,000,000 revolving credit agreement whereby the Fund is permitted to use bank borrowings for temporary or emergency purposes, such as to fund shareholder redemption requests. Interest under the credit agreement is charged to the Fund based on a borrowing rate equal to the higher of the Federal Funds rate in effect on that day plus 1.25% or the overnight LIBOR rate in effect on that day plus 1.25%. In addition, an annual commitment fee equal to 0.10% of the unused balance is allocated to each participating fund. For the six months ended December 31, 2014, the Fund paid $1,129 in commitment fees.
For the six months ended December 31 2014, there were no borrowings by the Fund under the agreement.
8. INDEMNIFICATION
Under the Trust’s organizational documents, the officers and Trustees are indemnified against certain liabilities that may arise out of performance of their duties to the Trust. Additionally, in the normal course of business, the Trust may enter into contracts with service providers that contain a variety of indemnification clauses. The Trust’s maximum exposure under these arrangements is dependent on future claims that may be made against the Fund and, therefore, cannot be estimated.
| | | | | | |
| Other information (unaudited) | | Wells Fargo Advantage Intermediate Tax/AMT-Free Fund | | | 27 | |
PROXY VOTING INFORMATION
A description of the policies and procedures that the Fund uses to determine how to vote proxies relating to portfolio securities is available without charge, upon request, by calling 1-800-222-8222, visiting our website at wellsfargoadvantagefunds.com, or visiting the SEC website at sec.gov. Information regarding how the Fund voted proxies relating to portfolio securities during the most recent 12-month period ended June 30 is available on the Fund’s website at wellsfargoadvantagefunds.com or by visiting the SEC website at sec.gov.
PORTFOLIO HOLDINGS INFORMATION
The complete portfolio holdings for the Fund are publicly available monthly on the Fund’s website (wellsfargoadvantagefunds.com), on a one-month delayed basis. In addition, top ten holdings information (excluding derivative positions) for the Fund is publicly available on the Fund’s website on a monthly, seven-day or more delayed basis. The Fund files its complete schedule of portfolio holdings with the SEC for the first and third quarters of each fiscal year on Form N-Q, which is available by visiting the SEC website at sec.gov. In addition, the Fund’s Form N-Q may be reviewed and copied at the SEC’s Public Reference Room in Washington, DC, and at regional offices in New York City, at 233 Broadway, and in Chicago, at 175 West Jackson Boulevard, Suite 900. Information about the Public Reference Room may be obtained by calling 1-800-SEC-0330.
| | | | |
| 28 | | Wells Fargo Advantage Intermediate Tax/AMT-Free Fund | | Other information (unaudited) |
BOARD OF TRUSTEES AND OFFICERS
Each of the Trustees and Officers1 listed in the table below acts in identical capacities for each fund in the Wells Fargo Advantage family of funds, which consists of 134 mutual funds comprising the Wells Fargo Funds Trust, Wells Fargo Variable Trust, Wells Fargo Master Trust and four closed-end funds (collectively the “Fund Complex”). This table should be read in conjunction with the Prospectus and the Statement of Additional Information2. The mailing address of each Trustee and Officer is 525 Market Street, 12th Floor, San Francisco, CA 94105. Each Trustee and Officer serves an indefinite term, however, each Trustee serves such term until reaching the mandatory retirement age established by the Trustees.
Independent Trustees
| | | | | | |
Name and year of birth | | Position held and length of service* | | Principal occupations during past five years or longer | | Other directorships during past five years |
Peter G. Gordon (Born 1942) | | Trustee, since 1998; Chairman, since 2005 | | Co-Founder, Retired Chairman, President and CEO of Crystal Geyser Water Company. Trustee Emeritus, Colby College. | | Asset Allocation Trust |
Isaiah Harris, Jr. (Born 1952) | | Trustee, since 2009 | | Retired. Prior thereto, President and CEO of BellSouth Advertising and Publishing Corp. from 2005 to 2007, President and CEO of BellSouth Enterprises from 2004 to 2005 and President of BellSouth Consumer Services from 2000 to 2003. Emeritus member of the Iowa State University Foundation Board of Governors. Emeritus Member of the Advisory Board of Iowa State University School of Business. Advisory Board Member, Palm Harbor Academy. Mr. Harris is a certified public accountant. | | CIGNA Corporation; Asset Allocation Trust |
Judith M. Johnson (Born 1949) | | Trustee, since 2008; Audit Committee Chairman, since 2008 | | Retired. Prior thereto, Chief Executive Officer and Chief Investment Officer of Minneapolis Employees Retirement Fund from 1996 to 2008. Ms. Johnson is an attorney, certified public accountant and a certified managerial accountant. | | Asset Allocation Trust |
Leroy Keith, Jr. (Born 1939) | | Trustee, since 2010** | | Chairman, Bloc Global Services (development and construction). Trustee of the Evergreen Funds complex (and its predecessors) from 1983 to 2010. Former Managing Director, Almanac Capital Management (commodities firm), former Partner, Stonington Partners, Inc. (private equity fund), former Director, Obagi Medical Products Co. and former Director, Lincoln Educational Services. | | Trustee, Virtus Fund Complex (consisting of 50 portfolios as of 12/16/2013); Asset Allocation Trust |
David F. Larcker (Born 1950) | | Trustee, since 2009 | | James Irvin Miller Professor of Accounting at the Graduate School of Business, Stanford University, Morgan Stanley Director of the Center for Leadership Development and Research and Senior Faculty of The Rock Center for Corporate Governance since 2006. From 2005 to 2008, Professor of Accounting at the Graduate School of Business, Stanford University. Prior thereto, Ernst & Young Professor of Accounting at The Wharton School, University of Pennsylvania from 1985 to 2005. | | Asset Allocation Trust |
Olivia S. Mitchell (Born 1953) | | Trustee, since 2006 | | International Foundation of Employee Benefit Plans Professor, Wharton School of the University of Pennsylvania since 1993. Director of Wharton’s Pension Research Council and Boettner Center on Pensions & Retirement Research, and Research Associate at the National Bureau of Economic Research. Previously, Cornell University Professor from 1978 to 1993. | | Asset Allocation Trust |
Timothy J. Penny (Born 1951) | | Trustee, since 1996 | | President and CEO of Southern Minnesota Initiative Foundation, a non-profit organization, since 2007 and Senior Fellow at the Humphrey Institute Policy Forum at the University of Minnesota since 1995. Member of the Board of Trustees of NorthStar Education Finance, Inc., a non-profit organization, since 2007. | | Asset Allocation Trust |
Michael S. Scofield (Born 1943) | | Trustee, since 2010 | | Served on the Investment Company Institute’s Board of Governors and Executive Committee from 2008-2011 as well the Governing Council of the Independent Directors Council from 2006-2011 and the Independent Directors Council Executive Committee from 2008-2011. Chairman of the IDC from 2008-2010. Institutional Investor (Fund Directions) Trustee of Year in 2007. Trustee of the Evergreen Funds complex (and its predecessors) from 1984 to 2010. Chairman of the Evergreen Funds from 2000-2010. Former Trustee of the Mentor Funds. Retired Attorney, Law Offices of Michael S. Scofield. | | Asset Allocation Trust |
| | | | | | |
| Other information (unaudited) | | Wells Fargo Advantage Intermediate Tax/AMT-Free Fund | | | 29 | |
| | | | | | |
Name and year of birth | | Position held and length of service* | | Principal occupations during past five years or longer | | Other directorships during past five years |
Donald C. Willeke (Born 1940) | | Trustee, since 1996 | | Principal of the law firm of Willeke & Daniels. General Counsel of the Minneapolis Employees Retirement Fund from 1984 until its consolidation into the Minnesota Public Employees Retirement Association on June 30, 2010. Director and Vice Chair of The Tree Trust (non-profit corporation). Director of the American Chestnut Foundation (non-profit corporation). | | Asset Allocation Trust |
| * | Length of service dates reflect the Trustee’s commencement of service with the Trust’s predecessor entities, where applicable. |
| ** | Leroy Keith, Jr. retired as a Trustee effective December 31, 2014. |
Officers
| | | | | | |
Name and year of birth | | Position held and length of service | | Principal occupations during past five years or longer | | |
Karla M. Rabusch (Born 1959) | | President, since 2003 | | Executive Vice President of Wells Fargo Bank, N.A. and President of Wells Fargo Funds Management, LLC since 2003. | | |
Nancy Wiser1 (Born 1967) | | Treasurer, since 2012 | | Executive Vice President of Wells Fargo Funds Management, LLC since 2011. Chief Operating Officer and Chief Compliance Officer at LightBox Capital Management LLC, from 2008 to 2011. Owned and operated a consulting business providing services to various hedge funds including acting as Chief Operating Officer and Chief Compliance Officer for a hedge fund from 2007 to 2008. Chief Operating Officer and Chief Compliance Officer of GMN Capital LLC from 2006 to 2007. | | |
C. David Messman (Born 1960) | | Secretary, since 2000; Chief Legal Officer, since 2003 | | Assistant General Counsel of Wells Fargo Bank, N.A. since 2013 and Vice President and Managing Counsel of Wells Fargo Bank N.A. from 1996 to 2013. Senior Vice President and Secretary of Wells Fargo Funds Management , LLC since 2001. | | |
Debra Ann Early (Born 1964) | | Chief Compliance Officer, since 2007 | | Senior Vice President of Wells Fargo Funds Management, LLC since 2007 and Chief Compliance Officer from 2007 to 2014. Chief Compliance Officer of Parnassus Investments from 2005 to 2007. Chief Financial Officer of Parnassus Investments from 2004 to 2007 and Senior Audit Manager of PricewaterhouseCoopers LLP from 1998 to 2004. | | |
David Berardi (Born 1975) | | Assistant Treasurer, since 2009 | | Vice President of Wells Fargo Funds Management, LLC since 2009. Vice President of Evergreen Investment Management Company, LLC from 2008 to 2010. Assistant Vice President of Evergreen Investment Services, Inc. from 2004 to 2008. Manager of Fund Reporting and Control for Evergreen Investment Management Company, LLC from 2004 to 2010. | | |
Jeremy DePalma1 (Born 1974) | | Assistant Treasurer, since 2009 | | Senior Vice President of Wells Fargo Funds Management, LLC since 2009. Senior Vice President of Evergreen Investment Management Company, LLC from 2008 to 2010. Vice President, Evergreen Investment Services, Inc. from 2004 to 2007. Head of the Fund Reporting and Control Team within Fund Administration from 2005 to 2010. | | |
| 1. | Nancy Wiser acts as Treasurer of 73 funds in the Fund Complex. Jeremy DePalma acts as Treasurer of 61 funds and Assistant Treasurer of 73 funds in the Fund Complex. |
| 2. | The Statement of Additional Information includes additional information about the Trustees and is available, without charge, upon request, by calling 1-800-222-8222 or by visiting the website at wellsfargoadvantagefunds.com. |
| | | | |
| 30 | | Wells Fargo Advantage Intermediate Tax/AMT-Free Fund | | List of abbreviations |
The following is a list of common abbreviations for terms and entities that may have appeared in this report.
| ACA | — ACA Financial Guaranty Corporation |
| ADR | — American depositary receipt |
| ADS | — American depositary shares |
| AGC | — Assured Guaranty Corporation |
| AGM | — Assured Guaranty Municipal |
| Ambac | — Ambac Financial Group Incorporated |
| AMT | — Alternative minimum tax |
| BAN | — Bond anticipation notes |
| BHAC | — Berkshire Hathaway Assurance Corporation |
| CAB | — Capital appreciation bond |
| CCAB | — Convertible capital appreciation bond |
| CDA | — Community Development Authority |
| CDO | — Collateralized debt obligation |
| DRIVER | — Derivative inverse tax-exempt receipts |
| DW&P | — Department of Water & Power |
| DWR | — Department of Water Resources |
| ECFA | — Educational & Cultural Facilities Authority |
| EDA | — Economic Development Authority |
| EDFA | — Economic Development Finance Authority |
| ETF | — Exchange-traded fund |
| FDIC | — Federal Deposit Insurance Corporation |
| FFCB | — Federal Farm Credit Banks |
| FGIC | — Financial Guaranty Insurance Corporation |
| FHA | — Federal Housing Administration |
| FHLB | — Federal Home Loan Bank |
| FHLMC | — Federal Home Loan Mortgage Corporation |
| FICO | — The Financing Corporation |
| FNMA | — Federal National Mortgage Association |
| GDR | — Global depositary receipt |
| GNMA | — Government National Mortgage Association |
| HCFR | — Healthcare facilities revenue |
| HEFA | — Health & Educational Facilities Authority |
| HEFAR | — Higher education facilities authority revenue |
| HFA | — Housing Finance Authority |
| HFFA | — Health Facilities Financing Authority |
| HUD | — Department of Housing and Urban Development |
| IDA | — Industrial Development Authority |
| IDAG | — Industrial Development Agency |
| KRW | — Republic of Korea won |
| LIBOR | — London Interbank Offered Rate |
| LIFERs | — Long Inverse Floating Exempt Receipts |
| LLC | — Limited liability company |
| LLLP | — Limited liability limited partnership |
| LLP | — Limited liability partnership |
| MBIA | — Municipal Bond Insurance Association |
| MFHR | — Multifamily housing revenue |
| MSTR | — Municipal securities trust receipts |
| MUD | — Municipal Utility District |
| National | — National Public Finance Guarantee Corporation |
| PCFA | — Pollution Control Financing Authority |
| PCL | — Public Company Limited |
| PCR | — Pollution control revenue |
| PFA | — Public Finance Authority |
| PFFA | — Public Facilities Financing Authority |
| PFOTER | — Puttable floating option tax-exempt receipts |
| plc | — Public limited company |
| PUTTER | — Puttable tax-exempt receipts |
| R&D | — Research & development |
| Radian | — Radian Asset Assurance |
| RAN | — Revenue anticipation notes |
| RDA | — Redevelopment Authority |
| RDFA | — Redevelopment Finance Authority |
| REIT | — Real estate investment trust |
| ROC | — Reset option certificates |
| SAVRS | — Select auction variable rate securities |
| SBA | — Small Business Authority |
| SFHR | — Single-family housing revenue |
| SFMR | — Single-family mortgage revenue |
| SPA | — Standby purchase agreement |
| SPDR | — Standard & Poor’s Depositary Receipts |
| SPEARs | — Short Puttable Exempt Adjustable Receipts |
| STRIPS | — Separate trading of registered interest and |
| TAN | — Tax anticipation notes |
| TIPS | — Treasury inflation-protected securities |
| TRAN | — Tax revenue anticipation notes |
| TTFA | — Transportation Trust Fund Authority |
| TVA | — Tennessee Valley Authority |
This page is intentionally left blank.
This page is intentionally left blank.


For more information
More information about Wells Fargo Advantage Funds is available free upon request. To obtain literature, please write, email, visit the Fund’s website, or call:
Wells Fargo Advantage Funds
P.O. Box 8266
Boston, MA 02266-8266
Email: wfaf@wellsfargo.com
Website: wellsfargoadvantagefunds.com
Individual investors: 1-800-222-8222
Retail investment professionals: 1-888-877-9275
Institutional investment professionals: 1-866-765-0778
This report and the financial statements contained herein are submitted for the general information of the shareholders of Wells Fargo Advantage Funds. If this report is used for promotional purposes, distribution of the report must be accompanied or preceded by a current prospectus. Before investing, please consider the investment objectives, risks, charges, and expenses of the investment. For a current prospectus and, if available, a summary prospectus, containing this information, call 1-800-222-8222 or visit the Fund’s website at wellsfargoadvantagefunds.com. Read the prospectus carefully before you invest or send money.
Wells Fargo Funds Management, LLC, a wholly owned subsidiary of Wells Fargo & Company, provides investment advisory and administrative services for Wells Fargo Advantage Funds. Other affiliates of Wells Fargo & Company provide subadvisory and other services for the Funds. The Funds are distributed by Wells Fargo Funds Distributor, LLC, Member FINRA/SIPC, an affiliate of Wells Fargo & Company.
NOT FDIC INSURED ¡ NO BANK GUARANTEE ¡ MAY LOSE VALUE
© 2014 Wells Fargo Funds Management, LLC. All rights reserved.
| | |
 | | 230425 02-15 SA251/SAR251 12-14 |

Wells Fargo Advantage Minnesota Tax-Free Fund

Semi-Annual Report
December 31, 2014

Reduce clutter. Save trees.
Sign up for electronic delivery of prospectuses and shareholder reports at wellsfargo.com/advantagedelivery
Contents
The views expressed and any forward-looking statements are as of December 31, 2014, unless otherwise noted, and are those of the Fund managers and/or Wells Fargo Funds Management, LLC. Discussions of individual securities, or the markets generally, or any Wells Fargo Advantage Fund are not intended as individual recommendations. Future events or results may vary significantly from those expressed in any forward-looking statements; the views expressed are subject to change at any time in response to changing circumstances in the market. Wells Fargo Funds Management, LLC and the Fund disclaim any obligation to publicly update or revise any views expressed or forward-looking statements.
NOT FDIC INSURED ¡ NO BANK GUARANTEE ¡ MAY LOSE VALUE
| | | | |
| 2 | | Wells Fargo Advantage Minnesota Tax-Free Fund | | Letter to shareholders (unaudited) |

Karla M. Rabusch
President
Wells Fargo Advantage Funds
Municipal bonds rose in the second half of 2014, helped by lower interest rates and strong demand for yield.
Dear Valued Shareholder:
We are pleased to provide you with this semi-annual report for the Wells Fargo Advantage Minnesota Tax-Free Fund for the six-month period that ended December 31, 2014. Municipal bonds rose in the second half of 2014, helped by lower interest rates and strong demand for yield. In fact, the longest-dated and weakest credits had the strongest returns. Municipal bond returns—as measured by the Barclays Municipal Bond Index1, the broadest measure for tracking investment-grade municipal bonds throughout the country—gained 2.88% for the six-month period that ended December 31, 2014.
Longer-maturity and lower-rated municipal bonds outperformed.
At the front end of the yield curve, municipal bond yields were extremely low because of the accommodative monetary policy. Throughout the reporting period, the U.S. Federal Reserve’s (Fed’s) monetary policymaking body kept its key interest rate near zero in order to support the economy and the financial system. Policymakers said they can be patient in normalizing monetary policy and that any increases in the target range for the federal funds rate will depend on incoming economic data. During the reporting period, the Fed reduced (or tapered) the size of its quantitative easing program each month until the program ended in October 2014, although it continues to reinvest principal and interest payments of the mortgage-backed securities and Treasury bonds it holds.
Longer-term yields declined during the second half of the year, with 10-year municipal yields declining from 2.33% as of June 30, 2014 to 2.10% as of December 31, 2014. For more perspective, the yield curve was steep on a historical basis at the beginning of the period and ended the period with the difference between 30-year and 2-year yields at 237 basis points (bps; 100 bps equals 1.00%), which was only slightly wider than its historical average. Because the yield curve was steep, longer-dated securities had higher yields. Given their longer maturities (as municipal yields fell further out the curve) and their more generous yields, longer-term bond returns outpaced shorter-term bonds.
Investors were also enticed to buy lower-rated securities for their higher yields. Over the six-month period that ended December 31, 2014, AAA-rated municipal bonds returned 2.04% while BBB-rated bonds returned 4.29%, according to the Barclays Municipal Bond Index. Credit conditions continued to improve, as evidenced by an 18th consecutive quarter of positive year-over-year gains in state and local municipal revenues. In addition to better fundamental credit conditions, technical factors of limited supply alongside strong investor demand also supported municipal bonds.
Puerto Rico’s struggle, the exit of two cities from bankruptcy, and pension issues topped credit news.
Puerto Rico was the asset class’s largest single credit story. Bonds from the commonwealth returned a meager 0.79% during the six-month period as population declines, a contracting economy, and a burdensome level of debt held back results. Meanwhile, the cities of Stockton, California, and Detroit, Michigan, exited bankruptcy by curbing retiree health care benefits and bondholder recoveries but largely avoiding concessions on pensions. While these recent bankruptcies have so far treated pensions better than bonded debt, no clear precedent has been established due to the difference in general obligation
| 1. | The Barclays Municipal Bond Index is an unmanaged index composed of long-term tax-exempt bonds with a minimum credit rating of Baa. You cannot invest directly in an index. |
| | | | | | |
| Letter to shareholders (unaudited) | | Wells Fargo Advantage Minnesota Tax-Free Fund | | | 3 | |
pledges and court-ordered versus negotiated concessions. Finally, underfunded pensions in Illinois, New Jersey, Pennsylvania, and Kansas gained attention for their negative fiscal effects and the political difficulties of finding a resolution.
Don’t let short-term uncertainty derail long-term investment goals.
Periods of uncertainty can present challenges, but experience has taught us that maintaining long-term investment goals can be an effective way to plan for the future. To help you create a sound strategy based on your personal goals and risk tolerance, Wells Fargo Advantage Funds offers more than 100 mutual funds and other investments spanning a wide range of asset classes and investment styles. Although diversification cannot guarantee an investment profit or prevent losses, we believe it can be an effective way to manage investment risk and potentially smooth out overall portfolio performance. We encourage investors to know their investments and to understand that appropriate levels of risk-taking may unlock opportunities.
Thank you for choosing to invest with Wells Fargo Advantage Funds. We appreciate your confidence in us and remain committed to helping you meet your financial needs. For current information about your fund investments, contact your investment professional, visit our website at wellsfargoadvantagefunds.com, or call us directly at 1-800-222-8222. We are available 24 hours a day, 7 days a week.
Sincerely,

Karla M. Rabusch
President
Wells Fargo Advantage Funds
Periods of uncertainty can present challenges, but experience has taught us that maintaining long-term investment goals can be an effective way to plan for the future.
| | | | |
| 4 | | Wells Fargo Advantage Minnesota Tax-Free Fund | | Performance highlights (unaudited) |
Investment objective
The Fund seeks current income exempt from federal income tax and Minnesota individual income tax.
Adviser
Wells Fargo Funds Management, LLC
Subadviser
Wells Capital Management Incorporated
Portfolio managers
Wendy Casetta
Bruce R. Johns
Average annual total returns1 (%) as of December 31, 2014
| | | | | | | | | | | | | | | | | | | | | | | | | | | | | | | | | | |
| | | | | Including sales charge | | | Excluding sales charge | | | Expense ratios2 (%) | |
| | | Inception date | | 1 year | | | 5 year | | | 10 year | | | 1 year | | | 5 year | | | 10 year | | | Gross | | | Net3 | |
| Class A (NMTFX) | | 1-12-1988 | | | 2.04 | | | | 3.56 | | | | 3.60 | | | | 6.85 | | | | 4.52 | | | | 4.07 | | | | 0.89 | | | | 0.85 | |
| Class C (WMTCX) | | 4-8-2005 | | | 5.05 | | | | 3.74 | | | | 3.29 | | | | 6.05 | | | | 3.74 | | | | 3.29 | | | | 1.64 | | | | 1.60 | |
| Administrator Class (NWMIX) | | 8-2-1993 | | | – | | | | – | | | | – | | | | 7.11 | | | | 4.78 | | | | 4.33 | | | | 0.83 | | | | 0.60 | |
| Barclays Municipal Bond Index4 | | – | | | – | | | | – | | | | – | | | | 9.05 | | | | 5.16 | | | | 4.74 | | | | – | | | | – | |
| Barclays Minnesota Municipal Bond Index5 | | – | | | – | | | | – | | | | – | | | | 6.80 | | | | 4.57 | | | | 4.56 | | | | – | | | | – | |
Figures quoted represent past performance, which is no guarantee of future results, and do not reflect taxes that a shareholder may pay on fund distributions or the redemption of fund shares. Investment return and principal value of an investment will fluctuate so that an investor’s shares, when redeemed, may be worth more or less than their original cost. Performance shown without sales charges would be lower if sales charges were reflected. Current performance may be lower or higher than the performance data quoted, which assumes the reinvestment of dividends and capital gains. Current month-end performance is available on the Fund’s website, wellsfargoadvantagefunds.com.
Index returns do not include transaction costs associated with buying and selling securities, any mutual fund fees or expenses, or any taxes. It is not possible to invest directly in an index.
For Class A shares, the maximum front-end sales charge is 4.50%. For Class C shares, the maximum contingent deferred sales charge is 1.00%. Performance including a contingent deferred sales charge assumes the sales charge for the corresponding time period. Administrator Class shares are sold without a front-end sales charge or contingent deferred sales charge.
Bond values fluctuate in response to the financial condition of individual issuers, general market and economic conditions, and changes in interest rates. Changes in market conditions and government policies may lead to periods of heightened volatility in the bond market and reduced liquidity for certain bonds held by the Fund. In general, when interest rates rise, bond values fall and investors may lose principal value. Interest-rate changes and their impact on the Fund and its share price can be sudden and unpredictable. The use of derivatives may reduce returns and/or increase volatility. Certain investment strategies tend to increase the total risk of an investment (relative to the broader market). The Fund is exposed to Minnesota municipal securities risk and high-yield securities risk. Consult the Fund’s prospectus for additional information on these and other risks. A portion of the Fund’s income may be subject to federal, state, and/or local income taxes or the Alternative Minimum Tax (AMT). Any capital gains distributions may be taxable.
Please see footnotes on page 5.
| | | | | | |
| Performance highlights (unaudited) | | Wells Fargo Advantage Minnesota Tax-Free Fund | | | 5 | |
|
| Credit quality distribution6 as of December 31, 2014 |
|
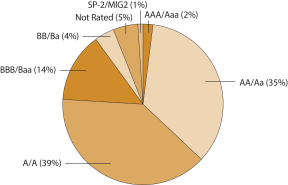 |
|
| Effective maturity distribution7 as of December 31, 2014 |
|
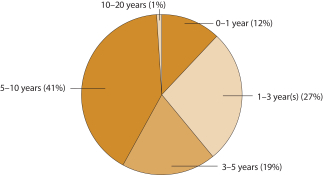 |
| 1. | Effective July 18, 2008, Class Z was renamed Administrator Class. Historical performance shown for Class C shares prior to their inception reflects the performance of Class A shares, adjusted to reflect the higher expenses applicable to Class C shares. |
| 2. | Reflects the expense ratios as stated in the most recent prospectuses. The expense ratios shown are subject to change and may differ from the annualized expense ratios shown in the financial highlights of this report. |
| 3. | The Adviser has committed through October 31, 2015, to waive fees and/or reimburse expenses to the extent necessary to cap the Fund’s Total Annual Fund Operating Expenses After Fee Waiver, excluding certain expenses, at the amounts shown. After this time, the cap may be increased or the commitment to maintain the cap may be terminated only with the approval of the Board of Trustees. Brokerage commissions, stamp duty fees, interest, taxes, acquired fund fees and expenses, and extraordinary expenses are excluded from the cap. Without this cap, the Fund’s returns would have been lower. |
| 4. | The Barclays Municipal Bond Index is an unmanaged index composed of long-term tax-exempt bonds with a minimum credit rating of Baa. You cannot invest directly in an index. |
| 5. | The Barclays Minnesota Municipal Bond Index is the Minnesota component of the Barclays Municipal Bond Index. You cannot invest directly in an index. |
| 6. | The credit quality distribution of portfolio holdings reflected in the chart is based on ratings from Standard & Poor’s, Moody’s Investors Service, and/or Fitch Ratings Ltd. Credit quality ratings apply to the underlying holdings of the Fund and not to the Fund itself. The percentages of the Fund’s portfolio with the ratings depicted in the chart are calculated based on the total market value of fixed income securities held by the Fund. If a security was rated by all three rating agencies, the middle rating was utilized. If rated by two of three rating agencies, the lower rating was utilized, and if rated by one of the rating agencies, that rating was utilized. Standard & Poor’s rates the creditworthiness of bonds on a scale of AAA (highest) to D (lowest). Ratings from A to CCC may be modified by the addition of a plus (+) or minus (-) sign to show relative standing within the rating categories. Standard & Poor’s rates the creditworthiness of short-term notes on a scale SP-1 (highest) to SP-3 (lowest). Moody’s rates the creditworthiness of bond on a scale of Aaa (highest) to C (lowest). Ratings Aa to B may be modified by the addition of a number 1 (highest) to 3 (lowest) to show relative standing within the ratings categories. Moody’s rates the creditworthiness of short-term U.S. tax-exempt municipal securities from MIG 1/VMIG 1 (highest) to SG (lowest). Fitch rates the creditworthiness of bonds, ranging from AAA (highest) to D (lowest). Credit quality and credit quality ratings are subject to change and may have changed since the date specified. |
| 7. | Effective maturity distribution is calculated based on the total long-term investments of the Fund. It is subject to change and may have changed since the date specified. |
| | | | |
| 6 | | Wells Fargo Advantage Minnesota Tax-Free Fund | | Fund expenses (unaudited) |
As a shareholder of the Fund, you incur two types of costs: (1) transaction costs, including sales charges (loads) on purchase payments and contingent deferred sales charges (if any) on redemptions and (2) ongoing costs, including management fees, distribution (12b-1) and/or shareholder service fees, and other Fund expenses. This example is intended to help you understand your ongoing costs (in dollars) of investing in the Fund and to compare these costs with the ongoing costs of investing in other mutual funds.
The example is based on an investment of $1,000 invested at the beginning of the six-month period and held for the entire period from July 1, 2014 to December 31, 2014.
Actual expenses
The “Actual” line of the table below provides information about actual account values and actual expenses. You may use the information in this line, together with the amount you invested, to estimate the expenses that you paid over the period. Simply divide your account value by $1,000 (for example, an $8,600 account value divided by $1,000 = 8.6), then multiply the result by the number in the “Actual” line under the heading entitled “Expenses paid during period” for your applicable class of shares to estimate the expenses you paid on your account during this period.
Hypothetical example for comparison purposes
The “Hypothetical” line of the table below provides information about hypothetical account values and hypothetical expenses based on the Fund’s actual expense ratio and an assumed rate of return of 5% per year before expenses, which is not the Fund’s actual return. The hypothetical account values and expenses may not be used to estimate the actual ending account balance or expenses you paid for the period. You may use this information to compare the ongoing costs of investing in the Fund and other funds. To do so, compare this 5% hypothetical example with the 5% hypothetical examples that appear in the shareholder reports of the other funds.
Please note that the expenses shown in the table are meant to highlight your ongoing costs only and do not reflect any transactional costs, such as sales charges (loads) and contingent deferred sales charges. Therefore, the “Hypothetical” line of the table is useful in comparing ongoing costs only and will not help you determine the relative total costs of owning different funds. In addition, if these transactional costs were included, your costs would have been higher.
| | | | | | | | | | | | | | | | |
| | | Beginning
account value
7-1-2014 | | | Ending
account value
12-31-2014 | | | Expenses
paid during
the period1 | | | Net annualized
expense ratio | |
Class A | | | | | | | | | | | | | | | | |
Actual | | $ | 1,000.00 | | | $ | 1,024.23 | | | $ | 4.34 | | | | 0.85 | % |
Hypothetical (5% return before expenses) | | $ | 1,000.00 | | | $ | 1,020.92 | | | $ | 4.33 | | | | 0.85 | % |
Class C | | | | | | | | | | | | | | | | |
Actual | | $ | 1,000.00 | | | $ | 1,020.38 | | | $ | 8.15 | | | | 1.60 | % |
Hypothetical (5% return before expenses) | | $ | 1,000.00 | | | $ | 1,017.14 | | | $ | 8.13 | | | | 1.60 | % |
Administrator Class | | | | | | | | | | | | | | | | |
Actual | | $ | 1,000.00 | | | $ | 1,025.52 | | | $ | 3.06 | | | | 0.60 | % |
Hypothetical (5% return before expenses) | | $ | 1,000.00 | | | $ | 1,022.18 | | | $ | 3.06 | | | | 0.60 | % |
| 1. | Expenses paid is equal to the annualized expense ratio of each class multiplied by the average account value over the period, multiplied by the number of days in the most recent fiscal half-year divided by the number of days in the fiscal year (to reflect the one-half-year period). |
| | | | | | |
| Portfolio of investments—December 31, 2014 (unaudited) | | Wells Fargo Advantage Minnesota Tax-Free Fund | | | 7 | |
| | | | | | | | | | | | | | | | |
| Security name | | Interest rate | | | Maturity date | | | Principal | | | Value | |
| | | | |
Municipal Obligations: 98.20% | | | | | | | | | | | | | | | | |
| | | | |
| Guam: 1.05% | | | | | | | | | | | | | | | | |
Guam International Airport Authority Series 2013A (Airport Revenue) | | | 5.00 | % | | | 10-1-2017 | | | $ | 200,000 | | | $ | 220,782 | |
Guam International Airport Authority Series 2013A (Airport Revenue) | | | 5.00 | | | | 10-1-2018 | | | | 100,000 | | | | 112,402 | |
Guam International Airport Authority Series 2013B (Airport Revenue) | | | 5.00 | | | | 10-1-2017 | | | | 300,000 | | | | 331,173 | |
Guam Waterworks Authority Water & Wastewater System Project Series 2013 (Water & Sewer Revenue) | | | 5.25 | | | | 7-1-2022 | | | | 865,000 | | | | 1,000,208 | |
| | | | |
| | | | | | | | | | | | | | | 1,664,565 | |
| | | | | | | | | | | | | | | | |
| | | | |
| Illinois: 0.62% | | | | | | | | | | | | | | | | |
Chicago IL Refunding Bond CAB Series C (GO) ¤ | | | 0.00 | | | | 1-1-2032 | | | | 2,500,000 | | | | 984,125 | |
| | | | | | | | | | | | | | | | |
| | | | |
| Minnesota: 94.13% | | | | | | | | | | | | | | | | |
Anoka County MN Capital Improvement Series A (GO) | | | 5.00 | | | | 2-1-2024 | | | | 500,000 | | | | 557,200 | |
Anoka County MN Charter School Series A (Education Revenue) | | | 2.65 | | | | 6-1-2016 | | | | 210,000 | | | | 209,332 | |
Anoka County MN Charter School Series A (Education Revenue) | | | 3.40 | | | | 6-1-2019 | | | | 225,000 | | | | 224,813 | |
Anoka County MN Charter School Series A (Education Revenue) | | | 3.65 | | | | 6-1-2020 | | | | 185,000 | | | | 185,357 | |
Anoka County MN Charter School Series A (Education Revenue) | | | 3.75 | | | | 6-1-2021 | | | | 245,000 | | | | 245,409 | |
Anoka County MN Charter School Series A (Education Revenue) | | | 5.00 | | | | 6-1-2027 | | | | 510,000 | | | | 539,748 | |
Anoka County MN Charter School Series A (Education Revenue) | | | 5.00 | | | | 6-1-2032 | | | | 300,000 | | | | 312,816 | |
Anoka County MN Charter School Series A (Education Revenue) | | | 5.00 | | | | 6-1-2043 | | | | 1,100,000 | | | | 1,130,822 | |
Anoka Hennepin MN Independent School District #11 Certificates of Participation Series 2014A (Miscellaneous Revenue) | | | 5.00 | | | | 2-1-2034 | | | | 1,000,000 | | | | 1,158,830 | |
Austin MN Housing & RDA Courtyard Residence Project Series A (Housing Revenue) | | | 5.00 | | | | 1-1-2031 | | | | 1,500,000 | | | | 1,619,925 | |
Baytown Township MN St. Croix Preparatory Academy Series A (Education Revenue) | | | 7.00 | | | | 8-1-2038 | | | | 2,150,000 | | | | 2,256,339 | |
Buffalo MN Housing & RDA Public Facility Buffalo Wild Marsh Golf Course (Miscellaneous Revenue) | | | 4.38 | | | | 5-1-2024 | | | | 185,000 | | | | 186,108 | |
Center City MN Health Care Facilities Hazelden Betty Ford Foundation Project Series 2014 (Health Revenue) | | | 5.00 | | | | 11-1-2026 | | | | 750,000 | | | | 888,225 | |
Center City MN Health Care Facilities Hazelden Betty Ford Foundation Project Series 2014 (Health Revenue) | | | 5.00 | | | | 11-1-2027 | | | | 500,000 | | | | 590,195 | |
Center City MN Health Care Facilities Hazelden Betty Ford Foundation Project Series 2014 (Health Revenue) | | | 5.00 | | | | 11-1-2029 | | | | 300,000 | | | | 351,591 | |
Center City MN Health Care Facilities Hazelden Betty Ford Foundation Project Series 2011 (Miscellaneous Revenue) | | | 5.00 | | | | 11-1-2041 | | | | 1,400,000 | | | | 1,500,940 | |
Central Minnesota Municipal Power Agency Brookings Southeast Twin Cities Transmission Project Series 2012 (Utilities Revenue) | | | 5.00 | | | | 1-1-2016 | | | | 875,000 | | | | 878,238 | |
Central Minnesota Municipal Power Agency Brookings Southeast Twin Cities Transmission Project Series 2012 (Utilities Revenue) | | | 5.00 | | | | 1-1-2042 | | | | 1,500,000 | | | | 1,645,455 | |
Cologne MN Charter School Lease Revenue Cologne Academy Project Series 2014A (Education Revenue) | | | 5.00 | | | | 7-1-2029 | | | | 590,000 | | | | 634,805 | |
Cologne MN Charter School Lease Revenue Cologne Academy Project Series 2014A (Education Revenue) | | | 5.00 | | | | 7-1-2034 | | | | 500,000 | | | | 527,860 | |
Dakota County MN Community Development Agency SFMR (Housing Revenue, GNMA/FNMA/FHLMC Insured) | | | 5.30 | | | | 12-1-2039 | | | | 109,782 | | | | 114,133 | |
Duluth MN Duluth Entertainment Convention Center Improvements Series A (GO) | | | 5.00 | | | | 2-1-2034 | | | | 1,000,000 | | | | 1,091,970 | |
Duluth MN Housing & RDA Lease Revenue Bonds Public School Academy Series 2010A (Education Revenue) | | | 5.60 | | | | 11-1-2030 | | | | 2,000,000 | | | | 2,137,320 | |
Elk River MN Independent School District #728 Series A (GO, AGM Insured) | | | 5.00 | | | | 2-1-2021 | | | | 3,400,000 | | | | 3,564,458 | |
Falcon Heights MN Kaleidoscope Charter School Series A (Education Revenue) | | | 5.50 | | | | 11-1-2017 | | | | 395,000 | | | | 411,183 | |
Falcon Heights MN Kaleidoscope Charter School Series A (Education Revenue) | | | 6.00 | | | | 11-1-2027 | | | | 1,870,000 | | | | 1,957,404 | |
The accompanying notes are an integral part of these financial statements.
| | | | |
| 8 | | Wells Fargo Advantage Minnesota Tax-Free Fund | | Portfolio of investments—December 31, 2014 (unaudited) |
| | | | | | | | | | | | | | | | |
| Security name | | Interest rate | | | Maturity date | | | Principal | | | Value | |
| | | | |
| Minnesota (continued) | | | | | | | | | | | | | | | | |
Forest Lakes MN Charter School Lease Revenue Bonds Lakes International Language Academy Project Series 2014A (Education Revenue) | | | 5.50 | % | | | 8-1-2036 | | | $ | 500,000 | | | $ | 549,460 | |
Glencoe MN HCFR Glencoe Regional Health Services Project Series 2013 (Health Revenue) | | | 1.50 | | | | 4-1-2016 | | | | 570,000 | | | | 574,418 | |
Glencoe MN HCFR Glencoe Regional Health Services Project Series 2013 (Health Revenue) | | | 4.00 | | | | 4-1-2022 | | | | 735,000 | | | | 781,334 | |
Goodhue County MN Education District #6051 Red Wing Certificates of Participation Series 2014A (Miscellaneous Revenue) | | | 5.00 | | | | 2-1-2029 | | | | 750,000 | | | | 863,963 | |
Hugo MN Charter School Lease Revenue Bonds Noble Academy Project Series 2014A (Education Revenue) | | | 5.00 | | | | 7-1-2029 | | | | 600,000 | | | | 647,526 | |
Hutchinson MN Public Utility Revenue Refunding Bonds Series 2012A (Utilities Revenue) | | | 5.00 | | | | 12-1-2026 | | | | 700,000 | | | | 809,501 | |
Lakeville MN (Tobacco Revenue) | | | 5.00 | | | | 2-1-2016 | | | | 180,000 | | | | 183,418 | |
Maple Grove MN Maple Grove Hospital Corporation (Health Revenue) | | | 5.25 | | | | 5-1-2024 | | | | 1,735,000 | | | | 1,852,338 | |
Meeker County MN Memorial Hospital Project Series 2007 (Health Revenue) | | | 5.63 | | | | 11-1-2022 | | | | 800,000 | | | | 850,104 | |
Minneapolis & St. Paul MN Housing & RDA Children’s Health Care Facilities Series A (Health Revenue) | | | 5.25 | | | | 8-15-2025 | | | | 1,000,000 | | | | 1,152,090 | |
Minneapolis & St. Paul MN Housing & RDA Children’s Health Care Facilities Series A (Health Revenue) | | | 5.25 | | | | 8-15-2035 | | | | 1,000,000 | | | | 1,128,260 | |
Minneapolis & St. Paul MN Housing & RDA Health Care Facilities Series A (Health Revenue, AGM Insured, U.S. Bank NA SPA) ø | | | 0.04 | | | | 8-15-2034 | | | | 575,000 | | | | 575,000 | |
Minneapolis & St. Paul MN Housing & RDA HealthSpan Series B (Health Revenue, Ambac Insured) ±(m)(n) | | | 0.06 | | | | 11-15-2017 | | | | 2,320,000 | | | | 2,227,200 | |
Minneapolis & St. Paul MN Metropolitan Airports Commission Sub Series 2014A (Airport Revenue) | | | 5.00 | | | | 1-1-2029 | | | | 500,000 | | | | 583,945 | |
Minneapolis & St. Paul MN Metropolitan Airports Commission Sub Series 2014B (Airport Revenue) | | | 5.00 | | | | 1-1-2026 | | | | 500,000 | | | | 579,645 | |
Minneapolis & St. Paul MN Metropolitan Airports Commission Sub Series B (Airport Revenue, National Insured) | | | 5.00 | | | | 1-1-2018 | | | | 1,000,000 | | | | 1,088,810 | |
Minneapolis MN Charter School Yinghua Academy Project Series 2013A (Education Revenue) | | | 5.00 | | | | 7-1-2023 | | | | 300,000 | | | | 315,474 | |
Minneapolis MN Development Limited Tax Supported Common Bond Series 1A (Miscellaneous Revenue) | | | 4.80 | | | | 12-1-2016 | | | | 555,000 | | | | 579,759 | |
Minneapolis MN Development Limited Tax Supported Common Bond Series 2A (Miscellaneous Revenue) | | | 5.00 | | | | 6-1-2028 | | | | 1,115,000 | | | | 1,154,449 | |
Minneapolis MN Development Limited Tax Supported Common Bond Series 2A (Miscellaneous Revenue) | | | 6.00 | | | | 12-1-2040 | | | | 1,000,000 | | | | 1,186,860 | |
Minneapolis MN Fairview Health Services Series A (Health Revenue, AGM Insured) | | | 6.63 | | | | 11-15-2028 | | | | 1,000,000 | | | | 1,182,940 | |
Minneapolis MN Fairview Health Services Series B (Health Revenue, AGM Insured) | | | 6.50 | | | | 11-15-2038 | | | | 2,235,000 | | | | 2,612,469 | |
Minneapolis MN St. Anthony Falls Project Series 2005 (Tax Revenue) | | | 5.65 | | | | 2-1-2027 | | | | 500,000 | | | | 500,405 | |
Minneapolis MN Student Housing Riverton Community Housing Project Series 2014 (Housing Revenue) | | | 5.00 | | | | 8-1-2032 | | | | 860,000 | | | | 884,372 | |
Minnesota Agricultural & Economic Development Board Health Care Essentia Health Series C1 (Health Revenue, AGM Insured) | | | 4.00 | | | | 2-15-2020 | | | | 50,000 | | | | 55,460 | |
Minnesota Agricultural & Economic Development Board Health Care Essentia Health Series C1 (Health Revenue, AGM Insured) | | | 5.00 | | | | 2-15-2030 | | | | 2,000,000 | | | | 2,201,520 | |
Minnesota Agricultural & Economic Development Board Health Care Essentia Health Series E (Health Revenue, AGM Insured) | | | 5.00 | | | | 2-15-2037 | | | | 4,030,000 | | | | 4,279,497 | |
Minnesota Agricultural & Economic Development Board Health Care System Fairview Hospital Series 1997A (Health Revenue, National Insured) | | | 5.50 | | | | 11-15-2017 | | | | 695,000 | | | | 697,877 | |
Minnesota General Fund Revenue Appropriation Bonds Series 2012B (Miscellaneous Revenue) | | | 5.00 | | | | 3-1-2027 | | | | 2,000,000 | | | | 2,376,940 | |
The accompanying notes are an integral part of these financial statements.
| | | | | | |
| Portfolio of investments—December 31, 2014 (unaudited) | | Wells Fargo Advantage Minnesota Tax-Free Fund | | | 9 | |
| | | | | | | | | | | | | | | | |
| Security name | | Interest rate | | | Maturity date | | | Principal | | | Value | |
| | | | |
| Minnesota (continued) | | | | | | | | | | | | | | | | |
Minnesota General Fund Revenue Appropriation Bonds Series 2012B (Miscellaneous Revenue) | | | 5.00 | % | | | 3-1-2029 | | | $ | 2,000,000 | | | $ | 2,345,720 | |
Minnesota General Fund Revenue Appropriation Bonds Series 2014A (Miscellaneous Revenue) | | | 5.00 | | | | 6-1-2033 | | | | 1,000,000 | | | | 1,170,470 | |
Minnesota HEFAR Bethel University Series 6R (Education Revenue) | | | 5.50 | | | | 5-1-2025 | | | | 1,535,000 | | | | 1,601,036 | |
Minnesota HEFAR Carleton College Series 7D (Education Revenue) | | | 5.00 | | | | 3-1-2030 | | | | 2,000,000 | | | | 2,253,100 | |
Minnesota HEFAR College of St. Scholastica Incorporated Series 7R (Education Revenue) | | | 4.25 | | | | 12-1-2027 | | | | 400,000 | | | | 414,224 | |
Minnesota HEFAR Hamline University Series 7E (Education Revenue) | | | 4.50 | | | | 10-1-2021 | | | | 300,000 | | | | 328,905 | |
Minnesota HEFAR Hamline University Series 7E (Education Revenue) | | | 5.00 | | | | 10-1-2029 | | | | 500,000 | | | | 546,625 | |
Minnesota HEFAR St. Benedict College Series 7M (Education Revenue) | | | 5.13 | | | | 3-1-2036 | | | | 275,000 | | | | 299,057 | |
Minnesota HEFAR St. Benedict College Series 7V (Education Revenue) | | | 5.00 | | | | 3-1-2018 | | | | 635,000 | | | | 697,484 | |
Minnesota HEFAR St. Olaf College Series 7F (Education Revenue) | | | 4.50 | | | | 10-1-2030 | | | | 500,000 | | | | 535,240 | |
Minnesota HEFAR St. Thomas University Series 6W (Education Revenue) | | | 5.00 | | | | 10-1-2018 | | | | 1,100,000 | | | | 1,184,007 | |
Minnesota HEFAR St. Thomas University Series 6W (Education Revenue) | | | 6.00 | | | | 10-1-2025 | | | | 1,030,000 | | | | 1,120,733 | |
Minnesota HEFAR St. Thomas University Series 6W (Education Revenue) | | | 6.00 | | | | 10-1-2030 | | | | 1,000,000 | | | | 1,073,350 | |
Minnesota HEFAR St. Thomas University Series 6X (Education Revenue) | | | 5.00 | | | | 4-1-2029 | | | | 1,000,000 | | | | 1,076,790 | |
Minnesota HEFAR St. Thomas University Series 7U (Education Revenue) | | | 5.00 | | | | 4-1-2017 | | | | 655,000 | | | | 715,221 | |
Minnesota HEFAR St. Thomas University Series 7U (Education Revenue) | | | 5.00 | | | | 4-1-2023 | | | | 750,000 | | | | 899,648 | |
Minnesota Housing Finance Agency Residential Housing Series 2007Q (Housing Revenue) | | | 5.25 | | | | 7-1-2033 | | | | 940,000 | | | | 970,400 | |
Minnesota Housing Finance Agency Residential Housing Series 2009E (Housing Revenue) | | | 4.20 | | | | 7-1-2021 | | | | 1,180,000 | | | | 1,213,087 | |
Minnesota Housing Finance Agency Residential Housing Series 2012D (Housing Revenue, GNMA/FNMA/FHLMC Insured) | | | 4.00 | | | | 7-1-2040 | | | | 1,045,000 | | | | 1,102,465 | |
Minnesota Housing Finance Agency Series 2009B (Housing Revenue) | | | 5.90 | | | | 7-1-2028 | | | | 160,000 | | | | 166,277 | |
Minnesota Municipal Power Agency Series 2007 (Utilities Revenue) | | | 5.00 | | | | 10-1-2037 | | | | 1,200,000 | | | | 1,304,316 | |
Minnesota Municipal Power Agency Series 2010A & Series 2010B (Utilities Revenue) | | | 5.00 | | | | 10-1-2025 | | | | 2,335,000 | | | | 2,670,633 | |
Minnesota Prerefunded (GO) | | | 5.00 | | | | 8-1-2022 | | | | 100,000 | | | | 111,184 | |
Minnesota Unrefunded (GO) | | | 5.00 | | | | 6-1-2020 | | | | 185,000 | | | | 196,786 | |
Minnesota Unrefunded (GO) | | | 5.00 | | | | 8-1-2022 | | | | 2,400,000 | | | | 2,667,456 | |
Minnesota Various Purposes Series 2010D (GO) | | | 5.00 | | | | 8-1-2022 | | | | 1,500,000 | | | | 1,753,725 | |
Montgomery MN Independent School District School Building #394 Series B (GO, AGM Insured) | | | 5.00 | | | | 2-1-2025 | | | | 500,000 | | | | 523,495 | |
Mounds View MN Independent School District #621 Series A (GO, South Dakota Credit Program Insured) | | | 4.00 | | | | 2-1-2022 | | | | 530,000 | | | | 577,117 | |
Mower County MN Housing & RDA Facilities Project Series A (Miscellaneous Revenue) | | | 5.75 | | | | 2-1-2027 | | | | 695,000 | | | | 735,477 | |
Mower County MN Housing & RDA Facilities Project Series A (Miscellaneous Revenue) | | | 5.90 | | | | 2-1-2029 | | | | 375,000 | | | | 397,448 | |
Northeast Minnesota Metropolitan Intermediate School District #916 Certificate of Participation Series 2013A (Miscellaneous Revenue) | | | 4.00 | | | | 2-1-2024 | | | | 1,100,000 | | | | 1,206,062 | |
Northern Minnesota Municipal Power Agency Series 2008A (Utilities Revenue, AGM Insured) | | | 5.00 | | | | 1-1-2018 | | | | 820,000 | | | | 915,669 | |
Northern Minnesota Municipal Power Agency Series 2008A (Utilities Revenue, AGM Insured) | | | 5.00 | | | | 1-1-2021 | | | | 50,000 | | | | 55,395 | |
Northern Minnesota Municipal Power Agency Series 2013A (Utilities Revenue) | | | 4.00 | | | | 1-1-2028 | | | | 450,000 | | | | 483,120 | |
Otsego MN Charter School Kaleidoscope Charter School Project Series 2014A (Education Revenue) | | | 4.15 | | | | 9-1-2024 | | | | 600,000 | | | | 612,444 | |
Otsego MN Charter School Kaleidoscope Charter School Project Series 2014A (Education Revenue) | | | 5.00 | | | | 9-1-2034 | | | | 1,100,000 | | | | 1,134,826 | |
Pine County MN Housing & RDA Public Project Series A (Miscellaneous Revenue) | | | 5.00 | | | | 2-1-2028 | | | | 1,475,000 | | | | 1,548,116 | |
Plymouth MN Certificate of Participation Intermediate School District #287 Series A (Miscellaneous Revenue) | | | 5.00 | | | | 2-1-2024 | | | | 250,000 | | | | 286,175 | |
The accompanying notes are an integral part of these financial statements.
| | | | |
| 10 | | Wells Fargo Advantage Minnesota Tax-Free Fund | | Portfolio of investments—December 31, 2014 (unaudited) |
| | | | | | | | | | | | | | | | |
| Security name | | Interest rate | | | Maturity date | | | Principal | | | Value | |
| | | | |
| Minnesota (continued) | | | | | | | | | | | | | | | | |
Red Wing MN Senior Housing Deer Crest Project Series A (Health Revenue) | | | 5.00 | % | | | 11-1-2032 | | | $ | 660,000 | | | $ | 696,419 | |
Red Wing MN Senior Housing Deer Crest Project Series A (Health Revenue) | | | 5.00 | | | | 11-1-2042 | | | | 560,000 | | | | 582,898 | |
Rochester MN Electric Utility Revenue Series 2007C (Utilities Revenue) | | | 5.00 | | | | 12-1-2030 | | | | 1,000,000 | | | | 1,069,640 | |
Rochester MN Electric Utility Revenue Series 2013B (Utilities Revenue) | | | 5.00 | | | | 12-1-2023 | | | | 815,000 | | | | 1,003,273 | |
Rochester MN Electric Utility Revenue Series 2013B (Utilities Revenue) | | | 5.00 | | | | 12-1-2025 | | | | 315,000 | | | | 382,779 | |
Rochester MN Electric Utility Revenue Series 2013B (Utilities Revenue) | | | 5.00 | | | | 12-1-2026 | | | | 250,000 | | | | 302,190 | |
Rochester MN HCFR Mayo Clinic Series 2011 (Health Revenue) ± | | | 4.50 | | | | 11-15-2038 | | | | 500,000 | | | | 578,275 | |
Shakopee MN St. Francis Regional Medical Center Series 2014 (Health Revenue) | | | 5.00 | | | | 9-1-2027 | | | | 700,000 | | | | 824,411 | |
Shakopee MN St. Francis Regional Medical Center Series 2014 (Health Revenue) | | | 5.00 | | | | 9-1-2029 | | | | 325,000 | | | | 378,290 | |
South St. Paul MN Housing & RDA Airport Project Series 2007 (Industrial Development Revenue, AGM Insured) | | | 4.70 | | | | 9-1-2019 | | | | 365,000 | | | | 387,101 | |
South St. Paul MN Housing & RDA Airport Project Series 2007 (Industrial Development Revenue, AGM Insured) | | | 5.13 | | | | 9-1-2029 | | | | 500,000 | | | | 528,745 | |
Southern Minnesota Municipal Power Agency CAB Series 1994A (Utilities Revenue, National Insured) ¤ | | | 0.00 | | | | 1-1-2020 | | | | 5,100,000 | | | | 4,621,518 | |
Southern Minnesota Municipal Power Agency Series 2006A (Utilities Revenue, National Insured) ± | | | 2.57 | | | | 1-1-2015 | | | | 1,030,000 | | | | 1,030,000 | |
Southern Minnesota Municipal Power Agency Series 2009A (Utilities Revenue) | | | 5.25 | | | | 1-1-2030 | | | | 2,000,000 | | | | 2,234,800 | |
St. Cloud MN CentraCare Health System Series 2010A (Health Revenue) | | | 5.13 | | | | 5-1-2030 | | | | 2,015,000 | | | | 2,261,455 | |
St. Louis Park MN Nicollett Health Services Series 2009 (Health Revenue) | | | 5.50 | | | | 7-1-2029 | | | | 1,000,000 | | | | 1,131,490 | |
St. Paul MN Housing & RDA Allina Health Systems Series A1 (Health Revenue) | | | 5.00 | | | | 11-15-2024 | | | | 2,000,000 | | | | 2,260,220 | |
St. Paul MN Housing & RDA Charter School Lease Revenue German Immersion School Series A (Education Revenue) | | | 4.00 | | | | 7-1-2023 | | | | 250,000 | | | | 248,398 | |
St. Paul MN Housing & RDA Charter School Nova Classical Academy Series A (Miscellaneous Revenue) | | | 6.63 | | | | 9-1-2042 | | | | 865,000 | | | | 986,481 | |
St. Paul MN Housing & RDA Community of Peace Academy Project Series A (Education Revenue) | | | 5.00 | | | | 12-1-2036 | | | | 1,500,000 | | | | 1,512,105 | |
St. Paul MN Housing & RDA Gillette Children’s Specialty Healthcare Project Series 2005 (Health Revenue) | | | 5.00 | | | | 2-1-2015 | | | | 200,000 | | | | 200,612 | |
St. Paul MN Housing & RDA Gillette Children’s Specialty Healthcare Project Series 2010 (Health Revenue) | | | 5.00 | | | | 2-1-2021 | | | | 500,000 | | | | 501,690 | |
St. Paul MN Housing & RDA Hmong Academy Project Series A (Education Revenue) | | | 5.75 | | | | 9-1-2026 | | | | 650,000 | | | | 662,753 | |
St. Paul MN Housing & RDA Hmong Academy Project Series A (Education Revenue) | | | 6.00 | | | | 9-1-2036 | | | | 500,000 | | | | 509,865 | |
St. Paul MN Housing & RDA Hope Community Academy Project Series A (Miscellaneous Revenue) | | | 6.25 | | | | 12-1-2019 | | | | 335,000 | | | | 341,697 | |
St. Paul MN Housing & RDA Maryland Park Apartment Project Series 2014 (Housing Revenue) | | | 0.55 | | | | 6-1-2016 | | | | 1,000,000 | | | | 1,000,030 | |
St. Paul MN Housing & RDA Parking Facilities Project Series A (Transportation Revenue) | | | 5.00 | | | | 8-1-2035 | | | | 875,000 | | | | 979,239 | |
St. Paul MN Housing & RDA St. Paul Academy & Summit School Project (Education Revenue) | | | 5.00 | | | | 10-1-2024 | | | | 2,000,000 | | | | 2,119,540 | |
St. Paul MN Housing & RDA St. Paul Conservatory for Performing Artists Series A (Education Revenue) | | | 4.00 | | | | 3-1-2028 | | | | 150,000 | | | | 147,132 | |
St. Paul MN Port Authority Lease Revenue Freeman Office Building Series 2 (Miscellaneous Revenue) | | | 5.00 | | | | 12-1-2024 | | | | 2,000,000 | | | | 2,423,620 | |
Todd Morrison Cass & Wadena Counties MN United Hospital District Lakewood Health System Series 2004 (GO) | | | 5.13 | | | | 12-1-2024 | | | | 1,000,000 | | | | 1,003,470 | |
University of Minnesota Series 2009A (Education Revenue) | | | 5.00 | | | | 4-1-2021 | | | | 1,180,000 | | | | 1,353,720 | |
University of Minnesota Series 2009A (Education Revenue) | | | 5.13 | | | | 4-1-2034 | | | | 1,000,000 | | | | 1,135,560 | |
University of Minnesota State Supported Biomedical Science Series 2011B (Education Revenue) | | | 5.00 | | | | 8-1-2036 | | | | 1,000,000 | | | | 1,128,840 | |
University of Minnesota State Supported Stadium Debt Series 2006 (Education Revenue) | | | 5.00 | | | | 8-1-2025 | | | | 5,000,000 | | | | 5,346,900 | |
The accompanying notes are an integral part of these financial statements.
| | | | | | |
| Portfolio of investments—December 31, 2014 (unaudited) | | Wells Fargo Advantage Minnesota Tax-Free Fund | | | 11 | |
| | | | | | | | | | | | | | | | |
| Security name | | Interest rate | | | Maturity date | | | Principal | | | Value | |
| | | | |
| Minnesota (continued) | | | | | | | | | | | | | | | | |
Virginia MN Housing & RDA HCFR Series 2005 (Miscellaneous Revenue) | | | 5.25 | % | | | 10-1-2025 | | | $ | 2,085,000 | | | $ | 2,119,090 | |
Washington County MN Capital Improvement Plan Series A (GO) | | | 5.00 | | | | 2-1-2021 | | | | 2,495,000 | | | | 2,755,253 | |
Western Minnesota Municipal Power Agency (Utilities Revenue, National Insured) | | | 9.75 | | | | 1-1-2016 | | | | 180,000 | | | | 190,224 | |
Western Minnesota Municipal Power Agency Series A (Utilities Revenue) | | | 5.00 | | | | 1-1-2027 | | | | 1,565,000 | | | | 1,859,580 | |
Western Minnesota Municipal Power Agency Series A (Utilities Revenue) | | | 5.00 | | | | 1-1-2030 | | | | 1,000,000 | | | | 1,172,340 | |
Western Minnesota Municipal Power Agency Series A (Utilities Revenue) | | | 5.00 | | | | 1-1-2032 | | | | 1,250,000 | | | | 1,472,881 | |
Willmar MN Rice Memorial Hospital Project Series 2012A (GO) | | | 5.00 | | | | 2-1-2026 | | | | 1,000,000 | | | | 1,157,190 | |
Winona MN Health Care Facilities Refunding Revenue Series 2012 (Health Revenue) | | | 3.00 | | | | 7-1-2018 | | | | 295,000 | | | | 304,824 | |
Winona MN Health Care Facilities Refunding Revenue Series 2012 (Health Revenue) | | | 5.00 | | | | 7-1-2034 | | | | 500,000 | | | | 539,645 | |
Woodbury MN Charter School Series A (Education Revenue) | | | 2.40 | | | | 12-1-2015 | | | | 180,000 | | | | 180,763 | |
Woodbury MN Charter School Series A (Education Revenue) | | | 3.15 | | | | 12-1-2018 | | | | 190,000 | | | | 193,439 | |
Woodbury MN Charter School Series A (Education Revenue) | | | 3.90 | | | | 12-1-2022 | | | | 220,000 | | | | 228,503 | |
Woodbury MN Charter School Series A (Education Revenue) | | | 5.00 | | | | 12-1-2027 | | | | 215,000 | | | | 231,039 | |
Woodbury MN Charter School Series A (Education Revenue) | | | 5.00 | | | | 12-1-2032 | | | | 220,000 | | | | 232,806 | |
| | | | |
| | | | | | | | | | | | | | | 148,801,526 | |
| | | | | | | | | | | | | | | | |
| | | | |
| Puerto Rico: 2.04% | | | | | | | | | | | | | | | | |
Puerto Rico Electric Power Authority Refunding Bond Series KK (Utilities Revenue, National Insured) | | | 5.50 | | | | 7-1-2016 | | | | 805,000 | | | | 830,712 | |
Puerto Rico Government Development Bank Series 1985 (Miscellaneous Revenue, National Insured) | | | 4.75 | | | | 12-1-2015 | | | | 400,000 | | | | 401,368 | |
Puerto Rico Government Development Bank Series 3402 (Miscellaneous Revenue, Morgan Stanley Bank LIQ) 144Aø | | | 0.50 | | | | 6-30-2015 | | | | 2,000,000 | | | | 2,000,000 | |
| | | | |
| | | | | | | | | | | | | | | 3,232,080 | |
| | | | | | | | | | | | | | | | |
| | | | |
| Virgin Islands: 0.36% | | | | | | | | | | | | | | | | |
Virgin Islands PFA Matching Fund Loan Notes Senior Lien Series B (Miscellaneous Revenue, AGM Insured) | | | 5.00 | | | | 10-1-2025 | | | | 500,000 | | | | 560,880 | |
| | | | | | | | | | | | | | | | |
| | | |
Total Municipal Obligations (Cost $145,991,658) | | | | | | | | | | | | 155,243,176 | |
| | | | | | | | | | | | | | | | |
| | | | | | | | |
| Total investments in securities (Cost $145,991,658) * | | | 98.20 | % | | | 155,243,176 | |
Other assets and liabilities, net | | | 1.80 | | | | 2,839,337 | |
| | | | | | | | |
| Total net assets | | | 100.00 | % | | $ | 158,082,513 | |
| | | | | | | | |
| ¤ | The security is issued in zero coupon form with no periodic interest payments. |
| ø | Variable rate demand notes are subject to a demand feature which reduces the effective maturity. The maturity date shown represents the final maturity date of the security. The interest rate is determined and reset by the issuer daily, weekly, or monthly depending upon the terms of the security. The rate shown is the rate in effect at period end. |
| ± | Variable rate investment. The rate shown is the rate in effect at period end. |
| (m) | The security is an auction-rate security which has an interest rate that resets at predetermined short-term intervals through a Dutch auction. The rate shown is the rate in effect at period end. |
| (n) | The auction to set the interest rate on the security failed at period end due to insufficient investor interest. A failed auction does not itself cause a default. |
| 144A | The security may be resold in transactions exempt from registration, normally to qualified institutional buyers, pursuant to Rule 144A under the Securities Act of 1933. |
| * | Cost for federal income tax purposes is $145,989,319 and unrealized gains (losses) consists of: |
| | | | |
Gross unrealized gains | | $ | 9,264,079 | |
Gross unrealized losses | | | (10,222 | ) |
| | | | |
Net unrealized gains | | $ | 9,253,857 | |
The accompanying notes are an integral part of these financial statements.
| | | | |
| 12 | | Wells Fargo Advantage Minnesota Tax-Free Fund | | Statement of assets and liabilities—December 31, 2014 (unaudited) |
| | | | |
| | | | |
| |
Assets | | | | |
Investments in unaffiliated securities, at value (cost $145,991,658) | | $ | 155,243,176 | |
Cash | | | 824,186 | |
Receivable for investments sold | | | 185,236 | |
Receivable for Fund shares sold | | | 125,504 | |
Receivable for interest | | | 2,054,344 | |
Prepaid expenses and other assets | | | 18,612 | |
| | | | |
Total assets | | | 158,451,058 | |
| | | | |
| |
Liabilities | | | | |
Dividends payable | | | 107,827 | |
Payable for Fund shares redeemed | | | 143,321 | |
Advisory fee payable | | | 26,558 | |
Distribution fees payable | | | 6,159 | |
Administration fees payable | | | 23,525 | |
Shareholder servicing fees payable | | | 34,479 | |
Accrued expenses and other liabilities | | | 26,676 | |
| | | | |
Total liabilities | | | 368,545 | |
| | | | |
Total net assets | | $ | 158,082,513 | |
| | | | |
| |
NET ASSETS CONSIST OF | | | | |
Paid-in capital | | $ | 148,323,234 | |
Undistributed net investment income | | | 503,931 | |
Accumulated net realized gains on investments | | | 3,830 | |
Net unrealized gains on investments | | | 9,251,518 | |
| | | | |
Total net assets | | $ | 158,082,513 | |
| | | | |
| |
COMPUTATION OF NET ASSET VALUE AND OFFERING PRICE PER SHARE | | | | |
Net assets – Class A | | $ | 44,717,844 | |
Shares outstanding – Class A1 | | | 4,093,303 | |
Net asset value per share – Class A | | | $10.92 | |
Maximum offering price per share – Class A2 | | | $11.43 | |
Net assets – Class C | | $ | 9,508,876 | |
Shares outstanding – Class C1 | | | 870,449 | |
Net asset value per share – Class C | | | $10.92 | |
Net assets – Administrator Class | | $ | 103,855,793 | |
Shares outstanding – Administrator Class1 | | | 9,509,484 | |
Net asset value per share – Administrator Class | | | $10.92 | |
| 1. | The Fund has an unlimited number of authorized shares. |
| 2. | Maximum offering price is computed as 100/95.50 of net asset value. On investments of $50,000 or more, the offering price is reduced. |
The accompanying notes are an integral part of these financial statements.
| | | | | | |
| Statement of operations—six months ended December 31, 2014 (unaudited) | | Wells Fargo Advantage Minnesota Tax-Free Fund | | | 13 | |
| | | | |
| | | | |
| |
Investment income | | | | |
Interest | | $ | 3,114,476 | |
| | | | |
| |
Expenses | | | | |
Advisory fee | | | 279,584 | |
Administration fees | | | | |
Fund level | | | 39,941 | |
Class A | | | 36,224 | |
Class B | | | 43 | 1 |
Class C | | | 7,354 | |
Administrator Class | | | 52,618 | |
Shareholder servicing fees | | | | |
Class A | | | 56,600 | |
Class B | | | 67 | 1 |
Class C | | | 11,491 | |
Administrator Class | | | 131,545 | |
Distribution fees | | | | |
Class B | | | 200 | 1 |
Class C | | | 34,472 | |
Custody and accounting fees | | | 5,142 | |
Professional fees | | | 21,571 | |
Registration fees | | | 10,205 | |
Shareholder report expenses | | | 10,066 | |
Trustees’ fees and expenses | | | 6,323 | |
Other fees and expenses | | | 4,593 | |
| | | | |
Total expenses | | | 708,039 | |
Less: Fee waivers and/or expense reimbursements | | | (125,923 | ) |
| | | | |
Net expenses | | | 582,116 | |
| | | | |
Net investment income | | | 2,532,360 | |
| | | | |
| |
REALIZED AND UNREALIZED GAINS (LOSSES) ON INVESTMENTS | | | | |
Net realized gains on investments | | | 346,865 | |
Net change in unrealized gains (losses) on investments | | | 1,133,832 | |
| | | | |
Net realized and unrealized gains (losses) on investments | | | 1,480,697 | |
| | | | |
Net increase in net assets resulting from operations | | $ | 4,013,057 | |
| | | | |
| 1. | For the period from July 1, 2014 to December 9, 2014. Class B shares of the Fund were no longer offered to shareholders effective December 10, 2014. |
The accompanying notes are an integral part of these financial statements.
| | | | |
| 14 | | Wells Fargo Advantage Minnesota Tax-Free Fund | | Statement of changes in net assets |
| | | | | | | | | | | | | | | | |
| | | Six months ended
December 31, 2014
(unaudited) | | | Year ended
June 30, 2014 | |
| | | | |
Operations | | | | | | | | | | | | | | | | |
Net investment income | | | | | | $ | 2,532,360 | | | | | | | $ | 5,101,614 | |
Net realized gains on investments | | | | | | | 346,865 | | | | | | | | 171,358 | |
Net change in unrealized gains (losses) on investments | | | | | | | 1,133,832 | | | | | | | | 2,493,370 | |
| | | | |
Net increase in net assets resulting from operations | | | | | | | 4,013,057 | | | | | | | | 7,766,342 | |
| | | | |
| | | | |
Distributions to shareholders from | | | | | | | | | | | | | | | | |
Net investment income | | | | | | | | | | | | | | | | |
Class A | | | | | | | (690,322 | ) | | | | | | | (1,480,210 | ) |
Class B | | | | | | | (612 | )1 | | | | | | | (2,332 | ) |
Class C | | | | | | | (105,660 | ) | | | | | | | (211,098 | ) |
Administrator Class | | | | | | | (1,735,766 | ) | | | | | | | (3,408,319 | ) |
Net realized gains | | | | | | | | | | | | | | | | |
Class A | | | | | | | (138,361 | ) | | | | | | | (341,532 | ) |
Class B | | | | | | | 0 | 1 | | | | | | | (776 | ) |
Class C | | | | | | | (28,745 | ) | | | | | | | (61,949 | ) |
Administrator Class | | | | | | | (319,450 | ) | | | | | | | (735,259 | ) |
| | | | |
Total distributions to shareholders | | | | | | | (3,018,916 | ) | | | | | | | (6,241,475 | ) |
| | | | |
| | | | |
Capital share transactions | | | Shares | | | | | | | | Shares | | | | | |
Proceeds from shares sold | | | | | | | | | | | | | | | | |
Class A | | | 164,655 | | | | 1,796,592 | | | | 390,716 | | | | 4,190,209 | |
Class C | | | 84,879 | | | | 925,407 | | | | 103,778 | | | | 1,116,883 | |
Administrator Class | | | 1,318,312 | | | | 14,346,766 | | | | 2,477,484 | | | | 26,484,566 | |
| | | | |
| | | | | | | 17,068,765 | | | | | | | | 31,791,658 | |
| | | | |
Reinvestment of distributions | | | | | | | | | | | | | | | | |
Class A | | | 74,700 | | | | 815,756 | | | | 168,243 | | | | 1,798,854 | |
Class B | | | 54 | 1 | | | 592 | 1 | | | 291 | | | | 3,108 | |
Class C | | | 12,256 | | | | 133,826 | | | | 25,511 | | | | 272,652 | |
Administrator Class | | | 124,193 | | | | 1,355,934 | | | | 227,915 | | | | 2,437,225 | |
| | | | |
| | | | | | | 2,306,108 | | | | | | | | 4,511,839 | |
| | | | |
Payment for shares redeemed | | | | | | | | | | | | | | | | |
Class A | | | (243,909 | ) | | | (2,661,608 | ) | | | (1,071,525 | ) | | | (11,449,343 | ) |
Class B | | | (7,573 | )1 | | | (82,744 | )1 | | | (3,210 | ) | | | (34,255 | ) |
Class C | | | (34,133 | ) | | | (371,971 | ) | | | (156,923 | ) | | | (1,674,184 | ) |
Administrator Class | | | (1,004,924 | ) | | | (11,001,136 | ) | | | (2,849,822 | ) | | | (30,450,811 | ) |
| | | | |
| | | | | | | (14,117,459 | ) | | | | | | | (43,608,593 | ) |
| | | | |
Net increase (decrease) in net assets resulting from capital share transactions | | | | | | | 5,257,414 | | | | | | | | (7,305,096 | ) |
| | | | |
Total increase (decrease) in net assets | | | | | | | 6,251,555 | | | | | | | | (5,780,229 | ) |
| | | | |
| | | | |
Net assets | | | | | | | | | | | | | | | | |
Beginning of period | | | | | | | 151,830,958 | | | | | | | | 157,611,187 | |
| | | | |
End of period | | | | | | $ | 158,082,513 | | | | | | | $ | 151,830,958 | |
| | | | |
Undistributed net investment income | | | | | | $ | 503,931 | | | | | | | $ | 503,931 | |
| | | | |
| 1. | For the period from July 1, 2014 to December 9, 2014. Class B shares of the Fund were no longer offered to shareholders effective December 10, 2014. |
The accompanying notes are an integral part of these financial statements.
| | | | | | |
| Financial highlights | | Wells Fargo Advantage Minnesota Tax-Free Fund | | | 15 | |
(For a share outstanding throughout each period)
| | | | | | | | | | | | | | | | | | | | | | | | |
| | | Six months ended
December 31, 2014 (unaudited) | | | Year ended June 30 | |
| CLASS A | | | 2014 | | | 2013 | | | 2012 | | | 2011 | | | 2010 | |
Net asset value, beginning of period | | | $10.86 | | | | $10.74 | | | | $11.08 | | | | $10.68 | | | | $10.75 | | | | $10.36 | |
Net investment income | | | 0.17 | | | | 0.35 | | | | 0.32 | | | | 0.37 | | | | 0.40 | | | | 0.43 | 1 |
Net realized and unrealized gains (losses) on investments | | | 0.09 | | | | 0.20 | | | | (0.31 | ) | | | 0.55 | | | | (0.05 | ) | | | 0.40 | |
| | | | | | | | | | | | | | | | | | | | | | | | |
Total from investment operations | | | 0.26 | | | | 0.55 | | | | 0.01 | | | | 0.92 | | | | 0.35 | | | | 0.83 | |
Distributions to shareholders from | | | | | | | | | | | | | | | | | | | | | | | | |
Net investment income | | | (0.17 | ) | | | (0.35 | ) | | | (0.32 | ) | | | (0.37 | ) | | | (0.40 | ) | | | (0.43 | ) |
Net realized gains | | | (0.03 | ) | | | (0.08 | ) | | | (0.03 | ) | | | (0.15 | ) | | | (0.02 | ) | | | (0.01 | ) |
| | | | | | | | | | | | | | | | | | | | | | | | |
Total distributions to shareholders | | | (0.20 | ) | | | (0.43 | ) | | | (0.35 | ) | | | (0.52 | ) | | | (0.42 | ) | | | (0.44 | ) |
Net asset value, end of period | | | $10.92 | | | | $10.86 | | | | $10.74 | | | | $11.08 | | | | $10.68 | | | | $10.75 | |
Total return2 | | | 2.42 | % | | | 5.29 | % | | | (0.01 | )% | | | 8.80 | % | | | 3.39 | % | | | 8.11 | % |
Ratios to average net assets (annualized) | | | | | | | | | | | | | | | | | | | | | | | | |
Gross expenses | | | 0.88 | % | | | 0.89 | % | | | 0.88 | % | | | 0.89 | % | | | 0.86 | % | | | 0.89 | % |
Net expenses | | | 0.85 | % | | | 0.85 | % | | | 0.85 | % | | | 0.85 | % | | | 0.85 | % | | | 0.85 | % |
Net investment income | | | 3.05 | % | | | 3.28 | % | | | 2.87 | % | | | 3.35 | % | | | 3.76 | % | | | 3.97 | % |
Supplemental data | | | | | | | | | | | | | | | | | | | | | | | | |
Portfolio turnover rate | | | 13 | %3 | | | 15 | %3 | | | 14 | %3 | | | 36 | % | | | 25 | % | | | 25 | % |
Net assets, end of period (000s omitted) | | | $44,718 | | | | $44,499 | | | | $49,535 | | | | $52,550 | | | | $52,628 | | | | $56,885 | |
| 1. | Calculated based upon average shares outstanding |
| 2. | Total return calculations do not include any sales charges. Returns for periods of less than one year are not annualized. |
| 3. | Portfolio turnover rate excludes variable rate demand notes which may account for changes from rates reported in prior periods. |
The accompanying notes are an integral part of these financial statements.
| | | | |
| 16 | | Wells Fargo Advantage Minnesota Tax-Free Fund | | Financial highlights |
(For a share outstanding throughout each period)
| | | | | | | | | | | | | | | | | | | | | | | | |
| | | Six months ended December 31, 2014 (unaudited) | | | Year ended June 30 | |
| CLASS C | | | 2014 | | | 2013 | | | 2012 | | | 2011 | | | 2010 | |
Net asset value, beginning of period | | | $10.86 | | | | $10.74 | | | | $11.08 | | | | $10.68 | | | | $10.75 | | | | $10.36 | |
Net investment income | | | 0.13 | | | | 0.27 | | | | 0.24 | | | | 0.28 | | | | 0.32 | | | | 0.35 | 1 |
Net realized and unrealized gains (losses) on investments | | | 0.09 | | | | 0.20 | | | | (0.31 | ) | | | 0.55 | | | | (0.05 | ) | | | 0.40 | |
| | | | | | | | | | | | | | | | | | | | | | | | |
Total from investment operations | | | 0.22 | | | | 0.47 | | | | (0.07 | ) | | | 0.83 | | | | 0.27 | | | | 0.75 | |
Distributions to shareholders from | | | | | | | | | | | | | | | | | | | | | | | | |
Net investment income | | | (0.13 | ) | | | (0.27 | ) | | | (0.24 | ) | | | (0.28 | ) | | | (0.32 | ) | | | (0.35 | ) |
Net realized gains | | | (0.03 | ) | | | (0.08 | ) | | | (0.03 | ) | | | (0.15 | ) | | | (0.02 | ) | | | (0.01 | ) |
| | | | | | | | | | | | | | | | | | | | | | | | |
Total distributions to shareholders | | | (0.16 | ) | | | (0.35 | ) | | | (0.27 | ) | | | (0.43 | ) | | | (0.34 | ) | | | (0.36 | ) |
Net asset value, end of period | | | $10.92 | | | | $10.86 | | | | $10.74 | | | | $11.08 | | | | $10.68 | | | | $10.75 | |
Total return2 | | | 2.04 | % | | | 4.50 | % | | | (0.76 | )% | | | 7.99 | % | | | 2.62 | % | | | 7.30 | % |
Ratios to average net assets (annualized) | | | | | | | | | | | | | | | | | | | | | | | | |
Gross expenses | | | 1.63 | % | | | 1.64 | % | | | 1.63 | % | | | 1.64 | % | | | 1.61 | % | | | 1.64 | % |
Net expenses | | | 1.60 | % | | | 1.60 | % | | | 1.60 | % | | | 1.60 | % | | | 1.60 | % | | | 1.60 | % |
Net investment income | | | 2.30 | % | | | 2.53 | % | | | 2.12 | % | | | 2.58 | % | | | 3.01 | % | | | 3.19 | % |
Supplemental data | | | | | | | | | | | | | | | | | | | | | | | | |
Portfolio turnover rate | | | 13 | %3 | | | 15 | %3 | | | 14 | %3 | | | 36 | % | | | 25 | % | | | 25 | % |
Net assets, end of period (000s omitted) | | | $9,509 | | | | $8,768 | | | | $8,972 | | | | $9,144 | | | | $7,670 | | | | $6,489 | |
| 1. | Calculated based upon average shares outstanding |
| 2. | Total return calculations do not include any sales charges. Returns for periods of less than one year are not annualized. |
| 3. | Portfolio turnover rate excludes variable rate demand notes which may account for changes from rates reported in prior periods. |
The accompanying notes are an integral part of these financial statements.
| | | | | | |
| Financial highlights | | Wells Fargo Advantage Minnesota Tax-Free Fund | | | 17 | |
(For a share outstanding throughout each period)
| | | | | | | | | | | | | | | | | | | | | | | | |
| | | Six months ended
December 31, 2014 (unaudited) | | | Year ended June 30 | |
| ADMINISTRATOR CLASS | | | 2014 | | | 2013 | | | 2012 | | | 2011 | | | 2010 | |
Net asset value, beginning of period | | | $10.86 | | | | $10.74 | | | | $11.07 | | | | $10.68 | | | | $10.75 | | | | $10.36 | |
Net investment income | | | 0.18 | | | | 0.38 | | | | 0.35 | | | | 0.39 | | | | 0.43 | 1 | | | 0.45 | 1 |
Net realized and unrealized gains (losses) on investments | | | 0.09 | | | | 0.20 | | | | (0.30 | ) | | | 0.54 | | | | (0.05 | ) | | | 0.40 | |
| | | | | | | | | | | | | | | | | | | | | | | | |
Total from investment operations | | | 0.27 | | | | 0.58 | | | | 0.05 | | | | 0.93 | | | | 0.38 | | | | 0.85 | |
Distributions to shareholders from | | | | | | | | | | | | | | | | | | | | | | | | |
Net investment income | | | (0.18 | ) | | | (0.38 | ) | | | (0.35 | ) | | | (0.39 | ) | | | (0.43 | ) | | | (0.45 | ) |
Net realized gains | | | (0.03 | ) | | | (0.08 | ) | | | (0.03 | ) | | | (0.15 | ) | | | (0.02 | ) | | | (0.01 | ) |
| | | | | | | | | | | | | | | | | | | | | | | | |
Total distributions to shareholders | | | (0.21 | ) | | | (0.46 | ) | | | (0.38 | ) | | | (0.54 | ) | | | (0.45 | ) | | | (0.46 | ) |
Net asset value, end of period | | | $10.92 | | | | $10.86 | | | | $10.74 | | | | $11.07 | | | | $10.68 | | | | $10.75 | |
Total return2 | | | 2.55 | % | | | 5.55 | % | | | 0.32 | % | | | 8.97 | % | | | 3.65 | % | | | 8.37 | % |
Ratios to average net assets (annualized) | | | | | | | | | | | | | | | | | | | | | | | | |
Gross expenses | | | 0.82 | % | | | 0.83 | % | | | 0.82 | % | | | 0.83 | % | | | 0.80 | % | | | 0.82 | % |
Net expenses | | | 0.60 | % | | | 0.60 | % | | | 0.60 | % | | | 0.60 | % | | | 0.60 | % | | | 0.60 | % |
Net investment income | | | 3.30 | % | | | 3.53 | % | | | 3.11 | % | | | 3.59 | % | | | 4.00 | % | | | 4.22 | % |
Supplemental data | | | | | | | | | | | | | | | | | | | | | | | | |
Portfolio turnover rate | | | 13 | %3 | | | 15 | %3 | | | 14 | %3 | | | 36 | % | | | 25 | % | | | 25 | % |
Net assets, end of period (000s omitted) | | | $103,856 | | | | $98,483 | | | | $98,992 | | | | $109,637 | | | | $106,412 | | | | $132,313 | |
| 1. | Calculated based upon average shares outstanding |
| 2. | Returns for periods of less than one year are not annualized. |
| 3. | Portfolio turnover rate excludes variable rate demand notes which may account for changes from rates reported in prior periods. |
The accompanying notes are an integral part of these financial statements.
| | | | |
| 18 | | Wells Fargo Advantage Minnesota Tax-Free Fund | | Notes to financial statements (unaudited) |
1. ORGANIZATION
Wells Fargo Funds Trust (the “Trust”), a Delaware statutory trust organized on March 10, 1999, is an open-end management investment company registered under the Investment Company Act of 1940, as amended (the “1940 Act”). As an investment company, the Trust follows the accounting and reporting guidance in FASB Accounting Standards Codification 946. These financial statements report on the Wells Fargo Advantage Minnesota Tax-Free Fund (the “Fund”), a series of the Trust. Originally classified as non-diversified, the Fund now is classified as a diversified open-end management investment company. Effective December 10, 2014, Class B shares of the Fund are no longer offered. Information for Class B shares reflected in the financial statements represents activity through December 9, 2014.
2. SIGNIFICANT ACCOUNTING POLICIES
The following significant accounting policies, which are consistently followed in the preparation of the financial statements of the Fund, are in conformity with U.S. generally accepted accounting principles which require management to make estimates and assumptions that affect the reported amounts of assets and liabilities, disclosure of contingent assets and liabilities at the date of the financial statements, and the reported amounts of revenues and expenses during the reporting period. Actual results could differ from those estimates.
Securities valuation
All investments are valued each business day as of the close of regular trading on the New York Stock Exchange (generally 4 p.m. Eastern Time).
Fixed income securities acquired with maturities exceeding 60 days are valued based on evaluated bid prices provided by an independent pricing service which may utilize both transaction data and market information such as yield, quality, coupon rate, maturity, type of issue, trading characteristics and other market data. If prices are not available from the independent pricing service or prices received are deemed not representative of market value, prices will be obtained from an independent broker-dealer.
Short-term securities, with maturities of 60 days or less at time of purchase, generally are valued at amortized cost which approximates fair value. The amortized cost method involves valuing a security at its cost, plus accretion of discount or minus amortization of premium over the period until maturity.
Investments which are not valued using any of the methods discussed above are valued at their fair value, as determined in good faith by the Board of Trustees of the Fund. The Board of Trustees has established a Valuation Committee comprised of the Trustees and has delegated to it the authority to take any actions regarding the valuation of portfolio securities that the Valuation Committee deems necessary or appropriate, including determining the fair value of portfolio securities, unless the determination has been delegated to the Management Valuation Team of Wells Fargo Funds Management, LLC (“Funds Management”). The Board of Trustees retains the authority to make or ratify any valuation decisions or approve any changes to the Valuation Procedures as it deems appropriate. On a quarterly basis, the Board of Trustees receives reports on any valuation actions taken by the Valuation Committee or the Management Valuation Team which may include items for ratification.
Valuations of fair valued securities are compared to the next actual sales price when available, or other appropriate market values, to assess the continued appropriateness of the fair valuation methodologies used. These securities are fair valued on a day-to-day basis, taking into consideration changes to appropriate market information and any significant changes to the inputs considered in the valuation process until there is a readily available price provided on an exchange or by an independent pricing service. Valuations received from an independent pricing service or independent broker-dealer quotes are periodically validated by comparisons to most recent trades and valuations provided by other independent pricing services in addition to the review of prices by the adviser and/or subadviser. Unobservable inputs used in determining fair valuations are identified based on the type of security, taking into consideration factors utilized by market participants in valuing the investment, knowledge about the issuer and the current market environment.
When-issued transactions
The Fund may purchase securities on a forward commitment or when-issued basis. The Fund records a when-issued transaction on the trade date and will segregate assets in an amount at least equal in value to the Fund’s commitment to purchase when-issued securities. Securities purchased on a when-issued basis are marked-to-market daily and the Fund begins earning interest on the settlement date. Losses may arise due to changes in the market value of the underlying securities or if the counterparty does not perform under the contract.
Security transactions and income recognition
Securities transactions are recorded on a trade date basis. Realized gains or losses are recorded on the basis of identified cost.
| | | | | | |
| Notes to financial statements (unaudited) | | Wells Fargo Advantage Minnesota Tax-Free Fund | | | 19 | |
Interest income is accrued daily and bond discounts are accreted and premiums are amortized daily based on the effective interest method. To the extent debt obligations are placed on non-accrual status, any related interest income may be reduced by writing off interest receivables when the collection of all or a portion of interest has become doubtful based on consistently applied procedures. If the issuer subsequently resumes interest payments or when the collectability of interest is reasonably assured, the debt obligation is removed from non-accrual status.
Distributions to shareholders
Distributions to shareholders from net investment income are accrued daily and paid monthly. Distributions from net realized gains, if any, are recorded on the ex-dividend date. Such distributions are determined in conformity with federal income tax regulations, which may differ in amount or character from net investment income and realized gains recognized for purposes of U.S. generally accepted accounting principles.
Federal and other taxes
The Fund intends to continue to qualify as a regulated investment company by distributing substantially all of its investment company taxable and tax-exempt income and any net realized capital gains (after reduction for capital loss carryforwards) sufficient to relieve it from all, or substantially all, federal income taxes. Accordingly, no provision for federal income taxes was required.
The Fund’s income and federal excise tax returns and all financial records supporting those returns for the prior three fiscal years are subject to examination by the federal and Delaware revenue authorities. Management has analyzed the Fund’s tax positions taken on federal, state, and foreign tax returns for all open tax years and does not believe that there are any uncertain tax positions that require recognition of a tax liability.
Class allocations
The separate classes of shares offered by the Fund differ principally in applicable sales charges, distribution, shareholder servicing, and administration fees. Class specific expenses are charged directly to that share class. Investment income, common expenses, and realized and unrealized gains (losses) on investments are allocated daily to each class of shares based on the relative proportion of net assets of each class.
3. FAIR VALUATION MEASUREMENTS
Fair value measurements of investments are determined within a framework that has established a fair value hierarchy based upon the various data inputs utilized in determining the value of the Fund’s investments. The three-level hierarchy gives the highest priority to unadjusted quoted prices in active markets for identical assets or liabilities (Level 1) and the lowest priority to significant unobservable inputs (Level 3). The Fund’s investments are classified within the fair value hierarchy based on the lowest level of input that is significant to the fair value measurement. The inputs are summarized into three broad levels as follows:
| n | | Level 1 – quoted prices in active markets for identical securities |
| n | | Level 2 – other significant observable inputs (including quoted prices for similar securities, interest rates, prepayment speeds, credit risk, use of amortized cost, etc.) |
| n | | Level 3 – significant unobservable inputs (including the Fund’s own assumptions in determining the fair value of investments) |
The inputs or methodologies used for valuing investments in securities are not necessarily an indication of the risk associated with investing in those securities.
The following is a summary of the inputs used in valuing the Fund’s assets and liabilities as of December 31, 2014:
| | | | | | | | | | | | | | | | |
| | | Quoted prices
(Level 1) | | | Other significant
observable inputs
(Level 2) | | | Significant
unobservable inputs
(Level 3) | | | Total | |
Assets | | | | | | | | | | | | | | | | |
Investments in: | | | | | | | | | | | | | | | | |
| | | | |
Municipal obligations | | $ | 0 | | | $ | 153,015,976 | | | $ | 2,227,200 | | | $ | 155,243,176 | |
Transfers in and transfers out are recognized at the end of the reporting period. At December 31, 2014, the Fund did not have any transfers between Level 1 and Level 2.
| | | | |
| 20 | | Wells Fargo Advantage Minnesota Tax-Free Fund | | Notes to financial statements (unaudited) |
The following is a reconciliation of assets in which significant unobservable inputs (Level 3) were used in determining fair value:
| | | | |
| | | Municipal
obligations | |
Balance as of June 30, 2014 | | $ | 1,910,000 | |
Accrued discounts (premiums) | | | 0 | |
Realized gains (losses) | | | 2,500 | |
Change in unrealized gains (losses) | | | 5,200 | |
Purchases | | | 409,500 | |
Sales | | | (100,000 | ) |
Transfers into Level 3 | | | 0 | |
Transfers out of Level 3 | | | 0 | |
Balance as of December 31, 2014 | | $ | 2,227,200 | |
Change in unrealized gains (losses) relating to securities still held at December 31, 2014 | | $ | 11,600 | |
The investment type categorized above was valued using an indicative broker quote. The indicative quote is considered a Level 3 input. Quantitative unobservable inputs used by the brokers are often proprietary and not provided to the Fund and therefore the disclosure that would address these inputs is not included above.
4. TRANSACTIONS WITH AFFILIATES
Advisory fee
The Trust has entered into an advisory contract with Funds Management, an indirect wholly owned subsidiary of Wells Fargo & Company (“Wells Fargo”). The adviser is responsible for implementing investment policies and guidelines and for supervising the subadviser, who is responsible for day-to-day portfolio management of the Fund.
Pursuant to the contract, Funds Management is entitled to receive an annual advisory fee starting at 0.35% and declining to 0.25% as the average daily net assets of the Fund increase. For the six months ended December 31, 2014, the advisory fee was equivalent to an annual rate of 0.35% of the Fund’s average daily net assets.
Funds Management has retained the services of a subadviser to provide daily portfolio management to the Fund. The fee for subadvisory services is borne by Funds Management. Wells Capital Management Incorporated, an affiliate of Funds Management and an indirect wholly owned subsidiary of Wells Fargo, is the subadviser to the Fund and is entitled to receive a fee from Funds Management at an annual rate starting at 0.20% and declining to 0.10% as the average daily net assets of the Fund increase.
Administration fees
The Trust has entered into an administration agreement with Funds Management. Under this agreement, for providing administrative services, which includes paying fees and expenses for services provided by the transfer agent, sub-transfer agents, omnibus account servicers and record-keepers, Funds Management is entitled to receive from the Fund an annual fund level administration fee starting at 0.05% and declining to 0.03% as the average daily net assets of the Fund increase and a class level administration fee which is calculated based on the average daily net assets of each class as follows:
| | | | |
| | | Class level
administration fee | |
Class A, Class B, Class C | | | 0.16 | % |
Administrator Class | | | 0.10 | |
Funds Management has contractually waived and/or reimbursed advisory and administration fees to the extent necessary to maintain certain net operating expense ratios for the Fund. Waiver of fees and/or reimbursement of expenses by Funds Management were made first from fund level expenses on a proportionate basis and then from class specific expenses. Funds Management has committed through October 31, 2015 to waive fees and/or reimburse expenses to the extent necessary to cap the Fund’s expenses at 0.85% for Class A shares, 1.60% for Class C shares, and 0.60% for Administrator Class shares. After this time, the cap may be increased or the commitment to maintain the cap may be terminated only with the approval of the Board of Trustees.
| | | | | | |
| Notes to financial statements (unaudited) | | Wells Fargo Advantage Minnesota Tax-Free Fund | | | 21 | |
Distribution fees
The Trust has adopted a Distribution Plan for Class B and Class C shares of the Fund pursuant to Rule 12b-1 under the 1940 Act. Distribution fees are charged to Class B and Class C shares and paid to Wells Fargo Funds Distributor, LLC (“Funds Distributor”), the principal underwriter, at an annual rate of 0.75% of the average daily net assets of Class B and Class C shares.
In addition, Funds Distributor is entitled to receive the front-end sales charge from the purchase of Class A shares and a contingent deferred sales charge on the redemption of certain shares. Funds Distributor is also entitled to receive the contingent deferred sales charges from redemptions of Class B and Class C shares. For the six months ended December 31, 2014, Funds Distributor received $1,474 from the sale of Class A shares.
Shareholder servicing fees
The Trust has entered into contracts with one or more shareholder servicing agents, whereby Class A, Class C, and Administrator Class of the Fund is charged a fee at an annual rate of 0.25% of the average daily net assets of each respective class.
A portion of these total shareholder servicing fees were paid to affiliates of Wells Fargo.
5. INVESTMENT PORTFOLIO TRANSACTIONS
Purchases and sales of investments, excluding U.S. government obligations (if any) and short-term securities, for the six months ended December 31, 2014 were $23,400,833 and $20,724,735, respectively.
6. BANK BORROWINGS
The Trust (excluding the money market funds and certain other funds in the Trust) and Wells Fargo Variable Trust are parties to a $150,000,000 revolving credit agreement, whereby the Fund is permitted to use bank borrowings for temporary or emergency purposes, such as to fund shareholder redemption requests. Interest under the credit agreement is charged to the Fund based on a borrowing rate equal to the higher of the Federal Funds rate in effect on that day plus 1.25% or the overnight LIBOR rate in effect on that day plus 1.25%. In addition, an annual commitment fee equal to 0.10% of the unused balance is allocated to each participating fund. For the six months ended December 31, 2014, the Fund paid $85 in commitment fees.
For the six months ended December 31, 2014, there were no borrowings by the Fund under the agreement.
7. CONCENTRATION RISK
The Fund invests a substantial portion of its assets in issuers of municipal debt securities located in a single state or territories of the U.S. Therefore, it may be more affected by economic and political developments in that state or region than would be a comparable general tax-exempt fund.
8. INDEMNIFICATION
Under the Trust’s organizational documents, the officers and Trustees are indemnified against certain liabilities that may arise out of performance of their duties to the Trust. Additionally, in the normal course of business, the Trust may enter into contracts with service providers that contain a variety of indemnification clauses. The Trust’s maximum exposure under these arrangements is dependent on future claims that may be made against the Fund and, therefore, cannot be estimated.
| | | | |
| 22 | | Wells Fargo Advantage Minnesota Tax-Free Fund | | Other information (unaudited) |
PROXY VOTING INFORMATION
A description of the policies and procedures that the Fund uses to determine how to vote proxies relating to portfolio securities is available without charge, upon request, by calling 1-800-222-8222, visiting our website at wellsfargoadvantagefunds.com, or visiting the SEC website at sec.gov. Information regarding how the Fund voted proxies relating to portfolio securities during the most recent 12-month period ended June 30 is available on the Fund’s website at wellsfargoadvantagefunds.com or by visiting the SEC website at sec.gov.
PORTFOLIO HOLDINGS INFORMATION
The complete portfolio holdings for the Fund are publicly available monthly on the Fund’s website (wellsfargoadvantagefunds.com), on a one-month delayed basis. In addition, top ten holdings information (excluding derivative positions) for the Fund is publicly available on the Fund’s website on a monthly, seven-day or more delayed basis. The Fund files its complete schedule of portfolio holdings with the SEC for the first and third quarters of each fiscal year on Form N-Q, which is available by visiting the SEC website at sec.gov. In addition, the Fund’s Form N-Q may be reviewed and copied at the SEC’s Public Reference Room in Washington, DC, and at regional offices in New York City, at 233 Broadway, and in Chicago, at 175 West Jackson Boulevard, Suite 900. Information about the Public Reference Room may be obtained by calling 1-800-SEC-0330.
| | | | | | |
| Other information (unaudited) | | Wells Fargo Advantage Minnesota Tax-Free Fund | | | 23 | |
BOARD OF TRUSTEES AND OFFICERS
Each of the Trustees and Officers1 listed in the table below acts in identical capacities for each fund in the Wells Fargo Advantage family of funds, which consists of 134 mutual funds comprising the Wells Fargo Funds Trust, Wells Fargo Variable Trust, Wells Fargo Master Trust and four closed-end funds (collectively the “Fund Complex”). This table should be read in conjunction with the Prospectus and the Statement of Additional Information2. The mailing address of each Trustee and Officer is 525 Market Street, 12th Floor, San Francisco, CA 94105. Each Trustee and Officer serves an indefinite term, however, each Trustee serves such term until reaching the mandatory retirement age established by the Trustees.
Independent Trustees
| | | | | | |
Name and year of birth | | Position held and length of service* | | Principal occupations during past five years or longer | | Other directorships during
past five years |
Peter G. Gordon
(Born 1942) | | Trustee, since 1998; Chairman, since 2005 | | Co-Founder, Retired Chairman, President and CEO of Crystal Geyser Water Company. Trustee Emeritus, Colby College. | | Asset Allocation Trust |
Isaiah Harris, Jr.
(Born 1952) | | Trustee, since 2009 | | Retired. Prior thereto, President and CEO of BellSouth Advertising and Publishing Corp. from 2005 to 2007, President and CEO of BellSouth Enterprises from 2004 to 2005 and President of BellSouth Consumer Services from 2000 to 2003. Emeritus member of the Iowa State University Foundation Board of Governors. Emeritus Member of the Advisory Board of Iowa State University School of Business. Advisory Board Member, Palm Harbor Academy. Mr. Harris is a certified public accountant. | | CIGNA Corporation; Asset Allocation Trust |
Judith M. Johnson
(Born 1949) | | Trustee, since 2008;
Audit Committee Chairman, since 2008 | | Retired. Prior thereto, Chief Executive Officer and Chief Investment Officer of Minneapolis Employees Retirement Fund from 1996 to 2008. Ms. Johnson is an attorney, certified public accountant and a certified managerial accountant. | | Asset Allocation Trust |
Leroy Keith, Jr.
(Born 1939) | | Trustee, since 2010** | | Chairman, Bloc Global Services (development and construction). Trustee of the Evergreen Funds complex (and its predecessors) from 1983 to 2010. Former Managing Director, Almanac Capital Management (commodities firm), former Partner, Stonington Partners, Inc. (private equity fund), former Director, Obagi Medical Products Co. and former Director, Lincoln Educational Services. | | Trustee, Virtus Fund Complex (consisting of 50 portfolios as of 12/16/2013); Asset Allocation Trust |
David F. Larcker
(Born 1950) | | Trustee, since 2009 | | James Irvin Miller Professor of Accounting at the Graduate School of Business, Stanford University, Morgan Stanley Director of the Center for Leadership Development and Research and Senior Faculty of The Rock Center for Corporate Governance since 2006. From 2005 to 2008, Professor of Accounting at the Graduate School of Business, Stanford University. Prior thereto, Ernst & Young Professor of Accounting at The Wharton School, University of Pennsylvania from 1985 to 2005. | | Asset Allocation Trust |
Olivia S. Mitchell
(Born 1953) | | Trustee, since 2006 | | International Foundation of Employee Benefit Plans Professor, Wharton School of the University of Pennsylvania since 1993. Director of Wharton’s Pension Research Council and Boettner Center on Pensions & Retirement Research, and Research Associate at the National Bureau of Economic Research. Previously, Cornell University Professor from 1978 to 1993. | | Asset Allocation Trust |
Timothy J. Penny
(Born 1951) | | Trustee, since 1996 | | President and CEO of Southern Minnesota Initiative Foundation, a non-profit organization, since 2007 and Senior Fellow at the Humphrey Institute Policy Forum at the University of Minnesota since 1995. Member of the Board of Trustees of NorthStar Education Finance, Inc., a non-profit organization, since 2007. | | Asset Allocation Trust |
| | | | |
| 24 | | Wells Fargo Advantage Minnesota Tax-Free Fund | | Other information (unaudited) |
| | | | | | |
Name and year of birth | | Position held and length of service* | | Principal occupations during past five years or longer | | Other directorships during
past five years |
Michael S. Scofield
(Born 1943) | | Trustee, since 2010 | | Served on the Investment Company Institute’s Board of Governors and Executive Committee from 2008-2011 as well the Governing Council of the Independent Directors Council from 2006-2011 and the Independent Directors Council Executive Committee from 2008-2011. Chairman of the IDC from 2008-2010. Institutional Investor (Fund Directions) Trustee of Year in 2007. Trustee of the Evergreen Funds complex (and its predecessors) from 1984 to 2010. Chairman of the Evergreen Funds from 2000-2010. Former Trustee of the Mentor Funds. Retired Attorney, Law Offices of Michael S. Scofield. | | Asset Allocation Trust |
Donald C. Willeke
(Born 1940) | | Trustee, since 1996 | | Principal of the law firm of Willeke & Daniels. General Counsel of the Minneapolis Employees Retirement Fund from 1984 until its consolidation into the Minnesota Public Employees Retirement Association on June 30, 2010. Director and Vice Chair of The Tree Trust (non-profit corporation). Director of the American Chestnut Foundation (non-profit corporation). | | Asset Allocation Trust |
| * | Length of service dates reflect the Trustee’s commencement of service with the Trust’s predecessor entities, where applicable. |
| ** | Leroy Keith, Jr. retired as a Trustee effective December 31, 2014. |
Officers
| | | | | | |
Name and year of birth | | Position held and
length of service | | Principal occupations during past five years or longer | | |
Karla M. Rabusch
(Born 1959) | | President, since 2003 | | Executive Vice President of Wells Fargo Bank, N.A. and President of Wells Fargo Funds Management, LLC since 2003. | | |
Nancy Wiser1
(Born 1967) | | Treasurer, since 2012 | | Executive Vice President of Wells Fargo Funds Management, LLC since 2011. Chief Operating Officer and Chief Compliance Officer at LightBox Capital Management LLC, from 2008 to 2011. Owned and operated a consulting business providing services to various hedge funds including acting as Chief Operating Officer and Chief Compliance Officer for a hedge fund from 2007 to 2008. Chief Operating Officer and Chief Compliance Officer of GMN Capital LLC from 2006 to 2007. | | |
C. David Messman
(Born 1960) | | Secretary, since 2000; Chief Legal Officer, since 2003 | | Assistant General Counsel of Wells Fargo Bank, N.A. since 2013 and Vice President and Managing Counsel of Wells Fargo Bank N.A. from 1996 to 2013. Senior Vice President and Secretary of Wells Fargo Funds Management , LLC since 2001. | | |
Debra Ann Early
(Born 1964) | | Chief Compliance Officer, since 2007 | | Senior Vice President of Wells Fargo Funds Management, LLC since 2007 and Chief Compliance Officer from 2007 to 2014. Chief Compliance Officer of Parnassus Investments from 2005 to 2007. Chief Financial Officer of Parnassus Investments from 2004 to 2007 and Senior Audit Manager of PricewaterhouseCoopers LLP from 1998 to 2004. | | |
David Berardi
(Born 1975) | | Assistant Treasurer, since 2009 | | Vice President of Wells Fargo Funds Management, LLC since 2009. Vice President of Evergreen Investment Management Company, LLC from 2008 to 2010. Assistant Vice President of Evergreen Investment Services, Inc. from 2004 to 2008. Manager of Fund Reporting and Control for Evergreen Investment Management Company, LLC from 2004 to 2010. | | |
Jeremy DePalma1
(Born 1974) | | Assistant Treasurer, since 2009 | | Senior Vice President of Wells Fargo Funds Management, LLC since 2009. Senior Vice President of Evergreen Investment Management Company, LLC from 2008 to 2010. Vice President, Evergreen Investment Services, Inc. from 2004 to 2007. Head of the Fund Reporting and Control Team within Fund Administration from 2005 to 2010. | | |
| 1. | Nancy Wiser acts as Treasurer of 73 funds in the Fund Complex. Jeremy DePalma acts as Treasurer of 61 funds and Assistant Treasurer of 73 funds in the Fund Complex. |
| 2. | The Statement of Additional Information includes additional information about the Trustees and is available, without charge, upon request, by calling 1-800-222-8222 or by visiting the website at wellsfargoadvantagefunds.com. |
| | | | | | |
| List of abbreviations | | Wells Fargo Advantage Minnesota Tax-Free Fund | | | 25 | |
The following is a list of common abbreviations for terms and entities that may have appeared in this report.
| ACA | — ACA Financial Guaranty Corporation |
| ADR | — American depositary receipt |
| ADS | — American depositary shares |
| AGC | — Assured Guaranty Corporation |
| AGM | — Assured Guaranty Municipal |
| Ambac | — Ambac Financial Group Incorporated |
| AMT | — Alternative minimum tax |
| BAN | — Bond anticipation notes |
| BHAC | — Berkshire Hathaway Assurance Corporation |
| CAB | — Capital appreciation bond |
| CCAB | — Convertible capital appreciation bond |
| CDA | — Community Development Authority |
| CDO | — Collateralized debt obligation |
| DRIVER | — Derivative inverse tax-exempt receipts |
| DW&P | — Department of Water & Power |
| DWR | — Department of Water Resources |
| ECFA | — Educational & Cultural Facilities Authority |
| EDA | — Economic Development Authority |
| EDFA | — Economic Development Finance Authority |
| ETF | — Exchange-traded fund |
| FDIC | — Federal Deposit Insurance Corporation |
| FFCB | — Federal Farm Credit Banks |
| FGIC | — Financial Guaranty Insurance Corporation |
| FHA | — Federal Housing Administration |
| FHLB | — Federal Home Loan Bank |
| FHLMC | — Federal Home Loan Mortgage Corporation |
| FICO | — The Financing Corporation |
| FNMA | — Federal National Mortgage Association |
| GDR | — Global depositary receipt |
| GNMA | — Government National Mortgage Association |
| HCFR | — Healthcare facilities revenue |
| HEFA | — Health & Educational Facilities Authority |
| HEFAR | — Higher education facilities authority revenue |
| HFA | — Housing Finance Authority |
| HFFA | — Health Facilities Financing Authority |
| HUD | — Department of Housing and Urban Development |
| IDA | — Industrial Development Authority |
| IDAG | — Industrial Development Agency |
| KRW | — Republic of Korea won |
| LIBOR | — London Interbank Offered Rate |
| LLC | — Limited liability company |
| LLLP | — Limited liability limited partnership |
| LLP | — Limited liability partnership |
| MBIA | — Municipal Bond Insurance Association |
| MFHR | — Multifamily housing revenue |
| MSTR | — Municipal securities trust receipts |
| MUD | — Municipal Utility District |
| National | — National Public Finance Guarantee Corporation |
| PCFA | — Pollution Control Financing Authority |
| PCL | — Public Company Limited |
| PCR | — Pollution control revenue |
| PFA | — Public Finance Authority |
| PFFA | — Public Facilities Financing Authority |
| PFOTER | — Puttable floating option tax-exempt receipts |
| plc | — Public limited company |
| PUTTER | — Puttable tax-exempt receipts |
| R&D | — Research & development |
| Radian | — Radian Asset Assurance |
| RAN | — Revenue anticipation notes |
| RDA | — Redevelopment Authority |
| RDFA | — Redevelopment Finance Authority |
| REIT | — Real estate investment trust |
| ROC | — Reset option certificates |
| SAVRS | — Select auction variable rate securities |
| SBA | — Small Business Authority |
| SFHR | — Single-family housing revenue |
| SFMR | — Single-family mortgage revenue |
| SPA | — Standby purchase agreement |
| SPDR | — Standard & Poor’s Depositary Receipts |
| STRIPS | — Separate trading of registered interest and |
| TAN | — Tax anticipation notes |
| TIPS | — Treasury inflation-protected securities |
| TRAN | — Tax revenue anticipation notes |
| TTFA | — Transportation Trust Fund Authority |
| TVA | — Tennessee Valley Authority |
This page is intentionally left blank.
This page is intentionally left blank.
This page is intentionally left blank.


For more information
More information about Wells Fargo Advantage Funds is available free upon request. To obtain literature, please write, email, visit the Fund’s website, or call:
Wells Fargo Advantage Funds
P.O. Box 8266
Boston, MA 02266-8266
Email: wfaf@wellsfargo.com
Website: wellsfargoadvantagefunds.com
Individual investors: 1-800-222-8222
Retail investment professionals: 1-888-877-9275
Institutional investment professionals: 1-866-765-0778
This report and the financial statements contained herein are submitted for the general information of the shareholders of Wells Fargo Advantage Funds. If this report is used for promotional purposes, distribution of the report must be accompanied or preceded by a current prospectus. Before investing, please consider the investment objectives, risks, charges, and expenses of the investment. For a current prospectus and, if available, a summary prospectus, containing this information, call 1-800-222-8222 or visit the Fund’s website at wellsfargoadvantagefunds.com. Read the prospectus carefully before you invest or send money.
Wells Fargo Funds Management, LLC, a wholly owned subsidiary of Wells Fargo & Company, provides investment advisory and administrative services for Wells Fargo Advantage Funds. Other affiliates of Wells Fargo & Company provide subadvisory and other services for the Funds. The Funds are distributed by Wells Fargo Funds Distributor, LLC, Member FINRA/SIPC, an affiliate of Wells Fargo & Company.
NOT FDIC INSURED ¡ NO BANK GUARANTEE ¡ MAY LOSE VALUE
© 2014 Wells Fargo Funds Management, LLC. All rights reserved.
| | |
 | | 230426 02-15 SA252/SAR252 12-14 |

Wells Fargo Advantage Municipal Bond Fund

Semi-Annual Report
December 31, 2014

Reduce clutter. Save trees.
Sign up for electronic delivery of prospectuses and shareholder reports at wellsfargo.com/advantagedelivery
Contents
The views expressed and any forward-looking statements are as of December 31, 2014, unless otherwise noted, and are those of the Fund managers and/or Wells Fargo Funds Management, LLC. Discussions of individual securities, or the markets generally, or any Wells Fargo Advantage Fund are not intended as individual recommendations. Future events or results may vary significantly from those expressed in any forward-looking statements; the views expressed are subject to change at any time in response to changing circumstances in the market. Wells Fargo Funds Management, LLC and the Fund disclaim any obligation to publicly update or revise any views expressed or forward-looking statements.
NOT FDIC INSURED ¡ NO BANK GUARANTEE ¡ MAY LOSE VALUE
| | | | |
| 2 | | Wells Fargo Advantage Municipal Bond Fund | | Letter to shareholders (unaudited) |

Karla M. Rabusch
President
Wells Fargo Advantage Funds
Municipal bonds rose in the second half of 2014, helped by lower interest rates and strong demand for yield.
Dear Valued Shareholder:
We are pleased to provide you with this semi-annual report for the Wells Fargo Advantage Municipal Bond Fund for the six-month period that ended December 31, 2014. Municipal bonds rose in the second half of 2014, helped by lower interest rates and strong demand for yield. In fact, the longest-dated and weakest credits had the strongest returns. Municipal bond returns—as measured by the Barclays Municipal Bond Index1, the broadest measure for tracking investment-grade municipal bonds throughout the country—gained 2.88% for the six-month period that ended December 31, 2014.
Longer-maturity and lower-rated municipal bonds outperformed.
At the front end of the yield curve, municipal bond yields were extremely low because of the accommodative monetary policy. Throughout the reporting period, the Federal Open Market Committee (FOMC)—the U.S. Federal Reserve’s (Fed’s) monetary policymaking body—kept its key interest rate near zero in order to support the economy and the financial system. Policymakers said they can be patient in normalizing monetary policy and that any increases in the target range for the federal funds rate will depend on incoming economic data. During the reporting period, the Fed reduced (or tapered) the size of its quantitative easing program each month until the program ended in October 2014, although it continues to reinvest principal and interest payments of the mortgage-backed securities and Treasury bonds it holds.
Longer-term yields declined during the second half of the year, with 10-year municipal yields declining from 2.33% as of June 30, 2014 to 2.10% as of December 31, 2014. For more perspective, the yield curve was steep on a historical basis at the beginning of the period and ended the period with the difference between 30-year and 2-year yields at 237 basis points (bps; 100 bps equals 1.00%), which was only slightly wider than its historical average. Because the yield curve was steep, longer-dated securities had higher yields. Given their longer maturities (as municipal yields fell further out the curve) and their more generous yields, longer-term bond returns outpaced shorter-term bonds.
Investors were also enticed to buy lower-rated securities for their higher yields. Over the six-month period that ended December 31, 2014, AAA-rated municipal bonds returned 2.04% while BBB-rated bonds returned 4.29%, according to the Barclays Municipal Bond Index. Credit conditions continued to improve, as evidenced by an 18th consecutive quarter of positive year-over-year gains in state and local municipal revenues. In addition to better fundamental credit conditions, technical factors of limited supply alongside strong investor demand also supported municipal bonds.
Puerto Rico’s struggle, the exit of two cities from bankruptcy, and pension issues topped credit news.
Puerto Rico was the asset class’s largest single credit story. Bonds from the commonwealth returned a meager 0.79% during the six-month period as population declines, a contracting economy, and a burdensome level of debt held back results. Meanwhile, the cities of Stockton, California, and Detroit, Michigan, exited bankruptcy by curbing retiree health care benefits and bondholder recoveries but largely avoiding concessions on pensions. While these recent bankruptcies have so far treated pensions better than bonded debt, no clear
| 1. | The Barclays Municipal Bond Index is an unmanaged index composed of long-term tax-exempt bonds with a minimum credit rating of Baa. You cannot invest directly in an index. |
| | | | | | |
| Letter to shareholders (unaudited) | | Wells Fargo Advantage Municipal Bond Fund | | | 3 | |
precedent has been established due to the difference in general obligation pledges and court-ordered versus negotiated concessions. Finally, underfunded pensions in Illinois, New Jersey, Pennsylvania, and Kansas gained attention for their negative fiscal effects and the political difficulties of finding a resolution.
Don’t let short-term uncertainty derail long-term investment goals.
Periods of uncertainty can present challenges, but experience has taught us that maintaining long-term investment goals can be an effective way to plan for the future. To help you create a sound strategy based on your personal goals and risk tolerance, Wells Fargo Advantage Funds offers more than 100 mutual funds and other investments spanning a wide range of asset classes and investment styles. Although diversification cannot guarantee an investment profit or prevent losses, we believe it can be an effective way to manage investment risk and potentially smooth out overall portfolio performance. We encourage investors to know their investments and to understand that appropriate levels of risk-taking may unlock opportunities.
Thank you for choosing to invest with Wells Fargo Advantage Funds. We appreciate your confidence in us and remain committed to helping you meet your financial needs. For current information about your fund investments, contact your investment professional, visit our website at wellsfargoadvantagefunds.com, or call us directly at 1-800-222-8222. We are available 24 hours a day, 7 days a week.
Sincerely,

Karla M. Rabusch
President
Wells Fargo Advantage Funds
Periods of uncertainty can present challenges, but experience has taught us that maintaining long-term investment goals can be an effective way to plan for the future.
| | | | |
| 4 | | Wells Fargo Advantage Municipal Bond Fund | | Performance highlights (unaudited) |
Investment objective
The Fund seeks current income exempt from federal income tax.
Adviser
Wells Fargo Funds Management, LLC
Subadviser
Wells Capital Management Incorporated
Portfolio managers
Lyle J. Fitterer, CFA, CPA
Robert J. Miller
Average annual total returns1 (%) as of December 31, 2014
| | | | | | | | | | | | | | | | | | | | | | | | | | | | | | | | | | |
| | | | | Including sales charge | | | Excluding sales charge | | | Expense ratios2 (%) | |
| | | Inception date | | 1 year | | | 5 year | | | 10 year | | | 1 year | | | 5 year | | | 10 year | | | Gross | | | Net3 | |
| Class A (WMFAX) | | 4-8-2005 | | | 6.08 | | | | 5.54 | | | | 5.01 | | | | 11.08 | | | | 6.51 | | | | 5.50 | | | | 0.80 | | | | 0.76 | |
| Class B (WMFBX)* | | 4-8-2005 | | | 5.35 | | | | 5.42 | | | | 4.96 | | | | 10.35 | | | | 5.74 | | | | 4.96 | | | | 1.55 | | | | 1.51 | |
| Class C (WMFCX) | | 4-8-2005 | | | 9.25 | | | | 5.72 | | | | 4.71 | | | | 10.25 | | | | 5.72 | | | | 4.71 | | | | 1.55 | | | | 1.51 | |
| Administrator Class (WMFDX) | | 4-8-2005 | | | – | | | | – | | | | – | | | | 11.35 | | | | 6.69 | | | | 5.73 | | | | 0.74 | | | | 0.61 | |
| Institutional Class (WMBIX) | | 3-31-2008 | | | – | | | | – | | | | – | | | | 11.39 | | | | 6.83 | | | | 5.72 | | | | 0.47 | | | | 0.47 | |
| Investor Class (SXFIX) | | 10-23-1986 | | | – | | | | – | | | | – | | | | 11.04 | | | | 6.48 | | | | 5.49 | | | | 0.83 | | | | 0.79 | |
| Barclays Municipal Bond Index4 | | – | | | – | | | | – | | | | – | | | | 9.05 | | | | 5.16 | | | | 4.74 | | | | – | | | | – | |
| * | | Class B shares are closed to investment, except in connection with the reinvestment of any distributions and permitted exchanges. |
Figures quoted represent past performance, which is no guarantee of future results, and do not reflect taxes that a shareholder may pay on fund distributions or the redemption of fund shares. Investment return and principal value of an investment will fluctuate so that an investor’s shares, when redeemed, may be worth more or less than their original cost. Performance shown without sales charges would be lower if sales charges were reflected. Current performance may be lower or higher than the performance data quoted, which assumes the reinvestment of dividends and capital gains. Current month-end performance is available on the Fund’s website, wellsfargoadvantagefunds.com.
Index returns do not include transaction costs associated with buying and selling securities, any mutual fund fees or expenses, or any taxes. It is not possible to invest directly in an index.
For Class A shares, the maximum front-end sales charge is 4.50%. For Class B shares, the maximum contingent deferred sales charge is 5.00%. For Class C shares, the maximum contingent deferred sales charge is 1.00%. Performance including a contingent deferred sales charge assumes the sales charge for the corresponding time period. Administrator Class, Institutional Class, and Investor Class shares shares are sold without a front-end sales charge or contingent deferred sales charge.
Bond values fluctuate in response to the financial condition of individual issuers, general market and economic conditions, and changes in interest rates. Changes in market conditions and government policies may lead to periods of heightened volatility in the bond market and reduced liquidity for certain bonds held by the Fund. In general, when interest rates rise, bond values fall and investors may lose principal value. Interest-rate changes and their impact on the Fund and its share price can be sudden and unpredictable. The use of derivatives may reduce returns and/or increase volatility. Certain investment strategies tend to increase the total risk of an investment (relative to the broader market). The Fund is exposed to high-yield securities risk and municipal securities risk. Consult the Fund’s prospectus for additional information on these and other risks. A portion of the Fund’s income may be subject to federal, state, and/or local income taxes or the Alternative Minimum Tax (AMT). Any capital gains distributions may be taxable.
Please see footnotes on page 5.
| | | | | | |
| Performance highlights (unaudited) | | Wells Fargo Advantage Municipal Bond Fund | | | 5 | |
|
| Credit quality distribution5 as of December 31, 2014 |
|
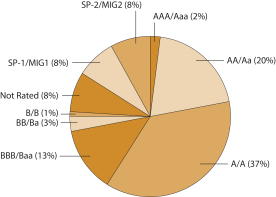 |
|
| Effective maturity distribution6 as of December 31, 2014 |
|
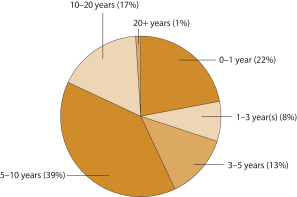 |
| 1. | Historical performance shown for Class A shares prior to their inception reflects the performance of Investor Class shares, and includes the higher expenses applicable to Investor Class shares (except during those periods in which expenses of Class A shares would have been higher than those of Investor Class no such adjustment is reflected). Historical performance shown for Class B and Class C shares prior to their inception reflects the performance of Investor Class shares, adjusted to reflect the higher expenses applicable to Class B and Class C shares. If these expenses had not been included, returns would be higher. Historical performance shown for Administrator Class and Institutional Class shares prior to their inception reflects the performance of Investor Class shares, and includes the higher expenses applicable to Investor Class shares. If these expenses had not been included, returns would be higher. |
| 2. | Reflects the expense ratios as stated in the most recent prospectuses. The expense ratios shown are subject to change and may differ from the annualized expense ratios shown in the financial highlights of this report. |
| 3. | The Adviser has committed through October 31, 2015, to waive fees and/or reimburse expenses to the extent necessary to cap the Fund’s Total Annual Fund Operating Expenses After Fee Waiver, excluding certain expenses, at 0.75% for Class A, 1.50% for Class B, 1.50% for Class C, 0.60% for Administrator Class, 0.48% for Institutional Class, and 0.78% for Investor Class. After this time, the cap may be increased or the commitment to maintain the cap may be terminated only with the approval of the Board of Trustees. Brokerage commissions, stamp duty fees, interest, taxes, acquired fund fees and expenses, and extraordinary expenses are excluded from the cap. Without this cap, the Fund’s returns would have been lower. |
| 4. | The Barclays Municipal Bond Index is an unmanaged index composed of long-term tax-exempt bonds with a minimum credit rating of Baa. You cannot invest directly in an index. |
| 5. | The credit quality distribution of portfolio holdings reflected in the chart is based on ratings from Standard & Poor’s, Moody’s Investors Service, and/or Fitch Ratings Ltd. Credit quality ratings apply to the underlying holdings of the Fund and not to the Fund itself. The percentages of the Fund’s portfolio with the ratings depicted in the chart are calculated based on the total market value of fixed income securities held by the Fund. If a security was rated by all three rating agencies, the middle rating was utilized. If rated by two of three rating agencies, the lower rating was utilized, and if rated by one of the rating agencies, that rating was utilized. Standard & Poor’s rates the creditworthiness of bonds, ranging from AAA (highest) to D (lowest). Ratings from A to CCC may be modified by the addition of a plus (+) or minus (-) sign to show relative standing within the rating categories. Standard & Poor’s rates the creditworthiness of short-term notes from SP-1 (highest) to SP-3 (lowest). Moody’s rates the creditworthiness of bonds, ranging from Aaa (highest) to C (lowest). Ratings Aa to B may be modified by the addition of a number 1 (highest) to 3 (lowest) to show relative standing within the ratings categories. Moody’s rates the creditworthiness of short-term U.S. tax-exempt municipal securities from MIG 1/VMIG 1 (highest) to SG (lowest). Fitch rates the creditworthiness of bonds, ranging from AAA (highest) to D (lowest). Credit quality and credit quality ratings are subject to change and may have changed since the date specified. |
| 6. | Effective maturity distribution is calculated based on the total long-term investments of the Fund. It is subject to change and may have changed since the date specified. |
| | | | |
| 6 | | Wells Fargo Advantage Municipal Bond Fund | | Fund expenses (unaudited) |
As a shareholder of the Fund, you incur two types of costs: (1) transaction costs, including sales charges (loads) on purchase payments and contingent deferred sales charges (if any) on redemptions and (2) ongoing costs, including management fees, distribution (12b-1) and/or shareholder service fees, and other Fund expenses. This example is intended to help you understand your ongoing costs (in dollars) of investing in the Fund and to compare these costs with the ongoing costs of investing in other mutual funds.
The example is based on an investment of $1,000 invested at the beginning of the six-month period and held for the entire period from July 1, 2014 to December 31, 2014.
Actual expenses
The “Actual” line of the table below provides information about actual account values and actual expenses. You may use the information in this line, together with the amount you invested, to estimate the expenses that you paid over the period. Simply divide your account value by $1,000 (for example, an $8,600 account value divided by $1,000 = 8.6), then multiply the result by the number in the “Actual” line under the heading entitled “Expenses paid during period” for your applicable class of shares to estimate the expenses you paid on your account during this period.
Hypothetical example for comparison purposes
The “Hypothetical” line of the table below provides information about hypothetical account values and hypothetical expenses based on the Fund’s actual expense ratio and an assumed rate of return of 5% per year before expenses, which is not the Fund’s actual return. The hypothetical account values and expenses may not be used to estimate the actual ending account balance or expenses you paid for the period. You may use this information to compare the ongoing costs of investing in the Fund and other funds. To do so, compare this 5% hypothetical example with the 5% hypothetical examples that appear in the shareholder reports of the other funds.
Please note that the expenses shown in the table are meant to highlight your ongoing costs only and do not reflect any transactional costs, such as sales charges (loads) and contingent deferred sales charges. Therefore, the “Hypothetical” line of the table is useful in comparing ongoing costs only and will not help you determine the relative total costs of owning different funds. In addition, if these transactional costs were included, your costs would have been higher.
| | | | | | | | | | | | | | | | |
| | | Beginning
account value
7-1-2014 | | | Ending
account value
12-31-2014 | | | Expenses
paid during
the period1 | | | Net annualized
expense ratio | |
Class A | | | | | | | | | | | | | | | | |
Actual | | $ | 1,000.00 | | | $ | 1,033.56 | | | $ | 3.84 | | | | 0.75 | % |
Hypothetical (5% return before expenses) | | $ | 1,000.00 | | | $ | 1,021.42 | | | $ | 3.82 | | | | 0.75 | % |
Class B | | | | | | | | | | | | | | | | |
Actual | | $ | 1,000.00 | | | $ | 1,029.66 | | | $ | 7.67 | | | | 1.50 | % |
Hypothetical (5% return before expenses) | | $ | 1,000.00 | | | $ | 1,017.64 | | | $ | 7.63 | | | | 1.50 | % |
Class C | | | | | | | | | | | | | | | | |
Actual | | $ | 1,000.00 | | | $ | 1,029.67 | | | $ | 7.67 | | | | 1.50 | % |
Hypothetical (5% return before expenses) | | $ | 1,000.00 | | | $ | 1,017.64 | | | $ | 7.63 | | | | 1.50 | % |
Administrator Class | | | | | | | | | | | | | | | | |
Actual | | $ | 1,000.00 | | | $ | 1,034.31 | | | $ | 3.08 | | | | 0.60 | % |
Hypothetical (5% return before expenses) | | $ | 1,000.00 | | | $ | 1,022.18 | | | $ | 3.06 | | | | 0.60 | % |
Institutional Class | | | | | | | | | | | | | | | | |
Actual | | $ | 1,000.00 | | | $ | 1,035.03 | | | $ | 2.41 | | | | 0.47 | % |
Hypothetical (5% return before expenses) | | $ | 1,000.00 | | | $ | 1,022.84 | | | $ | 2.40 | | | | 0.47 | % |
Investor Class | | | | | | | | | | | | | | | | |
Actual | | $ | 1,000.00 | | | $ | 1,033.40 | | | $ | 4.00 | | | | 0.78 | % |
Hypothetical (5% return before expenses) | | $ | 1,000.00 | | | $ | 1,021.27 | | | $ | 3.97 | | | | 0.78 | % |
| 1. | Expenses paid is equal to the annualized expense ratio of each class multiplied by the average account value over the period, multiplied by the number of days in the most recent fiscal half-year divided by the number of days in the fiscal year (to reflect the one-half-year period). |
| | | | | | |
| Summary portfolio of investments—December 31, 2014 (unaudited) | | Wells Fargo Advantage Municipal Bond Fund | | | 7 | |
The Summary Portfolio of Investments shows the 50 largest portfolio holdings in unaffiliated issuers and any holdings exceeding 1% of the total net assets as of the report date. The remaining securities held are grouped as “Other securities” in each category. You can request a complete schedule of portfolio holdings as of the report date, free of charge, by accessing the following website: http://a584.g.akamai.net/f/584/1326/1d/www.wellsfargoadvantagefunds.com/pdf/semi/holdings/municipalbond.pdf or by calling Wells Fargo Advantage Funds at 1-800-222-8222. This complete schedule, filed on Form N-CSRS, is also available on the SEC’s website at sec.gov.
| | | | | | | | | | | | | | | | | | | | |
| Security name | | Interest rate | | | Maturity date | | | Principal | | | Value | | | Percent of
net assets | |
| | | | | |
Municipal Obligations: 98.67% | | | | | | | | | | | | | | | | | | | | |
| | | | | |
| Alabama: 1.60% | | | | | | | | | | | | | | | | | | | | |
Tuscaloosa County AL IDA Series A (Industrial Development Revenue) ø | | | 0.24 | % | | | 9-1-2020 | | | $ | 20,000,000 | | | $ | 20,000,000 | | | | 0.62 | % |
Other securities | | | | | | | | | | | | | | | 31,337,470 | | | | 0.98 | |
| | | | | |
| | | | | | | | | | | | | | | 51,337,470 | | | | 1.60 | |
| | | | | | | | | | | | | | | | | | | | |
| | | | | |
| Arizona: 0.82% | | | | | | | | | | | | | | | | | | | | |
Other securities | | | | | | | | | | | | | | | 26,421,716 | | | | 0.82 | |
| | | | | | | | | | | | | | | | | | | | |
| | | | | |
| California: 10.32% | | | | | | | | | | | | | | | | | | | | |
Bay Area CA Toll Authority Toll Bridge Revenue Series A (Transportation Revenue) ± | | | 1.29 | | | | 4-1-2036 | | | | 28,000,000 | | | | 28,649,880 | | | | 0.89 | |
California (Miscellaneous Revenue) | | | 5.00 | | | | 8-1-2033 | | | | 30,000,000 | | | | 35,402,700 | | | | 1.10 | |
M-S-R California Energy Authority Gas Series B (Utilities Revenue) | | | 6.13 | | | | 11-1-2029 | | | | 25,425,000 | | | | 32,514,507 | | | | 1.01 | |
M-S-R Energy Authority California Gas (Utilities Revenue) | | | 6.13-7.00 | | | | 11-1-2029 to 11-1-2034 | | | | 4,755,000 | | | | 6,624,308 | | | | 0.21 | |
Northern California Gas Authority #1 LIBOR Series B (Utilities Revenue) ± | | | 0.88 | | | | 7-1-2027 | | | | 29,660,000 | | | | 27,257,243 | | | | 0.85 | |
Other securities | | | | | | | | | | | | | | | 200,834,070 | | | | 6.26 | |
| | | | | |
| | | | | | | | | | | | | | | 331,282,708 | | | | 10.32 | |
| | | | | | | | | | | | | | | | | | | | |
| | | | | |
| Colorado: 2.36% | | | | | | | | | | | | | | | | | | | | |
Other securities | | | | | | | | | | | | | | | 75,800,721 | | | | 2.36 | |
| | | | | | | | | | | | | | | | | | | | |
| | | | | |
| Connecticut: 0.43% | | | | | | | | | | | | | | | | | | | | |
Other securities | | | | | | | | | | | | | | | 13,727,083 | | | | 0.43 | |
| | | | | | | | | | | | | | | | | | | | |
| | | | | |
| Delaware: 0.08% | | | | | | | | | | | | | | | | | | | | |
Other securities | | | | | | | | | | | | | | | 2,434,624 | | | | 0.08 | |
| | | | | | | | | | | | | | | | | | | | |
| | | | | |
| District of Columbia: 1.08% | | | | | | | | | | | | | | | | | | | | |
District of Columbia Population Services International (Miscellaneous Revenue, SunTrust Bank LOC) ø | | | 0.22 | | | | 11-1-2042 | | | | 21,300,000 | | | | 21,300,000 | | | | 0.66 | |
Other securities | | | | | | | | | | | | | | | 13,417,877 | | | | 0.42 | |
| | | | | |
| | | | | | | | | | | | | | | 34,717,877 | | | | 1.08 | |
| | | | | | | | | | | | | | | | | | | | |
| | | | | |
| Florida: 4.30% | | | | | | | | | | | | | | | | | | | | |
Deutsche Bank SPEARs/LIFERs Trust Series DBE 1132 (Transportation Revenue, Deutsche Bank LIQ) 144Aø | | | 0.20 | | | | 7-1-2031 | | | | 14,760,000 | | | | 14,760,000 | | | | 0.46 | |
Florida Development Finance Corporation Educational Facilities Revenue Renaissance Charter School Project Series A (Education Revenue) | | | 8.50 | | | | 6-15-2044 | | | | 13,290,000 | | | | 15,118,040 | | | | 0.47 | |
The accompanying notes are an integral part of these financial statements.
| | | | |
| 8 | | Wells Fargo Advantage Municipal Bond Fund | | Summary portfolio of investments—December 31, 2014 (unaudited) |
| | | | | | | | | | | | | | | | | | | | |
| Security name | | Interest rate | | | Maturity date | | | Principal | | | Value | | | Percent of
net assets | |
| | | | | |
| Florida (continued) | | | | | | | | | | | | | | | | | | | | |
Palm Beach County FL PFOTER Series 4615 (Miscellaneous Revenue, Dexia Credit Local LIQ) ø | | | 0.31 | % | | | 8-1-2029 | | | $ | 20,245,000 | | | $ | 20,245,000 | | | | 0.63 | % |
Other securities | | | | | | | | | | | | | | | 88,080,456 | | | | 2.74 | |
| | | | | |
| | | | | | | | | | | | | | | 138,203,496 | | | | 4.30 | |
| | | | | | | | | | | | | | | | | | | | |
| | | | | |
| Georgia: 0.76% | | | | | | | | | | | | | | | | | | | | |
Other securities | | | | | | | | | | | | | | | 24,558,406 | | | | 0.76 | |
| | | | | | | | | | | | | | | | | | | | |
| | | | | |
| Guam: 0.13% | | | | | | | | | | | | | | | | | | | | |
Other securities | | | | | | | | | | | | | | | 4,095,655 | | | | 0.13 | |
| | | | | | | | | | | | | | | | | | | | |
| | | | | |
| Hawaii: 0.10% | | | | | | | | | | | | | | | | | | | | |
Other securities | | | | | | | | | | | | | | | 3,160,701 | | | | 0.10 | |
| | | | | | | | | | | | | | | | | | | | |
| | | | | |
| Idaho: 0.59% | | | | | | | | | | | | | | | | | | | | |
Other securities | | | | | | | | | | | | | | | 18,804,164 | | | | 0.59 | |
| | | | | | | | | | | | | | | | | | | | |
| | | | | |
| Illinois: 19.35% | | | | | | | | | | | | | | | | | | | | |
Chicago IL Board of Education (GO, AGM Insured) | | | 0.00-5.00 | | | | 12-1-2020 to 12-1-2031 | | | | 92,420,000 | | | | 51,521,282 | | | | 1.61 | |
Chicago IL Board of Education CAB School Reform Series B-1 (GO, National Insured) ¤ | | | 0.00 | | | | 12-1-2030 | | | | 29,000,000 | | | | 13,504,140 | | | | 0.42 | |
Chicago IL Board of Education CAB School Reform Series B-1 (GO, National Insured) ¤ | | | 0.00 | | | | 12-1-2027 | | | | 40,750,000 | | | | 22,627,660 | | | | 0.70 | |
Chicago IL Board of Education Series 2012-001 (GO, Dexia Credit Local LIQ) ±144A | | | 0.56 | | | | 12-1-2034 | | | | 15,000,000 | | | | 15,000,000 | | | | 0.47 | |
Chicago IL CAB City Colleges (GO, National Insured) ¤ | | | 0.00 | | | | 1-1-2029 | | | | 25,755,000 | | | | 13,293,958 | | | | 0.41 | |
Chicago IL µ | | | 0.00-5.56 | | | | 1-1-2021 to 1-1-2034 | | | | 64,770,000 | | | | 44,907,898 | | | | 1.40 | |
Chicago IL O’Hare International Airport (Airport Revenue) µ | | | 5.00-6.00 | | | | 1-1-2025 to 1-1-2044 | | | | 31,490,000 | | | | 35,474,189 | | | | 1.11 | |
Chicago IL Series C (GO) | | | 5.00 | | | | 1-1-2034 | | | | 24,015,000 | | | | 24,511,870 | | | | 0.76 | |
Chicago IL Water Revenue Second Lien Series A (Water & Sewer Revenue, Ambac Insured) | | | 5.00 | | | | 11-1-2032 | | | | 15,500,000 | | | | 16,370,325 | | | | 0.51 | |
Cook County IL (GO) µ | | | 5.00 | | | | 11-15-2024 to 11-15-2028 | | | | 10,160,000 | | | | 11,603,503 | | | | 0.36 | |
Cook County IL Series G (GO) | | | 5.00 | | | | 11-15-2028 | | | | 27,000,000 | | | | 30,303,990 | | | | 0.94 | |
DuPage County IL Community Unit School District #46 School Building (GO, Ambac Insured) ¤ | | | 0.00 | | | | 1-1-2023 | | | | 23,350,000 | | | | 18,663,655 | | | | 0.58 | |
Illinois µ | | | 5.00-6.00 | | | | 4-1-2020 to 7-1-2038 | | | | 71,200,000 | | | | 77,243,566 | | | | 2.41 | |
Illinois Finance Authority µ | | | 4.13-7.13 | | | | 9-1-2018 to 10-1-2041 | | | | 42,890,000 | | | | 49,165,966 | | | | 1.53 | |
Illinois Sports Facilities Authority (Tax Revenue) µ | | | 0.00-5.25 | | | | 6-15-2021 to 6-15-2032 | | | | 33,040,000 | | | | 34,559,488 | | | | 1.07 | |
Metropolitan Pier & Exposition Authority Illinois (Tax Revenue, AGM/MBIA Insured) ¤ | | | 0.00 | | | | 12-15-2029 | | | | 25,700,000 | | | | 13,985,940 | | | | 0.44 | |
Metropolitan Pier & Exposition Authority Illinois (Tax Revenue) ¤µ | | | 0.00 | | | | 12-15-2026 to 12-15-2031 | | | | 38,300,000 | | | | 20,605,379 | | | | 0.64 | |
University of Illinois Auxiliary Facilities Systems Series A (Education Revenue) | | | 5.75 | | | | 4-1-2038 | | | | 14,000,000 | | | | 16,025,660 | | | | 0.50 | |
Other securities | | | | | | | | | | | | | | | 112,219,452 | | | | 3.49 | |
| | | | | |
| | | | | | | | | | | | | | | 621,587,921 | | | | 19.35 | |
| | | | | | | | | | | | | | | | | | | | |
The accompanying notes are an integral part of these financial statements.
| | | | | | |
| Summary portfolio of investments—December 31, 2014 (unaudited) | | Wells Fargo Advantage Municipal Bond Fund | | | 9 | |
| | | | | | | | | | | | | | | | | | | | |
| Security name | | Interest rate | | | Maturity date | | | Principal | | | Value | | | Percent of
net assets | |
| | | | | |
| Indiana: 1.69% | | | | | | | | | | | | | | | | | | | | |
Indianapolis IN Local Public Improvement Bond Bank ROCS RR II R-11779 (Water & Sewer Revenue, AGM Insured, Citibank NA LIQ) 144Aø | | | 0.24 | % | | | 1-1-2017 | | | $ | 15,000,000 | | | $ | 15,000,000 | | | | 0.47 | % |
Other securities | | | | | | | | | | | | | | | 39,226,658 | | | | 1.22 | |
| | | | | |
| | | | | | | | | | | | | | | 54,226,658 | | | | 1.69 | |
| | | | | | | | | | | | | | | | | | | | |
| | | | | |
| Iowa: 0.07% | | | | | | | | | | | | | | | | | | | | |
Other securities | | | | | | | | | | | | | | | 2,349,277 | | | | 0.07 | |
| | | | | | | | | | | | | | | | | | | | |
| | | | | |
| Kansas: 0.23% | | | | | | | | | | | | | | | | | | | | |
Other securities | | | | | | | | | | | | | | | 7,295,640 | | | | 0.23 | |
| | | | | | | | | | | | | | | | | | | | |
| | | | | |
| Kentucky: 0.77% | | | | | | | | | | | | | | | | | | | | |
Other securities | | | | | | | | | | | | | | | 24,643,297 | | | | 0.77 | |
| | | | | | | | | | | | | | | | | | | | |
| | | | | |
| Louisiana: 2.15% | | | | | | | | | | | | | | | | | | | | |
Louisiana Tobacco Settlement Financing Corporation Revenue Bonds Series A (Tobacco Revenue) | | | 5.00 | | | | 5-15-2025 | | | | 12,500,000 | | | | 12,952,250 | | | | 0.40 | |
St. James Parish LA Nucor Steel LLC Project Gulf Opportunity Zone Series A1 (Industrial Development Revenue) ø | | | 0.22 | | | | 11-1-2040 | | | | 13,000,000 | | | | 13,000,000 | | | | 0.41 | |
St. James Parish LA Nucor Steel LLC Project Gulf Opportunity Zone Series B1 (Industrial Development Revenue) ø | | | 0.20 | | | | 11-1-2040 | | | | 16,000,000 | | | | 16,000,000 | | | | 0.50 | |
Other securities | | | | | | | | | | | | | | | 26,990,209 | | | | 0.84 | |
| | | | | |
| | | | | | | | | | | | | | | 68,942,459 | | | | 2.15 | |
| | | | | | | | | | | | | | | | | | | | |
| | | | | |
| Maine: 0.23% | | | | | | | | | | | | | | | | | | | | |
Other securities | | | | | | | | | | | | | | | 7,511,535 | | | | 0.23 | |
| | | | | | | | | | | | | | | | | | | | |
| | | | | |
| Maryland: 0.01% | | | | | | | | | | | | | | | | | | | | |
Other securities | | | | | | | | | | | | | | | 377,874 | | | | 0.01 | |
| | | | | | | | | | | | | | | | | | | | |
| | | | | |
| Massachusetts: 1.52% | | | | | | | | | | | | | | | | | | | | |
Massachusetts Series B (Miscellaneous Revenue, Dexia Credit Local LOC, AGM Insured, Dexia Credit Local LIQ) 144Aø | | | 0.12 | | | | 11-1-2026 | | | | 14,825,000 | | | | 14,825,000 | | | | 0.46 | |
Other securities | | | | | | | | | | | | | | | 33,962,736 | | | | 1.06 | |
| | | | | |
| | | | | | | | | | | | | | | 48,787,736 | | | | 1.52 | |
| | | | | | | | | | | | | | | | | | | | |
| | | | | |
| Michigan: 5.87% | | | | | | | | | | | | | | | | | | | | |
Michigan Finance Authority Revenue Local Government Loan Program (Water & Sewer Revenue) µ | | | 5.00 | | | | 7-1-2025 to 7-1-2036 | | | | 26,185,000 | | | | 29,318,353 | | | | 0.91 | |
Michigan Finance Authority Refunding Notes Local Government Loan Program Public Lighting Authority Series B (Tax Revenue) | | | 5.00 | | | | 7-1-2044 | | | | 12,625,000 | | | | 13,552,811 | | | | 0.42 | |
Michigan PFOTER Series 4711 (GO, AGM/Qualified School Bond Loan Fund Insured, Dexia Credit Local LIQ) 144Aø | | | 0.48 | | | | 5-1-2029 | | | | 19,840,000 | | | | 19,840,000 | | | | 0.62 | |
The accompanying notes are an integral part of these financial statements.
| | | | |
| 10 | | Wells Fargo Advantage Municipal Bond Fund | | Summary portfolio of investments—December 31, 2014 (unaudited) |
| | | | | | | | | | | | | | | | | | | | |
| Security name | | Interest rate | | | Maturity date | | | Principal | | | Value | | | Percent of
net assets | |
| | | | | |
| Michigan (continued) | | | | | | | | | | | | | | | | | | | | |
Michigan Strategic Fund Limited Obligation Events Center Project Series A (Tax Revenue) ± | | | 4.13 | % | | | 7-1-2045 | | | $ | 15,500,000 | | | $ | 15,638,260 | | | | 0.49 | % |
Other securities | | | | | | | | | | | | | | | 110,189,894 | | | | 3.43 | |
| | | | | |
| | | | | | | | | | | | | | | 188,539,318 | | | | 5.87 | |
| | | | | | | | | | | | | | | | | | | | |
| | | | | |
| Minnesota: 0.02% | | | | | | | | | | | | | | | | | | | | |
Other securities | | | | | | | | | | | | | | | 787,095 | | | | 0.02 | |
| | | | | | | | | | | | | | | | | | | | |
| | | | | |
| Mississippi: 0.76% | | | | | | | | | | | | | | | | | | | | |
Perry County MS PCR Leaf River Forest Product Project (Industrial Development Revenue, Georgia-Pacific LLC LOC) 144Aø | | | 0.26 | | | | 2-1-2022 | | | | 15,000,000 | | | | 15,000,000 | | | | 0.47 | |
Other securities | | | | | | | | | | | | | | | 9,372,705 | | | | 0.29 | |
| | | | | |
| | | | | | | | | | | | | | | 24,372,705 | | | | 0.76 | |
| | | | | | | | | | | | | | | | | | | | |
| | | | | |
| Missouri: 0.60% | | | | | | | | | | | | | | | | | | | | |
Other securities | | | | | | | | | | | | | | | 19,220,465 | | | | 0.60 | |
| | | | | | | | | | | | | | | | | | | | |
| | | | | |
| Nebraska: 0.04% | | | | | | | | | | | | | | | | | | | | |
Other securities | | | | | | | | | | | | | | | 1,142,431 | | | | 0.04 | |
| | | | | | | | | | | | | | | | | | | | |
| | | | | |
| Nevada: 0.04% | | | | | | | | | | | | | | | | | | | | |
Other securities | | | | | | | | | | | | | | | 1,370,037 | | | | 0.04 | |
| | | | | | | | | | | | | | | | | | | | |
| | | | | |
| New Hampshire: 0.06% | | | | | | | | | | | | | | | | | | | | |
Other securities | | | | | | | | | | | | | | | 1,789,151 | | | | 0.06 | |
| | | | | | | | | | | | | | | | | | | | |
| | | | | |
| New Jersey: 5.72% | | | | | | | | | | | | | | | | | | | | |
New Jersey EDA µ | | | 0.28-4.90 | | | | 2-1-2018 to 10-1-2040 | | | | 36,320,000 | | | | 36,908,273 | | | | 1.15 | |
New Jersey EDA School Facilities Construction Project Series I (Miscellaneous Revenue) ± | | | 1.64 | | | | 3-1-2028 | | | | 40,085,000 | | | | 39,994,007 | | | | 1.24 | |
New Jersey TTFA µ | | | 0.00-6.00 | | | | 6-15-2023 to 6-15-2042 | | | | 62,125,000 | | | | 68,321,448 | | | | 2.14 | |
Other securities | | | | | | | | | | | | | | | 38,412,530 | | | | 1.19 | |
| | | | | |
| | | | | | | | | | | | | | | 183,636,258 | | | | 5.72 | |
| | | | | | | | | | | | | | | | | | | | |
| | | | | |
| New Mexico: 0.34% | | | | | | | | | | | | | | | | | | | | |
Other securities | | | | | | | | | | | | | | | 10,966,792 | | | | 0.34 | |
| | | | | | | | | | | | | | | | | | | | |
| | | | | |
| New York: 11.23% | | | | | | | | | | | | | | | | | | | | |
Metropolitan Transportation Authority New York µ | | | 5.63-6.50 | | | | 7-1-2016 to 11-15-2028 | | | | 9,850,000 | | | | 11,548,808 | | | | 0.36 | |
Metropolitan Transportation Authority New York Series D (Transportation Revenue) | | | 5.25 | | | | 11-15-2044 | | | | 42,180,000 | | | | 49,099,207 | | | | 1.53 | |
New York NY Municipal Water Finance Authority 2nd General Resolution Series AA (Water & Sewer Revenue) | | | 5.00 | | | | 6-15-2044 | | | | 17,400,000 | | | | 19,406,742 | | | | 0.60 | |
New York NY Municipal Water Finance Authority 2nd General Resolution Series BB (Water & Sewer Revenue) | | | 5.00 | | | | 6-15-2044 | | | | 30,265,000 | | | | 33,998,793 | | | | 1.06 | |
The accompanying notes are an integral part of these financial statements.
| | | | | | |
| Summary portfolio of investments—December 31, 2014 (unaudited) | | Wells Fargo Advantage Municipal Bond Fund | | | 11 | |
| | | | | | | | | | | | | | | | | | | | |
| Security name | | Interest rate | | | Maturity date | | | Principal | | | Value | | | Percent of
net assets | |
| | | | | |
| New York (continued) | | | | | | | | | | | | | | | | | | | | |
New York NY Municipal Water Finance Authority (Water & Sewer Revenue) | | | 5.00-5.75 | % | | | 6-15-2026 to 6-15-2045 | | | $ | 28,820,000 | | | $ | 32,800,085 | | | | 1.02 | % |
New York NY Municipal Water Finance Authority 2nd General Resolution Series DD (Water & Sewer Revenue) | | | 6.00 | | | | 6-15-2040 | | | | 11,625,000 | | | | 13,340,966 | | | | 0.42 | |
New York NY Municipal Water Finance Authority Series AA3 (Water & Sewer Revenue, Dexia Credit Local SPA) ø | | | 0.16 | | | | 6-15-2032 | | | | 30,500,000 | | | | 30,500,000 | | | | 0.95 | |
New York NY Municipal Water Finance Authority Water & Sewer System Series A (Water & Sewer Revenue) | | | 5.00 | | | | 6-15-2038 | | | | 36,650,000 | | | | 39,724,569 | | | | 1.24 | |
New York NY Transitional Finance Authority µ | | | 0.20-5.75 | | | | 11-1-2022 to 1-15-2039 | | | | 32,970,000 | | | | 35,555,244 | | | | 1.11 | |
New York Urban Development Corporation Certificate of Participation James A. Farley Post Office Building Refinancing (Miscellaneous Revenue) | | | 4.00 | | | | 2-1-2015 | | | | 15,935,000 | | | | 15,951,094 | | | | 0.50 | |
Other securities | | | | | | | | | | | | | | | 78,750,087 | | | | 2.44 | |
| | | | | |
| | | | | | | | | | | | | | | 360,675,595 | | | | 11.23 | |
| | | | | | | | | | | | | | | | | | | | |
| | | | | |
| North Carolina: 0.60% | | | | | | | | | | | | | | | | | | | | |
Other securities | | | | | | | | | | | | | | | 19,303,573 | | | | 0.60 | |
| | | | | | | | | | | | | | | | | | | | |
| | | | | |
| Ohio: 2.13% | | | | | | | | | | | | | | | | | | | | |
Montgomery County OH Catholic Health Initiatives Series C2 (Health Revenue, U.S. Bank NA SPA) ø | | | 0.10 | | | | 10-1-2041 | | | | 15,000,000 | | | | 15,000,000 | | | | 0.47 | |
Other securities | | | | | | | | | | | | | | | 53,474,616 | | | | 1.66 | |
| | | | | |
| | | | | | | | | | | | | | | 68,474,616 | | | | 2.13 | |
| | | | | | | | | | | | | | | | | | | | |
| | | | | |
| Oklahoma: 0.15% | | | | | | | | | | | | | | | | | | | | |
Other securities | | | | | | | | | | | | | | | 4,688,462 | | | | 0.15 | |
| | | | | | | | | | | | | | | | | | | | |
| | | | | |
| Oregon: 0.17% | | | | | | | | | | | | | | | | | | | | |
Other securities | | | | | | | | | | | | | | | 5,448,555 | | | | 0.17 | |
| | | | | | | | | | | | | | | | | | | | |
| | | | | |
| Pennsylvania: 4.80% | | | | | | | | | | | | | | | | | | | | |
Berks County PA Municipal Authority Reading Hospital & Medical Center Project Series B (Health Revenue) | | | 1.54 | | | | 11-1-2039 | | | | 20,000,000 | | | | 20,513,200 | | | | 0.64 | |
Delaware Valley PA Regional Finance Authority Local Government Public Improvements Project (Miscellaneous Revenue) | | | 5.75 | | | | 7-1-2032 | | | | 13,610,000 | | | | 17,201,135 | | | | 0.54 | |
Delaware Valley PA Regional Finance Authority (Miscellaneous Revenue) µ | | | 0.29-7.75 | | | | 7-1-2017 to 7-1-2027 | | | | 9,660,000 | | | | 11,485,075 | | | | 0.36 | |
Delaware Valley PA Regional Finance Authority Series A (Miscellaneous Revenue, Ambac Insured) | | | 5.50 | | | | 8-1-2028 | | | | 16,420,000 | | | | 19,650,142 | | | | 0.61 | |
Delaware Valley PA Regional Finance Authority Series B (Miscellaneous Revenue, Bayerische Landesbank LOC) ø | | | 0.22 | | | | 6-1-2042 | | | | 16,495,000 | | | | 16,495,000 | | | | 0.51 | |
Pennsylvania HFA Single Family Mortgage Revenue Bonds AMT Series A (Housing Revenue) | | | 4.70 | | | | 10-1-2037 | | | | 15,800,000 | | | | 15,979,172 | | | | 0.50 | |
The accompanying notes are an integral part of these financial statements.
| | | | |
| 12 | | Wells Fargo Advantage Municipal Bond Fund | | Summary portfolio of investments—December 31, 2014 (unaudited) |
| | | | | | | | | | | | | | | | | | | | |
| Security name | | Interest rate | | | Maturity date | | | Principal | | | Value | | | Percent of
net assets | |
| | | | | |
| Pennsylvania (continued) | | | | | | | | | | | | | | | | | | | | |
Pennsylvania Turnpike Commission Motor License Series B1 (Transportation Revenue) | | | 5.00 | % | | | 12-1-2040 | | | $ | 12,410,000 | | | $ | 13,570,087 | | | | 0.42 | % |
Other securities | | | | | | | | | | | | | | | 39,144,076 | | | | 1.22 | |
| | | | | |
| | | | | | | | | | | | | | | 154,037,887 | | | | 4.80 | |
| | | | | | | | | | | | | | | | | | | | |
| | | | | |
| Puerto Rico: 0.86% | | | | | | | | | | | | | | | | | | | | |
Other securities | | | | | | | | | | | | | | | 27,705,648 | | | | 0.86 | |
| | | | | | | | | | | | | | | | | | | | |
| | | | | |
| Rhode Island: 0.10% | | | | | | | | | | | | | | | | | | | | |
Other securities | | | | | | | | | | | | | | | 3,339,736 | | | | 0.10 | |
| | | | | | | | | | | | | | | | | | | | |
| | | | | |
| South Carolina: 1.06% | | | | | | | | | | | | | | | | | | | | |
Other securities | | | | | | | | | | | | | | | 34,068,620 | | | | 1.06 | |
| | | | | | | | | | | | | | | | | | | | |
| | | | | |
| South Dakota: 0.46% | | | | | | | | | | | | | | | | | | | | |
Other securities | | | | | | | | | | | | | | | 14,936,642 | | | | 0.46 | |
| | | | | | | | | | | | | | | | | | | | |
| | | | | |
| Tennessee: 0.67% | | | | | | | | | | | | | | | | | | | | |
Other securities | | | | | | | | | | | | | | | 21,567,466 | | | | 0.67 | |
| | | | | | | | | | | | | | | | | | | | |
| | | | | |
| Texas: 8.34% | | | | | | | | | | | | | | | | | | | | |
Tarrant County TX Cultural Education Facilities Finance Corporation (Health Revenue) µ | | | 0.14-5.00 | | | | 5-15-2017 to 11-15-2047 | | | | 31,500,000 | | | | 32,383,694 | | | | 1.01 | |
Tarrant County TX Cultural Education Facilities Finance Corporation Series 2973 (Health Revenue, Morgan Stanley Bank LIQ) 144Aø | | | 0.24 | | | | 11-15-2029 | | | | 15,000,000 | | | | 15,000,000 | | | | 0.47 | |
Texas Municipal Gas Acquisition & Supply Corporation II Series B (Utilities Revenue, JPMorgan Chase & Company Guaranteed) ± | | | 0.50 | | | | 9-15-2017 | | | | 12,165,000 | | | | 12,181,544 | | | | 0.38 | |
Texas Municipal Gas Acquisition & Supply Corporation III (Utilities Revenue) | | | 5.00 | | | | 12-15-2024 | | | | 20,500,000 | | | | 23,242,695 | | | | 0.72 | |
Texas Municipal Gas Acquisition & Supply Corporation III Gas Supply Revenue (Utilities Revenue) | | | 5.00 | | | | 12-15-2023 | | | | 11,250,000 | | | | 12,840,300 | | | | 0.40 | |
Texas Private Activity Surface Transportation Corporation Project NTE Mobility Partners Segments LLC (Transportation Revenue) | | | 7.00 | | | | 12-31-2038 | | | | 12,500,000 | | | | 15,539,125 | | | | 0.48 | |
Other securities | | | | | | | | | | | | | | | 156,811,333 | | | | 4.88 | |
| | | | | |
| | | | | | | | | | | | | | | 267,998,691 | | | | 8.34 | |
| | | | | | | | | | | | | | | | | | | | |
| | | | | |
| Utah: 0.49% | | | | | | | | | | | | | | | | | | | | |
Other securities | | | | | | | | | | | | | | | 15,779,617 | | | | 0.49 | |
| | | | | | | | | | | | | | | | | | | | |
| | | | | |
| Vermont: 1.47% | | | | | | | | | | | | | | | | | | | | |
Vermont Student Assistance Corporation Education Loan Revenue Series B (Education Revenue) ± | | | 1.16 | | | | 6-2-2042 | | | | 30,336,439 | | | | 30,293,330 | | | | 0.94 | |
Vermont Student Assistance Corporation Education Loan Revenue Series B Class A2 (Education Revenue) ± | | | 3.24 | | | | 12-3-2035 | | | | 16,800,000 | | | | 16,897,272 | | | | 0.53 | |
| | | | | |
| | | | | | | | | | | | | | | 47,190,602 | | | | 1.47 | |
| | | | | | | | | | | | | | | | | | | | |
The accompanying notes are an integral part of these financial statements.
| | | | | | |
| Summary portfolio of investments—December 31, 2014 (unaudited) | | Wells Fargo Advantage Municipal Bond Fund | | | 13 | |
| | | | | | | | | | | | | | | | | | | | |
| Security name | | Interest rate | | | Maturity date | | | Principal | | | Value | | | Percent of
net assets | |
| | | | | |
| Virgin Islands: 0.30% | | | | | | | | | | | | | | | | | | | | |
Other securities | | | | | | | | | | | | | | $ | 9,696,030 | | | | 0.30 | % |
| | | | | | | | | | | | | | | | | | | | |
| | | | | |
| Virginia: 1.14% | | | | | | | | | | | | | | | | | | | | |
Other securities | | | | | | | | | | | | | | | 36,720,440 | | | | 1.14 | |
| | | | | | | | | | | | | | | | | | | | |
| | | | | |
| Washington: 1.49% | | | | | | | | | | | | | | | | | | | | |
Washington Refunding Bond Series R (Miscellaneous Revenue) | | | 5.00 | % | | | 7-1-2028 | | | $ | 24,640,000 | | | | 30,084,947 | | | | 0.94 | |
Other securities | | | | | | | | | | | | | | | 17,732,958 | | | | 0.55 | |
| | | | | |
| | | | | | | | | | | | | | | 47,817,905 | | | | 1.49 | |
| | | | | | | | | | | | | | | | | | | | |
| | | | | |
| West Virginia: 0.09% | | | | | | | | | | | | | | | | | | | | |
Other securities | | | | | | | | | | | | | | | 2,757,912 | | | | 0.09 | |
| | | | | | | | | | | | | | | | | | | | |
| | | | | |
| Wisconsin: 0.69% | | | | | | | | | | | | | | | | | | | | |
Other securities | | | | | | | | | | | | | | | 22,145,690 | | | | 0.69 | |
| | | | | | | | | | | | | | | | | | | | |
| | | | | |
| Wyoming: 0.39% | | | | | | | | | | | | | | | | | | | | |
Other securities | | | | | | | | | | | | | | | 12,419,898 | | | | 0.39 | |
| | | | | | | | | | | | | | | | | | | | |
| | | | | |
Total Municipal Obligations (Cost $2,998,353,208) | | | | | | | | | | | | | | | 3,168,864,855 | | | | 98.67 | |
| | | | | | | | | | | | | | | | | | | | |
| | | | | |
Short-Term Investments: 1.58% | | | | | | | | | | | | | | | | | | | | |
| | | | | |
| Commercial Paper: 0.47% | | | | | | | | | | | | | | | | | | | | |
Connecticut Development Authority Pollution Control | | | 0.27 | | | | 1-21-2015 | | | | 15,000,000 | | | | 15,000,000 | | | | 0.47 | |
| | | | | | | | | | | | | | | | | | | | |
| | | | | |
| | | Yield | | | | | | Shares | | | | | | | |
| | | | | |
| Investment Companies: 1.03% | | | | | | | | | | | | | | | | | | | | |
Wells Fargo Advantage National Tax-Free Money Market Fund, Institutional Class (l)(u)## | | | 0.01 | | | | | | | | 33,243,829 | | | | 33,243,829 | | | | 1.03 | |
| | | | | | | | | | | | | | | | | | | | |
| | | | | |
| | | | | | | | | Principal | | | | | | | |
| U.S. Treasury Securities: 0.08% | | | | | | | | | | | | | | | | | | | | |
U.S. Treasury Bill #(z) | | | 0.02 | | | | 3-19-2015 | | | $ | 2,600,000 | | | | 2,599,904 | | | | 0.08 | |
| | | | | | | | | | | | | | | | | | | | |
| Total Short-Term Investments (Cost $50,843,680) | | | | | | | | | | | | | | | 50,843,733 | | | | 1.58 | |
| | | | | | | | | | | | | | | | | | | | |
| | | | |
| Total investments in securities (Cost $3,049,196,888) * | | | | | | | | | | | | 3,219,708,588 | | | | 100.25 | |
Other assets and liabilities, net | | | | | | | | | | | | | | | (8,134,113 | ) | | | (0.25 | ) |
| | | | | | | | | | | | | | | | | | | | |
| Total net assets | | | | | | | | | | | | | | $ | 3,211,574,475 | | | | 100.00 | % |
| | | | | | | | | | | | | | | | | | | | |
The accompanying notes are an integral part of these financial statements.
| | | | |
| 14 | | Wells Fargo Advantage Municipal Bond Fund | | Summary portfolio of investments—December 31, 2014 (unaudited) |
| ¤ | The security is issued in zero coupon form with no periodic interest payments. |
| ø | Variable rate demand notes are subject to a demand feature which reduces the effective maturity. The maturity date shown represents the final maturity date of the security. The interest rate is determined and reset by the issuer daily, weekly, or monthly depending upon the terms of the security. The rate shown is the rate in effect at period end. |
| ± | Variable rate investment. The rate shown is the rate in effect at period end. |
| 144A | The security may be resold in transactions exempt from registration, normally to qualified institutional buyers, pursuant to Rule 144A under the Securities Act of 1933. |
| µ | All or some of these obligations have credit enhancements or liquidity features that may, under certain circumstances, provide for repayment of principal and interest. |
| (l) | The security represents an affiliate of the Fund as defined in the Investment Company Act of 1940. |
| (u) | The rate represents the 7-day annualized yield at period end. |
| ## | All or a portion of this security is segregated for when-issued securities. |
| # | All or a portion of this security is segregated as collateral for investments in derivative instruments. |
| (z) | Zero coupon security. The rate represents the current yield to maturity. |
| * | Cost for federal income tax purposes is $3,050,317,915 and unrealized gains (losses) consists of: |
| | | | |
Gross unrealized gains | | $ | 179,496,527 | |
Gross unrealized losses | | | (10,105,854 | ) |
| | | | |
Net unrealized gains | | $ | 169,390,673 | |
The accompanying notes are an integral part of these financial statements.
| | | | | | |
| Statements of assets and liabilities—December 31, 2014 (unaudited) | | Wells Fargo Advantage Municipal Bond Fund | | | 15 | |
| | | | |
| | | | |
| |
Assets | | | | |
Investments | | | | |
In unaffiliated securities, at value (cost $3,015,953,059) | | $ | 3,186,464,759 | |
In affiliated securities, at value (cost $33,243,829) | | | 33,243,829 | |
| | | | |
Total investments, at value (cost $3,049,196,888) | | | 3,219,708,588 | |
Receivable for investments sold | | | 2,052,993 | |
Receivable for Fund shares sold | | | 8,536,346 | |
Receivable for interest | | | 26,392,841 | |
Prepaid expenses and other assets | | | 426,731 | |
| | | | |
Total assets | | | 3,257,117,499 | |
| | | | |
| |
Liabilities | | | | |
Dividends payable | | | 1,095,716 | |
Payable for investments purchased | | | 32,010,141 | |
Payable for floating-rate notes issued | | | 5,025,000 | |
Payable for Fund shares redeemed | | | 4,844,603 | |
Interest and fee expense payable | | | 10,019 | |
Payable for daily variation margin on open futures contracts | | | 376,531 | |
Advisory fee payable | | | 727,663 | |
Distribution fees payable | | | 110,091 | |
Administration fees payable | | | 545,932 | |
Accrued expenses and other liabilities | | | 797,328 | |
| | | | |
Total liabilities | | | 45,543,024 | |
| | | | |
Total net assets | | $ | 3,211,574,475 | |
| | | | |
| |
NET ASSETS CONSIST OF | | | | |
Paid-in capital | | $ | 3,059,046,409 | |
Overdistributed net investment income | | | (285,262 | ) |
Accumulated net realized losses on investments | | | (16,766,827 | ) |
Net unrealized gains on investments | | | 169,580,155 | |
| | | | |
Total net assets | | $ | 3,211,574,475 | |
| | | | |
| |
COMPUTATION OF NET ASSET VALUE AND OFFERING PRICE PER SHARE | | | | |
Net assets – Class A | | $ | 1,627,048,213 | |
Shares outstanding – Class A1 | | | 155,671,504 | |
Net asset value per share – Class A | | | $10.45 | |
Maximum offering price per share – Class A2 | | | $10.94 | |
Net assets – Class B | | $ | 2,759,909 | |
Shares outstanding – Class B1 | | | 263,938 | |
Net asset value per share – Class B | | | $10.46 | |
Net assets – Class C | | $ | 165,521,959 | |
Shares outstanding – Class C1 | | | 15,840,006 | |
Net asset value per share – Class C | | | $10.45 | |
Net assets – Administrator Class | | $ | 430,620,728 | |
Shares outstanding – Administrator Class1 | | | 41,174,615 | |
Net asset value per share – Administrator Class | | | $10.46 | |
Net assets – Institutional Class | | $ | 459,320,481 | |
Shares outstanding – Institutional Class1 | | | 43,950,701 | |
Net asset value per share – Institutional Class | | | $10.45 | |
Net assets – Investor Class | | $ | 526,303,185 | |
Shares outstanding – Investor Class1 | | | 50,362,541 | |
Net asset value per share – Investor Class | | | $10.45 | |
| 1. | The Fund has an unlimited number of authorized shares. |
| 2. | Maximum offering price is computed as 100/95.50 of net asset value. On investments of $50,000 or more, the offering price is reduced. |
The accompanying notes are an integral part of these financial statements.
| | | | |
| 16 | | Wells Fargo Advantage Municipal Bond Fund | | Statement of operations—six months ended December 31, 2014 (unaudited) |
| | | | |
| | | | |
| |
Investment income | | | | |
Interest | | $ | 52,146,268 | |
Income from affiliated securities | | | 5,858 | |
| | | | |
Total investment income | | | 52,152,126 | |
| | | | |
| |
Expenses | | | | |
Advisory fee | | | 4,859,661 | |
Administration fees | | | | |
Fund level | | | 780,047 | |
Class A | | | 1,312,672 | |
Class B | | | 2,627 | |
Class C | | | 129,581 | |
Administrator Class | | | 204,880 | |
Institutional Class | | | 154,130 | |
Investor Class | | | 493,053 | |
Shareholder servicing fees | | | | |
Class A | | | 2,051,050 | |
Class B | | | 4,105 | |
Class C | | | 202,471 | |
Administrator Class | | | 512,200 | |
Investor Class | | | 647,657 | |
Distribution fees | | | | |
Class B | | | 12,314 | |
Class C | | | 607,411 | |
Custody and accounting fees | | | 78,876 | |
Professional fees | | | 36,493 | |
Registration fees | | | 153,554 | |
Shareholder report expenses | | | 66,191 | |
Trustees’ fees and expenses | | | 6,891 | |
Interest and fee expense | | | 22,927 | |
Other fees and expenses | | | 34,841 | |
| | | | |
Total expenses | | | 12,373,632 | |
Less: Fee waivers and/or expense reimbursements | | | (807,289 | ) |
| | | | |
Net expenses | | | 11,566,343 | |
| | | | |
Net investment income | | | 40,585,783 | |
| | | | |
| |
REALIZED AND UNREALIZED GAINS (LOSSES) ON INVESTMENTS | | | | |
| |
Net realized gains on: | | | | |
Unaffiliated securities | | | 17,578,098 | |
Futures transactions | | | 82,992 | |
| | | | |
Net realized gains on investments | | | 17,661,090 | |
| | | | |
| |
Net change in unrealized gains (losses) on: | | | | |
Unaffiliated securities | | | 44,088,909 | |
Futures transactions | | | (931,545 | ) |
| | | | |
Net change in unrealized gains (losses) on investments | | | 43,157,364 | |
| | | | |
Net realized and unrealized gains (losses) on investments | | | 60,818,454 | |
| | | | |
Net increase in net assets resulting from operations | | $ | 101,404,237 | |
| | | | |
The accompanying notes are an integral part of these financial statements.
| | | | | | |
| Statement of changes in net assets | | Wells Fargo Advantage Municipal Bond Fund | | | 17 | |
| | | | | | | | | | | | | | | | |
| | | Six months ended
December 31, 2014
(unaudited) | | | Year ended
June 30, 2014 | |
| | | |
Operations | | | | | | | | | | | | |
Net investment income | | | | | | $ | 40,585,783 | | | | | | | $ | 96,533,214 | |
Net realized gains on investments | | | | | | | 17,661,090 | | | | | | | | 22,530,255 | |
Net change in unrealized gains (losses) on investments | | | | | | | 43,157,364 | | | | | | | | 84,225,602 | |
| | | | |
Net increase in net assets resulting from operations | | | | | | | 101,404,237 | | | | | | | | 203,289,071 | |
| | | | |
| | | |
Distributions to shareholders from | | | | | | | | | | | | |
Net investment income | | | | | | | | | | | | | | | | |
Class A | | | | | | | (21,262,376 | ) | | | | | | | (56,335,083 | ) |
Class B | | | | | | | (30,246 | ) | | | | | | | (140,049 | ) |
Class C | | | | | | | (1,490,129 | ) | | | | | | | (3,864,948 | ) |
Administrator Class | | | | | | | (5,605,922 | ) | | | | | | | (12,212,403 | ) |
Institutional Class | | | | | | | (5,553,195 | ) | | | | | | | (6,887,074 | ) |
Investor Class | | | | | | | (6,644,435 | ) | | | | | | | (17,091,363 | ) |
Net realized gains | | | | | | | | | | | | | | | | |
Class A | | | | | | | (13,650,951 | ) | | | | | | | (11,977,149 | ) |
Class B | | | | | | | (23,225 | ) | | | | | | | (39,258 | ) |
Class C | | | | | | | (1,383,944 | ) | | | | | | | (1,046,658 | ) |
Administrator Class | | | | | | | (3,527,595 | ) | | | | | | | (2,318,044 | ) |
Institutional Class | | | | | | | (3,771,405 | ) | | | | | | | (1,035,016 | ) |
Investor Class | | | | | | | (4,402,074 | ) | | | | | | | (3,640,741 | ) |
| | | | |
Total distributions to shareholders | | | | | | | (67,345,497 | ) | | | | | | | (116,587,786 | ) |
| | | | |
| | | | |
Capital share transactions | | | Shares | | | | | | | | Shares | | | | | |
Proceeds from shares sold | | | | | | | | | | | | | | | | |
Class A | | | 10,671,655 | | | | 111,347,711 | | | | 28,056,137 | | | | 279,630,383 | |
Class B | | | 84 | | | | 880 | | | | 345 | | | | 3,415 | |
Class C | | | 1,774,553 | | | | 18,528,817 | | | | 2,602,705 | | | | 26,161,450 | |
Administrator Class | | | 13,050,770 | | | | 136,292,147 | | | | 31,882,753 | | | | 315,995,537 | |
Institutional Class | | | 27,056,107 | | | | 281,789,760 | | | | 21,558,052 | | | | 213,706,324 | |
Investor Class | | | 6,945,687 | | | | 72,448,680 | | | | 15,989,672 | | | | 159,765,145 | |
| | | | |
| | | | | | | 620,407,995 | | | | | | | | 995,262,254 | |
| | | | |
Reinvestment of distributions | | | | | | | | | | | | | | | | |
Class A | | | 3,023,688 | | | | 31,590,069 | | | | 6,205,035 | | | | 61,607,687 | |
Class B | | | 4,142 | | | | 43,278 | | | | 14,925 | | | | 147,677 | |
Class C | | | 231,436 | | | | 2,417,969 | | | | 410,888 | | | | 4,074,775 | |
Administrator Class | | | 817,633 | | | | 8,551,554 | | | | 1,147,408 | | | | 11,423,991 | |
Institutional Class | | | 634,286 | | | | 6,629,298 | | | | 487,809 | | | | 4,876,309 | |
Investor Class | | | 979,275 | | | | 10,229,928 | | | | 1,919,566 | | | | 19,064,610 | |
| | | | |
| | | | | | | 59,462,096 | | | | | | | | 101,195,049 | |
| | | | |
Payment for shares redeemed | | | | | | | | | | | | | | | | |
Class A | | | (18,810,982 | ) | | | (195,746,064 | ) | | | (54,278,184 | ) | | | (538,608,273 | ) |
Class B | | | (93,413 | ) | | | (975,058 | ) | | | (422,343 | ) | | | (4,191,821 | ) |
Class C | | | (1,156,794 | ) | | | (12,056,936 | ) | | | (4,894,041 | ) | | | (48,437,451 | ) |
Administrator Class | | | (7,791,946 | ) | | | (81,501,480 | ) | | | (43,009,050 | ) | | | (423,241,726 | ) |
Institutional Class | | | (8,429,182 | ) | | | (88,013,218 | ) | | | (11,664,150 | ) | | | (115,198,740 | ) |
Investor Class | | | (10,267,272 | ) | | | (106,465,688 | ) | | | (23,611,469 | ) | | | (233,119,997 | ) |
| | | | |
| | | | | | | (484,758,444 | ) | | | | | | | (1,362,798,008 | ) |
| | | | |
Net increase (decrease) in net assets resulting from capital share transactions | | | | | | | 195,111,647 | | | | | | | | (266,340,705 | ) |
| | | | |
Total increase (decrease) in net assets | | | | | | | 229,170,387 | | | | | | | | (179,639,420 | ) |
| | | | |
| | |
Net assets | | | | | | | | |
Beginning of period | | | | | | | 2,982,404,088 | | | | | | | | 3,162,043,508 | |
| | | | |
End of period | | | | | | $ | 3,211,574,475 | | | | | | | $ | 2,982,404,088 | |
| | | | |
Overdistributed net investment income | | | | | | $ | (285,262 | ) | | | | | | $ | (284,742 | ) |
| | | | |
The accompanying notes are an integral part of these financial statements.
| | | | |
| 18 | | Wells Fargo Advantage Municipal Bond Fund | | Financial highlights |
(For a share outstanding throughout each period)
| | | | | | | | | | | | | | | | | | | | | | | | |
| | | Six months ended
December 31, 2014 (unaudited) | | | Year ended June 30 | |
| CLASS A | | | 2014 | | | 2013 | | | 2012 | | | 2011 | | | 2010 | |
Net asset value, beginning of period | | | $10.33 | | | | $10.00 | | | | $10.24 | | | | $9.54 | | | | $9.51 | | | | $8.74 | |
Net investment income | | | 0.14 | | | | 0.33 | | | | 0.27 | | | | 0.37 | | | | 0.40 | | | | 0.41 | |
Net realized and unrealized gains (losses) on investments | | | 0.21 | | | | 0.40 | | | | (0.08 | ) | | | 0.70 | | | | 0.03 | | | | 0.84 | |
| | | | | | | | | | | | | | | | | | | | | | | | |
Total from investment operations | | | 0.35 | | | | 0.73 | | | | 0.19 | | | | 1.07 | | | | 0.43 | | | | 1.25 | |
Distributions to shareholders from | | | | | | | | | | | | | | | | | | | | | | | | |
Net investment income | | | (0.14 | ) | | | (0.33 | ) | | | (0.27 | ) | | | (0.37 | ) | | | (0.39 | ) | | | (0.41 | ) |
Net realized gains | | | (0.09 | ) | | | (0.07 | ) | | | (0.16 | ) | | | (0.00 | )1 | | | (0.01 | ) | | | (0.07 | ) |
| | | | | | | | | | | | | | | | | | | | | | | | |
Total distributions to shareholders | | | (0.23 | ) | | | (0.40 | ) | | | (0.43 | ) | | | (0.37 | ) | | | (0.40 | ) | | | (0.48 | ) |
Net asset value, end of period | | | $10.45 | | | | $10.33 | | | | $10.00 | | | | $10.24 | | | | $9.54 | | | | $9.51 | |
Total return2 | | | 3.36 | % | | | 7.60 | % | | | 1.70 | % | | | 11.45 | % | | | 4.70 | % | | | 14.28 | % |
Ratios to average net assets (annualized) | | | | | | | | | | | | | | | | | | | | | | | | |
Gross expenses | | | 0.80 | %3 | | | 0.80 | %3 | | | 0.80 | %3 | | | 0.81 | %3 | | | 0.83 | %3 | | | 0.86 | %3 |
Net expenses | | | 0.75 | %3 | | | 0.76 | %3 | | | 0.75 | %3 | | | 0.75 | %3 | | | 0.77 | %3 | | | 0.75 | %3 |
Net investment income | | | 2.59 | % | | | 3.36 | % | | | 2.56 | % | | | 3.72 | % | | | 4.18 | % | | | 4.37 | % |
Supplemental data | | | | | | | | | | | | | | | | | | | | | | | | |
Portfolio turnover rate | | | 14 | % | | | 37 | % | | | 54 | % | | | 63 | % | | | 69 | % | | | 84 | % |
Net assets, end of period (000s omitted) | | | $1,627,048 | | | | $1,661,362 | | | | $1,807,790 | | | | $1,759,128 | | | | $1,503,256 | | | | $383,203 | |
| 1. | Amount is less than $0.005. |
| 2. | Total return calculations do not include any sales charges. Returns for periods of less than one year are not annualized. |
| 3. | Ratios include interest and fee expense relating to inverse floating-rate obligations as follows: |
| | | | |
Six months ended December 31, 2014 (unaudited) | | | 0.00 | % |
Year ended June 30, 2014 | | | 0.01 | % |
Year ended June 30, 2013 | | | 0.00 | % |
Year ended June 30, 2012 | | | 0.00 | % |
Year ended June 30, 2011 | | | 0.02 | % |
Year ended June 30, 2010 | | | 0.03 | % |
The accompanying notes are an integral part of these financial statements.
| | | | | | |
| Financial highlights | | Wells Fargo Advantage Municipal Bond Fund | | | 19 | |
(For a share outstanding throughout each period)
| | | | | | | | | | | | | | | | | | | | | | | | |
| | | Six months ended December 31, 2014 (unaudited) | | | Year ended June 30 | |
| CLASS B | | | 2014 | | | 2013 | | | 2012 | | | 2011 | | | 2010 | |
Net asset value, beginning of period | | | $10.34 | | | | $10.00 | | | | $10.24 | | | | $9.54 | | | | $9.51 | | | | $8.72 | |
Net investment income | | | 0.10 | | | | 0.26 | 1 | | | 0.19 | | | | 0.29 | | | | 0.33 | | | | 0.35 | |
Net realized and unrealized gains (losses) on investments | | | 0.21 | | | | 0.41 | | | | (0.08 | ) | | | 0.71 | | | | 0.03 | | | | 0.85 | |
| | | | | | | | | | | | | | | | | | | | | | | | |
Total from investment operations | | | 0.31 | | | | 0.67 | | | | 0.11 | | | | 1.00 | | | | 0.36 | | | | 1.20 | |
Distributions to shareholders from | | | | | | | | | | | | | | | | | | | | | | | | |
Net investment income | | | (0.10 | ) | | | (0.26 | ) | | | (0.19 | ) | | | (0.30 | ) | | | (0.32 | ) | | | (0.34 | ) |
Net realized gains | | | (0.09 | ) | | | (0.07 | ) | | | (0.16 | ) | | | (0.00 | )2 | | | (0.01 | ) | | | (0.07 | ) |
| | | | | | | | | | | | | | | | | | | | | | | | |
Total distributions to shareholders | | | (0.19 | ) | | | (0.33 | ) | | | (0.35 | ) | | | (0.30 | ) | | | (0.33 | ) | | | (0.41 | ) |
Net asset value, end of period | | | $10.46 | | | | $10.34 | | | | $10.00 | | | | $10.24 | | | | $9.54 | | | | $9.51 | |
Total return3 | | | 2.97 | % | | | 6.90 | % | | | 0.94 | % | | | 10.62 | % | | | 3.92 | % | | | 13.43 | % |
Ratios to average net assets (annualized) | | | | | | | | | | | | | | | | | | | | | | | | |
Gross expenses | | | 1.55 | %4 | | | 1.55 | %4 | | | 1.54 | %4 | | | 1.56 | %4 | | | 1.57 | %4 | | | 1.61 | %4 |
Net expenses | | | 1.50 | %4 | | | 1.51 | %4 | | | 1.50 | %4 | | | 1.50 | %4 | | | 1.52 | %4 | | | 1.50 | %4 |
Net investment income | | | 1.84 | % | | | 2.66 | % | | | 1.83 | % | | | 3.05 | % | | | 3.39 | % | | | 3.71 | % |
Supplemental data | | | | | | | | | | | | | | | | | | | | | | | | |
Portfolio turnover rate | | | 14 | % | | | 37 | % | | | 54 | % | | | 63 | % | | | 69 | % | | | 84 | % |
Net assets, end of period (000s omitted) | | | $2,760 | | | | $3,650 | | | | $7,604 | | | | $14,723 | | | | $24,040 | | | | $3,437 | |
| 1. | Calculated based upon average shares outstanding |
| 2. | Amount is less than $0.005. |
| 3. | Total return calculations do not include any sales charges. Returns for periods of less than one year are not annualized. |
| 4. | Ratios include interest and fee expense relating to inverse floating-rate obligations as follows: |
| | | | |
Six months ended December 31, 2014 (unaudited) | | | 0.00 | % |
Year ended June 30, 2014 | | | 0.01 | % |
Year ended June 30, 2013 | | | 0.00 | % |
Year ended June 30, 2012 | | | 0.00 | % |
Year ended June 30, 2011 | | | 0.02 | % |
Year ended June 30, 2010 | | | 0.03 | % |
The accompanying notes are an integral part of these financial statements.
| | | | |
| 20 | | Wells Fargo Advantage Municipal Bond Fund | | Financial highlights |
(For a share outstanding throughout each period)
| | | | | | | | | | | | | | | | | | | | | | | | |
| | | Six months ended
December 31, 2014 (unaudited) | | | Year ended June 30 | |
| CLASS C | | | 2014 | | | 2013 | | | 2012 | | | 2011 | | | 2010 | |
Net asset value, beginning of period | | | $10.33 | | | | $10.00 | | | | $10.23 | | | | $9.53 | | | | $9.51 | | | | $8.74 | |
Net investment income | | | 0.10 | | | | 0.26 | | | | 0.19 | | | | 0.30 | | | | 0.32 | | | | 0.33 | |
Net realized and unrealized gains (losses) on investments | | | 0.21 | | | | 0.40 | | | | (0.07 | ) | | | 0.70 | | | | 0.03 | | | | 0.85 | |
| | | | | | | | | | | | | | | | | | | | | | | | |
Total from investment operations | | | 0.31 | | | | 0.66 | | | | 0.12 | | | | 1.00 | | | | 0.35 | | | | 1.18 | |
Distributions to shareholders from | | | | | | | | | | | | | | | | | | | | | | | | |
Net investment income | | | (0.10 | ) | | | (0.26 | ) | | | (0.19 | ) | | | (0.30 | ) | | | (0.32 | ) | | | (0.34 | ) |
Net realized gains | | | (0.09 | ) | | | (0.07 | ) | | | (0.16 | ) | | | (0.00 | )1 | | | (0.01 | ) | | | (0.07 | ) |
| | | | | | | | | | | | | | | | | | | | | | | | |
Total distributions to shareholders | | | (0.19 | ) | | | (0.33 | ) | | | (0.35 | ) | | | (0.30 | ) | | | (0.33 | ) | | | (0.41 | ) |
Net asset value, end of period | | | $10.45 | | | | $10.33 | | | | $10.00 | | | | $10.23 | | | | $9.53 | | | | $9.51 | |
Total return2 | | | 2.97 | % | | | 6.80 | % | | | 1.04 | % | | | 10.63 | % | | | 3.81 | % | | | 13.43 | % |
Ratios to average net assets (annualized) | | | | | | | | | | | | | | | | | | | | | | | | |
Gross expenses | | | 1.55 | %3 | | | 1.55 | %3 | | | 1.55 | %3 | | | 1.56 | %3 | | | 1.58 | %3 | | | 1.61 | %3 |
Net expenses | | | 1.50 | %3 | | | 1.51 | %3 | | | 1.50 | %3 | | | 1.50 | %3 | | | 1.52 | %3 | | | 1.50 | %3 |
Net investment income | | | 1.84 | % | | | 2.60 | % | | | 1.82 | % | | | 2.95 | % | | | 3.42 | % | | | 3.59 | % |
Supplemental data | | | | | | | | | | | | | | | | | | | | | | | | |
Portfolio turnover rate | | | 14 | % | | | 37 | % | | | 54 | % | | | 63 | % | | | 69 | % | | | 84 | % |
Net assets, end of period (000s omitted) | | | $165,522 | | | | $154,863 | | | | $168,658 | | | | $168,883 | | | | $126,338 | | | | $33,864 | |
| 1. | Amount is less than $0.005. |
| 2. | Total return calculations do not include any sales charges. Returns for periods of less than one year are not annualized. |
| 3. | Ratios include interest and fee expense relating to inverse floating-rate obligations as follows: |
| | | | |
Six months ended December 31, 2014 (unaudited) | | | 0.00 | % |
Year ended June 30, 2014 | | | 0.01 | % |
Year ended June 30, 2013 | | | 0.00 | % |
Year ended June 30, 2012 | | | 0.00 | % |
Year ended June 30, 2011 | | | 0.02 | % |
Year ended June 30, 2010 | | | 0.03 | % |
The accompanying notes are an integral part of these financial statements.
| | | | | | |
| Financial highlights | | Wells Fargo Advantage Municipal Bond Fund | | | 21 | |
(For a share outstanding throughout each period)
| | | | | | | | | | | | | | | | | | | | | | | | |
| | | Six months ended
December 31, 2014 (unaudited) | | | Year ended June 30 | |
| ADMINISTRATOR CLASS | | | 2014 | | | 2013 | | | 2012 | | | 2011 | | | 2010 | |
Net asset value, beginning of period | | | $10.34 | | | | $10.01 | | | | $10.24 | | | | $9.54 | | | | $9.50 | | | | $8.73 | |
Net investment income | | | 0.15 | | | | 0.35 | | | | 0.28 | | | | 0.39 | | | | 0.40 | | | | 0.42 | |
Net realized and unrealized gains (losses) on investments | | | 0.21 | | | | 0.40 | | | | (0.07 | ) | | | 0.69 | | | | 0.06 | | | | 0.85 | |
| | | | | | | | | | | | | | | | | | | | | | | | |
Total from investment operations | | | 0.36 | | | | 0.75 | | | | 0.21 | | | | 1.08 | | | | 0.46 | | | | 1.27 | |
Distributions to shareholders from | | | | | | | | | | | | | | | | | | | | | | | | |
Net investment income | | | (0.15 | ) | | | (0.35 | ) | | | (0.28 | ) | | | (0.38 | ) | | | (0.41 | ) | | | (0.43 | ) |
Net realized gains | | | (0.09 | ) | | | (0.07 | ) | | | (0.16 | ) | | | (0.00 | )1 | | | (0.01 | ) | | | (0.07 | ) |
| | | | | | | | | | | | | | | | | | | | | | | | |
Total distributions to shareholders | | | (0.24 | ) | | | (0.42 | ) | | | (0.44 | ) | | | (0.38 | ) | | | (0.42 | ) | | | (0.50 | ) |
Net asset value, end of period | | | $10.46 | | | | $10.34 | | | | $10.01 | | | | $10.24 | | | | $9.54 | | | | $9.50 | |
Total return2 | | | 3.43 | % | | | 7.75 | % | | | 1.96 | % | | | 11.62 | % | | | 4.96 | % | | | 14.33 | % |
Ratios to average net assets (annualized) | | | | | | | | | | | | | | | | | | | | | | | | |
Gross expenses | | | 0.74 | %3 | | | 0.74 | %3 | | | 0.74 | %3 | | | 0.74 | %3 | | | 0.75 | %3 | | | 0.78 | %3 |
Net expenses | | | 0.60 | %3 | | | 0.61 | %3 | | | 0.60 | %3 | | | 0.60 | %3 | | | 0.62 | %3 | | | 0.60 | %3 |
Net investment income | | | 2.74 | % | | | 3.49 | % | | | 2.72 | % | | | 3.74 | % | | | 4.26 | % | | | 4.55 | % |
Supplemental data | | | | | | | | | | | | | | | | | | | | | | | | |
Portfolio turnover rate | | | 14 | % | | | 37 | % | | | 54 | % | | | 63 | % | | | 69 | % | | | 84 | % |
Net assets, end of period (000s omitted) | | | $430,621 | | | | $362,896 | | | | $451,005 | | | | $227,942 | | | | $78,861 | | | | $186,661 | |
| 1. | Amount is less than $0.005. |
| 2. | Returns for periods of less than one year are not annualized. |
| 3. | Ratios include interest and fee expense relating to inverse floating-rate obligations as follows: |
| | | | |
Six months ended December 31, 2014 (unaudited) | | | 0.00 | % |
Year ended June 30, 2014 | | | 0.01 | % |
Year ended June 30, 2013 | | | 0.00 | % |
Year ended June 30, 2012 | | | 0.00 | % |
Year ended June 30, 2011 | | | 0.02 | % |
Year ended June 30, 2010 | | | 0.03 | % |
The accompanying notes are an integral part of these financial statements.
| | | | |
| 22 | | Wells Fargo Advantage Municipal Bond Fund | | Financial highlights |
(For a share outstanding throughout each period)
| | | | | | | | | | | | | | | | | | | | | | | | |
| | | Six months ended
December 31, 2014 (unaudited) | | | Year ended June 30 | |
| INSTITUTIONAL CLASS | | | 2014 | | | 2013 | | | 2012 | | | 2011 | | | 2010 | |
Net asset value, beginning of period | | | $10.33 | | | | $10.00 | | | | $10.24 | | | | $9.54 | | | | $9.51 | | | | $8.73 | |
Net investment income | | | 0.15 | | | | 0.36 | | | | 0.30 | | | | 0.40 | | | | 0.42 | | | | 0.41 | |
Net realized and unrealized gains (losses) on investments | | | 0.21 | | | | 0.40 | | | | (0.08 | ) | | | 0.70 | | | | 0.04 | | | | 0.88 | |
| | | | | | | | | | | | | | | | | | | | | | | | |
Total from investment operations | | | 0.36 | | | | 0.76 | | | | 0.22 | | | | 1.10 | | | | 0.46 | | | | 1.29 | |
Distributions to shareholders from | | | | | | | | | | | | | | | | | | | | | | | | |
Net investment income | | | (0.15 | ) | | | (0.36 | ) | | | (0.30 | ) | | | (0.40 | ) | | | (0.42 | ) | | | (0.44 | ) |
Net realized gains | | | (0.09 | ) | | | (0.07 | ) | | | (0.16 | ) | | | (0.00 | )1 | | | (0.01 | ) | | | (0.07 | ) |
| | | | | | | | | | | | | | | | | | | | | | | | |
Total distributions to shareholders | | | (0.24 | ) | | | (0.43 | ) | | | (0.46 | ) | | | (0.40 | ) | | | (0.43 | ) | | | (0.51 | ) |
Net asset value, end of period | | | $10.45 | | | | $10.33 | | | | $10.00 | | | | $10.24 | | | | $9.54 | | | | $9.51 | |
Total return2 | | | 3.50 | % | | | 7.90 | % | | | 2.00 | % | | | 11.76 | % | | | 4.99 | % | | | 14.73 | % |
Ratios to average net assets (annualized) | | | | | | | | | | | | | | | | | | | | | | | | |
Gross expenses | | | 0.47 | %3 | | | 0.47 | %3 | | | 0.47 | %3 | | | 0.47 | %3 | | | 0.50 | %3 | | | 0.50 | %3 |
Net expenses | | | 0.47 | %3 | | | 0.47 | %3 | | | 0.47 | %3 | | | 0.47 | %3 | | | 0.49 | %3 | | | 0.50 | %3 |
Net investment income | | | 2.88 | % | | | 3.58 | % | | | 2.85 | % | | | 4.15 | % | | | 4.46 | % | | | 4.42 | % |
Supplemental data | | | | | | | | | | | | | | | | | | | | | | | | |
Portfolio turnover rate | | | 14 | % | | | 37 | % | | | 54 | % | | | 63 | % | | | 69 | % | | | 84 | % |
Net assets, end of period (000s omitted) | | | $459,320 | | | | $255,112 | | | | $143,062 | | | | $151,285 | | | | $427,525 | | | | $2,809 | |
| 1. | Amount is less than $0.005. |
| 2. | Returns for periods of less than one year are not annualized. |
| 3. | Ratios include interest and fee expense relating to inverse floating-rate obligations as follows: |
| | | | |
Six months ended December 31, 2014 (unaudited) | | | 0.00 | % |
Year ended June 30, 2014 | | | 0.01 | % |
Year ended June 30, 2013 | | | 0.00 | % |
Year ended June 30, 2012 | | | 0.00 | % |
Year ended June 30, 2011 | | | 0.02 | % |
Year ended June 30, 2010 | | | 0.03 | % |
The accompanying notes are an integral part of these financial statements.
| | | | | | |
| Financial highlights | | Wells Fargo Advantage Municipal Bond Fund | | | 23 | |
(For a share outstanding throughout each period)
| | | | | | | | | | | | | | | | | | | | | | | | |
| | | Six months ended December 31, 2014 (unaudited) | | | Year ended June 30 | |
| INVESTOR CLASS | | | 2014 | | | 2013 | | | 2012 | | | 2011 | | | 2010 | |
Net asset value, beginning of period | | | $10.33 | | | | $10.00 | | | | $10.23 | | | | $9.53 | | | | $9.51 | | | | $8.74 | |
Net investment income | | | 0.14 | | | | 0.33 | | | | 0.26 | | | | 0.37 | | | | 0.39 | | | | 0.41 | |
Net realized and unrealized gains (losses) on investments | | | 0.21 | | | | 0.40 | | | | (0.07 | ) | | | 0.70 | | | | 0.03 | | | | 0.84 | |
| | | | | | | | | | | | | | | | | | | | | | | | |
Total from investment operations | | | 0.35 | | | | 0.73 | | | | 0.19 | | | | 1.07 | | | | 0.42 | | | | 1.25 | |
Distributions to shareholders from | | | | | | | | | | | | | | | | | | | | | | | | |
Net investment income | | | (0.14 | ) | | | (0.33 | ) | | | (0.26 | ) | | | (0.37 | ) | | | (0.39 | ) | | | (0.41 | ) |
Net realized gains | | | (0.09 | ) | | | (0.07 | ) | | | (0.16 | ) | | | (0.00 | )1 | | | (0.01 | ) | | | (0.07 | ) |
| | | | | | | | | | | | | | | | | | | | | | | | |
Total distributions to shareholders | | | (0.23 | ) | | | (0.40 | ) | | | (0.42 | ) | | | (0.37 | ) | | | (0.40 | ) | | | (0.48 | ) |
Net asset value, end of period | | | $10.45 | | | | $10.33 | | | | $10.00 | | | | $10.23 | | | | $9.53 | | | | $9.51 | |
Total return2 | | | 3.34 | % | | | 7.57 | % | | | 1.77 | % | | | 11.42 | % | | | 4.56 | % | | | 14.23 | % |
Ratios to average net assets (annualized) | | | | | | | | | | | | | | | | | | | | | | | | |
Gross expenses | | | 0.83 | %3 | | | 0.83 | %3 | | | 0.83 | %3 | | | 0.84 | %3 | | | 0.86 | %3 | | | 0.91 | %3 |
Net expenses | | | 0.78 | %3 | | | 0.79 | %3 | | | 0.78 | %3 | | | 0.78 | %3 | | | 0.80 | %3 | | | 0.80 | %3 |
Net investment income | | | 2.56 | % | | | 3.32 | % | | | 2.53 | % | | | 3.64 | % | | | 4.13 | % | | | 4.35 | % |
Supplemental data | | | | | | | | | | | | | | | | | | | | | | | | |
Portfolio turnover rate | | | 14 | % | | | 37 | % | | | 54 | % | | | 63 | % | | | 69 | % | | | 84 | % |
Net assets, end of period (000s omitted) | | | $526,303 | | | | $544,521 | | | | $583,925 | | | | $538,857 | | | | $334,987 | | | | $330,799 | |
| 1. | Amount is less than $0.005. |
| 2. | Returns for periods of less than one year are not annualized. |
| 3. | Ratios include interest and fee expense relating to inverse floating-rate obligations as follows: |
| | | | |
Six months ended December 31, 2014 (unaudited) | | | 0.00 | % |
Year ended June 30, 2014 | | | 0.01 | % |
Year ended June 30, 2013 | | | 0.00 | % |
Year ended June 30, 2012 | | | 0.00 | % |
Year ended June 30, 2011 | | | 0.02 | % |
Year ended June 30, 2010 | | | 0.03 | % |
The accompanying notes are an integral part of these financial statements.
| | | | |
| 24 | | Wells Fargo Advantage Municipal Bond Fund | | Notes to financial statements (unaudited) |
1. ORGANIZATION
Wells Fargo Funds Trust (the “Trust”), a Delaware statutory trust organized on March 10, 1999, is an open-end management investment company registered under the Investment Company Act of 1940, as amended (the “1940 Act”). As an investment company, the Trust follows the accounting and reporting guidance in FASB Accounting Standards Codification 946. These financial statements report on the Wells Fargo Advantage Municipal Bond Fund (the “Fund”) which is a diversified series of the Trust.
2. SIGNIFICANT ACCOUNTING POLICIES
The following significant accounting policies, which are consistently followed in the preparation of the financial statements of the Fund, are in conformity with U.S. generally accepted accounting principles which require management to make estimates and assumptions that affect the reported amounts of assets and liabilities, disclosure of contingent assets and liabilities at the date of the financial statements, and the reported amounts of revenues and expenses during the reporting period. Actual results could differ from those estimates.
Securities valuation
All investments are valued each business day as of the close of regular trading on the New York Stock Exchange (generally 4 p.m. Eastern Time).
Fixed income securities acquired with maturities exceeding 60 days are valued based on evaluated bid prices provided by an independent pricing service which may utilize both transaction data and market information such as yield, quality, coupon rate, maturity, type of issue, trading characteristics and other market data. If prices are not available from the independent pricing service or prices received are deemed not representative of market value, prices will be obtained from an independent broker-dealer.
Futures that are listed on a foreign or domestic exchange or market are valued at the official closing price or, if none, the last sales price.
Short-term securities, with maturities of 60 days or less at time of purchase, generally are valued at amortized cost which approximates fair value. The amortized cost method involves valuing a security at its cost, plus accretion of discount or minus amortization of premium over the period until maturity.
Investments in registered open-end investment companies are valued at net asset value.
Investments which are not valued using any of the methods discussed above are valued at their fair value, as determined in good faith by the Board of Trustees of the Fund. The Board of Trustees has established a Valuation Committee comprised of the Trustees and has delegated to it the authority to take any actions regarding the valuation of portfolio securities that the Valuation Committee deems necessary or appropriate, including determining the fair value of portfolio securities, unless the determination has been delegated to the Management Valuation Team of Wells Fargo Funds Management, LLC (“Funds Management”). The Board of Trustees retains the authority to make or ratify any valuation decisions or approve any changes to the Valuation Procedures as it deems appropriate. On a quarterly basis, the Board of Trustees receives reports on any valuation actions taken by the Valuation Committee or the Management Valuation Team which may include items for ratification.
Valuations of fair valued securities are compared to the next actual sales price when available, or other appropriate market values, to assess the continued appropriateness of the fair valuation methodologies used. These securities are fair valued on a day-to-day basis, taking into consideration changes to appropriate market information and any significant changes to the inputs considered in the valuation process until there is a readily available price provided on an exchange or by an independent pricing service. Valuations received from an independent pricing service or independent broker-dealer quotes are periodically validated by comparisons to most recent trades and valuations provided by other independent pricing services in addition to the review of prices by the adviser and/or subadviser. Unobservable inputs used in determining fair valuations are identified based on the type of security, taking into consideration factors utilized by market participants in valuing the investment, knowledge about the issuer and the current market environment.
When-issued transactions
The Fund may purchase securities on a forward commitment or when-issued basis. The Fund records a when-issued transaction on the trade date and will segregate assets in an amount at least equal in value to the Fund’s commitment to purchase when-issued securities. Securities purchased on a when-issued basis are marked-to-market daily and the Fund begins earning interest on the settlement date. Losses may arise due to changes in the market value of the underlying securities or if the counterparty does not perform under the contract.
| | | | | | |
| Notes to financial statements (unaudited) | | Wells Fargo Advantage Municipal Bond Fund | | | 25 | |
Futures contracts
The Fund is subject to interest rate risk in the normal course of pursuing its investment objectives. The Fund may buy and sell futures contracts in order to gain exposure to, or protect against, changes in security values and interest rates. The primary risks associated with the use of futures contracts are the imperfect correlation between changes in market values of securities held by the Fund and the prices of futures contracts, and the possibility of an illiquid market.
The aggregate principal amounts of the contracts are not recorded in the financial statements. Fluctuations in the value of the contracts are recorded in the Statement of Assets and Liabilities as an asset or liability and in the Statement of Operations as unrealized gains or losses until the contracts are closed, at which point they are recorded as net realized gains or losses on futures contracts. With futures contracts, there is minimal counterparty risk to the Fund since futures are exchange traded and the exchange’s clearinghouse, as counterparty to all exchange traded futures, guarantees the futures against default.
Inverse floating-rate obligations
The Fund may participate in inverse floating-rate obligation (“Inverse Floater”) structures whereby a fixed-rate bond (“Fixed-Rate Bond”) purchased by the Fund is transferred to a tender option bond trust (“TOB Trust”). The TOB Trust issues floating-rate notes (“Floating-Rate Notes”) to third-parties, which are collateralized by the Fixed-Rate Bond, and the Fund buys a residual interest in the TOB Trust’s assets and cash flows. The Inverse Floater held by the Fund gives the Fund the right (1) to cause the holders of the Floating-Rate Notes to tender their notes at par, and (2) to have the Fixed-Rate Bond held by the TOB Trust transferred back to the Fund, thereby collapsing the TOB Trust. The Fund accounts for the transaction described above as a secured borrowing by including the Fixed-Rate Bond in its Portfolio of Investments, and by recording the Floating-Rate Notes as a liability in the Statement of Assets and Liabilities. The Fund also records the interest paid on Floating-Rate Notes as interest expense. The Floating-Rate Notes have interest rates that generally reset weekly and their holders have the option to tender their notes for redemption at par at each reset date. Inverse Floaters held by the Fund are securities exempt from registration under Rule 144A of the Securities Act of 1933, as amended.
Security transactions and income recognition
Securities transactions are recorded on a trade date basis. Realized gains or losses are recorded on the basis of identified cost.
Interest income is accrued daily and bond discounts are accreted and premiums are amortized daily based on the effective interest method. To the extent debt obligations are placed on non-accrual status, any related interest income may be reduced by writing off interest receivables when the collection of all or a portion of interest has become doubtful based on consistently applied procedures. If the issuer subsequently resumes interest payments or when the collectability of interest is reasonably assured, the debt obligation is removed from non-accrual status.
Distributions to shareholders
Distributions to shareholders from net investment income are accrued daily and paid monthly. Distributions from net realized gains, if any, are recorded on the ex-dividend date. Such distributions are determined in conformity with federal income tax regulations, which may differ in amount or character from net investment income and realized gains recognized for purposes of U.S. generally accepted accounting principles.
Federal and other taxes
The Fund intends to continue to qualify as a regulated investment company by distributing substantially all of its investment company taxable and tax-exempt income and any net realized capital gains (after reduction for capital loss carryforwards) sufficient to relieve it from all, or substantially all, federal income taxes. Accordingly, no provision for federal income taxes was required.
The Fund’s income and federal excise tax returns and all financial records supporting those returns for the prior three fiscal years are subject to examination by the federal and Delaware revenue authorities. Management has analyzed the Fund’s tax positions taken on federal, state, and foreign tax returns for all open tax years and does not believe that there are any uncertain tax positions that require recognition of a tax liability.
As of June 30, 2014, capital loss carryforwards available to offset future net realized capital gains were as follows through the indicated expiration dates:
| | | | | | |
| 2016 | | 2017 | | 2018 | | 2019 |
| $11,849,292 | | $5,924,646 | | $5,924,646 | | $130,027 |
| | | | |
| 26 | | Wells Fargo Advantage Municipal Bond Fund | | Notes to financial statements (unaudited) |
Class allocations
The separate classes of shares offered by the Fund differ principally in applicable sales charges, distribution, shareholder servicing, and administration fees. Class specific expenses are charged directly to that share class. Investment income, common expenses, and realized and unrealized gains (losses) on investments are allocated daily to each class of shares based on the relative proportion of net assets of each class.
3. FAIR VALUATION MEASUREMENTS
Fair value measurements of investments are determined within a framework that has established a fair value hierarchy based upon the various data inputs utilized in determining the value of the Fund’s investments. The three-level hierarchy gives the highest priority to unadjusted quoted prices in active markets for identical assets or liabilities (Level 1) and the lowest priority to significant unobservable inputs (Level 3). The Fund’s investments are classified within the fair value hierarchy based on the lowest level of input that is significant to the fair value measurement. The inputs are summarized into three broad levels as follows:
| n | | Level 1 – quoted prices in active markets for identical securities |
| n | | Level 2 – other significant observable inputs (including quoted prices for similar securities, interest rates, prepayment speeds, credit risk, use of amortized cost, etc.) |
| n | | Level 3 – significant unobservable inputs (including the Fund’s own assumptions in determining the fair value of investments) |
The inputs or methodologies used for valuing investments in securities are not necessarily an indication of the risk associated with investing in those securities.
The following is a summary of the inputs used in valuing the Fund’s assets and liabilities as of December 31, 2014:
| | | | | | | | | | | | | | | | |
| | | Quoted prices
(Level 1) | | | Other significant
observable inputs
(Level 2) | | | Significant
unobservable inputs
(Level 3) | | | Total | |
Assets | | | | | | | | | | | | | | | | |
Investments in: | | | | | | | | | | | | | | | | |
| | | | |
Municipal obligations | | $ | 0 | | | $ | 3,162,074,855 | | | $ | 6,790,000 | | | $ | 3,168,864,855 | |
| | | | |
Short-term investments | | | | | | | | | | | | | | | | |
Commercial paper | | | 0 | | | | 15,000,000 | | | | 0 | | | | 15,000,000 | |
Investment companies | | | 33,243,829 | | | | 0 | | | | 0 | | | | 33,243,829 | |
U.S. Treasury securities | | | 2,599,904 | | | | 0 | | | | 0 | | | | 2,599,904 | |
Total assets | | $ | 35,843,733 | | | $ | 3,177,074,855 | | | $ | 6,790,000 | | | $ | 3,219,708,588 | |
Liabilities | | | | | | | | | | | | | | | | |
| | | | |
Futures contracts | | | 0 | | | | 376,531 | | | | 0 | | | | 376,531 | |
Total liabilities | | $ | 0 | | | $ | 376,531 | | | $ | 0 | | | $ | 376,531 | |
Futures contracts are reported at their variation margin at measurement date, which represents the amount due from the Fund at that date. All other assets and liabilities are reported at their market value at measurement date.
Transfers in and transfers out are recognized at the end of the reporting period. At December 31, 2014, the Fund did not have any transfers into/out of Level 1, Level 2, or Level 3.
4. TRANSACTIONS WITH AFFILIATES
Advisory fee
The Trust has entered into an advisory contract with Funds Management, an indirect wholly owned subsidiary of Wells Fargo & Company (“Wells Fargo”). The adviser is responsible for implementing investment policies and guidelines and for supervising the subadviser, who is responsible for day-to-day portfolio management of the Fund.
Pursuant to the contract, Funds Management is entitled to receive an annual advisory fee starting at 0.35% and declining to 0.25% as the average daily net assets of the Fund increase. For the six months ended December 31, 2014, the advisory fee was equivalent to an annual rate of 0.31% of the Fund’s average daily net assets.
| | | | | | |
| Notes to financial statements (unaudited) | | Wells Fargo Advantage Municipal Bond Fund | | | 27 | |
Funds Management has retained the services of a subadviser to provide daily portfolio management to the Fund. The fee for subadvisory services is borne by Funds Management. Wells Capital Management Incorporated, an affiliate of Funds Management and an indirect wholly owned subsidiary of Wells Fargo, is the subadviser to the Fund and is entitled to receive a fee from Funds Management at an annual rate starting at 0.20% and declining to 0.10% as the average daily net assets of the Fund increase.
Administration fees
The Trust has entered into an administration agreement with Funds Management. Under this agreement, for providing administrative services, which includes paying fees and expenses for services provided by the transfer agent, sub-transfer agents, omnibus account servicers and record-keepers, Funds Management is entitled to receive from the Fund an annual fund level administration fee starting at 0.05% and declining to 0.03% as the average daily net assets of the Fund increase and a class level administration fee which is calculated based on the average daily net assets of each class as follows:
| | | | |
| | | Class level
administration fee | |
Class A, Class B, Class C | | | 0.16 | % |
Administrator Class | | | 0.10 | |
Institutional Class | | | 0.08 | |
Investor Class | | | 0.19 | |
Funds Management has contractually waived and/or reimbursed advisory and administration fees to the extent necessary to maintain certain net operating expense ratios for the Fund. Waiver of fees and/or reimbursement of expenses by Funds Management were made first from fund level expenses on a proportionate basis and then from class specific expenses. Funds Management has committed through October 31, 2015 to waive fees and/or reimburse expenses to the extent necessary to cap the Fund’s expenses at 0.75% for Class A shares, 1.50% for Class B shares, 1.50% for Class C shares, 0.60% for Administrator Class shares, 0.48% for Institutional Class shares, and 0.78% for Investor Class shares. After this time, the cap may be increased or the commitment to maintain the cap may be terminated only with the approval of the Board of Trustees.
Distribution fees
The Trust has adopted a Distribution Plan for Class B and Class C shares of the Fund pursuant to Rule 12b-1 under the 1940 Act. Distribution fees are charged to Class B and Class C shares and paid to Wells Fargo Funds Distributor, LLC (“Funds Distributor”), the principal underwriter, at an annual rate of 0.75% of the average daily net assets of Class B and Class C shares.
In addition, Funds Distributor is entitled to receive the front-end sales charge from the purchase of Class A shares and a contingent deferred sales charge on the redemption of certain shares. Funds Distributor is also entitled to receive the contingent deferred sales charges from redemptions of Class B and Class C shares. For the six months ended December 31, 2014, Funds Distributor received $30,012 from the sale of Class A shares.
Shareholder servicing fees
The Trust has entered into contracts with one or more shareholder servicing agents, whereby Class A, Class B, Class C, Administrator Class, and Investor Class of the Fund is charged a fee at an annual rate of 0.25% of the average daily net assets of each respective class.
A portion of these total shareholder servicing fees were paid to affiliates of Wells Fargo.
5. INVESTMENT PORTFOLIO TRANSACTIONS
Purchases and sales of investments, excluding U.S. government obligations (if any) and short-term securities, for the six months ended December 31, 2014 were $854,187,982 and $342,945,087, respectively.
6. DERIVATIVE TRANSACTIONS
During the six months ended December 31, 2014, the Fund entered into futures contracts to take advantage of the differences between municipal and treasury yields and to help manage the duration of the portfolio.
| | | | |
| 28 | | Wells Fargo Advantage Municipal Bond Fund | | Notes to financial statements (unaudited) |
At December 31, 2014, the Fund had short futures contracts outstanding as follows:
| | | | | | | | | | | | | | |
| Expiration date | | Counterparty | | Contracts | | Type | | Contract value at December 31, 2014 | | | Unrealized
gains (losses) | |
3-20-2015 | | JPMorgan | | 595 Short | | 10-Year U.S. Treasury Notes | | $ | 75,444,141 | | | $ | 22,776 | |
3-20-2015 | | JPMorgan | | 876 Short | | U.S. Treasury Bonds | | | 126,636,750 | | | | (954,321 | ) |
The Fund had an average notional amount of $29,202,495 in futures contracts during the six months ended December 31, 2014.
On December 31, 2014, the cumulative unrealized losses on futures contracts in the amount of $931,545 are reflected in net unrealized gains on investments on the Statement of Assets and Liabilities. The payable for daily variation margin on open futures contracts reflected in the Statement of Assets and Liabilities only represents the current day’s variation margin. The realized gains and change in unrealized gains (losses) on futures contracts are reflected in the Statement of Operations.
For certain types of derivative transactions, the Fund has entered into International Swaps and Derivatives Association, Inc. master agreements (“ISDA Master Agreements”) or similar agreements with approved counterparties. The ISDA Master Agreements or similar agreements may have requirements to deliver/deposit securities or cash to/with an exchange or broker-dealer as collateral and allows the Fund to offset, with each counterparty, certain derivative financial instrument’s assets and/or liabilities with collateral held or pledged. Collateral requirements differ by type of derivative. Collateral or margin requirements are set by the broker or exchange clearing house for exchange traded derivatives while collateral terms are contract specific for over-the-counter traded derivatives. Cash collateral that has been pledged to cover obligations of the Fund under ISDA Master Agreements or similar agreements, if any, will be reported separately in the Statement of Assets and Liabilities. Securities pledged as collateral, if any, for the same purpose are noted in the Portfolio of Investments. With respect to balance sheet offsetting, absent an event of default by the counterparty or a termination of the agreement, the reported amounts of financial assets and financial liabilities in the Statement of Assets and Liabilities are not offset across transactions between the Fund and the applicable counterparty. A reconciliation of the gross amounts on the Statement of Assets and Liabilities to the net amounts by derivative type, including any collateral exposure, is as follows:
| | | | | | | | | | | | | | | | |
| Derivative type | | Counterparty | | Gross amounts
of liabilities in the
Statement of
Assets and
Liabilities | | Amounts
subject to
netting
agreements | | | Collateral
pledged1 | | | Net amount
of liabilities | |
Futures – variation margin | | JPMorgan | | $376,531 | | $ | 0 | | | $ | (376,531 | ) | | $ | 0 | |
| | 1. | Collateral pledged within this table is limited to the collateral for the net transaction with the counterparty. | |
7. BORROWINGS
The Trust (excluding the money market funds and certain other funds in the Trust) and Wells Fargo Variable Trust are parties to a $150,000,000 revolving credit agreement, whereby the Fund is permitted to use bank borrowings for temporary or emergency purposes, such as to fund shareholder redemption requests. Interest under the credit agreement is charged to the Fund based on a borrowing rate equal to the higher of the Federal Funds rate in effect on that day plus 1.25% or the overnight LIBOR rate in effect on that day plus 1.25%. In addition, an annual commitment fee equal to 0.10% of the unused balance is allocated to each participating fund. For the six months ended December 31, 2014, the Fund paid $1,641 in commitment fees.
For the six months ended December 31, 2014, there were no borrowings by the Fund under the agreement.
During the six months ended December 31, 2014, the Fund participated in Inverse Floaters which are accounted for as a secured borrowing. At December 31, 2014, the value of Floating-Rate Notes outstanding and the related collateral were $5,025,000 and $12,101,808, respectively. During the six months ended December 31, 2014, the Fund held Floating-Rate Notes that had an average daily balance outstanding of $5,025,000 (on an annualized basis) and incurred interest and fee expense in the amount of $22,927.
8. INDEMNIFICATION
Under the Trust’s organizational documents, the officers and Trustees are indemnified against certain liabilities that may arise out of performance of their duties to the Trust. Additionally, in the normal course of business, the Trust may enter into contracts with service providers that contain a variety of indemnification clauses. The Trust’s maximum exposure under these arrangements is dependent on future claims that may be made against the Fund and, therefore, cannot be estimated.
| | | | | | |
| Other information (unaudited) | | Wells Fargo Advantage Municipal Bond Fund | | | 29 | |
PROXY VOTING INFORMATION
A description of the policies and procedures that the Fund uses to determine how to vote proxies relating to portfolio securities is available without charge, upon request, by calling 1-800-222-8222, visiting our website at wellsfargoadvantagefunds.com, or visiting the SEC website at sec.gov. Information regarding how the Fund voted proxies relating to portfolio securities during the most recent 12-month period ended June 30 is available on the Fund’s website at wellsfargoadvantagefunds.com or by visiting the SEC website at sec.gov.
PORTFOLIO HOLDINGS INFORMATION
The complete portfolio holdings for the Fund are publicly available monthly on the Fund’s website (wellsfargoadvantagefunds.com), on a one-month delayed basis. In addition, top ten holdings information (excluding derivative positions) for the Fund is publicly available on the Fund’s website on a monthly, seven-day or more delayed basis. The Fund files its complete schedule of portfolio holdings with the SEC for the first and third quarters of each fiscal year on Form N-Q, which is available by visiting the SEC website at sec.gov. In addition, the Fund’s Form N-Q may be reviewed and copied at the SEC’s Public Reference Room in Washington, DC, and at regional offices in New York City, at 233 Broadway, and in Chicago, at 175 West Jackson Boulevard, Suite 900. Information about the Public Reference Room may be obtained by calling 1-800-SEC-0330.
| | | | |
| 30 | | Wells Fargo Advantage Municipal Bond Fund | | Other information (unaudited) |
BOARD OF TRUSTEES AND OFFICERS
Each of the Trustees and Officers1 listed in the table below acts in identical capacities for each fund in the Wells Fargo Advantage family of funds, which consists of 134 mutual funds comprising the Wells Fargo Funds Trust, Wells Fargo Variable Trust, Wells Fargo Master Trust and four closed-end funds (collectively the “Fund Complex”). This table should be read in conjunction with the Prospectus and the Statement of Additional Information2. The mailing address of each Trustee and Officer is 525 Market Street, 12th Floor, San Francisco, CA 94105. Each Trustee and Officer serves an indefinite term, however, each Trustee serves such term until reaching the mandatory retirement age established by the Trustees.
Independent Trustees
| | | | | | |
Name and
year of birth | | Position held and
length of service* | | Principal occupations during past five years or longer | | Other
directorships during
past five years |
| Peter G. Gordon (Born 1942) | | Trustee, since 1998; Chairman, since 2005 | | Co-Founder, Retired Chairman, President and CEO of Crystal Geyser Water Company. Trustee Emeritus, Colby College. | | Asset Allocation Trust |
| Isaiah Harris, Jr. (Born 1952) | | Trustee, since 2009 | | Retired. Prior thereto, President and CEO of BellSouth Advertising and Publishing Corp. from 2005 to 2007, President and CEO of BellSouth Enterprises from 2004 to 2005 and President of BellSouth Consumer Services from 2000 to 2003. Emeritus member of the Iowa State University Foundation Board of Governors. Emeritus Member of the Advisory Board of Iowa State University School of Business. Advisory Board Member, Palm Harbor Academy. Mr. Harris is a certified public accountant. | | CIGNA Corporation; Asset Allocation Trust |
| Judith M. Johnson (Born 1949) | | Trustee, since 2008; Audit Committee Chairman, since 2008 | | Retired. Prior thereto, Chief Executive Officer and Chief Investment Officer of Minneapolis Employees Retirement Fund from 1996 to 2008. Ms. Johnson is an attorney, certified public accountant and a certified managerial accountant. | | Asset Allocation Trust |
| Leroy Keith, Jr. (Born 1939) | | Trustee, since 2010** | | Chairman, Bloc Global Services (development and construction). Trustee of the Evergreen Funds complex (and its predecessors) from 1983 to 2010. Former Managing Director, Almanac Capital Management (commodities firm), former Partner, Stonington Partners, Inc. (private equity fund), former Director, Obagi Medical Products Co. and former Director, Lincoln Educational Services. | | Trustee, Virtus Fund Complex (consisting of 50 portfolios as of 12/16/2013); Asset Allocation Trust |
| David F. Larcker (Born 1950) | | Trustee, since 2009 | | James Irvin Miller Professor of Accounting at the Graduate School of Business, Stanford University, Morgan Stanley Director of the Center for Leadership Development and Research and Senior Faculty of The Rock Center for Corporate Governance since 2006. From 2005 to 2008, Professor of Accounting at the Graduate School of Business, Stanford University. Prior thereto, Ernst & Young Professor of Accounting at The Wharton School, University of Pennsylvania from 1985 to 2005. | | Asset Allocation Trust |
| Olivia S. Mitchell (Born 1953) | | Trustee, since 2006 | | International Foundation of Employee Benefit Plans Professor, Wharton School of the University of Pennsylvania since 1993. Director of Wharton’s Pension Research Council and Boettner Center on Pensions & Retirement Research, and Research Associate at the National Bureau of Economic Research. Previously, Cornell University Professor from 1978 to 1993. | | Asset Allocation Trust |
| Timothy J. Penny (Born 1951) | | Trustee, since 1996 | | President and CEO of Southern Minnesota Initiative Foundation, a non-profit organization, since 2007 and Senior Fellow at the Humphrey Institute Policy Forum at the University of Minnesota since 1995. Member of the Board of Trustees of NorthStar Education Finance, Inc., a non-profit organization, since 2007. | | Asset Allocation Trust |
| | | | | | |
| Other information (unaudited) | | Wells Fargo Advantage Municipal Bond Fund | | | 31 | |
| | | | | | |
Name and
year of birth | | Position held and
length of service* | | Principal occupations during past five years or longer | | Other
directorships during
past five years |
| Michael S. Scofield (Born 1943) | | Trustee, since 2010 | | Served on the Investment Company Institute’s Board of Governors and Executive Committee from 2008-2011 as well the Governing Council of the Independent Directors Council from 2006-2011 and the Independent Directors Council Executive Committee from 2008-2011. Chairman of the IDC from 2008-2010. Institutional Investor (Fund Directions) Trustee of Year in 2007. Trustee of the Evergreen Funds complex (and its predecessors) from 1984 to 2010. Chairman of the Evergreen Funds from 2000-2010. Former Trustee of the Mentor Funds. Retired Attorney, Law Offices of Michael S. Scofield. | | Asset Allocation Trust |
| Donald C. Willeke (Born 1940) | | Trustee, since 1996 | | Principal of the law firm of Willeke & Daniels. General Counsel of the Minneapolis Employees Retirement Fund from 1984 until its consolidation into the Minnesota Public Employees Retirement Association on June 30, 2010. Director and Vice Chair of The Tree Trust (non-profit corporation). Director of the American Chestnut Foundation (non-profit corporation). | | Asset Allocation Trust |
| * | Length of service dates reflect the Trustee’s commencement of service with the Trust’s predecessor entities, where applicable. |
| ** | Leroy Keith, Jr. retired as a Trustee effective December 31, 2014. |
Officers
| | | | | | |
Name and
year of birth | | Position held and
length of service | | Principal occupations during past five years or longer | | |
| Karla M. Rabusch (Born 1959) | | President, since 2003 | | Executive Vice President of Wells Fargo Bank, N.A. and President of Wells Fargo Funds Management, LLC since 2003. | | |
Nancy Wiser1
(Born 1967) | | Treasurer, since 2012 | | Executive Vice President of Wells Fargo Funds Management, LLC since 2011. Chief Operating Officer and Chief Compliance Officer at LightBox Capital Management LLC, from 2008 to 2011. Owned and operated a consulting business providing services to various hedge funds including acting as Chief Operating Officer and Chief Compliance Officer for a hedge fund from 2007 to 2008. Chief Operating Officer and Chief Compliance Officer of GMN Capital LLC from 2006 to 2007. | | |
| C. David Messman (Born 1960) | | Secretary, since 2000; Chief Legal Officer, since 2003 | | Assistant General Counsel of Wells Fargo Bank, N.A. since 2013 and Vice President and Managing Counsel of Wells Fargo Bank N.A. from 1996 to 2013. Senior Vice President and Secretary of Wells Fargo Funds Management , LLC since 2001. | | |
Debra Ann Early
(Born 1964) | | Chief Compliance Officer, since 2007 | | Senior Vice President of Wells Fargo Funds Management, LLC since 2007 and Chief Compliance Officer from 2007 to 2014. Chief Compliance Officer of Parnassus Investments from 2005 to 2007. Chief Financial Officer of Parnassus Investments from 2004 to 2007 and Senior Audit Manager of PricewaterhouseCoopers LLP from 1998 to 2004. | | |
David Berardi
(Born 1975) | | Assistant Treasurer, since 2009 | | Vice President of Wells Fargo Funds Management, LLC since 2009. Vice President of Evergreen Investment Management Company, LLC from 2008 to 2010. Assistant Vice President of Evergreen Investment Services, Inc. from 2004 to 2008. Manager of Fund Reporting and Control for Evergreen Investment Management Company, LLC from 2004 to 2010. | | |
| Jeremy DePalma1 (Born 1974) | | Assistant Treasurer, since 2009 | | Senior Vice President of Wells Fargo Funds Management, LLC since 2009. Senior Vice President of Evergreen Investment Management Company, LLC from 2008 to 2010. Vice President, Evergreen Investment Services, Inc. from 2004 to 2007. Head of the Fund Reporting and Control Team within Fund Administration from 2005 to 2010. | | |
| 1. | Nancy Wiser acts as Treasurer of 73 funds in the Fund Complex. Jeremy DePalma acts as Treasurer of 61 funds and Assistant Treasurer of 73 funds in the Fund Complex. |
| 2. | The Statement of Additional Information includes additional information about the Trustees and is available, without charge, upon request, by calling 1-800-222-8222 or by visiting the website at wellsfargoadvantagefunds.com. |
| | | | |
| 32 | | Wells Fargo Advantage Municipal Bond Fund | | List of abbreviations |
The following is a list of common abbreviations for terms and entities that may have appeared in this report.
| ACA | — ACA Financial Guaranty Corporation |
| ADR | — American depositary receipt |
| ADS | — American depositary shares |
| AGC | — Assured Guaranty Corporation |
| AGM | — Assured Guaranty Municipal |
| Ambac | — Ambac Financial Group Incorporated |
| AMT | — Alternative minimum tax |
| BAN | — Bond anticipation notes |
| BHAC | — Berkshire Hathaway Assurance Corporation |
| CAB | — Capital appreciation bond |
| CCAB | — Convertible capital appreciation bond |
| CDA | — Community Development Authority |
| CDO | — Collateralized debt obligation |
| DRIVER | — Derivative inverse tax-exempt receipts |
| DW&P | — Department of Water & Power |
| DWR | — Department of Water Resources |
| ECFA | — Educational & Cultural Facilities Authority |
| EDA | — Economic Development Authority |
| EDFA | — Economic Development Finance Authority |
| ETF | — Exchange-traded fund |
| FDIC | — Federal Deposit Insurance Corporation |
| FFCB | — Federal Farm Credit Banks |
| FGIC | — Financial Guaranty Insurance Corporation |
| FHA | — Federal Housing Administration |
| FHLB | — Federal Home Loan Bank |
| FHLMC | — Federal Home Loan Mortgage Corporation |
| FICO | — The Financing Corporation |
| FNMA | — Federal National Mortgage Association |
| GDR | — Global depositary receipt |
| GNMA | — Government National Mortgage Association |
| HCFR | — Healthcare facilities revenue |
| HEFA | — Health & Educational Facilities Authority |
| HEFAR | — Higher education facilities authority revenue |
| HFA | — Housing Finance Authority |
| HFFA | — Health Facilities Financing Authority |
| HUD | — Department of Housing and Urban Development |
| IDA | — Industrial Development Authority |
| IDAG | — Industrial Development Agency |
| KRW | — Republic of Korea won |
| LIBOR | — London Interbank Offered Rate |
| LIFERs | — Long Inverse Floating Exempt Receipts |
| LLC | — Limited liability company |
| LLLP | — Limited liability limited partnership |
| LLP | — Limited liability partnership |
| MBIA | — Municipal Bond Insurance Association |
| MFHR | — Multifamily housing revenue |
| MSTR | — Municipal securities trust receipts |
| MUD | — Municipal Utility District |
| National | — National Public Finance Guarantee Corporation |
| PCFA | — Pollution Control Financing Authority |
| PCL | — Public Company Limited |
| PCR | — Pollution control revenue |
| PFA | — Public Finance Authority |
| PFFA | — Public Facilities Financing Authority |
| PFOTER | — Puttable floating option tax-exempt receipts |
| plc | — Public limited company |
| PUTTER | — Puttable tax-exempt receipts |
| R&D | — Research & development |
| Radian | — Radian Asset Assurance |
| RAN | — Revenue anticipation notes |
| RDA | — Redevelopment Authority |
| RDFA | — Redevelopment Finance Authority |
| REIT | — Real estate investment trust |
| ROC | — Reset option certificates |
| SAVRS | — Select auction variable rate securities |
| SBA | — Small Business Authority |
| SFHR | — Single-family housing revenue |
| SFMR | — Single-family mortgage revenue |
| SPA | — Standby purchase agreement |
| SPDR | — Standard & Poor’s Depositary Receipts |
| SPEARs | — Short Puttable Exempt Adjustable Receipts |
| STRIPS | — Separate trading of registered interest and |
| TAN | — Tax anticipation notes |
| TIPS | — Treasury inflation-protected securities |
| TRAN | — Tax revenue anticipation notes |
| TTFA | — Transportation Trust Fund Authority |
| TVA | — Tennessee Valley Authority |


For more information
More information about Wells Fargo Advantage Funds is available free upon request. To obtain literature, please write, email, visit the Fund’s website, or call:
Wells Fargo Advantage Funds
P.O. Box 8266
Boston, MA 02266-8266
Email: wfaf@wellsfargo.com
Website: wellsfargoadvantagefunds.com
Individual investors: 1-800-222-8222
Retail investment professionals: 1-888-877-9275
Institutional investment professionals: 1-866-765-0778
This report and the financial statements contained herein are submitted for the general information of the shareholders of Wells Fargo Advantage Funds. If this report is used for promotional purposes, distribution of the report must be accompanied or preceded by a current prospectus. Before investing, please consider the investment objectives, risks, charges, and expenses of the investment. For a current prospectus and, if available, a summary prospectus, containing this information, call 1-800-222-8222 or visit the Fund’s website at wellsfargoadvantagefunds.com. Read the prospectus carefully before you invest or send money.
Wells Fargo Funds Management, LLC, a wholly owned subsidiary of Wells Fargo & Company, provides investment advisory and administrative services for Wells Fargo Advantage Funds. Other affiliates of Wells Fargo & Company provide subadvisory and other services for the Funds. The Funds are distributed by Wells Fargo Funds Distributor, LLC, Member FINRA/SIPC, an affiliate of Wells Fargo & Company.
NOT FDIC INSURED ¡ NO BANK GUARANTEE ¡ MAY LOSE VALUE
© 2014 Wells Fargo Funds Management, LLC. All rights reserved.
| | |
 | | 230427 02-15 SA253/SAR253 12-14 |

Wells Fargo Advantage
North Carolina Tax-Free Fund

Semi-Annual Report
December 31, 2014

Reduce clutter. Save trees.
Sign up for electronic delivery of prospectuses and shareholder reports at wellsfargo.com/advantagedelivery
Contents
The views expressed and any forward-looking statements are as of December 31, 2014, unless otherwise noted, and are those of the Fund managers and/or Wells Fargo Funds Management, LLC. Discussions of individual securities, or the markets generally, or any Wells Fargo Advantage Fund are not intended as individual recommendations. Future events or results may vary significantly from those expressed in any forward-looking statements; the views expressed are subject to change at any time in response to changing circumstances in the market. Wells Fargo Funds Management, LLC and the Fund disclaim any obligation to publicly update or revise any views expressed or forward-looking statements.
NOT FDIC INSURED ¡ NO BANK GUARANTEE ¡ MAY LOSE VALUE
| | | | |
| 2 | | Wells Fargo Advantage North Carolina Tax-Free Fund | | Letter to shareholders (unaudited) |

Karla M. Rabusch
President
Wells Fargo Advantage Funds
Municipal bonds rose in the second half of 2014, helped by lower interest rates and strong demand for yield.
Dear Valued Shareholder:
We are pleased to provide you with this semi-annual report for the Wells Fargo Advantage North Carolina Tax-Free Fund for the six-month period that ended December 31, 2014. Municipal bonds rose in the second half of 2014, helped by lower interest rates and strong demand for yield. In fact, the longest-dated and weakest credits had the strongest returns. Municipal bond returns—as measured by the Barclays Municipal Bond Index1, the broadest measure for tracking investment-grade municipal bonds throughout the country—gained 2.88% for the six-month period that ended December 31, 2014.
Longer-maturity and lower-rated municipal bonds outperformed.
At the front end of the yield curve, municipal bond yields were extremely low because of the accommodative monetary policy. Throughout the reporting period, the U.S. Federal Reserve’s (Fed’s) monetary policymaking body kept its key interest rate near zero in order to support the economy and the financial system. Policymakers said they can be patient in normalizing monetary policy and that any increases in the target range for the federal funds rate will depend on incoming economic data. During the reporting period, the Fed reduced (or tapered) the size of its quantitative easing program each month until the program ended in October 2014, although it continues to reinvest principal and interest payments of the mortgage-backed securities and Treasury bonds it holds.
Longer-term yields declined during the second half of the year, with 10-year municipal yields declining from 2.33% as of June 30, 2014 to 2.10% as of December 31, 2014. For more perspective, the yield curve was steep on a historical basis at the beginning of the period and ended the period with the difference between 30-year and 2-year yields at 237 basis points (bps; 100 bps equals 1.00%), which was only slightly wider than its historical average. Because the yield curve was steep, longer-dated securities had higher yields. Given their longer maturities (as municipal yields fell further out the curve) and their more generous yields, longer-term bond returns outpaced shorter-term bonds.
Investors were also enticed to buy lower-rated securities for their higher yields. Over the six-month period that ended December 31, 2014, AAA-rated municipal bonds returned 2.04% while BBB-rated bonds returned 4.29%, according to the Barclays Municipal Bond Index. Credit conditions continued to improve, as evidenced by an 18th consecutive quarter of positive year-over-year gains in state and local municipal revenues. In addition to better fundamental credit conditions, technical factors of limited supply alongside strong investor demand also supported municipal bonds.
Puerto Rico’s struggle, the exit of two cities from bankruptcy, and pension issues topped credit news.
Puerto Rico was the asset class’s largest single credit story. Bonds from the commonwealth returned a meager 0.79% during the six-month period as population declines, a contracting economy, and a burdensome level of debt held back results. Meanwhile, the cities of Stockton, California, and Detroit, Michigan, exited bankruptcy by curbing retiree health care benefits and bondholder recoveries but largely avoiding concessions on pensions. While these recent bankruptcies have so far treated pensions better than bonded debt, no clear precedent has been established due to the difference in general obligation pledges
| 1. | The Barclays Municipal Bond Index is an unmanaged index composed of long-term tax-exempt bonds with a minimum credit rating of Baa. You cannot invest directly in an index. |
| | | | | | |
| Letter to shareholders (unaudited) | | Wells Fargo Advantage North Carolina Tax-Free Fund | | | 3 | |
and court-ordered versus negotiated concessions. Finally, underfunded pensions in Illinois, New Jersey, Pennsylvania, and Kansas gained attention for their negative fiscal effects and the political difficulties of finding a resolution.
Don’t let short-term uncertainty derail long-term investment goals.
Periods of uncertainty can present challenges, but experience has taught us that maintaining long-term investment goals can be an effective way to plan for the future. To help you create a sound strategy based on your personal goals and risk tolerance, Wells Fargo Advantage Funds offers more than 100 mutual funds and other investments spanning a wide range of asset classes and investment styles. Although diversification cannot guarantee an investment profit or prevent losses, we believe it can be an effective way to manage investment risk and potentially smooth out overall portfolio performance. We encourage investors to know their investments and to understand that appropriate levels of risk-taking may unlock opportunities.
Thank you for choosing to invest with Wells Fargo Advantage Funds. We appreciate your confidence in us and remain committed to helping you meet your financial needs. For current information about your fund investments, contact your investment professional, visit our website at wellsfargoadvantagefunds.com, or call us directly at 1-800-222-8222. We are available 24 hours a day, 7 days a week.
Sincerely,

Karla M. Rabusch
President
Wells Fargo Advantage Funds
Periods of uncertainty can present challenges, but experience has taught us that maintaining long-term investment goals can be an effective way to plan for the future.
| | | | |
| 4 | | Wells Fargo Advantage North Carolina Tax-Free Fund | | Performance highlights (unaudited) |
Investment objective
The Fund seeks current income exempt from federal income tax and North Carolina individual income tax.
Adviser
Wells Fargo Funds Management, LLC
Subadviser
Wells Capital Management Incorporated
Portfolio managers
Robert J. Miller
Bruce R. Johns
Average annual total returns1 (%) as of December 31, 2014
| | | | | | | | | | | | | | | | | | | | | | | | | | | | | | | | | | |
| | | | | Including sales charge | | | Excluding sales charge | | | Expense ratios2 (%) | |
| | | Inception date | | 1 year | | | 5 year | | | 10 year | | | 1 year | | | 5 year | | | 10 year | | | Gross | | | Net3 | |
| Class A (ENCMX) | | 1-11-1993 | | | 3.75 | | | | 3.97 | | | | 3.27 | | | | 8.66 | | | | 4.93 | | | | 3.74 | | | | 0.94 | | | | 0.85 | |
| Class C (ENCCX) | | 3-27-2002 | | | 6.74 | | | | 4.15 | | | | 2.98 | | | | 7.74 | | | | 4.15 | | | | 2.98 | | | | 1.69 | | | | 1.60 | |
| Institutional Class (ENCYX) | | 2-28-1994 | | | – | | | | – | | | | – | | | | 8.88 | | | | 5.25 | | | | 4.04 | | | | 0.61 | | | | 0.54 | |
| Barclays Municipal Bond Index4 | | – | | | – | | | | – | | | | – | | | | 9.05 | | | | 5.16 | | | | 4.74 | | | | – | | | | – | |
| Barclays North Carolina Municipal Bond Index5 | | – | | | – | | | | – | | | | – | | | | 7.35 | | | | 4.43 | | | | 4.56 | | | | – | | | | – | |
Figures quoted represent past performance, which is no guarantee of future results, and do not reflect taxes that a shareholder may pay on fund distributions or the redemption of fund shares. Investment return and principal value of an investment will fluctuate so that an investor’s shares, when redeemed, may be worth more or less than their original cost. Performance shown without sales charges would be lower if sales charges were reflected. Current performance may be lower or higher than the performance data quoted, which assumes the reinvestment of dividends and capital gains. Current month-end performance is available on the Fund’s website, wellsfargoadvantagefunds.com.
Index returns do not include transaction costs associated with buying and selling securities, any mutual fund fees or expenses, or any taxes. It is not possible to invest directly in an index.
For Class A shares, the maximum front-end sales charge is 4.50%. For Class C shares, the maximum contingent deferred sales charge is 1.00%. Performance including a contingent deferred sales charge assumes the sales charge for the corresponding time period. Institutional Class shares are sold without a front-end sales charge or contingent deferred sales charge.
Bond values fluctuate in response to the financial condition of individual issuers, general market and economic conditions, and changes in interest rates. Changes in market conditions and government policies may lead to periods of heightened volatility in the bond market and reduced liquidity for certain bonds held by the Fund. In general, when interest rates rise, bond values fall and investors may lose principal value. Interest-rate changes and their impact on the Fund and its share price can be sudden and unpredictable. The use of derivatives may reduce returns and/or increase volatility. Certain investment strategies tend to increase the total risk of an investment (relative to the broader market). The Fund is exposed to North Carolina municipal securities risk, high-yield securities risk, and non-diversification risk. Consult the Fund’s prospectus for additional information on these and other risks. A portion of the Fund’s income may be subject to federal, state, and/or local income taxes or the Alternative Minimum Tax (AMT). Any capital gains distributions may be taxable.
Please see footnotes on page 5.
| | | | | | |
| Performance highlights (unaudited) | | Wells Fargo Advantage North Carolina Tax-Free Fund | | | 5 | |
|
| Credit quality distribution6 as of December 31, 2014 |
|
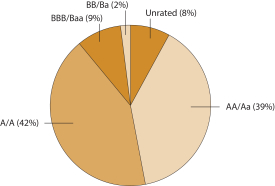 |
|
| Effective maturity distribution7 as of December 31, 2014 |
|
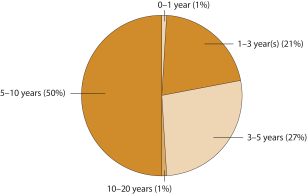 |
| 1. | Historical performance shown for all classes of the Fund prior to July 12, 2010, is based on the performance of the Fund’s predecessor, Evergreen North Carolina Municipal Bond Fund. |
| 2. | Reflects the expense ratios as stated in the most recent prospectuses. The expense ratios shown are subject to change and may differ from the annualized expense ratios shown in the financial highlights of this report. |
| 3. | The Adviser has committed through October 31, 2015, to waive fees and/or reimburse expenses to the extent necessary to cap the Fund’s Total Annual Fund Operating Expenses After Fee Waiver, excluding certain expenses, at the amounts shown. After this time, the cap may be increased or the commitment to maintain the cap may be terminated only with the approval of the Board of Trustees. Brokerage commissions, stamp duty fees, interest, taxes, acquired fund fees and expenses, and extraordinary expenses are excluded from the cap. Without this cap, the Fund’s returns would have been lower. |
| 4. | The Barclays Municipal Bond Index is an unmanaged index composed of long-term tax-exempt bonds with a minimum credit rating of Baa. You cannot invest directly in an index. |
| 5. | The Barclays North Carolina Municipal Bond Index is the North Carolina component of the Barclays Municipal Bond Index. You cannot invest directly in an index. |
| 6. | The credit quality distribution of portfolio holdings reflected in the chart is based on ratings from Standard & Poor’s, Moody’s Investors Service, and/or Fitch Ratings Ltd. Credit quality ratings apply to the underlying holdings of the Fund and not to the Fund itself. The percentages of the Fund’s portfolio with the ratings depicted in the chart are calculated based on the total market value of fixed income securities held by the Fund. If a security was rated by all three rating agencies, the middle rating was utilized. If rated by two of three rating agencies, the lower rating was utilized, and if rated by one of the rating agencies, that rating was utilized. Standard & Poor’s rates the creditworthiness of bonds, ranging from AAA (highest) to D (lowest). Ratings from A to CCC may be modified by the addition of a plus (+) or minus (-) sign to show relative standing within the rating categories. Standard & Poor’s rates the creditworthiness of short-term notes from SP-1 (highest) to SP-3 (lowest). Moody’s rates the creditworthiness of bonds, ranging from Aaa (highest) to C (lowest). Ratings Aa to B may be modified by the addition of a number 1 (highest) to 3 (lowest) to show relative standing within the ratings categories. Moody’s rates the creditworthiness of short-term U.S. tax-exempt municipal securities from MIG 1/VMIG 1 (highest) to SG (lowest). Fitch rates the creditworthiness of bonds, ranging from AAA (highest) to D (lowest). Credit quality and credit quality ratings are subject to change and may have changed since the date specified. |
| 7. | Effective maturity distribution is calculated based on the total long-term investments of the Fund. It is subject to change and may have changed since the date specified. |
| | | | |
| 6 | | Wells Fargo Advantage North Carolina Tax-Free Fund | | Fund expenses (unaudited) |
As a shareholder of the Fund, you incur two types of costs: (1) transaction costs, including sales charges (loads) on purchase payments and contingent deferred sales charges (if any) on redemptions and (2) ongoing costs, including management fees, distribution (12b-1) and/or shareholder service fees, and other Fund expenses. This example is intended to help you understand your ongoing costs (in dollars) of investing in the Fund and to compare these costs with the ongoing costs of investing in other mutual funds.
The example is based on an investment of $1,000 invested at the beginning of the six-month period and held for the entire period from July 1, 2014 to December 31, 2014.
Actual expenses
The “Actual” line of the table below provides information about actual account values and actual expenses. You may use the information in this line, together with the amount you invested, to estimate the expenses that you paid over the period. Simply divide your account value by $1,000 (for example, an $8,600 account value divided by $1,000 = 8.6), then multiply the result by the number in the “Actual” line under the heading entitled “Expenses paid during period” for your applicable class of shares to estimate the expenses you paid on your account during this period.
Hypothetical example for comparison purposes
The “Hypothetical” line of the table below provides information about hypothetical account values and hypothetical expenses based on the Fund’s actual expense ratio and an assumed rate of return of 5% per year before expenses, which is not the Fund’s actual return. The hypothetical account values and expenses may not be used to estimate the actual ending account balance or expenses you paid for the period. You may use this information to compare the ongoing costs of investing in the Fund and other funds. To do so, compare this 5% hypothetical example with the 5% hypothetical examples that appear in the shareholder reports of the other funds.
Please note that the expenses shown in the table are meant to highlight your ongoing costs only and do not reflect any transactional costs, such as sales charges (loads) and contingent deferred sales charges. Therefore, the “Hypothetical” line of the table is useful in comparing ongoing costs only and will not help you determine the relative total costs of owning different funds. In addition, if these transactional costs were included, your costs would have been higher.
| | | | | | | | | | | | | | | | |
| | | Beginning
account value
7-1-2014 | | | Ending
account value
12-31-2014 | | | Expenses
paid during
the period¹ | | | Net annualized
expense ratio | |
Class A | | | | | | | | | | | | | | | | |
Actual | | $ | 1,000.00 | | | $ | 1,028.60 | | | $ | 4.35 | | | | 0.85 | % |
Hypothetical (5% return before expenses) | | $ | 1,000.00 | | | $ | 1,020.92 | | | $ | 4.33 | | | | 0.85 | % |
Class C | | | | | | | | | | | | | | | | |
Actual | | $ | 1,000.00 | | | $ | 1,024.73 | | | $ | 8.17 | | | | 1.60 | % |
Hypothetical (5% return before expenses) | | $ | 1,000.00 | | | $ | 1,017.14 | | | $ | 8.13 | | | | 1.60 | % |
Institutional Class | | | | | | | | | | | | | | | | |
Actual | | $ | 1,000.00 | | | $ | 1,030.20 | | | $ | 2.76 | | | | 0.54 | % |
Hypothetical (5% return before expenses) | | $ | 1,000.00 | | | $ | 1,022.48 | | | $ | 2.75 | | | | 0.54 | % |
| 1. | Expenses paid is equal to the annualized expense ratio of each class multiplied by the average account value over the period, multiplied by the number of days in the most recent fiscal half-year divided by the number of days in the fiscal year (to reflect the one-half-year period). |
| | | | | | |
| Portfolio of investments—December 31, 2014 (unaudited) | | Wells Fargo Advantage North Carolina Tax-Free Fund | | | 7 | |
| | | | | | | | | | | | | | | | |
| Security name | | Interest rate | | | Maturity date | | | Principal | | | Value | |
| | | | |
Municipal Obligations: 98.81% | | | | | | | | | | | | | | | | |
| | | | |
| California: 1.07% | | | | | | | | | | | | | | | | |
University of California Series G (Education Revenue) | | | 5.00 | % | | | 5-15-2037 | | | $ | 1,000,000 | | | $ | 1,129,250 | |
| | | | | | | | | | | | | | | | |
| | | | |
| Guam: 4.45% | | | | | | | | | | | | | | | | |
Guam Government Business Privilege Tax Series A (Tax Revenue) | | | 5.00 | | | | 1-1-2031 | | | | 1,000,000 | | | | 1,119,400 | |
Guam Government Hotel Occupancy Series A (Tax Revenue) | | | 6.00 | | | | 11-1-2026 | | | | 2,000,000 | | | | 2,395,040 | |
Guam Government Waterworks Authority (Water & Sewer Revenue) | | | 5.25 | | | | 7-1-2023 | | | | 1,000,000 | | | | 1,165,280 | |
| | | | |
| | | | | | | | | | | | | | | 4,679,720 | |
| | | | | | | | | | | | | | | | |
| | | | |
| Indiana: 1.12% | | | | | | | | | | | | | | | | |
Indiana Finance Authority Wastewater CWA Authority Project Series A (Water & Sewer Revenue) | | | 5.00 | | | | 10-1-2031 | | | | 1,000,000 | | | | 1,173,480 | |
| | | | | | | | | | | | | | | | |
| | | | |
| New York: 1.61% | | | | | | | | | | | | | | | | |
New York Dormitory Authority Personal Income Tax Series B (Tax Revenue) | | | 5.00 | | | | 3-15-2042 | | | | 1,500,000 | | | | 1,695,105 | |
| | | | | | | | | | | | | | | | |
| | | | |
| North Carolina: 81.31% | | | | | | | | | | | | | | | | |
Cape Fear NC Public Utility Authority (Water & Sewer Revenue) | | | 5.00 | | | | 8-1-2035 | | | | 3,000,000 | | | | 3,320,280 | |
Charlotte NC Airport Series A (Airport Revenue) | | | 5.50 | | | | 7-1-2034 | | | | 2,500,000 | | | | 2,879,725 | |
Charlotte NC AMT Series B (Airport Revenue) | | | 5.00 | | | | 7-1-2020 | | | | 1,480,000 | | | | 1,720,234 | |
Charlotte NC AMT Series B (Airport Revenue) | | | 5.50 | | | | 7-1-2024 | | | | 810,000 | | | | 927,653 | |
Charlotte NC Certificate of Participation Series A (Miscellaneous Revenue) | | | 5.00 | | | | 12-1-2026 | | | | 1,160,000 | | | | 1,348,987 | |
Charlotte NC Certificate of Participation Series A (Miscellaneous Revenue) | | | 5.00 | | | | 6-1-2030 | | | | 1,000,000 | | | | 1,177,870 | |
Charlotte NC Certificate of Participation Series E (Miscellaneous Revenue) | | | 5.00 | | | | 6-1-2023 | | | | 3,650,000 | | | | 4,142,568 | |
Charlotte NC Douglas Airport Series A (Airport Revenue) | | | 5.00 | | | | 7-1-2025 | | | | 1,645,000 | | | | 1,895,122 | |
Charlotte-Mecklenburg NC Hospital Authority (Health Revenue) | | | 5.00 | | | | 1-15-2027 | | | | 1,885,000 | | | | 2,061,153 | |
Cumberland County NC Limited Obligation Series B (Miscellaneous Revenue) | | | 5.00 | | | | 11-1-2025 | | | | 1,000,000 | | | | 1,192,750 | |
Cumberland County NC Limited Obligation Series B (Miscellaneous Revenue) | | | 5.00 | | | | 11-1-2026 | | | | 1,000,000 | | | | 1,188,640 | |
Fayetteville NC Public Works Commission Series B (Utilities Revenue) | | | 5.00 | | | | 3-1-2023 | | | | 600,000 | | | | 684,120 | |
Johnston NC Memorial Hospital Authority (Health Revenue, AGM/FHA Insured) | | | 5.25 | | | | 10-1-2036 | | | | 1,960,000 | | | | 2,150,355 | |
Mecklenburg County NC Public Facilities Corporation (Miscellaneous Revenue) | | | 5.00 | | | | 3-1-2022 | | | | 1,035,000 | | | | 1,191,171 | |
New Hanover County NC New Hanover Regional Medical Center (Health Revenue) | | | 5.00 | | | | 10-1-2026 | | | | 1,000,000 | | | | 1,146,030 | |
New Hanover County NC New Hanover Regional Medical Center (Health Revenue) | | | 5.00 | | | | 10-1-2028 | | | | 3,000,000 | | | | 3,377,700 | |
New Hanover County NC New Hanover Regional Medical Center (Health Revenue, AGM Insured) | | | 5.13 | | | | 10-1-2031 | | | | 1,800,000 | | | | 1,990,764 | |
North Carolina Capital Improvement Limited Series A (Miscellaneous Revenue) | | | 5.00 | | | | 5-1-2026 | | | | 3,000,000 | | | | 3,394,200 | |
North Carolina Grant Anticipation Department of State Treasury (Miscellaneous Revenue) | | | 5.00 | | | | 3-1-2021 | | | | 1,700,000 | | | | 1,935,467 | |
North Carolina HFA Series 25-A (Housing Revenue) ± | | | 4.65 | | | | 7-1-2021 | | | | 2,195,000 | | | | 2,307,318 | |
North Carolina HFA Series B (Housing Revenue) | | | 4.25 | | | | 1-1-2028 | | | | 4,070,000 | | | | 4,238,620 | |
North Carolina Limited Obligation Series B (Miscellaneous Revenue) | | | 5.00 | | | | 6-1-2022 | | | | 1,000,000 | | | | 1,211,200 | |
North Carolina Medical Care Commission Baptist Hospital Project (Health Revenue) | | | 5.25 | | | | 6-1-2029 | | | | 2,000,000 | | | | 2,271,540 | |
North Carolina Medical Care Commission Cleveland County Health Care System (Health Revenue) | | | 5.00 | | | | 1-1-2018 | | | | 500,000 | | | | 561,495 | |
North Carolina Medical Care Commission Health Care Facilities University Health System Series D (Health Revenue) | | | 6.25 | | | | 12-1-2033 | | | | 1,500,000 | | | | 1,722,690 | |
North Carolina Medical Care Commission Hugh Chatam Memorial Hospital Project (Health Revenue, Radian Insured) | | | 5.50 | | | | 10-1-2020 | | | | 940,000 | | | | 941,288 | |
North Carolina Medical Care Commission Presbyterian Homes Project (Health Revenue) | | | 5.40 | | | | 10-1-2027 | | | | 1,000,000 | | | | 1,040,570 | |
The accompanying notes are an integral part of these financial statements.
| | | | |
| 8 | | Wells Fargo Advantage North Carolina Tax-Free Fund | | Portfolio of investments—December 31, 2014 (unaudited) |
| | | | | | | | | | | | | | | | |
| Security name | | Interest rate | | | Maturity date | | | Principal | | | Value | |
| | | | |
| North Carolina (continued) | | | | | | | | | | | | | | | | |
North Carolina Medical Care Commission Presbyterian Homes Project (Health Revenue) | | | 5.50 | % | | | 10-1-2031 | | | $ | 2,000,000 | | | $ | 2,074,120 | |
North Carolina Medical Care Commission Presbyterian Homes Project (Health Revenue) | | | 5.60 | | | | 10-1-2036 | | | | 1,500,000 | | | | 1,554,225 | |
North Carolina Medical Care Commission Southeastern Regional Medical Center (Health Revenue) | | | 5.00 | | | | 6-1-2026 | | | | 385,000 | | | | 433,152 | |
North Carolina Medical Care Commission Southeastern Regional Medical Center (Health Revenue) | | | 5.00 | | | | 6-1-2032 | | | | 500,000 | | | | 548,945 | |
North Carolina Medical Care Commission Stanley Memorial Hospital Project (Health Revenue) | | | 5.00 | | | | 7-1-2033 | | | | 1,000,000 | | | | 1,047,300 | |
North Carolina Medical Care Commission Wake Forest Baptist Medical Center (Health Revenue) | | | 5.00 | | | | 12-1-2022 | | | | 1,950,000 | | | | 2,296,847 | |
North Carolina Municipal Power Agency #1 Catawba Nuclear Power Project Series A (Utilities Revenue) | | | 5.00 | | | | 1-1-2021 | | | | 2,720,000 | | | | 3,128,789 | |
North Carolina Municipal Power Agency #1 Catawba Nuclear Power Project Series A (Utilities Revenue) | | | 5.00 | | | | 1-1-2030 | | | | 1,550,000 | | | | 1,734,869 | |
North Carolina Port Authority Series B (Airport Revenue) | | | 5.00 | | | | 2-1-2025 | | | | 3,540,000 | | | | 3,988,412 | |
North Carolina Raleigh-Durham Airport Authority Series B-1 (Airport Revenue) | | | 5.00 | | | | 11-1-2028 | | | | 1,500,000 | | | | 1,720,560 | |
Orange County NC Public Facilities Company Limited Obligation (Miscellaneous Revenue) | | | 5.00 | | | | 10-1-2026 | | | | 1,000,000 | | | | 1,161,100 | |
Raleigh NC Enterprise System Unrefunded Series A (Water & Sewer Revenue) | | | 5.00 | | | | 3-1-2036 | | | | 2,465,000 | | | | 2,586,253 | |
Raleigh NC Enterprise System Prerefunded Series A (Water & Sewer Revenue) | | | 5.00 | | | | 3-1-2036 | | | | 1,835,000 | | | | 1,935,815 | |
Raleigh NC Limited Obligation Series A (Miscellaneous Revenue) | | | 5.00 | | | | 10-1-2033 | | | | 1,000,000 | | | | 1,186,540 | |
University of North Carolina at Greensboro (Education Revenue) | | | 5.00 | | | | 4-1-2033 | | | | 2,000,000 | | | | 2,333,240 | |
University of North Carolina at Greensboro (Education Revenue) | | | 5.00 | | | | 4-1-2039 | | | | 1,620,000 | | | | 1,865,819 | |
University of North Carolina Wilmington Student Housing Project Certificate of Participation (Miscellaneous Revenue, National Insured) | | | 5.00 | | | | 6-1-2022 | | | | 1,000,000 | | | | 1,056,860 | |
Wilmington NC Certificate of Participation Series A (Miscellaneous Revenue) | | | 5.00 | | | | 6-1-2029 | | | | 2,580,000 | | | | 2,850,952 | |
| | | | |
| | | | | | | | | | | | | | | 85,523,308 | |
| | | | | | | | | | | | | | | | |
| | | | |
| Tennessee: 3.29% | | | | | | | | | | | | | | | | |
Tennessee Energy Acquisition Corporation Series A (Utilities Revenue) | | | 5.25 | | | | 9-1-2026 | | | | 1,020,000 | | | | 1,209,085 | |
Tennessee Energy Acquisition Corporation Series C (Utilities Revenue) | | | 5.00 | | �� | | 2-1-2021 | | | | 2,000,000 | | | | 2,252,960 | |
| | | | |
| | | | | | | | | | | | | | | 3,462,045 | |
| | | | | | | | | | | | | | | | |
| | | | |
| Virgin Islands: 3.77% | | | | | | | | | | | | | | | | |
Virgin Islands PFA (Miscellaneous Revenue) | | | 6.75 | | | | 10-1-2019 | | | | 3,500,000 | | | | 3,967,530 | |
| | | | | | | | | | | | | | | | |
| | | | |
| Washington: 1.13% | | | | | | | | | | | | | | | | |
Tumwater Office Properties Washington Lease Revenue Washington Office Buildings (Miscellaneous Revenue) | | | 5.00 | | | | 7-1-2026 | | | | 1,000,000 | | | | 1,191,150 | |
| | | | | | | | | | | | | | | | |
| | | | |
| Wisconsin: 1.06% | | | | | | | | | | | | | | | | |
Wisconsin PFA Carolina International School Series A (Education Revenue) 144A | | | 6.75 | | | | 8-1-2033 | | | | 1,000,000 | | | | 1,117,540 | |
| | | | | | | | | | | | | | | | |
| | | | |
Total Municipal Obligations (Cost $95,223,062) | | | | | | | | | | | | | | | 103,939,128 | |
| | | | | | | | | | | | | | | | |
The accompanying notes are an integral part of these financial statements.
| | | | | | |
| Portfolio of investments—December 31, 2014 (unaudited) | | Wells Fargo Advantage North Carolina Tax-Free Fund | | | 9 | |
| | | | | | | | | | | | | | | | |
| Security name | | Yield | | | | | | Shares | | | Value | |
| Short-Term Investments: 0.84% | | | | | | | | | | | | | | | | |
| | | | |
| Investment Companies: 0.84% | | | | | | | | | | | | | | | | |
Wells Fargo Advantage National Tax-Free Money Market Fund, Institutional Class (l)(u) | | | 0.01 | % | | | | | | | 882,460 | | | $ | 882,460 | |
| | | | | | | | | | | | | | | | |
| | | | |
Total Short-Term Investments (Cost $882,460) | | | | | | | | | | | | | | | 882,460 | |
| | | | | | | | | | | | | | | | |
| | | | | | | | |
| Total investments in securities (Cost $96,105,522) * | | | 99.65 | % | | | 104,821,588 | |
Other assets and liabilities, net | | | 0.35 | | | | 368,615 | |
| | | | | | | | |
| Total net assets | | | 100.00 | % | | $ | 105,190,203 | |
| | | | | | | | |
| ± | Variable rate investment. The rate shown is the rate in effect at period end. |
| 144A | The security may be resold in transactions exempt from registration, normally to qualified institutional buyers, pursuant to Rule 144A under the Securities Act of 1933. |
| (l) | The security represents an affiliate of the Fund as defined in the Investment Company Act of 1940. |
| (u) | The rate represents the 7-day annualized yield at period end. |
| * | Cost for federal income tax purposes is $96,105,522 and unrealized gains (losses) consists of: |
| | | | |
Gross unrealized gains | | $ | 8,744,251 | |
Gross unrealized losses | | | (28,185 | ) |
| | | | |
Net unrealized gains | | $ | 8,716,066 | |
The accompanying notes are an integral part of these financial statements.
| | | | |
| 10 | | Wells Fargo Advantage North Carolina Tax-Free Fund | | Statement of assets and liabilities—December 31, 2014 (unaudited) |
| | | | |
| | | | |
| |
Assets | | | | |
Investments | | | | |
In unaffiliated securities, at value (cost $95,223,062) | | $ | 103,939,128 | |
In affiliated securities, at value (cost $882,460) | | | 882,460 | |
| | | | |
Total investments, at value (cost $96,105,522) | | | 104,821,588 | |
Receivable for investments sold | | | 145,000 | |
Receivable for Fund shares sold | | | 1,064 | |
Receivable for interest | | | 1,432,794 | |
Prepaid expenses and other assets | | | 26,294 | |
| | | | |
Total assets | | | 106,426,740 | |
| | | | |
| |
Liabilities | | | | |
Dividends payable | | | 176,058 | |
Payable for Fund shares redeemed | | | 962,273 | |
Advisory fee payable | | | 25,564 | |
Distribution fee payable | | | 2,985 | |
Administration fees payable | | | 14,907 | |
Accrued expenses and other liabilities | | | 54,750 | |
| | | | |
Total liabilities | | | 1,236,537 | |
| | | | |
Total net assets | | $ | 105,190,203 | |
| | | | |
| |
NET ASSETS CONSIST OF | | | | |
Paid-in capital | | $ | 107,253,402 | |
Overdistributed net investment income | | | (59,574 | ) |
Accumulated net realized losses on investments | | | (10,719,691 | ) |
Net unrealized gains on investments | | | 8,716,066 | |
| | | | |
Total net assets | | $ | 105,190,203 | |
| | | | |
| |
COMPUTATION OF NET ASSET VALUE AND OFFERING PRICE PER SHARE | | | | |
Net assets – Class A | | $ | 34,822,737 | |
Shares outstanding – Class A1 | | | 3,325,057 | |
Net asset value per share – Class A | | | $10.47 | |
Maximum offering price per share – Class A2 | | | $10.96 | |
Net assets – Class C | | $ | 4,548,494 | |
Shares outstanding – Class C1 | | | 434,261 | |
Net asset value per share – Class C | | | $10.47 | |
Net assets – Institutional Class | | $ | 65,818,972 | |
Shares outstanding – Institutional Class1 | | | 6,284,690 | |
Net asset value per share – Institutional Class | | | $10.47 | |
| 1. | The Fund has an unlimited number of authorized shares. |
| 2. | Maximum offering price is computed as 100/95.50 of net asset value. On investments of $50,000 or more, the offering price is reduced. |
The accompanying notes are an integral part of these financial statements.
| | | | | | |
| Statement of operations—six months ended December 31, 2014 (unaudited) | | Wells Fargo Advantage North Carolina Tax-Free Fund | | | 11 | |
| | | | |
| | | | |
| |
Investment income | | | | |
Interest | | $ | 2,116,649 | |
Income from affiliated securities | | | 263 | |
| | | | |
Total investment income | | | 2,116,912 | |
| | | | |
| |
Expenses | | | | |
Advisory fee | | | 196,083 | |
Administration fees | | | | |
Fund level | | | 28,012 | |
Class A | | | 29,447 | |
Class C | | | 3,646 | |
Institutional Class | | | 28,272 | |
Shareholder servicing fees | | | | |
Class A | | | 46,011 | |
Class C | | | 5,697 | |
Distribution fee | | | | |
Class C | | | 17,091 | |
Custody and accounting fees | | | 5,499 | |
Professional fees | | | 22,925 | |
Registration fees | | | 21,490 | |
Shareholder report expenses | | | 7,282 | |
Trustees’ fees and expenses | | | 6,205 | |
Other fees and expenses | | | 3,741 | |
| | | | |
Total expenses | | | 421,401 | |
Less: Fee waivers and/or expense reimbursements | | | (37,664 | ) |
| | | | |
Net expenses | | | 383,737 | |
| | | | |
Net investment income | | | 1,733,175 | |
| | | | |
| |
REALIZED AND UNREALIZED GAINS (LOSSES) ON INVESTMENTS | | | | |
Net realized gains on investments | | | 415,377 | |
Net change in unrealized gains (losses) on investments | | | 1,117,533 | |
| | | | |
Net realized and unrealized gains (losses) on investments | | | 1,532,910 | |
| | | | |
Net increase in net assets resulting from operations | | $ | 3,266,085 | |
| | | | |
The accompanying notes are an integral part of these financial statements.
| | | | |
| 12 | | Wells Fargo Advantage North Carolina Tax-Free Fund | | Statement of changes in net assets |
| | | | | | | | | | | | | | | | |
| | | Six months ended
December 31, 2014
(unaudited) | | | Year ended
June 30, 2014 | |
| | | | |
Operations | | | | | | | | | | | | | | | | |
Net investment income | | | | | | $ | 1,733,175 | | | | | | | $ | 3,808,125 | |
Net realized gains (losses) on investments | | | | | | | 415,377 | | | | | | | | (419,547 | ) |
Net change in unrealized gains (losses) on investments | | | | | | | 1,117,533 | | | | | | | | 2,718,741 | |
| | | | |
Net increase in net assets resulting from operations | | | | | | | 3,266,085 | | | | | | | | 6,107,319 | |
| | | | |
| | | | |
Distributions to shareholders from | | | | | | | | | | | | | | | | |
Net investment income | | | | | | | | | | | | | | | | |
Class A | | | | | | | (539,288 | ) | | | | | | | (1,289,186 | ) |
Class C | | | | | | | (49,699 | ) | | | | | | | (115,169 | ) |
Institutional Class | | | | | | | (1,144,188 | ) | | | | | | | (2,403,895 | ) |
| | | | |
Total distributions to shareholders | | | | | | | (1,733,175 | ) | | | | | | | (3,808,250 | ) |
| | | | |
| | | | |
Capital share transactions | | | Shares | | | | | | | | Shares | | | | | |
Proceeds from shares sold | | | | | | | | | | | | | | | | |
Class A | | | 14,317 | | | | 148,942 | | | | 199,641 | | | | 2,003,221 | |
Class C | | | 25,302 | | | | 263,944 | | | | 60,193 | | | | 606,536 | |
Institutional Class | | | 562,294 | | | | 5,816,793 | | | | 1,504,993 | | | | 15,493,145 | |
| | | | |
| | | | | | | 6,229,679 | | | | | | | | 18,102,902 | |
| | | | |
Reinvestment of distributions | | | | | | | | | | | | | | | | |
Class A | | | 46,320 | | | | 483,045 | | | | 115,194 | | | | 1,161,678 | |
Class C | | | 4,203 | | | | 43,829 | | | | 10,088 | | | | 101,781 | |
Institutional Class | | | 17,858 | | | | 186,255 | | | | 38,672 | | | | 390,110 | |
| | | | |
| | | | | | | 713,129 | | | | | | | | 1,653,569 | |
| | | | |
Payment for shares redeemed | | | | | | | | | | | | | | | | |
Class A | | | (323,990 | ) | | | (3,391,696 | ) | | | (881,202 | ) | | | (8,853,763 | ) |
Class C | | | (37,260 | ) | | | (387,403 | ) | | | (140,535 | ) | | | (1,401,094 | ) |
Institutional Class | | | (1,312,058 | ) | | | (13,619,382 | ) | | | (2,257,694 | ) | | | (22,656,891 | ) |
| | | | |
| | | | | | | (17,398,481 | ) | | | | | | | (32,911,748 | ) |
| | | | |
Net decrease in net assets resulting from capital share transactions | | | | | | | (10,455,673 | ) | | | | | | | (13,155,277 | ) |
| | | | |
Total decrease in net assets | | | | | | | (8,922,763 | ) | | | | | | | (10,856,208 | ) |
| | | | |
| | | | |
Net assets | | | | | | | | | | | | | | | | |
Beginning of period | | | | | | | 114,112,966 | | | | | | | | 124,969,174 | |
| | | | |
End of period | | | | | | $ | 105,190,203 | | | | | | | $ | 114,112,966 | |
| | | | |
Overdistributed net investment income | | | | | | $ | (59,574 | ) | | | | | | $ | (59,574 | ) |
| | | | |
The accompanying notes are an integral part of these financial statements.
| | | | | | |
| Financial highlights | | Wells Fargo Advantage North Carolina Tax-Free Fund | | | 13 | |
(For a share outstanding throughout each period)
| | | | | | | | | | | | | | | | | | | | | | | | | | | | |
| | | Six months ended
December 31, 2014 (unaudited) | | | Year ended June 30 | | | Year ended August 31 | |
| CLASS A | | | 2014 | | | 2013 | | | 2012 | | | 20111 | | | 20102 | | | 20092 | |
Net asset value, beginning of period | | | $10.33 | | | | $10.08 | | | | $10.34 | | | | $9.71 | | | | $10.12 | | | | $9.64 | | | | $9.80 | |
Net investment income | | | 0.15 | | | | 0.33 | | | | 0.32 | | | | 0.34 | | | | 0.30 | | | | 0.39 | 3 | | | 0.39 | |
Net realized and unrealized gains (losses) on investments | | | 0.14 | | | | 0.25 | | | | (0.26 | ) | | | 0.63 | | | | (0.41 | ) | | | 0.49 | | | | (0.15 | ) |
| | | | | | | | | | | | | | | | | | | | | | | | | | | | |
Total from investment operations | | | 0.29 | | | | 0.58 | | | | 0.06 | | | | 0.97 | | | | (0.11 | ) | | | 0.88 | | | | 0.24 | |
Distributions to shareholders from | | | | | | | | | | | | | | | | | | | | | | | | | | | | |
Net investment income | | | (0.15 | ) | | | (0.33 | ) | | | (0.32 | ) | | | (0.34 | ) | | | (0.30 | ) | | | (0.40 | ) | | | (0.40 | ) |
Net asset value, end of period | | | $10.47 | | | | $10.33 | | | | $10.08 | | | | $10.34 | | | | $9.71 | | | | $10.12 | | | | $9.64 | |
Total return4 | | | 2.86 | % | | | 5.92 | % | | | 0.51 | % | | | 10.09 | % | | | (1.05 | )% | | | 9.38 | % | | | 2.63 | % |
Ratios to average net assets (annualized) | | | | | | | | | | | | | | | | | | | | | | | | | | | | |
Gross expenses | | | 0.93 | % | | | 0.94 | % | | | 0.91 | % | | | 0.90 | % | | | 0.91 | % | | | 0.90 | % | | | 0.87 | % |
Net expenses | | | 0.85 | % | | | 0.85 | % | | | 0.85 | % | | | 0.85 | % | | | 0.85 | % | | | 0.88 | % | | | 0.87 | % |
Net investment income | | | 2.93 | % | | | 3.32 | % | | | 3.06 | % | | | 3.34 | % | | | 3.72 | % | | | 4.03 | % | | | 4.22 | % |
Supplemental data | | | | | | | | | | | | | | | | | | | | | | | | | | | | |
Portfolio turnover rate | | | 7 | % | | | 15 | % | | | 15 | % | | | 48 | % | | | 44 | % | | | 63 | % | | | 48 | % |
Net assets, end of period (000s omitted) | | | $34,823 | | | | $37,067 | | | | $41,879 | | | | $44,082 | | | | $47,954 | | | | $56,508 | | | | $51,028 | |
| 1. | For the ten months ended June 30, 2011. The Fund changed its fiscal year end from August 31 to June 30, effective June 30, 2011. |
| 2. | After the close of business on July 9, 2010, the Fund acquired the net assets of Evergreen North Carolina Municipal Bond Fund which became the accounting and performance survivor in the transaction. The information for the periods prior to July 12, 2010 is that of Class A of Evergreen North Carolina Municipal Bond Fund. |
| 3. | Calculated based upon average shares outstanding |
| 4. | Total return calculations do not include any sales charges. Returns for periods of less than one year are not annualized. |
The accompanying notes are an integral part of these financial statements.
| | | | |
| 14 | | Wells Fargo Advantage North Carolina Tax-Free Fund | | Financial highlights |
(For a share outstanding throughout each period)
| | | | | | | | | | | | | | | | | | | | | | | | | | | | |
| | | Six months ended
December 31, 2014
(unaudited) | | | Year ended June 30 | | | Year ended August 31 | |
| CLASS C | | | 2014 | | | 2013 | | | 2012 | | | 20111 | | | 20102 | | | 20092 | |
Net asset value, beginning of period | | | $10.33 | | | | $10.08 | | | | $10.34 | | | | $9.71 | | | | $10.12 | | | | $9.64 | | | | $9.80 | |
Net investment income | | | 0.12 | 3 | | | 0.26 | | | | 0.24 | | | | 0.26 | | | | 0.24 | | | | 0.32 | 3 | | | 0.32 | |
Net realized and unrealized gains (losses) on investments | | | 0.14 | | | | 0.25 | | | | (0.26 | ) | | | 0.63 | | | | (0.41 | ) | | | 0.49 | | | | (0.15 | ) |
| | | | | | | | | | | | | | | | | | | | | | | | | | | | |
Total from investment operations | | | 0.26 | | | | 0.51 | | | | (0.02 | ) | | | 0.89 | | | | (0.17 | ) | | | 0.81 | | | | 0.17 | |
Distributions to shareholders from | | | | | | | | | | | | | | | | | | | | | | | | | | | | |
Net investment income | | | (0.12 | ) | | | (0.26 | ) | | | (0.24 | ) | | | (0.26 | ) | | | (0.24 | ) | | | (0.33 | ) | | | (0.33 | ) |
Net asset value, end of period | | | $10.47 | | | | $10.33 | | | | $10.08 | | | | $10.34 | | | | $9.71 | | | | $10.12 | | | | $9.64 | |
Total return4 | | | 2.47 | % | | | 5.13 | % | | | (0.24 | )% | | | 9.27 | % | | | (1.66 | )% | | | 8.57 | % | | | 1.87 | % |
Ratios to average net assets (annualized) | | | | | | | | | | | | | | | | | | | | | | | | | | | | |
Gross expenses | | | 1.68 | % | | | 1.69 | % | | | 1.66 | % | | | 1.65 | % | | | 1.66 | % | | | 1.65 | % | | | 1.62 | % |
Net expenses | | | 1.60 | % | | | 1.60 | % | | | 1.60 | % | | | 1.60 | % | | | 1.60 | % | | | 1.63 | % | | | 1.62 | % |
Net investment income | | | 2.18 | % | | | 2.56 | % | | | 2.31 | % | | | 2.59 | % | | | 2.96 | % | | | 3.26 | % | | | 3.47 | % |
Supplemental data | | | | | | | | | | | | | | | | | | | | | | | | | | | | |
Portfolio turnover rate | | | 7 | % | | | 15 | % | | | 15 | % | | | 48 | % | | | 44 | % | | | 63 | % | | | 48 | % |
Net assets, end of period (000s omitted) | | | $4,548 | | | | $4,566 | | | | $5,164 | | | | $5,523 | | | | $5,789 | | | | $7,671 | | | | $4,805 | |
| 1. | For the ten months ended June 30, 2011. The Fund changed its fiscal year end from August 31 to June 30, effective June 30, 2011. |
| 2. | After the close of business on July 9, 2010, the Fund acquired the net assets of Evergreen North Carolina Municipal Bond Fund which became the accounting and performance survivor in the transaction. The information for the periods prior to July 12, 2010 is that of Class C of Evergreen North Carolina Municipal Bond Fund. |
| 3. | Calculated based upon average shares outstanding |
| 4. | Total return calculations do not include any sales charges. Returns for periods of less than one year are not annualized. |
The accompanying notes are an integral part of these financial statements.
| | | | | | |
| Financial highlights | | Wells Fargo Advantage North Carolina Tax-Free Fund | | | 15 | |
(For a share outstanding throughout each period)
| | | | | | | | | | | | | | | | | | | | | | | | | | | | |
| | | Six months ended
December 31, 2014
(unaudited) | | | Year ended June 30 | | | Year ended August 31 | |
| INSTITUTIONAL CLASS | | | 2014 | | | 2013 | | | 2012 | | | 20111 | | | 20102 | | | 20092 | |
Net asset value, beginning of period | | | $10.33 | | | | $10.08 | | | | $10.34 | | | | $9.71 | | | | $10.12 | | | | $9.64 | | | | $9.80 | |
Net investment income | | | 0.17 | | | | 0.36 | | | | 0.35 | | | | 0.37 | | | | 0.32 | | | | 0.42 | 3 | | | 0.42 | |
Net realized and unrealized gains (losses) on investments | | | 0.14 | | | | 0.26 | | | | (0.26 | ) | | | 0.63 | | | | (0.41 | ) | | | 0.49 | | | | (0.16 | ) |
| | | | | | | | | | | | | | | | | | | | | | | | | | | | |
Total from investment operations | | | 0.31 | | | | 0.62 | | | | 0.09 | | | | 1.00 | | | | (0.09 | ) | | | 0.91 | | | | 0.26 | |
Distributions to shareholders from | | | | | | | | | | | | | | | | | | | | | | | | | | | | |
Net investment income | | | (0.17 | ) | | | (0.37 | ) | | | (0.35 | ) | | | (0.37 | ) | | | (0.32 | ) | | | (0.43 | ) | | | (0.42 | ) |
Net asset value, end of period | | | $10.47 | | | | $10.33 | | | | $10.08 | | | | $10.34 | | | | $9.71 | | | | $10.12 | | | | $9.64 | |
Total return4 | | | 3.02 | % | | | 6.25 | % | | | 0.82 | % | | | 10.43 | % | | | (0.79 | )% | | | 9.66 | % | | | 2.89 | % |
Ratios to average net assets (annualized) | | | | | | | | | | | | | | | | | | | | | | | | | | | | |
Gross expenses | | | 0.60 | % | | | 0.61 | % | | | 0.58 | % | | | 0.57 | % | | | 0.58 | % | | | 0.64 | % | | | 0.62 | % |
Net expenses | | | 0.54 | % | | | 0.54 | % | | | 0.54 | % | | | 0.54 | % | | | 0.54 | % | | | 0.63 | % | | | 0.62 | % |
Net investment income | | | 3.24 | % | | | 3.61 | % | | | 3.37 | % | | | 3.65 | % | | | 4.02 | % | | | 4.29 | % | | | 4.47 | % |
Supplemental data | | | | | | | | | | | | | | | | | | | | | | | | | | | | |
Portfolio turnover rate | | | 7 | % | | | 15 | % | | | 15 | % | | | 48 | % | | | 44 | % | | | 63 | % | | | 48 | % |
Net assets, end of period (000s omitted) | | | $65,819 | | | | $72,479 | | | | $77,926 | | | | $90,439 | | | | $107,972 | | | | $150,184 | | | | $153,115 | |
| 1. | For the ten months ended June 30, 2011. The Fund changed its fiscal year end from August 31 to June 30, effective June 30, 2011. |
| 2. | After the close of business on July 9, 2010, the Fund acquired the net assets of Evergreen North Carolina Municipal Bond Fund which became the accounting and performance survivor in the transaction. The information for the periods prior to July 12, 2010 is that of Class I of Evergreen North Carolina Municipal Bond Fund. |
| 3. | Calculated based upon average shares outstanding |
| 4. | Returns for periods of less than one year are not annualized. |
The accompanying notes are an integral part of these financial statements.
| | | | |
| 16 | | Wells Fargo Advantage North Carolina Tax-Free Fund | | Notes to financial statements (unaudited) |
1. ORGANIZATION
Wells Fargo Funds Trust (the “Trust”), a Delaware statutory trust organized on March 10, 1999, is an open-end management investment company registered under the Investment Company Act of 1940, as amended (the “1940 Act”). As an investment company, the Trust follows the accounting and reporting guidance in FASB Accounting Standards Codification 946. These financial statements report on the Wells Fargo Advantage North Carolina Tax-Free Fund (the “Fund”) which is a non-diversified series of the Trust.
2. SIGNIFICANT ACCOUNTING POLICIES
The following significant accounting policies, which are consistently followed in the preparation of the financial statements of the Fund, are in conformity with U.S. generally accepted accounting principles which require management to make estimates and assumptions that affect the reported amounts of assets and liabilities, disclosure of contingent assets and liabilities at the date of the financial statements, and the reported amounts of revenues and expenses during the reporting period. Actual results could differ from those estimates.
Securities valuation
All investments are valued each business day as of the close of regular trading on the New York Stock Exchange (generally 4 p.m. Eastern Time).
Fixed income securities acquired with maturities exceeding 60 days are valued based on evaluated bid prices provided by an independent pricing service which may utilize both transaction data and market information such as yield, quality, coupon rate, maturity, type of issue, trading characteristics and other market data. If prices are not available from the independent pricing service or prices received are deemed not representative of market value, prices will be obtained from an independent broker-dealer.
Short-term securities, with maturities of 60 days or less at time of purchase, generally are valued at amortized cost which approximates fair value. The amortized cost method involves valuing a security at its cost, plus accretion of discount or minus amortization of premium over the period until maturity.
Investments in registered open-end investment companies are valued at net asset value.
Investments which are not valued using any of the methods discussed above are valued at their fair value, as determined in good faith by the Board of Trustees of the Fund. The Board of Trustees has established a Valuation Committee comprised of the Trustees and has delegated to it the authority to take any actions regarding the valuation of portfolio securities that the Valuation Committee deems necessary or appropriate, including determining the fair value of portfolio securities, unless the determination has been delegated to the Management Valuation Team of Wells Fargo Funds Management, LLC (“Funds Management”). The Board of Trustees retains the authority to make or ratify any valuation decisions or approve any changes to the Valuation Procedures as it deems appropriate. On a quarterly basis, the Board of Trustees receives reports on any valuation actions taken by the Valuation Committee or the Management Valuation Team which may include items for ratification.
Valuations of fair valued securities are compared to the next actual sales price when available, or other appropriate market values, to assess the continued appropriateness of the fair valuation methodologies used. These securities are fair valued on a day-to-day basis, taking into consideration changes to appropriate market information and any significant changes to the inputs considered in the valuation process until there is a readily available price provided on an exchange or by an independent pricing service. Valuations received from an independent pricing service or independent broker-dealer quotes are periodically validated by comparisons to most recent trades and valuations provided by other independent pricing services in addition to the review of prices by the adviser and/or subadviser. Unobservable inputs used in determining fair valuations are identified based on the type of security, taking into consideration factors utilized by market participants in valuing the investment, knowledge about the issuer and the current market environment.
Security transactions and income recognition
Securities transactions are recorded on a trade date basis. Realized gains or losses are recorded on the basis of identified cost.
Interest income is accrued daily and bond discounts are accreted and premiums are amortized daily based on the effective interest method. To the extent debt obligations are placed on non-accrual status, any related interest income may be reduced by writing off interest receivables when the collection of all or a portion of interest has become doubtful based on consistently applied procedures. If the issuer subsequently resumes interest payments or when the collectability of interest is reasonably assured, the debt obligation is removed from non-accrual status.
| | | | | | |
| Notes to financial statements (unaudited) | | Wells Fargo Advantage North Carolina Tax-Free Fund | | | 17 | |
Distributions to shareholders
Distributions to shareholders from net investment income are accrued daily and paid monthly. Distributions from net realized gains, if any, are recorded on the ex-dividend date. Such distributions are determined in conformity with federal income tax regulations, which may differ in amount or character from net investment income and realized gains recognized for purposes of U.S. generally accepted accounting principles.
Federal and other taxes
The Fund intends to continue to qualify as a regulated investment company by distributing substantially all of its investment company taxable and tax-exempt income and any net realized capital gains (after reduction for capital loss carryforwards) sufficient to relieve it from all, or substantially all, federal income taxes. Accordingly, no provision for federal income taxes was required.
The Fund’s income and federal excise tax returns and all financial records supporting those returns for the prior three fiscal years are subject to examination by the federal and Delaware revenue authorities. Management has analyzed the Fund’s tax positions taken on federal, state, and foreign tax returns for all open tax years and does not believe that there are any uncertain tax positions that require recognition of a tax liability.
As of June 30, 2014, capital loss carryforwards available to offset future net realized capital gains were as follows through the indicated expiration dates:
| | | | | | |
| | | | | No expiration |
| 2017 | | 2018 | | Short-term | | Long-term |
| $7,092,084 | | $3,623,438 | | $225,315 | | $133,209 |
As of June 30, 2014, the Fund had $61,023 of current year deferred post-October capital losses which was recognized on the first day of the current fiscal year.
Class allocations
The separate classes of shares offered by the Fund differ principally in applicable sales charges, distribution, shareholder servicing, and administration fees. Class specific expenses are charged directly to that share class. Investment income, common expenses, and realized and unrealized gains (losses) on investments are allocated daily to each class of shares based on the relative proportion of net assets of each class.
3. FAIR VALUATION MEASUREMENTS
Fair value measurements of investments are determined within a framework that has established a fair value hierarchy based upon the various data inputs utilized in determining the value of the Fund’s investments. The three-level hierarchy gives the highest priority to unadjusted quoted prices in active markets for identical assets or liabilities (Level 1) and the lowest priority to significant unobservable inputs (Level 3). The Fund’s investments are classified within the fair value hierarchy based on the lowest level of input that is significant to the fair value measurement. The inputs are summarized into three broad levels as follows:
| n | | Level 1 – quoted prices in active markets for identical securities |
| n | | Level 2 – other significant observable inputs (including quoted prices for similar securities, interest rates, prepayment speeds, credit risk, use of amortized cost, etc.) |
| n | | Level 3 – significant unobservable inputs (including the Fund’s own assumptions in determining the fair value of investments) |
The inputs or methodologies used for valuing investments in securities are not necessarily an indication of the risk associated with investing in those securities.
| | | | |
| 18 | | Wells Fargo Advantage North Carolina Tax-Free Fund | | Notes to financial statements (unaudited) |
The following is a summary of the inputs used in valuing the Fund’s assets and liabilities as of December 31, 2014:
| | | | | | | | | | | | | | | | |
| | | Quoted prices
(Level 1) | | | Other significant
observable inputs (Level 2) | | | Significant
unobservable inputs (Level 3) | | | Total | |
Assets | | | | | | | | | | | | | | | | |
Investments in: | | | | | | | | | | | | | | | | |
| | | | |
Municipal obligations | | $ | 0 | | | $ | 103,939,128 | | | $ | 0 | | | $ | 103,939,128 | |
| | | | |
Short-term investments | | | | | | | | | | | | | | | | |
Investment companies | | | 882,460 | | | | 0 | | | | 0 | | | | 882,460 | |
Total assets | | $ | 882,460 | | | $ | 103,939,128 | | | $ | 0 | | | $ | 104,821,588 | |
Transfers in and transfers out are recognized at the end of the reporting period. At December 31, 2014, the Fund did not have any transfers into/out of Level 1, Level 2, or Level 3.
4. TRANSACTIONS WITH AFFILIATES
Advisory fee
The Trust has entered into an advisory contract with Funds Management, an indirect wholly owned subsidiary of Wells Fargo & Company (“Wells Fargo”). The adviser is responsible for implementing investment policies and guidelines and for supervising the subadviser, who is responsible for day-to-day portfolio management of the Fund.
Pursuant to the contract, Funds Management is entitled to receive an annual advisory fee starting at 0.35% and declining to 0.25% as the average daily net assets of the Fund increase. For the six months ended December 31, 2014, the advisory fee was equivalent to an annual rate of 0.35% of the Fund’s average daily net assets.
Funds Management has retained the services of a subadviser to provide daily portfolio management to the Fund. The fee for subadvisory services is borne by Funds Management. Wells Capital Management Incorporated, an affiliate of Funds Management and an indirect wholly owned subsidiary of Wells Fargo, is the subadviser to the Fund and is entitled to receive a fee from Funds Management at an annual rate starting at 0.20% and declining to 0.10% as the average daily net assets of the Fund increase
Administration fees
The Trust has entered into an administration agreement with Funds Management. Under this agreement, for providing administrative services, which includes paying fees and expenses for services provided by the transfer agent, sub-transfer agents, omnibus account servicers and record-keepers, Funds Management is entitled to receive from the Fund an annual fund level administration fee starting at 0.05% and declining to 0.03% as the average daily net assets of the Fund increase and a class level administration fee which is calculated based on the average daily net assets of each class as follows:
| | | | |
| | | Class level
administration fee | |
Class A, Class C | | | 0.16 | % |
Institutional Class | | | 0.08 | |
Funds Management has contractually waived and/or reimbursed advisory and administration fees to the extent necessary to maintain certain net operating expense ratios for the Fund. Waiver of fees and/or reimbursement of expenses by Funds Management were made first from fund level expenses on a proportionate basis and then from class specific expenses. Funds Management has committed through October 31, 2015 to waive fees and/or reimburse expenses to the extent necessary to cap the Fund’s expenses at 0.85% for Class A shares, 1.60% for Class C shares, and 0.54% for Institutional Class shares. After this time, the cap may be increased or the commitment to maintain the cap may be terminated only with the approval of the Board of Trustees.
Distribution fee
The Trust has adopted a Distribution Plan for Class C shares of the Fund pursuant to Rule 12b-1 under the 1940 Act. A distribution fee is charged to Class C shares and paid to Wells Fargo Funds Distributor, LLC (“Funds Distributor”), the principal underwriter, at an annual rate of 0.75% of the average daily net assets of Class C shares.
| | | | | | |
| Notes to financial statements (unaudited) | | Wells Fargo Advantage North Carolina Tax-Free Fund | | | 19 | |
In addition, Funds Distributor is entitled to receive the front-end sales charge from the purchase of Class A shares and a contingent deferred sales charge on the redemption of certain shares. Funds Distributor is also entitled to receive the contingent deferred sales charges from redemptions of Class C shares. For the six months ended December 31, 2014, Funds Distributor received $531 from the sale of Class A shares.
Shareholder servicing fees
The Trust has entered into contracts with one or more shareholder servicing agents, whereby Class A and Class C of the Fund is charged a fee at an annual rate of 0.25% of the average daily net assets of each respective class
A portion of these total shareholder servicing fees were paid to affiliates of Wells Fargo.
5. INVESTMENT PORTFOLIO TRANSACTIONS
Purchases and sales of investments, excluding U.S. government obligations (if any) and short-term securities, for the six months ended December 31, 2014 were $9,487,876 and $7,793,200 respectively.
6. BANK BORROWINGS
The Trust (excluding the money market funds and certain other funds in the Trust) and Wells Fargo Variable Trust are parties to a $150,000,000 revolving credit agreement, whereby the Fund is permitted to use bank borrowings for temporary or emergency purposes, such as to fund shareholder redemption requests. Interest under the credit agreement is charged to the Fund based on a borrowing rate equal to the higher of the Federal Funds rate in effect on that day plus 1.25% or the overnight LIBOR rate in effect on that day plus 1.25%. In addition, an annual commitment fee equal to 0.10% of the unused balance is allocated to each participating fund. For the six months ended December 31, 2014, the Fund paid $61 in commitment fees.
For the six months ended December 31, 2014, there were no borrowings by the Fund under the agreement.
7. CONCENTRATION RISK
The Fund invests a substantial portion of its assets in issuers of municipal debt securities located in a single state or territories of the U.S. Therefore, it may be more affected by economic and political developments in that state or region than would be a comparable general tax-exempt fund.
8. INDEMNIFICATION
Under the Trust’s organizational documents, the officers and Trustees are indemnified against certain liabilities that may arise out of performance of their duties to the Trust. Additionally, in the normal course of business, the Trust may enter into contracts with service providers that contain a variety of indemnification clauses. The Trust’s maximum exposure under these arrangements is dependent on future claims that may be made against the Fund and, therefore, cannot be estimated.
| | | | |
| 20 | | Wells Fargo Advantage North Carolina Tax-Free Fund | | Other information (unaudited) |
PROXY VOTING INFORMATION
A description of the policies and procedures that the Fund uses to determine how to vote proxies relating to portfolio securities is available without charge, upon request, by calling 1-800-222-8222, visiting our website at wellsfargoadvantagefunds.com, or visiting the SEC website at sec.gov. Information regarding how the Fund voted proxies relating to portfolio securities during the most recent 12-month period ended June 30 is available on the Fund’s website at wellsfargoadvantagefunds.com or by visiting the SEC website at sec.gov.
PORTFOLIO HOLDINGS INFORMATION
The complete portfolio holdings for the Fund are publicly available monthly on the Fund’s website (wellsfargoadvantagefunds.com), on a one-month delayed basis. In addition, top ten holdings information (excluding derivative positions) for the Fund is publicly available on the Fund’s website on a monthly, seven-day or more delayed basis. The Fund files its complete schedule of portfolio holdings with the SEC for the first and third quarters of each fiscal year on Form N-Q, which is available by visiting the SEC website at sec.gov. In addition, the Fund’s Form N-Q may be reviewed and copied at the SEC’s Public Reference Room in Washington, DC, and at regional offices in New York City, at 233 Broadway, and in Chicago, at 175 West Jackson Boulevard, Suite 900. Information about the Public Reference Room may be obtained by calling 1-800-SEC-0330.
| | | | | | |
| Other information (unaudited) | | Wells Fargo Advantage North Carolina Tax-Free Fund | | | 21 | |
BOARD OF TRUSTEES AND OFFICERS
Each of the Trustees and Officers1 listed in the table below acts in identical capacities for each fund in the Wells Fargo Advantage family of funds, which consists of 134 mutual funds comprising the Wells Fargo Funds Trust, Wells Fargo Variable Trust, Wells Fargo Master Trust and four closed-end funds (collectively the “Fund Complex”). This table should be read in conjunction with the Prospectus and the Statement of Additional Information2. The mailing address of each Trustee and Officer is 525 Market Street, 12th Floor, San Francisco, CA 94105. Each Trustee and Officer serves an indefinite term, however, each Trustee serves such term until reaching the mandatory retirement age established by the Trustees.
Independent Trustees
| | | | | | |
Name and year of birth | | Position held and length of service* | | Principal occupations during past five years or longer | | Other directorships during
past five years |
Peter G. Gordon
(Born 1942) | | Trustee, since 1998; Chairman, since 2005 | | Co-Founder, Retired Chairman, President and CEO of Crystal Geyser Water Company. Trustee Emeritus, Colby College. | | Asset Allocation Trust |
Isaiah Harris, Jr.
(Born 1952) | | Trustee, since 2009 | | Retired. Prior thereto, President and CEO of BellSouth Advertising and Publishing Corp. from 2005 to 2007, President and CEO of BellSouth Enterprises from 2004 to 2005 and President of BellSouth Consumer Services from 2000 to 2003. Emeritus member of the Iowa State University Foundation Board of Governors. Emeritus Member of the Advisory Board of Iowa State University School of Business. Advisory Board Member, Palm Harbor Academy. Mr. Harris is a certified public accountant. | | CIGNA Corporation; Asset Allocation Trust |
Judith M. Johnson
(Born 1949) | | Trustee, since 2008;
Audit Committee Chairman, since 2008 | | Retired. Prior thereto, Chief Executive Officer and Chief Investment Officer of Minneapolis Employees Retirement Fund from 1996 to 2008. Ms. Johnson is an attorney, certified public accountant and a certified managerial accountant. | | Asset Allocation Trust |
Leroy Keith, Jr.
(Born 1939) | | Trustee, since 2010** | | Chairman, Bloc Global Services (development and construction). Trustee of the Evergreen Funds complex (and its predecessors) from 1983 to 2010. Former Managing Director, Almanac Capital Management (commodities firm), former Partner, Stonington Partners, Inc. (private equity fund), former Director, Obagi Medical Products Co. and former Director, Lincoln Educational Services. | | Trustee, Virtus Fund Complex (consisting of 50 portfolios as of 12/16/2013); Asset Allocation Trust |
David F. Larcker
(Born 1950) | | Trustee, since 2009 | | James Irvin Miller Professor of Accounting at the Graduate School of Business, Stanford University, Morgan Stanley Director of the Center for Leadership Development and Research and Senior Faculty of The Rock Center for Corporate Governance since 2006. From 2005 to 2008, Professor of Accounting at the Graduate School of Business, Stanford University. Prior thereto, Ernst & Young Professor of Accounting at The Wharton School, University of Pennsylvania from 1985 to 2005. | | Asset Allocation Trust |
Olivia S. Mitchell
(Born 1953) | | Trustee, since 2006 | | International Foundation of Employee Benefit Plans Professor, Wharton School of the University of Pennsylvania since 1993. Director of Wharton’s Pension Research Council and Boettner Center on Pensions & Retirement Research, and Research Associate at the National Bureau of Economic Research. Previously, Cornell University Professor from 1978 to 1993. | | Asset Allocation Trust |
Timothy J. Penny
(Born 1951) | | Trustee, since 1996 | | President and CEO of Southern Minnesota Initiative Foundation, a non-profit organization, since 2007 and Senior Fellow at the Humphrey Institute Policy Forum at the University of Minnesota since 1995. Member of the Board of Trustees of NorthStar Education Finance, Inc., a non-profit organization, since 2007. | | Asset Allocation Trust |
| | | | |
| 22 | | Wells Fargo Advantage North Carolina Tax-Free Fund | | Other information (unaudited) |
| | | | | | |
Name and year of birth | | Position held and length of service* | | Principal occupations during past five years or longer | | Other directorships during
past five years |
Michael S. Scofield
(Born 1943) | | Trustee, since 2010 | | Served on the Investment Company Institute’s Board of Governors and Executive Committee from 2008-2011 as well the Governing Council of the Independent Directors Council from 2006-2011 and the Independent Directors Council Executive Committee from 2008-2011. Chairman of the IDC from 2008-2010. Institutional Investor (Fund Directions) Trustee of Year in 2007. Trustee of the Evergreen Funds complex (and its predecessors) from 1984 to 2010. Chairman of the Evergreen Funds from 2000-2010. Former Trustee of the Mentor Funds. Retired Attorney, Law Offices of Michael S. Scofield. | | Asset Allocation Trust |
Donald C. Willeke
(Born 1940) | | Trustee, since 1996 | | Principal of the law firm of Willeke & Daniels. General Counsel of the Minneapolis Employees Retirement Fund from 1984 until its consolidation into the Minnesota Public Employees Retirement Association on June 30, 2010. Director and Vice Chair of The Tree Trust (non-profit corporation). Director of the American Chestnut Foundation (non-profit corporation). | | Asset Allocation Trust |
| * | Length of service dates reflect the Trustee’s commencement of service with the Trust’s predecessor entities, where applicable. |
| ** | Leroy Keith, Jr. retired as a Trustee effective December 31, 2014. |
Officers
| | | | | | |
Name and year of birth | | Position held and
length of service | | Principal occupations during past five years or longer | | |
Karla M. Rabusch
(Born 1959) | | President, since 2003 | | Executive Vice President of Wells Fargo Bank, N.A. and President of Wells Fargo Funds Management, LLC since 2003. | | |
Nancy Wiser1
(Born 1967) | | Treasurer, since 2012 | | Executive Vice President of Wells Fargo Funds Management, LLC since 2011. Chief Operating Officer and Chief Compliance Officer at LightBox Capital Management LLC, from 2008 to 2011. Owned and operated a consulting business providing services to various hedge funds including acting as Chief Operating Officer and Chief Compliance Officer for a hedge fund from 2007 to 2008. Chief Operating Officer and Chief Compliance Officer of GMN Capital LLC from 2006 to 2007. | | |
C. David Messman
(Born 1960) | | Secretary, since 2000; Chief Legal Officer, since 2003 | | Assistant General Counsel of Wells Fargo Bank, N.A. since 2013 and Vice President and Managing Counsel of Wells Fargo Bank N.A. from 1996 to 2013. Senior Vice President and Secretary of Wells Fargo Funds Management , LLC since 2001. | | |
Debra Ann Early
(Born 1964) | | Chief Compliance Officer, since 2007 | | Senior Vice President of Wells Fargo Funds Management, LLC since 2007 and Chief Compliance Officer from 2007 to 2014. Chief Compliance Officer of Parnassus Investments from 2005 to 2007. Chief Financial Officer of Parnassus Investments from 2004 to 2007 and Senior Audit Manager of PricewaterhouseCoopers LLP from 1998 to 2004. | | |
David Berardi
(Born 1975) | | Assistant Treasurer, since 2009 | | Vice President of Wells Fargo Funds Management, LLC since 2009. Vice President of Evergreen Investment Management Company, LLC from 2008 to 2010. Assistant Vice President of Evergreen Investment Services, Inc. from 2004 to 2008. Manager of Fund Reporting and Control for Evergreen Investment Management Company, LLC from 2004 to 2010. | | |
Jeremy DePalma1
(Born 1974) | | Assistant Treasurer, since 2009 | | Senior Vice President of Wells Fargo Funds Management, LLC since 2009. Senior Vice President of Evergreen Investment Management Company, LLC from 2008 to 2010. Vice President, Evergreen Investment Services, Inc. from 2004 to 2007. Head of the Fund Reporting and Control Team within Fund Administration from 2005 to 2010. | | |
| 1. | Nancy Wiser acts as Treasurer of 73 funds in the Fund Complex. Jeremy DePalma acts as Treasurer of 61 funds and Assistant Treasurer of 73 funds in the Fund Complex. |
| 2. | The Statement of Additional Information includes additional information about the Trustees and is available, without charge, upon request, by calling 1-800-222-8222 or by visiting the website at wellsfargoadvantagefunds.com. |
| | | | | | |
| List of abbreviations | | Wells Fargo Advantage North Carolina Tax-Free Fund | | | 23 | |
The following is a list of common abbreviations for terms and entities that may have appeared in this report.
| ACA | — ACA Financial Guaranty Corporation |
| ADR | — American depositary receipt |
| ADS | — American depositary shares |
| AGC | — Assured Guaranty Corporation |
| AGM | — Assured Guaranty Municipal |
| Ambac | — Ambac Financial Group Incorporated |
| AMT | — Alternative minimum tax |
| BAN | — Bond anticipation notes |
| BHAC | — Berkshire Hathaway Assurance Corporation |
| CAB | — Capital appreciation bond |
| CCAB | — Convertible capital appreciation bond |
| CDA | — Community Development Authority |
| CDO | — Collateralized debt obligation |
| DRIVER | — Derivative inverse tax-exempt receipts |
| DW&P | — Department of Water & Power |
| DWR | — Department of Water Resources |
| ECFA | — Educational & Cultural Facilities Authority |
| EDA | — Economic Development Authority |
| EDFA | — Economic Development Finance Authority |
| ETF | — Exchange-traded fund |
| FDIC | — Federal Deposit Insurance Corporation |
| FFCB | — Federal Farm Credit Banks |
| FGIC | — Financial Guaranty Insurance Corporation |
| FHA | — Federal Housing Administration |
| FHLB | — Federal Home Loan Bank |
| FHLMC | — Federal Home Loan Mortgage Corporation |
| FICO | — The Financing Corporation |
| FNMA | — Federal National Mortgage Association |
| GDR | — Global depositary receipt |
| GNMA | — Government National Mortgage Association |
| HCFR | — Healthcare facilities revenue |
| HEFA | — Health & Educational Facilities Authority |
| HEFAR | — Higher education facilities authority revenue |
| HFA | — Housing Finance Authority |
| HFFA | — Health Facilities Financing Authority |
| HUD | — Department of Housing and Urban Development |
| IDA | — Industrial Development Authority |
| IDAG | — Industrial Development Agency |
| KRW | — Republic of Korea won |
| LIBOR | — London Interbank Offered Rate |
| LLC | — Limited liability company |
| LLLP | — Limited liability limited partnership |
| LLP | — Limited liability partnership |
| MBIA | — Municipal Bond Insurance Association |
| MFHR | — Multifamily housing revenue |
| MSTR | — Municipal securities trust receipts |
| MUD | — Municipal Utility District |
| National | — National Public Finance Guarantee Corporation |
| PCFA | — Pollution Control Financing Authority |
| PCL | — Public Company Limited |
| PCR | — Pollution control revenue |
| PFA | — Public Finance Authority |
| PFFA | — Public Facilities Financing Authority |
| PFOTER | — Puttable floating option tax-exempt receipts |
| plc | — Public limited company |
| PUTTER | — Puttable tax-exempt receipts |
| R&D | — Research & development |
| Radian | — Radian Asset Assurance |
| RAN | — Revenue anticipation notes |
| RDA | — Redevelopment Authority |
| RDFA | — Redevelopment Finance Authority |
| REIT | — Real estate investment trust |
| ROC | — Reset option certificates |
| SAVRS | — Select auction variable rate securities |
| SBA | — Small Business Authority |
| SFHR | — Single-family housing revenue |
| SFMR | — Single-family mortgage revenue |
| SPA | — Standby purchase agreement |
| SPDR | — Standard & Poor’s Depositary Receipts |
| STRIPS | — Separate trading of registered interest and |
| TAN | — Tax anticipation notes |
| TIPS | — Treasury inflation-protected securities |
| TRAN | — Tax revenue anticipation notes |
| TTFA | — Transportation Trust Fund Authority |
| TVA | — Tennessee Valley Authority |
This page is intentionally left blank.


For more information
More information about Wells Fargo Advantage Funds is available free upon request. To obtain literature, please write, email, visit the Fund’s website, or call:
Wells Fargo Advantage Funds
P.O. Box 8266
Boston, MA 02266-8266
Email: wfaf@wellsfargo.com
Website: wellsfargoadvantagefunds.com
Individual investors: 1-800-222-8222
Retail investment professionals: 1-888-877-9275
Institutional investment professionals: 1-866-765-0778
This report and the financial statements contained herein are submitted for the general information of the shareholders of Wells Fargo Advantage Funds. If this report is used for promotional purposes, distribution of the report must be accompanied or preceded by a current prospectus. Before investing, please consider the investment objectives, risks, charges, and expenses of the investment. For a current prospectus and, if available, a summary prospectus, containing this information, call 1-800-222-8222 or visit the Fund’s website at wellsfargoadvantagefunds.com. Read the prospectus carefully before you invest or send money.
Wells Fargo Funds Management, LLC, a wholly owned subsidiary of Wells Fargo & Company, provides investment advisory and administrative services for Wells Fargo Advantage Funds. Other affiliates of Wells Fargo & Company provide subadvisory and other services for the Funds. The Funds are distributed by Wells Fargo Funds Distributor, LLC, Member FINRA/SIPC, an affiliate of Wells Fargo & Company.
NOT FDIC INSURED ¡ NO BANK GUARANTEE ¡ MAY LOSE VALUE
© 2014 Wells Fargo Funds Management, LLC. All rights reserved.
| | |
 | | 230428 02-15 SA254/SAR254 12-14 |

Wells Fargo Advantage
Pennsylvania Tax-Free Fund

Semi-Annual Report
December 31, 2014

Reduce clutter. Save trees.
Sign up for electronic delivery of prospectuses and shareholder reports at wellsfargo.com/advantagedelivery
Contents
The views expressed and any forward-looking statements are as of December 31, 2014, unless otherwise noted, and are those of the Fund managers and/or Wells Fargo Funds Management, LLC. Discussions of individual securities, or the markets generally, or any Wells Fargo Advantage Fund are not intended as individual recommendations. Future events or results may vary significantly from those expressed in any forward-looking statements; the views expressed are subject to change at any time in response to changing circumstances in the market. Wells Fargo Funds Management, LLC and the Fund disclaim any obligation to publicly update or revise any views expressed or forward-looking statements.
NOT FDIC INSURED ¡ NO BANK GUARANTEE ¡ MAY LOSE VALUE
| | | | |
| 2 | | Wells Fargo Advantage Pennsylvania Tax-Free Fund | | Letter to shareholders (unaudited) |

Karla M. Rabusch
President
Wells Fargo Advantage Funds
Municipal bonds rose in the second half of 2014, helped by lower interest rates and strong demand for yield.
Dear Valued Shareholder:
We are pleased to provide you with this semi-annual report for the Wells Fargo Advantage Pennsylvania Tax-Free Fund for the six-month period that ended December 31, 2014. Municipal bonds rose in the second half of 2014, helped by lower interest rates and strong demand for yield. In fact, the longest-dated and weakest credits had the strongest returns. Municipal bond returns—as measured by the Barclays Municipal Bond Index1, the broadest measure for tracking investment-grade municipal bonds throughout the country—gained 2.88% for the six-month period that ended December 31, 2014.
Longer-maturity and lower-rated municipal bonds outperformed.
At the front end of the yield curve, municipal bond yields were extremely low because of the accommodative monetary policy. Throughout the reporting period, the U.S. Federal Reserve’s (Fed’s) monetary policymaking body kept its key interest rate near zero in order to support the economy and the financial system. Policymakers said they can be patient in normalizing monetary policy and that any increases in the target range for the federal funds rate will depend on incoming economic data. During the reporting period, the Fed reduced (or tapered) the size of its quantitative easing program each month until the program ended in October 2014, although it continues to reinvest principal and interest payments of the mortgage-backed securities and Treasury bonds it holds.
Longer-term yields declined during the second half of the year, with 10-year municipal yields declining from 2.33% as of June 30, 2014 to 2.10% as of December 31, 2014. For more perspective, the yield curve was steep on a historical basis at the beginning of the period and ended the period with the difference between 30-year and 2-year yields at 237 basis points (bps; 100 bps equals 1.00%), which was only slightly wider than its historical average. Because the yield curve was steep, longer-dated securities had higher yields. Given their longer maturities (as municipal yields fell further out the curve) and their more generous yields, longer-term bond returns outpaced shorter-term bonds.
Investors were also enticed to buy lower-rated securities for their higher yields. Over the six-month period that ended December 31, 2014, AAA-rated municipal bonds returned 2.04% while BBB-rated bonds returned 4.29%, according to the Barclays Municipal Bond Index. Credit conditions continued to improve, as evidenced by an 18th consecutive quarter of positive year-over-year gains in state and local municipal revenues. In addition to better fundamental credit conditions, technical factors of limited supply alongside strong investor demand also supported municipal bonds.
Puerto Rico’s struggle, the exit of two cities from bankruptcy, and pension issues topped credit news.
Puerto Rico was the asset class’s largest single credit story. Bonds from the commonwealth returned a meager 0.79% during the six-month period as population declines, a contracting economy, and a burdensome level of debt held back results. Meanwhile, the cities of Stockton, California, and Detroit, Michigan, exited bankruptcy by curbing retiree health care benefits and bondholder recoveries but largely avoiding concessions on pensions. While these recent bankruptcies have so far treated pensions better than bonded debt, no clear precedent has been established due to the difference in general obligation
| 1. | The Barclays Municipal Bond Index is an unmanaged index composed of long-term tax-exempt bonds with a minimum credit rating of Baa. You cannot invest directly in an index. |
| | | | | | |
| Letter to shareholders (unaudited) | | Wells Fargo Advantage Pennsylvania Tax-Free Fund | | | 3 | |
pledges and court-ordered versus negotiated concessions. Finally, underfunded pensions in Illinois, New Jersey, Pennsylvania, and Kansas gained attention for their negative fiscal effects and the political difficulties of finding a resolution.
Don’t let short-term uncertainty derail long-term investment goals.
Periods of uncertainty can present challenges, but experience has taught us that maintaining long-term investment goals can be an effective way to plan for the future. To help you create a sound strategy based on your personal goals and risk tolerance, Wells Fargo Advantage Funds offers more than 100 mutual funds and other investments spanning a wide range of asset classes and investment styles. Although diversification cannot guarantee an investment profit or prevent losses, we believe it can be an effective way to manage investment risk and potentially smooth out overall portfolio performance. We encourage investors to know their investments and to understand that appropriate levels of risk-taking may unlock opportunities.
Thank you for choosing to invest with Wells Fargo Advantage Funds. We appreciate your confidence in us and remain committed to helping you meet your financial needs. For current information about your fund investments, contact your investment professional, visit our website at wellsfargoadvantagefunds.com, or call us directly at 1-800-222-8222. We are available 24 hours a day, 7 days a week.
Sincerely,

Karla M. Rabusch
President
Wells Fargo Advantage Funds
Periods of uncertainty can present challenges, but experience has taught us that maintaining long-term investment goals can be an effective way to plan for the future.
| | | | |
| 4 | | Wells Fargo Advantage Pennsylvania Tax-Free Fund | | Performance highlights (unaudited) |
Investment objective
The Fund seeks current income exempt from federal income tax and Pennsylvania individual income tax.
Adviser
Wells Fargo Funds Management, LLC
Subadviser
Wells Capital Management Incorporated
Portfolio managers
Bruce R. Johns
Robert J. Miller
Average annual total returns1 (%) as of December 31, 2014
| | | | | | | | | | | | | | | | | | | | | | | | | | | | | | | | | | |
| | | | | Including sales charge | | | Excluding sales charge | | | Expense ratios2 (%) | |
| | | Inception date | | 1 year | | | 5 year | | | 10 year | | | 1 year | | | 5 year | | | 10 year | | | Gross | | | Net3 | |
| Class A (EKVAX) | | 12-27-1990 | | | 5.18 | | | | 4.84 | | | | 3.96 | | | | 10.17 | | | | 5.81 | | | | 4.44 | | | | 0.91 | | | | 0.74 | |
| Class B (EKVBX)* | | 2-1-1993 | | | 4.38 | | | | 4.69 | | | | 3.90 | | | | 9.38 | | | | 5.03 | | | | 3.90 | | | | 1.66 | | | | 1.49 | |
| Class C (EKVCX) | | 2-1-1993 | | | 8.36 | | | | 5.02 | | | | 3.67 | | | | 9.36 | | | | 5.02 | | | | 3.67 | | | | 1.66 | | | | 1.49 | |
| Institutional Class (EKVYX) | | 11-24-1997 | | | – | | | | – | | | | – | | | | 10.45 | | | | 6.07 | | | | 4.71 | | | | 0.58 | | | | 0.49 | |
| Barclays Municipal Bond Index4 | | – | | | – | | | | – | | | | – | | | | 9.05 | | | | 5.16 | | | | 4.74 | | | | – | | | | – | |
| Barclays Pennsylvania Municipal Bond Index5 | | – | | | – | | | | – | | | | – | | | | 9.02 | | | | 5.25 | | | | 4.88 | | | | – | | | | – | |
| * | | Class B shares are closed to investment, except in connection with the reinvestment of any distributions and permitted exchanges. |
Figures quoted represent past performance, which is no guarantee of future results, and do not reflect taxes that a shareholder may pay on fund distributions or the redemption of fund shares. Investment return and principal value of an investment will fluctuate so that an investor’s shares, when redeemed, may be worth more or less than their original cost. Performance shown without sales charges would be lower if sales charges were reflected. Current performance may be lower or higher than the performance data quoted, which assumes the reinvestment of dividends and capital gains. Current month-end performance is available on the Fund’s website, wellsfargoadvantagefunds.com.
Index returns do not include transaction costs associated with buying and selling securities, any mutual fund fees or expenses, or any taxes. It is not possible to invest directly in an index.
For Class A shares, the maximum front-end sales charge is 4.50%. For Class B shares, the maximum contingent deferred sales charge is 5.00%. For Class C shares, the maximum contingent deferred sales charge is 1.00%. Performance including a contingent deferred sales charge assumes the sales charge for the corresponding time period. Institutional Class shares are sold without a front-end sales charge or contingent deferred sales charge.
Bond values fluctuate in response to the financial condition of individual issuers, general market and economic conditions, and changes in interest rates. Changes in market conditions and government policies may lead to periods of heightened volatility in the bond market and reduced liquidity for certain bonds held by the Fund. In general, when interest rates rise, bond values fall and investors may lose principal value. Interest-rate changes and their impact on the Fund and its share price can be sudden and unpredictable. The use of derivatives may reduce returns and/or increase volatility. Certain investment strategies tend to increase the total risk of an investment (relative to the broader market). The Fund is exposed to Pennsylvania municipal securities risk and high-yield securities risk. Consult the Fund’s prospectus for additional information on these and other risks. A portion of the Fund’s income may be subject to federal, state, and/or local income taxes or the Alternative Minimum Tax (AMT). Any capital gains distributions may be taxable.
Please see footnotes on page 5.
| | | | | | |
| Performance highlights (unaudited) | | Wells Fargo Advantage Pennsylvania Tax-Free Fund | | | 5 | |
|
| Credit quality distribution6 as of December 31, 2014 |
|
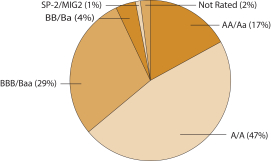 |
| | |
| Effective maturity distribution7 as of December 31, 2014 |
|
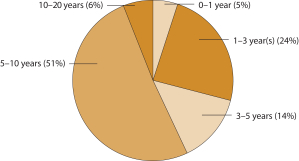 |
| 1. | Historical performance shown for all classes of the Fund prior to July 12, 2010, is based on the performance of the Fund’s predecessor, Evergreen Pennsylvania Municipal Bond Fund. |
| 2. | Reflects the expense ratios as stated in the most recent prospectuses. The expense ratios shown are subject to change and may differ from the annualized expense ratios shown in the financial highlights of this report. |
| 3. | The Adviser has committed through October 31, 2015, to waive fees and/or reimburse expenses to the extent necessary to cap the Fund’s Total Annual Fund Operating Expenses After Fee Waiver, excluding certain expenses, at the amounts shown. After this time, the cap may be increased or the commitment to maintain the cap may be terminated only with the approval of the Board of Trustees. Brokerage commissions, stamp duty fees, interest, taxes, acquired fund fees and expenses, and extraordinary expenses are excluded from the cap. Without this cap, the Fund’s returns would have been lower. |
| 4. | The Barclays Municipal Bond Index is an unmanaged index composed of long-term tax-exempt bonds with a minimum credit rating of Baa. You cannot invest directly in an index. |
| 5. | The Barclays Pennsylvania Municipal Bond Index is the Pennsylvania component of the Barclays Municipal Bond Index. You cannot invest directly in an index. |
| 6. | The credit quality distribution of portfolio holdings reflected in the chart is based on ratings from Standard & Poor’s, Moody’s Investors Service, and/or Fitch Ratings Ltd. Credit quality ratings apply to the underlying holdings of the Fund and not to the Fund itself. The percentages of the Fund’s portfolio with the ratings depicted in the chart are calculated based on the total market value of fixed income securities held by the Fund. If a security was rated by all three rating agencies, the middle rating was utilized. If rated by two of three rating agencies, the lower rating was utilized, and if rated by one of the rating agencies, that rating was utilized. Standard & Poor’s rates the creditworthiness of bonds, ranging from AAA (highest) to D (lowest). Ratings from A to CCC may be modified by the addition of a plus (+) or minus (-) sign to show relative standing within the rating categories. Standard & Poor’s rates the creditworthiness of short-term notes from SP-1 (highest) to SP-3 (lowest). Moody’s rates the creditworthiness of bonds, ranging from Aaa (highest) to C (lowest). Ratings Aa to B may be modified by the addition of a number 1 (highest) to 3 (lowest) to show relative standing within the ratings categories. Moody’s rates the creditworthiness of short-term U.S. tax-exempt municipal securities from MIG 1/VMIG 1 (highest) to SG (lowest). Fitch rates the creditworthiness of bonds, ranging from AAA (highest) to D (lowest). Credit quality and credit quality ratings are subject to change and may have changed since the date specified. |
| 7. | Effective maturity distribution is calculated based on the total long-term investments of the Fund. It is subject to change and may have changed since the date specified. |
| | | | |
| 6 | | Wells Fargo Advantage Pennsylvania Tax-Free Fund | | Fund expenses (unaudited) |
As a shareholder of the Fund, you incur two types of costs: (1) transaction costs, including sales charges (loads) on purchase payments and contingent deferred sales charges (if any) on redemptions and (2) ongoing costs, including management fees, distribution (12b-1) and/or shareholder service fees, and other Fund expenses. This example is intended to help you understand your ongoing costs (in dollars) of investing in the Fund and to compare these costs with the ongoing costs of investing in other mutual funds.
The example is based on an investment of $1,000 invested at the beginning of the six-month period and held for the entire period from July 1, 2014 to December 31, 2014.
Actual expenses
The “Actual” line of the table below provides information about actual account values and actual expenses. You may use the information in this line, together with the amount you invested, to estimate the expenses that you paid over the
period. Simply divide your account value by $1,000 (for example, an $8,600 account value divided by $1,000 = 8.6), then multiply the result by the number in the “Actual” line under the heading entitled “Expenses paid during period” for your applicable class of shares to estimate the expenses you paid on your account during this period.
Hypothetical example for comparison purposes
The “Hypothetical” line of the table below provides information about hypothetical account values and hypothetical
expenses based on the Fund’s actual expense ratio and an assumed rate of return of 5% per year before expenses, which
is not the Fund’s actual return. The hypothetical account values and expenses may not be used to estimate the actual
ending account balance or expenses you paid for the period. You may use this information to compare the ongoing costs
of investing in the Fund and other funds. To do so, compare this 5% hypothetical example with the 5% hypothetical examples that appear in the shareholder reports of the other funds.
Please note that the expenses shown in the table are meant to highlight your ongoing costs only and do not reflect any
transactional costs, such as sales charges (loads) and contingent deferred sales charges. Therefore, the “Hypothetical” line
of the table is useful in comparing ongoing costs only and will not help you determine the relative total costs of owning
different funds. In addition, if these transactional costs were included, your costs would have been higher.
| | | | | | | | | | | | | | | | |
| | | Beginning
account value
7-1-2014 | | | Ending
account value
12-31-2014 | | | Expenses
paid during
the period¹ | | | Net annualized
expense ratio | |
Class A | | | | | | | | | | | | | | | | |
Actual | | $ | 1,000.00 | | | $ | 1,037.03 | | | $ | 3.80 | | | | 0.74 | % |
Hypothetical (5% return before expenses) | | $ | 1,000.00 | | | $ | 1,021.48 | | | $ | 3.77 | | | | 0.74 | % |
Class B | | | | | | | | | | | | | | | | |
Actual | | $ | 1,000.00 | | | $ | 1,034.08 | | | $ | 7.64 | | | | 1.49 | % |
Hypothetical (5% return before expenses) | | $ | 1,000.00 | | | $ | 1,017.69 | | | $ | 7.58 | | | | 1.49 | % |
Class C | | | | | | | | | | | | | | | | |
Actual | | $ | 1,000.00 | | | $ | 1,033.16 | | | $ | 7.64 | | | | 1.49 | % |
Hypothetical (5% return before expenses) | | $ | 1,000.00 | | | $ | 1,017.69 | | | $ | 7.58 | | | | 1.49 | % |
Institutional Class | | | | | | | | | | | | | | | | |
Actual | | $ | 1,000.00 | | | $ | 1,038.33 | | | $ | 2.52 | | | | 0.49 | % |
Hypothetical (5% return before expenses) | | $ | 1,000.00 | | | $ | 1,022.74 | | | $ | 2.50 | | | | 0.49 | % |
| 1. | Expenses paid is equal to the annualized expense ratio of each class multiplied by the average account value over the period, multiplied by the number of days in the most recent fiscal half-year divided by the number of days in the fiscal year (to reflect the one-half-year period). |
| | | | | | |
| Portfolio of investments—December 31, 2014 (unaudited) | | Wells Fargo Advantage Pennsylvania Tax-Free Fund | | | 7 | |
| | | | | | | | | | | | | | | | |
| Security name | | Interest rate | | | Maturity date | | | Principal | | | Value | |
| | | | | | | | | | | | | | | | |
| | | | |
Municipal Obligations: 97.98% | | | | | | | | | | | | | | | | |
| | | | |
| Florida: 0.57% | | | | | | | | | | | | | | | | |
Jacksonville FL Economic Development AMT Metropolitan Parking Solutions Project (Industrial Development Revenue, ACA Insured) | | | 5.50 | % | | | 10-1-2030 | | | $ | 1,000,000 | | | $ | 1,014,920 | |
| | | | | | | | | | | | | | | | |
| | | | |
| Guam: 0.64% | | | | | | | | | | | | | | | | |
Guam Government Waterworks Authority Water & Wastewater System Project (Water & Sewer Revenue) | | | 5.25 | | | | 7-1-2025 | | | | 1,000,000 | | | | 1,148,720 | |
| | | | | | | | | | | | | | | | |
| | | | |
| New York: 0.95% | | | | | | | | | | | | | | | | |
New York Dormitory Authority Personal Income Tax Series B (Tax Revenue) | | | 5.00 | | | | 3-15-2042 | | | | 1,500,000 | | | | 1,695,105 | |
| | | | | | | | | | | | | | | | |
| | | | |
| Pennsylvania: 94.55% | | | | | | | | | | | | | | | | |
Allegheny County PA Airport Authority PFOTER Series 3965 (Airport Revenue, National Insured, Dexia Credit Local LIQ) ø | | | 0.28 | | | | 1-1-2020 | | | | 995,000 | | | | 995,000 | |
Allegheny County PA Higher Education Building Authority Refunding Bond Duquesne University of The Holy Spirit Series A (Education Revenue) | | | 5.00 | | | | 3-1-2029 | | | | 1,135,000 | | | | 1,329,346 | |
Allegheny County PA Hospital Development Authority Health Center Series B (Health Revenue, National Insured) | | | 6.00 | | | | 7-1-2027 | | | | 1,800,000 | | | | 2,320,200 | |
Allegheny County PA Hospital Development Authority University of Pittsburgh Medical Center Series A (Health Revenue) | | | 5.00 | | | | 9-1-2018 | | | | 1,000,000 | | | | 1,136,390 | |
Allegheny County PA Port Authority Refunding Transportation (Tax Revenue) | | | 5.75 | | | | 3-1-2029 | | | | 3,000,000 | | | | 3,557,640 | |
Allegheny County PA Series C-65 (GO) | | | 5.50 | | | | 5-1-2024 | | | | 4,675,000 | | | | 5,567,177 | |
Berks County PA Municipal Authority Reading Hospital & Medical Center Project Series A-3 (Health Revenue) | | | 5.25 | | | | 11-1-2024 | | | | 225,000 | | | | 259,817 | |
Berks County PA Municipal Authority Reading Hospital & Medical Center Project Series B (Health Revenue) | | | 1.54 | | | | 11-1-2039 | | | | 2,000,000 | | | | 2,051,320 | |
Blair County PA (GO, Build America Mutual Assurance Company Insured) | | | 5.00 | | | | 10-1-2026 | | | | 955,000 | | | | 1,147,815 | |
Bucks County PA IDA Lane Charter School Project Series A (Education Revenue) 144A | | | 4.88 | | | | 3-15-2027 | | | | 1,700,000 | | | | 1,716,864 | |
Butler County PA Hospital Authority Series A (Health Revenue, Royal Bank of Scotland LOC) ø | | | 0.24 | | | | 10-1-2032 | | | | 500,000 | | | | 500,000 | |
Butler County PA Hospital Authority Series A (Health Revenue, Royal Bank of Scotland LOC) ø | | | 0.24 | | | | 10-1-2042 | | | | 210,000 | | | | 210,000 | |
Chester County PA IDA Avon Grove Charter School Project Series A (Education Revenue) | | | 5.65 | | | | 12-15-2017 | | | | 380,000 | | | | 400,471 | |
Chester County PA IDA Avon Grove Charter School Project Series A (Education Revenue) | | | 6.25 | | | | 12-15-2027 | | | | 2,370,000 | | | | 2,511,110 | |
Chester County PA IDA Collegium Charter School Project (Education Revenue) | | | 5.00 | | | | 10-15-2022 | | | | 1,695,000 | | | | 1,779,581 | |
Chester County PA IDA Renaissance Academy Charter School (Education Revenue) | | | 3.75 | | | | 10-1-2024 | | | | 1,000,000 | | | | 1,009,740 | |
Chester County PA IDA University Student Housing LLC Project Series A (Housing Revenue) | | | 5.00 | | | | 8-1-2030 | | | | 555,000 | | | | 599,572 | |
Commonwealth of PA Financing Authority Series B (Water & Sewer Revenue) | | | 5.00 | | | | 6-1-2026 | | | | 1,000,000 | | | | 1,151,520 | |
Cumberland County PA Municipal Authority Diakon Lutheran Ministries Project (Health Revenue) | | | 5.00 | | | | 1-1-2036 | | | | 5,000,000 | | | | 5,107,750 | |
Cumberland County PA Municipal Authority Dickinson College Series HH1 (Education Revenue) | | | 5.00 | | | | 11-1-2039 | | | | 1,200,000 | | | | 1,307,184 | |
Dauphin County PA (GO, Syncora Guarantee Incorporated Insured) | | | 5.00 | | | | 11-15-2022 | | | | 1,000,000 | | | | 1,060,910 | |
Dauphin County PA General Authority Office & Parking Riverfront Office Project (Miscellaneous Revenue) | | | 6.00 | | | | 1-1-2025 | | | | 3,125,000 | | | | 3,126,781 | |
Delaware County PA IDA Chester Community Charter School Series A (Education Revenue) | | | 5.00 | | | | 8-15-2020 | | | | 1,795,000 | | | | 1,841,742 | |
Delaware County PA Voctech School Authority (Miscellaneous Revenue, Build America Mutual Assurance Company Insured) | | | 5.25 | | | | 11-1-2033 | | | | 1,000,000 | | | | 1,149,140 | |
The accompanying notes are an integral part of these financial statements.
| | | | |
| 8 | | Wells Fargo Advantage Pennsylvania Tax-Free Fund | | Portfolio of investments—December 31, 2014 (unaudited) |
| | | | | | | | | | | | | | | | |
| Security name | | Interest rate | | | Maturity date | | | Principal | | | Value | |
| | | | | | | | | | | | | | | | |
| | | | |
| Pennsylvania (continued) | | | | | | | | | | | | | | | | |
Delaware Valley PA Regional Finance Authority Series B (Miscellaneous Revenue, Ambac Insured) | | | 5.60 | % | | | 7-1-2017 | | | $ | 2,000,000 | | | $ | 2,196,320 | |
Delaware Valley PA Regional Financial Authority Series A (Miscellaneous Revenue, Ambac Insured) | | | 5.50 | | | | 8-1-2028 | | | | 4,390,000 | | | | 5,253,601 | |
General Authority of South Central Pennsylvania Association of Independent Colleges & Universities (Education Revenue) | | | 6.00 | | | | 11-1-2031 | | | | 2,500,000 | | | | 2,964,400 | |
Kiski PA Area School District (GO, AGM Insured) | | | 4.00 | | | | 3-1-2023 | | | | 1,240,000 | | | | 1,356,089 | |
Lehigh County PA General Purpose Authority Lehigh Valley Hospital Incorporated Series A (Health Revenue, National/FHA Insured) | | | 7.00 | | | | 7-1-2016 | | | | 840,000 | | | | 886,578 | |
Lehigh County PA General Purpose Authority Water & Sewer CAB Allentown Project (Water & Sewer Revenue) ¤ | | | 0.00 | | | | 12-1-2030 | | | | 2,000,000 | | | | 1,056,500 | |
Lycoming County PA College Authority (Education Revenue) | | | 5.50 | | | | 7-1-2026 | | | | 3,000,000 | | | | 3,444,720 | |
McKeesport PA Municipal Authority (Water & Sewer Revenue, AGM Insured) | | | 5.50 | | | | 12-15-2027 | | | | 2,405,000 | | | | 2,789,992 | |
Monroe County PA Hospital Authority Pocono Medical Center Series A (Health Revenue) | | | 5.00 | | | | 1-1-2027 | | | | 840,000 | | | | 925,294 | |
Monroe County PA Hospital Authority Pocono Medical Center Series A (Health Revenue) | | | 5.00 | | | | 1-1-2032 | | | | 880,000 | | | | 959,614 | |
Montgomery County PA HEFA Arcadia University (Education Revenue, Radian Insured) | | | 5.00 | | | | 4-1-2027 | | | | 3,760,000 | | | | 3,917,168 | |
Montgomery County PA Higher Education & Health Authority Abington Memorial Hospital Project (Health Revenue) | | | 5.00 | | | | 6-1-2031 | | | | 2,000,000 | | | | 2,215,080 | |
Montgomery County PA IDA Acts Retirement Community Series B (Health Revenue) | | | 5.00 | | | | 11-15-2022 | | | | 6,000,000 | | | | 6,272,280 | |
Montgomery County PA IDA Jefferson Health System Series A (Health Revenue) | | | 5.00 | | | | 10-1-2027 | | | | 1,000,000 | | | | 1,129,400 | |
Montgomery County PA IDA New Regional Medical Center Project (Health Revenue, FHA Insured) | | | 5.00 | | | | 8-1-2020 | | | | 980,000 | | | | 1,138,554 | |
Northampton County PA St. Luke’s Hospital of Bethlehem Series A (Health Revenue) | | | 5.00 | | | | 8-15-2033 | | | | 1,500,000 | | | | 1,624,335 | |
Penn Hills PA School District (GO, Build America Mutual Assurance Company Insured) | | | 4.00 | | | | 10-1-2021 | | | | 1,500,000 | | | | 1,645,755 | |
Pennsylvania Department of General Services Certificate of Participation (Lease Revenue, AGM Insured) | | | 3.00 | | | | 5-1-2015 | | | | 500,000 | | | | 504,320 | |
Pennsylvania Financing Authority Pennsylvania Hills Project Series B (Miscellaneous Revenue, National Insured) ¤ | | | 0.00 | | | | 12-1-2022 | | | | 1,200,000 | | | | 942,396 | |
Pennsylvania Financing Authority Pennsylvania Hills Project Series B (Miscellaneous Revenue, National Insured) ¤ | | | 0.00 | | | | 12-1-2023 | | | | 3,790,000 | | | | 2,834,389 | |
Pennsylvania HEFAR Association of Independent Colleges & University Series FF2 (Education Revenue, Radian Insured) | | | 5.00 | | | | 12-15-2024 | | | | 3,070,000 | | | | 3,217,114 | |
Pennsylvania HEFAR La Salle University Series A (Education Revenue) | | | 5.25 | | | | 5-1-2027 | | | | 5,250,000 | | | | 5,528,408 | |
Pennsylvania HEFAR Shippensburg University Project (Education Revenue) | | | 5.00 | | | | 10-1-2020 | | | | 1,460,000 | | | | 1,593,751 | |
Pennsylvania HEFAR Shippensburg University Project (Education Revenue) | | | 6.00 | | | | 10-1-2031 | | | | 3,000,000 | | | | 3,332,910 | |
Pennsylvania HEFAR Temple University First Series (Education Revenue) | | | 5.00 | | | | 4-1-2032 | | | | 1,000,000 | | | | 1,129,400 | |
Pennsylvania Housing Finance Agency SFMF Series 108-B (Housing Revenue) | | | 4.50 | | | | 10-1-2024 | | | | 1,825,000 | | | | 1,942,767 | |
Pennsylvania Housing Finance Agency SFMR Series 106-B (Housing Revenue) | | | 4.50 | | | | 10-1-2024 | | | | 5,010,000 | | | | 5,342,614 | |
Pennsylvania Housing Finance Agency SFMR Series 112 (Housing Revenue) | | | 5.00 | | | | 4-1-2028 | | | | 3,160,000 | | | | 3,368,781 | |
Pennsylvania Turnpike Commission Motor License Series B1 (Transportation Revenue) | | | 5.00 | | | | 12-1-2040 | | | | 1,500,000 | | | | 1,640,220 | |
Pennsylvania Turnpike Commission Series A (Miscellaneous Revenue, AGM Insured) | | | 5.25 | | | | 7-15-2021 | | | | 2,000,000 | | | | 2,387,020 | |
Pennsylvania Turnpike Commission Series C (Transportation Revenue, AGM Insured) | | | 6.25 | | | | 6-1-2038 | | | | 3,500,000 | | | | 3,990,525 | |
Philadelphia PA IDA 1st Philadelphia Preparatory Charter School Project Series A (Education Revenue) | | | 7.00 | | | | 6-15-2033 | | | | 1,000,000 | | | | 1,105,530 | |
Philadelphia PA IDA Architecture & Design Charter School Project (Education Revenue) | | | 5.25 | | | | 3-15-2023 | | | | 915,000 | | | | 964,154 | |
Philadelphia PA IDA Charter School Project Series A (Education Revenue) | | | 5.30 | | | | 9-15-2027 | | | | 5,150,000 | | | | 5,292,037 | |
The accompanying notes are an integral part of these financial statements.
| | | | | | |
| Portfolio of investments—December 31, 2014 (unaudited) | | Wells Fargo Advantage Pennsylvania Tax-Free Fund | | | 9 | |
| | | | | | | | | | | | | | | | |
| Security name | | Interest rate | | | Maturity date | | | Principal | | | Value | |
| | | | | | | | | | | | | | | | |
| | | | |
| Pennsylvania (continued) | | | | | | | | | | | | | | | | |
Philadelphia PA IDA Global Leadership Academy Project (Education Revenue) | | | 5.13 | % | | | 11-15-2020 | | | $ | 1,430,000 | | | $ | 1,502,315 | |
Philadelphia PA IDA Global Leadership Academy Project (Education Revenue) | | | 5.75 | | | | 11-15-2030 | | | | 1,000,000 | | | | 1,047,530 | |
Philadelphia PA IDA Master Charter School (Education Revenue) | | | 5.00 | | | | 8-1-2020 | | | | 825,000 | | | | 869,806 | |
Philadelphia PA IDA Tacony Academy Charter School Project (Education Revenue) | | | 6.88 | | | | 6-15-2033 | | | | 1,000,000 | | | | 1,109,600 | |
Philadelphia PA IDA West Philadelphia Achievement Charter Elementary School Project (Education Revenue) | | | 7.50 | | | | 5-1-2031 | | | | 1,285,000 | | | | 1,417,137 | |
Philadelphia PA School District Refunding Bond Series A (GO, AGM/FGIC Insured) | | | 5.00 | | | | 6-1-2024 | | | | 1,425,000 | | | | 1,613,057 | |
Philadelphia PA School District Refunding Bond Series C (GO) | | | 5.00 | | | | 9-1-2018 | | | | 3,000,000 | | | | 3,369,300 | |
Philadelphia PA School District Refunding Bond Series C (GO) | | | 5.00 | | | | 9-1-2021 | | | | 1,395,000 | | | | 1,602,646 | |
Philadelphia PA Series A (GO) | | | 5.25 | | | | 7-15-2033 | | | | 1,500,000 | | | | 1,751,220 | |
Pittsburgh & Allegheny Counties PA Sports & Exhibition Authority (Tax Revenue, AGM Insured) | | | 5.00 | | | | 2-1-2031 | | | | 3,000,000 | | | | 3,376,080 | |
Pittsburgh PA (GO, Build America Mutual Assurance Company Insured) | | | 5.00 | | | | 9-1-2030 | | | | 500,000 | | | | 591,180 | |
Pittsburgh PA Public Parking Authority Series A (Miscellaneous Revenue, National Insured) | | | 5.00 | | | | 12-1-2025 | | | | 2,500,000 | | | | 2,580,600 | |
Schuylkill Valley PA School District (GO) | | | 4.00 | | | | 4-1-2023 | | | | 1,000,000 | | | | 1,112,380 | |
Schuylkill Valley PA School District (GO) | | | 4.00 | | | | 4-1-2024 | | | | 370,000 | | | | 409,168 | |
Southcentral PA General Authority Refunding Bond Wellspan Health Obligation Group Series A (Health Revenue) | | | 5.00 | | | | 6-1-2024 | | | | 310,000 | | | | 370,400 | |
Southeastern Pennsylvania Transportation Authority (Miscellaneous Revenue) | | | 5.00 | | | | 6-1-2028 | | | | 4,000,000 | | | | 4,521,000 | |
State Public School Building Authority Pennsylvania Chester Upland School Project Series C (Miscellaneous Revenue, AGM Insured) | | | 5.00 | | | | 9-15-2026 | | | | 875,000 | | | | 984,200 | |
State Public School Building Authority Pennsylvania Harrisburg Project Series B-2 (Miscellaneous Revenue, Build America Mutual Assurance Company Insured) | | | 5.00 | | | | 12-1-2027 | | | | 1,010,000 | | | | 1,185,286 | |
State Public School Building Authority Pennsylvania Northampton County Area Community College Project (Education Revenue) | | | 5.50 | | | | 3-1-2031 | | | | 5,000,000 | | | | 5,839,650 | |
State Public School Building Authority Pennsylvania Northampton County Area Community College Project Series A (Education Revenue, Build America Mutual Assurance Company Insured) | | | 5.00 | | | | 6-15-2027 | | | | 1,610,000 | | | | 1,836,575 | |
University Area Joint Authority Pennsylvania Refunding Bond (Water & Sewer Revenue) ± | | | 0.44 | | | | 11-1-2028 | | | | 1,500,000 | | | | 1,500,915 | |
Wilkes-Barre PA Finance Authority University of Scranton (Education Revenue) | | | 5.00 | | | | 11-1-2020 | | | | 1,005,000 | | | | 1,164,966 | |
Wilkes-Barre PA Finance Authority Wilkes University Project (Education Revenue) | | | 5.00 | | | | 3-1-2027 | | | | 2,600,000 | | | | 2,764,239 | |
| | | | |
| | | | | | | | | | | | | | | 169,248,336 | |
| | | | | | | | | | | | | | | | |
| | | | |
| Virgin Islands: 1.27% | | | | | | | | | | | | | | | | |
Virgin Islands PFA Matching Fund Loan Note Senior Lien Series A (Miscellaneous Revenue, AGM Insured) | | | 5.00 | | | | 10-1-2029 | | | | 2,000,000 | | | | 2,278,820 | |
| | | | | | | | | | | | | | | | |
| | | | |
Total Municipal Obligations (Cost $163,342,999) | | | | | | | | | | | | | | | 175,385,901 | |
| | | | | | | | | | | | | | | | |
| | | | |
| | | Yield | | | | | | Shares | | | | |
| Short-Term Investments: 1.00% | | | | | | | | | | | | | | | | |
| | | | |
| Investment Companies: 1.00% | | | | | | | | | | | | | | | | |
Wells Fargo Advantage National Tax-Free Money Market Fund, Institutional Class (l)(u) | | | 0.01 | | | | | | | | 1,796,185 | | | | 1,796,185 | |
| | | | | | | | | | | | | | | | |
| | | | |
Total Short-Term Investments (Cost $1,796,185) | | | | | | | | | | | | | | | 1,796,185 | |
| | | | | | | | | | | | | | | | |
| | | | | | | | |
| Total investments in securities (Cost $165,139,184) * | | | 98.98 | % | | | 177,182,086 | |
Other assets and liabilities, net | | | 1.02 | | | | 1,829,499 | |
| | | | | | | | |
| Total net assets | | | 100.00 | % | | $ | 179,011,585 | |
| | | | | | | | |
The accompanying notes are an integral part of these financial statements.
| | | | |
| 10 | | Wells Fargo Advantage Pennsylvania Tax-Free Fund | | Portfolio of investments—December 31, 2014 (unaudited) |
| ø | Variable rate demand notes are subject to a demand feature which reduces the effective maturity. The maturity date shown represents the final maturity date of the security. The interest rate is determined and reset by the issuer daily, weekly, or monthly depending upon the terms of the security. The rate shown is the rate in effect at period end. |
| 144A | The security may be resold in transactions exempt from registration, normally to qualified institutional buyers, pursuant to Rule 144A under the Securities Act of 1933. |
| ¤ | The security is issued in zero coupon form with no periodic interest payments. |
| ± | Variable rate investment. The rate shown is the rate in effect at period end. |
| (l) | The security represents an affiliate of the Fund as defined in the Investment Company Act of 1940. |
| (u) | The rate represents the 7-day annualized yield at period end. |
| * | Cost for federal income tax purposes is $165,312,231 and unrealized gains (losses) consists of: |
| | | | |
Gross unrealized gains | | $ | 12,052,229 | |
Gross unrealized losses | | | (182,374 | ) |
| | | | |
Net unrealized gains | | $ | 11,869,855 | |
The accompanying notes are an integral part of these financial statements.
| | | | | | |
| Statement of assets and liabilities—December 31, 2014 (unaudited) | | Wells Fargo Advantage Pennsylvania Tax-Free Fund | | | 11 | |
| | | | |
| | | | |
| |
Assets | | | | |
Investments | | | | |
In unaffiliated securities, at value (cost $163,342,999) | | $ | 175,385,901 | |
In affiliated securities, at value (cost $1,796,185) | | | 1,796,185 | |
| | | | |
Total investments, at value (cost $165,139,184) | | | 177,182,086 | |
Receivable for investments sold | | | 200,000 | |
Receivable for Fund shares sold | | | 109,439 | |
Receivable for interest | | | 2,039,597 | |
Prepaid expenses and other assets | | | 34,883 | |
| | | | |
Total assets | | | 179,566,005 | |
| | | | |
| |
Liabilities | | | | |
Dividends payable | | | 330,634 | |
Payable for Fund shares redeemed | | | 87,709 | |
Advisory fee payable | | | 39,470 | |
Distribution fees payable | | | 8,735 | |
Administration fees payable | | | 24,534 | |
Accrued expenses and other liabilities | | | 63,338 | |
| | | | |
Total liabilities | | | 554,420 | |
| | | | |
Total net assets | | $ | 179,011,585 | |
| | | | |
| |
NET ASSETS CONSIST OF | | | | |
Paid-in capital | | $ | 178,902,317 | |
Overdistributed net investment income | | | (345,468 | ) |
Accumulated net realized losses on investments | | | (11,588,166 | ) |
Net unrealized gains on investments | | | 12,042,902 | |
| | | | |
Total net assets | | $ | 179,011,585 | |
| | | | |
| |
COMPUTATION OF NET ASSET VALUE AND OFFERING PRICE PER SHARE | | | | |
Net assets – Class A | | $ | 45,222,596 | |
Shares outstanding – Class A1 | | | 3,808,512 | |
Net asset value per share – Class A | | | $11.87 | |
Maximum offering price per share – Class A2 | | | $12.43 | |
Net assets – Class B | | $ | 773,854 | |
Shares outstanding – Class B1 | | | 65,413 | |
Net asset value per share – Class B | | | $11.83 | |
Net assets – Class C | | $ | 12,551,269 | |
Shares outstanding – Class C1 | | | 1,059,004 | |
Net asset value per share – Class C | | | $11.85 | |
Net assets – Institutional Class | | $ | 120,463,866 | |
Shares outstanding – Institutional Class1 | | | 10,145,000 | |
Net asset value per share – Institutional Class | | | $11.87 | |
| 1. | The Fund has an unlimited number of authorized shares. |
| 2. | Maximum offering price is computed as 100/95.50 of net asset value. On investments of $50,000 or more, the offering price is reduced. |
The accompanying notes are an integral part of these financial statements.
| | | | |
| 12 | | Wells Fargo Advantage Pennsylvania Tax-Free Fund | | Statement of operations—six months ended December 31, 2014 (unaudited) |
| | | | |
| | | | |
| |
Investment income | | | | |
Interest | | $ | 3,846,105 | |
Income from affiliated securities | | | 345 | |
| | | | |
Total investment income | | | 3,846,450 | |
| | | | |
| |
Expenses | | | | |
Advisory fee | | | 316,636 | |
Administration fees | | | | |
Fund level | | | 45,234 | |
Class A | | | 36,600 | |
Class B | | | 658 | |
Class C | | | 9,742 | |
Institutional Class | | | 48,874 | |
Shareholder servicing fees | | | | |
Class A | | | 57,188 | |
Class B | | | 1,029 | |
Class C | | | 15,222 | |
Distribution fees | | | | |
Class B | | | 3,086 | |
Class C | | | 45,667 | |
Custody and accounting fees | | | 8,454 | |
Professional fees | | | 22,822 | |
Registration fees | | | 27,297 | |
Shareholder report expenses | | | 10,453 | |
Trustees’ fees and expenses | | | 6,270 | |
Other fees and expenses | | | 6,090 | |
| | | | |
Total expenses | | | 661,322 | |
Less: Fee waivers and/or expense reimbursements | | | (95,840 | ) |
| | | | |
Net expenses | | | 565,482 | |
| | | | |
Net investment income | | | 3,280,968 | |
| | | | |
| |
REALIZED AND UNREALIZED GAINS (LOSSES) ON INVESTMENTS | | | | |
Net realized gains on investments | | | 512,010 | |
Net change in unrealized gains (losses) on investments | | | 2,921,729 | |
| | | | |
Net realized and unrealized gains (losses) on investments | | | 3,433,739 | |
| | | | |
Net increase in net assets resulting from operations | | $ | 6,714,707 | |
| | | | |
The accompanying notes are an integral part of these financial statements.
| | | | | | |
| Statement of changes in net assets | | Wells Fargo Advantage Pennsylvania Tax-Free Fund | | | 13 | |
| | | | | | | | | | | | | | | | |
| | | Six months ended December 31, 2014 (unaudited) | | | Year ended June 30, 2014 | |
| | | | |
Operations | | | | | | | | | | | | | | | | |
Net investment income | | | | | | $ | 3,280,968 | | | | | | | $ | 6,991,885 | |
Net realized gains (losses) on investments | | | | | | | 512,010 | | | | | | | | (674,589 | ) |
Net change in unrealized gains (losses) on investments | | | | | | | 2,921,729 | | | | | | | | 4,617,829 | |
| | | | |
Net increase in net assets resulting from operations | | | | | | | 6,714,707 | | | | | | | | 10,935,125 | |
| | | | |
| | | | |
Distributions to shareholders from | | | | | | | | | | | | | | | | |
Net investment income | | | | | | | | | | | | | | | | |
Class A | | | | | | | (803,436 | ) | | | | | | | (1,584,280 | ) |
Class B | | | | | | | (11,358 | ) | | | | | | | (31,103 | ) |
Class C | | | | | | | (167,912 | ) | | | | | | | (302,373 | ) |
Institutional Class | | | | | | | (2,298,263 | ) | | | | | | | (5,074,306 | ) |
| | | | |
Total distributions to shareholders | | | | | | | (3,280,969 | ) | | | | | | | (6,992,062 | ) |
| | | | |
| | | | |
Capital share transactions | | | Shares | | | | | | | | Shares | | | | | |
Proceeds from shares sold | | | | | | | | | | | | | | | | |
Class A | | | 223,157 | | | | 2,629,521 | | | | 569,888 | | | | 6,480,281 | |
Class B | | | 94 | | | | 1,089 | | | | 1,288 | | | | 14,164 | |
Class C | | | 159,319 | | | | 1,874,338 | | | | 265,432 | | | | 3,002,468 | |
Institutional Class | | | 401,689 | | | | 4,725,236 | | | | 519,236 | | | | 5,896,508 | |
| | | | |
| | | | | | | 9,230,184 | | | | | | | | 15,393,421 | |
| | | | |
Reinvestment of distributions | | | | | | | | | | | | | | | | |
Class A | | | 59,748 | | | | 704,996 | | | | 121,708 | | | | 1,384,148 | |
Class B | | | 929 | | | | 10,915 | | | | 2,651 | | | | 29,976 | |
Class C | | | 12,614 | | | | 148,601 | | | | 23,649 | | | | 268,452 | |
Institutional Class | | | 37,643 | | | | 444,227 | | | | 66,052 | | | | 751,638 | |
| | | | |
| | | | | | | 1,308,739 | | | | | | | | 2,434,214 | |
| | | | |
Payment for shares redeemed | | | | | | | | | | | | | | | | |
Class A | | | (294,987 | ) | | | (3,475,893 | ) | | | (669,302 | ) | | | (7,569,459 | ) |
Class B | | | (10,171 | ) | | | (119,235 | ) | | | (50,976 | ) | | | (574,126 | ) |
Class C | | | (75,607 | ) | | | (892,732 | ) | | | (190,180 | ) | | | (2,139,704 | ) |
Institutional Class | | | (534,789 | ) | | | (6,306,347 | ) | | | (3,427,664 | ) | | | (38,680,629 | ) |
| | | | |
| | | | | | | (10,794,207 | ) | | | | | | | (48,963,918 | ) |
| | | | |
Net decrease in net assets resulting from capital share transactions | | | | | | | (255,284 | ) | | | | | | | (31,136,283 | ) |
| | | | |
Total increase (decrease) in net assets | | | | | | | 3,178,454 | | | | | | | | (27,193,220 | ) |
| | | | |
| | | | |
Net assets | | | | | | | | | | | | | | | | |
Beginning of period | | | | | | | 175,833,131 | | | | | | | | 203,026,351 | |
| | | | |
End of period | | | | | | $ | 179,011,585 | | | | | | | $ | 175,833,131 | |
| | | | |
Overdistributed net investment income | | | | | | $ | (345,468 | ) | | | | | | $ | (345,467 | ) |
| | | | |
The accompanying notes are an integral part of these financial statements.
| | | | |
| 14 | | Wells Fargo Advantage Pennsylvania Tax-Free Fund | | Financial highlights |
(For a share outstanding throughout each period)
| | | | | | | | | | | | | | | | | | | | | | | | | | | | |
| | | Six months ended
December 31, 2014
(unaudited) | | | Year ended June 30 | | | Year ended March 31 | |
| CLASS A | | | 2014 | | | 2013 | | | 2012 | | | 20111 | | | 20112 | | | 20102 | |
Net asset value, beginning of period | | | $11.65 | | | | $11.36 | | | | $11.65 | | | | $10.93 | | | | $10.63 | | | | $10.90 | | | | $9.95 | |
Net investment income | | | 0.21 | | | | 0.43 | | | | 0.42 | | | | 0.44 | | | | 0.11 | | | | 0.44 | | | | 0.46 | |
Net realized and unrealized gains (losses) on investments | | | 0.22 | | | | 0.29 | | | | (0.29 | ) | | | 0.72 | | | | 0.30 | | | | (0.28 | ) | | | 0.95 | |
| | | | | | | | | | | | | | | | | | | | | | | | | | | | |
Total from investment operations | | | 0.43 | | | | 0.72 | | | | 0.13 | | | | 1.16 | | | | 0.41 | | | | 0.16 | | | | 1.41 | |
Distributions to shareholders from | | | | | | | | | | | | | | | | | | | | | | | | | | | | |
Net investment income | | | (0.21 | ) | | | (0.43 | ) | | | (0.42 | ) | | | (0.44 | ) | | | (0.11 | ) | | | (0.43 | ) | | | (0.46 | ) |
Net asset value, end of period | | | $11.87 | | | | $11.65 | | | | $11.36 | | | | $11.65 | | | | $10.93 | | | | $10.63 | | | | $10.90 | |
Total return3 | | | 3.70 | % | | | 6.45 | % | | | 1.02 | % | | | 10.81 | % | | | 3.84 | % | | | 1.56 | % | | | 14.41 | % |
Ratios to average net assets (annualized) | | | | | | | | | | | | | | | | | | | | | | | | | | | | |
Gross expenses | | | 0.90 | % | | | 0.91 | %4 | | | 0.88 | %4 | | | 0.88 | %4 | | | 0.87 | %4 | | | 0.84 | %4 | | | 0.76 | %4 |
Net expenses | | | 0.74 | % | | | 0.74 | %4 | | | 0.75 | %4 | | | 0.74 | %4 | | | 0.74 | %4 | | | 0.75 | %4 | | | 0.76 | %4 |
Net investment income | | | 3.51 | % | | | 3.75 | % | | | 3.55 | % | | | 3.90 | % | | | 3.98 | % | | | 3.99 | % | | | 4.35 | % |
Supplemental data | | | | | | | | | | | | | | | | | | | | | | | | | | | | |
Portfolio turnover rate | | | 8 | % | | | 15 | % | | | 14 | % | | | 21 | % | | | 10 | % | | | 46 | % | | | 45 | % |
Net assets, end of period (000s omitted) | | | $45,223 | | | | $44,500 | | | | $43,167 | | | | $45,178 | | | | $43,188 | | | | $41,832 | | | | $48,762 | |
| 1. | For the three months ended June 30, 2011. The Fund changed its fiscal year end from March 31 to June 30, effective June 30, 2011. |
| 2. | After the close of business on July 9, 2010, the Fund acquired the net assets of Evergreen Pennsylvania Municipal Bond Fund which became the accounting and performance survivor in the transaction. The information for the periods prior to July 12, 2010 is that of Class A of Evergreen Pennsylvania Municipal Bond Fund. |
| 3. | Total return calculations do not include any sales charges. Returns for periods of less than one year are not annualized. |
| 4. | Ratios include interest and fee expense relating to inverse floating-rate obligations as follows: |
| | | | |
Year ended June 30, 2014 | | | 0.00 | % |
Year ended June 30, 2013 | | | 0.01 | % |
Year ended June 30, 2012 | | | 0.00 | % |
Year ended June 30, 20111 | | | 0.01 | % |
Year ended March 31, 20112 | | | 0.01 | % |
Year ended March 31, 20102 | | | 0.00 | % |
The accompanying notes are an integral part of these financial statements.
| | | | | | |
| Financial highlights | | Wells Fargo Advantage Pennsylvania Tax-Free Fund | | | 15 | |
(For a share outstanding throughout each period)
| | | | | | | | | | | | | | | | | | | | | | | | | | | | |
| | | Six months ended
December 31, 2014
(unaudited) | | | Year ended June 30 | | | Year ended March 31 | |
| CLASS B | | | 2014 | | | 2013 | | | 2012 | | | 20111 | | | 20112 | | | 20102 | |
Net asset value, beginning of period | | | $11.60 | | | | $11.32 | | | | $11.61 | | | | $10.89 | | | | $10.59 | | | | $10.86 | | | | $9.91 | |
Net investment income | | | 0.16 | 3 | | | 0.34 | 3 | | | 0.33 | 3 | | | 0.36 | 3 | | | 0.09 | 3 | | | 0.35 | 3 | | | 0.38 | 3 |
Net realized and unrealized gains (losses) on investments | | | 0.23 | | | | 0.28 | | | | (0.29 | ) | | | 0.72 | | | | 0.30 | | | | (0.27 | ) | | | 0.95 | |
| | | | | | | | | | | | | | | | | | | | | | | | | | | | |
Total from investment operations | | | 0.39 | | | | 0.62 | | | | 0.04 | | | | 1.08 | | | | 0.39 | | | | 0.08 | | | | 1.33 | |
Distributions to shareholders from | | | | | | | | | | | | | | | | | | | | | | | | | | | | |
Net investment income | | | (0.16 | ) | | | (0.34 | ) | | | (0.33 | ) | | | (0.36 | ) | | | (0.09 | ) | | | (0.35 | ) | | | (0.38 | ) |
Net asset value, end of period | | | $11.83 | | | | $11.60 | | | | $11.32 | | | | $11.61 | | | | $10.89 | | | | $10.59 | | | | $10.86 | |
Total return4 | | | 3.41 | % | | | 5.58 | % | | | 0.26 | % | | | 10.01 | % | | | 3.66 | % | | | 0.80 | % | | | 13.60 | % |
Ratios to average net assets (annualized) | | | | | | | | | | | | | | | | | | | | | | | | | | | | |
Gross expenses | | | 1.65 | % | | | 1.66 | %5 | | | 1.63 | %5 | | | 1.62 | %5 | | | 1.62 | %5 | | | 1.60 | %5 | | | 1.51 | %5 |
Net expenses | | | 1.49 | % | | | 1.49 | %5 | | | 1.50 | %5 | | | 1.49 | %5 | | | 1.49 | %5 | | | 1.50 | %5 | | | 1.51 | %5 |
Net investment income | | | 2.76 | % | | | 3.00 | % | | | 2.80 | % | | | 3.15 | % | | | 3.22 | % | | | 3.23 | % | | | 3.63 | % |
Supplemental data | | | | | | | | | | | | | | | | | | | | | | | | | | | | |
Portfolio turnover rate | | | 8 | % | | | 15 | % | | | 14 | % | | | 21 | % | | | 10 | % | | | 46 | % | | | 45 | % |
Net assets, end of period (000s omitted) | | | $774 | | | | $865 | | | | $1,377 | | | | $2,264 | | | | $3,956 | | | | $4,932 | | | | $7,573 | |
| 1. | For the three months ended June 30, 2011. The Fund changed its fiscal year end from March 31 to June 30, effective June 30, 2011. |
| 2. | After the close of business on July 9, 2010, the Fund acquired the net assets of Evergreen Pennsylvania Municipal Bond Fund which became the accounting and performance survivor in the transaction. The information for the periods prior to July 12, 2010 is that of Class B of Evergreen Pennsylvania Municipal Bond Fund. |
| 3. | Calculated based upon average shares outstanding |
| 4. | Total return calculations do not include any sales charges. Returns for periods of less than one year are not annualized. |
| 5. | Ratios include interest and fee expense relating to inverse floating-rate obligations as follows: |
| | | | |
Year ended June 30, 2014 | | | 0.00 | % |
Year ended June 30, 2013 | | | 0.01 | % |
Year ended June 30, 2012 | | | 0.00 | % |
Year ended June 30, 20111 | | | 0.01 | % |
Year ended March 31, 20112 | | | 0.01 | % |
Year ended March 31, 20102 | | | 0.00 | % |
The accompanying notes are an integral part of these financial statements.
| | | | |
| 16 | | Wells Fargo Advantage Pennsylvania Tax-Free Fund | | Financial highlights |
(For a share outstanding throughout each period)
| | | | | | | | | | | | | | | | | | | | | | | | | | | | |
| | | Six months ended
December 31, 2014
(unaudited) | | | Year ended June 30 | | | Year ended March 31 | |
| CLASS C | | | 2014 | | | 2013 | | | 2012 | | | 20111 | | | 20112 | | | 20102 | |
Net asset value, beginning of period | | | $11.63 | | | | $11.34 | | | | $11.63 | | | | $10.91 | | | | $10.61 | | | | $10.88 | | | | $9.93 | |
Net investment income | | | 0.16 | 3 | | | 0.34 | | | | 0.33 | | | | 0.36 | | | | 0.09 | | | | 0.35 | | | | 0.38 | |
Net realized and unrealized gains (losses) on investments | | | 0.22 | | | | 0.29 | | | | (0.29 | ) | | | 0.72 | | | | 0.30 | | | | (0.27 | ) | | | 0.95 | |
| | | | | | | | | | | | | | | | | | | | | | | | | | | | |
Total from investment operations | | | 0.38 | | | | 0.63 | | | | 0.04 | | | | 1.08 | | | | 0.39 | | | | 0.08 | | | | 1.33 | |
Distributions to shareholders from | | | | | | | | | | | | | | | | | | | | | | | | | | | | |
Net investment income | | | (0.16 | ) | | | (0.34 | ) | | | (0.33 | ) | | | (0.36 | ) | | | (0.09 | ) | | | (0.35 | ) | | | (0.38 | ) |
Net asset value, end of period | | | $11.85 | | | | $11.63 | | | | $11.34 | | | | $11.63 | | | | $10.91 | | | | $10.61 | | | | $10.88 | |
Total return4 | | | 3.32 | % | | | 5.67 | % | | | 0.27 | % | | | 9.99 | % | | | 3.65 | % | | | 0.80 | % | | | 13.58 | % |
Ratios to average net assets (annualized) | | | | | | | | | | | | | | | | | | | | | | | | | | | | |
Gross expenses | | | 1.65 | % | | | 1.66 | %5 | | | 1.63 | %5 | | | 1.63 | %5 | | | 1.62 | %5 | | | 1.59 | %5 | | | 1.51 | %5 |
Net expenses | | | 1.49 | % | | | 1.49 | %5 | | | 1.50 | %5 | | | 1.49 | %5 | | | 1.49 | %5 | | | 1.50 | %5 | | | 1.51 | %5 |
Net investment income | | | 2.76 | % | | | 3.00 | % | | | 2.79 | % | | | 3.15 | % | | | 3.23 | % | | | 3.23 | % | | | 3.61 | % |
Supplemental data | | | | | | | | | | | | | | | | | | | | | | | | | | | | |
Portfolio turnover rate | | | 8 | % | | | 15 | % | | | 14 | % | | | 21 | % | | | 10 | % | | | 46 | % | | | 45 | % |
Net assets, end of period (000s omitted) | | | $12,551 | | | | $11,192 | | | | $9,798 | | | | $9,815 | | | | $8,331 | | | | $8,118 | | | | $9,020 | |
| 1. | For the three months ended June 30, 2011. The Fund changed its fiscal year end from March 31 to June 30, effective June 30, 2011. |
| 2. | After the close of business on July 9, 2010, the Fund acquired the net assets of Evergreen Pennsylvania Municipal Bond Fund which became the accounting and performance survivor in the transaction. The information for the periods prior to July 12, 2010 is that of Class C of Evergreen Pennsylvania Municipal Bond Fund. |
| 3. | Calculated based upon average shares outstanding |
| 4. | Total return calculations do not include any sales charges. Returns for periods of less than one year are not annualized. |
| 5. | Ratios include interest and fee expense relating to inverse floating-rate obligations as follows: |
| | | | |
Year ended June 30, 2014 | | | 0.00 | % |
Year ended June 30, 2013 | | | 0.01 | % |
Year ended June 30, 2012 | | | 0.00 | % |
Year ended June 30, 20111 | | | 0.01 | % |
Year ended March 31, 20112 | | | 0.01 | % |
Year ended March 31, 20102 | | | 0.00 | % |
The accompanying notes are an integral part of these financial statements.
| | | | | | |
| Financial highlights | | Wells Fargo Advantage Pennsylvania Tax-Free Fund | | | 17 | |
(For a share outstanding throughout each period)
| | | | | | | | | | | | | | | | | | | | | | | | | | | | |
| | | Six months ended
December 31, 2014
(unaudited) | | | Year ended June 30 | | | Year ended March 31 | |
| INSTITUTIONAL CLASS | | | 2014 | | | 2013 | | | 2012 | | | 20111 | | | 20112 | | | 20102 | |
Net asset value, beginning of period | | | $11.65 | | | | $11.36 | | | | $11.65 | | | | $10.93 | | | | $10.63 | | | | $10.90 | | | | $9.95 | |
Net investment income | | | 0.22 | | | | 0.45 | | | | 0.45 | 3 | | | 0.47 | | | | 0.11 | | | | 0.46 | | | | 0.49 | |
Net realized and unrealized gains (losses) on investments | | | 0.22 | | | | 0.29 | | | | (0.29 | ) | | | 0.72 | | | | 0.30 | | | | (0.27 | ) | | | 0.95 | |
| | | | | | | | | | | | | | | | | | | | | | | | | | | | |
Total from investment operations | | | 0.44 | | | | 0.74 | | | | 0.16 | | | | 1.19 | | | | 0.41 | | | | 0.19 | | | | 1.44 | |
Distributions to shareholders from | | | | | | | | | | | | | | | | | | | | | | | | | | | | |
Net investment income | | | (0.22 | ) | | | (0.45 | ) | | | (0.45 | ) | | | (0.47 | ) | | | (0.11 | ) | | | (0.46 | ) | | | (0.49 | ) |
Net asset value, end of period | | | $11.87 | | | | $11.65 | | | | $11.36 | | | | $11.65 | | | | $10.93 | | | | $10.63 | | | | $10.90 | |
Total return4 | | | 3.83 | % | | | 6.72 | % | | | 1.28 | % | | | 11.08 | % | | | 3.91 | % | | | 1.82 | % | | | 14.69 | % |
Ratios to average net assets (annualized) | | | | | | | | | | | | | | | | | | | | | | | | | | | | |
Gross expenses | | | 0.57 | % | | | 0.58 | %5 | | | 0.55 | %5 | | | 0.55 | %5 | | | 0.55 | %5 | | | 0.54 | %5 | | | 0.51 | %5 |
Net expenses | | | 0.49 | % | | | 0.49 | %5 | | | 0.50 | %5 | | | 0.49 | %5 | | | 0.49 | %5 | | | 0.50 | %5 | | | 0.51 | %5 |
Net investment income | | | 3.76 | % | | | 4.00 | % | | | 3.79 | % | | | 4.15 | % | | | 4.22 | % | | | 4.23 | % | | | 4.61 | % |
Supplemental data | | | | | | | | | | | | | | | | | | | | | | | | | | | | |
Portfolio turnover rate | | | 8 | % | | | 15 | % | | | 14 | % | | | 21 | % | | | 10 | % | | | 46 | % | | | 45 | % |
Net assets, end of period (000s omitted) | | | $120,464 | | | | $119,276 | | | | $148,684 | | | | $171,861 | | | | $212,341 | | | | $221,498 | | | | $290,586 | |
| 1. | For the three months ended June 30, 2011. The Fund changed its fiscal year end from March 31 to June 30, effective June 30, 2011. |
| 2. | After the close of business on July 9, 2010, the Fund acquired the net assets of Evergreen Pennsylvania Municipal Bond Fund which became the accounting and performance survivor in the transaction. The information for the periods prior to July 12, 2010 is that of Class I of Evergreen Pennsylvania Municipal Bond Fund. |
| 3. | Calculated based upon average shares outstanding |
| 4. | Returns for periods of less than one year are not annualized. |
| 5. | Ratios include interest and fee expense relating to inverse floating-rate obligations as follows: |
| | | | |
Year ended June 30, 2014 | | | 0.00 | % |
Year ended June 30, 2013 | | | 0.01 | % |
Year ended June 30, 2012 | | | 0.00 | % |
Year ended June 30, 20111 | | | 0.01 | % |
Year ended March 31, 20112 | | | 0.01 | % |
Year ended March 31, 20102 | | | 0.00 | % |
The accompanying notes are an integral part of these financial statements.
| | | | |
| 18 | | Wells Fargo Advantage Pennsylvania Tax-Free Fund | | Notes to financial statements (unaudited) |
1. ORGANIZATION
Wells Fargo Funds Trust (the “Trust”), a Delaware statutory trust organized on March 10, 1999, is an open-end management investment company registered under the Investment Company Act of 1940, as amended (the “1940 Act”). As an investment company, the Trust follows the accounting and reporting guidance in FASB Accounting Standards Codification 946. These financial statements report on the Wells Fargo Advantage Pennsylvania Tax-Free Fund (the “Fund”), a series of the Trust. Originally classified as non-diversified, the Fund now is classified as a diversified open-end management investment company.
2. SIGNIFICANT ACCOUNTING POLICIES
The following significant accounting policies, which are consistently followed in the preparation of the financial statements of the Fund, are in conformity with U.S. generally accepted accounting principles which require management to make estimates and assumptions that affect the reported amounts of assets and liabilities, disclosure of contingent assets and liabilities at the date of the financial statements, and the reported amounts of revenues and expenses during the reporting period. Actual results could differ from those estimates.
Securities valuation
All investments are valued each business day as of the close of regular trading on the New York Stock Exchange (generally 4 p.m. Eastern Time).
Fixed income securities acquired with maturities exceeding 60 days are valued based on evaluated bid prices provided by an independent pricing service which may utilize both transaction data and market information such as yield, quality, coupon rate, maturity, type of issue, trading characteristics and other market data. If prices are not available from the independent pricing service or prices received are deemed not representative of market value, prices will be obtained from an independent broker-dealer.
Short-term securities, with maturities of 60 days or less at time of purchase, generally are valued at amortized cost which approximates fair value. The amortized cost method involves valuing a security at its cost, plus accretion of discount or minus amortization of premium over the period until maturity.
Investments in registered open-end investment companies are valued at net asset value.
Investments which are not valued using any of the methods discussed above are valued at their fair value, as determined in good faith by the Board of Trustees of the Fund. The Board of Trustees has established a Valuation Committee comprised of the Trustees and has delegated to it the authority to take any actions regarding the valuation of portfolio securities that the Valuation Committee deems necessary or appropriate, including determining the fair value of portfolio securities, unless the determination has been delegated to the Management Valuation Team of Wells Fargo Funds Management, LLC (“Funds Management”). The Board of Trustees retains the authority to make or ratify any valuation decisions or approve any changes to the Valuation Procedures as it deems appropriate. On a quarterly basis, the Board of Trustees receives reports on any valuation actions taken by the Valuation Committee or the Management Valuation Team which may include items for ratification.
Valuations of fair valued securities are compared to the next actual sales price when available, or other appropriate market values, to assess the continued appropriateness of the fair valuation methodologies used. These securities are fair valued on a day-to-day basis, taking into consideration changes to appropriate market information and any significant changes to the inputs considered in the valuation process until there is a readily available price provided on an exchange or by an independent pricing service. Valuations received from an independent pricing service or independent broker-dealer quotes are periodically validated by comparisons to most recent trades and valuations provided by other independent pricing services in addition to the review of prices by the adviser and/or subadviser. Unobservable inputs used in determining fair valuations are identified based on the type of security, taking into consideration factors utilized by market participants in valuing the investment, knowledge about the issuer and the current market environment.
When-issued transactions
The Fund may purchase securities on a forward commitment or when-issued basis. The Fund records a when-issued transaction on the trade date and will segregate assets in an amount at least equal in value to the Fund’s commitment to purchase when-issued securities. Securities purchased on a when-issued basis are marked-to-market daily and the Fund begins earning interest on the settlement date. Losses may arise due to changes in the market value of the underlying securities or if the counterparty does not perform under the contract.
Inverse floating-rate obligations
The Fund may participate in inverse floating-rate obligation (“Inverse Floater”) structures whereby a fixed-rate bond
| | | | | | |
| Notes to financial statements (unaudited) | | Wells Fargo Advantage Pennsylvania Tax-Free Fund | | | 19 | |
(“Fixed-Rate Bond”) purchased by the Fund is transferred to a tender option bond trust (“TOB Trust”). The TOB Trust issues floating-rate notes (“Floating-Rate Notes”) to third-parties, which are collateralized by the Fixed-Rate Bond, and the Fund buys a residual interest in the TOB Trust’s assets and cash flows. The Inverse Floater held by the Fund gives the Fund the right (1) to cause the holders of the Floating-Rate Notes to tender their notes at par, and (2) to have the Fixed-Rate Bond held by the TOB Trust transferred back to the Fund, thereby collapsing the TOB Trust. The Fund accounts for the transaction described above as a secured borrowing by including the Fixed-Rate Bond in its Portfolio of Investments, and by recording the Floating-Rate Notes as a liability in the Statement of Assets and Liabilities. The Fund also records the interest paid on Floating-Rate Notes as interest expense. The Floating-Rate Notes have interest rates that generally reset weekly and their holders have the option to tender their notes for redemption at par at each reset date. Inverse Floaters held by the Fund are securities exempt from registration under Rule 144A of the Securities Act of 1933, as amended.
Security transactions and income recognition
Securities transactions are recorded on a trade date basis. Realized gains or losses are recorded on the basis of identified cost.
Interest income is accrued daily and bond discounts are accreted and premiums are amortized daily based on the effective interest method. To the extent debt obligations are placed on non-accrual status, any related interest income may be reduced by writing off interest receivables when the collection of all or a portion of interest has become doubtful based on consistently applied procedures. If the issuer subsequently resumes interest payments or when the collectability of interest is reasonably assured, the debt obligation is removed from non-accrual status.
Distributions to shareholders
Distributions to shareholders from net investment income are accrued daily and paid monthly. Distributions from net realized gains, if any, are recorded on the ex-dividend date. Such distributions are determined in conformity with federal income tax regulations, which may differ in amount or character from net investment income and realized gains recognized for purposes of U.S. generally accepted accounting principles.
Federal and other taxes
The Fund intends to continue to qualify as a regulated investment company by distributing substantially all of its investment company taxable and tax-exempt income and any net realized capital gains (after reduction for capital loss carryforwards) sufficient to relieve it from all, or substantially all, federal income taxes. Accordingly, no provision for federal income taxes was required.
The Fund’s income and federal excise tax returns and all financial records supporting those returns for the prior three fiscal years are subject to examination by the federal and Delaware revenue authorities. Management has analyzed the Fund’s tax positions taken on federal, state, and foreign tax returns for all open tax years and does not believe that there are any uncertain tax positions that require recognition of a tax liability.
As of June 30, 2014, capital loss carryforwards available to offset future net realized capital gains were as follows through the indicated expiration dates:
| | | | | | |
| | | | | | | No expiration |
| 2015 | | 2016 | | 2017 | | Short-term |
| $1,106,260 | | $4,324,935 | | $5,875,768 | | $620,164 |
Class allocations
The separate classes of shares offered by the Fund differ principally in applicable sales charges, distribution, shareholder servicing, and administration fees. Class specific expenses are charged directly to that share class. Investment income, common expenses, and realized and unrealized gains (losses) on investments are allocated daily to each class of shares based on the relative proportion of net assets of each class.
3. FAIR VALUATION MEASUREMENTS
Fair value measurements of investments are determined within a framework that has established a fair value hierarchy based upon the various data inputs utilized in determining the value of the Fund’s investments. The three-level hierarchy gives the highest priority to unadjusted quoted prices in active markets for identical assets or liabilities (Level 1) and the lowest priority to significant unobservable inputs (Level 3). The Fund’s investments are classified within the fair value hierarchy based on the lowest level of input that is significant to the fair value measurement. The inputs are summarized into three broad levels as follows:
| | | | |
| 20 | | Wells Fargo Advantage Pennsylvania Tax-Free Fund | | Notes to financial statements (unaudited) |
| n | | Level 1 – quoted prices in active markets for identical securities |
| n | | Level 2 – other significant observable inputs (including quoted prices for similar securities, interest rates, prepayment speeds, credit risk, use of amortized cost, etc.) |
| n | | Level 3 – significant unobservable inputs (including the Fund’s own assumptions in determining the fair value of investments) |
The inputs or methodologies used for valuing investments in securities are not necessarily an indication of the risk associated with investing in those securities.
The following is a summary of the inputs used in valuing the Fund’s assets and liabilities as of December 31, 2014:
| | | | | | | | | | | | | | | | |
| | | Quoted prices
(Level 1) | | | Other significant
observable inputs
(Level 2) | | | Significant
unobservable inputs
(Level 3) | | | Total | |
Assets | | | | | | | | | | | | | | | | |
Investments in: | | | | | | | | | | | | | | | | |
| | | | |
Municipal obligations | | $ | 0 | | | $ | 175,385,901 | | | $ | 0 | | | $ | 175,385,901 | |
| | | | |
Short-term investments | | | | | | | | | | | | | | | | |
Investment companies | | | 1,796,185 | | | | 0 | | | | 0 | | | $ | 1,796,185 | |
Total assets | | $ | 1,796,185 | | | $ | 175,385,901 | | | $ | 0 | | | $ | 177,182,086 | |
Transfers in and transfers out are recognized at the end of the reporting period. At December 31, 2014, the Fund did not have any transfers into/out of Level 1, Level 2, or Level 3.
4. TRANSACTIONS WITH AFFILIATES
Advisory fee
The Trust has entered into an advisory contract with Funds Management, an indirect wholly owned subsidiary of Wells Fargo & Company (“Wells Fargo”). The adviser is responsible for implementing investment policies and guidelines and for supervising the subadviser, who is responsible for day-to-day portfolio management of the Fund.
Pursuant to the contract, Funds Management is entitled to receive an annual advisory fee starting at 0.35% and declining to 0.25% as the average daily net assets of the Fund increase. For the six months ended December 31, 2014, the advisory fee was equivalent to an annual rate of 0.35% of the Fund’s average daily net assets.
Funds Management has retained the services of a subadviser to provide daily portfolio management to the Fund. The fee for subadvisory services is borne by Funds Management. Wells Capital Management Incorporated, an affiliate of Funds Management and an indirect wholly owned subsidiary of Wells Fargo, is the subadviser to the Fund and is entitled to receive a fee from Funds Management at an annual rate starting at 0.20% and declining to 0.10% as the average daily net assets of the Fund increase.
Administration fees
The Trust has entered into an administration agreement with Funds Management. Under this agreement, for providing administrative services, which includes paying fees and expenses for services provided by the transfer agent, sub-transfer agents, omnibus account servicers and record-keepers, Funds Management is entitled to receive from the Fund an annual fund level administration fee starting at 0.05% and declining to 0.03% as the average daily net assets of the Fund increase and a class level administration fee which is calculated based on the average daily net assets of each class as follows:
| | | | |
| | | Class level
administration fee | |
Class A, Class B, Class C | | | 0.16 | % |
Institutional Class | | | 0.08 | |
Funds Management has contractually waived and/or reimbursed advisory and administration fees to the extent necessary to maintain certain net operating expense ratios for the Fund. Waiver of fees and/or reimbursement of expenses by Funds Management were made first from fund level expenses on a proportionate basis and then from class specific expenses. Funds Management has committed through October 31, 2015 to waive fees and/or reimburse
| | | | | | |
| Notes to financial statements (unaudited) | | Wells Fargo Advantage Pennsylvania Tax-Free Fund | | | 21 | |
expenses to the extent necessary to cap the Fund’s expenses at 0.74% for Class A shares, 1.49% for Class B shares, 1.49% for Class C shares, and 0.49% for Institutional Class shares. After this time, the cap may be increased or the commitment to maintain the cap may be terminated only with the approval of the Board of Trustees.
Distribution fees
The Trust has adopted a Distribution Plan for Class B and Class C shares of the Fund pursuant to Rule 12b-1 under the 1940 Act. Distribution fees are charged to Class B and Class C shares and paid to Wells Fargo Funds Distributor, LLC (“Funds Distributor”), the principal underwriter, at an annual rate of 0.75% of the average daily net assets of Class B and Class C shares.
In addition, Funds Distributor is entitled to receive the front-end sales charge from the purchase of Class A shares and a contingent deferred sales charge on the redemption of certain shares. Funds Distributor is also entitled to receive the contingent deferred sales charges from redemptions of Class B and Class C shares. For the six months ended December 31, 2014, Funds Distributor received $5,746 from the sale of Class A shares.
Shareholder servicing fees
The Trust has entered into contracts with one or more shareholder servicing agents, whereby Class A, Class B, and Class C of the Fund is charged a fee at an annual rate of 0.25% of the average daily net assets of each respective class.
A portion of these total shareholder servicing fees were paid to affiliates of Wells Fargo.
5. INVESTMENT PORTFOLIO TRANSACTIONS
Purchases and sales of investments, excluding U.S. government obligations (if any) and short-term securities, for the six months ended December 31, 2014 were $13,595,839 and $14,780,070, respectively.
6. BANK BORROWINGS
The Trust (excluding the money market funds and certain other funds in the Trust) and Wells Fargo Variable Trust are parties to a $150,000,000 revolving credit agreement, whereby the Fund is permitted to use bank borrowings for temporary or emergency purposes, such as to fund shareholder redemption requests. Interest under the credit agreement is charged to the Fund based on a borrowing rate equal to the higher of the Federal Funds rate in effect on that day plus 1.25% or the overnight LIBOR rate in effect on that day plus 1.25%. In addition, an annual commitment fee equal to 0.10% of the unused balance is allocated to each participating fund. For the six months ended December 31, 2014, the Fund paid $98 in commitment fees.
For the six months ended December 31, 2014, there were no borrowings by the Fund under the agreement.
7. CONCENTRATION RISK
The Fund invests a substantial portion of its assets in issuers of municipal debt securities located in a single state or territories of the U.S. Therefore, it may be more affected by economic and political developments in that state or region than would be a comparable general tax-exempt fund.
8. INDEMNIFICATION
Under the Trust’s organizational documents, the officers and Trustees are indemnified against certain liabilities that may arise out of performance of their duties to the Trust. Additionally, in the normal course of business, the Trust may enter into contracts with service providers that contain a variety of indemnification clauses. The Trust’s maximum exposure under these arrangements is dependent on future claims that may be made against the Fund and, therefore, cannot be estimated.
| | | | |
| 22 | | Wells Fargo Advantage Pennsylvania Tax-Free Fund | | Other information (unaudited) |
PROXY VOTING INFORMATION
A description of the policies and procedures that the Fund uses to determine how to vote proxies relating to portfolio securities is available without charge, upon request, by calling 1-800-222-8222, visiting our website at wellsfargoadvantagefunds.com, or visiting the SEC website at sec.gov. Information regarding how the Fund voted proxies relating to portfolio securities during the most recent 12-month period ended June 30 is available on the Fund’s website at wellsfargoadvantagefunds.com or by visiting the SEC website at sec.gov.
PORTFOLIO HOLDINGS INFORMATION
The complete portfolio holdings for the Fund are publicly available monthly on the Fund’s website (wellsfargoadvantagefunds.com), on a one-month delayed basis. In addition, top ten holdings information (excluding derivative positions) for the Fund is publicly available on the Fund’s website on a monthly, seven-day or more delayed basis. The Fund files its complete schedule of portfolio holdings with the SEC for the first and third quarters of each fiscal year on Form N-Q, which is available by visiting the SEC website at sec.gov. In addition, the Fund’s Form N-Q may be reviewed and copied at the SEC’s Public Reference Room in Washington, DC, and at regional offices in New York City, at 233 Broadway, and in Chicago, at 175 West Jackson Boulevard, Suite 900. Information about the Public Reference Room may be obtained by calling 1-800-SEC-0330.
| | | | | | |
| Other information (unaudited) | | Wells Fargo Advantage Pennsylvania Tax-Free Fund | | | 23 | |
BOARD OF TRUSTEES AND OFFICERS
Each of the Trustees and Officers1 listed in the table below acts in identical capacities for each fund in the Wells Fargo Advantage family of funds, which consists of 134 mutual funds comprising the Wells Fargo Funds Trust, Wells Fargo Variable Trust, Wells Fargo Master Trust and four closed-end funds (collectively the “Fund Complex”). This table should be read in conjunction with the Prospectus and the Statement of Additional Information2. The mailing address of each Trustee and Officer is 525 Market Street, 12th Floor, San Francisco, CA 94105. Each Trustee and Officer serves an indefinite term, however, each Trustee serves such term until reaching the mandatory retirement age established by the Trustees.
Independent Trustees
| | | | | | |
Name and year of birth | | Position held and length of service* | | Principal occupations during past five years or longer | | Other directorships during
past five years |
| Peter G. Gordon (Born 1942) | | Trustee, since 1998; Chairman, since 2005 | | Co-Founder, Retired Chairman, President and CEO of Crystal Geyser Water Company. Trustee Emeritus, Colby College. | | Asset Allocation Trust |
| Isaiah Harris, Jr. (Born 1952) | | Trustee, since 2009 | | Retired. Prior thereto, President and CEO of BellSouth Advertising and Publishing Corp. from 2005 to 2007, President and CEO of BellSouth Enterprises from 2004 to 2005 and President of BellSouth Consumer Services from 2000 to 2003. Emeritus member of the Iowa State University Foundation Board of Governors. Emeritus Member of the Advisory Board of Iowa State University School of Business. Advisory Board Member, Palm Harbor Academy. Mr. Harris is a certified public accountant. | | CIGNA Corporation; Asset Allocation Trust |
| Judith M. Johnson (Born 1949) | | Trustee, since 2008; Audit Committee Chairman, since 2008 | | Retired. Prior thereto, Chief Executive Officer and Chief Investment Officer of Minneapolis Employees Retirement Fund from 1996 to 2008. Ms. Johnson is an attorney, certified public accountant and a certified managerial accountant. | | Asset Allocation Trust |
| Leroy Keith, Jr. (Born 1939) | | Trustee, since 2010** | | Chairman, Bloc Global Services (development and construction). Trustee of the Evergreen Funds complex (and its predecessors) from 1983 to 2010. Former Managing Director, Almanac Capital Management (commodities firm), former Partner, Stonington Partners, Inc. (private equity fund), former Director, Obagi Medical Products Co. and former Director, Lincoln Educational Services. | | Trustee, Virtus Fund Complex (consisting of 50 portfolios as of 12/16/2013); Asset Allocation Trust |
| David F. Larcker (Born 1950) | | Trustee, since 2009 | | James Irvin Miller Professor of Accounting at the Graduate School of Business, Stanford University, Morgan Stanley Director of the Center for Leadership Development and Research and Senior Faculty of The Rock Center for Corporate Governance since 2006. From 2005 to 2008, Professor of Accounting at the Graduate School of Business, Stanford University. Prior thereto, Ernst & Young Professor of Accounting at The Wharton School, University of Pennsylvania from 1985 to 2005. | | Asset Allocation Trust |
| Olivia S. Mitchell (Born 1953) | | Trustee, since 2006 | | International Foundation of Employee Benefit Plans Professor, Wharton School of the University of Pennsylvania since 1993. Director of Wharton’s Pension Research Council and Boettner Center on Pensions & Retirement Research, and Research Associate at the National Bureau of Economic Research. Previously, Cornell University Professor from 1978 to 1993. | | Asset Allocation Trust |
| Timothy J. Penny (Born 1951) | | Trustee, since 1996 | | President and CEO of Southern Minnesota Initiative Foundation, a non-profit organization, since 2007 and Senior Fellow at the Humphrey Institute Policy Forum at the University of Minnesota since 1995. Member of the Board of Trustees of NorthStar Education Finance, Inc., a non-profit organization, since 2007. | | Asset Allocation Trust |
| | | | |
| 24 | | Wells Fargo Advantage Pennsylvania Tax-Free Fund | | Other information (unaudited) |
| | | | | | |
Name and year of birth | | Position held and length of service* | | Principal occupations during past five years or longer | | Other directorships during
past five years |
| Michael S. Scofield (Born 1943) | | Trustee, since 2010 | | Served on the Investment Company Institute’s Board of Governors and Executive Committee from 2008-2011 as well the Governing Council of the Independent Directors Council from 2006-2011 and the Independent Directors Council Executive Committee from 2008-2011. Chairman of the IDC from 2008-2010. Institutional Investor (Fund Directions) Trustee of Year in 2007. Trustee of the Evergreen Funds complex (and its predecessors) from 1984 to 2010. Chairman of the Evergreen Funds from 2000-2010. Former Trustee of the Mentor Funds. Retired Attorney, Law Offices of Michael S. Scofield. | | Asset Allocation Trust |
| Donald C. Willeke (Born 1940) | | Trustee, since 1996 | | Principal of the law firm of Willeke & Daniels. General Counsel of the Minneapolis Employees Retirement Fund from 1984 until its consolidation into the Minnesota Public Employees Retirement Association on June 30, 2010. Director and Vice Chair of The Tree Trust (non-profit corporation). Director of the American Chestnut Foundation (non-profit corporation). | | Asset Allocation Trust |
| * | Length of service dates reflect the Trustee’s commencement of service with the Trust’s predecessor entities, where applicable. |
| ** | Leroy Keith, Jr. retired as a Trustee effective December 31, 2014. |
Officers
| | | | | | |
Name and year of birth | | Position held and
length of service | | Principal occupations during past five years or longer | | |
| Karla M. Rabusch (Born 1959) | | President, since 2003 | | Executive Vice President of Wells Fargo Bank, N.A. and President of Wells Fargo Funds Management, LLC since 2003. | | |
Nancy Wiser1
(Born 1967) | | Treasurer, since 2012 | | Executive Vice President of Wells Fargo Funds Management, LLC since 2011. Chief Operating Officer and Chief Compliance Officer at LightBox Capital Management LLC, from 2008 to 2011. Owned and operated a consulting business providing services to various hedge funds including acting as Chief Operating Officer and Chief Compliance Officer for a hedge fund from 2007 to 2008. Chief Operating Officer and Chief Compliance Officer of GMN Capital LLC from 2006 to 2007. | | |
| C. David Messman (Born 1960) | | Secretary, since 2000; Chief Legal Officer, since 2003 | | Assistant General Counsel of Wells Fargo Bank, N.A. since 2013 and Vice President and Managing Counsel of Wells Fargo Bank N.A. from 1996 to 2013. Senior Vice President and Secretary of Wells Fargo Funds Management , LLC since 2001. | | |
Debra Ann Early
(Born 1964) | | Chief Compliance Officer, since 2007 | | Senior Vice President of Wells Fargo Funds Management, LLC since 2007 and Chief Compliance Officer from 2007 to 2014. Chief Compliance Officer of Parnassus Investments from 2005 to 2007. Chief Financial Officer of Parnassus Investments from 2004 to 2007 and Senior Audit Manager of PricewaterhouseCoopers LLP from 1998 to 2004. | | |
David Berardi
(Born 1975) | | Assistant Treasurer, since 2009 | | Vice President of Wells Fargo Funds Management, LLC since 2009. Vice President of Evergreen Investment Management Company, LLC from 2008 to 2010. Assistant Vice President of Evergreen Investment Services, Inc. from 2004 to 2008. Manager of Fund Reporting and Control for Evergreen Investment Management Company, LLC from 2004 to 2010. | | |
| Jeremy DePalma1 (Born 1974) | | Assistant Treasurer, since 2009 | | Senior Vice President of Wells Fargo Funds Management, LLC since 2009. Senior Vice President of Evergreen Investment Management Company, LLC from 2008 to 2010. Vice President, Evergreen Investment Services, Inc. from 2004 to 2007. Head of the Fund Reporting and Control Team within Fund Administration from 2005 to 2010. | | |
| 1. | Nancy Wiser acts as Treasurer of 73 funds in the Fund Complex. Jeremy DePalma acts as Treasurer of 61 funds and Assistant Treasurer of 73 funds in the Fund Complex. |
| 2. | The Statement of Additional Information includes additional information about the Trustees and is available, without charge, upon request, by calling 1-800-222-8222 or by visiting the website at wellsfargoadvantagefunds.com. |
| | | | | | |
| List of abbreviations | | Wells Fargo Advantage Pennsylvania Tax-Free Fund | | | 25 | |
The following is a list of common abbreviations for terms and entities that may have appeared in this report.
| ACA | — ACA Financial Guaranty Corporation |
| ADR | — American depositary receipt |
| ADS | — American depositary shares |
| AGC | — Assured Guaranty Corporation |
| AGM | — Assured Guaranty Municipal |
| Ambac | — Ambac Financial Group Incorporated |
| AMT | — Alternative minimum tax |
| BAN | — Bond anticipation notes |
| BHAC | — Berkshire Hathaway Assurance Corporation |
| CAB | — Capital appreciation bond |
| CCAB | — Convertible capital appreciation bond |
| CDA | — Community Development Authority |
| CDO | — Collateralized debt obligation |
| DRIVER | — Derivative inverse tax-exempt receipts |
| DW&P | — Department of Water & Power |
| DWR | — Department of Water Resources |
| ECFA | — Educational & Cultural Facilities Authority |
| EDA | — Economic Development Authority |
| EDFA | — Economic Development Finance Authority |
| ETF | — Exchange-traded fund |
| FDIC | — Federal Deposit Insurance Corporation |
| FFCB | — Federal Farm Credit Banks |
| FGIC | — Financial Guaranty Insurance Corporation |
| FHA | — Federal Housing Administration |
| FHLB | — Federal Home Loan Bank |
| FHLMC | — Federal Home Loan Mortgage Corporation |
| FICO | — The Financing Corporation |
| FNMA | — Federal National Mortgage Association |
| GDR | — Global depositary receipt |
| GNMA | — Government National Mortgage Association |
| HCFR | — Healthcare facilities revenue |
| HEFA | — Health & Educational Facilities Authority |
| HEFAR | — Higher education facilities authority revenue |
| HFA | — Housing Finance Authority |
| HFFA | — Health Facilities Financing Authority |
| HUD | — Department of Housing and Urban Development |
| IDA | — Industrial Development Authority |
| IDAG | — Industrial Development Agency |
| KRW | — Republic of Korea won |
| LIBOR | — London Interbank Offered Rate |
| LLC | — Limited liability company |
| LLLP | — Limited liability limited partnership |
| LLP | — Limited liability partnership |
| MBIA | — Municipal Bond Insurance Association |
| MFHR | — Multifamily housing revenue |
| MSTR | — Municipal securities trust receipts |
| MUD | — Municipal Utility District |
| National | — National Public Finance Guarantee Corporation |
| PCFA | — Pollution Control Financing Authority |
| PCL | — Public Company Limited |
| PCR | — Pollution control revenue |
| PFA | — Public Finance Authority |
| PFFA | — Public Facilities Financing Authority |
| PFOTER | — Puttable floating option tax-exempt receipts |
| plc | — Public limited company |
| PUTTER | — Puttable tax-exempt receipts |
| R&D | — Research & development |
| Radian | — Radian Asset Assurance |
| RAN | — Revenue anticipation notes |
| RDA | — Redevelopment Authority |
| RDFA | — Redevelopment Finance Authority |
| REIT | — Real estate investment trust |
| ROC | — Reset option certificates |
| SAVRS | — Select auction variable rate securities |
| SBA | — Small Business Authority |
| SFHR | — Single-family housing revenue |
| SFMR | — Single-family mortgage revenue |
| SPA | — Standby purchase agreement |
| SPDR | — Standard & Poor’s Depositary Receipts |
| STRIPS | — Separate trading of registered interest and |
| TAN | — Tax anticipation notes |
| TIPS | — Treasury inflation-protected securities |
| TRAN | — Tax revenue anticipation notes |
| TTFA | — Transportation Trust Fund Authority |
| TVA | — Tennessee Valley Authority |
This page is intentionally left blank.
This page is intentionally left blank.
This page is intentionally left blank.


For more information
More information about Wells Fargo Advantage Funds is available free upon request. To obtain literature, please write, email, visit the Fund’s website, or call:
Wells Fargo Advantage Funds
P.O. Box 8266
Boston, MA 02266-8266
Email: wfaf@wellsfargo.com
Website: wellsfargoadvantagefunds.com
Individual investors: 1-800-222-8222
Retail investment professionals: 1-888-877-9275
Institutional investment professionals: 1-866-765-0778
This report and the financial statements contained herein are submitted for the general information of the shareholders of Wells Fargo Advantage Funds. If this report is used for promotional purposes, distribution of the report must be accompanied or preceded by a current prospectus. Before investing, please consider the investment objectives, risks, charges, and expenses of the investment. For a current prospectus and, if available, a summary prospectus, containing this information, call 1-800-222-8222 or visit the Fund’s website at wellsfargoadvantagefunds.com. Read the prospectus carefully before you invest or send money.
Wells Fargo Funds Management, LLC, a wholly owned subsidiary of Wells Fargo & Company, provides investment advisory and administrative services for Wells Fargo Advantage Funds. Other affiliates of Wells Fargo & Company provide subadvisory and other services for the Funds. The Funds are distributed by Wells Fargo Funds Distributor, LLC, Member FINRA/SIPC, an affiliate of Wells Fargo & Company.
NOT FDIC INSURED ¡ NO BANK GUARANTEE ¡ MAY LOSE VALUE
© 2014 Wells Fargo Funds Management, LLC. All rights reserved.
| | |
 | | 230429 02-15 SA255/SAR255 12-14 |

Wells Fargo Advantage
Short-Term Municipal Bond Fund

Semi-Annual Report
December 31, 2014

Reduce clutter. Save trees.
Sign up for electronic delivery of prospectuses and shareholder reports at wellsfargo.com/advantagedelivery
Contents
The views expressed and any forward-looking statements are as of December 31, 2014, unless otherwise noted, and are those of the Fund managers and/or Wells Fargo Funds Management, LLC. Discussions of individual securities, or the markets generally, or any Wells Fargo Advantage Fund are not intended as individual recommendations. Future events or results may vary significantly from those expressed in any forward-looking statements; the views expressed are subject to change at any time in response to changing circumstances in the market. Wells Fargo Funds Management, LLC, and the Funds disclaim any obligation to publicly update or revise any views expressed or forward-looking statements.
NOT FDIC INSURED ¡ NO BANK GUARANTEE ¡ MAY LOSE VALUE
| | | | |
| 2 | | Wells Fargo Advantage Short-Term Municipal Bond Fund | | Letter to shareholders (unaudited) |

Karla M. Rabusch
President
Wells Fargo Advantage Funds
Municipal bonds rose in the second half of 2014, helped by lower interest rates and strong demand for yield.
Dear Valued Shareholder:
We are pleased to provide you with this semi-annual report for the Wells Fargo Advantage Short-Term Municipal Bond Fund for the six-month period that ended December 31, 2014. Municipal bonds rose in the second half of 2014, helped by lower interest rates and strong demand for yield. In fact, the longest-dated and weakest credits had the strongest returns. Municipal bond returns—as measured by the Barclays Municipal Bond Index1, the broadest measure for tracking investment-grade municipal bonds throughout the country—gained 2.88% for the six-month period that ended December 31, 2014.
Longer-maturity and lower-rated municipal bonds outperformed.
At the front end of the yield curve, municipal bond yields were extremely low because of the accommodative monetary policy. Throughout the reporting period, the the U.S. Federal Reserve’s (Fed’s) monetary policymaking body kept its key interest rate near zero in order to support the economy and the financial system. Policymakers said they can be patient in normalizing monetary policy and that any increases in the target range for the federal funds rate will depend on incoming economic data. During the reporting period, the Fed reduced (or tapered) the size of its quantitative easing program each month until the program ended in October 2014, although it continues to reinvest principal and interest payments of the mortgage-backed securities and Treasury bonds it holds.
Longer-term yields declined during the second half of the year, with 10-year municipal yields declining from 2.33% as of June 30, 2014 to 2.10% as of December 31, 2014. For more perspective, the yield curve was steep on a historical basis at the beginning of the period and ended the period with the difference between 30-year and 2-year yields at 237 basis points (bps; 100 bps equals 1.00%), which was only slightly wider than its historical average. Because the yield curve was steep, longer-dated securities had higher yields. Given their longer maturities (as municipal yields fell further out the curve) and their more generous yields, longer-term bond returns outpaced shorter-term bonds.
Investors were also enticed to buy lower-rated securities for their higher yields. Over the six-month period that ended December 31, 2014, AAA-rated municipal bonds returned 2.04% while BBB-rated bonds returned 4.29%, according to the Barclays Municipal Bond Index. Credit conditions continued to improve, as evidenced by an 18th consecutive quarter of positive year-over-year gains in state and local municipal revenues. In addition to better fundamental credit conditions, technical factors of limited supply alongside strong investor demand also supported municipal bonds.
Puerto Rico’s struggle, the exit of two cities from bankruptcy, and pension issues topped credit news.
Puerto Rico was the asset class’s largest single credit story. Bonds from the commonwealth returned a meager 0.79% during the six-month period as population declines, a contracting economy, and a burdensome level of debt held back results. Meanwhile, the cities of Stockton, California, and Detroit, Michigan, exited bankruptcy by curbing retiree health care benefits and bondholder recoveries but largely avoiding concessions on pensions. While these recent bankruptcies have so far treated pensions better than bonded debt, no clear precedent has been established due to the difference in general obligation
| 1. | The Barclays Municipal Bond Index is an unmanaged index composed of long-term tax-exempt bonds with a minimum credit rating of Baa. You cannot invest directly in an index. |
| | | | | | |
| Letter to shareholders (unaudited) | | Wells Fargo Advantage Short-Term Municipal Bond Fund | | | 3 | |
pledges and court-ordered versus negotiated concessions. Finally, underfunded pensions in Illinois, New Jersey, Pennsylvania, and Kansas gained attention for their negative fiscal effects and the political difficulties of finding a resolution.
Don’t let short-term uncertainty derail long-term investment goals.
Periods of uncertainty can present challenges, but experience has taught us that maintaining long-term investment goals can be an effective way to plan for the future. To help you create a sound strategy based on your personal goals and risk tolerance, Wells Fargo Advantage Funds offers more than 100 mutual funds and other investments spanning a wide range of asset classes and investment styles. Although diversification cannot guarantee an investment profit or prevent losses, we believe it can be an effective way to manage investment risk and potentially smooth out overall portfolio performance. We encourage investors to know their investments and to understand that appropriate levels of risk-taking may unlock opportunities.
Thank you for choosing to invest with Wells Fargo Advantage Funds. We appreciate your confidence in us and remain committed to helping you meet your financial needs. For current information about your fund investments, contact your investment professional, visit our website at wellsfargoadvantagefunds.com, or call us directly at 1-800-222-8222. We are available 24 hours a day, 7 days a week.
Sincerely,

Karla M. Rabusch
President
Wells Fargo Advantage Funds
Periods of uncertainty can present challenges, but experience has taught us that maintaining long-term investment goals can be an effective way to plan for the future.
| | | | |
| 4 | | Wells Fargo Advantage Short-Term Municipal Bond Fund | | Performance highlights (unaudited) |
Investment objective
The Fund seeks current income exempt from federal income tax consistent with capital preservation.
Adviser
Wells Fargo Funds Management, LLC
Subadviser
Wells Capital Management Incorporated
Portfolio managers
Wendy Casetta
Lyle J. Fitterer, CFA, CPA
Average annual total returns1 (%) as of December 31, 2014
| | | | | | | | | | | | | | | | | | | | | | | | | | | | | | | | | | |
| | | | | Including sales charge | | | Excluding sales charge | | | Expense ratios2 (%) | |
| | | Inception date | | 1 year | | | 5 year | | | 10 year | | | 1 year | | | 5 year | | | 10 year | | | Gross | | | Net3 | |
| Class A (WSMAX) | | 7-18-2008 | | | (0.47 | ) | | | 1.68 | | | | 2.74 | | | | 1.56 | | | | 2.09 | | | | 2.94 | | | | 0.75 | | | | 0.60 | |
| Class C (WSSCX) | | 1-31-2003 | | | (0.20 | ) | | | 1.33 | | | | 2.12 | | | | 0.80 | | | | 1.33 | | | | 2.12 | | | | 1.50 | | | | 1.35 | |
| Administrator Class (WSTMX) | | 7-30-2010 | | | – | | | | – | | | | – | | | | 1.46 | | | | 2.09 | | | | 2.89 | | | | 0.69 | | | | 0.60 | |
| Institutional Class (WSBIX) | | 3-31-2008 | | | – | | | | – | | | | – | | | | 1.76 | | | | 2.29 | | | | 3.09 | | | | 0.42 | | | | 0.40 | |
| Investor Class (STSMX) | | 12-31-1991 | | | – | | | | – | | | | – | | | | 1.53 | | | | 2.06 | | | | 2.92 | | | | 0.78 | | | | 0.63 | |
| Barclays 1-3 Year Composite Municipal Bond Index4 | | – | | | – | | | | – | | | | – | | | | 0.90 | | | | 1.46 | | | | 2.59 | | | | – | | | | – | |
Figures quoted represent past performance, which is no guarantee of future results, and do not reflect taxes that a shareholder may pay on fund distributions or the redemption of fund shares. Investment return and principal value of an investment will fluctuate so that an investor’s shares, when redeemed, may be worth more or less than their original cost. Performance shown without sales charges would be lower if sales charges were reflected. Current performance may be lower or higher than the performance data quoted, which assumes the reinvestment of dividends and capital gains. Current month-end performance is available on the Fund’s website, wellsfargoadvantagefunds.com.
Index returns do not include transaction costs associated with buying and selling securities, any mutual fund fees or expenses, or any taxes. It is not possible to invest directly in an index.
For Class A shares, the maximum front-end sales charge is 2.00%. For Class C shares, the maximum contingent deferred sales charge is 1.00%. Performance including a contingent deferred sales charge assumes the sales charge for the corresponding time period. Administrator Class, Institutional Class, and Investor Class shares are sold without a front-end sales charge or contingent deferred sales charge.
Bond values fluctuate in response to the financial condition of individual issuers, general market and economic conditions, and changes in interest rates. Changes in market conditions and government policies may lead to periods of heightened volatility in the bond market and reduced liquidity for certain bonds held by the Fund. In general, when interest rates rise, bond values fall and investors may lose principal value. Interest-rate changes and their impact on the Fund and its share price can be sudden and unpredictable. The use of derivatives may reduce returns and/or increase volatility. Certain investment strategies tend to increase the total risk of an investment (relative to the broader market). The Fund is exposed to high-yield securities risk and municipal securities risk. Consult the Fund’s prospectus for additional information on these and other risks. A portion of the Fund’s income may be subject to federal, state, and/or local income taxes or the Alternative Minimum Tax (AMT). Any capital gains distributions may be taxable.
Please see footnotes on page 5.
| | | | | | |
| Performance highlights (unaudited) | | Wells Fargo Advantage Short-Term Municipal Bond Fund | | | 5 | |
|
| Credit quality distribution5 as of December 31, 2014 |
|
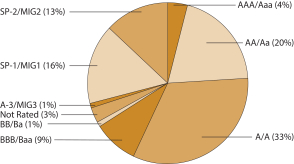 |
|
| Effective maturity distribution6 as of December 31, 2014 |
|
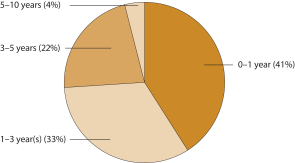 |
| 1. | Historical performance shown for Class A shares prior to their inception reflects the performance of Investor Class shares, and includes the higher expenses applicable to Investor Class shares (except during those periods in which expenses of Class A shares would have been higher than those of Investor Class shares, no such adjustment is reflected). If these expenses had not been included, returns would be higher. Historical performance shown for Administrator Class shares prior to their inception reflects the performance of Institutional Class shares, adjusted to reflect the higher expenses applicable to Administrator Class shares. Historical performance shown for Institutional Class shares prior to their inception reflects the performance of Investor Class shares, and includes the higher expenses applicable to Investor Class shares. If these expenses had not been included, returns would be higher. |
| 2. | Reflects the expense ratios as stated in the most recent prospectuses. The expense ratios shown are subject to change and may differ from the annualized expense ratios shown in the financial highlights of this report. |
| 3. | The Adviser has committed through October 31, 2015, to waive fees and/or reimburse expenses to the extent necessary to cap the Fund’s Total Annual Fund Operating Expenses After Fee Waiver, excluding certain expenses, at the amounts shown. After this time, the cap may be increased or the commitment to maintain the cap may be terminated only with the approval of the Board of Trustees. Brokerage commissions, stamp duty fees, interest, taxes, acquired fund fees and expenses, and extraordinary expenses are excluded from the cap. Without this cap, the Fund’s returns would have been lower. |
| 4. | The Barclays 1-3 Year Composite Municipal Bond Index is a blended index weighted 50% in the Barclays 1-Year Municipal Bond Index and 50% in the Barclays 3-Year Municipal Bond Index. You cannot invest directly in an index. |
| 5. | The credit quality distribution of portfolio holdings reflected in the chart is based on ratings from Standard & Poor’s, Moody’s Investors Service, and/or Fitch Ratings Ltd. Credit quality ratings apply to the underlying holdings of the Fund and not to the Fund itself. The percentages of the Fund’s portfolio with the ratings depicted in the chart are calculated based on the total market value of fixed income securities held by the Fund. If a security was rated by all three rating agencies, the middle rating was utilized. If rated by two of three rating agencies, the lower rating was utilized, and if rated by one of the rating agencies, that rating was utilized. Standard & Poor’s rates the creditworthiness of bonds on a scale of AAA (highest) to D (lowest). Ratings from A to CCC may be modified by the addition of a plus (+) or minus (-) sign to show relative standing within the rating categories. Standard & Poor’s rates the creditworthiness of short-term notes on a scale SP-1 (highest) to SP-3 (lowest). Moody’s rates the creditworthiness of bond on a scale of Aaa (highest) to C (lowest). Ratings Aa to B may be modified by the addition of a number 1 (highest) to 3 (lowest) to show relative standing within the ratings categories. Moody’s rates the creditworthiness of short-term U.S. tax-exempt municipal securities from MIG 1/VMIG 1 (highest) to SG (lowest). Fitch rates the creditworthiness of bonds, ranging from AAA (highest) to D (lowest). Credit quality and credit quality ratings are subject to change and may have changed since the date specified. |
| 6. | Effective maturity distribution is calculated based on the total long-term investments of the Fund. It is subject to change and may have changed since the date specified. |
| | | | |
| 6 | | Wells Fargo Advantage Short-Term Municipal Bond Fund | | Fund expenses (unaudited) |
As a shareholder of the Fund, you incur two types of costs: (1) transaction costs, including sales charges (loads) on purchase payments and contingent deferred sales charges (if any) on redemptions and (2) ongoing costs, including management fees, distribution (12b-1) and/or shareholder service fees, and other Fund expenses. This example is intended to help you understand your ongoing costs (in dollars) of investing in the Fund and to compare these costs with the ongoing costs of investing in other mutual funds.
The example is based on an investment of $1,000 invested at the beginning of the six-month period and held for the entire period from July 1, 2014 to December 31, 2014.
Actual expenses
The “Actual” line of the table below provides information about actual account values and actual expenses. You may use the information in this line, together with the amount you invested, to estimate the expenses that you paid over the period. Simply divide your account value by $1,000 (for example, an $8,600 account value divided by $1,000 = 8.6), then multiply the result by the number in the “Actual” line under the heading entitled “Expenses paid during period” for your applicable class of shares to estimate the expenses you paid on your account during this period.
Hypothetical example for comparison purposes
The “Hypothetical” line of the table below provides information about hypothetical account values and hypothetical expenses based on the Fund’s actual expense ratio and an assumed rate of return of 5% per year before expenses, which is not the Fund’s actual return. The hypothetical account values and expenses may not be used to estimate the actual ending account balance or expenses you paid for the period. You may use this information to compare the ongoing costs of investing in the Fund and other funds. To do so, compare this 5% hypothetical example with the 5% hypothetical examples that appear in the shareholder reports of the other funds.
Please note that the expenses shown in the table are meant to highlight your ongoing costs only and do not reflect any transactional costs, such as sales charges (loads) and contingent deferred sales charges. Therefore, the “Hypothetical” line of the table is useful in comparing ongoing costs only and will not help you determine the relative total costs of owning different funds. In addition, if these transactional costs were included, your costs would have been higher.
| | | | | | | | | | | | | | | | |
| | | Beginning
account value
7-1-2014 | | | Ending
account value
12-31-2014 | | | Expenses
paid during
the period1 | | | Net annualized
expense ratio | |
Class A | | | | | | | | | | | | | | | | |
Actual | | $ | 1,000.00 | | | $ | 1,004.27 | | | $ | 3.03 | | | | 0.60 | % |
Hypothetical (5% return before expenses) | | $ | 1,000.00 | | | $ | 1,022.18 | | | $ | 3.06 | | | | 0.60 | % |
Class C | | | | | | | | | | | | | | | | |
Actual | | $ | 1,000.00 | | | $ | 1,000.49 | | | $ | 6.81 | | | | 1.35 | % |
Hypothetical (5% return before expenses) | | $ | 1,000.00 | | | $ | 1,018.40 | | | $ | 6.87 | | | | 1.35 | % |
Administrator Class | | | | | | | | | | | | | | | | |
Actual | | $ | 1,000.00 | | | $ | 1,003.27 | | | $ | 3.03 | | | | 0.60 | % |
Hypothetical (5% return before expenses) | | $ | 1,000.00 | | | $ | 1,022.18 | | | $ | 3.06 | | | | 0.60 | % |
Institutional Class | | | | | | | | | | | | | | | | |
Actual | | $ | 1,000.00 | | | $ | 1,005.29 | | | $ | 2.02 | | | | 0.40 | % |
Hypothetical (5% return before expenses) | | $ | 1,000.00 | | | $ | 1,023.19 | | | $ | 2.04 | | | | 0.40 | % |
Investor Class | | | | | | | | | | | | | | | | |
Actual | | $ | 1,000.00 | | | $ | 1,004.12 | | | $ | 3.18 | | | | 0.63 | % |
Hypothetical (5% return before expenses) | | $ | 1,000.00 | | | $ | 1,022.03 | | | $ | 3.21 | | | | 0.63 | % |
| 1. | Expenses paid is equal to the annualized expense ratio of each class multiplied by the average account value over the period, multiplied by the number of days in the most recent fiscal half-year divided by the number of days in the fiscal year (to reflect the one-half-year period). |
| | | | | | |
| Portfolio of investments—December 31, 2014 (unaudited) | | Wells Fargo Advantage Short-Term Municipal Bond Fund | | | 7 | |
| | | | | | | | | | | | | | | | |
| Security name | | Interest rate | | | Maturity date | | | Principal | | | Value | |
| | | | | | | | | | | | | | | | |
| | | | |
Municipal Obligations: 99.19% | | | | | | | | | | | | | | | | |
| | | | |
| Alabama: 1.11% | | | | | | | | | | | | | | | | |
Alabama 21st Century Authority Tobacco Settlement Revenue Series A (Tobacco Revenue) | | | 5.00 | % | | | 6-1-2017 | | | $ | 3,000,000 | | | $ | 3,285,780 | |
Chatom AL Industrial Development Board Gulf Opportunity Zone PowerSouth Energy Cooperative Projects Series A (Utilities Revenue, National Rural Utilities Finance Corporation SPA) ± | | | 0.45 | | | | 11-15-2038 | | | | 15,000,000 | | | | 14,998,800 | |
Chatom AL Industrial Development Board Solid Waste Disposal Facilities Refunding Bond PowerSouth Energy Series B (Utilities Revenue) | | | 4.00 | | | | 8-1-2015 | | | | 2,890,000 | | | | 2,948,176 | |
Jefferson County AL Sewer Revenue Warrants Series D (Water & Sewer Revenue) | | | 5.00 | | | | 10-1-2018 | | | | 1,890,000 | | | | 2,095,254 | |
Jefferson County AL Warrants Series C (GO) | | | 4.90 | | | | 4-1-2021 | | | | 35,610,000 | | | | 38,390,785 | |
Mobile AL Industrial Development Board PCR Alabama Power Company Barry Plant (Industrial Development Revenue) ± | | | 0.32 | | | | 7-15-2034 | | | | 11,000,000 | | | | 11,003,080 | |
| | | | |
| | | | | | | | | | | | | | | 72,721,875 | |
| | | | | | | | | | | | | | | | |
| | | | |
| Alaska: 0.79% | | | | | | | | | | | | | | | | |
Alaska Housing Finance Corporation Series A (Housing Revenue, Landesbank Baden-Wuerttemberg SPA) ø | | | 0.14 | | | | 12-1-2041 | | | | 43,100,000 | | | | 43,100,000 | |
Alaska Housing Finance Corporation Series A2 (Housing Revenue) | | | 4.55 | | | | 12-1-2020 | | | | 1,445,000 | | | | 1,500,806 | |
Alaska International Airport Refunding Bond Series D (Airport Revenue, National Insured) | | | 5.00 | | | | 10-1-2018 | | | | 2,235,000 | | | | 2,409,956 | |
Valdez AK Marine Terminal Revenue BP Pipelines Project Series B (Industrial Development Revenue) | | | 5.00 | | | | 1-1-2016 | | | | 4,550,000 | | | | 4,753,522 | |
| | | | |
| | | | | | | | | | | | | | | 51,764,284 | |
| | | | | | | | | | | | | | | | |
| | | | |
| Arizona: 0.56% | | | | | | | | | | | | | | | | |
Arizona Navajo Tribal Utility Authority (Miscellaneous Revenue, AGM Insured) | | | 4.00 | | | | 1-1-2021 | | | | 17,473,000 | | | | 18,293,008 | |
Arizona School Facilities Board State School Trust (Miscellaneous Revenue, Ambac Insured) | | | 4.25 | | | | 7-1-2015 | | | | 4,325,000 | | | | 4,407,651 | |
Gilbert AZ Water Reserve Municipal Property Corporation Sub Lien (Water & Sewer Revenue) | | | 4.75 | | | | 10-1-2032 | | | | 1,275,000 | | | | 1,286,564 | |
Maricopa County AZ PCR Series B (Utilities Revenue) ± | | | 5.20 | | | | 6-1-2043 | | | | 2,500,000 | | | | 2,808,900 | |
Pima County AZ IDA Constellation Schools Project Series A (Miscellaneous Revenue) | | | 6.38 | | | | 1-1-2019 | | | | 2,010,000 | | | | 2,107,666 | |
Scottsdale AZ IDA Scottsdale Healthcare Series D (Health Revenue) | | | 5.00 | | | | 9-1-2017 | | | | 2,000,000 | | | | 2,173,100 | |
Verrado AZ Community Facilities District #1 Refunding Bond Series A (GO) 144A | | | 4.00 | | | | 7-15-2015 | | | | 1,295,000 | | | | 1,313,428 | |
Verrado AZ Community Facilities District #1 Refunding Bond Series A (GO) 144A | | | 4.00 | | | | 7-15-2016 | | | | 1,280,000 | | | | 1,325,274 | |
Verrado AZ Community Facilities District #1 Refunding Bond Series A (GO) 144A | | | 4.00 | | | | 7-15-2017 | | | | 1,365,000 | | | | 1,434,492 | |
Verrado AZ Community Facilities District #1 Refunding Bond Series A (GO) 144A | | | 4.00 | | | | 7-15-2018 | | | | 1,245,000 | | | | 1,322,999 | |
| | | | |
| | | | | | | | | | | | | | | 36,473,082 | |
| | | | | | | | | | | | | | | | |
| | | | |
| California: 9.52% | | | | | | | | | | | | | | | | |
Alameda County CA Corridor Transportation Authority CAB Series A (Transportation Revenue, Ambac Insured) ¤ | | | 0.00 | | | | 10-1-2016 | | | | 8,845,000 | | | | 8,686,586 | |
Alvord CA Unified School District Series 3306 (GO, AGM/National Insured, Credit Suisse LIQ) ø144A | | | 0.21 | | | | 8-1-2030 | | | | 9,960,000 | | | | 9,960,000 | |
Bay Area Toll Authority California San Francisco Bay Area Toll Bridge Series B (Transportation Revenue) ± | | | 1.50 | | | | 4-1-2047 | | | | 10,515,000 | | | | 10,614,156 | |
California (GO) ± | | | 4.00 | | | | 12-1-2027 | | | | 55,200,000 | | | | 59,168,880 | |
California HFA Home Mortgage Series G (Housing Revenue) | | | 4.95 | | | | 8-1-2023 | | | | 9,500,000 | | | | 9,760,205 | |
California Infrastructure & Economic Development Colburn School Project (Education Revenue) ± | | | 0.29 | | | | 8-1-2037 | | | | 53,925,000 | | | | 53,590,126 | |
The accompanying notes are an integral part of these financial statements.
| | | | |
| 8 | | Wells Fargo Advantage Short-Term Municipal Bond Fund | | Portfolio of investments—December 31, 2014 (unaudited) |
| | | | | | | | | | | | | | | | |
| Security name | | Interest rate | | | Maturity date | | | Principal | | | Value | |
| | | | | | | | | | | | | | | | |
| | | | |
| California (continued) | | | | | | | | | | | | | | | | |
California Infrastructure & Economic Development Refunding Bonds Museum Art Project Series A (Miscellaneous Revenue) ± | | | 1.87 | % | | | 12-1-2037 | | | $ | 12,000,000 | | | $ | 12,368,160 | |
California Municipal Finance Authority Republic Services (Resource Recovery Revenue) ± | | | 0.30 | | | | 9-1-2021 | | | | 26,000,000 | | | | 26,000,000 | |
California PCFA Solid Waste Disposal Waste Management Project Series A (Resource Recovery Revenue) ± | | | 1.65 | | | | 7-1-2031 | | | | 6,000,000 | | | | 6,000,240 | |
California PFOTER Series DCL-009 (GO, Dexia Credit Local LOC, AGM Insured) ø144A | | | 0.24 | | | | 8-1-2027 | | | | 66,320,000 | | | | 66,320,000 | |
California PFOTER Series DCL-011 (GO, Dexia Credit Local LOC, AGM Insured) ø144A | | | 0.24 | | | | 8-1-2027 | | | | 33,705,000 | | | | 33,705,000 | |
California Refunding Bond Series B (GO) ± | | | 0.79 | | | | 5-1-2017 | | | | 7,000,000 | | | | 7,064,120 | |
California Series B (GO) ± | | | 0.94 | | | | 5-1-2018 | | | | 6,000,000 | | | | 6,093,240 | |
California Series D (GO) ± | | | 0.81 | | | | 12-1-2028 | | | | 27,000,000 | | | | 27,283,230 | |
California Series E (GO) ± | | | 0.94 | | | | 12-1-2029 | | | | 18,000,000 | | | | 18,281,340 | |
California Statewide CDA Health Facilities Catholic Series D (Health Revenue, AGM Insured) ±(m) | | | 0.59 | | | | 7-1-2041 | | | | 5,225,000 | | | | 5,225,000 | |
California Statewide CDA Health Facilities Catholic Series E (Health Revenue, AGM Insured) ±(m) | | | 0.65 | | | | 7-1-2040 | | | | 5,425,000 | | | | 5,425,000 | |
California Statewide CDA Health Facilities Catholic Series F (Health Revenue, AGM Insured) ±(m) | | | 0.65 | | | | 7-1-2040 | | | | 2,775,000 | | | | 2,775,000 | |
California University Revenue Systemwide Series A (Education Revenue, AGM Insured, Credit Suisse LIQ) ø144A | | | 0.16 | | | | 11-1-2033 | | | | 2,685,000 | | | | 2,685,000 | |
Chino Ontario Upland CA Water Facilities Authority Certificate of Participation Agua de Lejos Project (Water & Sewer Revenue, National Insured) | | | 5.20 | | | | 10-1-2015 | | | | 170,000 | | | | 171,678 | |
Chula Vista CA Elementary School Building Projects Certificate of Participation Series A (Miscellaneous Revenue, AGM Insured) | | | 5.00 | | | | 9-1-2017 | | | | 1,765,000 | | | | 1,950,272 | |
Chula Vista CA Elementary School Building Projects Certificate of Participation Series A (Miscellaneous Revenue, AGM Insured) | | | 5.00 | | | | 9-1-2018 | | | | 1,985,000 | | | | 2,244,539 | |
Chula Vista CA Industrial Development Revenue San Diego Gas & Electric Company Series A (Utilities Revenue) | | | 1.65 | | | | 7-1-2018 | | | | 5,570,000 | | | | 5,595,288 | |
Compton CA Unified School District Election of 2002 CAB Series D (GO, Ambac Insured) ¤ | | | 0.00 | | | | 6-1-2017 | | | | 3,070,000 | | | | 2,954,476 | |
Deutsche Bank SPEARs/LIFERs Trust Series DBE 1377 (GO, AGM/FGIC Insured, Deutsche Bank LIQ) ±144A | | | 0.22 | | | | 8-1-2033 | | | | 12,960,000 | | | | 12,960,000 | |
Downey CA School Facilities Financing Authority PFOTER Series 4066 (Miscellaneous Revenue, National Insured, Dexia Credit Local LIQ) ø | | | 0.18 | | | | 8-1-2025 | | | | 5,965,000 | | | | 5,965,000 | |
Foothill-Eastern CA Transportation Corridor Agency Series B1 (Transportation Revenue) ± | | | 5.00 | | | | 1-15-2053 | | | | 23,500,000 | | | | 25,486,925 | |
Golden State Tobacco Securitization Corporation California Series 2954 (Tobacco Revenue, Morgan Stanley Bank LIQ) ø144A | | | 0.59 | | | | 6-1-2047 | | | | 31,160,000 | | | | 31,160,000 | |
Inland Valley CA Development Agency Series B (Tax Revenue) ± | | | 4.25 | | | | 3-1-2041 | | | | 35,100,000 | | | | 35,340,435 | |
Inland Valley CA Development Agency Series C (Tax Revenue) ± | | | 4.50 | | | | 3-1-2041 | | | | 17,000,000 | | | | 17,829,600 | |
Irwindale CA CDA PFOTER Series 3542 (Tax Revenue, AGM Insured, Dexia Credit Local LIQ) ø144A | | | 0.23 | | | | 7-15-2026 | | | | 27,320,000 | | | | 27,320,000 | |
Oakland CA Unified School District Alameda County Election of 2012 (GO) | | | 5.00 | | | | 8-1-2018 | | | | 1,000,000 | | | | 1,104,730 | |
Oakland CA Unified School District Alameda County Election of 2012 (GO) | | | 5.00 | | | | 8-1-2019 | | | | 1,000,000 | | | | 1,120,330 | |
Oakland CA Unified School District Alameda County Refunding Bond (GO, National Insured) | | | 5.00 | | | | 8-1-2016 | | | | 3,030,000 | | | | 3,223,163 | |
Palomar CA Pomerado Health CAB Election of 2004 Series A (GO, National Insured) ¤ | | | 0.00 | | | | 8-1-2019 | | | | 2,215,000 | | | | 2,024,643 | |
Palomar CA Pomerado Health PFOTER Series 4683 (GO, National Insured, Bank of America NA LIQ) ø144A | | | 0.32 | | | | 8-1-2037 | | | | 31,250,000 | | | | 31,250,000 | |
Palomar CA Pomerado Health Care District Certificate of Participation Series C (Health Revenue, AGM Insured) ±(m) | | | 1.35 | | | | 11-1-2036 | | | | 2,000,000 | | | | 2,000,000 | |
The accompanying notes are an integral part of these financial statements.
| | | | | | |
| Portfolio of investments—December 31, 2014 (unaudited) | | Wells Fargo Advantage Short-Term Municipal Bond Fund | | | 9 | |
| | | | | | | | | | | | | | | | |
| Security name | | Interest rate | | | Maturity date | | | Principal | | | Value | |
| | | | | | | | | | | | | | | | |
| | | | |
| California (continued) | | | | | | | | | | | | | | | | |
Sacramento County CA Sanitation District PFOTER Series 3934 (Water & Sewer Revenue, FGIC Insured, Dexia Credit Local LIQ) ø | | | 0.13 | % | | | 12-1-2035 | | | $ | 10,000,000 | | | $ | 10,000,000 | |
San Buenaventura CA Community Memorial Health System (Health Revenue) | | | 5.00 | | | | 12-1-2016 | | | | 1,730,000 | | | | 1,839,042 | �� |
San Diego CA PFFA Ballpark Series A (Miscellaneous Revenue, Ambac Insured) | | | 5.00 | | | | 2-15-2015 | | | | 4,525,000 | | | | 4,551,698 | |
San Francisco CA City & County Redevelopment Agency Hotel Occupancy (Tax Revenue, AGM Insured) | | | 4.00 | | | | 6-1-2015 | | | | 2,515,000 | | | | 2,552,046 | |
San Jose CA Redevelopment Agency Tax Unrefunded Balance Merged Area (Tax Revenue, National Insured) | | | 6.00 | | | | 8-1-2015 | | | | 3,090,000 | | | | 3,187,335 | |
Sierra CA Joint Community College District School Facilities Improvement District #2 CAB Series B (GO, National Insured) ¤ | | | 0.00 | | | | 8-1-2015 | | | | 500,000 | | | | 499,120 | |
South San Francisco CA Unified School District BAN Series D (GO) ¤ | | | 0.00 | | | | 5-15-2017 | | | | 20,000,000 | | | | 19,567,400 | |
Upland CA Certificate of Participation San Antonio Community Hospital Project (Miscellaneous Revenue) | | | 5.00 | | | | 1-1-2015 | | | | 1,915,000 | | | | 1,915,000 | |
| | | | |
| | | | | | | | | | | | | | | 624,818,003 | |
| | | | | | | | | | | | | | | | |
| | | | |
| Colorado: 0.69% | | | | | | | | | | | | | | | | |
Aurora CO E-470 Public Highway Authority CAB Series B (Transportation Revenue, National Insured) ¤ | | | 0.00 | | | | 9-1-2018 | | | | 4,000,000 | | | | 3,731,080 | |
Aurora CO E-470 Public Highway Authority Senior Series CD-2 (Transportation Revenue, National Insured) ± | | | 1.78 | | | | 9-1-2039 | | | | 15,325,000 | | | | 15,427,524 | |
Colorado MidCities Metropolitan District #1 Special Refunding and Improvement Bonds Series A (Tax Revenue, BNP Paribas LOC) ø | | | 0.12 | | | | 12-1-2020 | | | | 3,025,000 | | | | 3,025,000 | |
Colorado Springs CO Utilities Various Sub Lien Improvement Series B (Utilities Revenue, Bayerische Landesbank SPA) ø | | | 0.26 | | | | 11-1-2036 | | | | 15,175,000 | | | | 15,175,000 | |
Deutsche Bank Spears/Lifers Trust Series DBE 1356 (Miscellaneous Revenue, AGM Insured, Deutsche Bank LIQ) ø144A | | | 0.14 | | | | 6-1-2044 | | | | 8,000,000 | | | | 8,000,000 | |
| | | | |
| | | | | | | | | | | | | | | 45,358,604 | |
| | | | | | | | | | | | | | | | |
| | | | |
| Connecticut: 3.25% | | | | | | | | | | | | | | | | |
Connecticut Economic Recovery Notes Series A (GO) ø | | | 0.28 | | | | 1-1-2017 | | | | 10,210,000 | | | | 10,209,898 | |
Connecticut Economic Recovery Notes Series A (GO) ø | | | 0.38 | | | | 1-1-2018 | | | | 9,810,000 | | | | 9,810,196 | |
Connecticut Economic Recovery Notes Series A-3 (GO) ± | | | 0.32 | | | | 7-1-2017 | | | | 11,600,000 | | | | 11,600,000 | |
Connecticut Economic Recovery Notes Series A-4 (GO) ± | | | 0.32 | | | | 1-1-2018 | | | | 26,625,000 | | | | 26,625,000 | |
Connecticut HEFA Bridgeport Hospital Series D (Health Revenue) | | | 2.00 | | | | 7-1-2015 | | | | 2,240,000 | | | | 2,257,203 | |
Connecticut HEFA Bridgeport Hospital Series D (Health Revenue) | | | 5.00 | | | | 7-1-2016 | | | | 2,380,000 | | | | 2,528,750 | |
Connecticut HFA Series A2 (Housing Revenue, JPMorgan Chase & Company SPA) ø | | | 0.03 | | | | 5-15-2039 | | | | 23,120,000 | | | | 23,120,000 | |
Connecticut Securities Industry and Financial Market Association Index Refunding Notes (Miscellaneous Revenue) ± | | | 1.14 | | | | 5-15-2019 | | | | 3,500,000 | | | | 3,576,615 | |
Connecticut Series A (Miscellaneous Revenue) ± | | | 0.57 | | | | 4-15-2016 | | | | 5,000,000 | | | | 5,020,850 | |
Connecticut Series A (Miscellaneous Revenue) ± | | | 0.58 | | | | 3-1-2019 | | | | 3,200,000 | | | | 3,206,688 | |
Connecticut Series A (Miscellaneous Revenue) ± | | | 0.69 | | | | 3-1-2020 | | | | 7,230,000 | | | | 7,248,075 | |
Connecticut Series A (Miscellaneous Revenue) ± | | | 0.72 | | | | 4-15-2017 | | | | 4,600,000 | | | | 4,634,638 | |
Connecticut Series A (Miscellaneous Revenue) ± | | | 0.81 | | | | 5-15-2017 | | | | 17,000,000 | | | | 17,179,180 | |
Connecticut Series A (GO) ± | | | 0.96 | | | | 5-15-2018 | | | | 17,740,000 | | | | 18,025,437 | |
Connecticut Series A (Miscellaneous Revenue) ± | | | 0.99 | | | | 3-1-2017 | | | | 13,255,000 | | | | 13,273,159 | |
Connecticut Series A (Miscellaneous Revenue) ± | | | 1.14 | | | | 4-15-2019 | | | | 5,500,000 | | | | 5,616,875 | |
Connecticut Series A (GO) ± | | | 1.24 | | | | 3-1-2018 | | | | 13,500,000 | | | | 13,524,030 | |
Connecticut Series A (GO) ± | | | 1.39 | | | | 3-1-2019 | | | | 21,500,000 | | | | 21,543,645 | |
Connecticut Series C (Miscellaneous Revenue) ± | | | 0.69 | | | | 5-15-2016 | | | | 5,000,000 | | | | 5,030,350 | |
Connecticut Series D (GO) ± | | | 0.55 | | | | 9-15-2017 | | | | 1,500,000 | | | | 1,508,550 | |
The accompanying notes are an integral part of these financial statements.
| | | | |
| 10 | | Wells Fargo Advantage Short-Term Municipal Bond Fund | | Portfolio of investments—December 31, 2014 (unaudited) |
| | | | | | | | | | | | | | | | |
| Security name | | Interest rate | | | Maturity date | | | Principal | | | Value | |
| | | | | | | | | | | | | | | | |
| | | | |
| Connecticut (continued) | | | | | | | | | | | | | | | | |
Hamden CT Refunding Bond (GO) | | | 5.00 | % | | | 8-15-2017 | | | $ | 1,500,000 | | | $ | 1,629,135 | |
Hamden CT Refunding Bond (GO) | | | 5.00 | | | | 8-15-2018 | | | | 1,000,000 | | | | 1,106,620 | |
Hartford CT Series B (GO, AGM Insured) | | | 5.00 | | | | 10-1-2018 | | | | 1,000,000 | | | | 1,136,340 | |
New Haven CT Series A (GO, AGM Insured) | | | 3.00 | | | | 11-1-2019 | | | | 3,405,000 | | | | 3,559,928 | |
| | | | |
| | | | | | | | | | | | | | | 212,971,162 | |
| | | | | | | | | | | | | | | | |
| | | | |
| Delaware: 0.04% | | | | | | | | | | | | | | | | |
Delaware HCFR Nanticoke Memorial Hospital Project (Health Revenue) | | | 4.00 | | | | 7-1-2016 | | | | 1,045,000 | | | | 1,076,674 | |
Delaware HCFR Nanticoke Memorial Hospital Project (Health Revenue) | | | 5.00 | | | | 7-1-2017 | | | | 1,225,000 | | | | 1,309,231 | |
| | | | |
| | | | | | | | | | | | | | | 2,385,905 | |
| | | | | | | | | | | | | | | | |
| | | | |
| District of Columbia: 0.44% | | | | | | | | | | | | | | | | |
District of Columbia Income Tax Secured Refunding Bond Series E (Tax Revenue) ± | | | 0.79 | | | | 12-1-2017 | | | | 13,000,000 | | | | 13,133,250 | |
District of Columbia Thomas B. Fordham Foundation (Miscellaneous Revenue, SunTrust Bank LOC) ø | | | 0.22 | | | | 10-1-2037 | | | | 4,800,000 | | | | 4,800,000 | |
District of Columbia Water & Sewer Authority Public Utility District Series B2 (Water & Sewer Revenue) ± | | | 0.62 | | | | 10-1-2040 | | | | 11,000,000 | | | | 11,022,770 | |
| | | | |
| | | | | | | | | | | | | | | 28,956,020 | |
| | | | | | | | | | | | | | | | |
| | | | |
| Florida: 4.26% | | | | | | | | | | | | | | | | |
Brevard County FL HCFR Refunding Bond Health First Incorporated Series A (Health Revenue) | | | 5.00 | | | | 4-1-2018 | | | | 1,140,000 | | | | 1,263,405 | |
Brevard County FL Space Coast Infrastructure Agency I-95 Project (Industrial Development Revenue) | | | 4.00 | | | | 6-15-2018 | | | | 5,695,000 | | | | 6,139,552 | |
Deutsche Bank SPEARs/LIFERs Trust Series DBE 1376 (Miscellaneous Revenue, Ambac Insured, Deutsche Bank LIQ) ø144A | | | 0.15 | | | | 4-1-2027 | | | | 10,000,000 | | | | 10,000,000 | |
Escambia County FL Utilities Authority (Utilities Revenue, National Insured) | | | 6.25 | | | | 1-1-2015 | | | | 840,000 | | | | 840,000 | |
Eustis FL Multi-Purpose Revenue Series A (Miscellaneous Revenue, SunTrust Bank LOC) ø | | | 0.22 | | | | 12-1-2027 | | | | 1,020,000 | | | | 1,020,000 | |
Florida Department of Environmental Protection Everglades Restoration Series A (Tax Revenue, AGM Insured) ø | | | 0.15 | | | | 7-1-2027 | | | | 8,000,000 | | | | 8,000,000 | |
Gulf Breeze FL Local Government Loan Series B (Miscellaneous Revenue, FGIC Insured) ± | | | 4.00 | | | | 12-1-2020 | | | | 540,000 | | | | 541,215 | |
Gulf Breeze FL Local Government Loan Series FG&H (Miscellaneous Revenue) ± | | | 1.75 | | | | 12-1-2020 | | | | 15,100,000 | | | | 15,158,890 | |
Highlands County FL Health Facilities Authority Adventist Health Series B (Health Revenue) | | | 5.00 | | | | 11-15-2020 | | | | 1,000,000 | | | | 1,042,030 | |
Highlands County FL Health Facilities Authority Adventist Health Series I (Health Revenue) | | | 4.50 | | | | 11-15-2015 | | | | 4,625,000 | | | | 4,795,755 | |
Hillsborough County FL School Board Refunding Bond (Tax Revenue, Ambac Insured) | | | 5.00 | | | | 10-1-2015 | | | | 3,365,000 | | | | 3,468,608 | |
Hillsborough County FL School Board Refunding Bond (Tax Revenue, Ambac Insured) | | | 5.00 | | | | 10-1-2016 | | | | 7,325,000 | | | | 7,543,505 | |
Jacksonville FL Sales Refunding Bond Better Jacksonville (Tax Revenue) | | | 5.00 | | | | 10-1-2017 | | | | 2,000,000 | | | | 2,223,920 | |
Lee County FL IDA Alliance Community Project (Health Revenue) | | | 5.00 | | | | 11-15-2016 | | | | 1,000,000 | | | | 1,066,090 | |
Miami Beach FL Health Facilities Current Refunding Mount Sinai Medical Center (Health Revenue) | | | 3.00 | | | | 11-15-2015 | | | | 1,000,000 | | | | 1,016,680 | |
Miami Beach FL Health Facilities Current Refunding Mount Sinai Medical Center (Health Revenue) | | | 3.00 | | | | 11-15-2016 | | | | 1,500,000 | | | | 1,545,945 | |
Miami Beach FL Health Facilities Current Refunding Mount Sinai Medical Center (Health Revenue) | | | 4.00 | | | | 11-15-2017 | | | | 1,750,000 | | | | 1,855,630 | |
Miami FL Refunding Bond Homeland Defense (GO, National Insured) | | | 5.00 | | | | 1-1-2017 | | | | 5,000,000 | | | | 5,302,800 | |
Miami-Dade County FL Educational Facilities Authority University of Miami Series A (Education Revenue) | | | 5.25 | | | | 4-1-2016 | | | | 1,600,000 | | | | 1,688,048 | |
The accompanying notes are an integral part of these financial statements.
| | | | | | |
| Portfolio of investments—December 31, 2014 (unaudited) | | Wells Fargo Advantage Short-Term Municipal Bond Fund | | | 11 | |
| | | | | | | | | | | | | | | | |
| Security name | | Interest rate | | | Maturity date | | | Principal | | | Value | |
| | | | | | | | | | | | | | | | |
| | | | |
| Florida (continued) | | | | | | | | | | | | | | | | |
Miami-Dade County FL Expressway Authority Toll System (Transportation Revenue, AGM Insured, Citibank NA LIQ) ø144A | | | 0.24 | % | | | 7-1-2018 | | | $ | 670,000 | | | $ | 670,000 | |
Miami-Dade County FL Expressway Authority Toll System (Transportation Revenue, Dexia Credit Local LOC, Ambac Insured, Dexia Credit Local LIQ) ±144A | | | 0.46 | | | | 8-1-2028 | | | | 13,175,000 | | | | 13,175,000 | |
Miami-Dade County FL Expressway Authority Toll System (Transportation Revenue, Dexia Credit Local LOC, Dexia Credit Local LIQ) ±144A | | | 0.47 | | | | 10-13-2023 | | | | 6,670,000 | | | | 6,670,000 | |
Miami-Dade County FL Expressway Authority Toll System (Transportation Revenue, Dexia Credit Local LOC, Ambac Insured, Dexia Credit Local LIQ) ±144A | | | 0.62 | | | | 3-8-2030 | | | | 4,995,000 | | | | 4,995,000 | |
Miami-Dade County FL Health Facilities Authority Miami Children’s Hospital Series A (Health Revenue) | | | 4.00 | | | | 8-1-2015 | | | | 615,000 | | | | 625,996 | |
Miami-Dade County FL School Board Certificate of Participation Series A (Miscellaneous Revenue) ± | | | 5.00 | | | | 8-1-2021 | | | | 18,375,000 | | | | 19,317,270 | |
Miami-Dade County FL School Board Certificate of Participation Series B (Miscellaneous Revenue, AGM Insured) | | | 5.00 | | | | 5-1-2016 | | | | 1,400,000 | | | | 1,486,450 | |
Miami-Dade County FL School Board Certificate of Participation Series B (Miscellaneous Revenue) ± | | | 5.00 | | | | 5-1-2032 | | | | 17,500,000 | | | | 18,497,675 | |
Miami-Dade County FL School Board Master Equipment Lease 2 (Miscellaneous Revenue) | | | 3.59 | | | | 3-3-2016 | | | | 3,816,273 | | | | 3,915,114 | |
North Sumter County FL Utility Dependent District (Water & Sewer Revenue) | | | 5.00 | | | | 10-1-2015 | | | | 1,905,000 | | | | 1,966,074 | |
Orange County FL Health Facilities Authority Lakeside Health Facility (Health Revenue, SunTrust Bank LOC) ø | | | 0.22 | | | | 7-1-2027 | | | | 12,250,000 | | | | 12,250,000 | |
Orange County FL School Board Certificate of Participation Series A (Miscellaneous Revenue) | | | 5.00 | | | | 8-1-2015 | | | | 3,500,000 | | | | 3,598,280 | |
Orange County FL School Board Certificate of Participation Series A (Miscellaneous Revenue) | | | 5.00 | | | | 8-1-2016 | | | | 600,000 | | | | 641,652 | |
Palm Beach County FL HCFR ACTS Retirement Life Series B (Health Revenue) | | | 5.00 | | | | 11-15-2020 | | | | 6,300,000 | | | | 6,630,120 | |
Palm Beach County FL HCFR Jupiter Medical Center Project Series A (Health Revenue) | | | 4.00 | | | | 11-1-2018 | | | | 1,235,000 | | | | 1,317,486 | |
Palm Beach County FL PFOTER Series 4615 (Miscellaneous Revenue, Dexia Credit Local LIQ) ø | | | 0.31 | | | | 8-1-2029 | | | | 47,500,000 | | | | 47,500,000 | |
Polk County FL School Board Certificate of Participation Series A (Miscellaneous Revenue, AGM Insured) | | | 3.00 | | | | 1-1-2015 | | | | 1,935,000 | | | | 1,935,000 | |
Polk County FL School Board Certificate of Participation Series B (Miscellaneous Revenue, AGM Insured) | | | 3.00 | | | | 1-1-2015 | | | | 1,235,000 | | | | 1,235,000 | |
Reedy Creek FL Improvement Series B (GO, Ambac Insured) | | | 5.00 | | | | 6-1-2017 | | | | 3,500,000 | | | | 3,568,355 | |
Sarasota County FL Educational Facilities School Arts & Sciences Project (Education Revenue) | | | 5.20 | | | | 7-1-2017 | | | | 480,000 | | | | 497,602 | |
South Lake County FL Hospital District (Health Revenue) | | | 5.00 | | | | 10-1-2015 | | | | 920,000 | | | | 947,453 | |
Space Coast Infrastructure Agency I-95 Brevard County FL Project (Industrial Development Revenue) | | | 4.00 | | | | 6-15-2017 | | | | 14,865,000 | | | | 15,833,009 | |
St. Lucie County FL School Board Certificates Series A (Miscellaneous Revenue) | | | 4.00 | | | | 7-1-2015 | | | | 4,835,000 | | | | 4,921,837 | |
Sunshine Florida Governmental Funding Commission Miami-Dade County Project Series A (Miscellaneous Revenue) | | | 5.00 | | | | 9-1-2016 | | | | 3,675,000 | | | | 3,946,289 | |
Tampa Bay FL Educational Facilities Various Academy Holy Names Project (Miscellaneous Revenue, SunTrust Bank LOC) ø | | | 0.22 | | | | 3-1-2022 | | | | 1,030,000 | | | | 1,030,000 | |
Tampa Bay FL Water Regional Water Refunding Bond (Water & Sewer Revenue) | | | 5.00 | | | | 10-1-2015 | | | | 2,500,000 | | | | 2,590,350 | |
Volusia County FL School Board (Tax Revenue, AGM Insured) | | | 5.00 | | | | 10-1-2015 | | | | 12,905,000 | | | | 13,282,084 | |
Volusia County FL School Board (Tax Revenue, National Insured) | | | 5.00 | | | | 10-1-2016 | | | | 1,000,000 | | | | 1,037,360 | |
Volusia County FL School Board (Tax Revenue, AGM Insured) | | | 5.00 | | | | 10-1-2016 | | | | 10,000,000 | | | | 10,597,500 | |
| | | | |
| | | | | | | | | | | | | | | 279,190,029 | |
| | | | | | | | | | | | | | | | |
The accompanying notes are an integral part of these financial statements.
| | | | |
| 12 | | Wells Fargo Advantage Short-Term Municipal Bond Fund | | Portfolio of investments—December 31, 2014 (unaudited) |
| | | | | | | | | | | | | | | | |
| Security name | | Interest rate | | | Maturity date | | | Principal | | | Value | |
| | | | | | | | | | | | | | | | |
| | | | |
| Georgia: 1.66% | | | | | | | | | | | | | | | | |
Atlanta GA Water & Wastewater Project Series A-1 (Water & Sewer Revenue) ± | | | 1.61 | % | | | 11-1-2038 | | | $ | 21,500,000 | | | $ | 22,075,555 | |
Bartow County GA Development Authority Georgia Power Company Bowen Project (Utilities Revenue) ± | | | 2.70 | | | | 8-1-2043 | | | | 20,000,000 | | | | 20,653,000 | |
Burke County GA Development Authority Oglethorpe Power Corporation Vogtle Project Series A (Utilities Revenue) ± | | | 2.40 | | | | 1-1-2040 | | | | 17,825,000 | | | | 18,040,148 | |
Gainesville & Hall County GA Hospital Authority Health System Project Series B (Health Revenue) ± | | | 0.99 | | | | 8-15-2035 | | | | 23,000,000 | | | | 23,031,740 | |
Georgia Private Colleges & Universities Authority Mercer University Series B (Education Revenue) | | | 4.00 | | | | 10-1-2017 | | | | 3,285,000 | | | | 3,517,742 | |
Henry County GA Master State Municipal Loan (Miscellaneous Revenue) | | | 4.09 | | | | 4-24-2016 | | | | 1,228,417 | | | | 1,251,524 | |
Main Street Natural Gas Incorporated Georgia Gas Project Series B (Utilities Revenue) | | | 5.00 | | | | 3-15-2017 | | | | 8,015,000 | | | | 8,578,455 | |
Main Street Natural Gas Incorporated Georgia Gas Project Series B (Utilities Revenue) | | | 5.00 | | | | 3-15-2018 | | | | 4,780,000 | | | | 5,232,618 | |
Milledgeville & Baldwin County GA Development Authority College & State University (Education Revenue, Ambac Insured) ± | | | 0.66 | | | | 10-1-2016 | | | | 1,975,000 | | | | 1,970,991 | |
Pike County GA School District (GO, Ambac Insured) | | | 5.70 | | | | 2-1-2016 | | | | 430,000 | | | | 442,109 | |
Richmond County GA Development Authority (Industrial Development Revenue) | | | 5.15 | | | | 3-1-2015 | | | | 2,000,000 | | | | 2,015,040 | |
Savannah GA Economic Development Authority Calvary Day School Project (Miscellaneous Revenue, SunTrust Bank LOC) ø | | | 0.22 | | | | 11-1-2026 | | | | 1,900,000 | | | | 1,900,000 | |
| | | | |
| | | | | | | | | | | | | | | 108,708,922 | |
| | | | | | | | | | | | | | | | |
| | | | |
| Guam: 0.10% | | | | | | | | | | | | | | | | |
Guam Department of Education John F. Kennedy High School Project Series A Certificate of Participation (Education Revenue) | | | 5.50 | | | | 12-1-2015 | | | | 165,000 | | | | 167,752 | |
Guam Government Waterworks Authority (Water & Sewer Revenue) | | | 4.00 | | | | 7-1-2015 | | | | 980,000 | | | | 994,729 | |
Guam International Airport Authority Series A (Airport Revenue) | | | 5.00 | | | | 10-1-2019 | | | | 450,000 | | | | 518,589 | |
Guam International Airport Authority Series B (Airport Revenue) | | | 5.00 | | | | 10-1-2018 | | | | 675,000 | | | | 764,782 | |
Guam International Airport Authority Series C (Airport Revenue) | | | 5.00 | | | | 10-1-2018 | | | | 3,560,000 | | | | 3,964,380 | |
| | | | |
| | | | | | | | | | | | | | | 6,410,232 | |
| | | | | | | | | | | | | | | | |
| | | | |
| Idaho: 0.14% | | | | | | | | | | | | | | | | |
Idaho Housing & Finance Association Series A (Housing Revenue, FNMA LOC) ø | | | 0.29 | | | | 1-1-2038 | | | | 9,365,000 | | | | 9,365,000 | |
Idaho Housing & Finance Association Series A (Housing Revenue) | | | 6.25 | | | | 7-1-2038 | | | | 100,000 | | | | 101,075 | |
| | | | |
| | | | | | | | | | | | | | | 9,466,075 | |
| | | | | | | | | | | | | | | | |
| | | | |
| Illinois: 12.40% | | | | | | | | | | | | | | | | |
Chicago IL Board of Education Dedicated Series C1 (GO) ± | | | 0.99 | | | | 3-1-2032 | | | | 27,600,000 | | | | 27,451,512 | |
Chicago IL Board of Education Dedicated Series C2 (GO) ± | | | 1.14 | | | | 3-1-2032 | | | | 33,000,000 | | | | 32,792,760 | |
Chicago IL Board of Education Dedicated Series D (GO, AGM Insured) | | | 5.00 | | | | 12-1-2018 | | | | 1,400,000 | | | | 1,544,998 | |
Chicago IL Board of Education Lease Certificates Refunding Bond Series A (Miscellaneous Revenue, National Insured) | | | 6.00 | | | | 1-1-2020 | | | | 19,515,000 | | | | 21,796,499 | |
Chicago IL Board of Education Series 2012-001 (GO, Dexia Credit Local LIQ) ±144A | | | 0.56 | | | | 12-1-2034 | | | | 40,000,000 | | | | 40,000,000 | |
Chicago IL Board of Education Series A (GO, National Insured) | | | 5.00 | | | | 12-1-2019 | | | | 895,000 | | | | 997,665 | |
Chicago IL Board of Education Series A (GO, National Insured) | | | 5.00 | | | | 12-1-2020 | | | | 765,000 | | | | 767,892 | |
Chicago IL Board of Education Series A2 (GO) ± | | | 0.79 | | | | 3-1-2035 | | | | 24,000,000 | | | | 23,499,120 | |
Chicago IL Board of Education Series A3 (GO) ± | | | 0.87 | | | | 3-1-2036 | | | | 46,000,000 | | | | 44,703,260 | |
Chicago IL Board of Education Series C (GO) | | | 5.00 | | | | 12-1-2019 | | | | 5,335,000 | | | | 5,774,177 | |
Chicago IL Board of Education Series D (GO, AGM Insured) | | | 5.00 | | | | 12-1-2019 | | | | 1,105,000 | | | | 1,196,693 | |
Chicago IL CAB Series A (GO, National Insured) ± | | | 5.53 | | | | 1-1-2020 | | | | 1,290,000 | | | | 1,354,913 | |
Chicago IL City Colleges of Chicago Capital Improvement Project CAB
(GO, National Insured) ¤ | | | 0.00 | | | | 1-1-2019 | | | | 8,555,000 | | | | 7,844,336 | |
The accompanying notes are an integral part of these financial statements.
| | | | | | |
| Portfolio of investments—December 31, 2014 (unaudited) | | Wells Fargo Advantage Short-Term Municipal Bond Fund | | | 13 | |
| | | | | | | | | | | | | | | | |
| Security name | | Interest rate | | | Maturity date | | | Principal | | | Value | |
| | | | | | | | | | | | | | | | |
| | | | |
| Illinois (continued) | | | | | | | | | | | | | | | | |
Chicago IL Modern Schools Across Chicago Program Series A-K (GO, Ambac Insured) | | | 5.00 | % | | | 12-1-2019 | | | $ | 1,000,000 | | | $ | 1,054,760 | |
Chicago IL Motor Fuel Project Series A (Tax Revenue, AGM Insured,
Deutsche Bank LIQ) ø144A | | | 0.32 | | | | 1-1-2038 | | | | 11,155,000 | | | | 11,155,000 | |
Chicago IL O’Hare International Airport Customer Facility Charge (Airport Revenue) | | | 5.00 | | | | 1-1-2019 | | | | 1,000,000 | | | | 1,118,860 | |
Chicago IL O’Hare International Airport Customer Facility Charge (Airport Revenue) | | | 5.00 | | | | 1-1-2020 | | | | 850,000 | | | | 956,956 | |
Chicago IL O’Hare International Airport General Senior Lien Series A (Airport Revenue) | | | 5.00 | | | | 1-1-2017 | | | | 2,630,000 | | | | 2,852,577 | |
Chicago IL Park District Refunding Bonds Series B (GO) | | | 5.00 | | | | 1-1-2019 | | | | 3,555,000 | | | | 4,028,917 | |
Chicago IL Park District Refunding Bonds Series D (GO) | | | 4.00 | | | | 1-1-2019 | | | | 1,890,000 | | | | 2,068,926 | |
Chicago IL Park District Refunding Bonds Series D (GO) | | | 5.00 | | | | 1-1-2019 | | | | 1,000,000 | | | | 1,133,310 | |
Chicago IL Park District Refunding Bonds Series D (GO) | | | 5.00 | | | | 1-1-2020 | | | | 1,000,000 | | | | 1,149,770 | |
Chicago IL Park District Refunding Bonds Series D (GO) | | | 5.00 | | | | 1-1-2021 | | | | 1,000,000 | | | | 1,160,240 | |
Chicago IL Project & Refunding Bond Series A (GO, National Insured) | | | 5.00 | | | | 1-1-2019 | | | | 4,465,000 | | | | 4,811,216 | |
Chicago IL Project & Refunding Bond Series C (GO, Ambac Insured) | | | 4.00 | | | | 1-1-2017 | | | | 975,000 | | | | 1,021,664 | |
Chicago IL Project & Refunding Bond Series C (GO, National Insured) | | | 4.00 | | | | 1-1-2017 | | | | 345,000 | | | | 362,212 | |
Chicago IL Project & Refunding Bond Series C (GO, Ambac Insured) | | | 5.00 | | | | 1-1-2021 | | | | 10,280,000 | | | | 10,780,430 | |
Chicago IL Refunding Bond (Tax Revenue, JPMorgan Chase & Company SPA) ø | | | 0.16 | | | | 1-1-2034 | | | | 22,310,000 | | | | 22,310,000 | |
Chicago IL Refunding Bond Emergency Telephone System (GO, National Insured) | | | 5.25 | | | | 1-1-2018 | | | | 1,770,000 | | | | 1,939,938 | |
Chicago IL Refunding Bond Emergency Telephone System (GO, National Insured) | | | 5.25 | | | | 1-1-2020 | | | | 3,765,000 | | | | 4,220,603 | |
Chicago IL Refunding Bond Emergency Telephone System (GO, National Insured) | | | 5.50 | | | | 1-1-2019 | | | | 2,600,000 | | | | 2,915,172 | |
Chicago IL Refunding Bond Series A (GO, AGM Insured) | | | 5.00 | | | | 1-1-2015 | | | | 100,000 | | | | 100,000 | |
Chicago IL Refunding Bond Series A (GO, AGM Insured) | | | 5.00 | | | | 1-1-2019 | | | | 1,250,000 | | | | 1,254,888 | |
Chicago IL Refunding Bond Series A (GO, Ambac Insured) | | | 5.00 | | | | 1-1-2020 | | | | 1,475,000 | | | | 1,545,918 | |
Chicago IL Refunding Bond Series A (GO, AGM Insured) | | | 5.00 | | | | 1-1-2020 | | | | 10,200,000 | | | | 10,240,086 | |
Chicago IL Refunding Bond Series A (GO, AGM Insured) | | | 5.00 | | | | 1-1-2021 | | | | 1,100,000 | | | | 1,136,619 | |
Chicago IL Refunding Bond Series B (GO, Ambac Insured) | | | 5.13 | | | | 1-1-2022 | | | | 10,940,000 | | | | 11,621,343 | |
Chicago IL Refunding Bond Series C (GO) | | | 5.00 | | | | 1-1-2020 | | | | 4,375,000 | | | | 4,812,588 | |
Chicago IL Refunding Bond Series C (GO) | | | 5.00 | | | | 1-1-2021 | | | | 3,970,000 | | | | 4,352,748 | |
Chicago IL Revenue Recovery Zone Facility (Industrial Development Revenue) | | | 6.13 | | | | 12-1-2018 | | | | 6,125,000 | | | | 6,424,758 | |
Chicago IL ROC (GO, Citibank NA LIQ) ø144A | | | 0.29 | | | | 7-1-2017 | | | | 9,785,000 | | | | 9,785,000 | |
Chicago IL ROC (GO, Citibank NA LIQ) ø144A` | | | 0.29 | | | | 7-1-2028 | | | | 10,000,000 | | | | 10,000,000 | |
Chicago IL Series A (GO) | | | 5.00 | | | | 1-1-2019 | | | | 1,025,000 | | | | 1,124,015 | |
Chicago IL Series A (GO, AGM Insured) | | | 5.00 | | | | 1-1-2022 | | | | 1,245,000 | | | | 1,285,313 | |
Chicago IL Series A (GO) | | | 5.25 | | | | 1-1-2021 | | | | 610,000 | | | | 651,809 | |
Chicago IL Series A2 (GO, Ambac Insured) | | | 5.50 | | | | 1-1-2018 | | | | 7,020,000 | | | | 7,563,559 | |
Chicago IL Series B (GO, AGM Insured) | | | 5.00 | | | | 1-1-2019 | | | | 8,090,000 | | | | 8,279,791 | |
Chicago IL Series B (GO, AGM Insured) | | | 5.00 | | | | 1-1-2020 | | | | 2,860,000 | | | | 2,927,410 | |
Chicago IL Transit Authority ROCS RR II R-14084 (Tax Revenue, Citibank NA LIQ) ø144A | | | 0.12 | | | | 6-1-2022 | | | | 20,000,000 | | | | 20,000,000 | |
Chicago IL Various Certificates 2008 (GO, Dexia Credit Local LOC, AGM/Ambac Insured) ø144A | | | 0.35 | | | | 1-1-2019 | | | | 16,090,000 | | | | 16,090,000 | |
Chicago IL Water Revenue Project and Refunding Bonds (Water & Sewer Revenue, AGM Insured) | | | 4.25 | | | | 11-1-2018 | | | | 1,700,000 | | | | 1,875,015 | |
Cicero IL Series A (GO, Syncora Guarantee Incorporated Insured) | | | 5.00 | | | | 1-1-2015 | | | | 2,725,000 | | | | 2,725,000 | |
Cook County IL Series B (GO, National Insured) | | | 5.00 | | | | 11-15-2019 | | | | 1,595,000 | | | | 1,761,805 | |
Deutsche Bank SPEARs/LIFERs Trust Series DBE 1115 (Miscellaneous Revenue, Deutsche Bank LIQ) ø144A | | | 0.20 | | | | 5-15-2041 | | | | 10,000,000 | | | | 10,000,000 | |
Deutsche Bank SPEARs/LIFERs Trust Series DBE 1371 (Miscellaneous Revenue, AGM Insured, Deutsche Bank LIQ) ø144A | | | 0.16 | | | | 7-1-2033 | | | | 13,800,000 | | | | 13,800,000 | |
Deutsche Bank SPEARs/LIFERs Trust Series 331 (Tax Revenue, National Insured, Deutsche Bank LIQ) ø144A | | | 0.18 | | | | 12-15-2034 | | | | 2,060,000 | | | | 2,060,000 | |
Illinois (Miscellaneous Revenue) | | | 3.00 | | | | 7-1-2018 | | | | 2,000,000 | | | | 2,076,220 | |
The accompanying notes are an integral part of these financial statements.
| | | | |
| 14 | | Wells Fargo Advantage Short-Term Municipal Bond Fund | | Portfolio of investments—December 31, 2014 (unaudited) |
| | | | | | | | | | | | | | | | |
| Security name | | Interest rate | | | Maturity date | | | Principal | | | Value | |
| | | | | | | | | | | | | | | | |
| | | | |
| Illinois (continued) | | | | | | | | | | | | | | | | |
Illinois (GO) | | | 4.00 | % | | | 2-1-2019 | | | $ | 6,300,000 | | | $ | 6,736,464 | |
Illinois (GO) | | | 4.00 | | | | 2-1-2020 | | | | 1,750,000 | | | | 1,873,883 | |
Illinois (GO) | | | 5.00 | | | | 9-1-2015 | | | | 1,885,000 | | | | 1,892,465 | |
Illinois (GO) | | | 5.00 | | | | 1-1-2017 | | | | 3,200,000 | | | | 3,317,568 | |
Illinois (GO) | | | 5.00 | | | | 1-1-2018 | | | | 1,905,000 | | | | 2,085,175 | |
Illinois (GO) | | | 5.00 | | | | 2-1-2019 | | | | 1,000,000 | | | | 1,108,110 | |
Illinois (GO) | | | 5.00 | | | | 2-1-2020 | | | | 2,500,000 | | | | 2,795,600 | |
Illinois (Miscellaneous Revenue) | | | 5.00 | | | | 5-1-2021 | | | | 2,000,000 | | | | 2,250,880 | |
Illinois Development Finance Authority St. Vincent De Paul Center Project Series A
(Health Revenue) ± | | | 1.88 | | | | 11-15-2039 | | | | 5,095,000 | | | | 5,154,866 | |
Illinois Finance Authority Centegra Health System Project (Health Revenue) | | | 5.00 | | | | 9-1-2019 | | | | 2,265,000 | | | | 2,512,112 | |
Illinois Finance Authority Children’s Memorial Hospital Series A (Health Revenue, AGM Insured, Bank of America NA LIQ) ø144A | | | 0.31 | | | | 8-15-2047 | | | | 15,000,000 | | | | 15,000,000 | |
Illinois Finance Authority Provena Health Series A (Health Revenue) | | | 5.75 | | | | 5-1-2019 | | | | 3,000,000 | | | | 3,390,540 | |
Illinois Finance Authority Revenue Memorial Health System (Health Revenue) | | | 4.00 | | | | 4-1-2015 | | | | 555,000 | | | | 559,651 | |
Illinois Finance Authority Revenue Roosevelt University Project (Education Revenue) | | | 5.00 | | | | 4-1-2015 | | | | 900,000 | | | | 907,425 | |
Illinois Housing Development Authority (Housing Revenue, GNMA Insured) | | | 5.00 | | | | 8-1-2028 | | | | 2,105,000 | | | | 2,258,433 | |
Illinois Municipal Electric Agency Power Supply Series A (Utilities Revenue, National Insured) | | | 5.25 | | | | 2-1-2020 | | | | 2,705,000 | | | | 2,953,698 | |
Illinois Refunding Bond (GO) | | | 5.00 | | | | 8-1-2015 | | | | 1,000,000 | | | | 1,025,940 | |
Illinois Refunding Bond (GO, AGM Insured) | | | 5.00 | | | | 1-1-2017 | | | | 1,725,000 | | | | 1,852,736 | |
Illinois Refunding Bond (GO, AGM Insured) | | | 5.00 | | | | 1-1-2018 | | | | 7,740,000 | | | | 8,495,888 | |
Illinois Refunding Bond (GO) | | | 5.00 | | | | 3-1-2018 | | | | 1,795,000 | | | | 1,971,628 | |
Illinois Refunding Bond (GO, Ambac Insured) | | | 5.00 | | | | 11-1-2018 | | | | 10,650,000 | | | | 10,690,683 | |
Illinois Refunding Bond (GO) | | | 5.00 | | | | 1-1-2019 | | | | 12,570,000 | | | | 13,915,744 | |
Illinois Refunding Bond (GO) | | | 5.00 | | | | 1-1-2020 | | | | 3,400,000 | | | | 3,797,188 | |
Illinois Refunding Bond (Miscellaneous Revenue, Build America Mutual Assurance Company Insured) | | | 5.00 | | | | 8-1-2020 | | | | 9,175,000 | | | | 10,428,122 | |
Illinois Refunding Bond (Tax Revenue) | | | 5.00 | | | | 1-1-2021 | | | | 1,410,000 | | | | 1,584,375 | |
Illinois Refunding Bond (GO) | | | 5.00 | | | | 2-1-2021 | | | | 11,635,000 | | | | 13,079,020 | |
Illinois Refunding Bond (Miscellaneous Revenue) | | | 5.25 | | | | 1-1-2018 | | | | 1,430,000 | | | | 1,575,660 | |
Illinois Refunding Bond (Miscellaneous Revenue) | | | 5.00 | | | | 8-1-2018 | | | | 4,785,000 | | | | 5,296,612 | |
Illinois Refunding Bond (Miscellaneous Revenue, AGM Insured) | | | 5.00 | | | | 8-1-2020 | | | | 5,000,000 | | | | 5,682,900 | |
Illinois Series 2004 (GO) | | | 5.00 | | | | 9-1-2016 | | | | 10,000,000 | | | | 10,039,000 | |
Illinois Series 2010 (GO) | | | 5.00 | | | | 1-1-2016 | | | | 11,250,000 | | | | 11,730,038 | |
Illinois Series A (Tax Revenue) | | | 4.00 | | | | 1-1-2020 | | | | 12,265,000 | | | | 13,124,654 | |
Illinois Series A (Tax Revenue) | | | 4.00 | | | | 1-1-2021 | | | | 2,715,000 | | | | 2,901,548 | |
Illinois Series A (GO) | | | 5.00 | | | | 4-1-2019 | | | | 5,000,000 | | | | 5,551,050 | |
Illinois Series A (GO) | | | 5.00 | | | | 4-1-2020 | | | | 2,500,000 | | | | 2,802,700 | |
Illinois Toll Highway Authority Series A2 (Transportation Revenue, AGM Insured, Bank of America NA SPA) ø | | | 0.07 | | | | 1-1-2031 | | | | 10,000,000 | | | | 10,000,000 | |
Illinois Toll Highway Authority Series B (Transportation Revenue, AGM Insured, Landesbank Hessen-Thüringen SPA) ø | | | 0.23 | | | | 1-1-2016 | | | | 10,000,000 | | | | 10,000,000 | |
Illinois Toll Highway Authority Series B (Transportation Revenue, AGM Insured, Landesbank Hessen-Thüringen SPA) ø | | | 0.23 | | | | 1-1-2017 | | | | 30,000,000 | | | | 30,000,000 | |
Illinois Unemployment Insurance Series A (Tax Revenue) | | | 5.00 | | | | 12-15-2016 | | | | 5,200,000 | | | | 5,655,832 | |
Illinois Unemployment Insurance Series B (Tax Revenue) | | | 5.00 | | | | 12-15-2017 | | | | 4,700,000 | | | | 5,108,289 | |
Illinois Unemployment Insurance Series B (Tax Revenue) | | | 5.00 | | | | 6-15-2018 | | | | 17,120,000 | | | | 18,609,440 | |
Illinois Unemployment Insurance Series B (Tax Revenue) | | | 5.00 | | | | 6-15-2019 | | | | 8,520,000 | | | | 8,700,198 | |
Illinois Unrefunded Balance Series A (Miscellaneous Revenue) | | | 5.00 | | | | 10-1-2016 | | | | 3,965,000 | | | | 3,979,948 | |
Kane County IL School District Series B (GO) | | | 2.00 | | | | 2-1-2021 | | | | 880,000 | | | | 872,810 | |
The accompanying notes are an integral part of these financial statements.
| | | | | | |
| Portfolio of investments—December 31, 2014 (unaudited) | | Wells Fargo Advantage Short-Term Municipal Bond Fund | | | 15 | |
| | | | | | | | | | | | | | | | |
| Security name | | Interest rate | | | Maturity date | | | Principal | | | Value | |
| | | | | | | | | | | | | | | | |
| | | | |
| Illinois (continued) | | | | | | | | | | | | | | | | |
Kane McHenry Cook & Dekalb Counties IL School District #300 (GO, National/Syncora Guarantee Incorporated Insured) | | | 5.00 | % | | | 12-1-2019 | | | $ | 2,500,000 | | | $ | 2,601,700 | |
Kane McHenry Cook & Dekalb Counties IL United School District (GO, Syncora Guarantee Incorporated Insured) | | | 5.25 | | | | 1-1-2021 | | | | 920,000 | | | | 962,016 | |
Knox & Warren Counties IL Community United School District #205 Series A (GO) | | | 3.50 | | | | 1-1-2015 | | | | 500,000 | | | | 500,000 | |
Lake County IL Community Consolidated School District (GO, National Insured) | | | 8.70 | | | | 1-1-2016 | | | | 1,075,000 | | | | 1,148,240 | |
Lake County IL Community High School District #117 Antioch CAB Series B (GO, National Insured) ¤ | | | 0.00 | | | | 12-1-2016 | | | | 4,975,000 | | | | 4,837,242 | |
Lake County IL Community School District #60 Waukegan CAB Series A (GO, AGM Insured) ¤ | | | 0.00 | | | | 12-1-2018 | | | | 1,715,000 | | | | 1,583,717 | |
Lake County IL Forest Preservation District Series A (GO) ± | | | 0.61 | | | | 12-15-2016 | | | | 1,350,000 | | | | 1,350,675 | |
McHenry & Kane Counties IL Community Consolidated School District #158 CAB (GO, National Insured) ¤ | | | 0.00 | | | | 1-1-2021 | | | | 1,000,000 | | | | 840,850 | |
Metropolitan Pier & Exposition Authority Illinois CAB McCormick Project Series A (Tax Revenue, National Insured) ¤ | | | 0.00 | | | | 6-15-2017 | | | | 11,210,000 | | | | 10,824,712 | |
Metropolitan Pier & Exposition Authority Illinois CAB McCormick Project Series A (Tax Revenue, National Insured) ¤ | | | 0.00 | | | | 12-15-2017 | | | | 6,000,000 | | | | 5,733,960 | |
Metropolitan Pier & Exposition Authority Illinois Hospitality Facilities PFOTER Series 3554 (Miscellaneous Revenue, Dexia Credit Local LIQ) ø144A | | | 0.13 | | | | 7-1-2026 | | | | 12,250,000 | | | | 12,250,000 | |
Regional Transportation Authority Illinois Refunding Balance Series B (Tax Revenue) ± | | | 0.40 | | | | 6-1-2025 | | | | 14,085,000 | | | | 14,085,000 | |
Southern Illinois State University Housing & Auxiliary Facilities System Series A (Education Revenue) | | | 4.00 | | | | 4-1-2015 | | | | 1,090,000 | | | | 1,099,766 | |
Southern Illinois State University Housing & Auxiliary Facilities System Series A (Education Revenue) | | | 4.00 | | | | 4-1-2016 | | | | 635,000 | | | | 661,111 | |
Springfield IL Electric Senior Lien (Utilities Revenue, National Insured) | | | 5.00 | | | | 3-1-2018 | | | | 12,000,000 | | | | 13,037,280 | |
Springfield IL Electric Senior Lien (Utilities Revenue, National Insured) | | | 5.00 | | | | 3-1-2019 | | | | 5,900,000 | | | | 6,390,054 | |
University of Illinois Utility Infrastructure Projects Series 2004 (Education Revenue, Bank of New York Mellon SPA) ø | | | 0.08 | | | | 8-15-2021 | | | | 20,000,000 | | | | 20,000,000 | |
Western Illinois University Auxiliary Facilities System (Education Revenue) | | | 4.00 | | | | 4-1-2016 | | | | 855,000 | | | | 888,242 | |
Western Illinois University Auxiliary Facilities System (Education Revenue) | | | 4.00 | | | | 4-1-2017 | | | | 1,135,000 | | | | 1,201,171 | |
Will & Kendall Counties IL Community Consolidated School District #202 (GO) | | | 4.00 | | | | 1-1-2015 | | | | 1,800,000 | | | | 1,800,000 | |
Winnebago & Boone Counties IL School Districts CAB #205 Rockford (GO, AGM Insured) ¤ | | | 0.00 | | | | 2-1-2015 | | | | 500,000 | | | | 499,595 | |
| | | | |
| | | | | | | | | | | | | | | 813,822,465 | |
| | | | | | | | | | | | | | | | |
| | | | |
| Indiana: 3.70% | | | | | | | | | | | | | | | | |
Indiana Education Facilities Authority CAB (Education Revenue, National Insured) ¤ | | | 0.00 | | | | 2-1-2015 | | | | 400,000 | | | | 399,740 | |
Indiana Finance Authority HCFR Jackson County Schneck Hospital (Health Revenue) | | | 4.00 | | | | 2-15-2015 | | | | 1,230,000 | | | | 1,234,379 | |
Indiana Finance Authority HEFA Ascension Health Series B2 (Health Revenue) | | | 5.00 | | | | 3-1-2015 | | | | 1,895,000 | | | | 1,908,076 | |
Indiana Finance Authority Ohio River Bridges East End Crossing Project Series B (Industrial Development Revenue) | | | 5.00 | | | | 1-1-2019 | | | | 78,500,000 | | | | 84,361,595 | |
Indiana Finance Authority Series A (Miscellaneous Revenue, National Insured) | | | 4.50 | | | | 12-1-2021 | | | | 5,000,000 | | | | 5,372,050 | |
Indiana Finance Authority University Health Obligated Group Series 2011C (Health Revenue, Northern Trust Company LOC) ø | | | 0.02 | | | | 3-1-2033 | | | | 1,000,000 | | | | 1,000,000 | |
Indiana HEFA Ascension Health Series B3 (Health Revenue) ± | | | 1.91 | | | | 11-15-2031 | | | | 70,710,000 | | | | 71,096,077 | |
Indiana HFFA Ascension Health Series A1 (Health Revenue) ± | | | 2.80 | | | | 11-1-2027 | | | | 12,000,000 | | | | 12,638,160 | |
Indianapolis IN Local Public Improvement Bond Bank ROCS RR II R-11779 (Water & Sewer Revenue, AGM Insured, Citibank NA LIQ) ø144A | | | 0.24 | | | | 1-1-2017 | | | | 9,825,000 | | | | 9,825,000 | |
Knox County IN Economic Development Good Samaritan Hospital Series A (Health Revenue) | | | 3.00 | | | | 4-1-2015 | | | | 600,000 | | | | 603,474 | |
The accompanying notes are an integral part of these financial statements.
| | | | |
| 16 | | Wells Fargo Advantage Short-Term Municipal Bond Fund | | Portfolio of investments—December 31, 2014 (unaudited) |
| | | | | | | | | | | | | | | | |
| Security name | | Interest rate | | | Maturity date | | | Principal | | | Value | |
| | | | | | | | | | | | | | | | |
| | | | |
| Indiana (continued) | | | | | | | | | | | | | | | | |
Knox County IN Economic Development Good Samaritan Hospital Series A (Health Revenue) | | | 3.00 | % | | | 4-1-2016 | | | $ | 600,000 | | | $ | 614,334 | |
Petersburg IN PCR Refunding Bond Industry Power & Light (Industrial Development Revenue, National Insured) | | | 5.40 | | | | 8-1-2017 | | | | 1,000,000 | | | | 1,107,130 | |
Rockport IN PCR Indiana-Michigan Power Company Series B (Utilities Revenue) ± | | | 1.75 | | | | 6-1-2025 | | | | 3,500,000 | | | | 3,512,915 | |
Whiting IN BP Products North America Incorporated Project (Resource Recovery Revenue) | | | 0.79 | | | | 12-1-2044 | | | | 38,000,000 | | | | 37,810,000 | |
Zionsville IN Community Schools Building Corporation Series DCL 047 (Miscellaneous Revenue, Dexia Credit Local LOC, AGM Insured, Dexia Credit Local LIQ) ø144A | | | 0.14 | | | | 1-15-2025 | | | | 11,390,000 | | | | 11,390,000 | |
| | | | |
| | | | | | | | | | | | | | | 242,872,930 | |
| | | | | | | | | | | | | | | | |
| | | | |
| Iowa: 0.10% | | | | | | | | | | | | | | | | |
Iowa Student Loan Liquidity Corporation Senior Series A1 (Education Revenue) | | | 4.40 | | | | 12-1-2018 | | | | 6,255,000 | | | | 6,646,688 | |
| | | | | | | | | | | | | | | | |
| | | | |
| Kansas: 0.37% | | | | | | | | | | | | | | | | |
Wyandotte County & Kansas City KS Unified Government Special Obligation Second Lien CAB Series A (Tax Revenue) ¤ | | | 0.00 | | | | 6-1-2021 | | | | 34,235,000 | | | | 24,467,070 | |
| | | | | | | | | | | | | | | | |
| | | | |
| Kentucky: 1.05% | | | | | | | | | | | | | | | | |
Ashland KY Ashland Hospital Corporation Kings Daughters Medical Center Project (Health Revenue) ± | | | 1.79 | | | | 2-1-2040 | | | | 35,000,000 | | | | 35,161,000 | |
Ashland KY Ashland Hospital Corporation Medical Center Project Series B (Health Revenue) | | | 5.00 | | | | 2-1-2019 | | | | 1,500,000 | | | | 1,646,085 | |
Kentucky EDFA King’s Daughters Medical Center (Health Revenue) | | | 5.00 | | | | 2-1-2017 | | | | 1,000,000 | | | | 1,073,600 | |
Kentucky Higher Education Student Loan Corporation Series A (Education Revenue) | | | 3.75 | | | | 6-1-2026 | | | | 2,030,000 | | | | 2,058,278 | |
Kentucky Higher Education Student Loan Corporation Series A (Education Revenue) | | | 5.00 | | | | 6-1-2018 | | | | 1,200,000 | | | | 1,314,132 | |
Kentucky Public Transportation Infrastructure Authority Tolls BAN Downtown Crossing Project Series A (Transportation Revenue) | | | 5.00 | | | | 7-1-2017 | | | | 25,000,000 | | | | 27,358,750 | |
| | | | |
| | | | | | | | | | | | | | | 68,611,845 | |
| | | | | | | | | | | | | | | | |
| | | | |
| Louisiana: 3.50% | | | | | | | | | | | | | | | | |
DeSoto Parish LA PCR Southwestern Electrical Power (Utilities Revenue) ± | | | 3.25 | | | | 1-1-2019 | | | | 28,000,000 | | | | 28,001,680 | |
Desoto Parish LA Poll Control Despol (Utilities Revenue) %% | | | 1.60 | | | | 1-1-2019 | | | | 15,000,000 | | | | 14,895,000 | |
East Baton Rouge Parish LA Sewerage Commission Refunding Bond Series A (Water & Sewer Revenue) ± | | | 0.61 | | | | 2-1-2046 | | | | 44,350,000 | | | | 44,415,195 | |
Louisiana Local Government Environmental Facilities & CDA East Baton Rouge Sewer Commission Series B (Tax Revenue) ± | | | 0.81 | | | | 2-1-2049 | | | | 35,500,000 | | | | 35,753,470 | |
Louisiana Local Government Environmental Facilities & CDA Louisiana Tech University Project (Housing Revenue) | | | 3.00 | | | | 7-1-2017 | | | | 680,000 | | | | 711,776 | |
Louisiana Local Government Environmental Facilities & CDA Louisiana Tech University Project (Housing Revenue) | | | 3.00 | | | | 7-1-2018 | | | | 525,000 | | | | 550,106 | |
Louisiana PFA Nineteenth Judicial District Court (Miscellaneous Revenue, National Insured) | | | 5.00 | | | | 6-1-2016 | | | | 1,000,000 | | | | 1,057,860 | |
Louisiana Regional Transit Authority CAB (Tax Revenue, National Insured) ¤ | | | 0.00 | | | | 12-1-2021 | | | | 5,000,000 | | | | 3,593,600 | |
New Orleans LA Aviation Board Gulf Opportunity Zone Consolidated Rental Car Series A (Airport Revenue) | | | 4.63 | | | | 1-1-2015 | | | | 1,120,000 | | | | 1,120,000 | |
New Orleans LA Aviation Board Series A Refunding Balance (Airport Revenue, AGM Insured) | | | 5.00 | | | | 1-1-2015 | | | | 1,000,000 | | | | 1,000,000 | |
New Orleans LA Aviation Board Series B-2 Refunding Balance (Airport Revenue, AGM Insured) | | | 5.00 | | | | 1-1-2015 | | | | 1,845,000 | | | | 1,845,000 | |
The accompanying notes are an integral part of these financial statements.
| | | | | | |
| Portfolio of investments—December 31, 2014 (unaudited) | | Wells Fargo Advantage Short-Term Municipal Bond Fund | | | 17 | |
| | | | | | | | | | | | | | | | |
| Security name | | Interest rate | | | Maturity date | | | Principal | | | Value | |
| | | | | | | | | | | | | | | | |
| | | | |
| Louisiana (continued) | | | | | | | | | | | | | | | | |
New Orleans LA Master Lease (GO) (i) | | | 5.25 | % | | | 1-1-2018 | | | $ | 10,313,747 | | | $ | 10,408,427 | |
St. Bernard Parish LA Sales & Uses Tax (Tax Revenue) | | | 4.00 | | | | 3-1-2017 | | | | 3,135,000 | | | | 3,333,069 | |
St. Bernard Parish LA Sales & Uses Tax (Tax Revenue) | | | 4.00 | | | | 3-1-2018 | | | | 3,245,000 | | | | 3,489,803 | |
St. James Parish LA Nucor Steel LLC Project Gulf Opportunity Zone Series A1 (Industrial Development Revenue) ø | | | 0.22 | | | | 11-1-2040 | | | | 24,435,000 | | | | 24,435,000 | |
St. James Parish LA Nucor Steel LLC Project Gulf Opportunity Zone Series B1 (Industrial Development Revenue) ø | | | 0.20 | | | | 11-1-2040 | | | | 54,720,000 | | | | 54,720,000 | |
| | | | |
| | | | | | | | | | | | | | | 229,329,986 | |
| | | | | | | | | | | | | | | | |
| | | | |
| Maine: 0.23% | | | | | | | | | | | | | | | | |
Old Town ME Georgia Pacific Corporation Project (Resource Recovery Revenue) ø | | | 0.28 | | | | 12-1-2024 | | | | 15,260,000 | | | | 15,260,000 | |
| | | | | | | | | | | | | | | | |
| | | | |
| Maryland: 1.35% | | | | | | | | | | | | | | | | |
Howard County MD Housing Commission Series A (Housing Revenue) ± | | | 1.29 | | | | 7-1-2034 | | | | 16,050,000 | | | | 16,052,568 | |
Maryland Health & HEFAR John Hopkins Health System Series A (Health Revenue) ± | | | 0.70 | | | | 5-15-2046 | | | | 8,000,000 | | | | 8,005,920 | |
Maryland Health & HEFAR John Hopkins Health System Series B (Health Revenue) ± | | | 0.68 | | | | 5-15-2029 | | | | 10,605,000 | | | | 10,605,848 | |
Maryland Health & HEFAR John Hopkins Health System Series B (Health Revenue) ± | | | 1.25 | | | | 5-15-2042 | | | | 12,500,000 | | | | 12,622,625 | |
Maryland Health & HEFAR John Hopkins Health System Series C (Health Revenue) ± | | | 0.93 | | | | 5-15-2038 | | | | 22,300,000 | | | | 22,413,730 | |
Maryland Health & HEFAR John Hopkins Health System Series C (Health Revenue) ± | | | 0.93 | | | | 5-15-2038 | | | | 18,915,000 | | | | 19,011,467 | |
| | | | |
| | | | | | | | | | | | | | | 88,712,158 | |
| | | | | | | | | | | | | | | | |
| | | | |
| Massachusetts: 2.80% | | | | | | | | | | | | | | | | |
Massachusetts Consolidated Loan Series D-1 (Miscellaneous Revenue) ± | | | 0.24 | | | | 8-1-2043 | | | | 87,250,000 | | | | 87,113,890 | |
Massachusetts Development Finance Agency Boston Medical Center Series C
(Health Revenue) | | | 5.00 | | | | 7-1-2015 | | | | 1,000,000 | | | | 1,019,140 | |
Massachusetts Development Finance Agency Dominion Energy Brayton Recovery Zone Series A (Utilities Revenue) ± | | | 2.25 | | | | 12-1-2041 | | | | 2,665,000 | | | | 2,744,204 | |
Massachusetts Development Finance Agency Southcoast Health System Obligation
Series F (Health Revenue) | | | 3.00 | | | | 7-1-2016 | | | | 500,000 | | | | 518,200 | |
Massachusetts Development Finance Agency Southcoast Health System Obligation
Series F (Health Revenue) | | | 3.00 | | | | 7-1-2017 | | | | 500,000 | | | | 525,520 | |
Massachusetts Development Finance Agency Waste Management Incorporated (Resource Recovery Revenue) ± | | | 1.60 | | | | 5-1-2027 | | | | 7,000,000 | | | | 7,004,830 | |
Massachusetts Educational Financing Authority EDU Loan Series I (Education Revenue) | | | 4.00 | | | | 1-1-2018 | | | | 1,750,000 | | | | 1,870,960 | |
Massachusetts Educational Financing Authority Issue I Series A (Education Revenue) | | | 3.15 | | | | 1-1-2015 | | | | 1,575,000 | | | | 1,575,000 | |
Massachusetts Educational Financing Authority Refunding Bond Series K
(Education Revenue) | | | 5.00 | | | | 7-1-2019 | | | | 2,000,000 | | | | 2,228,700 | |
Massachusetts HEFA Massachusetts Eye & Ear Infirmary Series C (Health Revenue) | | | 5.00 | | | | 7-1-2015 | | | | 700,000 | | | | 713,076 | |
Massachusetts HEFA Partners Healthcare Series G6 (Health Revenue) ± | | | 0.92 | | | | 7-1-2038 | | | | 40,000,000 | | | | 40,020,800 | |
Massachusetts PFOTER Series 4406 (Tax Revenue, Dexia Credit Local LIQ) ø144A | | | 0.13 | | | | 7-1-2030 | | | | 12,940,000 | | | | 12,940,000 | |
Massachusetts Series A (GO) ± | | | 0.56 | | | | 9-1-2016 | | | | 4,000,000 | | | | 4,011,920 | |
Massachusetts Various Consolidated Loans Series D (Tax Revenue) ± | | | 0.47 | | | | 1-1-2018 | | | | 9,500,000 | | | | 9,547,215 | |
Massachusetts Water Resources Authority Series B (Water & Sewer Revenue,
Ambac Insured) | | | 5.25 | | | | 12-1-2015 | | | | 490,000 | | | | 512,589 | |
Massachusetts Water Resources Authority Series D (Water & Sewer Revenue, Dexia Credit Local LOC, AGM Insured) ø144A | | | 0.16 | | | | 8-1-2025 | | | | 11,475,000 | | | | 11,475,000 | |
| | | | |
| | | | | | | | | | | | | | | 183,821,044 | |
| | | | | | | | | | | | | | | | |
The accompanying notes are an integral part of these financial statements.
| | | | |
| 18 | | Wells Fargo Advantage Short-Term Municipal Bond Fund | | Portfolio of investments—December 31, 2014 (unaudited) |
| | | | | | | | | | | | | | | | |
| Security name | | Interest rate | | | Maturity date | | | Principal | | | Value | |
| | | | | | | | | | | | | | | | |
| | | | |
| Michigan: 4.01% | | | | | | | | | | | | | | | | |
Caledonia MI Community Schools (GO, Qualified School Bond Loan Fund Insured) %% | | | 5.00 | % | | | 5-1-2017 | | | $ | 250,000 | | | $ | 271,653 | |
Caledonia MI Community Schools (GO, Qualified School Bond Loan Fund Insured) %% | | | 5.00 | | | | 5-1-2018 | | | | 1,315,000 | | | | 1,463,700 | |
Caledonia MI Community Schools (GO, Qualified School Bond Loan Fund Insured) %% | | | 5.00 | | | | 5-1-2020 | | | | 500,000 | | | | 575,820 | |
Caledonia MI Community Schools (GO, Qualified School Bond Loan Fund Insured) %% | | | 5.00 | | | | 5-1-2021 | | | | 1,140,000 | | | | 1,328,659 | |
Chippewa Hills MI School District (GO, Qualified School Bond Loan Fund Insured) %% | | | 4.00 | | | | 5-1-2016 | | | | 680,000 | | | | 708,322 | |
Chippewa Hills MI School District (GO, Qualified School Bond Loan Fund Insured) %% | | | 4.00 | | | | 5-1-2017 | | | | 740,000 | | | | 789,928 | |
Chippewa Hills MI School District (GO, Qualified School Bond Loan Fund Insured) %% | | | 4.00 | | | | 5-1-2018 | | | | 1,535,000 | | | | 1,666,212 | |
Chippewa Hills MI School District (GO, Qualified School Bond Loan Fund Insured) %% | | | 4.00 | | | | 5-1-2019 | | | | 1,595,000 | | | | 1,750,816 | |
Detroit MI (GO, AGM Insured) | | | 5.00 | | | | 4-1-2015 | | | | 176,700 | | | | 178,031 | |
Detroit MI City School District Series DCL 045 (GO, Dexia Credit Local LOC, AGM/Qualified School Bond Loan Fund Insured, Dexia Credit Local LIQ) ø144A | | | 0.45 | | | | 5-1-2030 | | | | 18,880,000 | | | | 18,880,000 | |
Detroit MI (GO) | | | 5.00 | | | | 11-1-2016 | | | | 855,000 | | | | 909,797 | |
Detroit Wayne County MI Stadium Authority (Miscellaneous Revenue) | | | 5.00 | | | | 10-1-2015 | | | | 1,250,000 | | | | 1,284,238 | |
Detroit Wayne County MI Stadium Authority (Miscellaneous Revenue) | | | 5.00 | | | | 10-1-2016 | | | | 1,175,000 | | | | 1,241,223 | |
Detroit Wayne County MI Stadium Authority (Miscellaneous Revenue) | | | 5.00 | | | | 10-1-2017 | | | | 1,100,000 | | | | 1,182,005 | |
Flint MI International Academy Public School Project (Education Revenue) | | | 5.00 | | | | 10-1-2017 | | | | 750,000 | | | | 769,500 | |
Flushing MI Community Schools School District (GO, Qualified School Bond Loan Fund Insured) %% | | | 4.00 | | | | 5-1-2017 | | | | 975,000 | | | | 1,038,092 | |
Flushing MI Community Schools School District (GO, Qualified School Bond Loan Fund Insured) %% | | | 4.00 | | | | 5-1-2021 | | | | 1,135,000 | | | | 1,255,446 | |
Forest Hills MI Public Schools (GO) %% | | | 5.00 | | | | 5-1-2018 | | | | 2,000,000 | | | | 2,240,740 | |
Forest Hills MI Public Schools (GO) %% | | | 5.00 | | | | 5-1-2019 | | | | 1,375,000 | | | | 1,575,324 | |
Fraser MI Public Schools District (GO, Qualified School Bond Loan Fund Insured) %% | | | 5.00 | | | | 5-1-2016 | | | | 640,000 | | | | 674,003 | |
Fraser MI Public Schools District (GO, Qualified School Bond Loan Fund Insured) %% | | | 5.00 | | | | 5-1-2017 | | | | 1,000,000 | | | | 1,086,750 | |
Fraser MI Public Schools District (GO, Qualified School Bond Loan Fund Insured) %% | | | 5.00 | | | | 5-1-2019 | | | | 1,050,000 | | | | 1,192,496 | |
Grand Ledge MI Public School District (GO, Qualified School Bond Loan Fund Insured) %% | | | 5.00 | | | | 5-1-2020 | | | | 2,680,000 | | | | 3,091,112 | |
Grand Ledge MI Public School District (GO, National/Qualified School Bond Loan Fund Insured) | | | 5.00 | | | | 5-1-2020 | | | | 1,460,000 | | | | 1,482,382 | |
Hudsonville MI Public Schools (GO, Qualified School Bond Loan Fund Insured) %% | | | 5.00 | | | | 5-1-2018 | | | | 750,000 | | | | 834,945 | |
Hudsonville MI Public Schools (GO, Qualified School Bond Loan Fund Insured) %% | | | 5.00 | | | | 5-1-2019 | | | | 1,605,000 | | | | 1,822,799 | |
Huron Valley MI School District (GO, National/Qualified School Bond Loan Fund Insured) | | | 5.00 | | | | 5-1-2015 | | | | 2,965,000 | | | | 3,011,046 | |
Lake Orion MI Community School District (GO, Qualified School Bond Loan Fund Insured) %% | | | 5.00 | | | | 5-1-2020 | | | | 1,550,000 | | | | 1,793,211 | |
Lake Orion MI Community School District (GO, Qualified School Bond Loan Fund Insured) %% | | | 5.00 | | | | 5-1-2019 | | | | 2,325,000 | | | | 2,650,849 | |
Michigan Finance Authority Refunding Bond 2nd Lien Detroit Water & Sewer Series C-7 (Water & Sewer Revenue, National Insured) | | | 5.00 | | | | 7-1-2019 | | | | 2,500,000 | | | | 2,777,950 | |
Michigan Finance Authority Refunding Bond 2nd Lien Detroit Water & Sewer Series C-7 (Water & Sewer Revenue, National Insured) | | | 5.00 | | | | 7-1-2020 | | | | 3,835,000 | | | | 4,290,291 | |
Michigan Finance Authority Refunding Bond 2nd Lien Detroit Water & Sewer Series C-7 (Water & Sewer Revenue, National Insured) | | | 5.00 | | | | 7-1-2021 | | | | 3,095,000 | | | | 3,524,772 | |
The accompanying notes are an integral part of these financial statements.
| | | | | | |
| Portfolio of investments—December 31, 2014 (unaudited) | | Wells Fargo Advantage Short-Term Municipal Bond Fund | | | 19 | |
| | | | | | | | | | | | | | | | |
| Security name | | Interest rate | | | Maturity date | | | Principal | | | Value | |
| | | | | | | | | | | | | | | | |
| | | | |
| Michigan (continued) | | | | | | | | | | | | | | | | |
Michigan Finance Authority Refunding Bond 2nd Lien Detroit Water & Sewer Series C-8 (Water & Sewer Revenue) | | | 5.00 | % | | | 7-1-2016 | | | $ | 2,000,000 | | | $ | 2,103,760 | |
Michigan Finance Authority Refunding Bond 2nd Lien Detroit Water & Sewer Series C-8 (Water & Sewer Revenue) | | | 5.00 | | | | 7-1-2017 | | | | 2,500,000 | | | | 2,695,350 | |
Michigan Finance Authority Refunding Bond 2nd Lien Detroit Water & Sewer Series C-8 (Water & Sewer Revenue) | | | 5.00 | | | | 7-1-2018 | | | | 2,000,000 | | | | 2,193,320 | |
Michigan Finance Authority Refunding Bond Local Government Loan Program Detroit Water & Sewer Series D-1 (Water & Sewer Revenue, AGM Insured) | | | 5.00 | | | | 7-1-2020 | | | | 10,000,000 | | | | 11,429,100 | |
Michigan Finance Authority Refunding Bond Local Government Loan Program Detroit Water & Sewer Series D-3 (Water & Sewer Revenue, National Insured) | | | 5.00 | | | | 7-1-2019 | | | | 7,000,000 | | | | 7,873,740 | |
Michigan Finance Authority Refunding Bond Local Government Loan Program Detroit Water & Sewer Series D-6 (Water & Sewer Revenue, National Insured) | | | 5.00 | | | | 7-1-2019 | | | | 1,500,000 | | | | 1,666,770 | |
Michigan Finance Authority Refunding Bond Local Government Loan Program Detroit Water & Sewer Series D-6 (Water & Sewer Revenue, National Insured) | | | 5.00 | | | | 7-1-2020 | | | | 1,800,000 | | | | 2,013,696 | |
Michigan Finance Authority Refunding Bond Senior Lien Detroit Water & Sewer Series C-3 (Water & Sewer Revenue, AGM Insured) | | | 5.00 | | | | 7-1-2021 | | | | 7,500,000 | | | | 8,623,425 | |
Michigan Finance Authority Refunding Bond Senior Lien Detroit Water & Sewer Series C-5 (Water & Sewer Revenue, National Insured) | | | 5.00 | | | | 7-1-2019 | | | | 7,000,000 | | | | 7,873,740 | |
Michigan Finance Authority Refunding Bond Senior Lien Detroit Water & Sewer Series C-5 (Water & Sewer Revenue, National Insured) | | | 5.00 | | | | 7-1-2020 | | | | 8,720,000 | | | | 9,893,625 | |
Michigan Finance Authority Revenue Exchanged Detroit Bonds Series G-8A (Miscellaneous Revenue, AGM Insured) | | | 5.00 | | | | 4-1-2015 | | | | 963,300 | | | | 970,554 | |
Michigan Finance Authority School District (Miscellaneous Revenue) | | | 4.00 | | | | 6-1-2017 | | | | 800,000 | | | | 845,648 | |
Michigan Finance Authority School District (Miscellaneous Revenue) | | | 5.00 | | | | 6-1-2016 | | | | 1,575,000 | | | | 1,658,806 | |
Michigan Finance Authority School District (Miscellaneous Revenue) | | | 5.00 | | | | 6-1-2017 | | | | 1,500,000 | | | | 1,626,615 | |
Michigan Finance Authority Unemployment Obligation Assessment Series B (Miscellaneous Revenue) | | | 5.00 | | | | 1-1-2020 | | | | 15,000,000 | | | | 17,575,950 | |
Michigan Hospital Finance Authority Sparrow Hospital Obligation (Health Revenue) | | | 5.00 | | | | 11-15-2015 | | | | 1,000,000 | | | | 1,035,110 | |
Michigan Housing Development Authority Limited Greenwood Villa Project (Housing Revenue, AGM Insured) | | | 4.75 | | | | 9-15-2017 | | | | 1,880,000 | | | | 1,953,922 | |
Michigan Municipal Bond Authority Local Government Loan Program Series A (Miscellaneous Revenue, Ambac Insured) | | | 4.25 | | | | 5-1-2015 | | | | 990,000 | | | | 997,504 | |
Michigan Municipal Bond Authority Local Government Loan Program Series A (Miscellaneous Revenue, Ambac Insured) | | | 5.00 | | | | 5-1-2016 | | | | 415,000 | | | | 429,728 | |
Michigan PFOTER Series 4711 (GO, AGM/Qualified School Bond Loan Fund Insured, Dexia Credit Local LIQ) ø144A | | | 0.48 | | | | 5-1-2029 | | | | 30,725,000 | | | | 30,725,000 | |
Michigan State Hospital Finance Authority Ascension Health Series A-3 (Health Revenue) ± | | | 1.87 | | | | 11-1-2027 | | | | 25,500,000 | | | | 26,062,530 | |
Michigan Strategic Fund Limited Obligation Events Center Project Series A (Tax Revenue) ± | | | 4.13 | | | | 7-1-2045 | | | | 23,500,000 | | | | 23,709,620 | |
Rochester MI Community School District (GO, Qualified School Bond Loan Fund Insured) %% | | | 5.00 | | | | 5-1-2017 | | | | 900,000 | | | | 978,003 | |
Rochester MI Community School District (GO, Qualified School Bond Loan Fund Insured) %% | | | 5.00 | | | | 5-1-2019 | | | | 900,000 | | | | 1,021,986 | |
Wayne County MI Airport Authority Refunding Bond Detroit Metropolitan Airport (Airport Revenue, AGC/MBIA/FGIC Insured) | | | 5.00 | | | | 12-1-2015 | | | | 1,110,000 | | | | 1,156,997 | |
Wayne County MI Airport Authority Refunding Bond Series A (Airport Revenue) | | | 5.00 | | | | 12-1-2019 | | | | 19,405,000 | | | | 22,143,628 | |
Wayne County MI Airport Authority Revenue Detroit Met Wayne County Airport (Airport Revenue, National Insured) | | | 4.75 | | | | 12-1-2019 | | | | 3,750,000 | | | | 3,885,263 | |
Wayne County MI Airport Authority Series D (Airport Revenue) | | | 5.00 | | | | 12-1-2015 | | | | 1,290,000 | | | | 1,344,619 | |
Western Michigan University Refunding Bond (Education Revenue) | | | 5.00 | | | | 11-15-2020 | | | | 1,000,000 | | | | 1,162,270 | |
| | | | |
| | | | | | | | | | | | | | | 262,992,391 | |
| | | | | | | | | | | | | | | | |
The accompanying notes are an integral part of these financial statements.
| | | | |
| 20 | | Wells Fargo Advantage Short-Term Municipal Bond Fund | | Portfolio of investments—December 31, 2014 (unaudited) |
| | | | | | | | | | | | | | | | |
| Security name | | Interest rate | | | Maturity date | | | Principal | | | Value | |
| | | | | | | | | | | | | | | | |
| | | | |
| Minnesota: 0.26% | | | | | | | | | | | | | | | | |
Central MN Municipal Power Agency Brookings Southeast Twin Cities Transmission Project (Utilities Revenue) | | | 5.00 | % | | | 1-1-2017 | | | $ | 1,215,000 | | | $ | 1,219,058 | |
Chaska MN Electric Revenue Series A (Utilities Revenue) | | | 5.25 | | | | 10-1-2020 | | | | 1,640,000 | | | | 1,700,319 | |
Minneapolis & St. Paul MN Housing & RDA Children’s Health Care Facilities Series A1 (Health Revenue, AGM Insured) | | | 4.00 | | | | 8-15-2015 | | | | 750,000 | | | | 766,080 | |
Minneapolis & St. Paul MN Housing & RDA Children’s Health Care Facilities Series B (Health Revenue, AGM Insured) ± | | | 5.00 | | | | 8-15-2015 | | | | 600,000 | | | | 616,590 | |
Minneapolis & St. Paul MN Housing & RDA HealthSpan Series B (Health Revenue, Ambac Insured) ±(m)(n) | | | 0.06 | | | | 11-15-2017 | | | | 8,600,000 | | | | 8,256,000 | |
Minneapolis MN Health Care System Fairview Health Services Series B (Health Revenue, National Insured) | | | 5.50 | | | | 5-15-2016 | | | | 2,200,000 | | | | 2,209,350 | |
Northern Minnesota Municipal Power Agency Series 2008A (Utilities Revenue, AGM Insured) | | | 5.00 | | | | 1-1-2018 | | | | 670,000 | | | | 748,169 | |
Saint Paul MN Housing & RDA Community Peace Academy Project Series A (Education Revenue) | | | 5.00 | | | | 12-1-2018 | | | | 1,250,000 | | | | 1,281,450 | |
| | | | |
| | | | | | | | | | | | | | | 16,797,016 | |
| | | | | | | | | | | | | | | | |
| | | | |
| Mississippi: 0.34% | | | | | | | | | | | | | | | | |
Mississippi Development Bank Special Obligation Jackson Water & Sewer System Project (Water & Sewer Revenue, AGM Insured) | | | 5.00 | | | | 12-1-2016 | | | | 495,000 | | | | 533,655 | |
Mississippi Refunding Bond Capital Improvements Projects Series D (Miscellaneous Revenue) ± | | | 0.57 | | | | 9-1-2017 | | | | 6,680,000 | | | | 6,684,542 | |
Perry County MS PCR Leaf River Forest Product Project (Industrial Development Revenue, Georgia-Pacific LLC LOC) ø144A | | | 0.26 | | | | 2-1-2022 | | | | 15,000,000 | | | | 15,000,000 | |
| | | | |
| | | | | | | | | | | | | | | 22,218,197 | |
| | | | | | | | | | | | | | | | |
| | | | |
| Missouri: 0.66% | | | | | | | | | | | | | | | | |
Jackson County MO Special Obligation Harry S.Truman Sports Complex (Tax Revenue, Ambac Insured) | | | 5.00 | | | | 12-1-2019 | | | | 3,000,000 | | | | 3,252,660 | |
Missouri Development Finance Board Refunding Bond & Improvement Electric System Series F (Miscellaneous Revenue) | | | 4.00 | | | | 6-1-2016 | | | | 500,000 | | | | 521,730 | |
Missouri Joint Municipal Electric Utility Commission (Utilities Revenue) | | | 5.00 | | | | 1-1-2015 | | | | 1,380,000 | | | | 1,380,000 | |
Missouri Joint Municipal Electric Utility Commission (Utilities Revenue) | | | 5.00 | | | | 1-1-2016 | | | | 1,910,000 | | | | 1,999,178 | |
Sikeston MO Electric System Refunding Bond (Utilities Revenue) | | | 5.00 | | | | 6-1-2019 | | | | 11,625,000 | | | | 12,770,644 | |
St. Louis MO Municipal Finance Corporation (Miscellaneous Revenue) | | | 5.00 | | | | 2-15-2015 | | | | 1,000,000 | | | | 1,005,530 | |
St. Louis MO Municipal Finance Corporation (Miscellaneous Revenue) | | | 5.00 | | | | 2-15-2016 | | | | 1,000,000 | | | | 1,046,570 | |
St. Louis MO PFOTER Series 004 (Airport Revenue, Dexia Credit Local LOC, AGM Insured, Dexia Credit Local LIQ) ø144A | | | 0.14 | | | | 7-1-2026 | | | | 21,115,000 | | | | 21,115,000 | |
| | | | |
| | | | | | | | | | | | | | | 43,091,312 | |
| | | | | | | | | | | | | | | | |
| | | | |
| Nebraska: 0.18% | | | | | | | | | | | | | | | | |
Central Plains NE Energy Project #1 Series A (Utilities Revenue) | | | 5.00 | | | | 12-1-2015 | | | | 11,630,000 | | | | 12,050,192 | |
| | | | | | | | | | | | | | | | |
| | | | |
| Nevada: 1.01% | | | | | | | | | | | | | | | | |
Clark County NV Airport Jet Aviation Fuel Tax Series A (Airport Revenue) | | | 5.00 | | | | 7-1-2019 | | | | 1,000,000 | | | | 1,134,950 | |
Clark County NV Airport Jet Aviation Fuel Tax Series A (Airport Revenue) | | | 5.00 | | | | 7-1-2020 | | | | 1,000,000 | | | | 1,149,630 | |
Clark County NV Airport Series 11823 (Airport Revenue, Citibank NA LIQ) ø144A | | | 0.24 | | | | 1-1-2018 | | | | 13,050,000 | | | | 13,050,000 | |
Clark County NV School District Series A (GO, National Insured) | | | 5.00 | | | | 6-15-2019 | | | | 9,155,000 | | | | 9,439,537 | |
Clark County NV School District Series B (GO, National Insured) | | | 5.00 | | | | 6-15-2018 | | | | 5,240,000 | | | | 5,403,907 | |
Clark County NV School District Series B (GO) | | | 5.00 | | | | 6-15-2019 | | | | 18,800,000 | | | | 21,634,852 | |
The accompanying notes are an integral part of these financial statements.
| | | | | | |
| Portfolio of investments—December 31, 2014 (unaudited) | | Wells Fargo Advantage Short-Term Municipal Bond Fund | | | 21 | |
| | | | | | | | | | | | | | | | |
| Security name | | Interest rate | | | Maturity date | | | Principal | | �� | Value | |
| | | | | | | | | | | | | | | | |
| | | | |
| Nevada (continued) | | | | | | | | | | | | | | | | |
Clark County NV School District Series B (GO, National Insured) | | | 5.00 | % | | | 6-15-2020 | | | $ | 1,000,000 | | | $ | 1,031,120 | |
Clark County NV School District Series B (GO) | | | 5.00 | | | | 6-15-2021 | | | | 1,400,000 | | | | 1,565,522 | |
Las Vegas NV Special Improvement District #607 (Miscellaneous Revenue) | | | 2.00 | | | | 6-1-2015 | | | | 475,000 | | | | 475,014 | |
Las Vegas NV Special Improvement District #607 (Miscellaneous Revenue) | | | 3.00 | | | | 6-1-2016 | | | | 475,000 | | | | 479,009 | |
Nevada River Commission Hoover Upgrading Project Series E (GO) | | | 5.00 | | | | 10-1-2015 | | | | 4,365,000 | | | | 4,522,751 | |
Nevada River Commission Hoover Upgrading Project Series E (GO) | | | 5.00 | | | | 10-1-2016 | | | | 4,595,000 | | | | 4,957,270 | |
Sparks NV Redevelopment Agency Tax Increment Area #1 (Tax Revenue) | | | 4.00 | | | | 1-15-2015 | | | | 1,520,000 | | | | 1,520,137 | |
| | | | |
| | | | | | | | | | | | | | | 66,363,699 | |
| | | | | | | | | | | | | | | | |
| | | | |
| New Hampshire: 0.42% | | | | | | | | | | | | | | | | |
New Hampshire HEFA Catholic Medical Center (Health Revenue) | | | 4.00 | | | | 7-1-2018 | | | | 2,405,000 | | | | 2,520,248 | |
New Hampshire HEFA Catholic Medical Center (Health Revenue) | | | 4.00 | | | | 7-1-2019 | | | | 2,635,000 | | | | 2,783,825 | |
New Hampshire HEFA University System Series A1 (Education Revenue, U.S. Bank NA SPA) ø | | | 0.06 | | | | 7-1-2035 | | | | 19,500,000 | | | | 19,500,000 | |
New Hampshire HFA SFMR Series B (Housing Revenue) | | | 5.00 | | | | 7-1-2027 | | | | 2,440,000 | | | | 2,564,513 | |
| | | | |
| | | | | | | | | | | | | | | 27,368,586 | |
| | | | | | | | | | | | | | | | |
| | | | |
| New Jersey: 5.40% | | | | | | | | | | | | | | | | |
Camden County NJ Import Authority Health Care Redevelopment Revenue Cooper Health System Group Series B (Health Revenue) | | | 5.25 | | | | 2-15-2020 | | | | 4,505,000 | | | | 4,531,489 | |
Casino Reinvestment Development Authority New Jersey Hotel Room Fee Revenue (Miscellaneous Revenue, Ambac Insured) | | | 5.00 | | | | 1-1-2015 | | | | 2,310,000 | | | | 2,310,000 | |
Casino Reinvestment Development Authority New Jersey Luxury Tax Revenue (Tax Revenue) | | | 4.00 | | | | 11-1-2019 | | | | 1,500,000 | | | | 1,592,145 | |
Casino Reinvestment Development Authority New Jersey Luxury Tax Revenue (Tax Revenue) | | | 4.00 | | | | 11-1-2017 | | | | 1,000,000 | | | | 1,062,270 | |
Hudson County NJ Certificate of Participation (Miscellaneous Revenue, National Insured) | | | 6.25 | | | | 6-1-2016 | | | | 2,000,000 | | | | 2,137,640 | |
Hudson County NJ Refunding Bond County College (GO) | | | 4.00 | | | | 7-15-2017 | | | | 1,000,000 | | | | 1,078,490 | |
Hudson County NJ Refunding Bond County College (GO) | | | 4.00 | | | | 7-15-2018 | | | | 1,135,000 | | | | 1,244,017 | |
Jersey City NJ Refunding Bond (GO, AGM Insured) | | | 4.00 | | | | 9-1-2017 | | | | 1,620,000 | | | | 1,736,429 | |
Morris-Union Jointure Commission New Jersey Refunding Bond (Miscellaneous Revenue, AGM Insured) | | | 4.00 | | | | 8-1-2015 | | | | 750,000 | | | | 763,343 | |
Morris-Union Jointure Commission New Jersey Refunding Bond (Miscellaneous Revenue, AGM Insured) | | | 4.00 | | | | 8-1-2016 | | | | 2,235,000 | | | | 2,326,076 | |
New Jersey Certificate of Participation Equipment Lease Purchase Agreement Series A (Miscellaneous Revenue) | | | 5.00 | | | | 6-15-2018 | | | | 11,160,000 | | | | 12,438,824 | |
New Jersey Economic Development Authority Revenue Series UU (Miscellaneous Revenue) | | | 5.00 | | | | 6-15-2017 | | | | 3,000,000 | | | | 3,278,760 | |
New Jersey EDA Revenue Series UU (Miscellaneous Revenue) | | | 5.00 | | | | 6-15-2018 | | | | 7,355,000 | | | | 8,197,809 | |
New Jersey EDA CAB Saint Barnabas Hospital Series A (Health Revenue, National Insured) ¤ | | | 0.00 | | | | 7-1-2017 | | | | 2,740,000 | | | | 2,640,757 | |
New Jersey EDA Cigarette Tax (Tobacco Revenue) | | | 5.00 | | | | 6-15-2017 | | | | 18,520,000 | | | | 20,156,057 | |
New Jersey EDA Cigarette Tax (Tobacco Revenue, Radian Insured) | | | 5.38 | | | | 6-15-2015 | | | | 8,325,000 | | | | 8,524,550 | |
New Jersey EDA Motor Vehicle Commission Series A (Miscellaneous Revenue, National Insured) | | | 5.25 | | | | 7-1-2016 | | | | 2,190,000 | | | | 2,237,129 | |
New Jersey EDA School Facilities Construction Notes (Miscellaneous Revenue) ± | | | 0.94 | | | | 2-1-2017 | | | | 20,000,000 | | | | 20,027,600 | |
New Jersey EDA School Facilities Construction Notes Series DD1 (Miscellaneous Revenue) | | | 5.00 | | | | 12-15-2018 | | | | 4,400,000 | | | | 4,924,568 | |
New Jersey EDA School Facilities Construction Notes Series K (Miscellaneous Revenue) ± | | | 0.77 | | | | 2-1-2017 | | | | 10,000,000 | | | | 10,014,000 | |
The accompanying notes are an integral part of these financial statements.
| | | | |
| 22 | | Wells Fargo Advantage Short-Term Municipal Bond Fund | | Portfolio of investments—December 31, 2014 (unaudited) |
| | | | | | | | | | | | | | | | |
| Security name | | Interest rate | | | Maturity date | | | Principal | | | Value | |
| | | | | | | | | | | | | | | | |
| | | | |
| New Jersey (continued) | | | | | | | | | | | | | | | | |
New Jersey EDA School Facilities Construction Project Series C (Miscellaneous Revenue) ± | | | 1.83 | % | | | 2-1-2018 | | | $ | 38,000,000 | | | $ | 39,011,560 | |
New Jersey Educational Facilities Authority Higher Education Capital Improvement Project Series A (Education Revenue) | | | 4.00 | | | | 9-1-2017 | | | | 2,425,000 | | | | 2,595,526 | |
New Jersey Educational Facilities Authority Higher Education Capital Improvement Project Series B (Education Revenue) | | | 4.00 | | | | 9-1-2017 | | | | 525,000 | | | | 561,918 | |
New Jersey Educational Facilities Authority Higher Education Capital Improvement Project Series D (Education Revenue) | | | 4.00 | | | | 9-1-2016 | | | | 540,000 | | | | 567,896 | |
New Jersey Educational Facilities Authority Higher Education Capital Improvement Project Series D (Education Revenue) | | | 4.00 | | | | 9-1-2017 | | | | 565,000 | | | | 604,731 | |
New Jersey HCFR Series 3018 (Health Revenue, AGM Insured, Deutsche Bank LIQ) ø144A | | | 0.43 | | | | 7-1-2038 | | | | 21,805,285 | | | | 21,805,285 | |
New Jersey Higher Education Assistance Authority Series A1 (Education Revenue) | | | 3.63 | | | | 12-1-2030 | | | | 4,000,000 | | | | 4,049,400 | |
New Jersey Higher Education Assistance Authority Series A1 (Education Revenue) | | | 5.00 | | | | 12-1-2020 | | | | 9,775,000 | | | | 11,052,104 | |
New Jersey PFOTER Series 4716 (Miscellaneous Revenue, National/FGIC Insured, Dexia Credit Local LIQ) ø144A | | | 0.25 | | | | 9-1-2027 | | | | 36,245,000 | | | | 36,245,000 | |
New Jersey PFOTER Series 4717 (GO, Ambac Insured, Dexia Credit Local LIQ) ø144A | | | 0.13 | | | | 12-15-2022 | | | | 44,955,000 | | | | 44,955,000 | |
New Jersey Tobacco Settlement Financing Corporation Series 1A (Tobacco Revenue) | | | 5.00 | | | | 6-1-2015 | | | | 1,000,000 | | | | 1,017,450 | |
New Jersey Tobacco Settlement Financing Corporation Series C (Tobacco Revenue, Morgan Stanley Bank LIQ) ø144A | | | 0.69 | | | | 6-1-2029 | | | | 18,565,000 | | | | 18,565,000 | |
New Jersey Transit Corporation Federal Transit Administration Grants Series A (Miscellaneous Revenue, National Insured) | | | 5.00 | | | | 9-15-2016 | | | | 5,105,000 | | | | 5,280,561 | |
New Jersey Transit Corporation Federal Transit Administration Grants Series A (Miscellaneous Revenue, National Insured) | | | 5.00 | | | | 9-15-2017 | | | | 7,265,000 | | | | 8,097,496 | |
New Jersey Transit Corporation Series A (Miscellaneous Revenue, Ambac Insured) | | | 5.50 | | | | 9-15-2015 | | | | 1,100,000 | | | | 1,141,701 | |
New Jersey Transportation Program Series AA (Transportation Revenue, National Insured) | | | 4.00 | | | | 6-15-2015 | | | | 1,000,000 | | | | 1,016,720 | |
New Jersey Transportation Program Series B (Transportation Revenue, National Insured) | | | 5.50 | | | | 12-15-2016 | | | | 1,500,000 | | | | 1,633,440 | |
New Jersey Transportation Trust Fund Authority Series AA (Transportation Revenue) | | | 5.00 | | | | 6-15-2019 | | | | 2,070,000 | | | | 2,329,661 | |
New Jersey Turnpike Authority Series B-2 (Transportation Revenue) ± | | | 0.52 | | | | 1-1-2024 | | | | 25,000,000 | | | | 25,023,000 | |
New Jersey Turnpike Authority Series B-3 (Transportation Revenue) ± | | | 0.67 | | | | 1-1-2024 | | | | 4,700,000 | | | | 4,707,849 | |
Newark NJ Housing Authority Newark Redevelopment Project (Miscellaneous Revenue, National Insured) | | | 5.00 | | | | 1-1-2015 | | | | 1,450,000 | | | | 1,450,000 | |
Newark NJ Housing Authority Newark Redevelopment Project (Miscellaneous Revenue, National Insured) | | | 5.00 | | | | 1-1-2016 | | | | 790,000 | | | | 822,817 | |
Newark NJ Housing Authority Newark Redevelopment Project (Miscellaneous Revenue, National Insured) | | | 5.00 | | | | 1-1-2017 | | | | 3,455,000 | | | | 3,703,000 | |
Newark NJ Housing Authority Refunding Newark Redevelopment Project (Miscellaneous Revenue, National Insured) | | | 5.00 | | | | 1-1-2016 | | | | 1,070,000 | | | | 1,114,448 | |
Newark NJ Series D (GO) | | | 1.75 | | | | 12-8-2015 | | | | 2,500,000 | | | | 2,517,900 | |
Rutgers University Series J (Education Revenue) | | | 4.00 | | | | 5-1-2018 | | | | 700,000 | | | | 766,346 | |
Rutgers University Series L (Education Revenue) | | | 5.00 | | | | 5-1-2017 | | | | 600,000 | | | | 659,556 | |
Rutgers University Series L (Education Revenue) | | | 5.00 | | | | 5-1-2018 | | | | 300,000 | | | | 338,754 | |
Winslow Township NJ Board of Education Refunding Bond (GO) | | | 3.00 | | | | 8-1-2017 | | | | 600,000 | | | | 628,686 | |
Winslow Township NJ Board of Education Refunding Bond (GO) | | | 4.00 | | | | 8-1-2018 | | | | 425,000 | | | | 462,107 | |
Winslow Township NJ Board of Education Refunding Bond (GO) | | | 4.00 | | | | 8-1-2019 | | | | 525,000 | | | | 578,702 | |
| | | | |
| | | | | | | | | | | | | | | 354,525,567 | |
| | | | | | | | | | | | | | | | |
| | | | |
| New Mexico: 0.76% | | | | | | | | | | | | | | | | |
Clayton NM Jail Project (Miscellaneous Revenue, CIFG Insured) | | | 5.00 | | | | 11-1-2015 | | | | 875,000 | | | | 899,701 | |
The accompanying notes are an integral part of these financial statements.
| | | | | | |
| Portfolio of investments—December 31, 2014 (unaudited) | | Wells Fargo Advantage Short-Term Municipal Bond Fund | | | 23 | |
| | | | | | | | | | | | | | | | |
| Security name | | Interest rate | | | Maturity date | | | Principal | | | Value | |
| | | | | | | | | | | | | | | | |
| | | | |
| New Mexico (continued) | | | | | | | | | | | | | | | | |
Clayton NM Jail Project (Miscellaneous Revenue, CIFG Insured) | | | 5.00 | % | | | 11-1-2016 | | | $ | 2,100,000 | | | $ | 2,214,324 | |
Farmington NM PCR Series B (Utilities Revenue) ± | | | 4.75 | | | | 6-1-2040 | | | | 5,080,000 | | | | 5,444,033 | |
New Mexico Educational Assistance Foundation Series A2 (Education Revenue) ± | | | 0.89 | | | | 12-1-2028 | | | | 695,000 | | | | 691,511 | |
New Mexico Mortgage Finance Authority SFMR Class I-A-2 (Housing Revenue, GNMA/FNMA/FHLMC Insured) | | | 5.60 | | | | 1-1-2039 | | | | 395,000 | | | | 415,927 | |
New Mexico Mortgage Finance Authority SFMR Class I-D2 (Housing Revenue, GNMA/FNMA/FHLMC Insured) | | | 4.05 | | | | 7-1-2026 | | | | 115,000 | | | | 115,812 | |
New Mexico Municipal Energy Acquisition Authority Gas Supply Sub Series B (Utilities Revenue, Royal Bank of Canada SPA) ± | | | 0.85 | | | | 11-1-2039 | | | | 40,000,000 | | | | 40,257,600 | |
| | | | |
| | | | | | | | | | | | | | | 50,038,908 | |
| | | | | | | | | | | | | | | | |
| | | | |
| New York: 12.41% | | | | | | | | | | | | | | | | |
Branch Banking & Trust Class C (Miscellaneous Revenue, Rabobank LOC) ±144A | | | 0.74 | | | | 11-15-2017 | | | | 21,065,000 | | | | 21,065,000 | |
Branch Banking & Trust Class D (Miscellaneous Revenue, Rabobank LOC) ±144A | | | 0.84 | | | | 11-15-2019 | | | | 6,000,000 | | | | 6,000,000 | |
Deutsche Bank SPEARs/LIFERs Trust Series DBE 1190 (Airport Revenue, Deutsche Bank LIQ) ø144A | | | 0.14 | | | | 12-15-2041 | | | | 15,000,000 | | | | 15,000,000 | |
Liberty Development Corporation New York Series 1207 (Miscellaneous Revenue, Deutsche Bank LIQ) ø144A | | | 0.33 | | | | 10-1-2035 | | | | 5,000,000 | | | | 5,000,000 | |
Long Island NY Power Authority Series C (Utilities Revenue) ± | | | 0.76 | | | | 5-1-2033 | | | | 12,000,000 | | | | 12,003,720 | |
Metropolitan Transportation Authority New York BAN Series A (Transportation Revenue) ±144A | | | 0.69 | | | | 4-19-2015 | | | | 50,000,000 | | | | 50,005,500 | |
Metropolitan Transportation Authority New York Sub Series B3 (Tax Revenue) ± | | | 0.94 | | | | 11-1-2018 | | | | 32,600,000 | | | | 32,766,260 | |
Metropolitan Transportation Authority New York Sub Series B4 (Transportation Revenue) ± | | | 5.00 | | | | 11-15-2030 | | | | 12,445,000 | | | | 14,381,069 | |
Metropolitan Transportation Authority New York Sub Series D2 (Transportation Revenue, AGM Insured) ± | | | 0.71 | | | | 11-1-2032 | | | | 15,000,000 | | | | 15,121,200 | |
Metropolitan Transportation Authority New York Sub Series G-1F (Transportation Revenue) ± | | | 0.58 | | | | 11-1-2026 | | | | 31,925,000 | | | | 31,977,357 | |
Metropolitan Transportation Authority New York Sub Series G3 (Transportation Revenue) ± | | | 0.80 | | | | 11-1-2031 | | | | 16,000,000 | | | | 16,133,440 | |
Metropolitan Transportation Authority New York Sub Series G4 (Transportation Revenue) ± | | | 0.94 | | | | 11-1-2030 | | | | 11,705,000 | | | | 11,870,041 | |
Monroe County NY Airport Authority Greater Rochester International Airport (Airport Revenue, National Insured) | | | 5.75 | | | | 1-1-2015 | | | | 5,030,000 | | | | 5,030,000 | |
Monroe County NY Airport Authority Greater Rochester International Airport (Airport Revenue, National Insured) | | | 5.88 | | | | 1-1-2016 | | | | 3,830,000 | | | | 3,988,064 | |
Nassau County NY General Improvement Bonds Series C (GO) | | | 5.00 | | | | 10-1-2020 | | | | 3,065,000 | | | | 3,484,415 | |
Nassau County NY Local Economic Assistance Winthrop University Hospital Project (Health Revenue) | | | 4.00 | | | | 7-1-2016 | | | | 1,400,000 | | | | 1,460,452 | |
Nassau County NY Series A (GO) | | | 2.00 | | | | 2-2-2015 | | | | 2,500,000 | | | | 2,504,475 | |
Nassau County NY Series F (GO) | | | 5.00 | | | | 10-1-2020 | | | | 1,780,000 | | | | 2,019,677 | |
New York Dormitory Authority Non Miriam Osborn Memorial Home Association (Health Revenue) | | | 2.00 | | | | 7-1-2016 | | | | 1,800,000 | | | | 1,824,300 | |
New York Dormitory Authority North Shore Jewish Series B (Health Revenue) ± | | | 0.89 | | | | 5-1-2018 | | | | 12,805,000 | | | | 12,807,561 | |
New York Energy R&D Authority Electric & Gas Corporation Series A (Utilities Revenue) | | | 2.13 | | | | 3-15-2015 | | | | 19,500,000 | | | | 19,558,305 | |
New York Energy R&D Authority Series A (Resource Recovery Revenue, Ambac Insured) ±(m)(n) | | | 0.42 | | | | 7-1-2015 | | | | 36,000,000 | | | | 36,000,000 | |
New York Environmental Facilities Corporation Municipal Water Series A (Water & Sewer Revenue) | | | 5.00 | | | | 6-15-2017 | | | | 2,250,000 | | | | 2,491,560 | |
New York Environmental Facilities Corporation Municipal Water Series A (Water & Sewer Revenue) | | | 5.00 | | | | 6-15-2018 | | | | 750,000 | | | | 854,678 | |
The accompanying notes are an integral part of these financial statements.
| | | | |
| 24 | | Wells Fargo Advantage Short-Term Municipal Bond Fund | | Portfolio of investments—December 31, 2014 (unaudited) |
| | | | | | | | | | | | | | | | |
| Security name | | Interest rate | | | Maturity date | | | Principal | | | Value | |
| | | | | | | | | | | | | | | | |
| | | | |
| New York (continued) | | | | | | | | | | | | | | | | |
New York Environmental Facilities Corporation Municipal Water Series A (Water & Sewer Revenue) | | | 5.00 | % | | | 6-15-2019 | | | $ | 1,000,000 | | | $ | 1,164,020 | |
New York HFA Manhattan Residential Housing Series A (Housing Revenue, Bank of China LOC) ø | | | 0.22 | | | | 11-1-2049 | | | | 5,000,000 | | | | 5,000,000 | |
New York IDA American Airlines JFK International Airport (Industrial Development Revenue) | | | 7.50 | | | | 8-1-2016 | | | | 6,840,000 | | | | 7,240,619 | |
New York IDA Terminal One Group Association Project (Miscellaneous Revenue) ± | | | 5.50 | | | | 1-1-2020 | | | | 2,000,000 | | | | 2,093,640 | |
New York Local Government Assistance Corporation Series A9V (Tax Revenue, AGM Insured) ±(m)(n) | | | 0.12 | | | | 4-1-2017 | | | | 28,750,000 | | | | 28,318,750 | |
New York NY Adjusted Fiscal 2008 Sub Series C4 (GO, AGM Insured) ±(m) | | | 0.68 | | | | 10-1-2027 | | | | 9,975,000 | | | | 9,975,000 | |
New York NY Adjusted Fiscal 2008 Sub Series J5 (GO, Dexia Credit Local SPA) ø | | | 0.16 | | | | 8-1-2028 | | | | 29,555,000 | | | | 29,555,000 | |
New York NY Adjusted Fiscal 2008 Sub Series J7 (GO) ± | | | 0.51 | | | | 8-1-2021 | | | | 19,000,000 | | | | 19,007,220 | |
New York NY IDA Cong Machne Chaim Incorporated (Miscellaneous Revenue, Sovereign Bank LOC) ø | | | 0.34 | | | | 5-1-2036 | | | | 7,450,000 | | | | 7,450,000 | |
New York NY IDA Refunding Bond Senior Trips Series A (Airport Revenue) | | | 5.00 | | | | 7-1-2016 | | | | 2,250,000 | | | | 2,367,405 | |
New York NY IDA Refunding Bond Senior Trips Series A (Airport Revenue) | | | 5.00 | | | | 7-1-2017 | | | | 2,000,000 | | | | 2,159,860 | |
New York NY IDA Refunding Bond Terminal One Group Association Project (Miscellaneous Revenue) ± | | | 5.50 | | | | 1-1-2021 | | | | 6,940,000 | | | | 7,271,385 | |
New York NY Municipal Water Finance Authority Series AA2 (Water & Sewer Revenue, Dexia Credit Local SPA) ø | | | 0.11 | | | | 6-15-2032 | | | | 25,425,000 | | | | 25,425,000 | |
New York NY Municipal Water Finance Authority Series AA3 (Water & Sewer Revenue, Dexia Credit Local SPA) ø | | | 0.16 | | | | 6-15-2032 | | | | 11,550,000 | | | | 11,550,000 | |
New York NY Sub Series A-6 (GO, AGM Insured, Dexia Credit Local SPA) ø | | | 0.16 | | | | 11-1-2026 | | | | 10,495,000 | | | | 10,495,000 | |
New York NY Sub Series J-11 (GO) ± | | | 0.62 | | | | 8-1-2027 | | | | 18,960,000 | | | | 18,909,566 | |
New York NY Sub Series J-4 (GO) ± | | | 0.59 | | | | 8-1-2025 | | | | 2,000,000 | | | | 1,998,240 | |
New York NY Sub Series L-5 (GO, Dexia Credit Local SPA) ø | | | 0.16 | | | | 4-1-2035 | | | | 9,000,000 | | | | 9,000,000 | |
New York NY Transitional Finance Authority NYC Recovery Series 3 (Tax Revenue, Dexia Credit Local SPA) ø | | | 0.20 | | | | 11-1-2022 | | | | 19,605,000 | | | | 19,605,000 | |
New York NY Transitional Finance Authority Sub Series 2B (Tax Revenue, Dexia Credit Local SPA) ø | | | 0.20 | | | | 11-1-2022 | | | | 24,550,000 | | | | 24,550,000 | |
New York NY Transitional Finance Authority Sub Series A3 (Tax Revenue, Dexia Credit Local SPA) ø | | | 0.16 | | | | 8-1-2023 | | | | 34,000,000 | | | | 34,000,000 | |
New York NY Transitional Finance Authority Sub Series C3 (Tax Revenue, Dexia Credit Local SPA) ø | | | 0.20 | | | | 8-1-2031 | | | | 33,650,000 | | | | 33,650,000 | |
New York Refunding Bond 2015 Series A (GO) | | | 5.00 | | | | 8-1-2021 | | | | 7,515,000 | | | | 8,935,260 | |
New York Tobacco Settlement Financing Corporation Series B (Tobacco Revenue) | | | 5.00 | | | | 6-1-2017 | | | | 6,500,000 | | | | 7,161,960 | |
New York Urban Development Corporation Certificate of Participation James A. Farley Post Office Building Refinancing (Miscellaneous Revenue) | | | 4.00 | | | | 2-1-2015 | | | | 33,370,000 | | | | 33,403,704 | |
Niagara Falls NY Bridge Commission Series B (Transportation Revenue, National Insured) | | | 5.25 | | | | 10-1-2015 | | | | 60,000 | | | | 61,458 | |
Oyster Bay NY Public Improvement Series B (GO, AGM Insured) | | | 3.00 | | | | 11-1-2018 | | | | 1,140,000 | | | | 1,197,775 | |
Rockland County NY (GO, Build America Mutual Assurance Company Insured) | | | 3.00 | | | | 2-15-2018 | | | | 2,475,000 | | | | 2,588,578 | |
Rockland County NY (GO, Build America Mutual Assurance Company Insured) | | | 3.00 | | | | 2-15-2019 | | | | 1,830,000 | | | | 1,917,053 | |
Rockland County NY (GO, Build America Mutual Assurance Company Insured) | | | 3.00 | | | | 2-15-2020 | | | | 630,000 | | | | 659,396 | |
Suffolk County NY Economic Development Catholic Health Services (Health Revenue) | | | 5.00 | | | | 7-1-2016 | | | | 1,250,000 | | | | 1,330,838 | |
Suffolk County NY Judicial Facilities Agency Leases H. Lee Dennison Building (Miscellaneous Revenue) | | | 5.00 | | | | 11-1-2016 | | | | 2,245,000 | | | | 2,390,139 | |
Suffolk County NY Judicial Facilities Agency Leases H. Lee Dennison Building (Miscellaneous Revenue) | | | 5.00 | | | | 11-1-2017 | | | | 2,365,000 | | | | 2,571,890 | |
Suffolk County NY Judicial Facilities Agency Leases H. Lee Dennison Building (Miscellaneous Revenue) | | | 5.00 | | | | 11-1-2018 | | | | 2,640,000 | | | | 2,917,015 | |
The accompanying notes are an integral part of these financial statements.
| | | | | | |
| Portfolio of investments—December 31, 2014 (unaudited) | | Wells Fargo Advantage Short-Term Municipal Bond Fund | | | 25 | |
| | | | | | | | | | | | | | | | |
| Security name | | Interest rate | | | Maturity date | | | Principal | | | Value | |
| | | | | | | | | | | | | | | | |
| | | | |
| New York (continued) | | | | | | | | | | | | | | | | |
Suffolk County NY Judicial Facilities Agency Leases H. Lee Dennison Building (Miscellaneous Revenue) | | | 5.00 | % | | | 11-1-2019 | | | $ | 2,775,000 | | | $ | 3,101,340 | |
Suffolk County NY Judicial Facilities Agency Leases H. Lee Dennison Building (Miscellaneous Revenue) | | | 5.00 | | | | 11-1-2020 | | | | 2,915,000 | | | | 3,287,012 | |
Suffolk County NY Public Improvement Series A (GO) | | | 4.00 | | | | 5-15-2018 | | | | 1,615,000 | | | | 1,757,217 | |
Suffolk County NY Refunding Bond (GO, AGM Insured) | | | 5.00 | | | | 2-1-2016 | | | | 4,185,000 | | | | 4,394,083 | |
Suffolk County NY Refunding Bond (GO, AGM Insured) | | | 5.00 | | | | 2-1-2017 | | | | 1,500,000 | | | | 1,630,200 | |
Suffolk County NY Refunding Bond Series A (GO) | | | 5.00 | | | | 4-1-2018 | | | | 2,700,000 | | | | 3,018,249 | |
Suffolk County NY Refunding Bond Series A (GO) | | | 5.00 | | | | 4-1-2019 | | | | 1,385,000 | | | | 1,578,955 | |
Suffolk County NY Refunding Bond Series B (GO) | | | 4.00 | | | | 10-1-2015 | | | | 1,000,000 | | | | 1,026,740 | |
Suffolk County NY TAN (GO) | | | 2.00 | | | | 7-30-2015 | | | | 17,000,000 | | | | 17,147,220 | |
Tobacco Settlement Financing Corporation Asset Backed Revenue Bonds Series B (Tobacco Revenue) | | | 5.00 | | | | 6-1-2019 | | | | 12,025,000 | | | | 12,259,608 | |
Tobacco Settlement Financing Corporation Asset Backed Revenue Bonds Series B (Tobacco Revenue) | | | 5.00 | | | | 6-1-2020 | | | | 20,000,000 | | | | 21,285,800 | |
Triborough Bridge & Tunnel Authority New York Refunding Bond Sub Series ABCD-3 (Transportation Revenue, AGM Insured) ± | | | 0.29 | | | | 1-1-2017 | | | | 3,500,000 | | | | 3,498,915 | |
Triborough Bridge & Tunnel Authority New York Refunding Bond Sub Series BE (Transportation Revenue) ± | | | 0.75 | | | | 1-1-2032 | | | | 31,200,000 | | | | 31,367,856 | |
Troy NY Troy Capital Resource Corporation Series B (Education Revenue) | | | 5.00 | | | | 9-1-2015 | | | | 2,000,000 | | | | 2,062,040 | |
Westchester County NY Westchester County Healthcare Corporation Series B (Health Revenue) | | | 5.00 | | | | 11-1-2015 | | | | 3,000,000 | | | | 3,108,660 | |
Yonkers NY IDA Series A (GO) | | | 5.00 | | | | 10-1-2015 | | | | 2,295,000 | | | | 2,375,463 | |
Yonkers NY IDA Series A (GO) | | | 5.00 | | | | 10-1-2016 | | | | 2,000,000 | | | | 2,146,380 | |
| | | | |
| | | | | | | | | | | | | | | 814,313,583 | |
| | | | | | | | | | | | | | | | |
| | | | |
| North Carolina: 0.65% | | | | | | | | | | | | | | | | |
North Carolina Eastern Municipal Power Agency Series C (Utilities Revenue, AGM Insured) | | | 6.00 | | | | 1-1-2019 | | | | 735,000 | | | | 791,191 | |
North Carolina Eastern Municipal Power Agency Series D (Utilities Revenue) | | | 5.00 | | | | 1-1-2016 | | | | 5,000,000 | | | | 5,234,450 | |
North Carolina Eastern Municipal Power Agency Series D (Utilities Revenue) | | | 5.00 | | | | 1-1-2017 | | | | 10,000,000 | | | | 10,835,800 | |
North Carolina Grant Anticipation Capital Improvement (Miscellaneous Revenue) ± | | | 4.00 | | | | 3-1-2023 | | | | 11,500,000 | | | | 12,326,045 | |
North Carolina Medical Care Commission Healthcare Facilities Series A (Health Revenue, JPMorgan Chase & Company SPA) ø | | | 0.06 | | | | 11-1-2034 | | | | 12,350,000 | | | | 12,350,000 | |
North Carolina Medical Care Commission Novant Health Obligated Group Series A (Health Revenue) | | | 4.00 | | | | 11-1-2017 | | | | 1,330,000 | | | | 1,435,203 | |
| | | | |
| | | | | | | | | | | | | | | 42,972,689 | |
| | | | | | | | | | | | | | | | |
| | | | |
| North Dakota: 0.10% | | | | | | | | | | | | | | | | |
Fargo ND Sanford Health System (Health Revenue) | | | 4.00 | | | | 11-1-2015 | | | | 4,115,000 | | | | 4,243,347 | |
Ward County ND HCFA Trinity Obligated Group (Health Revenue) | | | 5.13 | | | | 7-1-2018 | | | | 1,000,000 | | | | 1,043,530 | |
Ward County ND HCFA Trinity Obligated Group (Health Revenue) | | | 5.25 | | | | 7-1-2015 | | | | 1,375,000 | | | | 1,403,243 | |
| | | | |
| | | | | | | | | | | | | | | 6,690,120 | |
| | | | | | | | | | | | | | | | |
| | | | |
| Ohio: 3.02% | | | | | | | | | | | | | | | | |
Cleveland OH Airport System (Airport Revenue) | | | 4.00 | | | | 1-1-2015 | | | | 5,245,000 | | | | 5,245,000 | |
Cleveland OH Municipal School District (GO, South Dakota Credit Program Insured) | | | 4.00 | | | | 12-1-2015 | | | | 1,640,000 | | | | 1,691,348 | |
Cleveland OH Municipal School District (GO, South Dakota Credit Program Insured) | | | 5.00 | | | | 12-1-2016 | | | | 1,705,000 | | | | 1,845,969 | |
Franklin County OH Hospital Current Refunding Ohio Health Corporation Series B (Health Revenue) ± | | | 5.00 | | | | 11-15-2033 | | | | 16,705,000 | | | | 18,460,361 | |
The accompanying notes are an integral part of these financial statements.
| | | | |
| 26 | | Wells Fargo Advantage Short-Term Municipal Bond Fund | | Portfolio of investments—December 31, 2014 (unaudited) |
| | | | | | | | | | | | | | | | |
| Security name | | Interest rate | | | Maturity date | | | Principal | | | Value | |
| | | | | | | | | | | | | | | | |
| | | | |
| Ohio (continued) | | | | | | | | | | | | | | | | |
Lancaster OH Port Authority Gas Supply (Utilities Revenue) ± | | | 0.82 | % | | | 5-1-2038 | | | $ | 73,500,000 | | | $ | 73,907,190 | |
Lorain County OH Port Authority EDA Series A (Health Revenue) | | | 4.00 | | | | 11-15-2018 | | | | 670,000 | | | | 713,945 | |
Montgomery County OH Catholic Health Initiatives Series A (Health Revenue, Morgan Stanley Bank LIQ) ø144A | | | 0.21 | | | | 5-1-2034 | | | | 13,565,000 | | | | 13,565,000 | |
Montgomery County OH Catholic Health Initiatives Series A (Health Revenue) | | | 4.00 | | | | 5-1-2015 | | | | 1,625,000 | | | | 1,627,600 | |
Montgomery County OH Catholic Health Initiatives Series C2 (Health Revenue, U.S. Bank NA SPA) ø | | | 0.10 | | | | 10-1-2041 | | | | 20,000,000 | | | | 20,000,000 | |
Muskingum County OH Hospital Facilities Genesis Healthcare System Project (Health Revenue) | | | 5.00 | | | | 2-15-2016 | | | | 750,000 | | | | 775,763 | |
Muskingum County OH Hospital Facilities Genesis Healthcare System Project (Health Revenue) | | | 5.00 | | | | 2-15-2017 | | | | 1,575,000 | | | | 1,665,232 | |
Muskingum County OH Hospital Facilities Genesis Healthcare System Project (Health Revenue) | | | 5.00 | | | | 2-15-2018 | | | | 1,000,000 | | | | 1,075,590 | |
Ohio Air Quality Development Authority Pollution Control Facilities Refunding Bond FirstEnergy Generation Project (Resource Recovery Revenue) ± | | | 3.10 | | | | 3-1-2023 | | | | 10,000,000 | | | | 10,243,800 | |
Ohio Higher Educational Facility Commission University Hospital Health System Series C (Health Revenue) ± | | | 4.88 | | | | 1-15-2039 | | | | 2,050,000 | | | | 2,100,943 | |
Ohio Higher Educational Facility Commission University of Dayton Project Series B (Education Revenue) ± | | | 1.29 | | | | 7-1-2016 | | | | 10,000,000 | | | | 10,016,800 | |
Ohio Water Development Authority Pollution Control Facilities Refunding Bond FirstEnergy Generation Project Series A (Water & Sewer Revenue) | | | 3.00 | | | | 5-15-2019 | | | | 30,000,000 | | | | 30,767,400 | |
Warren County OH HCFR Otterbein Homes Series A (Health Revenue) | | | 5.00 | | | | 7-1-2018 | | | | 2,000,000 | | | | 2,230,560 | |
Warren County OH HCFR Otterbein Homes Series A (Health Revenue) | | | 5.00 | | | | 7-1-2019 | | | | 2,215,000 | | | | 2,509,817 | |
| | | | |
| | | | | | | | | | | | | | | 198,442,318 | |
| | | | | | | | | | | | | | | | |
| | | | |
| Oklahoma: 0.45% | | | | | | | | | | | | | | | | |
Cleveland County OK Educational Facilities Authority Norman Public Schools Project (Miscellaneous Revenue) | | | 5.00 | | | | 7-1-2018 | | | | 2,650,000 | | | | 2,982,496 | |
Cleveland County OK Educational Facilities Authority Norman Public Schools Project (Miscellaneous Revenue) | | | 5.00 | | | | 7-1-2019 | | | | 2,000,000 | | | | 2,290,360 | |
Oklahoma City OK Industrial & Cultural Facilities Series B (Health Revenue, National Insured) ±(m)(n) | | | 0.09 | | | | 6-1-2019 | | | | 17,650,000 | | | | 17,120,500 | |
Tulsa OK Airports Improvement Trust Series A (Airport Revenue) | | | 4.00 | | | | 6-1-2017 | | | | 3,715,000 | | | | 3,868,652 | |
Tulsa OK Airports Improvement Trust Series A (Airport Revenue, Build America Mutual Assurance Company Insured) | | | 5.00 | | | | 6-1-2018 | | | | 530,000 | | | | 584,277 | |
Tulsa OK Airports Improvement Trust Series A (Airport Revenue, Build America Mutual Assurance Company Insured) | | | 5.00 | | | | 6-1-2020 | | | | 695,000 | | | | 787,484 | |
Woodward County OK PFFA Series B (Tax Revenue) | | | 3.25 | | | | 9-1-2026 | | | | 2,000,000 | | | | 2,013,840 | |
| | | | |
| | | | | | | | | | | | | | | 29,647,609 | |
| | | | | | | | | | | | | | | | |
| | | | |
| Other: 0.57% | | | | | | | | | | | | | | | | |
Branch Banking & Trust Municipal Trust Various States Class C (Miscellaneous Revenue, Rabobank LOC) ø144A | | | 0.64 | | | | 2-1-2016 | | | | 9,690,000 | | | | 9,690,000 | |
Branch Banking & Trust Municipal Trust Various States Class D (Miscellaneous Revenue, Rabobank LOC) ± | | | 0.79 | | | | 12-1-2017 | | | | 13,745,000 | | | | 13,745,000 | |
Public Housing Capital Fund Trust I (Miscellaneous Revenue, HUD Insured) 144A | | | 4.50 | | | | 7-1-2022 | | | | 10,417,264 | | | | 10,814,161 | |
Public Housing Capital Fund Trust II (Miscellaneous Revenue, HUD Insured) 144A | | | 4.50 | | | | 7-1-2022 | | | | 3,144,306 | | | | 3,148,834 | |
| | | | |
| | | | | | | | | | | | | | | 37,397,995 | |
| | | | | | | | | | | | | | | | |
The accompanying notes are an integral part of these financial statements.
| | | | | | |
| Portfolio of investments—December 31, 2014 (unaudited) | | Wells Fargo Advantage Short-Term Municipal Bond Fund | | | 27 | |
| | | | | | | | | | | | | | | | |
| Security name | | Interest rate | | | Maturity date | | | Principal | | | Value | |
| | | | | | | | | | | | | | | | |
| | | | |
| Pennsylvania: 4.05% | | | | | | | | | | | | | | | | |
Allegheny County PA Airport Authority PFOTER Series 3965 (Airport Revenue, National Insured, Dexia Credit Local LIQ) ø | | | 0.28 | % | | | 1-1-2020 | | | $ | 1,810,000 | | | $ | 1,810,000 | |
Allegheny County PA Airport Authority Pittsburgh International Airport (Airport Revenue, AGM Insured) | | | 5.00 | | | | 1-1-2015 | | | | 1,000,000 | | | | 1,000,000 | |
Allegheny County PA Airport Authority Pittsburgh International Airport (Airport Revenue, FGIC Insured) | | | 5.00 | | | | 1-1-2017 | | | | 2,500,000 | | | | 2,679,450 | |
Allegheny County PA IDA Carnegie Museums of Pittsburgh (Miscellaneous Revenue, Citizens Bank LOC) ø | | | 0.09 | | | | 8-1-2032 | | | | 16,295,000 | | | | 16,295,000 | |
Allegheny County PA Series C-68 (GO) | | | 5.00 | | | | 11-1-2017 | | | | 1,340,000 | | | | 1,491,715 | |
Beaver County PA IDA FirstEnergy Nuclear Series B (Industrial Development Revenue) ± | | | 3.50 | | | | 12-1-2035 | | | | 4,300,000 | | | | 4,432,096 | |
Chester PA EDA (Miscellaneous Revenue, Municipal Government Guaranty Insured) | | | 7.00 | | | | 3-1-2019 | | | | 7,435,000 | | | | 7,465,335 | |
Commonwealth Financing Authority Pennsylvania Series 2962 (Miscellaneous Revenue, AGM Insured, JPMorgan Chase & Company LIQ) ø144A | | | 0.14 | | | | 12-1-2015 | | | | 9,850,000 | | | | 9,850,000 | |
Cumberland County PA Municipal Authority Diakon Lutheran (Health Revenue) | | | 5.00 | | | | 1-1-2015 | | | | 2,310,000 | | | | 2,310,000 | |
Delaware County PA Authority Elwyn Project (Housing Revenue) | | | 4.00 | | | | 6-1-2016 | | | | 1,650,000 | | | | 1,713,509 | |
Delaware County PA IDA Resource Recovery Facility Series A (Resource Recovery Revenue) | | | 6.20 | | | | 7-1-2019 | | | | 2,560,000 | | | | 2,562,304 | |
Delaware Valley PA Regional Finance Authority (Miscellaneous Revenue, Ambac Insured) | | | 5.50 | | | | 8-1-2018 | | | | 1,250,000 | | | | 1,398,763 | |
Delaware Valley PA Regional Finance Authority (Miscellaneous Revenue) | | | 5.75 | | | | 7-1-2017 | | | | 8,650,000 | | | | 9,571,225 | |
Delaware Valley PA Regional Finance Authority (Miscellaneous Revenue, Ambac Insured) | | | 5.60 | | | | 7-1-2017 | | | | 5,015,000 | | | | 5,507,272 | |
Erie PA Higher Education Building Authority Mercyhurst College Project (Education Revenue) | | | 5.00 | | | | 3-15-2018 | | | | 1,075,000 | | | | 1,152,024 | |
Hempfield PA School District (GO) ±%% | | | 0.47 | | | | 8-1-2017 | | | | 3,770,000 | | | | 3,767,135 | |
Lackawanna County PA Riverside School District Project (GO, Build America Mutual Assurance Company Insured) | | | 4.00 | | | | 10-15-2019 | | | | 1,400,000 | | | | 1,540,616 | |
Lackawanna County PA Riverside School District Project (GO, Build America Mutual Assurance Company Insured) | | | 4.00 | | | | 10-15-2020 | | | | 1,455,000 | | | | 1,606,771 | |
Manheim Township PA School District Series A (GO) ± | | | 0.51 | | | | 5-1-2025 | | | | 4,700,000 | | | | 4,703,619 | |
Montgomery County PA IDA (Health Revenue, FHA Insured) | | | 5.00 | | | | 8-1-2015 | | | | 2,495,000 | | | | 2,563,438 | |
Nazareth PA Area School District (GO) ±%% | | | 0.63 | | | | 2-1-2031 | | | | 15,075,000 | | | | 15,056,910 | |
Northampton County PA General Purpose Hospital Authority St. Luke’s Hospital Project Series C (Health Revenue) ± | | | 4.50 | | | | 8-15-2032 | | | | 1,425,000 | | | | 1,501,622 | |
Pennsylvania EDFA Colver Project Series F (Resource Recovery Revenue, Ambac Insured) | | | 5.00 | | | | 12-1-2015 | | | | 1,675,000 | | | | 1,723,022 | |
Pennsylvania EDFA PPL Energy Supply LLC Series C (Utilities Revenue) ± | | | 3.00 | | | | 12-1-2037 | | | | 5,000,000 | | | | 5,054,600 | |
Pennsylvania HEFAR Foundation Indiana University PA Series A (Education Revenue, Syncora Guarantee Incorporated Insured) ± | | | 0.61 | | | | 7-1-2017 | | | | 2,460,000 | | | | 2,461,574 | |
Pennsylvania HEFAR Temple University (Education Revenue, National Insured) | | | 5.00 | | | | 4-1-2020 | | | | 745,000 | | | | 787,361 | |
Pennsylvania Public School Building Project (Miscellaneous Revenue, Dexia Credit Local LOC, AGM Insured) ø144A | | | 0.51 | | | | 6-1-2023 | | | | 15,785,000 | | | | 15,785,000 | |
Pennsylvania Turnpike Commission Series A (Transportation Revenue) ± | | | 0.64 | | | | 12-1-2017 | | | | 14,765,000 | | | | 14,831,443 | |
Pennsylvania Turnpike Commission Series B (Transportation Revenue) ± | | | 0.81 | | | | 6-1-2015 | | | | 13,770,000 | | | | 13,776,610 | |
Pennsylvania Turnpike Commission Series B (Transportation Revenue) ± | | | 1.19 | | | | 12-1-2019 | | | | 18,100,000 | | | | 18,513,404 | |
Pennsylvania Turnpike Commission Series B (Transportation Revenue) ± | | | 1.31 | | | | 12-1-2020 | | | | 11,250,000 | | | | 11,516,625 | |
Philadelphia PA Gas Works 17th Series 1975 General Ordinance (Utilities Revenue, AGM Insured) | | | 5.38 | | | | 7-1-2016 | | | | 5,000,000 | | | | 5,342,750 | |
Philadelphia PA Gas Works 4th Series 1998 General Ordinance (Utilities Revenue, AGM Insured) | | | 5.25 | | | | 8-1-2015 | | | | 1,150,000 | | | | 1,154,646 | |
The accompanying notes are an integral part of these financial statements.
| | | | |
| 28 | | Wells Fargo Advantage Short-Term Municipal Bond Fund | | Portfolio of investments—December 31, 2014 (unaudited) |
| | | | | | | | | | | | | | | | |
| Security name | | Interest rate | | | Maturity date | | | Principal | | | Value | |
| | | | | | | | | | | | | | | | |
| | | | |
| Pennsylvania (continued) | | | | | | | | | | | | | | | | |
Philadelphia PA Gas Works Revenue Refunding Bonds 10th Series 1998 (Utilities Revenue, AGM Insured) | | | 5.00 | % | | | 7-1-2019 | | | $ | 2,500,000 | | | $ | 2,842,000 | |
Philadelphia PA Gas Works Series 1998 General Ordinance (Utilities Revenue) | | | 5.00 | | | | 8-1-2015 | | | | 2,000,000 | | | | 2,051,880 | |
Philadelphia PA Hospital & HEFAR Temple University Health System Series B (Health Revenue) | | | 5.00 | | | | 7-1-2015 | | | | 1,500,000 | | | | 1,523,265 | |
Philadelphia PA Hospital & HEFAR Temple University Health System Series B (Health Revenue) | | | 5.00 | | | | 7-1-2016 | | | | 1,500,000 | | | | 1,565,715 | |
Philadelphia PA Hospital & HEFAR Temple University Health System Series B (Health Revenue) | | | 5.00 | | | | 7-1-2018 | | | | 8,385,000 | | | | 9,109,716 | |
Philadelphia PA Housing Authority (Housing Revenue, AGM Insured) | | | 5.25 | | | | 12-1-2017 | | | | 2,335,000 | | | | 2,344,457 | |
Philadelphia PA RDA Transformation Initiative (Miscellaneous Revenue) | | | 5.00 | | | | 4-15-2015 | | | | 1,000,000 | | | | 1,013,220 | |
Philadelphia PA RDA Transformation Initiative (Miscellaneous Revenue) | | | 5.00 | | | | 4-15-2016 | | | | 1,370,000 | | | | 1,443,775 | |
Philadelphia PA RDA Transformation Initiative (Miscellaneous Revenue) | | | 5.00 | | | | 4-15-2017 | | | | 1,500,000 | | | | 1,623,000 | |
Philadelphia PA School District Series C (GO) | | | 5.00 | | | | 9-1-2019 | | | | 5,945,000 | | | | 6,766,837 | |
Philadelphia PA School District Series A (GO, Ambac Insured) | | | 5.00 | | | | 8-1-2015 | | | | 10,105,000 | | | | 10,381,473 | |
Philadelphia PA School District Series A (GO, Ambac Insured) | | | 5.00 | | | | 8-1-2016 | | | | 5,210,000 | | | | 5,352,129 | |
Philadelphia PA School District Series B (GO, AGM Insured) | | | 5.00 | | | | 6-1-2015 | | | | 4,655,000 | | | | 4,743,026 | |
Philadelphia PA School District Series C (GO) | | | 5.00 | | | | 9-1-2017 | | | | 1,500,000 | | | | 1,655,070 | |
Philadelphia PA Series A (GO, AGM Insured) | | | 5.00 | | | | 12-15-2015 | | | | 1,315,000 | | | | 1,373,097 | |
Philadelphia PA Series A (GO) | | | 5.00 | | | | 7-15-2017 | | | | 1,000,000 | | | | 1,103,970 | |
Philadelphia PA Series A (GO) | | | 5.00 | | | | 7-15-2018 | | | | 1,000,000 | | | | 1,129,530 | |
Philadelphia PA Series A (GO, AGM Insured) | | | 5.00 | | | | 8-1-2019 | | | | 4,550,000 | | | | 4,971,467 | |
Pittsburgh PA Series A (GO) | | | 4.00 | | | | 9-1-2015 | | | | 825,000 | | | | 846,021 | |
Pittsburgh PA Series A (GO) | | | 4.00 | | | | 9-1-2016 | | | | 600,000 | | | | 634,008 | |
Reading PA Parking Authority CAB (Transportation Revenue, National Insured) ¤ | | | 0.00 | | | | 11-15-2019 | | | | 1,000,000 | | | | 877,400 | |
State Public School Building Authority Pennsylvania Philadelphia School District Project (Miscellaneous Revenue) | | | 5.00 | | | | 4-1-2015 | | | | 1,900,000 | | | | 1,922,724 | |
State Public School Building Authority Pennsylvania Philadelphia School District Project (Miscellaneous Revenue) | | | 5.00 | | | | 4-1-2016 | | | | 2,855,000 | | | | 3,014,309 | |
State Public School Building Authority Pennsylvania Philadelphia School District Project (Miscellaneous Revenue) | | | 5.00 | | | | 4-1-2017 | | | | 2,685,000 | | | | 2,919,562 | |
Susquehanna PA Regional Airport Authority Sub Series C (Airport Revenue) | | | 3.00 | | | | 1-1-2017 | | | | 2,245,000 | | | | 2,305,278 | |
Westmoreland County PA IDA Excela Health Project (Health Revenue) | | | 4.00 | | | | 7-1-2015 | | | | 1,435,000 | | | | 1,459,108 | |
| | | | |
| | | | | | | | | | | | | | | 265,897,876 | |
| | | | | | | | | | | | | | | | |
| | | | |
| Puerto Rico: 1.85% | | | | | | | | | | | | | | | | |
Commonwealth of Puerto Rico Government Development Bank Refunding Bond (Miscellaneous Revenue, National Insured) ± | | | 4.75 | | | | 12-1-2015 | | | | 23,470,000 | | | | 23,550,267 | |
Commonwealth of Puerto Rico Highway & Transportation Authority Refunding Bond Series AA (Transportation Revenue, National Insured) | | | 5.50 | | | | 7-1-2017 | | | | 7,885,000 | | | | 7,986,007 | |
Commonwealth of Puerto Rico Public Improvement Refunding Bond Series A (Tax Revenue, National Insured) | | | 5.50 | | | | 7-1-2016 | | | | 3,925,000 | | | | 4,021,398 | |
Puerto Rico Electric Power Authority Refunding Bond Series KK (Utilities Revenue, National Insured) | | | 5.50 | | | | 7-1-2016 | | | | 25,690,000 | | | | 26,510,539 | |
Puerto Rico Electric Power Authority Refunding Bond Series LL (Utilities Revenue, National Insured) | | | 5.50 | | | | 7-1-2017 | | | | 16,825,000 | | | | 17,501,029 | |
Puerto Rico Electric Power Authority Refunding Bond Series SS (Utilities Revenue, National Insured) | | | 4.25 | | | | 7-1-2017 | | | | 550,000 | | | | 551,216 | |
Puerto Rico Government Development Bank Series 3402 (Miscellaneous Revenue, Morgan Stanley Bank LIQ) ø144A | | | 0.50 | | | | 6-30-2015 | | | | 26,750,000 | | | | 26,750,000 | |
Puerto Rico HFA Unrefunded Balance Capital Funding Program (Housing Revenue) | | | 5.00 | | | | 12-1-2018 | | | | 900,000 | | | | 902,520 | |
The accompanying notes are an integral part of these financial statements.
| | | | | | |
| Portfolio of investments—December 31, 2014 (unaudited) | | Wells Fargo Advantage Short-Term Municipal Bond Fund | | | 29 | |
| | | | | | | | | | | | | | | | |
| Security name | | Interest rate | | | Maturity date | | | Principal | | | Value | |
| | | | | | | | | | | | | | | | |
| | | | |
| Puerto Rico (continued) | | | | | | | | | | | | | | | | |
Puerto Rico HFA Unrefunded Balance Capital Funding Program (Housing Revenue) | | | 5.00 | % | | | 12-1-2019 | | | $ | 1,050,000 | | | $ | 1,052,940 | |
Puerto Rico Highway & Transportation Authority Refunding Bond Series Z (Miscellaneous Revenue, National Insured) | | | 6.25 | | | | 7-1-2015 | | | | 2,225,000 | | | | 2,229,873 | |
Puerto Rico Public Buildings Authority Government Facilities Refunding Bond Series F (Miscellaneous Revenue, CIFG Insured) | | | 5.25 | | | | 7-1-2017 | | | | 10,200,000 | | | | 10,231,008 | |
| | | | |
| | | | | | | | | | | | | | | 121,286,797 | |
| | | | | | | | | | | | | | | | |
| | | | |
| Rhode Island: 0.20% | | | | | | | | | | | | | | | | |
Rhode Island Health & Educational Building Corporation Hospital Financing Revenue Refunding Bonds Lifespan Obligated Group Issue Series A (Health Revenue, AGM Insured) | | | 5.00 | | | | 5-15-2018 | | | | 4,300,000 | | | | 4,527,040 | |
Rhode Island Health & Educational Building Corporation Providence Public Schools Program Series A (Miscellaneous Revenue) | | | 3.00 | | | | 5-15-2015 | | | | 2,480,000 | | | | 2,501,328 | |
Rhode Island Health & Educational Building Corporation Providence Public Schools Program Series A (Miscellaneous Revenue) | | | 4.00 | | | | 5-15-2016 | | | | 3,015,000 | | | | 3,141,570 | |
Rhode Island Health & Educational Building Corporation Providence Public Schools Program Series A (Miscellaneous Revenue) | | | 4.00 | | | | 5-15-2017 | | | | 1,500,000 | | | | 1,596,600 | |
Rhode Island Health & Educational Building Corporation Providence Public Schools Program Series A (Miscellaneous Revenue) | | | 5.00 | | | | 5-15-2019 | | | | 1,000,000 | | | | 1,126,130 | |
| | | | |
| | | | | | | | | | | | | | | 12,892,668 | |
| | | | | | | | | | | | | | | | |
| | | | |
| South Carolina: 0.32% | | | | | | | | | | | | | | | | |
Connector 2000 Association Incorporated CAB Series A (Transportation Revenue) ¤ | | | 0.00 | | | | 1-1-2015 | | | | 119,099 | | | | 109,619 | |
Connector 2000 Association Incorporated CAB Series A (Transportation Revenue) ¤ | | | 0.00 | | | | 1-1-2016 | | | | 132,758 | | | | 111,490 | |
Connector 2000 Association Incorporated CAB Series A (Transportation Revenue) ¤ | | | 0.00 | | | | 1-1-2017 | | | | 179,606 | | | | 136,447 | |
Connector 2000 Association Incorporated CAB Series A (Transportation Revenue) ¤ | | | 0.00 | | | | 1-1-2018 | | | | 198,490 | | | | 134,854 | |
Piedmont Municipal Power Agency South Carolina Unrefunded Balance 2004 Series A (Utilities Revenue, FGIC Insured) | | | 6.50 | | | | 1-1-2016 | | | | 1,860,000 | | | | 1,971,284 | |
Scago SC Educational Facilities Corporation Calhoun School District Project (Miscellaneous Revenue, Radian Insured) | | | 5.00 | | | | 12-1-2021 | | | | 2,500,000 | | | | 2,593,225 | |
South Carolina Jobs EDA Anmed Health Project (Health Revenue) | | | 3.00 | | | | 2-1-2015 | | | | 225,000 | | | | 225,457 | |
South Carolina Jobs EDA Anmed Health Project (Health Revenue) | | | 5.00 | | | | 2-1-2015 | | | | 1,145,000 | | | | 1,149,351 | |
South Carolina Jobs EDA Brashier Charter LLC Project (Education Revenue, SunTrust Bank LOC) ø | | | 0.22 | | | | 12-1-2038 | | | | 3,920,000 | | | | 3,920,000 | |
South Carolina Public Service Authority Refunding Notes (Water & Sewer Revenue, AGM/Ambac Insured, Citibank NA LIQ) ø144A | | | 0.19 | | | | 1-1-2016 | | | | 10,780,000 | | | | 10,780,000 | |
| | | | |
| | | | | | | | | | | | | | | 21,131,727 | |
| | | | | | | | | | | | | | | | |
| | | | |
| Tennessee: 1.83% | | | | | | | | | | | | | | | | |
Clarksville TN Natural Gas Acquisition Corporation (Utilities Revenue) | | | 5.00 | | | | 12-15-2016 | | | | 3,230,000 | | | | 3,479,905 | |
Clarksville TN Natural Gas Acquisition Corporation (Utilities Revenue) | | | 5.00 | | | | 12-15-2017 | | | | 1,330,000 | | | | 1,457,760 | |
Clarksville TN Water Sewer & Gas Refunding Bond (Water & Sewer Revenue) | | | 4.00 | | | | 2-1-2017 | | | | 835,000 | | | | 889,517 | |
Knox County TN Health, Educational, & Housing Facilities Board University Health Systems Incorporated (Health Revenue) | | | 5.00 | | | | 4-1-2019 | | | | 1,425,000 | | | | 1,522,142 | |
Lewisburg TN Industrial Development Board Waste Management Project (Resource Recovery Revenue) ± | | | 0.37 | | | | 7-2-2035 | | | | 2,000,000 | | | | 1,999,960 | |
Memphis-Shelby County TN Airport Authority Series A1 (Airport Revenue) | | | 5.75 | | | | 7-1-2019 | | | | 1,500,000 | | | | 1,752,885 | |
Memphis-Shelby County TN Airport Authority Series B (Airport Revenue) | | | 5.38 | | | | 7-1-2018 | | | | 1,000,000 | | | | 1,128,000 | |
Memphis-Shelby County TN Airport Authority Series B (Airport Revenue) | | | 5.50 | | | | 7-1-2019 | | | | 1,505,000 | | | | 1,742,549 | |
Memphis-Shelby County TN Industrial Development Board Boys & Girls Club Series A (Miscellaneous Revenue, SunTrust Bank LOC) ø | | | 0.22 | | | | 1-1-2028 | | | | 4,530,000 | | | | 4,530,000 | |
The accompanying notes are an integral part of these financial statements.
| | | | |
| 30 | | Wells Fargo Advantage Short-Term Municipal Bond Fund | | Portfolio of investments—December 31, 2014 (unaudited) |
| | | | | | | | | | | | | | | | |
| Security name | | Interest rate | | | Maturity date | | | Principal | | | Value | |
| | | | | | | | | | | | | | | | |
| | | | |
| Tennessee (continued) | | | | | | | | | | | | | | | | |
Nashville TN Davidson County HEFA Vanderbilt University Series B (Education Revenue) ± | | | 0.64 | % | | | 10-1-2038 | | | $ | 11,000,000 | | | $ | 11,043,450 | |
Shelby County TN Health Educational & Housing Facilities Series A (Health Revenue) | | | 5.00 | | | | 9-1-2015 | | | | 2,750,000 | | | | 2,834,535 | |
Tennessee Energy Acquisition Corporation Series A (Utilities Revenue) | | | 5.00 | | | | 9-1-2015 | | | | 19,040,000 | | | | 19,541,323 | |
Tennessee Energy Acquisition Corporation Series A (Utilities Revenue) | | | 5.00 | | | | 9-1-2016 | | | | 7,330,000 | | | | 7,795,162 | |
Tennessee Energy Acquisition Corporation Series A (Utilities Revenue) | | | 5.25 | | | | 9-1-2017 | | | | 5,440,000 | | | | 6,009,459 | |
Tennessee Energy Acquisition Corporation Series A (Utilities Revenue) | | | 5.25 | | | | 9-1-2018 | | | | 3,300,000 | | | | 3,756,687 | |
Tennessee Energy Acquisition Corporation Series A (Utilities Revenue) | | | 5.25 | | | | 9-1-2019 | | | | 6,225,000 | | | | 7,092,765 | |
Tennessee Energy Acquisition Corporation Series C (Utilities Revenue) | | | 5.00 | | | | 2-1-2015 | | | | 12,575,000 | | | | 12,617,161 | |
Tennessee Energy Acquisition Corporation Series C (Utilities Revenue) | | | 5.00 | | | | 2-1-2017 | | | | 14,000,000 | | | | 15,077,720 | |
Tennessee Energy Acquisition Corporation Series C (Utilities Revenue) | | | 5.00 | | | | 2-1-2018 | | | | 8,895,000 | | | | 9,867,312 | |
Tennessee Energy Acquisition Corporation Series C (Utilities Revenue) | | | 5.00 | | | | 2-1-2019 | | | | 5,085,000 | | | | 5,659,503 | |
| | | | |
| | | | | | | | | | | | | | | 119,797,795 | |
| | | | | | | | | | | | | | | | |
| | | | |
| Texas: 9.54% | | | | | | | | | | | | | | | | |
Arlington TX Special Obligation Dallas Cowboys Series A
(Tax Revenue, National Insured) | | | 5.00 | | | | 8-15-2034 | | | | 420,000 | | | | 430,479 | |
Central Texas Regional Mobility Authority Senior Lien (Transportation Revenue) ± | | | 3.00 | | | | 1-1-2045 | | | | 8,000,000 | | | | 8,085,200 | |
Central Texas Regional Mobility Authority Senior Lien (Transportation Revenue) | | | 5.00 | | | | 1-1-2017 | | | | 1,500,000 | | | | 1,628,355 | |
Central Texas Regional Mobility Authority Senior Lien (Transportation Revenue) | | | 5.75 | | | | 1-1-2017 | | | | 500,000 | | | | 546,335 | |
Central Texas Regional Mobility Authority Sub Lien (Transportation Revenue) | | | 5.00 | | | | 1-1-2016 | | | | 250,000 | | | | 258,743 | |
Central Texas Regional Mobility Authority Sub Lien (Transportation Revenue) | | | 5.00 | | | | 1-1-2018 | | | | 250,000 | | | | 271,315 | |
Central Texas Regional Mobility Authority Sub Lien (Transportation Revenue) | | | 5.00 | | | | 1-1-2019 | | | | 750,000 | | | | 826,815 | |
Clear Creek TX Independent School District Series B (GO) ± | | | 3.00 | | | | 2-15-2032 | | | | 3,000,000 | | | | 3,208,890 | |
Cypress Fairbanks TX School District (GO) ± | | | 3.00 | | | | 2-15-2036 | | | | 3,450,000 | | | | 3,669,558 | |
Cypress Fairbanks TX School District (GO) | | | 4.25 | | | | 2-15-2021 | | | | 2,775,000 | | | | 2,976,437 | |
Dallas-Forth Worth TX International Airport Facilities Series 2001-A1
(Industrial Development Revenue) | | | 6.15 | | | | 1-1-2016 | | | | 3,000,000 | | | | 3,040,950 | |
Denton TX Independent School District Series B (GO) ± | | | 2.00 | | | | 8-1-2044 | | | | 39,075,000 | | | | 39,661,125 | |
Eagle Mountain & Saginaw TX Independent School District (GO) ± | | | 2.00 | | | | 8-1-2050 | | | | 12,150,000 | | | | 12,397,131 | |
Harris County TX Cultural Education Facilities Finance Corporation Memorial Hermann Health Systems Series A (Health Revenue) | | | 3.13 | | | | 6-1-2015 | | | | 2,290,000 | | | | 2,317,434 | |
Harris County TX Health Facilities Development Corporation Revenue (Health Revenue, Dexia Credit Local LIQ) ø144A | | | 0.18 | | | | 7-1-2027 | | | | 3,955,000 | | | | 3,955,000 | |
Houston TX Airport System Refunding Bond United Airlines Incorporated Terminal E Project (Airport Revenue) | | | 4.50 | | | | 7-1-2020 | | | | 2,000,000 | | | | 2,126,020 | |
Houston TX Higher Education Finance Corporation Refunding Bonds Rice University Series B (Education Revenue) ± | | | 0.57 | | | | 5-15-2048 | | | | 20,000,000 | | | | 20,109,800 | |
Houston TX Housing Finance Corporation Series A (Housing Revenue,
GNMA/FNMA Insured) ± | | | 6.75 | | | | 6-1-2033 | | | | 345,000 | | | | 355,950 | |
Houston TX Independent School District Limited Tax (GO) | | | 4.25 | | | | 2-15-2021 | | | | 5,075,000 | | | | 5,432,179 | |
Houston TX Utility System Revenue Series C (Water & Sewer Revenue) ± | | | 0.64 | | | | 5-15-2034 | | | | 90,000,000 | | | | 90,305,100 | |
Laredo TX Public Property Finance Contractual Obligation (GO) | | | 3.88 | | | | 2-15-2018 | | | | 2,735,000 | | | | 2,920,077 | |
Love Field TX Airport Modernization Corporation Southwest Airlines Company Project (Airport Revenue) | | | 5.00 | | | | 11-1-2016 | | | | 5,000,000 | | | | 5,338,700 | |
Lower Colorado River Texas Revenue Authority Unrefunded Balance 2012 Series A (Miscellaneous Revenue, AGM Insured) | | | 5.88 | | | | 5-15-2015 | | | | 1,510,000 | | | | 1,517,067 | |
Mansfield TX Independent School District (GO) ± | | | 1.75 | | | | 8-1-2042 | | | | 8,245,000 | | | | 8,418,145 | |
North East TX Independent School District Series A (GO) ± | | | 2.00 | | | | 8-1-2042 | | | | 25,000,000 | | | | 25,625,000 | |
North Texas Health Facilities Development Corporation United Regional Health Care System (Health Revenue, AGM Insured) | | | 5.00 | | | | 9-1-2017 | | | | 850,000 | | | | 933,632 | |
The accompanying notes are an integral part of these financial statements.
| | | | | | |
| Portfolio of investments—December 31, 2014 (unaudited) | | Wells Fargo Advantage Short-Term Municipal Bond Fund | | | 31 | |
| | | | | | | | | | | | | | | | |
| Security name | | Interest rate | | | Maturity date | | | Principal | | | Value | |
| | | | | | | | | | | | | | | | |
| | | | |
| Texas (continued) | | | | | | | | | | | | | | | | |
North Texas Higher Education Authority Incorporated Student Loan Series 1 Class A1 (Education Revenue) ± | | | 0.64 | % | | | 7-1-2019 | | | $ | 300,000 | | | $ | 300,000 | |
North Texas Higher Education Authority Incorporated Student Loan Series 2 Class A (Education Revenue) ± | | | 1.24 | | | | 4-1-2037 | | | | 9,805,000 | | | | 9,805,196 | |
North Texas Tollway Authority Refunding Bond Series A (Transportation Revenue) ± | | | 0.84 | | | | 1-1-2050 | | | | 5,000,000 | | | | 5,000,550 | |
Northside TX Independent School District Building Project (GO) ± | | | 2.00 | | | | 8-1-2044 | | | | 20,000,000 | | | | 20,389,000 | |
Pflugerville TX Independent School District Series A (GO) ± | | | 2.00 | | | | 8-15-2039 | | | | 27,000,000 | | | | 27,446,310 | |
Port Arthur TX Navigation District Jefferson County Environmental Facilities Motiva Enterprises LLC Project Series A (Resource Recovery Revenue) ø | | | 0.20 | | | | 12-1-2039 | | | | 13,600,000 | | | | 13,600,000 | |
Port Arthur TX Navigation District Jefferson County Environmental Facilities Motiva Enterprises LLC Project Series C (Resource Recovery Revenue) ø | | | 0.20 | | | | 12-1-2039 | | | | 13,625,000 | | | | 13,625,000 | |
Port Arthur TX Navigation District Jefferson County Environmental Facilities Motiva Enterprises LLC Project Series D (Industrial Development Revenue) ø | | | 0.20 | | | | 11-1-2040 | | | | 24,930,000 | | | | 24,930,000 | |
Port Arthur TX Navigation District Jefferson County Environmental Facilities Motiva Enterprises LLC Project Series E (Industrial Development Revenue) ø | | | 0.20 | | | | 11-1-2040 | | | | 10,000,000 | | | | 10,000,000 | |
San Antonio TX Electric & Gas Revenue Junior Lien Series A (Utilities Revenue) ± | | | 2.00 | | | | 12-1-2027 | | | | 20,320,000 | | | | 20,800,974 | |
San Antonio TX Electric & Gas Revenue Junior Lien Series B (Utilities Revenue) ±%% | | | 0.41 | | | | 2-1-2033 | | | | 26,700,000 | | | | 26,715,486 | |
San Antonio TX Energy Acquisition Public Facility Corporation (Utilities Revenue) | | | 5.25 | | | | 8-1-2018 | | | | 510,000 | | | | 579,013 | |
Tarrant County TX Cultural Education Facilities Finance Corporation Texas Health Resources Series B (Health Revenue) ø | | | 0.18 | | | | 11-15-2047 | | | | 11,500,000 | | | | 11,500,000 | |
Tarrant County TX Cultural Education Facilities Finance Corporation Texas Health Resources Series C (Health Revenue, JPMorgan Chase & Company SPA) ø | | | 0.14 | | | | 11-15-2033 | | | | 6,600,000 | | | | 6,600,000 | |
Tarrant County TX ECFA Hendrick Medical Center Group (Health Revenue) | | | 5.00 | | | | 9-1-2019 | | | | 655,000 | | | | 750,067 | |
Tarrant County TX ECFA Hendrick Medical Center Group (Health Revenue) | | | 5.00 | | | | 9-1-2020 | | | | 920,000 | | | | 1,068,552 | |
Texas Affordable Housing Corporation (Housing Revenue, GNMA/FNMA Insured) | | | 5.50 | | | | 9-1-2038 | | | | 130,000 | | | | 133,714 | |
Texas Municipal Gas Acquisition & Supply Corporation II Series 2007-042-1993B (Utilities Revenue, BNP Paribas LIQ) 144Aø | | | 0.19 | | | | 9-15-2018 | | | | 31,000,000 | | | | 31,000,000 | |
Texas Municipal Gas Acquisition & Supply Corporation II Series A (Utilities Revenue, JPMorgan Chase & Company Guaranteed) ± | | | 0.86 | | | | 9-15-2017 | | | | 3,960,000 | | | | 3,957,822 | |
Texas Municipal Gas Acquisition & Supply Corporation II Series B (Utilities Revenue, JPMorgan Chase & Company Guaranteed) ± | | | 0.50 | | | | 9-15-2017 | | | | 38,500,000 | | | | 38,552,360 | |
Texas Municipal Gas Acquisition & Supply Corporation III (Utilities Revenue) | | | 5.00 | | | | 12-15-2016 | | | | 500,000 | | | | 535,150 | |
Texas Municipal Gas Acquisition & Supply Corporation III (Utilities Revenue) | | | 5.00 | | | | 12-15-2017 | | | | 6,450,000 | | | | 7,093,517 | |
Texas Municipal Gas Acquisition & Supply Corporation III (Utilities Revenue) | | | 5.00 | | | | 12-15-2018 | | | | 4,500,000 | | | | 5,035,320 | |
Texas Municipal Gas Acquisition & Supply Corporation III (Utilities Revenue) | | | 5.00 | | | | 12-15-2019 | | | | 7,000,000 | | | | 7,980,000 | |
Texas Municipal Gas Acquisition & Supply Corporation Senior Lien Series A (Utilities Revenue) | | | 5.25 | | | | 12-15-2017 | | | | 1,745,000 | | | | 1,925,625 | |
Texas Municipal Gas Acquisition & Supply Corporation Senior Lien Series B (Utilities Revenue) ± | | | 0.71 | | | | 12-15-2017 | | | | 705,000 | | | | 703,844 | |
Texas PFA Assessment Unemployment Compensation Series B (Miscellaneous Revenue) | | | 4.00 | | | | 1-1-2018 | | | | 14,000,000 | | | | 14,722,680 | |
Texas PFA Southern University Financing System (Education Revenue, Build America Mutual Assurance Company Insured) | | | 5.00 | | | | 11-1-2017 | | | | 3,000,000 | | | | 3,271,140 | |
Texas PFA Southern University Financing System (Education Revenue, Build America Mutual Assurance Company Insured) | | | 5.00 | | | | 11-1-2018 | | | | 3,395,000 | | | | 3,732,803 | |
Texas PFA Southern University Financing System (Education Revenue, Build America Mutual Assurance Company Insured) | | | 5.00 | | | | 11-1-2019 | | | | 2,375,000 | | | | 2,640,929 | |
Texas Transportation Commission State Highway Series B (Transportation Revenue,
Banco Bilboa Vizcaya SPA) ø | | | 0.28 | | | | 4-1-2026 | | | | 28,650,000 | | | | 28,650,000 | |
Texas Transportation Commission Turnpike System First Tier PUTTER Series B
(Transportation Revenue) ± | | | 1.25 | | | | 8-15-2042 | | | | 4,000,000 | | | | 4,003,960 | |
Tomball TX Independent School District Series B2 (GO) ± | | | 3.00 | | | | 2-15-2039 | | | | 10,000,000 | | | | 10,608,900 | |
The accompanying notes are an integral part of these financial statements.
| | | | |
| 32 | | Wells Fargo Advantage Short-Term Municipal Bond Fund | | Portfolio of investments—December 31, 2014 (unaudited) |
| | | | | | | | | | | | | | | | |
| Security name | | Interest rate | | | Maturity date | | | Principal | | | Value | |
| | | | | | | | | | | | | | | | |
| | | | |
| Texas (continued) | | | | | | | | | | | | | | | | |
Waco TX Educational Finance Corporation Baylor University Series A
(Education Revenue, Bank of New York Mellon SPA) ø | | | 0.03 | % | | | 2-1-2032 | | | $ | 19,000,000 | | | $ | 19,000,000 | |
Walnut Creek TX Special Utility District (Water & Sewer Revenue, Build America Mutual Assurance Company Insured) | | | 3.00 | | | | 1-10-2017 | | | | 405,000 | | | | 421,062 | |
Walnut Creek TX Special Utility District (Water & Sewer Revenue, Build America Mutual Assurance Company Insured) | | | 4.00 | | | | 1-10-2018 | | | | 640,000 | | | | 689,581 | |
Walnut Creek TX Special Utility District (Water & Sewer Revenue, Build America Mutual Assurance Company Insured) | | | 4.00 | | | | 1-10-2019 | | | | 1,010,000 | | | | 1,101,809 | |
Walnut Creek TX Special Utility District (Water & Sewer Revenue, Build America Mutual Assurance Company Insured) | | | 4.00 | | | | 1-10-2020 | | | | 500,000 | | | | 549,975 | |
| | | | |
| | | | | | | | | | | | | | | 625,775,776 | |
| | | | | | | | | | | | | | | | |
| | | | |
| Utah: 0.02% | | | | | | | | | | | | | | | | |
Utah Charter School Finance Authority North Davis Preparatory (Education Revenue) | | | 5.00 | | | | 7-15-2015 | | | | 180,000 | | | | 181,831 | |
Utah Charter School Finance Authority Summit Academy Series A (Education Revenue) | | | 5.13 | | | | 6-15-2017 | | | | 920,000 | | | | 954,978 | |
| | | | |
| | | | | | | | | | | | | | | 1,136,809 | |
| | | | | | | | | | | | | | | | |
| | | | |
| Vermont: 0.40% | | | | | | | | | | | | | | | | |
Vermont Student Assistance Corporation Education Loan Revenue Series BCL-A1 (Education Revenue) ± | | | 1.74 | | | | 6-1-2022 | | | | 26,021,093 | | | | 26,064,548 | |
| | | | | | | | | | | | | | | | |
| | | | |
| Virgin Islands: 0.13% | | | | | | | | | | | | | | | | |
Virgin Islands PFA Sub Lien Series C (Miscellaneous Revenue) | | | 5.00 | | | | 10-1-2016 | | | | 7,500,000 | | | | 7,914,750 | |
Virgin Islands PFA Sub Matching Fund Loan Notes Series A (Tax Revenue) | | | 5.00 | | | | 10-1-2015 | | | | 620,000 | | | | 638,519 | |
| | | | |
| | | | | | | | | | | | | | | 8,553,269 | |
| | | | | | | | | | | | | | | | |
| | | | |
| Virginia: 0.45% | | | | | | | | | | | | | | | | |
Albemarle County VA Industrial Development Revenue Jefferson Scholars Foundation Project (Miscellaneous Revenue, SunTrust Bank LOC) ø | | | 0.22 | | | | 10-1-2037 | | | | 7,050,000 | | | | 7,050,000 | |
Breater Richmond VA Convention Center Authority Hotel Tax Revenue
(Tax Revenue) %% | | | 5.00 | | | | 6-15-2020 | | | | 1,000,000 | | | | 1,153,300 | |
Charles City VA EDA Solid Waste Disposal Waste Management Incorporated (Resource Recovery Revenue) ± | | | 1.60 | | | | 8-1-2027 | | | | 3,150,000 | | | | 3,151,701 | |
Fairfax County VA EDA Mount Vernon Ladies Association Project (Industrial Development Revenue, SunTrust Bank LOC) ø | | | 0.22 | | | | 6-1-2037 | | | | 13,200,000 | | | | 13,200,000 | |
Gloucester County VA EDA Solid Waste Disposal Revenue Waste Management Services Series A (Resource Recovery Revenue) ± | | | 1.60 | | | | 9-1-2038 | | | | 1,000,000 | | | | 1,006,260 | |
Greater Richmond VA Convention Center Authority Hotel Tax Revenue
(Tax Revenue) %% | | | 5.00 | | | | 6-15-2019 | | | | 1,250,000 | | | | 1,420,050 | |
Marquis VA CDA CAB Series A (Tax Revenue) (i) | | | 5.10 | | | | 9-1-2036 | | | | 2,169,000 | | | | 1,966,524 | |
Marquis VA CDA CAB Series C (Tax Revenue) ¤(i) | | | 0.00 | | | | 9-1-2041 | | | | 3,493,000 | | | | 494,888 | |
| | | | |
| | | | | | | | | | | | | | | 29,442,723 | |
| | | | | | | | | | | | | | | | |
| | | | |
| Washington: 0.20% | | | | | | | | | | | | | | | | |
Port Bellingham WA Industrial Development Corporation BP West Coast Products LLC (Industrial Development Revenue) | | | 5.00 | | | | 1-1-2016 | | | | 12,500,000 | | | | 13,059,125 | |
Port Kalama WA Series B (Airport Revenue) | | | 5.25 | | | | 12-1-2015 | | | | 175,000 | | | | 182,215 | |
| | | | |
| | | | | | | | | | | | | | | 13,241,340 | |
| | | | | | | | | | | | | | | | |
The accompanying notes are an integral part of these financial statements.
| | | | | | |
| Portfolio of investments—December 31, 2014 (unaudited) | | Wells Fargo Advantage Short-Term Municipal Bond Fund | | | 33 | |
| | | | | | | | | | | | | | | | |
| Security name | | Interest rate | | | Maturity date | | | Principal | | | Value | |
| | | | | | | | | | | | | | | | |
| | | | |
| West Virginia: 0.04% | | | | | | | | | | | | | | | | |
West Virginia Economic Development Authority Poll Control Revenue Appalachian Power Company Series D (Resource Recovery Revenue) | | | 3.25 | % | | | 5-1-2019 | | | $ | 2,745,000 | | | $ | 2,862,102 | |
| | | | | | | | | | | | | | | | |
| | | | |
| Wisconsin: 1.63% | | | | | | | | | | | | | | | | |
Deutsche Bank SPEARs/LIFERs Trust Series DBE 1348 (Miscellaneous Revenue, Deutsche Bank LIQ) ±144A | | | 0.25 | | | | 6-1-2049 | | | | 25,315,000 | | | | 25,315,000 | |
Deutsche Bank SPEARs/LIFERs Trust Series DBE 1228 (Housing Revenue, Deutsche Bank LIQ) ø144A | | | 0.52 | | | | 12-1-2048 | | | | 19,835,000 | | | | 19,835,000 | |
Milwaukee WI RDA Public Schools Refunding Bond Series A
(Miscellaneous Revenue) | | | 5.00 | | | | 8-1-2018 | | | | 5,070,000 | | | | 5,705,930 | |
Milwaukee WI RDA Wisconsin Housing Preservation Corporation (Housing Revenue, Johnson Bank LOC) ø | | | 0.96 | | | | 12-1-2038 | | | | 1,530,000 | | | | 1,530,000 | |
Racine WI Elderly Housing Authority Wisconsin Housing Preservation Corporation (Housing Revenue, Johnson Bank LOC) ø | | | 0.96 | | | | 10-1-2042 | | | | 2,240,000 | | | | 2,240,000 | |
Wisconsin Airport Facilities PFA Senior Obligation Group Series B
(Airport Revenue) | | | 5.00 | | | | 7-1-2022 | | | | 10,080,000 | | | | 11,210,270 | |
Wisconsin HEFA Ascension Health Alliance Series B (Health Revenue) ± | | | 4.00 | | | | 11-15-2043 | | | | 13,000,000 | | | | 14,440,530 | |
Wisconsin HEFA Medical College Incorporated (Health Revenue) | | | 4.00 | | | | 12-1-2015 | | | | 1,310,000 | | | | 1,347,676 | |
Wisconsin HEFA Mercy Alliance Incorporated Project Series A (Health Revenue) | | | 5.00 | | | | 6-1-2019 | | | | 4,140,000 | | | | 4,293,180 | |
Wisconsin HEFA Ministry Healthcare Series A (Health Revenue) | | | 5.00 | | | | 8-15-2015 | | | | 1,750,000 | | | | 1,801,398 | |
Wisconsin HEFA Ministry Healthcare Series C (Health Revenue) | | | 5.00 | | | | 8-15-2016 | | | | 500,000 | | | | 535,610 | |
Wisconsin HEFA Unity Point Health Facilities Series B (Health Revenue) ø | | | 0.12 | | | | 12-1-2041 | | | | 9,000,000 | | | | 9,000,000 | |
Wisconsin HEFA Vernon Memorial Healthcare Incorporated (Health Revenue) | | | 4.00 | | | | 3-1-2016 | | | | 100,000 | | | | 103,558 | |
Wisconsin HEFA Vernon Memorial Healthcare Incorporated (Health Revenue) | | | 4.00 | | | | 3-1-2017 | | | | 200,000 | | | | 211,398 | |
Wisconsin HEFA Vernon Memorial Healthcare Incorporated (Health Revenue) | | | 4.00 | | | | 3-1-2018 | | | | 300,000 | | | | 321,030 | |
Wisconsin HEFA Vernon Memorial Healthcare Incorporated (Health Revenue) | | | 4.00 | | | | 3-1-2019 | | | | 300,000 | | | | 322,713 | |
Wisconsin HEFA Vernon Memorial Healthcare Incorporated (Health Revenue) | | | 5.00 | | | | 3-1-2020 | | | | 200,000 | | | | 224,496 | |
Wisconsin HEFA Wheaton Franciscan Healthcare (Health Revenue) | | | 5.25 | | | | 8-15-2017 | | | | 8,230,000 | | | | 8,807,170 | |
| | | | |
| | | | | | | | | | | | | | | 107,244,959 | |
| | | | | | | | | | | | | | | | |
| | | | |
| Wyoming: 0.23% | | | | | | | | | | | | | | | | |
Sweetwater County WY Pollution Control Refunding PacifiCorp Project Series A (Industrial Development Revenue) ø | | | 0.22 | | | | 1-1-2017 | | | | 15,000,000 | | | | 15,000,000 | |
| | | | | | | | | | | | | | | | |
| | | | |
Total Municipal Obligations (Cost $6,458,226,252) | | | | | | | | | | | | | | | 6,508,006,950 | |
| | | | | | | | | | | | | | | | |
| | | | |
| Other: 0.99% | | | | | | | | | | | | | | | | |
Nuveen California AMT-Free Municipal Income Fund, Institutional MuniFund Term Preferred Shares ±144A§ | | | 0.51 | | | | 7-1-2018 | | | | 3,000,000 | | | | 2,997,600 | |
Nuveen Dividend Advantage Municipal Fund 3, Institutional MuniFund Term Preferred Shares ±144A | | | 0.79 | | | | 10-1-2017 | | | | 62,000,000 | | | | 62,003,100 | |
| | | | |
Total Other (Cost $65,000,000) | | | | | | | | | | | | | | | 65,000,700 | |
| | | | | | | | | | | | | | | | |
| | | | |
| | | Yield | | | | | | Shares | | | | |
| Short-Term Investments: 1.04% | | | | | | | | | | | | | | | | |
| | | | |
| Investment Companies: 1.04% | | | | | | | | | | | | | | | | |
Wells Fargo Advantage National Tax-Free Money Market Fund, Institutional Class (l)(u)## | | | 0.01 | | | | | | | | 68,578,517 | | | | 68,578,517 | |
| | | | | | | | | | | | | | | | |
| | | | |
Total Short-Term Investments (Cost $68,578,517) | | | | | | | | | | | | | | | 68,578,517 | |
| | | | | | | | | | | | | | | | |
| | | | | | | | |
| Total investments in securities (Cost $6,591,804,769) * | | | 101.22 | % | | | 6,641,586,167 | |
Other assets and liabilities, net | | | (1.22 | ) | | | (80,130,988 | ) |
| | | | | | | | |
| Total net assets | | | 100.00 | % | | $ | 6,561,455,179 | |
| | | | | | | | |
The accompanying notes are an integral part of these financial statements.
| | | | |
| 34 | | Wells Fargo Advantage Short-Term Municipal Bond Fund | | Portfolio of investments—December 31, 2014 (unaudited) |
| ± | Variable rate investment. The rate shown is the rate in effect at period end. |
| ø | Variable rate demand notes are subject to a demand feature which reduces the effective maturity. The maturity date shown represents the final maturity date of the security. The interest rate is determined and reset by the issuer daily, weekly, or monthly depending upon the terms of the security. The rate shown is the rate in effect at period end. |
| 144A | The security may be resold in transactions exempt from registration, normally to qualified institutional buyers, pursuant to Rule 144A under the Securities Act of 1933. |
| ¤ | The security is issued in zero coupon form with no periodic interest payments. |
| (m) | The security is an auction-rate security which has an interest rate that resets at predetermined short-term intervals through a Dutch auction. The rate shown is the rate in effect at period end. |
| %% | The security is issued on a when-issued basis. |
| (n) | The auction to set the interest rate on the security failed at period end due to insufficient investor interest. A failed auction does not itself cause a default. |
| § | The security is subject to a demand feature which reduces the effective maturity. |
| (l) | The security represents an affiliate of the Fund as defined in the Investment Company Act of 1940. |
| (u) | The rate represents the 7-day annualized yield at period end. |
| ## | All or a portion of this security is segregated for when-issued securities. |
| * | Cost for federal income tax purposes is $6,591,873,733 and unrealized gains (losses) consists of: |
| | | | |
Gross unrealized gains | | $ | 55,968,672 | |
Gross unrealized losses | | | (6,256,238 | ) |
| | | | |
Net unrealized gains | | $ | 49,712,434 | |
The accompanying notes are an integral part of these financial statements.
| | | | | | |
| Statement of assets and liabilities—December 31, 2014 (unaudited) | | Wells Fargo Advantage Short-Term Municipal Bond Fund | | | 35 | |
| | | | |
| | | | |
| |
Assets | | | | |
Investments | | | | |
In unaffiliated securities, at value (cost $6,523,226,252) | | $ | 6,573,007,650 | |
In affiliated securities, at value (cost $68,578,517) | | | 68,578,517 | |
| | | | |
Total investments, at value (cost $6,591,804,769) | | | 6,641,586,167 | |
Cash | | | 1,562 | |
Receivable for investments sold | | | 3,591,455 | |
Receivable for Fund shares sold | | | 17,396,721 | |
Receivable for interest | | | 37,472,329 | |
Prepaid expenses and other assets | | | 148,176 | |
| | | | |
Total assets | | | 6,700,196,410 | |
| | | | |
| |
Liabilities | | | | |
Dividends payable | | | 999,644 | |
Payable for investments purchased | | | 109,648,200 | |
Payable for Fund shares redeemed | | | 24,805,831 | |
Advisory fee payable | | | 960,408 | |
Distribution fee payable | | | 80,368 | |
Administration fees payable | | | 1,090,457 | |
Accrued expenses and other liabilities | | | 1,156,323 | |
| | | | |
Total liabilities | | | 138,741,231 | |
| | | | |
Total net assets | | $ | 6,561,455,179 | |
| | | | |
| |
NET ASSETS CONSIST OF | | | | |
Paid-in capital | | $ | 6,509,911,216 | |
Overdistributed net investment income | | | (159,492 | ) |
Accumulated net realized gains on investments | | | 1,922,057 | |
Net unrealized gains on investments | | | 49,781,398 | |
| | | | |
Total net assets | | $ | 6,561,455,179 | |
| | | | |
| |
COMPUTATION OF NET ASSET VALUE AND OFFERING PRICE PER SHARE | | | | |
Net assets – Class A | | $ | 2,102,446,679 | |
Shares outstanding – Class A1 | | | 210,507,330 | |
Net asset value per share – Class A | | | $9.99 | |
Maximum offering price per share – Class A2 | | | $10.19 | |
Net assets – Class C | | $ | 121,449,159 | |
Shares outstanding – Class C1 | | | 12,159,471 | |
Net asset value per share – Class C | | | $9.99 | |
Net assets – Administrator Class | | $ | 503,977,165 | |
Shares outstanding – Administrator Class1 | | | 50,341,664 | |
Net asset value per share – Administrator Class | | | $10.01 | |
Net assets – Institutional Class | | $ | 1,815,341,761 | |
Shares outstanding – Institutional Class1 | | | 181,438,869 | |
Net asset value per share – Institutional Class | | | $10.01 | |
Net assets – Investor Class | | $ | 2,018,240,415 | |
Shares outstanding – Investor Class1 | | | 201,872,742 | |
Net asset value per share – Investor Class | | | $10.00 | |
| 1. | The Fund has an unlimited number of authorized shares. |
| 2. | Maximum offering price is computed as 100/98 of net asset value. On investments of $50,000 or more, the offering price is reduced. |
The accompanying notes are an integral part of these financial statements.
| | | | |
| 36 | | Wells Fargo Advantage Short-Term Municipal Bond Fund | | Statement of operations—six months ended December 31, 2014 (unaudited) |
| | | | |
| | | | |
| |
Investment income | | | | |
Interest | | $ | 48,393,454 | |
Income from affiliated securities | | | 24,791 | |
| | | | |
Total investment income | | | 48,418,245 | |
| | | | |
| |
Expenses | | | | |
Advisory fee | | | 8,957,102 | |
Administration fees | | | | |
Fund level | | | 1,564,917 | |
Class A | | | 1,646,367 | |
Class C | | | 102,807 | |
Administrator Class | | | 291,025 | |
Institutional Class | | | 667,735 | |
Investor Class | | | 2,013,629 | |
Shareholder servicing fees | | | | |
Class A | | | 2,572,448 | |
Class C | | | 160,635 | |
Administrator Class | | | 709,448 | |
Investor Class | | | 2,645,522 | |
Distribution fee | | | | |
Class C | | | 481,906 | |
Custody and accounting fees | | | 155,409 | |
Professional fees | | | 32,068 | |
Registration fees | | | 128,199 | |
Shareholder report expenses | | | 140,258 | |
Trustees’ fees and expenses | | | 6,260 | |
Other fees and expenses | | | 58,663 | |
| | | | |
Total expenses | | | 22,334,398 | |
Less: Fee waivers and/or expense reimbursements | | | (3,531,500 | ) |
| | | | |
Net expenses | | | 18,802,898 | |
| | | | |
Net investment income | | | 29,615,347 | |
| | | | |
| |
REALIZED AND UNREALIZED GAINS (LOSSES) ON INVESTMENTS | | | | |
Net realized gains on investments | | | 1,900,846 | |
Net change in unrealized gains (losses) on investments | | | (6,479,798 | ) |
| | | | |
Net realized and unrealized gains (losses) on investments | | | (4,578,952 | ) |
| | | | |
Net increase in net assets resulting from operations | | $ | 25,036,395 | |
| | | | |
The accompanying notes are an integral part of these financial statements.
| | | | | | |
| Statement of changes in net assets | | Wells Fargo Advantage Short-Term Municipal Bond Fund | | | 37 | |
| | | | | | | | | | | | | | | | |
| | | Six months ended
December 31, 2014
(unaudited) | | | Year ended
June 30, 2014 | |
| | | | |
Operations | | | | | | | | | | | | | | | | |
Net investment income | | | | | | $ | 29,615,347 | | | | | | | $ | 64,771,503 | |
Net realized gains on investments | | | | | | | 1,900,846 | | | | | | | | 5,701,165 | |
Net change in unrealized gains (losses) on investments | | | | | | | (6,479,798 | ) | | | | | | | 24,498,856 | |
| | | | | | | | | | | | | | | | |
Net increase in net assets resulting from operations | | | | | | | 25,036,395 | | | | | | | | 94,971,524 | |
| | | | | | | | | | | | | | | | |
| | | | |
Distributions to shareholders from | | | | | | | | | | | | | | | | |
Net investment income | | | | | | | | | | | | | | | | |
Class A | | | | | | | (9,003,545 | ) | | | | | | | (18,675,535 | ) |
Class C | | | | | | | (82,192 | ) | | | | | | | (518,543 | ) |
Administrator Class | | | | | | | (2,557,963 | ) | | | | | | | (5,839,974 | ) |
Institutional Class | | | | | | | (9,008,224 | ) | | | | | | | (16,704,019 | ) |
Investor Class | | | | | | | (8,958,881 | ) | | | | | | | (23,038,738 | ) |
Net realized gains | | | | | | | | | | | | | | | | |
Class A | | | | | | | (1,768,741 | ) | | | | | | | (2,587,467 | ) |
Class C | | | | | | | (103,290 | ) | | | | | | | (234,964 | ) |
Administrator Class | | | | | | | (424,465 | ) | | | | | | | (797,395 | ) |
Institutional Class | | | | | | | (1,497,994 | ) | | | | | | | (1,923,330 | ) |
Investor Class | | | | | | | (1,714,158 | ) | | | | | | | (3,277,748 | ) |
| | | | | | | | | | | | | | | | |
Total distributions to shareholders | | | | | | | (35,119,453 | ) | | | | | | | (73,597,713 | ) |
| | | | | | | | | | | | | | | | |
| | | | |
Capital share transactions | | | Shares | | | | | | | | Shares | | | | | |
Proceeds from shares sold | | | | | | | | | | | | | | | | |
Class A | | | 48,816,633 | | | | 488,295,228 | | | | 128,625,256 | | | | 1,282,963,182 | |
Class C | | | 426,324 | | | | 4,263,776 | | | | 1,436,098 | | | | 14,314,949 | |
Administrator Class | | | 14,876,031 | | | | 149,114,005 | | | | 31,080,801 | | | | 310,532,531 | |
Institutional Class | | | 85,854,082 | | | | 859,971,535 | | | | 103,979,031 | | | | 1,038,468,961 | |
Investor Class | | | 25,425,227 | | | | 254,541,646 | | | | 82,009,263 | | | | 818,375,358 | |
| | | | | | | | | | | | | | | | |
| | | | | | | 1,756,186,190 | | | | | | | | 3,464,654,981 | |
| | | | | | | | | | | | | | | | |
Reinvestment of distributions | | | | | | | | | | | | | | | | |
Class A | | | 1,038,946 | | | | 10,389,242 | | | | 2,083,546 | | | | 20,777,536 | |
Class C | | | 16,088 | | | | 160,808 | | | | 65,245 | | | | 650,119 | |
Administrator Class | | | 267,519 | | | | 2,682,141 | | | | 559,415 | | | | 5,591,430 | |
Institutional Class | | | 551,705 | | | | 5,527,503 | | | | 909,417 | | | | 9,084,984 | |
Investor Class | | | 1,030,059 | | | | 10,310,750 | | | | 2,503,485 | | | | 24,987,779 | |
| | | | | | | | | | | | | | | | |
| | | | | | | 29,070,444 | | | | | | | | 61,091,848 | |
| | | | | | | | | | | | | | | | |
Payment for shares redeemed | | | | | | | | | | | | | | | | |
Class A | | | (42,468,111 | ) | | | (424,709,111 | ) | | | (90,215,985 | ) | | | (899,341,671 | ) |
Class C | | | (1,624,569 | ) | | | (16,247,063 | ) | | | (5,451,030 | ) | | | (54,347,761 | ) |
Administrator Class | | | (21,221,669 | ) | | | (212,833,420 | ) | | | (30,045,886 | ) | | | (299,945,869 | ) |
Institutional Class | | | (42,937,033 | ) | | | (430,158,087 | ) | | | (85,658,677 | ) | | | (855,484,063 | ) |
Investor Class | | | (49,470,260 | ) | | | (495,243,810 | ) | | | (71,685,647 | ) | | | (715,364,034 | ) |
| | | | | | | | | | | | | | | | |
| | | | | | | (1,579,191,491 | ) | | | | | | | (2,824,483,398 | ) |
| | | | | | | | | | | | | | | | |
Net increase in net assets resulting from capital share transactions | | | | | | | 206,065,143 | | | | | | | | 701,263,431 | |
| | | | | | | | | | | | | | | | |
Total increase in net assets | | | | | | | 195,982,085 | | | | | | | | 722,637,242 | |
| | | | | | | | | | | | | | | | |
| | | | |
Net assets | | | | | | | | | | | | | | | | |
Beginning of period | | | | | | | 6,365,473,094 | | | | | | | | 5,642,835,852 | |
| | | | | | | | | | | | | | | | |
End of period | | | | | | $ | 6,561,455,179 | | | | | | | $ | 6,365,473,094 | |
| | | | | | | | | | | | | | | | |
Overdistributed net investment income | | | | | | $ | (159,492 | ) | | | | | | $ | (164,034 | ) |
| | | | | | | | | | | | | | | | |
The accompanying notes are an integral part of these financial statements.
| | | | |
| 38 | | Wells Fargo Advantage Short-Term Municipal Bond Fund | | Financial highlights |
(For a share outstanding throughout each period)
| | | | | | | | | | | | | | | | | | | | | | | | |
| | | Six months ended
December 31, 2014 (unaudited) | | | Year ended June 30 | |
| CLASS A | | | 2014 | | | 2013 | | | 2012 | | | 2011 | | | 2010 | |
Net asset value, beginning of period | | | $10.00 | | | | $9.97 | | | | $10.01 | | | | $9.94 | | | | $9.88 | | | | $9.64 | |
Net investment income | | | 0.04 | | | | 0.11 | | | | 0.11 | | | | 0.19 | | | | 0.25 | | | | 0.27 | |
Net realized and unrealized gains (losses) on investments | | | 0.00 | 1 | | | 0.05 | | | | 0.00 | 1 | | | 0.08 | | | | 0.07 | | | | 0.24 | |
| | | | | | | | | | | | | | | | | | | | | | | | |
Total from investment operations | | | 0.04 | | | | 0.16 | | | | 0.11 | | | | 0.27 | | | | 0.32 | | | | 0.51 | |
Distributions to shareholders from | | | | | | | | | | | | | | | | | | | | | | | | |
Net investment income | | | (0.04 | ) | | | (0.11 | ) | | | (0.11 | ) | | | (0.19 | ) | | | (0.25 | ) | | | (0.27 | ) |
Net realized gains | | | (0.01 | ) | | | (0.02 | ) | | | (0.04 | ) | | | (0.01 | ) | | | (0.01 | ) | | | 0.00 | |
| | | | | | | | | | | | | | | | | | | | | | | | |
Total distributions to shareholders | | | (0.05 | ) | | | (0.13 | ) | | | (0.15 | ) | | | (0.20 | ) | | | (0.26 | ) | | | (0.27 | ) |
Net asset value, end of period | | | $9.99 | | | | $10.00 | | | | $9.97 | | | | $10.01 | | | | $9.94 | | | | $9.88 | |
Total return2 | | | 0.43 | % | | | 1.55 | % | | | 1.07 | % | | | 2.77 | % | | | 3.21 | % | | | 5.37 | % |
Ratios to average net assets (annualized) | | | | | | | | | | | | | | | | | | | | | | | | |
Gross expenses | | | 0.75 | % | | | 0.76 | % | | | 0.77 | % | | | 0.78 | % | | | 0.79 | % | | | 0.80 | % |
Net expenses | | | 0.60 | % | | | 0.60 | % | | | 0.60 | % | | | 0.60 | % | | | 0.60 | % | | | 0.60 | % |
Net investment income | | | 0.88 | % | | | 1.08 | % | | | 1.10 | % | | | 1.91 | % | | | 2.48 | % | | | 2.59 | % |
Supplemental data | | | | | | | | | | | | | | | | | | | | | | | | |
Portfolio turnover rate | | | 12 | %3 | | | 28 | %3 | | | 39 | %3 | | | 72 | % | | | 75 | % | | | 78 | % |
Net assets, end of period (000s omitted) | | | $2,102,447 | | | | $2,031,798 | | | | $1,620,994 | | | | $1,467,816 | | | | $1,027,653 | | | | $794,709 | |
| 1. | Amount is less than $0.005. |
| 2. | Total return calculations do not include any sales charges. Returns for periods of less than one year are not annualized. |
| 3. | Portfolio turnover rate excludes variable rate demand notes which may account for changes from rates reported in prior periods. |
The accompanying notes are an integral part of these financial statements.
| | | | | | |
| Financial highlights | | Wells Fargo Advantage Short-Term Municipal Bond Fund | | | 39 | |
(For a share outstanding throughout each period)
| | | | | | | | | | | | | | | | | | | | | | | | |
| | | Six months ended
December 31, 2014 (unaudited) | | | Year ended June 30 | |
| CLASS C | | | 2014 | | | 2013 | | | 2012 | | | 2011 | | | 2010 | |
Net asset value, beginning of period | | | $10.00 | | | | $9.97 | | | | $10.01 | | | | $9.94 | | | | $9.89 | | | | $9.64 | |
Net investment income | | | 0.01 | | | | 0.03 | | | | 0.04 | | | | 0.12 | | | | 0.17 | | | | 0.20 | |
Net realized and unrealized gains (losses) on investments | | | 0.00 | 1 | | | 0.05 | | | | 0.00 | 1 | | | 0.08 | | | | 0.06 | | | | 0.25 | |
| | | | | | | | | | | | | | | | | | | | | | | | |
Total from investment operations | | | 0.01 | | | | 0.08 | | | | 0.04 | | | | 0.20 | | | | 0.23 | | | | 0.45 | |
Distributions to shareholders from | | | | | | | | | | | | | | | | | | | | | | | | |
Net investment income | | | (0.01 | ) | | | (0.03 | ) | | | (0.04 | ) | | | (0.12 | ) | | | (0.17 | ) | | | (0.20 | ) |
Net realized gains | | | (0.01 | ) | | | (0.02 | ) | | | (0.04 | ) | | | (0.01 | ) | | | (0.01 | ) | | | 0.00 | |
| | | | | | | | | | | | | | | | | | | | | | | | |
Total distributions to shareholders | | | (0.02 | ) | | | (0.05 | ) | | | (0.08 | ) | | | (0.13 | ) | | | (0.18 | ) | | | (0.20 | ) |
Net asset value, end of period | | | $9.99 | | | | $10.00 | | | | $9.97 | | | | $10.01 | | | | $9.94 | | | | $9.89 | |
Total return2 | | | 0.05 | % | | | 0.79 | % | | | 0.32 | % | | | 2.01 | % | | | 2.34 | % | | | 4.67 | % |
Ratios to average net assets (annualized) | | | | | | | | | | | | | | | | | | | | | | | | |
Gross expenses | | | 1.50 | % | | | 1.51 | % | | | 1.52 | % | | | 1.53 | % | | | 1.54 | % | | | 1.56 | % |
Net expenses | | | 1.35 | % | | | 1.35 | % | | | 1.35 | % | | | 1.35 | % | | | 1.35 | % | | | 1.35 | % |
Net investment income | | | 0.13 | % | | | 0.34 | % | | | 0.37 | % | | | 1.18 | % | | | 1.74 | % | | | 1.80 | % |
Supplemental data | | | | | | | | | | | | | | | | | | | | | | | | |
Portfolio turnover rate | | | 12 | %3 | | | 28 | %3 | | | 39 | %3 | | | 72 | % | | | 75 | % | | | 78 | % |
Net assets, end of period (000s omitted) | | | $121,449 | | | | $133,463 | | | | $172,364 | | | | $211,286 | | | | $201,870 | | | | $184,885 | |
| 1. | Amount is less than $0.005. |
| 2. | Total return calculations do not include any sales charges. Returns for periods of less than one year are not annualized. |
| 3. | Portfolio turnover rate excludes variable rate demand notes which may account for changes from rates reported in prior periods. |
The accompanying notes are an integral part of these financial statements.
| | | | |
| 40 | | Wells Fargo Advantage Short-Term Municipal Bond Fund | | Financial highlights |
| (For | a share outstanding throughout each period) |
| | | | | | | | | | | | | | | | | | | | |
| | | Six months ended
December 31, 2014 (unaudited) | | | Year ended June 30 | |
| ADMINISTRATOR CLASS | | | 2014 | | | 2013 | | | 2012 | | | 20111 | |
Net asset value, beginning of period | | | $10.03 | | | | $9.99 | | | | $10.03 | | | | $9.96 | | | | $9.94 | |
Net investment income | | | 0.04 | | | | 0.11 | | | | 0.11 | | | | 0.19 | | | | 0.23 | |
Net realized and unrealized gains (losses) on investments | | | (0.01 | ) | | | 0.06 | | | | 0.00 | 2 | | | 0.08 | | | | 0.03 | |
| | | | | | | | | | | | | | | | | | | | |
Total from investment operations | | | 0.03 | | | | 0.17 | | | | 0.11 | | | | 0.27 | | | | 0.26 | |
Distributions to shareholders from | | | | | | | | | | | | | | | | | | | | |
Net investment income | | | (0.04 | ) | | | (0.11 | ) | | | (0.11 | ) | | | (0.19 | ) | | | (0.23 | ) |
Net realized gains | | | (0.01 | ) | | | (0.02 | ) | | | (0.04 | ) | | | (0.01 | ) | | | (0.01 | ) |
| | | | | | | | | | | | | | | | | | | | |
Total distributions to shareholders | | | (0.05 | ) | | | (0.13 | ) | | | (0.15 | ) | | | (0.20 | ) | | | (0.24 | ) |
Net asset value, end of period | | | $10.01 | | | | $10.03 | | | | $9.99 | | | | $10.03 | | | | $9.96 | |
Total return3 | | | 0.33 | % | | | 1.65 | % | | | 1.07 | % | | | 2.77 | % | | | 2.58 | % |
Ratios to average net assets (annualized) | | | | | | | | | | | | | | | | | | | | |
Gross expenses | | | 0.68 | % | | | 0.70 | % | | | 0.71 | % | | | 0.72 | % | | | 0.65 | % |
Net expenses | | | 0.60 | % | | | 0.60 | % | | | 0.60 | % | | | 0.60 | % | | | 0.60 | % |
Net investment income | | | 0.88 | % | | | 1.08 | % | | | 1.07 | % | | | 1.82 | % | | | 2.56 | % |
Supplemental data | | | | | | | | | | | | | | | | | | | | |
Portfolio turnover rate | | | 12 | %4 | | | 28 | %4 | | | 39 | %4 | | | 72 | % | | | 75 | % |
Net assets, end of period (000s omitted) | | | $503,977 | | | | $565,737 | | | | $547,806 | | | | $201,225 | | | | $61,238 | |
| 1. | For the period from July 30, 2010 (commencement of class operations) to June 30, 2011 |
| 2. | Amount is less than $0.005. |
| 3. | Returns for periods of less than one year are not annualized. |
| 4. | Portfolio turnover rate excludes variable rate demand notes which may account for changes from rates reported in prior periods. |
The accompanying notes are an integral part of these financial statements.
| | | | | | |
| Financial highlights | | Wells Fargo Advantage Short-Term Municipal Bond Fund | | | 41 | |
(For a share outstanding throughout each period)
| | | | | | | | | | | | | | | | | | | | | | | | |
| | | Six months ended
December 31, 2014 (unaudited) | | | Year ended June 30 | |
| INSTITUTIONAL CLASS | | | 2014 | | | 2013 | | | 2012 | | | 2011 | | | 2010 | |
Net asset value, beginning of period | | | $10.02 | | | | $9.99 | | | | $10.02 | | | | $9.96 | | | | $9.90 | | | | $9.66 | |
Net investment income | | | 0.05 | | | | 0.13 | | | | 0.13 | | | | 0.21 | | | | 0.27 | | | | 0.29 | |
Net realized and unrealized gains (losses) on investments | | | 0.00 | 1 | | | 0.05 | | | | 0.01 | | | | 0.07 | | | | 0.07 | | | | 0.24 | |
| | | | | | | | | | | | | | | | | | | | | | | | |
Total from investment operations | | | 0.05 | | | | 0.18 | | | | 0.14 | | | | 0.28 | | | | 0.34 | | | | 0.53 | |
Distributions to shareholders from | | | | | | | | | | | | | | | | | | | | | | | | |
Net investment income | | | (0.05 | ) | | | (0.13 | ) | | | (0.13 | ) | | | (0.21 | ) | | | (0.27 | ) | | | (0.29 | ) |
Net realized gains | | | (0.01 | ) | | | (0.02 | ) | | | (0.04 | ) | | | (0.01 | ) | | | (0.01 | ) | | | 0.00 | |
| | | | | | | | | | | | | | | | | | | | | | | | |
Total distributions to shareholders | | | (0.06 | ) | | | (0.15 | ) | | | (0.17 | ) | | | (0.22 | ) | | | (0.28 | ) | | | (0.29 | ) |
Net asset value, end of period | | | $10.01 | | | | $10.02 | | | | $9.99 | | | | $10.02 | | | | $9.96 | | | | $9.90 | |
Total return2 | | | 0.53 | % | | | 1.75 | % | | | 1.37 | % | | | 2.88 | % | | | 3.41 | % | | | 5.58 | % |
Ratios to average net assets (annualized) | | | | | | | | | | | | | | | | | | | | | | | | |
Gross expenses | | | 0.42 | % | | | 0.43 | % | | | 0.45 | % | | | 0.45 | % | | | 0.46 | % | | | 0.46 | % |
Net expenses | | | 0.40 | % | | | 0.40 | % | | | 0.40 | % | | | 0.40 | % | | | 0.40 | % | | | 0.39 | % |
Net investment income | | | 1.08 | % | | | 1.29 | % | | | 1.30 | % | | | 2.10 | % | | | 2.70 | % | | | 2.76 | % |
Supplemental data | | | | | | | | | | | | | | | | | | | | | | | | |
Portfolio turnover rate | | | 12 | %3 | | | 28 | %3 | | | 39 | %3 | | | 72 | % | | | 75 | % | | | 78 | % |
Net assets, end of period (000s omitted) | | | $1,815,342 | | | | $1,382,576 | | | | $1,185,687 | | | | $935,583 | | | | $703,955 | | | | $359,155 | |
| 1. | Amount is less than $0.005. |
| 2. | Returns for periods of less than one year are not annualized. |
| 3. | Portfolio turnover rate excludes variable rate demand notes which may account for changes from rates reported in prior periods. |
The accompanying notes are an integral part of these financial statements.
| | | | |
| 42 | | Wells Fargo Advantage Short-Term Municipal Bond Fund | | Financial highlights |
(For a share outstanding throughout each period)
| | | | | | | | | | | | | | | | | | | | | | | | |
| | | Six months ended
December 31, 2014 (unaudited) | | | Year ended June 30 | |
| INVESTOR CLASS | | | 2014 | | | 2013 | | | 2012 | | | 2011 | | | 2010 | |
Net asset value, beginning of period | | | $10.01 | | | | $9.98 | | | | $10.02 | | | | $9.95 | | | | $9.90 | | | | $9.65 | |
Net investment income | | | 0.04 | | | | 0.11 | | | | 0.11 | | | | 0.19 | | | | 0.24 | | | | 0.27 | |
Net realized and unrealized gains (losses) on investments | | | 0.00 | | | | 0.05 | | | | 0.00 | 1 | | | 0.08 | | | | 0.06 | | | | 0.25 | |
| | | | | | | | | | | | | | | | | | | | | | | | |
Total from investment operations | | | 0.04 | | | | 0.16 | | | | 0.11 | | | | 0.27 | | | | 0.30 | | | | 0.52 | |
Distributions to shareholders from | | | | | | | | | | | | | | | | | | | | | | | | |
Net investment income | | | (0.04 | ) | | | (0.11 | ) | | | (0.11 | ) | | | (0.19 | ) | | | (0.24 | ) | | | (0.27 | ) |
Net realized gains | | | (0.01 | ) | | | (0.02 | ) | | | (0.04 | ) | | | (0.01 | ) | | | (0.01 | ) | | | 0.00 | |
| | | | | | | | | | | | | | | | | | | | | | | | |
Total distributions to shareholders | | | (0.05 | ) | | | (0.13 | ) | | | (0.15 | ) | | | (0.20 | ) | | | (0.25 | ) | | | (0.27 | ) |
Net asset value, end of period | | | $10.00 | | | | $10.01 | | | | $9.98 | | | | $10.02 | | | | $9.95 | | | | $9.90 | |
Total return2 | | | 0.41 | % | | | 1.52 | % | | | 1.04 | % | | | 2.74 | % | | | 3.07 | % | | | 5.41 | % |
Ratios to average net assets (annualized) | | | | | | | | | | | | | | | | | | | | | | | | |
Gross expenses | | | 0.78 | % | | | 0.79 | % | | | 0.80 | % | | | 0.81 | % | | | 0.82 | % | | | 0.86 | % |
Net expenses | | | 0.63 | % | | | 0.63 | % | | | 0.63 | % | | | 0.63 | % | | | 0.63 | % | | | 0.66 | % |
Net investment income | | | 0.85 | % | | | 1.06 | % | | | 1.07 | % | | | 1.89 | % | | | 2.45 | % | | | 2.63 | % |
Supplemental data | | | | | | | | | | | | | | | | | | | | | | | | |
Portfolio turnover rate | | | 12 | %3 | | | 28 | %3 | | | 39 | %3 | | | 72 | % | | | 75 | % | | | 78 | % |
Net assets, end of period (000s omitted) | | | $2,018,240 | | | | $2,251,899 | | | | $2,115,985 | | | | $2,058,375 | | | | $1,783,805 | | | | $1,992,055 | |
| 1. | Amount is less than $0.005. |
| 2. | Returns for periods of less than one year are not annualized. |
| 3. | Portfolio turnover rate excludes variable rate demand notes which may account for changes from rates reported in prior periods. |
The accompanying notes are an integral part of these financial statements.
| | | | | | |
| Notes to financial statements (unaudited) | | Wells Fargo Advantage Short-Term Municipal Bond Fund | | | 43 | |
1. ORGANIZATION
Wells Fargo Funds Trust (the “Trust”), a Delaware statutory trust organized on March 10, 1999, is an open-end management investment company registered under the Investment Company Act of 1940, as amended (the “1940 Act”). As an investment company, the Trust follows the accounting and reporting guidance in FASB Accounting Standards Codification 946. These financial statements report on the Wells Fargo Advantage Short-Term Municipal Bond Fund (the “Fund”) which is a diversified series of the Trust.
2. SIGNIFICANT ACCOUNTING POLICIES
The following significant accounting policies, which are consistently followed in the preparation of the financial statements of the Fund, are in conformity with U.S. generally accepted accounting principles which require management to make estimates and assumptions that affect the reported amounts of assets and liabilities, disclosure of contingent assets and liabilities at the date of the financial statements, and the reported amounts of revenues and expenses during the reporting period. Actual results could differ from those estimates.
Securities valuation
All investments are valued each business day as of the close of regular trading on the New York Stock Exchange (generally 4 p.m. Eastern Time).
Fixed income securities acquired with maturities exceeding 60 days are valued based on evaluated bid prices provided by an independent pricing service which may utilize both transaction data and market information such as yield, quality, coupon rate, maturity, type of issue, trading characteristics and other market data. If prices are not available from the independent pricing service or prices received are deemed not representative of market value, prices will be obtained from an independent broker-dealer.
Short-term securities, with maturities of 60 days or less at time of purchase, generally are valued at amortized cost which approximates fair value. The amortized cost method involves valuing a security at its cost, plus accretion of discount or minus amortization of premium over the period until maturity.
Investments in registered open-end investment companies are valued at net asset value.
Investments which are not valued using any of the methods discussed above are valued at their fair value, as determined in good faith by the Board of Trustees of the Fund. The Board of Trustees has established a Valuation Committee comprised of the Trustees and has delegated to it the authority to take any actions regarding the valuation of portfolio securities that the Valuation Committee deems necessary or appropriate, including determining the fair value of portfolio securities, unless the determination has been delegated to the Management Valuation Team of Wells Fargo Funds Management, LLC (“Funds Management”). The Board of Trustees retains the authority to make or ratify any valuation decisions or approve any changes to the Valuation Procedures as it deems appropriate. On a quarterly basis, the Board of Trustees receives reports on any valuation actions taken by the Valuation Committee or the Management Valuation Team which may include items for ratification.
Valuations of fair valued securities are compared to the next actual sales price when available, or other appropriate market values, to assess the continued appropriateness of the fair valuation methodologies used. These securities are fair valued on a day-to-day basis, taking into consideration changes to appropriate market information and any significant changes to the inputs considered in the valuation process until there is a readily available price provided on an exchange or by an independent pricing service. Valuations received from an independent pricing service or independent broker-dealer quotes are periodically validated by comparisons to most recent trades and valuations provided by other independent pricing services in addition to the review of prices by the adviser and/or subadviser. Unobservable inputs used in determining fair valuations are identified based on the type of security, taking into consideration factors utilized by market participants in valuing the investment, knowledge about the issuer and the current market environment.
When-issued transactions
The Fund may purchase securities on a forward commitment or when-issued basis. The Fund records a when-issued transaction on the trade date and will segregate assets in an amount at least equal in value to the Fund’s commitment to purchase when-issued securities. Securities purchased on a when-issued basis are marked-to-market daily and the Fund begins earning interest on the settlement date. Losses may arise due to changes in the market value of the underlying securities or if the counterparty does not perform under the contract.
Security transactions and income recognition
Securities transactions are recorded on a trade date basis. Realized gains or losses are recorded on the basis of identified cost.
| | | | |
| 44 | | Wells Fargo Advantage Short-Term Municipal Bond Fund | | Notes to financial statements (unaudited) |
Interest income is accrued daily and bond discounts are accreted and premiums are amortized daily based on the effective interest method. To the extent debt obligations are placed on non-accrual status, any related interest income may be reduced by writing off interest receivables when the collection of all or a portion of interest has become doubtful based on consistently applied procedures. If the issuer subsequently resumes interest payments or when the collectability of interest is reasonably assured, the debt obligation is removed from non-accrual status.
Distributions to shareholders
Distributions to shareholders from net investment income are accrued daily and paid monthly. Distributions from net realized gains, if any, are recorded on the ex-dividend date. Such distributions are determined in conformity with federal income tax regulations, which may differ in amount or character from net investment income and realized gains recognized for purposes of U.S. generally accepted accounting principles.
Federal and other taxes
The Fund intends to continue to qualify as a regulated investment company by distributing substantially all of its investment company taxable and tax-exempt income and any net realized capital gains (after reduction for capital loss carryforwards) sufficient to relieve it from all, or substantially all, federal income taxes. Accordingly, no provision for federal income taxes was required.
The Fund’s income and federal excise tax returns and all financial records supporting those returns for the prior three fiscal years are subject to examination by the federal and Delaware revenue authorities. Management has analyzed the Fund’s tax positions taken on federal, state, and foreign tax returns for all open tax years and does not believe that there are any uncertain tax positions that require recognition of a tax liability.
Class allocations
The separate classes of shares offered by the Fund differ principally in applicable sales charges, distribution, shareholder servicing, and administration fees. Class specific expenses are charged directly to that share class. Investment income, common expenses, and realized and unrealized gains (losses) on investments are allocated daily to each class of shares based on the relative proportion of net assets of each class.
3. FAIR VALUATION MEASUREMENTS
Fair value measurements of investments are determined within a framework that has established a fair value hierarchy based upon the various data inputs utilized in determining the value of the Fund’s investments. The three-level hierarchy gives the highest priority to unadjusted quoted prices in active markets for identical assets or liabilities (Level 1) and the lowest priority to significant unobservable inputs (Level 3). The Fund’s investments are classified within the fair value hierarchy based on the lowest level of input that is significant to the fair value measurement. The inputs are summarized into three broad levels as follows:
| n | | Level 1 – quoted prices in active markets for identical securities |
| n | | Level 2 – other significant observable inputs (including quoted prices for similar securities, interest rates, prepayment speeds, credit risk, use of amortized cost, etc.) |
| n | | Level 3 – significant unobservable inputs (including the Fund’s own assumptions in determining the fair value of investments) |
The inputs or methodologies used for valuing investments in securities are not necessarily an indication of the risk associated with investing in those securities.
The following is a summary of the inputs used in valuing the Fund’s assets and liabilities as of December 31, 2014:
| | | | | | | | | | | | | | | | |
| | | Quoted prices
(Level 1) | | | Other significant
observable inputs
(Level 2) | | | Significant
unobservable inputs
(Level 3) | | | Total | |
Assets | | | | | | | | | | | | | | | | |
Investments in : | | | | | | | | | | | | | | | | |
| | | | |
Municipal obligations | | $ | 0 | | | $ | 6,418,311,700 | | | $ | 89,695,250 | | | $ | 6,508,006,950 | |
| | | | |
Other | | | 0 | | | | 65,000,700 | | | | 0 | | | | 65,000,700 | |
| | | | |
Short-term investments | | | | | | | | | | | | | | | | |
Investment companies | | | 68,578,517 | | | | 0 | | | | 0 | | | | 68,578,517 | |
Total assets | | $ | 68,578,517 | | | $ | 6,483,312,400 | | | $ | 89,695,250 | | | $ | 6,641,586,167 | |
| | | | | | |
| Notes to financial statements (unaudited) | | Wells Fargo Advantage Short-Term Municipal Bond Fund | | | 45 | |
Transfers in and transfers out are recognized at the end of the reporting period. At December 31, 2014, the Fund did not have any transfers between Level 1 and Level 2.
The following is a reconciliation of assets in which significant unobservable inputs (Level 3) were used in determining fair value:
| | | | |
| | | Municipal
obligations | |
Balance as of June 30, 2014 | | $ | 79,017,875 | |
Accrued discounts (premiums) | | | 238,416 | |
Realized gains (losses) | | | 7,027 | |
Change in unrealized gains (losses) | | | (168,068 | ) |
Purchases | | | 11,000,000 | |
Sales | | | (400,000 | ) |
Transfers into Level 3 | | | 0 | |
Transfers out of Level 3 | | | 0 | |
Balance as of December 31, 2014 | | $ | 89,695,250 | |
Change in unrealized gains (losses) relating to securities still held at December 31, 2014 | | $ | (165,264 | ) |
The investment type categorized above was valued using indicative broker quotes. These indicative broker quotes are considered Level 3 inputs. Quantitative unobservable inputs used by the brokers are often proprietary and not provided to the Fund and therefore the disclosure that would address these inputs is not included above.
4. TRANSACTIONS WITH AFFILIATES
Advisory fee
The Trust has entered into an advisory contract with Funds Management, an indirect wholly owned subsidiary of Wells Fargo & Company (“Wells Fargo”). The adviser is responsible for implementing investment policies and guidelines and for supervising the subadviser, who is responsible for day-to-day portfolio management of the Fund.
Pursuant to the contract, Funds Management is entitled to receive an annual advisory fee starting at 0.30% and declining to 0.225% as the average daily net assets of the Fund increase. For the six months ended December 31, 2014, the advisory fee was equivalent to an annual rate of 0.27% of the Fund’s average daily net assets.
Funds Management has retained the services of a subadviser to provide daily portfolio management to the Fund. The fee for subadvisory services is borne by Funds Management. Wells Capital Management Incorporated, an affiliate of Funds Management and an indirect wholly owned subsidiary of Wells Fargo, the subadviser to the Fund and is entitled to receive a fee from Funds Management at an annual rate starting at 0.15% and declining to 0.05% as the average daily net assets of the Fund increase.
Administration fees
The Trust has entered into an administration agreement with Funds Management. Under this agreement, for providing administrative services, which includes paying fees and expenses for services provided by the transfer agent, sub-transfer agents, omnibus account servicers and record-keepers, Funds Management is entitled to receive from the Fund an annual fund level administration fee starting at 0.05% and declining to 0.03% as the average daily net assets of the Fund increase and a class level administration fee which is calculated based on the average daily net assets of each class as follows:
| | | | |
| | | Class level
administration fee | |
Class A, Class C | | | 0.16 | % |
Administrator Class | | | 0.10 | |
Institutional Class | | | 0.08 | |
Investor Class | | | 0.19 | |
Funds Management has contractually waived and/or reimbursed advisory and administration fees to the extent necessary to maintain certain net operating expense ratios for the Fund. Waiver of fees and/or reimbursement of expenses by Funds Management were made first from fund level expenses on a proportionate basis and then from class specific expenses. Funds Management has committed through October 31, 2015 to waive fees and/or reimburse expenses to the extent
| | | | |
| 46 | | Wells Fargo Advantage Short-Term Municipal Bond Fund | | Notes to financial statements (unaudited) |
necessary to cap the Fund’s expenses at 0.60% for Class A shares, 1.35% for Class C shares, 0.60% for Administrator Class shares, 0.40% for Institutional Class shares, and 0.63% for Investor Class shares. After this time, the cap may be increased or the commitment to maintain the cap may be terminated only with the approval of the Board of Trustees.
Distribution fee
The Trust has adopted a Distribution Plan for Class C shares of the Fund pursuant to Rule 12b-1 under the 1940 Act. A distribution fee is charged to Class C shares and paid to Wells Fargo Funds Distributor, LLC (“Funds Distributor”), the principal underwriter, at an annual rate of 0.75% of the average daily net assets of Class C shares.
In addition, Funds Distributor is entitled to receive the front-end sales charge from the purchase of Class A shares and a contingent deferred sales charge on the redemption of certain shares. Funds Distributor is also entitled to receive the contingent deferred sales charges from redemptions of Class C shares. For the six months ended December 31, 2014, Funds Distributor received $3,932 from the sale of Class A shares and $116 in contingent deferred sales charges from redemptions of Class C shares.
Shareholder servicing fees
The Trust has entered into contracts with one or more shareholder servicing agents, whereby Class A, Class C, Administrator Class, and Investor Class of the Fund is charged a fee at an annual rate of 0.25% of the average daily net assets of each respective class.
A portion of these total shareholder servicing fees were paid to affiliates of Wells Fargo.
5. INVESTMENT PORTFOLIO TRANSACTIONS
Purchases and sales of investments, excluding U.S. government obligations (if any) and short-term securities, for the six months ended December 31, 2014 were $1,043,492,933 and $573,753,180, respectively.
6. BANK BORROWINGS
The Trust (excluding the money market funds and certain other funds in the Trust) and Wells Fargo Variable Trust are parties to a $150,000,000 revolving credit agreement, whereby the Fund is permitted to use bank borrowings for temporary or emergency purposes, such as to fund shareholder redemption requests. Interest under the credit agreement is charged to the Fund based on a borrowing rate equal to the higher of the Federal Funds rate in effect on that day plus 1.25% or the overnight LIBOR rate in effect on that day plus 1.25%. In addition, an annual commitment fee equal to 0.10% of the unused balance is allocated to each participating fund. For the six months ended December 31, 2014, the Fund paid $3,526 in commitment fees.
For the six months ended December 31, 2014, there were no borrowings by the Fund under the agreement.
7. INDEMNIFICATION
Under the Trust’s organizational documents, the officers and Trustees are indemnified against certain liabilities that may arise out of performance of their duties to the Trust. Additionally, in the normal course of business, the Trust may enter into contracts with service providers that contain a variety of indemnification clauses. The Trust’s maximum exposure under these arrangements is dependent on future claims that may be made against the Fund and, therefore, cannot be estimated.
| | | | | | |
| Other information (unaudited) | | Wells Fargo Advantage Short-Term Municipal Bond Fund | | | 47 | |
PROXY VOTING INFORMATION
A description of the policies and procedures that the Fund uses to determine how to vote proxies relating to portfolio securities is available without charge, upon request, by calling 1-800-222-8222, visiting our website at wellsfargoadvantagefunds.com, or visiting the SEC website at sec.gov. Information regarding how the Fund voted proxies relating to portfolio securities during the most recent 12-month period ended June 30 is available on the Fund’s website at wellsfargoadvantagefunds.com or by visiting the SEC website at sec.gov.
PORTFOLIO HOLDINGS INFORMATION
The complete portfolio holdings for the Fund are publicly available monthly on the Fund’s website (wellsfargoadvantagefunds.com), on a one-month delayed basis. In addition, top ten holdings information (excluding derivative positions) for the Fund is publicly available on the Fund’s website on a monthly, seven-day or more delayed basis. The Fund files its complete schedule of portfolio holdings with the SEC for the first and third quarters of each fiscal year on Form N-Q, which is available by visiting the SEC website at sec.gov. In addition, the Fund’s Form N-Q may be reviewed and copied at the SEC’s Public Reference Room in Washington, DC, and at regional offices in New York City, at 233 Broadway, and in Chicago, at 175 West Jackson Boulevard, Suite 900. Information about the Public Reference Room may be obtained by calling 1-800-SEC-0330.
| | | | |
| 48 | | Wells Fargo Advantage Short-Term Municipal Bond Fund | | Other information (unaudited) |
BOARD OF TRUSTEES AND OFFICERS
Each of the Trustees and Officers1 listed in the table below acts in identical capacities for each fund in the Wells Fargo Advantage family of funds, which consists of 134 mutual funds comprising the Wells Fargo Funds Trust, Wells Fargo Variable Trust, Wells Fargo Master Trust and four closed-end funds (collectively the “Fund Complex”). This table should be read in conjunction with the Prospectus and the Statement of Additional Information2. The mailing address of each Trustee and Officer is 525 Market Street, 12th Floor, San Francisco, CA 94105. Each Trustee and Officer serves an indefinite term, however, each Trustee serves such term until reaching the mandatory retirement age established by the Trustees.
Independent Trustees
| | | | | | |
Name and year of birth | | Position held and length of service* | | Principal occupations during past five years or longer | | Other directorships during
past five years |
| Peter G. Gordon (Born 1942) | | Trustee, since 1998; Chairman, since 2005 | | Co-Founder, Retired Chairman, President and CEO of Crystal Geyser Water Company. Trustee Emeritus, Colby College. | | Asset Allocation Trust |
| Isaiah Harris, Jr. (Born 1952) | | Trustee, since 2009 | | Retired. Prior thereto, President and CEO of BellSouth Advertising and Publishing Corp. from 2005 to 2007, President and CEO of BellSouth Enterprises from 2004 to 2005 and President of BellSouth Consumer Services from 2000 to 2003. Emeritus member of the Iowa State University Foundation Board of Governors. Emeritus Member of the Advisory Board of Iowa State University School of Business. Advisory Board Member, Palm Harbor Academy. Mr. Harris is a certified public accountant. | | CIGNA Corporation; Asset Allocation Trust |
| Judith M. Johnson (Born 1949) | | Trustee, since 2008;
Audit Committee Chairman, since 2008 | | Retired. Prior thereto, Chief Executive Officer and Chief Investment Officer of Minneapolis Employees Retirement Fund from 1996 to 2008. Ms. Johnson is an attorney, certified public accountant and a certified managerial accountant. | | Asset Allocation Trust |
| Leroy Keith, Jr. (Born 1939) | | Trustee, since 2010** | | Chairman, Bloc Global Services (development and construction). Trustee of the Evergreen Funds complex (and its predecessors) from 1983 to 2010. Former Managing Director, Almanac Capital Management (commodities firm), former Partner, Stonington Partners, Inc. (private equity fund), former Director, Obagi Medical Products Co. and former Director, Lincoln Educational Services. | | Trustee, Virtus Fund Complex (consisting of 50 portfolios as of 12/16/2013); Asset Allocation Trust |
| David F. Larcker (Born 1950) | | Trustee, since 2009 | | James Irvin Miller Professor of Accounting at the Graduate School of Business, Stanford University, Morgan Stanley Director of the Center for Leadership Development and Research and Senior Faculty of The Rock Center for Corporate Governance since 2006. From 2005 to 2008, Professor of Accounting at the Graduate School of Business, Stanford University. Prior thereto, Ernst & Young Professor of Accounting at The Wharton School, University of Pennsylvania from 1985 to 2005. | | Asset Allocation Trust |
| Olivia S. Mitchell (Born 1953) | | Trustee, since 2006 | | International Foundation of Employee Benefit Plans Professor, Wharton School of the University of Pennsylvania since 1993. Director of Wharton’s Pension Research Council and Boettner Center on Pensions & Retirement Research, and Research Associate at the National Bureau of Economic Research. Previously, Cornell University Professor from 1978 to 1993. | | Asset Allocation Trust |
| Timothy J. Penny (Born 1951) | | Trustee, since 1996 | | President and CEO of Southern Minnesota Initiative Foundation, a non-profit organization, since 2007 and Senior Fellow at the Humphrey Institute Policy Forum at the University of Minnesota since 1995. Member of the Board of Trustees of NorthStar Education Finance, Inc., a non-profit organization, since 2007. | | Asset Allocation Trust |
| Michael S. Scofield (Born 1943) | | Trustee, since 2010 | | Served on the Investment Company Institute’s Board of Governors and Executive Committee from 2008-2011 as well the Governing Council of the Independent Directors Council from 2006-2011 and the Independent Directors Council Executive Committee from 2008-2011. Chairman of the IDC from 2008-2010. Institutional Investor (Fund Directions) Trustee of Year in 2007. Trustee of the Evergreen Funds complex (and its predecessors) from 1984 to 2010. Chairman of the Evergreen Funds from 2000-2010. Former Trustee of the Mentor Funds. Retired Attorney, Law Offices of Michael S. Scofield. | | Asset Allocation Trust |
| | | | | | |
| Other information (unaudited) | | Wells Fargo Advantage Short-Term Municipal Bond Fund | | | 49 | |
| | | | | | |
Name and year of birth | | Position held and length of service* | | Principal occupations during past five years or longer | | Other directorships during
past five years |
Donald C. Willeke (Born 1940) | | Trustee, since 1996 | | Principal of the law firm of Willeke & Daniels. General Counsel of the Minneapolis Employees Retirement Fund from 1984 until its consolidation into the Minnesota Public Employees Retirement Association on June 30, 2010. Director and Vice Chair of The Tree Trust (non-profit corporation). Director of the American Chestnut Foundation (non-profit corporation). | | Asset Allocation Trust |
| * | Length of service dates reflect the Trustee’s commencement of service with the Trust’s predecessor entities, where applicable. |
| ** | Leroy Keith, Jr. retired as a Trustee effective December 31, 2014. |
Officers
| | | | | | |
Name and year of birth | | Position held and
length of service | | Principal occupations during past five years or longer | | |
| Karla M. Rabusch (Born 1959) | | President, since 2003 | | Executive Vice President of Wells Fargo Bank, N.A. and President of Wells Fargo Funds Management, LLC since 2003. | | |
Nancy Wiser1 (Born 1967) | | Treasurer, since 2012 | | Executive Vice President of Wells Fargo Funds Management, LLC since 2011. Chief Operating Officer and Chief Compliance Officer at LightBox Capital Management LLC, from 2008 to 2011. Owned and operated a consulting business providing services to various hedge funds including acting as Chief Operating Officer and Chief Compliance Officer for a hedge fund from 2007 to 2008. Chief Operating Officer and Chief Compliance Officer of GMN Capital LLC from 2006 to 2007. | | |
| C. David Messman (Born 1960) | | Secretary, since 2000; Chief Legal Officer, since 2003 | | Assistant General Counsel of Wells Fargo Bank, N.A. since 2013 and Vice President and Managing Counsel of Wells Fargo Bank N.A. from 1996 to 2013. Senior Vice President and Secretary of Wells Fargo Funds Management , LLC since 2001. | | |
Debra Ann Early (Born 1964) | | Chief Compliance Officer, since 2007 | | Senior Vice President of Wells Fargo Funds Management, LLC since 2007 and Chief Compliance Officer from 2007 to 2014. Chief Compliance Officer of Parnassus Investments from 2005 to 2007. Chief Financial Officer of Parnassus Investments from 2004 to 2007 and Senior Audit Manager of PricewaterhouseCoopers LLP from 1998 to 2004. | | |
David Berardi (Born 1975) | | Assistant Treasurer, since 2009 | | Vice President of Wells Fargo Funds Management, LLC since 2009. Vice President of Evergreen Investment Management Company, LLC from 2008 to 2010. Assistant Vice President of Evergreen Investment Services, Inc. from 2004 to 2008. Manager of Fund Reporting and Control for Evergreen Investment Management Company, LLC from 2004 to 2010. | | |
| Jeremy DePalma1 (Born 1974) | | Assistant Treasurer, since 2009 | | Senior Vice President of Wells Fargo Funds Management, LLC since 2009. Senior Vice President of Evergreen Investment Management Company, LLC from 2008 to 2010. Vice President, Evergreen Investment Services, Inc. from 2004 to 2007. Head of the Fund Reporting and Control Team within Fund Administration from 2005 to 2010. | | |
| 1. | Nancy Wiser acts as Treasurer of 73 funds in the Fund Complex. Jeremy DePalma acts as Treasurer of 61 funds and Assistant Treasurer of 73 funds in the Fund Complex. |
| 2. | The Statement of Additional Information includes additional information about the Trustees and is available, without charge, upon request, by calling 1-800-222-8222 or by visiting the website at wellsfargoadvantagefunds.com. |
| | | | |
| 50 | | Wells Fargo Advantage Short-Term Municipal Bond Fund | | List of abbreviations |
The following is a list of common abbreviations for terms and entities that may have appeared in this report.
| ACA | — ACA Financial Guaranty Corporation |
| ADR | — American depositary receipt |
| ADS | — American depositary shares |
| AGC | — Assured Guaranty Corporation |
| AGM | — Assured Guaranty Municipal |
| Ambac | — Ambac Financial Group Incorporated |
| AMT | — Alternative minimum tax |
| BAN | — Bond anticipation notes |
| BHAC | — Berkshire Hathaway Assurance Corporation |
| CAB | — Capital appreciation bond |
| CCAB | — Convertible capital appreciation bond |
| CDA | — Community Development Authority |
| CDO | — Collateralized debt obligation |
| DRIVER | — Derivative inverse tax-exempt receipts |
| DW&P | — Department of Water & Power |
| DWR | — Department of Water Resources |
| ECFA | — Educational & Cultural Facilities Authority |
| EDA | — Economic Development Authority |
| EDFA | — Economic Development Finance Authority |
| ETF | — Exchange-traded fund |
| FDIC | — Federal Deposit Insurance Corporation |
| FFCB | — Federal Farm Credit Banks |
| FGIC | — Financial Guaranty Insurance Corporation |
| FHA | — Federal Housing Administration |
| FHLB | — Federal Home Loan Bank |
| FHLMC | — Federal Home Loan Mortgage Corporation |
| FICO | — The Financing Corporation |
| FNMA | — Federal National Mortgage Association |
| GDR | — Global depositary receipt |
| GNMA | — Government National Mortgage Association |
| HCFR | — Healthcare facilities revenue |
| HEFA | — Health & Educational Facilities Authority |
| HEFAR | — Higher education facilities authority revenue |
| HFA | — Housing Finance Authority |
| HFFA | — Health Facilities Financing Authority |
| HUD | — Department of Housing and Urban Development |
| IDA | — Industrial Development Authority |
| IDAG | — Industrial Development Agency |
| KRW | — Republic of Korea won |
| LIBOR | — London Interbank Offered Rate |
| LLC | — Limited liability company |
| LLLP | — Limited liability limited partnership |
| LLP | — Limited liability partnership |
| MBIA | — Municipal Bond Insurance Association |
| MFHR | — Multifamily housing revenue |
| MSTR | — Municipal securities trust receipts |
| MUD | — Municipal Utility District |
| National | — National Public Finance Guarantee Corporation |
| PCFA | — Pollution Control Financing Authority |
| PCL | — Public Company Limited |
| PCR | — Pollution control revenue |
| PFA | — Public Finance Authority |
| PFFA | — Public Facilities Financing Authority |
| PFOTER | — Puttable floating option tax-exempt receipts |
| plc | — Public limited company |
| PUTTER | — Puttable tax-exempt receipts |
| R&D | — Research & development |
| Radian | — Radian Asset Assurance |
| RAN | — Revenue anticipation notes |
| RDA | — Redevelopment Authority |
| RDFA | — Redevelopment Finance Authority |
| REIT | — Real estate investment trust |
| ROC | — Reset option certificates |
| SAVRS | — Select auction variable rate securities |
| SBA | — Small Business Authority |
| SFHR | — Single-family housing revenue |
| SFMR | — Single-family mortgage revenue |
| SPA | — Standby purchase agreement |
| SPDR | — Standard & Poor’s Depositary Receipts |
| STRIPS | — Separate trading of registered interest and |
| TAN | — Tax anticipation notes |
| TIPS | — Treasury inflation-protected securities |
| TRAN | — Tax revenue anticipation notes |
| TTFA | — Transportation Trust Fund Authority |
| TVA | — Tennessee Valley Authority |
This page is intentionally left blank.
This page is intentionally left blank.


For more information
More information about Wells Fargo Advantage Funds is available free upon request. To obtain literature, please write, email, visit the Fund’s website, or call:
Wells Fargo Advantage Funds
P.O. Box 8266
Boston, MA 02266-8266
Email: wfaf@wellsfargo.com
Website: wellsfargoadvantagefunds.com
Individual investors: 1-800-222-8222
Retail investment professionals: 1-888-877-9275
Institutional investment professionals: 1-866-765-0778
This report and the financial statements contained herein are submitted for the general information of the shareholders of Wells Fargo Advantage Funds. If this report is used for promotional purposes, distribution of the report must be accompanied or preceded by a current prospectus. Before investing, please consider the investment objectives, risks, charges, and expenses of the investment. For a current prospectus and, if available, a summary prospectus, containing this information, call 1-800-222-8222 or visit the Fund’s website at wellsfargoadvantagefunds.com. Read the prospectus carefully before you invest or send money.
Wells Fargo Funds Management, LLC, a wholly owned subsidiary of Wells Fargo & Company, provides investment advisory and administrative services for Wells Fargo Advantage Funds. Other affiliates of Wells Fargo & Company provide subadvisory and other services for the Funds. The Funds are distributed by Wells Fargo Funds Distributor, LLC, Member FINRA/SIPC, an affiliate of Wells Fargo & Company.
NOT FDIC INSURED ¡ NO BANK GUARANTEE ¡ MAY LOSE VALUE
© 2014 Wells Fargo Funds Management, LLC. All rights reserved.
| | |
 | | 230430 02-15 SA256/SAR256 12-14 |

Wells Fargo Advantage
Strategic Municipal Bond Fund

Semi-Annual Report
December 31, 2014

Reduce clutter. Save trees.
Sign up for electronic delivery of prospectuses and shareholder reports at wellsfargo.com/advantagedelivery
Contents
The views expressed and any forward-looking statements are as of December 31, 2014, unless otherwise noted, and are those of the Fund managers and/or Wells Fargo Funds Management, LLC. Discussions of individual securities, or the markets generally, or any Wells Fargo Advantage Fund are not intended as individual recommendations. Future events or results may vary significantly from those expressed in any forward-looking statements; the views expressed are subject to change at any time in response to changing circumstances in the market. Wells Fargo Funds Management, LLC and the Fund disclaim any obligation to publicly update or revise any views expressed or forward-looking statements.
NOT FDIC INSURED ¡ NO BANK GUARANTEE ¡ MAY LOSE VALUE
| | | | |
| 2 | | Wells Fargo Advantage Strategic Municipal Bond Fund | | Letter to shareholders (unaudited) |

Karla M. Rabusch
President
Wells Fargo Advantage Funds
Municipal bonds rose in the second half of 2014, helped by lower interest rates and strong demand for yield.
Dear Valued Shareholder:
We are pleased to provide you with this semi-annual report for the Wells Fargo Advantage Strategic Municipal Bond Fund for the six-month period that ended December 31, 2014. Municipal bonds rose in the second half of 2014, helped by lower interest rates and strong demand for yield. In fact, the longest-dated and weakest credits had the strongest returns. Municipal bond returns—as measured by the Barclays Municipal Bond Index1, the broadest measure for tracking investment-grade municipal bonds throughout the country—gained 2.88% for the six-month period that ended December 31, 2014.
Longer-maturity and lower-rated municipal bonds outperformed.
At the front end of the yield curve, municipal bond yields were extremely low because of the accommodative monetary policy. Throughout the reporting period, the U.S. Federal Reserve’s (Fed’s) monetary policymaking body kept its key interest rate near zero in order to support the economy and the financial system. Policymakers said they can be patient in normalizing monetary policy and that any increases in the target range for the federal funds rate will depend on incoming economic data. During the reporting period, the Fed reduced (or tapered) the size of its quantitative easing program each month until the program ended in October 2014, although it continues to reinvest principal and interest payments of the mortgage-backed securities and Treasury bonds it holds.
Longer-term yields declined during the second half of the year, with 10-year municipal yields declining from 2.33% as of June 30, 2014 to 2.10% as of December 31, 2014. For more perspective, the yield curve was steep on a historical basis at the beginning of the period and ended the period with the difference between 30-year and 2-year yields at 237 basis points (bps; 100 bps equals 1.00%), which was only slightly wider than its historical average. Because the yield curve was steep, longer-dated securities had higher yields. Given their longer maturities (as municipal yields fell further out the curve) and their more generous yields, longer-term bond returns outpaced shorter-term bonds.
Investors were also enticed to buy lower-rated securities for their higher yields. Over the six-month period that ended December 31, 2014, AAA-rated municipal bonds returned 2.04% while BBB-rated bonds returned 4.29%, according to the Barclays Municipal Bond Index. Credit conditions continued to improve, as evidenced by an 18th consecutive quarter of positive year-over-year gains in state and local municipal revenues. In addition to better fundamental credit conditions, technical factors of limited supply alongside strong investor demand also supported municipal bonds.
Puerto Rico’s struggle, the exit of two cities from bankruptcy, and pension issues topped credit news.
Puerto Rico was the asset class’s largest single credit story. Bonds from the commonwealth returned a meager 0.79% during the six-month period as population declines, a contracting economy, and a burdensome level of debt held back results. Meanwhile, the cities of Stockton, California, and Detroit, Michigan, exited bankruptcy by curbing retiree health care benefits and bondholder recoveries but largely avoiding concessions on pensions. While these recent bankruptcies have so far treated pensions better than bonded debt, no clear precedent has been established due to the difference in general obligation
| 1. | The Barclays Municipal Bond Index is an unmanaged index composed of long-term tax-exempt bonds with a minimum credit rating of Baa. You cannot invest directly in an index. |
| | | | | | |
| Letter to shareholders (unaudited) | | Wells Fargo Advantage Strategic Municipal Bond Fund | | | 3 | |
pledges and court-ordered versus negotiated concessions. Finally, underfunded pensions in Illinois, New Jersey, Pennsylvania, and Kansas gained attention for their negative fiscal effects and the political difficulties of finding a resolution.
Don’t let short-term uncertainty derail long-term investment goals.
Periods of uncertainty can present challenges, but experience has taught us that maintaining long-term investment goals can be an effective way to plan for the future. To help you create a sound strategy based on your personal goals and risk tolerance, Wells Fargo Advantage Funds offers more than 100 mutual funds and other investments spanning a wide range of asset classes and investment styles. Although diversification cannot guarantee an investment profit or prevent losses, we believe it can be an effective way to manage investment risk and potentially smooth out overall portfolio performance. We encourage investors to know their investments and to understand that appropriate levels of risk-taking may unlock opportunities.
Thank you for choosing to invest with Wells Fargo Advantage Funds. We appreciate your confidence in us and remain committed to helping you meet your financial needs. For current information about your fund investments, contact your investment professional, visit our website at wellsfargoadvantagefunds.com, or call us directly at 1-800-222-8222. We are available 24 hours a day, 7 days a week.
Sincerely,

Karla M. Rabusch
President
Wells Fargo Advantage Funds
Periods of uncertainty can present challenges, but experience has taught us that maintaining long-term investment goals can be an effective way to plan for the future.
| | | | |
| 4 | | Wells Fargo Advantage Strategic Municipal Bond Fund | | Performance highlights (unaudited) |
Investment objective
The Fund seeks current income exempt from regular federal income tax.
Adviser
Wells Fargo Funds Management, LLC
Subadviser
Wells Capital Management Incorporated
Portfolio managers
Wendy Casetta
Lyle J. Fitterer, CFA, CPA
Robert J. Miller
Average annual total returns1 (%) as of December 31, 2014
| | | | | | | | | | | | | | | | | | | | | | | | | | | | | | | | | | |
| | | | | Including sales charge | | | Excluding sales charge | | | Expense ratios2 (%) | |
| | | Inception date | | 1 year | | | 5 year | | | 10 year | | | 1 year | | | 5 year | | | 10 year | | | Gross | | | Net3 | |
| Class A (VMPAX) | | 12-1-1994 | | | (0.10 | ) | | | 2.42 | | | | 2.87 | | | | 4.55 | | | | 3.37 | | | | 3.34 | | | | 0.83 | | | | 0.82 | |
| Class B (VMPIX)* | | 3-21-1985 | | | (1.22 | ) | | | 2.24 | | | | 2.81 | | | | 3.78 | | | | 2.60 | | | | 2.81 | | | | 1.58 | | | | 1.57 | |
| Class C (DHICX) | | 8-18-1997 | | | 2.76 | | | | 2.60 | | | | 2.57 | | | | 3.76 | | | | 2.60 | | | | 2.57 | | | | 1.58 | | | | 1.57 | |
| Administrator Class (VMPYX) | | 10-6-1997 | | | – | | | | – | | | | – | | | | 4.69 | | | | 3.54 | | | | 3.56 | | | | 0.77 | | | | 0.68 | |
| Institutional Class (STRIX) | | 11-30-2012 | | | – | | | | – | | | | – | | | | 4.90 | | | | 3.63 | | | | 3.60 | | | | 0.50 | | | | 0.48 | |
| Barclays Short-Intermediate Municipal Bond Index4 | | – | | | – | | | | – | | | | – | | | | 3.85 | | | | 3.33 | | | | 3.78 | | | | – | | | | – | |
| * | | Class B shares are closed to investment, except in connection with the reinvestment of any distributions and permitted exchanges. |
Figures quoted represent past performance, which is no guarantee of future results, and do not reflect taxes that a shareholder may pay on fund distributions or the redemption of fund shares. Investment return and principal value of an investment will fluctuate so that an investor’s shares, when redeemed, may be worth more or less than their original cost. Performance shown without sales charges would be lower if sales charges were reflected. Current performance may be lower or higher than the performance data quoted, which assumes the reinvestment of dividends and capital gains. Current month-end performance is available on the Fund’s website, wellsfargoadvantagefunds.com.
Index returns do not include transaction costs associated with buying and selling securities, any mutual fund fees or expenses, or any taxes. It is not possible to invest directly in an index.
For Class A shares, the maximum front-end sales charge is 4.50%. For Class B shares, the maximum contingent deferred sales charge is 5.00%. For Class C shares, the maximum contingent deferred sales charge is 1.00%. Performance including a contingent deferred sales charge assumes the sales charge for the corresponding time period. Administrator Class and Institutional Class shares are sold without a front-end sales charge or contingent deferred sales charge.
Bond values fluctuate in response to the financial condition of individual issuers, general market and economic conditions, and changes in interest rates. Changes in market conditions and government policies may lead to periods of heightened volatility in the bond market and reduced liquidity for certain bonds held by the Fund. In general, when interest rates rise, bond values fall and investors may lose principal value. Interest-rate changes and their impact on the Fund and its share price can be sudden and unpredictable. High-yield securities have a greater risk of default and tend to be more volatile than higher-rated debt securities. The use of derivatives may reduce returns and/or increase volatility. Certain investment strategies tend to increase the total risk of an investment (relative to the broader market). The Fund is exposed to municipal securities risk. Consult the Fund’s prospectus for additional information on these and other risks. A portion of the Fund’s income may be subject to federal, state, and/or local income taxes or the Alternative Minimum Tax (AMT). Any capital gains distributions may be taxable.
Please see footnotes on page 5.
| | | | | | |
| Performance highlights (unaudited) | | Wells Fargo Advantage Strategic Municipal Bond Fund | | | 5 | |
|
| Credit quality distribution5 as of December 31, 2014 |
|
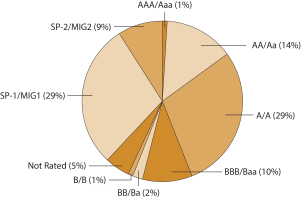 |
|
| Effective maturity distribution6 as of December 31, 2014 |
|
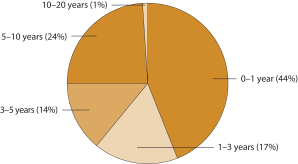 |
| 1. | Historical performance shown for the Institutional Class shares prior to their inception reflects the performance of the Administrator Class shares, and includes the higher expenses applicable to the Administrator Class shares. If these expenses had not been included, returns would be higher. Historical performance shown for all classes of the Fund prior to July 12, 2010, is based on the performance of the Fund’s predecessor, Evergreen Strategic Municipal Bond Fund. |
| 2. | Reflects the expense ratios as stated in the most recent prospectuses. The expense ratios shown are subject to change and may differ from the annualized expense ratios shown in the financial highlights of this report. |
| 3. | The Adviser has committed through October 31, 2015, to waive fees and/or reimburse expenses to the extent necessary to cap the Fund’s Total Annual Fund Operating Expenses After Fee Waiver, excluding certain expenses, at the amounts shown. After this time, the cap may be increased or the commitment to maintain the cap may be terminated only with the approval of the Board of Trustees. Brokerage commissions, stamp duty fees, interest, taxes, acquired fund fees and expenses, and extraordinary expenses are excluded from the cap. Without this cap, the Fund’s returns would have been lower. |
| 4. | The Barclays Short-Intermediate Municipal Bond Index is a rules-based, market-value-weighted index composed of publicly traded municipal bonds that cover the U.S. dollar-denominated short-term tax-exempt bond market, including state and local general obligation bonds, revenue bonds, insured bonds, and prerefunded bonds. You cannot invest directly in an index. |
| 5. | The credit quality distribution of portfolio holdings reflected in the chart is based on ratings from Standard & Poor’s, Moody’s Investors Service, and/or Fitch Ratings Ltd. Credit quality ratings apply to the underlying holdings of the Fund and not to the Fund itself. The percentages of the Fund’s portfolio with the ratings depicted in the chart are calculated based on the total market value of fixed income securities held by the Fund. If a security was rated by all three rating agencies, the middle rating was utilized. If rated by two of three rating agencies, the lower rating was utilized, and if rated by one of the rating agencies, that rating was utilized. Standard & Poor’s rates the creditworthiness of bonds on a scale of AAA (highest) to D (lowest). Ratings from A to CCC may be modified by the addition of a plus (+) or minus (-) sign to show relative standing within the rating categories. Standard & Poor’s rates the creditworthiness of short-term notes on a scale SP-1 (highest) to SP-3 (lowest). Moody’s rates the creditworthiness of bond on a scale of Aaa (highest) to C (lowest). Ratings Aa to B may be modified by the addition of a number 1 (highest) to 3 (lowest) to show relative standing within the ratings categories. Moody’s rates the creditworthiness of short-term U.S. tax-exempt municipal securities from MIG 1/VMIG 1 (highest) to SG (lowest). Fitch rates the creditworthiness of bonds, ranging from AAA (highest) to D (lowest). Credit quality and credit quality ratings are subject to change and may have changed since the date specified. |
| 6. | Effective maturity distribution is calculated based on the total long-term investments of the Fund. It is subject to change and may have changed since the date specified. |
| | | | |
| 6 | | Wells Fargo Advantage Strategic Municipal Bond Fund | | Fund expenses (unaudited) |
As a shareholder of the Fund, you incur two types of costs: (1) transaction costs, including sales charges (loads) on purchase payments and contingent deferred sales charges (if any) on redemptions and (2) ongoing costs, including management fees, distribution (12b-1) and/or shareholder service fees, and other Fund expenses. This example is intended to help you understand your ongoing costs (in dollars) of investing in the Fund and to compare these costs with the ongoing costs of investing in other mutual funds.
The example is based on an investment of $1,000 invested at the beginning of the six-month period and held for the entire period from July 1, 2014 to December 31, 2014.
Actual expenses
The “Actual” line of the table below provides information about actual account values and actual expenses. You may use the information in this line, together with the amount you invested, to estimate the expenses that you paid over the period. Simply divide your account value by $1,000 (for example, an $8,600 account value divided by $1,000 = 8.6), then multiply the result by the number in the “Actual” line under the heading entitled “Expenses paid during period” for your applicable class of shares to estimate the expenses you paid on your account during this period.
Hypothetical example for comparison purposes
The “Hypothetical” line of the table below provides information about hypothetical account values and hypothetical expenses based on the Fund’s actual expense ratio and an assumed rate of return of 5% per year before expenses, which is not the Fund’s actual return. The hypothetical account values and expenses may not be used to estimate the actual ending account balance or expenses you paid for the period. You may use this information to compare the ongoing costs of investing in the Fund and other funds. To do so, compare this 5% hypothetical example with the 5% hypothetical examples that appear in the shareholder reports of the other funds.
Please note that the expenses shown in the table are meant to highlight your ongoing costs only and do not reflect any transactional costs, such as sales charges (loads) and contingent deferred sales charges. Therefore, the “Hypothetical” line of the table is useful in comparing ongoing costs only and will not help you determine the relative total costs of owning different funds. In addition, if these transactional costs were included, your costs would have been higher.
| | | | | | | | | | | | | | | | |
| | | Beginning
account value
7-1-2014 | | | Ending
account value
12-31-2014 | | | Expenses
paid during
the period¹ | | | Net annualized
expense ratio | |
Class A | | | | | | | | | | | | | | | | |
Actual | | $ | 1,000.00 | | | $ | 1,009.71 | | | $ | 4.10 | | | | 0.81 | % |
Hypothetical (5% return before expenses) | | $ | 1,000.00 | | | $ | 1,021.12 | | | $ | 4.13 | | | | 0.81 | % |
Class B | | | | | | | | | | | | | | | | |
Actual | | $ | 1,000.00 | | | $ | 1,007.03 | | | $ | 7.89 | | | | 1.56 | % |
Hypothetical (5% return before expenses) | | $ | 1,000.00 | | | $ | 1,017.34 | | | $ | 7.93 | | | | 1.56 | % |
Class C | | | | | | | | | | | | | | | | |
Actual | | $ | 1,000.00 | | | $ | 1,005.87 | | | $ | 7.89 | | | | 1.56 | % |
Hypothetical (5% return before expenses) | | $ | 1,000.00 | | | $ | 1,017.34 | | | $ | 7.93 | | | | 1.56 | % |
Administrator Class | | | | | | | | | | | | | | | | |
Actual | | $ | 1,000.00 | | | $ | 1,011.51 | | | $ | 3.45 | | | | 0.68 | % |
Hypothetical (5% return before expenses) | | $ | 1,000.00 | | | $ | 1,021.78 | | | $ | 3.47 | | | | 0.68 | % |
Institutional Class | | | | | | | | | | | | | | | | |
Actual | | $ | 1,000.00 | | | $ | 1,011.41 | | | $ | 2.43 | | | | 0.48 | % |
Hypothetical (5% return before expenses) | | $ | 1,000.00 | | | $ | 1,022.79 | | | $ | 2.45 | | | | 0.48 | % |
| 1. | Expenses paid is equal to the annualized expense ratio of each class multiplied by the average account value over the period, multiplied by the number of days in the most recent fiscal half-year divided by the number of days in the fiscal year (to reflect the one-half-year period). |
| | | | | | |
| Portfolio of investments—December 31, 2014 (unaudited) | | Wells Fargo Advantage Strategic Municipal Bond Fund | | | 7 | |
| | | | | | | | | | | | | | | | |
| Security name | | Interest rate | | | Maturity date | | | Principal | | | Value | |
| | | | | | | | | | | | | | | | |
| | | | |
Municipal Obligations: 99.37% | | | | | | | | | | | | | | | | |
| | | | |
| Alabama: 0.61% | | | | | | | | | | | | | | | | |
Chatom AL Industrial Development Board Solid Waste Disposal (Utilities Revenue) | | | 4.00 | % | | | 8-1-2016 | | | $ | 1,875,000 | | | $ | 1,962,113 | |
Jefferson County AL Warrants Series A (GO) | | | 4.90 | | | | 4-1-2021 | | | | 7,155,000 | | | | 7,714,020 | |
| | | | |
| | | | | | | | | | | | | | | 9,676,133 | |
| | | | | | | | | | | | | | | | |
| | | | |
| Alaska: 0.79% | | | | | | | | | | | | | | | | |
Alaska Housing Finance Corporation Series B (Housing Revenue, Landesbank Baden-Wuerttemberg SPA) ø | | | 0.14 | | | | 12-1-2041 | | | | 12,450,000 | | | | 12,450,000 | |
| | | | | | | | | | | | | | | | |
| | | | |
| Arizona: 1.82% | | | | | | | | | | | | | | | | |
Arizona Navajo Tribal Utility Authority (Miscellaneous Revenue, AGM Insured) | | | 4.00 | | | | 1-1-2021 | | | | 4,368,000 | | | | 4,572,990 | |
Arizona Sports & Tourism Authority Multipurpose Stadium Facility Project Series A (Tax Revenue) | | | 4.00 | | | | 7-1-2017 | | | | 900,000 | | | | 960,039 | |
Florence AZ IDA Legacy Traditional School Project (Education Revenue) | | | 4.00 | | | | 7-1-2018 | | | | 410,000 | | | | 417,917 | |
Phoenix AZ IDA (Industrial Development Revenue) | | | 3.00 | | | | 2-1-2016 | | | | 425,000 | | | | 428,481 | |
Phoenix AZ IDA (Industrial Development Revenue) | | | 5.00 | | | | 2-1-2017 | | | | 2,845,000 | | | | 2,990,237 | |
Phoenix AZ IDA (Industrial Development Revenue) | | | 5.00 | | | | 2-1-2018 | | | | 1,795,000 | | | | 1,901,013 | |
Phoenix AZ IDA Legacy Traditional School Project Series A (Education Revenue) 144A | | | 5.75 | | | | 7-1-2024 | | | | 1,400,000 | | | | 1,534,078 | |
Phoenix AZ Industrial Development Revenue Great Hearts Academies Project (Education Revenue) | | | 5.20 | | | | 7-1-2022 | | | | 820,000 | | | | 852,882 | |
Pima County AZ IDA New Plan Learning Project Series A (Education Revenue) | | | 7.75 | | | | 7-1-2035 | | | | 1,000,000 | | | | 1,005,810 | |
Pima County AZ IDA Noah Webster Schools Project Series A (Education Revenue) | | | 5.50 | | | | 12-15-2023 | | | | 1,070,000 | | | | 1,115,272 | |
Pima County AZ IDA Series A (Education Revenue) | | | 8.13 | | | | 7-1-2041 | | | | 3,000,000 | | | | 3,017,370 | |
Pima County AZ Industrial Development Revenue Charter School (Education Revenue) | | | 4.00 | | | | 7-1-2016 | | | | 395,000 | | | | 401,624 | |
Pima County AZ Industrial Development Revenue Charter School (Education Revenue) | | | 4.00 | | | | 7-1-2017 | | | | 1,135,000 | | | | 1,163,239 | |
Salt Verde AZ Financial Corporation Project (Utilities Revenue) | | | 5.25 | | | | 12-1-2020 | | | | 1,565,000 | | | | 1,813,459 | |
Tempe AZ IDA Friendship Village Series A (Health Revenue) | | | 4.00 | | | | 12-1-2017 | | | | 220,000 | | | | 227,841 | |
Tempe AZ IDA Friendship Village Series A (Health Revenue) | | | 5.00 | | | | 12-1-2018 | | | | 800,000 | | | | 863,272 | |
Tempe AZ IDA Friendship Village Series A (Health Revenue) | | | 5.00 | | | | 12-1-2019 | | | | 1,000,000 | | | | 1,084,580 | |
University of Arizona Medical Center Corporation (Health Revenue) | | | 5.00 | | | | 7-1-2015 | | | | 1,660,000 | | | | 1,692,702 | |
Verrado AZ Community Facilities District #1 Series A (GO) 144A | | | 4.25 | | | | 7-15-2019 | | | | 1,320,000 | | | | 1,416,928 | |
Verrado AZ Community Facilities District #1 Series A (GO) 144A | | | 5.00 | | | | 7-15-2020 | | | | 700,000 | | | | 775,656 | |
Verrado AZ Community Facilities District #1 Series A (GO) 144A | | | 5.00 | | | | 7-15-2021 | | | | 500,000 | | | | 554,360 | |
| | | | |
| | | | | | | | | | | | | | | 28,789,750 | |
| | | | | | | | | | | | | | | | |
| | | | |
| Arkansas: 0.37% | | | | | | | | | | | | | | | | |
Fort Smith AR Sales & Use Tax Improvement Bonds (Tax Revenue) | | | 2.38 | | | | 5-1-2027 | | | | 355,000 | | | | 356,452 | |
Pulaski County AR HCFR Catholic Healthcare Series B (Health Revenue, U.S. Bank NA SPA) ø | | | 0.10 | | | | 12-1-2028 | | | | 5,500,000 | | | | 5,500,000 | |
| | | | |
| | | | | | | | | | | | | | | 5,856,452 | |
| | | | | | | | | | | | | | | | |
| | | | |
| California: 5.04% | | | | | | | | | | | | | | | | |
Alameda CA Corridor Transportation Authority CAB Series A (Transportation Revenue, Ambac Insured) ¤ | | | 0.00 | | | | 10-1-2017 | | | | 2,085,000 | | | | 1,993,969 | |
California Bay Area Toll Authority Toll Bridge Revenue Series E-3 (Transportation Revenue) ± | | | 0.74 | | | | 4-1-2047 | | | | 11,600,000 | | | | 11,638,164 | |
The accompanying notes are an integral part of these financial statements.
| | | | |
| 8 | | Wells Fargo Advantage Strategic Municipal Bond Fund | | Portfolio of investments—December 31, 2014 (unaudited) |
| | | | | | | | | | | | | | | | |
| Security name | | Interest rate | | | Maturity date | | | Principal | | | Value | |
| | | | | | | | | | | | | | | | |
| | | | |
| California (continued) | | | | | | | | | | | | | | | | |
California Foothill/Eastern Transportation Corridor Agency CAB Series A (Transportation Revenue, AGM Insured) ¤ | | | 0.00 | % | | | 1-15-2020 | | | $ | 3,930,000 | | | $ | 3,477,107 | |
California Infrastructure & Economic Development Colburn School Project (Education Revenue) ± | | | 0.29 | | | | 8-1-2037 | | | | 11,000,000 | | | | 10,931,690 | |
California Infrastructure & Economic Development Refunding Bonds Museum Art Project Series A (Miscellaneous Revenue) ± | | | 1.87 | | | | 12-1-2037 | | | | 3,000,000 | | | | 3,092,040 | |
California PCFA Refunding Bond Pacific Gas & Electric Company Series D (Industrial Development Revenue, FGIC Insured) | | | 4.75 | | | | 12-1-2023 | | | | 1,515,000 | | | | 1,621,338 | |
California Public Works Board Lease Community College Project Series B (Miscellaneous Revenue, Ambac Insured) | | | 5.63 | | | | 3-1-2016 | | | | 200,000 | | | | 203,386 | |
California Public Works Board Lease Revenue Bond California State University Project Series C (Miscellaneous Revenue, National Insured) | | | 5.38 | | | | 10-1-2016 | | | | 500,000 | | | | 502,095 | |
California Public Works Board Lease Revenue Bond California State University Project Series C (Miscellaneous Revenue, National Insured) | | | 5.40 | | | | 10-1-2022 | | | | 700,000 | | | | 702,898 | |
California Series B (GO) ± | | | 0.94 | | | | 5-1-2018 | | | | 3,000,000 | | | | 3,046,620 | |
California Statewide CDA Revenue Eskaton Properties Incorporated (Health Revenue) | | | 5.00 | | | | 11-15-2017 | | | | 1,130,000 | | | | 1,229,350 | |
California Statewide CDA Revenue Eskaton Properties Incorporated (Health Revenue) | | | 5.00 | | | | 11-15-2018 | | | | 1,060,000 | | | | 1,172,795 | |
California Student Education Loan Marketing Corporation Series IV-D1 (Education Revenue) | | | 5.88 | | | | 1-1-2018 | | �� | | 2,370,000 | | | | 2,369,668 | |
California Various Purpose Bonds (Miscellaneous Revenue) | | | 6.25 | | | | 10-1-2019 | | | | 15,000 | | | | 15,224 | |
Delhi CA Unified School District CAB (GO, Ambac Insured) ¤ | | | 0.00 | | | | 8-1-2019 | | | | 2,500,000 | | | | 2,197,700 | |
Downey CA School Facilities Financing Authority PFOTER Series 4066 (Miscellaneous Revenue, National Insured, Dexia Credit Local LIQ) ø | | | 0.18 | | | | 8-1-2025 | | | | 3,945,000 | | | | 3,945,000 | |
Inland Valley CA Development Agency Series B (Tax Revenue) ± | | | 4.25 | | | | 3-1-2041 | | | | 4,400,000 | | | | 4,430,140 | |
Inland Valley CA Development Agency Series C (Tax Revenue) ± | | | 4.50 | | | | 3-1-2041 | | | | 4,300,000 | | | | 4,509,840 | |
Los Angeles County CA Schools Regionalized Business Services CAB Series A (Miscellaneous Revenue, Ambac Insured) ¤ | | | 0.00 | | | | 8-1-2016 | | | | 1,945,000 | | | | 1,903,085 | |
Northern California Gas Authority #1 LIBOR Series B (Utilities Revenue) ± | | | 0.88 | | | | 7-1-2027 | | | | 12,805,000 | | | | 11,767,667 | |
Palmdale CA Civic Authority Civic Center Refinancing Series A (Tax Revenue, National Insured) | | | 5.60 | | | | 7-1-2015 | | | | 35,000 | | | | 35,128 | |
Sacramento County CA Sanitation District PFOTER Series 3934 (Water & Sewer Revenue, FGIC Insured, Dexia Credit Local LIQ) ø | | | 0.13 | | | | 12-1-2035 | | | | 4,995,000 | | | | 4,995,000 | |
San Buenaventura CA Community Memorial Health System (Health Revenue) | | | 5.25 | | | | 12-1-2017 | | | | 1,455,000 | | | | 1,593,414 | |
San Buenaventura CA Community Memorial Health System (Health Revenue) | | | 5.75 | | | | 12-1-2018 | | | | 2,110,000 | | | | 2,404,746 | |
| | | | |
| | | | | | | | | | | | | | | 79,778,064 | |
| | | | | | | | | | | | | | | | |
| | | | |
| Colorado: 0.53% | | | | | | | | | | | | | | | | |
Colorado ECFA Rocky Mountain Classical Academy Project (Education Revenue) | | | 6.38 | | | | 9-1-2023 | | | | 2,310,000 | | | | 2,359,827 | |
Colorado Health Facilities Authority Evangelical Lutheran Good Samaritan Project (Health Revenue) | | | 5.25 | | | | 6-1-2024 | | | | 3,380,000 | | | | 3,532,235 | |
Colorado Health Facilities Authority Total Long-Term Care Incorporated (Health Revenue) | | | 4.25 | | | | 11-15-2015 | | | | 150,000 | | | | 152,505 | |
University of Colorado Enterprise Systems PFOTER Series 3840 (Education Revenue, National Insured, Dexia Credit Local LIQ) ø | | | 0.13 | | | | 6-1-2025 | | | | 2,405,000 | | | | 2,405,000 | |
| | | | |
| | | | | | | | | | | | | | | 8,449,567 | |
| | | | | | | | | | | | | | | | |
| | | | |
| Connecticut: 2.11% | | | | | | | | | | | | | | | | |
Connecticut HEFA Bridgeport Hospital Series D (Health Revenue) | | | 5.00 | | | | 7-1-2017 | | | | 1,070,000 | | | | 1,175,138 | |
Connecticut HEFA Bridgeport Hospital Series D (Health Revenue) | | | 5.00 | | | | 7-1-2020 | | | | 500,000 | | | | 581,300 | |
The accompanying notes are an integral part of these financial statements.
| | | | | | |
| Portfolio of investments—December 31, 2014 (unaudited) | | Wells Fargo Advantage Strategic Municipal Bond Fund | | | 9 | |
| | | | | | | | | | | | | | | | |
| Security name | | Interest rate | | | Maturity date | | | Principal | | | Value | |
| | | | | | | | | | | | | | | | |
| | | | |
| Connecticut (continued) | | | | | | | | | | | | | | | | |
Connecticut Series A (GO) ± | | | 0.79 | % | | | 3-1-2021 | | | $ | 4,365,000 | | | $ | 4,376,916 | |
Connecticut Series A (GO) ± | | | 0.92 | | | | 4-15-2018 | | | | 5,000,000 | | | | 5,068,100 | |
Connecticut Series A (GO) ± | | | 0.96 | | | | 5-15-2018 | | | | 2,000,000 | | | | 2,032,180 | |
Connecticut Series A (GO) ± | | | 1.24 | | | | 3-1-2018 | | | | 2,500,000 | | | | 2,504,450 | |
Connecticut Series A (GO) ± | | | 1.29 | | | | 4-15-2020 | | | | 7,000,000 | | | | 7,174,020 | |
Connecticut Series A (GO) ± | | | 1.39 | | | | 3-1-2019 | | | | 4,050,000 | | | | 4,058,222 | |
Connecticut Series D (GO) ± | | | 0.80 | | | | 9-15-2018 | | | | 1,000,000 | | | | 1,012,730 | |
Connecticut Series D (GO) ± | | | 0.96 | | | | 9-15-2019 | | | | 3,300,000 | | | | 3,365,109 | |
Hamden CT Refunding Bond (GO) | | | 5.00 | | | | 8-15-2019 | | | | 1,835,000 | | | | 2,058,558 | |
| | | | |
| | | | | | | | | | | | | | | 33,406,723 | |
| | | | | | | | | | | | | | | | |
| | | | |
| District of Columbia: 0.38% | | | | | | | | | | | | | | | | |
District of Columbia American College of Cardiology (Education Revenue, SunTrust Bank LOC) ø | | | 0.22 | | | | 6-1-2040 | | | | 6,000,000 | | | | 6,000,000 | |
| | | | | | | | | | | | | | | | |
| | | | |
| Florida: 5.11% | | | | | | | | | | | | | | | | |
Brevard County FL Space Coast Infrastructure Agency I-95 Project (Industrial Development Revenue) | | | 4.00 | | | | 6-15-2018 | | | | 5,000,000 | | | | 5,390,300 | |
Deutsche Bank SPEARs/LIFERs Trust Series DBE 1376 (Miscellaneous Revenue, Ambac Insured, Deutsche Bank LIQ) 144Aø | | | 0.15 | | | | 4-1-2027 | | | | 4,635,000 | | | | 4,635,000 | |
Escambia County FL School Board (Miscellaneous Revenue, National Insured) | | | 5.00 | | | | 2-1-2020 | | | | 4,525,000 | | | | 4,543,326 | |
Florida Cityplace Community Development District Special Assessment Revenue (Miscellaneous Revenue) | | | 5.00 | | | | 5-1-2017 | | | | 500,000 | | | | 536,275 | |
Florida Cityplace Community Development District Special Assessment Revenue (Miscellaneous Revenue) | | | 5.00 | | | | 5-1-2018 | | | | 1,375,000 | | | | 1,497,293 | |
Florida Correctional Privatization Commission Certificate of Participation 350 Bed Youthful Polk County Series B (Miscellaneous Revenue, Ambac Insured) | | | 5.00 | | | | 8-1-2017 | | | | 40,000 | | | | 40,157 | |
Florida Department of Environmental Protection Everglades Restoration Series A (Tax Revenue, AGM Insured) ø | | | 0.15 | | | | 7-1-2027 | | | | 18,305,000 | | | | 18,305,000 | |
Florida Mid-Bay Bridge Authority Series A (Transportation Revenue, Ambac Insured) | | | 5.95 | | | | 10-1-2022 | | | | 1,400,000 | | | | 1,399,720 | |
Florida Mid-Bay Bridge Authority Series B (Transportation Revenue) | | | 5.00 | | | | 10-1-2016 | | | | 2,000,000 | | | | 2,135,860 | |
Florida Municipal Loan Council Revenue Series A (Miscellaneous Revenue, National Insured) | | | 5.25 | | | | 11-1-2015 | | | | 150,000 | | | | 150,581 | |
Florida Village Community Development District #10 Special Assignment (Miscellaneous Revenue) | | | 5.13 | | | | 5-1-2024 | | | | 4,635,000 | | | | 5,028,558 | |
Lakeland FL Hospital System Lakeland Regional Health System (Health Revenue) | | | 5.00 | | | | 11-15-2022 | | | | 4,495,000 | | | | 5,016,195 | |
Manatee County FL HFA SFHR Series A (Housing Revenue, GNMA/FNMA Insured) | | | 6.57 | | | | 5-1-2039 | | | | 25,000 | | | | 26,422 | |
Miami FL Special Obligation (Miscellaneous Revenue, AGM Insured) | | | 5.00 | | | | 2-1-2017 | | | | 1,000,000 | | | | 1,085,320 | |
Miami-Dade County FL School Board Certificate of Participation Series A (Miscellaneous Revenue) ± | | | 5.00 | | | | 8-1-2021 | | | | 4,310,000 | | | | 4,531,017 | |
Orange County FL IDA Various Central Florida Kidney Centers (Industrial Development Revenue, SunTrust Bank LOC) ø | | | 0.22 | | | | 12-1-2020 | | | | 1,000,000 | | | | 1,000,000 | |
Orange County FL Tourist Development Tax (Miscellaneous Revenue, Ambac/MBIA Insured) | | | 6.00 | | | | 10-1-2016 | | | | 110,000 | | | | 115,286 | |
Palm Beach County FL PFOTER Series 4615 (Miscellaneous Revenue, Dexia Credit Local LIQ) ø | | | 0.31 | | | | 8-1-2029 | | | | 18,045,000 | | | | 18,045,000 | |
Seminole Tribe of Florida Special Obligation Series A (Miscellaneous Revenue) 144A | | | 5.50 | | | | 10-1-2024 | | | | 500,000 | | | | 542,800 | |
Sumter County FL Village Community Development District #5 Special Assessment Revenue Bond Phase I (Miscellaneous Revenue) | | | 3.00 | | | | 5-1-2016 | | | | 780,000 | | | | 795,382 | |
The accompanying notes are an integral part of these financial statements.
| | | | |
| 10 | | Wells Fargo Advantage Strategic Municipal Bond Fund | | Portfolio of investments—December 31, 2014 (unaudited) |
| | | | | | | | | | | | | | | | |
| Security name | | Interest rate | | | Maturity date | | | Principal | | | Value | |
| | | | | | | | | | | | | | | | |
| | | | |
| Florida (continued) | | | | | | | | | | | | | | | | |
Sumter County FL Village Community Development District #5 Special Assessment Revenue Bond Phase I (Miscellaneous Revenue) | | | 3.00 | % | | | 5-1-2017 | | | $ | 565,000 | | | $ | 581,069 | |
Sumter County FL Village Community Development District #5 Special Assessment Revenue Bond Phase I (Miscellaneous Revenue) | | | 3.00 | | | | 5-1-2018 | | | | 580,000 | | | | 599,175 | |
Sumter County FL Village Community Development District #5 Special Assessment Revenue Bond Phase II (Miscellaneous Revenue) | | | 3.00 | | | | 5-1-2017 | | | | 805,000 | | | | 827,894 | |
Sumter County FL Village Community Development District #5 Special Assessment Revenue Bond Phase II (Miscellaneous Revenue) | | | 3.00 | | | | 5-1-2018 | | | | 825,000 | | | | 852,275 | |
Volusia County FL School Board (Tax Revenue, AGM Insured) | | | 5.00 | | | | 10-1-2016 | | | | 3,055,000 | | | | 3,237,536 | |
| | | | |
| | | | | | | | | | | | | | | 80,917,441 | |
| | | | | | | | | | | | | | | | |
| | | | |
| Georgia: 1.37% | | | | | | | | | | | | | | | | |
Atlanta GA Water & Wastewater Project Series A-1 (Water & Sewer Revenue) ± | | | 1.61 | | | | 11-1-2038 | | | | 5,000,000 | | | | 5,133,850 | |
Burke County GA Development Authority Georgia Power Company Vogtle Plant Project (Industrial Development Revenue) ± | | | 1.75 | | | | 12-1-2049 | | | | 2,000,000 | | | | 2,029,060 | |
Burke County GA Development Authority Oglethorpe Power Corporation Vogtle Project Series A (Utilities Revenue) ± | | | 2.40 | | | | 1-1-2040 | | | | 5,500,000 | | | | 5,566,385 | |
Cherokee County GA Water & Sewage Authority (Water & Sewer Revenue, National Insured) | | | 6.90 | | | | 8-1-2018 | | | | 5,000 | | | | 5,027 | |
Gainesville-Hall County GA Hospital Authority Health System Project Series B (Health Revenue) ± | | | 0.98 | | | | 8-15-2035 | | | | 6,000,000 | | | | 6,008,280 | |
Georgia Road & Tollway Authority I-75 S Express Lanes Project Series A (Transportation Revenue) 144A¤ | | | 0.00 | | | | 6-1-2024 | | | | 2,500,000 | | | | 1,442,875 | |
Private Colleges & Universities Authority of Georgia (Education Revenue) | | | 5.00 | | | | 10-1-2019 | | | | 1,325,000 | | | | 1,495,236 | |
| | | | |
| | | | | | | | | | | | | | | 21,680,713 | |
| | | | | | | | | | | | | | | | |
| | | | |
| Guam: 0.18% | | | | | | | | | | | | | | | | |
Guam Department of Education John F. Kennedy High School Project Series A Certificate of Participation (Miscellaneous Revenue) | | | 5.50 | | | | 12-1-2015 | | | | 495,000 | | | | 503,257 | |
Guam Government Waterworks Authority Water & Wastewater System (Water & Sewer Revenue) | | | 4.00 | | | | 7-1-2016 | | | | 1,255,000 | | | | 1,303,456 | |
Guam Government Waterworks Authority Water & Wastewater System Series A (Water & Sewer Revenue) | | | 5.00 | | | | 7-1-2020 | | | | 1,000,000 | | | | 1,126,920 | |
| | | | |
| | | | | | | | | | | | | | | 2,933,633 | |
| | | | | | | | | | | | | | | | |
| | | | |
| Illinois: 18.57% | | | | | | | | | | | | | | | | |
Chicago IL Board of Education Dedicated Series C2 (GO) ± | | | 1.14 | | | | 3-1-2032 | | | | 9,900,000 | | | | 9,837,828 | |
Chicago IL Board of Education School Reform Board Series A (GO, National Insured) | | | 5.25 | | | | 12-1-2020 | | | | 1,000,000 | | | | 1,129,690 | |
Chicago IL Board of Education School Reform Board Series B-1 (GO, National Insured) ¤ | | | 0.00 | | | | 12-1-2021 | | | | 10,255,000 | | | | 7,918,091 | |
Chicago IL Board of Education Series 2012-001 (GO, Dexia Credit Local LIQ) 144Aø | | | 0.56 | | | | 12-1-2034 | | | | 12,185,000 | | | | 12,185,000 | |
Chicago IL Board of Education Series A3 (GO) ± | | | 0.87 | | | | 3-1-2036 | | | | 16,200,000 | | | | 15,743,322 | |
Chicago IL CAB (GO, National Insured) ± | | | 5.50 | | | | 1-1-2019 | | | | 3,225,000 | | | | 3,387,992 | |
Chicago IL O’Hare International Airport Series B (Airport Revenue, National Insured) | | | 6.00 | | | | 1-1-2027 | | | | 1,800,000 | | | | 1,808,190 | |
Chicago IL O’Hare International Airport Customer Facility Charge (Airport Revenue) | | | 5.25 | | | | 1-1-2023 | | | | 1,350,000 | | | | 1,582,430 | |
Chicago IL O’Hare International Airport Customer Facility Charge (Airport Revenue) | | | 5.25 | | | | 1-1-2024 | | | | 1,415,000 | | | | 1,643,225 | |
The accompanying notes are an integral part of these financial statements.
| | | | | | |
| Portfolio of investments—December 31, 2014 (unaudited) | | Wells Fargo Advantage Strategic Municipal Bond Fund | | | 11 | |
| | | | | | | | | | | | | | | | |
| Security name | | Interest rate | | | Maturity date | | | Principal | | | Value | |
| | | | | | | | | | | | | | | | |
| | | | |
| Illinois (continued) | | | | | | | | | | | | | | | | |
Chicago IL Park District Harbor Facilities Series D (GO) | | | 5.00 | % | | | 1-1-2022 | | | $ | 1,500,000 | | | $ | 1,760,475 | |
Chicago IL Park District Harbor Facilities Series D (GO) | | | 5.00 | | | | 1-1-2023 | | | | 1,175,000 | | | | 1,391,470 | |
Chicago IL Park District Limited Tax Series B (GO) | | | 5.00 | | | | 1-1-2022 | | | | 4,495,000 | | | | 5,275,557 | |
Chicago IL Refunding Bond (Tax Revenue, JPMorgan Chase & Company SPA) ø | | | 0.16 | | | | 1-1-2034 | | | | 11,320,000 | | | | 11,320,000 | |
Chicago IL Refunding Bonds Series A (GO, AGM Insured) | | | 5.00 | | | | 1-1-2024 | | | | 2,400,000 | | | | 2,478,936 | |
Chicago IL Refunding Bonds Series C (GO) | | | 5.00 | | | | 1-1-2021 | | | | 2,030,000 | | | | 2,225,712 | |
Chicago IL ROC RR-II-R-11940 (GO, Citibank NA LIQ) 144Aø | | | 0.29 | | | | 7-1-2028 | | | | 6,250,000 | | | | 6,250,000 | |
Chicago IL Series A (GO) | | | 4.00 | | | | 1-1-2019 | | | | 810,000 | | | | 857,563 | |
Chicago IL Series A (GO, AGM Insured) | | | 5.00 | | | | 1-1-2022 | | | | 9,750,000 | | | | 10,065,705 | |
Chicago IL Series A (GO, AGM Insured) | | | 5.00 | | | | 1-1-2023 | | | | 2,985,000 | | | | 3,082,878 | |
Chicago IL Series A (Water & Sewer Revenue, Ambac Insured) | | | 5.00 | | | | 11-1-2025 | | | | 5,000,000 | | | | 5,327,200 | |
Chicago IL Series A (GO) | | | 5.25 | | | | 1-1-2022 | | | | 2,035,000 | | | | 2,164,223 | |
Chicago IL Series B (GO, AGM Insured) | | | 5.00 | | | | 1-1-2021 | | | | 4,675,000 | | | | 4,785,657 | |
Chicago IL Series D (GO, Ambac Insured) | | | 5.00 | | | | 12-1-2022 | | | | 3,915,000 | | | | 4,112,473 | |
Chicago IL Series G (GO, Ambac Insured) | | | 5.00 | | | | 12-1-2024 | | | | 1,100,000 | | | | 1,148,895 | |
Chicago IL Tax Increment Bond Pilson Redevelopment Project Series A (Tax Revenue) | | | 5.00 | | | | 6-1-2022 | | | | 1,635,000 | | | | 1,841,991 | |
Chicago IL Transit Authority Capital Grant Federal Transit Administration Section 5307-A (Transportation Revenue, AGM Insured) | | | 5.25 | | | | 6-1-2022 | | | | 1,800,000 | | | | 2,007,378 | |
Chicago IL Waterworks Revenue Series A (Water & Sewer Revenue, Ambac Insured) | | | 5.00 | | | | 11-1-2021 | | | | 1,000,000 | | | | 1,070,920 | |
Chicago IL Waterworks Revenue Sub Series 2000-1 (Water & Sewer Revenue, JPMorgan Chase & Company LOC) ø | | | 0.05 | | | | 11-1-2030 | | | | 1,000,000 | | | | 1,000,000 | |
Chicago IL Waterworks Revenue Sub Series 2000-2 (Water & Sewer Revenue, JPMorgan Chase & Company LOC) ø | | | 0.05 | | | | 11-1-2030 | | | | 6,000,000 | | | | 6,000,000 | |
Cook & Du Page Counties IL Combined School District #113A CAB (GO, National Insured) ¤ | | | 0.00 | | | | 12-1-2019 | | | | 1,025,000 | | | | 843,698 | |
Cook County IL Community College District #510 South Suburban College CAB (GO, AGM Insured) ¤ | | | 0.00 | | | | 12-1-2015 | | | | 1,090,000 | | | | 1,080,986 | |
Cook County IL School District #123 Oak Lawn CAB (GO, National Insured) ¤ | | | 0.00 | | | | 12-1-2021 | | | | 1,090,000 | | | | 900,929 | |
Cook County IL Series A (GO) | | | 5.25 | | | | 11-15-2022 | | | | 10,000,000 | | | | 11,491,600 | |
Deutsche Bank SPEARs/LIFERs Trust Series DBE 1115 (Miscellaneous Revenue, Deutsche Bank LIQ) 144Aø | | | 0.20 | | | | 5-15-2041 | | | | 8,075,000 | | | | 8,075,000 | |
Deutsche Bank SPEARs/LIFERs Trust Series DBE 1379 (Miscellaneous Revenue, Deutsche Bank LIQ) 144Aø | | | 0.16 | | | | 5-1-2032 | | | | 10,000,000 | | | | 10,000,000 | |
Huntley IL Special Service Area #6 (Tax Revenue, AGM Insured) | | | 4.60 | | | | 3-1-2017 | | | | 699,000 | | | | 708,485 | |
Illinois (GO) | | | 5.00 | | | | 1-1-2018 | | | | 4,500,000 | | | | 4,925,610 | |
Illinois (Miscellaneous Revenue) | | | 5.00 | | | | 7-1-2022 | | | | 1,880,000 | | | | 2,112,105 | |
Illinois (Miscellaneous Revenue, AGM Insured) | | | 5.00 | | | | 7-1-2023 | | | | 4,875,000 | | | | 5,554,770 | |
Illinois Finance Authority Proctor Hospital Project Series A (Health Revenue) | | | 5.13 | | | | 1-1-2025 | | | | 4,800,000 | | | | 5,001,456 | |
Illinois Finance Authority Student Housing (Education Revenue) | | | 5.13 | | | | 10-1-2020 | | | | 4,530,000 | | | | 4,846,828 | |
Illinois Municipal Electric Agency Power Series A (Utilities Revenue, National Insured) | | | 5.25 | | | | 2-1-2021 | | | | 3,840,000 | | | | 4,189,248 | |
Illinois Refunding Bonds (Miscellaneous Revenue, AGM Insured) | | | 5.00 | | | | 8-1-2020 | | | | 5,050,000 | | | | 5,739,729 | |
Illinois Series 2004 (GO) | | | 5.00 | | | | 9-1-2016 | | | | 1,400,000 | | | | 1,405,460 | |
Illinois Series 2010 (GO) | | | 5.00 | | | | 1-1-2017 | | | | 1,250,000 | | | | 1,341,275 | |
Illinois Series 2012 (Miscellaneous Revenue) | | | 5.00 | | | | 8-1-2021 | | | | 5,620,000 | | | | 6,330,368 | |
Illinois Series A (GO) | | | 5.00 | | | | 4-1-2020 | | | | 2,000,000 | | | | 2,242,160 | |
Illinois Series A (GO) | | | 5.00 | | | | 4-1-2023 | | | | 3,500,000 | | | | 3,940,020 | |
Illinois Sports Facilities Authority State Tax Supported CAB (Tax Revenue, Ambac Insured) ¤ | | | 0.00 | | | | 6-15-2022 | | | | 2,370,000 | | | | 1,809,448 | |
The accompanying notes are an integral part of these financial statements.
| | | | |
| 12 | | Wells Fargo Advantage Strategic Municipal Bond Fund | | Portfolio of investments—December 31, 2014 (unaudited) |
| | | | | | | | | | | | | | | | |
| Security name | | Interest rate | | | Maturity date | | | Principal | | | Value | |
| | | | | | | | | | | | | | | | |
| | | | |
| Illinois (continued) | | | | | | | | | | | | | | | | |
Illinois Toll Highway Authority Series A1 (Transportation Revenue, AGM Insured, JPMorgan Chase & Company SPA) ø | | | 0.06 | % | | | 1-1-2031 | | | $ | 28,205,000 | | | $ | 28,205,000 | |
Illinois Toll Highway Authority Series A2 (Transportation Revenue, AGM Insured, Bank of America NA SPA) ø | | | 0.07 | | | | 1-1-2031 | | | | 10,000,000 | | | | 10,000,000 | |
Kendall Kane & Will Counties IL Community Unit School District Series C (GO, AGM Insured) ¤ | | | 0.00 | | | | 10-1-2017 | | | | 1,350,000 | | | | 1,302,021 | |
Lake County IL Community Consolidated School District #3 Beach Park CAB (GO, Ambac Insured) ¤ | | | 0.00 | | | | 2-1-2017 | | | | 1,610,000 | | | | 1,517,489 | |
Lake County IL Community Consolidated School District #3 Beach Park CAB (GO, Ambac Insured) ¤ | | | 0.00 | | | | 2-1-2018 | | | | 1,000,000 | | | | 906,190 | |
Lake County IL Community Consolidated School District #3 Beach Park CAB (GO, Ambac Insured) ¤ | | | 0.00 | | | | 2-1-2019 | | | | 1,100,000 | | | | 954,668 | |
McHenry & Kane Counties IL Community Consolidated School District #158 CAB (GO, National Insured) ¤ | | | 0.00 | | | | 1-1-2018 | | | | 4,000,000 | | | | 3,872,800 | |
McHenry & Kane Counties IL Community Consolidated School District #158 CAB (GO, AGM/FGIC Insured) ¤ | | | 0.00 | | | | 1-1-2019 | | | | 1,185,000 | | | | 1,122,017 | |
Springfield IL Electric Senior Lien (Utilities Revenue, National Insured) | | | 5.00 | | | | 3-1-2021 | | | | 7,410,000 | | | | 7,990,648 | |
St. Clair County IL School District Series B (GO, National Insured) | | | 4.75 | | | | 1-1-2018 | | | | 655,000 | | | | 698,905 | |
University of Illinois Utility Infrastructure Projects Series 2004 (Education Revenue, Bank of New York Mellon SPA) ø | | | 0.08 | | | | 8-15-2021 | | | | 25,000,000 | | | | 25,000,000 | |
Will County IL School District #114 CAB Series C (GO, National Insured) ¤ | | | 0.00 | | | | 12-1-2021 | | | | 855,000 | | | | 668,738 | |
| | | | |
| | | | | | | | | | | | | | | 294,180,452 | |
| | | | | | | | | | | | | | | | |
| | | | |
| Indiana: 2.74% | | | | | | | | | | | | | | | | |
Dearborn County IN EDA Hospital Project (Health Revenue, Fifth Third Bank LOC) ø | | | 0.19 | | | | 4-1-2036 | | | | 3,600,000 | | | | 3,600,000 | |
Indiana Finance Authority Ohio River Bridges East End Crossing Project Series B (Industrial Development Revenue) | | | 5.00 | | | | 1-1-2019 | | | | 16,205,000 | | | | 17,415,027 | |
Indiana HEFA Ascension Health Series B3 (Health Revenue) ± | | | 1.91 | | | | 11-15-2031 | | | | 11,000,000 | | | | 11,060,060 | |
Indiana HFFA Ancilla System Incorporated (Health Revenue, National Insured) | | | 5.25 | | | | 7-1-2022 | | | | 325,000 | | | | 326,355 | |
Knox County IN EDA Good Samaritan Hospital Series A (Health Revenue) | | | 4.00 | | | | 4-1-2017 | | | | 625,000 | | | | 660,219 | |
Knox County IN EDA Good Samaritan Hospital Series A (Health Revenue) | | | 4.00 | | | | 4-1-2018 | | | | 400,000 | | | | 426,740 | |
Whiting IN BP Products North America Incorporated Project (Resource Recovery Revenue) | | | 0.79 | | | | 12-1-2044 | | | | 10,000,000 | | | | 9,950,000 | |
| | | | |
| | | | | | | | | | | | | | | 43,438,401 | |
| | | | | | | | | | | | | | | | |
| | | | |
| Iowa: 0.25% | | | | | | | | | | | | | | | | |
Iowa Student Loan Liquidity Corporation Series A1 (Education Revenue) | | | 3.50 | | | | 12-1-2015 | | | | 740,000 | | | | 750,686 | |
Iowa Student Loan Liquidity Corporation Series A1 (Education Revenue) | | | 3.88 | | | | 12-1-2016 | | | | 2,345,000 | | | | 2,419,782 | |
Iowa Student Loan Liquidity Corporation Series A1 (Education Revenue) | | | 4.13 | | | | 12-1-2017 | | | | 740,000 | | | | 774,173 | |
| | | | |
| | | | | | | | | | | | | | | 3,944,641 | |
| | | | | | | | | | | | | | | | |
| | | | |
| Kansas: 0.03% | | | | | | | | | | | | | | | | |
Kansas Development Finance Authority (Health Revenue) | | | 5.00 | | | | 11-15-2015 | | | | 500,000 | | | | 518,490 | |
| | | | | | | | | | | | | | | | |
| | | | |
| Kentucky: 1.67% | | | | | | | | | | | | | | | | |
Allen County KY Camp Courageous Project (Miscellaneous Revenue, SunTrust Bank LOC) ø | | | 0.24 | | | | 12-1-2025 | | | | 5,000,000 | | | | 5,000,000 | |
Ashland KY Ashland Hospital Corporation Kings Daughters Medical Center Project (Health Revenue) ± | | | 1.79 | | | | 2-1-2040 | | | | 8,000,000 | | | | 8,036,800 | |
The accompanying notes are an integral part of these financial statements.
| | | | | | |
| Portfolio of investments—December 31, 2014 (unaudited) | | Wells Fargo Advantage Strategic Municipal Bond Fund | | | 13 | |
| | | | | | | | | | | | | | | | |
| Security name | | Interest rate | | | Maturity date | | | Principal | | | Value | |
| | | | | | | | | | | | | | | | |
| | | | |
| Kentucky (continued) | | | | | | | | | | | | | | | | |
Christian County KY Jennie Stuart Medical Center (Health Revenue, AGM Insured) | | | 5.25 | % | | | 2-1-2018 | | | $ | 1,520,000 | | | $ | 1,606,944 | |
Kentucky EDFA Masonic Homes of Kentucky (Health Revenue) | | | 3.00 | | | | 11-15-2015 | | | | 720,000 | | | | 725,933 | |
Kentucky EDFA Masonic Homes of Kentucky (Health Revenue) | | | 4.00 | | | | 11-15-2016 | | | | 740,000 | | | | 760,986 | |
Kentucky EDFA Norton Healthcare Incorporated Series B (Health Revenue, National Insured) ¤ | | | 0.00 | | | | 10-1-2022 | | | | 1,000,000 | | | | 789,840 | |
Lexington-Fayette KY Urban County Government First Bracktown Incorporated Project (Industrial Development Revenue, Fifth Third Bank LOC) ø | | | 0.19 | | | | 12-1-2031 | | | | 3,806,000 | | | | 3,806,000 | |
Lexington-Fayette KY Urban County Government Northeast Christian Project (Miscellaneous Revenue, Fifth Third Bank LOC) ø | | | 0.19 | | | | 1-1-2033 | | | | 4,430,000 | | | | 4,430,000 | |
Pikeville KY Hospital Pikeville Medical Center (Health Revenue) | | | 4.00 | | | | 3-1-2015 | | | | 750,000 | | | | 753,998 | |
Pikeville KY Hospital Pikeville Medical Center (Health Revenue) | | | 5.00 | | | | 3-1-2016 | | | | 500,000 | | | | 523,155 | |
| | | | |
| | | | | | | | | | | | | | | 26,433,656 | |
| | | | | | | | | | | | | | | | |
| | | | |
| Louisiana: 1.51% | | | | | | | | | | | | | | | | |
Louisiana HFA SFHR Home Owner Series C-2 (Housing Revenue, GNMA Insured) | | | 5.55 | | | | 6-1-2035 | | | | 110,000 | | | | 112,696 | |
Louisiana Tobacco Settlement Financing Corporation Revenue Bonds Series A (Tobacco Revenue) | | | 5.00 | | | | 5-15-2024 | | | | 7,500,000 | | | | 7,572,000 | |
Louisiana Tobacco Settlement Financing Corporation Revenue Bonds Series A (Tobacco Revenue) | | | 5.00 | | | | 5-15-2025 | | | | 7,500,000 | | | | 7,771,350 | |
New Orleans LA (GO, National Insured) | | | 5.25 | | | | 12-1-2022 | | | | 3,540,000 | | | | 3,684,715 | |
St. Bernard Parish LA (Tax Revenue) | | | 4.00 | | | | 3-1-2019 | | | | 3,355,000 | | | | 3,636,485 | |
Terrebonne Parish LA Hospital Service District #1 Hospital (Health Revenue) | | | 4.00 | | | | 4-1-2015 | | | | 600,000 | | | | 604,494 | |
Terrebonne Parish LA Hospital Service District #1 Hospital (Health Revenue) | | | 4.00 | | | | 4-1-2016 | | | | 500,000 | | | | 517,120 | |
| | | | |
| | | | | | | | | | | | | | | 23,898,860 | |
| | | | | | | | | | | | | | | | |
| | | | |
| Maryland: 0.98% | | | | | | | | | | | | | | | | |
Baltimore MD MSTR Series 152 (Water & Sewer Revenue, Societe Generale LOC, National Insured) 144Aø | | | 0.17 | | | | 7-1-2020 | | | | 8,940,000 | | | | 8,940,000 | |
Howard County MD Housing Commission Series A (Housing Revenue) ± | | | 1.29 | | | | 7-1-2034 | | | | 6,625,000 | | | | 6,626,060 | |
| | | | |
| | | | | | | | | | | | | | | 15,566,060 | |
| | | | | | | | | | | | | | | | |
| | | | |
| Massachusetts: 2.95% | | | | | | | | | | | | | | | | |
Massachusetts Educational Financing Authority (Education Revenue) | | | 5.00 | | | | 7-1-2018 | | | | 750,000 | | | | 832,403 | |
Massachusetts Educational Financing Authority (Education Revenue) | | | 5.00 | | | | 7-1-2019 | | | | 5,000,000 | | | | 5,571,750 | |
Massachusetts Various Consolidated Loans Series D (Tax Revenue) ± | | | 0.47 | | | | 1-1-2018 | | | | 3,000,000 | | | | 3,014,910 | |
Massachusetts Water Resources Authority Series E (Water & Sewer Revenue, JPMorgan Chase & Company SPA) ø | | | 0.05 | | | | 8-1-2037 | | | | 23,600,000 | | | | 23,600,000 | |
University of Massachusetts Building Authority Series A (Education Revenue, Barclays Bank plc SPA) ø | | | 0.02 | | | | 5-1-2038 | | | | 13,800,000 | | | | 13,800,000 | |
| | | | |
| | | | | | | | | | | | | | | 46,819,063 | |
| | | | | | | | | | | | | | | | |
| | | | |
| Michigan: 5.46% | | | | | | | | | | | | | | | | |
Clarkston MI Community Schools (GO, Qualified School Bond Loan Fund Insured) %% | | | 5.00 | | | | 5-1-2021 | | | | 4,500,000 | | | | 5,244,705 | |
Clarkston MI Community Schools (GO, Qualified School Bond Loan Fund Insured) %% | | | 5.00 | | | | 5-1-2022 | | | | 5,000,000 | | | | 5,869,550 | |
Constantine MI Public Schools (GO, Qualified School Bond Loan Fund Insured) %% | | | 5.00 | | | | 5-1-2020 | | | | 350,000 | | | | 405,552 | |
Constantine MI Public Schools (GO, Qualified School Bond Loan Fund Insured) %% | | | 5.00 | | | | 5-1-2021 | | | | 1,200,000 | | | | 1,407,192 | |
The accompanying notes are an integral part of these financial statements.
| | | | |
| 14 | | Wells Fargo Advantage Strategic Municipal Bond Fund | | Portfolio of investments—December 31, 2014 (unaudited) |
| | | | | | | | | | | | | | | | |
| Security name | | Interest rate | | | Maturity date | | | Principal | | | Value | |
| | | | | | | | | | | | | | | | |
| | | | |
| Michigan (continued) | | | | | | | | | | | | | | | | |
Detroit MI Distribution of State Aid (GO) | | | 4.50 | % | | | 11-1-2023 | | | $ | 975,000 | | | $ | 1,050,163 | |
Detroit MI Downtown Development Authority CAB (Tax Revenue) ¤ | | | 0.00 | | | | 7-1-2015 | | | | 875,000 | | | | 851,559 | |
Detroit MI Downtown Development Authority CAB (Tax Revenue) ¤ | | | 0.00 | | | | 7-1-2016 | | | | 1,370,000 | | | | 1,271,442 | |
Detroit MI Downtown Development Authority CAB (Tax Revenue) ¤ | | | 0.00 | | | | 7-1-2017 | | | | 3,015,000 | | | | 2,591,935 | |
Forest Hills MI Public Schools (GO) %% | | | 5.00 | | | | 5-1-2020 | | | | 1,600,000 | | | | 1,869,392 | |
Forest Hills MI Public Schools (GO) %% | | | 5.00 | | | | 5-1-2021 | | | | 1,600,000 | | | | 1,896,864 | |
Fraser MI Public Schools District (GO, Qualified School Bond Loan Fund Insured) %% | | | 5.00 | | | | 5-1-2021 | | | | 1,000,000 | | | | 1,164,820 | |
Fraser MI Public Schools District (GO, Qualified School Bond Loan Fund Insured) %% | | | 5.00 | | | | 5-1-2022 | | | | 610,000 | | | | 716,408 | |
Grand Haven MI (Utilities Revenue, National Insured) | | | 5.50 | | | | 7-1-2016 | | | | 1,000,000 | | | | 1,052,990 | |
Hudsonville MI Public Schools (GO, Qualified School Bond Loan Fund Insured) %% | | | 5.00 | | | | 5-1-2021 | | | | 1,465,000 | | | | 1,705,553 | |
Hudsonville MI Public Schools (GO, Qualified School Bond Loan Fund Insured) %% | | | 5.00 | | | | 5-1-2022 | | | | 1,475,000 | | | | 1,731,517 | |
Michigan Finance Authority Limited Obligation Cesar Chavez Academy Project (Education Revenue) | | | 4.25 | | | | 2-1-2017 | | | | 1,000,000 | | | | 1,004,520 | |
Michigan Finance Authority Revenue Local Government Loan Program Series C (Miscellaneous Revenue) | | | 5.00 | | | | 11-1-2020 | | | | 1,500,000 | | | | 1,657,770 | |
Michigan Finance Authority Series 25-A (Education Revenue) | | | 5.00 | | | | 11-1-2018 | | | | 1,500,000 | | | | 1,652,160 | |
Michigan Finance Authority Series 25-A (Education Revenue) | | | 5.00 | | | | 11-1-2019 | | | | 1,500,000 | | | | 1,667,715 | |
Michigan Finance Authority Series A (Health Revenue) | | | 5.00 | | | | 6-1-2015 | | | | 1,090,000 | | | | 1,107,952 | |
Michigan Finance Authority Series H-1 (Tax Revenue) | | | 5.00 | | | | 10-1-2021 | | | | 1,565,000 | | | | 1,799,734 | |
Michigan Finance Authority St. John Health System Series A (Health Revenue, Ambac Insured) | | | 5.00 | | | | 5-15-2018 | | | | 300,000 | | | | 301,176 | |
Michigan Financial Authority Local Government Loan Program Series C7 (Water & Sewer Revenue, National Insured) | | | 5.00 | | | | 7-1-2022 | | | | 2,000,000 | | | | 2,291,480 | |
Michigan Financial Authority Local Government Loan Program Series D1 (Water & Sewer Revenue, AGM Insured) | | | 5.00 | | | | 7-1-2022 | | | | 2,700,000 | | | | 3,113,208 | |
Michigan Financial Authority Local Government Loan Program Series D1 (Water & Sewer Revenue, AGM Insured) | | | 5.00 | | | | 7-1-2023 | | | | 1,000,000 | | | | 1,157,220 | |
Michigan Financial Authority Local Government Loan Program Series D6 (Water & Sewer Revenue, National Insured) | | | 5.00 | | | | 7-1-2021 | | | | 6,355,000 | | | | 7,237,455 | |
Michigan Financial Authority Local Government Loan Program Series D6 (Water & Sewer Revenue, National Insured) | | | 5.00 | | | | 7-1-2022 | | | | 1,080,000 | | | | 1,237,399 | |
Michigan Financial Authority Local Government Loan Program Series D6 (Water & Sewer Revenue, National Insured) | | | 5.00 | | | | 7-1-2023 | | | | 3,670,000 | | | | 4,229,088 | |
Michigan Financial Authority Local Government Loan Program Series D6 (Water & Sewer Revenue, National Insured) | | | 5.00 | | | | 7-1-2024 | | | | 2,130,000 | | | | 2,470,353 | |
Michigan Hospital Finance Authority Hospice of Michigan (Miscellaneous Revenue, Fifth Third Bank LOC) ø | | | 0.19 | | | | 9-1-2027 | | | | 1,510,000 | | | | 1,510,000 | |
Michigan Municipal Bond Authority Local Government Loan Program Series A (Miscellaneous Revenue, Ambac Insured) | | | 4.00 | | | | 11-1-2019 | | | | 500,000 | | | | 506,910 | |
Michigan Municipal Bond Authority Local Government Loan Program Series A (Miscellaneous Revenue, Ambac Insured) | | | 5.00 | | | | 11-1-2015 | | | | 150,000 | | | | 153,654 | |
Michigan Municipal Bond Authority Local Government Loan Program Series A (Miscellaneous Revenue, Ambac Insured) | | | 5.00 | | | | 5-1-2018 | | | | 595,000 | | | | 611,892 | |
Michigan Municipal Bond Authority Local Government Loan Program Series C (Miscellaneous Revenue, Ambac Insured) | | | 4.13 | | | | 5-1-2020 | | | | 500,000 | | | | 506,460 | |
Michigan Municipal Bond Authority Local Government Loan Program Series C (Miscellaneous Revenue, Ambac Insured) | | | 5.00 | | | | 5-1-2023 | | | | 1,900,000 | | | | 1,941,401 | |
The accompanying notes are an integral part of these financial statements.
| | | | | | |
| Portfolio of investments—December 31, 2014 (unaudited) | | Wells Fargo Advantage Strategic Municipal Bond Fund | | | 15 | |
| | | | | | | | | | | | | | | | |
| Security name | | Interest rate | | | Maturity date | | | Principal | | | Value | |
| | | | | | | | | | | | | | | | |
| | | | |
| Michigan (continued) | | | | | | | | | | | | | | | | |
Michigan Public Educational Facilities Authority Chandler Park Academy (Miscellaneous Revenue) | | | 6.35 | % | | | 11-1-2028 | | | $ | 1,500,000 | | | $ | 1,524,825 | |
Michigan Strategic Fund Limited Obligation Events Center Project Series A (Tax Revenue) ± | | | 4.13 | | | | 7-1-2045 | | | | 7,500,000 | | | | 7,566,900 | |
Saginaw County MI Economic Development Corporation Limited Obligation Lease (Miscellaneous Revenue) | | | 3.00 | | | | 12-1-2015 | | | | 235,000 | | | | 239,035 | |
Southfield MI Public Schools (GO, National/Qualified School Bond Loan Fund Insured) | | | 4.38 | | | | 5-1-2025 | | | | 1,950,000 | | | | 2,076,575 | |
Wayne County MI Airport Authority AMT Detroit Metropolitan Airport Series A (Airport Revenue) | | | 5.00 | | | | 12-1-2022 | | | | 7,500,000 | | | | 8,599,275 | |
Wayne County MI Airport Authority AMT Detroit Metropolitan Airport Series C (Airport Revenue) | | | 5.00 | | | | 12-1-2022 | | | | 1,000,000 | | | | 1,139,720 | |
Wayne County MI Building Authority Capital Improvement Series A (GO, National Insured) | | | 5.25 | | | | 6-1-2016 | | | | 370,000 | | | | 371,502 | |
| | | | |
| | | | | | | | | | | | | | | 86,505,021 | |
| | | | | | | | | | | | | | | | |
| | | | |
| Minnesota: 1.71% | | | | | | | | | | | | | | | | |
Minneapolis & St. Paul MN Housing & RDA Children’s Hospital Clinics Series A (Miscellaneous Revenue, AGM Insured, U.S. Bank NA SPA) ø | | | 0.04 | | | | 8-15-2037 | | | | 14,495,000 | | | | 14,495,000 | |
Minnesota HEFAR Carleton College Series 5G (Education Revenue, JPMorgan Chase & Company SPA) ø | | | 0.07 | | | | 11-1-2029 | | | | 12,100,000 | | | | 12,100,000 | |
St. Paul MN Housing & RDA Charter School Hmong College Prep Academy Series A (Miscellaneous Revenue) | | | 4.75 | | | | 9-1-2022 | | | | 500,000 | | | | 525,675 | |
| | | | |
| | | | | | | | | | | | | | | 27,120,675 | |
| | | | | | | | | | | | | | | | |
| | | | |
| Mississippi: 0.52% | | | | | | | | | | | | | | | | |
Gulfport MS Hospital Facilities Gulfport Memorial Hospital Series A (Health Revenue, National Insured) | | | 6.20 | | | | 7-1-2018 | | | | 200,000 | | | | 200,596 | |
Perry County MS PCR Leaf River Forest Product Project (Industrial Development Revenue, Georgia-Pacific LLC LOC) 144Aø | | | 0.26 | | | | 2-1-2022 | | | | 8,000,000 | | | | 8,000,000 | |
| | | | |
| | | | | | | | | | | | | | | 8,200,596 | |
| | | | | | | | | | | | | | | | |
| | | | |
| Missouri: 0.51% | | | | | | | | | | | | | | | | |
Sikeston MO The Electric System of the Board of Municipal Utilities (Utilities Revenue, National Insured) | | | 6.00 | | | | 6-1-2015 | | | | 3,000,000 | | | | 3,069,480 | |
St. Louis MO PFOTER Series 3584 (Airport Revenue, National Insured, Dexia Credit Local LIQ) ø | | | 0.23 | | | | 7-1-2030 | | | | 4,980,000 | | | | 4,980,000 | |
| | | | |
| | | | | | | | | | | | | | | 8,049,480 | |
| | | | | | | | | | | | | | | | |
| | | | |
| Nebraska: 0.35% | | | | | | | | | | | | | | | | |
Nebraska Central Plains Energy Project #3 (Utilities Revenue) | | | 5.00 | | | | 9-1-2022 | | | | 2,420,000 | | | | 2,731,696 | |
Nebraska Higher Education Loan Program Foundation for Educational Funding Project (Education Revenue, National/FHA Insured) ¤ | | | 0.00 | | | | 12-15-2015 | | | | 2,970,000 | | | | 2,873,416 | |
| | | | |
| | | | | | | | | | | | | | | 5,605,112 | |
| | | | | | | | | | | | | | | | |
| | | | |
| Nevada: 0.20% | | | | | | | | | | | | | | | | |
Carson City NV Carson Tahoe Regional Medical Center (Health Revenue) | | | 4.00 | | | | 9-1-2015 | | | | 400,000 | | | | 407,632 | |
Carson City NV Carson Tahoe Regional Medical Center (Health Revenue) | | | 4.00 | | | | 9-1-2016 | | | | 400,000 | | | | 417,536 | |
Carson City NV Carson Tahoe Regional Medical Center (Health Revenue) | | | 5.00 | | | | 9-1-2018 | | | | 700,000 | | | | 774,466 | |
Las Vegas NV Special Improvement District #60 (Miscellaneous Revenue) | | | 3.00 | | | | 6-1-2017 | | | | 745,000 | | | | 749,142 | |
The accompanying notes are an integral part of these financial statements.
| | | | |
| 16 | | Wells Fargo Advantage Strategic Municipal Bond Fund | | Portfolio of investments—December 31, 2014 (unaudited) |
| | | | | | | | | | | | | | | | |
| Security name | | Interest rate | | | Maturity date | | | Principal | | | Value | |
| | | | | | | | | | | | | | | | |
| | | | |
| Nevada (continued) | | | | | | | | | | | | | | | | |
Las Vegas NV Special Improvement District #60 (Miscellaneous Revenue) | | | 4.00 | % | | | 6-1-2018 | | | $ | 735,000 | | | $ | 758,682 | |
| | | | |
| | | | | | | | | | | | | | | 3,107,458 | |
| | | | | | | | | | | | | | | | |
| | | | |
| New Hampshire: 0.03% | | | | | | | | | | | | | | | | |
New Hampshire HEFA Covenant Health Project Series B (Health Revenue) | | | 5.00 | | | | 7-1-2016 | | | | 520,000 | | | | 549,370 | |
| | | | | | | | | | | | | | | | |
| | | | |
| New Jersey: 2.50% | | | | | | | | | | | | | | | | |
Delaware River NJ Port Authority Pennsylvania & New Jersey Port District Project (Port Authority Revenue) | | | 5.00 | | | | 1-1-2017 | | | | 2,100,000 | | | | 2,276,400 | |
Delaware River NJ Port Authority Pennsylvania & New Jersey Port District Project (Port Authority Revenue) | | | 5.00 | | | | 1-1-2018 | | | | 1,230,000 | | | | 1,373,541 | |
Jersey City NJ (GO, AGM Insured) | | | 4.00 | | | | 9-1-2018 | | | | 1,140,000 | | | | 1,238,291 | |
New Jersey EDA Elite Pharmaceuticals Project Series A (Industrial Development Revenue) | | | 6.50 | | | | 9-1-2030 | | | | 510,000 | | | | 460,137 | |
New Jersey EDA School Facilities Construction Project Series C (Miscellaneous Revenue) ± | | | 1.83 | | | | 2-1-2018 | | | | 6,500,000 | | | | 6,673,030 | |
New Jersey EDA School Facilities Construction Project Series E (Miscellaneous Revenue) ± | | | 1.74 | | | | 2-1-2016 | | | | 1,100,000 | | | | 1,106,644 | |
New Jersey EDA School Facilities Construction Project Series I (Miscellaneous Revenue) ± | | | 1.59 | | | | 9-1-2027 | | | | 12,500,000 | | | | 12,472,625 | |
New Jersey EDA School Facilities Construction Project Series NN (Miscellaneous Revenue, AGM Insured) | | | 5.00 | | | | 3-1-2024 | | | | 1,645,000 | | | | 1,883,196 | |
New Jersey EDA The Goethals Bridge Replacement Project (Industrial Development Revenue) | | | 5.00 | | | | 7-1-2020 | | | | 500,000 | | | | 578,040 | |
New Jersey EDA The Goethals Bridge Replacement Project (Industrial Development Revenue) | | | 5.00 | | | | 1-1-2021 | | | | 585,000 | | | | 673,405 | |
New Jersey EDA The Goethals Bridge Replacement Project (Industrial Development Revenue) | | | 5.00 | | | | 7-1-2021 | | | | 900,000 | | | | 1,046,520 | |
New Jersey EDA The Goethals Bridge Replacement Project (Industrial Development Revenue) | | | 5.00 | | | | 1-1-2023 | | | | 400,000 | | | | 462,836 | |
New Jersey TTFA PFOTER Series 109 (Transportation Revenue, Dexia Credit Local LOC, FGIC Insured, Dexia Credit Local SPA) 144Aø | | | 0.24 | | | | 12-15-2030 | | | | 5,500,000 | | | | 5,500,000 | |
Newark NJ Housing Authority (Miscellaneous Revenue, National Insured) | | | 5.25 | | | | 1-1-2019 | | | | 2,995,000 | | | | 3,366,170 | |
Paterson NJ General Improvement (GO, AGM Insured) | | | 5.00 | | | | 6-15-2020 | | | | 400,000 | | | | 441,444 | |
| | | | |
| | | | | | | | | | | | | | | 39,552,279 | |
| | | | | | | | | | | | | | | | |
| | | | |
| New Mexico: 1.24% | | | | | | | | | | | | | | | | |
Dona Ana County NM Tax Revenue Receipts (Tax Revenue, Ambac Insured) | | | 5.50 | | | | 6-1-2015 | | | | 1,000,000 | | | | 1,014,760 | |
Dona Ana County NM Tax Revenue Receipts (Tax Revenue, Ambac Insured) | | | 5.50 | | | | 6-1-2016 | | | | 1,000,000 | | | | 1,045,680 | |
New Mexico Educational Assistance Foundation Series A2 (Education Revenue) ± | | | 0.89 | | | | 12-1-2028 | | | | 460,000 | | | | 457,691 | |
New Mexico Municipal Energy Acquisition Authority Gas Supply Sub Series B (Utilities Revenue, Royal Bank of Canada SPA) ± | | | 0.85 | | | | 11-1-2039 | | | | 17,100,000 | | | | 17,210,124 | |
| | | | |
| | | | | | | | | | | | | | | 19,728,255 | |
| | | | | | | | | | | | | | | | |
| | | | |
| New York: 10.18% | | | | | | | | | | | | | | | | |
Build New York City Resource Corporation Bronx Charter School for International Cultures & Arts Series A (Education Revenue) | | | 3.88 | | | | 4-15-2023 | | | | 1,000,000 | | | | 981,490 | |
Build New York City Resource Corporation Pratt Paper Incorporated Project (Industrial Development Revenue) 144A | | | 3.75 | | | | 1-1-2020 | | | | 1,000,000 | | | | 1,013,620 | |
Build New York City Resource Corporation Pratt Paper Incorporated Project (Industrial Development Revenue) 144A | | | 4.50 | | | | 1-1-2025 | | | | 250,000 | | | | 254,783 | |
The accompanying notes are an integral part of these financial statements.
| | | | | | |
| Portfolio of investments—December 31, 2014 (unaudited) | | Wells Fargo Advantage Strategic Municipal Bond Fund | | | 17 | |
| | | | | | | | | | | | | | | | |
| Security name | | Interest rate | | | Maturity date | | | Principal | | | Value | |
| | | | | | | | | | | | | | | | |
| | | | |
| New York (continued) | | | | | | | | | | | | | | | | |
Deutsche Bank SPEARs/LIFERs Trust Series DBE 1190 (Airport Revenue, Deutsche Bank LIQ) 144Aø | | | 0.14 | % | | | 12-15-2041 | | | $ | 6,035,000 | | | $ | 6,035,000 | |
Monroe County NY Industrial Development Corporation Unity Hospital Rochester Project (Health Revenue, FHA Insured) | | | 4.20 | | | | 8-15-2025 | | | | 7,195,000 | | | | 7,202,843 | |
New York Dormitory Authority Presbyterian Hospital (Health Revenue, AGM/FHA Insured) | | | 5.25 | | | | 8-15-2015 | | | | 640,000 | | | | 644,454 | |
New York Dormitory Authority St. John University Series B-1 (Education Revenue, Bank of America NA LOC) ø | | | 0.06 | | | | 7-1-2034 | | | | 5,555,000 | | | | 5,555,000 | |
New York Energy R&D Authority Electric & Gas Corporation Series A (Utilities Revenue) | | | 2.13 | | | | 3-15-2015 | | | | 1,000,000 | | | | 1,002,990 | |
New York HFA Manhattan Residential Housing Series A (Housing Revenue, Bank of China LOC) ø | | | 0.22 | | | | 11-1-2049 | | | | 4,000,000 | | | | 4,000,000 | |
New York IDA American Airlines JFK International Airport (Industrial Development Revenue) | | | 7.50 | | | | 8-1-2016 | | | | 1,610,000 | | | | 1,704,298 | |
New York Local Government Assistance Corporation Series A9V (Tax Revenue, AGM Insured) ±(m)(n) | | | 0.12 | | | | 4-1-2017 | | | | 4,250,000 | | | | 4,186,250 | |
New York Metropolitan Transportation Authority Dedicated Tax Fund (Tax Revenue) ± | | | 0.99 | | | | 11-1-2019 | | | | 7,500,000 | | | | 7,620,975 | |
New York NY City Housing Authority Lease Purchase Agreement (Housing Revenue) (i) | | | 4.78 | | | | 1-6-2016 | | | | 975,238 | | | | 989,867 | |
New York NY Municipal Water Finance Authority Series AA2 (Water & Sewer Revenue, Dexia Credit Local SPA) ø | | | 0.11 | | | | 6-15-2032 | | | | 15,865,000 | | | | 15,865,000 | |
New York NY Municipal Water Finance Authority Series F-1 (Water & Sewer Revenue, Mizuho Bank Limited SPA) ø | | | 0.02 | | | | 6-15-2033 | | | | 10,000,000 | | | | 10,000,000 | |
New York NY Sub Series A-6 (GO, AGM Insured, Dexia Credit Local SPA) ø | | | 0.16 | | | | 11-1-2026 | | | | 3,300,000 | | | | 3,300,000 | |
New York NY Sub Series C-2 (GO, Bayerische Landesbank LOC) ø | | | 0.03 | | | | 8-1-2020 | | | | 13,500,000 | | | | 13,500,000 | |
New York NY Sub Series J-4 (GO) ± | | | 0.59 | | | | 8-1-2025 | | | | 6,700,000 | | | | 6,694,104 | |
New York Port Authority of New York and New Jersey Consolidated Series 185 (Port Authority Revenue) | | | 5.00 | | | | 9-1-2021 | | | | 31,060,000 | | | | 36,473,137 | |
New York Tobacco Settlement Financing Corporation Series A (Tobacco Revenue) | | | 5.00 | | | | 6-1-2022 | | | | 3,000,000 | | | | 3,280,560 | |
New York Tobacco Settlement Financing Corporation Series B (Tobacco Revenue) | | | 5.00 | | | | 6-1-2021 | | | | 9,500,000 | | | | 10,407,535 | |
New York Urban Development Corporation (Tax Revenue, Dexia Credit Local LOC, National Insured, Dexia Credit Local LIQ) 144Aø | | | 0.13 | | | | 3-15-2024 | | | | 7,980,000 | | | | 7,980,000 | |
New York Urban Development Corporation Certificate of Participation James A. Farley Post Office Building Refinancing (Miscellaneous Revenue) | | | 4.00 | | | | 2-1-2015 | | | | 7,770,000 | | | | 7,777,848 | |
Niagara NY Area Development Corporation (Education Revenue) | | | 4.00 | | | | 5-1-2015 | | | | 250,000 | | | | 252,553 | |
Niagara NY Area Development Corporation (Education Revenue) | | | 4.00 | | | | 5-1-2016 | | | | 300,000 | | | | 310,764 | |
Niagara NY Area Development Corporation (Education Revenue) | | | 5.00 | | | | 5-1-2017 | | | | 250,000 | | | | 268,675 | |
Niagara NY Area Development Corporation (Education Revenue) | | | 5.00 | | | | 5-1-2018 | | | | 500,000 | | | | 546,945 | |
Suffolk County NY Economic Development Corporation (Health Revenue) | | | 5.00 | | | | 7-1-2017 | | | | 1,000,000 | | | | 1,097,470 | |
Suffolk County NY Tobacco Asset Securitization Corporation (Tobacco Revenue) | | | 5.00 | | | | 6-1-2019 | | | | 575,000 | | | | 649,077 | |
Suffolk County NY Tobacco Asset Securitization Corporation (Tobacco Revenue) | | | 5.00 | | | | 6-1-2020 | | | | 625,000 | | | | 715,350 | |
Ulster County NY Resource Recovery Agency (Resource Recovery Revenue) | | | 3.00 | | | | 3-1-2017 | | | | 900,000 | | | | 934,353 | |
| | | | |
| | | | | | | | | | | | | | | 161,244,941 | |
| | | | | | | | | | | | | | | | |
| | | | |
| North Carolina: 1.26% | | | | | | | | | | | | | | | | |
North Carolina Medical Care Commission Healthcare Facilities Series A (Health Revenue, JPMorgan Chase & Company SPA) ø | | | 0.06 | | | | 11-1-2034 | | | | 20,000,000 | | | | 20,000,000 | |
| | | | | | | | | | | | | | | | |
| | | | |
| North Dakota: 0.17% | | | | | | | | | | | | | | | | |
Ward County ND Health Care Facility Trinity Obligated Group Series B (Health Revenue) | | | 6.25 | | | | 7-1-2021 | | | | 1,425,000 | | | | 1,430,729 | |
The accompanying notes are an integral part of these financial statements.
| | | | |
| 18 | | Wells Fargo Advantage Strategic Municipal Bond Fund | | Portfolio of investments—December 31, 2014 (unaudited) |
| | | | | | | | | | | | | | | | |
| Security name | | Interest rate | | | Maturity date | | | Principal | | | Value | |
| | | | | | | | | | | | | | | | |
| | | | |
| North Dakota (continued) | | | | | | | | | | | | | | | | |
Williston ND Parks & Recreation District Sales Tax & Gross Revenue Series A (Tax Revenue) | | | 3.00 | % | | | 3-1-2016 | | | $ | 400,000 | | | $ | 409,588 | |
Williston ND Parks & Recreation District Sales Tax & Gross Revenue Series B-1 (Tax Revenue) | | | 2.00 | | | | 3-1-2032 | | | | 820,000 | | | | 820,098 | |
| | | | |
| | | | | | | | | | | | | | | 2,660,415 | |
| | | | | | | | | | | | | | | | |
| | | | |
| Ohio: 2.34% | | | | | | | | | | | | | | | | |
Akron OH Sanitary Sewer System Improvement Project (Water & Sewer Revenue, Ambac Insured) | | | 5.00 | | | | 12-1-2017 | | | | 750,000 | | | | 802,110 | |
Montgomery County OH Catholic Health Initiatives Series C2 (Health Revenue, U.S. Bank NA SPA) ø | | | 0.10 | | | | 10-1-2041 | | | | 15,000,000 | | | | 15,000,000 | |
Montgomery County OH Catholic Health Refunding Bond Series B-2 (Health Revenue, U.S. Bank NA SPA) ø | | | 0.10 | | | | 3-1-2027 | | | | 7,000,000 | | | | 7,000,000 | |
Ohio Air Quality Development Authority Pollution Control Facilities Refunding Bond FirstEnergy Generation Project (Resource Recovery Revenue) ± | | | 3.10 | | | | 3-1-2023 | | | | 2,000,000 | | | | 2,048,760 | |
Ohio HFA SFHR CAB Series A (Housing Revenue, FGIC/FHA/VA Insured) ¤ | | | 0.00 | | | | 1-15-2015 | | | | 5,725 | | | | 5,724 | |
Ohio University Hospitals Health Systems Series B (Health Revenue) ø | | | 0.35 | | | | 1-15-2033 | | | | 5,000,000 | | | | 5,000,000 | |
Ohio Water Development Authority Pollution Control Facilities Refunding Bond FirstEnergy Generation Project Series A (Water & Sewer Revenue) | | | 3.00 | | | | 5-15-2019 | | | | 7,000,000 | | | | 7,179,060 | |
| | | | |
| | | | | | | | | | | | | | | 37,035,654 | |
| | | | | | | | | | | | | | | | |
| | | | |
| Oklahoma: 0.20% | | | | | | | | | | | | | | | | |
Comanche County OK Hospital Authority Series A (Health Revenue) | | | 5.00 | | | | 7-1-2018 | | | | 795,000 | | | | 854,577 | |
Tulsa OK Airports Improvement Trust Series B (Airport Revenue) | | | 4.75 | | | | 6-1-2018 | | | | 325,000 | | | | 329,748 | |
Woodward County OK PFFA Series B (Tax Revenue) | | | 3.25 | | | | 9-1-2026 | | | | 2,000,000 | | | | 2,013,840 | |
| | | | |
| | | | | | | | | | | | | | | 3,198,165 | |
| | | | | | | | | | | | | | | | |
| | | | |
| Oregon: 0.08% | | | | | | | | | | | | | | | | |
Umatilla County OR Hospital Facilities Authority Series B (Health Revenue, Bayerische Landesbank SPA) ø | | | 0.12 | | | | 12-1-2024 | | | | 1,300,000 | | | | 1,300,000 | |
| | | | | | | | | | | | | | | | |
| | | | |
| Other: 0.14% | | | | | | | | | | | | | | | | |
Public Housing Capital Fund Trust II (Miscellaneous Revenue, HUD Insured) 144A | | | 4.50 | | | | 7-1-2022 | | | | 2,286,768 | | | | 2,290,061 | |
| | | | | | | | | | | | | | | | |
| | | | |
| Pennsylvania: 6.32% | | | | | | | | | | | | | | | | |
Allegheny County PA Airport Authority PFOTER Series 3965 (Airport Revenue, National Insured, Dexia Credit Local LIQ) ø | | | 0.28 | | | | 1-1-2020 | | | | 7,535,000 | | | | 7,535,000 | |
Allegheny County PA RDA Pittsburgh Mills Project (Tax Revenue) | | | 5.60 | | | | 7-1-2023 | | | | 1,500,000 | | | | 1,527,270 | |
Beaver County PA IDA FirstEnergy Nuclear Series B (Industrial Development Revenue) ± | | | 3.50 | | | | 12-1-2035 | | | | 2,000,000 | | | | 2,061,440 | |
Berks County PA Municipal Authority Reading Hospital & Medical Center Project Series B (Health Revenue) ± | | | 1.54 | | | | 11-1-2039 | | | | 8,750,000 | | | | 8,974,525 | |
Butler County PA General Authority South Park School District Project (Miscellaneous Revenue, AGM Insured, PNC Bank NA SPA) ø | | | 0.08 | | | | 8-1-2027 | | | | 9,995,000 | | | | 9,995,000 | |
Butler County PA Hospital Authority Series A (Health Revenue, Royal Bank of Scotland LOC) ø | | | 0.24 | | | | 10-1-2042 | | | | 5,400,000 | | | | 5,400,000 | |
Dauphin County PA General Authority Office & Parking Riverfront Office Project (Miscellaneous Revenue) | | | 6.00 | | | | 1-1-2025 | | | | 4,860,000 | | | | 4,862,770 | |
Delaware County PA IDA Chester Community Charter School (Education Revenue) | | | 4.50 | | | | 8-15-2017 | | | | 2,990,000 | | | | 3,046,900 | |
Delaware Valley PA Regional Finance Authority (Miscellaneous Revenue) | | | 5.75 | | | | 7-1-2017 | | | | 1,191,000 | | | | 1,317,842 | |
The accompanying notes are an integral part of these financial statements.
| | | | | | |
| Portfolio of investments—December 31, 2014 (unaudited) | | Wells Fargo Advantage Strategic Municipal Bond Fund | | | 19 | |
| | | | | | | | | | | | | | | | |
| Security name | | Interest rate | | | Maturity date | | | Principal | | | Value | |
| | | | |
| Pennsylvania (continued) | | | | | | | | | | | | | | | | |
Pennsylvania EDFA Solid Waste Refunding Bond Republic Services Incorporated Project Series A (Resource Recovery Revenue) ø | | | 0.37 | % | | | 4-1-2019 | | | $ | 4,750,000 | | | $ | 4,750,000 | |
Pennsylvania EDFA Solid Waste Refunding Bond Republic Services Incorporated Project Series B (Resource Recovery Revenue) ø | | | 0.30 | | | | 12-1-2030 | | | | 1,885,000 | | | | 1,885,000 | |
Pennsylvania HEFAR Shippensburg University Student Services (Education Revenue) | | | 4.00 | | | | 10-1-2017 | | | | 550,000 | | | | 570,587 | |
Pennsylvania Public School Building Authority Albert Gallatin Area School District Project (Miscellaneous Revenue) ± | | | 0.90 | | | | 9-1-2024 | | | | 4,500,000 | | | | 4,506,525 | |
Pennsylvania Public School Building Authority Series 11396 (Miscellaneous Revenue, AGM Insured, Citibank NA LIQ) 144Aø | | | 0.22 | | | | 12-1-2023 | | | | 5,000,000 | | | | 5,000,000 | |
Pennsylvania Turnpike Commission Series A (Transportation Revenue) ± | | | 0.72 | | | | 12-1-2018 | | | | 11,000,000 | | | | 11,060,500 | |
Pennsylvania Turnpike Commission Series B (Transportation Revenue) ± | | | 1.31 | | | | 12-1-2020 | | | | 10,000,000 | | | | 10,237,000 | |
Philadelphia PA Authority for Industrial Development Tacony Academy Christian School Project Series A-1 (Education Revenue) | | | 6.25 | | | | 6-15-2023 | | | | 730,000 | | | | 794,897 | |
Philadelphia PA Hospital & HEFAR Temple University Health System Series B (Health Revenue) | | | 5.00 | | | | 7-1-2017 | | | | 1,500,000 | | | | 1,603,140 | |
St. Marys PA Hospital Authority Catholic Series B (Health Revenue, Bayerische Landesbank SPA) ø | | | 0.12 | | | | 12-1-2024 | | | | 4,600,000 | | | | 4,600,000 | |
St. Marys PA Hospital Authority Health System Catholic Health East Series B (Health Revenue) | | | 5.00 | | | | 11-15-2015 | | | | 930,000 | | | | 933,636 | |
Susquehanna PA Area Regional Airport Authority System Series A (Airport Revenue) | | | 5.00 | | | | 1-1-2019 | | | | 3,630,000 | | | | 4,020,080 | |
Susquehanna PA Area Regional Airport Authority System Series A (Airport Revenue) | | | 5.00 | | | | 1-1-2020 | | | | 4,855,000 | | | | 5,427,016 | |
| | | | |
| | | | | | | | | | | | | | | 100,109,128 | |
| | | | | | | | | | | | | | | | |
| | | | |
| Puerto Rico: 3.11% | | | | | | | | | | | | | | | | |
Puerto Rico Aqueduct & Sewer Authority Series A (Water & Sewer Revenue, AGM Insured) | | | 5.00 | | | | 7-1-2016 | | | | 5,190,000 | | | | 5,333,452 | |
Puerto Rico CAB Refunding Bonds (Miscellaneous Revenue, National Insured) ¤ | | | 0.00 | | | | 7-1-2016 | | | | 400,000 | | | | 362,036 | |
Puerto Rico Electric Power Authority Series L (Utilities Revenue, National Insured) | | | 5.50 | | | | 7-1-2016 | | | | 2,540,000 | | | | 2,621,128 | |
Puerto Rico Government Development Bank Series 1985 (Miscellaneous Revenue, National Insured) ± | | | 4.75 | | | | 12-1-2015 | | | | 7,025,000 | | | | 7,049,026 | |
Puerto Rico Government Development Bank Series 3402 (Miscellaneous Revenue, Morgan Stanley Bank LIQ) 144Aø | | | 0.50 | | | | 6-30-2015 | | | | 15,000,000 | | | | 15,000,000 | |
Puerto Rico Highway & Transportation Revenue Series BB (Transportation Revenue, Ambac Insured) | | | 5.25 | | | | 7-1-2017 | | | | 3,165,000 | | | | 3,183,389 | |
Puerto Rico Highway & Transportation Revenue Series BB (Transportation Revenue, Ambac Insured) | | | 5.25 | | | | 7-1-2018 | | | | 2,955,000 | | | | 2,978,551 | |
Puerto Rico Municipal Finance Authority Series C (Miscellaneous Revenue, AGM Insured) | | | 5.00 | | | | 8-1-2015 | | | | 925,000 | | | | 929,986 | |
Puerto Rico Municipal Finance Authority Series C (Miscellaneous Revenue, AGM Insured) | | | 5.25 | | | | 8-1-2017 | | | | 300,000 | | | | 307,254 | |
Puerto Rico Municipal Finance Authority Series C (Tobacco Revenue, BHAC/FGIC Insured) | | | 5.50 | | | | 7-1-2020 | | | | 8,550,000 | | | | 9,801,464 | |
Puerto Rico Public Improvement Series A (GO, AGM Insured) | | | 5.00 | | | | 7-1-2015 | | | | 1,695,000 | | | | 1,698,458 | |
| | | | |
| | | | | | | | | | | | | | | 49,264,744 | |
| | | | | | | | | | | | | | | | |
| | | | |
| Rhode Island: 0.66% | | | | | | | | | | | | | | | | |
Providence RI RDA (Miscellaneous Revenue, Ambac Insured) | | | 4.75 | | | | 4-1-2020 | | | | 2,710,000 | | | | 2,720,027 | |
Rhode Island Clean Water Finance Agency Cranston Wastewater Treatment System (Miscellaneous Revenue, National Insured) | | | 5.80 | | | | 9-1-2022 | | | | 975,000 | | | | 976,385 | |
Rhode Island Health & Educational Building Corporation (Miscellaneous Revenue, AGM Insured) | | | 5.00 | | | | 5-15-2018 | | | | 2,180,000 | | | | 2,294,821 | |
Rhode Island HEFA Educational Facilitation Meeting Center (Miscellaneous Revenue, Citizens Bank LOC) ø | | | 0.17 | | | | 6-1-2035 | | | | 4,445,000 | | | | 4,445,000 | |
Rhode Island Housing & Mortgage Finance (Housing Revenue) | | | 6.50 | | | | 4-1-2027 | | | | 15,000 | | | | 15,186 | |
| | | | |
| | | | | | | | | | | | | | | 10,451,419 | |
| | | | | | | | | | | | | | | | |
The accompanying notes are an integral part of these financial statements.
| | | | |
| 20 | | Wells Fargo Advantage Strategic Municipal Bond Fund | | Portfolio of investments—December 31, 2014 (unaudited) |
| | | | | | | | | | | | | | | | |
| Security name | | Interest rate | | | Maturity date | | | Principal | | | Value | |
| | | | | | | | | | | | | | | | |
| | | | |
| South Carolina: 0.93% | | | | | | | | | | | | | | | | |
South Carolina EDA York Preparatory Academy Project Series A (Education Revenue) | | | 5.75 | % | | | 11-1-2023 | | | $ | 1,080,000 | | | $ | 1,128,557 | |
South Carolina Jobs EDA Ebenezer Nursing Series A (Health Revenue, GNMA Insured) | | | 6.90 | | | | 1-20-2037 | | | | 2,890,000 | | | | 2,900,924 | |
South Carolina Public Service Authority Series 3065X (Utilities Revenue, Credit Suisse LIQ) 144Aø | | | 0.04 | | | | 1-1-2038 | | | | 10,640,000 | | | | 10,640,000 | |
| | | | |
| | | | | | | | | | | | | | | 14,669,481 | |
| | | | | | | | | | | | | | | | |
| | | | |
| South Dakota: 0.07% | | | | | | | | | | | | | | | | |
South Dakota HEFA (Health Revenue) | | | 4.50 | | | | 9-1-2019 | | | | 990,000 | | | | 1,079,991 | |
| | | | | | | | | | | | | | | | |
| | | | |
| Tennessee: 1.78% | | | | | | | | | | | | | | | | |
Clarksville TN Natural Gas Acquisition Corporation Gas Revenue Bonds (Utilities Revenue) | | | 5.00 | | | | 12-15-2021 | | | | 640,000 | | | | 731,072 | |
Shelby County TN HEFA Methodist Le Bonheur Series A (Health Revenue, AGM Insured, U.S. Bank NA SPA) ø | | | 0.05 | | | | 6-1-2042 | | | | 5,100,000 | | | | 5,100,000 | |
Shelby County TN Series C (GO, JPMorgan Chase & Company SPA) ø | | | 0.07 | | | | 12-1-2031 | | | | 4,850,000 | | | | 4,850,000 | |
Tennessee Energy Acquisition Corporation Series A (Utilities Revenue) | | | 5.25 | | | | 9-1-2017 | | | | 1,655,000 | | | | 1,828,245 | |
Tennessee Energy Acquisition Corporation Series A (Utilities Revenue) | | | 5.25 | | | | 9-1-2018 | | | | 4,000,000 | | | | 4,553,560 | |
Tennessee Energy Acquisition Corporation Series A (Utilities Revenue) | | | 5.25 | | | | 9-1-2020 | | | | 4,720,000 | | | | 5,412,707 | |
Tennessee Energy Acquisition Corporation Series A (Utilities Revenue) | | | 5.25 | | | | 9-1-2021 | | | | 4,000,000 | | | | 4,610,720 | |
Tennessee Energy Acquisition Corporation Series C (Utilities Revenue) | | | 5.00 | | | | 2-1-2017 | | | | 1,010,000 | | | | 1,087,750 | |
| | | | |
| | | | | | | | | | | | | | | 28,174,054 | |
| | | | | | | | | | | | | | | | |
| | | | |
| Texas: 7.70% | | | | | | | | | | | | | | | | |
Austin TX Airport Systems Revenue Bond (Airport Revenue) %% | | | 5.00 | | | | 11-15-2026 | | | | 1,655,000 | | | | 1,969,268 | |
Austin TX Airport Systems Revenue Bond (Airport Revenue) %% | | | 5.00 | | | | 11-15-2027 | | | | 1,300,000 | | | | 1,536,249 | |
Austin TX Airport Systems Revenue Bond (Airport Revenue) %% | | | 5.00 | | | | 11-15-2028 | | | | 1,500,000 | | | | 1,758,840 | |
Austin TX Housing Finance Corporation SFHR (Housing Revenue) ¤ | | | 0.00 | | | | 2-1-2016 | | | | 1,530,000 | | | | 22,537 | |
Austin TX Independent School District (GO) | | | 5.00 | | | | 8-1-2024 | | | | 4,470,000 | | | | 5,574,850 | |
Central Texas Regional Mobility Authority Senior Lien Series A (Transportation Revenue) | | | 5.00 | | | | 1-1-2021 | | | | 1,000,000 | | | | 1,179,670 | |
Central Texas Regional Mobility Authority Senior Lien Series A (Transportation Revenue) | | | 5.00 | | | | 1-1-2023 | | | | 500,000 | | | | 595,115 | |
Coastal Water Authority Texas Conveyance System (Water & Sewer Revenue, FGIC Insured) | | | 7.50 | | | | 12-15-2016 | | | | 20,000 | | | | 20,121 | |
Dallas TX International Airport Facilities Series 2001-A1 (Industrial Development Revenue) | | | 6.15 | | | | 1-1-2016 | | | | 3,000,000 | | | | 3,040,950 | |
Deutsche Bank SPEARs/LIFERs Trust Series DBE 1149 (Health Revenue, Deutsche Bank LIQ) 144Aø | | | 0.29 | | | | 8-15-2043 | | | | 4,985,000 | | | | 4,985,000 | |
Galveston TX Wharves & Terminal Revenue (Airport Revenue) | | | 5.00 | | | | 2-1-2017 | | | | 1,100,000 | | | | 1,178,331 | |
Houston TX Airport System United Airlines Incorporated Terminal E Project (Airport Revenue) | | | 4.50 | | | | 7-1-2020 | | | | 3,400,000 | | | | 3,614,234 | |
Lubbock TX Health Facilities Development Corporation Lutheran Retirement (Housing Revenue, GNMA Insured) | | | 6.00 | | | | 3-20-2029 | | | | 1,000,000 | | | | 1,002,500 | |
Midtown TX RDA (Tax Revenue) | | | 4.00 | | | | 1-1-2016 | | | | 1,980,000 | | | | 2,047,419 | |
Midtown TX RDA (Tax Revenue) | | | 5.00 | | | | 1-1-2017 | | | | 2,270,000 | | | | 2,439,024 | |
North Texas Higher Education Authority Incorporated Student Loan Series 2 Class A (Education Revenue) ± | | | 1.24 | | | | 4-1-2037 | | | | 2,855,000 | | | | 2,855,057 | |
Port Arthur TX Naval District Environmental Facilities Motiva Enterprises Project Series B (Resource Recovery Revenue) ø | | | 0.20 | | | | 12-1-2039 | | | | 6,500,000 | | | | 6,500,000 | |
The accompanying notes are an integral part of these financial statements.
| | | | | | |
| Portfolio of investments—December 31, 2014 (unaudited) | | Wells Fargo Advantage Strategic Municipal Bond Fund | | | 21 | |
| | | | | | | | | | | | | | | | |
| Security name | | Interest rate | | | Maturity date | | | Principal | | | Value | |
| | | | | | | | | | | | | | | | |
| | | | |
| Texas (continued) | | | | | | | | | | | | | | | | |
Port Arthur TX Naval District Motiva Enterprises Series B (Industrial Development Revenue) ø | | | 0.20 | % | | | 4-1-2040 | | | $ | 6,100,000 | | | $ | 6,100,000 | |
Sam Rayburn TX Municipal Power Agency (Utilities Revenue) | | | 5.00 | | | | 10-1-2017 | | | | 560,000 | | | | 618,503 | |
Tarrant County TX Cultural Educational Facilities Texas Health Resources Series B (Health Revenue) ø | | | 0.18 | | | | 11-15-2047 | | | | 10,000,000 | | | | 10,000,000 | |
Texas Gas Supply SA Energy Acquisition Public Facilities Corporation (Utilities Revenue) | | | 5.50 | | | | 8-1-2021 | | | | 4,330,000 | | | | 5,048,434 | |
Texas Municipal Gas Acquisition & Supply Corporation II Series B (Utilities Revenue, JPMorgan Chase & Company Guaranteed) ± | | | 0.50 | | | | 9-15-2017 | | | | 6,465,000 | | | | 6,473,792 | |
Texas Municipal Gas Acquisition & Supply Corporation III Gas Supply Revenue (Utilities Revenue) | | | 5.00 | | | | 12-15-2020 | | | | 6,500,000 | | | | 7,506,720 | |
Texas Municipal Gas Acquisition & Supply Corporation III Gas Supply Revenue (Utilities Revenue) | | | 5.00 | | | | 12-15-2021 | | | | 3,000,000 | | | | 3,494,820 | |
Texas Municipal Gas Acquisition & Supply Corporation III Gas Supply Revenue (Utilities Revenue) | | | 5.00 | | | | 12-15-2023 | | | | 6,000,000 | | | | 6,848,160 | |
Texas PFA Southern University Financing System (Education Revenue, Build America Mutual Assurance Company Insured) | | | 5.00 | | | | 11-1-2020 | | | | 1,715,000 | | | | 1,918,433 | |
Texas PFA Southern University Financing System (Education Revenue, Build America Mutual Assurance Company Insured) | | | 5.00 | | | | 11-1-2021 | | | | 1,275,000 | | | | 1,434,630 | |
Texas Transportation Commission Highway Improvement (GO) | | | 5.00 | | | | 4-1-2027 | | | | 10,010,000 | | | | 12,257,245 | |
Texas Turnpike Authority Central Texas Turnpike System CAB (Transportation Revenue, Ambac Insured) ¤ | | | 0.00 | | | | 8-15-2027 | | | | 1,425,000 | | | | 674,809 | |
Waco TX Educational Finance Corporation Baylor University Series A (Education Revenue, Bank of New York Mellon SPA) ø | | | 0.03 | | | | 2-1-2032 | | | | 16,675,000 | | | | 16,675,000 | |
Wood Glen TX Housing Finance Corporation Mortgage Copperwood Project Series A (Miscellaneous Revenue, National/FHA Insured) | | | 7.65 | | | | 7-1-2022 | | | | 2,125,000 | | | | 2,598,620 | |
| | | | |
| | | | | | | | | | | | | | | 121,968,331 | |
| | | | | | | | | | | | | | | | |
| | | | |
| Utah: 0.24% | | | | | | | | | | | | | | | | |
Box Elder County UT Nucor Corporation Project (Industrial Development Revenue) ø | | | 0.22 | | | | 4-1-2028 | | | | 3,000,000 | | | | 3,000,000 | |
Utah HFA RHA Community Services Project Series A (Health Revenue) | | | 6.88 | | | | 7-1-2027 | | | | 755,000 | | | | 755,815 | |
| | | | |
| | | | | | | | | | | | | | | 3,755,815 | |
| | | | | | | | | | | | | | | | |
| | | | |
| Vermont: 1.35% | | | | | | | | | | | | | | | | |
Vermont Student Assistance Corporation Education Loan Revenue Series B (Education Revenue) ± | | | 1.16 | | | | 6-2-2042 | | | | 14,941,828 | | | | 14,920,611 | |
Vermont Student Assistance Corporation Education Loan Revenue Series BCL-A1 (Education Revenue) ± | | | 1.74 | | | | 6-1-2022 | | | | 6,505,273 | | | | 6,516,137 | |
| | | | |
| | | | | | | | | | | | | | | 21,436,748 | |
| | | | | | | | | | | | | | | | |
| | | | |
| Virgin Islands: 0.11% | | | | | | | | | | | | | | | | |
Virgin Islands PFA Sub Lien Series C (Miscellaneous Revenue) | | | 5.00 | | | | 10-1-2017 | | | | 1,600,000 | | | | 1,724,624 | |
| | | | | | | | | | | | | | | | |
| | | | |
| Virginia: 0.47% | | | | | | | | | | | | | | | | |
Caroline County VA Industrial Development Revenue Public Facility Lease BAN (Miscellaneous Revenue) | | | 4.00 | | | | 8-1-2016 | | | | 1,810,000 | | | | 1,813,131 | |
Dulles VA Town Center CDA (Miscellaneous Revenue) | | | 3.00 | | | | 3-1-2015 | | | | 550,000 | | | | 550,605 | |
Dulles VA Town Center CDA (Miscellaneous Revenue) | | | 3.00 | | | | 3-1-2016 | | | | 620,000 | | | | 622,021 | |
Dulles VA Town Center CDA (Miscellaneous Revenue) | | | 4.00 | | | | 3-1-2017 | | | | 1,910,000 | | | | 1,945,526 | |
The accompanying notes are an integral part of these financial statements.
| | | | |
| 22 | | Wells Fargo Advantage Strategic Municipal Bond Fund | | Portfolio of investments—December 31, 2014 (unaudited) |
| | | | | | | | | | | | | | | | |
| Security name | | Interest rate | | | Maturity date | | | Principal | | | Value | |
| | | | | | | | | | | | | | | | |
| | | | |
| Virginia (continued) | | | | | | | | | | | | | | | | |
Virginia Housing Development Authority AMT Series A Sub Series A-5 (Housing Revenue) | | | 4.50 | % | | | 1-1-2020 | | | $ | 2,600,000 | | | $ | 2,600,000 | |
| | | | |
| | | | | | | | | | | | | | | 7,531,283 | |
| | | | | | | | | | | | | | | | |
| | | | |
| Washington: 0.49% | | | | | | | | | | | | | | | | |
King County WA Public Hospital District #1 Valley Medical Center Series A (Health Revenue) | | | 4.00 | | | | 6-15-2015 | | | | 1,185,000 | | | | 1,195,262 | |
King County WA Public Hospital District #1 Valley Medical Center Series A (Health Revenue) | | | 4.00 | | | | 6-15-2016 | | | | 1,480,000 | | | | 1,513,596 | |
Redmond WA Library Capital Facilities Area (GO) | | | 5.00 | | | | 12-1-2017 | | | | 200,000 | | | | 200,794 | |
Seattle WA Housing Authority High Rise Rehabilitation Phase 1 (Housing Revenue, AGM Insured) | | | 5.00 | | | | 11-1-2025 | | | | 1,000,000 | | | | 1,032,420 | |
Washington HCFR Catholic Health Initiatives Series B (Health Revenue, JPMorgan Chase & Company SPA) ø | | | 0.12 | | | | 3-1-2032 | | | | 3,800,000 | | | | 3,800,000 | |
| | | | |
| | | | | | | | | | | | | | | 7,742,072 | |
| | | | | | | | | | | | | | | | |
| | | | |
| Wisconsin: 1.61% | | | | | | | | | | | | | | | | |
Deutsche Bank SPEARs/LIFERs Trust Series DBE 1228 (Housing Revenue, Deutsche Bank LIQ) 144Aø | | | 0.52 | | | | 12-1-2048 | | | | 5,700,000 | | | | 5,700,000 | |
Milwaukee WI RDA Public Schools Series A (Miscellaneous Revenue) | | | 5.00 | | | | 8-1-2019 | | | | 7,140,000 | | | | 8,167,721 | |
Milwaukee WI RDA Science Education Consortium Incorporated Project Series A (Education Revenue) | | | 4.75 | | | | 8-1-2023 | | | | 1,140,000 | | | | 1,238,667 | |
Wisconsin HEFA Beloit Health System Incorporation (Health Revenue) | | | 5.00 | | | | 4-1-2015 | | | | 640,000 | | | | 646,195 | |
Wisconsin HEFA Wheaton Franciscan Series B (Health Revenue, U.S. Bank NA LOC) ø | | | 0.04 | | | | 8-15-2033 | | | | 9,730,000 | | | | 9,730,000 | |
| | | | |
| | | | | | | | | | | | | | | 25,482,583 | |
| | | | | | | | | | | | | | | | |
| | | | |
| Wyoming: 0.63% | | | | | | | | | | | | | | | | |
Sweetwater County WY Pollution Control Refunding PacifiCorp Project Series A (Industrial Development Revenue) ø | | | 0.22 | | | | 1-1-2017 | | | | 10,000,000 | | | | 10,000,000 | |
| | | | | | | | | | | | | | | | |
| | | | |
Total Municipal Obligations (Cost $1,552,861,147) | | | | | | | | | | | | | | | 1,574,275,854 | |
| | | | | | | | | | | | | | | | |
| | | | |
| | | Yield | | | | | | Shares | | | | |
| Short-Term Investments: 2.56% | | | | | | | | | | | | | | | | |
| | | | |
| Investment Companies: 2.53% | | | | | | | | | | | | | | | | |
Wells Fargo Advantage National Tax-Free Money Market Fund, Institutional Class (l)(u)## | | | 0.01 | | | | | | | | 40,139,233 | | | | 40,139,233 | |
| | | | | | | | | | | | | | | | |
| | | | |
| | | | | | | | | Principal | | | | |
| U.S. Treasury Securities: 0.03% | | | | | | | | | | | | | | | | |
U.S. Treasury Bill (z)# | | | 0.02 | | | | 3-19-2015 | | | $ | 475,000 | | | | 474,982 | |
| | | | | | | | | | | | | | | | |
| | | | |
Total Short-Term Investments (Cost $40,614,206) | | | | | | | | | | | | | | | 40,614,215 | |
| | | | | | | | | | | | | | | | |
| | | | | | | | |
| Total investments in securities (Cost $1,593,475,353) * | | | 101.93 | % | | | 1,614,890,069 | |
Other assets and liabilities, net | | | (1.93 | ) | | | (30,575,557 | ) |
| | | | | | | | |
| Total net assets | | | 100.00 | % | | $ | 1,584,314,512 | |
| | | | | | | | |
The accompanying notes are an integral part of these financial statements.
| | | | | | |
| Portfolio of investments—December 31, 2014 (unaudited) | | Wells Fargo Advantage Strategic Municipal Bond Fund | | | 23 | |
| ø | Variable rate demand notes are subject to a demand feature which reduces the effective maturity. The maturity date shown represents the final maturity date of the security. The interest rate is determined and reset by the issuer daily, weekly, or monthly depending upon the terms of the security. The rate shown is the rate in effect at period end. |
| 144A | The security may be resold in transactions exempt from registration, normally to qualified institutional buyers, pursuant to Rule 144A under the Securities Act of 1933. |
| ¤ | The security is issued in zero coupon form with no periodic interest payments. |
| ± | Variable rate investment. The rate shown is the rate in effect at period end. |
| %% | The security is issued on a when-issued basis. |
| (m) | The security is an auction-rate security which has an interest rate that resets at predetermined short-term intervals through a Dutch auction. The rate shown is the rate in effect at period end. |
| (n) | The auction to set the interest rate on the security failed at period end due to insufficient investor interest. A failed auction does not itself cause a default. |
| (l) | The security represents an affiliate of the Fund as defined in the Investment Company Act of 1940. |
| (u) | The rate represents the 7-day annualized yield at period end. |
| ## | All or a portion of this security is segregated for when-issued securities. |
| (z) | Zero coupon security. The rate represents the current yield to maturity. |
| # | All or a portion of this security is segregated as collateral for investments in derivative instruments. |
| * | Cost for federal income tax purposes is $1,593,476,395 and unrealized gains (losses) consists of: |
| | | | |
Gross unrealized gains | | $ | 24,389,434 | |
Gross unrealized losses | | | (2,975,760 | ) |
| | | | |
Net unrealized gains | | $ | 21,413,674 | |
The accompanying notes are an integral part of these financial statements.
| | | | |
| 24 | | Wells Fargo Advantage Strategic Municipal Bond Fund | | Statement of assets and liabilities—December 31, 2014 (unaudited) |
| | | | |
| | | | |
| |
Assets | | | | |
Investments | | | | |
In unaffiliated securities, at value (cost $1,553,336,120) | | $ | 1,574,750,836 | |
In affiliated securities, at value (cost $40,139,233) | | | 40,139,233 | |
| | | | |
Total investments, at value (cost $1,593,475,353) | | | 1,614,890,069 | |
Receivable for investments sold | | | 1,825,007 | |
Receivable for Fund shares sold | | | 8,394,038 | |
Receivable for interest | | | 9,996,022 | |
Prepaid expenses and other assets | | | 100,175 | |
| | | | |
Total assets | | | 1,635,205,311 | |
| | | | |
| |
Liabilities | | | | |
Dividends payable | | | 176,586 | |
Payable for investments purchased | | | 33,745,559 | |
Payable for Fund shares redeemed | | | 11,990,443 | |
Payable for daily variation margin on open futures contracts | | | 80,500 | |
Due to custodian bank | | | 3,800,268 | |
Advisory fee payable | | | 409,530 | |
Distribution fees payable | | | 102,311 | |
Administration fees payable | | | 241,232 | |
Accrued expenses and other liabilities | | | 344,370 | |
| | | | |
Total liabilities | | | 50,890,799 | |
| | | | |
Total net assets | | $ | 1,584,314,512 | |
| | | | |
| |
NET ASSETS CONSIST OF | | | | |
Paid-in capital | | $ | 1,562,338,828 | |
Overdistributed net investment income | | | (87,766 | ) |
Accumulated net realized gains on investments | | | 615,704 | |
Net unrealized gains on investments | | | 21,447,746 | |
| | | | |
Total net assets | | $ | 1,584,314,512 | |
| | | | |
| |
COMPUTATION OF NET ASSET VALUE AND OFFERING PRICE PER SHARE | | | | |
Net assets – Class A | | $ | 604,817,662 | |
Shares outstanding – Class A1 | | | 67,271,539 | |
Net asset value per share – Class A | | | $8.99 | |
Maximum offering price per share – Class A2 | | | $9.41 | |
Net assets – Class B | | $ | 1,255,537 | |
Shares outstanding – Class B1 | | | 140,006 | |
Net asset value per share – Class B | | | $8.97 | |
Net assets – Class C | | $ | 155,529,700 | |
Shares outstanding – Class C1 | | | 17,238,915 | |
Net asset value per share – Class C | | | $9.02 | |
Net assets – Administrator Class | | $ | 558,632,225 | |
Shares outstanding – Administrator Class1 | | | 62,155,343 | |
Net asset value per share – Administrator Class | | | $8.99 | |
Net assets – Institutional Class | | $ | 264,079,388 | |
Shares outstanding – Institutional Class1 | | | 29,377,603 | |
Net asset value per share – Institutional Class | | | $8.99 | |
| 1. | The Fund has an unlimited number of authorized shares. |
| 2. | Maximum offering price is computed as 100/95.50 of net asset value. On investments of $50,000 or more, the offering price is reduced. |
The accompanying notes are an integral part of these financial statements.
| | | | | | |
| Statement of operations—six months ended December 31, 2014 (unaudited) | | Wells Fargo Advantage Strategic Municipal Bond Fund | | | 25 | |
| | | | |
| | | | |
| |
Investment income | | | | |
Interest | | $ | 14,145,434 | |
Income from affiliated securities | | | 15,957 | |
| | | | |
Total investment income | | | 14,161,391 | |
| | | | |
| |
Expenses | | | | |
Advisory fee | | | 2,413,094 | |
Administration fees | | | | |
Fund level | | | 370,504 | |
Class A | | | 478,027 | |
Class B | | | 1,152 | |
Class C | | | 122,456 | |
Administrator Class | | | 284,355 | |
Institutional Class | | | 64,506 | |
Shareholder servicing fees | | | | |
Class A | | | 746,918 | |
Class B | | | 1,799 | |
Class C | | | 191,337 | |
Administrator Class | | | 710,886 | |
Distribution fees | | | | |
Class B | | | 5,398 | |
Class C | | | 574,013 | |
Custody and accounting fees | | | 36,932 | |
Professional fees | | | 31,861 | |
Registration fees | | | 92,348 | |
Shareholder report expenses | | | 24,668 | |
Trustees’ fees and expenses | | | 6,273 | |
Other fees and expenses | | | 14,025 | |
| | | | |
Total expenses | | | 6,170,552 | |
Less: Fee waivers and/or expense reimbursements | | | (212,586 | ) |
| | | | |
Net expenses | | | 5,957,966 | |
| | | | |
Net investment income | | | 8,203,425 | |
| | | | |
| |
REALIZED AND UNREALIZED GAINS (LOSSES) ON INVESTMENTS | | | | |
| |
Net realized gains on: | | | | |
Unaffiliated securities | | | 3,871,585 | |
Futures transactions | | | 521,664 | |
| | | | |
Net realized gains on investments | | | 4,393,249 | |
| | | | |
| |
Net change in unrealized gains (losses) on: | | | | |
Unaffiliated securities | | | 2,116,759 | |
Futures transactions | | | (19,905 | ) |
| | | | |
Net change in unrealized gains (losses) on investments | | | 2,096,854 | |
| | | | |
Net realized and unrealized gains (losses) on investments | | | 6,490,103 | |
| | | | |
Net increase in net assets resulting from operations | | $ | 14,693,528 | |
| | | | |
The accompanying notes are an integral part of these financial statements.
| | | | |
| 26 | | Wells Fargo Advantage Strategic Municipal Bond Fund | | Statement of changes in net assets |
| | | | | | | | | | | | | | | | |
| | | Six months ended December 31, 2014
(unaudited) | | | Year ended June 30, 2014 | |
| | | | |
Operations | | | | | | | | | | | | | | | | |
Net investment income | | | | | | $ | 8,203,425 | | | | | | | $ | 23,693,165 | |
Net realized gains on investments | | | | | | | 4,393,249 | | | | | | | | 10,580,085 | |
Net change in unrealized gains (losses) on investments | | | | | | | 2,096,854 | | | | | | | | 17,323,748 | |
| | | | |
Net increase in net assets resulting from operations | | | | | | | 14,693,528 | | | | | | | | 51,596,998 | |
| | | | |
| | | | |
Distributions to shareholders from | | | | | | | | | | | | | | | | |
Net investment income | | | | | | | | | | | | | | | | |
Class A | | | | | | | (3,295,307 | ) | | | | | | | (11,410,485 | ) |
Class B | | | | | | | (2,621 | ) | | | | | | | (20,197 | ) |
Class C | | | | | | | (268,434 | ) | | | | | | | (1,639,759 | ) |
Administrator Class | | | | | | | (3,510,228 | ) | | | | | | | (9,898,992 | ) |
Institutional Class | | | | | | | (1,126,838 | ) | | | | | | | (723,431 | ) |
Net realized gains | | | | | | | | | | | | | | | | |
Class A | | | | | | | (5,154,519 | ) | | | | | | | (3,590,262 | ) |
Class B | | | | | | | (10,851 | ) | | | | | | | (10,326 | ) |
Class C | | | | | | | (1,307,185 | ) | | | | | | | (845,496 | ) |
Administrator Class | | | | | | | (4,674,679 | ) | | | | | | | (2,870,855 | ) |
Institutional Class | | | | | | | (2,007,331 | ) | | | | | | | (188,481 | ) |
| | | | |
Total distributions to shareholders | | | | | | | (21,357,993 | ) | | | | | | | (31,198,284 | ) |
| | | | |
| | | | |
Capital share transactions | | | Shares | | | | | | | | Shares | | | | | |
Proceeds from shares sold | | | | | | | | | | | | | | | | |
Class A | | | 14,136,802 | | | | 127,848,525 | | | | 28,926,675 | | | | 257,655,705 | |
Class B | | | 460 | | | | 4,170 | | | | 1,935 | | | | 17,022 | |
Class C | | | 2,359,706 | | | | 21,417,645 | | | | 3,619,687 | | | | 32,409,215 | |
Administrator Class | | | 20,668,699 | | | | 186,904,778 | | | | 32,247,991 | | | | 287,028,535 | |
Institutional Class | | | 28,112,804 | | | | 253,890,678 | | | | 3,333,368 | | | | 29,628,574 | |
| | | | |
| | | | | | | 590,065,796 | | | | | | | | 606,739,051 | |
| | | | |
Reinvestment of distributions | | | | | | | | | | | | | | | | |
Class A | | | 880,558 | | | | 7,934,711 | | | | 1,607,617 | | | | 14,270,441 | |
Class B | | | 1,383 | | | | 12,416 | | | | 3,048 | | | | 26,940 | |
Class C | | | 143,525 | | | | 1,297,150 | | | | 237,798 | | | | 2,114,754 | |
Administrator Class | | | 848,850 | | | | 7,648,725 | | | | 1,227,149 | | | | 10,891,131 | |
Institutional Class | | | 248,358 | | | | 2,238,223 | | | | 90,792 | | | | 805,172 | |
| | | | |
| | | | | | | 19,131,225 | | | | | | | | 28,108,438 | |
| | | | |
Payment for shares redeemed | | | | | | | | | | | | | | | | |
Class A | | | (20,451,865 | ) | | | (184,534,106 | ) | | | (26,507,307 | ) | | | (234,944,257 | ) |
Class B | | | (30,249 | ) | | | (273,208 | ) | | | (77,083 | ) | | | (681,165 | ) |
Class C | | | (1,420,005 | ) | | | (12,891,603 | ) | | | (4,793,086 | ) | | | (42,673,690 | ) |
Administrator Class | | | (16,554,206 | ) | | | (149,817,843 | ) | | | (35,059,711 | ) | | | (310,718,456 | ) |
Institutional Class | | | (2,254,949 | ) | | | (20,399,772 | ) | | | (3,744,238 | ) | | | (33,295,959 | ) |
| | | | |
| | | | | | | (367,916,532 | ) | | | | | | | (622,313,527 | ) |
| | | | |
Net increase in net assets resulting from capital share transactions | | | | | | | 241,280,489 | | | | | | | | 12,533,962 | |
| | | | |
Total increase in net assets | | | | | | | 234,616,024 | | | | | | | | 32,932,676 | |
| | | | |
| | | | |
Net assets | | | | | | | | | | | | | | | | |
Beginning of period | | | | | | | 1,349,698,488 | | | | | | | | 1,316,765,812 | |
| | | | |
End of period | | | | | | $ | 1,584,314,512 | | | | | | | $ | 1,349,698,488 | |
| | | | |
Overdistributed net investment income | | | | | | $ | (87,766 | ) | | | | | | $ | (87,763 | ) |
| | | | |
The accompanying notes are an integral part of these financial statements.
| | | | | | |
| Financial highlights | | Wells Fargo Advantage Strategic Municipal Bond Fund | | | 27 | |
(For a share outstanding throughout each period)
| | | | | | | | | | | | | | | | | | | | | | | | | | | | |
| | | Six months ended
December 31, 2014 (unaudited) | | | Year ended June 30 | | | Year ended May 31 | |
| CLASS A | | | 2014 | | | 2013 | | | 2012 | | | 20111 | | | 20112 | | | 20102 | |
Net asset value, beginning of period | | | $9.03 | | | | $8.87 | | | | $8.94 | | | | $8.77 | | | | $8.75 | | | | $8.67 | | | | $8.59 | |
Net investment income | | | 0.05 | | | | 0.17 | | | | 0.13 | | | | 0.21 | | | | 0.02 | | | | 0.26 | | | | 0.25 | |
Net realized and unrealized gains (losses) on investments | | | 0.04 | | | | 0.21 | | | | 0.01 | | | | 0.18 | | | | 0.02 | | | | 0.08 | | | | 0.08 | |
| | | | | | | | | | | | | | | | | | | | | | | | | | | | |
Total from investment operations | | | 0.09 | | | | 0.38 | | | | 0.14 | | | | 0.39 | | | | 0.04 | | | | 0.34 | | | | 0.33 | |
Distributions to shareholders from | | | | | | | | | | | | | | | | | | | | | | | | | | | | |
Net investment income | | | (0.05 | ) | | | (0.17 | ) | | | (0.13 | ) | | | (0.21 | ) | | | (0.02 | ) | | | (0.26 | ) | | | (0.25 | ) |
Net realized gains | | | (0.08 | ) | | | (0.05 | ) | | | (0.08 | ) | | | (0.01 | ) | | | 0.00 | | | | 0.00 | | | | 0.00 | |
| | | | | | | | | | | | | | | | | | | | | | | | | | | | |
Total distributions to shareholders | | | (0.13 | ) | | | (0.22 | ) | | | (0.21 | ) | | | (0.22 | ) | | | (0.02 | ) | | | (0.26 | ) | | | (0.25 | ) |
Net asset value, end of period | | | $8.99 | | | | $9.03 | | | | $8.87 | | | | $8.94 | | | | $8.77 | | | | $8.75 | | | | $8.67 | |
Total return3 | | | 0.97 | % | | | 4.41 | % | | | 1.59 | % | | | 4.48 | % | | | 0.49 | % | | | 4.01 | % | | | 3.76 | % |
Ratios to average net assets (annualized) | | | | | | | | | | | | | | | | | | | | | | | | | | | | |
Gross expenses | | | 0.81 | % | | | 0.83 | % | | | 0.82 | % | | | 0.83 | % | | | 0.83 | % | | | 0.88 | % | | | 0.99 | % |
Net expenses | | | 0.81 | % | | | 0.82 | % | | | 0.82 | % | | | 0.83 | % | | | 0.83 | % | | | 0.87 | % | | | 0.99 | % |
Net investment income | | | 1.10 | % | | | 1.91 | % | | | 1.49 | % | | | 2.31 | % | | | 3.15 | % | | | 3.02 | % | | | 2.85 | % |
Supplemental data | | | | | | | | | | | | | | | | | | | | | | | | | | | | |
Portfolio turnover rate | | | 20 | % | | | 51 | % | | | 49 | % | | | 74 | % | | | 12 | % | | | 130 | % | | | 40 | % |
Net assets, end of period (000s omitted) | | | $604,818 | | | | $656,256 | | | | $609,303 | | | | $549,357 | | | | $353,518 | | | | $330,896 | | | | $329,475 | |
| 1. | For the one month ended June 30, 2011. The Fund changed its fiscal year end from May 31 to June 30, effective June 30, 2011. |
| 2. | After the close of business on July 9, 2010, the Fund acquired the net assets of Evergreen Strategic Municipal Bond Fund which became the accounting and performance survivor in the transaction. The information for the periods prior to July 12, 2010 is that of Class A of Evergreen Strategic Municipal Bond Fund. |
| 3. | Total return calculations do not include any sales charges. Returns for periods of less than one year are not annualized. |
The accompanying notes are an integral part of these financial statements.
| | | | |
| 28 | | Wells Fargo Advantage Strategic Municipal Bond Fund | | Financial highlights |
(For a share outstanding throughout each period)
| | | | | | | | | | | | | | | | | | | | | | | | | | | | |
| | | Six months ended
December 31, 2014
(unaudited) | | | Year ended June 30 | | | Year ended May 31 | |
| CLASS B | | | 2014 | | | 2013 | | | 2012 | | | 20111 | | | 20112 | | | 20102 | |
Net asset value, beginning of period | | | $9.00 | | | | $8.85 | | | | $8.92 | | | | $8.75 | | | | $8.73 | | | | $8.65 | | | | $8.57 | |
Net investment income | | | 0.02 | 3 | | | 0.10 | 3 | | | 0.07 | 3 | | | 0.15 | 3 | | | 0.02 | 3 | | | 0.19 | 3 | | | 0.19 | 3 |
Net realized and unrealized gains (losses) on investments | | | 0.05 | | | | 0.20 | | | | 0.01 | | | | 0.17 | | | | 0.02 | | | | 0.09 | | | | 0.07 | |
| | | | | | | | | | | | | | | | | | | | | | | | | | | | |
Total from investment operations | | | 0.07 | | | | 0.30 | | | | 0.08 | | | | 0.32 | | | | 0.04 | | | | 0.28 | | | | 0.26 | |
Distributions to shareholders from | | | | | | | | | | | | | | | | | | | | | | | | | | | | |
Net investment income | | | (0.02 | ) | | | (0.10 | ) | | | (0.07 | ) | | | (0.14 | ) | | | (0.02 | ) | | | (0.20 | ) | | | (0.18 | ) |
Net realized gains | | | (0.08 | ) | | | (0.05 | ) | | | (0.08 | ) | | | (0.01 | ) | | | 0.00 | | | | 0.00 | | | | 0.00 | |
| | | | | | | | | | | | | | | | | | | | | | | | | | | | |
Total distributions to shareholders | | | (0.10 | ) | | | (0.15 | ) | | | (0.15 | ) | | | (0.15 | ) | | | (0.02 | ) | | | (0.20 | ) | | | (0.18 | ) |
Net asset value, end of period | | | $8.97 | | | | $9.00 | | | | $8.85 | | | | $8.92 | | | | $8.75 | | | | $8.73 | | | | $8.65 | |
Total return4 | | | 0.70 | % | | | 3.53 | % | | | 0.83 | % | | | 3.71 | % | | | 0.43 | % | | | 3.23 | % | | | 2.99 | % |
Ratios to average net assets (annualized) | | | | | | | | | | | | | | | | | | | | | | | | | | | | |
Gross expenses | | | 1.56 | % | | | 1.58 | % | | | 1.57 | % | | | 1.58 | % | | | 1.58 | % | | | 1.64 | % | | | 1.74 | % |
Net expenses | | | 1.56 | % | | | 1.57 | % | | | 1.57 | % | | | 1.58 | % | | | 1.58 | % | | | 1.63 | % | | | 1.74 | % |
Net investment income | | | 0.36 | % | | | 1.17 | % | | | 0.77 | % | | | 1.69 | % | | | 2.40 | % | | | 2.20 | % | | | 2.20 | % |
Supplemental data | | | | | | | | | | | | | | | | | | | | | | | | | | | | |
Portfolio turnover rate | | | 20 | % | | | 51 | % | | | 49 | % | | | 74 | % | | | 12 | % | | | 130 | % | | | 40 | % |
Net assets, end of period (000s omitted) | | | $1,256 | | | | $1,516 | | | | $2,128 | | | | $3,738 | | | | $6,741 | | | | $7,531 | | | | $16,123 | |
| 1. | For the one month ended June 30, 2011. The Fund changed its fiscal year end from May 31 to June 30, effective June 30, 2011. |
| 2. | After the close of business on July 9, 2010, the Fund acquired the net assets of Evergreen Strategic Municipal Bond Fund which became the accounting and performance survivor in the transaction. The information for the periods prior to July 12, 2010 is that of Class B of Evergreen Strategic Municipal Bond Fund. |
| 3. | Calculated based upon average shares outstanding |
| 4. | Total return calculations do not include any sales charges. Returns for periods of less than one year are not annualized. |
The accompanying notes are an integral part of these financial statements.
| | | | | | |
| Financial highlights | | Wells Fargo Advantage Strategic Municipal Bond Fund | | | 29 | |
(For a share outstanding throughout each period)
| | | | | | | | | | | | | | | | | | | | | | | | | | | | |
| | | Six months ended
December 31, 2014
(unaudited) | | | Year ended June 30 | | | Year ended May 31 | |
| CLASS C | | | 2014 | | | 2013 | | | 2012 | | | 20111 | | | 20112 | | | 20102 | |
Net asset value, beginning of period | | | $9.06 | | | | $8.90 | | | | $8.97 | | | | $8.80 | | | | $8.78 | | | | $8.70 | | | | $8.62 | |
Net investment income | | | 0.02 | | | | 0.10 | | | | 0.07 | | | | 0.14 | | | | 0.02 | | | | 0.20 | | | | 0.18 | |
Net realized and unrealized gains (losses) on investments | | | 0.04 | | | | 0.21 | | | | 0.01 | | | | 0.18 | | | | 0.02 | | | | 0.08 | | | | 0.09 | |
| | | | | | | | | | | | | | | | | | | | | | | | | | | | |
Total from investment operations | | | 0.06 | | | | 0.31 | | | | 0.08 | | | | 0.32 | | | | 0.04 | | | | 0.28 | | | | 0.27 | |
Distributions to shareholders from | | | | | | | | | | | | | | | | | | | | | | | | | | | | |
Net investment income | | | (0.02 | ) | | | (0.10 | ) | | | (0.07 | ) | | | (0.14 | ) | | | (0.02 | ) | | | (0.20 | ) | | | (0.19 | ) |
Net realized gains | | | (0.08 | ) | | | (0.05 | ) | | | (0.08 | ) | | | (0.01 | ) | | | 0.00 | | | | 0.00 | | | | 0.00 | |
| | | | | | | | | | | | | | | | | | | | | | | | | | | | |
Total distributions to shareholders | | | (0.10 | ) | | | (0.15 | ) | | | (0.15 | ) | | | (0.15 | ) | | | (0.02 | ) | | | (0.20 | ) | | | (0.19 | ) |
Net asset value, end of period | | | $9.02 | | | | $9.06 | | | | $8.90 | | | | $8.97 | | | | $8.80 | | | | $8.78 | | | | $8.70 | |
Total return3 | | | 0.59 | % | | | 3.63 | % | | | 0.83 | % | | | 3.69 | % | | | 0.42 | % | | | 3.23 | % | | | 2.99 | % |
Ratios to average net assets (annualized) | | | | | | | | | | | | | | | | | | | | | | | | | | | | |
Gross expenses | | | 1.56 | % | | | 1.58 | % | | | 1.57 | % | | | 1.58 | % | | | 1.58 | % | | | 1.63 | % | | | 1.74 | % |
Net expenses | | | 1.56 | % | | | 1.57 | % | | | 1.57 | % | | | 1.58 | % | | | 1.58 | % | | | 1.62 | % | | | 1.74 | % |
Net investment income | | | 0.35 | % | | | 1.16 | % | | | 0.74 | % | | | 1.59 | % | | | 2.40 | % | | | 2.26 | % | | | 2.08 | % |
Supplemental data | | | | | | | | | | | | | | | | | | | | | | | | | | | | |
Portfolio turnover rate | | | 20 | % | | | 51 | % | | | 49 | % | | | 74 | % | | | 12 | % | | | 130 | % | | | 40 | % |
Net assets, end of period (000s omitted) | | | $155,530 | | | | $146,329 | | | | $152,155 | | | | $147,006 | | | | $113,724 | | | | $112,740 | | | | $130,775 | |
| 1. | For the one month ended June 30, 2011. The Fund changed its fiscal year end from May 31 to June 30, effective June 30, 2011. |
| 2. | After the close of business on July 9, 2010, the Fund acquired the net assets of Evergreen Strategic Municipal Bond Fund which became the accounting and performance survivor in the transaction. The information for the periods prior to July 12, 2010 is that of Class C of Evergreen Strategic Municipal Bond Fund. |
| 3. | Total return calculations do not include any sales charges. Returns for periods of less than one year are not annualized. |
The accompanying notes are an integral part of these financial statements.
| | | | |
| 30 | | Wells Fargo Advantage Strategic Municipal Bond Fund | | Financial highlights |
(For a share outstanding throughout each period)
| | | | | | | | | | | | | | | | | | | | | | | | | | | | |
| | | Six months ended
December 31, 2014
(unaudited) | | | Year ended June 30 | | | Year ended May 31 | |
| ADMINISTRATOR CLASS | | | 2014 | | | 2013 | | | 2012 | | | 20111 | | | 20112 | | | 20102 | |
Net asset value, beginning of period | | | $9.02 | | | | $8.87 | | | | $8.94 | | | | $8.76 | | | | $8.75 | | | | $8.67 | | | | $8.59 | |
Net investment income | | | 0.06 | | | | 0.18 | | | | 0.15 | | | | 0.22 | | | | 0.02 | | | | 0.28 | | | | 0.27 | |
Net realized and unrealized gains (losses) on investments | | | 0.05 | | | | 0.20 | | | | 0.01 | | | | 0.19 | | | | 0.01 | | | | 0.08 | | | | 0.08 | |
| | | | | | | | | | | | | | | | | | | | | | | | | | | | |
Total from investment operations | | | 0.11 | | | | 0.38 | | | | 0.16 | | | | 0.41 | | | | 0.03 | | | | 0.36 | | | | 0.35 | |
Distributions to shareholders from | | | | | | | | | | | | | | | | | | | | | | | | | | | | |
Net investment income | | | (0.06 | ) | | | (0.18 | ) | | | (0.15 | ) | | | (0.22 | ) | | | (0.02 | ) | | | (0.28 | ) | | | (0.27 | ) |
Net realized gains | | | (0.08 | ) | | | (0.05 | ) | | | (0.08 | ) | | | (0.01 | ) | | | 0.00 | | | | 0.00 | | | | 0.00 | |
| | | | | | | | | | | | | | | | | | | | | | | | | | | | |
Total distributions to shareholders | | | (0.14 | ) | | | (0.23 | ) | | | (0.23 | ) | | | (0.23 | ) | | | (0.02 | ) | | | (0.28 | ) | | | (0.27 | ) |
Net asset value, end of period | | | $8.99 | | | | $9.02 | | | | $8.87 | | | | $8.94 | | | | $8.76 | | | | $8.75 | | | | $8.67 | |
Total return3 | | | 1.15 | % | | | 4.44 | % | | | 1.73 | % | | | 4.76 | % | | | 0.39 | % | | | 4.20 | % | | | 4.02 | % |
Ratios to average net assets (annualized) | | | | | | | | | | | | | | | | | | | | | | | | | | | | |
Gross expenses | | | 0.75 | % | | | 0.77 | % | | | 0.76 | % | | | 0.75 | % | | | 0.77 | % | | | 0.77 | % | | | 0.75 | % |
Net expenses | | | 0.68 | % | | | 0.68 | % | | | 0.68 | % | | | 0.68 | % | | | 0.68 | % | | | 0.69 | % | | | 0.75 | % |
Net investment income | | | 1.23 | % | | | 2.05 | % | | | 1.62 | % | | | 2.42 | % | | | 3.32 | % | | | 3.23 | % | | | 3.03 | % |
Supplemental data | | | | | | | | | | | | | | | | | | | | | | | | | | | | |
Portfolio turnover rate | | | 20 | % | | | 51 | % | | | 49 | % | | | 74 | % | | | 12 | % | | | 130 | % | | | 40 | % |
Net assets, end of period (000s omitted) | | | $558,632 | | | | $516,069 | | | | $521,312 | | | | $435,170 | | | | $159,045 | | | | $146,149 | | | | $151,636 | |
| 1. | For the one month ended June 30, 2011. The Fund changed its fiscal year end from May 31 to June 30, effective June 30, 2011. |
| 2. | After the close of business on July 9, 2010, the Fund acquired the net assets of Evergreen Strategic Municipal Bond Fund which became the accounting and performance survivor in the transaction. The information for the periods prior to July 12, 2010 is that of Class I of Evergreen Strategic Municipal Bond Fund. |
| 3. | Returns for periods of less than one year are not annualized. |
The accompanying notes are an integral part of these financial statements.
| | | | | | |
| Financial highlights | | Wells Fargo Advantage Strategic Municipal Bond Fund | | | 31 | |
(For a share outstanding throughout each period)
| | | | | | | | | | | | |
| | | Six months ended
December 31, 2014 (unaudited) | | | Year ended June 30 | |
| INSTITUTIONAL CLASS | | | 2014 | | | 20131 | |
Net asset value, beginning of period | | | $9.03 | | | | $8.87 | | | | $9.06 | |
Net investment income | | | 0.07 | | | | 0.20 | | | | 0.08 | 2 |
Net realized and unrealized gains (losses) on investments | | | 0.04 | | | | 0.21 | | | | (0.10 | ) |
| | | | | | | | | | | | |
Total from investment operations | | | 0.11 | | | | 0.41 | | | | (0.02 | ) |
Distributions to shareholders from | | | | | | | | | | | | |
Net investment income | | | (0.07 | ) | | | (0.20 | ) | | | (0.09 | ) |
Net realized gains | | | (0.08 | ) | | | (0.05 | ) | | | (0.08 | ) |
| | | | | | | | | | | | |
Total distributions to shareholders | | | (0.15 | ) | | | (0.25 | ) | | | (0.17 | ) |
Net asset value, end of period | | | $8.99 | | | | $9.03 | | | | $8.87 | |
Total return3 | | | 1.14 | % | | | 4.77 | % | | | (0.28 | )% |
Ratios to average net assets (annualized) | | | | | | | | | | | | |
Gross expenses | | | 0.48 | % | | | 0.50 | % | | | 0.50 | % |
Net expenses | | | 0.48 | % | | | 0.48 | % | | | 0.48 | % |
Net investment income | | | 1.40 | % | | | 2.27 | % | | | 1.65 | % |
Supplemental data | | | | | | | | | | | | |
Portfolio turnover rate | | | 20 | % | | | 51 | % | | | 49 | % |
Net assets, end of period (000s omitted) | | | $264,079 | | | | $29,528 | | | | $31,868 | |
| 1. | For the period from November 30, 2012 (commencement of class operations) to June 30, 2013 |
| 2. | Calculated based upon average shares outstanding |
| 3. | Returns for periods of less than one year are not annualized. |
The accompanying notes are an integral part of these financial statements.
| | | | |
| 32 | | Wells Fargo Advantage Strategic Municipal Bond Fund | | Notes to financial statements (unaudited) |
1. ORGANIZATION
Wells Fargo Funds Trust (the “Trust”), a Delaware statutory trust organized on March 10, 1999, is an open-end management investment company registered under the Investment Company Act of 1940, as amended (the “1940 Act”). As an investment company, the Trust follows the accounting and reporting guidance in FASB Accounting Standards Codification 946. These financial statements report on the Wells Fargo Advantage Strategic Municipal Bond Fund (the “Fund”) which is a diversified series of the Trust.
2. SIGNIFICANT ACCOUNTING POLICIES
The following significant accounting policies, which are consistently followed in the preparation of the financial statements of the Fund, are in conformity with U.S. generally accepted accounting principles which require management to make estimates and assumptions that affect the reported amounts of assets and liabilities, disclosure of contingent assets and liabilities at the date of the financial statements, and the reported amounts of revenues and expenses during the reporting period. Actual results could differ from those estimates.
Securities valuation
All investments are valued each business day as of the close of regular trading on the New York Stock Exchange (generally 4 p.m. Eastern Time).
Fixed income securities acquired with maturities exceeding 60 days are valued based on evaluated bid prices provided by an independent pricing service which may utilize both transaction data and market information such as yield, quality, coupon rate, maturity, type of issue, trading characteristics and other market data. If prices are not available from the independent pricing service or prices received are deemed not representative of market value, prices will be obtained from an independent broker-dealer.
Short-term securities, with maturities of 60 days or less at time of purchase, generally are valued at amortized cost which approximates fair value. The amortized cost method involves valuing a security at its cost, plus accretion of discount or minus amortization of premium over the period until maturity.
Futures that are listed on a foreign or domestic exchange or market are valued at the official closing price or, if none, the last sales price.
Investments in registered open-end investment companies are valued at net asset value.
Investments which are not valued using any of the methods discussed above are valued at their fair value, as determined in good faith by the Board of Trustees of the Fund. The Board of Trustees has established a Valuation Committee comprised of the Trustees and has delegated to it the authority to take any actions regarding the valuation of portfolio securities that the Valuation Committee deems necessary or appropriate, including determining the fair value of portfolio securities, unless the determination has been delegated to the Management Valuation Team of Wells Fargo Funds Management, LLC (“Funds Management”). The Board of Trustees retains the authority to make or ratify any valuation decisions or approve any changes to the Valuation Procedures as it deems appropriate. On a quarterly basis, the Board of Trustees receives reports on any valuation actions taken by the Valuation Committee or the Management Valuation Team which may include items for ratification.
Valuations of fair valued securities are compared to the next actual sales price when available, or other appropriate market values, to assess the continued appropriateness of the fair valuation methodologies used. These securities are fair valued on a day-to-day basis, taking into consideration changes to appropriate market information and any significant changes to the inputs considered in the valuation process until there is a readily available price provided on an exchange or by an independent pricing service. Valuations received from an independent pricing service or independent broker-dealer quotes are periodically validated by comparisons to most recent trades and valuations provided by other independent pricing services in addition to the review of prices by the adviser and/or subadviser. Unobservable inputs used in determining fair valuations are identified based on the type of security, taking into consideration factors utilized by market participants in valuing the investment, knowledge about the issuer and the current market environment.
When-issued transactions
The Fund may purchase securities on a forward commitment or when-issued basis. The Fund records a when-issued transaction on the trade date and will segregate assets in an amount at least equal in value to the Fund’s commitment to purchase when-issued securities. Securities purchased on a when-issued basis are marked-to-market daily and the Fund begins earning interest on the settlement date. Losses may arise due to changes in the market value of the underlying securities or if the counterparty does not perform under the contract.
| | | | | | |
| Notes to financial statements (unaudited) | | Wells Fargo Advantage Strategic Municipal Bond Fund | | | 33 | |
Futures contracts
The Fund is subject to interest rate risk in the normal course of pursuing its investment objectives. The Fund may buy and sell futures contracts in order to gain exposure to, or protect against, changes in security values and interest rates. The primary risks associated with the use of futures contracts are the imperfect correlation between changes in market values of securities held by the Fund and the prices of futures contracts, and the possibility of an illiquid market.
The aggregate principal amounts of the contracts are not recorded in the financial statements. Fluctuations in the value of the contracts are recorded in the Statement of Assets and Liabilities as an asset or liability and in the Statement of Operations as unrealized gains or losses until the contracts are closed, at which point they are recorded as net realized gains or losses on futures contracts. With futures contracts, there is minimal counterparty risk to the Fund since futures are exchange traded and the exchange’s clearinghouse, as counterparty to all exchange traded futures, guarantees the futures against default.
Security transactions and income recognition
Securities transactions are recorded on a trade date basis. Realized gains or losses are recorded on the basis of identified cost.
Interest income is accrued daily and bond discounts are accreted and premiums are amortized daily based on the effective interest method. To the extent debt obligations are placed on non-accrual status, any related interest income may be reduced by writing off interest receivables when the collection of all or a portion of interest has become doubtful based on consistently applied procedures. If the issuer subsequently resumes interest payments or when the collectability of interest is reasonably assured, the debt obligation is removed from non-accrual status.
Distributions to shareholders
Distributions to shareholders from net investment income are accrued daily and paid monthly. Distributions from net realized gains, if any, are recorded on the ex-dividend date. Such distributions are determined in conformity with federal income tax regulations, which may differ in amount or character from net investment income and realized gains recognized for purposes of U.S. generally accepted accounting principles.
Federal and other taxes
The Fund intends to continue to qualify as a regulated investment company by distributing substantially all of its investment company taxable and tax-exempt income and any net realized capital gains (after reduction for capital loss carryforwards) sufficient to relieve it from all, or substantially all, federal income taxes. Accordingly, no provision for federal income taxes was required.
The Fund’s income and federal excise tax returns and all financial records supporting those returns for the prior three fiscal years are subject to examination by the federal and Delaware revenue authorities. Management has analyzed the Fund’s tax positions taken on federal, state, and foreign tax returns for all open tax years and does not believe that there are any uncertain tax positions that require recognition of a tax liability.
Class allocations
The separate classes of shares offered by the Fund differ principally in applicable sales charges, distribution, shareholder servicing, and administration fees. Class specific expenses are charged directly to that share class. Investment income, common expenses, and realized and unrealized gains (losses) on investments are allocated daily to each class of shares based on the relative proportion of net assets of each class.
3. FAIR VALUATION MEASUREMENTS
Fair value measurements of investments are determined within a framework that has established a fair value hierarchy based upon the various data inputs utilized in determining the value of the Fund’s investments. The three-level hierarchy gives the highest priority to unadjusted quoted prices in active markets for identical assets or liabilities (Level 1) and the lowest priority to significant unobservable inputs (Level 3). The Fund’s investments are classified within the fair value hierarchy based on the lowest level of input that is significant to the fair value measurement. The inputs are summarized into three broad levels as follows:
| n | | Level 1 – quoted prices in active markets for identical securities |
| n | | Level 2 – other significant observable inputs (including quoted prices for similar securities, interest rates, prepayment speeds, credit risk, use of amortized cost, etc.) |
| n | | Level 3 – significant unobservable inputs (including the Fund’s own assumptions in determining the fair value of investments) |
| | | | |
| 34 | | Wells Fargo Advantage Strategic Municipal Bond Fund | | Notes to financial statements (unaudited) |
The inputs or methodologies used for valuing investments in securities are not necessarily an indication of the risk associated with investing in those securities.
The following is a summary of the inputs used in valuing the Fund’s assets and liabilities as of December 31, 2014:
| | | | | | | | | | | | | | | | |
| | | Quoted prices
(Level 1) | | | Other significant
observable inputs
(Level 2) | | | Significant
unobservable inputs
(Level 3) | | | Total | |
Assets | | | | | | | | | | | | | | | | |
Investments in: | | | | | | | | | | | | | | | | |
| | | | |
Municipal obligations | | $ | 0 | | | $ | 1,569,099,737 | | | $ | 5,176,117 | | | $ | 1,574,275,854 | |
| | | | |
Short-term investments | | | | | | | | | | | | | | | | |
Investment companies | | | 40,139,233 | | | | 0 | | | | 0 | | | | 40,139,233 | |
U.S. Treasury securities | | | 474,982 | | | | 0 | | | | 0 | | | | 474,982 | |
Total assets | | $ | 40,614,215 | | | $ | 1,569,099,737 | | | $ | 5,176,117 | | | $ | 1,614,890,069 | |
Liabilities | | | | | | | | | | | | | | | | |
| | | | |
Futures contracts | | $ | 80,500 | | | $ | 0 | | | $ | 0 | | | $ | 80,500 | |
Total liabilities | | $ | 80,500 | | | $ | 0 | | | $ | 0 | | | $ | 80,500 | |
Futures contracts are reported at their variation margin at measurement date, which represents the amount due from the Fund at that date. All other assets and liabilities are reported at their market value at measurement date.
Transfers in and transfers out are recognized at the end of the reporting period. At December 31, 2014, the Fund did not have any transfers into/out of Level 1, Level 2, or Level 3.
4. TRANSACTIONS WITH AFFILIATES
Advisory fee
The Trust has entered into an advisory contract with Funds Management, an indirect wholly owned subsidiary of Wells Fargo & Company (“Wells Fargo”). The adviser is responsible for implementing investment policies and guidelines and for supervising the subadviser, who is responsible for day-to-day portfolio management of the Fund.
Pursuant to the contract, Funds Management is entitled to receive an annual advisory fee starting at 0.35% and declining to 0.25% as the average daily net assets of the Fund increase. For the six months ended December 31, 2014, the advisory fee was equivalent to an annual rate of 0.33% of the Fund’s average daily net assets.
Funds Management has retained the services of a subadviser to provide daily portfolio management to the Fund. The fee for subadvisory services is borne by Funds Management. Wells Capital Management Incorporated, an affiliate of Funds Management and an indirect wholly owned subsidiary of Wells Fargo, is the subadviser to the Fund and is entitled to receive a fee from Funds Management at an annual rate starting at 0.20% and declining to 0.10% as the average daily net assets of the Fund increase.
Administration fees
The Trust has entered into an administration agreement with Funds Management. Under this agreement, for providing administrative services, which includes paying fees and expenses for services provided by the transfer agent, sub-transfer agents, omnibus account servicers and record-keepers, Funds Management is entitled to receive from the Fund an annual fund level administration fee starting at 0.05% and declining to 0.03% as the average daily net assets of the Fund increase and a class level administration fee which is calculated based on the average daily net assets of each class as follows:
| | | | |
| | | Class level
administration fee | |
Class A, Class B, Class C | | | 0.16 | % |
Administrator Class | | | 0.10 | |
Institutional Class | | | 0.08 | |
| | | | | | |
| Notes to financial statements (unaudited) | | Wells Fargo Advantage Strategic Municipal Bond Fund | | | 35 | |
Funds Management has contractually waived and/or reimbursed advisory and administration fees to the extent necessary to maintain certain net operating expense ratios for the Fund. Waiver of fees and/or reimbursement of expenses by Funds Management were made first from fund level expenses on a proportionate basis and then from class specific expenses. Funds Management has committed through October 31, 2015 to waive fees and/or reimburse expenses to the extent necessary to cap the Fund’s expenses at 0.82% for Class A shares, 1.57% for Class B shares, 1.57% for Class C shares, 0.68% for Administrator Class shares, and 0.48% for Institutional Class shares. After this time, the cap may be increased or the commitment to maintain the cap may be terminated only with the approval of the Board of Trustees.
Distribution fees
The Trust has adopted a Distribution Plan for Class B and Class C shares of the Fund pursuant to Rule 12b-1 under the 1940 Act. Distribution fees are charged to Class B and Class C shares and paid to Wells Fargo Funds Distributor, LLC (“Funds Distributor”), the principal underwriter, at an annual rate of 0.75% of the average daily net assets of Class B and Class C shares.
In addition, Funds Distributor is entitled to receive the front-end sales charge from the purchase of Class A shares and a contingent deferred sales charge on the redemption of certain shares. Funds Distributor is also entitled to receive the contingent deferred sales charges from redemptions of Class B and Class C shares. For the six months ended December 31, 2014, Funds Distributor received $18,713 from the sale of Class A shares and $604 and $350 in contingent deferred sales charges from redemptions of Class B and Class C shares, respectively.
Shareholder servicing fees
The Trust has entered into contracts with one or more shareholder servicing agents, whereby Class A, Class B, Class C, and Administrator Class of the Fund is charged a fee at an annual rate of 0.25% of the average daily net assets of each respective class.
A portion of these total shareholder servicing fees were paid to affiliates of Wells Fargo.
5. INVESTMENT PORTFOLIO TRANSACTIONS
Purchases and sales of investments, excluding U.S. government obligations (if any) and short-term securities, for the six months ended December 31, 2014 were $319,315,950 and $190,716,594, respectively.
6. DERIVATIVE TRANSACTIONS
During the six months ended December 31, 2014, the Fund entered into futures contracts to take advantage of the differences between municipal and treasury yields and to help manage the duration of the portfolio.
At December 31, 2014, the Fund had short futures contracts outstanding as follows:
| | | | | | | | | | | | | | |
| Expiration date | | Counterparty | | Contracts | | Type | | Contract value at December 31, 2014 | | | Unrealized
gains
(losses) | |
3-20-2015 | | JPMorgan | | 218 Short | | 10-Year U.S. Treasury Notes | | $ | 27,641,719 | | | $ | 82,648 | |
3-31-2015 | | JPMorgan | | 210 Short | | 5-Year U.S. Treasury Notes | | | 24,975,234 | | | | (49,618 | ) |
The Fund had an average notional amount of $15,340,326 in short futures contracts during the six months ended December 31, 2014.
On December 31, 2014, the cumulative unrealized gains on futures contracts in the amount of $33,030 are reflected in net unrealized gains on investments on the Statement of Assets and Liabilities. The payable for daily variation margin on open futures contracts reflected in the Statement of Assets and Liabilities only represents the current day’s variation margin. The realized gains and change in unrealized gains (losses) on futures contracts are reflected in the Statement of Operations.
For certain types of derivative transactions, the Fund has entered into International Swaps and Derivatives Association, Inc. master agreements (“ISDA Master Agreements”) or similar agreements with approved counterparties. The ISDA Master Agreements or similar agreements may have requirements to deliver/deposit securities or cash to/with an exchange or broker-dealer as collateral and allows the Fund to offset, with each counterparty, certain derivative financial instrument’s assets and/or liabilities with collateral held or pledged. Collateral requirements differ by type of derivative. Collateral or margin requirements are set by the broker or exchange clearing house for exchange traded derivatives while
| | | | |
| 36 | | Wells Fargo Advantage Strategic Municipal Bond Fund | | Notes to financial statements (unaudited) |
collateral terms are contract specific for over-the-counter traded derivatives. Cash collateral that has been pledged to cover obligations of the Fund under ISDA Master Agreements or similar agreements, if any, will be reported separately in the Statement of Assets and Liabilities. Securities pledged as collateral, if any, for the same purpose are noted in the Portfolio of Investments. With respect to balance sheet offsetting, absent an event of default by the counterparty or a termination of the agreement, the reported amounts of financial assets and financial liabilities in the Statement of Assets and Liabilities are not offset across transactions between the Fund and the applicable counterparty. A reconciliation of the gross amounts on the Statement of Assets and Liabilities to the net amounts by derivative type, including any collateral exposure, is as follows:
| | | | | | | | | | | | | | | | |
| Derivative type | | Counterparty | | Gross amounts
of liabilities in the
Statement of
Assets and
Liabilities | | Amounts
subject to
netting
agreements | | | Collateral
pledged1 | | | Net amount
of liabilities | |
Futures – variation margin | | JPMorgan | | $80,500 | | $ | 0 | | | $ | (80,500 | ) | | $ | 0 | |
| | 1. | Collateral pledged within this table is limited to the collateral for the net transaction with the counterparty. | |
7. BANK BORROWINGS
The Trust (excluding the money market funds and certain other funds in the Trust) and Wells Fargo Variable Trust are parties to a $150,000,000 revolving credit agreement whereby the Fund is permitted to use bank borrowings for temporary or emergency purposes, such as to fund shareholder redemption requests. Interest under the credit agreement is charged to the Fund based on a borrowing rate equal to the higher of the Federal Funds rate in effect on that day plus 1.25% or the overnight LIBOR rate in effect on that day plus 1.25%. In addition, an annual commitment fee equal to 0.10% of the unused balance is allocated to each participating fund. For the six months ended December 31, 2014, the Fund paid $747 in commitment fees.
For the six months ended December 31, 2014, there were no borrowings by the Fund under the agreement.
8. INDEMNIFICATION
Under the Trust’s organizational documents, the officers and Trustees are indemnified against certain liabilities that may arise out of performance of their duties to the Trust. Additionally, in the normal course of business, the Trust may enter into contracts with service providers that contain a variety of indemnification clauses. The Trust’s maximum exposure under these arrangements is dependent on future claims that may be made against the Fund and, therefore, cannot be estimated.
| | | | | | |
| Other information (unaudited) | | Wells Fargo Advantage Strategic Municipal Bond Fund | | | 37 | |
PROXY VOTING INFORMATION
A description of the policies and procedures that the Fund uses to determine how to vote proxies relating to portfolio securities is available without charge, upon request, by calling 1-800-222-8222, visiting our website at wellsfargoadvantagefunds.com, or visiting the SEC website at sec.gov. Information regarding how the Fund voted proxies relating to portfolio securities during the most recent 12-month period ended June 30 is available on the Fund’s website at wellsfargoadvantagefunds.com or by visiting the SEC website at sec.gov.
PORTFOLIO HOLDINGS INFORMATION
The complete portfolio holdings for the Fund are publicly available monthly on the Fund’s website (wellsfargoadvantagefunds.com), on a one-month delayed basis. In addition, top ten holdings information (excluding derivative positions) for the Fund is publicly available on the Fund’s website on a monthly, seven-day or more delayed basis. The Fund files its complete schedule of portfolio holdings with the SEC for the first and third quarters of each fiscal year on Form N-Q, which is available by visiting the SEC website at sec.gov. In addition, the Fund’s Form N-Q may be reviewed and copied at the SEC’s Public Reference Room in Washington, DC, and at regional offices in New York City, at 233 Broadway, and in Chicago, at 175 West Jackson Boulevard, Suite 900. Information about the Public Reference Room may be obtained by calling 1-800-SEC-0330.
| | | | |
| 38 | | Wells Fargo Advantage Strategic Municipal Bond Fund | | Other information (unaudited) |
BOARD OF TRUSTEES AND OFFICERS
Each of the Trustees and Officers1 listed in the table below acts in identical capacities for each fund in the Wells Fargo Advantage family of funds, which consists of 134 mutual funds comprising the Wells Fargo Funds Trust, Wells Fargo Variable Trust, Wells Fargo Master Trust and four closed-end funds (collectively the “Fund Complex”). This table should be read in conjunction with the Prospectus and the Statement of Additional Information2. The mailing address of each Trustee and Officer is 525 Market Street, 12th Floor, San Francisco, CA 94105. Each Trustee and Officer serves an indefinite term, however, each Trustee serves such term until reaching the mandatory retirement age established by the Trustees.
Independent Trustees
| | | | | | |
Name and
year of birth | | Position held and
length of service* | | Principal occupations during past five years or longer | | Other directorships during past five years |
Peter G. Gordon (Born 1942) | | Trustee, since 1998; Chairman, since 2005 | | Co-Founder, Retired Chairman, President and CEO of Crystal Geyser Water Company. Trustee Emeritus, Colby College. | | Asset Allocation Trust |
Isaiah Harris, Jr. (Born 1952) | | Trustee, since 2009 | | Retired. Prior thereto, President and CEO of BellSouth Advertising and Publishing Corp. from 2005 to 2007, President and CEO of BellSouth Enterprises from 2004 to 2005 and President of BellSouth Consumer Services from 2000 to 2003. Emeritus member of the Iowa State University Foundation Board of Governors. Emeritus Member of the Advisory Board of Iowa State University School of Business. Advisory Board Member, Palm Harbor Academy. Mr. Harris is a certified public accountant. | | CIGNA Corporation; Asset Allocation Trust |
Judith M. Johnson (Born 1949) | | Trustee, since 2008;
Audit Committee Chairman, since 2008 | | Retired. Prior thereto, Chief Executive Officer and Chief Investment Officer of Minneapolis Employees Retirement Fund from 1996 to 2008. Ms. Johnson is an attorney, certified public accountant and a certified managerial accountant. | | Asset Allocation Trust |
Leroy Keith, Jr. (Born 1939) | | Trustee, since 2010** | | Chairman, Bloc Global Services (development and construction). Trustee of the Evergreen Funds complex (and its predecessors) from 1983 to 2010. Former Managing Director, Almanac Capital Management (commodities firm), former Partner, Stonington Partners, Inc. (private equity fund), former Director, Obagi Medical Products Co. and former Director, Lincoln Educational Services. | | Trustee, Virtus Fund Complex (consisting of 50 portfolios as of 12/16/2013); Asset Allocation Trust |
David F. Larcker (Born 1950) | | Trustee, since 2009 | | James Irvin Miller Professor of Accounting at the Graduate School of Business, Stanford University, Morgan Stanley Director of the Center for Leadership Development and Research and Senior Faculty of The Rock Center for Corporate Governance since 2006. From 2005 to 2008, Professor of Accounting at the Graduate School of Business, Stanford University. Prior thereto, Ernst & Young Professor of Accounting at The Wharton School, University of Pennsylvania from 1985 to 2005. | | Asset Allocation Trust |
Olivia S. Mitchell (Born 1953) | | Trustee, since 2006 | | International Foundation of Employee Benefit Plans Professor, Wharton School of the University of Pennsylvania since 1993. Director of Wharton’s Pension Research Council and Boettner Center on Pensions & Retirement Research, and Research Associate at the National Bureau of Economic Research. Previously, Cornell University Professor from 1978 to 1993. | | Asset Allocation Trust |
Timothy J. Penny (Born 1951) | | Trustee, since 1996 | | President and CEO of Southern Minnesota Initiative Foundation, a non-profit organization, since 2007 and Senior Fellow at the Humphrey Institute Policy Forum at the University of Minnesota since 1995. Member of the Board of Trustees of NorthStar Education Finance, Inc., a non-profit organization, since 2007. | | Asset Allocation Trust |
Michael S. Scofield (Born 1943) | | Trustee, since 2010 | | Served on the Investment Company Institute’s Board of Governors and Executive Committee from 2008-2011 as well the Governing Council of the Independent Directors Council from 2006-2011 and the Independent Directors Council Executive Committee from 2008-2011. Chairman of the IDC from 2008-2010. Institutional Investor (Fund Directions) Trustee of Year in 2007. Trustee of the Evergreen Funds complex (and its predecessors) from 1984 to 2010. Chairman of the Evergreen Funds from 2000-2010. Former Trustee of the Mentor Funds. Retired Attorney, Law Offices of Michael S. Scofield. | | Asset Allocation Trust |
| | | | | | |
| Other information (unaudited) | | Wells Fargo Advantage Strategic Municipal Bond Fund | | | 39 | |
| | | | | | |
Name and
year of birth | | Position held and
length of service* | | Principal occupations during past five years or longer | | Other directorships during past five years |
Donald C. Willeke (Born 1940) | | Trustee, since 1996 | | Principal of the law firm of Willeke & Daniels. General Counsel of the Minneapolis Employees Retirement Fund from 1984 until its consolidation into the Minnesota Public Employees Retirement Association on June 30, 2010. Director and Vice Chair of The Tree Trust (non-profit corporation). Director of the American Chestnut Foundation (non-profit corporation). | | Asset Allocation Trust |
| * | Length of service dates reflect the Trustee’s commencement of service with the Trust’s predecessor entities, where applicable. |
| ** | Leroy Keith, Jr. retired as a Trustee effective December 31, 2014. |
Officers
| | | | | | |
Name and year of birth | | Position held and
length of service | | Principal occupations during past five years or longer | | |
Karla M. Rabusch (Born 1959) | | President, since 2003 | | Executive Vice President of Wells Fargo Bank, N.A. and President of Wells Fargo Funds Management, LLC since 2003. | | |
Nancy Wiser1 (Born 1967) | | Treasurer, since 2012 | | Executive Vice President of Wells Fargo Funds Management, LLC since 2011. Chief Operating Officer and Chief Compliance Officer at LightBox Capital Management LLC, from 2008 to 2011. Owned and operated a consulting business providing services to various hedge funds including acting as Chief Operating Officer and Chief Compliance Officer for a hedge fund from 2007 to 2008. Chief Operating Officer and Chief Compliance Officer of GMN Capital LLC from 2006 to 2007. | | |
C. David Messman (Born 1960) | | Secretary, since 2000; Chief Legal Officer, since 2003 | | Assistant General Counsel of Wells Fargo Bank, N.A. since 2013 and Vice President and Managing Counsel of Wells Fargo Bank N.A. from 1996 to 2013. Senior Vice President and Secretary of Wells Fargo Funds Management , LLC since 2001. | | |
Debra Ann Early (Born 1964) | | Chief Compliance Officer, since 2007 | | Senior Vice President of Wells Fargo Funds Management, LLC since 2007 and Chief Compliance Officer from 2007 to 2014. Chief Compliance Officer of Parnassus Investments from 2005 to 2007. Chief Financial Officer of Parnassus Investments from 2004 to 2007 and Senior Audit Manager of PricewaterhouseCoopers LLP from 1998 to 2004. | | |
David Berardi (Born 1975) | | Assistant Treasurer, since 2009 | | Vice President of Wells Fargo Funds Management, LLC since 2009. Vice President of Evergreen Investment Management Company, LLC from 2008 to 2010. Assistant Vice President of Evergreen Investment Services, Inc. from 2004 to 2008. Manager of Fund Reporting and Control for Evergreen Investment Management Company, LLC from 2004 to 2010. | | |
Jeremy DePalma1 (Born 1974) | | Assistant Treasurer, since 2009 | | Senior Vice President of Wells Fargo Funds Management, LLC since 2009. Senior Vice President of Evergreen Investment Management Company, LLC from 2008 to 2010. Vice President, Evergreen Investment Services, Inc. from 2004 to 2007. Head of the Fund Reporting and Control Team within Fund Administration from 2005 to 2010. | | |
| 1. | Nancy Wiser acts as Treasurer of 73 funds in the Fund Complex. Jeremy DePalma acts as Treasurer of 61 funds and Assistant Treasurer of 73 funds in the Fund Complex. |
| 2. | The Statement of Additional Information includes additional information about the Trustees and is available, without charge, upon request, by calling 1-800-222-8222 or by visiting the website at wellsfargoadvantagefunds.com. |
| | | | |
| 40 | | Wells Fargo Advantage Strategic Municipal Bond Fund | | List of abbreviations |
The following is a list of common abbreviations for terms and entities that may have appeared in this report.
| ACA | — ACA Financial Guaranty Corporation |
| ADR | — American depositary receipt |
| ADS | — American depositary shares |
| AGC | — Assured Guaranty Corporation |
| AGM | — Assured Guaranty Municipal |
| Ambac | — Ambac Financial Group Incorporated |
| AMT | — Alternative minimum tax |
| BAN | — Bond anticipation notes |
| BHAC | — Berkshire Hathaway Assurance Corporation |
| CAB | — Capital appreciation bond |
| CCAB | — Convertible capital appreciation bond |
| CDA | — Community Development Authority |
| CDO | — Collateralized debt obligation |
| DRIVER | — Derivative inverse tax-exempt receipts |
| DW&P | — Department of Water & Power |
| DWR | — Department of Water Resources |
| ECFA | — Educational & Cultural Facilities Authority |
| EDA | — Economic Development Authority |
| EDFA | — Economic Development Finance Authority |
| ETF | — Exchange-traded fund |
| FDIC | — Federal Deposit Insurance Corporation |
| FFCB | — Federal Farm Credit Banks |
| FGIC | — Financial Guaranty Insurance Corporation |
| FHA | — Federal Housing Administration |
| FHLB | — Federal Home Loan Bank |
| FHLMC | — Federal Home Loan Mortgage Corporation |
| FICO | — The Financing Corporation |
| FNMA | — Federal National Mortgage Association |
| GDR | — Global depositary receipt |
| GNMA | — Government National Mortgage Association |
| HCFR | — Healthcare facilities revenue |
| HEFA | — Health & Educational Facilities Authority |
| HEFAR | — Higher education facilities authority revenue |
| HFA | — Housing Finance Authority |
| HFFA | — Health Facilities Financing Authority |
| HUD | — Department of Housing and Urban Development |
| IDA | — Industrial Development Authority |
| IDAG | — Industrial Development Agency |
| KRW | — Republic of Korea won |
| LIBOR | — London Interbank Offered Rate |
| LIFERs | — Long Inverse Floating Exempt Receipts |
| LLC | — Limited liability company |
| LLLP | — Limited liability limited partnership |
| LLP | — Limited liability partnership |
| MBIA | — Municipal Bond Insurance Association |
| MFHR | — Multifamily housing revenue |
| MSTR | — Municipal securities trust receipts |
| MUD | — Municipal Utility District |
| National | — National Public Finance Guarantee Corporation |
| PCFA | — Pollution Control Financing Authority |
| PCL | — Public Company Limited |
| PCR | — Pollution control revenue |
| PFA | — Public Finance Authority |
| PFFA | — Public Facilities Financing Authority |
| PFOTER | — Puttable floating option tax-exempt receipts |
| plc | — Public limited company |
| PUTTER | — Puttable tax-exempt receipts |
| R&D | — Research & development |
| Radian | — Radian Asset Assurance |
| RAN | — Revenue anticipation notes |
| RDA | — Redevelopment Authority |
| RDFA | — Redevelopment Finance Authority |
| REIT | — Real estate investment trust |
| ROC | — Reset option certificates |
| SAVRS | — Select auction variable rate securities |
| SBA | — Small Business Authority |
| SFHR | — Single-family housing revenue |
| SFMR | — Single-family mortgage revenue |
| SPA | — Standby purchase agreement |
| SPDR | — Standard & Poor’s Depositary Receipts |
| SPEARs | — Short Puttable Exempt Adjustable Receipts |
| STRIPS | — Separate trading of registered interest and |
| TAN | — Tax anticipation notes |
| TIPS | — Treasury inflation-protected securities |
| TRAN | — Tax revenue anticipation notes |
| TTFA | — Transportation Trust Fund Authority |
| TVA | — Tennessee Valley Authority |


For more information
More information about Wells Fargo Advantage Funds is available free upon request. To obtain literature, please write, email, visit the Fund’s website, or call:
Wells Fargo Advantage Funds
P.O. Box 8266
Boston, MA 02266-8266
Email: wfaf@wellsfargo.com
Website: wellsfargoadvantagefunds.com
Individual investors: 1-800-222-8222
Retail investment professionals: 1-888-877-9275
Institutional investment professionals: 1-866-765-0778
This report and the financial statements contained herein are submitted for the general information of the shareholders of Wells Fargo Advantage Funds. If this report is used for promotional purposes, distribution of the report must be accompanied or preceded by a current prospectus. Before investing, please consider the investment objectives, risks, charges, and expenses of the investment. For a current prospectus and, if available, a summary prospectus, containing this information, call 1-800-222-8222 or visit the Fund’s website at wellsfargoadvantagefunds.com. Read the prospectus carefully before you invest or send money.
Wells Fargo Funds Management, LLC, a wholly owned subsidiary of Wells Fargo & Company, provides investment advisory and administrative services for Wells Fargo Advantage Funds. Other affiliates of Wells Fargo & Company provide subadvisory and other services for the Funds. The Funds are distributed by Wells Fargo Funds Distributor, LLC, Member FINRA/SIPC, an affiliate of Wells Fargo & Company.
NOT FDIC INSURED ¡ NO BANK GUARANTEE ¡ MAY LOSE VALUE
© 2014 Wells Fargo Funds Management, LLC. All rights reserved.
| | |
 | | 230431 02-15 SA257/SAR257 12-14 |

Wells Fargo Advantage
Ultra Short-Term Municipal Income Fund

Semi-Annual Report
December 31, 2014

Reduce clutter. Save trees.
Sign up for electronic delivery of prospectuses and shareholder reports at wellsfargo.com/advantagedelivery
Contents
The views expressed and any forward-looking statements are as of December 31, 2014, unless otherwise noted, and are those of the Fund managers and/or Wells Fargo Funds Management, LLC. Discussions of individual securities, or the markets generally, or any Wells Fargo Advantage Fund are not intended as individual recommendations. Future events or results may vary significantly from those expressed in any forward-looking statements; the views expressed are subject to change at any time in response to changing circumstances in the market. Wells Fargo Funds Management, LLC and the Fund disclaim any obligation to publicly update or revise any views expressed or forward-looking statements.
NOT FDIC INSURED ¡ NO BANK GUARANTEE ¡ MAY LOSE VALUE
| | | | |
| 2 | | Wells Fargo Advantage Ultra Short-Term Municipal Income Fund | | Letter to shareholders (unaudited) |

Karla M. Rabusch
President
Wells Fargo Advantage Funds
Municipal bonds rose in the second half of 2014, helped by lower interest rates and strong demand for yield.
Dear Valued Shareholder:
We are pleased to provide you with this semi-annual report for the Wells Fargo Advantage Ultra Short-Term Municipal Income Fund for the six-month period that ended December 31, 2014. Municipal bonds rose in the second half of 2014, helped by lower interest rates and strong demand for yield. In fact, the longest-dated and weakest credits had the strongest returns. Municipal bond returns—as measured by the Barclays Municipal Bond Index1, the broadest measure for tracking investment-grade municipal bonds throughout the country—gained 2.88% for the six-month period that ended December 31, 2014.
Longer-maturity and lower-rated municipal bonds outperformed.
At the front end of the yield curve, municipal bond yields were extremely low because of the accommodative monetary policy. Throughout the reporting period, the U.S. Federal Reserve’s (Fed’s) monetary policymaking body kept its key interest rate near zero in order to support the economy and the financial system. Policymakers said they can be patient in normalizing monetary policy and that any increases in the target range for the federal funds rate will depend on incoming economic data. During the reporting period, the Fed reduced (or tapered) the size of its quantitative easing program each month until the program ended in October 2014, although it continues to reinvest principal and interest payments of the mortgage-backed securities and Treasury bonds it holds.
Longer-term yields declined during the second half of the year, with 10-year municipal yields declining from 2.33% as of June 30, 2014 to 2.10% as of December 31, 2014. For more perspective, the yield curve was steep on a historical basis at the beginning of the period and ended the period with the difference between 30-year and 2-year yields at 237 basis points (bps; 100 bps equals 1.00%), which was only slightly wider than its historical average. Because the yield curve was steep, longer-dated securities had higher yields. Given their longer maturities (as municipal yields fell further out the curve) and their more generous yields, longer-term bond returns outpaced shorter-term bonds.
Investors were also enticed to buy lower-rated securities for their higher yields. Over the six-month period that ended December 31, 2014, AAA-rated municipal bonds returned 2.04% while BBB-rated bonds returned 4.29%, according to the Barclays Municipal Bond Index. Credit conditions continued to improve, as evidenced by an 18th consecutive quarter of positive year-over-year gains in state and local municipal revenues. In addition to better fundamental credit conditions, technical factors of limited supply alongside strong investor demand also supported municipal bonds.
Puerto Rico’s struggle, the exit of two cities from bankruptcy, and pension issues topped credit news.
Puerto Rico was the asset class’s largest single credit story. Bonds from the commonwealth returned a meager 0.79% during the six-month period as population declines, a contracting economy, and a burdensome level of debt held back results. Meanwhile, the cities of Stockton, California, and Detroit, Michigan, exited bankruptcy by curbing retiree health care benefits and bondholder recoveries but largely avoiding concessions on pensions. While these recent bankruptcies have so far treated pensions better than bonded debt, no clear precedent has been established due to the difference in general obligation
| 1. | The Barclays Municipal Bond Index is an unmanaged index composed of long-term tax-exempt bonds with a minimum credit rating of Baa. You cannot invest directly in an index. |
| | | | | | |
| Letter to shareholders (unaudited) | | Wells Fargo Advantage Ultra Short-Term Municipal Income Fund | | | 3 | |
pledges and court-ordered versus negotiated concessions. Finally, underfunded pensions in Illinois, New Jersey, Pennsylvania, and Kansas gained attention for their negative fiscal effects and the political difficulties of finding a resolution.
Don’t let short-term uncertainty derail long-term investment goals.
Periods of uncertainty can present challenges, but experience has taught us that maintaining long-term investment goals can be an effective way to plan for the future. To help you create a sound strategy based on your personal goals and risk tolerance, Wells Fargo Advantage Funds offers more than 100 mutual funds and other investments spanning a wide range of asset classes and investment styles. Although diversification cannot guarantee an investment profit or prevent losses, we believe it can be an effective way to manage investment risk and potentially smooth out overall portfolio performance. We encourage investors to know their investments and to understand that appropriate levels of risk-taking may unlock opportunities.
Thank you for choosing to invest with Wells Fargo Advantage Funds. We appreciate your confidence in us and remain committed to helping you meet your financial needs. For current information about your fund investments, contact your investment professional, visit our website at wellsfargoadvantagefunds.com, or call us directly at 1-800-222-8222. We are available 24 hours a day, 7 days a week.
Sincerely,

Karla M. Rabusch
President
Wells Fargo Advantage Funds
Periods of uncertainty can present challenges, but experience has taught us that maintaining long-term investment goals can be an effective way to plan for the future.
| | | | |
| 4 | | Wells Fargo Advantage Ultra Short-Term Municipal Income Fund | | Performance highlights (unaudited) |
Investment objective
The Fund seeks current income exempt from federal income tax, consistent with capital preservation.
Adviser
Wells Fargo Funds Management, LLC
Subadviser
Wells Capital Management Incorporated
Portfolio managers
Wendy Casetta
Lyle J. Fitterer, CFA, CPA
Average annual total returns1 (%) as of December 31, 2014
| | | | | | | | | | | | | | | | | | | | | | | | | | | | | | | | | | |
| | | | | Including sales charge | | | Excluding sales charge | | | Expense ratios2 (%) | |
| | | Inception date | | 1 year | | | 5 year | | | 10 year | | | 1 year | | | 5 year | | | 10 year | | | Gross | | | Net3 | |
| Class A (SMAVX) | | 10-2-2000 | | | (1.72 | ) | | | 0.36 | | | | 1.93 | | | | 0.29 | | | | 0.76 | | | | 2.14 | | | | 0.75 | | | | 0.67 | |
| Class C (WFUSX) | | 3-31-2008 | | | (1.40 | ) | | | 0.04 | | | | 1.41 | | | | (0.40 | ) | | | 0.04 | | | | 1.41 | | | | 1.50 | | | | 1.42 | |
| Administrator Class (WUSMX) | | 7-30-2010 | | | – | | | | – | | | | – | | | | 0.36 | | | | 0.84 | | | | 2.28 | | | | 0.69 | | | | 0.60 | |
| Institutional Class (SMAIX) | | 7-31-2000 | | | – | | | | – | | | | – | | | | 0.59 | | | | 1.07 | | | | 2.50 | | | | 0.42 | | | | 0.37 | |
| Investor Class (SMUAX) | | 11-30-1995 | | | – | | | | – | | | | – | | | | 0.47 | | | | 0.77 | | | | 2.15 | | | | 0.78 | | | | 0.70 | |
| Barclays 1-Year Municipal Bond Index4 | | – | | | – | | | | – | | | | – | | | | 0.58 | | | | 0.99 | | | | 2.20 | | | | – | | | | – | |
Figures quoted represent past performance, which is no guarantee of future results, and do not reflect taxes that a shareholder may pay on fund distributions or the redemption of fund shares. Investment return and principal value of an investment will fluctuate so that an investor’s shares, when redeemed, may be worth more or less than their original cost. Performance shown without sales charges would be lower if sales charges were reflected. Current performance may be lower or higher than the performance data quoted, which assumes the reinvestment of dividends and capital gains. Current month-end performance is available on the Fund’s website, wellsfargoadvantagefunds.com.
Index returns do not include transaction costs associated with buying and selling securities, any mutual fund fees or expenses, or any taxes. It is not possible to invest directly in an index.
For Class A shares, the maximum front-end sales charge is 2.00%. For Class C shares, the maximum contingent deferred sales charge is 1.00%. Performance including a contingent deferred sales charge assumes the sales charge for the corresponding time period. Administrator Class, Institutional Class, and Investor Class shares are sold without a front-end sales charge or contingent deferred sales charge.
Bond values fluctuate in response to the financial condition of individual issuers, general market and economic conditions, and changes in interest rates. Changes in market conditions and government policies may lead to periods of heightened volatility in the bond market and reduced liquidity for certain bonds held by the Fund. In general, when interest rates rise, bond values fall and investors may lose principal value. Interest-rate changes and their impact on the Fund and its share price can be sudden and unpredictable. The use of derivatives may reduce returns and/or increase volatility. Certain investment strategies tend to increase the total risk of an investment (relative to the broader market). The Fund is exposed to high-yield securities risk and municipal securities risk. Consult the Fund’s prospectus for additional information on these and other risks. A portion of the Fund’s income may be subject to federal, state, and/or local income taxes or the Alternative Minimum Tax (AMT). Any capital gains distributions may be taxable.
Please see footnotes on page 5.
| | | | | | |
| Performance highlights (unaudited) | | Wells Fargo Advantage Ultra Short-Term Municipal Income Fund | | | 5 | |
|
| Credit quality5 distribution as of December 31, 2014 |
|
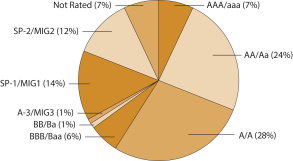 |
|
| Effective maturity distribution6 as of December 31, 2014 |
|
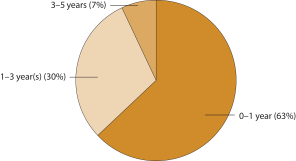 |
| 1. | Historical performance shown for Class C shares prior to their inception reflects the performance of Class A shares, adjusted to reflect the higher expenses applicable to Class C shares. Historical performance shown for Administrator Class shares prior to their inception reflects the performance of Institutional Class shares, adjusted to reflect the higher expenses applicable to Administrator Class shares. |
| 2. | Reflects the expense ratios as stated in the most recent prospectuses. The expense ratios shown are subject to change and may differ from the annualized expense ratios shown in the financial highlights of this report. |
| 3. | The Adviser has committed through October 31, 2015, to waive fees and/or reimburse expenses to the extent necessary to cap the Fund’s Total Annual Fund Operating Expenses After Fee Waiver, excluding certain expenses, at the amounts shown. After this time, the cap may be increased or the commitment to maintain the cap may be terminated only with the approval of the Board of Trustees. Brokerage commissions, stamp duty fees, interest, taxes, acquired fund fees and expenses, and extraordinary expenses are excluded from the cap. Without this cap, the Fund’s returns would have been lower. |
| 4. | The Barclays 1-Year Municipal Bond Index is the 1-year component of the Barclays Municipal Bond Index, which is an unmanaged index composed of long-term tax-exempt bonds with a minimum credit rating of Baa. You cannot invest directly in an index. |
| 5. | The credit quality distribution of portfolio holdings reflected in the chart is based on ratings from Standard & Poor’s, Moody’s Investors Service, and/or Fitch Ratings Ltd. Credit quality ratings apply to the underlying holdings of the Fund and not to the Fund itself. The percentages of the Fund’s portfolio with the ratings depicted in the chart are calculated based on the total market value of fixed income securities held by the Fund. If a security was rated by all three rating agencies, the middle rating was utilized. If rated by two of three rating agencies, the lower rating was utilized, and if rated by one of the rating agencies, that rating was utilized. Standard & Poor’s rates the creditworthiness of bonds on a scale of AAA (highest) to D (lowest). Ratings from A to CCC may be modified by the addition of a plus (+) or minus (-) sign to show relative standing within the rating categories. Standard & Poor’s rates the creditworthiness of short-term notes on a scale SP-1 (highest) to SP-3 (lowest). Moody’s rates the creditworthiness of bond on a scale of Aaa (highest) to C (lowest). Ratings Aa to B may be modified by the addition of a number 1 (highest) to 3 (lowest) to show relative standing within the ratings categories. Moody’s rates the creditworthiness of short-term U.S. tax-exempt municipal securities from MIG 1/VMIG 1 (highest) to SG (lowest). Fitch rates the creditworthiness of bonds, ranging from AAA (highest) to D (lowest). Credit quality and credit quality ratings are subject to change and may have changed since the date specified. |
| 6. | Effective maturity distribution is calculated based on the total long-term investments of the Fund. It is subject to change and may have changed since the date specified. |
| | | | |
| 6 | | Wells Fargo Advantage Ultra Short-Term Municipal Income Fund | | Fund expenses (unaudited) |
As a shareholder of the Fund, you incur two types of costs: (1) transaction costs, including sales charges (loads) on purchase payments and contingent deferred sales charges (if any) on redemptions and (2) ongoing costs, including management fees, distribution (12b-1) and/or shareholder service fees, and other Fund expenses. This example is intended to help you understand your ongoing costs (in dollars) of investing in the Fund and to compare these costs with the ongoing costs of investing in other mutual funds.
The example is based on an investment of $1,000 invested at the beginning of the six-month period and held for the entire period from July 1, 2014 to December 31, 2014.
Actual expenses
The “Actual” line of the table below provides information about actual account values and actual expenses. You may use the information in this line, together with the amount you invested, to estimate the expenses that you paid over the period. Simply divide your account value by $1,000 (for example, an $8,600 account value divided by $1,000 = 8.6), then multiply the result by the number in the “Actual” line under the heading entitled “Expenses paid during period” for your applicable class of shares to estimate the expenses you paid on your account during this period.
Hypothetical example for comparison purposes
The “Hypothetical” line of the table below provides information about hypothetical account values and hypothetical expenses based on the Fund’s actual expense ratio and an assumed rate of return of 5% per year before expenses, which is not the Fund’s actual return. The hypothetical account values and expenses may not be used to estimate the actual ending account balance or expenses you paid for the period. You may use this information to compare the ongoing costs of investing in the Fund and other funds. To do so, compare this 5% hypothetical example with the 5% hypothetical examples that appear in the shareholder reports of the other funds.
Please note that the expenses shown in the table are meant to highlight your ongoing costs only and do not reflect any transactional costs, such as sales charges (loads) and contingent deferred sales charges. Therefore, the “Hypothetical” line of the table is useful in comparing ongoing costs only and will not help you determine the relative total costs of owning different funds. In addition, if these transactional costs were included, your costs would have been higher.
| | | | | | | | | | | | | | | | |
| | | Beginning
account value
7-1-2014 | | | Ending
account value
12-31-2014 | | | Expenses
paid during
the period¹ | | | Net annualized
expense ratio | |
Class A | | | | | | | | | | | | | | | | |
Actual | | $ | 1,000.00 | | | $ | 1,001.25 | | | $ | 3.38 | | | | 0.67 | % |
Hypothetical (5% return before expenses) | | $ | 1,000.00 | | | $ | 1,021.83 | | | $ | 3.41 | | | | 0.67 | % |
Class C | | | | | | | | | | | | | | | | |
Actual | | $ | 1,000.00 | | | $ | 996.04 | | | $ | 7.14 | | | | 1.42 | % |
Hypothetical (5% return before expenses) | | $ | 1,000.00 | | | $ | 1,018.05 | | | $ | 7.22 | | | | 1.42 | % |
Administrator Class | | | | | | | | | | | | | | | | |
Actual | | $ | 1,000.00 | | | $ | 1,001.60 | | | $ | 3.03 | | | | 0.60 | % |
Hypothetical (5% return before expenses) | | $ | 1,000.00 | | | $ | 1,022.18 | | | $ | 3.06 | | | | 0.60 | % |
Institutional Class | | | | | | | | | | | | | | | | |
Actual | | $ | 1,000.00 | | | $ | 1,002.77 | | | $ | 1.87 | | | | 0.37 | % |
Hypothetical (5% return before expenses) | | $ | 1,000.00 | | | $ | 1,023.34 | | | $ | 1.89 | | | | 0.37 | % |
Investor Class | | | | | | | | | | | | | | | | |
Actual | | $ | 1,000.00 | | | $ | 1,001.10 | | | $ | 3.53 | | | | 0.70 | % |
Hypothetical (5% return before expenses) | | $ | 1,000.00 | | | $ | 1,021.68 | | | $ | 3.57 | | | | 0.70 | % |
| 1. | Expenses paid is equal to the annualized expense ratio of each class multiplied by the average account value over the period, multiplied by the number of days in the most recent fiscal half-year divided by the number of days in the fiscal year (to reflect the one-half-year period). |
| | | | | | |
| Summary portfolio of investments—December 31, 2014 (unaudited) | | Wells Fargo Advantage Ultra Short-Term Municipal Income Fund | | | 7 | |
The Summary Portfolio of Investments shows the 50 largest portfolio holdings in unaffiliated issuers and any holdings exceeding 1% of the total net assets as of the report date. The remaining securities held are grouped as “Other securities” in each category. You can request a complete schedule of portfolio holdings as of the report date, free of charge, by accessing the following website: http://a584.g.akamai.net/f/584/1326/1d/www.wellsfargoadvantagefunds.com/pdf/semi/holdings/ultrashorttermmunicipalincome.pdf or by calling Wells Fargo Advantage Funds at 1-800-222-8222. This complete schedule, filed on Form N-CSRS, is also available on the SEC’s website at sec.gov.
| | | | | | | | | | | | | | | | | | | | |
| Security name | | Interest rate | | | Maturity date | | | Principal | | | Value | | | Percent of
net assets | |
| | | | | |
| Agency Securities: 0.16% | | | | | | | | | | | | | | | | | | | | |
Other securities | | | | | | | | | | | | | | $ | 9,881,250 | | | | 0.16 | % |
| | | | | | | | | | | | | | | | | | | | |
| | | | | |
Municipal Obligations: 98.01% | | | | | | | | | | | | | | | | | | | | |
| | | | | |
| Alabama: 2.11% | | | | | | | | | | | | | | | | | | | | |
Chatom AL Industrial Development Board Gulf Opportunity Zone PowerSouth Energy Cooperative Projects Series A (Utilities Revenue, National Rural Utilities Finance Corporation SPA) ± | | | 0.45 | % | | | 11-15-2038 | | | $ | 44,965,000 | | | | 44,961,403 | | | | 0.71 | |
Other securities | | | | | | | | | | | | | | | 87,801,947 | | | | 1.40 | |
| | | | | |
| | | | | | | | | | | | | | | 132,763,350 | | | | 2.11 | |
| | | | | | | | | | | | | | | | | | | | |
| | | | | |
| Alaska: 0.05% | | | | | | | | | | | | | | | | | | | | |
Other securities | | | | | | | | | | | | | | | 3,273,200 | | | | 0.05 | |
| | | | | | | | | | | | | | | | | | | | |
| | | | | |
| Arizona: 1.09% | | | | | | | | | | | | | | | | | | | | |
Scottsdale AZ IDA Healthcare Series F (Health Revenue, AGM Insured) ±(m) | | | 1.25 | | | | 9-1-2045 | | | | 53,375,000 | | | | 53,375,000 | | | | 0.85 | |
Other securities | | | | | | | | | | | | | | | 15,472,742 | | | | 0.24 | |
| | | | | |
| | | | | | | | | | | | | | | 68,847,742 | | | | 1.09 | |
| | | | | | | | | | | | | | | | | | | | |
| | | | | |
| Arkansas: 0.04% | | | | | | | | | | | | | | | | | | | | |
Other securities | | | | | | | | | | | | | | | 2,317,143 | | | | 0.04 | |
| | | | | | | | | | | | | | | | | | | | |
| | | | | |
| California: 9.10% | | | | | | | | | | | | | | | | | | | | |
California (GO) ± | | | 4.00 | | | | 12-1-2026 | | | | 86,860,000 | | | | 91,281,174 | | | | 1.45 | |
California (Various Revenue) | | | 0.72-4.00 | | | | 12-1-2027 to 5-1-2033 | | | | 9,800,000 | | | | 10,080,720 | | | | 0.16 | |
California Infrastructure & Economic Development Bank The J. Paul Getty Trust Series A-4 (Miscellaneous Revenue) ± | | | 0.33 | | | | 4-1-2038 | | | | 32,000,000 | | | | 32,030,080 | | | | 0.51 | |
California Statewide CDA (Various Revenue) µ | | | 0.65-5.00 | | | | 11-15-2016 to 7-1-2040 | | | | 40,155,000 | | | | 40,337,118 | | | | 0.63 | |
California Statewide CDA Health Facilities Catholic Series D (Health Revenue, AGM Insured) ±(m) | | | 0.59 | | | | 7-1-2041 | | | | 36,900,000 | | | | 36,900,000 | | | | 0.59 | |
Northern California Gas Authority #1 LIBOR Series B (Utilities Revenue) ± | | | 0.76 | | | | 7-1-2017 | | | | 35,510,000 | | | | 35,308,658 | | | | 0.56 | |
Palomar Pomerado CA Health Care (Health Revenue, AGM Insured) µ | | | 1.10-1.35 | | | | 11-1-2036 to 12-1-2036 | | | | 78,100,000 | | | | 78,100,000 | | | | 1.24 | |
Other securities | | | | | | | | | | | | | | | 248,669,920 | | | | 3.96 | |
| | | | | |
| | | | | | | | | | | | | | | 572,707,670 | | | | 9.10 | |
| | | | | | | | | | | | | | | | | | | | |
| | | | | |
| Colorado: 0.93% | | | | | | | | | | | | | | | | | | | | |
Other securities | | | | | | | | | | | | | | | 58,476,228 | | | | 0.93 | |
| | | | | | | | | | | | | | | | | | | | |
| | | | | |
| Connecticut: 2.46% | | | | | | | | | | | | | | | | | | | | |
Connecticut (Various Revenue) ± | | | 0.46-0.96 | | | | 8-15-2015 to 8-15-2018 | | | | 73,230,000 | | | | 73,646,359 | | | | 1.18 | |
Other securities | | | | | | | | | | | | | | | 80,803,751 | | | | 1.28 | |
| | | | | |
| | | | | | | | | | | | | | | 154,450,110 | | | | 2.46 | |
| | | | | | | | | | | | | | | | | | | | |
The accompanying notes are an integral part of these financial statements.
| | | | |
| 8 | | Wells Fargo Advantage Ultra Short-Term Municipal Income Fund | | Summary portfolio of investments—December 31, 2014 (unaudited) |
| | | | | | | | | | | | | | | | | | | | |
| Security name | | Interest rate | | | Maturity date | | | Principal | | | Value | | | Percent of
net assets | |
| | | | | |
| District of Columbia: 0.59% | | | | | | | | | | | | | | | | | | | | |
Other securities | | | | | | | | | | | | | | $ | 37,274,136 | | | | 0.59 | % |
| | | | | | | | | | | | | | | | | | | | |
| | | | | |
| Florida: 2.76% | | | | | | | | | | | | | | | | | | | | |
Florida PFOTER 4638 (Miscellaneous Revenue, Dexia Credit Local LIQ) 144Aø | | | 0.21 | % | | | 7-1-2036 | | | $ | 43,580,000 | | | | 43,580,000 | | | | 0.69 | |
Other securities | | | | | | | | | | | | | | | 130,156,361 | | | | 2.07 | |
| | | | | |
| | | | | | | | | | | | | | | 173,736,361 | | | | 2.76 | |
| | | | | | | | | | | | | | | | | | | | |
| | | | | |
| Georgia: 2.12% | | | | | | | | | | | | | | | | | | | | |
Georgia Series G (GO) | | | 0.44 | | | | 12-1-2026 | | | | 106,305,000 | | | | 106,218,893 | | | | 1.69 | |
Other securities | | | | | | | | | | | | | | | 26,881,378 | | | | 0.43 | |
| | | | | |
| | | | | | | | | | | | | | | 133,100,271 | | | | 2.12 | |
| | | | | | | | | | | | | | | | | | | | |
| | | | | |
| Guam: 0.08% | | | | | | | | | | | | | | | | | | | | |
Other securities | | | | | | | | | | | | | | | 4,805,735 | | | | 0.08 | |
| | | | | | | | | | | | | | | | | | | | |
| | | | | |
| Hawaii: 0.02% | | | | | | | | | | | | | | | | | | | | |
Other securities | | | | | | | | | | | | | | | 1,533,494 | | | | 0.02 | |
| | | | | | | | | | | | | | | | | | | | |
| | | | | |
| Idaho: 0.22% | | | | | | | | | | | | | | | | | | | | |
Other securities | | | | | | | | | | | | | | | 14,045,000 | | | | 0.22 | |
| | | | | | | | | | | | | | | | | | | | |
| | | | | |
| Illinois: 9.72% | | | | | | | | | | | | | | | | | | | | |
Chicago IL Board of Education Series 2012-001 (GO, Dexia Credit Local LIQ) ø | | | 0.56 | | | | 12-1-2034 | | | | 40,000,000 | | | | 40,000,000 | | | | 0.64 | |
Chicago IL Board of Education (GO) µ | | | 0.00-5.25 | | | | 12-1-2015 to 12-1-2018 | | | | 19,690,000 | | | | 19,514,317 | | | | 0.32 | |
Chicago IL Board of Education Series A-1 (GO) ± | | | 0.69 | | | | 3-1-2026 | | | | 49,275,000 | | | | 48,734,946 | | | | 0.77 | |
Chicago IL Board of Education Series A2 (GO) ± | | | 0.80 | | | | 3-1-2035 | | | | 72,320,000 | | | | 70,810,682 | | | | 1.13 | |
Deutsche Bank SPEARs/LIFERs Trust (Various Revenue) µ | | | 0.16 | | | | 5-1-2032 to 2-1-2039 | | | | 22,400,000 | | | | 22,400,000 | | | | 0.36 | |
Illinois (Various Revenue) µ | | | 2.00-5.38 | | | | 4-1-2015 to 9-1-2018 | | | | 141,720,000 | | | | 149,783,883 | | | | 2.38 | |
Illinois Toll Highway Authority Series B (Transportation Revenue, AGM Insured, Landesbank Hessen-Thüringen SPA) ø | | | 0.23 | | | | 1-1-2017 | | | | 32,350,000 | | | | 32,350,000 | | | | 0.51 | |
Regional Transportation Authority Illinois Refunding Balance Series B (Tax Revenue) ø | | | 0.40 | | | | 6-1-2025 | | | | 40,650,000 | | | | 40,650,000 | | | | 0.65 | |
Other securities | | | | | | | | | | | | | | | 187,024,478 | | | | 2.96 | |
| | | | | |
| | | | | | | | | | | | | | | 611,268,306 | | | | 9.72 | |
| | | | | | | | | | | | | | | | | | | | |
| | | | | |
| Indiana: 0.96% | | | | | | | | | | | | | | | | | | | | |
Posey County IN Economic Development Midwest Fertilizer Company Project Series A (Industrial Development Revenue) ± | | | 0.23 | | | | 7-1-2046 | | | | 44,750,000 | | | | 44,748,658 | | | | 0.71 | |
Other securities | | | | | | | | | | | | | | | 15,569,360 | | | | 0.25 | |
| | | | | |
| | | | | | | | | | | | | | | 60,318,018 | | | | 0.96 | |
| | | | | | | | | | | | | | | | | | | | |
| | | | | |
| Iowa: 0.07% | | | | | | | | | | | | | | | | | | | | |
Other securities | | | | | | | | | | | | | | | 4,488,525 | | | | 0.07 | |
| | | | | | | | | | | | | | | | | | | | |
| | | | | |
| Kansas: 0.44% | | | | | | | | | | | | | | | | | | | | |
Other securities | | | | | | | | | | | | | | | 27,489,730 | | | | 0.44 | |
| | | | | | | | | | | | | | | | | | | | |
The accompanying notes are an integral part of these financial statements.
| | | | | | |
| Summary portfolio of investments—December 31, 2014 (unaudited) | | Wells Fargo Advantage Ultra Short-Term Municipal Income Fund | | | 9 | |
| | | | | | | | | | | | | | | | | | | | |
| Security name | | Interest rate | | | Maturity date | | | Principal | | | Value | | | Percent of
net assets | |
| | | | | |
| Kentucky: 1.71% | | | | | | | | | | | | | | | | | | | | |
Ashland KY Ashland Hospital Corporation Kings Daughters Medical Center Project (Health Revenue) ± | | | 1.79 | % | | | 2-1-2040 | | | $ | 32,085,000 | | | $ | 32,232,591 | | | | 0.51 | % |
Kentucky Public Transportation Infrastructure Authority Tolls BAN Downtown Crossing Project Series A (Transportation Revenue) | | | 5.00 | | | | 7-1-2017 | | | | 50,420,000 | | | | 55,177,127 | | | | 0.88 | |
Other securities | | | | | | | | | | | | | | | 19,918,318 | | | | 0.32 | |
| | | | | |
| | | | | | | | | | | | | | | 107,328,036 | | | | 1.71 | |
| | | | | | | | | | | | | | | | | | | | |
| | | | | |
| Louisiana: 1.89% | | | | | | | | | | | | | | | | | | | | |
St. James Parish LA Nucor Steel LLC Project Gulf Opportunity Zone Series A1 (Industrial Development Revenue) ø | | | 0.22 | | | | 11-1-2040 | | | | 60,000,000 | | | | 60,000,000 | | | | 0.95 | |
St. James Parish LA Nucor Steel LLC Project Gulf Opportunity Zone Series B1 (Industrial Development Revenue) ø | | | 0.20 | | | | 11-1-2040 | | | | 10,000,000 | | | | 10,000,000 | | | | 0.16 | |
Other securities | | | | | | | | | | | | | | | 49,125,453 | | | | 0.78 | |
| | | | | |
| | | | | | | | | | | | | | | 119,125,453 | | | | 1.89 | |
| | | | | | | | | | | | | | | | | | | | |
| | | | | |
| Maine: 0.07% | | | | | | | | | | | | | | | | | | | | |
Other securities | | | | | | | | | | | | | | | 4,104,320 | | | | 0.07 | |
| | | | | | | | | | | | | | | | | | | | |
| | | | | |
| Maryland: 0.29% | | | | | | | | | | | | | | | | | | | | |
Other securities | | | | | | | | | | | | | | | 18,527,775 | | | | 0.29 | |
| | | | | | | | | | | | | | | | | | | | |
| | | | | |
| Massachusetts: 3.26% | | | | | | | | | | | | | | | | | | | | |
BB&T Municipal Trust Class B (Miscellaneous Revenue, Rabobank LOC) 144Aø | | | 0.35 | | | | 10-15-2015 | | | | 36,635,000 | | | | 36,635,000 | | | | 0.58 | |
Massachusetts Consolidated Loan Series D-1 (Miscellaneous Revenue) ± | | | 0.24 | | | | 8-1-2043 | | | | 80,000,000 | | | | 79,875,200 | | | | 1.27 | |
Other securities | | | | | | | | | | | | | | | 88,277,134 | | | | 1.41 | |
| | | | | |
| | | | | | | | | | | | | | | 204,787,334 | | | | 3.26 | |
| | | | | | | | | | | | | | | | | | | | |
| | | | | |
| Michigan: 5.35% | | | | | | | | | | | | | | | | | | | | |
Michigan Finance Authority (Various Revenue) µ | | | 2.85-5.00 | | | | 6-1-2015 to 7-1-2018 | | | | 102,595,000 | | | | 111,353,484 | | | | 1.76 | |
University of Michigan Series F (Education Revenue) ± | | | 0.45 | | | | 4-1-2043 | | | | 48,970,000 | | | | 49,025,307 | | | | 0.78 | |
Other securities | | | | | | | | | | | | | | | 176,251,964 | | | | 2.81 | |
| | | | | |
| | | | | | | | | | | | | | | 336,630,755 | | | | 5.35 | |
| | | | | | | | | | | | | | | | | | | | |
| | | | | |
| Minnesota: 0.41% | | | | | | | | | | | | | | | | | | | | |
Other securities | | | | | | | | | | | | | | | 26,013,730 | | | | 0.41 | |
| | | | | | | | | | | | | | | | | | | | |
| | | | | |
| Mississippi: 0.11% | | | | | | | | | | | | | | | | | | | | |
Other securities | | | | | | | | | | | | | | | 6,980,473 | | | | 0.11 | |
| | | | | | | | | | | | | | | | | | | | |
| | | | | |
| Missouri: 0.55% | | | | | | | | | | | | | | | | | | | | |
Other securities | | | | | | | | | | | | | | | 34,330,199 | | | | 0.55 | |
| | | | | | | | | | | | | | | | | | | | |
| | | | | |
| Montana: 0.08% | | | | | | | | | | | | | | | | | | | | |
Other securities | | | | | | | | | | | | | | | 5,087,332 | | | | 0.08 | |
| | | | | | | | | | | | | | | | | | | | |
The accompanying notes are an integral part of these financial statements.
| | | | |
| 10 | | Wells Fargo Advantage Ultra Short-Term Municipal Income Fund | | Summary portfolio of investments—December 31, 2014 (unaudited) |
| | | | | | | | | | | | | | | | | | | | |
| Security name | | Interest rate | | | Maturity date | | | Principal | | | Value | | | Percent of
net assets | |
| | | | | |
| Nevada: 0.32% | | | | | | | | | | | | | | | | | | | | |
Other securities | | | | | | | | | | | | | | $ | 19,983,190 | | | | 0.32 | % |
| | | | | | | | | | | | | | | | | | | | |
| | | | | |
| New Hampshire: 0.10% | | | | | | | | | | | | | | | | | | | | |
Other securities | | | | | | | | | | | | | | | 6,417,784 | | | | 0.10 | |
| | | | | | | | | | | | | | | | | | | | |
| | | | | |
| New Jersey: 6.89% | | | | | | | | | | | | | | | | | | | | |
New Jersey EDA (Various Revenue) | | | 0.55-5.25 | % | | | 6-1-2015 to 12-15-2017 | | | $ | 12,785,000 | | | | 12,940,693 | | | | 0.20 | |
New Jersey EDA School Facilities Construction Project Series E (Miscellaneous Revenue) ± | | | 1.74 | | | | 2-1-2016 | | | | 59,540,000 | | | | 59,899,622 | | | | 0.95 | |
New Jersey PFOTER PT-4709 (Miscellaneous Revenue, Dexia Credit Local LIQ) 144Aø | | | 0.25 | | | | 9-1-2029 | | | | 41,600,000 | | | | 41,600,000 | | | | 0.66 | |
New Jersey PFOTER PT-4712 (Transportation Revenue, National Insured, Dexia Credit Local LIQ) 144Aø | | | 0.23 | | | | 12-15-2022 | | | | 32,785,000 | | | | 32,785,000 | | | | 0.52 | |
New Jersey PFOTER PT-4713 (GO, Ambac Insured, Dexia Credit Local LIQ) 144Aø | | | 0.13 | | | | 12-15-2021 | | | | 22,855,000 | | | | 22,855,000 | | | | 0.36 | |
New Jersey PFOTER Series 4716 (Miscellaneous Revenue, National/FGIC Insured, Dexia Credit Local LIQ) 144Aø | | | 0.25 | | | | 9-1-2027 | | | | 45,000,000 | | | | 45,000,000 | | | | 0.72 | |
New Jersey TTFA PFOTER Series 109 (Transportation Revenue, Dexia Credit Local LOC, FGIC Insured, Dexia Credit Local SPA) 144Aø | | | 0.24 | | | | 12-15-2030 | | | | 43,575,000 | | | | 43,575,000 | | | | 0.69 | |
Other securities | | | | | | | | | | | | | | | 174,489,429 | | | | 2.79 | |
| | | | | |
| | | | | | | | | | | | | | | 433,144,744 | | | | 6.89 | |
| | | | | | | | | | | | | | | | | | | | |
| | | | | |
| New Mexico: 1.30% | | | | | | | | | | | | | | | | | | | | |
New Mexico Municipal Energy Acquisition Authority Gas Supply Sub Series B (Utilities Revenue, Royal Bank of Canada SPA) ± | | | 0.85 | | | | 11-1-2039 | | | | 60,000,000 | | | | 60,386,400 | | | | 0.96 | |
Other securities | | | | | | | | | | | | | | | 21,114,487 | | | | 0.34 | |
| | | | | |
| | | | | | | | | | | | | | | 81,500,887 | | | | 1.30 | |
| | | | | | | | | | | | | | | | | | | | |
| | | | | |
| New York: 19.70% | | | | | | | | | | | | | | | | | | | | |
Deutsche Bank SPEARs/LIFERs Trust (Various Revenue , Deutsche Bank LIQ) | | | 0.28-0.70 | | | | 7-1-2022 to 10-1-2053 | | | | 79,760,000 | | | | 79,760,000 | | | | 1.28 | |
Metropolitan Transportation Authority New York (Transportation Revenue) µ | | | 0.31-0.42 | | | | 11-1-2026 to 11-15-2041 | | | | 23,000,000 | | | | 23,001,570 | | | | 0.37 | |
Metropolitan Transportation Authority New York Series A-3 (Transportation Revenue) ø | | | 0.43 | | | | 11-15-2042 | | | | 50,000,000 | | | | 50,000,000 | | | | 0.79 | |
Metropolitan Transportation Authority New York Sub Series 3-3B (Transportation Revenue) ± | | | 0.40 | | | | 11-1-2030 | | | | 42,470,000 | | | | 42,413,515 | | | | 0.67 | |
Metropolitan Transportation Authority New York Sub Series G-2 (Transportation Revenue) ± | | | 0.64 | | | | 11-1-2032 | | | | 34,000,000 | | | | 34,072,760 | | | | 0.54 | |
Metropolitan Transportation Authority New York Transportation Sub Series D-2A (Transportation Revenue, AGM
Insured) ± | | | 0.58 | | | | 11-1-2032 | | | | 36,650,000 | | | | 36,795,867 | | | | 0.58 | |
New York Energy R&D Authority Series A (Resource Recovery Revenue, Ambac
Insured) ±(m)(n) | | | 0.42 | | | | 7-1-2015 | | | | 51,960,000 | | | | 51,960,000 | | | | 0.83 | |
New York Local Government Assistance Corporation Refinance Sub Lien Series A-10V (Tax Revenue, AGM
Insured) ±(m)(n) | | | 0.11 | | | | 4-1-2017 | | | | 43,625,000 | | | | 42,970,625 | | | | 0.68 | |
The accompanying notes are an integral part of these financial statements.
| | | | | | |
| Summary portfolio of investments—December 31, 2014 (unaudited) | | Wells Fargo Advantage Ultra Short-Term Municipal Income Fund | | | 11 | |
| | | | | | | | | | | | | | | | | | | | |
| Security name | | Interest rate | | | Maturity date | | | Principal | | | Value | | | Percent of
net assets | |
| | | | | |
| New York (continued) | | | | | | | | | | | | | | | | | | | | |
New York NY Adjusted Fiscal 2008 Sub Series A-4 (GO, AGM Insured) ±(m) | | | 0.68 | % | | | 8-1-2026 | | | $ | 41,125,000 | | | $ | 41,125,000 | | | | 0.65 | % |
New York NY Adjusted Fiscal 2008 Sub Series C4 (GO, AGM Insured) ±(m) | | | 0.68 | | | | 10-1-2027 | | | | 60,375,000 | | | | 60,375,000 | | | | 0.96 | |
New York NY Series A-6 (GO) ± | | | 0.54 | | | | 8-1-2031 | | | | 39,950,000 | | | | 39,960,387 | | | | 0.63 | |
New York NY (Various Revenue) µ | | | 0.16-0.68 | | | | 8-1-2021 to 6-1-2036 | | | | 118,020,000 | | | | 118,016,923 | | | | 1.88 | |
New York NY Series J-9 (GO) ± | | | 0.45 | | | | 8-1-2027 | | | | 38,000,000 | | | | 38,000,380 | | | | 0.60 | |
New York NY Sub Series L-5 (GO, Dexia Credit Local SPA) ø | | | 0.16 | | | | 4-1-2035 | | | | 34,000,000 | | | | 34,000,000 | | | | 0.54 | |
New York Urban Development Corporation (Various Revenue) µ | | | 0.13-4.00 | | | | 2-1-2015 to 3-15-2024 | | | | 39,925,000 | | | | 39,957,052 | | | | 0.63 | |
New York Urban Development Corporation Personal Income Tax Series A (Tax Revenue) | | | 5.00 | | | | 3-15-2018 | | | | 28,890,000 | | | | 32,596,298 | | | | 0.52 | |
Suffolk County NY (GO) µ | | | 1.50-4.50 | | | | 3-26-2015 to 11-1-2015 | | | | 54,140,000 | | | | 54,412,331 | | | | 0.87 | |
Suffolk County NY TAN Series III (GO) | | | 1.50 | | | | 9-11-2015 | | | | 47,800,000 | | | | 48,145,116 | | | | 0.76 | |
Triborough Bridge & Tunnel Authority New York Various Refunding General Sub Series B-D (Transportation Revenue) ± | | | 0.69 | | | | 1-1-2031 | | | | 40,800,000 | | | | 40,902,816 | | | | 0.65 | |
Other securities | | | | | | | | | | | | | | | 330,636,264 | | | | 5.27 | |
| | | | | |
| | | | | | | | | | | | | | | 1,239,101,904 | | | | 19.70 | |
| | | | | | | | | | | | | | | | | | | | |
| | | | | |
| North Carolina: 0.75% | | | | | | | | | | | | | | | | | | | | |
Other securities | | | | | | | | | | | | | | | 47,282,074 | | | | 0.75 | |
| | | | | | | | | | | | | | | | | | | | |
| | | | | |
| North Dakota: 0.20% | | | | | | | | | | | | | | | | | | | | |
Other securities | | | | | | | | | | | | | | | 12,368,871 | | | | 0.20 | |
| | | | | | | | | | | | | | | | | | | | |
| | | | | |
| Ohio: 1.43% | | | | | | | | | | | | | | | | | | | | |
Other securities | | | | | | | | | | | | | | | 89,843,640 | | | | 1.43 | |
| | | | | | | | | | | | | | | | | | | | |
| | | | | |
| Oklahoma: 0.20% | | | | | | | | | | | | | | | | | | | | |
Other securities | | | | | | | | | | | | | | | 12,415,992 | | | | 0.20 | |
| | | | | | | | | | | | | | | | | | | | |
| | | | | |
| Oregon: 0.29% | | | | | | | | | | | | | | | | | | | | |
Other securities | | | | | | | | | | | | | | | 18,108,675 | | | | 0.29 | |
| | | | | | | | | | | | | | | | | | | | |
| | | | | |
| Pennsylvania: 3.55% | | | | | | | | | | | | | | | | | | | | |
Pennsylvania EDFA (Various Revenue) | | | 0.37-3.00 | | | | 4-1-2019 to 8-1-2045 | | | | 87,365,000 | | | | 87,815,218 | | | | 1.40 | |
Pennsylvania Turnpike Commission Series B-2 (Transportation Revenue) ± | | | 0.34 | | | | 12-1-2016 | | | | 34,950,000 | | | | 34,954,893 | | | | 0.55 | |
Other securities | | | | | | | | | | | | | | | 100,781,948 | | | | 1.60 | |
| | | | | |
| | | | | | | | | | | | | | | 223,552,059 | | | | 3.55 | |
| | | | | | | | | | | | | | | | | | | | |
| | | | | |
| Puerto Rico: 1.41% | | | | | | | | | | | | | | | | | | | | |
Puerto Rico Commonwealth Government Development Bank Refunding Bond (Miscellaneous Revenue, National Insured) ± | | | 4.75 | | | | 12-1-2015 | | | | 39,790,000 | | | | 39,926,082 | | | | 0.63 | |
Other securities | | | | | | | | | | | | | | | 48,817,606 | | | | 0.78 | |
| | | | | |
| | | | | | | | | | | | | | | 88,743,688 | | | | 1.41 | |
| | | | | | | | | | | | | | | | | | | | |
The accompanying notes are an integral part of these financial statements.
| | | | |
| 12 | | Wells Fargo Advantage Ultra Short-Term Municipal Income Fund | | Summary portfolio of investments—December 31, 2014 (unaudited) |
| | | | | | | | | | | | | | | | | | | | |
| Security name | | Interest rate | | | Maturity date | | | Principal | | | Value | | | Percent of
net assets | |
| | | | | |
| Rhode Island: 0.33% | | | | | | | | | | | | | | | | | | | | |
Other securities | | | | | | | | | | | | | | $ | 20,678,728 | | | | 0.33 | % |
| | | | | | | | | | | | | | | | | | | | |
| | | | | |
| South Carolina: 0.08% | | | | | | | | | | | | | | | | | | | | |
Other securities | | | | | | | | | | | | | | | 5,218,398 | | | | 0.08 | |
| | | | | | | | | | | | | �� | | | | | | | |
| | | | | |
| South Dakota: 0.01% | | | | | | | | | | | | | | | | | | | | |
Other securities | | | | | | | | | | | | | | | 928,020 | | | | 0.01 | |
| | | | | | | | | | | | | | | | | | | | |
| | | | | |
| Tennessee: 0.76% | | | | | | | | | | | | | | | | | | | | |
Other securities | | | | | | | | | | | | | | | 47,742,420 | | | | 0.76 | |
| | | | | | | | | | | | | | | | | | | | |
| | | | | |
| Texas: 12.09% | | | | | | | | | | | | | | | | | | | | |
Harris County TX (Various Revenue) µ | | | 0.63-1.09 | % | | | 8-15-2021 to 11-15-2045 | | | $ | 58,730,000 | | | | 58,823,968 | | | | 0.93 | |
Harris County TX Health Facilities Development Corporation Series A3 (Health Revenue, AGM Insured) ±(m) | | | 0.69 | | | | 7-1-2031 | | | | 32,425,000 | | | | 32,425,000 | | | | 0.52 | |
Houston TX Independent School District Series A (GO) ± | | | 1.00 | | | | 6-1-2039 | | | | 36,650,000 | | | | 36,746,390 | | | | 0.58 | |
Port Arthur TX Navigation District Jefferson County Environmental Facilities Motiva Enterprises LLC Project Series D (Industrial Development Revenue) ø | | | 0.20 | | | | 11-1-2040 | | | | 59,000,000 | | | | 59,000,000 | | | | 0.94 | |
San Antonio TX Electric & Gas Refunding System Junior Lien Series A (Utilities Revenue) ±%% | | | 1.00 | | | | 2-1-2033 | | | | 53,000,000 | | | | 53,019,080 | | | | 0.84 | |
San Antonio TX (Various Revenue) | | | 0.72-2.00 | | | | 12-1-2027 to 5-1-2043 | | | | 15,225,000 | | | | 15,343,454 | | | | 0.24 | |
Texas Municipal Gas Acquisition & Supply Corporation (Utilities Revenue) µ | | | 0.71-5.63 | | | | 12-15-2015 to 12-15-2017 | | | | 36,265,000 | | | | 36,753,818 | | | | 0.58 | |
Texas Municipal Gas Acquisition & Supply Corporation II Series B (Utilities Revenue, JPMorgan Chase & Company Guaranteed) ± | | | 0.50 | | | | 9-15-2017 | | | | 61,510,000 | | | | 61,593,654 | | | | 0.98 | |
Texas Transportation Commission State Highway Fund Floating Ist Tier Series B (Tax Revenue) ± | | | 0.39 | | | | 4-1-2032 | | | | 24,000,000 | | | | 24,057,360 | | | | 0.38 | |
Texas Transportation Commission State Highway Series B (Transportation Revenue, Banco Bilboa Vizcaya SPA) ø | | | 0.28 | | | | 4-1-2026 | | | | 40,900,000 | | | | 40,900,000 | | | | 0.65 | |
Texas Transportation Commission Turnpike System First Tier PUTTER Series B (Transportation Revenue) ± | | | 1.25 | | | | 8-15-2042 | | | | 51,525,000 | | | | 51,576,010 | | | | 0.82 | |
Other securities | | | | | | | | | | | | | | | 290,057,103 | | | | 4.63 | |
| | | | | |
| | | | | | | | | | | | | | | 760,295,837 | | | | 12.09 | |
| | | | | | | | | | | | | | | | | | | | |
| | | | | |
| Virgin Islands: 0.18% | | | | | | | | | | | | | | | | | | | | |
Other securities | | | | | | | | | | | | | | | 11,390,619 | | | | 0.18 | |
| | | | | | | | | | | | | | | | | | | | |
| | | | | |
| Virginia: 0.49% | | | | | | | | | | | | | | | | | | | | |
Other securities | | | | | | | | | | | | | | | 31,030,880 | | | | 0.49 | |
| | | | | | | | | | | | | | | | | | | | |
| | | | | |
| Washington: 0.15% | | | | | | | | | | | | | | | | | | | | |
Other securities | | | | | | | | | | | | | | | 9,677,116 | | | | 0.15 | |
| | | | | | | | | | | | | | | | | | | | |
| | | | | |
| West Virginia: 0.14% | | | | | | | | | | | | | | | | | | | | |
Other securities | | | | | | | | | | | | | | | 9,001,440 | | | | 0.14 | |
| | | | | | | | | | | | | | | | | | | | |
The accompanying notes are an integral part of these financial statements.
| | | | | | |
| Summary portfolio of investments—December 31, 2014 (unaudited) | | Wells Fargo Advantage Ultra Short-Term Municipal Income Fund | | | 13 | |
| | | | | | | | | | | | | | | | | | | | |
| Security name | | Interest rate | | | Maturity date | | | Principal | | | Value | | | Percent of
net assets | |
| | | | | |
| Wisconsin: 0.92% | | | | | | | | | | | | | | | | | | | | |
Other securities | | | | | | | | | | | | | | $ | 57,700,724 | | | | 0.92 | % |
| | | | | | | | | | | | | | | | | | | | |
| | | | | |
| Wyoming: 0.24% | | | | | | | | | | | | | | | | | | | | |
Other securities | | | | | | | | | | | | | | | 15,000,000 | | | | 0.24 | |
| | | | | | | | | | | | | | | | | | | | |
| | | | |
Total Municipal Obligations (Cost $6,152,604,732) | | | | | | | | | | | | 6,164,938,116 | | | | 98.01 | |
| | | | | | | | | | | | | | | | | | | | |
| | | | | |
Other: 0.87% | | | | | | | | | | | | | | | | | | | | |
Nuveen Dividend Advantage Municipal Fund 3, Institutional MuniFund Term Preferred Shares ±144A | | | 0.79 | % | | | 10-1-2017 | | | $ | 38,000,000 | | | | 38,001,900 | | | | 0.60 | |
Other securities | | | | | | | | | | | | | | | 17,003,230 | | | | 0.27 | |
| | | | | |
Total Other (Cost $55,000,000) | | | | | | | | | | | | | | | 55,005,130 | | | | 0.87 | |
| | | | | | | | | | | | | | | | | | | | |
| | | | | |
| | | Yield | | | | | | Shares | | | | | | | |
| Short-Term Investments: 1.85% | | | | | | | | | | | | | | | | | | | | |
| | | | | |
| Investment Companies: 1.84% | | | | | | | | | | | | | | | | | | | | |
Wells Fargo Advantage National Tax-Free Money Market Fund, Institutional
Class ##(l)(u) | | | 0.01 | | | | | | | | 115,629,459 | | | | 115,629,459 | | | | 1.84 | |
| | | | | | | | | | | | | | | | | | | | |
| | | | | |
| | | | | | | | | Principal | | | | | | | |
| U.S. Treasury Securities: 0.01% | | | | | | | | | | | | | | | | | | | | |
U.S. Treasury Bill (z)# | | | 0.02 | | | | 3-19-2015 | | | $ | 400,000 | | | | 399,985 | | | | 0.01 | |
| | | | | | | | | | | | | | | | | | | | |
| | | | | |
Total Short-Term Investments (Cost $116,029,456) | | | | | | | | | | | | | | | 116,029,444 | | | | 1.85 | |
| | | | | | | | | | | | | | | | | | | | |
| | | | |
| Total investments in securities (Cost $6,333,534,342) * | | | | | | | | | | | | 6,345,853,940 | | | | 100.89 | |
Other assets and liabilities, net | | | | | | | | | | | | | | | (55,828,755 | ) | | | (0.89 | ) |
| | | | | | | | | | | | | | | | | | | | |
| Total net assets | | | | | | | | | | | | | | $ | 6,290,025,185 | | | | 100.00 | % |
| | | | | | | | | | | | | | | | | | | | |
| ø | Variable rate demand notes are subject to a demand feature which reduces the effective maturity. The maturity date shown represents the final maturity date of the security. The interest rate is determined and reset by the issuer daily, weekly, or monthly depending upon the terms of the security. The rate shown is the rate in effect at period end. |
| ± | Variable rate investment. The rate shown is the rate in effect at period end. |
| (m) | The security is an auction-rate security which has an interest rate that resets at predetermined short-term intervals through a Dutch auction. The rate shown is the rate in effect at period end. |
| (n) | The auction to set the interest rate on the security failed at period end due to insufficient investor interest. A failed auction does not itself cause a default. |
| µ | All or some of these obligations have credit enhancements or liquidity features that may, under certain circumstances, provide for repayment of principal and interest. |
| %% | The security is issued on a when-issued basis. |
| 144A | The security may be resold in transactions exempt from registration, normally to qualified institutional buyers, pursuant to Rule 144A under the Securities Act of 1933. |
| (l) | The security represents an affiliate of the Fund as defined in the Investment Company Act of 1940. |
| (u) | The rate represents the 7-day annualized yield at period end. |
| (z) | Zero coupon security. The rate represents the current yield to maturity. |
| ## | All or a portion of this security has been segregated for when-issued securities. |
| # | All or a portion of this security is segregated as collateral for investments in derivative instruments. |
| * | Cost for federal income tax purposes is $6,333,525,167 and unrealized gains (losses) consists of: |
| | | | |
Gross unrealized gains | | $ | 16,234,778 | |
Gross unrealized losses | | | (3,906,005 | ) |
| | | | |
Net unrealized gains | | $ | 12,328,773 | |
The accompanying notes are an integral part of these financial statements.
| | | | |
| 14 | | Wells Fargo Advantage Ultra Short-Term Municipal Income Fund | | Statement of assets and liabilities—December 31, 2014 (unaudited) |
| | | | |
| | | | |
| |
Assets | | | | |
Investments | | | | |
In unaffiliated securities, at value (cost $6,217,904,883) | | $ | 6,230,224,481 | |
In affiliated securities, at value (cost $115,629,459) | | | 115,629,459 | |
| | | | |
Total investments, at value (cost $6,333,534,342) | | | 6,345,853,940 | |
Receivable for investments sold | | | 11,029,348 | |
Receivable for Fund shares sold | | | 57,518,578 | |
Receivable for interest | | | 21,801,130 | |
Prepaid expenses and other assets | | | 128,713 | |
| | | | |
Total assets | | | 6,436,331,709 | |
| | | | |
| |
Liabilities | | | | |
Dividends payable | | | 783,781 | |
Payable for investments purchased | | | 116,264,656 | |
Payable for Fund shares redeemed | | | 20,930,101 | |
Payable for daily variation margin on open futures contracts | | | 37,499 | |
Due to custodian bank | | | 5,671,999 | |
Advisory fee payable | | | 1,161,773 | |
Distribution fee payable | | | 32,739 | |
Administration fees payable | | | 814,654 | |
Accrued expenses and other liabilities | | | 609,322 | |
| | | | |
Total liabilities | | | 146,306,524 | |
| | | | |
Total net assets | | $ | 6,290,025,185 | |
| | | | |
| |
NET ASSETS CONSIST OF | | | | |
Paid-in capital | | $ | 6,276,182,333 | |
Overdistributed net investment income | | | (482,860 | ) |
Accumulated net realized gains on investments | | | 2,076,384 | |
Net unrealized gains on investments | | | 12,249,328 | |
| | | | |
Total net assets | | $ | 6,290,025,185 | |
| | | | |
| |
COMPUTATION OF NET ASSET VALUE AND OFFERING PRICE PER SHARE | | | | |
Net assets – Class A | | $ | 1,114,219,707 | |
Shares outstanding – Class A1 | | | 231,161,084 | |
Net asset value per share – Class A | | | $4.82 | |
Maximum offering price per share – Class A2 | | | $4.92 | |
Net assets – Class C | | $ | 48,448,734 | |
Shares outstanding – Class C1 | | | 10,154,451 | |
Net asset value per share – Class C | | | $4.77 | |
Net assets – Administrator Class | | $ | 392,300,174 | |
Shares outstanding – Administrator Class1 | | | 81,389,260 | |
Net asset value per share – Administrator Class | | | $4.82 | |
Net assets – Institutional Class | | $ | 4,286,125,709 | |
Shares outstanding – Institutional Class1 | | | 889,245,731 | |
Net asset value per share – Institutional Class | | | $4.82 | |
Net assets – Investor Class | | $ | 448,930,861 | |
Shares outstanding – Investor Class1 | | | 93,026,428 | |
Net asset value per share – Investor Class | | | $4.83 | |
| 1. | The Fund has an unlimited number of authorized shares. |
| 2. | Maximum offering price is computed as 100/98 of net asset value. On investments of $50,000 or more, the offering price is reduced. |
The accompanying notes are an integral part of these financial statements.
| | | | | | |
| Statement of operations—six months ended December 31, 2014 (unaudited) | | Wells Fargo Advantage Ultra Short-Term Municipal Income Fund | | | 15 | |
| | | | |
| | | | |
| |
Investment income | | | | |
Interest | | $ | 26,851,801 | |
Income from affiliated securities | | | 21,111 | |
| | | | |
Total investment income | | | 26,872,912 | |
| | | | |
| |
Expenses | | | | |
Advisory fee | | | 8,394,344 | |
Administration fees | | | | |
Fund level | | | 1,474,876 | |
Class A | | | 1,087,713 | |
Class C | | | 43,732 | |
Administrator Class | | | 202,183 | |
Institutional Class | | | 1,521,510 | |
Investor Class | | | 460,568 | |
Shareholder servicing fees | | | | |
Class A | | | 1,699,552 | |
Class C | | | 68,331 | |
Administrator Class | | | 505,458 | |
Investor Class | | | 603,576 | |
Distribution fee | | | | |
Class C | | | 204,993 | |
Custody and accounting fees | | | 154,308 | |
Professional fees | | | 24,496 | |
Registration fees | | | 70,017 | |
Shareholder report expenses | | | 56,368 | |
Trustees’ fees and expenses | | | 6,323 | |
Other fees and expenses | | | 75,560 | |
| | | | |
Total expenses | | | 16,653,908 | |
Less: Fee waivers and/or expense reimbursements | | | (1,764,077 | ) |
| | | | |
Net expenses | | | 14,889,831 | |
| | | | |
Net investment income | | | 11,983,081 | |
| | | | |
| |
REALIZED AND UNREALIZED GAINS (LOSSES) ON INVESTMENTS | | | | |
Net realized gains on investments | | | 2,070,263 | |
| | | | |
| |
Net change in unrealized gains (losses) on: | | | | |
Unaffiliated securities | | | (4,144,908 | ) |
Futures transactions | | | (70,270 | ) |
| | | | |
Net change in unrealized gains (losses) on investments | | | (4,215,178 | ) |
| | | | |
Net realized and unrealized gains (losses) on investments | | | (2,144,915 | ) |
| | | | |
Net increase in net assets resulting from operations | | $ | 9,838,166 | |
| | | | |
The accompanying notes are an integral part of these financial statements.
| | | | |
| 16 | | Wells Fargo Advantage Ultra Short-Term Municipal Income Fund | | Statement of changes in net assets |
| | | | | | | | | | | | | | | | |
| | | Six months ended
December 31, 2014
(unaudited) | | | Year ended
June 30, 2014 | |
| | | | |
Operations | | | | | | | | | | | | | | | | |
Net investment income | | | | | | $ | 11,983,081 | | | | | | | $ | 30,356,773 | |
Net realized gains on investments | | | | | | | 2,070,263 | | | | | | | | 1,275,986 | |
Net change in unrealized gains (losses) on investments | | | | | | | (4,215,178 | ) | | | | | | | 1,104,524 | |
| | | | |
Net increase in net assets resulting from operations | | | | | | | 9,838,166 | | | | | | | | 32,737,283 | |
| | | | |
| | | | |
Distributions to shareholders from | | | | | | | | | | | | | | | | |
Net investment income | | | | | | | | | | | | | | | | |
Class A | | | | | | | (1,392,852 | ) | | | | | | | (5,850,481 | ) |
Administrator Class | | | | | | | (554,646 | ) | | | | | | | (1,679,716 | ) |
Institutional Class | | | | | | | (9,617,500 | ) | | | | | | | (20,993,060 | ) |
Investor Class | | | | | | | (422,986 | ) | | | | | | | (1,796,119 | ) |
Net realized gains | | | | | | | | | | | | | | | | |
Class A | | | | | | | (244,521 | ) | | | | | | | (268,368 | ) |
Class C | | | | | | | (11,088 | ) | | | | | | | (11,554 | ) |
Administrator Class | | | | | | | (85,022 | ) | | | | | | | (62,086 | ) |
Institutional Class | | | | | | | (858,240 | ) | | | | | | | (467,194 | ) |
Investor Class | | | | | | | (98,683 | ) | | | | | | | (91,540 | ) |
| | | | |
Total distributions to shareholders | | | | | | | (13,285,538 | ) | | | | | | | (31,220,118 | ) |
| | | | |
| | | | |
Capital share transactions | | | Shares | | | | | | | | Shares | | | | | |
Proceeds from shares sold | | | | | | | | | | | | | | | | |
Class A | | | 62,137,714 | | | | 299,506,507 | | | | 153,515,272 | | | | 740,042,032 | |
Class C | | | 135,585 | | | | 647,977 | | | | 556,128 | | | | 2,667,896 | |
Administrator Class | | | 16,389,811 | | | | 78,998,887 | | | | 45,684,977 | | | | 220,201,589 | |
Institutional Class | | | 555,199,137 | | | | 2,676,059,839 | | | | 884,595,338 | | | | 4,263,841,240 | |
Investor Class | | | 5,835,752 | | | | 28,186,681 | | | | 21,440,358 | | | | 103,493,611 | |
| | | | |
| | | | | | | 3,083,399,891 | | | | | | | | 5,330,246,368 | |
| | | | |
Reinvestment of distributions | | | | | | | | | | | | | | | | |
Class A | | | 330,202 | | | | 1,592,151 | | | | 1,243,954 | | | | 5,996,760 | |
Class C | | | 1,902 | | | | 9,074 | | | | 1,999 | | | | 9,569 | |
Administrator Class | | | 127,450 | | | | 614,310 | | | | 343,353 | | | | 1,654,960 | |
Institutional Class | | | 1,206,153 | | | | 5,813,657 | | | | 2,368,393 | | | | 11,415,651 | |
Investor Class | | | 103,733 | | | | 501,032 | | | | 370,943 | | | | 1,790,854 | |
| | | | |
| | | | | | | 8,530,224 | | | | | | | | 20,867,794 | |
| | | | |
Payment for shares redeemed | | | | | | | | | | | | | | | | |
Class A | | | (159,274,423 | ) | | | (768,426,449 | ) | | | (223,884,938 | ) | | | (1,079,373,632 | ) |
Class C | | | (2,382,359 | ) | | | (11,383,629 | ) | | | (6,711,100 | ) | | | (32,179,579 | ) |
Administrator Class | | | (19,686,376 | ) | | | (94,888,334 | ) | | | (61,585,309 | ) | | | (296,841,189 | ) |
Institutional Class | | | (372,769,995 | ) | | | (1,796,751,377 | ) | | | (821,224,511 | ) | | | (3,958,421,473 | ) |
Investor Class | | | (18,533,168 | ) | | | (89,515,202 | ) | | | (56,025,392 | ) | | | (270,495,316 | ) |
| | | | |
| | | | | | | (2,760,964,991 | ) | | | | | | | (5,637,311,189 | ) |
| | | | |
Net increase (decrease) in net assets resulting from capital share transactions | | | | | | | 330,965,124 | | | | | | | | (286,197,027 | ) |
| | | | |
Total increase (decrease) in net assets | | | | | | | 327,517,752 | | | | | | | | (284,679,862 | ) |
| | | | |
| | | | |
Net assets | | | | | | | | | | | | | | | | |
Beginning of period | | | | | | | 5,962,507,433 | | | | | | | | 6,247,187,295 | |
| | | | |
End of period | | | | | | $ | 6,290,025,185 | | | | | | | $ | 5,962,507,433 | |
| | | | |
Overdistributed net investment income | | | | | | $ | (482,860 | ) | | | | | | $ | (477,957 | ) |
| | | | |
The accompanying notes are an integral part of these financial statements.
| | | | | | |
| Financial highlights | | Wells Fargo Advantage Ultra Short-Term Municipal Income Fund | | | 17 | |
(For a share outstanding throughout each period)
| | | | | | | | | | | | | | | | | | | | | | | | |
| | | Six months ended
December 31, 2014 (unaudited) | | | Year ended June 30 | |
| CLASS A | | | 2014 | | | 2013 | | | 2012 | | | 2011 | | | 2010 | |
Net asset value, beginning of period | | | $4.82 | | | | $4.82 | | | | $4.82 | | | | $4.82 | | | | $4.81 | | | | $4.78 | |
Net investment income | | | 0.01 | | | | 0.02 | | | | 0.02 | | | | 0.05 | | | | 0.06 | | | | 0.07 | |
Net realized and unrealized gains (losses) on investments | | | 0.00 | 1 | | | 0.00 | 1 | | | (0.01 | ) | | | 0.00 | 1 | | | 0.01 | | | | 0.03 | |
| | | | | | | | | | | | | | | | | | | | | | | | |
Total from investment operations | | | 0.01 | | | | 0.02 | | | | 0.01 | | | | 0.05 | | | | 0.07 | | | | 0.10 | |
Distributions to shareholders from | | | | | | | | | | | | | | | | | | | | | | | | |
Net investment income | | | (0.01 | ) | | | (0.02 | ) | | | (0.01 | ) | | | (0.05 | ) | | | (0.06 | ) | | | (0.07 | ) |
Net realized gains | | | (0.00 | )1 | | | (0.00 | )1 | | | 0.00 | | | | 0.00 | | | | 0.00 | | | | 0.00 | |
| | | | | | | | | | | | | | | | | | | | | | | | |
Total distributions to shareholders | | | (0.01 | ) | | | (0.02 | ) | | | (0.01 | ) | | | (0.05 | ) | | | (0.06 | ) | | | (0.07 | ) |
Net asset value, end of period | | | $4.82 | | | | $4.82 | | | | $4.82 | | | | $4.82 | | | | $4.82 | | | | $4.81 | |
Total return2 | | | 0.12 | % | | | 0.35 | % | | | 0.31 | % | | | 0.96 | % | | | 1.51 | % | | | 2.17 | % |
Ratios to average net assets (annualized) | | | | | | | | | | | | | | | | | | | | | | | | |
Gross expenses | | | 0.75 | % | | | 0.75 | % | | | 0.75 | % | | | 0.76 | % | | | 0.76 | % | | | 0.78 | % |
Net expenses | | | 0.67 | % | | | 0.67 | % | | | 0.67 | % | | | 0.67 | % | | | 0.67 | % | | | 0.67 | % |
Net investment income | | | 0.21 | % | | | 0.34 | % | | | 0.32 | % | | | 0.95 | % | | | 1.28 | % | | | 1.44 | % |
Supplemental data | | | | | | | | | | | | | | | | | | | | | | | | |
Portfolio turnover rate | | | 19 | %3 | | | 51 | %3 | | | 65 | %3 | | | 111 | % | | | 127 | % | | | 120 | % |
Net assets, end of period (000s omitted) | | | $1,114,220 | | | | $1,582,112 | | | | $1,914,970 | | | | $2,603,618 | | | | $2,691,449 | | | | $3,466,977 | |
| 1. | Amount is less than $0.005. |
| 2. | Total return calculations do not include any sales charges. Returns for periods of less than one year are not annualized. |
| 3. | Portfolio turnover rate excludes variable rate demand notes which may account for changes from rates reported in prior periods. |
The accompanying notes are an integral part of these financial statements.
| | | | |
| 18 | | Wells Fargo Advantage Ultra Short-Term Municipal Income Fund | | Financial highlights |
(For a share outstanding throughout each period)
| | | | | | | | | | | | | | | | | | | | | | | | |
| | | Six months ended
December 31, 2014 (unaudited) | | | Year ended June 30 | |
| CLASS C | | | 2014 | | | 2013 | | | 2012 | | | 2011 | | | 2010 | |
Net asset value, beginning of period | | | $4.79 | | | | $4.81 | | | | $4.82 | | | | $4.82 | | | | $4.81 | | | | $4.78 | |
Net investment income (loss) | | | (0.03 | ) | | | (0.02 | )1 | | | (0.03 | ) | | | 0.01 | | | | 0.03 | | | | 0.04 | |
Net realized and unrealized gains (losses) on investments | | | 0.01 | | | | 0.00 | 2 | | | 0.02 | | | | 0.00 | 2 | | | 0.01 | | | | 0.03 | |
| | | | | | | | | | | | | | | | | | | | | | | | |
Total from investment operations | | | (0.02 | ) | | | (0.02 | ) | | | (0.01 | ) | | | 0.01 | | | | 0.04 | | | | 0.07 | |
Distribution to shareholders from | | | | | | | | | | | | | | | | | | | | | | | | |
Net investment income | | | 0.00 | | | | 0.00 | | | | 0.00 | | | | (0.01 | ) | | | (0.03 | ) | | | (0.04 | ) |
Net realized gains | | | (0.00 | )2 | | | (0.00 | )2 | | | 0.00 | | | | 0.00 | | | | 0.00 | | | | 0.00 | |
| | | | | | | | | | | | | | | | | | | | | | | | |
Total distributions to shareholders | | | (0.00 | )2 | | | (0.00 | )2 | | | 0.00 | | | | (0.01 | ) | | | (0.03 | ) | | | (0.04 | ) |
Net asset value, end of period | | | $4.77 | | | | $4.79 | | | | $4.81 | | | | $4.82 | | | | $4.82 | | | | $4.81 | |
Total return3 | | | (0.40 | )% | | | (0.40 | )% | | | (0.21 | )% | | | 0.25 | % | | | 0.76 | % | | | 1.40 | % |
Ratios to average net assets (annualized) | | | | | | | | | | | | | | | | | | | | | | | | |
Gross expenses | | | 1.50 | % | | | 1.50 | % | | | 1.50 | % | | | 1.51 | % | | | 1.51 | % | | | 1.53 | % |
Net expenses | | | 1.42 | % | | | 1.42 | % | | | 1.42 | % | | | 1.42 | % | | | 1.42 | % | | | 1.42 | % |
Net investment income (loss) | | | (0.54 | )% | | | (0.41 | )% | | | (0.43 | )% | | | 0.23 | % | | | 0.54 | % | | | 0.70 | % |
Supplemental data | | | | | | | | | | | | | | | | | | | | | | | | |
Portfolio turnover rate | | | 19 | %4 | | | 51 | %4 | | | 65 | %4 | | | 111 | % | | | 127 | % | | | 120 | % |
Net assets, end of period (000s omitted) | | | $48,449 | | | | $59,352 | | | | $89,148 | | | | $148,465 | | | | $216,389 | | | | $385,331 | |
| 1. | Calculated based upon average shares outstanding |
| 2. | Amount is less than $0.005. |
| 3. | Total return calculations do not include any sales charges. Returns for periods of less than one year are not annualized. |
| 4. | Portfolio turnover rate excludes variable rate demand notes which may account for changes from rates reported in prior periods. |
The accompanying notes are an integral part of these financial statements.
| | | | | | |
| Financial highlights | | Wells Fargo Advantage Ultra Short-Term Municipal Income Fund | | | 19 | |
(For a share outstanding throughout each period)
| | | | | | | | | | | | | | | | | | | | |
| | | Six months ended
December 31, 2014 (unaudited) | | | Year ended June 30 | |
| ADMINISTRATOR CLASS | | | 2014 | | | 2013 | | | 2012 | | | 20111 | |
Net asset value, beginning of period | | | $4.82 | | | | $4.82 | | | | $4.82 | | | | $4.82 | | | | $4.81 | |
Net investment income | | | 0.01 | | | | 0.02 | | | | 0.02 | | | | 0.05 | | | | 0.06 | |
Net realized and unrealized gains (losses) on investments | | | 0.00 | 2 | | | 0.00 | 2 | | | 0.00 | 2 | | | 0.00 | 2 | | | 0.01 | |
| | | | | | | | | | | | | | | | | | | | |
Total from investment operations | | | 0.01 | | | | 0.02 | | | | 0.02 | | | | 0.05 | | | | 0.07 | |
Distributions to shareholders from | | | | | | | | | | | | | | | | | | | | |
Net investment income | | | (0.01 | ) | | | (0.02 | ) | | | (0.02 | ) | | | (0.05 | ) | | | (0.06 | ) |
Net realized gains | | | (0.00 | )2 | | | (0.00 | )2 | | | 0.00 | | | | 0.00 | | | | 0.00 | |
| | | | | | | | | | | | | | | | | | | | |
Total distributions to shareholders | | | (0.01 | ) | | | (0.02 | ) | | | (0.02 | ) | | | (0.05 | ) | | | (0.06 | ) |
Net asset value, end of period | | | $4.82 | | | | $4.82 | | | | $4.82 | | | | $4.82 | | | | $4.82 | |
Total return3 | | | 0.16 | % | | | 0.42 | % | | | 0.38 | % | | | 1.03 | % | | | 1.47 | % |
Ratios to average net assets (annualized) | | | | | | | | | | | | | | | | | | | | |
Gross expenses | | | 0.69 | % | | | 0.69 | % | | | 0.69 | % | | | 0.68 | % | | | 0.67 | % |
Net expenses | | | 0.60 | % | | | 0.60 | % | | | 0.60 | % | | | 0.60 | % | | | 0.60 | % |
Net investment income | | | 0.28 | % | | | 0.41 | % | | | 0.39 | % | | | 0.95 | % | | | 1.42 | % |
Supplemental data | | | | | | | | | | | | | | | | | | | | |
Portfolio turnover rate | | | 19 | %4 | | | 51 | %4 | | | 65 | %4 | | | 111 | % | | | 127 | % |
Net assets, end of period (000s omitted) | | | $392,300 | | | | $407,791 | | | | $482,711 | | | | $597,108 | | | | $266,710 | |
| 1. | For the period from July 30, 2010 (commencement of class operations) to June 30, 2011 |
| 2. | Amount is less than $0.005. |
| 3. | Returns for periods of less than one year are not annualized. |
| 4. | Portfolio turnover rate excludes variable rate demand notes which may account for changes from rates reported in prior periods. |
The accompanying notes are an integral part of these financial statements.
| | | | |
| 20 | | Wells Fargo Advantage Ultra Short-Term Municipal Income Fund | | Financial highlights |
(For a share outstanding throughout each period)
| | | | | | | | | | | | | | | | | | | | | | | | |
| | | Six months ended
December 31, 2014 (unaudited) | | | Year ended June 30 | |
| INSTITUTIONAL CLASS | | | 2014 | | | 2013 | | | 2012 | | | 2011 | | | 2010 | |
Net asset value, beginning of period | | | $4.82 | | | | $4.82 | | | | $4.82 | | | | $4.82 | | | | $4.81 | | | | $4.78 | |
Net investment income | | | 0.01 | | | | 0.03 | | | | 0.03 | | | | 0.06 | | | | 0.08 | | | | 0.09 | |
Net realized and unrealized gains (losses) on investments | | | 0.00 | 1 | | | 0.00 | 1 | | | 0.00 | 1 | | | 0.00 | 1 | | | 0.01 | | | | 0.03 | |
| | | | | | | | | | | | | | | | | | | | | | | | |
Total from investment operations | | | 0.01 | | | | 0.03 | | | | (0.03 | ) | | | 0.06 | | | | 0.09 | | | | 0.12 | |
Distributions to shareholders from | | | | | | | | | | | | | | | | | | | | | | | | |
Net investment income | | | (0.01 | ) | | | (0.03 | ) | | | (0.03 | ) | | | (0.06 | ) | | | (0.08 | ) | | | (0.09 | ) |
Net realized gains | | | (0.00 | )1 | | | (0.00 | )1 | | | 0.00 | | | | 0.00 | | | | 0.00 | | | | 0.00 | |
| | | | | | | | | | | | | | | | | | | | | | | | |
Total distributions to shareholders | | | (0.01 | ) | | | (0.03 | ) | | | (0.03 | ) | | | (0.06 | ) | | | (0.08 | ) | | | (0.09 | ) |
Net asset value, end of period | | | $4.82 | | | | $4.82 | | | | $4.82 | | | | $4.82 | | | | $4.82 | | | | $4.81 | |
Total return2 | | | 0.28 | % | | | 0.65 | % | | | 0.61 | % | | | 1.26 | % | | | 1.82 | % | | | 2.48 | % |
Ratios to average net assets (annualized) | | | | | | | | | | | | | | | | | | | | | | | | |
Gross expenses | | | 0.42 | % | | | 0.42 | % | | | 0.42 | % | | | 0.43 | % | | | 0.43 | % | | | 0.43 | % |
Net expenses | | | 0.37 | % | | | 0.37 | % | | | 0.37 | % | | | 0.37 | % | | | 0.37 | % | | | 0.37 | % |
Net investment income | | | 0.51 | % | | | 0.64 | % | | | 0.61 | % | | | 1.23 | % | | | 1.60 | % | | | 1.67 | % |
Supplemental data | | | | | | | | | | | | | | | | | | | | | | | | |
Portfolio turnover rate | | | 19 | %3 | | | 51 | %3 | | | 65 | %3 | | | 111 | % | | | 127 | % | | | 120 | % |
Net assets, end of period (000s omitted) | | | $4,286,126 | | | | $3,403,244 | | | | $3,085,284 | | | | $3,158,674 | | | | $2,423,330 | | | | $1,860,538 | |
| 1. | Amount is less than $0.005. |
| 2. | Returns for periods of less than one year are not annualized. |
| 3. | Portfolio turnover rate excludes variable rate demand notes which may account for changes from rates reported in prior periods. |
The accompanying notes are an integral part of these financial statements.
| | | | | | |
| Financial highlights | | Wells Fargo Advantage Ultra Short-Term Municipal Income Fund | | | 21 | |
(For a share outstanding throughout each period)
| | | | | | | | | | | | | | | | | | | | | | | | |
| | | Six months ended
December 31, 2014 (unaudited) | | | Year ended June 30 | |
| INVESTOR CLASS | | | 2014 | | | 2013 | | | 2012 | | | 2011 | | | 2010 | |
Net asset value, beginning of period | | | $4.83 | | | | $4.83 | | | | $4.83 | | | | $4.82 | | | | $4.81 | | | | $4.78 | |
Net investment income | | | 0.00 | 1 | | | 0.01 | | | | 0.01 | | | | 0.04 | | | | 0.06 | | | | 0.07 | |
Net realized and unrealized gains (losses) on investments | | | 0.00 | 1 | | | 0.00 | 1 | | | 0.00 | 1 | | | 0.01 | | | | 0.01 | | | | 0.03 | |
| | | | | | | | | | | | | | | | | | | | | | | | |
Total from investment operations | | | 0.00 | 1 | | | 0.01 | | | | 0.01 | | | | 0.05 | | | | 0.07 | | | | 0.10 | |
Distributions to shareholders from | | | | | | | | | | | | | | | | | | | | | | | | |
Net investment income | | | (0.00 | )1 | | | (0.01 | ) | | | (0.01 | ) | | | (0.04 | ) | | | (0.06 | ) | | | (0.07 | ) |
Net realized gains | | | (0.00 | )1 | | | (0.00 | )1 | | | 0.00 | | | | 0.00 | | | | 0.00 | | | | 0.00 | |
| | | | | | | | | | | | | | | | | | | | | | | | |
Total distributions to shareholders | | | (0.00 | )1 | | | (0.01 | ) | | | (0.01 | ) | | | (0.04 | ) | | | (0.06 | ) | | | (0.07 | ) |
Net asset value, end of period | | | $4.83 | | | | $4.83 | | | | $4.83 | | | | $4.83 | | | | $4.82 | | | | $4.81 | |
Total return2 | | | 0.11 | % | | | 0.32 | % | | | 0.28 | % | | | 1.14 | % | | | 1.48 | % | | | 2.12 | % |
Ratios to average net assets (annualized) | | | | | | | | | | | | | | | | | | | | | | | | |
Gross expenses | | | 0.77 | % | | | 0.78 | % | | | 0.78 | % | | | 0.79 | % | | | 0.79 | % | | | 0.82 | % |
Net expenses | | | 0.70 | % | | | 0.70 | % | | | 0.70 | % | | | 0.70 | % | | | 0.70 | % | | | 0.72 | % |
Net investment income | | | 0.18 | % | | | 0.31 | % | | | 0.29 | % | | | 0.92 | % | | | 1.25 | % | | | 1.44 | % |
Supplemental data | | | | | | | | | | | | | | | | | | | | | | | | |
Portfolio turnover rate | | | 19 | %3 | | | 51 | %3 | | | 65 | %3 | | | 111 | % | | | 127 | % | | | 120 | % |
Net assets, end of period (000s omitted) | | | $448,931 | | | | $510,008 | | | | $675,074 | | | | $987,752 | | | | $1,068,221 | | | | $1,528,358 | |
| 1. | Amount is less than $0.005. |
| 2. | Returns for periods of less than one year are not annualized. |
| 3. | Portfolio turnover rate excludes variable rate demand notes which may account for changes from rates reported in prior periods. |
The accompanying notes are an integral part of these financial statements.
| | | | |
| 22 | | Wells Fargo Advantage Ultra Short-Term Municipal Income Fund | | Notes to financial statements (unaudited) |
1. ORGANIZATION
Wells Fargo Funds Trust (the “Trust”), a Delaware statutory trust organized on March 10, 1999, is an open-end management investment company registered under the Investment Company Act of 1940, as amended (the “1940 Act”). As an investment company, the Trust follows the accounting and reporting guidance in FASB Accounting Standards Codification 946. These financial statements report on the Wells Fargo Advantage Ultra Short-Term Municipal Income Fund (the “Fund”) which is a diversified series of the Trust.
2. SIGNIFICANT ACCOUNTING POLICIES
The following significant accounting policies, which are consistently followed in the preparation of the financial statements of the Fund, are in conformity with U.S. generally accepted accounting principles which require management to make estimates and assumptions that affect the reported amounts of assets and liabilities, disclosure of contingent assets and liabilities at the date of the financial statements, and the reported amounts of revenues and expenses during the reporting period. Actual results could differ from those estimates.
Securities valuation
All investments are valued each business day as of the close of regular trading on the New York Stock Exchange (generally 4 p.m. Eastern Time).
Fixed income securities acquired with maturities exceeding 60 days are valued based on evaluated bid prices provided by an independent pricing service which may utilize both transaction data and market information such as yield, quality, coupon rate, maturity, type of issue, trading characteristics and other market data. If prices are not available from the independent pricing service or prices received are deemed not representative of market value, prices will be obtained from an independent broker-dealer.
Short-term securities, with maturities of 60 days or less at time of purchase, generally are valued at amortized cost which approximates fair value. The amortized cost method involves valuing a security at its cost, plus accretion of discount or minus amortization of premium over the period until maturity.
Futures that are listed on a foreign or domestic exchange or market are valued at the official closing price or, if none, the last sales price.
Investments in registered open-end investment companies are valued at net asset value.
Investments which are not valued using any of the methods discussed above are valued at their fair value, as determined in good faith by the Board of Trustees of the Fund. The Board of Trustees has established a Valuation Committee comprised of the Trustees and has delegated to it the authority to take any actions regarding the valuation of portfolio securities that the Valuation Committee deems necessary or appropriate, including determining the fair value of portfolio securities, unless the determination has been delegated to the Management Valuation Team of Wells Fargo Funds Management, LLC (“Funds Management”). The Board of Trustees retains the authority to make or ratify any valuation decisions or approve any changes to the Valuation Procedures as it deems appropriate. On a quarterly basis, the Board of Trustees receives reports on any valuation actions taken by the Valuation Committee or the Management Valuation Team which may include items for ratification.
Valuations of fair valued securities are compared to the next actual sales price when available, or other appropriate market values, to assess the continued appropriateness of the fair valuation methodologies used. These securities are fair valued on a day-to-day basis, taking into consideration changes to appropriate market information and any significant changes to the inputs considered in the valuation process until there is a readily available price provided on an exchange or by an independent pricing service. Valuations received from an independent pricing service or independent broker-dealer quotes are periodically validated by comparisons to most recent trades and valuations provided by other independent pricing services in addition to the review of prices by the adviser and/or subadviser. Unobservable inputs used in determining fair valuations are identified based on the type of security, taking into consideration factors utilized by market participants in valuing the investment, knowledge about the issuer and the current market environment.
When-issued transactions
The Fund may purchase securities on a forward commitment or when-issued basis. The Fund records a when-issued transaction on the trade date and will segregate assets in an amount at least equal in value to the Fund’s commitment to purchase when-issued securities. Securities purchased on a when-issued basis are marked-to-market daily and the Fund begins earning interest on the settlement date. Losses may arise due to changes in the market value of the underlying securities or if the counterparty does not perform under the contract.
| | | | | | |
| Notes to financial statements (unaudited) | | Wells Fargo Advantage Ultra Short-Term Municipal Income Fund | | | 23 | |
Futures contracts
The Fund is subject to interest rate risk in the normal course of pursuing its investment objectives. The Fund may buy and sell futures contracts in order to gain exposure to, or protect against, changes in security values and interest rates. The primary risks associated with the use of futures contracts are the imperfect correlation between changes in market values of securities held by the Fund and the prices of futures contracts, and the possibility of an illiquid market.
The aggregate principal amounts of the contracts are not recorded in the financial statements. Fluctuations in the value of the contracts are recorded in the Statement of Assets and Liabilities as an asset or liability and in the Statement of Operations as unrealized gains or losses until the contracts are closed, at which point they are recorded as net realized gains or losses on futures contracts. With futures contracts, there is minimal counterparty risk to the Fund since futures are exchange traded and the exchange’s clearinghouse, as counterparty to all exchange traded futures, guarantees the futures against default.
Security transactions and income recognition
Securities transactions are recorded on a trade date basis. Realized gains or losses are recorded on the basis of identified cost.
Interest income is accrued daily and bond discounts are accreted and premiums are amortized daily based on the effective interest method. To the extent debt obligations are placed on non-accrual status, any related interest income may be reduced by writing off interest receivables when the collection of all or a portion of interest has become doubtful based on consistently applied procedures. If the issuer subsequently resumes interest payments or when the collectability of interest is reasonably assured, the debt obligation is removed from non-accrual status.
Distributions to shareholders
Distributions to shareholders from net investment income are accrued daily and paid monthly. Distributions from net realized gains, if any, are recorded on the ex-dividend date. Such distributions are determined in conformity with federal income tax regulations, which may differ in amount or character from net investment income and realized gains recognized for purposes of U.S. generally accepted accounting principles.
Federal and other taxes
The Fund intends to continue to qualify as a regulated investment company by distributing substantially all of its investment company taxable and tax-exempt income and any net realized capital gains (after reduction for capital loss carryforwards) sufficient to relieve it from all, or substantially all, federal income taxes. Accordingly, no provision for federal income taxes was required.
The Fund’s income and federal excise tax returns and all financial records supporting those returns for the prior three fiscal years are subject to examination by the federal and Delaware revenue authorities. Management has analyzed the Fund’s tax positions taken on federal, state, and foreign tax returns for all open tax years and does not believe that there are any uncertain tax positions that require recognition of a tax liability.
Class allocations
The separate classes of shares offered by the Fund differ principally in applicable sales charges, distribution, shareholder servicing, and administration fees. Class specific expenses are charged directly to that share class. Investment income, common expenses, and realized and unrealized gains (losses) on investments are allocated daily to each class of shares based on the relative proportion of net assets of each class.
3. FAIR VALUATION MEASUREMENTS
Fair value measurements of investments are determined within a framework that has established a fair value hierarchy based upon the various data inputs utilized in determining the value of the Fund’s investments. The three-level hierarchy gives the highest priority to unadjusted quoted prices in active markets for identical assets or liabilities (Level 1) and the lowest priority to significant unobservable inputs (Level 3). The Fund’s investments are classified within the fair value hierarchy based on the lowest level of input that is significant to the fair value measurement. The inputs are summarized into three broad levels as follows:
| | | | |
| 24 | | Wells Fargo Advantage Ultra Short-Term Municipal Income Fund | | Notes to financial statements (unaudited) |
| n | | Level 1 – quoted prices in active markets for identical securities |
| n | | Level 2 – other significant observable inputs (including quoted prices for similar securities, interest rates, prepayment speeds, credit risk, use of amortized cost, etc.) |
| n | | Level 3 – significant unobservable inputs (including the Fund’s own assumptions in determining the fair value of investments) |
The inputs or methodologies used for valuing investments in securities are not necessarily an indication of the risk associated with investing in those securities.
The following is a summary of the inputs used in valuing the Fund’s assets and liabilities as of December 31, 2014:
| | | | | | | | | | | | | | | | |
| | | Quoted prices
(Level 1) | | | Other significant
observable inputs
(Level 2) | | | Significant
unobservable inputs
(Level 3) | | | Total | |
Assets | | | | | | | | | | | | | | | | |
Investments in: | | | | | | | | | | | | | | | | |
| | | | |
Agency securities | | $ | 0 | | | $ | 9,881,250 | | | $ | 0 | | | $ | 9,881,250 | |
| | | | |
Municipal obligations | | | 0 | | | | 6,057,485,491 | | | | 107,452,625 | | | | 6,164,938,116 | |
| | | | |
Other | | | 0 | | | | 55,005,130 | | | | 0 | | | | 55,005,130 | |
| | | | |
Short-term investments | | | | | | | | | | | | | | | | |
Investment companies | | | 115,629,459 | | | | 0 | | | | 0 | | | | 115,629,459 | |
U.S. Treasury securities | | | 399,985 | | | | 0 | | | | 0 | | | | 399,985 | |
Total assets | | $ | 116,029,444 | | | $ | 6,122,371,871 | | | $ | 107,452,625 | | | $ | 6,345,853,940 | |
Liabilities | | | | | | | | | | | | | | | | |
| | | | |
Futures contracts | | $ | 37,499 | | | $ | 0 | | | $ | 0 | | | $ | 37,499 | |
Total liabilities | | $ | 37,499 | | | $ | 0 | | | $ | 0 | | | $ | 37,499 | |
Futures contracts are reported at their variation margin at measurement date, which represents the amount due from the Fund at that date. All other assets and liabilities are reported at their market value at measurement date.
Transfers in and transfers out are recognized at the end of the reporting period. At December 31, 2014, the Fund did not have any transfers between Level 1 and Level 2.
The following is a reconciliation of assets in which significant unobservable inputs (Level 3) were used in determining fair value:
| | | | |
| | | Municipal
obligations | |
Balance as of June 30, 2014 | | $ | 108,747,688 | |
Accrued discounts (premiums) | | | 260,434 | |
Realized gains (losses) | | | 23,006 | |
Change in unrealized gains (losses) | | | (278,503 | ) |
Purchases | | | 0 | |
Sales | | | (1,300,000 | ) |
Transfers into Level 3 | | | 0 | |
Transfers out of Level 3 | | | 0 | |
Balance as of December 31, 2014 | | $ | 107,452,625 | |
Change in unrealized gains (losses) relating to securities still held at December 31, 2014 | | $ | (312,167 | ) |
The investment type categorized above was valued using indicative broker quotes. These indicative broker quotes are considered Level 3 inputs. Quantitative unobservable inputs used by the brokers are often proprietary and not provided to the Fund and therefore the disclosure that would address these inputs is not included above.
| | | | | | |
| Notes to financial statements (unaudited) | | Wells Fargo Advantage Ultra Short-Term Municipal Income Fund | | | 25 | |
4. TRANSACTIONS WITH AFFILIATES
Advisory fee
The Trust has entered into an advisory contract with Funds Management, an indirect wholly owned subsidiary of Wells Fargo & Company (“Wells Fargo”). The adviser is responsible for implementing investment policies and guidelines and for supervising the subadviser, who is responsible for day-to-day portfolio management of the Fund.
Pursuant to the contract, Funds Management is entitled to receive an annual advisory fee starting at 0.30% and declining to 0.225% as the average daily net assets of the Fund increase. For the six months ended December 31, 2014, the advisory fee was equivalent to an annual rate of 0.28% of the Fund’s average daily net assets.
Funds Management has retained the services of a subadviser to provide daily portfolio management to the Fund. The fee for subadvisory services is borne by Funds Management. Wells Capital Management Incorporated, an affiliate of Funds Management and an indirect wholly owned subsidiary of Wells Fargo, is the subadviser to the Fund and is entitled to receive a fee from Funds Management at an annual rate starting at 0.15% and declining to 0.05% as the average daily net assets of the Fund increase.
Administration fees
The Trust has entered into an administration agreement with Funds Management. Under this agreement, for providing administrative services, which includes paying fees and expenses for services provided by the transfer agent, sub-transfer agents, omnibus account servicers and record-keepers, Funds Management is entitled to receive from the Fund an annual fund level administration fee starting at 0.05% and declining to 0.03% as the average daily net assets of the Fund increase and a class level administration fee which is calculated based on the average daily net assets of each class as follows:
| | | | |
| | | Class level
administration fee | |
Class A, Class C | | | 0.16 | % |
Administrator Class | | | 0.10 | |
Institutional Class | | | 0.08 | |
Investor Class | | | 0.19 | |
Funds Management has contractually waived and/or reimbursed advisory and administration fees to the extent necessary to maintain certain net operating expense ratios for the Fund. Waiver of fees and/or reimbursement of expenses by Funds Management were made first from fund level expenses on a proportionate basis and then from class specific expenses. Funds Management has committed through October 31, 2015 to waive fees and/or reimburse expenses to the extent necessary to cap the Fund’s expenses at 0.67% for Class A shares, 1.42% for Class C shares, 0.60% for Administrator Class shares, 0.37% for Institutional Class shares and 0.70% for Investor Class shares. After this time, the cap may be increased or the commitment to maintain the cap may be terminated only with the approval of the Board of Trustees.
Distribution fee
The Trust has adopted a Distribution Plan for Class C shares of the Fund pursuant to Rule 12b-1 under the 1940 Act. A distribution fee is charged to Class C shares and paid to Wells Fargo Funds Distributor, LLC (“Funds Distributor”), the principal underwriter, at an annual rate of 0.75% of the average daily net assets of Class C shares.
In addition, Funds Distributor is entitled to receive the front-end sales charge from the purchase of Class A shares and a contingent deferred sales charge on the redemption of certain shares. Funds Distributor is also entitled to receive the contingent deferred sales charges from redemptions of Class C shares. For the six months ended December 31, 2014, Funds Distributor received $1,323 from the sale of Class A shares.
Shareholder servicing fees
The Trust has entered into contracts with one or more shareholder servicing agents, whereby Class A, Class C, Administrator Class, and Investor Class of the Fund is charged a fee at an annual rate of 0.25% of the average daily net assets of each respective class.
A portion of these total shareholder servicing fees were paid to affiliates of Wells Fargo.
5. INVESTMENT PORTFOLIO TRANSACTIONS
Purchases and sales of investments, excluding U.S. government obligations (if any) and short-term securities, for the six months ended December 31, 2014 were $1,694,808,485 and $876,179,171, respectively.
| | | | |
| 26 | | Wells Fargo Advantage Ultra Short-Term Municipal Income Fund | | Notes to financial statements (unaudited) |
6. DERIVATIVE TRANSACTIONS
During the six months ended December 31, 2014, the Fund entered into futures contracts for to take advantage of the differences between municipal and treasury yields and to help manage the duration of the portfolio.
At December 31, 2014, the Fund had short futures contracts outstanding as follows:
| | | | | | | | | | | | | | | | |
| Expiration date | | Counterparty | | Contracts | | Type | | | Contract
value at December 31, 2014 | | | Unrealized
losses | |
3/31/2015 | | JPMorgan | | 800 Short | | | 2 Year U.S Treasury Notes | | | $ | 174,875,000 | | | $ | (70,270 | ) |
At December 31, 2014, the Fund had an average notional amount of $2,374,911 in futures contracts during the six months ended December 31, 2014.
On December 31, 2014, the cumulative unrealized losses on futures contracts in the amount of $70,270 are reflected in net unrealized gains on investments on the Statement of Assets and Liabilities. The payable for daily variation margin on open futures contracts reflected in the Statement of Assets and Liabilities only represents the current day’s variation margin. The change in unrealized gains (losses) on futures contracts are reflected in the Statement of Operations.
For certain types of derivative transactions, the Fund has entered into International Swaps and Derivatives Association, Inc. master agreements (“ISDA Master Agreements”) or similar agreements with approved counterparties. The ISDA Master Agreements or similar agreements may have requirements to deliver/deposit securities or cash to/with an exchange or broker-dealer as collateral and allows the Fund to offset, with each counterparty, certain derivative financial instrument’s assets and/or liabilities with collateral held or pledged. Collateral requirements differ by type of derivative. Collateral or margin requirements are set by the broker or exchange clearing house for exchange traded derivatives while collateral terms are contract specific for over-the-counter traded derivatives. Cash collateral that has been pledged to cover obligations of the Fund under ISDA Master Agreements or similar agreements, if any, will be reported separately in the Statement of Assets and Liabilities. Securities pledged as collateral, if any, for the same purpose are noted in the Portfolio of Investments. With respect to balance sheet offsetting, absent an event of default by the counterparty or a termination of the agreement, the reported amounts of financial assets and financial liabilities in the Statement of Assets and Liabilities are not offset across transactions between the Fund and the applicable counterparty. A reconciliation of the gross amounts on the Statement of Assets and Liabilities to the net amounts by derivative type, including any collateral exposure, is as follows:
| | | | | | | | | | | | | | | | |
| Derivative type | | Counterparty | | Gross amounts
of liabilities in the
Statement of
Assets and
Liabilities | | Amounts
subject to
netting
agreements | | | Collateral
received1 | | | Net amount
of liabilities | |
Futures – variation margin | | JPMorgan | | $37,499 | | $ | 0 | | | $ | (37,499 | ) | | $ | 0 | |
| | 1. | Collateral pledged within this table is limited to the collateral for the net transaction with the counterparty | |
7. BANK BORROWINGS
The Trust (excluding the money market funds and certain other funds in the Trust) and Wells Fargo Variable Trust are parties to a $150,000,000 revolving credit agreement, whereby the Fund is permitted to use bank borrowings for temporary or emergency purposes, such as to fund shareholder redemption requests. Interest under the credit agreement is charged to the Fund based on a borrowing rate equal to the higher of the Federal Funds rate in effect on that day plus 1.25% or the overnight LIBOR rate in effect on that day plus 1.25%. In addition, an annual commitment fee equal to 0.10% of the unused balance is allocated to each participating fund. For the six months ended December 31, 2014, the Fund paid $3,359 in commitment fees.
For the six months ended December 31, 2014, there were no borrowings by the Fund under the agreement.
8. INDEMNIFICATION
Under the Trust’s organizational documents, the officers and Trustees are indemnified against certain liabilities that may arise out of performance of their duties to the Trust. Additionally, in the normal course of business, the Trust may enter into contracts with service providers that contain a variety of indemnification clauses. The Trust’s maximum exposure under these arrangements is dependent on future claims that may be made against the Fund and, therefore, cannot be estimated.
| | | | | | |
| Other information (unaudited) | | Wells Fargo Advantage Ultra Short-Term Municipal Income Fund | | | 27 | |
PROXY VOTING INFORMATION
A description of the policies and procedures that the Fund uses to determine how to vote proxies relating to portfolio securities is available without charge, upon request, by calling 1-800-222-8222, visiting our website at wellsfargoadvantagefunds.com, or visiting the SEC website at sec.gov. Information regarding how the Fund voted proxies relating to portfolio securities during the most recent 12-month period ended June 30 is available on the Fund’s website at wellsfargoadvantagefunds.com or by visiting the SEC website at sec.gov.
PORTFOLIO HOLDINGS INFORMATION
The complete portfolio holdings for the Fund are publicly available monthly on the Fund’s website (wellsfargoadvantagefunds.com), on a one-month delayed basis. In addition, top ten holdings information (excluding derivative positions) for the Fund is publicly available on the Fund’s website on a monthly, seven-day or more delayed basis. The Fund files its complete schedule of portfolio holdings with the SEC for the first and third quarters of each fiscal year on Form N-Q, which is available by visiting the SEC website at sec.gov. In addition, the Fund’s Form N-Q may be reviewed and copied at the SEC’s Public Reference Room in Washington, DC, and at regional offices in New York City, at 233 Broadway, and in Chicago, at 175 West Jackson Boulevard, Suite 900. Information about the Public Reference Room may be obtained by calling 1-800-SEC-0330.
| | | | |
| 28 | | Wells Fargo Advantage Ultra Short-Term Municipal Income Fund | | Other information (unaudited) |
BOARD OF TRUSTEES AND OFFICERS
Each of the Trustees and Officers1 listed in the table below acts in identical capacities for each fund in the Wells Fargo Advantage family of funds, which consists of 134 mutual funds comprising the Wells Fargo Funds Trust, Wells Fargo Variable Trust, Wells Fargo Master Trust and four closed-end funds (collectively the “Fund Complex”). This table should be read in conjunction with the Prospectus and the Statement of Additional Information2. The mailing address of each Trustee and Officer is 525 Market Street, 12th Floor, San Francisco, CA 94105. Each Trustee and Officer serves an indefinite term, however, each Trustee serves such term until reaching the mandatory retirement age established by the Trustees.
Independent Trustees
| | | | | | |
Name and year of birth | | Position held and length of service* | | Principal occupations during past five years or longer | | Other directorships during past five years |
Peter G. Gordon (Born 1942) | | Trustee, since 1998; Chairman, since 2005 | | Co-Founder, Retired Chairman, President and CEO of Crystal Geyser Water Company. Trustee Emeritus, Colby College. | | Asset Allocation Trust |
Isaiah Harris, Jr. (Born 1952) | | Trustee, since 2009 | | Retired. Prior thereto, President and CEO of BellSouth Advertising and Publishing Corp. from 2005 to 2007, President and CEO of BellSouth Enterprises from 2004 to 2005 and President of BellSouth Consumer Services from 2000 to 2003. Emeritus member of the Iowa State University Foundation Board of Governors. Emeritus Member of the Advisory Board of Iowa State University School of Business. Advisory Board Member, Palm Harbor Academy. Mr. Harris is a certified public accountant. | | CIGNA Corporation; Asset Allocation Trust |
Judith M. Johnson (Born 1949) | | Trustee, since 2008; Audit Committee Chairman, since 2008 | | Retired. Prior thereto, Chief Executive Officer and Chief Investment Officer of Minneapolis Employees Retirement Fund from 1996 to 2008. Ms. Johnson is an attorney, certified public accountant and a certified managerial accountant. | | Asset Allocation Trust |
Leroy Keith, Jr. (Born 1939) | | Trustee, since 2010** | | Chairman, Bloc Global Services (development and construction). Trustee of the Evergreen Funds complex (and its predecessors) from 1983 to 2010. Former Managing Director, Almanac Capital Management (commodities firm), former Partner, Stonington Partners, Inc. (private equity fund), former Director, Obagi Medical Products Co. and former Director, Lincoln Educational Services. | | Trustee, Virtus Fund Complex (consisting of 50 portfolios as of 12/16/2013); Asset Allocation Trust |
David F. Larcker (Born 1950) | | Trustee, since 2009 | | James Irvin Miller Professor of Accounting at the Graduate School of Business, Stanford University, Morgan Stanley Director of the Center for Leadership Development and Research and Senior Faculty of The Rock Center for Corporate Governance since 2006. From 2005 to 2008, Professor of Accounting at the Graduate School of Business, Stanford University. Prior thereto, Ernst & Young Professor of Accounting at The Wharton School, University of Pennsylvania from 1985 to 2005. | | Asset Allocation Trust |
Olivia S. Mitchell (Born 1953) | | Trustee, since 2006 | | International Foundation of Employee Benefit Plans Professor, Wharton School of the University of Pennsylvania since 1993. Director of Wharton’s Pension Research Council and Boettner Center on Pensions & Retirement Research, and Research Associate at the National Bureau of Economic Research. Previously, Cornell University Professor from 1978 to 1993. | | Asset Allocation Trust |
Timothy J. Penny (Born 1951) | | Trustee, since 1996 | | President and CEO of Southern Minnesota Initiative Foundation, a non-profit organization, since 2007 and Senior Fellow at the Humphrey Institute Policy Forum at the University of Minnesota since 1995. Member of the Board of Trustees of NorthStar Education Finance, Inc., a non-profit organization, since 2007. | | Asset Allocation Trust |
| | | | | | |
| Other information (unaudited) | | Wells Fargo Advantage Ultra Short-Term Municipal Income Fund | | | 29 | |
| | | | | | |
Name and year of birth | | Position held and length of service* | | Principal occupations during past five years or longer | | Other directorships during past five years |
Michael S. Scofield (Born 1943) | | Trustee, since 2010 | | Served on the Investment Company Institute’s Board of Governors and Executive Committee from 2008-2011 as well the Governing Council of the Independent Directors Council from 2006-2011 and the Independent Directors Council Executive Committee from 2008-2011. Chairman of the IDC from 2008-2010. Institutional Investor (Fund Directions) Trustee of Year in 2007. Trustee of the Evergreen Funds complex (and its predecessors) from 1984 to 2010. Chairman of the Evergreen Funds from 2000-2010. Former Trustee of the Mentor Funds. Retired Attorney, Law Offices of Michael S. Scofield. | | Asset Allocation Trust |
Donald C. Willeke (Born 1940) | | Trustee, since 1996 | | Principal of the law firm of Willeke & Daniels. General Counsel of the Minneapolis Employees Retirement Fund from 1984 until its consolidation into the Minnesota Public Employees Retirement Association on June 30, 2010. Director and Vice Chair of The Tree Trust (non-profit corporation). Director of the American Chestnut Foundation (non-profit corporation). | | Asset Allocation Trust |
| * | Length of service dates reflect the Trustee’s commencement of service with the Trust’s predecessor entities, where applicable. |
| ** | Leroy Keith, Jr. retired as a Trustee effective December 31, 2014. |
Officers
| | | | | | |
Name and year of birth | | Position held and length of service | | Principal occupations during past five years or longer | | |
Karla M. Rabusch (Born 1959) | | President, since 2003 | | Executive Vice President of Wells Fargo Bank, N.A. and President of Wells Fargo Funds Management, LLC since 2003. | | |
Nancy Wiser1 (Born 1967) | | Treasurer, since 2012 | | Executive Vice President of Wells Fargo Funds Management, LLC since 2011. Chief Operating Officer and Chief Compliance Officer at LightBox Capital Management LLC, from 2008 to 2011. Owned and operated a consulting business providing services to various hedge funds including acting as Chief Operating Officer and Chief Compliance Officer for a hedge fund from 2007 to 2008. Chief Operating Officer and Chief Compliance Officer of GMN Capital LLC from 2006 to 2007. | | |
C. David Messman (Born 1960) | | Secretary, since 2000; Chief Legal Officer, since 2003 | | Assistant General Counsel of Wells Fargo Bank, N.A. since 2013 and Vice President and Managing Counsel of Wells Fargo Bank N.A. from 1996 to 2013. Senior Vice President and Secretary of Wells Fargo Funds Management , LLC since 2001. | | |
Debra Ann Early (Born 1964) | | Chief Compliance Officer, since 2007 | | Senior Vice President of Wells Fargo Funds Management, LLC since 2007 and Chief Compliance Officer from 2007 to 2014. Chief Compliance Officer of Parnassus Investments from 2005 to 2007. Chief Financial Officer of Parnassus Investments from 2004 to 2007 and Senior Audit Manager of PricewaterhouseCoopers LLP from 1998 to 2004. | | |
David Berardi (Born 1975) | | Assistant Treasurer, since 2009 | | Vice President of Wells Fargo Funds Management, LLC since 2009. Vice President of Evergreen Investment Management Company, LLC from 2008 to 2010. Assistant Vice President of Evergreen Investment Services, Inc. from 2004 to 2008. Manager of Fund Reporting and Control for Evergreen Investment Management Company, LLC from 2004 to 2010. | | |
Jeremy DePalma1 (Born 1974) | | Assistant Treasurer, since 2009 | | Senior Vice President of Wells Fargo Funds Management, LLC since 2009. Senior Vice President of Evergreen Investment Management Company, LLC from 2008 to 2010. Vice President, Evergreen Investment Services, Inc. from 2004 to 2007. Head of the Fund Reporting and Control Team within Fund Administration from 2005 to 2010. | | |
| 1. | Nancy Wiser acts as Treasurer of 73 funds in the Fund Complex. Jeremy DePalma acts as Treasurer of 61 funds and Assistant Treasurer of 73 funds in the Fund Complex. |
| 2. | The Statement of Additional Information includes additional information about the Trustees and is available, without charge, upon request, by calling 1-800-222-8222 or by visiting the website at wellsfargoadvantagefunds.com. |
| | | | | | |
| List of abbreviations | | Wells Fargo Advantage Ultra Short-Term Municipal Income Fund | | | 30 | |
The following is a list of common abbreviations for terms and entities that may have appeared in this report.
| ACA | — ACA Financial Guaranty Corporation |
| ADR | — American depositary receipt |
| ADS | — American depositary shares |
| AGC | — Assured Guaranty Corporation |
| AGM | — Assured Guaranty Municipal |
| Ambac | — Ambac Financial Group Incorporated |
| AMT | — Alternative minimum tax |
| BAN | — Bond anticipation notes |
| BHAC | — Berkshire Hathaway Assurance Corporation |
| CAB | — Capital appreciation bond |
| CCAB | — Convertible capital appreciation bond |
| CDA | — Community Development Authority |
| CDO | — Collateralized debt obligation |
| DRIVER | — Derivative inverse tax-exempt receipts |
| DW&P | — Department of Water & Power |
| DWR | — Department of Water Resources |
| ECFA | — Educational & Cultural Facilities Authority |
| EDA | — Economic Development Authority |
| EDFA | — Economic Development Finance Authority |
| ETF | — Exchange-traded fund |
| FDIC | — Federal Deposit Insurance Corporation |
| FFCB | — Federal Farm Credit Banks |
| FGIC | — Financial Guaranty Insurance Corporation |
| FHA | — Federal Housing Administration |
| FHLB | — Federal Home Loan Bank |
| FHLMC | — Federal Home Loan Mortgage Corporation |
| FICO | — The Financing Corporation |
| FNMA | — Federal National Mortgage Association |
| GDR | — Global depositary receipt |
| GNMA | — Government National Mortgage Association |
| HCFR | — Healthcare facilities revenue |
| HEFA | — Health & Educational Facilities Authority |
| HEFAR | — Higher education facilities authority revenue |
| HFA | — Housing Finance Authority |
| HFFA | — Health Facilities Financing Authority |
| HUD | — Department of Housing and Urban Development |
| IDA | — Industrial Development Authority |
| IDAG | — Industrial Development Agency |
| KRW | — Republic of Korea won |
| LIBOR | — London Interbank Offered Rate |
| LIFERS | — Long Inverse Floating Exempt Receipts |
| LLC | — Limited liability company |
| LLLP | — Limited liability limited partnership |
| LLP | — Limited liability partnership |
| MBIA | — Municipal Bond Insurance Association |
| MFHR | — Multifamily housing revenue |
| MSTR | — Municipal securities trust receipts |
| MUD | — Municipal Utility District |
| National | — National Public Finance Guarantee Corporation |
| PCFA | — Pollution Control Financing Authority |
| PCL | — Public Company Limited |
| PCR | — Pollution control revenue |
| PFA | — Public Finance Authority |
| PFFA | — Public Facilities Financing Authority |
| PFOTER | — Puttable floating option tax-exempt receipts |
| plc | — Public limited company |
| PUTTER | — Puttable tax-exempt receipts |
| R&D | — Research & development |
| Radian | — Radian Asset Assurance |
| RAN | — Revenue anticipation notes |
| RDA | — Redevelopment Authority |
| RDFA | — Redevelopment Finance Authority |
| REIT | — Real estate investment trust |
| ROC | — Reset option certificates |
| SAVRS | — Select auction variable rate securities |
| SBA | — Small Business Authority |
| SFHR | — Single-family housing revenue |
| SFMR | — Single-family mortgage revenue |
| SPA | — Standby purchase agreement |
| SPDR | — Standard & Poor’s Depositary Receipts |
| SPEARs | — Short Puttable Exempt Adjustable Receipts |
| STRIPS | — Separate trading of registered interest and |
| TAN | — Tax anticipation notes |
| TIPS | — Treasury inflation-protected securities |
| TRAN | — Tax revenue anticipation notes |
| TTFA | — Transportation Trust Fund Authority |
| TVA | — Tennessee Valley Authority |
This page is intentionally left blank.
This page is intentionally left blank.


For more information
More information about Wells Fargo Advantage Funds is available free upon request. To obtain literature, please write, email, visit the Fund’s website, or call:
Wells Fargo Advantage Funds
P.O. Box 8266
Boston, MA 02266-8266
Email: wfaf@wellsfargo.com
Website: wellsfargoadvantagefunds.com
Individual investors: 1-800-222-8222
Retail investment professionals: 1-888-877-9275
Institutional investment professionals: 1-866-765-0778
This report and the financial statements contained herein are submitted for the general information of the shareholders of Wells Fargo Advantage Funds. If this report is used for promotional purposes, distribution of the report must be accompanied or preceded by a current prospectus. Before investing, please consider the investment objectives, risks, charges, and expenses of the investment. For a current prospectus and, if available, a summary prospectus, containing this information, call 1-800-222-8222 or visit the Fund’s website at wellsfargoadvantagefunds.com. Read the prospectus carefully before you invest or send money.
Wells Fargo Funds Management, LLC, a wholly owned subsidiary of Wells Fargo & Company, provides investment advisory and administrative services for Wells Fargo Advantage Funds. Other affiliates of Wells Fargo & Company provide subadvisory and other services for the Funds. The Funds are distributed by Wells Fargo Funds Distributor, LLC, Member FINRA/SIPC, an affiliate of Wells Fargo & Company.
NOT FDIC INSURED ¡ NO BANK GUARANTEE ¡ MAY LOSE VALUE
© 2014 Wells Fargo Funds Management, LLC. All rights reserved.
| | |
 | | 230432 02-15 SA258/SAR258 12-14 |

Wells Fargo Advantage Wisconsin Tax-Free Fund

Semi-Annual Report
December 31, 2014

Reduce clutter. Save trees.
Sign up for electronic delivery of prospectuses and shareholder reports at wellsfargo.com/advantagedelivery
Contents
The views expressed and any forward-looking statements are as of December 31, 2014, unless otherwise noted, and are those of the Fund managers and/or Wells Fargo Funds Management, LLC. Discussions of individual securities, or the markets generally, or any Wells Fargo Advantage Fund are not intended as individual recommendations. Future events or results may vary significantly from those expressed in any forward-looking statements; the views expressed are subject to change at any time in response to changing circumstances in the market. Wells Fargo Funds Management, LLC and the Fund disclaim any obligation to publicly update or revise any views expressed or forward-looking statements.
NOT FDIC INSURED ¡ NO BANK GUARANTEE ¡ MAY LOSE VALUE
| | | | |
| 2 | | Wells Fargo Advantage Wisconsin Tax-Free Fund | | Letter to shareholders (unaudited) |

Karla M. Rabusch
President
Wells Fargo Advantage Funds
Municipal bonds rose in the second half of 2014, helped by lower interest rates and strong demand for yield.
Dear Valued Shareholder:
We are pleased to provide you with this semi-annual report for the Wells Fargo Advantage Wisconsin Tax-Free Fund for the six-month period that ended December 31, 2014. Municipal bonds rose in the second half of 2014, helped by lower interest rates and strong demand for yield. In fact, the longest-dated and weakest credits had the strongest returns. Municipal bond returns—as measured by the Barclays Municipal Bond Index1, the broadest measure for tracking investment-grade municipal bonds throughout the country—gained 2.88% for the six-month period that ended December 31, 2014.
Longer-maturity and lower-rated municipal bonds outperformed.
At the front end of the yield curve, municipal bond yields were extremely low because of the accommodative monetary policy. Throughout the reporting period, the U.S. Federal Reserve’s (Fed’s) monetary policymaking body kept its key interest rate near zero in order to support the economy and the financial system. Policymakers said they can be patient in normalizing monetary policy and that any increases in the target range for the federal funds rate will depend on incoming economic data. During the reporting period, the Fed reduced (or tapered) the size of its quantitative easing program each month until the program ended in October 2014, although it continues to reinvest principal and interest payments of the mortgage-backed securities and Treasury bonds it holds.
Longer-term yields declined during the second half of the year, with 10-year municipal yields declining from 2.33% as of June 30, 2014 to 2.10% as of December 31, 2014. For more perspective, the yield curve was steep on a historical basis at the beginning of the period and ended the period with the difference between 30-year and 2-year yields at 237 basis points (bps; 100 bps equals 1.00%), which was only slightly wider than its historical average. Because the yield curve was steep, longer-dated securities had higher yields. Given their longer maturities (as municipal yields fell further out the curve) and their more generous yields, longer-term bond returns outpaced shorter-term bonds.
Investors were also enticed to buy lower-rated securities for their higher yields. Over the six-month period that ended December 31, 2014, AAA-rated municipal bonds returned 2.04% while BBB-rated bonds returned 4.29%, according to the Barclays Municipal Bond Index. Credit conditions continued to improve, as evidenced by an 18th consecutive quarter of positive year-over-year gains in state and local municipal revenues. In addition to better fundamental credit conditions, technical factors of limited supply alongside strong investor demand also supported municipal bonds.
Puerto Rico’s struggle, the exit of two cities from bankruptcy, and pension issues topped credit news.
Puerto Rico was the asset class’s largest single credit story. Bonds from the commonwealth returned a meager 0.79% during the six-month period as population declines, a contracting economy, and a burdensome level of debt held back results. Meanwhile, the cities of Stockton, California, and Detroit, Michigan, exited bankruptcy by curbing retiree health care benefits and bondholder recoveries but largely avoiding concessions on pensions. While these recent bankruptcies have so far treated pensions better than bonded debt, no clear precedent has been established due to the difference in general obligation
| 1. | The Barclays Municipal Bond Index is an unmanaged index composed of long-term tax-exempt bonds with a minimum credit rating of Baa. You cannot invest directly in an index. |
| | | | | | |
| Letter to shareholders (unaudited) | | Wells Fargo Advantage Wisconsin Tax-Free Fund | | | 3 | |
pledges and court-ordered versus negotiated concessions. Finally, underfunded pensions in Illinois, New Jersey, Pennsylvania, and Kansas gained attention for their negative fiscal effects and the political difficulties of finding a resolution.
Don’t let short-term uncertainty derail long-term investment goals.
Periods of uncertainty can present challenges, but experience has taught us that maintaining long-term investment goals can be an effective way to plan for the future. To help you create a sound strategy based on your personal goals and risk tolerance, Wells Fargo Advantage Funds offers more than 100 mutual funds and other investments spanning a wide range of asset classes and investment styles. Although diversification cannot guarantee an investment profit or prevent losses, we believe it can be an effective way to manage investment risk and potentially smooth out overall portfolio performance. We encourage investors to know their investments and to understand that appropriate levels of risk-taking may unlock opportunities.
Thank you for choosing to invest with Wells Fargo Advantage Funds. We appreciate your confidence in us and remain committed to helping you meet your financial needs. For current information about your fund investments, contact your investment professional, visit our website at wellsfargoadvantagefunds.com, or call us directly at 1-800-222-8222. We are available 24 hours a day, 7 days a week.
Sincerely,

Karla M. Rabusch
President
Wells Fargo Advantage Funds
Periods of uncertainty can present challenges, but experience has taught us that maintaining long-term investment goals can be an effective way to plan for the future.
| | | | |
| 4 | | Wells Fargo Advantage Wisconsin Tax-Free Fund | | Performance highlights (unaudited) |
Investment objective
The Fund seeks current income exempt from federal income tax and Wisconsin individual income tax.
Adviser
Wells Fargo Funds Management, LLC
Subadviser
Wells Capital Management Incorporated
Portfolio managers
Lyle J. Fitterer, CFA, CPA
Thomas Stoeckmann
Average annual total returns1 (%) as of December 31, 2014
| | | | | | | | | | | | | | | | | | | | | | | | | | | | | | | | | | |
| | | | | Including sales charge | | | Excluding sales charge | | | Expense ratios2 (%) | |
| | | Inception date | | 1 year | | | 5 year | | | 10 year | | | 1 year | | | 5 year | | | 10 year | | | Gross | | | Net3 | |
| Class A (WWTFX) | | 3-31-2008 | | | 2.13 | | | | 3.14 | | | | 3.54 | | | | 6.95 | | | | 4.10 | | | | 4.02 | | | | 0.92 | | | | 0.70 | |
| Class C (WWCTX) | | 12-26-2002 | | | 5.15 | | | | 3.31 | | | | 3.23 | | | | 6.15 | | | | 3.31 | | | | 3.23 | | | | 1.67 | | | | 1.45 | |
| Investor Class (SWFRX) | | 4-6-2001 | | | – | | | | – | | | | – | | | | 6.92 | | | | 4.07 | | | | 4.00 | | | | 0.95 | | | | 0.73 | |
| Barclays Municipal Bond Index4 | | – | | | – | | | | – | | | | – | | | | 9.05 | | | | 5.16 | | | | 4.74 | | | | – | | | | – | |
| Barclays Wisconsin Municipal Bond Index5 | | – | | | – | | | | – | | | | – | | | | 8.10 | | | | 4.75 | | | | 4.92 | | | | – | | | | – | |
Figures quoted represent past performance, which is no guarantee of future results, and do not reflect taxes that a shareholder may pay on fund distributions or the redemption of fund shares. Investment return and principal value of an investment will fluctuate so that an investor’s shares, when redeemed, may be worth more or less than their original cost. Performance shown without sales charges would be lower if sales charges were reflected. Current performance may be lower or higher than the performance data quoted, which assumes the reinvestment of dividends and capital gains. Current month-end performance is available on the Fund’s website, wellsfargoadvantagefunds.com.
Index returns do not include transaction costs associated with buying and selling securities, any mutual fund fees or expenses, or any taxes. It is not possible to invest directly in an index.
For Class A shares, the maximum front-end sales charge is 4.50%. For Class C shares, the maximum contingent deferred sales charge is 1.00%. Performance including a contingent deferred sales charge assumes the sales charge for the corresponding time period. Investor Class shares are sold without a front-end sales charge or contingent deferred sales charge.
Bond values fluctuate in response to the financial condition of individual issuers, general market and economic conditions, and changes in interest rates. Changes in market conditions and government policies may lead to periods of heightened volatility in the bond market and reduced liquidity for certain bonds held by the Fund. In general, when interest rates rise, bond values fall and investors may lose principal value. Interest-rate changes and their impact on the Fund and its share price can be sudden and unpredictable. The use of derivatives may reduce returns and/or increase volatility. Certain investment strategies tend to increase the total risk of an investment (relative to the broader market). The Fund is exposed to Wisconsin and Puerto Rico municipal securities risk and high-yield securities risk. Consult the Fund’s prospectus for additional information on these and other risks. A portion of the Fund’s income may be subject to federal, state, and/or local income taxes or the Alternative Minimum Tax (AMT). Any capital gains distributions may be taxable.
Please see footnotes on page 5.
| | | | | | |
| Performance highlights (unaudited) | | Wells Fargo Advantage Wisconsin Tax-Free Fund | | | 5 | |
|
| Credit quality distribution6 as of December 31, 2014 |
|
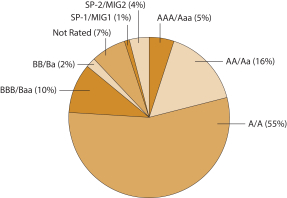 |
|
| Effective maturity distribution7 as of December 31, 2014 |
|
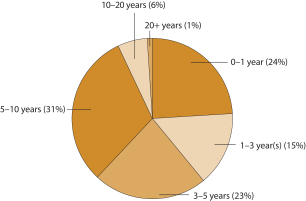 |
| 1. | Historical performance shown for Class A shares prior to their inception reflects the performance of Investor Class shares, and includes the higher expenses applicable to the Investor Class shares (except during those periods in which expenses of Class A shares would have been higher than those of Investor Class shares, no such adjustment is reflected). If these expenses had not been included, returns would be higher. |
| 2. | Reflects the expense ratios as stated in the most recent prospectuses. The expense ratios shown are subject to change and may differ from the annualized expense ratios shown in the financial highlights of this report. |
| 3. | The Adviser has committed through October 31, 2015, to waive fees and/or reimburse expenses to the extent necessary to cap the Fund’s Total Annual Fund Operating Expenses After Fee Waiver, excluding certain expenses, at the amounts shown. After this time, the cap may be increased or the commitment to maintain the cap may be terminated only with the approval of the Board of Trustees. Brokerage commissions, stamp duty fees, interest, taxes, acquired fund fees and expenses, and extraordinary expenses are excluded from the cap. Without this cap, the Fund’s returns would have been lower. |
| 4. | The Barclays Municipal Bond Index is an unmanaged index composed of long-term tax-exempt bonds with a minimum credit rating of Baa. You cannot invest directly in an index. |
| 5. | The Barclays Wisconsin Municipal Bond Index is the Wisconsin component of the Barclays Municipal Bond Index. You cannot invest directly in an index. |
| 6. | The credit quality distribution of portfolio holdings reflected in the chart is based on ratings from Standard & Poor’s, Moody’s Investors Service, and/or Fitch Ratings Ltd. Credit quality ratings apply to the underlying holdings of the Fund and not to the Fund itself. The percentages of the Fund’s portfolio with the ratings depicted in the chart are calculated based on the total market value of fixed income securities held by the Fund. If a security was rated by all three rating agencies, the middle rating was utilized. If rated by two of three rating agencies, the lower rating was utilized, and if rated by one of the rating agencies, that rating was utilized. Standard & Poor’s rates the creditworthiness of bonds, ranging from AAA (highest) to D (lowest). Ratings from A to CCC may be modified by the addition of a plus (+) or minus (-) sign to show relative standing within the rating categories. Standard & Poor’s rates the creditworthiness of short-term notes from SP-1 (highest) to SP-3 (lowest). Moody’s rates the creditworthiness of bonds, ranging from Aaa (highest) to C (lowest). Ratings Aa to B may be modified by the addition of a number 1 (highest) to 3 (lowest) to show relative standing within the ratings categories. Moody’s rates the creditworthiness of short-term U.S. tax-exempt municipal securities from MIG 1/VMIG 1 (highest) to SG (lowest). Fitch rates the creditworthiness of bonds, ranging from AAA (highest) to D (lowest). Credit quality and credit quality ratings are subject to change and may have changed since the date specified. |
| 7. | Effective maturity distribution is calculated based on the total long-term investments of the Fund. It is subject to change and may have changed since the date specified. |
| | | | |
| 6 | | Wells Fargo Advantage Wisconsin Tax-Free Fund | | Fund expenses (unaudited) |
As a shareholder of the Fund, you incur two types of costs: (1) transaction costs, including sales charges (loads) on purchase payments and contingent deferred sales charges (if any) on redemptions and (2) ongoing costs, including management fees, distribution (12b-1) and/or shareholder service fees, and other Fund expenses. This example is intended to help you understand your ongoing costs (in dollars) of investing in the Fund and to compare these costs with the ongoing costs of investing in other mutual funds.
The example is based on an investment of $1,000 invested at the beginning of the six-month period and held for the entire period from July 1, 2014 to December 31, 2014.
Actual expenses
The “Actual” line of the table below provides information about actual account values and actual expenses. You may use the information in this line, together with the amount you invested, to estimate the expenses that you paid over the period. Simply divide your account value by $1,000 (for example, an $8,600 account value divided by $1,000 = 8.6), then multiply the result by the number in the “Actual” line under the heading entitled “Expenses paid during period” for your applicable class of shares to estimate the expenses you paid on your account during this period.
Hypothetical example for comparison purposes
The “Hypothetical” line of the table below provides information about hypothetical account values and hypothetical expenses based on the Fund’s actual expense ratio and an assumed rate of return of 5% per year before expenses, which is not the Fund’s actual return. The hypothetical account values and expenses may not be used to estimate the actual ending account balance or expenses you paid for the period. You may use this information to compare the ongoing costs of investing in the Fund and other funds. To do so, compare this 5% hypothetical example with the 5% hypothetical examples that appear in the shareholder reports of the other funds.
Please note that the expenses shown in the table are meant to highlight your ongoing costs only and do not reflect any transactional costs, such as sales charges (loads) and contingent deferred sales charges. Therefore, the “Hypothetical” line of the table is useful in comparing ongoing costs only and will not help you determine the relative total costs of owning different funds. In addition, if these transactional costs were included, your costs would have been higher.
| | | | | | | | | | | | | | | | |
| | | Beginning
account value
7-1-2014 | | | Ending
account value
12-31-2014 | | | Expenses
paid during
the period¹ | | | Net annualized
expense ratio | |
Class A | | | | | | | | | | | | | | | | |
Actual | | $ | 1,000.00 | | | $ | 1,020.13 | | | $ | 3.56 | | | | 0.70 | % |
Hypothetical (5% return before expenses) | | $ | 1,000.00 | | | $ | 1,021.68 | | | $ | 3.57 | | | | 0.70 | % |
Class C | | | | | | | | | | | | | | | | |
Actual | | $ | 1,000.00 | | | $ | 1,016.29 | | | $ | 7.37 | | | | 1.45 | % |
Hypothetical (5% return before expenses) | | $ | 1,000.00 | | | $ | 1,017.90 | | | $ | 7.38 | | | | 1.45 | % |
Investor Class | | | | | | | | | | | | | | | | |
Actual | | $ | 1,000.00 | | | $ | 1,019.97 | | | $ | 3.72 | | | | 0.73 | % |
Hypothetical (5% return before expenses) | | $ | 1,000.00 | | | $ | 1,021.53 | | | $ | 3.72 | | | | 0.73 | % |
| 1. | Expenses paid is equal to the annualized expense ratio of each class multiplied by the average account value over the period, multiplied by the number of days in the most recent fiscal half-year divided by the number of days in the fiscal year (to reflect the one-half-year period). |
| | | | | | |
| Portfolio of investments—December 31, 2014 (unaudited) | | Wells Fargo Advantage Wisconsin Tax-Free Fund | | | 7 | |
| | | | | | | | | | | | | | | | |
| Security name | | Interest rate | | | Maturity date | | | Principal | | | Value | |
| | | | |
Municipal Obligations: 86.12% | | | | | | | | | | | | | | | | |
| | | | |
| Guam: 5.90% | | | | | | | | | | | | | | | | |
Guam Government Business Privilege Series A (Tax Revenue) | | | 5.25 | % | | | 1-1-2036 | | | $ | 2,000,000 | | | $ | 2,242,000 | |
Guam Government Limited Obligation Section 30 Series A (Miscellaneous Revenue) | | | 5.38 | | | | 12-1-2024 | | | | 1,000,000 | | | | 1,104,460 | |
Guam Government Limited Obligation Section 30 Series A (Miscellaneous Revenue) | | | 5.50 | | | | 12-1-2019 | | | | 1,000,000 | | | | 1,160,810 | |
Guam Government Waterworks Authority Water & Wastewater System Project (Water & Sewer Revenue) | | | 5.25 | | | | 7-1-2025 | | | | 740,000 | | | | 850,053 | |
Guam Government Waterworks Authority Water & Wastewater System Project (Water & Sewer Revenue) | | | 5.00 | | | | 7-1-2019 | | | | 650,000 | | | | 724,029 | |
Guam International Airport Authority Series A (Airport Revenue) | | | 5.00 | | | | 10-1-2016 | | | | 100,000 | | | | 107,029 | |
Guam International Airport Authority Series B (Airport Revenue) | | | 5.00 | | | | 10-1-2016 | | | | 150,000 | | | | 160,544 | |
Guam Power Authority Series A (Utilities Revenue, AGM Insured) | | | 5.00 | | | | 10-1-2019 | | | | 1,575,000 | | | | 1,816,605 | |
Guam Power Authority Series A (Utilities Revenue, AGM Insured) | | | 5.00 | | | | 10-1-2020 | | | | 500,000 | | | | 585,295 | |
| | | | |
| | | | | | | | | | | | | | | 8,750,825 | |
| | | | | | | | | | | | | | | | |
| | | | |
| Illinois: 4.05% | | | | | | | | | | | | | | | | |
Chicago IL Board of Education Refunding Bond Series A (GO, Ambac Insured) | | | 5.50 | | | | 12-1-2025 | | | | 2,115,000 | | | | 2,373,897 | |
Chicago IL Refunding Bond CAB Series C (GO) ¤ | | | 0.00 | | | | 1-1-2032 | | | | 2,500,000 | | | | 984,125 | |
Chicago IL Refunding Bond Series A (GO) | | | 5.00 | | | | 1-1-2027 | | | | 1,700,000 | | | | 1,812,863 | |
City of Chicago Waterworks Second Lien (Water & Sewer Revenue, AGM Insured) | | | 5.00 | | | | 11-1-2020 | | | | 500,000 | | | | 561,130 | |
Illinois (Miscellaneous Revenue) | | | 5.50 | | | | 7-1-2026 | | | | 250,000 | | | | 285,010 | |
| | | | |
| | | | | | | | | | | | | | | 6,017,025 | |
| | | | | | | | | | | | | | | | |
| | | | |
| Puerto Rico: 15.91% | | | | | | | | | | | | | | | | |
Puerto Rico Commonwealth Highway & Transportation Authority Refunding Bond Series L (Transportation Revenue, AGC Insured) | | | 5.25 | | | | 7-1-2019 | | | | 1,000,000 | | | | 1,033,120 | |
Puerto Rico Commonwealth Public Improvement Refunding Bond Series A (GO, AGM Insured) | | | 5.00 | | | | 7-1-2015 | | | | 1,750,000 | | | | 1,753,570 | |
Puerto Rico Commonwealth Public Improvement Refunding Bond Series A (GO, AGM Insured) | | | 5.00 | | | | 7-1-2016 | | | | 1,500,000 | | | | 1,543,680 | |
Puerto Rico Commonwealth Public Improvement Refunding Bond Series A (Tax Revenue, National Insured) | | | 5.50 | | | | 7-1-2016 | | | | 210,000 | | | | 215,158 | |
Puerto Rico Commonwealth Public Improvement Refunding Bond Series A (Tax Revenue, National Insured) | | | 5.50 | | | | 7-1-2016 | | | | 40,000 | | | | 40,982 | |
Puerto Rico Electric Power Authority Refunding Bond Series JJ (Utilities Revenue, National Insured) | | | 5.25 | | | | 7-1-2015 | | | | 565,000 | | | | 572,108 | |
Puerto Rico Electric Power Authority Refunding Bond Series KK (Utilities Revenue, National Insured) | | | 5.50 | | | | 7-1-2015 | | | | 750,000 | | | | 760,358 | |
Puerto Rico Electric Power Authority Refunding Bond Series KK (Utilities Revenue, National Insured) | | | 5.50 | | | | 7-1-2016 | | | | 1,000,000 | | | | 1,031,940 | |
Puerto Rico Electric Power Authority Refunding Bond Series LL (Utilities Revenue, National Insured) | | | 5.50 | | | | 7-1-2017 | | | | 1,000,000 | | | | 1,040,180 | |
Puerto Rico Electric Power Authority Refunding Bond Series UU (Utilities Revenue, AGM Insured) | | | 4.00 | | | | 7-1-2015 | | | | 1,100,000 | | | | 1,107,953 | |
Puerto Rico Electric Power Authority Refunding Bond Series UU (Utilities Revenue, AGM Insured) | | | 5.00 | | | | 7-1-2016 | | | | 2,255,000 | | | | 2,305,670 | |
Puerto Rico Government Development Bank Series 3402 (Miscellaneous Revenue, Morgan Stanley Bank LIQ) 144A± | | | 0.50 | | | | 6-30-2015 | | | | 2,000,000 | | | | 2,000,000 | |
Puerto Rico HFA Subordinated Capital Fund Modernization Refunding Bond (Housing Revenue, HUD Insured) | | | 5.50 | | | | 12-1-2018 | | | | 600,000 | | | | 690,954 | |
The accompanying notes are an integral part of these financial statements.
| | | | |
| 8 | | Wells Fargo Advantage Wisconsin Tax-Free Fund | | Portfolio of investments—December 31, 2014 (unaudited) |
| | | | | | | | | | | | | | | | |
| Security name | | Interest rate | | | Maturity date | | | Principal | | | Value | |
| | | | |
| Puerto Rico (continued) | | | | | | | | | | | | | | | | |
Puerto Rico HFA Unrefunded Balance Capital Funding Program (Housing Revenue, HUD Insured) | | | 5.00 | % | | | 12-1-2015 | | | $ | 500,000 | | | $ | 501,615 | |
Puerto Rico HFA Unrefunded Balance Capital Funding Program (Housing Revenue, HUD Insured) | | | 5.00 | | | | 12-1-2019 | | | | 1,835,000 | | | | 1,840,138 | |
Puerto Rico HFA Unrefunded Balance Capital Funding Program (Housing Revenue, HUD Insured) | | | 5.00 | | | | 12-1-2020 | | | | 260,000 | | | | 260,728 | |
Puerto Rico Highway & Transportation Authority Prerefunded Bond Series W (Tax Revenue, National Insured) | | | 5.50 | | | | 7-1-2015 | | | | 850,000 | | | | 872,500 | |
Puerto Rico Highway & Transportation Authority Refunding Bond Series L (Transportation Revenue, BHAC/FGIC Insured) | | | 5.25 | | | | 7-1-2021 | | | | 300,000 | | | | 339,978 | |
Puerto Rico Highway & Transportation Authority Unrefunded Balance Series W (Tax Revenue, National Insured) | | | 5.50 | | | | 7-1-2015 | | | | 335,000 | | | | 335,734 | |
Puerto Rico Industrial Tourist Educational Medical & Environmental Control Facilities Financing Authority Hospital De La Concepcion Series A (Health Revenue) | | | 6.50 | | | | 11-15-2020 | | | | 25,000 | | | | 25,586 | |
Puerto Rico Municipal Finance Authority Series C (Tobacco Revenue, BHAC/FGIC Insured) | | | 5.50 | | | | 7-1-2020 | | | | 3,000,000 | | | | 3,439,110 | |
Puerto Rico Public Buildings Authority Refunding Bond (Miscellaneous Revenue, National Insured) | | | 5.50 | | | | 7-1-2015 | | | | 1,875,000 | | | | 1,889,719 | |
| | | | |
| | | | | | | | | | | | | | | 23,600,781 | |
| | | | | | | | | | | | | | | | |
| | | | |
| Virgin Islands: 4.07% | | | | | | | | | | | | | | | | |
Virgin Islands PFA Gross Receipts Series C (Tax Revenue) | | | 5.00 | | | | 10-1-2017 | | | | 2,240,000 | | | | 2,436,448 | |
Virgin Islands PFA Gross Receipts Taxes Loan Notes (Tax Revenue, AGM Insured) | | | 4.00 | | | | 10-1-2022 | | | | 1,000,000 | | | | 1,081,870 | |
Virgin Islands PFA Gross Receipts Taxes Loan Notes (Tax Revenue, National Insured) | | | 5.00 | | | | 10-1-2016 | | | | 250,000 | | | | 265,588 | |
Virgin Islands PFA Matching Fund Loan Notes Senior Lien Series B (Miscellaneous Revenue, AGM Insured) | | | 5.00 | | | | 10-1-2025 | | | | 2,000,000 | | | | 2,243,520 | |
Virgin Islands PFA Unrefunded Balance Series A (Miscellaneous Revenue) | | | 7.30 | | | | 10-1-2018 | | | | 10,000 | | | | 11,408 | |
| | | | |
| | | | | | | | | | | | | | | 6,038,834 | |
| | | | | | | | | | | | | | | | |
| | | | |
| Wisconsin: 56.19% | | | | | | | | | | | | | | | | |
Appleton WI RDA Fox Cities Performing Arts Center Project (Tax Revenue) | | | 1.50 | | | | 9-1-2015 | | | | 400,000 | | | | 401,156 | |
Appleton WI RDA Fox Cities Performing Arts Center Project (Tax Revenue) | | | 1.75 | | | | 9-1-2016 | | | | 415,000 | | | | 416,656 | |
Beloit WI CDA Series A (Tax Revenue) | | | 1.25 | | | | 6-1-2015 | | | | 100,000 | | | | 100,208 | |
Cudahy WI CDA Series A (Miscellaneous Revenue) | | | 1.20 | | | | 6-1-2017 | | | | 170,000 | | | | 170,451 | |
Cudahy WI CDA Series A (Miscellaneous Revenue) | | | 1.50 | | | | 6-1-2018 | | | | 200,000 | | | | 200,038 | |
Glendale WI CDA Series A (Miscellaneous Revenue) | | | 3.50 | | | | 10-1-2017 | | | | 1,635,000 | | | | 1,736,844 | |
Glendale WI CDA Series A (Miscellaneous Revenue) | | | 3.50 | | | | 10-1-2018 | | | | 1,700,000 | | | | 1,823,165 | |
Green Bay WI Housing Authority University Student Village Housing Series 2009 (Education Revenue) | | | 5.00 | | | | 4-1-2016 | | | | 1,445,000 | | | | 1,458,858 | |
Green Bay WI Housing Authority University Student Village Housing Series 2009 (Education Revenue) | | | 4.38 | | | | 4-1-2022 | | | | 200,000 | | | | 216,228 | |
Green Bay WI Housing Authority University Student Village Housing Series 2009 (Education Revenue) | | | 5.00 | | | | 4-1-2030 | | | | 1,320,000 | | | | 1,435,394 | |
Green Bay WI RDA Bellin Memorial Hospital Incorporated (Health Revenue) | | | 4.25 | | | | 12-1-2015 | | | | 50,000 | | | | 51,399 | |
Green Bay WI RDA Bellin Memorial Hospital Incorporated (Health Revenue) | | | 5.50 | | | | 12-1-2023 | | | | 250,000 | | | | 280,350 | |
Green Bay WI RDA Bellin Memorial Hospital Incorporated (Health Revenue) | | | 6.15 | | | | 12-1-2032 | | | | 365,000 | | | | 414,695 | |
Green Bay WI RDA Pine Street Parking Ramp Project (Miscellaneous Revenue) | | | 2.50 | | | | 4-1-2015 | | | | 125,000 | | | | 125,740 | |
Green Bay WI RDA Pine Street Parking Ramp Project (Miscellaneous Revenue) | | | 2.70 | | | | 4-1-2016 | | | | 405,000 | | | | 416,603 | |
Greenfield WI CDA Layton Terrace Project (Housing Revenue) ± | | | 4.75 | | | | 9-1-2033 | | | | 500,000 | | | | 500,650 | |
Little Chute WI CDA (Industrial Development Revenue, Associated Bank NA LOC) ø | | | 0.14 | | | | 7-1-2053 | | | | 855,000 | | | | 855,000 | |
The accompanying notes are an integral part of these financial statements.
| | | | | | |
| Portfolio of investments—December 31, 2014 (unaudited) | | Wells Fargo Advantage Wisconsin Tax-Free Fund | | | 9 | |
| | | | | | | | | | | | | | | | |
| Security name | | Interest rate | | | Maturity date | | | Principal | | | Value | |
| | | | |
| Wisconsin (continued) | | | | | | | | | | | | | | | | |
Little Chute WI CDA (Miscellaneous Revenue) | | | 4.25 | % | | | 3-1-2017 | | | $ | 200,000 | | | $ | 200,472 | |
Little Chute WI CDA (Miscellaneous Revenue) | | | 4.35 | | | | 3-1-2018 | | | | 200,000 | | | | 200,430 | |
Madison WI CDA Wisconsin Alumni Research Foundation (Education Revenue) | | | 5.00 | | | | 10-1-2023 | | | | 150,000 | | | | 174,021 | |
Madison WI CDA Wisconsin Alumni Research Foundation (Education Revenue) | | | 5.00 | | | | 10-1-2025 | | | | 475,000 | | | | 549,499 | |
Madison WI CDA Wisconsin Alumni Research Foundation (Education Revenue) | | | 5.00 | | | | 10-1-2039 | | | | 5,000,000 | | | | 5,695,200 | |
Milwaukee WI Housing Authority Veterans Housing Project (Housing Revenue, FNMA Insured) | | | 5.10 | | | | 7-1-2022 | | | | 1,050,000 | | | | 1,074,738 | |
Milwaukee WI RDA Historic Third Ward Package (Transportation Revenue, Northern Trust Company LOC) ø | | | 0.04 | | | | 9-1-2028 | | | | 550,000 | | | | 550,000 | |
Milwaukee WI RDA Milwaukee Public Schools Congress Series A (Miscellaneous Revenue) | | | 4.60 | | | | 8-1-2022 | | | | 100,000 | | | | 101,408 | |
Milwaukee WI RDA Public Schools Series A (Miscellaneous Revenue) | | | 5.00 | | | | 8-1-2020 | | | | 3,100,000 | | | | 3,593,086 | |
Milwaukee WI RDA Public Schools Series A (Miscellaneous Revenue) | | | 5.00 | | | | 8-1-2021 | | | | 3,330,000 | | | | 3,894,269 | |
Milwaukee WI RDA Science Education Consortium Incorporated Project Series A (Education Revenue) | | | 6.25 | | | | 8-1-2043 | | | | 2,100,000 | | | | 2,386,398 | |
Milwaukee WI RDA Summer Festival Project (Miscellaneous Revenue) | | | 3.15 | | | | 8-1-2017 | | | | 50,000 | | | | 52,697 | |
Milwaukee WI RDA Summer Festival Project (Miscellaneous Revenue) | | | 4.60 | | | | 8-1-2024 | | | | 870,000 | | | | 947,978 | |
Milwaukee WI RDA Summer Festival Project (Miscellaneous Revenue) | | | 5.00 | | | | 8-1-2030 | | | | 3,000,000 | | | | 3,279,270 | |
Milwaukee WI RDA Wisconsin Housing Preservation Corporation (Housing Revenue, Johnson Bank LOC) ø | | | 0.96 | | | | 12-1-2038 | | | | 1,525,000 | | | | 1,525,000 | |
Monroe WI RDA Monroe Clinic Incorporated (Health Revenue) | | | 5.50 | | | | 2-15-2029 | | | | 1,000,000 | | | | 1,088,130 | |
Monroe WI RDA Monroe Clinic Incorporated (Health Revenue) | | | 5.88 | | | | 2-15-2039 | | | | 1,570,000 | | | | 1,717,580 | |
Oostburg WI CDA Series A (Miscellaneous Revenue) | | | 1.20 | | | | 5-1-2015 | | | | 80,000 | | | | 80,106 | |
Oostburg WI CDA Series A (Miscellaneous Revenue) | | | 1.40 | | | | 5-1-2016 | | | | 70,000 | | | | 70,262 | |
Oostburg WI CDA Series A (Miscellaneous Revenue) | | | 1.75 | | | | 5-1-2018 | | | | 50,000 | | | | 49,828 | |
Pittsville WI CDA Series A (Miscellaneous Revenue) | | | 1.20 | | | | 6-1-2015 | | | | 100,000 | | | | 100,051 | |
Pittsville WI CDA Series A (Miscellaneous Revenue) | | | 1.45 | | | | 6-1-2016 | | | | 50,000 | | | | 49,982 | |
Pittsville WI CDA Series A (Miscellaneous Revenue) | | | 1.65 | | | | 6-1-2017 | | | | 100,000 | | | | 99,576 | |
Platteville WI RDA University of Wisconsin Platteville Real Estate (Education Revenue) | | | 5.00 | | | | 7-1-2022 | | | | 1,000,000 | | | | 1,119,180 | |
Racine WI Elderly Housing Authority Wisconsin Housing Preservation Corporation (Housing Revenue, Johnson Bank LOC) ø | | | 0.96 | | | | 10-1-2042 | | | | 1,445,000 | | | | 1,445,000 | |
Southeast Wisconsin Professional Baseball Park District Series A (Tax Revenue, National Insured) | | | 5.50 | | | | 12-15-2015 | | | | 160,000 | | | | 167,990 | |
Southeast Wisconsin Professional Baseball Park District Series A (Tax Revenue, National Insured) | | | 5.50 | | | | 12-15-2017 | | | | 1,765,000 | | | | 1,992,403 | |
Southeast Wisconsin Professional Baseball Park District Series A (Tax Revenue, National Insured) | | | 5.50 | | | | 12-15-2018 | | | | 380,000 | | | | 442,932 | |
Southeast Wisconsin Professional Baseball Park District Series A (Tax Revenue, National Insured) | | | 5.50 | | | | 12-15-2019 | | | | 100,000 | | | | 119,286 | |
Southeast Wisconsin Professional Baseball Park District Series A (Tax Revenue, National Insured) | | | 5.50 | | | | 12-15-2021 | | | | 2,000,000 | | | | 2,468,260 | |
Southeast Wisconsin Professional Baseball Park District Series A (Tax Revenue, National Insured) | | | 5.50 | | | | 12-15-2023 | | | | 1,600,000 | | | | 1,984,880 | |
Southeast Wisconsin Professional Baseball Park District Series A (Tax Revenue, National Insured) | | | 5.50 | | | | 12-15-2026 | | | | 2,330,000 | | | | 2,882,210 | |
Sturgeon Bay WI Waterfront RDA Series A (Miscellaneous Revenue) | | | 4.35 | | | | 10-1-2018 | | | | 150,000 | | | | 156,398 | |
Sun Prairie WI CDA Tax Incremental # 6 & 7 (Miscellaneous Revenue) | | | 3.80 | | | | 2-1-2018 | | | | 300,000 | | | | 313,401 | |
Sun Prairie WI CDA Tax Incremental # 6 & 7 (Miscellaneous Revenue) | | | 4.00 | | | | 2-1-2019 | | | | 220,000 | | | | 229,220 | |
Sun Prairie WI CDA Tax Incremental # 6 & 7 (Miscellaneous Revenue) | | | 4.50 | | | | 2-1-2022 | | | | 250,000 | | | | 260,188 | |
Verona WI CDA Economic Improvements (Industrial Development Revenue) | | | 4.30 | | | | 2-1-2015 | | | | 100,000 | | | | 100,280 | |
The accompanying notes are an integral part of these financial statements.
| | | | |
| 10 | | Wells Fargo Advantage Wisconsin Tax-Free Fund | | Portfolio of investments—December 31, 2014 (unaudited) |
| | | | | | | | | | | | | | | | |
| Security name | | Interest rate | | | Maturity date | | | Principal | | | Value | |
| | | | |
| Wisconsin (continued) | | | | | | | | | | | | | | | | |
Verona WI CDA Public Improvements (Miscellaneous Revenue) | | | 5.38 | % | | | 12-1-2022 | | | $ | 830,000 | | | $ | 831,760 | |
Warrens WI CDA Economic Improvements (Miscellaneous Revenue) | | | 5.10 | | | | 11-1-2020 | | | | 70,000 | | | | 48,783 | |
Warrens WI CDA Interim Workout Extension (Tax Revenue) | | | 3.70 | | | | 11-1-2029 | | | | 250,000 | | | | 124,925 | |
Warrens WI CDA Public Improvements (Miscellaneous Revenue) | | | 5.00 | | | | 11-1-2016 | | | | 70,000 | | | | 45,493 | |
Waukesha WI Housing Authority Preservation Corporation Project (Housing Revenue, Johnson Bank LOC) ø | | | 0.96 | | | | 12-1-2042 | | | | 1,985,000 | | | | 1,985,000 | |
Waukesha WI Housing Authority The Arboretum Project (Housing Revenue) ± | | | 5.00 | | | | 12-1-2027 | | | | 340,000 | | | | 340,775 | |
Waukesha WI RDA Welldall Manufacturing Incorporated Project (Industrial Development Revenue, U.S. Bank NA LOC) | | | 2.30 | | | | 12-1-2016 | | | | 135,000 | | | | 139,155 | |
Waukesha WI RDA Welldall Manufacturing Incorporated Project (Industrial Development Revenue, U.S. Bank NA LOC) | | | 2.65 | | | | 12-1-2017 | | | | 335,000 | | | | 350,651 | |
Waukesha WI RDA Welldall Manufacturing Incorporated Project (Industrial Development Revenue, U.S. Bank NA LOC) | | | 4.00 | | | | 12-1-2023 | | | | 150,000 | | | | 162,123 | |
Waukesha WI RDA Welldall Manufacturing Incorporated Project (Industrial Development Revenue, U.S. Bank NA LOC) | | | 4.20 | | | | 12-1-2024 | | | | 150,000 | | | | 164,120 | |
Waukesha WI RDA Welldall Manufacturing Incorporated Project (Industrial Development Revenue, U.S. Bank NA LOC) | | | 4.25 | | | | 12-1-2025 | | | | 250,000 | | | | 273,113 | |
Weston WI CDA Series A (Miscellaneous Revenue) | | | 5.25 | | | | 10-1-2020 | | | | 720,000 | | | | 722,160 | |
Wisconsin Center District CAB (Tax Revenue, National Insured) ¤ | | | 0.00 | | | | 12-15-2019 | | | | 175,000 | | | | 156,982 | |
Wisconsin Center District CAB (Tax Revenue, AGM Insured) ¤ | | | 0.00 | | | | 12-15-2030 | | | | 190,000 | | | | 110,952 | |
Wisconsin Center District Junior Dedicated Bond (Tax Revenue, AGM Insured) | | | 5.25 | | | | 12-15-2015 | | | | 30,000 | | | | 31,391 | |
Wisconsin Center District Junior Dedicated Bond (Tax Revenue, AGM Insured) | | | 5.25 | | | | 12-15-2018 | | | | 65,000 | | | | 74,082 | |
Wisconsin Center District Junior Dedicated Bond (Tax Revenue, AGM Insured) | | | 5.25 | | | | 12-15-2023 | | | | 2,340,000 | | | | 2,747,417 | |
Wisconsin Center District Junior Dedicated Bond (Tax Revenue, AGM Insured) | | | 5.25 | | | | 12-15-2027 | | | | 485,000 | | | | 579,842 | |
Wisconsin Center District Junior Dedicated Bond Series A (Tax Revenue) | | | 5.00 | | | | 12-15-2030 | | | | 2,100,000 | | | | 2,365,188 | |
Wisconsin Center District Junior Dedicated Bond Series A (Tax Revenue) | | | 5.00 | | | | 12-15-2022 | | | | 730,000 | | | | 825,688 | |
Wisconsin Dells CDA (Miscellaneous Revenue) | | | 4.60 | | | | 3-1-2025 | | | | 175,000 | | | | 178,220 | |
Wisconsin HEFA Rogers Memorial Hospital Incorporated Series B (Health Revenue) | | | 5.00 | | | | 7-1-2044 | | | | 1,000,000 | | | | 1,100,810 | |
Wisconsin Housing & EDA (Housing Revenue, FHA Insured) | | | 6.10 | | | | 6-1-2021 | | | | 80,000 | | | | 88,554 | |
Wisconsin Housing & EDA AMT Series A (Housing Revenue) | | | 4.63 | | | | 11-1-2037 | | | | 25,000 | | | | 25,180 | |
Wisconsin Housing & EDA AMT Series A (Housing Revenue) | | | 4.75 | | | | 5-1-2037 | | | | 280,000 | | | | 280,146 | |
Wisconsin Housing & EDA MFHR Series A (Industrial Development Revenue) ± | | | 4.25 | | | | 12-1-2035 | | | | 1,960,000 | | | | 2,023,445 | |
Wisconsin Housing & EDA President House Project (Housing Revenue, Associated Bank NA LOC) ø | | | 0.14 | | | | 8-1-2046 | | | | 1,775,000 | | | | 1,775,000 | |
Wisconsin Housing & EDA Series A (Housing Revenue) | | | 0.55 | | | | 12-1-2016 | | | | 50,000 | | | | 49,911 | |
Wisconsin Housing & EDA Series A (Housing Revenue, FHLB LIQ) ø | | | 0.04 | | | | 5-1-2055 | | | | 1,550,000 | | | | 1,550,000 | |
Wisconsin Housing & EDA Series A (Housing Revenue) | | | 0.80 | | | | 6-1-2017 | | | | 50,000 | | | | 49,913 | |
Wisconsin Housing & EDA Series A (Housing Revenue) | | | 0.90 | | | | 12-1-2017 | | | | 50,000 | | | | 49,809 | |
Wisconsin Housing & EDA Series A (Housing Revenue) | | | 1.15 | | | | 6-1-2018 | | | | 55,000 | | | | 54,843 | |
Wisconsin Housing & EDA Series A (Housing Revenue) | | | 1.25 | | | | 12-1-2018 | | | | 55,000 | | | | 54,789 | |
Wisconsin Housing & EDA Series A (Housing Revenue) | | | 1.55 | | | | 12-1-2019 | | | | 55,000 | | | | 54,709 | |
Wisconsin Housing & EDA Series A (Housing Revenue) | | | 1.95 | | | | 12-1-2020 | | | | 55,000 | | | | 54,714 | |
Wisconsin Housing & EDA Series A (Housing Revenue) | | | 3.80 | | | | 12-1-2039 | | | | 1,130,000 | | | | 1,130,825 | |
Wisconsin Housing & EDA Series A (Housing Revenue) | | | 3.90 | | | | 12-1-2044 | | | | 1,445,000 | | | | 1,442,428 | |
Wisconsin Housing & EDA Series A (Housing Revenue) | | | 4.05 | | | | 12-1-2049 | | | | 1,650,000 | | | | 1,650,083 | |
Wisconsin Housing & EDA Series A (Housing Revenue) | | | 5.75 | | | | 11-1-2043 | | | | 3,390,000 | | | | 3,665,438 | |
Wisconsin Housing & EDA Series E (Housing Revenue) | | | 4.90 | | | | 11-1-2035 | | | | 2,015,000 | | | | 2,024,168 | |
Wisconsin Oneida Tribe of Indians (Tax Revenue) 144A | | | 5.50 | | | | 2-1-2021 | | | | 685,000 | | | | 769,488 | |
The accompanying notes are an integral part of these financial statements.
| | | | | | |
| Portfolio of investments—December 31, 2014 (unaudited) | | Wells Fargo Advantage Wisconsin Tax-Free Fund | | | 11 | |
| | | | | | | | | | | | | | | | |
| Security name | | Interest rate | | | Maturity date | | | Principal | | | Value | |
| | | | |
| Wisconsin (continued) | | | | | | | | | | | | | | | | |
Wisconsin Refunding Bond of 2011 Series 1 (GO) | | | 5.00 | % | | | 5-1-2022 | | | $ | 1,225,000 | | | $ | 1,464,283 | |
| | | | |
| | | | | | | | | | | | | | | 83,381,400 | |
| | | | | | | | | | | | | | | | |
| | | | |
Total Municipal Obligations (Cost $123,026,713) | | | | | | | | | | | | | | | 127,788,865 | |
| | | | | | | | | | | | | | | | |
| | | | | | | | |
| Total investments in securities (Cost $123,026,713) * | | | 86.12 | % | | | 127,788,865 | |
Other assets and liabilities, net | | | 13.88 | | | | 20,589,430 | |
| | | | | | | | |
| Total net assets | | | 100.00 | % | | $ | 148,378,295 | |
| | | | | | | | |
| ¤ | The security is issued in zero coupon form with no periodic interest payments. |
| 144A | The security may be resold in transactions exempt from registration, normally to qualified institutional buyers, pursuant to Rule 144A under the Securities Act of 1933. |
| ± | Variable rate investment. The rate shown is the rate in effect at period end. |
| ø | Variable rate demand notes are subject to a demand feature which reduces the effective maturity. The maturity date shown represents the final maturity date of the security. The interest rate is determined and reset by the issuer daily, weekly, or monthly depending upon the terms of the security. The rate shown is the rate in effect at period end. |
| * | Cost for federal income tax purposes is $123,023,511 and unrealized gains (losses) consists of: |
| | | | |
Gross unrealized gains | | $ | 4,983,917 | |
Gross unrealized losses | | | (218,563 | ) |
| | | | |
Net unrealized gains | | $ | 4,765,354 | |
The accompanying notes are an integral part of these financial statements.
| | | | |
| 12 | | Wells Fargo Advantage Wisconsin Tax-Free Fund | | Statement of assets and liabilities—December 31, 2014 (unaudited) |
| | | | |
| | | | |
| |
Assets | | | | |
Investments in unaffiliated securities, at value (cost $123,026,713) | | $ | 127,788,865 | |
Cash | | | 19,030,579 | |
Receivable for Fund shares sold | | | 287,111 | |
Receivable for interest | | | 1,473,444 | |
Prepaid expenses and other assets | | | 24,446 | |
| | | | |
Total assets | | | 148,604,445 | |
| | | | |
| |
Liabilities | | | | |
Dividends payable | | | 30,406 | |
Payable for Fund shares redeemed | | | 79,744 | |
Advisory fee payable | | | 18,325 | |
Distribution fee payable | | | 6,989 | |
Administration fees payable | | | 29,984 | |
Shareholder servicing fees payable | | | 32,099 | |
Professional fees payable | | | 17,084 | |
Accrued expenses and other liabilities | | | 11,519 | |
| | | | |
Total liabilities | | | 226,150 | |
| | | | |
Total net assets | | $ | 148,378,295 | |
| | | | |
| |
NET ASSETS CONSIST OF | | | | |
Paid-in capital | | $ | 143,612,978 | |
Overdistributed net investment income | | | (10,698 | ) |
Accumulated net realized gains on investments | | | 13,863 | |
Net unrealized gains on investments | | | 4,762,152 | |
| | | | |
Total net assets | | $ | 148,378,295 | |
| | | | |
| |
COMPUTATION OF NET ASSET VALUE AND OFFERING PRICE PER SHARE | | | | |
Net assets – Class A | | $ | 21,292,141 | |
Shares outstanding – Class A1 | | | 1,946,473 | |
Net asset value per share – Class A | | | $10.94 | |
Maximum offering price per share – Class A2 | | | $11.46 | |
Net assets – Class C | | $ | 10,598,416 | |
Shares outstanding – Class C1 | | | 968,901 | |
Net asset value per share – Class C | | | $10.94 | |
Net assets – Investor Class | | $ | 116,487,738 | |
Shares outstanding – Investor Class1 | | | 10,648,562 | |
Net asset value per share – Investor Class | | | $10.94 | |
| 1. | The Fund has an unlimited number of authorized shares. |
| 2. | Maximum offering price is computed as 100/95.50 of net asset value. On investments of $50,000 or more, the offering price is reduced. |
The accompanying notes are an integral part of these financial statements.
| | | | | | |
| Statement of operations—six months ended December 31, 2014 (unaudited) | | Wells Fargo Advantage Wisconsin Tax-Free Fund | | | 13 | |
| | | | |
| | | | |
| |
Investment income | | | | |
Interest | | $ | 2,199,487 | |
| | | | |
| |
Expenses | | | | |
Advisory fee | | | 257,480 | |
Administration fees | | | | |
Fund level | | | 36,783 | |
Class A | | | 16,540 | |
Class C | | | 8,505 | |
Investor Class | | | 110,034 | |
Shareholder servicing fees | | | | |
Class A | | | 25,844 | |
Class C | | | 13,290 | |
Investor Class | | | 144,780 | |
Distribution fee | | | | |
Class C | | | 39,869 | |
Custody and accounting fees | | | 4,363 | |
Professional fees | | | 22,463 | |
Registration fees | | | 23,175 | |
Shareholder report expenses | | | 11,459 | |
Trustees’ fees and expenses | | | 6,281 | |
Other fees and expenses | | | 4,442 | |
| | | | |
Total expenses | | | 725,308 | |
Less: Fee waivers and/or expense reimbursements | | | (153,106 | ) |
| | | | |
Net expenses | | | 572,202 | |
| | | | |
Net investment income | | | 1,627,285 | |
| | | | |
| |
REALIZED AND UNREALIZED GAINS (LOSSES) ON INVESTMENTS | | | | |
Net realized gains on investments | | | 1,144,999 | |
Net change in unrealized gains (losses) on investments | | | 87,775 | |
| | | | |
Net realized and unrealized gains (losses) on investments | | | 1,232,774 | |
| | | | |
Net increase in net assets resulting from operations | | $ | 2,860,059 | |
| | | | |
The accompanying notes are an integral part of these financial statements.
| | | | |
| 14 | | Wells Fargo Advantage Wisconsin Tax-Free Fund | | Statement of changes in net assets |
| | | | | | | | | | | | | | | | |
| | | Six months ended
December 31, 2014 (unaudited) | | | Year ended June 30, 2014 | |
| | | | |
Operations | | | | | | | | | | | | | | | | |
Net investment income | | | | | | $ | 1,627,285 | | | | | | | $ | 4,265,458 | |
Net realized gains on investments | | | | | | | 1,144,999 | | | | | | | | 741,993 | |
Net change in unrealized gains (losses) on investments | | | | | | | 87,775 | | | | | | | | 1,267,295 | |
| | | | |
Net increase in net assets resulting from operations | | | | | | | 2,860,059 | | | | | | | | 6,274,746 | |
| | | | |
| | | | |
Distributions to shareholders from | | | | | | | | | | | | | | | | |
Net investment income | | | | | | | | | | | | | | | | |
Class A | | | | | | | (236,771 | ) | | | | | | | (614,858 | ) |
Class C | | | | | | | (81,880 | ) | | | | | | | (243,713 | ) |
Investor Class | | | | | | | (1,308,634 | ) | | | | | | | (3,406,831 | ) |
Net realized gains | | | | | | | | | | | | | | | | |
Class A | | | | | | | (213,581 | ) | | | | | | | (149,910 | ) |
Class C | | | | | | | (108,605 | ) | | | | | | | (78,371 | ) |
Investor Class | | | | | | | (1,168,572 | ) | | | | | | | (843,712 | ) |
| | | | |
Total distributions to shareholders | | | | | | | (3,118,043 | ) | | | | | | | (5,337,395 | ) |
| | | | |
| | | | |
Capital share transactions | | | Shares | | | | | | | | Shares | | | | | |
Proceeds from shares sold | | | | | | | | | | | | | | | | |
Class A | | | 243,127 | | | | 2,671,684 | | | | 477,359 | | | | 5,145,319 | |
Class C | | | 69,733 | | | | 767,550 | | | | 161,136 | | | | 1,742,442 | |
Investor Class | | | 1,090,012 | | | | 11,966,915 | | | | 1,404,090 | | | | 15,125,122 | |
| | | | |
| | | | | | | 15,406,149 | | | | | | | | 22,012,883 | |
| | | | |
Reinvestment of distributions | | | | | | | | | | | | | | | | |
Class A | | | 37,063 | | | | 406,496 | | | | 63,758 | | | | 685,335 | |
Class C | | | 16,913 | | | | 185,417 | | | | 28,834 | | | | 309,706 | |
Investor Class | | | 206,511 | | | | 2,265,193 | | | | 361,702 | | | | 3,888,245 | |
| | | | |
| | | | | | | 2,857,106 | | | | | | | | 4,883,286 | |
| | | | |
Payment for shares redeemed | | | | | | | | | | | | | | | | |
Class A | | | (142,875 | ) | | | (1,571,112 | ) | | | (1,093,429 | ) | | | (11,711,174 | ) |
Class C | | | (69,626 | ) | | | (763,624 | ) | | | (351,862 | ) | | | (3,783,217 | ) |
Investor Class | | | (936,025 | ) | | | (10,291,135 | ) | | | (3,054,100 | ) | | | (32,782,075 | ) |
| | | | |
| | | | | | | (12,625,871 | ) | | | | | | | (48,276,466 | ) |
| | | | |
Net increase (decrease) in net assets resulting from capital share transactions | | | | | | | 5,637,384 | | | | | | | | (21,380,297 | ) |
| | | | |
Total increase (decrease) in net assets | | | | | | | 5,379,400 | | | | | | | | (20,442,946 | ) |
| | | | |
| | | | |
Net assets | | | | | | | | | | | | | | | | |
Beginning of period | | | | | | | 142,998,895 | | | | | | | | 163,441,841 | |
| | | | |
End of period | | | | | | $ | 148,378,295 | | | | | | | $ | 142,998,895 | |
| | | | |
Overdistributed net investment income | | | | | | $ | (10,698 | ) | | | | | | $ | (10,698 | ) |
| | | | |
The accompanying notes are an integral part of these financial statements.
| | | | | | |
| Financial highlights | | Wells Fargo Advantage Wisconsin Tax-Free Fund | | | 15 | |
(For a share outstanding throughout each period)
| | | | | | | | | | | | | | | | | | | | | | | | |
| | | Six months ended
December 31, 2014 (unaudited) | | | Year ended June 30 | |
| CLASS A | | | 2014 | | | 2013 | | | 2012 | | | 2011 | | | 2010 | |
Net asset value, beginning of period | | | $10.96 | | | | $10.86 | | | | $11.09 | | | | $10.68 | | | | $10.67 | | | | $10.43 | |
Net investment income | | | 0.13 | | | | 0.33 | | | | 0.27 | | | | 0.34 | | | | 0.36 | | | | 0.32 | |
Net realized and unrealized gains (losses) on investments | | | 0.09 | | | | 0.18 | | | | (0.22 | ) | | | 0.42 | | | | 0.01 | | | | 0.35 | |
| | | | | | | | | | | | | | | | | | | | | | | | |
Total from investment operations | | | 0.22 | | | | 0.51 | | | | 0.05 | | | | 0.76 | | | | 0.37 | | | | 0.67 | |
Distributions to shareholders from | | | | | | | | | | | | | | | | | | | | | | | | |
Net investment income | | | (0.13 | ) | | | (0.33 | ) | | | (0.27 | ) | | | (0.34 | ) | | | (0.36 | ) | | | (0.32 | ) |
Net realized gains | | | (0.11 | ) | | | (0.08 | ) | | | (0.01 | ) | | | (0.01 | ) | | | 0.00 | | | | (0.11 | ) |
| | | | | | | | | | | | | | | | | | | | | | | | |
Total distributions to shareholders | | | (0.24 | ) | | | (0.41 | ) | | | (0.28 | ) | | | (0.35 | ) | | | (0.36 | ) | | | (0.43 | ) |
Net asset value, end of period | | | $10.94 | | | | $10.96 | | | | $10.86 | | | | $11.09 | | | | $10.68 | | | | $10.67 | |
Total return1 | | | 2.01 | % | | | 4.80 | % | | | 0.46 | % | | | 7.19 | % | | | 3.52 | % | | | 6.52 | % |
Ratios to average net assets (annualized) | | | | | | | | | | | | | | | | | | | | | | | | |
Gross expenses | | | 0.91 | % | | | 0.92 | % | | | 0.90 | % | | | 0.92 | % | | | 0.92 | % | | | 0.93 | % |
Net expenses | | | 0.70 | % | | | 0.70 | % | | | 0.70 | % | | | 0.70 | % | | | 0.70 | % | | | 0.70 | % |
Net investment income | | | 2.29 | % | | | 3.02 | % | | | 2.44 | % | | | 3.06 | % | | | 3.43 | % | | | 3.00 | % |
Supplemental data | | | | | | | | | | | | | | | | | | | | | | | | |
Portfolio turnover rate | | | 19 | % | | | 25 | % | | | 31 | % | | | 14 | % | | | 60 | % | | | 48 | % |
Net assets, end of period (000s omitted) | | | $21,292 | | | | $19,825 | | | | $25,641 | | | | $20,844 | | | | $11,540 | | | | $7,535 | |
| 1. | Total return calculations do not include any sales charges. Returns for periods of less than one year are not annualized. |
The accompanying notes are an integral part of these financial statements.
| | | | |
| 16 | | Wells Fargo Advantage Wisconsin Tax-Free Fund | | Financial highlights |
(For a share outstanding throughout each period)
| | | | | | | | | | | | | | | | | | | | | | | | |
| | | Six months ended
December 31, 2014 (unaudited) | | | Year ended June 30 | |
| CLASS C | | | 2014 | | | 2013 | | | 2012 | | | 2011 | | | 2010 | |
Net asset value, beginning of period | | | $10.96 | | | | $10.86 | | | | $11.09 | | | | $10.68 | | | | $10.67 | | | | $10.43 | |
Net investment income | | | 0.09 | | | | 0.25 | | | | 0.19 | | | | 0.26 | | | | 0.27 | | | | 0.23 | |
Net realized and unrealized gains (losses) on investments | | | 0.09 | | | | 0.18 | | | | (0.22 | ) | | | 0.42 | | | | 0.01 | | | | 0.35 | |
| | | | | | | | | | | | | | | | | | | | | | | | |
Total from investment operations | | | 0.18 | | | | 0.43 | | | | (0.03 | ) | | | 0.68 | | | | 0.28 | | | | 0.58 | |
Distributions to shareholders from | | | | | | | | | | | | | | | | | | | | | | | | |
Net investment income | | | (0.09 | ) | | | (0.25 | ) | | | (0.19 | ) | | | (0.26 | ) | | | (0.27 | ) | | | (0.23 | ) |
Net realized gains | | | (0.11 | ) | | | (0.08 | ) | | | (0.01 | ) | | | (0.01 | ) | | | 0.00 | | | | (0.11 | ) |
| | | | | | | | | | | | | | | | | | | | | | | | |
Total distributions to shareholders | | | (0.20 | ) | | | (0.33 | ) | | | (0.20 | ) | | | (0.27 | ) | | | (0.27 | ) | | | (0.34 | ) |
Net asset value, end of period | | | $10.94 | | | | $10.96 | | | | $10.86 | | | | $11.09 | | | | $10.68 | | | | $10.67 | |
Total return1 | | | 1.63 | % | | | 4.02 | % | | | (0.29 | )% | | | 6.40 | % | | | 2.71 | % | | | 5.67 | % |
Ratios to average net assets (annualized) | | | | | | | | | | | | | | | | | | | | | | | | |
Gross expenses | | | 1.66 | % | | | 1.67 | % | | | 1.65 | % | | | 1.67 | % | | | 1.67 | % | | | 1.68 | % |
Net expenses | | | 1.45 | % | | | 1.45 | % | | | 1.45 | % | | | 1.45 | % | | | 1.48 | % | | | 1.49 | % |
Net investment income | | | 1.54 | % | | | 2.28 | % | | | 1.69 | % | | | 2.32 | % | | | 2.56 | % | | | 2.20 | % |
Supplemental data | | | | | | | | | | | | | | | | | | | | | | | | |
Portfolio turnover rate | | | 19 | % | | | 25 | % | | | 31 | % | | | 14 | % | | | 60 | % | | | 48 | % |
Net assets, end of period (000s omitted) | | | $10,598 | | | | $10,431 | | | | $12,094 | | | | $11,393 | | | | $9,552 | | | | $10,979 | |
| 1. | Total return calculations do not include any sales charges. Returns for periods of less than one year are not annualized. |
The accompanying notes are an integral part of these financial statements.
| | | | | | |
| Financial highlights | | Wells Fargo Advantage Wisconsin Tax-Free Fund | | | 17 | |
(For a share outstanding throughout each period)
| | | | | | | | | | | | | | | | | | | | | | | | |
| | | Six months ended
December 31, 2014 (unaudited) | | | Year ended June 30 | |
| INVESTOR CLASS | | | 2014 | | | 2013 | | | 2012 | | | 2011 | | | 2010 | |
Net asset value, beginning of period | | | $10.96 | | | | $10.86 | | | | $11.09 | | | | $10.68 | | | | $10.67 | | | | $10.43 | |
Net investment income | | | 0.13 | | | | 0.32 | | | | 0.27 | | | | 0.33 | | | | 0.35 | | | | 0.31 | |
Net realized and unrealized gains (losses) on investments | | | 0.09 | | | | 0.18 | | | | (0.22 | ) | | | 0.42 | | | | 0.01 | | | | 0.35 | |
| | | | | | | | | | | | | | | | | | | | | | | | |
Total from investment operations | | | 0.22 | | | | 0.50 | | | | 0.05 | | | | 0.75 | | | | 0.36 | | | | 0.66 | |
Distributions to shareholders from | | | | | | | | | | | | | | | | | | | | | | | | |
Net investment income | | | (0.13 | ) | | | (0.32 | ) | | | (0.27 | ) | | | (0.33 | ) | | | (0.35 | ) | | | (0.31 | ) |
Net realized gains | | | (0.11 | ) | | | (0.08 | ) | | | (0.01 | ) | | | (0.01 | ) | | | 0.00 | | | | (0.11 | ) |
| | | | | | | | | | | | | | | | | | | | | | | | |
Total distributions to shareholders | | | (0.24 | ) | | | (0.40 | ) | | | (0.28 | ) | | | (0.34 | ) | | | (0.35 | ) | | | (0.42 | ) |
Net asset value, end of period | | | $10.94 | | | | $10.96 | | | | $10.86 | | | | $11.09 | | | | $10.68 | | | | $10.67 | |
Total return1 | | | 2.00 | % | | | 4.77 | % | | | 0.43 | % | | | 7.16 | % | | | 3.49 | % | | | 6.46 | % |
Ratios to average net assets (annualized) | | | | | | | | | | | | | | | | | | | | | | | | |
Gross expenses | | | 0.94 | % | | | 0.95 | % | | | 0.93 | % | | | 0.95 | % | | | 0.95 | % | | | 0.99 | % |
Net expenses | | | 0.73 | % | | | 0.73 | % | | | 0.73 | % | | | 0.73 | % | | | 0.73 | % | | | 0.75 | % |
Net investment income | | | 2.26 | % | | | 3.00 | % | | | 2.41 | % | | | 3.04 | % | | | 3.32 | % | | | 2.94 | % |
Supplemental data | | | | | | | | | | | | | | | | | | | | | | | | |
Portfolio turnover rate | | | 19 | % | | | 25 | % | | | 31 | % | | | 14 | % | | | 60 | % | | | 48 | % |
Net assets, end of period (000s omitted) | | | $116,488 | | | | $112,743 | | | | $125,707 | | | | $121,449 | | | | $100,804 | | | | $108,326 | |
| 1. | Returns for periods of less than one year are not annualized. |
The accompanying notes are an integral part of these financial statements.
| | | | |
| 18 | | Wells Fargo Advantage Wisconsin Tax-Free Fund | | Notes to financial statements (unaudited) |
1. ORGANIZATION
Wells Fargo Funds Trust (the “Trust”), a Delaware statutory trust organized on March 10, 1999, is an open-end management investment company registered under the Investment Company Act of 1940, as amended (the “1940 Act”). As an investment company, the Trust follows the accounting and reporting guidance in FASB Accounting Standards Codification 946. These financial statements report on the Wells Fargo Advantage Wisconsin Tax-Free Fund (the “Fund”) which is a diversified series of the Trust.
2. SIGNIFICANT ACCOUNTING POLICIES
The following significant accounting policies, which are consistently followed in the preparation of the financial statements of the Fund, are in conformity with U.S. generally accepted accounting principles which require management to make estimates and assumptions that affect the reported amounts of assets and liabilities, disclosure of contingent assets and liabilities at the date of the financial statements, and the reported amounts of revenues and expenses during the reporting period. Actual results could differ from those estimates.
Securities valuation
All investments are valued each business day as of the close of regular trading on the New York Stock Exchange (generally 4 p.m. Eastern Time).
Fixed income securities acquired with maturities exceeding 60 days are valued based on evaluated bid prices provided by an independent pricing service which may utilize both transaction data and market information such as yield, quality, coupon rate, maturity, type of issue, trading characteristics and other market data. If prices are not available from the independent pricing service or prices received are deemed not representative of market value, prices will be obtained from an independent broker-dealer.
Short-term securities, with maturities of 60 days or less at time of purchase, generally are valued at amortized cost which approximates fair value. The amortized cost method involves valuing a security at its cost, plus accretion of discount or minus amortization of premium over the period until maturity.
Investments which are not valued using any of the methods discussed above are valued at their fair value, as determined in good faith by the Board of Trustees of the Fund. The Board of Trustees has established a Valuation Committee comprised of the Trustees and has delegated to it the authority to take any actions regarding the valuation of portfolio securities that the Valuation Committee deems necessary or appropriate, including determining the fair value of portfolio securities, unless the determination has been delegated to the Management Valuation Team of Wells Fargo Funds Management, LLC (“Funds Management”). The Board of Trustees retains the authority to make or ratify any valuation decisions or approve any changes to the Valuation Procedures as it deems appropriate. On a quarterly basis, the Board of Trustees receives reports on any valuation actions taken by the Valuation Committee or the Management Valuation Team which may include items for ratification.
Valuations of fair valued securities are compared to the next actual sales price when available, or other appropriate market values, to assess the continued appropriateness of the fair valuation methodologies used. These securities are fair valued on a day-to-day basis, taking into consideration changes to appropriate market information and any significant changes to the inputs considered in the valuation process until there is a readily available price provided on an exchange or by an independent pricing service. Valuations received from an independent pricing service or independent broker-dealer quotes are periodically validated by comparisons to most recent trades and valuations provided by other independent pricing services in addition to the review of prices by the adviser and/or subadviser. Unobservable inputs used in determining fair valuations are identified based on the type of security, taking into consideration factors utilized by market participants in valuing the investment, knowledge about the issuer and the current market environment.
When-issued transactions
The Fund may purchase securities on a forward commitment or when-issued basis. The Fund records a when-issued transaction on the trade date and will segregate assets in an amount at least equal in value to the Fund’s commitment to purchase when-issued securities. Securities purchased on a when-issued basis are marked-to-market daily and the Fund begins earning interest on the settlement date. Losses may arise due to changes in the market value of the underlying securities or if the counterparty does not perform under the contract.
Security transactions and income recognition
Securities transactions are recorded on a trade date basis. Realized gains or losses are recorded on the basis of identified cost.
Interest income is accrued daily and bond discounts are accreted and premiums are amortized daily based on the effective interest method. To the extent debt obligations are placed on non-accrual status, any related interest income
| | | | | | |
| Notes to financial statements (unaudited) | | Wells Fargo Advantage Wisconsin Tax-Free Fund | | | 19 | |
may be reduced by writing off interest receivables when the collection of all or a portion of interest has become doubtful based on consistently applied procedures. If the issuer subsequently resumes interest payments or when the collectability of interest is reasonably assured, the debt obligation is removed from non-accrual status.
Distributions to shareholders
Distributions to shareholders from net investment income are accrued daily and paid monthly. Distributions from net realized gains, if any, are recorded on the ex-dividend date. Such distributions are determined in conformity with federal income tax regulations, which may differ in amount or character from net investment income and realized gains recognized for purposes of U.S. generally accepted accounting principles.
Federal and other taxes
The Fund intends to continue to qualify as a regulated investment company by distributing substantially all of its investment company taxable and tax-exempt income and any net realized capital gains (after reduction for capital loss carryforwards) sufficient to relieve it from all, or substantially all, federal income taxes. Accordingly, no provision for federal income taxes was required.
The Fund’s income and federal excise tax returns and all financial records supporting those returns for the prior three fiscal years are subject to examination by the federal and Delaware revenue authorities. Management has analyzed the Fund’s tax positions taken on federal, state, and foreign tax returns for all open tax years and does not believe that there are any uncertain tax positions that require recognition of a tax liability.
As of June 30, 2014, the Fund had $312,233 of current year deferred post-October capital losses which were recognized on the first day of the current fiscal year.
Class allocations
The separate classes of shares offered by the Fund differ principally in applicable sales charges, distribution, shareholder servicing, and administration fees. Class specific expenses are charged directly to that share class. Investment income, common expenses, and realized and unrealized gains (losses) on investments are allocated daily to each class of shares based on the relative proportion of net assets of each class.
3. FAIR VALUATION MEASUREMENTS
Fair value measurements of investments are determined within a framework that has established a fair value hierarchy based upon the various data inputs utilized in determining the value of the Fund’s investments. The three-level hierarchy gives the highest priority to unadjusted quoted prices in active markets for identical assets or liabilities (Level 1) and the lowest priority to significant unobservable inputs (Level 3). The Fund’s investments are classified within the fair value hierarchy based on the lowest level of input that is significant to the fair value measurement. The inputs are summarized into three broad levels as follows:
| n | | Level 1 – quoted prices in active markets for identical securities |
| n | | Level 2 – other significant observable inputs (including quoted prices for similar securities, interest rates, prepayment speeds, credit risk, use of amortized cost, etc.) |
| n | | Level 3 – significant unobservable inputs (including the Fund’s own assumptions in determining the fair value of investments) |
The inputs or methodologies used for valuing investments in securities are not necessarily an indication of the risk associated with investing in those securities.
The following is a summary of the inputs used in valuing the Fund’s assets and liabilities as of December 31, 2014:
| | | | | | | | | | | | | | | | |
| | | Quoted prices
(Level 1) | | | Other significant
observable inputs
(Level 2) | | | Significant
unobservable inputs
(Level 3) | | | Total | |
Assets | | | | | | | | | | | | | | | | |
Investments in: | | | | | | | | | | | | | | | | |
| | | | |
Municipal obligations | | $ | 0 | | | $ | 127,788,865 | | | $ | 0 | | | $ | 127,788,865 | |
Transfers in and transfers out are recognized at the end of the reporting period. At December 31, 2014, the Fund did not have any transfers into/out of Level 1, Level 2, or Level 3.
| | | | |
| 20 | | Wells Fargo Advantage Wisconsin Tax-Free Fund | | Notes to financial statements (unaudited) |
4. TRANSACTIONS WITH AFFILIATES
Advisory fee
The Trust has entered into an advisory contract with Funds Management, an indirect wholly owned subsidiary of Wells Fargo & Company (“Wells Fargo”). The adviser is responsible for implementing investment policies and guidelines and for supervising the subadviser, who is responsible for day-to-day portfolio management of the Fund.
Pursuant to the contract, Funds Management is entitled to receive an annual advisory fee starting at 0.35% and declining to 0.25% as the average daily net assets of the Fund increase. For the six months ended December 31, 2014, the advisory fee was equivalent to an annual rate of 0.35% of the Fund’s average daily net assets.
Funds Management has retained the services of a subadviser to provide daily portfolio management to the Fund. The fee for subadvisory services is borne by Funds Management. Wells Capital Management Incorporated, an affiliate of Funds Management and an indirect wholly owned subsidiary of Wells Fargo, is the subadviser to the Fund and is entitled to receive a fee from Funds Management at an annual rate starting at 0.20% and declining to 0.10% as the average daily net assets of the Fund increase.
Administration fees
The Trust has entered into an administration agreement with Funds Management. Under this agreement, for providing administrative services, which includes paying fees and expenses for services provided by the transfer agent, sub-transfer agents, omnibus account servicers and record-keepers, Funds Management is entitled to receive from the Fund an annual fund level administration fee starting at 0.05% and declining to 0.03% as the average daily net assets of the Fund increase and a class level administration fee which is calculated based on the average daily net assets of each class as follows:
| | | | |
| | | Class level
administration fee | |
Class A, Class C | | | 0.16 | % |
Investor Class | | | 0.19 | |
Funds Management has contractually waived and/or reimbursed advisory and administration fees to the extent necessary to maintain certain net operating expense ratios for the Fund. Waiver of fees and/or reimbursement of expenses by Funds Management were made first from fund level expenses on a proportionate basis and then from class specific expenses. Funds Management has committed through October 31, 2015 to waive fees and/or reimburse expenses to the extent necessary to cap the Fund’s expenses at 0.70% for Class A shares, 1.45% for Class C shares, and 0.73% for Investor Class shares. After this time, the cap may be increased or the commitment to maintain the cap may be terminated only with the approval of the Board of Trustees.
Distribution fee
The Trust has adopted a Distribution Plan for Class C shares of the Fund pursuant to Rule 12b-1 under the 1940 Act. A distribution fee is charged to Class C shares and paid to Wells Fargo Funds Distributor, LLC (“Funds Distributor”), the principal underwriter, at an annual rate of 0.75% of the average daily net assets of Class C shares.
In addition, Funds Distributor is entitled to receive the front-end sales charge from the purchase of Class A shares and a contingent deferred sales charge on the redemption of certain shares. Funds Distributor is also entitled to receive the contingent deferred sales charges from redemptions of Class C shares. For the six months ended December 31, 2014, Funds Distributor received $1,085 from the sale of Class A shares and $79 in contingent deferred sales charges from redemptions of Class C shares.
Shareholder servicing fees
The Trust has entered into contracts with one or more shareholder servicing agents, whereby Class A, Class C, and Investor Class of the Fund is charged a fee at an annual rate of 0.25% of the average daily net assets of each respective class.
A portion of these total shareholder servicing fees were paid to affiliates of Wells Fargo.
5. INVESTMENT PORTFOLIO TRANSACTIONS
Purchases and sales of investments, excluding U.S. government obligations (if any) and short-term securities, for the six months ended December 31, 2014 were $24,545,256 and $22,409,388, respectively.
| | | | | | |
| Notes to financial statements (unaudited) | | Wells Fargo Advantage Wisconsin Tax-Free Fund | | | 21 | |
6. BANK BORROWINGS
The Trust (excluding the money market funds and certain other funds in the Trust) and Wells Fargo Variable Trust are parties to a $150,000,000 revolving credit agreement, whereby the Fund is permitted to use bank borrowings for temporary or emergency purposes, such as to fund shareholder redemption requests. Interest under the credit agreement is charged to the Fund based on a borrowing rate equal to the higher of the Federal Funds rate in effect on that day plus 1.25% or the overnight LIBOR rate in effect on that day plus 1.25%. In addition, an annual commitment fee equal to 0.10% of the unused balance is allocated to each participating fund. For the six months ended December 31, 2014, the Fund paid $79 in commitment fees.
For the six months ended December 31, 2014, there were no borrowings by the Fund under the agreement.
7. CONCENTRATION RISK
The Fund invests a substantial portion of its assets in issuers of municipal debt securities located in a single state or territories of the U.S., therefore, it may be more affected by economic and political developments in that state or region than would be a comparable general tax-exempt fund.
8. INDEMNIFICATION
Under the Trust’s organizational documents, the officers and Trustees are indemnified against certain liabilities that may arise out of performance of their duties to the Trust. Additionally, in the normal course of business, the Trust may enter into contracts with service providers that contain a variety of indemnification clauses. The Trust’s maximum exposure under these arrangements is dependent on future claims that may be made against the Fund and, therefore, cannot be estimated.
| | | | |
| 22 | | Wells Fargo Advantage Wisconsin Tax-Free Fund | | Other information (unaudited) |
PROXY VOTING INFORMATION
A description of the policies and procedures that the Fund uses to determine how to vote proxies relating to portfolio securities is available without charge, upon request, by calling 1-800-222-8222, visiting our website at wellsfargoadvantagefunds.com, or visiting the SEC website at sec.gov. Information regarding how the Fund voted proxies relating to portfolio securities during the most recent 12-month period ended June 30 is available on the Fund’s website at wellsfargoadvantagefunds.com or by visiting the SEC website at sec.gov.
PORTFOLIO HOLDINGS INFORMATION
The complete portfolio holdings for the Fund are publicly available monthly on the Fund’s website (wellsfargoadvantagefunds.com), on a one-month delayed basis. In addition, top ten holdings information (excluding derivative positions) for the Fund is publicly available on the Fund’s website on a monthly, seven-day or more delayed basis. The Fund files its complete schedule of portfolio holdings with the SEC for the first and third quarters of each fiscal year on Form N-Q, which is available by visiting the SEC website at sec.gov. In addition, the Fund’s Form N-Q may be reviewed and copied at the SEC’s Public Reference Room in Washington, DC, and at regional offices in New York City, at 233 Broadway, and in Chicago, at 175 West Jackson Boulevard, Suite 900. Information about the Public Reference Room may be obtained by calling 1-800-SEC-0330.
| | | | | | |
| Other information (unaudited) | | Wells Fargo Advantage Wisconsin Tax-Free Fund | | | 23 | |
BOARD OF TRUSTEES AND OFFICERS
Each of the Trustees and Officers1 listed in the table below acts in identical capacities for each fund in the Wells Fargo Advantage family of funds, which consists of 134 mutual funds comprising the Wells Fargo Funds Trust, Wells Fargo Variable Trust, Wells Fargo Master Trust and four closed-end funds (collectively the “Fund Complex”). This table should be read in conjunction with the Prospectus and the Statement of Additional Information2. The mailing address of each Trustee and Officer is 525 Market Street, 12th Floor, San Francisco, CA 94105. Each Trustee and Officer serves an indefinite term, however, each Trustee serves such term until reaching the mandatory retirement age established by the Trustees.
Independent Trustees
| | | | | | |
Name and
year of birth | | Position held and
length of service* | | Principal occupations during past five years or longer | | Other
directorships during
past five years |
| Peter G. Gordon (Born 1942) | | Trustee, since 1998; Chairman, since 2005 | | Co-Founder, Retired Chairman, President and CEO of Crystal Geyser Water Company. Trustee Emeritus, Colby College. | | Asset Allocation Trust |
| Isaiah Harris, Jr. (Born 1952) | | Trustee, since 2009 | | Retired. Prior thereto, President and CEO of BellSouth Advertising and Publishing Corp. from 2005 to 2007, President and CEO of BellSouth Enterprises from 2004 to 2005 and President of BellSouth Consumer Services from 2000 to 2003. Emeritus member of the Iowa State University Foundation Board of Governors. Emeritus Member of the Advisory Board of Iowa State University School of Business. Advisory Board Member, Palm Harbor Academy. Mr. Harris is a certified public accountant. | | CIGNA Corporation; Asset Allocation Trust |
| Judith M. Johnson (Born 1949) | | Trustee, since 2008; Audit Committee Chairman, since 2008 | | Retired. Prior thereto, Chief Executive Officer and Chief Investment Officer of Minneapolis Employees Retirement Fund from 1996 to 2008. Ms. Johnson is an attorney, certified public accountant and a certified managerial accountant. | | Asset Allocation Trust |
| Leroy Keith, Jr. (Born 1939) | | Trustee, since 2010** | | Chairman, Bloc Global Services (development and construction). Trustee of the Evergreen Funds complex (and its predecessors) from 1983 to 2010. Former Managing Director, Almanac Capital Management (commodities firm), former Partner, Stonington Partners, Inc. (private equity fund), former Director, Obagi Medical Products Co. and former Director, Lincoln Educational Services. | | Trustee, Virtus Fund Complex (consisting of 50 portfolios as of 12/16/2013); Asset Allocation Trust |
| David F. Larcker (Born 1950) | | Trustee, since 2009 | | James Irvin Miller Professor of Accounting at the Graduate School of Business, Stanford University, Morgan Stanley Director of the Center for Leadership Development and Research and Senior Faculty of The Rock Center for Corporate Governance since 2006. From 2005 to 2008, Professor of Accounting at the Graduate School of Business, Stanford University. Prior thereto, Ernst & Young Professor of Accounting at The Wharton School, University of Pennsylvania from 1985 to 2005. | | Asset Allocation Trust |
| Olivia S. Mitchell (Born 1953) | | Trustee, since 2006 | | International Foundation of Employee Benefit Plans Professor, Wharton School of the University of Pennsylvania since 1993. Director of Wharton’s Pension Research Council and Boettner Center on Pensions & Retirement Research, and Research Associate at the National Bureau of Economic Research. Previously, Cornell University Professor from 1978 to 1993. | | Asset Allocation Trust |
| Timothy J. Penny (Born 1951) | | Trustee, since 1996 | | President and CEO of Southern Minnesota Initiative Foundation, a non-profit organization, since 2007 and Senior Fellow at the Humphrey Institute Policy Forum at the University of Minnesota since 1995. Member of the Board of Trustees of NorthStar Education Finance, Inc., a non-profit organization, since 2007. | | Asset Allocation Trust |
| | | | |
| 24 | | Wells Fargo Advantage Wisconsin Tax-Free Fund | | Other information (unaudited) |
| | | | | | |
Name and
year of birth | | Position held and
length of service* | | Principal occupations during past five years or longer | | Other
directorships during
past five years |
| Michael S. Scofield (Born 1943) | | Trustee, since 2010 | | Served on the Investment Company Institute’s Board of Governors and Executive Committee from 2008-2011 as well the Governing Council of the Independent Directors Council from 2006-2011 and the Independent Directors Council Executive Committee from 2008-2011. Chairman of the IDC from 2008-2010. Institutional Investor (Fund Directions) Trustee of Year in 2007. Trustee of the Evergreen Funds complex (and its predecessors) from 1984 to 2010. Chairman of the Evergreen Funds from 2000-2010. Former Trustee of the Mentor Funds. Retired Attorney, Law Offices of Michael S. Scofield. | | Asset Allocation Trust |
| Donald C. Willeke (Born 1940) | | Trustee, since 1996 | | Principal of the law firm of Willeke & Daniels. General Counsel of the Minneapolis Employees Retirement Fund from 1984 until its consolidation into the Minnesota Public Employees Retirement Association on June 30, 2010. Director and Vice Chair of The Tree Trust (non-profit corporation). Director of the American Chestnut Foundation (non-profit corporation). | | Asset Allocation Trust |
| * | Length of service dates reflect the Trustee’s commencement of service with the Trust’s predecessor entities, where applicable. |
| ** | Leroy Keith, Jr. retired as a Trustee effective December 31, 2014. |
Officers
| | | | | | |
Name and
year of birth | | Position held and
length of service | | Principal occupations during past five years or longer | | |
| Karla M. Rabusch (Born 1959) | | President, since 2003 | | Executive Vice President of Wells Fargo Bank, N.A. and President of Wells Fargo Funds Management, LLC since 2003. | | |
Nancy Wiser1
(Born 1967) | | Treasurer, since 2012 | | Executive Vice President of Wells Fargo Funds Management, LLC since 2011. Chief Operating Officer and Chief Compliance Officer at LightBox Capital Management LLC, from 2008 to 2011. Owned and operated a consulting business providing services to various hedge funds including acting as Chief Operating Officer and Chief Compliance Officer for a hedge fund from 2007 to 2008. Chief Operating Officer and Chief Compliance Officer of GMN Capital LLC from 2006 to 2007. | | |
| C. David Messman (Born 1960) | | Secretary, since 2000; Chief Legal Officer, since 2003 | | Assistant General Counsel of Wells Fargo Bank, N.A. since 2013 and Vice President and Managing Counsel of Wells Fargo Bank N.A. from 1996 to 2013. Senior Vice President and Secretary of Wells Fargo Funds Management , LLC since 2001. | | |
Debra Ann Early
(Born 1964) | | Chief Compliance Officer, since 2007 | | Senior Vice President of Wells Fargo Funds Management, LLC since 2007 and Chief Compliance Officer from 2007 to 2014. Chief Compliance Officer of Parnassus Investments from 2005 to 2007. Chief Financial Officer of Parnassus Investments from 2004 to 2007 and Senior Audit Manager of PricewaterhouseCoopers LLP from 1998 to 2004. | | |
David Berardi
(Born 1975) | | Assistant Treasurer, since 2009 | | Vice President of Wells Fargo Funds Management, LLC since 2009. Vice President of Evergreen Investment Management Company, LLC from 2008 to 2010. Assistant Vice President of Evergreen Investment Services, Inc. from 2004 to 2008. Manager of Fund Reporting and Control for Evergreen Investment Management Company, LLC from 2004 to 2010. | | |
| Jeremy DePalma1 (Born 1974) | | Assistant Treasurer, since 2009 | | Senior Vice President of Wells Fargo Funds Management, LLC since 2009. Senior Vice President of Evergreen Investment Management Company, LLC from 2008 to 2010. Vice President, Evergreen Investment Services, Inc. from 2004 to 2007. Head of the Fund Reporting and Control Team within Fund Administration from 2005 to 2010. | | |
| 1. | Nancy Wiser acts as Treasurer of 73 funds in the Fund Complex. Jeremy DePalma acts as Treasurer of 61 funds and Assistant Treasurer of 73 funds in the Fund Complex. |
| 2. | The Statement of Additional Information includes additional information about the Trustees and is available, without charge, upon request, by calling 1-800-222-8222 or by visiting the website at wellsfargoadvantagefunds.com. |
| | | | | | |
| List of abbreviations | | Wells Fargo Advantage Wisconsin Tax-Free Fund | | | 25 | |
The following is a list of common abbreviations for terms and entities that may have appeared in this report.
| ACA | — ACA Financial Guaranty Corporation |
| ADR | — American depositary receipt |
| ADS | — American depositary shares |
| AGC | — Assured Guaranty Corporation |
| AGM | — Assured Guaranty Municipal |
| Ambac | — Ambac Financial Group Incorporated |
| AMT | — Alternative minimum tax |
| BAN | — Bond anticipation notes |
| BHAC | — Berkshire Hathaway Assurance Corporation |
| CAB | — Capital appreciation bond |
| CCAB | — Convertible capital appreciation bond |
| CDA | — Community Development Authority |
| CDO | — Collateralized debt obligation |
| DRIVER | — Derivative inverse tax-exempt receipts |
| DW&P | — Department of Water & Power |
| DWR | — Department of Water Resources |
| ECFA | — Educational & Cultural Facilities Authority |
| EDA | — Economic Development Authority |
| EDFA | — Economic Development Finance Authority |
| ETF | — Exchange-traded fund |
| FDIC | — Federal Deposit Insurance Corporation |
| FFCB | — Federal Farm Credit Banks |
| FGIC | — Financial Guaranty Insurance Corporation |
| FHA | — Federal Housing Administration |
| FHLB | — Federal Home Loan Bank |
| FHLMC | — Federal Home Loan Mortgage Corporation |
| FICO | — The Financing Corporation |
| FNMA | — Federal National Mortgage Association |
| GDR | — Global depositary receipt |
| GNMA | — Government National Mortgage Association |
| HCFR | — Healthcare facilities revenue |
| HEFA | — Health & Educational Facilities Authority |
| HEFAR | — Higher education facilities authority revenue |
| HFA | — Housing Finance Authority |
| HFFA | — Health Facilities Financing Authority |
| HUD | — Department of Housing and Urban Development |
| IDA | — Industrial Development Authority |
| IDAG | — Industrial Development Agency |
| KRW | — Republic of Korea won |
| LIBOR | — London Interbank Offered Rate |
| LLC | — Limited liability company |
| LLLP | — Limited liability limited partnership |
| LLP | — Limited liability partnership |
| MBIA | — Municipal Bond Insurance Association |
| MFHR | — Multifamily housing revenue |
| MSTR | — Municipal securities trust receipts |
| MUD | — Municipal Utility District |
| National | — National Public Finance Guarantee Corporation |
| PCFA | — Pollution Control Financing Authority |
| PCL | — Public Company Limited |
| PCR | — Pollution control revenue |
| PFA | — Public Finance Authority |
| PFFA | — Public Facilities Financing Authority |
| PFOTER | — Puttable floating option tax-exempt receipts |
| plc | — Public limited company |
| PUTTER | — Puttable tax-exempt receipts |
| R&D | — Research & development |
| Radian | — Radian Asset Assurance |
| RAN | — Revenue anticipation notes |
| RDA | — Redevelopment Authority |
| RDFA | — Redevelopment Finance Authority |
| REIT | — Real estate investment trust |
| ROC | — Reset option certificates |
| SAVRS | — Select auction variable rate securities |
| SBA | — Small Business Authority |
| SFHR | — Single-family housing revenue |
| SFMR | — Single-family mortgage revenue |
| SPA | — Standby purchase agreement |
| SPDR | — Standard & Poor’s Depositary Receipts |
| STRIPS | — Separate trading of registered interest and |
| TAN | — Tax anticipation notes |
| TIPS | — Treasury inflation-protected securities |
| TRAN | — Tax revenue anticipation notes |
| TTFA | — Transportation Trust Fund Authority |
| TVA | — Tennessee Valley Authority |
This page is intentionally left blank.
This page is intentionally left blank.
This page is intentionally left blank.

For more information
More information about Wells Fargo Advantage Funds is available free upon request. To obtain literature, please write, email, visit the Fund’s website, or call:
Wells Fargo Advantage Funds
P.O. Box 8266
Boston, MA 02266-8266
Email: wfaf@wellsfargo.com
Website: wellsfargoadvantagefunds.com
Individual investors: 1-800-222-8222
Retail investment professionals: 1-888-877-9275
Institutional investment professionals: 1-866-765-0778
This report and the financial statements contained herein are submitted for the general information of the shareholders of Wells Fargo Advantage Funds. If this report is used for promotional purposes, distribution of the report must be accompanied or preceded by a current prospectus. Before investing, please consider the investment objectives, risks, charges, and expenses of the investment. For a current prospectus and, if available, a summary prospectus, containing this information, call 1-800-222-8222 or visit the Fund’s website at wellsfargoadvantagefunds.com. Read the prospectus carefully before you invest or send money.
Wells Fargo Funds Management, LLC, a wholly owned subsidiary of Wells Fargo & Company, provides investment advisory and administrative services for Wells Fargo Advantage Funds. Other affiliates of Wells Fargo & Company provide subadvisory and other services for the Funds. The Funds are distributed by Wells Fargo Funds Distributor, LLC, Member FINRA/SIPC, an affiliate of Wells Fargo & Company.
NOT FDIC INSURED ¡ NO BANK GUARANTEE ¡ MAY LOSE VALUE
© 2014 Wells Fargo Funds Management, LLC. All rights reserved.
| | |
 | | 230433 02-15 SA259/SAR259 12-14 |
Not applicable.
| ITEM 3. | AUDIT COMMITTEE FINANCIAL EXPERT |
Not applicable.
| ITEM 4. | PRINCIPAL ACCOUNTANT FEES AND SERVICES |
Not applicable.
| ITEM 5. | AUDIT COMMITTEE OF LISTED REGISTRANTS |
Not applicable.
A Portfolio of investments for each series of Wells Fargo Funds Trust is included as part of the report to shareholders filed under Item 1 of this Form, except for Wells Fargo Advantage Intermediate Tax/AMT-Free Fund, Wells Fargo Advantage Municipal Bond Fund and Wells Fargo Advantage Ultra Short-Term Municipal Income Fund which included a Summary portfolio of investments under Item 1. The Portfolios of investments for Wells Fargo Advantage Intermediate Tax/AMT-Free Fund, Wells Fargo Advantage Municipal Bond Fund and Wells Fargo Advantage Ultra Short-Term Municipal Income Fund are filed under this Item.
| | | | | | |
| Portfolio of investments—December 31, 2014 (unaudited) | | Wells Fargo Advantage Intermediate Tax/AMT-Free Fund | | | 1 | |
| | | | | | | | | | | | | | | | |
| Security name | | Interest rate | | | Maturity date | | | Principal | | | Value | |
| | | | | | | | | | | | | | | | |
| | | | |
Municipal Obligations: 98.15% | | | | | | | | | | | | | | | | |
| | | | |
| Alabama: 0.89% | | | | | | | | | | | | | | | | |
Alabama Public School & College Authority Capital Improvement (Tax Revenue) | | | 5.00 | % | | | 12-1-2017 | | | $ | 2,640,000 | | | $ | 2,958,727 | |
Jefferson County AL Warrants Series A (GO) | | | 4.90 | | | | 4-1-2021 | | | | 4,470,000 | | | | 4,819,241 | |
Mobile AL Industrial Development Board Alabama Power Company Series C (Industrial Development Revenue) ± | | | 5.00 | | | | 6-1-2034 | | | | 3,000,000 | | | | 3,028,110 | |
Mobile County AL Board of School Commissioners Series 2012 (Tax Revenue) | | | 5.00 | | | | 3-1-2032 | | | | 1,000,000 | | | | 1,125,330 | |
Tuscaloosa County AL IDA Gulf Opportunity Zone Hunt Refining Project Series A (Industrial Development Revenue, Sumitomo Mitsui Banking LOC) ø | | | 0.03 | | | | 6-1-2028 | | | | 8,000,000 | | | | 8,000,000 | |
| | | | |
| | | | | | | | | | | | | | | 19,931,408 | |
| | | | | | | | | | | | | | | | |
| | | | |
| Alaska: 1.82% | | | | | | | | | | | | | | | | |
Alaska Energy Authority Bradley Lake Fourth Series (Utilities Revenue, AGM Insured) | | | 6.00 | | | | 7-1-2015 | | | | 350,000 | | | | 360,087 | |
Alaska Housing Finance Corporation Series A (Housing Revenue, Landesbank Baden-Wuerttemberg SPA) ø | | | 0.14 | | | | 12-1-2041 | | | | 5,100,000 | | | | 5,100,000 | |
Alaska Housing Finance Corporation Series B (Housing Revenue, Landesbank Baden-Wuerttemberg SPA) ø | | | 0.14 | | | | 12-1-2041 | | | | 20,700,000 | | | | 20,700,000 | |
Alaska Housing Finance Corporation Series D (Housing Revenue, Landesbank Baden-Wuerttemberg SPA) ø | | | 0.14 | | | | 12-1-2041 | | | | 11,185,000 | | | | 11,185,000 | |
Alaska Railroad Corporation Series A (Miscellaneous Revenue, National Insured) | | | 5.00 | | | | 8-1-2020 | | | | 3,245,000 | | | | 3,558,597 | |
| | | | |
| | | | | | | | | | | | | | | 40,903,684 | |
| | | | | | | | | | | | | | | | |
| | | | |
| Arizona: 1.38% | | | | | | | | | | | | | | | | |
Arizona Sports & Tourism Authority Series A (Tax Revenue) | | | 4.00 | | | | 7-1-2020 | | | | 1,365,000 | | | | 1,478,022 | |
Arizona Sports & Tourism Authority Series A (Tax Revenue) | | | 5.00 | | | | 7-1-2021 | | | | 795,000 | | | | 909,981 | |
Arizona Sports & Tourism Authority Series A (Tax Revenue) | | | 5.00 | | | | 7-1-2022 | | | | 1,000,000 | | | | 1,153,770 | |
Greater Arizona Development Authority Infrastructure Pinal County Road Project Series 1 (Miscellaneous Revenue, National Insured) | | | 4.50 | | | | 8-1-2023 | | | | 2,755,000 | | | | 2,931,954 | |
Maricopa County AZ Elementary School District #28 Kyrene Elementary School Project 2010 Series B (GO) ± | | | 1.00 | | | | 7-1-2024 | | | | 1,575,000 | | | | 1,721,302 | |
Maricopa County AZ Elementary School District #28 Kyrene Elementary School Project 2010 Series B (GO) ± | | | 1.00 | | | | 7-1-2025 | | | | 1,270,000 | | | | 1,387,970 | |
Maricopa County AZ Elementary School District #28 Kyrene Elementary School Project 2010 Series B (GO) ± | | | 1.00 | | | | 7-1-2027 | | | | 420,000 | | | | 473,613 | |
Maricopa County AZ Elementary School District #28 Kyrene Elementary School Project 2010 Series B (GO) ± | | | 1.00 | | | | 7-1-2029 | | | | 960,000 | | | | 1,115,914 | |
Phoenix AZ Civic Improvement Corporation Series A (Airport Revenue) | | | 5.00 | | | | 7-1-2029 | | | | 5,000,000 | | | | 5,694,150 | |
Pima County AZ IDA New Plan Learning Project Series A (Education Revenue) | | | 7.75 | | | | 7-1-2035 | | | | 5,000,000 | | | | 5,029,050 | |
Pima County AZ IDA Series A (Education Revenue) | | | 7.00 | | | | 7-1-2021 | | | | 775,000 | | | | 776,597 | |
Pinal County AZ Electrical District #4 (Utilities Revenue) | | | 4.75 | | | | 12-1-2015 | | | | 315,000 | | | | 326,816 | |
San Luis AZ Pledged Excise Tax Series A (Tax Revenue, Build America Mutual Assurance Company Insured) | | | 5.00 | | | | 7-1-2027 | | | | 450,000 | | | | 521,906 | |
San Luis AZ Pledged Excise Tax Series A (Tax Revenue, Build America Mutual Assurance Company Insured) | | | 5.00 | | | | 7-1-2028 | | | | 700,000 | | | | 808,101 | |
San Luis AZ Pledged Excise Tax Series A (Tax Revenue, Build America Mutual Assurance Company Insured) | | | 5.00 | | | | 7-1-2030 | | | | 1,195,000 | | | | 1,370,008 | |
San Luis AZ Pledged Excise Tax Series A (Tax Revenue, Build America Mutual Assurance Company Insured) | | | 5.00 | | | | 7-1-2034 | | | | 3,680,000 | | | | 4,151,408 | |
San Luis AZ Pledged Excise Tax Series A (Tax Revenue, Build America Mutual Assurance Company Insured) | | | 5.00 | | | | 7-1-2038 | | | | 1,000,000 | | | | 1,115,210 | |
| | | | |
| | | | | | | | | | | | | | | 30,965,772 | |
| | | | | | | | | | | | | | | | |
| | | | |
| 2 | | Wells Fargo Advantage Intermediate Tax/AMT-Free Fund | | Portfolio of investments—December 31, 2014 (unaudited) |
| | | | | | | | | | | | | | | | |
| Security name | | Interest rate | | | Maturity date | | | Principal | | | Value | |
| | | | | | | | | | | | | | | | |
| | | | |
| Arkansas: 0.71% | | | | | | | | | | | | | | | | |
Pulaski County AR HCFR Catholic Healthcare Series B (Health Revenue, U.S. Bank NA SPA) ø | | | 0.10 | % | | | 12-1-2028 | | | $ | 15,900,000 | | | $ | 15,900,000 | |
| | | | | | | | | | | | | | | | |
| | | | |
| California: 11.71% | | | | | | | | | | | | | | | | |
Alameda CA Corridor Transportation Authority CAB Sub Lien Series A (Transportation Revenue, Ambac Insured) ¤ | | | 0.00 | | | | 10-1-2018 | | | | 5,570,000 | | | | 5,190,572 | |
Anaheim CA PFA Anaheim Convention Center Expansion Project Series A (Miscellaneous Revenue) | | | 5.00 | | | | 5-1-2039 | | | | 2,500,000 | | | | 2,792,050 | |
Bay Area CA Toll Authority Toll Bridge Revenue Series A (Transportation Revenue) ± | | | 1.29 | | | | 4-1-2036 | | | | 20,000,000 | | | | 20,464,200 | |
California (GO) | | | 5.25 | | | | 3-1-2024 | | | | 5,000,000 | | | | 5,925,950 | |
California (GO) | | | 5.25 | | | | 3-1-2030 | | | | 1,440,000 | | | | 1,677,067 | |
California (GO) | | | 6.00 | | | | 3-1-2033 | | | | 2,510,000 | | | | 3,079,268 | |
California Infrastructure & Economic Development Bank California Independent System Operator Series A (Utilities Revenue) | | | 5.25 | | | | 2-1-2024 | | | | 1,800,000 | | | | 1,807,686 | |
California Municipal Finance Authority (Utilities Revenue) | | | 5.00 | | | | 10-1-2025 | | | | 1,500,000 | | | | 1,892,295 | |
California Public Works Board Department of Corrections Project Series A (Miscellaneous Revenue, Ambac Insured) | | | 5.00 | | | | 12-1-2019 | | | | 2,285,000 | | | | 2,532,237 | |
California Public Works Board Department of General Services Buildings 8 & 9A (Miscellaneous Revenue) | | | 6.25 | | | | 4-1-2034 | | | | 2,750,000 | | | | 3,296,233 | |
California Public Works Board Regents University of California Series G (Miscellaneous Revenue) | | | 5.00 | | | | 12-1-2030 | | | | 12,110,000 | | | | 14,738,718 | |
California Public Works Board Series D (Miscellaneous Revenue) | | | 5.25 | | | | 12-1-2026 | | | | 1,000,000 | | | | 1,204,280 | |
California Public Works Board University of California Institute Project C (Miscellaneous Revenue) | | | 5.00 | | | | 4-1-2030 | | | | 1,350,000 | | | | 1,366,119 | |
California Public Works Board University of California Research Project Series L (Education Revenue, National Insured) | | | 5.25 | | | | 11-1-2028 | | | | 1,890,000 | | | | 1,968,492 | |
California Statewide CDA Series A (Education Revenue) | | | 6.90 | | | | 8-1-2031 | | | | 1,915,000 | | | | 2,211,748 | |
California Statewide CDA Series C (Health Revenue) | | | 5.25 | | | | 8-15-2031 | | | | 3,000,000 | | | | 3,414,150 | |
California Various Purposes (GO) | | | 6.00 | | | | 4-1-2038 | | | | 8,055,000 | | | | 9,663,261 | |
Cerritos CA Community College District Series D (GO) ¤ | | | 0.00 | | | | 8-1-2025 | | | | 1,800,000 | | | | 1,298,232 | |
Compton CA Community College District Election of 2002 CAB Series C (GO) ¤ | | | 0.00 | | | | 8-1-2029 | | | | 1,565,000 | | | | 802,814 | |
Compton CA Community College District Series C (GO) ¤ | | | 0.00 | | | | 8-1-2031 | | | | 2,400,000 | | | | 1,100,040 | |
Deutsche Bank SPEARs/LIFERs Trust Series DBE 1377 (GO, AGM/FGIC Insured, Deutsche Bank LIQ) ±144A | | | 0.22 | | | | 8-1-2033 | | | | 10,000,000 | | | | 10,000,000 | |
Emery CA Unified School District Election of 2010 Series A (GO, AGM Insured) | | | 6.25 | | | | 8-1-2031 | | | | 4,500,000 | | | | 5,601,825 | |
Golden State Tobacco Securitization Corporate California Tobacco Settlement Revenue Series A (Tobacco Revenue, AGM Insured) ¤ | | | 0.00 | | | | 6-1-2026 | | | | 7,500,000 | | | | 5,271,450 | |
Los Angeles CA DW&P Series D (Utilities Revenue) | | | 5.00 | | | | 7-1-2039 | | | | 2,500,000 | | | | 2,903,925 | |
Los Angeles CA DW&P Series D (Water & Sewer Revenue) | | | 5.00 | | | | 7-1-2044 | | | | 1,500,000 | | | | 1,730,310 | |
Los Angeles CA Metropolitan Transportation Authority Series A (Tax Revenue, Ambac Insured) | | | 5.00 | | | | 7-1-2035 | | | | 1,380,000 | | | | 1,413,368 | |
Los Angeles CA MetropolitanTransportation Authority Series A (Tax Revenue, Ambac Insured) | | | 5.00 | | | | 7-1-2035 | | | | 270,000 | | | | 276,404 | |
Los Angeles CA Schools Regionalized Business Services Project Series A (Miscellaneous Revenue, Ambac Insured) ¤ | | | 0.00 | | | | 8-1-2015 | | | | 1,100,000 | | | | 1,095,006 | |
M-S-R California Energy Authority Gas Series B (Utilities Revenue) | | | 7.00 | | | | 11-1-2034 | | | | 2,000,000 | | | | 2,847,120 | |
M-S-R California Energy Authority Gas Series C (Utilities Revenue) | | | 7.00 | | | | 11-1-2034 | | | | 5,000,000 | | | | 7,117,800 | |
Merrill Lynch PFOTER Series PT-4211 (GO, Dexia Credit Local SPA) ø144A | | | 0.23 | | | | 2-1-2025 | | | | 6,170,000 | | | | 6,170,000 | |
Montebello CA Unified School District (GO) %% | | | 5.00 | | | | 8-1-2032 | | | | 2,015,000 | | | | 2,346,206 | |
Montebello CA Unified School District (GO) %% | | | 5.00 | | | | 8-1-2033 | | | | 2,675,000 | | | | 3,102,117 | |
New Haven CA Unified School District CAB Project (GO, AGM Insured) ¤ | | | 0.00 | | | | 8-1-2033 | | | | 5,590,000 | | | | 2,629,424 | |
| | | | | | |
| Portfolio of investments—December 31, 2014 (unaudited) | | Wells Fargo Advantage Intermediate Tax/AMT-Free Fund | | | 3 | |
| | | | | | | | | | | | | | | | |
| Security name | | Interest rate | | | Maturity date | | | Principal | | | Value | |
| | | | | | | | | | | | | | | | |
| | | | |
| California (continued) | | | | | | | | | | | | | | | | |
Northern California Gas Authority #1 LIBOR Series B (Utilities Revenue) ± | | | 0.88 | % | | | 7-1-2027 | | | $ | 11,000,000 | | | $ | 10,108,890 | |
Northern California Power Agency Series A (Utilities Revenue) | | | 5.25 | | | | 8-1-2023 | | | | 5,150,000 | | | | 5,882,588 | |
Northern Humboldt CA High School District Election of 2010 Series A (GO) | | | 6.50 | | | | 8-1-2034 | | | | 1,145,000 | | | | 1,479,306 | |
Oakland CA Unified School District Alameda County Election of 2006 Project Series A (GO) | | | 6.50 | | | | 8-1-2020 | | | | 1,730,000 | | | | 2,065,724 | |
Oakland CA Unified School District Alameda County Election of 2012 (GO) | | | 6.25 | | | | 8-1-2028 | | | | 2,000,000 | | | | 2,419,200 | |
Oakland CA Unified School District Alameda County Election of 2012 (GO) | | | 6.25 | | | | 8-1-2030 | | | | 2,000,000 | | | | 2,417,500 | |
Oakland CA Unified School District Alameda County Series A (GO) | | | 6.25 | | | | 8-1-2019 | | | | 1,285,000 | | | | 1,507,408 | |
Oxnard CA School District Series A (GO, National Insured) | | | 5.75 | | | | 8-1-2030 | | | | 1,825,000 | | | | 2,260,482 | |
Pasadena CA PFA Rose Bowl Renovation Series A (Miscellaneous Revenue) | | | 5.00 | | | | 3-1-2021 | | | | 1,655,000 | | | | 1,939,991 | |
Patterson CA Unified School District CAB Election of 2008 Project Series B (GO, AGM Insured) ¤ | | | 0.00 | | | | 8-1-2033 | | | | 3,000,000 | | | | 1,353,300 | |
Peralta CA Community College District Alameda County (GO) | | | 5.00 | | | | 8-1-2023 | | | | 3,045,000 | | | | 3,689,931 | |
Peralta CA Community College District Alameda County (GO) | | | 5.00 | | | | 8-1-2024 | | | | 3,000,000 | | | | 3,618,390 | |
Richmond CA Joint Powers Financing Authority Point Potrero Series A (Miscellaneous Revenue) | | | 6.25 | | | | 7-1-2024 | | | | 2,700,000 | | | | 3,216,753 | |
Rio Hondo CA Community College District (GO) ¤ | | | 0.00 | | | | 8-1-2030 | | | | 2,315,000 | | | | 1,291,562 | |
Sacramento CA Municipal Utility District Series B (Utilities Revenue) | | | 5.00 | | | | 8-15-2030 | | | | 1,075,000 | | | | 1,274,015 | |
Sacramento County CA Airport Systems (Airport Revenue) | | | 5.00 | | | | 7-1-2025 | | | | 2,000,000 | | | | 2,316,700 | |
San Diego CA Community College District Election of 2012 (GO) | | | 5.00 | | | | 8-1-2032 | | | | 3,095,000 | | | | 3,608,677 | |
San Diego CA Unified School District Election of 1998 Series E-2 (GO, AGM Insured) | | | 5.50 | | | | 7-1-2027 | | | | 5,000,000 | | | | 6,526,600 | |
San Gorgonio CA Memorial Healthcare District (GO) | | | 7.00 | | | | 8-1-2029 | | | | 2,000,000 | | | | 2,327,520 | |
San Jose CA Libraries & Parks Project (GO) | | | 5.13 | | | | 9-1-2031 | | | | 6,110,000 | | | | 6,134,746 | |
San Jose CA Redevelopment Agency Series A-1 (Tax Revenue) | | | 5.50 | | | | 8-1-2030 | | | | 1,355,000 | | | | 1,513,156 | |
Santa Ana CA Financing Authority Police Administration and Holding Facilities Series A (Miscellaneous Revenue, National Insured) | | | 6.25 | | | | 7-1-2019 | | | | 500,000 | | | | 605,645 | |
Santa Ana CA Financing Authority Police Administration and Holding Facilities Series A (Miscellaneous Revenue, National Insured) | | | 6.25 | | | | 7-1-2019 | | | | 500,000 | | | | 596,480 | |
Southern California Public Power Authority Milford Wind Corridor Project #1 (Utilities Revenue) | | | 5.00 | | | | 7-1-2024 | | | | 5,000,000 | | | | 5,884,800 | |
Southern California Public Power Authority Natural Gas Project #1 Series A (Utilities Revenue) | | | 5.25 | | | | 11-1-2025 | | | | 3,280,000 | | | | 3,901,265 | |
Southern California Public Power Authority Southern Transmission Project Series S (Utilities Revenue) | | | 5.75 | | | | 7-1-2024 | | | | 2,000,000 | | | | 2,322,320 | |
Sylvan CA Unified School District CAB Election of 2006 (GO, AGM Insured) ¤ | | | 0.00 | | | | 8-1-2031 | | | | 2,590,000 | | | | 1,304,246 | |
Sylvan CA Unified School District CAB Election of 2006 (GO, AGM Insured) ¤ | | | 0.00 | | | | 8-1-2032 | | | | 2,800,000 | | | | 1,345,876 | |
Tustin CA Unified School District #88-1 Election of 2008 Series B (GO) | | | 6.00 | | | | 8-1-2036 | | | | 2,500,000 | | | | 3,056,925 | |
University of California Limited Project Series G (Health Revenue) | | | 5.25 | | | | 5-15-2030 | | | | 15,000,000 | | | | 17,923,050 | |
University of California Series G (Education Revenue) | | | 5.00 | | | | 5-15-2037 | | | | 10,390,000 | | | | 11,732,908 | |
University of California Series Q (Education Revenue) | | | 5.25 | | | | 5-15-2024 | | | | 2,155,000 | | | | 2,409,290 | |
Washington Township CA Health Care District Series A (Health Revenue) | | | 5.00 | | | | 7-1-2016 | | | | 300,000 | | | | 316,665 | |
Washington Township CA Health Care District Series A (Health Revenue) | | | 5.00 | | | | 7-1-2018 | | | | 445,000 | | | | 489,754 | |
Washington Township CA Health Care District Series A (Health Revenue) | | | 5.00 | | | | 7-1-2019 | | | | 905,000 | | | | 1,010,125 | |
Washington Township CA Health Care District Series A (Health Revenue) | | | 5.00 | | | | 7-1-2020 | | | | 1,300,000 | | | | 1,393,171 | |
Washington Township CA Health Care District Series A (Health Revenue) | | | 5.13 | | | | 7-1-2017 | | | | 260,000 | | | | 281,705 | |
West Contra Costa CA University (GO, AGM Insured) ¤ | | | 0.00 | | | | 8-1-2026 | | | | 4,620,000 | | | | 3,102,422 | |
| | | | |
| | | | | | | | | | | | | | | 263,559,453 | |
| | | | | | | | | | | | | | | | |
| | | | |
| Colorado: 0.34% | | | | | | | | | | | | | | | | |
Colorado ECFA Charter School Monument Academy Project Series A (Education Revenue) | | | 5.50 | | | | 10-1-2017 | | | | 570,000 | | | | 613,457 | |
| | | | |
| 4 | | Wells Fargo Advantage Intermediate Tax/AMT-Free Fund | | Portfolio of investments—December 31, 2014 (unaudited) |
| | | | | | | | | | | | | | | | |
| Security name | | Interest rate | | | Maturity date | | | Principal | | | Value | |
| | | | | | | | | | | | | | | | |
| | | | |
| Colorado (continued) | | | | | | | | | | | | | | | | |
Colorado ECFA First Academy Project (Education Revenue, Fifth Third Bank LOC) ø | | | 0.09 | % | | | 4-1-2038 | | | $ | 6,715,000 | | | $ | 6,715,000 | |
North Range CO Metropolitan District #1 (GO, ACA Insured) | | | 5.00 | | | | 12-15-2015 | | | | 250,000 | | | | 254,270 | |
| | | | |
| | | | | | | | | | | | | | | 7,582,727 | |
| | | | | | | | | | | | | | | | |
| | | | |
| Connecticut: 1.15% | | | | | | | | | | | | | | | | |
Connecticut Securities Industry & Financial Markets Association Index Series A (Miscellaneous Revenue) ± | | | 1.03 | | | | 3-1-2025 | | | | 2,400,000 | | | | 2,405,712 | |
Connecticut Series A (Miscellaneous Revenue) ± | | | 0.89 | | | | 3-1-2022 | | | | 3,000,000 | | �� | | 3,011,250 | |
Connecticut Series A (Miscellaneous Revenue) ± | | | 0.94 | | | | 3-1-2023 | | | | 3,000,000 | | | | 3,003,840 | |
Connecticut Series A (Miscellaneous Revenue) ± | | | 0.99 | | | | 3-1-2024 | | | | 5,500,000 | | | | 5,506,875 | |
Connecticut Series A (Miscellaneous Revenue) ± | | | 1.14 | | | | 4-15-2019 | | | | 2,300,000 | | | | 2,348,875 | |
Connecticut Series A (GO) ± | | | 1.29 | | | | 4-15-2020 | | | | 3,300,000 | | | | 3,382,038 | |
Hamden CT (GO) | | | 4.00 | | | | 8-15-2020 | | | | 1,235,000 | | | | 1,330,861 | |
Hamden CT (GO) | | | 4.00 | | | | 8-15-2021 | | | | 1,235,000 | | | | 1,331,972 | |
Hamden CT (GO, Build America Mutual Assurance Company Insured) | | | 4.00 | | | | 8-15-2022 | | | | 300,000 | | | | 331,608 | |
Hamden CT (GO, AGM Insured) | | | 5.00 | | | | 8-15-2021 | | | | 1,000,000 | | | | 1,163,560 | |
Hamden CT (GO, AGM Insured) | | | 5.00 | | | | 8-15-2022 | | | | 1,000,000 | | | | 1,174,430 | |
Hamden CT (GO, Build America Mutual Assurance Company Insured) | | | 5.00 | | | | 8-15-2025 | | | | 300,000 | | | | 342,279 | |
Hamden CT (GO, Build America Mutual Assurance Company Insured) | | | 5.00 | | | | 8-15-2026 | | | | 500,000 | | | | 567,995 | |
| | | | |
| | | | | | | | | | | | | | | 25,901,295 | |
| | | | | | | | | | | | | | | | |
| | | | |
| District of Columbia: 0.65% | | | | | | | | | | | | | | | | |
District of Columbia Federal Highway Grant Anticipation Bonds (Miscellaneous Revenue) | | | 5.00 | | | | 12-1-2023 | | | | 1,000,000 | | | | 1,191,980 | |
District of Columbia Federal Highway Grant Anticipation Bonds (Miscellaneous Revenue) | | | 5.00 | | | | 12-1-2025 | | | | 3,520,000 | | | | 4,144,272 | |
District of Columbia Federal Highway Grant Anticipation Bonds (Miscellaneous Revenue) | | | 5.25 | | | | 12-1-2025 | | | | 2,630,000 | | | | 3,101,954 | |
District of Columbia Howard University Series A (Education Revenue) | | | 5.75 | | | | 10-1-2026 | | | | 2,510,000 | | | | 2,833,062 | |
District of Columbia Medical Association of Colleges Series B (Miscellaneous Revenue) | | | 5.00 | | | | 10-1-2024 | | | | 3,095,000 | | | | 3,464,017 | |
| | | | |
| | | | | | | | | | | | | | | 14,735,285 | |
| | | | | | | | | | | | | | | | |
| | | | |
| Florida: 4.16% | | | | | | | | | | | | | | | | |
Boynton Beach FL Utilities Systems (Water & Sewer Revenue, National Insured) | | | 5.50 | | | | 11-1-2016 | | | | 1,500,000 | | | | 1,609,095 | |
Cityplace Florida Community Development District Special Assessment (Miscellaneous Revenue) | | | 5.00 | | | | 5-1-2021 | | | | 2,945,000 | | | | 3,284,824 | |
Daytona Beach FL Utility System (Water & Sewer Revenue, AGM Insured) | | | 5.00 | | | | 11-1-2022 | | | | 2,205,000 | | | | 2,635,240 | |
Escambia County FL School Board (Miscellaneous Revenue, National Insured) | | | 5.00 | | | | 2-1-2021 | | | | 4,720,000 | | | | 4,739,116 | |
Florida Development Finance Corporation Renaissance Charter School Series A (Education Revenue) | | | 5.00 | | | | 9-15-2020 | | | | 2,405,000 | | | | 2,507,766 | |
Florida HEFAR (Education Revenue) | | | 4.00 | | | | 4-1-2021 | | | | 1,000,000 | | | | 1,075,790 | |
Gulf Breeze FL Capital Funding Loan Program Series A (Miscellaneous Revenue, AGM Insured) | | | 5.00 | | | | 10-1-2017 | | | | 1,665,000 | | | | 1,837,977 | |
Gulf Breeze FL Capital Funding Loan Program Series B (Miscellaneous Revenue, AGM Insured) | | | 4.00 | | | | 10-1-2016 | | | | 1,000,000 | | | | 1,055,660 | |
Gulf Breeze FL Capital Funding Loan Program Series B (Miscellaneous Revenue, AGM Insured) | | | 4.00 | | | | 10-1-2017 | | | | 1,000,000 | | | | 1,076,900 | |
Gulf Breeze FL Local Government Loan Series J (Water & Sewer Revenue) ± | | | 4.10 | | | | 12-1-2020 | | | | 3,000,000 | | | | 3,138,270 | |
Gulf Breeze FL Local Government Loan Series J (Water & Sewer Revenue) ± | | | 4.20 | | | | 12-1-2020 | | | | 3,290,000 | | | | 3,494,638 | |
Gulf Breeze FL Miami Beach Local Government Series B (Miscellaneous Revenue, FGIC Insured) ± | | | 4.75 | | | | 12-1-2015 | | | | 125,000 | | | | 125,355 | |
| | | | | | |
| Portfolio of investments—December 31, 2014 (unaudited) | | Wells Fargo Advantage Intermediate Tax/AMT-Free Fund | | | 5 | |
| | | | | | | | | | | | | | | | |
| Security name | | Interest rate | | | Maturity date | | | Principal | | | Value | |
| | | | | | | | | | | | | | | | |
| | | | |
| Florida (continued) | | | | | | | | | | | | | | | | |
Miami FL HFA Jewish Home & Hospital Project (Health Revenue, SunTrust Bank LOC) ø | | | 0.22 | % | | | 8-1-2026 | | | $ | 7,350,000 | | | $ | 7,350,000 | |
Miami-Dade County FL Educational Facilities Authority University of Miami Series A (Education Revenue) | | | 5.25 | | | | 4-1-2016 | | | | 1,000,000 | | | | 1,055,030 | |
Miami-Dade County FL Public Services (Tax Revenue, AGM Insured) | | | 4.00 | | | | 10-1-2019 | | | | 3,440,000 | | | | 3,794,492 | |
Miami-Dade County FL Public Services (Tax Revenue, AGM Insured) | | | 4.00 | | | | 10-1-2020 | | | | 3,600,000 | | | | 3,993,768 | |
Miami-Dade County FL Public Services (Tax Revenue, AGM Insured) | | | 4.00 | | | | 4-1-2021 | | | | 2,485,000 | | | | 2,754,051 | |
Miami-Dade County FL School Board Certificates of Participation Series A (Miscellaneous Revenue) ± | | | 5.00 | | | | 5-1-2031 | | | | 3,000,000 | | | | 3,509,160 | |
Miami-Dade County FL School Board Certificates of Participation Series D (Miscellaneous Revenue) | | | 5.00 | | | | 11-1-2027 | | | | 6,600,000 | | | | 7,720,614 | |
Miami-Dade County FL Special Obligation Series A (Tax Revenue) | | | 5.00 | | | | 10-1-2023 | | | | 700,000 | | | | 826,224 | |
Miami-Dade County FL Water & Sewer Refunding Bond Series C (Water & Sewer Revenue, BHAC Insured) | | | 5.00 | | | | 10-1-2024 | | | | 2,950,000 | | | | 3,320,078 | |
Miami-Dade County FL Water & Sewer Series C (Water & Sewer Revenue) | | | 5.25 | | | | 10-1-2022 | | | | 3,000,000 | | | | 3,421,230 | |
North Brevard County FL Hospital District Parrish Medical Center Project (Health Revenue) | | | 5.00 | | | | 10-1-2015 | | | | 930,000 | | | | 957,110 | |
Orange County FL IDA Various Central Florida Kidney Centers (Industrial Development Revenue, SunTrust Bank LOC) ø | | | 0.22 | | | | 12-1-2020 | | | | 2,250,000 | | | | 2,250,000 | |
Orange County FL School Board Certificates Partner Series A (Miscellaneous Revenue, National Insured) | | | 5.00 | | | | 8-1-2016 | | | | 1,000,000 | | | | 1,069,420 | |
Orlando FL Capital Improvement Special Revenue Bonds B Series B (Miscellaneous Revenue) | | | 5.00 | | | | 10-1-2031 | | | | 2,835,000 | | | | 3,332,089 | |
Palm Beach County FL PFOTER Series 4615 (Miscellaneous Revenue, Dexia Credit Local LIQ) ø | | | 0.31 | | | | 8-1-2029 | | | | 10,000,000 | | | | 10,000,000 | |
Putnam County FL Development Authority PCR Seminole Project Series A (Utilities Revenue, Ambac Insured) ± | | | 5.35 | | | | 3-15-2042 | | | | 5,260,000 | | | | 5,934,963 | |
Seminole Tribe of Florida Special Obligation Series A (Miscellaneous Revenue) 144A | | | 5.50 | | | | 10-1-2024 | | | | 2,500,000 | | | | 2,714,000 | |
South Lake County FL Hospital District South Lake Hospital Incorporated (Health Revenue) | | | 5.00 | | | | 10-1-2016 | | | | 1,015,000 | | | | 1,079,838 | |
South Lake County FL Hospital District South Lake Hospital Incorporated (Health Revenue) | | | 5.00 | | | | 10-1-2017 | | | | 900,000 | | | | 981,081 | |
University of South Florida Financing Corporation Certificate of Participation Master Lease Series A (Miscellaneous Revenue, Ambac Insured) | | | 5.00 | | | | 7-1-2018 | | | | 1,000,000 | | | | 1,016,920 | |
| | | | |
| | | | | | | | | | | | | | | 93,660,699 | |
| | | | | | | | | | | | | | | | |
| | | | |
| Georgia: 0.60% | | | | | | | | | | | | | | | | |
Georgia Municipal Electric Authority Power Revenue Unrefunded Balance (Utilities Revenue, National Insured) | | | 6.50 | | | | 1-1-2017 | | | | 20,000 | | | | 20,927 | |
Georgia Public Gas Partners Incorporated Series A (Utilities Revenue) | | | 5.00 | | | | 10-1-2017 | | | | 2,500,000 | | | | 2,776,650 | |
Georgia Public Gas Partners Incorporated Series A (Utilities Revenue) | | | 5.00 | | | | 10-1-2019 | | | | 5,000,000 | | | | 5,753,400 | |
Main Street Natural Gas Incorporated Georgia Gas Project Series A (Utilities Revenue) | | | 5.50 | | | | 9-15-2022 | | | | 1,000,000 | | | | 1,178,410 | |
Private Colleges & Universities Authority of Georgia Series A (Education Revenue) | | | 5.00 | | | | 10-1-2021 | | | | 3,330,000 | | | | 3,811,185 | |
| | | | |
| | | | | | | | | | | | | | | 13,540,572 | |
| | | | | | | | | | | | | | | | |
| | | | |
| Guam: 0.47% | | | | | | | | | | | | | | | | |
Guam Education Financing Foundation Certificate of Participation Guam Public School Facilities Project Series A (Miscellaneous Revenue) | | | 5.00 | | | | 10-1-2015 | | | | 1,000,000 | | | | 1,030,870 | |
Guam Education Financing Foundation Certificate of Participation Guam Public School Facilities Project Series A (Miscellaneous Revenue) | | | 5.00 | | | | 10-1-2017 | | | | 2,195,000 | | | | 2,315,023 | |
Guam Government Waterworks Authority (Water & Sewer Revenue) | | | 5.00 | | | | 7-1-2028 | | | | 1,000,000 | | | | 1,125,110 | |
| | | | |
| 6 | | Wells Fargo Advantage Intermediate Tax/AMT-Free Fund | | Portfolio of investments—December 31, 2014 (unaudited) |
| | | | | | | | | | | | | | | | |
| Security name | | Interest rate | | | Maturity date | | | Principal | | | Value | |
| | | | | | | | | | | | | | | | |
| | | | |
| Guam (continued) | | | | | | | | | | | | | | | | |
Guam Government Waterworks Authority (Water & Sewer Revenue) | | | 5.25 | % | | | 7-1-2020 | | | $ | 350,000 | | | $ | 398,888 | |
Guam Government Waterworks Authority (Water & Sewer Revenue) | | | 5.25 | | | | 7-1-2033 | | | | 2,500,000 | | | | 2,844,875 | |
Guam International Airport Authority (Airport Revenue) | | | 5.00 | | | | 10-1-2022 | | | | 1,000,000 | | | | 1,178,960 | |
Guam International Airport Authority (Airport Revenue) | | | 5.00 | | | | 10-1-2023 | | | | 1,500,000 | | | | 1,785,225 | |
| | | | |
| | | | | | | | | | | | | | | 10,678,951 | |
| | | | | | | | | | | | | | | | |
| | | | |
| Illinois: 22.19% | | | | | | | | | | | | | | | | |
Bolingbrook WIll & Du Page Counties IL Series A (GO, AGM Insured) | | | 5.00 | | | | 1-1-2022 | | | | 1,000,000 | | | | 1,162,420 | |
Bolingbrook Will & Du Page Counties IL Series A (GO, AGM Insured) | | | 5.00 | | | | 1-1-2023 | | | | 650,000 | | | | 760,487 | |
Bolingbrook Will & Du Page Counties IL Series A (GO, AGM Insured) | | | 5.00 | | | | 1-1-2024 | | | | 700,000 | | | | 823,592 | |
Bolingbrook Will & Du Page Counties IL Series A (GO, AGM Insured) | | | 5.00 | | | | 1-1-2032 | | | | 1,400,000 | | | | 1,600,032 | |
Champaign & Coles Counties IL Community College District #505 Series A (GO) | | | 4.00 | | | | 12-1-2018 | | | | 1,015,000 | | | | 1,112,704 | |
Chicago IL Board of Education (GO) | | | 5.00 | | | | 12-1-2031 | | | | 4,860,000 | | | | 5,025,629 | |
Chicago IL Board of Education (GO, National/FGIC Insured) | | | 5.25 | | | | 12-1-2023 | | | | 5,125,000 | | | | 5,681,011 | |
Chicago IL Board of Education CAB School Reform Series A (GO, National Insured) ¤ | | | 0.00 | | | | 12-1-2024 | | | | 7,750,000 | | | | 5,164,135 | |
Chicago IL Board of Education CAB School Reform Series B-1 (GO, National Insured) ¤ | | | 0.00 | | | | 12-1-2022 | | | | 20,000,000 | | | | 14,701,400 | |
Chicago IL Board of Education School Reform Board Series B-1 (GO, National Insured) ¤ | | | 0.00 | | | | 12-1-2021 | | | | 1,000,000 | | | | 772,120 | |
Chicago IL Board of Education Series A3 (GO) ± | | | 0.87 | | | | 3-1-2036 | | | | 10,000,000 | | | | 9,718,100 | |
Chicago IL Board of Education Series B (GO, Ambac Insured) | | | 5.00 | | | | 12-1-2021 | | | | 7,760,000 | | | | 7,926,374 | |
Chicago IL Board of Education Series C (GO) | | | 5.25 | | | | 12-1-2023 | | | | 9,980,000 | | | | 10,689,279 | |
Chicago IL CAB Project (GO, National Insured) | | | 5.44 | | | | 1-1-2018 | | | | 1,725,000 | | | | 1,814,890 | |
Chicago IL Metropolitan Reclamation Series B (GO) | | | 5.00 | | | | 12-1-2025 | | | | 2,500,000 | | | | 2,908,875 | |
Chicago IL O’Hare International Airport Senior Lien (Airport Revenue, AGM Insured) | | | 5.00 | | | | 1-1-2033 | | | | 1,000,000 | | | | 1,051,120 | |
Chicago IL O’Hare International Airport Senior Lien (Airport Revenue, AGM Insured) | | | 5.13 | | | | 1-1-2030 | | | | 2,610,000 | | | | 3,008,886 | |
Chicago IL O’Hare International Airport Senior Lien (Airport Revenue, AGM Insured) | | | 5.13 | | | | 1-1-2031 | | | | 3,335,000 | | | | 3,833,182 | |
Chicago IL O’Hare International Airport Senior Lien (Airport Revenue) | | | 5.25 | | | | 1-1-2032 | | | | 8,755,000 | | | | 10,146,870 | |
Chicago IL O’Hare International Airport Third Lien Series C (Airport Revenue, AGM Insured) | | | 5.25 | | | | 1-1-2025 | | | | 4,075,000 | | | | 4,623,251 | |
Chicago IL O’Hare International Airport Third Lien Series F (Airport Revenue) | | | 4.25 | | | | 1-1-2021 | | | | 735,000 | | | | 810,367 | |
Chicago IL Park District Series A (GO) | | | 5.00 | | | | 1-1-2036 | | | | 2,000,000 | | | | 2,186,120 | |
Chicago IL Park District Series C (GO) | | | 5.00 | | | | 1-1-2026 | | | | 1,395,000 | | | | 1,577,508 | |
Chicago IL Public Building Commission School Reform (Miscellaneous Revenue, National Insured) | | | 5.25 | | | | 12-1-2017 | | | | 3,555,000 | | | | 3,891,445 | |
Chicago IL Refunding Bond Series A (GO) | | | 5.00 | | | | 1-1-2027 | | | | 1,700,000 | | | | 1,812,863 | |
Chicago IL Second Lien (Water & Sewer Revenue) | | | 5.00 | | | | 11-1-2029 | | | | 1,490,000 | | | | 1,693,251 | |
Chicago IL Series A (GO, Ambac Insured) | | | 5.00 | | | | 1-1-2019 | | | | 2,500,000 | | | | 2,629,200 | |
Chicago IL Series A (GO) | | | 5.25 | | | | 1-1-2022 | | | | 3,820,000 | | | | 4,062,570 | |
Chicago IL Series A (GO) | | | 5.25 | | | | 1-1-2023 | | | | 4,475,000 | | | | 4,745,961 | |
Chicago IL Series A (GO) | | | 5.25 | | | | 1-1-2028 | | | | 1,750,000 | | | | 1,819,790 | |
Chicago IL Series A (GO, Build America Mutual Assurance Company Insured) | | | 5.25 | | | | 1-1-2037 | | | | 5,750,000 | | | | 5,964,475 | |
Chicago IL Series A Prerefunded Balance (GO, National Insured) | | | 5.65 | | | | 1-1-2028 | | | | 555,000 | | | | 590,276 | |
Chicago IL Series B (GO, AGM Insured) | | | 5.00 | | | | 1-1-2024 | | | | 1,300,000 | | | | 1,331,369 | |
Chicago IL Series C (GO) | | | 4.00 | | | | 1-1-2020 | | | | 1,505,000 | | | | 1,585,849 | |
Chicago IL Series C (GO) | | | 5.00 | | | | 1-1-2024 | | | | 3,695,000 | | | | 3,849,747 | |
Chicago IL Series G (GO, Ambac Insured) | | | 5.00 | | | | 12-1-2024 | | | | 16,865,000 | | | | 17,614,649 | |
Chicago IL Series J (GO, Ambac Insured) | | | 5.00 | | | | 12-1-2023 | | | | 365,000 | | | | 381,604 | |
Chicago IL Transit Authority Capital Grant Federal Transit Administration Section 5307-A (Transportation Revenue, AGM Insured) | | | 5.25 | | | | 6-1-2022 | | | | 500,000 | | | | 557,605 | |
Chicago IL Transit Authority Capital Grant Receipts Series A (Transportation Revenue, AGM Insured) | | | 6.00 | | | | 6-1-2024 | | | | 2,000,000 | | | | 2,315,440 | |
| | | | | | |
| Portfolio of investments—December 31, 2014 (unaudited) | | Wells Fargo Advantage Intermediate Tax/AMT-Free Fund | | | 7 | |
| | | | | | | | | | | | | | | | |
| Security name | | Interest rate | | | Maturity date | | | Principal | | | Value | |
| | | | | | | | | | | | | | | | |
| | | | |
| Illinois (continued) | | | | | | | | | | | | | | | | |
Chicago IL Transit Authority Sales Tax Receipts (Tax Revenue) | | | 5.25 | % | | | 12-1-2027 | | | $ | 2,600,000 | | | $ | 2,986,074 | |
Chicago IL Waste Water Transmission Refunding Bond Second Lien Series B (Water & Sewer Revenue, National Insured) | | | 5.00 | | | | 1-1-2030 | | | | 2,000,000 | | | | 2,117,860 | |
Chicago IL Waste Water Transmission Second Lien (Water & Sewer Revenue) | | | 5.00 | | | | 1-1-2022 | | | | 1,340,000 | | | | 1,571,753 | |
Chicago IL Waste Water Transmission Second Lien (Water & Sewer Revenue) | | | 5.00 | | | | 1-1-2023 | | | | 1,080,000 | | | | 1,248,653 | |
Chicago IL Waste Water Transmission Second Lien (Water & Sewer Revenue) | | | 5.00 | | | | 1-1-2024 | | | | 2,000,000 | | | | 2,291,620 | |
Chicago IL Waste Water Transmission Second Lien (Water & Sewer Revenue) | | | 5.00 | | | | 1-1-2029 | | | | 4,060,000 | | | | 4,550,204 | |
Chicago IL Waste Water Transmission Second Lien (Water & Sewer Revenue) | | | 5.00 | | | | 1-1-2030 | | | | 4,000,000 | | | | 4,469,600 | |
Chicago IL Waste Water Transmission Second Lien (Water & Sewer Revenue) | | | 5.00 | | | | 1-1-2032 | | | | 1,000,000 | | | | 1,134,780 | |
Chicago IL Waste Water Transmission Second Lien (Water & Sewer Revenue) | | | 5.00 | | | | 1-1-2033 | | | | 1,000,000 | | | | 1,129,780 | |
Chicago IL Waste Water Transmission Second Lien (Water & Sewer Revenue) | | | 5.00 | | | | 1-1-2034 | | | | 1,000,000 | | | | 1,125,640 | |
Chicago IL Water Revenue Second Lien (Water & Sewer Revenue) | | | 5.00 | | | | 11-1-2022 | | | | 1,730,000 | | | | 2,048,026 | |
Chicago IL Water Revenue Second Lien (Water & Sewer Revenue) | | | 5.00 | | | | 11-1-2023 | | | | 1,155,000 | | | | 1,357,864 | |
Chicago IL Water Revenue Second Lien (Water & Sewer Revenue) | | | 5.00 | | | | 11-1-2026 | | | | 2,000,000 | | | | 2,300,140 | |
Chicago IL Water Revenue Second Lien (Water & Sewer Revenue) | | | 5.00 | | | | 11-1-2028 | | | | 3,000,000 | | | | 3,429,480 | |
Chicago IL Water Revenue Second Lien (Water & Sewer Revenue) | | | 5.00 | | | | 11-1-2031 | | | | 5,000,000 | | | | 5,611,650 | |
Chicago IL Water Revenue Second Lien (Water & Sewer Revenue) | | | 5.00 | | | | 11-1-2033 | | | | 1,000,000 | | | | 1,136,320 | |
Chicago IL Water Revenue Second Lien Series A (Water & Sewer Revenue, Ambac Insured) | | | 5.00 | | | | 11-1-2032 | | | | 10,000,000 | | | | 10,561,500 | |
Cook County IL Community College District #508 (GO) | | | 5.25 | | | | 12-1-2025 | | | | 1,250,000 | | | | 1,483,175 | |
Cook County IL Community College District #508 (GO) | | | 5.25 | | | | 12-1-2027 | | | | 1,295,000 | | | | 1,526,248 | |
Cook County IL Community College District #508 (GO) | | | 5.25 | | | | 12-1-2028 | | | | 1,250,000 | | | | 1,466,450 | |
Cook County IL Community College District #508 (GO) | | | 5.25 | | | | 12-1-2030 | | | | 3,000,000 | | | | 3,496,500 | |
Cook County IL Community College District #508 (GO) | | | 5.25 | | | | 12-1-2031 | | | | 3,200,000 | | | | 3,718,784 | |
Cook County IL Series A (GO) | | | 5.25 | | | | 11-15-2022 | | | | 7,240,000 | | | | 8,319,918 | |
Cook County IL Series A (GO) | | | 5.25 | | | | 11-15-2023 | | | | 7,680,000 | | | | 8,825,549 | |
Cook County IL Series B (GO) | | | 5.00 | | | | 11-15-2023 | | | | 600,000 | | | | 706,596 | |
Cook County IL Series C (GO) | | | 5.00 | | | | 11-15-2021 | | | | 1,340,000 | | | | 1,546,306 | |
Deutsche Bank SPEARs/LIFERs Trust Series DBE 1360 (GO, AGM Insured, Deutsche Bank LIQ) ø144A | | | 0.16 | | | | 2-1-2039 | | | | 15,995,000 | | | | 15,995,000 | |
Du Page Cook & Will Counties IL Community College District #502 Series A (GO) | | | 5.00 | | | | 6-1-2022 | | | | 2,650,000 | | | | 3,189,381 | |
Du Page County IL (Transportation Revenue, AGM Insured) | | | 5.00 | | | | 1-1-2017 | | | | 2,020,000 | | | | 2,066,581 | |
Du Page County IL High School District (GO, AGM Insured) | | | 5.00 | | | | 1-1-2021 | | | | 1,000,000 | | | | 1,085,880 | |
Homer Glen Will & Cook Village Counties IL Series A (GO) | | | 4.00 | | | | 12-1-2019 | | | | 1,000,000 | | | | 1,097,530 | |
Homer Glen Will & Cook Village Counties IL Series A (GO) | | | 5.00 | | | | 12-1-2021 | | | | 1,015,000 | | | | 1,149,264 | |
Huntley IL Special Service Area # 9 (Tax Revenue, AGM Insured) | | | 4.60 | | | | 3-1-2017 | | | | 890,000 | | | | 921,764 | |
Illinois (GO) | | | 4.75 | | | | 4-1-2020 | | | | 2,650,000 | | | | 2,832,983 | |
Illinois (GO, AGM Insured) | | | 5.00 | | | | 9-1-2016 | | | | 585,000 | | | | 600,684 | |
Illinois (GO, Ambac Insured) | | | 5.00 | | | | 4-1-2020 | | | | 3,000,000 | | | | 3,030,570 | |
Illinois (GO, AGM Insured) | | | 5.00 | | | | 1-1-2023 | | | | 2,450,000 | | | | 2,667,634 | |
Illinois (Tax Revenue) | | | 5.00 | | | | 6-15-2023 | | | | 16,050,000 | | | | 19,312,965 | |
Illinois (Miscellaneous Revenue) | | | 5.00 | | | | 7-1-2023 | | | | 5,000,000 | | | | 5,637,500 | |
Illinois (Miscellaneous Revenue) | | | 5.00 | | | | 8-1-2024 | | | | 5,000,000 | | | | 5,524,800 | |
Illinois (GO, AGM Insured) | | | 5.00 | | | | 4-1-2026 | | | | 5,000,000 | | | | 5,612,250 | |
Illinois (Miscellaneous Revenue) | | | 5.50 | | | | 7-1-2026 | | | | 5,565,000 | | | | 6,344,323 | |
Illinois Education Facilities Authority (Miscellaneous Revenue) ± | | | 3.40 | | | | 11-1-2036 | | | | 1,275,000 | | | | 1,324,725 | |
Illinois Education Facilities Authority (Education Revenue, Syncora Guarantee Incorporated Insured) | | | 4.75 | | | | 12-1-2023 | | | | 1,445,000 | | | | 1,450,029 | |
Illinois Education Facilities Authority Field Museum (Miscellaneous Revenue) ± | | | 4.13 | | | | 11-1-2036 | | | | 4,560,000 | | | | 4,828,493 | |
Illinois Finance Authority DePaul University Series A (Education Revenue, Syncora Guarantee Incorporated Insured) | | | 5.00 | | | | 10-1-2019 | | | | 1,550,000 | | | | 1,587,386 | |
| | | | |
| 8 | | Wells Fargo Advantage Intermediate Tax/AMT-Free Fund | | Portfolio of investments—December 31, 2014 (unaudited) |
| | | | | | | | | | | | | | | | |
| Security name | | Interest rate | | | Maturity date | | | Principal | | | Value | |
| | | | | | | | | | | | | | | | |
| | | | |
| Illinois (continued) | | | | | | | | | | | | | | | | |
Illinois Finance Authority Student Housing Illinois State University Project (Education Revenue) | | | 5.50 | % | | | 4-1-2021 | | | $ | 4,495,000 | | | $ | 4,874,648 | |
Illinois Health Facilities Authority Mercy Hospital & Medical Center (Health Revenue) | | | 10.00 | | | | 1-1-2015 | | | | 135,000 | | | | 135,000 | |
Illinois Municipal Electric Agency Power Supply (Utilities Revenue, National Insured) | | | 5.00 | | | | 2-1-2023 | | | | 1,000,000 | | | | 1,043,890 | |
Illinois Municipal Electric Agency Power Supply (Utilities Revenue, National Insured) | | | 5.25 | | | | 2-1-2024 | | | | 2,500,000 | | | | 2,721,725 | |
Illinois Municipal Electric Agency Power Supply Series A (Utilities Revenue, National/FGIC Insured) | | | 5.25 | | | | 2-1-2023 | | | | 1,100,000 | | | | 1,198,131 | |
Illinois Refunded Balance (Tax Revenue) | | | 5.00 | | | | 6-15-2018 | | | | 175,000 | | | | 198,907 | |
Illinois Refunded Balance (Tax Revenue) | | | 5.00 | | | | 6-15-2018 | | | | 825,000 | | | | 933,545 | |
Illinois Regional Transportation Authority (Tax Revenue, AGM Insured) | | | 5.75 | | | | 6-1-2018 | | | | 6,790,000 | | | | 7,836,746 | |
Illinois Regional Transportation Authority (Tax Revenue, National/FHA Insured) | | | 6.50 | | | | 7-1-2026 | | | | 7,815,000 | | | | 10,463,347 | |
Illinois Sales Tax Revenue Build Illinois (Tax Revenue) | | | 5.00 | | | | 6-15-2029 | | | | 1,000,000 | | | | 1,155,460 | |
Illinois Series A (Tax Revenue) | | | 5.00 | | | | 6-1-2022 | | | | 485,000 | | | | 513,067 | |
Illinois Series A (GO) | | | 5.00 | | | | 4-1-2023 | | | | 4,500,000 | | | | 5,065,740 | |
Illinois Series A (GO, AGM Insured) | | | 5.00 | | | | 4-1-2024 | | | | 2,500,000 | | | | 2,821,500 | |
Illinois Series A (Miscellaneous Revenue, National Insured) | | | 5.25 | | | | 10-1-2015 | | | | 1,355,000 | | | | 1,360,583 | |
Illinois Sports Facilities Authority (Tax Revenue, AGM Insured) | | | 5.00 | | | | 6-15-2028 | | | | 2,500,000 | | | | 2,825,425 | |
Illinois Sports Facilities Authority (Tax Revenue, AGM Insured) | | | 5.25 | | | | 6-15-2030 | | | | 4,000,000 | | | | 4,615,040 | |
Illinois Sports Facilities Authority State Tax Supported Refunding Bonds (Tax Revenue, AGM Insured) | | | 5.25 | | | | 6-15-2032 | | | | 3,000,000 | | | | 3,432,480 | |
Illinois Toll Highway Authority Series A-1 (Transportation Revenue, AGM Insured) | | | 5.00 | | | | 1-1-2024 | | | | 4,650,000 | | | | 4,965,921 | |
Illinois Toll Highway Authority Series A-1 (Transportation Revenue) | | | 5.25 | | | | 1-1-2026 | | | | 3,500,000 | | | | 3,995,705 | |
Illinois Toll Highway Authority Series A2 (Transportation Revenue, AGM Insured, Bank of America NA SPA) ø | | | 0.07 | | | | 1-1-2031 | | | | 34,385,000 | | | | 34,385,000 | |
Illinois Unrefunded Balance Series A (Miscellaneous Revenue) | | | 5.00 | | | | 10-1-2016 | | | | 3,200,000 | | | | 3,212,064 | |
Kane Cook & Du Page Counties IL School District #46 (GO) | | | 4.50 | | | | 1-1-2024 | | | | 4,270,000 | | | | 4,742,860 | |
Kane County IL School District #129 (GO, National Insured) | | | 5.00 | | | | 2-1-2018 | | | | 1,750,000 | | | | 1,756,580 | |
Kane McHenry Cook & DeKalb Counties IL Unified School District (GO, Ambac Insured) | | | 5.00 | | | | 1-1-2024 | | | | 2,000,000 | | | | 2,155,120 | |
Kendall Kane & Will Counties IL Unified School District Series A (GO) | | | 5.00 | | | | 2-1-2023 | | | | 1,000,000 | | | | 1,147,180 | |
McHenry & Kane Counties IL Community Consolidated School District #158 (GO) | | | 5.63 | | | | 1-15-2031 | | | | 2,000,000 | | | | 2,381,880 | |
McHenry & Lake Counties IL Community Consolidated School District #26 (GO, AGM Insured) | | | 5.00 | | | | 2-1-2020 | | | | 1,455,000 | | | | 1,651,556 | |
Metropolitan Pier & Exposition Authority Illinois CAB FSA (Tax Revenue, AGM/MBIA Insured) ¤ | | | 0.00 | | | | 6-15-2030 | | | | 15,000,000 | | | | 7,866,450 | |
Metropolitan Pier & Exposition Authority Illinois Hospitality Facilities PFOTER Series 3554 (Miscellaneous Revenue, Dexia Credit Local LIQ) ø144A | | | 0.13 | | | | 7-1-2026 | | | | 12,890,000 | | | | 12,890,000 | |
Northern IIlinois Municipal Power Agency Prairie State Project Series A (Utilities Revenue, National Insured) | | | 5.00 | | | | 1-1-2021 | | | | 2,740,000 | | | | 3,005,890 | |
Northern Illinois University (Education Revenue, AGM Insured) | | | 5.00 | | | | 9-1-2022 | | | | 1,325,000 | | | | 1,514,661 | |
Northern Illinois University (Education Revenue, AGM Insured) | | | 5.00 | | | | 9-1-2024 | | | | 1,000,000 | | | | 1,153,380 | |
Northern Illinois University Auxiliary Facilities Revenue (Education Revenue, AGM Insured) | | | 5.00 | | | | 4-1-2019 | | | | 1,000,000 | | | | 1,116,440 | |
Southwestern Illinois Development Authority Local Government Program Collinsville Limited (Tax Revenue) | | | 5.00 | | | | 3-1-2025 | | | | 1,975,000 | | | | 1,643,990 | |
Springfield IL Senior Lien (Utilities Revenue, National Insured) | | | 5.00 | | | | 3-1-2022 | | | | 3,600,000 | | | | 3,875,652 | |
Springfield IL Senior Lien (Utilities Revenue, National Insured) | | | 5.00 | | | | 3-1-2023 | | | | 1,560,000 | | | | 1,671,134 | |
Tazewell County IL School District #51 (GO, National Insured) | | | 9.00 | | | | 12-1-2017 | | | | 455,000 | | | | 549,544 | |
Tazewell County IL School District #51 (GO, National Insured) | | | 9.00 | | | | 12-1-2018 | | | | 535,000 | | | | 676,887 | |
University of Illinois Auxiliary Facilities Systems (Education Revenue) ¤ | | | 0.00 | | | | 4-1-2020 | | | | 8,270,000 | | | | 7,315,394 | |
| | | | | | |
| Portfolio of investments—December 31, 2014 (unaudited) | | Wells Fargo Advantage Intermediate Tax/AMT-Free Fund | | | 9 | |
| | | | | | | | | | | | | | | | |
| Security name | | Interest rate | | | Maturity date | | | Principal | | | Value | |
| | | | | | | | | | | | | | | | |
| | | | |
| Illinois (continued) | | | | | | | | | | | | | | | | |
University of Illinois Auxiliary Facilities Systems Series A (Education Revenue, Ambac Insured) | | | 5.50 | % | | | 4-1-2024 | | | $ | 1,000,000 | | | $ | 1,249,160 | |
University of Illinois Board of Trustees Series B (Miscellaneous Revenue, AGM Insured) | | | 5.00 | | | | 10-1-2020 | | | | 2,000,000 | | | | 2,215,920 | |
University of Illinois Utility Infrastructure Projects Series 2004 (Education Revenue, Bank of New York Mellon SPA) ø | | | 0.08 | | | | 8-15-2021 | | | | 13,775,000 | | | | 13,775,000 | |
Will County IL Community Unified School District CAB (GO, National Insured) ¤ | | | 0.00 | | | | 11-1-2018 | | | | 9,730,000 | | | | 9,030,024 | |
| | | | |
| | | | | | | | | | | | | | | 499,503,284 | |
| | | | | | | | | | | | | | | | |
| | | | |
| Indiana: 2.08% | | | | | | | | | | | | | | | | |
Indiana Bond Bank Hendricks Regional Health Series A (Miscellaneous Revenue) | | | 4.00 | | | | 8-1-2017 | | | | 1,000,000 | | | | 1,078,610 | |
Indiana Bond Bank Hendricks Regional Health Series A (Miscellaneous Revenue) | | | 5.00 | | | | 8-1-2016 | | | | 1,340,000 | | | | 1,431,656 | |
Indiana Bond Bank Special Program Series A (Utilities Revenue) | | | 5.00 | | | | 10-15-2017 | | | | 5,410,000 | | | | 5,919,893 | |
Indiana Bond Bank Special Program Series A (Miscellaneous Revenue, AGM Insured) | | | 5.00 | | | | 9-1-2022 | | | | 1,545,000 | | | | 1,818,728 | |
Indiana Bond Bank Special Program Series A (Utilities Revenue) | | | 5.25 | | | | 10-15-2016 | | | | 600,000 | | | | 643,488 | |
Indiana Finance Authority Parkview Health System Series A (Health Revenue) | | | 5.50 | | | | 5-1-2024 | | | | 4,500,000 | | | | 5,151,195 | |
Indiana Finance Authority Wastewater Utilities Revenue CWA Authority Project Series A (Water & Sewer Revenue) | | | 5.00 | | | | 10-1-2030 | | | | 2,315,000 | | | | 2,729,524 | |
Indiana Finance Authority Wastewater Utilities Revenue CWA Authority Project Series A (Water & Sewer Revenue) | | | 5.00 | | | | 10-1-2031 | | | | 1,035,000 | | | | 1,214,552 | |
Indiana HEFA Ascension Health Series B3 (Health Revenue) ± | | | 1.91 | | | | 11-15-2031 | | | | 15,000,000 | | | | 15,081,900 | |
Jasper County IN PCR Northern Series A (Industrial Development Revenue, National Insured) | | | 5.60 | | | | 11-1-2016 | | | | 5,900,000 | | | | 6,316,363 | |
Jeffersonville IN Building Corporation First Mortgage Series C (Miscellaneous Revenue) | | | 4.25 | | | | 8-15-2017 | | | | 615,000 | | | | 647,251 | |
Knox County IN EDA Series A (Health Revenue) | | | 5.00 | | | | 4-1-2022 | | | | 925,000 | | | | 1,046,971 | |
Knox County IN EDA Series A (Health Revenue) | | | 5.00 | | | | 4-1-2023 | | | | 665,000 | | | | 745,771 | |
Knox County IN EDA Series A (Health Revenue) | | | 5.00 | | | | 4-1-2026 | | | | 750,000 | | | | 822,713 | |
Mount Vernon IN School Building Corporation Prerefunded Balance First Mortgage (Miscellaneous Revenue, AGM Insured) | | | 5.00 | | | | 7-15-2019 | | | | 265,000 | | | | 298,019 | |
Mount Vernon IN School Building Corporation Unrefunded Balance First Mortgage (Miscellaneous Revenue, AGM Insured) | | | 5.00 | | | | 7-15-2019 | | | | 735,000 | | | | 818,136 | |
University of Southern Indiana Student Fee Series J (Education Revenue, AGM Insured) | | | 5.00 | | | | 10-1-2019 | | | | 1,000,000 | | | | 1,147,720 | |
| | | | |
| | | | | | | | | | | | | | | 46,912,490 | |
| | | | | | | | | | | | | | | | |
| | | | |
| Iowa: 0.41% | | | | | | | | | | | | | | | | |
Iowa Student Loan Liquidity Corporation Series 1 (Education Revenue) | | | 5.25 | | | | 12-1-2017 | | | | 3,000,000 | | | | 3,321,330 | |
Iowa Student Loan Liquidity Corporation Series 1 (Education Revenue) | | | 5.25 | | | | 12-1-2018 | | | | 5,285,000 | | | | 5,970,729 | |
| | | | |
| | | | | | | | | | | | | | | 9,292,059 | |
| | | | | | | | | | | | | | | | |
| | | | |
| Kansas: 0.07% | | | | | | | | | | | | | | | | |
Kansas Development Finance Authority Health Facilities (Health Revenue) | | | 5.00 | | | | 11-15-2021 | | | | 1,300,000 | | | | 1,488,019 | |
| | | | | | | | | | | | | | | | |
| | | | |
| Kentucky: 0.86% | | | | | | | | | | | | | | | | |
Allen County KY Camp Courageous Project (Miscellaneous Revenue, SunTrust Bank LOC) ø | | | 0.24 | | | | 12-1-2025 | | | | 5,500,000 | | | | 5,500,000 | |
Kentucky Property & Buildings Commission Series A Project #95 (GO) | | | 5.00 | | | | 8-1-2019 | | | | 1,265,000 | | | | 1,459,253 | |
Kentucky Public Transportation Infrastructure Authority Downtown Crossing Project CAB Series B (Transportation Revenue) ¤ | | | 0.00 | | | | 7-1-2020 | | | | 1,000,000 | | | | 830,310 | |
| | | | |
| 10 | | Wells Fargo Advantage Intermediate Tax/AMT-Free Fund | | Portfolio of investments—December 31, 2014 (unaudited) |
| | | | | | | | | | | | | | | | |
| Security name | | Interest rate | | | Maturity date | | | Principal | | | Value | |
| | | | | | | | | | | | | | | | |
| | | | |
| Kentucky (continued) | | | | | | | | | | | | | | | | |
Kentucky Public Transportation Infrastructure Authority Downtown Crossing Project CAB Series B (Transportation Revenue) ¤ | | | 0.00 | % | | | 7-1-2021 | | | $ | 2,750,000 | | | $ | 2,185,673 | |
Kentucky Public Transportation Infrastructure Authority Downtown Crossing Project CAB Series B (Transportation Revenue) ¤ | | | 0.00 | | | | 7-1-2022 | | | | 4,320,000 | | | | 3,246,653 | |
Kentucky Public Transportation Infrastructure Authority Downtown Crossing Project CAB Series B (Transportation Revenue) ¤ | | | 0.00 | | | | 7-1-2025 | | | | 1,020,000 | | | | 625,250 | |
Kentucky Public Transportation Infrastructure Authority Downtown Crossing Project CAB Series B (Transportation Revenue) ¤ | | | 0.00 | | | | 7-1-2029 | | | | 1,400,000 | | | | 664,454 | |
University of Kentucky Certificate of Participation Master Street Lease #4 (Miscellaneous Revenue) | | | 4.45 | | | | 6-18-2018 | | | | 4,673,448 | | | | 4,957,780 | |
| | | | |
| | | | | | | | | | | | | | | 19,469,373 | |
| | | | | | | | | | | | | | | | |
| | | | |
| Louisiana: 1.43% | | | | | | | | | | | | | | | | |
Ascension Parish LA IDA Incorporated (Miscellaneous Revenue) | | | 6.00 | | | | 7-1-2036 | | | | 4,000,000 | | | | 4,340,520 | |
Bossier City LA Utilities Revenue (Water & Sewer Revenue) | | | 5.00 | | | | 10-1-2037 | | | | 2,000,000 | | | | 2,297,580 | |
DeSoto Parish LA PCR Southwestern Electrical Power (Utilities Revenue) ± | | | 3.25 | | | | 1-1-2019 | | | | 5,000,000 | | | | 5,000,300 | |
Louisiana Correctional Facilities Corporation (Miscellaneous Revenue, Ambac Insured) | | | 5.00 | | | | 9-1-2019 | | | | 1,000,000 | | | | 1,144,160 | |
Louisiana Local Government Environmental Facilities & CDA East Baton Rouge Series A (Water & Sewer Revenue) | | | 5.00 | | | | 2-1-2030 | | | | 1,000,000 | | | | 1,160,550 | |
Louisiana Local Government Environmental Facilities & CDA Trinity Properties (Housing Revenue, FNMA Insured, FNMA LIQ) ± | | | 4.25 | | | | 4-15-2039 | | | | 1,245,000 | | | | 1,275,527 | |
Louisiana Public Facilities Authority Archdiocese of New Orleans Project (Miscellaneous Revenue, CIFG Insured) | | | 5.00 | | | | 7-1-2016 | | | | 100,000 | | | | 105,295 | |
Louisiana Public Facilities Authority Archdiocese of New Orleans Project (Miscellaneous Revenue, CIFG Insured) | | | 5.00 | | | | 7-1-2017 | | | | 150,000 | | | | 161,415 | |
Louisiana Public Facilities Authority Black & Gold Facilities Project Series A (Housing Revenue, AGC Insured) | | | 4.00 | | | | 7-1-2015 | | | | 505,000 | | | | 513,969 | |
Louisiana Public Facilities Authority Black & Gold Facilities Project Series A (Housing Revenue, AGC Insured) | | | 4.25 | | | | 7-1-2017 | | | | 55,000 | | | | 58,488 | |
New Orleans LA Public Improvement Series A (GO, Radian Insured) | | | 5.00 | | | | 12-1-2016 | | | | 1,365,000 | | | | 1,468,822 | |
New Orleans LA Sewer Service (Water & Sewer Revenue, AGM Insured) | | | 5.50 | | | | 6-1-2016 | | | | 690,000 | | | | 740,253 | |
New Orleans LA Sewer Service (GO, FGIC Insured) | | | 5.50 | | | | 12-1-2016 | | | | 1,350,000 | | | | 1,465,736 | |
St. Bernard Parish LA Sales & Use Tax (Tax Revenue) | | | 4.00 | | | | 3-1-2023 | | | | 3,405,000 | | | | 3,732,255 | |
St. James Parish LA Nucor Steel LLC Project Gulf Opportunity Zone Series A1 (Industrial Development Revenue) ø | | | 0.22 | | | | 11-1-2040 | | | | 8,615,000 | | | | 8,615,000 | |
| | | | |
| | | | | | | | | | | | | | | 32,079,870 | |
| | | | | | | | | | | | | | | | |
| | | | |
| Maryland: 0.10% | | | | | | | | | | | | | | | | |
Maryland CDA Series A-2 (Miscellaneous Revenue) | | | 5.00 | | | | 6-1-2034 | | | | 1,400,000 | | | | 1,603,504 | |
Maryland Economic Development Corporation Salisbury University Project (Education Revenue) | | | 5.00 | | | | 6-1-2027 | | | | 500,000 | | | | 548,945 | |
| | | | |
| | | | | | | | | | | | | | | 2,152,449 | |
| | | | | | | | | | | | | | | | |
| | | | |
| Massachusetts: 2.15% | | | | | | | | | | | | | | | | |
Massachusetts Consolidated Loan Series C (Tax Revenue, AGM Insured) | | | 5.25 | | | | 8-1-2025 | | | | 5,000,000 | | | | 5,574,750 | |
Massachusetts Development Finance Agency Lasell College (Education Revenue) | | | 5.00 | | | | 7-1-2021 | | | | 2,820,000 | | | | 3,182,849 | |
Massachusetts Development Finance Agency Merrimack College Series A (Education Revenue) | | | 5.00 | | | | 7-1-2021 | | | | 1,035,000 | | | | 1,154,480 | |
Massachusetts Development Finance Agency Sabis International Charter Series A (Education Revenue) | | | 6.50 | | | | 4-15-2019 | | | | 1,350,000 | | | | 1,492,911 | |
| | | | | | |
| Portfolio of investments—December 31, 2014 (unaudited) | | Wells Fargo Advantage Intermediate Tax/AMT-Free Fund | | | 11 | |
| | | | | | | | | | | | | | | | |
| Security name | | Interest rate | | | Maturity date | | | Principal | | | Value | |
| | | | | | | | | | | | | | | | |
| | | | |
| Massachusetts (continued) | | | | | | | | | | | | | | | | |
Massachusetts Development Finance Agency Sabis International Charter Series A (Education Revenue) | | | 6.55 | % | | | 4-15-2020 | | | $ | 615,000 | | | $ | 688,659 | |
Massachusetts Educational Financing Authority Issue I (Education Revenue) | | | 5.50 | | | | 1-1-2018 | | | | 2,000,000 | | | | 2,238,840 | |
Massachusetts Educational Financing Authority Issue I Series A (Education Revenue) | | | 5.50 | | | | 1-1-2017 | | | | 2,000,000 | | | | 2,177,360 | |
Massachusetts HEFA Harvard University Series A (Education Revenue) | | | 5.00 | | | | 12-15-2029 | | | | 1,890,000 | | | | 2,201,396 | |
Massachusetts HEFA Various Partners Healthcare Series G-6 (Health Revenue) ± | | | 0.92 | | | | 7-1-2038 | | | | 14,000,000 | | | | 14,007,280 | |
Massachusetts Water Resources Authority Series DCL 005 (Water & Sewer Revenue, Dexia Credit Local LOC, AGM Insured) ø144A | | | 0.16 | | | | 8-1-2025 | | | | 15,700,000 | | | | 15,700,000 | |
| | | | |
| | | | | | | | | | | | | | | 48,418,525 | |
| | | | | | | | | | | | | | | | |
| | | | |
| Michigan: 5.55% | | | | | | | | | | | | | | | | |
Clinton MI Township Building Authority (Miscellaneous Revenue, Ambac Insured) | | | 5.50 | | | | 11-1-2017 | | | | 4,045,000 | | | | 4,269,498 | |
Detroit MI City School District (GO, Qualified School Board Loan Fund Insured) | | | 5.00 | | | | 5-1-2017 | | | | 595,000 | | | | 646,676 | |
Detroit MI City School District Building and Site Improvement Series A (GO, AGM/Qualified School Board Loan Fund Insured) | | | 5.00 | | | | 5-1-2019 | | | | 8,000,000 | | | | 8,106,400 | |
Detroit MI City School District PFOTER-3556 (GO, FGIC/Qualified School Board Loan Fund Insured, Dexia Credit Local LIQ) ø144A | | | 0.48 | | | | 5-1-2025 | | | | 13,195,000 | | | | 13,195,000 | |
Detroit MI District Aid (GO) | | | 5.00 | | | | 11-1-2018 | | | | 3,000,000 | | | | 3,310,110 | |
Detroit MI District Aid (GO) | | | 5.00 | | | | 11-1-2019 | | | | 1,500,000 | | | | 1,673,505 | |
Detroit MI District Aid (GO) | | | 5.00 | | | | 11-1-2020 | | | | 2,700,000 | | | | 3,038,337 | |
Eaton Rapids MI Public Schools (GO, Qualified School Board Loan Fund Insured) | | | 4.00 | | | | 5-1-2019 | | | | 1,450,000 | | | | 1,592,158 | |
Eaton Rapids MI Public Schools (GO, Qualified School Board Loan Fund Insured) | | | 5.00 | | | | 5-1-2022 | | | | 1,785,000 | | | | 2,111,619 | |
Flint MI International Academy (Education Revenue) | | | 5.38 | | | | 10-1-2022 | | | | 2,270,000 | | | | 2,326,273 | |
Flint MI International Academy (Education Revenue) | | | 5.50 | | | | 10-1-2027 | | | | 1,985,000 | | | | 2,021,266 | |
Flint MI International Academy Public School Project (Education Revenue) | | | 5.00 | | | | 10-1-2017 | | | | 275,000 | | | | 282,150 | |
Hazel Park MI School District (GO, AGM/Qualified School Board Loan Fund Insured) | | | 5.00 | | | | 5-1-2020 | | | | 1,160,000 | | | | 1,351,168 | |
Kent County MI (GO) | | | 5.00 | | | | 1-1-2025 | | | | 1,000,000 | | | | 1,132,480 | |
Macomb MI Interceptor Drainage (Miscellaneous Revenue) | | | 5.00 | | | | 5-1-2024 | | | | 1,750,000 | | | | 2,014,950 | |
Macomb MI Interceptor Drainage (Miscellaneous Revenue) | | | 5.00 | | | | 5-1-2025 | | | | 1,750,000 | | | | 2,014,950 | |
Macomb MI Interceptor Drainage (Miscellaneous Revenue) | | | 5.00 | | | | 5-1-2026 | | | | 1,930,000 | | | | 2,216,238 | |
Michigan Comprehensive Transportation Program (Tax Revenue) | | | 5.25 | | | | 5-15-2017 | | | | 2,750,000 | | | | 3,015,870 | |
Michigan Finance Authority (Miscellaneous Revenue) | | | 5.00 | | | | 6-1-2020 | | | | 1,400,000 | | | | 1,591,968 | |
Michigan Finance Authority (Health Revenue) | | | 5.00 | | | | 11-15-2023 | | | | 400,000 | | | | 456,996 | |
Michigan Finance Authority (Health Revenue) | | | 5.00 | | | | 11-15-2026 | | | | 800,000 | | | | 891,752 | |
Michigan Finance Authority Limited Obligation Public School Academy Cesar Chavez Academy Project (Education Revenue) | | | 5.00 | | | | 2-1-2022 | | | | 2,540,000 | | | | 2,562,428 | |
Michigan Finance Authority Local Government Loan Program Series C (Health Revenue) | | | 5.00 | | | | 11-1-2022 | | | | 2,070,000 | | | | 2,330,986 | |
Michigan Finance Authority Local Government Loan Program Series D (Water & Sewer Revenue, National Insured) | | | 5.00 | | | | 7-1-2025 | | | | 1,000,000 | | | | 1,152,220 | |
Michigan Finance Authority Local Government Loan Program Series D (Water & Sewer Revenue) | | | 5.00 | | | | 7-1-2030 | | | | 12,000,000 | | | | 13,321,200 | |
Michigan Finance Authority Local Government Loan Program Series D (Water & Sewer Revenue, AGM Insured) | | | 5.00 | | | | 7-1-2035 | | | | 2,750,000 | | | | 3,073,868 | |
Michigan Finance Authority Local Government Loan Program Series D (Water & Sewer Revenue, AGM Insured) | | | 5.00 | | | | 7-1-2037 | | | | 2,000,000 | | | | 2,223,600 | |
Michigan Housing Development Authority Limited Greenwood Villa Project (Housing Revenue, AGM Insured) | | | 4.75 | | | | 9-15-2017 | | | | 1,040,000 | | | | 1,080,893 | |
Michigan Municipal Bond Authority Local Government Loan Program Series A (Miscellaneous Revenue, Ambac Insured) | | | 4.50 | | | | 5-1-2016 | | | | 100,000 | | | | 102,897 | |
| | | | |
| 12 | | Wells Fargo Advantage Intermediate Tax/AMT-Free Fund | | Portfolio of investments—December 31, 2014 (unaudited) |
| | | | | | | | | | | | | | | | |
| Security name | | Interest rate | | | Maturity date | | | Principal | | | Value | |
| | | | | | | | | | | | | | | | |
| | | | |
| Michigan (continued) | | | | | | | | | | | | | | | | |
Michigan Municipal Bond Authority Local Government Loan Program Series B Group A (Miscellaneous Revenue, Ambac Insured) | | | 5.00 | % | | | 12-1-2018 | | | $ | 1,075,000 | | | $ | 1,126,439 | |
Michigan PFOTER Series 4711 (GO, AGM/Qualified School Board Loan Fund Insured, Dexia Credit Local LIQ) ø144A | | | 0.48 | | | | 5-1-2029 | | | | 9,910,000 | | | | 9,910,000 | |
Michigan Public Educational Facilities Authority Limited Obligation Chandler Park Academy (Miscellaneous Revenue) | | | 5.60 | | | | 11-1-2018 | | | | 785,000 | | | | 798,055 | |
Michigan Public Educational Facilities Authority Limited Obligation Nataki Talibah (Miscellaneous Revenue) | | | 6.25 | | | | 10-1-2023 | | | | 815,000 | | | | 407,484 | |
Michigan Strategic Fund Limited Obligation Cadillac Place Office Building Project (Miscellaneous Revenue) | | | 5.25 | | | | 10-15-2025 | | | | 4,165,000 | | | | 4,850,976 | |
Michigan Strategic Fund Limited Obligation Events Center Project Series A (Tax Revenue) ± | | | 4.13 | | | | 7-1-2045 | | | | 9,000,000 | | | | 9,080,280 | |
Pinckney MI Community School District (GO, Qualified School Board Loan Fund Insured) | | | 5.00 | | | | 5-1-2024 | | | | 1,020,000 | | | | 1,206,232 | |
Pinckney MI Community School District (GO, Qualified School Board Loan Fund Insured) | | | 5.00 | | | | 5-1-2025 | | | | 2,040,000 | | | | 2,383,822 | |
Pinckney MI Community School District (GO, Qualified School Board Loan Fund Insured) | | | 5.00 | | | | 5-1-2026 | | | | 2,505,000 | | | | 2,910,885 | |
Southfield MI Public Schools (GO, National/Qualified School Board Loan Fund Insured) | | | 4.38 | | | | 5-1-2025 | | | | 4,000,000 | | | | 4,259,640 | |
Western MI University (Education Revenue) | | | 5.25 | | | | 11-15-2027 | | | | 600,000 | | | | 709,266 | |
Western MI University (Education Revenue) | | | 5.25 | | | | 11-15-2029 | | | | 1,000,000 | | | | 1,174,090 | |
Western MI University (Education Revenue, AGM Insured) | | | 5.25 | | | | 11-15-2033 | | | | 750,000 | | | | 856,088 | |
Western Townships MI Utilities Authority (GO) | | | 5.00 | | | | 1-1-2017 | | | | 1,500,000 | | | | 1,626,315 | |
Wyandotte MI Series A (Utilities Revenue, AGM Insured) | | | 4.00 | | | | 10-1-2016 | | | | 500,000 | | | | 526,575 | |
| | | | |
| | | | | | | | | | | | | | | 124,933,603 | |
| | | | | | | | | | | | | | | | |
| | | | |
| Minnesota: 0.96% | | | | | | | | | | | | | | | | |
Minneapolis & St. Paul MN Housing & RDA Health Care Facilities Series A (Health Revenue, AGM Insured, U.S. Bank NA SPA) ø | | | 0.04 | | | | 8-15-2034 | | | | 2,200,000 | | | | 2,200,000 | |
Minneapolis & St. Paul MN Metropolitan Airports Commission Sub Series B (Airport Revenue, National Insured) | | | 5.00 | | | | 1-1-2018 | | | | 4,555,000 | | | | 4,959,530 | |
Minnesota HEFAR Carleton College Series 5G (Education Revenue, JPMorgan Chase & Company SPA) ø | | | 0.07 | | | | 11-1-2029 | | | | 10,000,000 | | | | 10,000,000 | |
Northern Minnesota Municipal Power Agency Series A (Utilities Revenue, AGM Insured) | | | 5.00 | | | | 1-1-2016 | | | | 1,365,000 | | | | 1,429,851 | |
St. Louis Park MN Nicollett Health Services Series C (Health Revenue) | | | 5.50 | | | | 7-1-2023 | | | | 2,500,000 | | | | 2,778,700 | |
St. Paul MN Housing & RDA Hmong Academy Project Series A (Education Revenue) | | | 5.50 | | | | 9-1-2018 | | | | 300,000 | | | | 306,378 | |
| | | | |
| | | | | | | | | | | | | | | 21,674,459 | |
| | | | | | | | | | | | | | | | |
| | | | |
| Mississippi: 0.58% | | | | | | | | | | | | | | | | |
Mississippi Development Bank Special Obligation Jackson Water & Sewer System Project (Water & Sewer Revenue, AGM Insured) | | | 6.00 | | | | 12-1-2023 | | | | 1,145,000 | | | | 1,476,821 | |
Mississippi Development Bank Special Obligation Jackson Water & Sewer System Project Series A (Water & Sewer Revenue, AGM Insured) | | | 5.00 | | | | 9-1-2030 | | | | 10,000,000 | | | | 11,493,200 | |
| | | | |
| | | | | | | | | | | | | | | 12,970,021 | |
| | | | | | | | | | | | | | | | |
| | | | |
| Missouri: 0.49% | | | | | | | | | | | | | | | | |
Kansas City MO Municipal Assistance Corporation Series B-1 (Miscellaneous Revenue, Ambac Insured) ¤ | | | 0.00 | | | | 4-15-2022 | | | | 3,540,000 | | | | 2,931,545 | |
Manchester MO Highway 141 Manchester Road Project (Tax Revenue) | | | 6.00 | | | | 11-1-2025 | | | | 700,000 | | | | 743,323 | |
| | | | | | |
| Portfolio of investments—December 31, 2014 (unaudited) | | Wells Fargo Advantage Intermediate Tax/AMT-Free Fund | | | 13 | |
| | | | | | | | | | | | | | | | |
| Security name | | Interest rate | | | Maturity date | | | Principal | | | Value | |
| | | | | | | | | | | | | | | | |
| | | | |
| Missouri (continued) | | | | | | | | | | | | | | | | |
Maryland Heights MO South Heights Redevelopment Project A (Tax Revenue) | | | 5.50 | % | | | 9-1-2018 | | | $ | 645,000 | | | $ | 668,652 | |
Poplar Bluff MO School District (Miscellaneous Revenue, AGM Insured) | | | 5.00 | | | | 3-1-2032 | | | | 1,500,000 | | | | 1,720,680 | |
Poplar Bluff MO School District (Miscellaneous Revenue, AGM Insured) | | | 5.00 | | | | 3-1-2033 | | | | 1,000,000 | | | | 1,142,840 | |
Poplar Bluff MO School District (Miscellaneous Revenue, AGM Insured) | | | 5.00 | | | | 3-1-2034 | | | | 1,000,000 | | | | 1,138,570 | |
Poplar Bluff MO School District (Miscellaneous Revenue, AGM Insured) | | | 5.00 | | | | 3-1-2035 | | | | 2,000,000 | | | | 2,265,280 | |
St. Louis MO Lambert St. Louis International Airport Series A-1 (Airport Revenue) | | | 6.00 | | | | 7-1-2019 | | | | 415,000 | | | | 489,430 | |
| | | | |
| | | | | | | | | | | | | | | 11,100,320 | |
| | | | | | | | | | | | | | | | |
| | | | |
| Nebraska: 0.14% | | | | | | | | | | | | | | | | |
Lincoln County NE Hospital Authority Great Plains Regional Medical Center (Health Revenue) | | | 5.00 | | | | 11-1-2024 | | | | 1,000,000 | | | | 1,116,800 | |
Municipal Energy Agency of Nebraska Series A (Utilities Revenue, BHAC Insured) | | | 5.00 | | | | 4-1-2019 | | | | 500,000 | | | | 576,025 | |
Nebraska Central Plains Energy Project #3 (Utilities Revenue) | | | 5.00 | | | | 9-1-2027 | | | | 1,290,000 | | | | 1,444,839 | |
| | | | |
| | | | | | | | | | | | | | | 3,137,664 | |
| | | | | | | | | | | | | | | | |
| | | | |
| Nevada: 1.32% | | | | | | | | | | | | | | | | |
Clark County NV Airport Series C (Airport Revenue, AGM Insured) | | | 5.00 | | | | 7-1-2023 | | | | 5,600,000 | | | | 6,437,760 | |
Clark County NV Airport Series D (Airport Revenue) | | | 5.00 | | | | 7-1-2024 | | | | 2,750,000 | | | | 3,177,515 | |
Clark County NV Las Vegas McCarran International Airport Series A (Airport Revenue) | | | 5.00 | | | | 7-1-2016 | | | | 3,000,000 | | | | 3,200,100 | |
Clark County NV School District Series A (GO, National Insured) | | | 5.00 | | | | 6-15-2019 | | | | 7,500,000 | | | | 7,733,100 | |
Clark County NV Water Reclamation District Series A (GO) | | | 5.25 | | | | 7-1-2038 | | | | 2,880,000 | | | | 3,273,638 | |
Las Vegas NV New Convention & Visitors Authority Series E (Tax Revenue, AGM Insured) | | | 4.20 | | | | 7-1-2021 | | | | 500,000 | | | | 545,720 | |
Las Vegas NV Special Improvement District #607 (Miscellaneous Revenue) | | | 4.00 | | | | 6-1-2019 | | | | 805,000 | | | | 831,646 | |
Las Vegas NV Special Improvement District #607 (Miscellaneous Revenue) | | | 4.00 | | | | 6-1-2020 | | | | 680,000 | | | | 700,352 | |
Las Vegas NV Special Improvement District #607 (Miscellaneous Revenue) | | | 4.00 | | | | 6-1-2021 | | | | 880,000 | | | | 900,495 | |
Las Vegas NV Special Improvement District #607 (Miscellaneous Revenue) | | | 4.25 | | | | 6-1-2024 | | | | 200,000 | | | | 203,886 | |
Reno NV Sparks Indian Governmental Colony (Miscellaneous Revenue, U.S. Bank NA LOC) | | | 5.00 | | | | 6-1-2021 | | | | 2,580,000 | | | | 2,637,818 | |
| | | | |
| | | | | | | | | | | | | | | 29,642,030 | |
| | | | | | | | | | | | | | | | |
| | | | |
| New Hampshire: 0.12% | | | | | | | | | | | | | | | | |
New Hampshire HFA (Housing Revenue) | | | 4.80 | | | | 7-1-2028 | | | | 2,540,000 | | | | 2,703,398 | |
| | | | | | | | | | | | | | | | |
| | | | |
| New Jersey: 3.47% | | | | | | | | | | | | | | | | |
Essex County NJ Import Authority Series A (Miscellaneous Revenue) | | | 6.00 | | | | 11-1-2025 | | | | 5,000,000 | | | | 5,663,000 | |
Garden NJ Open Space & Farmland Preservation Refunding Bonds Series A (Tax Revenue) | | | 4.00 | | | | 11-1-2017 | | | | 930,000 | | | | 1,012,454 | |
New Jersey EDA (Tobacco Revenue) | | | 5.00 | | | | 6-15-2021 | | | | 2,500,000 | | | | 2,837,975 | |
New Jersey EDA Motor Vehicle Surcharges Series A (Miscellaneous Revenue, National Insured) | | | 5.25 | | | | 7-1-2026 | | | | 2,860,000 | | | | 3,496,064 | |
New Jersey EDA School Facilities Construction Project Series I (Miscellaneous Revenue) ± | | | 1.64 | | | | 3-1-2028 | | | | 15,000,000 | | | | 14,965,950 | |
New Jersey EDA School Facilities Construction Project Series NN (Miscellaneous Revenue, NATL-RE Insured) | | | 5.00 | | | | 3-1-2030 | | | | 4,475,000 | | | | 4,927,960 | |
New Jersey HEFAR Series A (Education Revenue) | | | 5.00 | | | | 6-1-2017 | | | | 2,000,000 | | | | 2,161,120 | |
New Jersey HEFAR Series A (Education Revenue) | | | 5.00 | | | | 6-1-2019 | | | | 9,810,000 | | | | 10,959,830 | |
New Jersey HEFAR Student Loan Series 1A (Education Revenue) | | | 5.00 | | | | 12-1-2016 | | | | 2,100,000 | | | | 2,263,422 | |
New Jersey HEFAR Student Loan Series A (Education Revenue) | | | 5.00 | | | | 6-1-2016 | | | | 500,000 | | | | 529,995 | |
| | | | |
| 14 | | Wells Fargo Advantage Intermediate Tax/AMT-Free Fund | | Portfolio of investments—December 31, 2014 (unaudited) |
| | | | | | | | | | | | | | | | |
| Security name | | Interest rate | | | Maturity date | | | Principal | | | Value | |
| | | | | | | | | | | | | | | | |
| | | | |
| New Jersey (continued) | | | | | | | | | | | | | | | | |
New Jersey Housing & Mortgage Finance Agency Series AA (Housing Revenue) | | | 5.25 | % | | | 10-1-2016 | | | $ | 335,000 | | | $ | 351,244 | |
New Jersey Sports & Exposition Authority (Miscellaneous Revenue, National Insured) | | | 5.50 | | | | 3-1-2022 | | | | 1,755,000 | | | | 2,177,797 | |
New Jersey TTFA Series A (Transportation Revenue) | | | 5.25 | | | | 12-15-2020 | | | | 5,305,000 | | | | 6,100,962 | |
New Jersey TTFA Series A (Transportation Revenue, AGM Insured) | | | 5.50 | | | | 12-15-2022 | | | | 8,010,000 | | | | 9,603,429 | |
New Jersey TTFA Series B (Miscellaneous Revenue, National Insured) | | | 5.50 | | | | 12-15-2020 | | | | 7,000,000 | | | | 8,243,690 | |
New Jersey TTFA Series D (Transportation Revenue) | | | 5.00 | | | | 6-15-2032 | | | | 2,500,000 | | | | 2,772,950 | |
| | | | |
| | | | | | | | | | | | | | | 78,067,842 | |
| | | | | | | | | | | | | | | | |
| | | | |
| New Mexico: 0.37% | | | | | | | | | | | | | | | | |
Albuquerque Bernalillo County NM Water Utility Authority Series B (Water & Sewer Revenue) | | | 5.00 | | | | 7-1-2024 | | | | 1,000,000 | | | | 1,231,650 | |
New Mexico Mortgage Finance Authority SFMR Class I Series A (Housing Revenue, GNMA/FNMA Insured) | | | 4.63 | | | | 9-1-2025 | | | | 1,475,000 | | | | 1,521,890 | |
New Mexico Mortgage Finance Authority SFMR Series B (Housing Revenue, GNMA/FNMA/FHLMC Insured) | | | 5.00 | | | | 3-1-2028 | | | | 595,000 | | | | 628,028 | |
New Mexico Municipal Energy Acquisition Authority Gas Supply Sub Series B (Utilities Revenue, Royal Bank of Canada SPA) ± | | | 0.85 | | | | 11-1-2039 | | | | 5,000,000 | | | | 5,032,200 | |
| | | | |
| | | | | | | | | | | | | | | 8,413,768 | |
| | | | | | | | | | | | | | | | |
| | | | |
| New York: 9.37% | | | | | | | | | | | | | | | | |
Deutsche Bank SPEARs/LIFERs Trust Series DBE 1177 (Transportation Revenue, Deutsche Bank LIQ) ø144A | | | 0.20 | | | | 11-15-2038 | | | | 11,250,000 | | | | 11,250,000 | |
Hempstead Town NY Local Development Corporation The Academy Charter School Project Series A (Education Revenue) | | | 7.65 | | | | 2-1-2044 | | | | 2,720,000 | | | | 3,092,858 | |
Metropolitan Transportation Authority New York Dedicated Tax Fund Series A (Tax Revenue) | | | 5.00 | | | | 11-15-2024 | | | | 6,010,000 | | | | 7,283,038 | |
Metropolitan Transportation Authority New York Series A (Transportation Revenue) | | | 5.00 | | | | 11-15-2030 | | | | 4,010,000 | | | | 4,669,284 | |
Metropolitan Transportation Authority New York Series B (Transportation Revenue) | | | 5.25 | | | | 11-15-2039 | | | | 6,035,000 | | | | 7,045,681 | |
Metropolitan Transportation Authority New York Series D (Transportation Revenue) | | | 5.00 | | | | 11-15-2027 | | | | 2,000,000 | | | | 2,351,600 | |
Metropolitan Transportation Authority New York Series F (Transportation Revenue) | | | 5.00 | | | | 11-15-2028 | | | | 2,450,000 | | | | 2,875,614 | |
Monroe County NY Development Corporation (Education Revenue) | | | 5.00 | | | | 6-1-2020 | | | | 2,125,000 | | | | 2,408,943 | |
Monroe County NY Industrial Development Corporation Revenue Monroe Community College (Education Revenue, AGM Insured) | | | 5.00 | | | | 1-15-2022 | | | | 790,000 | | | | 897,401 | |
Monroe County NY Industrial Development Corporation Revenue Monroe Community College (Education Revenue, AGM Insured) | | | 5.00 | | | | 1-15-2023 | | | | 645,000 | | | | 737,370 | |
Monroe County NY Industrial Development Corporation Revenue Monroe Community College (Education Revenue, AGM Insured) | | | 5.00 | | | | 1-15-2024 | | | | 905,000 | | | | 1,037,800 | |
New York Dormitory Authority Interagency Council Pooled Loan Series A-1 (Miscellaneous Revenue) | | | 4.00 | | | | 7-1-2019 | | | | 740,000 | | | | 802,064 | |
New York Dormitory Authority Mount Sinai School of Medicine (Education Revenue) | | | 5.50 | | | | 7-1-2022 | | | | 2,000,000 | | | | 2,338,980 | |
New York Dormitory Authority North Shore Jewish Series B (Health Revenue) ± | | | 0.89 | | | | 5-1-2018 | | | | 1,545,000 | | | | 1,545,309 | |
New York Dormitory Authority Series B (Tax Revenue, Ambac Insured) | | | 5.50 | | | | 3-15-2025 | | | | 3,885,000 | | | | 4,987,097 | |
New York Dormitory Authority Series C (Tax Revenue) | | | 5.00 | | | | 3-15-2036 | | | | 8,650,000 | | | | 10,047,321 | |
New York Dormitory Authority St. John University Series B-1 (Education Revenue, Bank of America NA LOC) ø | | | 0.06 | | | | 7-1-2034 | | | | 5,000,000 | | | | 5,000,000 | |
New York Dormitory Authority State University Educational Facilities Series A (Miscellaneous Revenue) | | | 5.50 | | | | 5-15-2019 | | | | 3,675,000 | | | | 4,200,084 | |
| | | | | | |
| Portfolio of investments—December 31, 2014 (unaudited) | | Wells Fargo Advantage Intermediate Tax/AMT-Free Fund | | | 15 | |
| | | | | | | | | | | | | | | | |
| Security name | | Interest rate | | | Maturity date | | | Principal | | | Value | |
| | | | | | | | | | | | | | | | |
| | | | |
| New York (continued) | | | | | | | | | | | | | | | | |
New York Dormitory Authority United Health Hospitals (Health Revenue, FHA Insured) | | | 4.50 | % | | | 8-1-2018 | | | $ | 1,500,000 | | | $ | 1,610,250 | |
New York NY Adjusted Fiscal 2008 Sub Series J5 (GO, Dexia Credit Local SPA) ø | | | 0.16 | | | | 8-1-2028 | | | | 10,000,000 | | | | 10,000,000 | |
New York NY City Transitional Balance Future Tax Sub Series A-1 (Tax Revenue) | | | 5.00 | | | | 8-1-2027 | | | | 1,115,000 | | | | 1,356,609 | |
New York NY City Transitional Prerefunded Balance Future Tax Sub Series A-1 (Tax Revenue) | | | 5.00 | | | | 5-1-2023 | | | | 65,000 | | | | 75,539 | |
New York NY City Transitional Unrefunded Balance Future Tax Sub Series A-1 (Tax Revenue) | | | 5.00 | | | | 5-1-2023 | | | | 2,810,000 | | | | 3,248,248 | |
New York NY IDAG 2006 Project Samaritan AIDS Services (Miscellaneous Revenue, Citibank NA LOC) | | | 4.50 | | | | 11-1-2015 | | | | 275,000 | | | | 283,641 | |
New York NY Municipal Water Finance Authority Series AA3 (Water & Sewer Revenue, Dexia Credit Local SPA) ø | | | 0.16 | | | | 6-15-2032 | | | | 15,000,000 | | | | 15,000,000 | |
New York NY Series A (GO) | | | 5.00 | | | | 8-1-2033 | | | | 1,535,000 | | | | 1,798,774 | |
New York NY Series F-1 (GO) | | | 5.00 | | | | 3-1-2032 | | | | 7,670,000 | | | | 8,845,504 | |
New York NY Sub Series F-1 (GO) | | | 5.00 | | | | 8-1-2032 | | | | 2,250,000 | | | | 2,646,945 | |
New York NY Sub Series J-4 (GO) ± | | | 0.59 | | | | 8-1-2025 | | | | 10,000,000 | | | | 9,991,200 | |
New York NY Sub Series L-5 (GO, Dexia Credit Local SPA) ø | | | 0.16 | | | | 4-1-2035 | | | | 6,000,000 | | | | 6,000,000 | |
New York NY Trust for Cultural Resources Series A-1 (Miscellaneous Revenue) | | | 5.00 | | | | 7-1-2031 | | | | 2,475,000 | | | | 2,789,845 | |
New York Urban Development Corporation Certificate of Participation James A. Farley Post Office Building Refinancing (Miscellaneous Revenue) | | | 4.00 | | | | 2-1-2015 | | | | 9,960,000 | | | | 9,970,060 | |
New York Urban Development Corporation Series C (Tax Revenue) | | | 5.00 | | | | 3-15-2032 | | | | 1,820,000 | | | | 2,118,899 | |
New York Urban Development Corporation Series D (Miscellaneous Revenue, AGC Insured) | | | 5.50 | | | | 1-1-2019 | | | | 3,000,000 | | | | 3,497,220 | |
Niagara NY Area Development Corporation (Education Revenue) | | | 5.00 | | | | 5-1-2020 | | | | 1,160,000 | | | | 1,300,047 | |
Niagara NY Area Development Corporation (Education Revenue) | | | 5.00 | | | | 5-1-2022 | | | | 1,350,000 | | | | 1,537,326 | |
Port Authority New York & New Jersey Series 184 (Airport Revenue) | | | 5.00 | | | | 9-1-2031 | | | | 1,645,000 | | | | 1,969,608 | |
Port Authority New York & New Jersey Series 184 (Airport Revenue) | | | 5.00 | | | | 9-1-2032 | | | | 11,000,000 | | | | 13,098,250 | |
Port Authority New York & New Jersey Special Obligation (Airport Revenue) | | | 5.00 | | | | 12-1-2020 | | | | 5,000,000 | | | | 5,755,850 | |
Port Authority New York & New Jersey Special Obligation (Airport Revenue) | | | 5.00 | | | | 9-1-2039 | | | | 25,040,000 | | | | 29,191,382 | |
Suffolk NY Tobacco Asset Securitization Corporation Tobacco Settlement Series B (Tobacco Revenue) | | | 4.00 | | | | 6-1-2022 | | | | 420,000 | | | | 458,959 | |
Suffolk NY Tobacco Asset Securitization Corporation Tobacco Settlement Series B (Tobacco Revenue) | | | 5.00 | | | | 6-1-2023 | | | | 500,000 | | | | 575,975 | |
Troy NY Capital Resource Corporation Rensselaer Polytechnic Series B (Education Revenue) | | | 5.00 | | | | 9-1-2020 | | | | 1,430,000 | | | | 1,660,630 | |
Upper Mohawk Valley NY Regional Water Finance Authority Series A (Water & Sewer Revenue, AGM Insured) | | | 5.00 | | | | 4-1-2018 | | | | 820,000 | | | | 872,160 | |
Utility Debt Securitization Authority New York (Utilities Revenue) | | | 5.00 | | | | 12-15-2032 | | | | 1,250,000 | | | | 1,497,125 | |
Yonkers NY (GO, AGM Insured) | | | 5.00 | | | | 10-1-2024 | | | | 1,000,000 | | | | 1,143,830 | |
| | | | |
| | | | | | | | | | | | | | | 210,864,320 | |
| | | | | | | | | | | | | | | | |
| | | | |
| North Carolina: 1.54% | | | | | | | | | | | | | | | | |
Craven County NC Certificate of Participation (Miscellaneous Revenue, National Insured) | | | 5.00 | | | | 6-1-2023 | | | | 4,400,000 | | | | 4,865,652 | |
New Hanover County NC Regional Medical Center (Health Revenue) | | | 5.00 | | | | 10-1-2020 | | | | 3,400,000 | | | | 3,961,850 | |
New Hanover County NC Regional Medical Center (Health Revenue) | | | 5.00 | | | | 10-1-2022 | | | | 250,000 | | | | 291,193 | |
New Hanover County NC Regional Medical Center (Health Revenue) | | | 5.00 | | | | 10-1-2023 | | | | 1,000,000 | | | | 1,171,760 | |
North Carolina Medical Care Commission Healthcare Facilities Series A (Health Revenue, JPMorgan Chase & Company SPA) ø | | | 0.06 | | | | 11-1-2034 | | | | 21,350,000 | | | | 21,350,000 | |
Onslow County NC Limited Obligation Series A (Miscellaneous Revenue) | | | 4.00 | | | | 6-1-2022 | | | | 90,000 | | | | 100,324 | |
Pitt County NC Certificate of Participation School Facilities Project (Miscellaneous Revenue, National Insured) | | | 5.00 | | | | 4-1-2023 | | | | 2,755,000 | | | | 3,013,226 | |
| | | | |
| | | | | | | | | | | | | | | 34,754,005 | |
| | | | | | | | | | | | | | | | |
| | | | |
| 16 | | Wells Fargo Advantage Intermediate Tax/AMT-Free Fund | | Portfolio of investments—December 31, 2014 (unaudited) |
| | | | | | | | | | | | | | | | |
| Security name | | Interest rate | | | Maturity date | | | Principal | | | Value | |
| | | | | | | | | | | | | | | | |
| | | | |
| North Dakota: 0.05% | | | | | | | | | | | | | | | | |
North Dakota Housing Finance Agency Series D (Housing Revenue) | | | 4.50 | % | | | 1-1-2029 | | | $ | 1,030,000 | | | $ | 1,083,519 | |
| | | | | | | | | | | | | | | | |
| | | | |
| Ohio: 2.02% | | | | | | | | | | | | | | | | |
Cincinnati OH CIty School District Improvement Project COP (Miscellaneous Revenue) | | | 5.00 | | | | 12-15-2024 | | | | 4,815,000 | | | | 5,717,764 | |
Cincinnati OH City School District Improvement Project COP (Miscellaneous Revenue) | | | 5.00 | | | | 12-15-2025 | | | | 2,095,000 | | | | 2,477,631 | |
JobsOhio Beverage System Statewide Liquor Profits Senior Lien Series A (Miscellaneous Revenue) | | | 5.00 | | | | 1-1-2022 | | | | 2,500,000 | | | | 2,969,675 | |
Kent University Ohio General Receipts Series B (Education Revenue, AGM Insured) | | | 5.00 | | | | 5-1-2018 | | | | 1,165,000 | | | | 1,309,914 | |
Montgomery County OH Catholic Health Refunding Bond Series B-2 (Health Revenue, U.S. Bank NA SPA) ø | | | 0.10 | | | | 3-1-2027 | | | | 10,000,000 | | | | 10,000,000 | |
Ohio Air Quality Development Authority Series B (Industrial Development Revenue) ± | | | 3.63 | | | | 10-1-2033 | | | | 1,750,000 | | | | 1,804,425 | |
Ohio Air Quality Development Authority Series B (Industrial Development Revenue) ± | | | 3.63 | | | | 12-1-2033 | | | | 2,500,000 | | | | 2,580,075 | |
Ohio Building Authority (Miscellaneous Revenue) | | | 5.00 | | | | 10-1-2024 | | | | 1,000,000 | | | | 1,167,200 | |
Ohio Turnpike Commission Junior Lien Infrastructure Projects Series A-1 (Transportation Revenue) | | | 5.25 | | | | 2-15-2029 | | | | 1,000,000 | | | | 1,182,430 | |
Ohio Turnpike Commission Junior Lien Infrastructure Projects Series A-1 (Transportation Revenue) | | | 5.25 | | | | 2-15-2030 | | | | 1,000,000 | | | | 1,181,630 | |
Ohio Water Development Authority Pollution Control Facilities Revenue Series B (Industrial Development Revenue) ± | | | 3.63 | | | | 10-1-2033 | | | | 3,150,000 | | | | 3,299,499 | |
Reynoldsburg OH City School District Series DCL-2014-001 (GO, Dexia Credit Local LIQ) ø144A | | | 0.14 | | | | 9-1-2030 | | | | 9,585,000 | | | | 9,585,000 | |
RiverSouth Authority Ohio Lazarus Building Redevelopment Series A (Lease Revenue) | | | 5.75 | | | | 12-1-2027 | | | | 950,000 | | | | 1,030,750 | |
Summit County OH Port Authority (Education Revenue) | | | 5.25 | | | | 1-1-2024 | | | | 1,000,000 | | | | 1,131,500 | |
| | | | |
| | | | | | | | | | | | | | | 45,437,493 | |
| | | | | | | | | | | | | | | | |
| | | | |
| Oklahoma: 0.71% | | | | | | | | | | | | | | | | |
Claremore OK Public Works Authority (Utilities Revenue) | | | 4.00 | | | | 6-1-2019 | | | | 1,325,000 | | | | 1,453,326 | |
Claremore OK Public Works Authority (Utilities Revenue) | | | 4.00 | | | | 6-1-2022 | | | | 2,595,000 | | | | 2,897,966 | |
Claremore OK Public Works Authority (Utilities Revenue) | | | 4.00 | | | | 6-1-2023 | | | | 1,010,000 | | | | 1,119,373 | |
Cushing OK Educational Facilities Authority (Miscellaneous Revenue) | | | 5.00 | | | | 9-1-2022 | | | | 3,210,000 | | | | 3,823,335 | |
McGee Creek OK Authority (Water & Sewer Revenue, State Street Bank & Trust Company LOC, National Insured) | | | 6.00 | | | | 1-1-2023 | | | | 1,660,000 | | | | 1,844,277 | |
Muskogee OK Industrial Trust Educational Facilities (Miscellaneous Revenue) | | | 5.00 | | | | 9-1-2020 | | | | 1,000,000 | | | | 1,131,270 | |
Muskogee OK Industrial Trust Educational Facilities (Miscellaneous Revenue) | | | 5.00 | | | | 9-1-2021 | | | | 1,000,000 | | | | 1,137,240 | |
Muskogee OK Industrial Trust Educational Facilities (Miscellaneous Revenue) | | | 5.00 | | | | 9-1-2022 | | | | 1,000,000 | | | | 1,140,920 | |
Oklahoma Development Finance Authority (Miscellaneous Revenue) | | | 4.00 | | | | 6-1-2023 | | | | 1,270,000 | | | | 1,426,693 | |
| | | | |
| | | | | | | | | | | | | | | 15,974,400 | |
| | | | | | | | | | | | | | | | |
| | | | |
| Oregon: 0.06% | | | | | | | | | | | | | | | | |
Medford OR Hospital Facilities Authority Revenue (Health Revenue) | | | 5.00 | | | | 10-1-2020 | | | | 1,155,000 | | | | 1,320,846 | |
| | | | | | | | | | | | | | | | |
| | | | |
| Pennsylvania: 5.79% | | | | | | | | | | | | | | | | |
Adams County PA IDA Gettysburg College Project (Education Revenue) | | | 5.00 | | | | 8-15-2024 | | | | 1,500,000 | | | | 1,715,850 | |
Adams County PA IDA Gettysburg College Project (Education Revenue) | | | 5.00 | | | | 8-15-2025 | | | | 1,500,000 | | | | 1,710,105 | |
Allegheny County PA Hospital Development Authority Series B (Health Revenue, National Insured) | | | 6.00 | | | | 7-1-2025 | | | | 2,605,000 | | | | 3,297,722 | |
Allegheny County PA Series 72 (GO) | | | 5.25 | | | | 12-1-2033 | | | | 4,000,000 | | | | 4,662,000 | |
Berks County PA Municipal Authority Reading Hospital & Medical Center Project Series B (Health Revenue) | | | 1.54 | | | | 11-1-2039 | | | | 10,000,000 | | | | 10,256,600 | |
Bucks County PA Water & Sewer Authority Water System (Water & Sewer Revenue, AGM Insured) | | | 5.00 | | | | 12-1-2026 | | | | 2,400,000 | | | | 2,744,040 | |
| | | | | | |
| Portfolio of investments—December 31, 2014 (unaudited) | | Wells Fargo Advantage Intermediate Tax/AMT-Free Fund | | | 17 | |
| | | | | | | | | | | | | | | | |
| Security name | | Interest rate | | | Maturity date | | | Principal | | | Value | |
| | | | | | | | | | | | | | | | |
| | | | |
| Pennsylvania (continued) | | | | | | | | | | | | | | | | |
Chester County PA IDA Avon Grove Charter School Project Series A (Education Revenue) | | | 5.65 | % | | | 12-15-2017 | | | $ | 375,000 | | | $ | 395,201 | |
Dauphin County PA General Authority Office & Parking Riverfront Office Project (Miscellaneous Revenue) | | | 6.00 | | | | 1-1-2025 | | | | 3,750,000 | | | | 3,752,138 | |
Delaware County PA Voctech School Authority (Miscellaneous Revenue, Build America Mutual Assurance Company Insured) | | | 5.25 | | | | 11-1-2033 | | | | 2,000,000 | | | | 2,298,280 | |
Delaware Valley PA Regional Finance Authority Series 2996 (Miscellaneous Revenue, Morgan Stanley Bank LIQ) ø144A | | | 0.29 | | | | 7-1-2017 | | | | 2,000,000 | | | | 2,000,000 | |
Johnstown PA School District (GO, AGM Insured) | | | 5.00 | | | | 8-1-2024 | | | | 2,730,000 | | | | 3,102,645 | |
Lancaster County PA Solid Waste Management Authority Series A (Resource Recovery Revenue) | | | 5.25 | | | | 12-15-2028 | | | | 5,665,000 | | | | 6,649,690 | |
Lycoming County PA College Authority (Education Revenue) | | | 5.50 | | | | 7-1-2026 | | | | 4,000,000 | | | | 4,592,960 | |
Millcreek Richland Joint Authority Pennsylvania Series B (Water & Sewer Revenue, Radian Insured) | | | 4.70 | | | | 8-1-2017 | | | | 565,000 | | | | 611,884 | |
Northampton County PA General Purpose Hospital Authority St. Luke’s Hospital Project Series C (Health Revenue) ± | | | 4.50 | | | | 8-15-2032 | | | | 1,170,000 | | | | 1,232,911 | |
Pennsylvania Higher Educational Facilities Series LL1 (Education Revenue) | | | 5.00 | | | | 11-1-2019 | | | | 880,000 | | | | 963,582 | |
Pennsylvania Higher Educational Facilities Series LL1 (Education Revenue) | | | 5.00 | | | | 11-1-2020 | | | | 590,000 | | | | 649,378 | |
Pennsylvania Higher Educational Facilities Series LL1 (Education Revenue) | | | 5.00 | | | | 11-1-2022 | | | | 1,310,000 | | | | 1,454,925 | |
Pennsylvania Hills PA School District (GO, Build America Mutual Assurance Company Insured) | | | 4.00 | | | | 10-1-2021 | | | | 1,460,000 | | | | 1,601,868 | |
Pennsylvania Public School Building Authority (Miscellaneous Revenue, Build America Mutual Assurance Company Insured) | | | 2.00 | | | | 5-15-2016 | | | | 800,000 | | | | 813,256 | |
Pennsylvania Public School Building Authority (Miscellaneous Revenue, Build America Mutual Assurance Company Insured) | | | 4.00 | | | | 5-15-2021 | | | | 500,000 | | | | 547,960 | |
Pennsylvania Public School Building Authority (Miscellaneous Revenue, Build America Mutual Assurance Company Insured) | | | 4.00 | | | | 5-15-2022 | | | | 1,000,000 | | | | 1,085,280 | |
Pennsylvania Public School Building Authority (Miscellaneous Revenue) | | | 5.00 | | | | 4-1-2020 | | | | 2,000,000 | | | | 2,279,100 | |
Pennsylvania Public School Building Authority (Miscellaneous Revenue) | | | 5.00 | | | | 4-1-2029 | | | | 1,000,000 | | | | 1,102,670 | |
Pennsylvania Public School Building Authority School District Project (Miscellaneous Revenue) | | | 5.00 | | | | 4-1-2024 | | | | 2,000,000 | | | | 2,297,780 | |
Pennsylvania Series 2 (GO) | | | 5.00 | | | | 4-15-2023 | | | | 2,000,000 | | | | 2,291,480 | |
Pennsylvania Turnpike Commission Sub Series B (Miscellaneous Revenue, AGM Insured, JPMorgan Chase & Company SPA) ø | | | 0.04 | | | | 7-15-2041 | | | | 5,400,000 | | | | 5,400,000 | |
Pennsylvania Turnpike Commission Sub Series B (Transportation Revenue) | | | 5.00 | | | | 6-1-2017 | | | | 325,000 | | | | 356,522 | |
Pennsylvania Turnpike Commission Sub Series C (Transportation Revenue, AGM Insured) ¤ | | | 0.00 | | | | 6-1-2033 | | | | 1,350,000 | | | | 1,598,711 | |
Pennsylvania Turnpike Commission Sub Series E (Transportation Revenue) ¤ | | | 0.00 | | | | 12-1-2038 | | | | 2,000,000 | | | | 2,172,980 | |
Philadelphia PA Authority for Industrial Development (Education Revenue) | | | 6.13 | | | | 6-15-2023 | | | | 1,000,000 | | | | 1,080,350 | |
Philadelphia PA Authority for Industrial Development (Education Revenue) | | | 5.88 | | | | 6-15-2022 | | | | 1,000,000 | | | | 1,061,860 | |
Philadelphia PA Authority for Industrial Development (Education Revenue) | | | 7.00 | | | | 5-1-2026 | | | | 740,000 | | | | 801,901 | |
Philadelphia PA Gas Works Series 1998 General Ordinance Series A (Utilities Revenue) | | | 5.00 | | | | 8-1-2015 | | | | 1,000,000 | | | | 1,025,940 | |
Philadelphia PA Gas Works Series 1998 General Ordinance Series A (Utilities Revenue) | | | 5.00 | | | | 8-1-2016 | | | | 1,000,000 | | | | 1,063,560 | |
Philadelphia PA IDA Master Charter School (Education Revenue) | | | 5.00 | | | | 8-1-2020 | | | | 600,000 | | | | 632,586 | |
Philadelphia PA IDA West Philadelphia Achievement Charter Elementary School Project (Education Revenue) | | | 5.00 | | | | 5-1-2016 | | | | 185,000 | | | | 186,650 | |
Philadelphia PA IDA West Philadelphia Achievement Charter Elementary School Project (Education Revenue) | | | 6.25 | | | | 5-1-2021 | | | | 285,000 | | | | 302,525 | |
Philadelphia PA School District Refunding Bond Series C (GO) | | | 5.00 | | | | 9-1-2018 | | | | 8,065,000 | | | | 9,057,802 | |
Philadelphia PA School District Refunding Bond Series C (GO) | | | 5.00 | | | | 9-1-2021 | | | | 2,200,000 | | | | 2,527,470 | |
| | | | |
| 18 | | Wells Fargo Advantage Intermediate Tax/AMT-Free Fund | | Portfolio of investments—December 31, 2014 (unaudited) |
| | | | | | | | | | | | | | | | |
| Security name | | Interest rate | | | Maturity date | | | Principal | | | Value | |
| | | | | | | | | | | | | | | | |
| | | | |
| Pennsylvania (continued) | | | | | | | | | | | | | | | | |
Philadelphia PA Series A (GO) | | | 5.00 | % | | | 9-15-2021 | | | $ | 7,000,000 | | | $ | 8,255,730 | |
Philadelphia PA Series A (GO) | | | 5.25 | | | | 7-15-2028 | | | | 2,590,000 | | | | 3,089,041 | |
Philadelphia PA Series A (GO) | | | 5.25 | | | | 7-15-2029 | | | | 4,410,000 | | | | 5,224,924 | |
Philadelphia PA Series A (GO) | | | 5.25 | | | | 7-15-2032 | | | | 4,380,000 | | | | 5,121,096 | |
Pittsburgh PA Series A (GO) | | | 4.00 | | | | 9-1-2022 | | | | 1,000,000 | | | | 1,128,330 | |
Pittsburgh PA Series A (GO) | | | 5.00 | | | | 9-1-2022 | | | | 2,060,000 | | | | 2,469,095 | |
Pittsburgh PA Series A (GO) | | | 5.00 | | | | 9-1-2023 | | | | 3,810,000 | | | | 4,525,213 | |
Reading PA School District (GO) | | | 5.00 | | | | 4-1-2021 | | | | 3,120,000 | | | | 3,485,882 | |
State Public School Building Authority Pennsylvania School Revenue City of Harrisburg Project Series B-2 (Miscellaneous Revenue, Build America Mutual Assurance Company Insured) | | | 5.00 | | | | 12-1-2024 | | | | 1,250,000 | | | | 1,486,150 | |
State Public School Building Authority Pennsylvania School Revenue City of Harrisburg Project Series B-2 (Miscellaneous Revenue, Build America Mutual Assurance Company Insured) | | | 5.00 | | | | 12-1-2025 | | | | 1,250,000 | | | | 1,469,575 | |
State Public School Building Authority Pennsylvania School Revenue City of Harrisburg Project Series B-2 (Miscellaneous Revenue, Build America Mutual Assurance Company Insured) | | | 5.00 | | | | 12-1-2026 | | | | 1,250,000 | | | | 1,462,350 | |
State Public School Building Authority Pennsylvania School Revenue City of Harrisburg Project Series B-2 (Miscellaneous Revenue, Build America Mutual Assurance Company Insured) | | | 5.00 | | | | 12-1-2027 | | | | 1,010,000 | | | | 1,185,286 | |
| | | | |
| | | | | | | | | | | | | | | 130,280,834 | |
| | | | | | | | | | | | | | | | |
| | | | |
| Puerto Rico: 0.05% | | | | | | | | | | | | | | | | |
Puerto Rico Commonwealth Public Improvement Refunding Bond Series A (Miscellaneous Revenue, National Insured) | | | 5.50 | | | | 7-1-2016 | | | | 1,015,000 | | | | 1,039,928 | |
| | | | | | | | | | | | | | | | |
| | | | |
| Rhode Island: 0.43% | | | | | | | | | | | | | | | | |
Providence RI Series A (GO, AGM Insured) | | | 4.00 | | | | 1-15-2018 | | | | 2,115,000 | | | | 2,259,814 | |
Rhode Island Health & Educational Building Corporation Providence Public Schools Financing Program Series A (Miscellaneous Revenue, AGM Insured) | | | 5.00 | | | | 5-15-2015 | | | | 2,060,000 | | | | 2,090,962 | |
Rhode Island Health & Educational Building Corporation Providence Public Schools Financing Program Series A (Miscellaneous Revenue, AGM Insured) | | | 5.00 | | | | 5-15-2021 | | | | 2,670,000 | | | | 2,807,612 | |
Rhode Island Health & Educational Building Corporation Providence Public Schools Financing Program Series A (Miscellaneous Revenue, AGM Insured) | | | 5.00 | | | | 5-15-2022 | | | | 2,425,000 | | | | 2,599,794 | |
| | | | |
| | | | | | | | | | | | | | | 9,758,182 | |
| | | | | | | | | | | | | | | | |
| | | | |
| South Carolina: 0.37% | | | | | | | | | | | | | | | | |
Connector 2000 Association Incorporated CAB Series A (Transportation Revenue) ¤ | | | 0.00 | | | | 1-1-2015 | | | | 23,869 | | | | 21,969 | |
Connector 2000 Association Incorporated CAB Series A (Transportation Revenue) ¤ | | | 0.00 | | | | 1-1-2016 | | | | 26,606 | | | | 22,344 | |
Connector 2000 Association Incorporated CAB Series A (Transportation Revenue) ¤ | | | 0.00 | | | | 1-1-2017 | | | | 35,996 | | | | 27,346 | |
Connector 2000 Association Incorporated CAB Series A (Transportation Revenue) ¤ | | | 0.00 | | | | 1-1-2018 | | | | 39,781 | | | | 27,027 | |
Lee County SC School Facilities Incorporated Series 2006 (Miscellaneous Revenue, Radian Insured) | | | 6.00 | | | | 12-1-2016 | | | | 590,000 | | | | 638,781 | |
Piedmont SC Municipal Power Agency Series A-3 (Utilities Revenue) | | | 5.25 | | | | 1-1-2019 | | | | 3,500,000 | | | | 3,894,520 | |
South Carolina Education Assistance Authority Student Loan Series I (Education Revenue) | | | 5.00 | | | | 10-1-2024 | | | | 2,380,000 | | | | 2,573,256 | |
South Carolina Jobs EDA York Preparatory Academy Project Series A (Education Revenue) | | | 7.00 | | | | 11-1-2033 | | | | 1,000,000 | | | | 1,096,730 | |
| | | | |
| | | | | | | | | | | | | | | 8,301,973 | |
| | | | | | | | | | | | | | | | |
| | | | | | |
| Portfolio of investments—December 31, 2014 (unaudited) | | Wells Fargo Advantage Intermediate Tax/AMT-Free Fund | | | 19 | |
| | | | | | | | | | | | | | | | |
| Security name | | Interest rate | | | Maturity date | | | Principal | | | Value | |
| | | | | | | | | | | | | | | | |
| | | | |
| South Dakota: 0.05% | | | | | | | | | | | | | | | | |
Rapid City SD Airport Project (Airport Revenue) | | | 6.25 | % | | | 12-1-2026 | | | $ | 920,000 | | | $ | 1,022,037 | |
| | | | | | | | | | | | | | | | |
| | | | |
| Tennessee: 1.96% | | | | | | | | | | | | | | | | |
Franklin County TN HEFA (Education Revenue) | | | 4.00 | | | | 9-1-2024 | | | | 250,000 | | | | 276,743 | |
Franklin County TN HEFA (Education Revenue) | | | 5.00 | | | | 9-1-2030 | | | | 560,000 | | | | 644,034 | |
Shelby County TN Health Educational & Housing Facilities Board Le Bonheur Children’s Medical Center Series D (Health Revenue, National Insured) | | | 5.50 | | | | 8-15-2019 | | | | 540,000 | | | | 600,712 | |
Shelby County TN Health Educational & Housing Facilities Board Methodist Le Bonheur Series B (Health Revenue, AGM Insured, U.S. Bank NA SPA) ø | | | 0.05 | | | | 6-1-2042 | | | | 20,150,000 | | | | 20,150,000 | |
Tennessee Energy Acquisition Corporation Series A (Utilities Revenue) | | | 5.25 | | | | 9-1-2024 | | | | 1,750,000 | | | | 2,066,943 | |
Tennessee Energy Acquisition Corporation Series A (Utilities Revenue) | | | 5.25 | | | | 9-1-2017 | | | | 2,140,000 | | | | 2,364,015 | |
Tennessee Energy Acquisition Corporation Series A (Utilities Revenue) | | | 5.25 | | | | 9-1-2018 | | | | 1,400,000 | | | | 1,593,746 | |
Tennessee Energy Acquisition Corporation Series A (Utilities Revenue) | | | 5.25 | | | | 9-1-2021 | | | | 4,060,000 | | | | 4,679,881 | |
Tennessee Energy Acquisition Corporation Series A (Utilities Revenue) | | | 5.25 | | | | 9-1-2026 | | | | 5,790,000 | | | | 6,863,350 | |
Tennessee Energy Acquisition Corporation Series C (Utilities Revenue) | | | 5.00 | | | | 2-1-2016 | | | | 1,820,000 | | | | 1,895,384 | |
Tennessee Energy Acquisition Corporation Series C (Utilities Revenue) | | | 5.00 | | | | 2-1-2027 | | | | 2,485,000 | | | | 2,884,265 | |
| | | | |
| | | | | | | | | | | | | | | 44,019,073 | |
| | | | | | | | | | | | | | | | |
| | | | |
| Texas: 6.00% | | | | | | | | | | | | | | | | |
Arlington TX Special Obligation Dallas Cowboys Series A (Tax Revenue, National Insured) | | | 5.00 | | | | 8-15-2034 | | | | 250,000 | | | | 256,238 | |
Austin TX Refunding Revenue Bond (Utilities Revenue, National Insured) | | | 5.25 | | | | 5-15-2025 | | | | 1,400,000 | | | | 1,710,828 | |
Bexar County TX Combination Tax COP (GO) | | | 5.00 | | | | 6-15-2024 | | | | 1,000,000 | | | | 1,237,760 | |
Central Texas Regional Mobility Authority (Transportation Revenue) | | | 5.75 | | | | 1-1-2019 | | | | 1,310,000 | | | | 1,514,596 | |
Conroe TX Independent School District Series A (GO) | | | 4.00 | | | | 2-15-2023 | | | | 1,000,000 | | | | 1,151,270 | |
Galveston TX Wharves & Terminal (Airport Revenue) | | | 5.00 | | | | 2-1-2026 | | | | 2,000,000 | | | | 2,166,260 | |
Harris County TX Toll Road Project Series C (GO, AGM Insured) | | | 5.25 | | | | 8-15-2027 | | | | 4,000,000 | | | | 5,107,040 | |
Houston TX Airport Senior Lien Series A (Airport Revenue) | | | 5.00 | | | | 7-1-2025 | | | | 1,000,000 | | | | 1,116,430 | |
Houston TX Higher Education Financial Corporation Series A (Education Revenue) | | | 4.00 | | | | 2-15-2022 | | | | 955,000 | | | | 1,003,906 | |
Houston TX Independent School District Limited Tax (GO) | | | 4.25 | | | | 2-15-2021 | | | | 5,000,000 | | | | 5,351,900 | |
Houston TX Utilities Systems Series A (Water & Sewer Revenue) | | | 5.25 | | | | 11-15-2031 | | | | 3,000,000 | | | | 3,529,230 | |
Lower Colorado River TX Authority (Utilities Revenue) | | | 5.50 | | | | 5-15-2031 | | | | 2,500,000 | | | | 2,998,525 | |
Midtown TX RDA (Tax Revenue, Ambac Insured) | | | 5.00 | | | | 1-1-2020 | | | | 1,495,000 | | | | 1,498,738 | |
Midtown TX RDA (Tax Revenue, Build America Mutual Assurance Company Insured) | | | 5.25 | | | | 1-1-2027 | | | | 1,880,000 | | | | 2,199,280 | |
Midtown TX RDA (Tax Revenue, Build America Mutual Assurance Company Insured) | | | 5.25 | | | | 1-1-2029 | | | | 2,390,000 | | | | 2,775,483 | |
Midtown TX RDA (Tax Revenue, Build America Mutual Assurance Company Insured) | | | 5.25 | | | | 1-1-2030 | | | | 1,500,000 | | | | 1,731,540 | |
Midtown TX RDA (Tax Revenue, Build America Mutual Assurance Company Insured) | | | 5.25 | | | | 1-1-2031 | | | | 1,000,000 | | | | 1,143,680 | |
North Harris County TX Regional Water Authority Senior Lien (Water & Sewer Revenue, Build America Mutual Assurance Company Insured) | | | 5.00 | | | | 12-15-2029 | | | | 1,215,000 | | | | 1,417,626 | |
North Texas Health Facilities Development Corporation United Regional Health Care System (Health Revenue, AGM Insured) | | | 5.00 | | | | 9-1-2016 | | | | 1,135,000 | | | | 1,211,590 | |
North Texas Higher Education Authority Incoming Student Loan Series A-2 (Education Revenue) ± | | | 1.14 | | | | 7-1-2030 | | | | 9,880,000 | | | | 9,895,709 | |
Port Arthur TX Naval District Environmental Facilities Motiva Enterprises Project Series B (Resource Recovery Revenue) ø | | | 0.20 | | | | 12-1-2039 | | | | 3,800,000 | | | | 3,800,000 | |
Port Arthur TX Navigation District Jefferson County Environmental Facilities Motiva Enterprises LLC Project Series A (Resource Recovery Revenue) ø | | | 0.20 | | | | 12-1-2039 | | | | 19,000,000 | | | | 19,000,000 | |
| | | | |
| 20 | | Wells Fargo Advantage Intermediate Tax/AMT-Free Fund | | Portfolio of investments—December 31, 2014 (unaudited) |
| | | | | | | | | | | | | | | | |
| Security name | | Interest rate | | | Maturity date | | | Principal | | | Value | |
| | | | | | | | | | | | | | | | |
| | | | |
| Texas (continued) | | | | | | | | | | | | | | | | |
Round Rock TX Transportation Systems Development Corporation (Tax Revenue, National Insured) | | | 4.50 | % | | | 8-15-2020 | | | $ | 1,000,000 | | | $ | 1,014,670 | |
Tarrant County TX Cultural Education Facilities Finance Corporation Texas Health Resources Series C (Health Revenue, JPMorgan Chase & Company SPA) ø | | | 0.14 | | | | 11-15-2033 | | | | 10,000,000 | | | | 10,000,000 | |
Texas Municipal Gas Acquisition & Supply Corporation II Series B (Utilities Revenue, JPMorgan Chase & Company Guaranteed) ± | | | 0.50 | | | | 9-15-2017 | | | | 5,075,000 | | | | 5,081,902 | |
Texas Municipal Gas Acquisition & Supply Corporation III Gas Supply Revenue (Utilities Revenue) | | | 5.00 | | | | 12-15-2021 | | | | 3,945,000 | | | | 4,595,688 | |
Texas Municipal Gas Acquisition & Supply Corporation III Gas Supply Revenue (Utilities Revenue) | | | 5.00 | | | | 12-15-2023 | | | | 7,925,000 | | | | 9,045,278 | |
Texas Municipal Gas Acquisition & Supply Corporation Series B (Utilities Revenue) | | | 5.00 | | | | 12-15-2022 | | | | 8,000,000 | | | | 9,309,280 | |
Texas PFA Cosmos Foundation Series A (Education Revenue) | | | 5.00 | | | | 2-15-2018 | | | | 530,000 | | | | 533,111 | |
Texas Private Activity Surface Transportation Corporation Project (Transportation Revenue) | | | 7.50 | | | | 6-30-2032 | | | | 2,000,000 | | | | 2,488,200 | |
Texas Private Activity Surface Transportation Corporation Project (Transportation Revenue) | | | 7.50 | | | | 6-30-2033 | | | | 2,000,000 | | | | 2,484,720 | |
Texas Private Activity Surface Transportation Corporation Project Senior Lien Note (Transportation Revenue) | | | 7.50 | | | | 12-31-2031 | | | | 3,500,000 | | | | 4,273,535 | |
Texas SA Energy Acquisition Public Facility Corporation (Utilities Revenue) | | | 5.25 | | | | 8-1-2016 | | | | 1,210,000 | | | | 1,287,743 | |
Texas SA Energy Acquisition Public Facility Corporation Gas Supply (Utilities Revenue) | | | 5.50 | | | | 8-1-2019 | | | | 1,465,000 | | | | 1,681,688 | |
Texas Woman’s University Financing System (Education Revenue) | | | 4.00 | | | | 7-1-2020 | | | | 1,000,000 | | | | 1,118,070 | |
Tomball TX Independent School District Refunding Balance School Building (GO, Permanent School Fund Insured) ¤ | | | 0.00 | | | | 2-15-2015 | | | | 825,000 | | | | 824,860 | |
University of Houston Texas (Education Revenue) | | | 5.00 | | | | 2-15-2024 | | | | 2,700,000 | | | | 3,064,095 | |
University of Houston Texas Series B (Education Revenue) | | | 5.25 | | | | 7-1-2026 | | | | 4,225,000 | | | | 5,451,053 | |
Waco TX Health Facilities Development Corporation Hillcrest System Project Series A (Health Revenue, National/FHA Insured) | | | 5.00 | | | | 8-1-2016 | | | | 920,000 | | | | 985,734 | |
| | | | |
| | | | | | | | | | | | | | | 135,057,256 | |
| | | | | | | | | | | | | | | | |
| | | | |
| Utah: 0.02% | | | | | | | | | | | | | | | | |
Utah County UT Lakeview Academy Series A (Education Revenue) | | | 5.35 | | | | 7-15-2017 | | | | 430,000 | | | | 442,444 | |
| | | | | | | | | | | | | | | | |
| | | | |
| Virgin Islands: 0.39% | | | | | | | | | | | | | | | | |
Virgin Islands PFA (Miscellaneous Revenue) | | | 6.75 | | | | 10-1-2019 | | | | 3,000,000 | | | | 3,400,740 | |
Virgin Islands PFA Sub Lien Series C (Miscellaneous Revenue) | | | 5.00 | | | | 10-1-2017 | | | | 5,000,000 | | | | 5,389,450 | |
| | | | |
| | | | | | | | | | | | | | | 8,790,190 | |
| | | | | | | | | | | | | | | | |
| | | | |
| Virginia: 1.30% | | | | | | | | | | | | | | | | |
Marquis VA CDA CAB Series C (Tax Revenue) ¤ | | | 0.00 | | | | 9-1-2041 | | | | 1,772,000 | | | | 251,057 | |
Marquis VA CDA Series B (Tax Revenue) | | | 5.63 | | | | 9-1-2041 | | | | 1,274,000 | | | | 1,208,121 | |
Reynolds Crossing CDA VA Reynolds Crossing Project (Miscellaneous Revenue) | | | 5.10 | | | | 3-1-2021 | | | | 321,000 | | | | 322,226 | |
Virginia Public Building Authority Series C (Miscellaneous Revenue) | | | 4.00 | | | | 8-1-2025 | | | | 20,255,000 | | | | 23,005,200 | |
Virginia Small Business Financing Authority (Education Revenue) | | | 5.25 | | | | 10-1-2029 | | | | 3,000,000 | | | | 3,467,910 | |
Virginia State College Building Authority Regent University Project (Education Revenue) | | | 5.00 | | | | 6-1-2015 | | | | 210,000 | | | | 213,707 | |
Watkins Centre VA CDA (Miscellaneous Revenue) | | | 5.40 | | | | 3-1-2020 | | | | 808,000 | | | | 810,384 | |
| | | | |
| | | | | | | | | | | | | | | 29,278,605 | |
| | | | | | | | | | | | | | | | |
| | | | | | |
| Portfolio of investments—December 31, 2014 (unaudited) | | Wells Fargo Advantage Intermediate Tax/AMT-Free Fund | | | 21 | |
| | | | | | | | | | | | | | | | |
| Security name | | Interest rate | | | Maturity date | | | Principal | | | Value | |
| | | | | | | | | | | | | | | | |
| | | | |
| Washington: 1.05% | | | | | | | | | | | | | | | | |
Energy Northwest Washington (Utilities Revenue) | | | 5.00 | % | | | 7-1-2022 | | | $ | 1,185,000 | | | $ | 1,409,676 | |
Grant County WA Public Utility District # 2 Priest Rapids Series A (Utilities Revenue, National Insured) | | | 5.00 | | | | 1-1-2023 | | | | 345,000 | | | | 361,284 | |
Lewis County WA Public Utility District Refunding (Utilities Revenue) | | | 5.25 | | | | 4-1-2032 | | | | 6,115,000 | | | | 7,306,936 | |
Port of Seattle WA Intermediate Lien Series A (Airport Revenue, National Insured) | | | 5.00 | | | | 3-1-2028 | | | | 7,475,000 | | | | 7,524,260 | |
TES Properties Washington (Miscellaneous Revenue) | | | 5.50 | | | | 12-1-2029 | | | | 1,400,000 | | | | 1,607,788 | |
Tumwater Office Properties Washington Lease Revenue Washington Office Buildings (Miscellaneous Revenue) | | | 5.00 | | | | 7-1-2026 | | | | 2,750,000 | | | | 3,275,663 | |
Washington EDFA (Education Revenue) | | | 5.00 | | | | 6-1-2028 | | | | 1,000,000 | | | | 1,212,320 | |
Washington HEFAR Whitworth University Project (Education Revenue, U.S. Bank NA Insured) | | | 5.00 | | | | 10-1-2015 | | | | 1,010,000 | | | | 1,040,098 | |
| | | | |
| | | | | | | | | | | | | | | 23,738,025 | |
| | | | | | | | | | | | | | | | |
| | | | |
| West Virginia: 0.05% | | | | | | | | | | | | | | | | |
West Virginia School Building Authority (Miscellaneous Revenue) | | | 5.25 | | | | 7-1-2020 | | | | 1,100,000 | | | | 1,236,543 | |
| | | | | | | | | | | | | | | | |
| | | | |
| Wisconsin: 0.77% | | | | | | | | | | | | | | | | |
Kenosha WI Unified School District #1 Series A (GO) | | | 4.50 | | | | 4-1-2015 | | | | 1,620,000 | | | | 1,636,702 | |
Wisconsin HEFA Bellin Memorial Hospital (Health Revenue, Ambac Insured) | | | 5.50 | | | | 2-15-2019 | | | | 950,000 | | | | 1,004,739 | |
Wisconsin HEFA Mercy Alliance Incorporated Project Series A (Health Revenue) | | | 5.00 | | | | 6-1-2019 | | | | 2,070,000 | | | | 2,146,590 | |
Wisconsin HEFA Series A (Health Revenue) | | | 5.00 | | | | 7-15-2021 | | | | 3,500,000 | | | | 3,968,230 | |
Wisconsin HEFA Series A (Health Revenue) | | | 5.00 | | | | 11-15-2023 | | | | 3,500,000 | | | | 4,149,075 | |
Wisconsin HEFA Series E (Housing Revenue) | | | 4.15 | | | | 5-1-2015 | | | | 210,000 | | | | 212,579 | |
Wisconsin HEFA Series M (Health Revenue, National Insured) ±(n)(m) | | | 0.09 | | | | 6-1-2019 | | | | 2,650,000 | | | | 2,570,500 | |
Wisconsin PFA Charter School Voyager Foundation Incorporate Project Series A (Education Revenue) | | | 6.00 | | | | 10-1-2032 | | | | 1,475,000 | | | | 1,593,251 | |
| | | | |
| | | | | | | | | | | | | | | 17,281,666 | |
| | | | | | | | | | | | | | | | |
| | | | |
Total Municipal Obligations (Cost $2,109,122,269) | | | | | | | | | | | | | | | 2,209,000,359 | |
| | | | | | | | | | | | | | | | |
| | | | |
| | | Yield | | | | | | Shares | | | | |
| Short-Term Investments: 1.11% | | | | | | | | | | | | | | | | |
| | | | |
| Investment Companies: 1.10% | | | | | | | | | | | | | | | | |
Wells Fargo Advantage National Tax-Free Money Market Fund, Institutional Class (u)(l)## | | | 0.01 | | | | | | | | 24,714,237 | | | | 24,714,237 | |
| | | | | | | | | | | | | | | | |
| | | | |
| | | | | | | | | Principal | | | | |
| U.S. Treasury Securities: 0.01% | | | | | | | | | | | | | | | | |
U.S. Treasury Bill (z)# | | | 0.03 | | | | 3-19-2015 | | | $ | 275,000 | | | | 274,990 | |
| | | | | | | | | | | | | | | | |
| | | | |
Total Short-Term Investments (Cost $24,989,221) | | | | | | | | | | | | | | | 24,989,227 | |
| | | | | | | | | | | | | | | | |
| | | | | | | | |
| Total investments in securities (Cost $2,134,111,490) * | | | 99.26 | % | | | 2,233,989,586 | |
Other assets and liabilities, net | | | 0.74 | | | | 16,669,587 | |
| | | | | | | | |
| Total net assets | | | 100.00 | % | | $ | 2,250,659,173 | |
| | | | | | | | |
| | | | |
| 22 | | Wells Fargo Advantage Intermediate Tax/AMT-Free Fund | | Portfolio of investments—December 31, 2014 (unaudited) |
| ± | Variable rate investment. The rate shown is the rate in effect at period end. |
| ø | Variable rate demand notes are subject to a demand feature which reduces the effective maturity. The maturity date shown represents the final maturity date of the security. The interest rate is determined and reset by the issuer daily, weekly, or monthly depending upon the terms of the security. The rate shown is the rate in effect at period end. |
| ¤ | The security is issued in zero coupon form with no periodic interest payments. |
| 144A | The security may be resold in transactions exempt from registration, normally to qualified institutional buyers, pursuant to Rule 144A under the Securities Act of 1933. |
| %% | The security is issued on a when-issued basis. |
| (n) | The auction to set the interest rate on the security failed at period end due to insufficient investor interest. A failed auction does not itself cause a default. |
| (m) | The security is an auction-rate security which has an interest rate that resets at predetermined short-term intervals through a Dutch auction. The rate shown is the rate in effect at period end. |
| (u) | The rate represents the 7-day annualized yield at period end. |
| (l) | The security represents an affiliate of the Fund as defined in the Investment Company Act of 1940. |
| ## | All or a portion of this security is segregated for when-issued securities. |
| (z) | Zero coupon security. The rate represents the current yield to maturity. |
| # | All or a portion of this security is segregated as collateral for investments in derivative instruments. |
| * | Cost for federal income tax purposes is $2,134,108,781 and unrealized gains (losses) consists of: |
| | | | |
Gross unrealized gains | | $ | 101,774,065 | |
Gross unrealized losses | | | (1,893,260 | ) |
| | | | |
Net unrealized gains | | $ | 99,880,805 | |
| | | | | | |
| Portfolio of investments—December 31, 2014 (unaudited) | | Wells Fargo Advantage Municipal Bond Fund | | | 1 | |
| | | | | | | | | | | | | | | | |
| Security name | | Interest rate | | | Maturity date | | | Principal | | | Value | |
| | | | |
Municipal Obligations: 98.67% | | | | | | | | | | | | | | | | |
| | | | |
| Alabama: 1.60% | | | | | | | | | | | | | | | | |
Alabama State University General Tuition and Fee Revenue Bonds (Education Revenue, Syncora Guarantee Incorporated Insured) | | | 5.25 | % | | | 8-1-2032 | | | $ | 10,520,000 | | | $ | 10,827,080 | |
Jefferson County AL Limited Obligation School District Series A (Tax Revenue, AGM Insured) | | | 5.25 | | | | 1-1-2018 | | | | 775,000 | | | | 776,736 | |
Jefferson County AL Limited Obligation School District Series A (Tax Revenue) | | | 5.25 | | | | 1-1-2020 | | | | 3,000,000 | | | | 3,024,900 | |
Jefferson County AL Sewer Revenue Warrants CAB Series B (Water & Sewer Revenue, AGM Insured) ¤ | | | 0.00 | | | | 10-1-2025 | | | | 710,000 | | | | 433,164 | |
Jefferson County AL Sewer Revenue Warrants CAB Series B (Water & Sewer Revenue, AGM Insured) ¤ | | | 0.00 | | | | 10-1-2026 | | | | 3,000,000 | | | | 1,748,040 | |
Jefferson County AL Sewer Revenue Warrants CAB Series B (Water & Sewer Revenue, AGM Insured) ¤ | | | 0.00 | | | | 10-1-2029 | | | | 4,115,000 | | | | 1,989,068 | |
Jefferson County AL Warrants Series A (GO) | | | 4.90 | | | | 4-1-2021 | | | | 7,375,000 | | | | 7,951,209 | |
Jefferson County AL Warrants Series C (GO) | | | 4.90 | | | | 4-1-2021 | | | | 4,255,000 | | | | 4,587,273 | |
Tuscaloosa County AL IDA Series A (Industrial Development Revenue) ø | | | 0.24 | | | | 9-1-2020 | | | | 20,000,000 | | | | 20,000,000 | |
| | | | |
| | | | | | | | | | | | | | | 51,337,470 | |
| | | | | | | | | | | | | | | | |
| | | | |
| Arizona: 0.82% | | | | | | | | | | | | | | | | |
Phoenix AZ IDA Legacy Traditional Schools Project Series A (Education Revenue) 144A | | | 6.50 | | | | 7-1-2034 | | | | 2,000,000 | | | | 2,260,220 | |
Pima County AZ IDA Acclaim Charter School Project (Education Revenue) | | | 5.60 | | | | 12-1-2016 | | | | 250,000 | | | | 255,233 | |
Pima County AZ IDA Global Water Resources LLC Project (Water & Sewer Revenue) | | | 5.45 | | | | 12-1-2017 | | | | 100,000 | | | | 102,163 | |
Pima County AZ IDA New Plan Learning Project Series A (Education Revenue) | | | 7.75 | | | | 7-1-2035 | | | | 7,510,000 | | | | 7,553,633 | |
Pima County AZ IDA New Plan Learning Series A (Education Revenue) | | | 8.13 | | | | 7-1-2041 | | | | 6,495,000 | | | | 6,532,606 | |
Pima County AZ IDA Noah Webster Schools-PIMA Project (Education Revenue) | | | 7.00 | | | | 12-15-2043 | | | | 3,225,000 | | | | 3,416,049 | |
Salt Verde AZ Financial Corporation (Utilities Revenue, Citibank NA Guaranty Agreement) | | | 5.00 | | | | 12-1-2032 | | | | 2,605,000 | | | | 3,008,462 | |
Tempe AZ IDA Friendship Village Project Series A (Health Revenue) | | | 5.25 | | | | 12-1-2020 | | | | 1,000,000 | | | | 1,098,390 | |
Tempe AZ IDA Friendship Village Project Series A (Health Revenue) | | | 5.38 | | | | 12-1-2021 | | | | 1,000,000 | | | | 1,100,080 | |
Tempe AZ IDA Friendship Village Project Series A (Health Revenue) | | | 5.50 | | | | 12-1-2022 | | | | 1,000,000 | | | | 1,094,880 | |
| | | | |
| | | | | | | | | | | | | | | 26,421,716 | |
| | | | | | | | | | | | | | | | |
| | | | |
| California: 10.32% | | | | | | | | | | | | | | | | |
Alameda County CA Certificate of Participation (Miscellaneous Revenue, National Insured) ¤ | | | 0.00 | | | | 6-15-2019 | | | | 1,400,000 | | | | 1,262,744 | |
Alhambra CA Unified School District CAB Election of 2008 Series B (GO, AGM Insured) ¤ | | | 0.00 | | | | 8-1-2031 | | | | 2,175,000 | | | | 1,136,981 | |
Alhambra CA Unified School District CAB Election of 2008 Series B (GO, AGM Insured) ¤ | | | 0.00 | | | | 8-1-2032 | | | | 3,795,000 | | | | 1,865,470 | |
Alhambra CA Unified School District CAB Election of 2008 Series B (GO, AGM Insured) ¤ | | | 0.00 | | | | 8-1-2034 | | | | 5,000,000 | | | | 2,202,750 | |
Alhambra CA Unified School District CAB Election of 2008 Series B (GO, AGM Insured) ¤ | | | 0.00 | | | | 8-1-2035 | | | | 6,700,000 | | | | 2,817,149 | |
Alhambra CA Unified School District CAB Series B (GO, AGM Insured) ¤ | | | 0.00 | | | | 8-1-2031 | | | | 7,500,000 | | | | 3,876,225 | |
Anaheim CA PFA Series A (Lease Revenue) | | | 5.00 | | | | 5-1-2046 | | | | 8,500,000 | | | | 9,357,395 | |
Bass Lake CA Unified Elementary School District CAB (GO, AGM Insured) ¤ | | | 0.00 | | | | 8-1-2037 | | | | 1,305,000 | | | | 490,523 | |
Bass Lake CA Unified Elementary School District CAB (GO, AGM Insured) ¤ | | | 0.00 | | | | 8-1-2038 | | | | 1,900,000 | | | | 680,751 | |
Bass Lake CA Unified Elementary School District CAB (GO, AGM Insured) ¤ | | | 0.00 | | | | 8-1-2039 | | | | 2,005,000 | | | | 682,823 | |
Bay Area CA Toll Authority Toll Bridge Revenue Series A (Transportation Revenue) ± | | | 1.29 | | | | 4-1-2036 | | | | 28,000,000 | | | | 28,649,880 | |
California (Miscellaneous Revenue) | | | 5.00 | | | | 8-1-2033 | | | | 30,000,000 | | | | 35,402,700 | |
| | | | |
| 2 | | Wells Fargo Advantage Municipal Bond Fund | | Portfolio of investments—December 31, 2014 (unaudited) |
| | | | | | | | | | | | | | | | |
| Security name | | Interest rate | | | Maturity date | | | Principal | | | Value | |
| | | | |
| California (continued) | | | | | | | | | | | | | | | | |
California Foothill/Eastern Transportation Corridor Agency CAB Series A (Transportation Revenue, AGM Insured) ¤ | | | 0.00 | % | | | 1-15-2022 | | | $ | 12,255,000 | | | $ | 10,068,218 | |
California Foothill/Eastern Transportation Corridor Agency CAB Series A (Transportation Revenue, AGM Insured) ¤ | | | 0.00 | | | | 1-15-2023 | | | | 11,695,000 | | | | 9,181,861 | |
California Foothill/Eastern Transportation Corridor Agency CAB Series A (Transportation Revenue, AGM Insured) ¤ | | | 0.00 | | | | 1-15-2024 | | | | 2,000,000 | | | | 1,512,960 | |
California HFFA Unrefunded Bond Providence Health Services Series C (Health Revenue) (h) | | | 6.50 | | | | 10-1-2038 | | | | 10,050,000 | | | | 12,101,808 | |
California Municipal Finance Authority Charter School Revenue Albert Einstein Academies Project Series A (Miscellaneous Revenue) | | | 7.13 | | | | 8-1-2043 | | | | 2,230,000 | | | | 2,568,246 | |
California PFOTER PT-2802 (GO, National Insured, Dexia Credit Local SPA) ø | | | 0.23 | | | | 2-1-2025 | | | | 3,985,000 | | | | 3,985,000 | |
California Pollution Control Financing Waste Management Incorporated Project Series A-2 (Resource Recovery Revenue) | | | 5.40 | | | | 4-1-2025 | | | | 1,240,000 | | | | 1,264,205 | |
California Public Works Board Department of General Services Buildings 8 & 9A (Miscellaneous Revenue) | | | 6.25 | | | | 4-1-2034 | | | | 4,000,000 | | | | 4,794,520 | |
California Public Works Board Judicial Council Project Series A (Miscellaneous Revenue) | | | 5.00 | | | | 3-1-2031 | | | | 3,260,000 | | | | 3,764,778 | |
California Statewide CDA School Facility Aspire Public Schools (Education Revenue) | | | 5.00 | | | | 7-1-2020 | | | | 870,000 | | | | 902,521 | |
California Statewide CDA Sutter Health Series A (Health Revenue) | | | 6.00 | | | | 8-15-2042 | | | | 4,900,000 | | | | 5,876,619 | |
Cerritos CA Community College District CAB Election of 2004 Series D (GO) ¤ | | | 0.00 | | | | 8-1-2024 | | | | 750,000 | | | | 571,358 | |
Cerritos CA Community College District CAB Election of 2004 Series D (GO) ¤ | | | 0.00 | | | | 8-1-2027 | | | | 1,000,000 | | | | 662,150 | |
Cerritos CA Community College District CAB Election of 2004 Series D (GO) ¤ | | | 0.00 | | | | 8-1-2028 | | | | 1,040,000 | | | | 650,021 | |
Clovis CA Unified School District CAB Election of 2001 Series B (GO, National Insured) ¤ | | | 0.00 | | | | 8-1-2025 | | | | 535,000 | | | | 390,315 | |
Colton CA Unified School District CAB Series B (GO, AGM Insured) ¤ | | | 0.00 | | | | 8-1-2031 | | | | 1,000,000 | | | | 516,830 | |
Colton CA Unified School District CAB Series B (GO, AGM Insured) ¤ | | | 0.00 | | | | 8-1-2032 | | | | 1,000,000 | | | | 490,710 | |
Colton CA Unified School District CAB Series B (GO, AGM Insured) ¤ | | | 0.00 | | | | 8-1-2033 | | | | 1,000,000 | | | | 469,530 | |
Compton CA Community College District CAB Election of 2002 Series C (GO) ¤ | | | 0.00 | | | | 8-1-2032 | | | | 2,515,000 | | | | 1,092,265 | |
Compton CA Community College District CAB Election of 2002 Series C (GO) ¤ | | | 0.00 | | | | 8-1-2033 | | | | 2,000,000 | | | | 814,940 | |
Compton CA Community College District CAB Election of 2002 Series C (GO) ¤ | | | 0.00 | | | | 8-1-2036 | | | | 510,000 | | | | 177,577 | |
El Monte CA Union High School District CAB Election of 2008 (GO, AGM Insured) ¤ | | | 0.00 | | | | 6-1-2028 | | | | 1,165,000 | | | | 703,054 | |
El Monte CA Union High School District CAB Election of 2008 (GO, AGM Insured) ¤ | | | 0.00 | | | | 6-1-2029 | | | | 1,500,000 | | | | 864,405 | |
El Monte CA Union High School District CAB Election of 2008 (GO, AGM Insured) ¤ | | | 0.00 | | | | 6-1-2030 | | | | 2,000,000 | | | | 1,092,660 | |
El Monte CA Union High School District CAB Election of 2008 (GO, AGM Insured) ¤ | | | 0.00 | | | | 6-1-2031 | | | | 2,000,000 | | | | 1,020,640 | |
El Monte CA Union High School District CAB Election of 2008 (GO, AGM Insured) ¤ | | | 0.00 | | | | 6-1-2032 | | | | 1,660,000 | | | | 803,473 | |
El Monte CA Union High School District CAB Election of 2008 (GO, AGM Insured) ¤ | | | 0.00 | | | | 6-1-2033 | | | | 1,230,000 | | | | 567,965 | |
El Monte CA Union High School District CAB Election of 2008 (GO, AGM Insured) ¤ | | | 0.00 | | | | 6-1-2034 | | | | 1,615,000 | | | | 708,339 | |
Gilroy CA Unified School District Prerefunded CAB Election of 2008 Series A (GO, AGM Insured) ¤ | | | 0.00 | | | | 8-1-2032 | | | | 6,470,000 | | | | 3,839,427 | |
Gilroy CA Unified School District Unrefunded CAB Election of 2008 Series A (GO, AGM Insured) ¤ | | | 0.00 | | | | 8-1-2032 | | | | 3,330,000 | | | | 1,634,064 | |
Golden State Tobacco Securitization Corporate California Tobacco Settlement Revenue Series A (Tobacco Revenue, AGM Insured) ¤ | | | 0.00 | | | | 6-1-2026 | | | | 18,200,000 | | | | 12,792,052 | |
Golden State Tobacco Securitization Corporate California Tobacco Settlement Revenue Series A (Miscellaneous Revenue) | | | 5.00 | | | | 6-1-2030 | | | | 970,000 | | | | 1,112,551 | |
Golden West CA Schools Financing Authority PFOTER 3016 (Miscellaneous Revenue, Dexia Credit Local LOC, FGIC Insured, Dexia Credit Local LIQ) 144Aø | | | 0.13 | | | | 8-1-2026 | | | | 6,920,000 | | | | 6,920,000 | |
Grossmont CA Union High School District CAB Election of 2004 (GO) ¤ | | | 0.00 | | | | 8-1-2025 | | | | 2,060,000 | | | | 1,502,894 | |
Hawthorne CA School District CAB Series C (GO, National Insured) ¤ | | | 0.00 | | | | 11-1-2025 | | | | 1,265,000 | | | | 846,437 | |
Long Beach CA Bond Financing Authority Series A (Utilities Revenue) | | | 5.50 | | | | 11-15-2032 | | | | 4,990,000 | | | | 6,134,407 | |
M-S-R California Energy Authority Gas Series B (Utilities Revenue) | | | 6.13 | | | | 11-1-2029 | | | | 25,425,000 | | | | 32,514,507 | |
| | | | | | |
| Portfolio of investments—December 31, 2014 (unaudited) | | Wells Fargo Advantage Municipal Bond Fund | | | 3 | |
| | | | | | | | | | | | | | | | |
| Security name | | Interest rate | | | Maturity date | | | Principal | | | Value | |
| | | | |
| California (continued) | | | | | | | | | | | | | | | | |
M-S-R California Energy Authority Gas Series C (Utilities Revenue) | | | 6.13 | % | | | 11-1-2029 | | | $ | 1,000,000 | | | $ | 1,278,840 | |
M-S-R California Energy Authority Gas Series C (Utilities Revenue) | | | 7.00 | | | | 11-1-2034 | | | | 3,755,000 | | | | 5,345,468 | |
Merced CA City School District CAB (GO, National Insured) ¤ | | | 0.00 | | | | 8-1-2024 | | | | 1,375,000 | | | | 1,014,393 | |
Modesto CA High School District CAB Series A (GO, National Insured) ¤ | | | 0.00 | | | | 8-1-2024 | | | | 2,215,000 | | | | 1,697,000 | |
Montebello CA Unified School District CAB Election of 1998 (GO, National Insured) ¤ | | | 0.00 | | | | 8-1-2024 | | | | 1,130,000 | | | | 833,646 | |
Montebello CA Unified School District CAB Election of 1998 (GO, National Insured) ¤ | | | 0.00 | | | | 8-1-2025 | | | | 2,335,000 | | | | 1,642,532 | |
Montebello CA Unified School District CAB Election of 1998 (GO, National Insured) ¤ | | | 0.00 | | | | 8-1-2027 | | | | 2,775,000 | | | | 1,716,671 | |
Morongo Band of Mission Indians California Enterprise Casino Series B (Miscellaneous Revenue) 144A | | | 6.50 | | | | 3-1-2028 | | | | 2,000,000 | | | | 2,245,800 | |
Newark CA Unified School District CAB Election of 1997 Series D (GO, AGM Insured) ¤ | | | 0.00 | | | | 8-1-2026 | | | | 1,770,000 | | | | 1,183,192 | |
Northern California Gas Authority #1 LIBOR Series B (Utilities Revenue) ± | | | 0.88 | | | | 7-1-2027 | | | | 29,660,000 | | | | 27,257,243 | |
Ontario Montclair CA School District CAB (GO, AGM Insured) ¤ | | | 0.00 | | | | 8-1-2028 | | | | 1,500,000 | | | | 927,570 | |
Ontario Montclair CA School District CAB (GO, AGM Insured) ¤ | | | 0.00 | | | | 8-1-2030 | | | | 2,000,000 | | | | 1,127,840 | |
Palomar CA College District CAB Election of 2006 Series B (GO) ¤ | | | 0.00 | | | | 8-1-2025 | | | | 2,000,000 | | | | 1,459,120 | |
Palomar Pomerado CA Health ROC (GO, National Insured, Citibank NA LIQ) 144Aø | | | 0.29 | | | | 2-1-2016 | | | | 6,000,000 | | | | 6,000,000 | |
Pasadena CA PFA CAB Rose Bowl Series A (Miscellaneous Revenue) ¤ | | | 0.00 | | | | 3-1-2027 | | | | 2,095,000 | | | | 1,342,246 | |
Pasadena CA PFA CAB Rose Bowl Series A (Miscellaneous Revenue) ¤ | | | 0.00 | | | | 3-1-2028 | | | | 4,450,000 | | | | 2,689,936 | |
Pasadena CA PFA CAB Rose Bowl Series A (Miscellaneous Revenue) ¤ | | | 0.00 | | | | 3-1-2029 | | | | 4,520,000 | | | | 2,607,904 | |
Pasadena CA PFA CAB Rose Bowl Series A (Miscellaneous Revenue) ¤ | | | 0.00 | | | | 3-1-2030 | | | | 6,725,000 | | | | 3,585,568 | |
Pasadena CA PFA CAB Rose Bowl Series A (Miscellaneous Revenue) ¤ | | | 0.00 | | | | 3-1-2031 | | | | 2,185,000 | | | | 1,108,844 | |
Pasadena CA PFA CAB Rose Bowl Series A (Miscellaneous Revenue) ¤ | | | 0.00 | | | | 3-1-2032 | | | | 2,000,000 | | | | 960,260 | |
Pasadena CA PFA CAB Rose Bowl Series A (Miscellaneous Revenue) ¤ | | | 0.00 | | | | 3-1-2033 | | | | 4,295,000 | | | | 1,966,595 | |
Porterville CA Unified School Facilities Improvement District CAB Election of 2002 Series A (GO, National Insured) ¤ | | | 0.00 | | | | 8-1-2025 | | | | 1,445,000 | | | | 960,983 | |
Richmond CA Joint Powers Financing Authority Civic Center Project Series A (Miscellaneous Revenue, AGM Insured) | | | 5.88 | | | | 8-1-2037 | | | | 25,000 | | | | 28,682 | |
Richmond CA Joint Powers Financing Authority Point Potrero Series A (Miscellaneous Revenue) | | | 6.25 | | | | 7-1-2024 | | | | 5,420,000 | | | | 6,457,334 | |
San Bernardino CA Unified School District Election of 2012 Series A (GO, AGM Insured) | | | 5.00 | | | | 8-1-2031 | | | | 1,100,000 | | | | 1,254,638 | |
San Bernardino CA Unified School District Series A (GO, AGM Insured) | | | 5.00 | | | | 8-1-2026 | | | | 1,100,000 | | | | 1,289,970 | |
San Bernardino CA Unified School District Series A (GO, AGM Insured) | | | 5.00 | | | | 8-1-2028 | | | | 1,250,000 | | | | 1,445,088 | |
San Buenaventura CA Community Mental Health System (Health Revenue) | | | 6.00 | | | | 12-1-2019 | | | | 1,040,000 | | | | 1,226,805 | |
San Buenaventura CA Community Mental Health System (Health Revenue) | | | 6.25 | | | | 12-1-2020 | | | | 2,000,000 | | | | 2,425,260 | |
San Diego CA Unified School District CAB Series C (GO) ¤ | | | 0.00 | | | | 7-1-2031 | | | | 2,000,000 | | | | 1,055,720 | |
San Diego CA Unified School District CAB Series C (GO) ¤ | | | 0.00 | | | | 7-1-2032 | | | | 1,500,000 | | | | 751,335 | |
San Diego CA Unified School District CAB Series C (GO) ¤ | | | 0.00 | | | | 7-1-2033 | | | | 1,000,000 | | | | 480,610 | |
San Diego CA Unified School District CAB Series C (GO) ¤ | | | 0.00 | | | | 7-1-2034 | | | | 2,000,000 | | | | 908,140 | |
San Diego CA Unified School District CAB Series C (GO) ¤ | | | 0.00 | | | | 7-1-2035 | | | | 1,500,000 | | | | 650,145 | |
San Mateo County CA Community College District Capital Appreciation Election 2001 Series B (GO, National Insured, Deutsche Bank LIQ) 144Aø | | | 0.15 | | | | 6-1-2031 | | | | 11,396,000 | | | | 11,396,000 | |
Santa Ana CA Financing Authority Prerefunded Police Administration and Holding Facility Series A (Miscellaneous Revenue, National Insured) | | | 6.25 | | | | 7-1-2015 | | | | 150,000 | | | | 154,533 | |
Santa Ana CA Financing Authority Unrefunded Police Administration and Holding Facility Series A (Miscellaneous Revenue, National Insured) | | | 6.25 | | | | 7-1-2015 | | | | 150,000 | | | | 154,256 | |
Santa Ana CA Unified School District CAB Election of 1999 Series B (GO, National Insured) ¤ | | | 0.00 | | | | 8-1-2026 | | | | 2,515,000 | | | | 1,688,873 | |
Sylvan CA Unified School District CAB (GO, AGM Insured) ¤ | | | 0.00 | | | | 8-1-2037 | | | | 1,085,000 | | | | 398,922 | |
Tahoe-Truckee CA Unified School District CAB (GO, National Insured) ¤ | | | 0.00 | | | | 8-1-2024 | | | | 2,965,000 | | | | 2,213,521 | |
Upland CA Unified School District CAB Election of 2008 Series C (GO) ¤ | | | 0.00 | | | | 8-1-2032 | | | | 3,000,000 | | | | 1,444,500 | |
| | | | |
| 4 | | Wells Fargo Advantage Municipal Bond Fund | | Portfolio of investments—December 31, 2014 (unaudited) |
| | | | | | | | | | | | | | | | |
| Security name | | Interest rate | | | Maturity date | | | Principal | | | Value | |
| | | | |
| California (continued) | | | | | | | | | | | | | | | | |
West Contra Costa CA Unified School District CAB Series C (GO, AGM Insured) ¤ | | | 0.00 | % | | | 8-1-2029 | | | $ | 3,000,000 | | | $ | 1,717,830 | |
West Contra Costa CA Unified School District Election of 2005 Series C-1 (GO, AGM Insured) ¤ | | | 0.00 | | | | 8-1-2029 | | | | 1,690,000 | | | | 969,097 | |
Wiseburn CA School District CAB Election of 2010 Series B (GO, AGM Insured) ¤ | | | 0.00 | | | | 8-1-2034 | | | | 2,000,000 | | | | 881,100 | |
| | | | |
| | | | | | | | | | | | | | | 331,282,708 | |
| | | | | | | | | | | | | | | | |
| | | | |
| Colorado: 2.36% | | | | | | | | | | | | | | | | |
Colorado E-470 Public Highway Authority CAB Series A (Miscellaneous Revenue, National Insured) ¤ | | | 0.00 | | | | 9-1-2027 | | | | 9,500,000 | | | | 6,198,085 | |
Colorado E-470 Public Highway Authority CAB Series B (Transportation Revenue, National Insured) ¤ | | | 0.00 | | | | 9-1-2020 | | | | 9,385,000 | | | | 8,272,033 | |
Colorado E-470 Public Highway Authority CAB Series B (Transportation Revenue, National Insured) ¤ | | | 0.00 | | | | 9-1-2022 | | | | 4,600,000 | | | | 3,822,416 | |
Colorado ECFA Charter School American Academy Project (Education Revenue) | | | 7.13 | | | | 12-1-2033 | | | | 2,200,000 | | | | 2,502,610 | |
Colorado ECFA Charter School Banning Lewis Ranch Academy Project (Education Revenue) 144A | | | 6.13 | | | | 12-15-2035 | | | | 4,040,000 | | | | 4,098,014 | |
Colorado ECFA Charter School Community Leadership (Education Revenue) | | | 5.75 | | | | 7-1-2019 | | | | 875,000 | | | | 920,754 | |
Colorado ECFA Charter School Monument Academy Project Series A (Education Revenue) | | | 5.50 | | | | 10-1-2017 | | | | 185,000 | | | | 199,104 | |
Colorado ECFA Charter School Monument Academy Project Series A (Education Revenue) | | | 7.25 | | | | 10-1-2039 | | | | 500,000 | | | | 608,625 | |
Colorado ECFA Community Leadership Academy Incorporated Second Campus Project (Education Revenue) | | | 7.00 | | | | 8-1-2033 | | | | 1,330,000 | | | | 1,539,874 | |
Colorado ECFA Rocky Mountain Classical Academy Project Series A (Education Revenue) | | | 7.50 | | | | 9-1-2033 | | | | 5,015,000 | | | | 5,110,034 | |
Colorado ECFA Rocky Mountain Classical Academy Project Series A (Education Revenue) | | | 8.00 | | | | 9-1-2043 | | | | 5,930,000 | | | | 6,088,924 | |
Colorado ECFA Rocky Mountain Classical Academy Project Series A (Education Revenue) | | | 8.13 | | | | 9-1-2048 | | | | 3,795,000 | | | | 3,902,209 | |
Colorado ECFA Twin Peaks Charter Academy (Miscellaneous Revenue) | | | 6.50 | | | | 3-15-2043 | | | | 1,290,000 | | | | 1,460,164 | |
Colorado ECFA Union Colony Charter School Project (Education Revenue) 144A | | | 5.75 | | | | 12-1-2037 | | | | 3,960,000 | | | | 3,968,197 | |
Colorado Health Facilities Authority Catholic Health Initiatives Series D1 (Health Revenue) | | | 6.25 | | | | 10-1-2033 | | | | 4,000,000 | | | | 4,659,960 | |
Colorado High Performance Transportation Enterprise U.S. 36 and I-25 Managed Lanes (Transportation Revenue) | | | 5.75 | | | | 1-1-2044 | | | | 2,160,000 | | | | 2,326,190 | |
Colorado PFA Charter School Highline Academy Project (Education Revenue) | | | 6.25 | | | | 12-15-2020 | | | | 390,000 | | | | 420,447 | |
Colorado PFA Charter School Highline Academy Project (Education Revenue) | | | 6.75 | | | | 12-15-2025 | | | | 455,000 | | | | 494,221 | |
Colorado PFA Charter School Highline Academy Project (Education Revenue) | | | 7.38 | | | | 12-15-2040 | | | | 4,010,000 | | | | 4,444,083 | |
Eagle County CO Airport Terminal Corporation Airport Terminal Improvement Project Series A (Airport Revenue) | | | 5.15 | | | | 5-1-2017 | | | | 915,000 | | | | 942,304 | |
Eagle County CO Airport Terminal Corporation Airport Terminal Improvement Project Series B (Airport Revenue) | | | 5.05 | | | | 5-1-2015 | | | | 110,000 | | | | 110,784 | |
Eagle County CO Airport Terminal Corporation Airport Terminal Improvement Project Series B (Airport Revenue) | | | 5.25 | | | | 5-1-2020 | | | | 965,000 | | | | 993,989 | |
Public Authority for Colorado Energy Natural Gas Purchase (Utilities Revenue, Merrill Lynch & Company Guaranty Agreement) | | | 6.50 | | | | 11-15-2038 | | | | 4,500,000 | | | | 6,151,140 | |
Regional Transportation District of Colorado Certificate of Participation Series A (Miscellaneous Revenue) | | | 5.00 | | | | 6-1-2023 | | | | 5,500,000 | | | | 6,566,560 | |
| | | | |
| | | | | | | | | | | | | | | 75,800,721 | |
| | | | | | | | | | | | | | | | |
| | | | | | |
| Portfolio of investments—December 31, 2014 (unaudited) | | Wells Fargo Advantage Municipal Bond Fund | | | 5 | |
| | | | | | | | | | | | | | | | |
| Security name | | Interest rate | | | Maturity date | | | Principal | | | Value | |
| | | | |
| Connecticut: 0.43% | | | | | | | | | | | | | | | | |
Connecticut HEFA Eastern Connecticut Health Network Series A (Health Revenue, Radian Insured) | | | 6.38 | % | | | 7-1-2016 | | | $ | 480,000 | | | $ | 481,512 | |
Connecticut HFA Special Needs Housing Series 2 (Health Revenue, Ambac Insured) | | | 5.25 | | | | 6-15-2022 | | | | 1,675,000 | | | | 1,681,449 | |
Connecticut Series A (Miscellaneous Revenue) ± | | | 1.14 | | | | 4-15-2019 | | | | 4,050,000 | | | | 4,136,063 | |
Connecticut Series A (GO) ± | | | 1.29 | | | | 4-15-2020 | | | | 5,900,000 | | | | 6,046,674 | |
Hamden CT BAN (GO) | | | 5.00 | | | | 8-15-2026 | | | | 1,235,000 | | | | 1,381,385 | |
| | | | |
| | | | | | | | | | | | | | | 13,727,083 | |
| | | | | | | | | | | | | | | | |
| | | | |
| Delaware: 0.08% | | | | | | | | | | | | | | | | |
Kent County DE Charter School Incorporated Project (Education Revenue) | | | 7.38 | | | | 5-1-2037 | | | | 2,110,000 | | | | 2,434,624 | |
| | | | | | | | | | | | | | | | |
| | | | |
| District of Columbia: 1.08% | | | | | | | | | | | | | | | | |
District of Columbia Cesar Chavez Public Charter School (Education Revenue) | | | 6.50 | | | | 11-15-2021 | | | | 4,665,000 | | | | 5,215,377 | |
District of Columbia Children’s Research Center (Miscellaneous Revenue, SunTrust Bank LOC) ø | | | 0.22 | | | | 4-1-2038 | | | | 5,835,000 | | | | 5,835,000 | |
District of Columbia Population Services International (Miscellaneous Revenue, SunTrust Bank LOC) ø | | | 0.22 | | | | 11-1-2042 | | | | 21,300,000 | | | | 21,300,000 | |
District of Columbia Water & Sewer Authority Public Utilities Series A (Water & Sewer Revenue) | | | 6.00 | | | | 10-1-2035 | | | | 2,000,000 | | | | 2,367,500 | |
| | | | |
| | | | | | | | | | | | | | | 34,717,877 | |
| | | | | | | | | | | | | | | | |
| | | | |
| Florida: 4.30% | | | | | | | | | | | | | | | | |
Championsgate FL Community Development District Capital Improvement Series A (Miscellaneous Revenue) | | | 6.25 | | | | 5-1-2020 | | | | 1,515,000 | | | | 1,500,002 | |
CityPlace Florida Community Development District (Miscellaneous Revenue) | | | 5.00 | | | | 5-1-2022 | | | | 1,000,000 | | | | 1,123,060 | |
CityPlace Florida Community Development District (Miscellaneous Revenue) | | | 5.00 | | | | 5-1-2026 | | | | 2,000,000 | | | | 2,270,560 | |
Collier County FL School Board Refunding Certificate of Participation (Miscellaneous Revenue, AGM Insured) | | | 5.25 | | | | 2-15-2021 | | | | 1,000,000 | | | | 1,189,080 | |
Crossings At Fleming Island FL Community Development District Refunding Senior Lien Series A-1 (Miscellaneous Revenue) | | | 2.25 | | | | 5-1-2018 | | | | 1,260,000 | | | | 1,264,019 | |
Crossings At Fleming Island FL Community Development District Refunding Senior Lien Series A-1 (Miscellaneous Revenue) | | | 2.63 | | | | 5-1-2019 | | | | 1,295,000 | | | | 1,296,826 | |
Crossings At Fleming Island FL Community Development District Refunding Senior Lien Series A-1 (Miscellaneous Revenue) | | | 4.00 | | | | 5-1-2024 | | | | 1,025,000 | | | | 1,032,114 | |
Daytona Beach FL Refunding & Improvement Project (Water & Sewer Revenue, AGM Insured) | | | 5.00 | | | | 11-1-2031 | | | | 1,155,000 | | | | 1,330,814 | |
Daytona Beach FL Refunding & Improvement Project (Water & Sewer Revenue, AGM Insured) | | | 5.00 | | | | 11-1-2032 | | | | 1,465,000 | | | | 1,682,465 | |
Deutsche Bank SPEARs/LIFERs Trust Series DBE 1132 (Transportation Revenue, Deutsche Bank LIQ) 144Aø | | | 0.20 | | | | 7-1-2031 | | | | 14,760,000 | | | | 14,760,000 | |
Florida Development Finance Corporation Educational Facilities Revenue Renaissance Charter School Project Series A (Education Revenue) | | | 5.50 | | | | 6-15-2022 | | | | 1,240,000 | | | | 1,283,623 | |
Florida Development Finance Corporation Educational Facilities Revenue Renaissance Charter School Project Series A (Education Revenue) | | | 8.50 | | | | 6-15-2044 | | | | 13,290,000 | | | | 15,118,040 | |
Florida Housing Finance Corporation Journet Place Apartments Series 1 (Housing Revenue) | | | 7.60 | | | | 12-15-2047 | | | | 815,000 | | | | 1,017,691 | |
Florida Housing Finance Corporation Villa Capri Phase III (Housing Revenue) | | | 7.60 | | | | 12-15-2042 | | | | 2,765,000 | | | | 3,049,325 | |
Gulf Breeze FL Miami Beach Local Government Series B (Miscellaneous Revenue, FGIC Insured) ± | | | 4.75 | | | | 12-1-2015 | | | | 40,000 | | | | 40,114 | |
Heritage Harbor FL Community Development District (Miscellaneous Revenue) | | | 7.75 | | | | 5-1-2023 | | | | 470,000 | | | | 469,934 | |
Holmes County FL Hospital Corporation Doctors Memorial Hospital Project (Health Revenue) | | | 6.00 | | | | 11-1-2038 | | | | 2,500,000 | | | | 2,515,675 | |
| | | | |
| 6 | | Wells Fargo Advantage Municipal Bond Fund | | Portfolio of investments—December 31, 2014 (unaudited) |
| | | | | | | | | | | | | | | | |
| Security name | | Interest rate | | | Maturity date | | | Principal | | | Value | |
| | | | |
| Florida (continued) | | | | | | | | | | | | | | | | |
Indigo FL Community Development District Series C (Miscellaneous Revenue) (s)(i) | | | 1.40 | % | | | 5-1-2030 | | | $ | 2,561,001 | | | $ | 1,288,030 | |
Lakeland FL Educational Facilities Authority Florida Southern College Project Series A (Education Revenue) | | | 5.00 | | | | 9-1-2025 | | | | 530,000 | | | | 584,277 | |
Lakeland FL Educational Facilities Authority Florida Southern College Project Series A (Education Revenue) | | | 5.00 | | | | 9-1-2028 | | | | 1,195,000 | | | | 1,303,649 | |
Lakeside Plantation FL Community Development District Series A (Miscellaneous Revenue) | | | 6.95 | | | | 5-1-2031 | | | | 1,266,000 | | | | 1,266,836 | |
Marshall Creek FL Community Development District (Miscellaneous Revenue) | | | 6.63 | | | | 5-1-2032 | | | | 2,465,000 | | | | 2,192,544 | |
Marshall Creek FL Community Development District Series A (Miscellaneous Revenue) | | | 7.65 | | | | 5-1-2032 | | | | 1,640,000 | | | | 1,641,542 | |
Miami FL HFA Jewish Home & Hospital Project (Health Revenue, SunTrust Bank LOC) ø | | | 0.22 | | | | 8-1-2026 | | | | 12,060,000 | | | | 12,060,000 | |
Miami-Dade County FL Educational Facilities University of Miami Series A (Education Revenue) | | | 5.75 | | | | 4-1-2028 | | | | 1,200,000 | | | | 1,264,356 | |
Miami-Dade County FL Seaport Revenue Bond Series B (Airport Revenue) | | | 6.00 | | | | 10-1-2033 | | | | 500,000 | | | | 604,805 | |
Orlando FL Capital Improvement Special Revenue Series B (Miscellaneous Revenue) | | | 5.00 | | | | 10-1-2033 | | | | 1,525,000 | | | | 1,781,109 | |
Orlando FL Capital Improvement Special Revenue Series B (Miscellaneous Revenue) | | | 5.00 | | | | 10-1-2034 | | | | 1,600,000 | | | | 1,856,960 | |
Orlando FL Capital Improvement Special Revenue Series B (Miscellaneous Revenue) | | | 5.00 | | | | 10-1-2035 | | | | 1,680,000 | | | | 1,945,205 | |
Orlando FL Capital Improvement Special Revenue Series B (Miscellaneous Revenue) | | | 5.00 | | | | 10-1-2036 | | | | 1,765,000 | | | | 2,040,411 | |
Orlando FL Capital Improvement Special Revenue Series B (Miscellaneous Revenue) | | | 5.00 | | | | 10-1-2041 | | | | 10,240,000 | | | | 11,689,882 | |
Palm Beach County FL PFOTER Series 4615 (Miscellaneous Revenue, Dexia Credit Local LIQ) ø | | | 0.31 | | | | 8-1-2029 | | | | 20,245,000 | | | | 20,245,000 | |
Palm Beach County FL Public Improvement Series 2 (Miscellaneous Revenue) | | | 5.38 | | | | 11-1-2028 | | | | 2,000,000 | | | | 2,286,660 | |
Saint Petersburg FL Health Facilities Authority All Children’s Project Series A (Health Revenue) | | | 6.50 | | | | 11-15-2039 | | | | 5,500,000 | | | | 6,525,310 | |
Seminole County FL IDA Choices in Learning Series A (Education Revenue) | | | 6.20 | | | | 11-15-2026 | | | | 2,060,000 | | | | 2,233,308 | |
Seminole County FL IDA Choices in Learning Series A (Education Revenue) | | | 7.38 | | | | 11-15-2041 | | | | 3,525,000 | | | | 4,059,320 | |
South Miami FL Health Facilities Baptist Health (Health Revenue) | | | 5.00 | | | | 8-15-2023 | | | | 2,810,000 | | | | 3,102,549 | |
St. Johns County FL IDA Refunding Glenmoor Project Series A (Health Revenue) ± | | | 1.34 | | | | 1-1-2049 | | | | 750,000 | | | | 275,760 | |
St. Johns County FL IDA Refunding Subordinated Glenmoor Project Series B (Health Revenue) | | | 2.50 | | | | 1-1-2049 | | | | 277,527 | | | | 3 | |
Viera East FL Community Development District Water Management Project (Water & Sewer Revenue, National Insured) | | | 5.75 | | | | 5-1-2020 | | | | 2,020,000 | | | | 2,189,862 | |
Viera East FL Community Development District Water Management Project (Water & Sewer Revenue, National Insured) | | | 5.75 | | | | 5-1-2021 | | | | 2,140,000 | | | | 2,341,310 | |
Viera East FL Community Development District Water Management Project (Water & Sewer Revenue, National Insured) | | | 5.75 | | | | 5-1-2022 | | | | 2,265,000 | | | | 2,481,466 | |
| | | | |
| | | | | | | | | | | | | | | 138,203,496 | |
| | | | | | | | | | | | | | | | |
| | | | |
| Georgia: 0.76% | | | | | | | | | | | | | | | | |
Cobb County GA Development Authority Charter Learning Center Foundation Central Project Series A (Education Revenue) | | | 6.38 | | | | 7-1-2025 | | | | 2,370,000 | | | | 2,259,463 | |
Forsyth County GA Hospital Authority Georgia Baptist Health Care System Project (Health Revenue) | | | 6.38 | | | | 10-1-2028 | | | | 465,000 | | | | 604,505 | |
Georgia Municipal Association Certificate of Participation City Court Atlanta Project (Miscellaneous Revenue, Ambac Insured) | | | 5.50 | | | | 12-1-2016 | | | | 2,175,000 | | | | 2,182,460 | |
Georgia Municipal Association Certificate of Participation City Court Atlanta Project (Miscellaneous Revenue, Ambac Insured) | | | 5.50 | | | | 12-1-2017 | | | | 2,220,000 | | | | 2,226,838 | |
Georgia Municipal Association Certificate of Participation City Court Atlanta Project (Miscellaneous Revenue, Ambac Insured) | | | 5.50 | | | | 12-1-2018 | | | | 2,500,000 | | | | 2,507,025 | |
Georgia Municipal Electric Authority Power Series EE (Utilities Revenue, Ambac Insured) | | | 7.25 | | | | 1-1-2024 | | | | 400,000 | | | | 551,504 | |
| | | | | | |
| Portfolio of investments—December 31, 2014 (unaudited) | | Wells Fargo Advantage Municipal Bond Fund | | | 7 | |
| | | | | | | | | | | | | | | | |
| Security name | | Interest rate | | | Maturity date | | | Principal | | | Value | |
| | | | |
| Georgia (continued) | | | | | | | | | | | | | | | | |
Georgia Municipal Electric Authority Prerefunded Balance Class A (Utilities Revenue, National Insured, Societe Generale LIQ) 144Aø | | | 0.06 | % | | | 1-1-2018 | | | $ | 1,795,000 | | | $ | 1,795,000 | |
Georgia Private Colleges & Universities Authority Series A (Education Revenue) | | | 5.25 | | | | 10-1-2027 | | | | 2,000,000 | | | | 2,235,440 | |
Georgia Road & Tollway Authority Convertible CAB I-75 South Expressway Lanes Project Series B (Transportation Revenue) 144A¤ | | | 0.00 | | | | 6-1-2049 | | | | 5,600,000 | | | | 2,945,096 | |
Georgia Road & Tollway Authority Toll Revenue CAB I-75 South Expressway Lanes Project Series A (Transportation Revenue) 144A¤ | | | 0.00 | | | | 6-1-2034 | | | | 3,750,000 | | | | 1,078,988 | |
Main Street Natural Gas Incorporated Georgia Gas Project Series A (Utilities Revenue) | | | 5.50 | | | | 9-15-2027 | | | | 5,060,000 | | | | 6,172,087 | |
| | | | |
| | | | | | | | | | | | | | | 24,558,406 | |
| | | | | | | | | | | | | | | | |
| | | | |
| Guam: 0.13% | | | | | | | | | | | | | | | | |
Guam Government Limited Obligation Section 30 Series A (Miscellaneous Revenue) | | | 5.38 | | | | 12-1-2024 | | | | 3,195,000 | | | | 3,528,750 | |
Guam Government Waterworks Authority Water & Wastewater System Project (Water & Sewer Revenue) | | | 5.00 | | | | 7-1-2019 | | | | 450,000 | | | | 501,251 | |
Guam Housing Corporation Guaranteed Mortgage-Backed Securities Series A (Housing Revenue, FHLMC Insured) | | | 5.75 | | | | 9-1-2031 | | | | 60,000 | | | | 65,654 | |
| | | | |
| | | | | | | | | | | | | | | 4,095,655 | |
| | | | | | | | | | | | | | | | |
| | | | |
| Hawaii: 0.10% | | | | | | | | | | | | | | | | |
Hawaii Series DZ (GO) | | | 5.00 | | | | 12-1-2031 | | | | 2,700,000 | | | | 3,160,701 | |
| | | | | | | | | | | | | | | | |
| | | | |
| Idaho: 0.59% | | | | | | | | | | | | | | | | |
Boise-Kuna ID Irrigation District Arrowrock Hydroelectric Project (Utilities Revenue) | | | 7.38 | | | | 6-1-2040 | | | | 6,300,000 | | | | 7,343,217 | |
Idaho Health Facilities Authority Trinity Health Credit Group Series B (Health Revenue) | | | 6.25 | | | | 12-1-2033 | | | | 3,000,000 | | | | 3,478,350 | |
Idaho Housing & Finance Association Idaho Arts Charter School Incorporated Project Series A (Education Revenue) | | | 5.75 | | | | 12-1-2032 | | | | 500,000 | | | | 534,010 | |
Idaho Housing & Finance Association Idaho Arts Charter School Incorporated Project Series A (Education Revenue) | | | 6.50 | | | | 12-1-2038 | | | | 1,405,000 | | | | 1,486,729 | |
Idaho Housing & Finance Association Legacy Public Charter School Incorporated Project Series A (Education Revenue) | | | 5.85 | | | | 5-1-2033 | | | | 730,000 | | | | 744,585 | |
Idaho Housing & Finance Association Legacy Public Charter School Incorporated Project Series A (Education Revenue) | | | 6.25 | | | | 5-1-2043 | | | | 1,365,000 | | | | 1,389,666 | |
Idaho Housing & Finance Association Liberty Charter School Series A (Education Revenue) | | | 6.00 | | | | 6-1-2038 | | | | 500,000 | | | | 524,290 | |
Idaho Housing & Finance Association Nonprofit Facilities Revenue CAB North Star Charter School Series A (Education Revenue) | | | 6.75 | | | | 7-1-2048 | | | | 1,322,876 | | | | 1,307,293 | |
Idaho Housing & Finance Association Nonprofit Facilities Revenue CAB North Star Charter School Series B (Education Revenue) 144A¤ | | | 0.00 | | | | 7-1-2049 | | | | 1,276,564 | | | | 104,691 | |
Idaho Housing & Finance Association Series A (Education Revenue) | | | 6.13 | | | | 7-1-2038 | | | | 1,500,000 | | | | 1,580,610 | |
Idaho Housing & Finance Association Series H2 (Housing Revenue, FHA/VA Insured) | | | 6.15 | | | | 1-1-2028 | | | | 15,000 | | | | 15,000 | |
Idaho Housing & Finance Association SFHR Series D (Housing Revenue) | | | 6.30 | | | | 7-1-2025 | | | | 295,000 | | | | 295,723 | |
| | | | |
| | | | | | | | | | | | | | | 18,804,164 | |
| | | | | | | | | | | | | | | | |
| | | | |
| Illinois: 19.35% | | | | | | | | | | | | | | | | |
Chicago IL Board of Education CAB City Colleges (GO, National Insured) ¤ | | | 0.00 | | | | 1-1-2025 | | | | 9,935,000 | | | | 6,581,938 | |
Chicago IL Board of Education CAB School Reform Series A (GO, National Insured) ¤ | | | 0.00 | | | | 12-1-2023 | | | | 7,955,000 | | | | 5,552,033 | |
Chicago IL Board of Education CAB School Reform Series A (GO, National Insured) ¤ | | | 0.00 | | | | 12-1-2029 | | | | 5,800,000 | | | | 2,866,882 | |
Chicago IL Board of Education CAB School Reform Series A (GO, National Insured) ¤ | | | 0.00 | | | | 12-1-2020 | | | | 1,000,000 | | | | 810,620 | |
Chicago IL Board of Education CAB School Reform Series A (GO, National Insured) ¤ | | | 0.00 | | | | 12-1-2031 | | | | 2,705,000 | | | | 1,186,765 | |
Chicago IL Board of Education CAB School Reform Series B-1 (GO, National Insured) ¤ | | | 0.00 | | | | 12-1-2030 | | | | 29,000,000 | | | | 13,504,140 | |
Chicago IL Board of Education CAB School Reform Series B-1 (GO, National Insured) ¤ | | | 0.00 | | | | 12-1-2026 | | | | 4,000,000 | | | | 2,387,760 | |
| | | | |
| 8 | | Wells Fargo Advantage Municipal Bond Fund | | Portfolio of investments—December 31, 2014 (unaudited) |
| | | | | | | | | | | | | | | | |
| Security name | | Interest rate | | | Maturity date | | | Principal | | | Value | |
| | | | |
| Illinois (continued) | | | | | | | | | | | | | | | | |
Chicago IL Board of Education CAB School Reform Series B-1 (GO, National Insured) ¤ | | | 0.00 | % | | | 12-1-2027 | | | $ | 40,750,000 | | | $ | 22,627,660 | |
Chicago IL Board of Education CAB School Reform Series B-1 (GO, National Insured) ¤ | | | 0.00 | | | | 12-1-2028 | | | | 22,390,000 | | | | 11,793,261 | |
Chicago IL Board of Education CAB School Reform Series B-1 (GO, AGM/FGIC Insured) ¤ | | | 0.00 | | | | 12-1-2029 | | | | 14,205,000 | | | | 7,282,051 | |
Chicago IL Board of Education CAB School Reform Series B-1 (GO, National Insured) ¤ | | | 0.00 | | | | 12-1-2029 | | | | 6,250,000 | | | | 3,089,313 | |
Chicago IL Board of Education CAB School Reform Series B-1 (GO, National Insured) ¤ | | | 0.00 | | | | 12-1-2031 | | | | 11,750,000 | | | | 5,155,078 | |
Chicago IL Board of Education Series 2012-001 (GO, Dexia Credit Local LIQ) 144A± | | | 0.56 | | | | 12-1-2034 | | | | 15,000,000 | | | | 15,000,000 | |
Chicago IL Board of Education Series A (GO, National Insured) ¤ | | | 0.00 | | | | 12-1-2027 | | | | 4,000,000 | | | | 2,221,120 | |
Chicago IL Board of Education Series B (GO, Ambac Insured) | | | 5.00 | | | | 12-1-2023 | | | | 1,000,000 | | | | 1,050,290 | |
Chicago IL Board of Education Series D (GO, AGM Insured) | | | 5.00 | | | | 12-1-2025 | | | | 1,430,000 | | | | 1,544,171 | |
Chicago IL CAB City Colleges (GO, National Insured) ¤ | | | 0.00 | | | | 1-1-2029 | | | | 25,755,000 | | | | 13,293,958 | |
Chicago IL CAB City Colleges (GO, National Insured) ¤ | | | 0.00 | | | | 1-1-2030 | | | | 5,745,000 | | | | 2,795,574 | |
Chicago IL CAB City Colleges (GO, National Insured) ¤ | | | 0.00 | | | | 1-1-2034 | | | | 11,600,000 | | | | 4,572,720 | |
Chicago IL CAB Project & Refunding Series A (GO, National Insured) ± | | | 5.56 | | | | 1-1-2021 | | | | 3,520,000 | | | | 3,691,283 | |
Chicago IL CAB Project & Refunding Series C (GO, AGM Insured) ¤ | | | 0.00 | | | | 1-1-2026 | | | | 7,360,000 | | | | 4,801,958 | |
Chicago IL CAB Series A (GO, National Insured) ¤ | | | 0.00 | | | | 1-1-2027 | | | | 3,955,000 | | | | 2,345,987 | |
Chicago IL CAB Series A (GO, National Insured) ¤ | | | 0.00 | | | | 1-1-2028 | | | | 5,515,000 | | | | 3,096,342 | |
Chicago IL CAB Series A (GO, National Insured) ¤ | | | 0.00 | | | | 1-1-2029 | | | | 4,080,000 | | | | 2,105,974 | |
Chicago IL CAB Series C (GO) ¤ | | | 0.00 | | | | 1-1-2031 | | | | 4,945,000 | | | | 2,088,570 | |
Chicago IL O’Hare International Airport (Airport Revenue, AGM Insured) | | | 5.50 | | | | 1-1-2043 | | | | 4,530,000 | | | | 5,188,028 | |
Chicago IL O’Hare International Airport (Airport Revenue) | | | 5.75 | | | | 1-1-2038 | | | | 7,500,000 | | | | 8,489,700 | |
Chicago IL O’Hare International Airport AMT Passenger Facility Charge Series B (Airport Revenue) | | | 5.00 | | | | 1-1-2026 | | | | 5,000,000 | | | | 5,637,250 | |
Chicago IL O’Hare International Airport AMT Senior Lien Series A (Airport Revenue) | | | 5.00 | | | | 1-1-2025 | | | | 2,000,000 | | | | 2,268,420 | |
Chicago IL O’Hare International Airport AMT Senior Lien Series C (Airport Revenue) | | | 5.50 | | | | 1-1-2044 | | | | 4,000,000 | | | | 4,465,320 | |
Chicago IL O’Hare International Airport Customer Facility Charge Senior Lien Series D (Airport Revenue) | | | 5.75 | | | | 1-1-2043 | | | | 4,500,000 | | | | 5,047,695 | |
Chicago IL O’Hare International Airport Third Lien Series A (Airport Revenue) | | | 5.75 | | | | 1-1-2039 | | | | 2,760,000 | | | | 3,172,316 | |
Chicago IL O’Hare International Airport Third Lien Series B (Airport Revenue, National Insured) | | | 6.00 | | | | 1-1-2027 | | | | 1,200,000 | | | | 1,205,460 | |
Chicago IL Park District Limited Tax Series A (GO) | | | 5.75 | | | | 1-1-2038 | | | | 6,715,000 | | | | 7,878,508 | |
Chicago IL Second Lien (Water & Sewer Revenue) | | | 5.00 | | | | 11-1-2029 | | | | 4,500,000 | | | | 5,113,845 | |
Chicago IL Series A (GO, National Insured) | | | 5.00 | | | | 1-1-2029 | | | | 4,000,000 | | | | 4,161,280 | |
Chicago IL Series A (GO, AGM Insured) | | | 5.00 | | | | 1-1-2028 | | | | 9,550,000 | | | | 10,134,365 | |
Chicago IL Series C (GO) | | | 5.00 | | | | 1-1-2034 | | | | 24,015,000 | | | | 24,511,870 | |
Chicago IL Transit Authority Sales Tax Receipts Revenue Bonds (Tax Revenue, AGM Insured) | | | 5.00 | | | | 12-1-2044 | | | | 4,000,000 | | | | 4,545,640 | |
Chicago IL Waste Water Transmission Refunding Bond Second Lien Series B (Water & Sewer Revenue, National Insured) | | | 5.00 | | | | 1-1-2030 | | | | 2,500,000 | | | | 2,647,325 | |
Chicago IL Wastewater Transmission (Water & Sewer Revenue) | | | 5.00 | | | | 1-1-2027 | | | | 4,000,000 | | | | 4,512,520 | |
Chicago IL Water Revenue Second Lien (Water & Sewer Revenue) | | | 5.00 | | | | 11-1-2030 | | | | 5,000,000 | | | | 5,633,800 | |
Chicago IL Water Revenue Second Lien Series A (Water & Sewer Revenue, Ambac Insured) | | | 5.00 | | | | 11-1-2032 | | | | 15,500,000 | | | | 16,370,325 | |
Cook County IL Community College District #508 (GO) | | | 5.25 | | | | 12-1-2043 | | | | 4,000,000 | | | | 4,512,480 | |
Cook County IL Community College District #508 (GO) | | | 5.50 | | | | 12-1-2038 | | | | 6,000,000 | | | | 6,972,000 | |
Cook County IL Series C (GO, AGM Insured) | | | 5.00 | | | | 11-15-2024 | | | | 4,240,000 | | | | 4,879,053 | |
Cook County IL Series C (GO) | | | 5.00 | | | | 11-15-2025 | | | | 2,140,000 | | | | 2,447,539 | |
Cook County IL Series C (GO) | | | 5.00 | | | | 11-15-2027 | | | | 325,000 | | | | 369,168 | |
Cook County IL Series C (GO) | | | 5.00 | | | | 11-15-2028 | | | | 3,455,000 | | | | 3,907,743 | |
Cook County IL Series G (GO) | | | 5.00 | | | | 11-15-2028 | | | | 27,000,000 | | | | 30,303,990 | |
| | | | | | |
| Portfolio of investments—December 31, 2014 (unaudited) | | Wells Fargo Advantage Municipal Bond Fund | | | 9 | |
| | | | | | | | | | | | | | | | |
| Security name | | Interest rate | | | Maturity date | | | Principal | | | Value | |
| | | | |
| Illinois (continued) | | | | | | | | | | | | | | | | |
DeKalb-Kane-Lasalle Counties IL Kishwaukee Community College District #523 Series B (GO) ¤ | | | 0.00 | % | | | 2-1-2019 | | | $ | 725,000 | | | $ | 676,019 | |
DuPage County IL Community Unit School District #46 School Building (GO, Ambac Insured) ¤ | | | 0.00 | | | | 1-1-2023 | | | | 23,350,000 | | | | 18,663,655 | |
Illinois (GO, Ambac Insured) | | | 5.00 | | | | 4-1-2020 | | | | 5,905,000 | | | | 5,965,172 | |
Illinois (GO) | | | 5.00 | | | | 1-1-2022 | | | | 2,260,000 | | | | 2,336,840 | |
Illinois (Miscellaneous Revenue) | | | 5.00 | | | | 7-1-2022 | | | | 6,700,000 | | | | 7,527,182 | |
Illinois (GO) | | | 5.00 | | | | 1-1-2023 | | | | 1,145,000 | | | | 1,182,659 | |
Illinois (GO, Ambac Insured) | | | 5.00 | | | | 4-1-2024 | | | | 1,830,000 | | | | 1,846,690 | |
Illinois (Miscellaneous Revenue) | | | 5.00 | | | | 8-1-2024 | | | | 2,610,000 | | | | 2,883,946 | |
Illinois (Miscellaneous Revenue) | | | 5.00 | | | | 8-1-2025 | | | | 4,000,000 | | | | 4,401,160 | |
Illinois (GO, AGM Insured) | | | 5.00 | | | | 4-1-2026 | | | | 3,000,000 | | | | 3,367,350 | |
Illinois (GO, Ambac Insured) | | | 5.00 | | | | 4-1-2027 | | | | 7,585,000 | | | | 7,649,245 | |
Illinois (GO, Ambac Insured) | | | 5.00 | | | | 4-1-2028 | | | | 6,705,000 | | | | 6,758,171 | |
Illinois (GO) | | | 5.00 | | | | 4-1-2028 | | | | 3,685,000 | | | | 3,837,485 | |
Illinois (GO) | | | 5.50 | | | | 7-1-2025 | | | | 6,000,000 | | | | 6,885,240 | |
Illinois (GO) | | | 5.50 | | | | 1-1-2030 | | | | 2,900,000 | | | | 3,456,075 | |
Illinois (Miscellaneous Revenue) | | | 5.50 | | | | 7-1-2038 | | | | 4,000,000 | | | | 4,453,120 | |
Illinois Development Finance Authority Balance Community Rehabilitation Series A (Health Revenue) (s) | | | 7.88 | | | | 7-1-2020 | | | | 84,516 | | | | 44,457 | |
Illinois Finance Authority Advocate Healthcare Network Series D (Health Revenue) | | | 6.50 | | | | 11-1-2038 | | | | 5,415,000 | | | | 6,504,119 | |
Illinois Finance Authority Centegra Health System Project (Health Revenue) | | | 5.00 | | | | 9-1-2018 | | | | 1,325,000 | | | | 1,461,011 | |
Illinois Finance Authority Centegra Health System Project (Health Revenue) | | | 5.00 | | | | 9-1-2020 | | | | 1,465,000 | | | | 1,638,969 | |
Illinois Finance Authority Charter Schools Refunding Bond Series A (Education Revenue) | | | 6.88 | | | | 10-1-2031 | | | | 1,930,000 | | | | 2,204,716 | |
Illinois Finance Authority Charter Schools Series A (Education Revenue) | | | 6.25 | | | | 9-1-2039 | | | | 7,955,000 | | | | 9,011,504 | |
Illinois Finance Authority Charter Schools Series A (Education Revenue) | | | 7.13 | | | | 10-1-2041 | | | | 3,300,000 | | | | 3,795,000 | |
Illinois Finance Authority Medical District Commission Project A (Health Revenue, AGC Insured) | | | 4.13 | | | | 9-1-2018 | | | | 675,000 | | | | 682,702 | |
Illinois Finance Authority Northwestern Memorial Hospital Project Series A (Health Revenue) | | | 6.00 | | | | 8-15-2039 | | | | 5,000,000 | | | | 5,856,950 | |
Illinois Finance Authority Student Housing (Education Revenue) | | | 5.13 | | | | 10-1-2020 | | | | 4,710,000 | | | | 5,039,417 | |
Illinois Finance Authority Student Housing Illinois State University (Education Revenue) | | | 6.75 | | | | 4-1-2031 | | | | 8,000,000 | | | | 9,301,360 | |
Illinois Finance Authority University of Chicago Series B (Education Revenue) | | | 6.25 | | | | 7-1-2038 | | | | 3,115,000 | | | | 3,670,218 | |
Illinois Series 1 (GO, National Insured) | | | 6.00 | | | | 11-1-2026 | | | | 3,200,000 | | | | 3,797,856 | |
Illinois Series A (GO) | | | 5.00 | | | | 4-1-2021 | | | | 6,675,000 | | | | 7,509,575 | |
Illinois Series A (GO, AGM Insured) | | | 5.00 | | | | 4-1-2024 | | | | 3,000,000 | | | | 3,385,800 | |
Illinois Sports Facilities Authority (Tax Revenue, AGM Insured) | | | 5.00 | | | | 6-15-2028 | | | | 4,030,000 | | | | 4,554,585 | |
Illinois Sports Facilities Authority State Tax Supported CAB (Tax Revenue, Ambac Insured) ¤ | | | 0.00 | | | | 6-15-2021 | | | | 7,595,000 | | | | 6,114,810 | |
Illinois Sports Facilities Authority State Tax Supported CAB (Tax Revenue, Ambac Insured) ¤ | | | 0.00 | | | | 6-15-2025 | | | | 1,040,000 | | | | 671,434 | |
Illinois Sports Facilities Authority State Tax Supported Refunding Bonds (Tax Revenue, AGM Insured) | | | 5.00 | | | | 6-15-2025 | | | | 3,745,000 | | | | 4,290,647 | |
Illinois Sports Facilities Authority State Tax Supported Refunding Bonds (Tax Revenue, AGM Insured) | | | 5.00 | | | | 6-15-2026 | | | | 4,775,000 | | | | 5,436,099 | |
Illinois Sports Facilities Authority State Tax Supported Refunding Bonds (Tax Revenue, AGM Insured) | | | 5.00 | | | | 6-15-2027 | | | | 8,355,000 | | | | 9,487,353 | |
Illinois Sports Facilities Authority State Tax Supported Refunding Bonds (Tax Revenue, AGM Insured) | | | 5.25 | | | | 6-15-2032 | | | | 3,500,000 | | | | 4,004,560 | |
| | | | |
| 10 | | Wells Fargo Advantage Municipal Bond Fund | | Portfolio of investments—December 31, 2014 (unaudited) |
| | | | | | | | | | | | | | | | |
| Security name | | Interest rate | | | Maturity date | | | Principal | | | Value | |
| | | | |
| Illinois (continued) | | | | | | | | | | | | | | | | |
Illinois Toll Highway Authority Series B (Transportation Revenue, AGM Insured, Landesbank Hessen-Thüringen SPA) ø | | | 0.23 | % | | | 1-1-2016 | | | $ | 12,300,000 | | | $ | 12,300,000 | |
Illinois Toll Highway Authority Series B (Transportation Revenue) | | | 5.00 | | | | 1-1-2039 | | | | 1,500,000 | | | | 1,697,160 | |
Kane & DeKalb Counties IL Community Unit School District #302 School Building (GO, AGM Insured) | | | 5.50 | | | | 2-1-2025 | | | | 1,265,000 | | | | 1,331,615 | |
Kane & DeKalb Counties IL Community Unit School District #302 School Building (GO, AGM Insured) | | | 5.50 | | | | 2-1-2026 | | | | 3,610,000 | | | | 3,795,843 | |
Kendall Kane & Will Counties IL CAB School District #308 (GO, AGM Insured) ¤ | | | 0.00 | | | | 2-1-2025 | | | | 1,760,000 | | | | 1,242,666 | |
Kendall Kane & Will Counties IL CAB School District #308 (GO, AGM Insured) ¤ | | | 0.00 | | | | 2-1-2026 | | | | 5,050,000 | | | | 3,359,159 | |
Kendall Kane & Will Counties IL CAB School District #308 (GO, AGM Insured) ¤ | | | 0.00 | | | | 2-1-2027 | | | | 12,050,000 | | | | 7,544,023 | |
Lake County IL School District #24 Millburn CAB (GO, National Insured) ¤ | | | 0.00 | | | | 1-1-2024 | | | | 2,000,000 | | | | 1,448,120 | |
Lake County IL School District #38 Big Hollow CAB (GO, Ambac Insured) ¤ | | | 0.00 | | | | 2-1-2018 | | | | 3,800,000 | | | | 3,572,874 | |
Lake County IL School District #38 Big Hollow CAB (GO, Ambac Insured) ¤ | | | 0.00 | | | | 2-1-2019 | | | | 675,000 | | | | 615,553 | |
Lake County IL School District #38 Big Hollow CAB (GO, Ambac Insured) ¤ | | | 0.00 | | | | 2-1-2020 | | | | 1,250,000 | | | | 1,102,788 | |
Lake County IL School District #38 Big Hollow CAB (GO, Ambac Insured) ¤ | | | 0.00 | | | | 2-1-2021 | | | | 1,040,000 | | | | 890,531 | |
Lake County IL School District #38 Big Hollow CAB (GO, Ambac Insured) ¤ | | | 0.00 | | | | 2-1-2024 | | | | 5,385,000 | | | | 4,034,765 | |
Lake County IL Township High School District #126 Zion-Benton CAB (GO, National Insured) ¤ | | | 0.00 | | | | 2-1-2020 | | | | 910,000 | | | | 788,224 | |
McHenry & Kane Counties IL Community Consolidated School District #158 (GO) | | | 5.63 | | | | 1-15-2032 | | | | 2,500,000 | | | | 2,971,175 | |
McHenry & Kane Counties IL Community Consolidated School District #158 CAB (GO, AGM/FGIC Insured) ¤ | | | 0.00 | | | | 1-1-2023 | | | | 1,905,000 | | | | 1,488,243 | |
McHenry & Kane Counties IL Community Consolidated School District #158 CAB (GO, National Insured) ¤ | | | 0.00 | | | | 1-1-2021 | | | | 6,250,000 | | | | 5,255,313 | |
McHenry & Kane Counties IL Community Consolidated School District #158 Huntley CAB (GO, National Insured) ¤ | | | 0.00 | | | | 1-1-2019 | | | | 765,000 | | | | 724,340 | |
McHenry County IL Community Unit School District #12 (GO, Build America Mutual Assurance Company Insured) %% | | | 5.00 | | | | 1-1-2035 | | | | 4,785,000 | | | | 5,238,140 | |
McHenry County IL Community Unit School District #12 Johnsburg (GO, Build America Mutual Assurance Company Insured) %% | | | 5.00 | | | | 1-1-2033 | | | | 1,835,000 | | | | 2,021,601 | |
Metropolitan Pier & Exposition Authority Illinois (Tax Revenue, AGM/MBIA
Insured) ¤ | | | 0.00 | | | | 12-15-2029 | | | | 25,700,000 | | | | 13,985,940 | |
Metropolitan Pier & Exposition Authority Illinois CAB FSA (Tax Revenue, AGM/MBIA Insured) ¤ | | | 0.00 | | | | 6-15-2030 | | | | 9,740,000 | | | | 5,107,948 | |
Metropolitan Pier & Exposition Authority Illinois CAB McCormick Place Expansion Project Series A (Tax Revenue, National Insured) ¤ | | | 0.00 | | | | 12-15-2026 | | | | 10,000,000 | | | | 6,430,500 | |
Metropolitan Pier & Exposition Authority Illinois CAB McCormick Place Expansion Project Series A (Tax Revenue, National Insured) ¤ | | | 0.00 | | | | 12-15-2031 | | | | 18,560,000 | | | | 9,066,931 | |
Regional Transportation Authority Illinois (Tax Revenue, AGM Insured) | | | 5.75 | | | | 6-1-2023 | | | | 400,000 | | | | 499,524 | |
Sangamon County IL School District #186 Certificate of Participation Hay-Edwards Elementary School Project Series A (Miscellaneous Revenue, ACA Insured) | | | 5.88 | | | | 8-15-2018 | | | | 2,345,000 | | | | 2,249,019 | |
Southwestern Illinois Development Authority Local Government Program Collinsville Limited (Tax Revenue) | | | 5.00 | | | | 3-1-2025 | | | | 2,525,000 | | | | 2,101,810 | |
Springfield IL Senior Lien Notes (Utilities Revenue, National Insured) | | | 5.00 | | | | 3-1-2024 | | | | 1,425,000 | | | | 1,522,727 | |
Tazewell County IL School District #51 (GO, National Insured) | | | 9.00 | | | | 12-1-2023 | | | | 500,000 | | | | 737,900 | |
Town of Cicero IL Series A (GO, Syncora Guarantee Incorporated Insured) | | | 5.25 | | | | 1-1-2016 | | | | 2,000,000 | | | | 2,000,000 | |
University of Illinois Auxiliary Facilities Systems Series A (Education Revenue, National Insured) ¤ | | | 0.00 | | | | 4-1-2026 | | | | 2,355,000 | | | | 1,582,089 | |
University of Illinois Auxiliary Facilities Systems Series A (Education Revenue, National Insured) ¤ | | | 0.00 | | | | 4-1-2027 | | | | 2,435,000 | | | | 1,550,291 | |
University of Illinois Auxiliary Facilities Systems Series A (Education Revenue) | | | 5.75 | | | | 4-1-2038 | | | | 14,000,000 | | | | 16,025,660 | |
Will County IL Community Unified School District #201 U Crete-Monee CAB (GO, National Insured) ¤ | | | 0.00 | | | | 11-1-2023 | | | | 1,500,000 | | | | 1,131,210 | |
| | | | |
| | | | | | | | | | | | | | | 621,587,921 | |
| | | | | | | | | | | | | | | | |
| | | | | | |
| Portfolio of investments—December 31, 2014 (unaudited) | | Wells Fargo Advantage Municipal Bond Fund | | | 11 | |
| | | | | | | | | | | | | | | | |
| Security name | | Interest rate | | | Maturity date | | | Principal | | | Value | |
| | | | |
| Indiana: 1.69% | | | | | | | | | | | | | | | | |
Dearborn County IN EDA Hospital Project (Health Revenue, Fifth Third Bank LOC) ø | | | 0.19 | % | | | 4-1-2036 | | | $ | 4,000,000 | | | $ | 4,000,000 | |
Indiana Finance Authority AMT-I-69 Development Partners LLC (Miscellaneous Revenue) | | | 5.25 | | | | 9-1-2040 | | | | 5,000,000 | | | | 5,503,050 | |
Indiana Finance Authority Environmental Duke Energy Series B (Industrial Development Revenue) | | | 6.00 | | | | 8-1-2039 | | | | 2,000,000 | | | | 2,282,540 | |
Indiana Finance Authority I-69 Development Partners (Miscellaneous Revenue) | | | 5.25 | | | | 9-1-2034 | | | | 5,000,000 | | | | 5,556,050 | |
Indiana Finance Authority Ohio River Bridges East End Crossing Project Series A (Industrial Development Revenue) | | | 5.00 | | | | 7-1-2035 | | | | 9,970,000 | | | | 10,652,845 | |
Indiana Finance Authority Ohio River Bridges East End Crossing Project Series A (Industrial Development Revenue) | | | 5.00 | | | | 7-1-2040 | | | | 2,470,000 | | | | 2,628,204 | |
Indiana HEFA Clarian Health Series B (Health Revenue) | | | 5.00 | | | | 2-15-2022 | | | | 3,050,000 | | | | 3,198,749 | |
Indianapolis IN Local Public Improvement Bond Bank Airport Authority Project Series F (Miscellaneous Revenue, Ambac Insured) | | | 5.00 | | | | 1-1-2023 | | | | 2,750,000 | | | | 2,910,848 | |
Indianapolis IN Local Public Improvement Bond Bank ROCS RR II R-11779 (Water & Sewer Revenue, AGM Insured, Citibank NA LIQ) 144Aø | | | 0.24 | | | | 1-1-2017 | | | | 15,000,000 | | | | 15,000,000 | |
Valparaiso IN Pratt Paper LLC Project (Industrial Development Revenue) | | | 5.88 | | | | 1-1-2024 | | | | 2,235,000 | | | | 2,494,372 | |
| | | | |
| | | | | | | | | | | | | | | 54,226,658 | |
| | | | | | | | | | | | | | | | |
| | | | |
| Iowa: 0.07% | | | | | | | | | | | | | | | | |
Coralville IA Certificate of Participation Series D (Lease Revenue) | | | 5.25 | | | | 6-1-2026 | | | | 2,355,000 | | | | 2,349,277 | |
| | | | | | | | | | | | | | | | |
| | | | |
| Kansas: 0.23% | | | | | | | | | | | | | | | | |
Kansas Independent College Finance Authority RAN Ottawa University Series C (Education Revenue) | | | 4.60 | | | | 5-1-2015 | | | | 2,300,000 | | | | 2,306,026 | |
Sedgwick & Shawnee Counties KS Mortgage-Backed Securities Series A2 (Housing Revenue, GNMA Insured) | | | 6.70 | | | | 6-1-2029 | | | | 100,000 | | | | 101,203 | |
Wyandotte County & Kansas City KS Unified Government Special Obligation Second Lien CAB Series A (Tax Revenue) ¤ | | | 0.00 | | | | 6-1-2021 | | | | 6,840,000 | | | | 4,888,411 | |
| | | | |
| | | | | | | | | | | | | | | 7,295,640 | |
| | | | | | | | | | | | | | | | |
| | | | |
| Kentucky: 0.77% | | | | | | | | | | | | | | | | |
Kentucky EDFA Balance Norton Series B (Health Revenue, National Insured) ¤ | | | 0.00 | | | | 10-1-2028 | | | | 4,845,000 | | | | 2,799,199 | |
Kentucky EDFA Norton Healthcare Incorporated Series B (Health Revenue, National Insured) ¤ | | | 0.00 | | | | 10-1-2024 | | | | 9,260,000 | | | | 6,600,621 | |
Kentucky EDFA Series 2980 (Health Revenue, Morgan Stanley Bank LIQ) 144Aø | | | 0.36 | | | | 8-15-2024 | | | | 10,500,000 | | | | 10,500,000 | |
Kentucky Public Transportation Infrastructure Authority Downtown Crossing Project Series B (Transportation Revenue) ¤ | | | 0.00 | | | | 7-1-2030 | | | | 2,000,000 | | | | 876,540 | |
Kentucky Public Transportation Infrastructure Authority Downtown Crossing Project Series B (Transportation Revenue) ¤ | | | 0.00 | | | | 7-1-2031 | | | | 2,780,000 | | | | 1,121,730 | |
Kentucky Public Transportation Infrastructure Authority Downtown Crossing Project Series B (Transportation Revenue) ¤ | | | 0.00 | | | | 7-1-2032 | | | | 2,500,000 | | | | 940,000 | |
Kentucky Public Transportation Infrastructure Authority Downtown Crossing Project Series C (Transportation Revenue) ¤ | | | 0.00 | | | | 7-1-2033 | | | | 1,000,000 | | | | 722,510 | |
Kentucky Public Transportation Infrastructure Authority Downtown Crossing Project Series C (Transportation Revenue) ¤ | | | 0.00 | | | | 7-1-2034 | | | | 1,505,000 | | | | 1,082,697 | |
| | | | |
| | | | | | | | | | | | | | | 24,643,297 | |
| | | | | | | | | | | | | | | | |
| | | | |
| Louisiana: 2.15% | | | | | | | | | | | | | | | | |
Louisiana Local Government Environmental Facilities (Miscellaneous Revenue, Ambac Insured) | | | 5.25 | | | | 12-1-2018 | | | | 5,260,000 | | | | 5,446,204 | |
Louisiana Public Facilities Authority Dock & Impala Warehousing LLC Project (Miscellaneous Revenue) | | | 6.50 | | | | 7-1-2036 | | | | 10,500,000 | | | | 11,739,315 | |
| | | | |
| 12 | | Wells Fargo Advantage Municipal Bond Fund | | Portfolio of investments—December 31, 2014 (unaudited) |
| | | | | | | | | | | | | | | | |
| Security name | | Interest rate | | | Maturity date | | | Principal | | | Value | |
| | | | |
| Louisiana (continued) | | | | | | | | | | | | | | | | |
Louisiana Tobacco Settlement Financing Corporation Revenue Bonds Series A (Tobacco Revenue) | | | 5.00 | % | | | 5-15-2025 | | | $ | 12,500,000 | | | $ | 12,952,250 | |
New Orleans LA (GO, FGIC Insured) | | | 5.50 | | | | 12-1-2021 | | | | 2,050,000 | | | | 2,315,455 | |
New Orleans LA Aviation Board Gulf Opportunity Zone Consolidated Rental Car Series A (Airport Revenue) | | | 6.50 | | | | 1-1-2040 | | | | 6,500,000 | | | | 7,489,235 | |
St. James Parish LA Nucor Steel LLC Project Gulf Opportunity Zone Series A1 (Industrial Development Revenue) ø | | | 0.22 | | | | 11-1-2040 | | | | 13,000,000 | | | | 13,000,000 | |
St. James Parish LA Nucor Steel LLC Project Gulf Opportunity Zone Series B1 (Industrial Development Revenue) ø | | | 0.20 | | | | 11-1-2040 | | | | 16,000,000 | | | | 16,000,000 | |
| | | | |
| | | | | | | | | | | | | | | 68,942,459 | |
| | | | | | | | | | | | | | | | |
| | | | |
| Maine: 0.23% | | | | | | | | | | | | | | | | |
Maine Educational Loan Authority Student Loan Series A-3 Class A (Education Revenue, AGM Insured) | | | 5.88 | | | | 12-1-2039 | | | | 6,750,000 | | | | 7,511,535 | |
| | | | | | | | | | | | | | | | |
| | | | |
| Maryland: 0.01% | | | | | | | | | | | | | | | | |
Howard County MD Certificate of Participation Agricultural Land Preservation #90-23 Series A (Miscellaneous Revenue) | | | 8.00 | | | | 8-15-2020 | | | | 296,000 | | | | 377,874 | |
| | | | | | | | | | | | | | | | |
| | | | |
| Massachusetts: 1.52% | | | | | | | | | | | | | | | | |
Deutsche Bank SPEARs/LIFERs Trust Series DBE 1163 (Education Revenue, Deutsche Bank LIQ) 144Aø | | | 0.20 | | | | 10-1-2048 | | | | 11,630,000 | | | | 11,630,000 | |
Massachusetts Development Finance Agency Sabis International Charter Series A (Education Revenue) | | | 8.00 | | | | 4-15-2031 | | | | 2,150,000 | | | | 2,534,571 | |
Massachusetts Development Finance Agency Sabis International Charter Series A (Education Revenue) | | | 8.00 | | | | 4-15-2039 | | | | 3,900,000 | | | | 4,584,567 | |
Massachusetts Educational Finance Authority Series B (Education Revenue) | | | 5.38 | | | | 1-1-2020 | | | | 2,360,000 | | | | 2,552,505 | |
Massachusetts Educational Finance Authority Series E (Education Revenue, Ambac Insured) | | | 5.30 | | | | 1-1-2016 | | | | 40,000 | | | | 40,158 | |
Massachusetts Educational Finance Authority Series I (Education Revenue) | | | 6.00 | | | | 1-1-2028 | | | | 2,365,000 | | | | 2,512,765 | |
Massachusetts Educational Finance Authority Series J (Education Revenue) | | | 5.00 | | | | 7-1-2020 | | | | 6,000,000 | | | | 6,715,680 | |
Massachusetts Educational Finance Authority Series J (Education Revenue) | | | 5.00 | | | | 7-1-2021 | | | | 3,000,000 | | | | 3,377,490 | |
Massachusetts PFOTER Series 4406 (Tax Revenue, Dexia Credit Local LIQ) 144Aø | | | 0.13 | | | | 7-1-2030 | | | | 15,000 | | | | 15,000 | |
Massachusetts Series B (Miscellaneous Revenue, Dexia Credit Local LOC, AGM Insured, Dexia Credit Local LIQ) 144Aø | | | 0.12 | | | | 11-1-2026 | | | | 14,825,000 | | | | 14,825,000 | |
| | | | |
| | | | | | | | | | | | | | | 48,787,736 | |
| | | | | | | | | | | | | | | | |
| | | | |
| Michigan: 5.87% | | | | | | | | | | | | | | | | |
Detroit MI City School District Building and Site Improvement Series A (GO, AGM/Qualified School Bond Loan Fund Insured) | | | 5.00 | | | | 5-1-2019 | | | | 5,900,000 | | | | 5,978,470 | |
Detroit MI Distribution of State Aid (GO) | | | 5.00 | | | | 11-1-2030 | | | | 2,855,000 | | | | 3,066,584 | |
Detroit MI Downtown Development Authority CAB (Tax Revenue) ¤ | | | 0.00 | | | | 7-1-2018 | | | | 3,050,000 | | | | 2,463,973 | |
Detroit MI Downtown Development Authority CAB (Tax Revenue) ¤ | | | 0.00 | | | | 7-1-2019 | | | | 3,050,000 | | | | 2,313,212 | |
Detroit MI Downtown Development Authority CAB (Tax Revenue) ¤ | | | 0.00 | | | | 7-1-2020 | | | | 2,070,000 | | | | 1,472,453 | |
Detroit MI Water Supply System Second Lien Series B (Water & Sewer Revenue, AGM Insured) | | | 7.00 | | | | 7-1-2036 | | | | 9,675,000 | | | | 11,030,371 | |
Livonia MI Public Schools School District Building & Site Series I (GO) | | | 5.00 | | | | 5-1-2026 | | | | 1,075,000 | | | | 1,234,455 | |
Livonia MI Public Schools School District Building & Site Series I (GO) | | | 5.00 | | | | 5-1-2028 | | | | 1,450,000 | | | | 1,650,898 | |
Livonia MI Public Schools School District Building & Site Series I (GO) | | | 5.00 | | | | 5-1-2029 | | | | 1,350,000 | | | | 1,529,631 | |
Livonia MI Public Schools School District Building & Site Series I (GO) | | | 5.00 | | | | 5-1-2030 | | | | 1,775,000 | | | | 2,004,241 | |
Livonia MI Public Schools School District Building & Site Series I (GO) | | | 5.00 | | | | 5-1-2031 | | | | 1,425,000 | | | | 1,602,384 | |
| | | | | | |
| Portfolio of investments—December 31, 2014 (unaudited) | | Wells Fargo Advantage Municipal Bond Fund | | | 13 | |
| | | | | | | | | | | | | | | | |
| Security name | | Interest rate | | | Maturity date | | | Principal | | | Value | |
| | | | |
| Michigan (continued) | | | | | | | | | | | | | | | | |
Michigan Finance Authority Limited Obligation Holly Academy (Education Revenue) | | | 6.50 | % | | | 10-1-2020 | | | $ | 180,000 | | | $ | 195,860 | |
Michigan Finance Authority Limited Obligation Holly Academy (Education Revenue) | | | 8.00 | | | | 10-1-2040 | | | | 1,175,000 | | | | 1,391,705 | |
Michigan Finance Authority Limited Obligation Series A (Miscellaneous Revenue) | | | 7.50 | | | | 12-1-2020 | | | | 360,000 | | | | 386,906 | |
Michigan Finance Authority Limited Obligation Series A (Miscellaneous Revenue) | | | 8.00 | | | | 12-1-2030 | | | | 1,135,000 | | | | 1,237,740 | |
Michigan Finance Authority Limited Obligation Series A (Miscellaneous Revenue) | | | 8.25 | | | | 12-1-2039 | | | | 2,220,000 | | | | 2,441,223 | |
Michigan Finance Authority Public School Academy Old Redford Series A (Education Revenue) | | | 5.90 | | | | 12-1-2030 | | | | 2,000,000 | | | | 2,005,420 | |
Michigan Finance Authority Public School Academy University Learning (Education Revenue) | | | 5.25 | | | | 11-1-2015 | | | | 70,000 | | | | 70,879 | |
Michigan Finance Authority Public School Academy University Learning (Education Revenue) | | | 6.25 | | | | 11-1-2020 | | | | 440,000 | | | | 471,640 | |
Michigan Finance Authority Refunding Bond Local Government Loan Program Detroit Water & Sewer Series D4 (Water & Sewer Revenue) | | | 5.00 | | | | 7-1-2031 | | | | 6,500,000 | | | | 7,188,155 | |
Michigan Finance Authority Refunding Bond Local Government Loan Program Detroit Water & Sewer Series D6 (Water & Sewer Revenue, National Insured) | | | 5.00 | | | | 7-1-2036 | | | | 3,250,000 | | | | 3,566,713 | |
Michigan Finance Authority Refunding Notes Local Government Loan Program Public Lighting Authority Series B (Tax Revenue) | | | 5.00 | | | | 7-1-2044 | | | | 12,625,000 | | | | 13,552,811 | |
Michigan Finance Authority Revenue Local Government Loan Program Series C (Water & Sewer Revenue, National Insured) | | | 5.00 | | | | 7-1-2025 | | | | 2,000,000 | | | | 2,304,440 | |
Michigan Finance Authority Revenue Local Government Loan Program Series C (Water & Sewer Revenue, National Insured) | | | 5.00 | | | | 7-1-2026 | | | | 1,945,000 | | | | 2,220,470 | |
Michigan Finance Authority Revenue Local Government Loan Program Series C (Water & Sewer Revenue, National Insured) | | | 5.00 | | | | 7-1-2027 | | | | 2,260,000 | | | | 2,569,191 | |
Michigan Finance Authority Revenue Local Government Loan Program Series C (Water & Sewer Revenue, National Insured) | | | 5.00 | | | | 7-1-2028 | | | | 3,480,000 | | | | 3,934,836 | |
Michigan Finance Authority Revenue Local Government Loan Program Series C (Water & Sewer Revenue, National Insured) | | | 5.00 | | | | 7-1-2032 | | | | 5,750,000 | | | | 6,397,738 | |
Michigan Finance Authority Revenue Local Government Loan Program Series D (Water & Sewer Revenue, National Insured) | | | 5.00 | | | | 7-1-2027 | | | | 1,000,000 | | | | 1,136,810 | |
Michigan Finance Authority Revenue Series H-1 (Tax Revenue) | | | 5.00 | | | | 10-1-2031 | | | | 1,340,000 | | | | 1,536,953 | |
Michigan Finance Authority Revenue Series H-1 (Tax Revenue) | | | 5.00 | | | | 10-1-2032 | | | | 2,000,000 | | | | 2,288,560 | |
Michigan Finance Authority Revenue Series H-1 (Tax Revenue) | | | 5.00 | | | | 10-1-2033 | | | | 2,975,000 | | | | 3,393,583 | |
Michigan Finance Authority Revenue Series H-1 (Tax Revenue) | | | 5.00 | | | | 10-1-2034 | | | | 3,670,000 | | | | 4,173,230 | |
Michigan Finance Authority Revenue Series H-1 (Tax Revenue) | | | 5.00 | | | | 10-1-2039 | | | | 7,955,000 | | | | 8,905,145 | |
Michigan Municipal Bond Authority CAB Local Government Loan Program Series G (Miscellaneous Revenue, Ambac Insured) ¤ | | | 0.00 | | | | 5-1-2017 | | | | 365,000 | | | | 345,505 | |
Michigan Municipal Bond Authority Local Government Loan Program CAB Series G (Miscellaneous Revenue, Ambac Insured) ¤ | | | 0.00 | | | | 5-1-2016 | | | | 175,000 | | | | 170,599 | |
Michigan Municipal Bond Authority Local Government Loan Program Series C (Miscellaneous Revenue, Ambac Insured) | | | 4.75 | | | | 5-1-2027 | | | | 4,610,000 | | | | 4,665,551 | |
Michigan Municipal Bond Authority Revenue Local Government Loan Program Series A (Miscellaneous Revenue, Ambac Insured) | | | 4.00 | | | | 11-1-2021 | | | | 150,000 | | | | 150,110 | |
Michigan Municipal Bond Authority Revenue Local Government Loan Program Series A (Miscellaneous Revenue, Ambac Insured) | | | 5.00 | | | | 5-1-2017 | | | | 550,000 | | | | 580,877 | |
Michigan Municipal Bond Authority Revenue Local Government Loan Program Series B Group A (Miscellaneous Revenue, Ambac Insured) | | | 4.25 | | | | 12-1-2016 | | | | 2,770,000 | | | | 2,863,183 | |
Michigan Municipal Bond Authority Revenue Local Government Loan Program Series B Group A (Miscellaneous Revenue, Ambac Insured) | | | 5.00 | | | | 12-1-2015 | | | | 1,480,000 | | | | 1,519,398 | |
Michigan Municipal Bond Authority Revenue Local Government Loan Program Series B Group A (Miscellaneous Revenue, Ambac Insured) | | | 5.00 | | | | 12-1-2017 | | | | 2,475,000 | | | | 2,611,793 | |
Michigan Municipal Bond Authority Revenue Local Government Loan Program Series B Group A (Miscellaneous Revenue, Ambac Insured) | | | 5.25 | | | | 12-1-2023 | | | | 1,185,000 | | | | 1,215,739 | |
| | | | |
| 14 | | Wells Fargo Advantage Municipal Bond Fund | | Portfolio of investments—December 31, 2014 (unaudited) |
| | | | | | | | | | | | | | | | |
| Security name | | Interest rate | | | Maturity date | | | Principal | | | Value | |
| | | | |
| Michigan (continued) | | | | | | | | | | | | | | | | |
Michigan Municipal Bond Authority Revenue Local Government Loan Program Series C (Miscellaneous Revenue, Ambac Insured) | | | 3.63 | % | | | 5-1-2016 | | | $ | 1,000,000 | | | $ | 1,015,230 | |
Michigan Municipal Bond Authority Revenue Local Government Loan Program Series C (Miscellaneous Revenue, Ambac Insured) | | | 3.75 | | | | 5-1-2017 | | | | 450,000 | | | | 460,539 | |
Michigan Municipal Bond Authority Revenue Local Government Loan Program Series C (Miscellaneous Revenue, Ambac Insured) | | | 4.00 | | | | 5-1-2019 | | | | 100,000 | | | | 101,609 | |
Michigan Municipal Bond Authority Revenue Local Government Loan Program Series G (Miscellaneous Revenue, Ambac Insured) ¤ | | | 0.00 | | | | 5-1-2019 | | | | 75,000 | | | | 66,459 | |
Michigan Municipal Bond Authority Revenue Local Government Loan Program Series G (Miscellaneous Revenue, Ambac Insured) ¤ | | | 0.00 | | | | 5-1-2020 | | | | 205,000 | | | | 175,205 | |
Michigan PFOTER Series 4711 (GO, AGM/Qualified School Bond Loan Fund Insured, Dexia Credit Local LIQ) 144Aø | | | 0.48 | | | | 5-1-2029 | | | | 19,840,000 | | | | 19,840,000 | |
Michigan Public Educational Facilities Authority Bradford Academy Project (Education Revenue) | | | 8.75 | | | | 9-1-2039 | | | | 3,500,000 | | | | 2,275,035 | |
Michigan Public Educational Facilities Authority Limited Obligation Bradford Academy Project (Education Revenue) 144A | | | 6.50 | | | | 9-1-2037 | | | | 3,745,000 | | | | 2,434,287 | |
Michigan Public Educational Facilities Authority Limited Obligation Bradford Academy Project (Education Revenue) | | | 8.50 | | | | 9-1-2029 | | | | 1,500,000 | | | | 975,015 | |
Michigan Public Educational Facilities Authority Limited Obligation Crescent (Education Revenue, Qualified School Bond Loan Fund Insured) | | | 7.00 | | | | 10-1-2036 | | | | 1,195,000 | | | | 1,216,426 | |
Michigan Public Educational Facilities Authority Limited Obligation Nataki Talibah (Miscellaneous Revenue) | | | 6.25 | | | | 10-1-2023 | | | | 800,000 | | | | 399,984 | |
Michigan Public Educational Facilities Authority Madison Academy Project (Education Revenue) | | | 8.38 | | | | 12-1-2030 | | | | 2,085,000 | | | | 2,290,373 | |
Michigan Public Educational Facilities Authority Madison Academy Project (Education Revenue) | | | 8.63 | | | | 12-1-2039 | | | | 4,170,000 | | | | 4,635,831 | |
Michigan Strategic Fund Limited Obligation Detroit Edison Company Exempt Facilities Project Series KT (Utilities Revenue) | | | 5.63 | | | | 7-1-2020 | | | | 1,200,000 | | | | 1,416,264 | |
Michigan Strategic Fund Limited Obligation Events Center Project Series A (Tax Revenue) ± | | | 4.13 | | | | 7-1-2045 | | | | 15,500,000 | | | | 15,638,260 | |
Oakland County MI Economic Development Corporation The Academy of The Sacred Heart Project Series A (Education Revenue) | | | 6.50 | | | | 12-15-2036 | | | | 4,505,000 | | | | 4,608,525 | |
Star International Academy Michigan (Miscellaneous Revenue) | | | 2.90 | | | | 3-1-2015 | | | | 100,000 | | | | 100,156 | |
Star International Academy Michigan (Miscellaneous Revenue) | | | 3.15 | | | | 3-1-2016 | | | | 200,000 | | | | 201,942 | |
Star International Academy Michigan (Miscellaneous Revenue) | | | 3.40 | | | | 3-1-2017 | | | | 100,000 | | | | 101,778 | |
Wayne Charter County MI Building Improvement Series A (GO) | | | 6.75 | | | | 11-1-2039 | | | | 9,080,000 | | | | 9,546,712 | |
Wayne County MI Airport Authority Junior Lien (Airport Revenue, National Insured) | | | 5.00 | | | | 12-1-2016 | | | | 1,115,000 | | | | 1,200,253 | |
| | | | |
| | | | | | | | | | | | | | | 188,539,318 | |
| | | | | | | | | | | | | | | | |
| | | | |
| Minnesota: 0.02% | | | | | | | | | | | | | | | | |
Baytown Township MN St. Croix Preparatory Academy Series A (Education Revenue) | | | 7.00 | | | | 8-1-2038 | | | | 750,000 | | | | 787,095 | |
| | | | | | | | | | | | | | | | |
| | | | |
| Mississippi: 0.76% | | | | | | | | | | | | | | | | |
Mississippi Development Bank Special Obligation Jackson Water & Sewer System Project Series A (Water & Sewer Revenue, AGM Insured) | | | 5.00 | | | | 9-1-2030 | | | | 8,155,000 | | | | 9,372,705 | |
Perry County MS PCR Leaf River Forest Product Project (Industrial Development Revenue, Georgia-Pacific LLC LOC) 144Aø | | | 0.26 | | | | 2-1-2022 | | | | 15,000,000 | | | | 15,000,000 | |
| | | | |
| | | | | | | | | | | | | | | 24,372,705 | |
| | | | | | | | | | | | | | | | |
| | | | |
| Missouri: 0.60% | | | | | | | | | | | | | | | | |
Independence MO Thirty-Ninth Street Transportation District Improvement Development Road Improvement Project (Tax Revenue) | | | 6.88 | | | | 9-1-2032 | | | | 4,600,000 | | | | 4,899,506 | |
| | | | | | |
| Portfolio of investments—December 31, 2014 (unaudited) | | Wells Fargo Advantage Municipal Bond Fund | | | 15 | |
| | | | | | | | | | | | | | | | |
| Security name | | Interest rate | | | Maturity date | | | Principal | | | Value | |
| | | | |
| Missouri (continued) | | | | | | | | | | | | | | | | |
Manchester MO Highway 141 Manchester Road Project (Tax Revenue) | | | 6.00 | % | | | 11-1-2025 | | | $ | 2,105,000 | | | $ | 2,235,278 | |
Sikeston MO The Electric System of the Board of Municipal Utilities (Utilities Revenue, National Insured) | | | 6.00 | | | | 6-1-2015 | | | | 750,000 | | | | 767,370 | |
Sikeston MO The Electric System of the Board of Municipal Utilities (Utilities Revenue, National Insured) | | | 6.00 | | | | 6-1-2016 | | | | 1,500,000 | | | | 1,606,215 | |
St. Louis MO IDA Convention Center Hotel (Miscellaneous Revenue, Ambac Insured) ¤ | | | 0.00 | | | | 7-15-2019 | | | | 2,475,000 | | | | 2,206,116 | |
St. Louis MO Lambert St. Louis International Airport Series A-1 (Airport Revenue) | | | 6.25 | | | | 7-1-2029 | | | | 2,000,000 | | | | 2,315,980 | |
St. Louis MO PFOTER Series 3584 (Airport Revenue, National Insured, Dexia Credit Local LIQ) ø | | | 0.23 | | | | 7-1-2030 | | | | 5,190,000 | | | | 5,190,000 | |
| | | | |
| | | | | | | | | | | | | | | 19,220,465 | |
| | | | | | | | | | | | | | | | |
| | | | |
| Nebraska: 0.04% | | | | | | | | | | | | | | | | |
Nebraska Central Plains Energy Project #3 (Utilities Revenue) | | | 5.00 | | | | 9-1-2027 | | | | 1,020,000 | | | | 1,142,431 | |
| | | | | | | | | | | | | | | | |
| | | | |
| Nevada: 0.04% | | | | | | | | | | | | | | | | |
Las Vegas NV Special Improvement District #60 Local Improvement (Miscellaneous Revenue) | | | 5.00 | | | | 6-1-2022 | | | | 540,000 | | | | 583,697 | |
Las Vegas NV Special Improvement District #60 Local Improvement (Miscellaneous Revenue) | | | 5.00 | | | | 6-1-2023 | | | | 425,000 | | | | 460,156 | |
Las Vegas NV Special Improvement District #60 Local Improvement (Miscellaneous Revenue) | | | 5.00 | | | | 6-1-2024 | | | | 300,000 | | | | 326,184 | |
| | | | |
| | | | | | | | | | | | | | | 1,370,037 | |
| | | | | | | | | | | | | | | | |
| | | | |
| New Hampshire: 0.06% | | | | | | | | | | | | | | | | |
Manchester NH Housing & RDA CAB Series B (Miscellaneous Revenue, ACA Insured) ¤ | | | 0.00 | | | | 1-1-2021 | | | | 2,375,000 | | | | 1,660,933 | |
Manchester NH Housing & RDA CAB Series B (Miscellaneous Revenue, ACA Insured) ¤ | | | 0.00 | | | | 1-1-2025 | | | | 250,000 | | | | 128,218 | |
| | | | |
| | | | | | | | | | | | | | | 1,789,151 | |
| | | | | | | | | | | | | | | | |
| | | | |
| New Jersey: 5.72% | | | | | | | | | | | | | | | | |
Bayonne NJ School Refunding Bonds (GO, AGM Insured) | | | 5.00 | | | | 7-15-2023 | | | | 2,505,000 | | | | 2,929,748 | |
New Jersey EDA (Miscellaneous Revenue, Dexia Credit Local LOC, Ambac Insured, Dexia Credit Local LIQ) 144Aø | | | 0.28 | | | | 12-15-2020 | | | | 10,465,000 | | | | 10,465,000 | |
New Jersey EDA Natural Gas Company Project Series C (Utilities Revenue, National Insured) ± | | | 4.90 | | | | 10-1-2040 | | | | 5,680,000 | | | | 5,869,826 | |
New Jersey EDA School Facilities Construction Notes Series C (Miscellaneous Revenue) ± | | | 1.83 | | | | 2-1-2018 | | | | 3,000,000 | | | | 3,079,860 | |
New Jersey EDA School Facilities Construction Project Series I (Miscellaneous Revenue) ± | | | 1.59 | | | | 9-1-2027 | | | | 10,675,000 | | | | 10,651,622 | |
New Jersey EDA School Facilities Construction Project Series I (Miscellaneous Revenue) ± | | | 1.64 | | | | 3-1-2028 | | | | 40,085,000 | | | | 39,994,007 | |
New Jersey EDA Special Facility Revenue Continental Airlines Incorporated Project (Industrial Development Revenue) | | | 4.88 | | | | 9-15-2019 | | | | 6,500,000 | | | | 6,841,965 | |
New Jersey Tobacco Settlement Financing Corporation Series C (Tobacco Revenue, Morgan Stanley Bank LIQ) 144Aø | | | 0.69 | | | | 6-1-2029 | | | | 5,000,000 | | | | 5,000,000 | |
New Jersey TTFA (Transportation Revenue) | | | 6.00 | | | | 12-15-2038 | | | | 10,425,000 | | | | 12,083,826 | |
New Jersey TTFA CAB Series A (Transportation Revenue) ¤ | | | 0.00 | | | | 12-15-2026 | | | | 2,100,000 | | | | 1,283,751 | |
New Jersey TTFA PFOTER Series 109 (Transportation Revenue, Dexia Credit Local LOC, FGIC Insured, Dexia Credit Local SPA) 144Aø | | | 0.24 | | | | 12-15-2030 | | | | 8,000,000 | | | | 8,000,000 | |
New Jersey TTFA Series A (Miscellaneous Revenue, National Insured) | | | 5.75 | | | | 6-15-2023 | | | | 2,000,000 | | | | 2,427,740 | |
New Jersey TTFA Series A (Miscellaneous Revenue, National Insured) | | | 5.75 | | | | 6-15-2025 | | | | 10,000,000 | | | | 12,389,600 | |
New Jersey TTFA Series AA (Miscellaneous Revenue) | | | 5.00 | | | | 6-15-2038 | | | | 8,165,000 | | | | 8,882,948 | |
| | | | |
| 16 | | Wells Fargo Advantage Municipal Bond Fund | | Portfolio of investments—December 31, 2014 (unaudited) |
| | | | | | | | | | | | | | | | |
| Security name | | Interest rate | | | Maturity date | | | Principal | | | Value | |
| | | | |
| New Jersey (continued) | | | | | | | | | | | | | | | | |
New Jersey TTFA Series B (Miscellaneous Revenue) | | | 5.00 | % | | | 6-15-2042 | | | $ | 10,000,000 | | | $ | 10,604,700 | |
New Jersey TTFA Series B (Miscellaneous Revenue) | | | 5.25 | | | | 6-15-2036 | | | | 3,435,000 | | | | 3,775,443 | |
New Jersey TTFA Transportation Series D (Transportation Revenue) | | | 5.00 | | | | 6-15-2032 | | | | 8,000,000 | | | | 8,873,440 | |
Rutgers NJ State University Series L (Education Revenue) | | | 5.00 | | | | 5-1-2033 | | | | 3,560,000 | | | | 4,144,125 | |
South Jersey NJ Transportation Authority Series A (Transportation Revenue) | | | 5.00 | | | | 11-1-2023 | | | | 1,500,000 | | | | 1,707,225 | |
South Jersey NJ Transportation Authority Series A (Transportation Revenue) | | | 5.00 | | | | 11-1-2024 | | | | 4,500,000 | | | | 5,069,205 | |
South Jersey NJ Transportation Authority Series A (Transportation Revenue) | | | 5.00 | | | | 11-1-2025 | | | | 3,400,000 | | | | 3,803,818 | |
South Jersey NJ Transportation Authority Series A (Transportation Revenue) | | | 5.00 | | | | 11-1-2026 | | | | 3,920,000 | | | | 4,368,409 | |
Washington Township NJ Board of Education Mercer County PFOTER (GO, AGM Insured, Dexia Bank SPA) ø | | | 0.18 | | | | 1-1-2028 | | | | 11,390,000 | | | | 11,390,000 | |
| | | | |
| | | | | | | | | | | | | | | 183,636,258 | |
| | | | | | | | | | | | | | | | |
| | | | |
| New Mexico: 0.34% | | | | | | | | | | | | | | | | |
New Mexico Mortgage Finance Authority SFMR Class I (Housing Revenue, GNMA/FNMA/FHLMC Insured) | | | 5.35 | | | | 3-1-2030 | | | | 845,000 | | | | 902,392 | |
New Mexico Municipal Energy Acquisition Authority Gas Supply Sub Series B (Utilities Revenue, Royal Bank of Canada SPA) ± | | | 0.85 | | | | 11-1-2039 | | | | 10,000,000 | | | | 10,064,400 | |
| | | | |
| | | | | | | | | | | | | | | 10,966,792 | |
| | | | | | | | | | | | | | | | |
| | | | |
| New York: 11.23% | | | | | | | | | | | | | | | | |
Deutsche Bank SPEARs/LIFERs Trust Series DB 1220 (Housing Revenue, Deutsche Bank LIQ) 144A± | | | 0.50 | | | | 10-1-2053 | | | | 8,705,000 | | | | 8,705,000 | |
Hempstead Town NY Local Development Corporation The Academy Charter School Project Series A (Education Revenue) | | | 7.65 | | | | 2-1-2044 | | | | 3,500,000 | | | | 3,979,780 | |
Hempstead Town NY Local Development Corporation The Academy Charter School Project Series A (Education Revenue) | | | 8.25 | | | | 2-1-2041 | | | | 10,005,000 | | | | 11,714,754 | |
Metropolitan Transportation Authority New York Series 2008-C (Transportation Revenue) | | | 6.50 | | | | 11-15-2028 | | | | 8,000,000 | | | | 9,633,040 | |
Metropolitan Transportation Authority New York Services Contract Series 7 (Miscellaneous Revenue) | | | 5.63 | | | | 7-1-2016 | | | | 1,850,000 | | | | 1,915,768 | |
Metropolitan Transportation Authority New York Series D (Transportation Revenue) | | | 5.25 | | | | 11-15-2044 | | | | 42,180,000 | | | | 49,099,207 | |
New York City NY Housing Development Corporation 8 Spruce Street Class E (Housing Revenue) | | | 3.50 | | | | 2-15-2048 | | | | 3,000,000 | | | | 3,031,410 | |
New York City NY Housing Development Corporation Mortgage Refunding Bond 8 Spruce Street Class F (Housing Revenue) | | | 4.50 | | | | 2-15-2048 | | | | 3,500,000 | | | | 3,558,695 | |
New York Dormitory Authority North Shore Jewish Series B (Health Revenue) ± | | | 0.89 | | | | 5-1-2018 | | | | 2,940,000 | | | | 2,940,588 | |
New York Dormitory Authority Series B (Tax Revenue) | | | 5.75 | | | | 3-15-2036 | | | | 10,000,000 | | | | 11,597,000 | |
New York Energy R&D Authority Brooklyn Union Gas Company Series B (Utilities Revenue) (x) | | | 13.52 | | | | 7-1-2026 | | | | 4,300,000 | | | | 4,343,602 | |
New York Energy R&D Authority Linked SAVRS & Residual Interest Bonds Brooklyn (Utilities Revenue) | | | 6.95 | | | | 7-1-2026 | | | | 2,600,000 | | | | 2,613,182 | |
New York NY Municipal Water Finance Authority 2nd General Resolution Series AA (Water & Sewer Revenue) | | | 5.00 | | | | 6-15-2044 | | | | 17,400,000 | | | | 19,406,742 | |
New York NY Municipal Water Finance Authority 2nd General Resolution Series BB (Water & Sewer Revenue) | | | 5.00 | | | | 6-15-2044 | | | | 30,265,000 | | | | 33,998,793 | |
New York NY Municipal Water Finance Authority 2nd General Resolution Series BB (Water & Sewer Revenue) | | | 5.25 | | | | 6-15-2044 | | | | 9,800,000 | | | | 11,188,072 | |
New York NY Municipal Water Finance Authority 2nd General Resolution Series DD (Water & Sewer Revenue) | | | 6.00 | | | | 6-15-2040 | | | | 11,625,000 | | | | 13,340,966 | |
New York NY Municipal Water Finance Authority 2nd General Resolution Series FF (Water & Sewer Revenue) | | | 5.00 | | | | 6-15-2045 | | | | 10,765,000 | | | | 12,041,083 | |
| | | | | | |
| Portfolio of investments—December 31, 2014 (unaudited) | | Wells Fargo Advantage Municipal Bond Fund | | | 17 | |
| | | | | | | | | | | | | | | | |
| Security name | | Interest rate | | | Maturity date | | | Principal | | | Value | |
| | | | |
| New York (continued) | | | | | | | | | | | | | | | | |
New York NY Municipal Water Finance Authority Series 2009-A (Water & Sewer Revenue) | | | 5.75 | % | | | 6-15-2040 | | | $ | 5,000,000 | | | $ | 5,721,600 | |
New York NY Municipal Water Finance Authority Series AA3 (Water & Sewer Revenue, Dexia Credit Local SPA) ø | | | 0.16 | | | | 6-15-2032 | | | | 30,500,000 | | | | 30,500,000 | |
New York NY Municipal Water Finance Authority Water & Sewer System Series A (Water & Sewer Revenue) | | | 5.00 | | | | 6-15-2038 | | | | 36,650,000 | | | | 39,724,569 | |
New York NY Municipal Water Finance Authority Water & Sewer System Series DD (Water & Sewer Revenue) | | | 5.00 | | | | 6-15-2026 | | | | 3,255,000 | | | | 3,849,330 | |
New York NY Series F-1 (GO) | | | 5.00 | | | | 3-1-2032 | | | | 3,000,000 | | | | 3,459,780 | |
New York NY Transitional Finance Authority Building Aid Fiscal Year 2009 Series S-4 (Miscellaneous Revenue) | | | 5.75 | | | | 1-15-2039 | | | | 2,500,000 | | | | 2,882,400 | |
New York NY Transitional Finance Authority Future Tax Secured Revenue Series I (Tax Revenue) | | | 5.00 | | | | 5-1-2033 | | | | 5,395,000 | | | | 6,284,582 | |
New York NY Transitional Finance Authority Future Tax Secured Subordinate Bonds Series A (Tax Revenue) | | | 5.00 | | | | 8-1-2031 | | | | 7,075,000 | | | | 8,388,262 | |
New York NY Transitional Finance Authority Series 3 Sub Series 3C (Tax Revenue, Dexia Credit Local SPA) ø | | | 0.20 | | | | 11-1-2022 | | | | 9,800,000 | | | | 9,800,000 | |
New York NY Transitional Finance Authority Sub Series 2B (Tax Revenue, Dexia Credit Local SPA) ø | | | 0.20 | | | | 11-1-2022 | | | | 8,200,000 | | | | 8,200,000 | |
New York Urban Development Corporation (Tax Revenue, Dexia Credit Local LOC, National Insured, Dexia Credit Local LIQ) 144Aø | | | 0.13 | | | | 3-15-2024 | | | | 9,930,000 | | | | 9,930,000 | |
New York Urban Development Corporation Certificate of Participation James A. Farley Post Office Building Refinancing (Miscellaneous Revenue) | | | 4.00 | | | | 2-1-2015 | | | | 15,935,000 | | | | 15,951,094 | |
Niagara Falls NY Public Improvement Project (GO, National Insured) | | | 7.50 | | | | 3-1-2016 | | | | 685,000 | | | | 734,560 | |
Niagara Falls NY Public Improvement Project (GO, National Insured) | | | 7.50 | | | | 3-1-2016 | | | | 65,000 | | | | 70,465 | |
Port Authority of New York & New Jersey Special Obligation JFK International Airport Terminal 6 (Airport Revenue, National Insured) | | | 5.75 | | | | 12-1-2025 | | | | 4,000,000 | | | | 4,011,800 | |
Suffolk NY Tobacco Securitization Corporation Series B (Tobacco Revenue) | | | 4.50 | | | | 6-1-2026 | | | | 520,000 | | | | 567,866 | |
Suffolk NY Tobacco Securitization Corporation Series B (Tobacco Revenue) | | | 5.00 | | | | 6-1-2025 | | | | 500,000 | | | | 566,430 | |
Westchester County NY Local Development Corporation Pace University Series A (Education Revenue) | | | 5.00 | | | | 5-1-2034 | | | | 1,750,000 | | | | 1,925,175 | |
Westchester County NY Local Development Pace University Series B (Education Revenue) ø | | | 1.50 | | | | 5-1-2044 | | | | 5,000,000 | | | | 5,000,000 | |
| | | | |
| | | | | | | | | | | | | | | 360,675,595 | |
| | | | | | | | | | | | | | | | |
| | | | |
| North Carolina: 0.60% | | | | | | | | | | | | | | | | |
North Carolina Eastern Municipal Power Agency Series A (Utilities Revenue) | | | 5.50 | | | | 1-1-2026 | | | | 1,250,000 | | | | 1,442,363 | |
North Carolina Eastern Municipal Power Agency Series C (Utilities Revenue) | | | 6.75 | | | | 1-1-2024 | | | | 2,000,000 | | | | 2,410,500 | |
North Carolina Medical Care Commission Health Care Facilities University Health System Series D (Health Revenue) | | | 6.25 | | | | 12-1-2033 | | | | 8,500,000 | | | | 9,761,910 | |
North Carolina Medical Care Commission University Health System Eastern (Health Revenue) | | | 6.00 | | | | 12-1-2029 | | | | 5,000,000 | | | | 5,688,800 | |
| | | | |
| | | | | | | | | | | | | | | 19,303,573 | |
| | | | | | | | | | | | | | | | |
| | | | |
| Ohio: 2.13% | | | | | | | | | | | | | | | | |
Akron OH Sewer System (Water & Sewer Revenue, Ambac Insured) | | | 5.00 | | | | 12-1-2016 | | | | 1,500,000 | | | | 1,584,750 | |
Allen County OH Catholic Healthcare Series B (Health Revenue) | | | 5.25 | | | | 9-1-2027 | | | | 3,825,000 | | | | 4,375,265 | |
Cleveland OH Airport System Revenue Series A (Airport Revenue) | | | 5.00 | | | | 1-1-2025 | | | | 4,015,000 | | | | 4,542,973 | |
Cleveland OH Airport System Revenue Series A (Airport Revenue, AGM Insured) | | | 5.00 | | | | 1-1-2031 | | | | 3,600,000 | | | | 4,010,688 | |
Kings OH Local School District (GO, National/FGIC Insured) | | | 7.50 | | | | 12-1-2016 | | | | 435,000 | | | | 474,737 | |
| | | | |
| 18 | | Wells Fargo Advantage Municipal Bond Fund | | Portfolio of investments—December 31, 2014 (unaudited) |
| | | | | | | | | | | | | | | | |
| Security name | | Interest rate | | | Maturity date | | | Principal | | | Value | |
| | | | |
| Ohio (continued) | | | | | | | | | | | | | | | | |
Montgomery County OH Catholic Health Initiatives Series C2 (Health Revenue, U.S. Bank NA SPA) ø | | | 0.10 | % | | | 10-1-2041 | | | $ | 15,000,000 | | | $ | 15,000,000 | |
Montgomery County OH Hospital Kettering Medical Center (Health Revenue, National Insured) | | | 6.25 | | | | 4-1-2020 | | | | 2,500,000 | | | | 2,818,100 | |
Ohio Air Quality Development Authority AMT Refunding Bond Pollution Control 1st Energy Series C (Industrial Development Revenue) ± | | | 3.95 | | | | 11-1-2032 | | | | 5,000,000 | | | | 5,162,500 | |
Ohio Enterprise Bond Toledo Series 2A (Industrial Development Revenue) | | | 5.50 | | | | 12-1-2019 | | | | 1,750,000 | | | | 1,957,533 | |
Ohio Turnpike Commission CAB Series A-4 (Transportation Revenue) ¤ | | | 0.00 | | | | 2-15-2034 | | | | 8,500,000 | | | | 7,074,890 | |
Ohio Water Development Authority Pollution Control AMT Series C (Industrial Development Revenue) ± | | | 3.95 | | | | 11-1-2032 | | | | 8,000,000 | | | | 8,311,680 | |
Reynoldsburg OH City School District Series DCL-2014-001 (GO, Dexia Credit Local LIQ) 144Aø | | | 0.14 | | | | 9-1-2030 | | | | 11,100,000 | | | | 11,100,000 | |
RiverSouth Authority Ohio Lazarus Building Redevelopment Series A (Lease Revenue) | | | 5.75 | | | | 12-1-2027 | | | | 1,900,000 | | | | 2,061,500 | |
| | | | |
| | | | | | | | | | | | | | | 68,474,616 | |
| | | | | | | | | | | | | | | | |
| | | | |
| Oklahoma: 0.15% | | | | | | | | | | | | | | | | |
McGee Creek Authority Oklahoma Water Revenue (Water & Sewer Revenue, State Street Bank & Trust Company LOC, National Insured) | | | 6.00 | | | | 1-1-2023 | | | | 4,220,000 | | | | 4,688,462 | |
| | | | | | | | | | | | | | | | |
| | | | |
| Oregon: 0.17% | | | | | | | | | | | | | | | | |
Deschutes County OR Hospital Facilities Authority Cascade Healthcare Community Incorporated Project (Health Revenue) | | | 8.25 | | | | 1-1-2038 | | | | 4,500,000 | | | | 5,448,555 | |
| | | | | | | | | | | | | | | | |
| | | | |
| Pennsylvania: 4.80% | | | | | | | | | | | | | | | | |
Allegheny County PA Hospital Development Authority University of Pittsburgh Medical Center Series A (Health Revenue) | | | 5.63 | | | | 8-15-2039 | | | | 5,130,000 | | | | 5,868,925 | |
Berks County PA Municipal Authority Reading Hospital & Medical Center Project Series B (Health Revenue) | | | 1.54 | | | | 11-1-2039 | | | | 20,000,000 | | | | 20,513,200 | |
Butler County PA Hospital Authority Series A (Health Revenue, Royal Bank of Scotland LOC) ø | | | 0.24 | | | | 10-1-2042 | | | | 3,000,000 | | | | 3,000,000 | |
Chester County PA IDA Avon Grove Charter School Project Series A (Education Revenue) | | | 6.25 | | | | 12-15-2027 | | | | 2,000,000 | | | | 2,119,080 | |
Dauphin County PA General Authority Office & Parking Riverfront Office Project (Miscellaneous Revenue) | | | 6.00 | | | | 1-1-2025 | | | | 3,565,000 | | | | 3,567,032 | |
Delaware County PA IDA Resource Recovery Facility Series A (Resource Recovery Revenue) | | | 6.20 | | | | 7-1-2019 | | | | 1,420,000 | | | | 1,421,278 | |
Delaware Valley PA Regional Finance Authority Local Government Public Improvements Project (Miscellaneous Revenue) | | | 5.75 | | | | 7-1-2032 | | | | 13,610,000 | | | | 17,201,135 | |
Delaware Valley PA Regional Finance Authority Local Government Series C (Miscellaneous Revenue, Ambac Insured) | | | 7.75 | | | | 7-1-2027 | | | | 4,160,000 | | | | 5,985,075 | |
Delaware Valley PA Regional Finance Authority Series 2996 (Miscellaneous Revenue, Morgan Stanley Bank LIQ) 144Aø | | | 0.29 | | | | 7-1-2017 | | | | 5,500,000 | | | | 5,500,000 | |
Delaware Valley PA Regional Finance Authority Series A (Miscellaneous Revenue, Ambac Insured) | | | 5.50 | | | | 8-1-2028 | | | | 16,420,000 | | | | 19,650,142 | |
Delaware Valley PA Regional Finance Authority Series B (Miscellaneous Revenue, Bayerische Landesbank LOC) ø | | | 0.22 | | | | 6-1-2042 | | | | 16,495,000 | | | | 16,495,000 | |
Luzerne County PA Series E (GO, AGM Insured) | | | 8.00 | | | | 11-1-2027 | | | | 135,000 | | | | 164,338 | |
Penn Hills Municipality PA Series B (GO, Ambac Insured) ¤ | | | 0.00 | | | | 12-1-2017 | | | | 1,000,000 | | | | 945,280 | |
Pennsylvania EDFA Colver Project Series F (Resource Recovery Revenue, Ambac Insured) | | | 5.00 | | | | 12-1-2015 | | | | 9,250,000 | | | | 9,515,198 | |
Pennsylvania Finance Authority Penn Hills Project Series B (Miscellaneous Revenue, National Insured) ¤ | | | 0.00 | | | | 12-1-2025 | | | | 3,790,000 | | | | 2,587,130 | |
| | | | | | |
| Portfolio of investments—December 31, 2014 (unaudited) | | Wells Fargo Advantage Municipal Bond Fund | | | 19 | |
| | | | | | | | | | | | | | | | |
| Security name | | Interest rate | | | Maturity date | | | Principal | | | Value | |
| | | | |
| Pennsylvania (continued) | | | | | | | | | | | | | | | | |
Pennsylvania HFA Single Family Mortgage Revenue Bonds AMT Series A (Housing Revenue) | | | 4.70 | % | | | 10-1-2037 | | | $ | 15,800,000 | | | $ | 15,979,172 | |
Pennsylvania Public School Building Authority School District Project (Miscellaneous Revenue) | | | 5.00 | | | | 4-1-2024 | | | | 3,000,000 | | | | 3,446,670 | |
Pennsylvania Turnpike Commission Motor License Series B1 (Transportation Revenue) | | | 5.00 | | | | 12-1-2040 | | | | 12,410,000 | | | | 13,570,087 | |
Philadelphia PA IDA 1st Philadelphia Preparatory Charter School Project Series A (Education Revenue) | | | 7.00 | | | | 6-15-2033 | | | | 2,000,000 | | | | 2,211,060 | |
Philadelphia PA IDA New Foundations Charter School Project (Education Revenue) | | | 6.00 | | | | 12-15-2027 | | | | 290,000 | | | | 315,981 | |
State Public School Building Authority Pennsylvania Philadelphia School District Project (Miscellaneous Revenue) | | | 5.00 | | | | 4-1-2022 | | | | 2,000,000 | | | | 2,314,200 | |
Wilkes Barre PA Finance Authority Wilkes University Project (Education Revenue) | | | 5.00 | | | | 3-1-2022 | | | | 1,600,000 | | | | 1,667,904 | |
| | | | |
| | | | | | | | | | | | | | | 154,037,887 | |
| | | | | | | | | | | | | | | | |
| | | | |
| Puerto Rico: 0.86% | | | | | | | | | | | | | | | | |
Puerto Rico Electric Power Authority Refunding Bond Series KK (Utilities Revenue, National Insured) | | | 5.50 | | | | 7-1-2016 | | | | 7,000,000 | | | | 7,223,580 | |
Puerto Rico Highway & Transportation Authority Series AA (Transportation Revenue, National Insured) | | | 5.50 | | | | 7-1-2020 | | | | 3,015,000 | | | | 3,138,253 | |
Puerto Rico Highway & Transportation Authority Series Z (Tax Revenue, AGM Insured) | | | 6.00 | | | | 7-1-2018 | | | | 5,570,000 | | | | 5,887,601 | |
Puerto Rico Highway and Transportation Authority Series Y (Miscellaneous Revenue, AGM Insured) | | | 6.25 | | | | 7-1-2021 | | | | 9,000,000 | | | | 9,799,830 | |
Puerto Rico Public Buildings Authority Government Facilities Series S (Lease Revenue, Commonwealth insured) | | | 5.88 | | | | 7-1-2039 | | | | 2,400,000 | | | | 1,656,384 | |
| | | | |
| | | | | | | | | | | | | | | 27,705,648 | |
| | | | | | | | | | | | | | | | |
| | | | |
| Rhode Island: 0.10% | | | | | | | | | | | | | | | | |
Rhode Island Clean Water Finance Agency Cranston Wastewater Treatment System (Miscellaneous Revenue, National Insured) | | | 5.80 | | | | 9-1-2022 | | | | 3,335,000 | | | | 3,339,736 | |
| | | | | | | | | | | | | | | | |
| | | | |
| South Carolina: 1.06% | | | | | | | | | | | | | | | | |
Calhoun County SC Solid Waste Disposal Facilities Eastman Kodak Company Project (Industrial Development Revenue) | | | 6.75 | | | | 5-1-2017 | | | | 400,000 | | | | 453,376 | |
Cherokee County SC Scago Educational Facilities Corporation Cherokee School District #1 Series B (Miscellaneous Revenue, AGM Insured) | | | 5.00 | | | | 12-1-2026 | | | | 2,295,000 | | | | 2,422,464 | |
Connector 2000 Association Incorporated CAB Series A (Transportation Revenue) ¤ | | | 0.00 | | | | 1-1-2015 | | | | 1,385,405 | | | | 1,275,127 | |
Connector 2000 Association Incorporated CAB Series A (Transportation Revenue) ¤ | | | 0.00 | | | | 1-1-2016 | | | | 121,679 | | | | 102,186 | |
Connector 2000 Association Incorporated CAB Series A (Transportation Revenue) ¤ | | | 0.00 | | | | 1-1-2017 | | | | 164,621 | | | | 125,063 | |
Connector 2000 Association Incorporated CAB Series A (Transportation Revenue) ¤ | | | 0.00 | | | | 1-1-2018 | | | | 181,929 | | | | 123,603 | |
Kershaw County SC Public Schools Kershaw County School District Project (Miscellaneous Revenue, AGC Insured) | | | 5.00 | | | | 12-1-2021 | | | | 2,870,000 | | | | 3,097,648 | |
Kershaw County SC Public Schools Kershaw County School District Project (Miscellaneous Revenue, AGC Insured) | | | 5.00 | | | | 12-1-2022 | | | | 905,000 | | | | 975,889 | |
Kershaw County SC Public Schools Kershaw County School District Project (Miscellaneous Revenue, AGC Insured) | | | 5.00 | | | | 12-1-2023 | | | | 6,950,000 | | | | 7,483,274 | |
Lee County SC School Facilities Incorporated Series 2006 (Miscellaneous Revenue, Radian Insured) | | | 6.00 | | | | 12-1-2031 | | | | 2,890,000 | | | | 3,061,406 | |
Newberry SC Newberry County School District Project (Miscellaneous Revenue) | | | 5.25 | | | | 12-1-2017 | | | | 760,000 | | | | 791,791 | |
Piedmont SC Municipal Power Agency (Utilities Revenue, FGIC Insured) | | | 6.75 | | | | 1-1-2019 | | | | 210,000 | | | | 255,295 | |
South Carolina Education Assistance Authority Student Loan Series I (Education Revenue) | | | 5.10 | | | | 10-1-2029 | | | | 2,075,000 | | | | 2,248,678 | |
| | | | |
| 20 | | Wells Fargo Advantage Municipal Bond Fund | | Portfolio of investments—December 31, 2014 (unaudited) |
| | | | | | | | | | | | | | | | |
| Security name | | Interest rate | | | Maturity date | | | Principal | | | Value | |
| | | | |
| South Carolina (continued) | | | | | | | | | | | | | | | | |
South Carolina Jobs EDA York Preparatory Academy Project Series A (Education Revenue) | | | 7.25 | % | | | 11-1-2045 | | | $ | 1,500,000 | | | $ | 1,652,820 | |
South Carolina Public Service Authority Revenue Series A (Utilities Revenue, National Insured, Citibank NA LIQ) ø | | | 0.19 | | | | 1-1-2036 | | | | 10,000,000 | | | | 10,000,000 | |
| | | | |
| | | | | | | | | | | | | | | 34,068,620 | |
| | | | | | | | | | | | | | | | |
| | | | |
| South Dakota: 0.46% | | | | | | | | | | | | | | | | |
Rapid City SD Series A (Airport Revenue) | | | 6.75 | | | | 12-1-2031 | | | | 1,020,000 | | | | 1,167,023 | |
Rapid City SD Series A (Airport Revenue) | | | 7.00 | | | | 12-1-2035 | | | | 750,000 | | | | 861,390 | |
Sisseton-Wahpeton Sioux Tribe South Dakota Lake Traverse Reservation (Miscellaneous Revenue) | | | 7.00 | | | | 11-1-2023 | | | | 1,195,000 | | | | 1,219,115 | |
South Dakota EDFA Pooled Loan Program Spearfish Forest Series A (Miscellaneous Revenue) | | | 5.88 | | | | 4-1-2028 | | | | 2,350,000 | | | | 2,479,650 | |
South Dakota HEFA Regional Health (Health Revenue) | | | 4.25 | | | | 9-1-2024 | | | | 3,400,000 | | | | 3,634,464 | |
South Dakota HEFA Sanford Health Project (Health Revenue) | | | 5.50 | | | | 11-1-2040 | | | | 5,000,000 | | | | 5,575,000 | |
| | | | |
| | | | | | | | | | | | | | | 14,936,642 | |
| | | | | | | | | | | | | | | | |
| | | | |
| Tennessee: 0.67% | | | | | | | | | | | | | | | | |
Tennessee Energy Acquisition Corporation Series A (Utilities Revenue) | | | 5.25 | | | | 9-1-2024 | | | | 6,555,000 | | | | 7,742,176 | |
Tennessee Energy Acquisition Corporation Series A (Utilities Revenue) | | | 5.00 | | | | 2-1-2022 | | | | 3,090,000 | | | | 3,517,780 | |
Tennessee Energy Acquisition Corporation Series A (Utilities Revenue) | | | 5.25 | | | | 9-1-2026 | | | | 1,485,000 | | | | 1,760,289 | |
Tennessee Energy Acquisition Corporation Series C (Utilities Revenue) | | | 5.00 | | | | 2-1-2025 | | | | 6,385,000 | | | | 7,386,551 | |
Tennessee Energy Acquisition Corporation Series C (Utilities Revenue) | | | 5.00 | | | | 2-1-2027 | | | | 1,000,000 | | | | 1,160,670 | |
| | | | |
| | | | | | | | | | | | | | | 21,567,466 | |
| | | | | | | | | | | | | | | | |
| | | | |
| Texas: 8.34% | | | | | | | | | | | | | | | | |
Austin TX Airport System AMT (Airport Revenue) %% | | | 5.00 | | | | 11-15-2039 | | | | 8,000,000 | | | | 8,965,680 | |
Austin TX Airport System AMT (Airport Revenue) %% | | | 5.00 | | | | 11-15-2044 | | | | 3,500,000 | | | | 3,891,650 | |
Beasley TX Higher Education Finance Corporation Focus Learning Academy Series A (Education Revenue) | | | 7.75 | | | | 8-15-2041 | | | | 2,000,000 | | | | 2,092,160 | |
Central Texas Regional Mobility Authority Senior Lien (Transportation Revenue, National Insured) ± | | | 4.25 | | | | 1-1-2016 | | | | 440,000 | | | | 457,477 | |
Central Texas Regional Mobility Authority Senior Lien (Transportation Revenue) | | | 5.75 | | | | 1-1-2025 | | | | 2,000,000 | | | | 2,247,180 | |
Central Texas Regional Mobility Authority Senior Lien Series A (Transportation Revenue) | | | 5.00 | | | | 1-1-2033 | | | | 2,740,000 | | | | 3,026,631 | |
Dallas TX Independent School District School Building (GO, Permanent School Fund Insured) | | | 6.38 | | | | 2-15-2034 | | | | 10,000,000 | | | | 11,689,400 | |
Dallas-Fort Worth TX International Airport Facilities Series 2001-A1 (Industrial Development Revenue) | | | 6.15 | | | | 1-1-2016 | | | | 6,065,000 | | | | 6,147,787 | |
Grand Parkway Transportation Corporation Texas CAB Series B (Transportation Revenue) ¤ | | | 0.00 | | | | 10-1-2029 | | | | 1,015,000 | | | | 787,305 | |
Grand Parkway Transportation Corporation Texas CAB Series B (Transportation Revenue) ¤ | | | 0.00 | | | | 10-1-2030 | | | | 2,000,000 | | | | 1,549,880 | |
Harris County Houston TX Sports Authority Series A (Tax Revenue, National Insured) | | | 5.00 | | | | 11-15-2025 | | | | 795,000 | | | | 797,798 | |
Harris County Houston TX Sports Authority Series A (Tax Revenue, National Insured) | | | 5.00 | | | | 11-15-2028 | | | | 3,305,000 | | | | 3,316,634 | |
Houston TX Airport System Refunding Bond United Airlines Incorporated Terminal E Project (Airport Revenue) | | | 4.50 | | | | 7-1-2020 | | | | 4,000,000 | | | | 4,252,040 | |
Houston TX Housing Finance Corporation Cullen Park Apartments Series A (Housing Revenue, FNMA LIQ) | | | 5.70 | | | | 12-1-2033 | | | | 965,000 | | | | 974,959 | |
Houston TX Water Conveyance Systems Certificate of Participation Series H (Miscellaneous Revenue, Ambac Insured) | | | 7.50 | | | | 12-15-2015 | | | | 1,400,000 | | | | 1,470,602 | |
| | | | | | |
| Portfolio of investments—December 31, 2014 (unaudited) | | Wells Fargo Advantage Municipal Bond Fund | | | 21 | |
| | | | | | | | | | | | | | | | |
| Security name | | Interest rate | | | Maturity date | | | Principal | | | Value | |
| | | | |
| Texas (continued) | | | | | | | | | | | | | | | | |
La Vernia TX Higher Education Finance Corporation Lifeschool of Dallas Series A (Education Revenue) | | | 6.25 | % | | | 8-15-2021 | | | $ | 4,150,000 | | | $ | 5,039,013 | |
La Vernia TX Higher Education Finance Corporation Lifeschool of Dallas Series A (Education Revenue) | | | 7.50 | | | | 8-15-2041 | | | | 6,500,000 | | | | 8,254,415 | |
La Vernia TX Higher Education Finance Corporation Series A (Education Revenue) | | | 6.25 | | | | 2-15-2017 | | | | 480,000 | | | | 507,010 | |
Lewisville TX Combination Contract Revenue & Special Assessment Capital Improvement District #3 (Miscellaneous Revenue, ACA Insured) | | | 6.13 | | | | 9-1-2029 | | | | 3,300,000 | | | | 3,307,854 | |
Lewisville TX Combination Contract Revenue & Special Assessment Capital Improvement District #4 (Miscellaneous Revenue) | | | 6.75 | | | | 10-1-2032 | | | | 2,005,000 | | | | 2,094,182 | |
Lower Colorado TX River Authority Prerefunded Series A (Miscellaneous Revenue) | | | 6.50 | | | | 5-15-2037 | | | | 15,000 | | | | 17,690 | |
Lower Colorado TX River Authority Series A (Utilities Revenue) | | | 5.00 | | | | 5-15-2033 | | | | 2,475,000 | | | | 2,805,685 | |
Lower Colorado TX River Authority Series A (Utilities Revenue) | | | 5.00 | | | | 5-15-2036 | | | | 8,855,000 | | | | 9,791,062 | |
Lower Colorado TX River Authority Unrefunded Balance (Miscellaneous Revenue) | | | 6.50 | | | | 5-15-2037 | | | | 4,985,000 | | | | 5,088,190 | |
Lower Colorado TX River Authority Unrefunded Balance (Miscellaneous Revenue) | | | 7.25 | | | | 5-15-2037 | | | | 95,000 | | | | 97,267 | |
Mission TX Economic Development Corporation Solid Waste Disposal Revenue Bond Republic Services Incorporated Series A (Resource Recovery Revenue) ± | | | 0.30 | | | | 1-1-2020 | | | | 12,000,000 | | | | 12,000,000 | |
Newark TX ECFA A.W. Brown-Fellowship Leadership Academy Project Series A (Education Revenue) | | | 6.00 | | | | 8-15-2032 | | | | 1,750,000 | | | | 1,808,713 | |
Newark TX ECFA A.W. Brown-Fellowship Leadership Academy Project Series A (Education Revenue) | | | 6.00 | | | | 8-15-2042 | | | | 2,330,000 | | | | 2,407,822 | |
Port Arthur TX Navigation District Jefferson County Environmental Facilities Motiva Enterprises LLC Project Series D (Industrial Development Revenue) ø | | | 0.20 | | | | 11-1-2040 | | | | 10,000,000 | | | | 10,000,000 | |
Port Houston TX Authority Series D-1 (GO) | | | 5.00 | | | | 10-1-2035 | | | | 10,000,000 | | | | 11,417,100 | |
San Leanna TX Education Facilities Corporation Street Edwards University Project (Education Revenue) | | | 5.13 | | | | 6-1-2022 | | | | 1,735,000 | | | | 1,829,766 | |
San Leanna TX Education Facilities Corporation Street Edwards University Project (Education Revenue) | | | 5.13 | | | | 6-1-2023 | | | | 1,000,000 | | | | 1,051,750 | |
San Leanna TX Education Facilities Corporation Street Edwards University Project (Education Revenue) | | | 5.13 | | | | 6-1-2024 | | | | 750,000 | | | | 786,300 | |
Southeast Texas Housing Finance Corporation Mortgage-Backed Securities Program Series B (Housing Revenue, GNMA/FNMA Insured) | | | 6.00 | | | | 2-1-2036 | | | | 264,229 | | | | 272,626 | |
Southeast Texas Housing Finance Corporation Mortgage-Backed Securities Program Series B (Housing Revenue, GNMA/FNMA Insured) | | | 6.30 | | | | 10-1-2035 | | | | 154,266 | | | | 157,541 | |
Tarrant County TX Cultural Education Facilities Finance Corporation Air Force Village Obligation Group (Health Revenue) | | | 5.00 | | | | 5-15-2017 | | | | 1,400,000 | | | | 1,467,340 | |
Tarrant County TX Cultural Education Facilities Finance Corporation Series 2973 (Health Revenue, Morgan Stanley Bank LIQ) 144Aø | | | 0.24 | | | | 11-15-2029 | | | | 15,000,000 | | | | 15,000,000 | |
Tarrant County TX Cultural Education Facilities Finance Corporation Series 2974 (Health Revenue, Credit Suisse LIQ) 144Aø | | | 0.24 | | | | 11-15-2029 | | | | 3,200,000 | | | | 3,200,000 | |
Tarrant County TX Cultural Education Facilities Finance Corporation Texas Health Resources Series A (Health Revenue) | | | 5.00 | | | | 2-15-2023 | | | | 9,900,000 | | | | 10,716,354 | |
Tarrant County TX Cultural Education Facilities Finance Corporation Texas Health Resources Series B (Health Revenue) ø | | | 0.18 | | | | 11-15-2047 | | | | 10,000,000 | | | | 10,000,000 | |
Tarrant County TX Cultural Education Facilities Finance Corporation Texas Health Resources Series C (Health Revenue, JPMorgan Chase & Company SPA) ø | | | 0.14 | | | | 11-15-2033 | | | | 7,000,000 | | | | 7,000,000 | |
Texas Gas Supply SA Energy Acquisition Public Facilities Corporation (Utilities Revenue) | | | 5.50 | | | | 8-1-2023 | | | | 9,300,000 | | | | 11,110,617 | |
Texas Municipal Gas Acquisition & Supply Corporation II Series B (Utilities Revenue, JPMorgan Chase & Company Guaranteed) ± | | | 0.50 | | | | 9-15-2017 | | | | 12,165,000 | | | | 12,181,544 | |
Texas Municipal Gas Acquisition & Supply Corporation III (Utilities Revenue) | | | 5.00 | | | | 12-15-2024 | | | | 20,500,000 | | | | 23,242,695 | |
Texas Municipal Gas Acquisition & Supply Corporation III Gas Supply Revenue (Utilities Revenue) | | | 5.00 | | | | 12-15-2023 | | | | 11,250,000 | | | | 12,840,300 | |
| | | | |
| 22 | | Wells Fargo Advantage Municipal Bond Fund | | Portfolio of investments—December 31, 2014 (unaudited) |
| | | | | | | | | | | | | | | | |
| Security name | | Interest rate | | | Maturity date | | | Principal | | | Value | |
| | | | |
| Texas (continued) | | | | | | | | | | | | | | | | |
Texas Municipal Power Agency (Utilities Revenue, National Insured) ¤ | | | 0.00 | % | | | 9-1-2015 | | | $ | 40,000 | | | $ | 39,943 | |
Texas PFA Cosmos Foundation Series A (Education Revenue) | | | 5.00 | | | | 2-15-2018 | | | | 1,240,000 | | | | 1,247,279 | |
Texas Private Activity Surface Transportation Corporation Project NTE Mobility Partners Segments LLC (Transportation Revenue) | | | 6.75 | | | | 6-30-2043 | | | | 4,000,000 | | | | 4,857,520 | |
Texas Private Activity Surface Transportation Corporation Project NTE Mobility Partners Segments LLC (Transportation Revenue) | | | 7.00 | | | | 12-31-2038 | | | | 12,500,000 | | | | 15,539,125 | |
Texas Transportation Commission Highway Improvement (Miscellaneous Revenue) | | | 5.00 | | | | 4-1-2028 | | | | 7,280,000 | | | | 8,844,836 | |
Travis County TX Housing Finance Corporation Series A (Housing Revenue, GNMA Insured) | | | 6.35 | | | | 10-1-2034 | | | | 306,718 | | | | 309,969 | |
| | | | |
| | | | | | | | | | | | | | | 267,998,691 | |
| | | | | | | | | | | | | | | | |
| | | | |
| Utah: 0.49% | | | | | | | | | | | | | | | | |
Spanish Fork City UT Charter School American Leadership Academy (Education Revenue) 144A | | | 5.55 | | | | 11-15-2021 | | | | 1,160,000 | | | | 1,177,191 | |
Utah County UT Charter School Ronald Wilson Reagan Series A (Education Revenue) | | | 5.75 | | | | 2-15-2022 | | | | 725,000 | | | | 757,096 | |
Utah State Charter School Finance Authority Early Light Academy Project (Education Revenue) | | | 8.50 | | | | 7-15-2046 | | | | 6,480,000 | | | | 7,303,738 | |
Utah State Charter School Finance Authority Oquirrh Mountain Charter School Project (Education Revenue) | | | 8.00 | | | | 7-15-2030 | | | | 2,045,000 | | | | 2,250,093 | |
Utah State Charter School Finance Authority Oquirrh Mountain Charter School Project (Education Revenue) | | | 8.00 | | | | 7-15-2041 | | | | 3,910,000 | | | | 4,291,499 | |
| | | | |
| | | | | | | | | | | | | | | 15,779,617 | |
| | | | | | | | | | | | | | | | |
| | | | |
| Vermont: 1.47% | | | | | | | | | | | | | | | | |
Vermont Student Assistance Corporation Education Loan Revenue Series B (Education Revenue) ± | | | 1.16 | | | | 6-2-2042 | | | | 30,336,439 | | | | 30,293,330 | |
Vermont Student Assistance Corporation Education Loan Revenue Series B Class A2 (Education Revenue) ± | | | 3.24 | | | | 12-3-2035 | | | | 16,800,000 | | | | 16,897,272 | |
| | | | |
| | | | | | | | | | | | | | | 47,190,602 | |
| | | | | | | | | | | | | | | | |
| | | | |
| Virgin Islands: 0.30% | | | | | | | | | | | | | | | | |
Virgin Islands PFA Series C (Miscellaneous Revenue) | | | 5.00 | | | | 10-1-2018 | | | | 8,860,000 | | | | 9,696,030 | |
| | | | | | | | | | | | | | | | |
| | | | |
| Virginia: 1.14% | | | | | | | | | | | | | | | | |
Albemarle County VA Industrial Development Revenue Jefferson Scholars Foundation Project (Miscellaneous Revenue, SunTrust Bank LOC) ø | | | 0.22 | | | | 10-1-2037 | | | | 5,000,000 | | | | 5,000,000 | |
Dulles VA Town Center CDA (Miscellaneous Revenue) | | | 4.00 | | | | 3-1-2018 | | | | 2,025,000 | | | | 2,064,042 | |
Dulles VA Town Center CDA (Miscellaneous Revenue) | | | 4.00 | | | | 3-1-2019 | | | | 1,590,000 | | | | 1,614,279 | |
Dulles VA Town Center CDA (Miscellaneous Revenue) | | | 5.00 | | | | 3-1-2021 | | | | 1,395,000 | | | | 1,471,906 | |
Dulles VA Town Center CDA (Miscellaneous Revenue) | | | 5.00 | | | | 3-1-2022 | | | | 1,100,000 | | | | 1,160,808 | |
Fairfax County VA Public Improvement Series B (GO) | | | 5.00 | | | | 10-1-2024 | | | | 10,000,000 | | | | 12,624,900 | |
Fairfax County VA Redevelopment & Housing Authority Housing for the Elderly Series A (Housing Revenue, FHA Insured) | | | 6.00 | | | | 9-1-2016 | | | | 405,000 | | | | 406,551 | |
Marquis VA CDA CAB Series C (Tax Revenue) ¤(i) | | | 0.00 | | | | 9-1-2041 | | | | 1,824,000 | | | | 258,424 | |
Marquis VA CDA Series B (Tax Revenue) (i) | | | 5.63 | | | | 9-1-2041 | | | | 1,310,000 | | | | 1,242,260 | |
Prince William County VA County Facilities (Miscellaneous Revenue) | | | 5.00 | | | | 10-1-2024 | | | | 2,560,000 | | | | 3,120,538 | |
Reynolds Crossing VA CDA Reynolds Crossing Project (Miscellaneous Revenue) | | | 5.10 | | | | 3-1-2021 | | | | 1,627,000 | | | | 1,633,215 | |
Riverside VA Regional Jail Authority (Miscellaneous Revenue) | | | 5.00 | | | | 7-1-2025 | | | | 3,435,000 | | | | 4,015,893 | |
Virginia Resources Authority Unrefunded Balance Series A (Utilities Revenue, National Insured) | | | 5.50 | | | | 5-1-2016 | | | | 30,000 | | | | 30,131 | |
| | | | | | |
| Portfolio of investments—December 31, 2014 (unaudited) | | Wells Fargo Advantage Municipal Bond Fund | | | 23 | |
| | | | | | | | | | | | | | | | |
| Security name | | Interest rate | | | Maturity date | | | Principal | | | Value | |
| | | | |
| Virginia (continued) | | | | | | | | | | | | | | | | |
Watkins Centre VA CDA (Miscellaneous Revenue) | | | 5.40 | % | | | 3-1-2020 | | | $ | 845,000 | | | $ | 847,493 | |
Winchester VA IDA Winchester Medical Center Incorporated (Health Revenue, Ambac Insured) ± | | | 5.50 | | | | 1-1-2015 | | | | 715,000 | | | | 715,000 | |
Winchester VA IDA Winchester Medical Center Incorporated (Health Revenue, Ambac Insured) ± | | | 5.50 | | | | 1-1-2015 | | | | 515,000 | | | | 515,000 | |
| | | | |
| | | | | | | | | | | | | | | 36,720,440 | |
| | | | | | | | | | | | | | | | |
| | | | |
| Washington: 1.49% | | | | | | | | | | | | | | | | |
King County WA Multi-Modal Limited Tax (GO, State Street Bank & Trust Company SPA) ø | | | 0.03 | | | | 1-1-2040 | | | | 10,000,000 | | | | 10,000,000 | |
Spokane WA Housing Finance Commission Riverview Retirement Community Project (Health Revenue) | | | 5.00 | | | | 1-1-2023 | | | | 1,725,000 | | | | 1,871,608 | |
Washington Health Care Facilities Authority Central Washington (Health Revenue) | | | 7.00 | | | | 7-1-2039 | | | | 5,000,000 | | | | 5,861,350 | |
Washington Refunding Bond Series R (Miscellaneous Revenue) | | | 5.00 | | | | 7-1-2028 | | | | 24,640,000 | | | | 30,084,947 | |
| | | | |
| | | | | | | | | | | | | | | 47,817,905 | |
| | | | | | | | | | | | | | | | |
| | | | |
| West Virginia: 0.09% | | | | | | | | | | | | | | | | |
Ohio County WV Fort Henry Center Financing District Series A (Tax Revenue) | | | 5.00 | | | | 6-1-2015 | | | | 215,000 | | | | 216,419 | |
West Virginia Hospital Finance Authority Improvement Series D (Health Revenue, AGM Insured) | | | 5.50 | | | | 6-1-2033 | | | | 2,305,000 | | | | 2,541,493 | |
| | | | |
| | | | | | | | | | | | | | | 2,757,912 | |
| | | | | | | | | | | | | | | | |
| | | | |
| Wisconsin: 0.69% | | | | | | | | | | | | | | | | |
Milwaukee WI RDA Science Education Consortium Incorporated Project Series A (Education Revenue) | | | 6.00 | | | | 8-1-2033 | | | | 2,120,000 | | | | 2,392,547 | |
Milwaukee WI RDA Science Education Consortium Incorporated Project Series A (Education Revenue) | | | 6.25 | | | | 8-1-2043 | | | | 4,650,000 | | | | 5,284,167 | |
Wisconsin Center District Junior Dedicated Bond Series A (Tax Revenue) | | | 5.00 | | | | 12-15-2030 | | | | 1,395,000 | | | | 1,571,161 | |
Wisconsin HEFA Aurora Health Care Incorporated Series A (Health Revenue) | | | 5.25 | | | | 4-15-2024 | | | | 1,025,000 | | | | 1,154,734 | |
Wisconsin HEFA Series M (Health Revenue, National Insured) ±(n)(m) | | | 0.09 | | | | 6-1-2019 | | | | 7,000,000 | | | | 6,790,000 | |
Wisconsin PFA Carolina International School Series A (Education Revenue) 144A | | | 6.00 | | | | 8-1-2023 | | | | 470,000 | | | | 505,852 | |
Wisconsin PFA Carolina International School Series A (Education Revenue) 144A | | | 6.75 | | | | 8-1-2033 | | | | 1,430,000 | | | | 1,598,082 | |
Wisconsin PFA Carolina International School Series A (Education Revenue) 144A | | | 7.00 | | | | 8-1-2043 | | | | 1,575,000 | | | | 1,778,506 | |
Wisconsin PFA Carolina International School Series A (Education Revenue) 144A | | | 7.20 | | | | 8-1-2048 | | | | 940,000 | | | | 1,070,641 | |
| | | | |
| | | | | | | | | | | | | | | 22,145,690 | |
| | | | | | | | | | | | | | | | |
| | | | |
| Wyoming: 0.39% | | | | | | | | | | | | | | | | |
Sweetwater County WY Pollution Control Refunding PacifiCorp Project Series A (Industrial Development Revenue) ø | | | 0.22 | | | | 1-1-2017 | | | | 10,000,000 | | | | 10,000,000 | |
West Park Hospital District Wyoming Series B (Health Revenue) | | | 6.50 | | | | 6-1-2027 | | | | 500,000 | | | | 582,090 | |
Wyoming CDA (Education Revenue) | | | 6.50 | | | | 7-1-2043 | | | | 1,600,000 | | | | 1,837,808 | |
| | | | |
| | | | | | | | | | | | | | | 12,419,898 | |
| | | | | | | | | | | | | | | | |
| | | | |
Total Municipal Obligations (Cost $2,998,353,208) | | | | | | | | | | | | | | | 3,168,864,855 | |
| | | | | | | | | | | | | | | | |
| | | | |
Short-Term Investments: 1.58% | | | | | | | | | | | | | | | | |
| | | | |
| Commercial Paper: 0.47% | | | | | | | | | | | | | | | | |
Connecticut Development Authority Pollution Control | | | 0.27 | | | | 1-21-2015 | | | | 15,000,000 | | | | 15,000,000 | |
| | | | | | | | | | | | | | | | |
| | | | |
| 24 | | Wells Fargo Advantage Municipal Bond Fund | | Portfolio of investments—December 31, 2014 (unaudited) |
| | | | | | | | | | | | | | | | |
| Security name | | Yield | | | Maturity date | | | Shares | | | Value | |
| | | | |
| Investment Companies: 1.03% | | | | | | | | | | | | | | | | |
Wells Fargo Advantage National Tax-Free Money Market Fund,
Institutional Class (l)(u)## | | | 0.01 | % | | | | | | | 33,243,829 | | | $ | 33,243,829 | |
| | | | | | | | | | | | | | | | |
| | | | |
| | | | | | | | | Principal | | | | |
| U.S. Treasury Securities: 0.08% | | | | | | | | | | | | | | | | |
U.S. Treasury Bill #(z) | | | 0.02 | | | | 3-19-2015 | | | $ | 2,600,000 | | | | 2,599,904 | |
| | | | | | | | | | | | | | | | |
| Total Short-Term Investments (Cost $50,843,680) | | | | | | | | | | | | | | | 50,843,733 | |
| | | | | | | | | | | | | | | | |
| | | | | | | | |
| | |
| Total investments in securities (Cost $3,049,196,888) * | | | 100.25 | % | | | 3,219,708,588 | |
Other assets and liabilities, net | | | (0.25 | ) | | | (8,134,113 | ) |
| | | | | | | | |
| Total net assets | | | 100.00 | % | | $ | 3,211,574,475 | |
| | | | | | | | |
| ± | Variable rate investment. The rate shown is the rate in effect at period end. |
| 144A | The security may be resold in transactions exempt from registration, normally to qualified institutional buyers, pursuant to Rule 144A under the Securities Act of 1933. |
| (s) | The security is currently in default with regards to scheduled interest and/or principal payments. |
| (x) | Inverse floating rate security |
| (h) | Underlying security in an inverse floater structure |
| %% | The security is issued on a when-issued basis. |
| ø | Variable rate demand notes are subject to a demand feature which reduces the effective maturity. The maturity date shown represents the final maturity date of the security. The interest rate is determined and reset by the issuer daily, weekly, or monthly depending upon the terms of the security. The rate shown is the rate in effect at period end. |
| ¤ | The security is issued in zero coupon form with no periodic interest payments. |
| (m) | The security is an auction-rate security which has an interest rate that resets at predetermined short-term intervals through a Dutch auction. The rate shown is the rate in effect at period end. |
| (n) | The auction to set the interest rate on the security failed at period end due to insufficient investor interest. A failed auction does not itself cause a default. |
| (l) | The security represents an affiliate of the Fund as defined in the Investment Company Act of 1940. |
| (u) | The rate represents the 7-day annualized yield at period end. |
| ## | All or a portion of this security is segregated for when-issued securities. |
| # | All or a portion of this security is segregated as collateral for investments in derivative instruments. |
| (z) | Zero coupon security. The rate represents the current yield to maturity. |
| * | Cost for federal income tax purposes is $3,050,317,915 and unrealized gains (losses) consists of: |
| | | | |
Gross unrealized gains | | $ | 179,496,527 | |
Gross unrealized losses | | | (10,105,854 | ) |
| | | | |
Net unrealized gains | | $ | 169,390,673 | |
| | | | | | |
| Portfolio of investments—December 31, 2014 (unaudited) | | Wells Fargo Advantage Ultra Short-Term Municipal Income Fund | | | 1 | |
| | | | | | | | | | | | | | | | |
| Security name | | Interest rate | | | Maturity date | | | Principal | | | Value | |
| | | | |
| Agency Securities: 0.16% | | | | | | | | | | | | | | | | |
FHLMC Multifamily Variable Rate Demand Certificates Series M012 Class A1A | | | 5.50 | % | | | 8-15-2051 | | | $ | 7,000,000 | | | $ | 7,437,500 | |
FHLMC Series M012 Class A1A2 | | | 5.50 | | | | 8-15-2051 | | | | 2,300,000 | | | | 2,443,750 | |
| | | | |
Total Agency Securities (Cost $9,900,154) | | | | | | | | | | | | | | | 9,881,250 | |
| | | | | | | | | | | | | | | | |
| | | | |
Municipal Obligations: 98.01% | | | | | | | | | | | | | | | | |
| | | | |
| Alabama: 2.11% | | | | | | | | | | | | | | | | |
Alabama Health Care Authority for Baptist Health Series B (Health Revenue) ø | | | 0.50 | | | | 11-1-2042 | | | | 13,400,000 | | | | 13,400,000 | |
Alabama Health Care Authority for Baptist Health Series B (Health Revenue, AGM Insured) ±(m) | | | 0.65 | | | | 11-15-2037 | | | | 8,500,000 | | | | 8,500,000 | |
Alabama HFA MFHR The Plaza Centennial Hill Phase 2 Series C (Housing Revenue) ± | | | 0.55 | | | | 5-1-2017 | | | | 13,500,000 | | | | 13,489,740 | |
Alabama Port Authority Docks Facilities AMT Series A (Airport Revenue, National Insured) | | | 5.00 | | | | 10-1-2017 | | | | 2,000,000 | | | | 2,123,260 | |
Chatom AL Industrial Development Board Alabama Electric Series A (Utilities Revenue, National Rural Utilities Cooperative Finance Corporation SPA) ± | | | 0.45 | | | | 8-1-2037 | | | | 11,700,000 | | | | 11,699,883 | |
Chatom AL Industrial Development Board Gulf Opportunity Zone PowerSouth Energy Cooperative Projects Series A (Utilities Revenue, National Rural Utilities Finance Corporation SPA) ± | | | 0.45 | | | | 11-15-2038 | | | | 44,965,000 | | | | 44,961,403 | |
Jefferson County AL Sewer Sub Lien Series D (Water & Sewer Revenue) | | | 5.00 | | | | 10-1-2015 | | | | 500,000 | | | | 514,785 | |
Jefferson County AL Sewer Sub Lien Series D (Water & Sewer Revenue) | | | 5.00 | | | | 10-1-2016 | | | | 1,000,000 | | | | 1,064,150 | |
Jefferson County AL Sewer Sub Lien Series D (Water & Sewer Revenue) | | | 5.00 | | | | 10-1-2017 | | | | 1,750,000 | | | | 1,905,453 | |
Jefferson County AL Warrants Series A (GO) | | | 4.90 | | | | 4-1-2021 | | | | 22,355,000 | | | | 24,101,596 | |
Mobile AL Industrial Development Board PCR Alabama Power Company Barry Plant (Industrial Development Revenue) ± | | | 0.32 | | | | 7-15-2034 | | | | 11,000,000 | | | | 11,003,080 | |
| | | | |
| | | | | | | | | | | | | | | 132,763,350 | |
| | | | | | | | | | | | | | | | |
| | | | |
| Alaska: 0.05% | | | | | | | | | | | | | | | | |
Alaska Railroad Corporation Capital Grant Receipt Section 5307 & 5309 Formula Funds (Miscellaneous Revenue, National Insured) | | | 5.00 | | | | 8-1-2015 | | | | 2,000,000 | | | | 2,052,620 | |
North Slope Borough AK Water & Wastewater Facilities Service (Water & Sewer Revenue) | | | 4.00 | | | | 6-30-2018 | | | | 1,125,000 | | | | 1,220,580 | |
| | | | |
| | | | | | | | | | | | | | | 3,273,200 | |
| | | | | | | | | | | | | | | | |
| | | | |
| Arizona: 1.09% | | | | | | | | | | | | | | | | |
Glendale AZ (GO) | | | 4.00 | | | | 7-1-2015 | | | | 5,645,000 | | | | 5,744,408 | |
Navajo County AZ Pollution Control Corporation Arizona Public Company Cholla Series A (Industrial Development Revenue) ± | | | 0.45 | | | | 6-1-2034 | | | | 2,250,000 | | | | 2,249,190 | |
Scottsdale AZ IDA Healthcare Series A (Health Revenue) | | | 5.00 | | | | 9-1-2016 | | | | 3,000,000 | | | | 3,205,530 | |
Scottsdale AZ IDA Healthcare Series F (Health Revenue, AGM Insured) ±(m) | | | 1.25 | | | | 9-1-2045 | | | | 53,375,000 | | | | 53,375,000 | |
University of Arizona Medical Center Corporation (Health Revenue) | | | 4.00 | | | | 7-1-2015 | | | | 490,000 | | | | 497,213 | |
University of Arizona Medical Center Corporation (Health Revenue) | | | 5.00 | | | | 7-1-2016 | | | | 700,000 | | | | 737,597 | |
University of Arizona Medical Center Corporation (Health Revenue) | | | 5.00 | | | | 7-1-2017 | | | | 545,000 | | | | 588,142 | |
Yavapai County AZ IDA Waste Management Incorporated Project Series A2 (Resource Recovery Revenue) ± | | | 0.63 | | | | 3-1-2028 | | | | 2,450,000 | | | | 2,450,662 | |
| | | | |
| | | | | | | | | | | | | | | 68,847,742 | |
| | | | | | | | | | | | | | | | |
| | | | |
| Arkansas: 0.04% | | | | | | | | | | | | | | | | |
Arkansas Development Finance Authority Police Headquarters & Wireless Data Equipment Project (Miscellaneous Revenue, AGM Insured) | | | 4.00 | | | | 6-1-2017 | | | | 850,000 | | | | 910,937 | |
Arkansas Development Finance Authority Police Headquarters & Wireless Data Equipment Project (Miscellaneous Revenue, AGM Insured) | | | 4.00 | | | | 6-1-2018 | | | | 500,000 | | | | 544,500 | |
| | | | |
| 2 | | Wells Fargo Advantage Ultra Short-Term Municipal Income Fund | | Portfolio of investments—December 31, 2014 (unaudited) |
| | | | | | | | | | | | | | | | |
| Security name | | Interest rate | | | Maturity date | | | Principal | | | Value | |
| | | | |
| Arkansas (continued) | | | | | | | | | | | | | | | | |
Springdale AR Sales & Use Tax Refunding & Improvement (Tax Revenue) | | | 2.00 | % | | | 11-1-2016 | | | $ | 840,000 | | | $ | 861,706 | |
| | | | |
| | | | | | | | | | | | | | | 2,317,143 | |
| | | | | | | | | | | | | | | | |
| | | | |
| California: 9.10% | | | | | | | | | | | | | | | | |
Acalanes CA Union High School District BAN (GO) | | | 5.00 | | | | 8-1-2017 | | | | 4,500,000 | | | | 4,975,110 | |
Bay Area Toll Authority California San Francisco Bay Area Toll Bridge Series A (Transportation Revenue) ± | | | 1.00 | | | | 4-1-2047 | | | | 28,500,000 | | | | 28,536,480 | |
Bay Area Toll Authority California San Francisco Bay Area Toll Bridge Series C (Transportation Revenue) ± | | | 0.96 | | | | 4-1-2045 | | | | 1,500,000 | | | | 1,518,735 | |
California (GO) ± | | | 4.00 | | | | 12-1-2026 | | | | 86,860,000 | | | | 91,281,174 | |
California (GO) ± | | | 4.00 | | | | 12-1-2027 | | | | 3,800,000 | | | | 4,073,220 | |
California Administrative Services Sacramento Unified School District (Miscellaneous Revenue, Ambac Insured) ± | | | 1.16 | | | | 1-1-2017 | | | | 1,195,000 | | | | 1,193,841 | |
California HFFA San Diego Hospital Series A (Health Revenue, National Insured) ±(n)(m) | | | 0.07 | | | | 7-15-2018 | | | | 3,600,000 | | | | 3,402,000 | |
California Infrastructure & Economic Development Bank The J. Paul Getty Trust Series A-2 (Miscellaneous Revenue) ± | | | 0.32 | | | | 4-1-2038 | | | | 9,000,000 | | | | 9,008,460 | |
California Infrastructure & Economic Development Bank The J. Paul Getty Trust Series A-3 (Miscellaneous Revenue) ± | | | 0.32 | | | | 4-1-2038 | | | | 15,600,000 | | | | 15,614,664 | |
California Infrastructure & Economic Development Bank The J. Paul Getty Trust Series A-4 (Miscellaneous Revenue) ± | | | 0.33 | | | | 4-1-2038 | | | | 32,000,000 | | | | 32,030,080 | |
California Municipal Finance Authority Northbay Healthcare Series A (Health Revenue) ± | | | 2.14 | | | | 11-1-2027 | | | | 9,000,000 | | | | 9,020,610 | |
California Municipal Finance Authority Northbay Healthcare Series B (Health Revenue) | | | 5.00 | | | | 11-1-2015 | | | | 1,455,000 | | | | 1,499,654 | |
California Municipal Finance Authority Republic Services (Resource Recovery Revenue) ø | | | 0.30 | | | | 9-1-2021 | | | | 2,850,000 | | | | 2,850,000 | |
California PCFA Solid Waste Disposal Series A (Resource Recovery Revenue) 144A± | | | 0.40 | | | | 8-1-2023 | | | | 15,705,000 | | | | 15,704,686 | |
California PCFA Waste Management Services Incorporated Series A1 (Resource Recovery Revenue) ± | | | 1.88 | | | | 4-1-2025 | | | | 1,000,000 | | | | 1,003,260 | |
California PFOTER 4369 (GO, AGM Insured, Dexia Credit Local LIQ) ø | | | 0.23 | | | | 8-1-2032 | | | | 10,560,000 | | | | 10,560,000 | |
California PFOTER Series DCL-009 (GO, Dexia Credit Local LOC, AGM Insured) 144Aø | | | 0.24 | | | | 8-1-2027 | | | | 13,570,000 | | | | 13,570,000 | |
California PFOTER Series DCL-011 (GO, Dexia Credit Local LOC, AGM Insured) 144Aø | | | 0.24 | | | | 8-1-2027 | | | | 10,945,000 | | | | 10,945,000 | |
California Public Works Board Department of Corrections Project Series A (Miscellaneous Revenue, Ambac Insured) | | | 5.00 | | | | 12-1-2019 | | | | 1,295,000 | | | | 1,435,119 | |
California Refunding Series A (Miscellaneous Revenue) ± | | | 0.72 | | | | 5-1-2033 | | | | 6,000,000 | | | | 6,007,500 | |
California Statewide CDA Buck Institute for Research (Miscellaneous Revenue) | | | 3.00 | | | | 11-15-2016 | | | | 250,000 | | | | 260,355 | |
California Statewide CDA Buck Institute for Research (Miscellaneous Revenue) | | | 4.00 | | | | 11-15-2017 | | | | 260,000 | | | | 281,624 | |
California Statewide CDA Buck Institute for Research (Miscellaneous Revenue) | | | 5.00 | | | | 11-15-2018 | | | | 275,000 | | | | 311,740 | |
California Statewide CDA Health Facilities Catholic Series D (Health Revenue, AGM Insured) ±(m) | | | 0.59 | | | | 7-1-2041 | | | | 36,900,000 | | | | 36,900,000 | |
California Statewide CDA Health Facilities Catholic Series E (Health Revenue, AGM Insured) ±(m) | | | 0.65 | | | | 7-1-2040 | | | | 28,600,000 | | | | 28,600,000 | |
California Statewide CDA Health Facilities Catholic Series F (Health Revenue, AGM Insured) ±(m) | | | 0.65 | | | | 7-1-2040 | | | | 7,025,000 | | | | 7,025,000 | |
California Statewide CDA Thomas Jefferson School of Law Series B (Education Revenue) | | | 4.88 | | | | 10-1-2031 | | | | 3,745,000 | | | | 3,858,399 | |
Compton CA Series A (GO) | | | 2.75 | | | | 6-1-2015 | | | | 4,210,000 | | | | 4,209,158 | |
Contra Costa County CA Transportation Authority Series A (Tax Revenue) ± | | | 0.47 | | | | 3-1-2034 | | | | 29,000,000 | | | | 29,022,040 | |
Golden State Tobacco Securitization Corporation California Series 2954 (Tobacco Revenue, Morgan Stanley Bank LIQ) 144Aø | | | 0.59 | | | | 6-1-2047 | | | | 25,000,000 | | | | 25,000,000 | |
Hemet CA Unified School District Certificate of Participation (Miscellaneous Revenue) ø | | | 0.69 | | | | 10-1-2036 | | | | 3,400,000 | | | | 3,399,966 | |
JPMorgan Chase Putters Drivers Trust Series 4483Z California Statewide CDA Kaiser Permanente Series A (Health Revenue, JPMorgan Chase & Company LIQ) 144Aø | | | 0.19 | | | | 10-1-2020 | | | | 6,050,000 | | | | 6,050,000 | |
Kern County CA Housing Authority MFHR Jasmine Heights Apartments (Housing Revenue, FHA Insured) | | | 0.55 | | | | 3-1-2016 | | | | 3,900,000 | | | | 3,901,092 | |
| | | | | | |
| Portfolio of investments—December 31, 2014 (unaudited) | | Wells Fargo Advantage Ultra Short-Term Municipal Income Fund | | | 3 | |
| | | | | | | | | | | | | | | | |
| Security name | | Interest rate | | | Maturity date | | | Principal | | | Value | |
| | | | |
| California (continued) | | | | | | | | | | | | | | | | |
Los Angeles County CA Metropolitan Transportation Authority Series A (Tax Revenue) | | | 5.00 | % | | | 7-1-2015 | | | $ | 3,000,000 | | | $ | 3,073,470 | |
Los Angeles County CA Metropolitan Transportation Authority Series A (Tax Revenue) | | | 5.00 | | | | 7-1-2016 | | | | 3,280,000 | | | | 3,512,618 | |
Merrill Lynch PFOTER Series PT-4211 (GO, Dexia Credit Local SPA) 144Aø | | | 0.23 | | | | 2-1-2025 | | | | 7,970,000 | | | | 7,970,000 | |
Northern California Gas Authority #1 LIBOR Series B (Utilities Revenue) ± | | | 0.76 | | | | 7-1-2017 | | | | 35,510,000 | | | | 35,308,658 | |
Oxnard CA Harbor District Series A (Airport Revenue) | | | 5.00 | | | | 8-1-2016 | | | | 1,150,000 | | | | 1,218,908 | |
Palomar Pomerado CA Health Care District Certificate of Participation Series A (Health Revenue, AGM Insured) ±(m) | | | 1.25 | | | | 11-1-2036 | | | | 27,900,000 | | | | 27,900,000 | |
Palomar Pomerado CA Health Care District Certificate of Participation Series B (Health Revenue, AGM Insured) ±(m) | | | 1.10 | | | | 11-1-2036 | | | | 29,050,000 | | | | 29,050,000 | |
Palomar Pomerado CA Health Care District Certificate of Participation Series C (Health Revenue, AGM Insured) ±(m) | | | 1.35 | | | | 11-1-2036 | | | | 21,150,000 | | | | 21,150,000 | |
Sacramento CA SFMR PFOTER 2327 (Housing Revenue, FNMA/GNMA Insured, Dexia Credit Local SPA) 144Aø | | | 0.18 | | | | 10-1-2023 | | | | 7,695,000 | | | | 7,695,000 | |
San Joaquin Hills CA Transportation Corridor Agency Toll Road Capital Convertible Appreciation Series A (Transportation Revenue) | | | 5.65 | | | | 1-15-2017 | | | | 3,000,000 | | | | 3,035,250 | |
San Joaquin Hills CA Transportation Corridor Agency Toll Road Capital Convertible Appreciation Series A (Transportation Revenue) | | | 5.75 | | | | 1-15-2021 | | | | 3,000,000 | | | | 3,035,370 | |
San Joaquin Hills County CA Transportation Corridor Agency CAB Series A (Transportation Revenue, National Insured) ¤ | | | 0.00 | | | | 1-15-2015 | | | | 2,000,000 | | | | 1,999,460 | |
San Jose CA MFHR Parkview Family Apartments Series B (Housing Revenue) | | | 0.55 | | | | 6-1-2016 | | | | 13,600,000 | | | | 13,597,416 | |
Windsor CA Redevelopment Successor Refunding Agency Windsor Redevelopment Project (Tax Revenue) | | | 2.00 | | | | 9-1-2016 | | | | 1,095,000 | | | | 1,112,553 | |
| | | | |
| | | | | | | | | | | | | | | 572,707,670 | |
| | | | | | | | | | | | | | | | |
| | | | |
| Colorado: 0.93% | | | | | | | | | | | | | | | | |
Arapahoe County CO IDK Partners I Trust Series A Class A (Housing Revenue, GNMA Insured) | | | 5.25 | | | | 11-1-2019 | | | | 8,875 | | | | 8,931 | |
Arkansas River Power Authority Colorado PFOTER PT-3575 (Utilities Revenue, Syncora Guarantee Incorporated Insured, Dexia Credit Local LIQ) 144Aø | | | 0.29 | | | | 10-1-2021 | | | | 8,455,000 | | | | 8,455,000 | |
Colorado Springs CO Utilities Various Sub Lien Improvement Series B (Utilities Revenue, Bayerische Landesbank SPA) ø | | | 0.26 | | | | 11-1-2036 | | | | 22,665,000 | | | | 22,665,000 | |
Denver CO City & County Airport Sub Series A (Airport Revenue) | | | 4.00 | | | | 11-15-2015 | | | | 200,000 | | | | 206,682 | |
Denver CO City & County Airport Sub Series A (Airport Revenue) | | | 4.00 | | | | 11-15-2016 | | | | 450,000 | | | | 478,355 | |
Denver CO City & County Airport Sub Series A (Airport Revenue) | | | 5.00 | | | | 11-15-2016 | | | | 250,000 | | | | 270,168 | |
Denver CO City & County Airport Sub Series A (Airport Revenue) | | | 5.00 | | | | 11-15-2017 | | | | 400,000 | | | | 444,980 | |
Denver CO City & County Airport Sub Series A (Airport Revenue) | | | 5.00 | | | | 11-15-2018 | | | | 500,000 | | | | 567,155 | |
Denver CO City & County Airport Sub Series B (Airport Revenue) | | | 3.00 | | | | 11-15-2015 | | | | 100,000 | | | | 102,405 | |
Denver CO City & County Airport Sub Series B (Airport Revenue) | | | 5.00 | | | | 11-15-2017 | | | | 600,000 | | | | 668,640 | |
Denver CO City & County Airport Sub Series B (Airport Revenue) | | | 5.00 | | | | 11-15-2018 | | | | 600,000 | | | | 683,382 | |
Denver CO City & County Airport Sub Series F2 (Airport Revenue, AGM Insured) ±(m) | | | 0.65 | | | | 11-15-2025 | | | | 5,525,000 | | | | 5,525,000 | |
E 470 Colorado Public Highway Authority Senior SIFMA Index Series A (Transportation Revenue) ± | | | 1.22 | | | | 9-1-2039 | | | | 11,700,000 | | | | 11,710,530 | |
University of Colorado Enterprise System Series 2007-A (Education Revenue, National Insured, Dexia Credit Local LIQ) ø | | | 0.13 | | | | 6-1-2026 | | | | 6,690,000 | | | | 6,690,000 | |
| | | | |
| | | | | | | | | | | | | | | 58,476,228 | |
| | | | | | | | | | | | | | | | |
| | | | |
| Connecticut: 2.46% | | | | | | | | | | | | | | | | |
Connecticut Economic Recovery Notes Series A-1 (GO) ± | | | 0.28 | | | | 7-1-2016 | | | | 8,745,000 | | | | 8,745,000 | |
Connecticut Economic Recovery Notes Series A-2 (GO) ± | | | 0.32 | | | | 1-1-2017 | | | | 15,000,000 | | | | 15,000,000 | |
Connecticut Economic Recovery Notes Series A-3 (GO) ± | | | 0.32 | | | | 7-1-2017 | | | | 20,000,000 | | | | 20,000,000 | |
| | | | |
| 4 | | Wells Fargo Advantage Ultra Short-Term Municipal Income Fund | | Portfolio of investments—December 31, 2014 (unaudited) |
| | | | | | | | | | | | | | | | |
| Security name | | Interest rate | | | Maturity date | | | Principal | | | Value | |
| | | | |
| Connecticut (continued) | | | | | | | | | | | | | | | | |
Connecticut Health & Education Facilities Authority Lawrence & Memorial Hospital Series F (Health Revenue) | | | 4.00 | % | | | 7-1-2017 | | | $ | 1,880,000 | | | $ | 2,012,145 | |
Connecticut Series A (Miscellaneous Revenue) ± | | | 0.46 | | | | 3-1-2018 | | | | 2,875,000 | | | | 2,871,148 | |
Connecticut Series A (Miscellaneous Revenue) ± | | | 0.74 | | | | 3-1-2016 | | | | 25,000,000 | | | | 25,023,750 | |
Connecticut Series A (GO) ± | | | 0.96 | | | | 5-15-2018 | | | | 7,000,000 | | | | 7,112,630 | |
Connecticut Series D (Miscellaneous Revenue) ± | | | 0.49 | | | | 8-15-2015 | | | | 12,000,000 | | | | 12,019,080 | |
Connecticut Series D (Miscellaneous Revenue) ± | | | 0.63 | | | | 8-15-2016 | | | | 5,500,000 | | | | 5,532,340 | |
Connecticut Series D (Miscellaneous Revenue) ± | | | 0.73 | | | | 8-15-2017 | | | | 14,855,000 | | | | 14,996,271 | |
Connecticut Series D (Miscellaneous Revenue) ± | | | 0.92 | | | | 8-15-2018 | | | | 6,000,000 | | | | 6,091,140 | |
Hamden CT BAN (GO) | | | 1.25 | | | | 8-20-2015 | | | | 5,200,000 | | | | 5,217,784 | |
New Britain CT (GO, Ambac Insured) | | | 5.00 | | | | 4-15-2017 | | | | 1,165,000 | | | | 1,267,147 | |
New Britain CT BAN Series B (GO) | | | 2.00 | | | | 3-26-2015 | | | | 9,000,000 | | | | 9,026,460 | |
New Haven CT (GO, Ambac Insured) | | | 5.00 | | | | 11-1-2016 | | | | 6,250,000 | | | | 6,697,313 | |
New Haven CT Series A (GO) | | | 5.00 | | | | 8-1-2015 | | | | 3,000,000 | | | | 3,078,180 | |
New Haven CT Series A (GO) | | | 5.00 | | | | 8-1-2016 | | | | 5,680,000 | | | | 6,060,106 | |
Waterbury CT (GO) | | | 4.00 | | | | 2-1-2016 | | | | 850,000 | | | | 881,841 | |
Waterbury CT (GO) | | | 5.00 | | | | 2-1-2017 | | | | 1,350,000 | | | | 1,463,670 | |
Waterbury CT (GO) | | | 5.00 | | | | 2-1-2018 | | | | 1,215,000 | | | | 1,354,105 | |
| | | | |
| | | | | | | | | | | | | | | 154,450,110 | |
| | | | | | | | | | | | | | | | |
| | | | |
| District of Columbia: 0.59% | | | | | | | | | | | | | | | | |
District of Columbia HFA MFHR Gregory Apartments Project (Housing Revenue) | | | 0.40 | | | | 2-1-2016 | | | | 7,200,000 | | | | 7,200,936 | |
District of Columbia Income Tax Refunding Secured Series B (Tax Revenue) ± | | | 0.64 | | | | 12-1-2015 | | | | 30,000,000 | | | | 30,073,200 | |
| | | | |
| | | | | | | | | | | | | | | 37,274,136 | |
| | | | | | | | | | | | | | | | |
| | | | |
| Florida: 2.76% | | | | | | | | | | | | | | | | |
Collier County FL IDA Maria Utility Company Project (Water & Sewer Revenue, SunTrust Bank LOC) ø | | | 0.23 | | | | 10-1-2035 | | | | 6,200,000 | | | | 6,200,000 | |
Florida Housing Finance Corporation Crossings-Indian Run Apartments Series G (Housing Revenue) | | | 0.55 | | | | 6-1-2016 | | | | 7,000,000 | | | | 7,000,420 | |
Florida PFOTER 4638 (Miscellaneous Revenue, Dexia Credit Local LIQ) 144Aø | | | 0.21 | | | | 7-1-2036 | | | | 43,580,000 | | | | 43,580,000 | |
Florida Space Coast Infrastructure Agency I-95 Brevard County DBF Project (Industrial Development Revenue) | | | 3.00 | | | | 12-15-2015 | | | | 1,660,000 | | | | 1,693,466 | |
Gulf Breeze FL Local Government Loan Series FG&H (Miscellaneous Revenue) ± | | | 1.75 | | | | 12-1-2020 | | | | 7,500,000 | | | | 7,529,250 | |
Gulf Breeze FL Local Government Loan Series K (Miscellaneous Revenue) ± | | | 1.40 | | | | 12-1-2020 | | | | 1,000,000 | | | | 1,007,650 | |
Hernando County FL Criminal Justice Complex Financing (Miscellaneous Revenue, National Insured) ± | | | 7.65 | | | | 7-1-2016 | | | | 11,175,000 | | | | 12,298,982 | |
Lakeland FL Energy System (Utilities Revenue) ± | | | 0.79 | | | | 10-1-2017 | | | | 5,220,000 | | | | 5,241,872 | |
Lee County FL IDA Shell Point Alliance Community Project (Health Revenue) | | | 5.00 | | | | 11-15-2015 | | | | 2,245,000 | | | | 2,320,365 | |
Lee County FL Solid Waste System Series A (Resource Recovery Revenue, Ambac Insured) | | | 5.00 | | | | 10-1-2016 | | | | 4,535,000 | | | | 4,814,084 | |
Miami-Dade County FL Expressway Authority Toll System (Transportation Revenue, AGM Insured, Citibank NA LIQ) 144Aø | | | 0.24 | | | | 7-1-2018 | | | | 330,000 | | | | 330,000 | |
Miami-Dade County FL Expressway Authority Toll System (Transportation Revenue, Dexia Credit Local LOC, Ambac Insured, Dexia Credit Local LIQ) 144Aø | | | 0.46 | | | | 8-1-2028 | | | | 3,330,000 | | | | 3,330,000 | |
Miami-Dade County FL Expressway Authority Toll System (Transportation Revenue, Dexia Credit Local LOC, Dexia Credit Local LIQ) 144Aø | | | 0.47 | | | | 10-13-2023 | | | | 6,320,000 | | | | 6,320,000 | |
Miami-Dade County FL Expressway Authority Toll System (Transportation Revenue, Dexia Credit Local LOC, Ambac Insured, Dexia Credit Local LIQ) 144Aø | | | 0.62 | | | | 3-8-2030 | | | | 6,135,000 | | | | 6,135,000 | |
Miami-Dade County FL Expressway Authority Toll System Series DCL-2012-003 (Transportation Revenue, Dexia Credit Local LOC, Ambac Insured, Dexia Credit Local LIQ) 144Aø | | | 0.47 | | | | 3-8-2026 | | | | 16,860,000 | | | | 16,860,000 | |
| | | | | | |
| Portfolio of investments—December 31, 2014 (unaudited) | | Wells Fargo Advantage Ultra Short-Term Municipal Income Fund | | | 5 | |
| | | | | | | | | | | | | | | | |
| Security name | | Interest rate | | | Maturity date | | | Principal | | | Value | |
| | | | |
| Florida (continued) | | | | | | | | | | | | | | | | |
Miami-Dade County FL HFA MFHR Golfside Villas Apartment Project (Housing Revenue) | | | 0.55 | % | | | 5-1-2016 | | | $ | 5,500,000 | | | $ | 5,498,845 | |
Miami-Dade County FL International Airport Aviation Series 2008-1139X (Airport Revenue, AGM Insured, Bank of America NA LIQ) 144Aø | | | 0.39 | | | | 10-1-2033 | | | | 7,500,000 | | | | 7,500,000 | |
Miami-Dade County FL School Board Master Equipment Lease Purchase (Miscellaneous Revenue) 144A | | | 3.59 | | | | 3-3-2016 | | | | 4,232,825 | | | | 4,247,302 | |
Okeechobee County FL Disposal Waste Management Landfill Series A (Resource Recovery Revenue) ± | | | 2.25 | | | | 7-1-2039 | | | | 2,250,000 | | | | 2,315,453 | |
Orange County FL Health Facilities Unrefunded Balance-2006 Series A (Health Revenue, National Insured) | | | 6.25 | | | | 10-1-2016 | | | | 945,000 | | | | 997,476 | |
Palm Beach County FL School Board Series A (Miscellaneous Revenue) ± | | | 5.00 | | | | 8-1-2032 | | | | 5,250,000 | | | | 5,613,983 | |
Pasco County FL School Board Certificates Series B (Miscellaneous Revenue, Ambac Insured) ±(m) | | | 0.90 | | | | 8-1-2030 | | | | 19,100,000 | | | | 19,100,000 | |
Pasco County FL School District (Tax Revenue) | | | 3.00 | | | | 10-1-2016 | | | | 1,250,000 | | | | 1,302,463 | |
Pinellas County FL HFA Clearwater Apartment Project (Housing Revenue) ± | | | 0.35 | | | | 1-1-2016 | | | | 2,500,000 | | | | 2,499,750 | |
| | | | |
| | | | | | | | | | | | | | | 173,736,361 | |
| | | | | | | | | | | | | | | | |
| | | | |
| Georgia: 2.12% | | | | | | | | | | | | | | | | |
Burke County GA Development Authority Georgia Power Company Plant Vogtle Project Series 2012 (Utilities Revenue) ± | | | 1.75 | | | | 12-1-2049 | | | | 4,600,000 | | | | 4,666,838 | |
Burke County GA Development Authority Georgia Power Company Vogtle Plant Project (Industrial Development Revenue) ± | | | 1.75 | | | | 12-1-2049 | | | | 5,100,000 | | | | 5,174,103 | |
Georgia Series G (GO) ± | | | 0.44 | | | | 12-1-2026 | | | | 106,305,000 | | | | 106,218,893 | |
Main Street Natural Gas Incorporated Georgia Gas Project Series B (Utilities Revenue) | | | 5.00 | | | | 3-15-2016 | | | | 1,775,000 | | | | 1,859,632 | |
Monroe County GA Development Authority Georgia Power Company Scherer 1st Series (Industrial Development Revenue) ø | | | 0.12 | | | | 7-1-2049 | | | | 7,200,000 | | | | 7,200,000 | |
Private Colleges & Universities Authority Georgia Mercer University Series A (Education Revenue) | | | 4.00 | | | | 10-1-2016 | | | | 1,500,000 | | | | 1,580,805 | |
Savannah GA EDA Exempt Facilities Home Depot Project Series B (Industrial Development Revenue, SunTrust Bank LOC) ø | | | 0.23 | | | | 8-1-2025 | | | | 6,400,000 | | | | 6,400,000 | |
| | | | |
| | | | | | | | | | | | | | | 133,100,271 | |
| | | | | | | | | | | | | | | | |
| | | | |
| Guam: 0.08% | | | | | | | | | | | | | | | | |
Guam International Airport Authority Series 2013A (Airport Revenue) | | | 5.00 | | | | 10-1-2017 | | | | 850,000 | | | | 938,324 | |
Guam International Airport Authority Series A (Airport Revenue) | | | 4.00 | | | | 10-1-2015 | | | | 300,000 | | | | 308,217 | |
Guam International Airport Authority Series B (Airport Revenue) | | | 4.00 | | | | 10-1-2015 | | | | 540,000 | | | | 554,791 | |
Guam International Airport Authority Series C (Airport Revenue) | | | 5.00 | | | | 10-1-2017 | | | | 2,750,000 | | | | 3,004,403 | |
| | | | |
| | | | | | | | | | | | | | | 4,805,735 | |
| | | | | | | | | | | | | | | | |
| | | | |
| Hawaii: 0.02% | | | | | | | | | | | | | | | | |
Hawaii Department of Transportation Airports Division Lease AMT (Miscellaneous Revenue) | | | 4.00 | | | | 8-1-2018 | | | | 1,000,000 | | | | 1,067,430 | |
Hawaii Department of Transportation Airports Division Lease AMT (Miscellaneous Revenue) | | | 5.00 | | | | 8-1-2017 | | | | 425,000 | | | | 466,064 | |
| | | | |
| | | | | | | | | | | | | | | 1,533,494 | |
| | | | | | | | | | | | | | | | |
| | | | |
| Idaho: 0.22% | | | | | | | | | | | | | | | | |
Idaho Housing & Finance Association Series A (Housing Revenue, FNMA LOC) ø | | | 0.29 | | | | 1-1-2038 | | | | 14,045,000 | | | | 14,045,000 | |
| | | | | | | | | | | | | | | | |
| | | | |
| Illinois: 9.72% | | | | | | | | | | | | | | | | |
BB&T Municipal Trust Class C (GO, Rabobank LOC) ø | | | 0.54 | | | | 12-1-2015 | | | | 15,599,702 | | | | 15,599,702 | |
Belleville IL Series B (GO) ø | | | 2.25 | | | | 1-1-2015 | | | | 1,530,000 | | | | 1,530,000 | |
| | | | |
| 6 | | Wells Fargo Advantage Ultra Short-Term Municipal Income Fund | | Portfolio of investments—December 31, 2014 (unaudited) |
| | | | | | | | | | | | | | | | |
| Security name | | Interest rate | | | Maturity date | | | Principal | | | Value | |
| | | | |
| Illinois (continued) | | | | | | | | | | | | | | | | |
Chicago IL (GO, National Insured) ¤ | | | 0.00 | % | | | 1-1-2015 | | | $ | 13,500,000 | | | $ | 13,500,000 | |
Chicago IL (GO, National Insured) | | | 5.25 | | | | 1-1-2017 | | | | 500,000 | | | | 537,220 | |
Chicago IL Board of Education Series 2012-001 (GO, Dexia Credit Local LIQ) 144Aø | | | 0.56 | | | | 12-1-2034 | | | | 40,000,000 | | | | 40,000,000 | |
Chicago IL Board of Education Series A (GO, Ambac Insured) ¤ | | | 0.00 | | | | 12-1-2016 | | | | 6,845,000 | | | | 6,612,544 | |
Chicago IL Board of Education Series A (GO, National Insured) ¤ | | | 0.00 | | | | 12-1-2018 | | | | 5,000,000 | | | | 4,563,900 | |
Chicago IL Board of Education Series A (GO, National Insured) | | | 5.00 | | | | 12-1-2016 | | | | 1,595,000 | | | | 1,601,093 | |
Chicago IL Board of Education Series A (GO, Ambac Insured) | | | 5.25 | | | | 12-1-2015 | | | | 1,000,000 | | | | 1,042,750 | |
Chicago IL Board of Education Series A (GO, National Insured) | | | 5.25 | | | | 12-1-2017 | | | | 1,645,000 | | | | 1,807,723 | |
Chicago IL Board of Education Series A-1 (GO) ± | | | 0.69 | | | | 3-1-2026 | | | | 49,275,000 | | | | 48,734,946 | |
Chicago IL Board of Education Series A2 (GO) ± | | | 0.80 | | | | 3-1-2035 | | | | 72,320,000 | | | | 70,810,682 | |
Chicago IL Board of Education Series B (GO, Ambac Insured) | | | 5.00 | | | | 12-1-2017 | | | | 1,085,000 | | | | 1,173,373 | |
Chicago IL Board of Education Series C (GO) | | | 5.00 | | | | 12-1-2017 | | | | 1,520,000 | | | | 1,643,804 | |
Chicago IL Board of Education Series F (GO) | | | 5.00 | | | | 12-1-2016 | | | | 1,000,000 | | | | 1,069,130 | |
Chicago IL Park District Harbor Facilities Series D (GO) | | | 4.00 | | | | 1-1-2016 | | | | 1,000,000 | | | | 1,036,200 | |
Chicago IL Park District Limited Tax Series A (GO) | | | 4.00 | | | | 1-1-2016 | | | | 615,000 | | | | 637,263 | |
Chicago IL Park District Limited Tax Series D (GO) | | | 3.00 | | | | 1-1-2016 | | | | 1,540,000 | | | | 1,580,394 | |
Chicago IL Park District Limited Tax Series D (GO) | | | 4.00 | | | | 1-1-2017 | | | | 1,000,000 | | | | 1,062,130 | |
Chicago IL Park District Limited Tax Series D (GO) | | | 4.00 | | | | 1-1-2018 | | | | 2,760,000 | | | | 2,987,038 | |
Chicago IL Park District Series C (GO) ø | | | 2.00 | | | | 1-1-2015 | | | | 2,530,000 | | | | 2,530,000 | |
Chicago IL Park District Series D (GO) ø | | | 2.00 | | | | 1-1-2015 | | | | 2,995,000 | | | | 2,995,000 | |
Chicago IL Project & Refunding Series A (GO, AGM Insured) | | | 5.00 | | | | 1-1-2018 | | | | 10,000,000 | | | | 10,378,600 | |
Chicago IL Project & Refunding Series C (GO, National Insured) | | | 5.00 | | | | 1-1-2018 | | | | 5,350,000 | | | | 5,824,866 | |
Chicago IL Refunding Bond (Tax Revenue, JPMorgan Chase & Company SPA) ø | | | 0.16 | | | | 1-1-2034 | | | | 23,825,000 | | | | 23,825,000 | |
Chicago IL Refunding Emergency System (GO, AGM/FGIC Insured) | | | 5.50 | | | | 1-1-2019 | | | | 3,000,000 | | | | 3,364,860 | |
Chicago IL Series A (GO) | | | 5.00 | | | | 12-1-2015 | | | | 2,175,000 | | | | 2,263,436 | |
Chicago IL Series A (GO, AGM Insured) | | | 5.00 | | | | 1-1-2016 | | | | 2,100,000 | | | | 2,108,211 | |
Chicago IL Series D (GO, AGM/FGIC Insured) | | | 5.25 | | | | 1-1-2017 | | | | 1,210,000 | | | | 1,300,072 | |
Chicago IL Transit Authority Capital Grant Unrefunded Balance Federal Transit Administration (Miscellaneous Revenue, Ambac Insured) | | | 5.00 | | | | 6-1-2018 | | | | 1,500,000 | | | | 1,614,510 | |
Deutsche Bank SPEARs/LIFERs Trust Series DB 1360 (GO, AGM Insured, Deutsche Bank LIQ) 144Aø | | | 0.16 | | | | 2-1-2039 | | | | 10,000,000 | | | | 10,000,000 | |
Deutsche Bank SPEARs/LIFERs Trust Series DBE 1379 (Miscellaneous Revenue, Deutsche Bank LIQ) 144Aø | | | 0.16 | | | | 5-1-2032 | | | | 12,400,000 | | | | 12,400,000 | |
Du Page County IL (Transportation Revenue, AGM Insured) | | | 5.00 | | | | 1-1-2018 | | | | 3,510,000 | | | | 3,590,133 | |
Granite City IL Solid Waste Management Incorporated Project (Resource Recovery Revenue) ± | | | 0.70 | | | | 5-1-2027 | | | | 17,320,000 | | | | 17,323,810 | |
Grundy Kendall & Will Counties IL Community School District #201 (GO, AGM Insured) | | | 5.75 | | | | 10-15-2019 | | | | 540,000 | | | | 621,113 | |
Illinois (Miscellaneous Revenue) | | | 2.00 | | | | 5-1-2015 | | | | 12,500,000 | | | | 12,562,375 | |
Illinois (Miscellaneous Revenue) | | | 2.50 | | | | 7-1-2017 | | | | 3,000,000 | | | | 3,077,070 | |
Illinois (GO) | | | 3.00 | | | | 2-1-2016 | | | | 8,000,000 | | | | 8,193,440 | |
Illinois (GO) | | | 3.00 | | | | 2-1-2017 | | | | 8,740,000 | | | | 9,041,443 | |
Illinois (GO) | | | 4.00 | | | | 4-1-2016 | | | | 500,000 | | | | 519,600 | |
Illinois (Miscellaneous Revenue) | | | 4.00 | | | | 7-1-2016 | | | | 10,000,000 | | | | 10,450,100 | |
Illinois (GO) | | | 4.00 | | | | 2-1-2017 | | | | 2,000,000 | | | | 2,109,960 | |
Illinois (GO) | | | 4.00 | | | | 2-1-2018 | | | | 4,150,000 | | | | 4,426,390 | |
Illinois (Miscellaneous Revenue) | | | 4.00 | | | | 7-1-2018 | | | | 13,610,000 | | | | 14,587,742 | |
Illinois (Tax Revenue) | | | 4.00 | | | | 9-1-2018 | | | | 4,500,000 | | | | 4,828,500 | |
Illinois (GO) | | | 5.00 | | | | 4-1-2016 | | | | 5,000,000 | | | | 5,258,050 | |
Illinois (Miscellaneous Revenue) | | | 5.00 | | | | 5-1-2016 | | | | 3,000,000 | | | | 3,163,320 | |
Illinois (GO) | | | 5.00 | | | | 3-1-2017 | | | | 5,000,000 | | | | 5,389,550 | |
Illinois (Miscellaneous Revenue) | | | 5.00 | | | | 5-1-2017 | | | | 5,000,000 | | | | 5,412,950 | |
| | | | | | |
| Portfolio of investments—December 31, 2014 (unaudited) | | Wells Fargo Advantage Ultra Short-Term Municipal Income Fund | | | 7 | |
| | | | | | | | | | | | | | | | |
| Security name | | Interest rate | | | Maturity date | | | Principal | | | Value | |
| | | | |
| Illinois (continued) | | | | | | | | | | | | | | | | |
Illinois (Miscellaneous Revenue) | | | 5.00 | % | | | 7-1-2017 | | | $ | 10,000,000 | | | $ | 10,871,100 | |
Illinois (GO, AGM Insured) | | | 5.00 | | | | 9-1-2017 | | | | 3,000,000 | | | | 3,082,830 | |
Illinois (GO) | | | 5.00 | | | | 1-1-2018 | | | | 5,800,000 | | | | 5,986,064 | |
Illinois (GO) | | | 5.00 | | | | 1-1-2018 | | | | 6,250,000 | | | | 6,841,125 | |
Illinois (Miscellaneous Revenue) | | | 5.00 | | | | 5-1-2018 | | | | 5,000,000 | | | | 5,510,250 | |
Illinois Educational Authority University of Chicago Series B-1 (Education Revenue) ± | | | 1.10 | | | | 7-1-2036 | | | | 6,375,000 | | | | 6,358,935 | |
Illinois Finance Authority Carle Foundation Series A (Health Revenue) | | | 5.00 | | | | 8-15-2016 | | | | 2,200,000 | | | | 2,351,866 | |
Illinois Finance Authority Children’s Memorial Hospital Series A (Health Revenue, AGM Insured, Bank of America NA LIQ) 144Aø | | | 0.31 | | | | 8-15-2047 | | | | 8,375,000 | | | | 8,375,000 | |
Illinois Finance Authority Revenue DePaul University (Education Revenue) | | | 5.00 | | | | 10-1-2016 | | | | 1,850,000 | | | | 1,989,601 | |
Illinois Refunding Bond (GO) | | | 5.00 | | | | 3-1-2018 | | | | 2,000,000 | | | | 2,196,800 | |
Illinois Refunding Bond Series 2012 (Miscellaneous Revenue) | | | 5.00 | | | | 8-1-2018 | | | | 1,520,000 | | | | 1,682,518 | |
Illinois Series 1 (GO, National Insured) | | | 5.38 | | | | 4-1-2015 | | | | 1,410,000 | | | | 1,427,174 | |
Illinois Series A (Tax Revenue) | | | 4.00 | | | | 1-1-2017 | | | | 12,935,000 | | | | 13,624,953 | |
Illinois Series A (GO) | | | 5.00 | | | | 4-1-2017 | | | | 6,840,000 | | | | 7,388,978 | |
Illinois Series A (Tax Revenue) | | | 5.00 | | | | 6-1-2017 | | | | 250,000 | | | | 271,215 | |
Illinois Series A (GO) | | | 5.00 | | | | 4-1-2018 | | | | 5,235,000 | | | | 5,759,704 | |
Illinois Sports Authority (Tax Revenue) | | | 5.00 | | | | 6-15-2016 | | | | 755,000 | | | | 798,850 | |
Illinois Sports Authority (Tax Revenue) | | | 5.00 | | | | 6-15-2017 | | | | 760,000 | | | | 824,912 | |
Illinois Toll Highway Authority Series B (Transportation Revenue, AGM Insured, Landesbank Hessen-Thüringen SPA) ø | | | 0.23 | | | | 1-1-2016 | | | | 6,000,000 | | | | 6,000,000 | |
Illinois Toll Highway Authority Series B (Transportation Revenue, AGM Insured, Landesbank Hessen-Thüringen SPA) ø | | | 0.23 | | | | 1-1-2017 | | | | 32,350,000 | | | | 32,350,000 | |
Illinois Unemployment Insurance Fund Series A (Miscellaneous Revenue) | | | 4.00 | | | | 12-15-2015 | | | | 2,750,000 | | | | 2,850,348 | |
Illinois Unemployment Insurance Fund Series A (Miscellaneous Revenue) | | | 5.00 | | | | 6-15-2015 | | | | 10,100,000 | | | | 10,323,715 | |
Illinois Unrefunded Balance Series A (Miscellaneous Revenue) | | | 5.00 | | | | 10-1-2016 | | | | 5,560,000 | | | | 5,580,961 | |
Kane County IL School District #129 Aurora West Series B (GO) | | | 2.00 | | | | 2-1-2017 | | | | 2,190,000 | | | | 2,235,924 | |
Kane County IL School District #129 West Side Series B (GO) | | | 2.00 | | | | 2-1-2018 | | | | 2,430,000 | | | | 2,478,722 | |
Kendall Kane & Will Counties IL Community Unit School District #308 (GO) | | | 4.00 | | | | 10-1-2018 | | | | 2,000,000 | | | | 2,198,120 | |
Lake County IL Community High School District #117 CAB Series B (GO, National Insured) ¤ | | | 0.00 | | | | 12-1-2015 | | | | 6,545,000 | | | | 6,495,847 | |
Lake County IL School District #38 Big Hollow CAB (GO, Ambac Insured) ¤ | | | 0.00 | | | | 2-1-2017 | | | | 500,000 | | | | 481,605 | |
Metropolitan Pier & Exposition Unrefunded Balance Capital (Tax Revenue, National Insured) ¤ | | | 0.00 | | | | 6-15-2017 | | | | 1,915,000 | | | | 1,849,181 | |
Minooka IL Special Assessment Refunding & Improvement (Miscellaneous Revenue, AGM Insured) | | | 1.00 | | | | 12-1-2015 | | | | 170,000 | | | | 170,734 | |
Minooka IL Special Assessment Refunding & Improvement (Miscellaneous Revenue, AGM Insured) | | | 2.00 | | | | 12-1-2016 | | | | 244,000 | | | | 247,289 | |
Minooka IL Special Assessment Refunding & Improvement (Miscellaneous Revenue, AGM Insured) | | | 3.00 | | | | 12-1-2017 | | | | 419,000 | | | | 433,238 | |
Minooka IL Special Assessment Refunding & Improvement (Miscellaneous Revenue, AGM Insured) | | | 3.50 | | | | 12-1-2018 | | | | 404,000 | | | | 424,192 | |
Minooka IL Special Assessment Refunding & Improvement (Miscellaneous Revenue, AGM Insured) | | | 3.50 | | | | 12-1-2019 | | | | 569,000 | | | | 594,264 | |
Regional Transportation Authority Illinois Refunding Balance Series B (Tax Revenue) ø | | | 0.40 | | | | 6-1-2025 | | | | 40,650,000 | | | | 40,650,000 | |
Rock Island County IL Metropolitan Airport Authority Refunding Series A (GO, AGM Insured) | | | 3.80 | | | | 12-1-2015 | | | | 865,000 | | | | 888,986 | |
Springfield IL (Utilities Revenue, National Insured) | | | 3.80 | | | | 3-1-2015 | | | | 250,000 | | | | 251,440 | |
Springfield IL (Utilities Revenue) | | | 5.00 | | | | 3-1-2016 | | | | 2,600,000 | | | | 2,731,872 | |
| | | | |
| | | | | | | | | | | | | | | 611,268,306 | |
| | | | | | | | | | | | | | | | |
| | | | |
| 8 | | Wells Fargo Advantage Ultra Short-Term Municipal Income Fund | | Portfolio of investments—December 31, 2014 (unaudited) |
| | | | | | | | | | | | | | | | |
| Security name | | Interest rate | | | Maturity date | | | Principal | | | Value | |
| | | | |
| Indiana: 0.96% | | | | | | | | | | | | | | | | |
Hamilton IN Southeastern Consolidated School Building Corporation BAN (GO) | | | 0.50 | % | | | 5-27-2015 | | | $ | 2,450,000 | | | $ | 2,449,731 | |
Indiana Bond Bank Special Program Gas Revenue (Utilities Revenue, JPMorgan Chase & Company LIQ) 144Aø | | | 0.39 | | | | 4-15-2017 | | | | 700,000 | | | | 700,000 | |
Indiana Finance Authority Ohio River Bridges East End Crossing Project Series B (Industrial Development Revenue) | | | 5.00 | | | | 1-1-2019 | | | | 4,610,000 | | | | 4,954,229 | |
Indiana Finance Authority Republic Services Incorporated Project Series B (Resource Recovery Revenue) ± | | | 0.30 | | | | 5-1-2028 | | | | 2,000,000 | | | | 2,000,020 | |
Indiana Transportation Finance Authority Series A (Miscellaneous Revenue) | | | 6.80 | | | | 12-1-2016 | | | | 2,255,000 | | | | 2,436,122 | |
Perry Township IN Multi-School Building Corporation (Miscellaneous Revenue, AGM Insured) | | | 5.00 | | | | 7-10-2015 | | | | 1,010,000 | | | | 1,021,878 | |
Posey County IN Economic Development Midwest Fertilizer Company Project Series A (Industrial Development Revenue) ± | | | 0.23 | | | | 7-1-2046 | | | | 44,750,000 | | | | 44,748,658 | |
Rockport IN PCR Indiana-Michigan Power Company Series B (Utilities Revenue) ± | | | 1.75 | | | | 6-1-2025 | | | | 2,000,000 | | | | 2,007,380 | |
| | | | |
| | | | | | | | | | | | | | | 60,318,018 | |
| | | | | | | | | | | | | | | | |
| | | | |
| Iowa: 0.07% | | | | | | | | | | | | | | | | |
Randall IA Healthcare BAN Bethany Manor Incorporated (Health Revenue) | | | 1.25 | | | | 8-1-2016 | | | | 4,500,000 | | | | 4,488,525 | |
| | | | | | | | | | | | | | | | |
| | | | |
| Kansas: 0.44% | | | | | | | | | | | | | | | | |
Kansas Department of Transportation Highway Libor Index Series B-2 (Tax Revenue) ± | | | 0.29 | | | | 9-1-2016 | | | | 10,000,000 | | | | 10,004,200 | |
Kansas Department of Transportation Highway Libor Index Series B-3 (Tax Revenue) ± | | | 0.34 | | | | 9-1-2017 | | | | 4,500,000 | | | | 4,502,790 | |
Kansas Department of Transportation Highway Libor Index Series B-4 (Tax Revenue) ± | | | 0.42 | | | | 9-1-2018 | | | | 7,000,000 | | | | 7,002,240 | |
Kansas Department of Transportation Highway Libor Index Series B-5 (Tax Revenue) ± | | | 0.50 | | | | 9-1-2019 | | | | 6,000,000 | | | | 5,980,500 | |
| | | | |
| | | | | | | | | | | | | | | 27,489,730 | |
| | | | | | | | | | | | | | | | |
| | | | |
| Kentucky: 1.71% | | | | | | | | | | | | | | | | |
Ashland KY Ashland Hospital Corporation Kings Daughters Medical Center Project (Health Revenue) ± | | | 1.79 | | | | 2-1-2040 | | | | 32,085,000 | | | | 32,232,591 | |
Ashland KY Medical Center Ashland Hospital Corporation Series B (Health Revenue) | | | 5.00 | | | | 2-1-2018 | | | | 900,000 | | | | 977,688 | |
Kentucky Public Transportation Infrastructure Authority Tolls BAN Downtown Crossing Project Series A (Transportation Revenue) | | | 5.00 | | | | 7-1-2017 | | | | 50,420,000 | | | | 55,177,127 | |
Louisville & Jefferson Counties KY PCR Louisville Gas & Electric Company Project Series B (Utilities Revenue) ± | | | 1.35 | | | | 11-1-2027 | | | | 16,000,000 | | | | 15,944,800 | |
Somerset KY BAN (GO) | | | 1.25 | | | | 10-1-2016 | | | | 3,000,000 | | | | 2,995,830 | |
| | | | |
| | | | | | | | | | | | | | | 107,328,036 | |
| | | | | | | | | | | | | | | | |
| | | | |
| Louisiana: 1.89% | | | | | | | | | | | | | | | | |
East Baton Rouge Parish LA Sewerage Commission Refunding Bond Series A (Water & Sewer Revenue) ± | | | 0.61 | | | | 2-1-2046 | | | | 25,000,000 | | | | 25,036,750 | |
Louisiana Gas & Fuel Tax Revenue 2nd Lien Series A (Tax Revenue) ± | | | 0.58 | | | | 5-1-2043 | | | | 11,050,000 | | | | 11,056,630 | |
Louisiana Offshore Terminal Authority Deepwater Loop LLC Project Series B-1 (Airport Revenue) ± | | | 2.20 | | | | 10-1-2040 | | | | 750,000 | | | | 763,875 | |
Louisiana Offshore Terminal Authority Deepwater Loop LLC Project Series B-1A1 (Airport Revenue) ± | | | 1.38 | | | | 10-1-2037 | | | | 2,365,000 | | | | 2,385,670 | |
Louisiana Offshore Terminal Authority Deepwater Loop LLC Project Series B-2A (Airport Revenue) ± | | | 2.13 | | | | 10-1-2037 | | | | 3,090,000 | | | | 3,125,999 | |
Louisiana Public Authority Entergy Gulf States Series B (Utilities Revenue) | | | 2.88 | | | | 11-1-2015 | | | | 2,250,000 | | | | 2,294,100 | |
Orleans Parish LA Parishwide School District (GO, FGIC Insured) ¤ | | | 0.00 | | | | 2-1-2015 | | | | 1,230,000 | | | | 1,225,129 | |
Shreveport LA Water & Sewer Refunding Revenue Series A (Water & Sewer Revenue, Build America Mutual Assurance Company Insured) | | | 4.00 | | | | 12-1-2017 | | | | 3,000,000 | | | | 3,237,300 | |
St. James Parish LA Nucor Steel LLC Project Gulf Opportunity Zone Series A1 (Industrial Development Revenue) ø | | | 0.22 | | | | 11-1-2040 | | | | 60,000,000 | | | | 60,000,000 | |
| | | | | | |
| Portfolio of investments—December 31, 2014 (unaudited) | | Wells Fargo Advantage Ultra Short-Term Municipal Income Fund | | | 9 | |
| | | | | | | | | | | | | | | | |
| Security name | | Interest rate | | | Maturity date | | | Principal | | | Value | |
| | | | |
| Louisiana (continued) | | | | | | | | | | | | | | | | |
St. James Parish LA Nucor Steel LLC Project Gulf Opportunity Zone Series B1 (Industrial Development Revenue) ø | | | 0.20 | % | | | 11-1-2040 | | | $ | 10,000,000 | | | $ | 10,000,000 | |
| | | | |
| | | | | | | | | | | | | | | 119,125,453 | |
| | | | | | | | | | | | | | | | |
| | | | |
| Maine: 0.07% | | | | | | | | | | | | | | | | |
Maine Finance Authority Solid Waste Disposable Management (Resource Recovery Revenue) ± | | | 4.65 | | | | 2-1-2016 | | | | 4,000,000 | | | | 4,104,320 | |
| | | | | | | | | | | | | | | | |
| | | | |
| Maryland: 0.29% | | | | | | | | | | | | | | | | |
Maryland Community Development Administration Department of Housing & Community Development Marlborough Apartment Series I (Housing Revenue, FNMA Insured) | | | 0.55 | | | | 12-15-2016 | | | | 2,050,000 | | | | 2,048,565 | |
Maryland Community Development Administration Department of Housing & Community Development Windsor Valley Apartments I &II Series G (Housing Revenue) | | | 1.00 | | | | 6-1-2017 | | | | 16,500,000 | | | | 16,479,210 | |
| | | | |
| | | | | | | | | | | | | | | 18,527,775 | |
| | | | | | | | | | | | | | | | |
| | | | |
| Massachusetts: 3.26% | | | | | | | | | | | | | | | | |
BB&T Municipal Trust Class B (Miscellaneous Revenue, Rabobank LOC) 144Aø | | | 0.35 | | | | 10-15-2015 | | | | 36,635,000 | | | | 36,635,000 | |
Massachusetts Consolidated Loan Series D-1 (Miscellaneous Revenue) ± | | | 0.24 | | | | 8-1-2043 | | | | 80,000,000 | | | | 79,875,200 | |
Massachusetts Development Finance Agency Boston University Series U-6E (Education Revenue) ± | | | 0.59 | | | | 10-1-2042 | | | | 14,000,000 | | | | 14,032,060 | |
Massachusetts HEFA Lahey Clinic Medical Center Series C (Health Revenue, National Insured) | | | 5.00 | | | | 8-15-2016 | | | | 5,945,000 | | | | 6,103,672 | |
Massachusetts HEFA Lahey Clinic Medical Center Series C (Health Revenue, National Insured) | | | 5.00 | | | | 8-15-2018 | | | | 2,780,000 | | | | 2,859,842 | |
Massachusetts HEFA Partners Healthcare Series G-2 (Health Revenue, AGM Insured) ±(m) | | | 0.33 | | | | 7-1-2042 | | | | 21,475,000 | | | | 21,475,000 | |
Massachusetts PFOTER Series 4406 (Tax Revenue, Dexia Credit Local LIQ) 144Aø | | | 0.13 | | | | 7-1-2030 | | | | 12,925,000 | | | | 12,925,000 | |
Massachusetts Refunding Balance Series A (GO) ± | | | 0.52 | | | | 2-1-2016 | | | | 13,000,000 | | | | 13,001,560 | |
Massachusetts Water Resources Authority Series D (Water & Sewer Revenue, Dexia Credit Local LOC, AGM Insured) 144Aø | | | 0.16 | | | | 8-1-2025 | | | | 7,880,000 | | | | 7,880,000 | |
Massachusetts Water Resources Authority Series DCL 005 (Water & Sewer Revenue, Dexia Credit Local LOC, AGM Insured) 144Aø | | | 0.16 | | | | 8-1-2025 | | | | 10,000,000 | | | | 10,000,000 | |
| | | | |
| | | | | | | | | | | | | | | 204,787,334 | |
| | | | | | | | | | | | | | | | |
| | | | |
| Michigan: 5.35% | | | | | | | | | | | | | | | | |
Bridgeport MI Spaulding Community School District (GO) | | | 1.50 | | | | 6-23-2015 | | | | 4,830,000 | | | | 4,840,481 | |
Charlotte MI Public School District (GO, Qualified School Board Loan Fund Insured) %% | | | 4.00 | | | | 5-1-2017 | | | | 685,000 | | | | 730,600 | |
Charlotte MI Public School District (GO, Qualified School Board Loan Fund Insured) %% | | | 5.00 | | | | 5-1-2019 | | | | 1,515,000 | | | | 1,727,994 | |
Detroit MI (GO) | | | 5.00 | | | | 11-1-2017 | | | | 7,485,000 | | | | 8,133,276 | |
Detroit MI City School District Series DC8032 (GO, Dexia Credit Local LOC, AGM/Qualified School Board Loan Fund Insured, Dexia Credit Local LIQ) 144Aø | | | 0.32 | | | | 5-1-2029 | | | | 11,245,000 | | | | 11,245,000 | |
Detroit MI City School District Series DCL 045 (GO, Dexia Credit Local LOC, AGM/Qualified School Board Loan Fund Insured, Dexia Credit Local LIQ) 144Aø | | | 0.45 | | | | 5-1-2030 | | | | 12,610,000 | | | | 12,610,000 | |
Forest Hills MI Public Schools (GO) %% | | | 4.00 | | | | 5-1-2016 | | | | 2,600,000 | | | | 2,710,994 | |
Forest Hills MI Public Schools (GO) %% | | | 4.00 | | | | 5-1-2017 | | | | 2,150,000 | | | | 2,298,178 | |
Genesee County MI Limited Tax Water Supply System (GO, Build America Mutual Assurance Company Insured) | | | 3.00 | | | | 11-1-2016 | | | | 425,000 | | | | 440,891 | |
Genesee County MI Limited Tax Water Supply System (GO, Build America Mutual Assurance Company Insured) | | | 4.00 | | | | 11-1-2017 | | | | 225,000 | | | | 241,837 | |
Genesee County MI Limited Tax Water Supply System (GO, Build America Mutual Assurance Company Insured) | | | 4.00 | | | | 11-1-2018 | | | | 220,000 | | | | 238,009 | |
Genesee County MI Limited Tax Water Supply System (GO, Build America Mutual Assurance Company Insured) | | | 5.00 | | | | 11-1-2019 | | | | 240,000 | | | | 271,267 | |
Grand Ledge MI Public School District (GO, Qualified School Board Loan Fund Insured) %% | | | 5.00 | | | | 5-1-2016 | | | | 1,985,000 | | | | 2,091,098 | |
Grand Ledge MI Public School District (GO, Qualified School Board Loan Fund Insured) %% | | | 5.00 | | | | 5-1-2017 | | | | 1,235,000 | | | | 1,341,371 | |
| | | | |
| 10 | | Wells Fargo Advantage Ultra Short-Term Municipal Income Fund | | Portfolio of investments—December 31, 2014 (unaudited) |
| | | | | | | | | | | | | | | | |
| Security name | | Interest rate | | | Maturity date | | | Principal | | | Value | |
| | | | |
| Michigan (continued) | | | | | | | | | | | | | | | | |
Lake Orion MI Community School District (GO, Qualified School Board Loan Fund Insured) %% | | | 4.00 | % | | | 5-1-2016 | | | $ | 3,775,000 | | | $ | 3,937,212 | |
Lake Orion MI Community School District (GO, Qualified School Board Loan Fund Insured) %% | | | 4.00 | | | | 5-1-2017 | | | | 2,325,000 | | | | 2,483,635 | |
Lake Orion MI Community School District (GO, Qualified School Board Loan Fund Insured) %% | | | 5.00 | | | | 5-1-2018 | | | | 4,650,000 | | | | 5,198,933 | |
Mattawan MI Consolidated School District (GO, Qualified School Board Loan Fund Insured) %% | | | 4.00 | | | | 5-1-2016 | | | | 905,000 | | | | 940,557 | |
Mattawan MI Consolidated School District (GO, Qualified School Board Loan Fund Insured) %% | | | 4.00 | | | | 5-1-2017 | | | | 875,000 | | | | 933,380 | |
Mattawan MI Consolidated School District (GO, Qualified School Board Loan Fund Insured) %% | | | 5.00 | | | | 5-1-2018 | | | | 855,000 | | | | 954,120 | |
Michigan Comprehensive Transportation PFOTER 2754 (Tax Revenue, AGM Insured, Dexia Credit Local LIQ) ø | | | 0.13 | | | | 5-15-2023 | | | | 1,065,000 | | | | 1,065,000 | |
Michigan Finance Authority Detroit School District (Miscellaneous Revenue) | | | 5.00 | | | | 6-1-2015 | | | | 4,400,000 | | | | 4,476,164 | |
Michigan Finance Authority Detroit School District Series E (Miscellaneous Revenue) | | | 2.85 | | | | 8-20-2015 | | | | 1,850,000 | | | | 1,855,180 | |
Michigan Finance Authority Local Government Loan Program Detroit Water & Sewer Series C (Miscellaneous Revenue) | | | 5.00 | | | | 11-1-2015 | | | | 1,500,000 | | | | 1,551,600 | |
Michigan Finance Authority Local Government Loan Program Detroit Water & Sewer Series D-1 (Water & Sewer Revenue, AGM Insured) | | | 5.00 | | | | 7-1-2016 | | | | 2,400,000 | | | | 2,550,360 | |
Michigan Finance Authority Local Government Loan Program Detroit Water & Sewer Series D-1 (Water & Sewer Revenue, AGM Insured) | | | 5.00 | | | | 7-1-2017 | | | | 5,265,000 | | | | 5,756,277 | |
Michigan Finance Authority Local Government Loan Program Detroit Water & Sewer Series D-3 (Water & Sewer Revenue, National Insured) | | | 5.00 | | | | 7-1-2018 | | | | 20,000,000 | | | | 22,240,600 | |
Michigan Finance Authority Local Government Loan Program Detroit Water & Sewer Series D-4 (Water & Sewer Revenue) | | | 5.00 | | | | 7-1-2016 | | | | 11,000,000 | | | | 11,631,400 | |
Michigan Finance Authority Local Government Loan Program Detroit Water & Sewer Series D-4 (Water & Sewer Revenue) | | | 5.00 | | | | 7-1-2017 | | | | 15,000,000 | | | | 16,268,100 | |
Michigan Finance Authority Local Government Loan Program Detroit Water & Sewer Series D-7 (Water & Sewer Revenue) | | | 5.00 | | | | 7-1-2017 | | | | 1,630,000 | | | | 1,757,368 | |
Michigan Finance Authority Senior Lien Detroit Water & Sewer Series C-5 (Water & Sewer Revenue, National Insured) | | | 5.00 | | | | 7-1-2017 | | | | 10,000,000 | | | | 10,907,200 | |
Michigan Finance Authority Senior Lien Detroit Water & Sewer Series C-5 (Water & Sewer Revenue, National Insured) | | | 5.00 | | | | 7-1-2018 | | | | 17,500,000 | | | | 19,460,525 | |
Michigan Finance Authority Senior Lien Detroit Water & Sewer Series C-6 (Water & Sewer Revenue) | | | 5.00 | | | | 7-1-2016 | | | | 8,050,000 | | | | 8,512,070 | |
Michigan Finance Authority Senior Lien Detroit Water & Sewer Series C-6 (Water & Sewer Revenue) | | | 5.00 | | | | 7-1-2018 | | | | 4,000,000 | | | | 4,386,640 | |
Michigan Grant Anticipation Bonds (Miscellaneous Revenue, AGM Insured) | | | 5.25 | | | | 9-15-2018 | | | | 1,500,000 | | | | 1,676,010 | |
Michigan Housing Development Authority Bicentennial Tower Apartment Project (Housing Revenue) | | | 0.45 | | | | 6-1-2016 | | | | 8,000,000 | | | | 7,989,520 | |
Michigan Housing Development Authority The Summit Apartments Project (Housing Revenue) | | | 0.45 | | | | 5-1-2016 | | | | 3,250,000 | | | | 3,250,390 | |
Michigan Housing Development Authority Village Manor Apartment Project (Housing Revenue) | | | 0.45 | | | | 6-1-2016 | | | | 3,800,000 | | | | 3,799,278 | |
Michigan PFOTER Series 4711 (GO, AGM/Qualified School Board Loan Fund Insured, Dexia Credit Local LIQ) 144Aø | | | 0.48 | | | | 5-1-2029 | | | | 19,830,000 | | | | 19,830,000 | |
Michigan PFOTER Series 4714 (Miscellaneous Revenue, Ambac Insured, Dexia Credit Local LIQ) 144Aø | | | 0.25 | | | | 9-1-2024 | | | | 10,765,000 | | | | 10,765,000 | |
Michigan State Hospital Finance Authority Ascension Health Series A-3 (Health Revenue) ± | | | 1.87 | | | | 11-1-2027 | | | | 6,750,000 | | | | 6,898,905 | |
| | | | | | |
| Portfolio of investments—December 31, 2014 (unaudited) | | Wells Fargo Advantage Ultra Short-Term Municipal Income Fund | | | 11 | |
| | | | | | | | | | | | | | | | |
| Security name | | Interest rate | | | Maturity date | | | Principal | | | Value | |
| | | | |
| Michigan (continued) | | | | | | | | | | | | | | | | |
Michigan State Hospital Finance Authority Ascension Health Series F-3 (Health Revenue) ± | | | 1.40 | % | | | 11-15-2047 | | | $ | 9,250,000 | | | $ | 9,313,640 | |
Michigan Strategic Fund Limited Obligation Events Center Project Series A (Tax Revenue) ± | | | 4.13 | | | | 7-1-2045 | | | | 11,000,000 | | | | 11,098,120 | |
Pinckney MI Community Schools (GO, Qualified School Board Loan Fund Insured) | | | 4.00 | | | | 5-1-2017 | | | | 645,000 | | | | 688,796 | |
Pinckney MI Community Schools (GO, Qualified School Board Loan Fund Insured) | | | 5.00 | | | | 5-1-2018 | | | | 1,035,000 | | | | 1,157,844 | |
Rochester MI Community School District (GO, Qualified School Board Loan Fund Insured) %% | | | 5.00 | | | | 5-1-2016 | | | | 2,600,000 | | | | 2,739,412 | |
Rockford MI Public School District (GO, Qualified School Board Loan Fund Insured) %% | | | 5.00 | | | | 5-1-2016 | | | | 1,030,000 | | | | 1,084,425 | |
Rockford MI Public School District (GO, Qualified School Board Loan Fund Insured) %% | | | 5.00 | | | | 5-1-2017 | | | | 1,000,000 | | | | 1,085,770 | |
Rockford MI Public School District (GO, Qualified School Board Loan Fund Insured) %% | | | 5.00 | | | | 5-1-2018 | | | | 750,000 | | | | 833,985 | |
Rockford MI Public School District (GO, Qualified School Board Loan Fund Insured) %% | | | 5.00 | | | | 5-1-2019 | | | | 1,000,000 | | | | 1,134,600 | |
Saline MI School District (GO, Qualified School Board Loan Fund Insured) ± | | | 0.60 | | | | 5-1-2030 | | | | 16,200,000 | | | | 16,190,604 | |
University of Michigan Series F (Education Revenue) ± | | | 0.45 | | | | 4-1-2043 | | | | 48,970,000 | | | | 49,025,307 | |
Walled Lake MI Consolidated School District (GO, Qualified School Board Loan Fund Insured) %% | | | 4.00 | | | | 5-1-2016 | | | | 5,340,000 | | | | 5,557,071 | |
Walled Lake MI Consolidated School District (GO, Qualified School Board Loan Fund Insured) %% | | | 5.00 | | | | 5-1-2018 | | | | 6,020,000 | | | | 6,724,761 | |
| | | | |
| | | | | | | | | | | | | | | 336,630,755 | |
| | | | | | | | | | | | | | | | |
| | | | |
| Minnesota: 0.41% | | | | | | | | | | | | | | | | |
Edina MN MFHR Yorktown Continental LP Project (Housing Revenue) | | | 0.50 | | | | 6-1-2016 | | | | 15,000,000 | | | | 14,997,150 | |
Minneapolis & St. Paul MN Housing & RDA HealthSpan Series B (Health Revenue, Ambac Insured) ±(n)(m) | | | 0.06 | | | | 11-15-2017 | | | | 9,500,000 | | | | 9,120,000 | |
Pipestone County MN Medical Center BAN (Health Revenue) | | | 0.85 | | | | 5-1-2017 | | | | 1,900,000 | | | | 1,896,580 | |
| | | | |
| | | | | | | | | | | | | | | 26,013,730 | |
| | | | | | | | | | | | | | | | |
| | | | |
| Mississippi: 0.11% | | | | | | | | | | | | | | | | |
Mississippi Business Finance Corporation Coast Electric Power Association Series C (Utilities Revenue) ± | | | 0.30 | | | | 5-1-2037 | | | | 2,000,000 | | | | 1,999,860 | |
Mississippi Business Finance Corporation Solid Waste Disposal Gulf Power Company Project (Industrial Development Revenue) ± | | | 0.55 | | | | 11-1-2042 | | | | 3,000,000 | | | | 2,998,860 | |
Mississippi Business Finance Corporation Waste Management Incorporated Project (Resource Recovery Revenue) ± | | | 1.38 | | | | 3-1-2027 | | | | 800,000 | | | | 799,016 | |
Mississippi Hospital Equipment & Facilities Authority Mississippi Baptist Health System Incorporated Series A (Health Revenue) | | | 5.00 | | | | 8-15-2018 | | | | 1,090,000 | | | | 1,182,737 | |
| | | | |
| | | | | | | | | | | | | | | 6,980,473 | |
| | | | | | | | | | | | | | | | |
| | | | |
| Missouri: 0.55% | | | | | | | | | | | | | | | | |
Missouri Development Finance Board Independence Water System Series D (Miscellaneous Revenue) | | | 2.00 | | | | 11-1-2015 | | | | 2,055,000 | | | | 2,082,147 | |
Missouri HEFA Freeman Health System (Health Revenue) | | | 5.00 | | | | 2-15-2016 | | | | 1,020,000 | | | | 1,068,052 | |
Missouri HEFA SSM Health Care Series B (Health Revenue) ø | | | 0.18 | | | | 6-1-2041 | | | | 10,000,000 | | | | 10,000,000 | |
Missouri HEFA SSM Health Care Series C (Health Revenue) ø | | | 0.18 | | | | 6-1-2041 | | | | 10,000,000 | | | | 10,000,000 | |
St. Louis MO PFOTER 4085 (Airport Revenue) ø | | | 0.28 | | | | 7-1-2022 | | | | 11,180,000 | | | | 11,180,000 | |
| | | | |
| | | | | | | | | | | | | | | 34,330,199 | |
| | | | | | | | | | | | | | | | |
| | | | |
| Montana: 0.08% | | | | | | | | | | | | | | | | |
Shelby MT BAN Multi-Modal Rail Project Series A (Miscellaneous Revenue) | | | 2.00 | | | | 7-1-2015 | | | | 5,075,000 | | | | 5,087,332 | |
| | | | | | | | | | | | | | | | |
| | | | |
| 12 | | Wells Fargo Advantage Ultra Short-Term Municipal Income Fund | | Portfolio of investments—December 31, 2014 (unaudited) |
| | | | | | | | | | | | | | | | |
| Security name | | Interest rate | | | Maturity date | | | Principal | | | Value | |
| | | | |
| Nevada: 0.32% | | | | | | | | | | | | | | | | |
Las Vegas NV New Convention & Visitors Authority Revenue (Tax Revenue, Ambac Insured) | | | 5.25 | % | | | 7-1-2015 | | | $ | 3,800,000 | | | $ | 3,893,328 | |
Las Vegas NV Redevelopment Agency Series A (Tax Revenue) | | | 6.00 | | | | 6-15-2015 | | | | 2,100,000 | | | | 2,129,862 | |
Washoe County NV (GO, Dexia Credit Local LIQ) 144Aø | | | 0.39 | | | | 12-9-2030 | | | | 13,960,000 | | | | 13,960,000 | |
| | | | |
| | | | | | | | | | | | | | | 19,983,190 | |
| | | | | | | | | | | | | | | | |
| | | | |
| New Hampshire: 0.10% | | | | | | | | | | | | | | | | |
New Hampshire Health & Education Catholic Medical Center (Health Revenue) | | | 4.00 | | | | 7-1-2015 | | | | 1,200,000 | | | | 1,217,784 | |
New Hampshire HEFA Kendal at Hanover Series B (Health Revenue, Royal Bank of Scotland LOC) ø | | | 0.24 | | | | 10-1-2030 | | | | 5,200,000 | | | | 5,200,000 | |
| | | | |
| | | | | | | | | | | | | | | 6,417,784 | |
| | | | | | | | | | | | | | | | |
| | | | |
| New Jersey: 6.89% | | | | | | | | | | | | | | | | |
Aberdeen Township NJ BAN (GO) | | | 1.25 | | | | 3-13-2015 | | | | 5,740,200 | | | | 5,749,384 | |
Atlantic Highlands NJ BAN (GO) | | | 1.25 | | | | 3-18-2015 | | | | 4,800,000 | | | | 4,803,408 | |
Beach Haven NJ BAN (GO) | | | 1.25 | | | | 5-14-2015 | | | | 5,792,700 | | | | 5,798,029 | |
Bound Brook Borough NJ BAN (GO) | | | 1.50 | | | | 4-23-2015 | | | | 9,850,000 | | | | 9,873,345 | |
Bridgeton NJ BAN (GO) | | | 1.25 | | | | 2-27-2015 | | | | 5,028,526 | | | | 5,031,593 | |
Carlstadt-East Rutherford NJ Regional School District Grant Anticipation Notes (GO) | | | 1.25 | | | | 7-7-2015 | | | | 3,000,000 | | | | 3,005,580 | |
East Orange NJ Capital Improvement Series A (GO, AGM Insured) | | | 3.00 | | | | 6-1-2017 | | | | 1,420,000 | | | | 1,482,423 | |
East Orange NJ Capital Improvement Series A (GO, AGM Insured) | | | 4.00 | | | | 6-1-2018 | | | | 650,000 | | | | 704,444 | |
Kearny NJ TAN (GO) | | | 1.00 | | | | 4-30-2015 | | | | 5,000,000 | | | | 5,005,050 | |
Keyport NJ BAN (GO) | | | 1.25 | | | | 7-31-2015 | | | | 5,538,100 | | | | 5,554,437 | |
Lakewood Township NJ Board of Education (GO) | | | 1.25 | | | | 2-27-2015 | | | | 6,000,000 | | | | 6,004,980 | |
Lyndhurst Township NJ BAN (GO) | | | 1.00 | | | | 3-18-2015 | | | | 6,126,000 | | | | 6,129,492 | |
Maple Shade Township NJ BAN (GO) | | | 1.25 | | | | 6-30-2015 | | | | 10,397,240 | | | | 10,427,912 | |
Moonachie NJ Refunding Notes (GO) | | | 1.25 | | | | 10-21-2015 | | | | 3,000,000 | | | | 3,013,590 | |
New Jersey Building Authority Series A (Miscellaneous Revenue) | | | 5.00 | | | | 6-15-2016 | | | | 1,500,000 | | | | 1,592,775 | |
New Jersey Building Authority Series A (Miscellaneous Revenue) | | | 5.00 | | | | 6-15-2016 | | | | 500,000 | | | | 530,925 | |
New Jersey EDA School Facilities Construction Notes Series K (Miscellaneous Revenue) ± | | | 0.77 | | | | 2-1-2017 | | | | 9,000,000 | | | | 9,012,600 | |
New Jersey EDA School Facilities Construction Notes Series K (Miscellaneous Revenue) | | | 5.00 | | | | 12-15-2017 | | | | 1,150,000 | | | | 1,264,632 | |
New Jersey EDA School Facilities Construction Project Series E (Miscellaneous Revenue) ± | | | 1.74 | | | | 2-1-2016 | | | | 59,540,000 | | | | 59,899,622 | |
New Jersey EDA School Facilities Construction Project Series N-1 (Miscellaneous Revenue, National Insured) | | | 5.25 | | | | 9-1-2016 | | | | 835,000 | | | | 863,281 | |
New Jersey EDA Solid Waste Facilities Disposal Waste Management Series A (Resource Recovery Revenue) | | | 0.55 | | | | 6-1-2015 | | | | 1,800,000 | | | | 1,800,180 | |
New Jersey Educational Authority Higher Education Technology Infrastructure Fund (Education Revenue) | | | 5.00 | | | | 6-1-2016 | | | | 1,840,000 | | | | 1,949,296 | |
New Jersey Higher Education Assistance Authority Senior Series 1A (Education Revenue) | | | 4.00 | | | | 12-1-2015 | | | | 2,000,000 | | | | 2,066,180 | |
New Jersey Housing & Mortgage Finance Agency Salem Lafayette Apartments Series J (Housing Revenue) ± | | | 0.50 | | | | 12-1-2015 | | | | 10,000,000 | | | | 10,002,300 | |
New Jersey PFOTER PT-4709 (Miscellaneous Revenue, Dexia Credit Local LIQ) 144Aø | | | 0.25 | | | | 9-1-2029 | | | | 41,600,000 | | | | 41,600,000 | |
New Jersey PFOTER PT-4712 (Transportation Revenue, National Insured, Dexia Credit Local LIQ) 144Aø | | | 0.23 | | | | 12-15-2022 | | | | 32,785,000 | | | | 32,785,000 | |
New Jersey PFOTER PT-4713 (GO, Ambac Insured, Dexia Credit Local LIQ) 144Aø | | | 0.13 | | | | 12-15-2021 | | | | 22,855,000 | | | | 22,855,000 | |
New Jersey PFOTER Series 4716 (Miscellaneous Revenue, National/FGIC Insured, Dexia Credit Local LIQ) 144Aø | | | 0.25 | | | | 9-1-2027 | | | | 45,000,000 | | | | 45,000,000 | |
New Jersey Transit Corporation Federal Transit Administration Grants Series A (Miscellaneous Revenue, National Insured) | | | 5.00 | | | | 9-15-2018 | | | | 3,115,000 | | | | 3,222,125 | |
New Jersey Transportation Trust Fund Authority Transportation Program Series AA (Miscellaneous Revenue) | | | 2.00 | | | | 6-15-2015 | | | | 1,000,000 | | | | 1,007,620 | |
New Jersey Transportation Trust Fund Authority Transportation System Series A (Miscellaneous Revenue, Ambac Insured) | | | 5.50 | | | | 12-15-2015 | | | | 4,360,000 | | | | 4,573,030 | |
| | | | | | |
| Portfolio of investments—December 31, 2014 (unaudited) | | Wells Fargo Advantage Ultra Short-Term Municipal Income Fund | | | 13 | |
| | | | | | | | | | | | | | | | |
| Security name | | Interest rate | | | Maturity date | | | Principal | | | Value | |
| | | | |
| New Jersey (continued) | | | | | | | | | | | | | | | | |
New Jersey Transportation Trust Fund Series B (Miscellaneous Revenue, National Insured) | | | 5.50 | % | | | 12-15-2017 | | | $ | 2,505,000 | | | $ | 2,801,367 | |
New Jersey TTFA PFOTER Series 109 (Transportation Revenue, Dexia Credit Local LOC, FGIC Insured, Dexia Credit Local SPA) 144Aø | | | 0.24 | | | | 12-15-2030 | | | | 43,575,000 | | | | 43,575,000 | |
New Jersey Turnpike Authority Series B-1 (Transportation Revenue) ± | | | 0.37 | | | | 1-1-2024 | | | | 10,500,000 | | | | 10,504,515 | |
New Jersey Turnpike Authority Series C (Transportation Revenue) ± | | | 0.52 | | | | 1-1-2017 | | | | 11,000,000 | | | | 11,017,600 | |
Newark NJ BAN Series B (GO) | | | 1.75 | | | | 6-24-2015 | | | | 10,000,000 | | | | 10,035,700 | |
Newark NJ TAN Series A (GO) | | | 1.75 | | | | 2-20-2015 | | | | 18,160,000 | | | | 18,168,717 | |
Oakland NJ BAN (GO) | | | 0.75 | | | | 2-10-2015 | | | | 9,823,121 | | | | 9,828,033 | |
Orange NJ BAN (GO) | | | 1.00 | | | | 12-16-2015 | | | | 3,645,000 | | | | 3,654,076 | |
Paterson NJ BAN (GO) | | | 1.25 | | | | 6-3-2015 | | | | 3,300,000 | | | | 3,306,435 | |
Willingboro Township NJ School District Grant Anticipation Notes (GO) | | | 1.25 | | | | 12-23-2015 | | | | 7,600,000 | | | | 7,645,068 | |
| | | | |
| | | | | | | | | | | | | | | 433,144,744 | |
| | | | | | | | | | | | | | | | |
| | | | |
| New Mexico: 1.30% | | | | | | | | | | | | | | | | |
Bernalillo County NM Series B (Tax Revenue) | | | 5.25 | | | | 4-1-2016 | | | | 420,000 | | | | 435,637 | |
Farmington NM PCR Southern California Edison Series A (Utilities Revenue) ± | | | 2.88 | | | | 4-1-2029 | | | | 1,500,000 | | | | 1,508,850 | |
New Mexico Municipal Energy Acquisition Authority Gas Supply Sub Series B (Utilities Revenue, Royal Bank of Canada SPA) ± | | | 0.85 | | | | 11-1-2039 | | | | 60,000,000 | | | | 60,386,400 | |
Pueblo of Sandia NM Series A (GO) ø | | | 1.54 | | | | 3-1-2015 | | | | 1,895,000 | | | | 1,895,000 | |
University of New Mexico Various Refunding Sub Lien Systems Series B (Education Revenue, U.S. Bank NA SPA) ø | | | 0.03 | | | | 6-1-2026 | | | | 17,275,000 | | | | 17,275,000 | |
| | | | |
| | | | | | | | | | | | | | | 81,500,887 | |
| | | | | | | | | | | | | | | | |
| | | | |
| New York: 19.70% | | | | | | | | | | | | | | | | |
Auburn NY BAN Series B (GO) | | | 1.00 | | | | 5-29-2015 | | | | 12,417,000 | | | | 12,428,424 | |
Babylon NY BAN (GO) | | | 1.25 | | | | 3-26-2015 | | | | 5,440,000 | | | | 5,445,549 | |
Babylon NY IDA Covanta Babylon Series A (Industrial Development Revenue) | | | 5.00 | | | | 1-1-2018 | | | | 2,500,000 | | | | 2,776,750 | |
BB&T Municipal Trust Class A (, Rabobank LOC) 144Aø | | | 0.23 | | | | 5-15-2015 | | | | 8,932,648 | | | | 8,932,648 | |
Board Cooperative Educational Services Sole Supervisory District RAN (Miscellaneous Revenue) | | | 1.25 | | | | 6-26-2015 | | | | 4,000,000 | | | | 4,010,520 | |
Board Cooperative Educational Services Sole Supervisory District RAN (Miscellaneous Revenue) | | | 1.25 | | | | 10-30-2015 | | | | 5,000,000 | | | | 5,023,700 | |
Board Cooperative Educational Services Sole Supervisory District RAN (Miscellaneous Revenue) | | | 1.50 | | | | 6-30-2015 | | | | 25,900,000 | | | | 25,992,722 | |
Board Cooperative Educational Services Sole Supervisory District RAN (Miscellaneous Revenue) | | | 1.50 | | | | 7-24-2015 | | | | 3,500,000 | | | | 3,515,575 | |
Broome County NY TAN (GO) | | | 1.00 | | | | 3-4-2015 | | | | 12,500,000 | | | | 12,513,875 | |
Corning NY Community College BAN (Miscellaneous Revenue) | | | 1.25 | | | | 3-5-2015 | | | | 5,035,000 | | | | 5,037,215 | |
Deutsche Bank SPEARs/LIFERs Trust Series DB 1087 (GO, HUD Insured, Deutsche Bank LIQ) 144Aø | | | 0.70 | | | | 12-1-2029 | | | | 20,605,000 | | | | 20,605,000 | |
Deutsche Bank SPEARs/LIFERs Trust Series DB 1088 (GO, HUD Insured, Deutsche Bank LIQ) 144Aø | | | 0.58 | | | | 9-1-2029 | | | | 8,945,000 | | | | 8,945,000 | |
Deutsche Bank SPEARs/LIFERs Trust Series DB 1089 (GO, HUD Insured, Deutsche Bank LIQ) 144Aø | | | 0.58 | | | | 6-1-2030 | | | | 15,125,000 | | | | 15,125,000 | |
Deutsche Bank SPEARs/LIFERs Trust Series DB 1099 (GO, HUD Insured, Deutsche Bank LIQ) 144Aø | | | 0.28 | | | | 7-1-2022 | | | | 6,665,000 | | | | 6,665,000 | |
Deutsche Bank SPEARs/LIFERs Trust Series DB 1100 (GO, HUD Insured, Deutsche Bank LIQ) 144Aø | | | 0.28 | | | | 7-1-2022 | | | | 8,555,000 | | | | 8,555,000 | |
Deutsche Bank SPEARs/LIFERs Trust Series DB 1220 (Housing Revenue, Deutsche Bank LIQ) 144Aø | | | 0.50 | | | | 10-1-2053 | | | | 19,865,000 | | | | 19,865,000 | |
| | | | |
| 14 | | Wells Fargo Advantage Ultra Short-Term Municipal Income Fund | | Portfolio of investments—December 31, 2014 (unaudited) |
| | | | | | | | | | | | | | | | |
| Security name | | Interest rate | | | Maturity date | | | Principal | | | Value | |
| | | | |
| New York (continued) | | | | | | | | | | | | | | | | |
Franklin County NY Solid Waste Management Authority BAN (Resource Recovery Revenue) | | | 1.00 | % | | | 3-31-2015 | | | $ | 1,440,000 | | | $ | 1,439,611 | |
Hempstead Town NY Budget Notes (GO) | | | 1.00 | | | | 12-30-2015 | | | | 30,400,000 | | | | 30,609,152 | |
Lockport City NY Anticipation Deficit Financing Notes (GO) 144A | | | 3.38 | | | | 10-27-2015 | | | | 1,571,021 | | | | 1,573,959 | |
Long Beach NY RAN Series A (GO) | | | 1.50 | | | | 9-18-2015 | | | | 2,075,000 | | | | 2,078,777 | |
Long Beach NY RAN Series B (GO) | | | 1.50 | | | | 9-18-2015 | | | | 1,735,000 | | | | 1,741,593 | |
Long Island NY Power Authority Series 2010-A (Utilities Revenue) | | | 5.00 | | | | 5-1-2015 | | | | 1,295,000 | | | | 1,315,875 | |
Metropolitan Transportation Authority New York Refunding Series 2008A-2A (Transportation Revenue) ± | | | 0.42 | | | | 11-1-2026 | | | | 7,000,000 | | | | 7,000,070 | |
Metropolitan Transportation Authority New York Refunding Sub Series B-3A (Transportation Revenue) ± | | | 0.41 | | | | 11-1-2028 | | | | 3,000,000 | | | | 3,000,330 | |
Metropolitan Transportation Authority New York Series 2012A-1 (Transportation Revenue) ± | | | 0.31 | | | | 11-15-2041 | | | | 13,000,000 | | | | 13,001,170 | |
Metropolitan Transportation Authority New York Series A-3 (Transportation Revenue) ø | | | 0.43 | | | | 11-15-2042 | | | | 50,000,000 | | | | 50,000,000 | |
Metropolitan Transportation Authority New York Sub Series 3-3B (Transportation Revenue) ± | | | 0.40 | | | | 11-1-2030 | | | | 42,470,000 | | | | 42,413,515 | |
Metropolitan Transportation Authority New York Sub Series G-2 (Transportation Revenue) ± | | | 0.64 | | | | 11-1-2032 | | | | 34,000,000 | | | | 34,072,760 | |
Metropolitan Transportation Authority New York Transportation Sub Series D-2A (Transportation Revenue, AGM Insured) ± | | | 0.58 | | | | 11-1-2032 | | | | 36,650,000 | | | | 36,795,867 | |
Monroe County NY Industrial Development Corporation St. John Fisher College Series A (Education Revenue) | | | 4.00 | | | | 6-1-2015 | | | | 845,000 | | | | 856,610 | |
Montauk NY Union Free School District TAN (GO) | | | 1.00 | | | | 6-19-2015 | | | | 3,200,000 | | | | 3,206,944 | |
Nassau County NY Health Care Corporation RAN (Health Revenue) | | | 2.25 | | | | 1-15-2015 | | | | 4,640,000 | | | | 4,642,288 | |
Nassau County NY RAN Series A (GO) | | | 2.00 | | | | 3-16-2015 | | | | 8,250,000 | | | | 8,278,545 | |
Nassau County NY RAN Series A (GO) | | | 2.00 | | | | 9-15-2015 | | | | 10,350,000 | | | | 10,470,474 | |
Nassau County NY RAN Series B (GO) | | | 2.00 | | | | 10-15-2015 | | | | 4,450,000 | | | | 4,506,782 | |
New York Dormitory Authority Rochester General Hospital (Health Revenue, Radian Insured) | | | 5.00 | | | | 12-1-2025 | | | | 6,990,000 | | | | 7,296,092 | |
New York Dormitory Authority Rochester General Hospital (Health Revenue, Radian Insured) | | | 5.00 | | | | 12-1-2035 | | | | 18,210,000 | | | | 19,007,416 | |
New York Dormitory Authority Saint Luke’s Roosevelt Hospital (Health Revenue, FHA Insured) | | | 4.80 | | | | 8-15-2025 | | | | 1,000,000 | | | | 1,028,600 | |
New York Dormitory Authority Series B (Education Revenue) | | | 5.00 | | | | 7-1-2015 | | | | 1,080,000 | | | | 1,105,456 | |
New York Energy R&D Authority PCR Keyspan Generation Series A (Industrial Development Revenue, Ambac Insured) ±(m) | | | 1.10 | | | | 10-1-2028 | | | | 3,575,000 | | | | 3,575,000 | |
New York Energy R&D Authority PCR Rochester Gas & Electric Corporation Series C (Industrial Development Revenue, National Insured) ± | | | 5.00 | | | | 8-1-2032 | | | | 4,250,000 | | | | 4,496,713 | |
New York Energy R&D Authority Series A (Resource Recovery Revenue, Ambac Insured) ±(n)(m) | | | 0.42 | | | | 7-1-2015 | | | | 51,960,000 | | | | 51,960,000 | |
New York Environmental Facilities Waste Management Incorporated Project Series A (Resource Recovery Revenue) ± | | | 2.75 | | | | 7-1-2017 | | | | 1,650,000 | | | | 1,737,681 | |
New York Environmental Facility Corporation Solid Waste Management Incorporated Project (Resource Recovery Revenue) ± | | | 0.37 | | | | 5-1-2030 | | | | 500,000 | | | | 499,985 | |
New York Local Government Assistance Corporation Refinance Sub Lien Series A-10V (Tax Revenue, AGM Insured) ±(n)(m) | | | 0.11 | | | | 4-1-2017 | | | | 43,625,000 | | | | 42,970,625 | |
New York Local Government Refunding Series C (Tax Revenue) | | | 5.50 | | | | 4-1-2017 | | | | 2,960,000 | | | | 3,173,386 | |
New York NY Adjusted Fiscal 2008 Sub Series A-3 (GO, AGM Insured) ±(m) | | | 0.68 | | | | 8-1-2026 | | | | 10,000,000 | | | | 10,000,000 | |
New York NY Adjusted Fiscal 2008 Sub Series A-4 (GO, AGM Insured) ±(m) | | | 0.68 | | | | 8-1-2026 | | | | 41,125,000 | | | | 41,125,000 | |
New York NY Adjusted Fiscal 2008 Sub Series C4 (GO, AGM Insured) ±(m) | | | 0.68 | | | | 10-1-2027 | | | | 60,375,000 | | | | 60,375,000 | |
New York NY Adjusted Fiscal 2008 Sub Series J5 (GO, Dexia Credit Local SPA) ø | | | 0.16 | | | | 8-1-2028 | | | | 15,000,000 | | | | 15,000,000 | |
New York NY Adjusted Fiscal 2008 Sub Series J7 (GO) ± | | | 0.51 | | | | 8-1-2021 | | | | 8,325,000 | | | | 8,328,164 | |
| | | | | | |
| Portfolio of investments—December 31, 2014 (unaudited) | | Wells Fargo Advantage Ultra Short-Term Municipal Income Fund | | | 15 | |
| | | | | | | | | | | | | | | | |
| Security name | | Interest rate | | | Maturity date | | | Principal | | | Value | |
| | | | |
| New York (continued) | | | | | | | | | | | | | | | | |
New York NY Housing Development Corporation Series B1 (Miscellaneous Revenue) | | | 3.00 | % | | | 7-1-2015 | | | $ | 13,205,000 | | | $ | 13,380,362 | |
New York NY Housing Development Corporation Series E-1-B (Housing Revenue) | | | 0.75 | | | | 11-1-2016 | | | | 4,000,000 | | | | 4,002,360 | |
New York NY Industrial Development Agency Refunding Transportation Infrastructure Properties, LLC Obligated Group Series A (Airport Revenue) | | | 5.00 | | | | 7-1-2015 | | | | 1,920,000 | | | | 1,957,536 | |
New York NY Municipal Water Finance Authority Series AA3 (Water & Sewer Revenue, Dexia Credit Local SPA) ø | | | 0.16 | | | | 6-15-2032 | | | | 13,500,000 | | | | 13,500,000 | |
New York NY Series A-6 (GO) ± | | | 0.54 | | | | 8-1-2031 | | | | 39,950,000 | | | | 39,960,387 | |
New York NY Series J Sub Series J-2 (GO, AGM Insured) ±(m) | | | 0.59 | | | | 6-1-2036 | | | | 23,175,000 | | | | 23,175,000 | |
New York NY Series J Sub Series J-3 (GO, AGM Insured) ±(m) | | | 0.59 | | | | 6-1-2036 | | | | 31,300,000 | | | | 31,300,000 | |
New York NY Series J-9 (GO) ± | | | 0.45 | | | | 8-1-2027 | | | | 38,000,000 | | | | 38,000,380 | |
New York NY Sub Series C-4 (GO, AGM Insured) ±(m) | | | 0.68 | | | | 1-1-2032 | | | | 1,025,000 | | | | 1,025,000 | |
New York NY Sub Series J-4 (GO) ± | | | 0.59 | | | | 8-1-2025 | | | | 10,845,000 | | | | 10,835,456 | |
New York NY Sub Series J-8 (GO) ± | | | 0.42 | | | | 8-1-2021 | | | | 18,350,000 | | | | 18,353,303 | |
New York NY Sub Series L-5 (GO, Dexia Credit Local SPA) ø | | | 0.16 | | | | 4-1-2035 | | | | 34,000,000 | | | | 34,000,000 | |
New York NY Transitional Finance Authority NYC Recovery Series 3 (Tax Revenue, Dexia Credit Local SPA) ø | | | 0.20 | | | | 11-1-2022 | | | | 21,905,000 | | | | 21,905,000 | |
New York NY Transitional Finance Authority Series 3 Sub Series 3C (Tax Revenue, Dexia Credit Local SPA) ø | | | 0.20 | | | | 11-1-2022 | | | | 8,045,000 | | | | 8,045,000 | |
New York NY Transitional Finance Authority Sub Series 2E (Tax Revenue, Dexia Credit Local SPA) ø | | | 0.20 | | | | 11-1-2022 | | | | 6,005,000 | | | | 6,005,000 | |
New York NY Transitional Finance Authority Sub Series A3 (Tax Revenue, Dexia Credit Local SPA) ø | | | 0.16 | | | | 8-1-2023 | | | | 3,000,000 | | | | 3,000,000 | |
New York Urban Development Corporation (Tax Revenue, Dexia Credit Local LOC, National Insured, Dexia Credit Local LIQ) 144Aø | | | 0.13 | | | | 3-15-2024 | | | | 8,190,000 | | | | 8,190,000 | |
New York Urban Development Corporation Certificate of Participation James A. Farley Post Office Building Refinancing (Miscellaneous Revenue) | | | 4.00 | | | | 2-1-2015 | | | | 31,735,000 | | | | 31,767,052 | |
New York Urban Development Corporation Personal Income Tax Series A (Tax Revenue) | | | 5.00 | | | | 3-15-2018 | | | | 28,890,000 | | | | 32,596,298 | |
North Evans NY Fire District BAN (GO) | | | 1.25 | | | | 3-4-2015 | | | | 1,750,000 | | | | 1,751,453 | |
Orange & Ulster Counties NY Board Cooperative Educational Services Sole Supervisory District RAN Series A (Miscellaneous Revenue) | | | 1.00 | | | | 1-30-2015 | | | | 1,000,000 | | | | 1,000,190 | |
Oyster Bay NY Public Improvement (GO) | | | 3.00 | | | | 8-15-2017 | | | | 500,000 | | | | 520,395 | |
Oyster Bay NY Public Improvement Series A (GO, AGM Insured) | | | 3.00 | | | | 3-1-2015 | | | | 5,980,000 | | | | 6,005,774 | |
Oyster Bay NY Public Improvement Series A (GO, AGM Insured) | | | 3.00 | | | | 3-1-2016 | | | | 1,995,000 | | | | 2,048,865 | |
Ramapo NY BAN Series B (GO) 144A | | | 4.00 | | | | 5-27-2015 | | | | 8,725,000 | | | | 8,765,310 | |
Rockland County NY (GO) | | | 3.50 | | | | 10-1-2015 | | | | 1,365,000 | | | | 1,390,526 | |
Rockland County NY Public Improvement Series C (GO, AGM Insured) | | | 3.00 | | | | 5-1-2016 | | | | 1,175,000 | | | | 1,210,321 | |
Rockland County NY TAN (GO) | | | 2.00 | | | | 3-17-2015 | | | | 7,200,000 | | | | 7,217,280 | |
Suffolk County NY BAN Series A (GO) | | | 1.50 | | | | 5-1-2015 | | | | 22,110,000 | | | | 22,176,551 | |
Suffolk County NY Public Improvement Series B (GO) | | | 4.50 | | | | 11-1-2015 | | | | 1,100,000 | | | | 1,137,444 | |
Suffolk County NY RAN (GO) | | | 1.50 | | | | 3-26-2015 | | | | 16,970,000 | | | | 17,004,619 | |
Suffolk County NY Series A (GO) | | | 4.00 | | | | 4-1-2015 | | | | 1,100,000 | | | | 1,109,966 | |
Suffolk County NY TAN (GO) | | | 2.00 | | | | 7-30-2015 | | | | 10,000,000 | | | | 10,086,600 | |
Suffolk County NY TAN Series B (GO, AGM Insured) | | | 2.00 | | | | 10-15-2015 | | | | 2,860,000 | | | | 2,897,151 | |
Suffolk County NY TAN Series III (GO) | | | 1.50 | | | | 9-11-2015 | | | | 47,800,000 | | | | 48,145,116 | |
Tompkins-Seneca-Tioga NY Board Cooperative Educational Services RAN (Miscellaneous Revenue) | | | 1.25 | | | | 6-30-2015 | | | | 8,500,000 | | | | 8,522,100 | |
Triborough Bridge & Tunnel Authority New York Various Refunding General Sub Series B-4 (Transportation Revenue) ± | | | 0.62 | | | | 1-1-2029 | | | | 4,500,000 | | | | 4,512,645 | |
Triborough Bridge & Tunnel Authority New York Various Refunding General Sub Series B-D (Transportation Revenue) ± | | | 0.69 | | | | 1-1-2031 | | | | 40,800,000 | | | | 40,902,816 | |
Utica NY School District (GO) | | | 2.00 | | | | 7-1-2015 | | | | 1,095,000 | | | | 1,102,534 | |
| | | | |
| 16 | | Wells Fargo Advantage Ultra Short-Term Municipal Income Fund | | Portfolio of investments—December 31, 2014 (unaudited) |
| | | | | | | | | | | | | | | | |
| Security name | | Interest rate | | | Maturity date | | | Principal | | | Value | |
| | | | |
| New York (continued) | | | | | | | | | | | | | | | | |
Utica NY School District (GO) | | | 3.00 | % | | | 7-1-2016 | | | $ | 960,000 | | | $ | 984,893 | |
Utica NY School District (GO) | | | 3.00 | | | | 7-1-2017 | | | | 1,320,000 | | | | 1,363,798 | |
Westchester County NY Hudson Project (Health Revenue) | | | 2.00 | | | | 1-1-2016 | | | | 450,000 | | | | 453,074 | |
Westchester County NY Hudson Project (Health Revenue) | | | 3.00 | | | | 1-1-2017 | | | | 500,000 | | | | 512,230 | |
Westchester County NY Hudson Project (Health Revenue) | | | 3.00 | | | | 1-1-2018 | | | | 450,000 | | | | 462,245 | |
Yonkers NY Series A (GO) | | | 4.00 | | | | 7-1-2015 | | | | 1,000,000 | | | | 1,018,570 | |
Yonkers NY Series A (GO) | | | 4.00 | | | | 7-1-2016 | | | | 2,835,000 | | | | 2,973,490 | |
Yonkers NY Series B (GO) | | | 3.00 | | | | 7-1-2015 | | | | 1,495,000 | | | | 1,515,302 | |
Yonkers NY Series B (GO) | | | 3.00 | | | | 7-1-2016 | | | | 1,290,000 | | | | 1,333,808 | |
Yonkers NY Series C (GO) | | | 4.00 | | | | 8-15-2015 | | | | 1,000,000 | | | | 1,023,000 | |
Yonkers NY Series C (GO) | | | 4.00 | | | | 8-15-2016 | | | | 2,085,000 | | | | 2,194,066 | |
Yonkers NY Series D (GO) | | | 3.00 | | | | 8-15-2015 | | | | 1,925,000 | | | | 1,957,321 | |
Yonkers NY Series D (GO) | | | 3.00 | | | | 8-15-2016 | | | | 660,000 | | | | 683,899 | |
| | | | |
| | | | | | | | | | | | | | | 1,239,101,904 | |
| | | | | | | | | | | | | | | | |
| | | | |
| North Carolina: 0.75% | | | | | | | | | | | | | | | | |
Mecklenburg County NC Series A (Miscellaneous Revenue) ± | | | 0.42 | | | | 2-1-2028 | | | | 2,465,000 | | | | 2,457,901 | |
North Carolina Capital Finance Republic Services Incorporated Project (Resource Recovery Revenue) ø | | | 0.40 | | | | 6-1-2038 | | | | 10,500,000 | | | | 10,500,000 | |
North Carolina Eastern Municipal Power Refunding Series D (Utilities Revenue) ø | | | 5.00 | | | | 1-1-2015 | | | | 11,585,000 | | | | 11,585,000 | |
North Carolina Medical Care Commission Healthcare Facilities Series A (Health Revenue, JPMorgan Chase & Company SPA) ø | | | 0.06 | | | | 11-1-2034 | | | | 11,000,000 | | | | 11,000,000 | |
North Carolina Medical Care Commission Moses Cone Health System (Health Revenue) | | | 5.00 | | | | 10-1-2015 | | | | 500,000 | | | | 517,185 | |
University of North Carolina Chapel Hill Series A (Education Revenue) ± | | | 0.55 | | | | 12-1-2041 | | | | 10,200,000 | | | | 10,206,528 | |
Wilson NC Certificate of Participation Public Facilities Project (Miscellaneous Revenue, AGM Insured) | | | 5.00 | | | | 5-1-2015 | | | | 1,000,000 | | | | 1,015,460 | |
| | | | |
| | | | | | | | | | | | | | | 47,282,074 | |
| | | | | | | | | | | | | | | | |
| | | | |
| North Dakota: 0.20% | | | | | | | | | | | | | | | | |
Dickinson ND Series A (Tax Revenue) | | | 3.00 | | | | 10-1-2015 | | | | 685,000 | | | | 698,529 | |
Dickinson ND Series A (Tax Revenue) | | | 3.00 | | | | 10-1-2017 | | | | 1,100,000 | | | | 1,153,526 | |
Williston ND Series A (GO) | | | 1.75 | | | | 5-1-2015 | | | | 3,500,000 | | | | 3,502,310 | |
Williston ND Series A (GO) | | | 2.50 | | | | 11-1-2015 | | | | 2,195,000 | | | | 2,196,954 | |
Williston ND Series A (Tax Revenue, AGM Insured) | | | 3.00 | | | | 5-1-2016 | | | | 750,000 | | | | 772,478 | |
Williston ND Series A (Tax Revenue, AGM Insured) | | | 3.00 | | | | 5-1-2017 | | | | 3,875,000 | | | | 4,045,074 | |
| | | | |
| | | | | | | | | | | | | | | 12,368,871 | |
| | | | | | | | | | | | | | | | |
| | | | |
| Ohio: 1.43% | | | | | | | | | | | | | | | | |
American Municipal Power OH Incorporated BAN (Utilities Revenue) | | | 1.00 | | | | 10-22-2015 | | | | 7,530,000 | | | | 7,545,587 | |
American Municipal Power OH Incorporated BAN Electric System Improvement Cleveland Power Project (Utilities Revenue) | | | 1.13 | | | | 8-6-2015 | | | | 1,000,000 | | | | 1,000,370 | |
Buckeye OH Tobacco Settlement Finance Authority Series A-1 (Tobacco Revenue) | | | 5.00 | | | | 6-1-2015 | | | | 2,000,000 | | | | 2,030,460 | |
Cleveland OH Airport System Series A (Airport Revenue, Ambac Insured) | | | 5.25 | | | | 1-1-2017 | | | | 2,315,000 | | | | 2,500,223 | |
Cleveland OH Airport System Series C (Airport Revenue, AGM Insured) | | | 5.00 | | | | 1-1-2017 | | | | 2,895,000 | | | | 3,126,137 | |
Hamilton County OH Sewer System Revenue Refunding Metropolitan Sewer District Series A (Water & Sewer Revenue) %% | | | 3.00 | | | | 12-1-2015 | | | | 6,810,000 | | | | 6,938,164 | |
Lancaster OH Port Authority (Utilities Revenue) ± | | | 0.50 | | | | 2-1-2017 | | | | 3,895,000 | | | | 3,896,130 | |
Lancaster OH Port Authority (Utilities Revenue) ± | | | 0.55 | | | | 8-1-2017 | | | | 3,240,000 | | | | 3,244,082 | |
Lancaster OH Port Authority (Utilities Revenue) ± | | | 0.60 | | | | 2-1-2018 | | | | 7,225,000 | | | | 7,230,708 | |
Lancaster OH Port Authority (Utilities Revenue) ± | | | 0.65 | | | | 8-1-2018 | | | | 4,000,000 | | | | 4,011,200 | |
| | | | | | |
| Portfolio of investments—December 31, 2014 (unaudited) | | Wells Fargo Advantage Ultra Short-Term Municipal Income Fund | | | 17 | |
| | | | | | | | | | | | | | | | |
| Security name | | Interest rate | | | Maturity date | | | Principal | | | Value | |
| | | | |
| Ohio (continued) | | | | | | | | | | | | | | | | |
Montgomery County OH Catholic Health Refunding Bond Series B-2 (Health Revenue, U.S. Bank NA SPA) ø | | | 0.10 | % | | | 3-1-2027 | | | $ | 15,000,000 | | | $ | 15,000,000 | |
Muskingum County OH Hospital Facilities Genesis Healthcare System Project (Health Revenue) | | | 5.00 | | | | 2-15-2016 | | | | 750,000 | | | | 775,763 | |
Ohio HFA MFHR Kingsbury Tower Apartments Project Series D (Housing Revenue) | | | 0.65 | | | | 4-1-2015 | | | | 1,250,000 | | | | 1,250,500 | |
Ohio Higher Educational Facility John Carroll University Project (Education Revenue) ± | | | 2.25 | | | | 9-1-2033 | | | | 2,060,000 | | | | 2,092,919 | |
Ohio State Hospital Various Hospitals Health System Incorporated (Health Revenue) ø | | | 0.40 | | | | 1-15-2045 | | | | 5,500,000 | | | | 5,500,000 | |
Ohio University Hospitals Health Systems Series B (Health Revenue) ø | | | 0.35 | | | | 1-15-2033 | | | | 12,720,000 | | | | 12,720,000 | |
Ohio Water Development Authority Waste Management Project (Resource Recovery Revenue) ± | | | 2.25 | | | | 7-1-2021 | | | | 1,250,000 | | | | 1,286,363 | |
Warren County OH Health Care Facilities Otterbein Homes Series A (Health Revenue) | | | 4.00 | | | | 7-1-2016 | | | | 1,760,000 | | | | 1,841,646 | |
Warren County OH Health Care Facilities Otterbein Homes Series A (Health Revenue) | | | 4.00 | | | | 7-1-2017 | | | | 4,375,000 | | | | 4,667,994 | |
Warrensville Heights OH BAN (GO) | | | 2.13 | | | | 8-13-2015 | | | | 1,560,000 | | | | 1,573,010 | |
Warrensville Heights OH Certificate of Participation (GO) | | | 2.38 | | | | 12-15-2015 | | | | 1,600,000 | | | | 1,612,384 | |
| | | | |
| | | | | | | | | | | | | | | 89,843,640 | |
| | | | | | | | | | | | | | | | |
| | | | |
| Oklahoma: 0.20% | | | | | | | | | | | | | | | | |
Cleveland County OK Educational Facilities Moore Public Schools Project (Miscellaneous Revenue) | | | 5.00 | | | | 6-1-2017 | | | | 4,675,000 | | | | 5,134,319 | |
Oklahoma County OK Finance Authority Luther Public Schools Project (Miscellaneous Revenue) | | | 2.00 | | | | 9-1-2015 | | | | 735,000 | | | | 742,916 | |
Oklahoma School District and County Revenue Anticipation Program Certificate of Participation (Miscellaneous Revenue) | | | 0.75 | | | | 6-30-2015 | | | | 6,540,000 | | | | 6,538,757 | |
| | | | |
| | | | | | | | | | | | | | | 12,415,992 | |
| | | | | | | | | | | | | | | | |
| | | | |
| Oregon: 0.29% | | | | | | | | | | | | | | | | |
Gilliam County OR Waste Management Series A (Resource Recovery Revenue) 144A± | | | 0.75 | | | | 8-1-2025 | | | | 3,550,000 | | | | 3,550,675 | |
Oregon Facilities Authority Providence Health & Services Series C (Health Revenue) ± | | | 0.92 | | | | 10-1-2020 | | | | 14,500,000 | | | | 14,558,000 | |
| | | | |
| | | | | | | | | | | | | | | 18,108,675 | |
| | | | | | | | | | | | | | | | |
| | | | |
| Pennsylvania: 3.55% | | | | | | | | | | | | | | | | |
Allentown PA Hospital Authority Sacred Heart Hospital (Health Revenue) | | | 6.00 | | | | 11-15-2016 | | | | 1,940,000 | | | | 2,025,535 | |
Bethlehem PA Area School District Authority (Miscellaneous Revenue) ± | | | 0.54 | | | | 1-1-2030 | | | | 7,995,000 | | | | 8,038,493 | |
Butler County PA General Authority South Park School District Project (Miscellaneous Revenue, AGM Insured, PNC Bank NA SPA) ø | | | 0.08 | | | | 8-1-2027 | | | | 8,960,000 | | | | 8,960,000 | |
Clarion County PA IDA Clarion University Housing Project Series D (Housing Revenue) | | | 3.00 | | | | 7-1-2015 | | | | 175,000 | | | | 176,768 | |
Clarion County PA IDA Clarion University Housing Project Series D (Housing Revenue) | | | 3.00 | | | | 7-1-2016 | | | | 435,000 | | | | 446,079 | |
Clarion County PA IDA Clarion University Housing Project Series D (Housing Revenue) | | | 3.00 | | | | 7-1-2017 | | | | 900,000 | | | | 930,312 | |
Clarion County PA IDA Student Housing (Housing Revenue) | | | 1.05 | | | | 5-1-2016 | | | | 4,000,000 | | | | 4,001,520 | |
Downingtown PA School District (GO) ± | | | 0.41 | | | | 5-1-2030 | | | | 6,000,000 | | | | 5,987,640 | |
Lycoming County PA Authority Association of Independent Colleges & Universities of Pennsylvania Financing Program (Education Revenue) ± | | | 3.00 | | | | 11-1-2035 | | | | 4,000,000 | | | | 4,110,440 | |
Montgomery County PA IDA ACTS Retirement Community Series B (Health Revenue) | | | 5.00 | | | | 11-15-2017 | | | | 2,300,000 | | | | 2,432,135 | |
North Pennsylvania PA Water Authority (Water & Sewer Revenue) ± | | | 0.45 | | | | 11-1-2018 | | | | 700,000 | | | | 700,245 | |
North Pennsylvania PA Water Authority (Water & Sewer Revenue) ± | | | 0.51 | | | | 11-1-2019 | | | | 1,000,000 | | | | 1,001,340 | |
North Pennsylvania PA Water Authority (Water & Sewer Revenue) ± | | | 0.60 | | | | 11-1-2024 | | | | 5,000,000 | | | | 5,007,100 | |
Northampton County PA General Purpose Hospital Authority St. Luke’s Hospital Project Series C (Health Revenue) ± | | | 4.50 | | | | 8-15-2032 | | | | 2,500,000 | | | | 2,634,425 | |
Pennsylvania Department of General Services (Miscellaneous Revenue, AGM Insured) | | | 3.00 | | | | 11-1-2015 | | | | 1,500,000 | | | | 1,531,725 | |
| | | | |
| 18 | | Wells Fargo Advantage Ultra Short-Term Municipal Income Fund | | Portfolio of investments—December 31, 2014 (unaudited) |
| | | | | | | | | | | | | | | | |
| Security name | | Interest rate | | | Maturity date | | | Principal | | | Value | |
| | | | |
| Pennsylvania (continued) | | | | | | | | | | | | | | | | |
Pennsylvania Department of General Services (Miscellaneous Revenue, AGM Insured) | | | 4.00 | % | | | 5-1-2016 | | | $ | 1,225,000 | | | $ | 1,279,329 | |
Pennsylvania Department of General Services Certificate of Participation (Lease Revenue, AGM Insured) | | | 3.00 | | | | 5-1-2015 | | | | 1,385,000 | | | | 1,396,966 | |
Pennsylvania EDFA PPL Energy Supply LLC Project (Utilities Revenue) ± | | | 3.00 | | | | 12-1-2038 | | | | 6,000,000 | | | | 6,075,600 | |
Pennsylvania EDFA PPL Energy Supply Series A (Utilities Revenue) ± | | | 3.00 | | | | 12-1-2038 | | | | 16,750,000 | | | | 16,961,050 | |
Pennsylvania EDFA Solid Waste Disposal Republic Services Incorporated Project (Resource Recovery Revenue) ø | | | 0.40 | | | | 6-1-2044 | | | | 18,050,000 | | | | 18,050,000 | |
Pennsylvania EDFA Solid Waste Refunding Bond Republic Services Incorporated Project Series A (Resource Recovery Revenue) ø | | | 0.37 | | | | 4-1-2019 | | | | 7,000,000 | | | | 7,000,000 | |
Pennsylvania EDFA Waste Management Incorporated Project (Resource Recovery Revenue) ± | | | 0.37 | | | | 8-1-2045 | | | | 24,500,000 | | | | 24,499,510 | |
Pennsylvania EDFA Waste Management Project (Resource Recovery Revenue) ± | | | 1.75 | | | | 12-1-2033 | | | | 15,065,000 | | | | 15,229,058 | |
Pennsylvania HEFAR AICUP Financing Program Mount Aloysius College Project Series R1 (Education Revenue) ± | | | 0.85 | | | | 11-1-2041 | | | | 1,140,000 | | | | 1,140,103 | |
Pennsylvania HEFAR Associated Independent Colleges Series 13 (Education Revenue) ± | | | 0.55 | | | | 11-1-2031 | | | | 2,960,000 | | | | 2,960,326 | |
Pennsylvania Higher Education Facilities Authority Independent Colleges Series I4 (Education Revenue) ± | | | 0.60 | | | | 11-1-2031 | | | | 4,200,000 | | | | 4,201,302 | |
Pennsylvania Turnpike Commission Series B (Transportation Revenue) ± | | | 0.60 | | | | 12-1-2016 | | | | 6,825,000 | | | | 6,845,134 | |
Pennsylvania Turnpike Commission Series B-1 (Transportation Revenue) ± | | | 0.34 | | | | 12-1-2016 | | | | 15,050,000 | | | | 15,050,753 | |
Pennsylvania Turnpike Commission Series B-2 (Transportation Revenue) ± | | | 0.34 | | | | 12-1-2016 | | | | 34,950,000 | | | | 34,954,893 | |
Philadelphia PA Authority for Industrial Development One Benjamin Franklin-C (Miscellaneous Revenue, AGM Insured) | | | 5.00 | | | | 2-15-2016 | | | | 1,000,000 | | | | 1,047,260 | |
Philadelphia PA School District Series A (GO, Ambac Insured) | | | 5.00 | | | | 8-1-2017 | | | | 1,000,000 | | | | 1,027,010 | |
Pittsburgh PA Water & Sewer Authority Series C-1D (Water & Sewer Revenue, AGM Insured) ± | | | 1.40 | | | | 9-1-2035 | | | | 6,145,000 | | | | 6,179,965 | |
University Area PA Joint Authority Refunding Bond (Water & Sewer Revenue) ± | | | 0.45 | | | | 11-1-2028 | | | | 3,300,000 | | | | 3,302,013 | |
Washington County PA Washington Hospital Project (Health Revenue) | | | 4.00 | | | | 7-1-2016 | | | | 1,080,000 | | | | 1,123,999 | |
Washington County PA Washington Hospital Project (Health Revenue) | | | 4.00 | | | | 7-1-2017 | | | | 1,085,000 | | | | 1,145,554 | |
West Mifflin PA School District (GO, AGM Insured) | | | 4.10 | | | | 10-1-2018 | | | | 2,500,000 | | | | 2,564,275 | |
Westmoreland County PA IDA Excela Health Project (Health Revenue) | | | 4.00 | | | | 7-1-2017 | | | | 1,650,000 | | | | 1,731,725 | |
Westmoreland County PA IDA Excela Health Project (Health Revenue) | | | 5.00 | | | | 7-1-2018 | | | | 1,650,000 | | | | 1,802,477 | |
| | | | |
| | | | | | | | | | | | | | | 223,552,059 | |
| | | | | | | | | | | | | | | | |
| | | | |
| Puerto Rico: 1.41% | | | | | | | | | | | | | | | | |
Puerto Rico (GO, AGM Insured) | | | 5.25 | | | | 7-1-2015 | | | | 1,120,000 | | | | 1,136,722 | |
Puerto Rico (Miscellaneous Revenue, AGM Insured) | | | 5.50 | | | | 7-1-2016 | | | | 1,180,000 | | | | 1,219,436 | |
Puerto Rico (Tax Revenue, National Insured) | | | 6.00 | | | | 7-1-2015 | | | | 450,000 | | | | 454,635 | |
Puerto Rico (Tax Revenue, National Insured) | | | 6.50 | | | | 7-1-2015 | | | | 4,550,000 | | | | 4,608,013 | |
Puerto Rico Aqueduct & Senior Lien Series A (Water & Sewer Revenue, AGM Insured) | | | 5.00 | | | | 7-1-2015 | | | | 3,200,000 | | | | 3,242,080 | |
Puerto Rico Commonwealth Government Development Bank Refunding Bond (Miscellaneous Revenue, National Insured) ± | | | 4.75 | | | | 12-1-2015 | | | | 39,790,000 | | | | 39,926,082 | |
Puerto Rico Commonwealth Public Improvement Series A (GO, AGM Insured) | | | 5.00 | | | | 7-1-2017 | | | | 250,000 | | | | 258,903 | |
Puerto Rico Electric Power Authority Refunding Bond Series JJ (Utilities Revenue, National Insured) | | | 5.25 | | | | 7-1-2015 | | | | 3,460,000 | | | | 3,503,527 | |
Puerto Rico Electric Power Authority Series L (Utilities Revenue, National Insured) | | | 5.50 | | | | 7-1-2016 | | | | 1,900,000 | | | | 1,960,686 | |
Puerto Rico Electric Power Authority Series QQ (Utilities Revenue, Syncora Guarantee Incorporated Insured) | | | 5.50 | | | | 7-1-2015 | | | | 1,145,000 | | | | 1,146,111 | |
Puerto Rico Electric Power Authority Series SS (Utilities Revenue, National Insured) | | | 5.00 | | | | 7-1-2015 | | | | 6,100,000 | | | | 6,169,235 | |
Puerto Rico Electric Power Authority Series SS (Utilities Revenue, National Insured) | | | 5.00 | | | | 7-1-2016 | | | | 725,000 | | | | 731,061 | |
Puerto Rico Electric Power Authority Series UU (Utilities Revenue, AGM Insured) | | | 4.00 | | | | 7-1-2015 | | | | 1,200,000 | | | | 1,208,676 | |
Puerto Rico Electric Power Authority Series UU (Utilities Revenue, AGM Insured) | | | 5.00 | | | | 7-1-2015 | | | | 1,000,000 | | | | 1,012,750 | |
| | | | | | |
| Portfolio of investments—December 31, 2014 (unaudited) | | Wells Fargo Advantage Ultra Short-Term Municipal Income Fund | | | 19 | |
| | | | | | | | | | | | | | | | |
| Security name | | Interest rate | | | Maturity date | | | Principal | | | Value | |
| | | | |
| Puerto Rico (continued) | | | | | | | | | | | | | | | | |
Puerto Rico Highway & Transportation Authority Refunding Bond Series Z (Miscellaneous Revenue, National Insured) | | | 6.25 | % | | | 7-1-2015 | | | $ | 5,615,000 | | | $ | 5,627,297 | |
Puerto Rico Highway & Transportation Authority Refunding Series W-FAS-CR (Tax Revenue, AGM Insured) | | | 5.50 | | | | 7-1-2015 | | | | 2,570,000 | | | | 2,608,627 | |
Puerto Rico Highway & Transportation Authority Unrefunded Balance Series W (Tax Revenue, National Insured) | | | 5.50 | | | | 7-1-2015 | | | | 320,000 | | | | 320,701 | |
Puerto Rico Municipal Finance Agency Series C (Miscellaneous Revenue, AGM Insured) | | | 5.00 | | | | 8-1-2016 | | | | 4,820,000 | | | | 4,851,523 | |
Puerto Rico Public Improvement Series A (GO, AGM Insured) | | | 5.00 | | | | 7-1-2015 | | | | 1,265,000 | | | | 1,282,331 | |
Puerto Rico Public Improvement Series A (GO, AGM Insured) | | | 5.00 | | | | 7-1-2015 | | | | 15,000 | | | | 15,031 | |
Puerto Rico Public Improvement Series A (Tax Revenue, National Insured) | | | 5.50 | | | | 7-1-2015 | | | | 1,250,000 | | | | 1,259,813 | |
Puerto Rico Series A (GO, AGM Insured) | | | 5.00 | | | | 7-1-2016 | | | | 6,025,000 | | | | 6,200,448 | |
| | | | |
| | | | | | | | | | | | | | | 88,743,688 | |
| | | | | | | | | | | | | | | | |
| | | | |
| Rhode Island: 0.33% | | | | | | | | | | | | | | | | |
Cranston RI Series B (GO) | | | 3.00 | | | | 7-1-2015 | | | | 1,000,000 | | | | 1,013,530 | |
East Providence RI TAN (GO) | | | 1.50 | | | | 7-30-2015 | | | | 5,000,000 | | | | 5,028,950 | |
Providence RI Series A (GO) | | | 2.00 | | | | 7-15-2015 | | | | 1,770,000 | | | | 1,783,718 | |
Rhode Island Convention Center Authority (Miscellaneous Revenue, National Insured) | | | 5.25 | | | | 5-15-2015 | | | | 4,615,000 | | | | 4,655,797 | |
Rhode Island Health & Education Building Finance Corporation (Health Revenue, AGM Insured) | | | 5.00 | | | | 5-15-2017 | | | | 7,370,000 | | | | 7,774,171 | |
Rhode Island Student Loan Authority Program Senior Series A (Education Revenue) | | | 4.00 | | | | 12-1-2015 | | | | 410,000 | | | | 422,562 | |
| | | | |
| | | | | | | | | | | | | | | 20,678,728 | |
| | | | | | | | | | | | | | | | |
| | | | |
| South Carolina: 0.08% | | | | | | | | | | | | | | | | |
Charleston County SC Care Alliance Health Services Series A (Health Revenue, AGM Insured) | | | 5.13 | | | | 8-15-2015 | | | | 2,000,000 | | | | 2,061,080 | |
Jasper County SC Jasper County School Project (Miscellaneous Revenue) | | | 3.00 | | | | 4-1-2015 | | | | 800,000 | | | | 804,016 | |
Jasper County SC Jasper County School Project (Miscellaneous Revenue) | | | 3.00 | | | | 4-1-2016 | | | | 700,000 | | | | 710,325 | |
Jasper County SC Jasper County School Project (Miscellaneous Revenue) | | | 4.00 | | | | 4-1-2019 | | | | 500,000 | | | | 525,925 | |
Jasper County SC Jasper School Project (Miscellaneous Revenue) | | | 3.00 | | | | 4-1-2018 | | | | 500,000 | | | | 505,250 | |
Jasper County SC School Project (Miscellaneous Revenue) | | | 3.00 | | | | 4-1-2017 | | | | 600,000 | | | | 611,802 | |
| | | | |
| | | | | | | | | | | | | | | 5,218,398 | |
| | | | | | | | | | | | | | | | |
| | | | |
| South Dakota: 0.01% | | | | | | | | | | | | | | | | |
Rapid City SD (Tax Revenue) | | | 3.00 | | | | 12-1-2015 | | | | 915,000 | | | | 928,020 | |
| | | | | | | | | | | | | | | | |
| | | | |
| Tennessee: 0.76% | | | | | | | | | | | | | | | | |
Clarksville TN Natural Gas Acquisition Corporation (Utilities Revenue) | | | 5.00 | | | | 12-15-2016 | | | | 2,585,000 | | | | 2,785,001 | |
Knoxville TN Industrial Development Board Collateralized Housing Golden Age Retirement Village Project (Housing Revenue, GNMA Insured) | | | 0.85 | | | | 12-1-2017 | | | | 5,900,000 | | | | 5,868,966 | |
Lewisburg TN Industrial Development Board Waste Management Project (Resource Recovery Revenue) ± | | | 0.37 | | | | 7-2-2035 | | | | 1,000,000 | | | | 999,980 | |
Metropolitan Government Nashville & Davidson Counties TN Health & Education Facilities Meharry Medical College (Health Revenue, Ambac Insured) | | | 6.00 | | | | 12-1-2016 | | | | 1,085,000 | | | | 1,132,566 | |
Tennessee Energy Acquisition Corporation Series A (Utilities Revenue) | | | 5.00 | | | | 9-1-2015 | | | | 15,575,000 | | | | 15,985,090 | |
Tennessee Energy Acquisition Corporation Series A (Utilities Revenue) | | | 5.00 | | | | 9-1-2016 | | | | 4,315,000 | | | | 4,588,830 | |
Tennessee Energy Acquisition Corporation Series A (Utilities Revenue) | | | 5.25 | | | | 9-1-2017 | | | | 1,360,000 | | | | 1,502,365 | |
Tennessee Energy Acquisition Corporation Series C (Utilities Revenue) | | | 5.00 | | | | 2-1-2016 | | | | 6,630,000 | | | | 6,904,615 | |
Tennessee Energy Acquisition Corporation Series C (Utilities Revenue) | | | 5.00 | | | | 2-1-2017 | | | | 6,875,000 | | | | 7,404,238 | |
Unicoi County TN (GO, National Insured) | | | 5.00 | | | | 4-1-2015 | | | | 565,000 | | | | 570,769 | |
| | | | |
| | | | | | | | | | | | | | | 47,742,420 | |
| | | | | | | | | | | | | | | | |
| | | | |
| 20 | | Wells Fargo Advantage Ultra Short-Term Municipal Income Fund | | Portfolio of investments—December 31, 2014 (unaudited) |
| | | | | | | | | | | | | | | | |
| Security name | | Interest rate | | | Maturity date | | | Principal | | | Value | |
| | | | |
| Texas: 12.09% | | | | | | | | | | | | | | | | |
Arlington TX Special Obligation Dallas Cowboys Series A (Tax Revenue, National Insured) | | | 5.00 | % | | | 8-15-2034 | | | $ | 435,000 | | | $ | 445,853 | |
Central Texas Regional Mobility Authority Senior Lien Series A (Transportation
Revenue) ø | | | 4.00 | | | | 1-1-2015 | | | | 250,000 | | | | 250,000 | |
Central Texas Regional Mobility Authority Sub Lien (Transportation Revenue) ø | | | 4.00 | | | | 1-1-2015 | | | | 400,000 | | | | 400,000 | |
Clear Creek TX Independent School District (GO) ± | | | 3.00 | | | | 2-15-2035 | | | | 4,150,000 | | | | 4,373,810 | |
Coastal Bend TX Health Facilities Development Corporation (Health Revenue, AGM Insured) ±(m) | | | 0.63 | | | | 7-1-2031 | | | | 28,775,000 | | | | 28,775,000 | |
Dallas TX Housing Finance Corporation Fountain Rosemeade Apartments (Housing Revenue) | | | 0.60 | | | | 10-1-2016 | | | | 4,875,000 | | | | 4,851,551 | |
Denton TX Independent School District (GO) ± | | | 2.00 | | | | 8-1-2043 | | | | 16,000,000 | | | | 16,336,160 | |
Galveston TX Hotel Occupancy Series B (Tax Revenue, AGM Insured) | | | 4.00 | | | | 9-1-2016 | | | | 420,000 | | | | 441,651 | |
Gulf Coast TX IDA (Industrial Development Revenue, BNP Paribas LOC) ø | | | 0.60 | | | | 11-1-2019 | | | | 4,850,000 | | | | 4,850,000 | |
Gulf Coast Waste Disposal Authority Waste Management of Texas Series B (Resource Recovery Revenue) ± | | | 0.70 | | | | 5-1-2028 | | | | 5,000,000 | | | | 5,000,250 | |
Harris County TX Cultural Education Mortgage Baylor College (Health Revenue) ± | | | 1.09 | | | | 11-15-2045 | | | | 13,375,000 | | | | 13,398,273 | |
Harris County TX Health Facilities Development Corporation Series A3 (Health Revenue, AGM Insured) ±(m) | | | 0.69 | | | | 7-1-2031 | | | | 32,425,000 | | | | 32,425,000 | |
Harris County TX Health Facilities Development Corporation Series A4 (Health Revenue, AGM Insured) ±(m) | | | 0.75 | | | | 7-1-2031 | | | | 19,925,000 | | | | 19,925,000 | |
Harris County TX Senior Lien Toll Road Series B (Transportation Revenue) ± | | | 0.63 | | | | 8-15-2021 | | | | 25,430,000 | | | | 25,500,695 | |
Houston TX Independent School District Series A (GO) ± | | | 1.00 | | | | 6-1-2039 | | | | 36,650,000 | | | | 36,746,390 | |
Houston TX PFOTER 265 (Water & Sewer Revenue, AGM Insured, Dexia Credit Local LIQ) 144Aø | | | 0.13 | | | | 12-1-2028 | | | | 6,850,000 | | | | 6,850,000 | |
Houston TX Utility System Combined First Lien Security Industry & Financial Market Association Index Series A (Water & Sewer Revenue) ± | | | 0.59 | | | | 5-15-2034 | | | | 29,950,000 | | | | 29,956,589 | |
Katy TX Independent School District Series C (GO, Permanent School Fund Insured) ± | | | 0.75 | | | | 8-15-2036 | | | | 14,500,000 | | | | 14,508,845 | |
Mission TX Economic Development Corporation Republic Services Incorporated Project (Resource Recovery Revenue) ± | | | 0.40 | | | | 1-1-2026 | | | | 20,800,000 | | | | 20,799,792 | |
Mission TX Economic Development Corporation Solid Waste Disposal Revenue Bond Republic Services Incorporated Series A (Resource Recovery Revenue) ø | | | 0.30 | | | | 1-1-2020 | | | | 8,075,000 | | | | 8,075,000 | |
North East TX Independent School District Series A (GO) ± | | | 2.00 | | | | 8-1-2042 | | | | 26,825,000 | | | | 27,495,625 | |
North Texas Higher Education Authority Incorporated Student Loan Series 1 Class A1 (Education Revenue) ø | | | 0.64 | | | | 7-1-2019 | | | | 685,000 | | | | 685,000 | |
Northside TX Independent School District Building Project (GO) ± | | | 2.00 | | | | 8-1-2044 | | | | 1,240,000 | | | | 1,264,118 | |
Northside TX Independent School District Series A (GO) ± | | | 2.00 | | | | 6-1-2039 | | | | 23,935,000 | | | | 24,291,871 | |
Port Arthur TX Navigation District Jefferson County Environmental Facilities Motiva Enterprises LLC Project Series D (Industrial Development Revenue) ø | | | 0.20 | | | | 11-1-2040 | | | | 59,000,000 | | | | 59,000,000 | |
Sam Rayburn TX Municipal Power Agency (Utilities Revenue) | | | 5.00 | | | | 10-1-2015 | | | | 1,710,000 | | | | 1,769,423 | |
San Antonio TX Electric & Gas Refunding System Junior Lien Series A (Utilities Revenue) ±%% | | | 1.00 | | | | 2-1-2033 | | | | 53,000,000 | | | | 53,019,080 | |
San Antonio TX Electric & Gas Refunding System Junior Lien Series B (Utilities Revenue) ± | | | 2.00 | | | | 12-1-2027 | | | | 3,225,000 | | | | 3,271,214 | |
San Antonio TX Junior Lien No Reserve Fund Series F (Water & Sewer Revenue) ± | | | 0.72 | | | | 5-1-2043 | | | | 12,000,000 | | | | 12,072,240 | |
Tarrant County TX Cultural Education Facilities Finance Corporation Hendrick Medical Center (Health Revenue) | | | 4.00 | | | | 9-1-2017 | | | | 550,000 | | | | 588,682 | |
Tarrant County TX Cultural Education Facilities Finance Corporation Series 2973 (Health Revenue, Morgan Stanley Bank LIQ) 144Aø | | | 0.24 | | | | 11-15-2029 | | | | 14,000,000 | | | | 14,000,000 | |
Tarrant County TX Cultural Education Facilities Finance Corporation Texas Health Resources Series C (Health Revenue, JPMorgan Chase & Company SPA) ø | | | 0.14 | | | | 11-15-2033 | | | | 17,300,000 | | | | 17,300,000 | |
Tarrant County TX Health Facilities Development Corporation Cook Children’s Medical Center (Health Revenue) ø | | | 0.08 | | | | 12-1-2039 | | | | 9,540,000 | | | | 9,540,000 | |
Texas Municipal Gas Acquisition & Supply Corporation I Series A (Utilities Revenue) | | | 5.00 | | | | 12-15-2015 | | | | 1,950,000 | | | | 2,024,549 | |
Texas Municipal Gas Acquisition & Supply Corporation II Series A (Utilities Revenue, JPMorgan Chase & Company Guaranteed) ± | | | 0.86 | | | | 9-15-2017 | | | | 23,860,000 | | | | 23,846,877 | |
| | | | | | |
| Portfolio of investments—December 31, 2014 (unaudited) | | Wells Fargo Advantage Ultra Short-Term Municipal Income Fund | | | 21 | |
| | | | | | | | | | | | | | | | |
| Security name | | Interest rate | | | Maturity date | | | Principal | | | Value | |
| | | | |
| Texas (continued) | | | | | | | | | | | | | | | | |
Texas Municipal Gas Acquisition & Supply Corporation II Series B (Utilities Revenue, JPMorgan Chase & Company Guaranteed) ± | | | 0.50 | % | | | 9-15-2017 | | | $ | 61,510,000 | | | $ | 61,593,654 | |
Texas Municipal Gas Acquisition & Supply Corporation III (Utilities Revenue) | | | 5.00 | | | | 12-15-2015 | | | | 2,900,000 | | | | 3,011,128 | |
Texas Municipal Gas Acquisition & Supply Corporation III (Utilities Revenue) | | | 5.00 | | | | 12-15-2016 | | | | 2,500,000 | | | | 2,675,750 | |
Texas Municipal Gas Acquisition & Supply Corporation Senior Lien Series B (Utilities Revenue) ± | | | 0.71 | | | | 12-15-2017 | | | | 3,315,000 | | | | 3,309,563 | |
Texas Municipal Gas Acquisition & Supply Corporation Senior Lien Series D (Utilities Revenue) | | | 5.63 | | | | 12-15-2017 | | | | 1,740,000 | | | | 1,885,951 | |
Texas Public Finance Authority Southern University Financing System (Education Revenue, Build America Mutual Assurance Company Insured) | | | 4.00 | | | | 11-1-2015 | | | | 4,000,000 | | | | 4,114,640 | |
Texas Public Finance Authority Southern University Financing System (Education Revenue, Build America Mutual Assurance Company Insured) | | | 5.00 | | | | 11-1-2016 | | | | 2,080,000 | | | | 2,224,539 | |
Texas Public Finance Authority Unemployment Compensation Series B (Miscellaneous Revenue) | | | 4.00 | | | | 7-1-2017 | | | | 11,500,000 | | | | 12,319,720 | |
Texas Public Finance Authority Unemployment Compensation Series B (Miscellaneous Revenue) | | | 4.00 | | | | 7-1-2018 | | | | 6,000,000 | | | | 6,203,100 | |
Texas SA Energy Acquisition Public Facility Corporation (Utilities Revenue) | | | 5.25 | | | | 8-1-2015 | | | | 2,430,000 | | | | 2,489,584 | |
Texas Transportation Commission State Highway Fund Floating 1st Tier Series B (Tax Revenue) ± | | | 0.39 | | | | 4-1-2032 | | | | 24,000,000 | | | | 24,057,360 | |
Texas Transportation Commission State Highway Series B (Transportation Revenue, Banco Bilboa Vizcaya SPA) ø | | | 0.28 | | | | 4-1-2026 | | | | 40,900,000 | | | | 40,900,000 | |
Texas Transportation Commission Turnpike System First Tier PUTTER Series B (Transportation Revenue) ± | | | 1.25 | | | | 8-15-2042 | | | | 51,525,000 | | | | 51,576,010 | |
Texas Turnpike Authority Central Texas Turnpike System Capital Appreciation First Tier Series A (Transportation Revenue, Ambac Insured) ¤ | | | 0.00 | | | | 8-15-2016 | | | | 5,000,000 | | | | 4,931,300 | |
Weslaco TX Health Facilities Development Various Refunding & Improvement Knapp Medical Center Series A (Health Revenue, Compass Bank LOC) ø | | | 0.33 | | | | 6-1-2038 | | | | 6,950,000 | | | | 6,950,000 | |
Weslaco TX Health Facilities Development Various Refunding & Improvement Knapp Medical Center Series B (Health Revenue, Compass Bank LOC) ø | | | 0.33 | | | | 6-1-2031 | | | | 7,975,000 | | | | 7,975,000 | |
| | | | |
| | | | | | | | | | | | | | | 760,295,837 | |
| | | | | | | | | | | | | | | | |
| | | | |
| Virgin Islands: 0.18% | | | | | | | | | | | | | | | | |
Virgin Islands PFA Senior Lien Matching Fund Loan Series A (Miscellaneous Revenue) | | | 4.00 | | | | 10-1-2016 | | | | 1,700,000 | | | | 1,776,704 | |
Virgin Islands PFA Senior Lien Series B (Miscellaneous Revenue) | | | 5.00 | | | | 10-1-2017 | | | | 6,950,000 | | | | 7,559,515 | |
Virgin Islands PFA Sub Lien Series C (Miscellaneous Revenue) | | | 5.00 | | | | 10-1-2015 | | | | 2,000,000 | | | | 2,054,400 | |
| | | | |
| | | | | | | | | | | | | | | 11,390,619 | |
| | | | | | | | | | | | | | | | |
| | | | |
| Virginia: 0.49% | | | | | | | | | | | | | | | | |
Amelia County VA IDA Waste Management Project (Resource Recovery Revenue) ± | | | 0.63 | | | | 4-1-2027 | | | | 3,700,000 | | | | 3,702,442 | |
Fredericksburg VA EDA Mary Washington Healthcare Group Series A (Health Revenue) ± | | | 1.94 | | | | 8-1-2038 | | | | 3,905,000 | | | | 3,996,221 | |
Greater Richmond VA Convention Center Authority (Tax Revenue) %% | | | 5.00 | | | | 6-15-2016 | | | | 1,000,000 | | | | 1,053,590 | |
Greater Richmond VA Convention Center Authority (Tax Revenue) %% | | | 5.00 | | | | 6-15-2017 | | | | 1,250,000 | | | | 1,359,900 | |
Greater Richmond VA Convention Center Authority (Tax Revenue) %% | | | 5.00 | | | | 6-15-2018 | | | | 1,500,000 | | | | 1,671,405 | |
King George County VA IDA Waste Management Incorporated Series A (Resource Recovery Revenue) ± | | | 0.70 | | | | 6-1-2023 | | | | 10,000,000 | | | | 10,002,200 | |
Louisa VA IDA Virginia Electric & Power Company Series C (Utilities Revenue) ± | | | 0.70 | | | | 11-1-2035 | | | | 6,350,000 | | | | 6,342,634 | |
Virginia Small Business Financing Authority Hampton University (Education Revenue) | | | 3.00 | | | | 10-1-2015 | | | | 1,880,000 | | | | 1,914,197 | |
Virginia Small Business Financing Authority Hampton University (Education Revenue) | | | 3.00 | | | | 10-1-2016 | | | | 955,000 | | | | 988,291 | |
| | | | |
| | | | | | | | | | | | | | | 31,030,880 | |
| | | | | | | | | | | | | | | | |
| | | | |
| 22 | | Wells Fargo Advantage Ultra Short-Term Municipal Income Fund | | Portfolio of investments—December 31, 2014 (unaudited) |
| | | | | | | | | | | | | | | | |
| Security name | | Interest rate | | | Maturity date | | | Principal | | | Value | |
| | | | |
| Washington: 0.15% | | | | | | | | | | | | | | | | |
Grant County WA Public Utility District #2 Series K (Utilities Revenue) ± | | | 0.37 | % | | | 1-1-2044 | | | $ | 4,000,000 | | | $ | 4,000,200 | |
Kent WA (GO) | | | 2.00 | | | | 12-1-2015 | | | | 400,000 | | | | 405,416 | |
Kent WA (GO) | | | 3.00 | | | | 12-1-2016 | | | | 500,000 | | | | 519,885 | |
Washington Housing Finance Commission Market Street Apartments Project Series A (Housing Revenue) | | | 0.55 | | | | 6-1-2016 | | | | 4,750,000 | | | | 4,751,615 | |
| | | | |
| | | | | | | | | | | | | | | 9,677,116 | |
| | | | | | | | | | | | | | | | |
| | | | |
| West Virginia: 0.14% | | | | | | | | | | | | | | | | |
Mason County WV PCR Appalachian Power Company Series L (Industrial Development Revenue) ± | | | 1.63 | | | | 10-1-2022 | | | | 9,000,000 | | | | 9,001,440 | |
| | | | | | | | | | | | | | | | |
| | | | |
| Wisconsin: 0.92% | | | | | | | | | | | | | | | | |
Cameron WI School District BAN (Miscellaneous Revenue) | | | 2.00 | | | | 8-17-2015 | | | | 2,400,000 | | | | 2,408,112 | |
Ellsworth WI Community School District Notes Anticipation Notes (Miscellaneous Revenue) | | | 2.00 | | | | 4-1-2016 | | | | 835,000 | | | | 844,110 | |
Milwaukee County WI Series A (Airport Revenue) | | | 5.00 | | | | 12-1-2015 | | | | 295,000 | | | | 308,051 | |
Milwaukee County WI Series A (Airport Revenue) | | | 5.00 | | | | 12-1-2016 | | | | 345,000 | | | | 372,569 | |
Milwaukee County WI Series B (Airport Revenue) | | | 4.00 | | | | 12-1-2015 | | | | 390,000 | | | | 403,615 | |
Milwaukee County WI Series B (Airport Revenue) | | | 4.00 | | | | 12-1-2016 | | | | 385,000 | | | | 408,458 | |
Milwaukee County WI Series B (Airport Revenue) | | | 4.00 | | | | 12-1-2017 | | | | 385,000 | | | | 415,989 | |
Milwaukee County WI Series F9 (GO) ± | | | 0.49 | | | | 2-15-2032 | | | | 7,500,000 | | | | 7,506,300 | |
Onalaska WI School District BAN (Miscellaneous Revenue) %% | | | 2.00 | | | | 4-15-2015 | | | | 1,850,000 | | | | 1,858,399 | |
Racine WI (GO) | | | 2.00 | | | | 6-1-2015 | | | | 2,000,000 | | | | 2,013,640 | |
Richland Center WI Sewer System BAN Series A (Water & Sewer Revenue) | | | 1.00 | | | | 5-1-2016 | | | | 14,740,000 | | | | 14,748,549 | |
Saint Croix WI Central School District BAN (Miscellaneous Revenue) | | | 2.00 | | | | 3-23-2015 | | | | 3,330,000 | | | | 3,341,988 | |
Waukesha WI Housing Preservation Corporation (Housing Revenue, Johnson Bank LOC) ø | | | 0.96 | | | | 12-1-2042 | | | | 3,865,000 | | | | 3,865,000 | |
Wisconsin Certificate of Participation Master Lease Series B (Miscellaneous Revenue) | | | 2.00 | | | | 3-1-2015 | | | | 1,000,000 | | | | 1,003,130 | |
Wisconsin HEFA Aurora Health Care Series B-1 (Health Revenue) ± | | | 1.25 | | | | 8-15-2025 | | | | 3,420,000 | | | | 3,434,569 | |
Wisconsin HEFA Unity Point Series B-1 (Health Revenue) ø | | | 0.12 | | | | 12-1-2041 | | | | 10,500,000 | | | | 10,500,000 | |
Wisconsin HEFAR Vernon Memorial Healthcare Incorporated Project (Health Revenue) | | | 5.25 | | | | 3-1-2035 | | | | 4,235,000 | | | | 4,268,245 | |
| | | | |
| | | | | | | | | | | | | | | 57,700,724 | |
| | | | | | | | | | | | | | | | |
| | | | |
| Wyoming: 0.24% | | | | | | | | | | | | | | | | |
Sweetwater County WY Pollution Control Refunding PacifiCorp Project Series A (Industrial Development Revenue) ø | | | 0.22 | | | | 1-1-2017 | | | | 15,000,000 | | | | 15,000,000 | |
| | | | | | | | | | | | | | | | |
| | | | |
Total Municipal Obligations (Cost $6,152,604,732) | | | | | | | | | | | | | | | 6,164,938,116 | |
| | | | | | | | | | | | | | | | |
| | | | |
| Other: 0.87% | | | | | | | | | | | | | | | | |
Nuveen Dividend Advantage Municipal Fund 3, Institutional MuniFund Term Preferred Shares ±144A | | | 0.79 | | | | 10-1-2017 | | | | 38,000,000 | | | | 38,001,900 | |
Nuveen New York AMT-Free Municipal Income Fund, Institutional MuniFund Term Preferred Shares ±144A | | | 0.66 | | | | 10-1-2017 | | | | 17,000,000 | | | | 17,003,230 | |
| | | | |
Total Other (Cost $55,000,000) | | | | | | | | | | | | | | | 55,005,130 | |
| | | | | | | | | | | | | | | | |
| | | | |
| | | Yield | | | | | | Shares | | | | |
| Short-Term Investments: 1.85% | | | | | | | | | | | | | | | | |
| | | | |
| Investment Companies: 1.84% | | | | | | | | | | | | | | | | |
Wells Fargo Advantage National Tax-Free Money Market Fund, Institutional Class (u)(l)## | | | 0.01 | | | | | | | | 115,629,459 | | | | 115,629,459 | |
| | | | | | | | | | | | | | | | |
| | | | | | |
| Portfolio of investments—December 31, 2014 (unaudited) | | Wells Fargo Advantage Ultra Short-Term Municipal Income Fund | | | 23 | |
| | | | | | | | | | | | | | | | |
| Security name | | Yield | | | Maturity date | | | Principal | | | Value | |
| | | | |
| U.S. Treasury Securities: 0.01% | | | | | | | | | | | | | | | | |
U.S. Treasury Bill #(z) | | | 0.02 | % | | | 3-19-2015 | | | $ | 400,000 | | | $ | 399,985 | |
| | | | | | | | | | | | | | | | |
| Total Short-Term Investments (Cost $116,029,456) | | | | | | | | | | | | | | | 116,029,444 | |
| | | | | | | | | | | | | | | | |
| | | | | | | | |
| Total investments in securities (Cost $6,333,534,342) * | | | 100.89 | % | | | 6,345,853,940 | |
Other assets and liabilities, net | | | (0.89 | ) | | | (55,828,755 | ) |
| | | | | | | | |
| Total net assets | | | 100.00 | % | | $ | 6,290,025,185 | |
| | | | | | | | |
| ø | Variable rate demand notes are subject to a demand feature which reduces the effective maturity. The maturity date shown represents the final maturity date of the security. The interest rate is determined and reset by the issuer daily, weekly, or monthly depending upon the terms of the security. The rate shown is the rate in effect at period end. |
| ± | Variable rate investment. The rate shown is the rate in effect at period end. |
| (m) | The security is an auction-rate security which has an interest rate that resets at predetermined short-term intervals through a Dutch auction. The rate shown is the rate in effect at period end. |
| (n) | The auction to set the interest rate on the security failed at period end due to insufficient investor interest. A failed auction does not itself cause a default. |
| 144A | The security may be resold in transactions exempt from registration, normally to qualified institutional buyers, pursuant to Rule 144A under the Securities Act of 1933. |
| ¤ | The security is issued in zero coupon form with no periodic interest payments. |
| %% | The security is issued on a when-issued basis. |
| (u) | The rate represents the 7-day annualized yield at period end. |
| (l) | The security represents an affiliate of the Fund as defined in the Investment Company Act of 1940. |
| ## | All or a portion of this security is segregated for when-issued securities. |
| # | All or a portion of this security is segregated as collateral for investments in derivative instruments. |
| (z) | Zero coupon security. The rate represents the current yield to maturity. |
| * | Cost for federal income tax purposes is $6,333,525,167 and unrealized gains (losses) consists of: |
| | | | |
Gross unrealized gains | | $ | 16,234,778 | |
Gross unrealized losses | | | (3,906,005 | ) |
| | | | |
Net unrealized gains | | $ | 12,328,773 | |
| ITEM 7. | DISCLOSURE OF PROXY VOTING POLICIES AND PROCEDURES FOR CLOSED-END MANAGEMENT INVESTMENT COMPANIES |
Not applicable.
| ITEM 8. | PORTFOLIO MANAGERS OF CLOSED-END MANAGEMENT INVESTMENT COMPANIES |
Not applicable.
| ITEM 9. | PURCHASES OF EQUITY SECURITIES BY CLOSED-END MANAGEMEENT INVESTMENT COMPANY AND AFFILIATED PURCHASERS |
Not applicable.
| ITEM 10. | SUBMISSION OF MATTERS TO A VOTE OF SECURITY HOLDERS |
There have been no material changes to the procedures by which shareholders may recommend nominees to the Registrant’s board of trustees that have been implemented since the Registrant’s last provided disclosure in response to the requirements of this Item.
| ITEM 11. | CONTROLS AND PROCEDURES |
(a) The President and Treasurer have concluded that the Wells Fargo Funds Trust (the “Trust”) disclosure controls and procedures (as defined in Rule 30a-3(c) under the Investment Company Act of 1940) provide reasonable assurances that material information relating to the Trust is made known to them by the appropriate persons, based on their evaluation of these controls and procedures as of a date within 90 days of the filing of this report.
(b) There were no significant changes in the Trust’s internal controls over financial reporting (as defined in Rule 30a-3(d) under the Investment Company Act of 1940) that occurred during the second fiscal quarter of the period covered by this report that materially affected, or is reasonably likely to materially affect, the registrant’s internal control over financial reporting.
(a)(1) Not applicable.
(a)(2) Certification pursuant to Rule 30a-2(a) under the Investment Company Act of 1940 (17 CFR 270.30a-2(a)) is filed and attached hereto as Exhibit 99.CERT.
(a)(3) Not applicable.
(b) Certification pursuant to Rule 30a-2(b) under the Investment Company Act of 1940 (17 CFR 270.30a-2(b)) is filed and attached hereto as Exhibit 99.906CERT.
SIGNATURES
Pursuant to the requirements of the Securities Exchange Act of 1934 and the Investment Company Act of 1940, the registrant has duly caused this report to be signed on its behalf by the undersigned, thereunto duly authorized.
| | |
Wells Fargo Funds Trust |
| |
| By: | | |
| | /s/ Karla M. Rabusch |
| |
| | Karla M. Rabusch |
| | President |
| |
| Date: | | February 24, 2015 |
Pursuant to the requirements of the Securities Exchange Act of 1934 and the Investment Company Act of 1940, this report has been signed below by the following persons on behalf of the registrant and in the capacities and on the date indicated.
| | |
Wells Fargo Funds Trust |
| |
By: | | |
| | /s/ Karla M. Rabusch |
| |
| | Karla M. Rabusch |
| | President |
| |
| Date: | | February 24, 2015 |
| | |
By: | | |
| | /s/ Nancy Wiser |
| |
| | Nancy Wiser |
| | Treasurer |
| |
| Date: | | February 24, 2015 |
| | |
| By: | | |
| | /s/ Jeremy DePalma |
| |
| | Jeremy DePalma |
| | Treasurer |
| |
Date: | | February 24, 2015 |