
UNITED STATES
SECURITIES AND EXCHANGE COMMISSION
Washington, D.C. 20549
FORM N-CSRS
CERTIFIED SHAREHOLDER REPORT OF REGISTERED
MANAGEMENT INVESTMENT COMPANIES
Investment Company Act file number: 811-09253
Wells Fargo Funds Trust
(Exact name of registrant as specified in charter)
525 Market St., San Francisco, CA 94105
(Address of principal executive offices) (Zip code)
C. David Messman
Wells Fargo Funds Management, LLC
525 Market St., San Francisco, CA 94105
(Name and address of agent for service)
Registrant’s telephone number, including area code: 800-222-8222
Date of fiscal year end: The following 11 series of Wells Fargo Funds Trust have a January 31 fiscal year end:
Wells Fargo Advantage Alternative Strategies Fund, Wells Fargo Advantage Capital Growth Fund, Wells Fargo Advantage Disciplined U.S. Core Fund, Wells Fargo Advantage Endeavor Select Fund, Wells Fargo Advantage Growth Fund, Wells Fargo Advantage Intrinsic Value Fund, Wells Fargo Advantage Large Cap Core Fund, Wells Fargo Advantage Large Cap Growth Fund, Wells Fargo Advantage Large Company Value Fund, Wells Fargo Advantage Omega Growth Fund, and Wells Fargo Advantage Premier Large Company Growth Fund. Each series has n July 31 fiscal year end.
Date of reporting period: January 31, 2015
ITEM 1. REPORT TO STOCKHOLDERS

Wells Fargo Advantage
Alternative Strategies Fund

Semi-Annual Report
January 31, 2015

Reduce clutter. Save trees.
Sign up for electronic delivery of prospectuses and shareholder reports at wellsfargo.com/advantagedelivery
Contents
The views expressed and any forward-looking statements are as of January 31, 2015, unless otherwise noted, and are those of the Fund managers and/or Wells Fargo Funds Management, LLC. Discussions of individual securities, or the markets generally, or any Wells Fargo Advantage Fund are not intended as individual recommendations. Future events or results may vary significantly from those expressed in any forward-looking statements; the views expressed are subject to change at any time in response to changing circumstances in the market. Wells Fargo Funds Management, LLC and the Fund disclaim any obligation to publicly update or revise any views expressed or forward-looking statements.
NOT FDIC INSURED ¡ NO BANK GUARANTEE ¡ MAY LOSE VALUE
| | | | |
| 2 | | Wells Fargo Advantage Alternative Strategies Fund | | Letter to shareholders (unaudited) |

Karla M. Rabusch
President
Wells Fargo Advantage Funds
Throughout the reporting period, the Federal Open Market Committee (FOMC), which is the Fed’s monetary policymaking body, kept its key interest rate near zero.
Dear Valued Shareholder:
We are pleased to offer you this semi-annual report for the Wells Fargo Advantage Alternative Strategies Fund for the six-month period that ended January 31, 2015. The period was marked by continued geopolitical uncertainty as the U.S. and Europe confronted Russia over Ukraine. In addition, expectations that the U.S. Federal Reserve (Fed) would begin raising interest rates in mid-2015 led the U.S. dollar to strengthen against most major currencies, dampening returns for U.S. dollar–based investors. The S&P 500 Index1, a proxy for U.S. large-cap stocks, ended the period with a 4.37% gain, while the MSCI EAFE Index (Net)2, a proxy for international developed markets, ended the period with a 4.31% loss.
Major central banks continued to provide liquidity to the markets.
Throughout the reporting period, the Federal Open Market Committee (FOMC), which is the Fed’s monetary policymaking body, kept its key interest rate near zero. This tended to support global markets given the Fed’s role in providing investor liquidity. The FOMC ended its bond-buying program in October 2014 and issued guidance that led investors to expect an interest-rate hike in mid-2015.
The European Central Bank maintained a variety of measures aimed at encouraging lending, including making funds available to banks at low interest rates and imposing a negative interest rate on bank deposits held at the central bank. In Japan, the Bank of Japan (BoJ) maintained an aggressive monetary program aimed at combating deflation. In October 2014, the BoJ surprised investors by expanding its program of quantitative easing in an effort to support Japan’s struggling economy.
The backdrop of a challenging geopolitical situation and slowing global growth caused significant volatility.
Geopolitical events were major negatives throughout the reporting period. The ongoing standoff between the West (the U.S., Europe, and their allies) and Russia over Ukraine began in early 2014 and continued throughout the reporting period. As of January 2015, it seemed unlikely that the situation would result in a war between Russia and the West, though a civil war raged in Ukraine. However, economic sanctions from the West against Russia and from Russia against the West contributed to slower growth in Europe, a key Russian trading partner. In the Middle East, the advance of Islamic militants in Syria and Iraq led to airstrikes by the U.S. and its allies.
The U.S. continued to outperform other developed economies, posting 2.6% annualized gross domestic product (GDP) growth in the fourth quarter according to initial estimates. The unemployment rate also continued its slow improvement, declining from 6.1% in August 2014 to 5.7% in January 2015. The positive economic news boosted U.S. stocks and also fed expectations that the Fed would increase the federal funds rate.
| 1 | The S&P 500 Index consists of 500 stocks chosen for market size, liquidity, and industry group representation. It is a market-value-weighted index with each stock’s weight in the index proportionate to its market value. You cannot invest directly in an index. |
| 2 | The Morgan Stanley Capital International Europe, Australasia, and Far East (MSCI EAFE) Index (Net) is an unmanaged group of securities widely regarded by investors to be representations of the stock markets of Europe, Australasia, and the Far East. Calculations for MSCI EAFE use net dividends, which reflect the deduction of withholding taxes. You cannot invest directly in an index. Source: MSCI. MSCI makes no express or implied warranties or representations and shall have no liability whatsoever with respect to any MSCI data contained herein. The MSCI data may not be further redistributed or used as a basis for other indexes or any securities or financial products. This report is not approved, reviewed, or produced by MSCI. |
| | | | | | |
| Letter to shareholders (unaudited) | | Wells Fargo Advantage Alternative Strategies Fund | | | 3 | |
By contrast, the 28 countries in the European Union showed collective annualized GDP growth of 1.3% in the fourth quarter, hurt by sanctions against Russia (a major trading partner) and continued weakness in countries such as Italy and Greece. Slower European growth and expectations of higher U.S. interest rates sent the euro lower during the reporting period, pressuring European returns for U.S. dollar–denominated investors. Late in January, a far-left political party, Syriza, won national elections in Greece with the promise to renegotiate the country’s debt, raising the possibility of credit-related turmoil in the eurozone.
Returns in Asia were dampened by an uneven Japanese economy. An increased sales tax weighed on the country’s consumers, even as a weaker yen boosted exports. After Japan’s economy contracted in the second and third quarters of 2014, the country showed signs of expansion in the fourth quarter. Even though Japan’s stock market posted a gain for the period in local currency terms, the weaker yen turned that gain into a loss for U.S. dollar–based investors.
Don’t let short-term uncertainty derail long-term investment goals.
Periods of uncertainty can present challenges, but experience has taught us that maintaining long-term investment goals can be an effective way to plan for the future. To help you create a sound strategy based on your personal goals and risk tolerance, Wells Fargo Advantage Funds offers more than 100 mutual funds and other investments spanning a wide range of asset classes and investment styles. Although diversification cannot guarantee an investment profit or prevent losses, we believe it can be an effective way to manage investment risk and potentially smooth out overall portfolio performance. We encourage investors to know their investments and to understand that appropriate levels of risk-taking may unlock opportunities.
Thank you for choosing to invest with Wells Fargo Advantage Funds. We appreciate your confidence in us and remain committed to helping you meet your financial needs. For current information about your fund investments, contact your investment professional, visit our website at wellsfargoadvantagefunds.com, or call us directly at 1-800-222-8222. We are available 24 hours a day, 7 days a week.
Sincerely,

Karla M. Rabusch
President
Wells Fargo Advantage Funds
Slower European growth and expectations of higher U.S. interest rates sent the euro lower during the reporting period, pressuring European returns for U.S. dollar–denominated investors.
| | | | |
| 4 | | Wells Fargo Advantage Alternative Strategies Fund | | Performance highlights (unaudited) |
Investment objective
The Fund seeks long-term capital appreciation.
Adviser
Wells Fargo Funds Management, LLC
Subadvisers
The Rock Creek Group, LP
Chilton Investment Company, LLC
Mellon Capital Management Corporation
Passport Capital, LLC
Pine River Capital Management L.P.
River Canyon Fund Management, LLC
Sirios Capital Management, L.P.
Wellington Management Company, LLP
Portfolio managers
Sudhir Krisnamurthi
Ronald van der Wouden
Kenneth LaPlace
Richard L. Chilton, Jr.
Vassilis Dagioglu
John Burbank
Tim Garry
James Clark
Aaron Zimmerman
Lucy DeStefano
Soon Pho
John F. Brennan, Jr.
Kent M. Stahl, CFA
Gregg R. Thomas, CFA
Average annual total returns (%) as of January 31, 2015
| | | | | | | | | | | | | | | | | | |
| | | | | Including sales charge | | | Excluding sales charge | | | Expense ratios1 (%) | |
| | | Inception date | | Since inception | | | Since inception | | | Gross | | | Net2 | |
| Class A (WALTX) | | 4-30-2014 | | | (1.22 | ) | | | 4.80 | | | | 3.84 | | | | 3.11 | |
| Class C (WACTX) | | 4-30-2014 | | | 3.20 | | | | 4.20 | | | | 4.59 | | | | 3.86 | |
| Administrator Class (WADTX) | | 4-30-2014 | | | – | | | | 4.90 | | | | 3.68 | | | | 2.96 | |
| Institutional Class (WAITX) | | 4-30-2014 | | | – | | | | 5.00 | | | | 3.41 | | | | 2.86 | |
| Barclays U.S. Aggregate Bond Index3 | | – | | | – | | | | 5.34 | | | | – | | | | – | |
| Credit Suisse Liquid Alternatives Beta Index4 | | – | | | – | | | | 2.28 | | | | – | | | | – | |
Figures quoted represent past performance, which is no guarantee of future results, and do not reflect taxes that a shareholder may pay on fund distributions or the redemption of fund shares. Investment return and principal value of an investment will fluctuate so that an investor’s shares, when redeemed, may be worth more or less than their original cost. Performance shown without sales charges would be lower if sales charges were reflected. Current performance may be lower or higher than the performance data quoted, which assumes the reinvestment of dividends and capital gains. Current month-end performance is available on the Fund’s website, wellsfargoadvantagefunds.com.
Index returns do not include transaction costs associated with buying and selling securities, any mutual fund fees or expenses, or any taxes. It is not possible to invest directly in an index.
For Class A shares, the maximum front-end sales charge is 5.75%. For Class C shares, the maximum contingent deferred sales charge is 1.00%. Performance including a contingent deferred sales charge assumes the sales charge for the corresponding time period. Administrator Class and Institutional Class shares are sold without a front-end sales charge or contingent deferred sales charge.
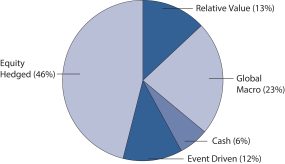
The Fund does not invest directly in hedge funds but pursues similar strategies to those typically used by hedge funds. The Fund invests using alternative investment strategies such as equity hedged, event driven, global macro, and relative value, which are speculative and entail a high degree of risk. Stock values fluctuate in response to the activities of individual companies and general market and economic conditions. Bond values fluctuate in response to the financial condition of individual issuers, general market and economic conditions, and changes in interest rates. Changes in market conditions and government policies may lead to periods of heightened volatility in the bond market and reduced liquidity for certain bonds held by the Fund. In general when interest rates rise, bond values fall and investors may lose principal value. Interest rate changes and their impact on the Fund and its share price can be sudden and unpredictable. Foreign investments are especially volatile and can rise or fall dramatically due to differences in the political and economic conditions of the host country. These risks are generally intensified in emerging markets. The use of derivatives may reduce returns and/or increase volatility. Borrowing money to purchase securities or cover short positions magnifies losses and incurs expenses. Short selling is generally considered speculative, has the potential for unlimited loss, and may involve leverage. Certain investment strategies tend to increase the total risk of an investment (relative to the broader market). The Fund is exposed to high-yield securities risk, mortgage- and asset-backed securities risk, convertible securities risk, loan risk, and smaller-company securities risk. Consult the Fund’s prospectus for additional information on these and other risks.
Please see footnotes on page 5.
| | | | | | |
| Performance highlights (unaudited) | | Wells Fargo Advantage Alternative Strategies Fund | | | 5 | |
| | | | | | | | |
| Sector allocation5 as of January 31, 2015 | |
| | | | Gross exposure (%) | | | | Net exposure (%) | |
Consumer Discretionary | | | 19 | | | | 24 | |
Consumer Staples | | | 5 | | | | 7 | |
Energy | | | 8 | | | | 1 | |
Financials | | | 10 | | | | 14 | |
Health Care | | | 13 | | | | 14 | |
Industrials | | | 9 | | | | 11 | |
Information Technology | | | 12 | | | | 7 | |
Materials | | | 7 | | | | 8 | |
Telecommunication Services | | | 2 | | | | 3 | |
Utilities | | | 0 | | | | 1 | |
Other | | | 15 | | | | 10 | |
| | | | 100 | | | | 100 | |
| | | | |
| Ten largest long position holdings6 (%) as of January 31, 2015 | |
AQR Managed Futures Strategy Fund Class I | | | 7.62 | |
Medtronic plc | | | 1.21 | |
Becton Dickinson & Company | | | 0.89 | |
CF Industries Holdings Incorporated | | | 0.79 | |
Verizon Communications Incorporated | | | 0.78 | |
Google Incorporated Class A | | | 0.73 | |
W.R. Grace & Company | | | 0.71 | |
Time Warner Cable Incorporated | | | 0.69 | |
Actavis plc | | | 0.65 | |
CBS Corporation Class B | | | 0.65 | |
| | | | |
| Ten largest short position holdings6 (%) as of January 31, 2015 | |
SPDR S&P 500 ETF | | | (2.31) | |
International Business Machines Corporation | | | (0.59) | |
Corning Incorporated | | | (0.53) | |
Schlumberger Limited | | | (0.52) | |
Infosys Limited ADR | | | (0.50) | |
Motorola Solutions Incorporated | | | (0.48) | |
Express Scripts Holding Company | | | (0.45) | |
Comcast Corporation Class A | | | (0.44) | |
Adobe Systems Incorporated | | | (0.43) | |
Amazon.com Incorporated | | | (0.41) | |
|
| Strategy allocation7 as of January 31, 2015 |
|
 |
| 1 | Reflects the expense ratios as stated in the most recent prospectuses, which include the impact of 0.12% in acquired fund fees and expenses. The expense ratios shown are subject to change and may differ from the annualized expense ratios shown in the financial highlights of this report, which do not include acquired fund fees and expenses. |
| 2 | The Adviser has committed through November 30, 2015, to waive fees and/or reimburse expenses to the extent necessary to cap the Fund’s Total Annual Fund Operating Expenses After Fee Waiver, excluding certain expenses, at 2.50% for Class A, 3.25% for Class C, 2.35% for Administrator Class, and 2.25% for Institutional Class. After this time, the cap may be increased or the commitment to maintain the cap may be terminated only with the approval of the Board of Trustees. Brokerage commissions, stamp duty fees, interest, taxes, acquired fund fees and expenses, expenses from dividends and interest on short positions, and extraordinary expenses are excluded from the cap. Acquired fund fees and expenses incurred by investments made by The Rock Creek Group, LP, a subadviser of the Fund, are included in the cap. Without this cap, the Fund’s returns would have been lower. |
| 3 | The Barclays U.S. Aggregate Bond Index is a broad-based benchmark that measures the investment-grade, U.S. dollar-denominated, fixed-rate taxable bond market, including Treasuries, government-related and corporate securities, MBS (agency fixed-rate and hybrid ARM passthroughs), ABS, and CMBS. You cannot invest directly in an index. |
| 4 | The Credit Suisse Liquid Alternatives Beta Index reflects the returns of a dynamic basket of liquid, investable market factors selected and weighted in accordance with an algorithm that aims to approximate the aggregate returns of the universe of hedge fund managers, as represented by the Credit Suisse Hedge Fund Index. You cannot invest directly in an index. |
| 5 | Amounts are calculated based on the total long-term investments of the Fund. These percentages are subject to change and may have changed since the date specified. |
| 6 | The ten largest long and short position holdings are calculated based on the value of the securities divided by total net assets of the Fund. Holdings are subject to change and may have changed since the date specified. |
| 7 | Strategy allocation is subject to change and may have changed since the date specified. Cash shown is the sweep cash position of the Fund, and excludes any cash or cash equivalents that may be pledged as collateral for other investments of the Fund. |
| | | | |
| 6 | | Wells Fargo Advantage Alternative Strategies Fund | | Fund expenses (unaudited) |
As a shareholder of the Fund, you incur two types of costs: (1) transaction costs, including sales charges (loads) on purchase payments and contingent deferred sales charges (if any) on redemptions and (2) ongoing costs, including management fees, distribution (12b-1) and/or shareholder service fees, and other Fund expenses. This example is intended to help you understand your ongoing costs (in dollars) of investing in the Fund and to compare these costs with the ongoing costs of investing in other mutual funds.
The example is based on an investment of $1,000 invested at the beginning of the six-month period and held for the entire period from August 1, 2014 to January 31, 2015.
Actual Expenses
The “Actual” line of the table below provides information about actual account values and actual expenses. You may use the information in this line, together with the amount you invested, to estimate the expenses that you paid over the period. Simply divide your account value by $1,000 (for example, an $8,600 account value divided by $1,000 = 8.6), then multiply the result by the number in the “Actual” line under the heading entitled “Expenses paid during period” for your applicable class of shares to estimate the expenses you paid on your account during this period.
Hypothetical Example for Comparison Purposes
The “Hypothetical” line of the table below provides information about hypothetical account values and hypothetical expenses based on the Fund’s actual expense ratio and an assumed rate of return of 5% per year before expenses, which is not the Fund’s actual return. The hypothetical account values and expenses may not be used to estimate the actual ending account balance or expenses you paid for the period. You may use this information to compare the ongoing costs of investing in the Fund and other funds. To do so, compare this 5% hypothetical example with the 5% hypothetical examples that appear in the shareholder reports of the other funds.
Please note that the expenses shown in the table are meant to highlight your ongoing costs only and do not reflect any transactional costs, such as sales charges (loads) and contingent deferred sales charges. Therefore, the “Hypothetical” line of the table is useful in comparing ongoing costs only and will not help you determine the relative total costs of owning different funds. In addition, if these transactional costs were included, your costs would have been higher.
| | | | | | | | | | | | | | | | |
| | | Beginning
account value
8-1-2014 | | | Ending
account value
1-31-2015 | | | Expenses
paid during
the period¹ | | | Net annualized
expense ratio | |
Class A | | | | | | | | | | | | | | | | |
Actual | | $ | 1,000.00 | | | $ | 1,039.70 | | | $ | 15.42 | | | | 3.00 | % |
Hypothetical (5% return before expenses) | | $ | 1,000.00 | | | $ | 1,010.08 | | | $ | 15.20 | | | | 3.00 | % |
Class C | | | | | | | | | | | | | | | | |
Actual | | $ | 1,000.00 | | | $ | 1,035.78 | | | $ | 19.24 | | | | 3.75 | % |
Hypothetical (5% return before expenses) | | $ | 1,000.00 | | | $ | 1,006.30 | | | $ | 18.96 | | | | 3.75 | % |
Administrator Class | | | | | | | | | | | | | | | | |
Actual | | $ | 1,000.00 | | | $ | 1,039.66 | | | $ | 14.65 | | | | 2.85 | % |
Hypothetical (5% return before expenses) | | $ | 1,000.00 | | | $ | 1,010.84 | | | $ | 14.44 | | | | 2.85 | % |
Institutional Class | | | | | | | | | | | | | | | | |
Actual | | $ | 1,000.00 | | | $ | 1,040.65 | | | $ | 14.14 | | | | 2.75 | % |
Hypothetical (5% return before expenses) | | $ | 1,000.00 | | | $ | 1,011.34 | | | $ | 13.94 | | | | 2.75 | % |
| 1 | Expenses paid is equal to the annualized expense ratio of each class multiplied by the average account value over the period, multiplied by the number of days in the most recent fiscal half-year divided by the number of days in the fiscal year (to reflect the one-half-year period). |
| | | | | | |
| Portfolio of investments—January 31, 2015 (unaudited) | | Wells Fargo Advantage Alternative Strategies Fund | | | 7 | |
| | | | | | | | | | | | |
| Security name | | | | | | Shares | | | Value | |
| | | | |
Common Stocks: 50.56% | | | | | | | | | | | | |
| | | | |
Consumer Discretionary: 11.23% | | | | | | | | | | | | |
| | | | |
| Auto Components: 0.01% | | | | | | | | | | | | |
Musashi Seimitsu Industry Company Limited | | | | | | | 800 | | | $ | 15,063 | |
| | | | | | | | | | | | |
| | | | |
| Automobiles: 0.09% | | | | | | | | | | | | |
Chongqing Changchun Automobile Class B | | | | | | | 10,000 | | | | 25,013 | |
Fiat Chrysler Automobiles NV † | | | | | | | 1,545 | | | | 20,377 | |
General Motors Company | | | | | | | 1,836 | | | | 59,890 | |
| | | | |
| | | | | | | | | | | 105,280 | |
| | | | | | | | | | | | |
| | | | |
| Diversified Consumer Services: 0.13% | | | | | | | | | | | | |
Service Corporation International | | | | | | | 4,447 | | | | 100,636 | |
Sotheby’s | | | | | | | 1,152 | | | | 49,018 | |
| | | | |
| | | | | | | | | | | 149,654 | |
| | | | | | | | | | | | |
| | | | |
| Hotels, Restaurants & Leisure: 2.39% | | | | | | | | | | | | |
Bloomin’ Brands Incorporated † | | | | | | | 6,329 | | | | 156,421 | |
Boyd Gaming Corporation † | | | | | | | 4,501 | | | | 58,783 | |
Buffalo Wild Wings Incorporated † | | | | | | | 1,561 | | | | 278,358 | |
Caesars Acquisition Company Class A † | | | | | | | 73 | | | | 572 | |
Caesars Entertainment Corporation † | | | | | | | 520 | | | | 5,663 | |
Carnival Corporation (b) | | | | | | | 7,012 | | | | 308,248 | |
ClubCorp Holdings Incorporated | | | | | | | 1,452 | | | | 24,699 | |
Compass Group plc | | | | | | | 2,366 | | | | 40,793 | |
Domino’s Pizza Incorporated | | | | | | | 4,440 | | | | 439,782 | |
Mandarin Oriental International Limited | | | | | | | 10,000 | | | | 16,377 | |
McDonald’s Corporation | | | | | | | 2,399 | | | | 221,763 | |
Melco Crown Entertainment Limited ADR | | | | | | | 550 | | | | 13,200 | |
Norwegian Cruise Line Holdings Limited † | | | | | | | 277 | | | | 12,122 | |
Pinnacle Entertainment Incorporated † | | | | | | | 1,089 | | | | 23,032 | |
Sands China Limited | | | | | | | 6,800 | | | | 33,105 | |
Sonic Corporation | | | | | | | 10,490 | | | | 317,532 | |
Starbucks Corporation | | | | | | | 1,620 | | | | 141,799 | |
Wyndham Worldwide Corporation | | | | | | | 5,714 | | | | 478,776 | |
Wynn Macau Limited | | | | | | | 26,200 | | | | 72,552 | |
Wynn Resorts Limited (b) | | | | | | | 613 | | | | 90,693 | |
| | | | |
| | | | | | | | | | | 2,734,270 | |
| | | | | | | | | | | | |
| | | | |
| Household Durables: 0.18% | | | | | | | | | | | | |
Electrolux AB Class B | | | | | | | 765 | | | | 23,546 | |
GoPro Incorporated Class A † | | | | | | | 465 | | | | 23,134 | |
Whirlpool Corporation | | | | | | | 792 | | | | 157,671 | |
| | | | |
| | | | | | | | | | | 204,351 | |
| | | | | | | | | | | | |
| | | | |
| Internet & Catalog Retail: 0.38% | | | | | | | | | | | | |
Amazon.com Incorporated † | | | | | | | 173 | | | | 61,334 | |
Groupon Incorporated † | | | | | | | 4,800 | | | | 34,368 | |
HSN Incorporated | | | | | | | 350 | | | | 27,104 | |
Netflix Incorporated † | | | | | | | 114 | | | | 50,365 | |
The accompanying notes are an integral part of these financial statements.
| | | | |
| 8 | | Wells Fargo Advantage Alternative Strategies Fund | | Portfolio of investments—January 31, 2015 (unaudited) |
| | | | | | | | | | | | |
| Security name | | | | | | Shares | | | Value | |
| | | | |
| Internet & Catalog Retail (continued) | | | | | | | | | | | | |
The Priceline Group Incorporated †(b) | | | | | | | 258 | | | $ | 260,446 | |
Wayfair Incorporated Class A † | | | | | | | 285 | | | | 5,575 | |
| | | | |
| | | | | | | | | | | 439,192 | |
| | | | | | | | | | | | |
| | | | |
| Media: 4.98% | | | | | | | | | | | | |
Avex Group Holdings Incorporated | | | | | | | 700 | | | | 11,804 | |
British Sky Broadcasting plc | | | | | | | 1,403 | | | | 19,565 | |
CBS Corporation Class B | | | | | | | 13,500 | | | | 739,936 | |
Charter Communication Incorporated †(b) | | | | | | | 2,500 | | | | 377,788 | |
Clear Channel Outdoor Holdings Incorporated | | | | | | | 7,054 | | | | 63,839 | |
Comcast Corporation Class A | | | | | | | 5,035 | | | | 267,585 | |
DHX Media Limited | | | | | | | 2,695 | | | | 18,367 | |
DIRECTV Group Incorporated †(b) | | | | | | | 7,772 | | | | 662,796 | |
Discovery Communications Incorporated Class A (b) | | | | | | | 835 | | | | 24,202 | |
Discovery Communications Incorporated Class C †(b) | | | | | | | 835 | | | | 23,280 | |
DISH Network Corporation † | | | | | | | 8,910 | | | | 626,818 | |
Liberty Global plc Class A | | | | | | | 6,579 | | | | 307,371 | |
Loral Space & Communications Incorporated † | | | | | | | 275 | | | | 19,775 | |
PagesJaunes SA † | | | | | | | 13,105 | | | | 11,000 | |
ProSiebenSat.1 Media AG | | | | | | | 652 | | | | 28,863 | |
Quebecor Incorporated | | | | | | | 700 | | | | 17,545 | |
SES SA | | | | | | | 1,126 | | | | 41,018 | |
Sirius XM Holdings Incorporated †(b) | | | | | | | 36,095 | | | | 128,137 | |
The Walt Disney Company | | | | | | | 4,700 | | | | 427,512 | |
Time Warner Cable Incorporated (b) | | | | | | | 5,777 | | | | 786,423 | |
Time Warner Incorporated | | | | | | | 7,596 | | | | 591,956 | |
Tribune Media Company Class A | | | | | | | 120 | | | | 7,067 | |
Twenty-First Century Fox Incorporated | | | | | | | 9,889 | | | | 327,920 | |
Viacom Incorporated Class B | | | | | | | 2,643 | | | | 170,262 | |
| | | | |
| | | | | | | | | | | 5,700,829 | |
| | | | | | | | | | | | |
| | | | |
| Multiline Retail: 0.80% | | | | | | | | | | | | |
Dollar General Corporation † | | | | | | | 7,766 | | | | 520,788 | |
Dollar Tree Incorporated † | | | | | | | 2,455 | | | | 174,551 | |
Family Dollar Stores Incorporated | | | | | | | 2,200 | | | | 167,420 | |
Intime Retail Group Company Limited | | | | | | | 34,905 | | | | 21,468 | |
Marks & Spencer Group plc | | | | | | | 2,234 | | | | 16,239 | |
Tuesday Morning Corporation † | | | | | | | 890 | | | | 15,753 | |
| | | | |
| | | | | | | | | | | 916,219 | |
| | | | | | | | | | | | |
| | | | |
| Specialty Retail: 2.05% | | | | | | | | | | | | |
Advance Auto Parts Incorporated | | | | | | | 403 | | | | 64,077 | |
AutoZone Incorporated † | | | | | | | 662 | | | | 395,188 | |
Baoxin Auto Group Limited | | | | | | | 23,000 | | | | 13,166 | |
Best Buy Company Incorporated | | | | | | | 10,054 | | | | 353,901 | |
CST Brands Incorporated | | | | | | | 530 | | | | 22,843 | |
GNC Holdings Incorporated Class A | | | | | | | 382 | | | | 16,938 | |
L Brands Incorporated | | | | | | | 295 | | | | 24,966 | |
Lowe’s Companies Incorporated | | | | | | | 966 | | | | 65,456 | |
Luk Fook Holdings International Limited | | | | | | | 6,000 | | | | 22,266 | |
The accompanying notes are an integral part of these financial statements.
| | | | | | |
| Portfolio of investments—January 31, 2015 (unaudited) | | Wells Fargo Advantage Alternative Strategies Fund | | | 9 | |
| | | | | | | | | | | | |
| Security name | | | | | | Shares | | | Value | |
| | | | |
| Specialty Retail (continued) | | | | | | | | | | | | |
Office Depot Incorporated † | | | | | | | 745 | | | $ | 5,662 | |
Penske Auto Group Incorporated (b) | | | | | | | 4,521 | | | | 218,590 | |
PetSmart Incorporated | | | | | | | 3,463 | | | | 282,944 | |
Signet Jewelers Limited | | | | | | | 200 | | | | 24,222 | |
The Home Depot Incorporated | | | | | | | 3,888 | | | | 405,985 | |
Tiffany & Company | | | | | | | 2,224 | | | | 192,687 | |
TJX Companies Incorporated | | | | | | | 3,341 | | | | 220,306 | |
Vitamin Shoppe Incorporated † | | | | | | | 344 | | | | 14,541 | |
Zhongsheng Group Holdings Limited | | | | | | | 5,345 | | | | 4,650 | |
| | | | |
| | | | | | | | | | | 2,348,388 | |
| | | | | | | | | | | | |
| | | | |
| Textiles, Apparel & Luxury Goods: 0.22% | | | | | | | | | | | | |
Kate Spade & Company † | | | | | | | 270 | | | | 8,513 | |
Michael Kors Holdings Limited † | | | | | | | 40 | | | | 2,832 | |
Nike Incorporated Class B | | | | | | | 2,064 | | | | 190,404 | |
Samsonite International SA | | | | | | | 12,900 | | | | 39,150 | |
Vera Bradley Incorporated † | | | | | | | 561 | | | | 10,698 | |
| | | | |
| | | | | | | | | | | 251,597 | |
| | | | | | | | | | | | |
| | | | |
Consumer Staples: 3.56% | | | | | | | | | | | | |
| | | | |
| Beverages: 1.57% | | | | | | | | | | | | |
Anheuser-Busch InBev NV ADR | | | | | | | 4,103 | | | | 500,853 | |
Anheuser-Busch InBev NV | | | | | | | 773 | | | | 94,280 | |
Brown-Forman Corporation Class B | | | | | | | 3,198 | | | | 284,206 | |
C&C Group plc | | | | | | | 5,152 | | | | 20,081 | |
Constellation Brands Incorporated Class A † | | | | | | | 6,152 | | | | 679,488 | |
Diageo plc | | | | | | | 2,243 | | | | 66,394 | |
Monster Beverage Corporation † | | | | | | | 400 | | | | 46,780 | |
The Coca-Cola Company | | | | | | | 2,035 | | | | 83,781 | |
Treasury Wine Estates Limited | | | | | | | 5,298 | | | | 20,142 | |
| | | | |
| | | | | | | | | | | 1,796,005 | |
| | | | | | | | | | | | |
| | | | |
| Food & Staples Retailing: 0.84% | | | | | | | | | | | | |
Costco Wholesale Corporation | | | | | | | 2,764 | | | | 395,224 | |
CVS Health Corporation | | | | | | | 1,218 | | | | 119,559 | |
E-MART Company Limited | | | | | | | 77 | | | | 14,610 | |
Seven & I Holdings Company Limited | | | | | | | 500 | | | | 18,297 | |
Wal-Mart Stores Incorporated | | | | | | | 4,907 | | | | 416,997 | |
| | | | |
| | | | | | | | | | | 964,687 | |
| | | | | | | | | | | | |
| | | | |
| Food Products: 0.89% | | | | | | | | | | | | |
Archer Daniels Midland Company | | | | | | | 3,323 | | | | 154,951 | |
Greencore Group plc | | | | | | | 6,105 | | | | 28,314 | |
Kraft Foods Group Incorporated | | | | | | | 3,033 | | | | 198,177 | |
Lindt & Spruengli AG | | | | | | | 7 | | | | 440,965 | |
Mondelez International Incorporated Class A | | | | | | | 1,255 | | | | 44,226 | |
Nestle SA | | | | | | | 658 | | | | 50,252 | |
Post Holdings Incorporated † | | | | | | | 360 | | | | 17,010 | |
TreeHouse Foods Incorporated † | | | | | | | 210 | | | | 19,047 | |
The accompanying notes are an integral part of these financial statements.
| | | | |
| 10 | | Wells Fargo Advantage Alternative Strategies Fund | | Portfolio of investments—January 31, 2015 (unaudited) |
| | | | | | | | | | | | |
| Security name | | | | | | Shares | | | Value | |
| | | | |
| Food Products (continued) | | | | | | | | | | | | |
Unilever NV | | | | | | | 434 | | | $ | 18,820 | |
Unilever NV ADR | | | | | | | 1,111 | | | | 48,184 | |
| | | | |
| | | | | | | | | | | 1,019,946 | |
| | | | | | | | | | | | |
| | | | |
| Household Products: 0.06% | | | | | | | | | | | | |
Svenska Cellulosa AB Class B | | | | | | | 703 | | | | 16,945 | |
The Procter & Gamble Company | | | | | | | 613 | | | | 51,670 | |
| | | | |
| | | | | | | | | | | 68,615 | |
| | | | | | | | | | | | |
| | | | |
| Tobacco: 0.20% | | | | | | | | | | | | |
British American Tobacco plc | | | | | | | 1,416 | | | | 79,885 | |
Imperial Tobacco Group plc | | | | | | | 1,194 | | | | 56,081 | |
Lorillard Incorporated | | | | | | | 1,456 | | | | 95,528 | |
| | | | |
| | | | | | | | | | | 231,494 | |
| | | | | | | | | | | | |
| | | | |
Energy: 3.74% | | | | | | | | | | | | |
| | | | |
| Energy Equipment & Services: 0.87% | | | | | | | | | | | | |
Baker Hughes Incorporated (b) | | | | | | | 4,605 | | | | 267,020 | |
Halliburton Company (b) | | | | | | | 13,327 | | | | 532,947 | |
Hilong Holding Limited | | | | | | | 60,000 | | | | 18,523 | |
McDermott International Incorporated † | | | | | | | 1,930 | | | | 4,343 | |
National Oilwell Varco Incorporated | | | | | | | 374 | | | | 20,357 | |
Patterson-UTI Energy Incorporated | | | | | | | 1,085 | | | | 18,619 | |
Petroleum Geo-Services ASA | | | | | | | 865 | | | | 4,703 | |
Schlumberger Limited | | | | | | | 1,349 | | | | 111,144 | |
Trican Well Service Limited | | | | | | | 5,880 | | | | 22,674 | |
| | | | |
| | | | | | | | | | | 1,000,330 | |
| | | | | | | | | | | | |
| | | | |
| Oil, Gas & Consumable Fuels: 2.87% | | | | | | | | | | | | |
Anadarko Petroleum Corporation (b) | | | | | | | 3,104 | | | | 253,752 | |
BG Group plc | | | | | | | 3,161 | | | | 42,161 | |
Cabot Oil & Gas Corporation | | | | | | | 1,071 | | | | 28,382 | |
Cameco Corporation | | | | | | | 800 | | | | 11,257 | |
Canadian Natural Resources Limited | | | | | | | 1,010 | | | | 29,229 | |
Chevron Corporation | | | | | | | 735 | | | | 75,360 | |
China Suntien Green Energy Corporation Class H | | | | | | | 51,590 | | | | 11,542 | |
Cobalt International Energy Incorporated † | | | | | | | 2,820 | | | | 25,718 | |
Devon Energy Corporation (b) | | | | | | | 9,637 | | | | 580,822 | |
DHT Holdings Incorporated | | | | | | | 612 | | | | 4,498 | |
Diamondback Energy Incorporated † | | | | | | | 257 | | | | 17,730 | |
Enbridge Incorporated | | | | | | | 623 | | | | 30,172 | |
Energen Corporation | | | | | | | 139 | | | | 8,815 | |
Energy Transfer Equity LP | | | | | | | 8,031 | | | | 477,202 | |
EOG Resources Incorporated (b) | | | | | | | 3,735 | | | | 332,527 | |
EQT Corporation | | | | | | | 154 | | | | 11,464 | |
Euronav SA | | | | | | | 752 | | | | 8,776 | |
Exxon Mobil Corporation (b) | | | | | | | 5,485 | | | | 479,499 | |
HollyFrontier Corporation | | | | | | | 515 | | | | 18,499 | |
Imperial Oil Limited | | | | | | | 1,365 | | | | 50,746 | |
The accompanying notes are an integral part of these financial statements.
| | | | | | |
| Portfolio of investments—January 31, 2015 (unaudited) | | Wells Fargo Advantage Alternative Strategies Fund | | | 11 | |
| | | | | | | | | | | | |
| Security name | | | | | | Shares | | | Value | |
| | | | |
| Oil, Gas & Consumable Fuels (continued) | | | | | | | | | | | | |
Karoon Gas Australia Limited † | | | | | | | 7,965 | | | $ | 12,956 | |
Marathon Oil Corporation | | | | | | | 625 | | | | 16,625 | |
Marathon Petroleum Corporation | | | | | | | 2,616 | | | | 242,215 | |
PetroChina Company Limited | | | | | | | 24,000 | | | | 26,062 | |
Pioneer Natural Resources Company | | | | | | | 359 | | | | 54,040 | |
Rice Energy Incorporated † | | | | | | | 540 | | | | 9,223 | |
Royal Dutch Shell plc Class B | | | | | | | 900 | | | | 28,494 | |
Southwestern Energy Company †(b) | | | | | | | 12,602 | | | | 312,404 | |
Total SA | | | | | | | 580 | | | | 29,772 | |
Tsakos Energy Navigation Limited | | | | | | | 3,575 | | | | 24,668 | |
Valero Energy Corporation | | | | | | | 378 | | | | 19,989 | |
Western Refining Incorporated | | | | | | | 67 | | | | 2,488 | |
Whiting Petroleum Corporation † | | | | | | | 240 | | | | 7,205 | |
| | | | |
| | | | | | | | | | | 3,284,292 | |
| | | | | | | | | | | | |
| | | | |
Financials: 6.17% | | | | | | | | | | | | |
| | | | |
| Banks: 2.01% | | | | | | | | | | | | |
Alpha Bank AE † | | | | | | | 23,790 | | | | 8,692 | |
Banca Popolare dell’Emilia Romagna Scarl † | | | | | | | 2,944 | | | | 19,855 | |
Banco Bilbao Vizcaya Argentaria SA | | | | | | | 2,519 | | | | 21,518 | |
Bangkok Bank PCL - Non-voting | | | | | | | 2,900 | | | | 16,859 | |
Bank of America Corporation | | | | | | | 48,368 | | | | 732,775 | |
Bank of Nova Scotia | | | | | | | 797 | | | | 38,288 | |
Barclays plc | | | | | | | 2,182 | | | | 7,663 | |
China Construction Bank | | | | | | | 25,500 | | | | 20,412 | |
Citigroup Incorporated | | | | | | | 4,258 | | | | 199,913 | |
Comerica Incorporated (b) | | | | | | | 4,511 | | | | 187,207 | |
HDFC Bank Limited ADR | | | | | | | 453 | | | | 25,812 | |
HSBC Holdings plc | | | | | | | 4,600 | | | | 42,086 | |
Industrial & Commercial Bank of China Limited Class H | | | | | | | 34,000 | | | | 24,246 | |
JPMorgan Chase & Company | | | | | | | 3,203 | | | | 174,179 | |
KeyCorp (b) | | | | | | | 10,190 | | | | 132,368 | |
Mitsubishi UFJ Financial Group Incorporated | | | | | | | 5,200 | | | | 27,634 | |
Piraeus Bank SA † | | | | | | | 29,116 | | | | 16,941 | |
PNC Financial Services Group Incorporated | | | | | | | 913 | | | | 77,185 | |
Signature Bank † | | | | | | | 4,353 | | | | 509,867 | |
Svenska Handelsbanken AB | | | | | | | 399 | | | | 18,894 | |
| | | | |
| | | | | | | | | | | 2,302,394 | |
| | | | | | | | | | | | |
| | | | |
| Capital Markets: 1.26% | | | | | | | | | | | | |
Affiliated Managers Group Incorporated †(b) | | | | | | | 968 | | | | 198,943 | |
Anima Holding SpA † | | | | | | | 5,153 | | | | 25,744 | |
Apollo Global Management LLC (b) | | | | | | | 4,705 | | | | 117,013 | |
Ares Capital Corporation | | | | | | | 795 | | | | 13,237 | |
Banca Generali SpA | | | | | | | 704 | | | | 19,667 | |
BlackRock Incorporated | | | | | | | 158 | | | | 53,801 | |
Fortress Investment Group LLC Class A | | | | | | | 8,650 | | | | 61,761 | |
Henderson Group plc | | | | | | | 7,218 | | | | 25,730 | |
Ichiyoshi Securities Company Limited | | | | | | | 2,500 | | | | 25,293 | |
The accompanying notes are an integral part of these financial statements.
| | | | |
| 12 | | Wells Fargo Advantage Alternative Strategies Fund | | Portfolio of investments—January 31, 2015 (unaudited) |
| | | | | | | | | | | | |
| Security name | | | | | | Shares | | | Value | |
| | | | |
| Capital Markets (continued) | | | | | | | | | | | | |
Julius Baer Group Limited | | | | | | | 1,417 | | | $ | 57,649 | |
Lazard Limited | | | | | | | 1,359 | | | | 62,242 | |
Matsui Securities Company Limited | | | | | | | 680 | | | | 5,751 | |
Motors Liquidation Company GUC Trust | | | | | | | 3,504 | | | | 57,466 | |
The Blackstone Group LP (b) | | | | | | | 8,515 | | | | 317,950 | |
WL Ross Holding Corporation † | | | | | | | 40,000 | | | | 396,400 | |
| | | | |
| | | | | | | | | | | 1,438,647 | |
| | | | | | | | | | | | |
| | | | |
| Consumer Finance: 0.36% | | | | | | | | | | | | |
Ally Financial Incorporated † | | | | | | | 4,400 | | | | 82,324 | |
Discover Financial Services | | | | | | | 3,565 | | | | 193,865 | |
Santander Consumer USA Holdings Incorporated | | | | | | | 7,970 | | | | 142,265 | |
| | | | |
| | | | | | | | | | | 418,454 | |
| | | | | | | | | | | | |
| | | | |
| Diversified Financial Services: 0.71% | | | | | | | | | | | | |
BM&F Bovespa SA | | | | | | | 3,600 | | | | 12,209 | |
Bolsas y Mercados Espanoles | | | | | | | 149 | | | | 6,125 | |
McGraw Hill Financial Incorporated | | | | | | | 4,708 | | | | 421,083 | |
Moody’s Corporation | | | | | | | 4,120 | | | | 376,280 | |
| | | | |
| | | | | | | | | | | 815,697 | |
| | | | | | | | | | | | |
| | | | |
| Insurance: 0.55% | | | | | | | | | | | | |
ACE Limited | | | | | | | 475 | | | | 51,281 | |
Ageas NV | | | | | | | 447 | | | | 15,307 | |
Ambac Financial Group Incorporated †(b) | | | | | | | 5,270 | | | | 128,852 | |
American International Group Incorporated | | | | | | | 1,347 | | | | 65,828 | |
Assicurazioni Generali SpA | | | | | | | 1,365 | | | | 28,809 | |
Delta Lloyd NV | | | | | | | 1,298 | | | | 24,524 | |
Direct Line Insurance Group plc | | | | | | | 5,823 | | | | 27,308 | |
Marsh & McLennan Companies Incorporated | | | | | | | 400 | | | | 21,508 | |
MetLife Incorporated | | | | | | | 1,365 | | | | 63,473 | |
Principal Financial Group Incorporated | | | | | | | 584 | | | | 27,407 | |
T&D Holdings Incorporated | | | | | | | 3,000 | | | | 33,785 | |
W.R. Berkley Corporation | | | | | | | 1,173 | | | | 57,465 | |
Zurich Financial Services AG | | | | | | | 259 | | | | 85,879 | |
| | | | |
| | | | | | | | | | | 631,426 | |
| | | | | | | | | | | | |
| | | | |
| Real Estate Management & Development: 0.24% | | | | | | | | | | | | |
Castellum AB | | | | | | | 1,357 | | | | 21,338 | |
City Developments Limited | | | | | | | 2,000 | | | | 14,824 | |
Deutsche Annington Immobilien SE | | | | | | | 1,324 | | | | 45,985 | |
Deutsche Wohnen AG | | | | | | | 783 | | | | 20,340 | |
Leopalace21 Corporation † | | | | | | | 4,500 | | | | 29,116 | |
Mitsui Fudosan Company Limited | | | | | | | 1,060 | | | | 26,798 | |
Realogy Holdings Corporation † | | | | | | | 2,467 | | | | 114,716 | |
| | | | |
| | | | | | | | | | | 273,117 | |
| | | | | | | | | | | | |
| | | | |
| REITs: 1.04% | | | | | | | | | | | | |
AvalonBay Communities Incorporated | | | | | | | 194 | | | | 33,560 | |
Campus Crest Communities Incorporated | | | | | | | 15,726 | | | | 108,352 | |
The accompanying notes are an integral part of these financial statements.
| | | | | | |
| Portfolio of investments—January 31, 2015 (unaudited) | | Wells Fargo Advantage Alternative Strategies Fund | | | 13 | |
| | | | | | | | | | | | |
| Security name | | | | | | Shares | | | Value | |
| | | | |
| REITs (continued) | | | | | | | | | | | | |
Colony Financial Incorporated (b) | | | | | | | 9,218 | | | $ | 230,911 | |
Columbia Property Trust Incorporated | | | | | | | 564 | | | | 13,801 | |
Icade SA | | | | | | | 196 | | | | 17,108 | |
Lamar Advertising Company (b) | | | | | | | 3,314 | | | | 185,650 | |
National Storage REIT | | | | | | | 15,449 | | | | 17,613 | |
NorthStar Realty Finance Corporation | | | | | | | 29,887 | | | | 565,163 | |
Two Harbors Investment Corporation | | | | | | | 1,568 | | | | 16,182 | |
| | | | |
| | | | | | | | | | | 1,188,340 | |
| | | | | | | | | | | | |
| | | | |
Health Care: 8.88% | | | | | | | | | | | | |
| | | | |
| Biotechnology: 0.74% | | | | | | | | | | | | |
Agios Pharmaceuticals Incorporated † | | | | | | | 115 | | | | 13,331 | |
Alnylam Pharmaceuticals Incorporated † | | | | | | | 285 | | | | 26,742 | |
Arena Pharmaceuticals Incorporated † | | | | | | | 1,865 | | | | 8,038 | |
Biogen Idec Incorporated † | | | | | | | 70 | | | | 27,241 | |
Celgene Corporation † | | | | | | | 250 | | | | 29,790 | |
Five Prime Therapeutics Incorporated † | | | | | | | 230 | | | | 6,051 | |
Gilead Sciences Incorporated †(b) | | | | | | | 5,353 | | | | 561,155 | |
Incyte Corporation † | | | | | | | 315 | | | | 25,109 | |
Innate Pharma SA † | | | | | | | 730 | | | | 7,537 | |
Portola Pharmaceuticals Incorporated † | | | | | | | 291 | | | | 8,273 | |
PTC Therapeutics Incorporated † | | | | | | | 230 | | | | 12,629 | |
Receptos Incorporated † | | | | | | | 74 | | | | 8,153 | |
Regeneron Pharmaceuticals Incorporated † | | | | | | | 117 | | | | 48,749 | |
Regulus Therapeutics Incorporated † | | | | | | | 320 | | | | 6,128 | |
Tesaro Incorporated † | | | | | | | 818 | | | | 32,908 | |
Vertex Pharmaceuticals Incorporated † | | | | | | | 265 | | | | 29,187 | |
| | | | |
| | | | | | | | | | | 851,021 | |
| | | | | | | | | | | | |
| | | | |
| Health Care Equipment & Supplies: 2.35% | | | | | | | | | | | | |
Becton Dickinson & Company | | | | | | | 7,409 | | | | 1,023,035 | |
Corindus Vascular Robotics Incorporated † | | | | | | | 3,835 | | | | 16,299 | |
Intuitive Surgical Incorporated †(b) | | | | | | | 313 | | | | 154,772 | |
Medtronic plc | | | | | | | 19,433 | | | | 1,387,545 | |
Nikkiso Company Limited | | | | | | | 2,000 | | | | 17,601 | |
St. Jude Medical Incorporated | | | | | | | 1,525 | | | | 100,452 | |
| | | | |
| | | | | | | | | | | 2,699,704 | |
| | | | | | | | | | | | |
| | | | |
| Health Care Providers & Services: 2.33% | | | | | | | | | | | | |
Aetna Incorporated | | | | | | | 1,981 | | | | 181,895 | |
Anthem Incorporated (b) | | | | | | | 2,353 | | | | 317,561 | |
Brookdale Senior Living Incorporated † | | | | | | | 4,838 | | | | 163,283 | |
Cardinal Health Incorporated (b) | | | | | | | 4,265 | | | | 354,806 | |
Cigna Corporation | | | | | | | 4,018 | | | | 429,243 | |
Envision Healthcare Holdings Incorporated † | | | | | | | 736 | | | | 25,304 | |
HCA Holdings Incorporated †(b) | | | | | | | 4,286 | | | | 303,448 | |
McKesson Corporation (b) | | | | | | | 1,478 | | | | 314,297 | |
UnitedHealth Group Incorporated (b) | | | | | | | 3,546 | | | | 376,763 | |
Universal Health Services Incorporated Class B (b) | | | | | | | 1,959 | | | | 200,856 | |
| | | | |
| | | | | | | | | | | 2,667,456 | |
| | | | | | | | | | | | |
The accompanying notes are an integral part of these financial statements.
| | | | |
| 14 | | Wells Fargo Advantage Alternative Strategies Fund | | Portfolio of investments—January 31, 2015 (unaudited) |
| | | | | | | | | | | | |
| Security name | | | | | | Shares | | | Value | |
| | | | |
| Health Care Technology: 0.01% | | | | | | | | | | | | |
Careview Communications Incorporated † | | | | | | | 14,890 | | | $ | 6,701 | |
| | | | | | | | | | | | |
| | | | |
| Life Sciences Tools & Services: 0.30% | | | | | | | | | | | | |
Illumina Incorporated † | | | | | | | 156 | | | | 30,450 | |
Thermo Fisher Scientific Incorporated | | | | | | | 2,491 | | | | 311,898 | |
| | | | |
| | | | | | | | | | | 342,348 | |
| | | | | | | | | | | | |
| | | | |
| Pharmaceuticals: 3.15% | | | | | | | | | | | | |
Actavis plc † | | | | | | | 2,791 | | | | 743,913 | |
Allergan Incorporated (b) | | | | | | | 2,897 | | | | 635,196 | |
Almirall SA † | | | | | | | 665 | | | | 11,601 | |
AstraZeneca plc | | | | | | | 1,172 | | | | 83,429 | |
AstraZeneca plc ADR | | | | | | | 1,562 | | | | 110,964 | |
Bristol-Myers Squibb Company | | | | | | | 3,003 | | | | 180,991 | |
China Shineway Pharmaceutical Group Limited | | | | | | | 6,000 | | | | 9,400 | |
Eisai Company Limited | | | | | | | 500 | | | | 24,929 | |
Endo International plc † | | | | | | | 993 | | | | 78,926 | |
Johnson & Johnson | | | | | | | 645 | | | | 64,590 | |
Merck & Company Incorporated (b) | | | | | | | 5,968 | | | | 359,751 | |
Mylan Laboratories Incorporated † | | | | | | | 679 | | | | 36,089 | |
Novartis AG | | | | | | | 293 | | | | 28,554 | |
Ono Pharmaceutical Company Limited | | | | | | | 1,025 | | | | 107,875 | |
Pfizer Incorporated (b) | | | | | | | 6,727 | | | | 210,219 | |
Roche Holdings AG | | | | | | | 404 | | | | 108,885 | |
Takeda Pharmaceutical Company Limited | | | | | | | 720 | | | | 35,971 | |
Teva Pharmaceutical Industries Limited ADR | | | | | | | 5,703 | | | | 324,273 | |
TherapeuticsMD Incorporated † | | | | | | | 7,930 | | | | 32,196 | |
UCB SA | | | | | | | 243 | | | | 18,891 | |
Valeant Pharmaceuticals International Incorporated † | | | | | | | 2,495 | | | | 399,125 | |
| | | | |
| | | | | | | | | | | 3,605,768 | |
| | | | | | | | | | | | |
| | | | |
Industrials: 5.58% | | | | | | | | | | | | |
| | | | |
| Aerospace & Defense: 0.93% | | | | | | | | | | | | |
Airbus Group NV | | | | | | | 6,398 | | | | 340,886 | |
DigitalGlobe Incorporated † | | | | | | | 1,260 | | | | 33,881 | |
Lockheed Martin Corporation | | | | | | | 280 | | | | 52,744 | |
Precision Castparts Corporation (b) | | | | | | | 985 | | | | 197,099 | |
Safran SA | | | | | | | 337 | | | | 22,444 | |
TransDigm Group Incorporated | | | | | | | 1,791 | | | | 368,104 | |
United Technologies Corporation | | | | | | | 427 | | | | 49,011 | |
| | | | |
| | | | | | | | | | | 1,064,169 | |
| | | | | | | | | | | | |
| | | | |
| Air Freight & Logistics: 0.53% | | | | | | | | | | | | |
Deutsche Post AG | | | | | | | 516 | | | | 16,699 | |
FedEx Corporation | | | | | | | 3,129 | | | | 529,145 | |
United Parcel Service Incorporated Class B | | | | | | | 541 | | | | 53,472 | |
UTI Worldwide Incorporated † | | | | | | | 516 | | | | 6,125 | |
| | | | |
| | | | | | | | | | | 605,441 | |
| | | | | | | | | | | | |
The accompanying notes are an integral part of these financial statements.
| | | | | | |
| Portfolio of investments—January 31, 2015 (unaudited) | | Wells Fargo Advantage Alternative Strategies Fund | | | 15 | |
| | | | | | | | | | | | |
| Security name | | | | | | Shares | | | Value | |
| | | | |
| Airlines: 0.01% | | | | | | | | | | | | |
AirAsia Bhd | | | | | | | 21,100 | | | $ | 16,284 | |
| | | | | | | | | | | | |
| | | | |
| Building Products: 0.44% | | | | | | | | | | | | |
Fortune Brands Home & Security Incorporated | | | | | | | 10,560 | | | | 472,982 | |
Owens Corning Incorporated | | | | | | | 202 | | | | 8,090 | |
Sanwa Shutter Corporation | | | | | | | 3,400 | | | | 23,512 | |
Wienerberger AG | | | | | | | 330 | | | | 4,663 | |
| | | | |
| | | | | | | | | | | 509,247 | |
| | | | | | | | | | | | |
| | | | |
| Commercial Services & Supplies: 0.07% | | | | | | | | | | | | |
Clean Harbors Incorporated † | | | | | | | 190 | | | | 8,991 | |
Edenred | | | | | | | 1,335 | | | | 38,369 | |
Knoll Incorporated | | | | | | | 1,402 | | | | 28,727 | |
| | | | |
| | | | | | | | | | | 76,087 | |
| | | | | | | | | | | | |
| | | | |
| Construction & Engineering: 0.07% | | | | | | | | | | | | |
AECOM Technology Corporation † | | | | | | | 2,369 | | | | 60,220 | |
Balfour Beatty plc | | | | | | | 6,219 | | | | 20,795 | |
China Machinery Engineering Corporation | | | | | | | 4,560 | | | | 3,869 | |
| | | | |
| | | | | | | | | | | 84,884 | |
| | | | | | | | | | | | |
| | | | |
| Electrical Equipment: 0.76% | | | | | | | | | | | | |
Acuity Brands Incorporated | | | | | | | 2,768 | | | | 414,896 | |
Capstone Turbine Corporation † | | | | | | | 14,270 | | | | 8,849 | |
Denyo Company Limited | | | | | | | 1,200 | | | | 19,818 | |
Eaton Corporation plc | | | | | | | 100 | | | | 6,309 | |
Generac Holdings Incorporated † | | | | | | | 469 | | | | 20,514 | |
NIDEC Corporation | | | | | | | 245 | | | | 16,672 | |
Polypore International Incorporated † | | | | | | | 20 | | | | 894 | |
Schneider Electric SA | | | | | | | 1,148 | | | | 86,297 | |
SolarCity Corporation †(b) | | | | | | | 5,731 | | | | 278,584 | |
Zumtobel Group AG | | | | | | | 745 | | | | 17,094 | |
| | | | |
| | | | | | | | | | | 869,927 | |
| | | | | | | | | | | | |
| | | | |
| Industrial Conglomerates: 0.42% | | | | | | | | | | | | |
Danaher Corporation | | | | | | | 5,133 | | | | 422,856 | |
Doosan Corporation | | | | | | | 146 | | | | 13,811 | |
General Electric Company | | | | | | | 800 | | | | 19,112 | |
Siemens AG | | | | | | | 242 | | | | 25,564 | |
| | | | |
| | | | | | | | | | | 481,343 | |
| | | | | | | | | | | | |
| | | | |
| Machinery: 0.81% | | | | | | | | | | | | |
Arcam AB † | | | | | | | 991 | | | | 21,402 | |
Atlas Copco AB Class A | | | | | | | 1,713 | | | | 50,720 | |
Kone Oyj Class B | | | | | | | 872 | | | | 39,329 | |
Okuma Corporation | | | | | | | 2,000 | | | | 17,018 | |
Pall Corporation | | | | | | | 4,225 | | | | 408,811 | |
Stanley Black & Decker Incorporated | | | | | | | 2,697 | | | | 252,574 | |
Sulzer AG | | | | | | | 211 | | | | 22,341 | |
The accompanying notes are an integral part of these financial statements.
| | | | |
| 16 | | Wells Fargo Advantage Alternative Strategies Fund | | Portfolio of investments—January 31, 2015 (unaudited) |
| | | | | | | | | | | | |
| Security name | | | | | | Shares | | | Value | |
| | | | |
| Machinery (continued) | | | | | | | | | | | | |
Toro Company | | | | | | | 1,729 | | | $ | 112,229 | |
| | | | |
| | | | | | | | | | | 924,424 | |
| | | | | | | | | | | | |
| | | | |
| Marine: 0.02% | | | | | | | | | | | | |
Kuehne & Nagel International AG | | | | | | | 146 | | | | 20,098 | |
Pacific Basin Shipping Limited | | | | | | | 4,495 | | | | 1,658 | |
| | | | |
| | | | | | | | | | | 21,756 | |
| | | | | | | | | | | | |
| | | | |
| Road & Rail: 1.34% | | | | | | | | | | | | |
Canadian National Railway Company | | | | | | | 750 | | | | 49,414 | |
CSX Corporation | | | | | | | 600 | | | | 19,980 | |
DSV AS | | | | | | | 1,404 | | | | 44,223 | |
Hertz Global Holdings Incorporated † | | | | | | | 205 | | | | 4,207 | |
Hitachi Transport System Limited | | | | | | | 1,500 | | | | 19,624 | |
J.B. Hunt Transport Services Incorporated | | | | | | | 695 | | | | 55,329 | |
Kansas City Southern | | | | | | | 2,797 | | | | 307,922 | |
Old Dominion Freight Line Incorporated †(b) | | | | | | | 2,571 | | | | 180,279 | |
Saia Incorporated †(b) | | | | | | | 3,167 | | | | 133,362 | |
Union Pacific Corporation (b) | | | | | | | 6,108 | | | | 715,919 | |
| | | | |
| | | | | | | | | | | 1,530,259 | |
| | | | | | | | | | | | |
| | | | |
| Trading Companies & Distributors: 0.09% | | | | | | | | | | | | |
Fastenal Company | | | | | | | 621 | | | | 27,572 | |
HD Supply Holdings Incorporated † | | | | | | | 1,000 | | | | 28,830 | |
Mitsubishi Corporation | | | | | | | 400 | | | | 6,978 | |
Rexel SA | | | | | | | 2,251 | | | | 42,057 | |
| | | | |
| | | | | | | | | | | 105,437 | |
| | | | | | | | | | | | |
| | | | |
| Transportation Infrastructure: 0.09% | | | | | | | | | | | | |
BBA Aviation plc | | | | | | | 11,872 | | | | 60,546 | |
Jiangsu Express Company Limited | | | | | | | 30,000 | | | | 37,235 | |
| | | | |
| | | | | | | | | | | 97,781 | |
| | | | | | | | | | | | |
| | | | |
Information Technology: 6.45% | | | | | | | | | | | | |
| | | | |
| Communications Equipment: 0.14% | | | | | | | | | | | | |
Alcatel-Lucent SA ADR † | | | | | | | 3,040 | | | | 10,488 | |
ARRIS Group Incorporated † | | | | | | | 800 | | | | 20,976 | |
Cisco Systems Incorporated | | | | | | | 4,775 | | | | 125,893 | |
ParkerVision Incorporated † | | | | | | | 9,325 | | | | 9,512 | |
| | | | |
| | | | | | | | | | | 166,869 | |
| | | | | | | | | | | | |
| | | | |
| Electronic Equipment, Instruments & Components: 0.09% | | | | | | | | | | | | |
CDW Corporation of Delaware | | | | | | | 86 | | | | 2,946 | |
Largan Precision Company Limited | | | | | | | 400 | | | | 33,263 | |
TE Connectivity Limited | | | | | | | 788 | | | | 52,315 | |
WPG Holdings Company Limited | | | | | | | 14,000 | | | | 17,382 | |
| | | | |
| | | | | | | | | | | 105,906 | |
| | | | | | | | | | | | |
The accompanying notes are an integral part of these financial statements.
| | | | | | |
| Portfolio of investments—January 31, 2015 (unaudited) | | Wells Fargo Advantage Alternative Strategies Fund | | | 17 | |
| | | | | | | | | | | | |
| Security name | | | | | | Shares | | | Value | |
| | | | |
| Internet Software & Services: 2.90% | | | | | | | | | | | | |
21Vianet Group Incorporated ADR † | | | | | | | 330 | | | $ | 5,462 | |
Akamai Technologies Incorporated † | | | | | | | 624 | | | | 36,289 | |
Alibaba Group Holding Limited ADR † | | | | | | | 695 | | | | 61,911 | |
AOL Incorporated † | | | | | | | 473 | | | | 20,457 | |
Baidu Incorporated ADR †(b) | | | | | | | 2,534 | | | | 552,210 | |
CoStar Group Incorporated † | | | | | | | 120 | | | | 22,141 | |
Coupons.com Incorporated † | | | | | | | 1,685 | | | | 24,129 | |
Facebook Incorporated Class A †(b) | | | | | | | 7,456 | | | | 565,986 | |
Gogo Incorporated † | | | | | | | 2,165 | | | | 31,468 | |
Google Incorporated Class A †(b) | | | | | | | 1,558 | | | | 837,503 | |
IAC/InterActive Corporation | | | | | | | 123 | | | | 7,497 | |
Kakaku.com Incorporated | | | | | | | 1,300 | | | | 18,390 | |
LinkedIn Corporation Class A †(b) | | | | | | | 532 | | | | 119,562 | |
Monster Worldwide Incorporated † | | | | | | | 4,490 | | | | 18,544 | |
Pandora Media Incorporated † | | | | | | | 605 | | | | 10,043 | |
Tencent Holdings Limited | | | | | | | 18,628 | | | | 314,190 | |
Twitter Incorporated † | | | | | | | 145 | | | | 5,442 | |
Yahoo! Incorporated † | | | | | | | 15,152 | | | | 666,537 | |
| | | | |
| | | | | | | | | | | 3,317,761 | |
| | | | | | | | | | | | |
| | | | |
| IT Services: 1.25% | | | | | | | | | | | | |
Accenture plc | | | | | | | 580 | | | | 48,737 | |
Automatic Data Processing Incorporated | | | | | | | 471 | | | | 38,872 | |
Cognizant Technology Solutions Corporation Class A †(b) | | | | | | | 8,689 | | | | 470,336 | |
FleetCor Technologies Incorporated † | | | | | | | 2,352 | | | | 330,456 | |
MasterCard Incorporated Class A | | | | | | | 3,463 | | | | 284,070 | |
Optimal Payments plc † | | | | | | | 7,215 | | | | 37,340 | |
Visa Incorporated Class A | | | | | | | 879 | | | | 224,066 | |
| | | | |
| | | | | | | | | | | 1,433,877 | |
| | | | | | | | | | | | |
| | | | |
| Semiconductors & Semiconductor Equipment: 0.51% | | | | | | | | | | | | |
Applied Materials Incorporated | | | | | | | 1,300 | | | | 29,692 | |
GCL-Poly Energy Holdings Limited † | | | | | | | 85,865 | | | | 18,644 | |
Intel Corporation | | | | | | | 1,440 | | | | 47,578 | |
Maxim Integrated Products Incorporated | | | | | | | 2,737 | | | | 90,567 | |
Micron Technology Incorporated † | | | | | | | 1,089 | | | | 31,870 | |
NXP Semiconductors NV † | | | | | | | 791 | | | | 62,758 | |
SK Hynix Incorporated | | | | | | | 465 | | | | 20,086 | |
Spansion Incorporated Class A † | | | | | | | 330 | | | | 11,702 | |
Sumco Corporation | | | | | | | 7,545 | | | | 126,626 | |
SunEdison Incorporated † | | | | | | | 1,570 | | | | 29,406 | |
SunEdison Semiconductor Limited † | | | | | | | 1,540 | | | | 30,122 | |
SunPower Corporation † | | | | | | | 495 | | | | 11,939 | |
Taiwan Semiconductor Manufacturing Company Limited | | | | | | | 10,300 | | | | 45,296 | |
Taiwan Semiconductor Manufacturing Company Limited ADR | | | | | | | 1,200 | | | | 27,252 | |
| | | | |
| | | | | | | | | | | 583,538 | |
| | | | | | | | | | | | |
| | | | |
| Software: 0.53% | | | | | | | | | | | | |
Activision Blizzard Incorporated | | | | | | | 1,105 | | | | 23,089 | |
Adobe Systems Incorporated † | | | | | | | 335 | | | | 23,494 | |
The accompanying notes are an integral part of these financial statements.
| | | | |
| 18 | | Wells Fargo Advantage Alternative Strategies Fund | | Portfolio of investments—January 31, 2015 (unaudited) |
| | | | | | | | | | | | |
| Security name | | | | | | Shares | | | Value | |
| | | | |
| Software (continued) | | | | | | | | | | | | |
Cadence Design Systems Incorporated † | | | | | | | 1,621 | | | $ | 29,162 | |
CDK Global Incorporated | | | | | | | 1,151 | | | | 51,979 | |
EnerNOC Incorporated † | | | | | | | 1,310 | | | | 22,558 | |
Intuit Incorporated | | | | | | | 920 | | | | 79,874 | |
Microsoft Corporation | | | | | | | 2,467 | | | | 99,667 | |
Oracle Corporation | | | | | | | 1,042 | | | | 43,649 | |
Salesforce.com Incorporated † | | | | | | | 2,245 | | | | 126,730 | |
SAP AG ADR | | | | | | | 1,532 | | | | 100,132 | |
Tangoe Incorporated † | | | | | | | 570 | | | | 6,515 | |
| | | | |
| | | | | | | | | | | 606,849 | |
| | | | | | | | | | | | |
| | | | |
| Technology Hardware, Storage & Peripherals: 1.03% | | | | | | | | | | | | |
Apple Incorporated | | | | | | | 4,241 | | | | 496,876 | |
EMC Corporation | | | | | | | 4,978 | | | | 129,080 | |
Samsung Electronics Company Limited | | | | | | | 17 | | | | 21,104 | |
Stratasys Limited † | | | | | | | 220 | | | | 17,488 | |
Western Digital Corporation (b) | | | | | | | 5,272 | | | | 512,597 | |
| | | | |
| | | | | | | | | | | 1,177,145 | |
| | | | | | | | | | | | |
| | | | |
Materials: 3.29% | | | | | | | | | | | | |
| | | | |
| Chemicals: 2.79% | | | | | | | | | | | | |
Akzo Nobel NV | | | | | | | 286 | | | | 20,604 | |
BASF SE | | | | | | | 232 | | | | 20,750 | |
Cabot Corporation | | | | | | | 510 | | | | 21,629 | |
Celanese Corporation Series A | | | | | | | 471 | | | | 25,321 | |
CF Industries Holdings Incorporated (b) | | | | | | | 2,975 | | | | 908,506 | |
E.I. du Pont de Nemours & Company | | | | | | | 700 | | | | 49,847 | |
Ecolab Incorporated | | | | | | | 3,852 | | | | 399,722 | |
Givaudan SA | | | | | | | 5 | | | | 9,114 | |
Methanex Corporation | | | | | | | 440 | | | | 19,404 | |
Monsanto Company | | | | | | | 940 | | | | 110,901 | |
Platform Specialty Products Corporation † | | | | | | | 1,850 | | | | 38,850 | |
Platform Specialty Products Corporation - Private Placement Shares †(a)(i) | | | | | | | 95 | | | | 1,995 | |
Praxair Incorporated | | | | | | | 444 | | | | 53,542 | |
PTT Global Chemical PCL | | | | | | | 11,500 | | | | 19,852 | |
The Sherwin-Williams Company (b) | | | | | | | 2,433 | | | | 660,000 | |
W.R. Grace & Company † | | | | | | | 9,396 | | | | 814,445 | |
Wacker Chemie AG | | | | | | | 200 | | | | 21,415 | |
| | | | |
| | | | | | | | | | | 3,195,897 | |
| | | | | | | | | | | | |
| | | | |
| Construction Materials: 0.18% | | | | | | | | | | | | |
Eagle Materials Incorporated | | | | | | | 612 | | | | 43,587 | |
Headwaters Incorporated † | | | | | | | 824 | | | | 11,602 | |
Holcim Limited | | | | | | | 273 | | | | 19,086 | |
Lafarge SA | | | | | | | 190 | | | | 13,018 | |
Martin Marietta Materials Incorporated | | | | | | | 1,152 | | | | 124,116 | |
| | | | |
| | | | | | | | | | | 211,409 | |
| | | | | | | | | | | | |
| | | | |
| Containers & Packaging: 0.04% | | | | | | | | | | | | |
Packaging Corporation of America | | | | | | | 575 | | | | 43,614 | |
| | | | | | | | | | | | |
The accompanying notes are an integral part of these financial statements.
| | | | | | |
| Portfolio of investments—January 31, 2015 (unaudited) | | Wells Fargo Advantage Alternative Strategies Fund | | | 19 | |
| | | | | | | | | | | | |
| Security name | | | | | | Shares | | | Value | |
| | | | |
| Metals & Mining: 0.19% | | | | | | | | | | | | |
Barrick Gold Corporation | | | | | | | 6,007 | | | $ | 76,769 | |
BHP Billiton plc | | | | | | | 594 | | | | 12,902 | |
Constellium NV Class A † | | | | | | | 1,053 | | | | 19,386 | |
Freeport-McMoRan Copper & Gold Incorporated Class B | | | | | | | 2,070 | | | | 34,797 | |
Glencore International plc | | | | | | | 3,683 | | | | 13,732 | |
Reliance Steel & Aluminum Company | | | | | | | 735 | | | | 38,492 | |
Rio Tinto plc ADR | | | | | | | 579 | | | | 25,551 | |
| | | | |
| | | | | | | | | | | 221,629 | |
| | | | | | | | | | | | |
| | | | |
| Paper & Forest Products: 0.09% | | | | | | | | | | | | |
International Paper Company | | | | | | | 1,440 | | | | 75,830 | |
Norbord Incorporated | | | | | | | 1,120 | | | | 24,926 | |
| | | | |
| | | | | | | | | | | 100,756 | |
| | | | | | | | | | | | |
| | | | |
Telecommunication Services: 1.34% | | | | | | | | | | | | |
| | | | |
| Diversified Telecommunication Services: 0.91% | | | | | | | | | | | | |
Nippon Telegraph & Telephone Corporation | | | | | | | 1,050 | | | | 62,146 | |
Telenor ASA | | | | | | | 3,692 | | | | 79,314 | |
Verizon Communications Incorporated (b) | | | | | | | 19,530 | | | | 892,716 | |
| | | | |
| | | | | | | | | | | 1,034,176 | |
| | | | | | | | | | | | |
| | | | |
| Wireless Telecommunication Services: 0.43% | | | | | | | | | | | | |
NTT DoCoMo Incorporated | | | | | | | 4,260 | | | | 71,914 | |
SoftBank Corporation | | | | | | | 400 | | | | 23,541 | |
T-Mobile USA Incorporated † | | | | | | | 12,714 | | | | 383,709 | |
Total Access Communication PCL | | | | | | | 5,200 | | | | 14,918 | |
| | | | |
| | | | | | | | | | | 494,082 | |
| | | | | | | | | | | | |
| | | | |
Utilities: 0.32% | | | | | | | | | | | | |
| | | | |
| Electric Utilities: 0.13% | | | | | | | | | | | | |
Cheung Kong Infrastructure Holdings Limited | | | | | | | 3,900 | | | | 32,008 | |
Duke Energy Corporation | | | | | | | 300 | | | | 26,142 | |
Edison International | | | | | | | 300 | | | | 20,445 | |
Hokkaido Electric Power Company Incorporated † | | | | | | | 3,600 | | | | 29,079 | |
Kyushu Electric Power Company Incorporated † | | | | | | | 1,600 | | | | 15,440 | |
The Southern Company | | | | | | | 230 | | | | 11,666 | |
Xcel Energy Incorporated | | | | | | | 350 | | | | 13,136 | |
| | | | |
| | | | | | | | | | | 147,916 | |
| | | | | | | | | | | | |
| | | | |
| Gas Utilities: 0.07% | | | | | | | | | | | | |
Snam SpA | | | | | | | 5,980 | | | | 29,259 | |
Towngas China Company Limited | | | | | | | 14,000 | | | | 12,226 | |
Xinao Gas Holdings Limited | | | | | | | 6,000 | | | | 35,468 | |
| | | | |
| | | | | | | | | | | 76,953 | |
| | | | | | | | | | | | |
| | | | |
| Independent Power & Renewable Electricity Producers: 0.07% | | | | | | | | | | | | |
China Longyuan Power Group | | | | | | | 45,415 | | | | 48,743 | |
Vivint Solar Incorporated † | | | | | | | 3,880 | | | | 30,807 | |
| | | | |
| | | | | | | | | | | 79,550 | |
| | | | | | | | | | | | |
The accompanying notes are an integral part of these financial statements.
| | | | |
| 20 | | Wells Fargo Advantage Alternative Strategies Fund | | Portfolio of investments—January 31, 2015 (unaudited) |
| | | | | | | | | | | | | | | | |
| Security name | | | | | | | | Shares | | | Value | |
| | | | |
| Multi-Utilities: 0.03% | | | | | | | | | | | | | | | | |
Centrica plc | | | | | | | | | | | 4,498 | | | $ | 19,850 | |
National Grid plc | | | | | | | | | | | 1,357 | | | | 19,078 | |
| | | | |
| | | | | | | | | | | | | | | 38,928 | |
| | | | | | | | | | | | | | | | |
| | | | |
| Water Utilities: 0.02% | | | | | | | | | | | | | | | | |
Guangdong Investment Limited | | | | | | | | | | | 18,760 | | | | 25,182 | |
| | | | | | | | | | | | | | | | |
| | | | |
Total Common Stocks (Cost $55,488,804) | | | | | | | | | | | | | | | 57,920,361 | |
| | | | | | | | | | | | | | | | |
| | | | |
| | | Interest rate | | | Maturity date | | | Principal | | | | |
| | | | |
Corporate Bonds and Notes: 3.66% | | | | | | | | | | | | | | | | |
| | | | |
Consumer Discretionary: 1.55% | | | | | | | | | | | | | | | | |
| | | | |
| Hotels, Restaurants & Leisure: 0.53% | | | | | | | | | | | | | | | | |
Caesars Entertainment Operating Company Incorporated (s) | | | 8.50 | % | | | 2-15-2020 | | | $ | 15,000 | | | | 11,325 | |
Caesars Entertainment Operating Company Incorporated (s) | | | 9.00 | | | | 2-15-2020 | | | | 650,000 | | | | 484,250 | |
Caesars Entertainment Operating Company Incorporated (s) | | | 11.25 | | | | 6-1-2017 | | | | 155,000 | | | | 117,800 | |
| | | | |
| | | | | | | | | | | | | | | 613,375 | |
| | | | | | | | | | | | | | | | |
| | | | |
| Media: 0.36% | | | | | | | | | | | | | | | | |
iHeartCommunications Incorporated | | | 9.00 | | | | 3-1-2021 | | | | 30,000 | | | | 29,100 | |
iHeartCommunications Incorporated | | | 9.00 | | | | 9-15-2022 | | | | 220,000 | | | | 212,850 | |
iHeartCommunications Incorporated | | | 11.25 | | | | 3-1-2021 | | | | 165,000 | | | | 169,538 | |
| | | | |
| | | | | | | | | | | | | | | 411,488 | |
| | | | | | | | | | | | | | | | |
| | | | |
| Specialty Retail: 0.53% | | | | | | | | | | | | | | | | |
New Albertsons Incorporated | | | 6.63 | | | | 6-1-2028 | | | | 5,000 | | | | 4,125 | |
New Albertsons Incorporated | | | 7.45 | | | | 8-1-2029 | | | | 80,000 | | | | 72,800 | |
New Albertsons Incorporated | | | 7.75 | | | | 6-15-2026 | | | | 25,000 | | | | 23,250 | |
New Albertsons Incorporated | | | 8.00 | | | | 5-1-2031 | | | | 295,000 | | | | 274,350 | |
New Albertsons Incorporated | | | 8.70 | | | | 5-1-2030 | | | | 25,000 | | | | 24,500 | |
Petco Animal Supplies Incorporated 144A | | | 9.25 | | | | 12-1-2018 | | | | 195,000 | | | | 203,288 | |
| | | | |
| | | | | | | | | | | | | | | 602,313 | |
| | | | | | | | | | | | | | | | |
| | | | |
| Textiles, Apparel & Luxury Goods: 0.13% | | | | | | | | | | | | | | | | |
Quiksilver Incorporated 144A | | | 7.88 | | | | 8-1-2018 | | | | 170,000 | | | | 153,850 | |
| | | | | | | | | | | | | | | | |
| | | | |
Financials: 0.98% | | | | | | | | | | | | | | | | |
| | | | |
| Diversified Financial Services: 0.37% | | | | | | | | | | | | | | | | |
Lehman Brothers Holdings Incorporated (s) | | | 0.00 | | | | 12-30-2016 | | | | 655,000 | | | | 94,975 | |
Lehman Brothers Holdings Incorporated (s) | | | 7.88 | | | | 5-8-2018 | | | | 1,350,000 | | | | 325,339 | |
| | | | |
| | | | | | | | | | | | | | | 420,314 | |
| | | | | | | | | | | | | | | | |
| | | | |
| Insurance: 0.37% | | | | | | | | | | | | | | | | |
Ambac Assurance Corporation 144A | | | 5.10 | | | | 6-7-2020 | | | | 368,882 | | | | 422,831 | |
| | | | | | | | | | | | | | | | |
| | | | |
| REITs: 0.24% | | | | | | | | | | | | | | | | |
Apollo Commercial Real Estate Finance Incorporated | | | 5.50 | | | | 3-15-2019 | | | | 5,000 | | | | 4,934 | |
Starwood Waypoint Residential Trust | | | 3.00 | | | | 7-1-2019 | | | | 280,000 | | | | 256,550 | |
Starwood Waypoint Residential Trust | | | 4.50 | | | | 10-15-2017 | | | | 15,000 | | | | 15,000 | |
| | | | |
| | | | | | | | | | | | | | | 276,484 | |
| | | | | | | | | | | | | | | | |
The accompanying notes are an integral part of these financial statements.
| | | | | | |
| Portfolio of investments—January 31, 2015 (unaudited) | | Wells Fargo Advantage Alternative Strategies Fund | | | 21 | |
| | | | | | | | | | | | | | | | |
| Security name | | Interest rate | | | Maturity date | | | Principal | | | Value | |
| | | | |
Industrials: 0.72% | | | | | | | | | | | | | | | | |
| | | | |
| Electrical Equipment: 0.41% | | | | | | | | | | | | | | | | |
SolarCity Corporation (b) | | | 1.63 | % | | | 11-1-2019 | | | $ | 535,000 | | | $ | 463,444 | |
| | | | | | | | | | | | | | | | |
| | | | |
| Transportation Infrastructure: 0.31% | | | | | | | | | | | | | | | | |
Teekay Offshore Partners LP | | | 6.00 | | | | 7-30-2019 | | | | 400,000 | | | | 360,000 | |
| | | | | | | | | | | | | | | | |
| | | | |
Information Technology: 0.02% | | | | | | | | | | | | | | | | |
| | | | |
| IT Services: 0.02% | | | | | | | | | | | | | | | | |
DynCorp International Incorporated | | | 10.38 | | | | 7-1-2017 | | | | 20,000 | | | | 18,050 | |
| | | | | | | | | | | | | | | | |
| | | | |
Materials: 0.26% | | | | | | | | | | | | | | | | |
| | | | |
| Containers & Packaging: 0.14% | | | | | | | | | | | | | | | | |
Tekni-Plex Incorporated 144A | | | 9.75 | | | | 6-1-2019 | | | | 145,000 | | | | 156,963 | |
| | | | | | | | | | | | | | | | |
| | | | |
| Metals & Mining: 0.12% | | | | | | | | | | | | | | | | |
Thompson Creek Metals Company Incorporated | | | 7.38 | | | | 6-1-2018 | | | | 195,000 | | | | 143,813 | |
| | | | | | | | | | | | | | | | |
| | | | |
Telecommunication Services: 0.13% | | | | | | | | | | | | | | | | |
| | | | |
| Wireless Telecommunication Services: 0.13% | | | | | | | | | | | | | | | | |
T-Mobile USA Incorporated | | | 6.38 | | | | 3-1-2025 | | | | 150,000 | | | | 153,938 | |
| | | | | | | | | | | | | | | | |
| | | | |
Total Corporate Bonds and Notes (Cost $4,567,834) | | | | | | | | | | | | | | | 4,196,863 | |
| | | | | | | | | | | | | | | | |
| | | | |
| | | | | | | | | Shares | | | | |
| Exchange-Traded Funds: 0.21% | | | | | | | | | | | | | | | | |
iShares MSCI ACWI ETF | | | | | | | | | | | 4,227 | | | | 244,025 | |
| | | | | | | | | | | | | | | | |
| | | | |
Total Exchange-Traded Funds (Cost $250,190) | | | | | | | | | | | | | | | 244,025 | |
| | | | | | | | | | | | | | | | |
| | | | |
| | | | | | | | | Principal | | | | |
| | | | |
Foreign Corporate Bonds and Notes @: 0.36% | | | | | | | | | | | | | | | | |
| | | | |
Consumer Discretionary: 0.36% | | | | | | | | | | | | | | | | |
| | | | |
| Diversified Consumer Services: 0.25% | | | | | | | | | | | | | | | | |
Odeon & UCI Finco plc (GBP) | | | 9.00 | | | | 8-1-2018 | | | | 190,000 | | | | 280,455 | |
| | | | | | | | | | | | | | | | |
| | | | |
| Textiles, Apparel & Luxury Goods: 0.11% | | | | | | | | | | | | | | | | |
Boardriders SA (EUR) | | | 8.88 | | | | 12-15-2017 | | | | 125,000 | | | | 129,964 | |
| | | | | | | | | | | | | | | | |
| | | | |
Total Foreign Corporate Bonds and Notes (Cost $472,697) | | | | | | | | | | | | | | | 410,419 | |
| | | | | | | | | | | | | | | | |
| | | | |
| | | | | | | | | Shares | | | | |
| Investment Companies: 7.62% | | | | | | | | | | | | | | | | |
| | | | |
| Alternative Investment Funds: 7.62% | | | | | | | | | | | | | | | | |
AQR Managed Futures Strategy Fund Class I | | | | | | | | | | | 783,118 | | | | 8,723,939 | |
| | | | | | | | | | | | | | | | |
| | | | |
Total Investment Companies (Cost $7,768,888) | | | | | | | | | | | | | | | 8,723,939 | |
| | | | | | | | | | | | | | | | |
The accompanying notes are an integral part of these financial statements.
| | | | |
| 22 | | Wells Fargo Advantage Alternative Strategies Fund | | Portfolio of investments—January 31, 2015 (unaudited) |
| | | | | | | | | | | | | | | | |
| Security name | | Interest rate | | | Maturity date | | | Principal | | | Value | |
| | | | |
Municipal Obligations: 0.38% | | | | | | | | | | | | | | | | |
| | | | |
| Puerto Rico: 0.38% | | | | | | | | | | | | | | | | |
Puerto Rico Public Buildings Authority Government Facilities Revenue Bonds Series T (Miscellaneous Revenue) (i) | | | 5.60 | % | | | 7-1-2030 | | | $ | 650,000 | | | $ | 435,624 | |
| | | | | | | | | | | | | | | | |
| | | | |
Total Municipal Obligations (Cost $490,907) | | | | | | | | | | | | | | | 435,624 | |
| | | | | | | | | | | | | | | | |
| | | | |
| | | | | | Expiration date | | | Shares | | | | |
| | | | |
Participation Notes: 0.31% | | | | | | | | | | | | | | | | |
| | | | |
Financials: 0.31% | | | | | | | | | | | | | | | | |
| | | | |
| Capital Markets: 0.31% | | | | | | | | | | | | | | | | |
Morgan Stanley BV (National Commercial Bank) † | | | | | | | 11-21-2016 | | | | 22,431 | | | | 353,433 | |
| | | | | | | | | | | | | | | | |
| | | | |
Total Participation Notes (Cost $356,460) | | | | | | | | | | | | | | | 353,433 | |
| | | | | | | | | | | | | | | | |
| | | | |
| | | Dividend yield | | | | | | | | | | |
| | | | |
Preferred Stocks: 0.06% | | | | | | | | | | | | | | | | |
| | | | |
Financials: 0.03% | | | | | | | | | | | | | | | | |
| | | | |
| REITs: 0.03% | | | | | | | | | | | | | | | | |
Campus Crest Communities Incorporated | | | 7.66 | | | | | | | | 1,150 | | | | 30,038 | |
| | | | | | | | | | | | | | | | |
| | | | |
Industrials: 0.03% | | | | | | | | | | | | | | | | |
| | | | |
| Transportation Infrastructure: 0.03% | | | | | | | | | | | | | | | | |
Uber Technologies Incorporated †(a)(i) | | | 0.00 | | | | | | | | 1,216 | | | | 40,514 | |
| | | | | | | | | | | | | | | | |
| | | | |
Total Preferred Stocks (Cost $48,275) | | | | | | | | | | | | | | | 70,552 | |
| | | | | | | | | | | | | | | | |
| | | | |
| | | Strike price | | | | | | Contracts | | | | |
| | | | |
Purchased Put Options: 0.28% | | | | | | | | | | | | | | | | |
AT&T Incorporated | | $ | 35 | | | | 6-19-2015 | | | | 1,800 | | | | 5,346 | |
AT&T Incorporated | | | 35 | | | | 4-17-2015 | | | | 12,600 | | | | 33,012 | |
Energy Select Sector SPDR Fund ETF | | | 74 | | | | 3-20-2015 | | | | 33,600 | | | | 89,712 | |
International Business Machines Corporation | | | 150 | | | | 2-20-2015 | | | | 700 | | | | 1,449 | |
Pfizer Incorporated | | | 33 | | | | 2-20-2015 | | | | 2,900 | | | | 4,205 | |
S&P 500 Index | | | 1,850 | | | | 9-18-2015 | | | | 1,800 | | | | 124,200 | |
S&P 500 Index | | | 1,950 | | | | 3-20-2015 | | | | 1,500 | | | | 61,800 | |
| | | | |
Total Purchased Put Options (Cost $312,505) | | | | | | | | | | | | | | | 319,724 | |
| | | | | | | | | | | | | | | | |
| | | | |
| | | | | | | | | Shares | | | | |
| | | | |
Warrants: 0.10% | | | | | | | | | | | | | | | | |
| | | | |
Financials: 0.10% | | | | | | | | | | | | | | | | |
| | | | |
| Banks: 0.08% | | | | | | | | | | | | | | | | |
JPMorgan Chase & Company † | | | | | | | 10-28-2018 | | | | 6,148 | | | | 93,327 | |
| | | | | | | | | | | | | | | | |
| | | | |
| Capital Markets: 0.02% | | | | | | | | | | | | | | | | |
WL Ross Holding Corporation † | | | | | | | 8-5-2018 | | | | 40,000 | | | | 20,600 | |
| | | | | | | | | | | | | | | | |
| | | | |
Total Warrants (Cost $144,277) | | | | | | | | | | | | | | | 113,927 | |
| | | | | | | | | | | | | | | | |
The accompanying notes are an integral part of these financial statements.
| | | | | | |
| Portfolio of investments—January 31, 2015 (unaudited) | | Wells Fargo Advantage Alternative Strategies Fund | | | 23 | |
| | | | | | | | | | | | | | | | |
| Security name | | Interest rate | | | Maturity Date | | | Principal | | | Value | |
| | | | |
Yankee Corporate Bonds and Notes: 1.84% | | | | | | | | | | | | | | | | |
| | | | |
Consumer Discretionary: 0.34% | | | | | | | | | | | | | | | | |
| | | | |
| Media: 0.34% | | | | | | | | | | | | | | | | |
Numericable - Societe Francaise du Radiotelephone 144A | | | 6.25 | % | | | 5-15-2024 | | | $ | 375,000 | | | $ | 388,125 | |
| | | | | | | | | | | | | | | | |
| | | | |
Materials: 1.26% | | | | | | | | | | | | | | | | |
| | | | |
| Metals & Mining: 1.26% | | | | | | | | | | | | | | | | |
AuRico Gold Incorporated 144A | | | 7.75 | | | | 4-1-2020 | | | | 110,000 | | | | 106,700 | |
Consolidated Minerals Limited 144A | | | 8.00 | | | | 5-15-2020 | | | | 440,000 | | | | 318,725 | |
Evraz Incorporated North America Canada 144A | | | 7.50 | | | | 11-15-2019 | | | | 360,000 | | | | 308,700 | |
First Quantum Minerals Limited 144A | | | 7.25 | | | | 5-15-2022 | | | | 200,000 | | | | 167,000 | |
Hudbay Minerals Incorporated | | | 9.50 | | | | 10-1-2020 | | | | 25,000 | | | | 24,313 | |
Hudbay Minerals Incorporated 144A | | | 9.50 | | | | 10-1-2020 | | | | 535,000 | | | | 520,268 | |
| | | | |
| | | | | | | | | | | | | | | 1,445,706 | |
| | | | | | | | | | | | | | | | |
| | | | |
Telecommunication Services: 0.24% | | | | | | | | | | | | | | | | |
| | | | |
| Wireless Telecommunication Services: 0.24% | | | | | | | | | | | | | | | | |
Altice Financing SA 144A%% | | | 6.63 | | | | 2-15-2023 | | | | 275,000 | | | | 275,000 | |
| | | | | | | | | | | | | | | | |
| | | | |
Total Yankee Corporate Bonds and Notes (Cost $2,303,565) | | | | | | | | | | | | | | | 2,108,831 | |
| | | | | | | | | | | | | | | | |
| | | | |
| | | Yield | | | | | | Shares | | | | |
| | | | |
Short-Term Investments: 25.71% | | | | | | | | | | | | | | | | |
| | | | |
| Investment Companies: 24.27% | | | | | | | | | | | | | | | | |
Wells Fargo Advantage Cash Investment Money Market Fund, Select Class (l)(u)## | | | 0.10 | | | | | | | | 27,806,267 | | | | 27,806,267 | |
| | | | | | | | | | | | | | | | |
| | | | |
| | | | | | | | | Principal | | | | |
| | | | |
| U.S. Treasury Securities: 1.44% | | | | | | | | | | | | | | | | |
U.S. Treasury Bill #(z) | | | 0.01 | | | | 3-12-2015 | | | $ | 25,000 | | | | 25,000 | |
U.S. Treasury Bill #(z) | | | 0.02 | | | | 6-4-2015 | | | | 1,625,000 | | | | 1,624,862 | |
| | | | |
| | | | | | | | | | | | | | | 1,649,862 | |
| | | | | | | | | | | | | | | | |
| | | | |
Total Short-Term Investments (Cost $29,455,858) | | | | | | | | | | | | | | | 29,456,129 | |
| | | | | | | | | | | | | | | | |
| | | | |
| | | | | | | | | Shares | | | | |
| Securities Sold Short: (15.24%) | | | | | | | | | | | | | | | | |
| | | | |
Common Stocks: (11.75%) | | | | | | | | | | | | | | | | |
| | | | |
Consumer Discretionary: (1.49%) | | | | | | | | | | | | | | | | |
| | | | |
| Automobiles: (0.43%) | | | | | | | | | | | | | | | | |
Ford Motor Company | | | | | | | | | | | (18,582 | ) | | | (273,341 | ) |
General Motors Company | | | | | | | | | | | (6,600 | ) | | | (215,292 | ) |
| | | | |
| | | | | | | | | | | | | | | (488,633 | ) |
| | | | | | | | | | | | | | | | |
| | | | |
| Hotels, Restaurants & Leisure: (0.01%) | | | | | | | | | | | | | | | | |
Chipotle Mexican Grill Incorporated † | | | | | | | | | | | (13 | ) | | | (9,228 | ) |
| | | | | | | | | | | | | | | | |
The accompanying notes are an integral part of these financial statements.
| | | | |
| 24 | | Wells Fargo Advantage Alternative Strategies Fund | | Portfolio of investments—January 31, 2015 (unaudited) |
| | | | | | | | | | | | |
| Security name | | | | | | Shares | | | Value | |
| | | | |
| Internet & Catalog Retail: (0.53%) | | | | | | | | | | | | |
Amazon.com Incorporated | | | | | | | (1,317 | ) | | $ | (466,916 | ) |
TripAdvisor Incorporated † | | | | | | | (2,268 | ) | | | (151,979 | ) |
| | | | |
| | | | | | | | | | | (618,895 | ) |
| | | | | | | | | | | | |
| | | | |
| Media: (0.48%) | | | | | | | | | | | | |
Comcast Corporation Class A | | | | | | | (9,461 | ) | | | (502,805 | ) |
Omnicom Group Incorporated | | | | | | | (689 | ) | | | (50,177 | ) |
| | | | |
| | | | | | | | | | | (552,982 | ) |
| | | | | | | | | | | | |
| | | | |
| Multiline Retail: (0.03%) | | | | | | | | | | | | |
Dollar Tree Incorporated | | | | | | | (544 | ) | | | (38,678 | ) |
| | | | | | | | | | | | |
| | | | |
| Specialty Retail: (0.01%) | | | | | | | | | | | | |
The Gap Incorporated | | | | | | | (222 | ) | | | (9,144 | ) |
| | | | | | | | | | | | |
| | | | |
Consumer Staples: (0.13%) | | | | | | | | | | | | |
| | | | |
| Food & Staples Retailing: (0.10%) | | | | | | | | | | | | |
Wal-Mart Stores Incorporated | | | | | | | (1,375 | ) | | | (116,848 | ) |
| | | | | | | | | | | | |
| | | | |
| Tobacco: (0.03%) | | | | | | | | | | | | |
Reynolds American Incorporated | | | | | | | (424 | ) | | | (28,811 | ) |
| | | | | | | | | | | | |
| | | | |
Energy: (2.94%) | | | | | | | | | | | | |
| | | | |
| Energy Equipment & Services: (1.11%) | | | | | | | | | | | | |
Halliburton Company | | | | | | | (1,336 | ) | | | (53,426 | ) |
National Oilwell Varco Incorporated | | | | | | | (6,051 | ) | | | (329,356 | ) |
Schlumberger Limited | | | | | | | (7,199 | ) | | | (593,126 | ) |
Transocean Limited | | | | | | | (11,782 | ) | | | (192,047 | ) |
Weatherford International plc † | | | | | | | (9,991 | ) | | | (103,207 | ) |
| | | | |
| | | | | | | | | | | (1,271,162 | ) |
| | | | | | | | | | | | |
| | | | |
| Oil, Gas & Consumable Fuels: (1.83%) | | | | | | | | | | | | |
Antero Resources Corporation † | | | | | | | (2,403 | ) | | | (83,264 | ) |
Apache Corporation | | | | | | | (5,241 | ) | | | (327,929 | ) |
Chevron Corporation | | | | | | | (3,309 | ) | | | (339,272 | ) |
Conocophillips | | | | | | | (2,700 | ) | | | (170,046 | ) |
Continental Resources Incorporated † | | | | | | | (6,698 | ) | | | (304,089 | ) |
Occidental Petroleum Corporation | | | | | | | (3,584 | ) | | | (286,720 | ) |
Petroleo Brasileiro SA ADR | | | | | | | (12,535 | ) | | | (75,335 | ) |
Pioneer Natural Resources Company | | | | | | | (1,577 | ) | | | (237,386 | ) |
Statoil ASA | | | | | | | (16,362 | ) | | | (274,003 | ) |
| | | | |
| | | | | | | | | | | (2,098,044 | ) |
| | | | | | | | | | | | |
| | | | |
Financials: (0.70%) | | | | | | | | | | | | |
| | | | |
| REITs: (0.70%) | | | | | | | | | | | | |
Health Care REIT Incorporated | | | | | | | (3,886 | ) | | | (318,458 | ) |
Starwood Waypoint Residential Trust | | | | | | | (1,018 | ) | | | (24,676 | ) |
Ventas Incorporated | | | | | | | (5,788 | ) | | | (461,940 | ) |
| | | | |
| | | | | | | | | | | (805,074 | ) |
| | | | | | | | | | | | |
The accompanying notes are an integral part of these financial statements.
| | | | | | |
| Portfolio of investments—January 31, 2015 (unaudited) | | Wells Fargo Advantage Alternative Strategies Fund | | | 25 | |
| | | | | | | | | | | | |
| Security name | | | | | | Shares | | | Value | |
| | | | |
Health Care: (1.95%) | | | | | | | | | | | | |
| | | | |
| Health Care Equipment & Supplies: (0.22%) | | | | | | | | | | | | |
Abbott Laboratories | | | | | | | (1,856 | ) | | $ | (83,075 | ) |
Baxter International Incorporated | | | | | | | (1,040 | ) | | | (73,122 | ) |
Medtronic plc | | | | | | | (7 | ) | | | (500 | ) |
Stryker Corporation | | | | | | | (1,073 | ) | | | (97,697 | ) |
| | | | |
| | | | | | | | | | | (254,394 | ) |
| | | | | | | | | | | | |
| | | | |
| Health Care Providers & Services: (1.38%) | | | | | | | | | | | | |
AmerisourceBergen Corporation | | | | | | | (2,628 | ) | | | (249,791 | ) |
Davita Healthcare Partners Incorporated † | | | | | | | (4,714 | ) | | | (353,833 | ) |
Express Scripts Holding Company † | | | | | | | (6,407 | ) | | | (517,110 | ) |
Humana Incorpoted | | | | | | | (2,380 | ) | | | (348,527 | ) |
UnitedHealth Group Incorporated | | | | | | | (1,005 | ) | | | (106,781 | ) |
| | | | |
| | | | | | | | | | | (1,576,042 | ) |
| | | | | | | | | | | | |
| | | | |
| Pharmaceuticals: (0.35%) | | | | | | | | | | | | |
Actavis plc | | | | | | | (1,498 | ) | | | (399,277 | ) |
| | | | | | | | | | | | |
| | | | |
Industrials: (0.57%) | | | | | | | | | | | | |
| | | | |
| Aerospace & Defense: (0.10%) | | | | | | | | | | | | |
The Boeing Company | | | | | | | (815 | ) | | | (118,477 | ) |
| | | | | | | | | | | | |
| | | | |
| Electrical Equipment: (0.14%) | | | | | | | | | | | | |
SolarCity Corporation | | | | | | | (3,355 | ) | | | (163,087 | ) |
| | | | | | | | | | | | |
| | | | |
| Machinery: (0.14%) | | | | | | | | | | | | |
Caterpillar Incorporated | | | | | | | (2,027 | ) | | | (162,099 | ) |
| | | | | | | | | | | | |
| | | | |
| Trading Companies & Distributors: (0.19%) | | | | | | | | | | | | |
Fastenal Company | | | | | | | (4,641 | ) | | | (206,060 | ) |
| | | | | | | | | | | | |
| | | | |
Information Technology: (3.12%) | | | | | | | | | | | | |
| | | | |
| Communications Equipment: (0.48%) | | | | | | | | | | | | |
Motorola Solutions Incorporated | | | | | | | (8,859 | ) | | | (552,890 | ) |
| | | | | | | | | | | | |
| | | | |
| Electronic Equipment, Instruments & Components: (0.53%) | | | | | | | | | | | | |
Corning Incorporated | | | | | | | (25,412 | ) | | | (604,043 | ) |
| | | | | | | | | | | | |
| | | | |
| IT Services: (1.55%) | | | | | | | | | | | | |
Accenture plc Class A | | | | | | | (3,727 | ) | | | (313,180 | ) |
Infosys Limited ADR | | | | | | | (16,676 | ) | | | (568,318 | ) |
International Business Machines Corporation | | | | | | | (4,400 | ) | | | (674,564 | ) |
Teradata Corporation † | | | | | | | (2,593 | ) | | | (115,544 | ) |
Visa Incorporated Class A | | | | | | | (418 | ) | | | (106,552 | ) |
| | | | |
| | | | | | | | | | | (1,778,158 | ) |
| | | | | | | | | | | | |
| | | | |
| Semiconductors & Semiconductor Equipment: (0.13%) | | | | | | | | | | | | |
Texas Instruments Incorporated | | | | | | | (2,847 | ) | | | (152,172 | ) |
| | | | | | | | | | | | |
| | | | |
| Software: (0.43%) | | | | | | | | | | | | |
Adobe Systems Incorporated | | | | | | | (6,957 | ) | | | (487,894 | ) |
| | | | | | | | | | | | |
The accompanying notes are an integral part of these financial statements.
| | | | |
| 26 | | Wells Fargo Advantage Alternative Strategies Fund | | Portfolio of investments—January 31, 2015 (unaudited) |
| | | | | | | | | | | | |
| Security name | | | | | | Shares | | | Value | |
| | | | |
Materials: (0.67%) | | | | | | | | | | | | |
| | | | |
| Metals & Mining: (0.67%) | | | | | | | | | | | | |
ArcelorMittal | | | | | | | (20,890 | ) | | $ | (201,380 | ) |
First Quantum Minerals Limited | | | | | | | (36,771 | ) | | | (335,387 | ) |
Goldcorp Incorporated | | | | | | | (3,110 | ) | | | (74,733 | ) |
Newmont Mining Corporation | | | | | | | (6,096 | ) | | | (153,314 | ) |
| | | | |
| | | | | | | | | | | (764,814 | ) |
| | | | | | | | | | | | |
| | | | |
Telecommunication Services: (0.18%) | | | | | | | | | | | | |
| | | | |
| Diversified Telecommunication Services: (0.18%) | | | | | | | | | | | | |
AT&T Incorporated | | | | | | | (6,288 | ) | | | (207,001 | ) |
| | | | | | | | | | | | |
| | | | |
| | | | | | | | | | | (13,463,907 | ) |
| | | | | | | | | | | | |
| | | | |
| Exchange Traded Funds: (3.49%) | | | | | | | | | | | | |
Consumer Discretionary Select Sector SPDR ETF | | | | | | | (2,592 | ) | | | (181,414 | ) |
Energy Select Sector SPDR Fund ETF | | | | | | | (2,951 | ) | | | (222,948 | ) |
Health Care Select Sector SPDR Fund ETF | | | | | | | (1,778 | ) | | | (123,162 | ) |
iShares MSCI Brazil Capped ETF | | | | | | | (9,451 | ) | | | (324,264 | ) |
iShares MSCI Emerging Markets ETF | | | | | | | (7,118 | ) | | | (277,744 | ) |
SPDR S&P 500 ETF | | | | | | | (13,249 | ) | | | (2,642,778 | ) |
SPDR S&P Regional Banking ETF | | | | | | | (4,608 | ) | | | (169,805 | ) |
Technology Select Sector SPDR Fund ETF | | | | | | | (1,445 | ) | | | (57,656 | ) |
| | | | |
| | | | | | | | | | | (3,999,771 | ) |
| | | | | | | | | | | | |
| | | | |
Total Securities Sold Short (Proceeds $(18,713,563)) | | | | | | | | | | | (17,463,678 | ) |
| | | | | | | | | | | | |
| | | | | | | | |
| Total investments in securities (excluding securities sold short) (Cost $101,660,260) * | | | 91.09 | % | | | 104,353,827 | |
| Total securities sold short | | | (15.24 | ) | | | (17,463,678 | ) |
Other assets and liabilities, net | | | 24.15 | | | | 27,669,199 | |
| | | | | | | | |
| Total net assets | | | 100.00 | % | | $ | 114,559,348 | |
| | | | | | | | |
| † | Non-income-earning security |
| (b) | All or a portion of this security is segregated as collateral for securities sold short. |
| (a) | The security is fair valued in accordance with procedures approved by the Board of Trustees. |
| (s) | The security is currently in default with regards to scheduled interest and/or principal payments. The Fund has stopped accruing interest on the security. |
| 144A | The security may be resold in transactions exempt from registration, normally to qualified institutional buyers, pursuant to Rule 144A under the Securities Act of 1933. |
| @ | Foreign bond principal is denominated in the local currency of the issuer. |
| %% | The security is issued on a when-issued basis. |
| (l) | The security represents an affiliate of the Fund as defined in the Investment Company Act of 1940. |
| (u) | The rate represents the 7-day annualized yield at period end. |
| ## | All or a portion of this security is segregated for when-issued securities. |
| # | All or a portion of this security is segregated as collateral for investments in derivative instruments. |
| (z) | Zero coupon security. The rate represents the current yield to maturity. |
| * | Cost for federal income tax purposes is $103,764,485 and unrealized gains (losses) consists of: |
| | | | |
Gross unrealized gains | | $ | 5,542,830 | |
Gross unrealized losses | | | (4,953,488 | ) |
| | | | |
Net unrealized gains | | $ | 589,342 | |
The accompanying notes are an integral part of these financial statements.
| | | | | | |
| Statement of assets and liabilities—January 31, 2015 (unaudited) | | Wells Fargo Advantage Alternative Strategies Fund | | | 27 | |
| | | | |
| | | | |
| |
Assets | | | | |
Investments | | | | |
In unaffiliated securities, at value (cost $73,853,993) | | $ | 76,547,560 | |
In affiliated securities, at value (cost $27,806,267) | | | 27,806,267 | |
| | | | |
Total investments, at value (cost $101,660,260) | | | 104,353,827 | |
Cash | | | 331,390 | |
Segregated cash for securities sold short | | | 19,465,345 | |
Segregated cash for written options | | | 218,835 | |
Segregated cash for total return swap | | | 210,610 | |
Segregated cash for futures transactions | | | 182,710 | |
Foreign currency, at value (cost $7,966,654) | | | 7,605,067 | |
Receivable for investments sold | | | 3,275,649 | |
Receivable for Fund shares sold | | | 949,525 | |
Receivable for dividends and interest | | | 131,545 | |
Receivable for daily variation margin on open futures contracts | | | 237,072 | |
Unrealized gains on forward foreign currency contracts | | | 39,541 | |
Unrealized gains on total return swap transactions | | | 40,497 | |
Prepaid expenses and other assets | | | 40,452 | |
| | | | |
Total assets | | | 137,082,065 | |
| | | | |
| |
Liabilities | | | | |
Dividends payable on securities sold short | | | 15,296 | |
Payable for investments purchased | | | 4,543,689 | |
Unrealized losses on total return swap transactions | | | 39,841 | |
Unrealized losses on forward foreign currency contracts | | | 27,738 | |
Payable for daily variation margin on open futures contracts | | | 109,526 | |
Written options, at value (premiums received $124,040) | | | 122,218 | |
Payable for securities sold short, at value (proceeds $18,713,563) | | | 17,463,678 | |
Advisory fee payable | | | 161,535 | |
Distribution fee payable | | | 834 | |
Administration fees payable | | | 13,390 | |
Accrued expenses and other liabilities | | | 24,972 | |
| | | | |
Total liabilities | | | 22,522,717 | |
| | | | |
Total net assets | | $ | 114,559,348 | |
| | | | |
| |
NET ASSETS CONSIST OF | | | | |
Paid-in capital | | $ | 111,033,004 | |
Accumulated net investment loss | | | (329,867 | ) |
Accumulated net realized losses on investments | | | (641,794 | ) |
Net unrealized gains on investments | | | 4,498,005 | |
| | | | |
Total net assets | | $ | 114,559,348 | |
| | | | |
| |
COMPUTATION OF NET ASSET VALUE AND OFFERING PRICE PER SHARE | | | | |
Net assets – Class A | | $ | 1,873,146 | |
Shares outstanding – Class A1 | | | 181,305 | |
Net asset value per share – Class A | | | $10.33 | |
Maximum offering price per share – Class A2 | | | $10.96 | |
Net assets – Class C | | $ | 1,268,448 | |
Shares outstanding – Class C1 | | | 123,496 | |
Net asset value per share – Class C | | | $10.27 | |
Net assets – Administrator Class | | $ | 1,226,413 | |
Shares outstanding – Administrator Class1 | | | 118,569 | |
Net asset value per share – Administrator Class | | | $10.34 | |
Net assets – Institutional Class | | $ | 110,191,341 | |
Shares outstanding – Institutional Class1 | | | 10,645,102 | |
Net asset value per share – Institutional Class | | | $10.35 | |
| 1 | The Fund has an unlimited number of authorized shares. |
| 2 | Maximum offering price is computed as 100/94.25 of net asset value. On investments of $50,000 or more, the offering price is reduced. |
The accompanying notes are an integral part of these financial statements.
| | | | |
| 28 | | Wells Fargo Advantage Alternative Strategies Fund | | Statement of operations—six months ended January 31, 2015 (unaudited) |
| | | | |
| | | | |
| |
Investment income | | | | |
Dividends (net of foreign withholding taxes of $3,996) | | $ | 729,117 | |
Interest | | | 435,718 | |
Income from affiliated securities | | | 8,656 | |
| | | | |
Total investment income | | | 1,173,491 | |
| | | | |
| |
Expenses | | | | |
Advisory fee | | | 961,979 | |
Administration fees | | | | |
Fund level | | | 26,722 | |
Class A | | | 2,234 | |
Class C | | | 1,506 | |
Administrator Class | | | 594 | |
Institutional Class | | | 41,128 | |
Shareholder servicing fees | | | | |
Class A | | | 2,147 | |
Class C | | | 1,448 | |
Administrator Class | | | 1,485 | |
Distribution fee | | | | |
Class C | | | 4,343 | |
Custody and accounting fees | | | 125,237 | |
Professional fees | | | 30,733 | |
Registration fees | | | 57,412 | |
Shareholder report expenses | | | 8,238 | |
Trustees’ fees and expenses | | | 6,207 | |
Dividends on securities sold short | | | 195,048 | |
Prime broker fees | | | 123,002 | |
Other fees and expenses | | | 6,790 | |
| | | | |
Total expenses | | | 1,596,253 | |
Less: Fee waivers and/or expense reimbursements | | | (117,008 | ) |
| | | | |
Net expenses | | | 1,479,245 | |
| | | | |
Net investment loss | | | (305,754 | ) |
| | | | |
| |
REALIZED AND UNREALIZED GAINS (LOSSES) ON INVESTMENTS | | | | |
| |
Net realized gains (losses) on: | | | | |
Unaffiliated securities | | | (2,006,878 | ) |
Futures transactions | | | 2,636,664 | |
Foreign currency and foreign currency translations | | | (86,239 | ) |
Forward foreign currency contract transactions | | | 185,750 | |
Securities sold short | | | 117,745 | |
Total return swap transactions | | | 12,759 | |
Written options | | | 79,213 | |
Capital gain distributions from investment companies | | | 372,416 | |
| | | | |
Net realized gains on investments | | | 1,311,430 | |
| | | | |
| |
Net change in unrealized gains (losses) on: | | | | |
Unaffiliated securities | | | 1,702,175 | |
Futures transactions | | | 861,523 | |
Foreign currency and foreign currency translations | | | (293,746 | ) |
Forward foreign currency contract transactions | | | (4,765 | ) |
Securities sold short | | | 986,980 | |
Total return swap transactions | | | 2,069 | |
Written options | | | (38,081 | ) |
| | | | |
Net change in unrealized gains (losses) on investments | | | 3,216,155 | |
| | | | |
Net realized and unrealized gains (losses) on investments | | | 4,527,585 | |
| | | | |
Net increase in net assets resulting from operations | | $ | 4,221,831 | |
| | | | |
The accompanying notes are an integral part of these financial statements.
| | | | | | |
| Statement of changes in net assets | | Wells Fargo Advantage Alternative Strategies Fund | | | 29 | |
| | | | | | | | | | | | | | | | |
| | | Six months ended
January 31, 2015
(unaudited) | | | Year ended
July 31, 20141 | |
| | | |
Operations | | | | | | | | | | | | |
Net investment loss | | | | | | $ | (305,754 | ) | | | | | | $ | (372,313 | ) |
Net realized gains (losses) on investments | | | | | | | 1,311,430 | | | | | | | | (48,598 | ) |
Net change in unrealized gains (losses) on investments | | | | | | | 3,216,155 | | | | | | | | 1,281,850 | |
| | | | |
Net increase in net assets resulting from operations | | | | | | | 4,221,831 | | | | | | | | 860,939 | |
| | | | |
| | | |
Distributions to shareholders from | | | | | | | | | | | | |
Net realized gains | | | | | | | | | | | | | | | | |
Class A | | | | | | | (25,783 | ) | | | | | | | 0 | |
Class C | | | | | | | (18,175 | ) | | | | | | | 0 | |
Administrator Class | | | | | | | (17,178 | ) | | | | | | | 0 | |
Institutional Class | | | | | | | (1,497,363 | ) | | | | | | | 0 | |
| | | | |
Total distributions to shareholders | | | | | | | (1,558,499 | ) | | | | | | | 0 | |
| | | | |
| | | | |
Capital share transactions | | | Shares | | | | | | | | Shares | | | | | |
Proceeds from shares sold | | | | | | | | | | | | | | | | |
Class A | | | 23,419 | | | | 240,238 | | | | 156,226 | | | | 1,567,098 | |
Class C | | | 17,740 | | | | 183,277 | | | | 112,656 | | | | 1,127,500 | |
Administrator Class | | | 5,882 | | | | 60,000 | | | | 111,014 | | | | 1,110,000 | |
Institutional Class | | | 804,366 | | | | 8,335,737 | | | | 9,700,000 | | | | 97,000,000 | |
| | | | |
| | | | | | | 8,819,252 | | | | | | | | 100,804,598 | |
| | | | |
Reinvestment of distributions | | | | | | | | | | | | | | | | |
Class A | | | 2,510 | | | | 25,746 | | | | 0 | | | | 0 | |
Class C | | | 1,541 | | | | 15,734 | | | | 0 | | | | 0 | |
Administrator Class | | | 1,673 | | | | 17,178 | | | | 0 | | | | 0 | |
Institutional Class | | | 140,736 | | | | 1,446,167 | | | | 0 | | | | 0 | |
| | | | |
| | | | | | | 1,504,825 | | | | | | | | 0 | |
| | | | |
Payment for shares redeemed | | | | | | | | | | | | | | | | |
Class A | | | (464 | ) | | | (4,770 | ) | | | (386 | ) | | | (3,912 | ) |
Class C | | | (8,441 | ) | | | (84,916 | ) | | | 0 | | | | 0 | |
| | | | |
| | | | | | | (89,686 | ) | | | | | | | (3,912 | ) |
| | | | |
Net increase in net assets resulting from capital share transactions | | | | | | | 10,234,391 | | | | | | | | 100,800,686 | |
| | | | |
Total increase in net assets | | | | | | | 12,897,723 | | | | | | | | 101,661,625 | |
| | | | |
| | |
Net assets | | | | | | | | |
Beginning of period | | | | | | | 101,661,625 | | | | | | | | 0 | |
| | | | |
End of period | | | | | | $ | 114,559,348 | | | | | | | $ | 101,661,625 | |
| | | | |
Accumulated net investment loss | | | | | | $ | (329,867 | ) | | | | | | $ | (24,113 | ) |
| | | | |
| 1 | For the period from April 30, 2014 (commencement of operations) to July 31, 2014 |
The accompanying notes are an integral part of these financial statements.
| | | | |
| 30 | | Wells Fargo Advantage Alternative Strategies Fund | | Financial highlights |
(For a share outstanding throughout each period)
| | | | | | | | |
| | | Six months ended
January 31, 2015 (unaudited) | | | Year ended July 31, 20141 | |
| CLASS A | | |
Net asset value, beginning of period | | | $10.08 | | | | $10.00 | |
Net investment loss | | | (0.04 | ) | | | (0.04 | ) |
Net realized and unrealized gains (losses) on investments | | | 0.44 | | | | 0.12 | |
| | | | | | | | |
Total from investment operations | | | 0.40 | | | | 0.08 | |
Distributions to shareholders from | | | | | | | | |
Net realized gains | | | (0.15 | ) | | | 0.00 | |
Net asset value, end of period | | | $10.33 | | | | $10.08 | |
Total return2 | | | 3.97 | % | | | 0.80 | % |
Ratios to average net assets (annualized) | | | | | | | | |
Gross expenses3 | | | 3.40 | % | | | 3.77 | % |
Net expenses3 | | | 3.00 | % | | | 3.00 | % |
Net investment loss | | | (0.78 | )% | | | (1.70 | )% |
Supplemental data | | | | | | | | |
Portfolio turnover rate | | | 136 | % | | | 92 | % |
Net assets, end of period (000s omitted) | | | $1,873 | | | | $1,571 | |
| 1 | For the period from April 30, 2014 (commencement of class operations) to July 31, 2014 |
| 2 | Total return calculations do not include any sales charges. Returns for periods of less than one year are not annualized. |
| 3 | Ratios include fees for the prime broker and expenses from dividends and interest on securities sold short as follows: |
| | | | |
Six months ended January 31, 2015 (unaudited) | | | 0.60 | % |
Year ended July 31, 20141 | | | 0.58 | % |
The accompanying notes are an integral part of these financial statements.
| | | | | | |
| Financial highlights | | Wells Fargo Advantage Alternative Strategies Fund | | | 31 | |
(For a share outstanding throughout each period)
| | | | | | | | |
| | | Six months ended
January 31, 2015 (unaudited) | | | Year ended
July 31, 20141 | |
| CLASS C | | |
Net asset value, beginning of period | | | $10.06 | | | | $10.00 | |
Net investment loss | | | (0.07 | ) | | | (0.06 | ) |
Net realized and unrealized gains (losses) on investments | | | 0.43 | | | | 0.12 | |
| | | | | | | | |
Total from investment operations | | | 0.36 | | | | 0.06 | |
Distributions to shareholders from | | | | | | | | |
Net realized gains | | | (0.15 | ) | | | 0.00 | |
Net asset value, end of period | | | $10.27 | | | | $10.06 | |
Total return2 | | | 3.58 | % | | | 0.60 | % |
Ratios to average net assets (annualized) | | | | | | | | |
Gross expenses3 | | | 4.14 | % | | | 4.49 | % |
Net expenses3 | | | 3.75 | % | | | 3.75 | % |
Net investment loss | | | (1.51 | )% | | | (2.45 | )% |
Supplemental data | | | | | | | | |
Portfolio turnover rate | | | 136 | % | | | 92 | % |
Net assets, end of period (000s omitted) | | | $1,268 | | | | $1,133 | |
| 1 | For the period from April 30, 2014 (commencement of class operations) to July 31, 2014 |
| 2 | Total return calculations do not include any sales charges. Returns for periods of less than one year are not annualized. |
| 3 | Ratios include fees for the prime broker and expenses from dividends and interest on securities sold short as follows: |
| | | | |
Six months ended January 31, 2015 (unaudited) | | | 0.60 | % |
Year ended July 31, 20141 | | | 0.58 | % |
The accompanying notes are an integral part of these financial statements.
| | | | |
| 32 | | Wells Fargo Advantage Alternative Strategies Fund | | Financial highlights |
(For a share outstanding throughout each period)
| | | | | | | | |
| | | Six months ended
January 31, 2015 (unaudited) | | | Year ended July 31, 20141 | |
| ADMINISTRATOR CLASS | | |
Net asset value, beginning of period | | | $10.08 | | | | $10.00 | |
Net investment loss | | | (0.03 | ) | | | (0.04 | ) |
Net realized and unrealized gains (losses) on investments | | | 0.44 | | | | 0.12 | |
| | | | | | | | |
Total from investment operations | | | 0.41 | | | | 0.08 | |
Distributions to shareholders from | | | | | | | | |
Net realized gains | | | (0.15 | ) | | | 0.00 | |
Net asset value, end of period | | | $10.34 | | | | $10.08 | |
Total return2 | | | 3.97 | % | | | 0.90 | % |
Ratios to average net assets (annualized) | | | | | | | | |
Gross expenses3 | | | 3.23 | % | | | 3.57 | % |
Net expenses3 | | | 2.85 | % | | | 2.84 | % |
Net investment loss | | | (0.65 | )% | | | (1.54 | )% |
Supplemental data | | | | | | | | |
Portfolio turnover rate | | | 136 | % | | | 92 | % |
Net assets, end of period (000s omitted) | | | $1,226 | | | | $1,119 | |
| 1 | For the period from April 30, 2014 (commencement of class operations) to July 31, 2014 |
| 2 | Returns for periods of less than one year are not annualized. |
| 3 | Ratios include fees for the prime broker and expenses from dividends and interest on securities sold short as follows: |
| | | | |
Six months ended January 31, 2015 (unaudited) | | | 0.60 | % |
Year ended July 31, 20141 | | | 0.58 | % |
The accompanying notes are an integral part of these financial statements.
| | | | | | |
| Financial highlights | | Wells Fargo Advantage Alternative Strategies Fund | | | 33 | |
(For a share outstanding throughout each period)
| | | | | | | | |
| | | Six months ended
January 31, 2015 (unaudited) | | | Year ended July 31, 20141 | |
| INSTITUTIONAL CLASS | | |
Net asset value, beginning of period | | | $10.09 | | | | $10.00 | |
Net investment loss | | | (0.03 | ) | | | (0.04 | ) |
Net realized and unrealized gains (losses) on investments | | | 0.44 | | | | 0.13 | |
| | | | | | | | |
Total from investment operations | | | 0.41 | | | | 0.09 | |
Distributions to shareholders from | | | | | | | | |
Net realized gains | | | (0.15 | ) | | | 0.00 | |
Net asset value, end of period | | | $10.35 | | | | $10.09 | |
Total return2 | | | 4.07 | % | | | 0.90 | % |
Ratios to average net assets (annualized) | | | | | | | | |
Gross expenses3 | | | 2.96 | % | | | 3.29 | % |
Net expenses3 | | | 2.75 | % | | | 2.74 | % |
Net investment loss | | | (0.56 | )% | | | (1.44 | )% |
Supplemental data | | | | | | | | |
Portfolio turnover rate | | | 136 | % | | | 92 | % |
Net assets, end of period (000s omitted) | | | $110,191 | | | | $97,838 | |
| 1 | For the period from April 30, 2014 (commencement of class operations) to July 31, 2014 |
| 2 | Returns for periods of less than one year are not annualized. |
| 3 | Ratios include fees for the prime broker and expenses from dividends and interest on securities sold short as follows: |
| | | | |
Six months ended January 31, 2015 (unaudited) | | | 0.60 | % |
Year ended July 31, 20141 | | | 0.58 | % |
The accompanying notes are an integral part of these financial statements.
| | | | |
| 34 | | Wells Fargo Advantage Alternative Strategies Fund | | Notes to financial statements (unaudited) |
1. ORGANIZATION
Wells Fargo Funds Trust (the “Trust”), a Delaware statutory trust organized on March 10, 1999, is an open-end management investment company registered under the Investment Company Act of 1940, as amended (the “1940 Act”). As an investment company, the Trust follows the accounting and reporting guidance in Financial Accounting Standards Board (“FASB”) Accounting Standards Codification Topic 946, Financial Services – Investment Companies. These financial statements report on the Wells Fargo Advantage Alternative Strategies Fund (the “Fund”) which is a diversified series of the Trust.
2. SIGNIFICANT ACCOUNTING POLICIES
The following significant accounting policies, which are consistently followed in the preparation of the financial statements of the Fund, are in conformity with U.S. generally accepted accounting principles which require management to make estimates and assumptions that affect the reported amounts of assets and liabilities, disclosure of contingent assets and liabilities at the date of the financial statements, and the reported amounts of revenues and expenses during the reporting period. Actual results could differ from those estimates.
Securities valuation
All investments are valued each business day as of the close of regular trading on the New York Stock Exchange (generally 4 p.m. Eastern Time).
Equity securities, options, and futures that are listed on a foreign or domestic exchange or market are valued at the official closing price or, if none, the last sales price. If no sale occurs on the primary exchange or market for the security that day, the prior day’s price will be deemed “stale” and fair values will be determined in accordance with the Fund’s Valuation Procedures. Non-listed OTC options, swaps, and exotics (i.e. caps, floors, etc.) are valued at the evaluated price provided by an independent pricing service or an independent broker-dealer that the Management Valuation Team of Wells Fargo Funds Management, LLC (“Funds Management”) had determined is an acceptable source.
The values of securities denominated in foreign currencies are translated into U.S. dollars at rates provided by an independent foreign currency pricing source at a time each business day specified by the Management Valuation Team.
Many securities markets and exchanges outside the U.S. close prior to the close of the New York Stock Exchange and therefore may not fully reflect trading or events that occur after the close of the principal exchange in which the foreign securities are traded, but before the close of the New York Stock Exchange. If such trading or events are expected to materially affect the value of such securities, then fair value pricing procedures approved by the Board of Trustees of the Fund are applied. These procedures take into account multiple factors including movements in U.S. securities markets after foreign exchanges close. Foreign securities that are fair valued under these procedures are categorized as Level 2 and the application of these procedures may result in transfers between Level 1 and Level 2. Depending on market activity, such fair valuations may be frequent. Such fair value pricing may result in net asset values that are higher or lower than net asset values based on the last reported sales price or latest quoted bid price. On January 31, 2015, such fair value pricing was used in pricing foreign securities.
Fixed income securities acquired with maturities exceeding 60 days are valued based on evaluated bid prices provided by an independent pricing service which may utilize both transaction data and market information such as yield, quality, coupon rate, maturity, type of issue, trading characteristics and other market data. If prices are not available from the independent pricing service or prices received are deemed not representative of market value, prices will be obtained from an independent broker-dealer.
Short-term securities, with maturities of 60 days or less at time of purchase, generally are valued at amortized cost which approximates fair value. The amortized cost method involves valuing a security at its cost, plus accretion of discount or minus amortization of premium over the period until maturity.
Investments in registered open-end investment companies are valued at net asset value.
Investments which are not valued using any of the methods discussed above are valued at their fair value, as determined in good faith by the Board of Trustees. The Board of Trustees has established a Valuation Committee comprised of the Trustees and has delegated to it the authority to take any actions regarding the valuation of portfolio securities that the Valuation Committee deems necessary or appropriate, including determining the fair value of portfolio securities, unless the determination has been delegated to the Management Valuation Team. The Board of Trustees retains the authority to make or ratify any valuation decisions or approve any changes to the Valuation Procedures as it deems appropriate. On a quarterly basis, the Board of Trustees receives reports on any valuation actions taken by the Valuation Committee or the Management Valuation Team which may include items for ratification.
| | | | | | |
| Notes to financial statements (unaudited) | | Wells Fargo Advantage Alternative Strategies Fund | | | 35 | |
Valuations of fair valued securities are compared to the next actual sales price when available, or other appropriate market values, to assess the continued appropriateness of the fair valuation methodologies used. These securities are fair valued on a day-to-day basis, taking into consideration changes to appropriate market information and any significant changes to the inputs considered in the valuation process until there is a readily available price provided on an exchange or by an independent pricing service. Valuations received from an independent pricing service or independent broker-dealer quotes are periodically validated by comparisons to most recent trades and valuations provided by other independent pricing services in addition to the review of prices by the adviser and/or subadviser. Unobservable inputs used in determining fair valuations are identified based on the type of security, taking into consideration factors utilized by market participants in valuing the investment, knowledge about the issuer and the current market environment.
Foreign currency translation
The accounting records of the Fund are maintained in U.S. dollars. The values of other assets and liabilities denominated in foreign currencies are translated into U.S. dollars at rates provided by an independent foreign currency pricing source at a time each business day specified by the Management Valuation Team. Purchases and sales of securities, and income and expenses are converted at the rate of exchange on the respective dates of such transactions. Net realized foreign exchange gains or losses arise from sales of foreign currencies, currency gains or losses realized between the trade and settlement dates on securities transactions, and the difference between the amounts of dividends, interest and foreign withholding taxes recorded and the U.S. dollar equivalent of the amounts actually paid or received. Net unrealized foreign exchange gains and losses arise from changes in the fair value of assets and liabilities other than investments in securities resulting from changes in exchange rates. The changes in net assets arising from changes in exchange rates and the changes in net assets resulting from changes in market prices of securities are not separately presented. Such changes are included in net realized and unrealized gains or losses from investments.
Forward foreign currency contracts
The Fund is subject to foreign currency exchange rate risk in the normal course of pursuing its investment objectives. A forward foreign currency contract is an agreement between two parties to purchase or sell a specific currency for an agreed-upon price at a future date. The Fund enters into forward foreign currency contracts to facilitate transactions in foreign-denominated securities and to attempt to minimize the risk to the Fund from adverse changes in the relationship between currencies. Forward foreign currency contracts are recorded at the forward rate and marked-to-market daily. When the contracts are closed, realized gains and losses arising from such transactions are recorded as realized gains or losses on forward foreign currency contract transactions. The Fund could be exposed to risks if the counterparties to the contracts are unable to meet the terms of their contracts or if the value of the foreign currency changes unfavorably. The Fund’s maximum risk of loss from counterparty credit risk is the unrealized gains on the contracts. This risk may be mitigated if there is a master netting arrangement between the Fund and the counterparty.
When-issued transactions
The Fund may purchase securities on a forward commitment or when-issued basis. The Fund records a when-issued transaction on the trade date and will segregate assets in an amount at least equal in value to the Fund’s commitment to purchase when-issued securities. Securities purchased on a when-issued basis are marked-to-market daily and the Fund begins earning interest on the settlement date. Losses may arise due to changes in the market value of the underlying securities or if the counterparty does not perform under the contract.
Futures contracts
The Fund is subject to interest rate risk, equity price risk, and foreign currency exchange rate risk in the normal course of pursuing its investment objectives. The Fund may buy and sell futures contracts in order to gain exposure to, or protect against, changes in security values and interest rates. The primary risks associated with the use of futures contracts are the imperfect correlation between changes in market values of securities held by the Fund and the prices of futures contracts, and the possibility of an illiquid market.
The aggregate principal amounts of the contracts are not recorded in the financial statements. Fluctuations in the value of the contracts are recorded in the Statement of Assets and Liabilities as an asset or liability and in the Statement of Operations as unrealized gains or losses until the contracts are closed, at which point they are recorded as net realized gains or losses on futures contracts. With futures contracts, there is minimal counterparty risk to the Fund since futures are exchange traded and the exchange’s clearinghouse, as counterparty to all exchange traded futures, guarantees the futures against default.
Options
The Fund is subject to equity price risk in the normal course of pursuing its investment objectives. The Fund may write covered call options or secured put options on individual securities and/or indexes. When the Fund writes an option, an
| | | | |
| 36 | | Wells Fargo Advantage Alternative Strategies Fund | | Notes to financial statements (unaudited) |
amount equal to the premium received is recorded as a liability and is subsequently adjusted to the current market value of the written option. Premiums received from written options that expire unexercised are recognized as realized gains on the expiration date. For exercised options, the difference between the premium received and the amount paid on effecting a closing purchase transaction, including brokerage commissions, is treated as a realized gain or loss. If a call option is exercised, the premium is added to the proceeds from the sale of the underlying security in calculating the realized gain or loss on the sale. If a put option is exercised, the premium reduces the cost of the security purchased. The Fund, as a writer of an option, bears the market risk of an unfavorable change in the price of the security and/or index underlying the written option.
The Fund may also purchase call or put options. The premium is included in the Statement of Assets and Liabilities as an investment, the value of which is subsequently adjusted based on the current market value of the option. Premiums paid for purchased options that expire are recognized as realized losses on the expiration date. Premiums paid for purchased options that are exercised or closed are added to the amount paid or offset against the proceeds received for the underlying security to determine the realized gain or loss. The risk of loss associated with purchased options is limited to the premium paid.
Options traded on an exchange are regulated and terms of the options are standardized. Purchased options traded over-the-counter expose the Fund to counterparty risk in the event the counterparty does not perform. This risk can be mitigated by having a master netting arrangement between the Fund and the counterparty and by having the counterparty post collateral to cover the Fund’s exposure to the counterparty.
Short sales
The Fund may sell a security it does not own in anticipation of a decline in the market value of that security (short sale). When the Fund makes a short sale, it must borrow the security sold short and deliver it to the buyer. The Fund is then obligated to replace the security borrowed by purchasing the security at the market price at the time of replacement.
The Fund records the proceeds as a liability which is marked-to-market daily based upon quotations from an independent pricing service or an independent broker-dealer and any change in value is recorded as an unrealized gain or loss. Any interest or dividends accrued on such borrowed securities during the period of the loan are recorded as an expense on the Statement of Operations. To borrow the security, the Fund may be required to pay a premium, which would decrease the proceeds of the security sold. A gain, limited to the price at which the Fund sold the security short, or a loss, unlimited in size, will be recognized upon the closing of a short sale if the market price at the closing is less than or greater than, respectively, the proceeds originally received. Until the short sale is closed or the borrowed security is replaced, the Fund maintains a segregated account of cash or liquid securities, the dollar value of which is at least equal to the market value of the security at the time of the short sale.
Total return swaps
The Fund is subject to interest rate risk and equity price risk in the normal course of pursuing its investment objectives. The Fund may enter into total return swap contracts for hedging or speculative purposes. Total return swaps involve commitments to pay interest in exchange for a market-linked return, both based on notional amounts. To the extent the total return of the security or index underlying the transaction exceeds or falls short of the offsetting interest rate obligation, the Fund will receive a payment from, or make a payment to, the counterparty.
The value of the swap contract is marked-to-market daily based upon quotations from an independent pricing service or an independent broker-dealer and any change in value is recorded as an unrealized gain or loss. Periodic payments made or received are recorded as realized gains or losses. The Fund could be exposed to risks if the counterparty defaults on its obligation to perform, or if there are unfavorable changes in the fluctuation of interest rates or in the price of the underlying security or index. The Fund’s maximum risk of loss from counterparty risk is the fair value of the contract. This risk is mitigated by having a master netting arrangement between the Fund and the counterparty and by having the counterparty post collateral to cover the Fund’s exposure to the counterparty.
Certain total return swap contracts entered into by the Fund provide for conditions that result in events of default or termination that enable the counterparty to the agreement to cause an early termination of the transactions under those agreements. Any election by the counterparty to terminate early may impact the amounts reported on the financial statements.
Security transactions and income recognition
Securities transactions are recorded on a trade date basis. Realized gains or losses are recorded on the basis of identified cost.
| | | | | | |
| Notes to financial statements (unaudited) | | Wells Fargo Advantage Alternative Strategies Fund | | | 37 | |
Interest income is accrued daily and bond discounts are accreted and premiums are amortized daily based on the effective interest method. To the extent debt obligations are placed on non-accrual status, any related interest income may be reduced by writing off interest receivables when the collection of all or a portion of interest has become doubtful based on consistently applied procedures. If the issuer subsequently resumes interest payments or when the collectability of interest is reasonably assured, the debt obligation is removed from non-accrual status.
Dividend income is recognized on the ex-dividend date, except for certain dividends from foreign securities, which are recorded as soon as the custodian verifies the ex-dividend date. Dividend income from foreign securities is recorded net of foreign taxes withheld where recovery of such taxes is not assured.
Distributions to shareholders
Distributions to shareholders from net investment income and net realized gains, if any, are recorded on the ex-dividend date. Such distributions are determined in conformity with federal income tax regulations, which may differ in amount or character from net investment income and realized gains recognized for purposes of U.S. generally accepted accounting principles.
Federal and other taxes
The Fund intends to continue to qualify as a regulated investment company by distributing substantially all of its investment company taxable income and any net realized capital gains (after reduction for capital loss carryforwards) sufficient to relieve it from all, or substantially all, federal income taxes. Accordingly, no provision for federal income taxes was required.
The Fund’s income and federal excise tax returns and all financial records supporting those returns for the fiscal year since commencement of operations are subject to examination by the federal and Delaware revenue authorities. Management has analyzed the Fund’s tax positions taken on federal, state, and foreign tax returns for all open tax years and does not believe that there are any uncertain tax positions that require recognition of a tax liability.
Class allocations
The separate classes of shares offered by the Fund differ principally in applicable sales charges, distribution, shareholder servicing, and administration fees. Class specific expenses are charged directly to that share class. Investment income, common expenses, and realized and unrealized gains (losses) on investments are allocated daily to each class of shares based on the relative proportion of net assets of each class.
3. FAIR VALUATION MEASUREMENTS
Fair value measurements of investments are determined within a framework that has established a fair value hierarchy based upon the various data inputs utilized in determining the value of the Fund’s investments. The three-level hierarchy gives the highest priority to unadjusted quoted prices in active markets for identical assets or liabilities (Level 1) and the lowest priority to significant unobservable inputs (Level 3). The Fund’s investments are classified within the fair value hierarchy based on the lowest level of input that is significant to the fair value measurement. The inputs are summarized into three broad levels as follows:
| n | | Level 1 – quoted prices in active markets for identical securities |
| n | | Level 2 – other significant observable inputs (including quoted prices for similar securities, interest rates, prepayment speeds, credit risk, use of amortized cost, etc.) |
| n | | Level 3 – significant unobservable inputs (including the Fund’s own assumptions in determining the fair value of investments) |
The inputs or methodologies used for valuing investments in securities are not necessarily an indication of the risk associated with investing in those securities.
| | | | |
| 38 | | Wells Fargo Advantage Alternative Strategies Fund | | Notes to financial statements (unaudited) |
The following is a summary of the inputs used in valuing the Fund’s assets and liabilities as of January 31, 2015:
| | | | | | | | | | | | | | | | |
| | | Quoted prices (Level 1) | | | Other significant observable inputs (Level 2) | | | Significant unobservable inputs (Level 3) | | | Total | |
Assets | | | | | | | | | | | | | | | | |
Investments in: | | | | | | | | | | | | | | | | |
| | | | |
Common stocks | | | | | | | | | | | | | | | | |
Consumer discretionary | | $ | 12,388,828 | | | $ | 476,015 | | | $ | 0 | | | $ | 12,864,843 | |
Consumer staples | | | 3,155,681 | | | | 925,066 | | | | 0 | | | | 4,080,747 | |
Energy | | | 4,110,409 | | | | 174,213 | | | | 0 | | | | 4,284,622 | |
Financials | | | 6,268,582 | | | | 799,493 | | | | 0 | | | | 7,068,075 | |
Health care | | | 9,718,325 | | | | 454,673 | | | | 0 | | | | 10,172,998 | |
Industrials | | | 5,374,112 | | | | 1,012,927 | | | | 0 | | | | 6,387,039 | |
Information technology | | | 6,739,624 | | | | 652,321 | | | | 0 | | | | 7,391,945 | |
Materials | | | 3,640,689 | | | | 132,616 | | | | 0 | | | | 3,773,305 | |
Telecommunication services | | | 1,276,425 | | | | 251,833 | | | | 0 | | | | 1,528,258 | |
Utilities | | | 102,196 | | | | 266,333 | | | | 0 | | | | 368,529 | |
| | | | |
Corporate bonds and notes | | | 0 | | | | 4,196,863 | | | | 0 | | | | 4,196,863 | |
| | | | |
Exchange-traded funds | | | 244,025 | | | | 0 | | | | 0 | | | | 244,025 | |
| | | | |
Foreign corporate bonds and notes | | | 0 | | | | 410,419 | | | | 0 | | | | 410,419 | |
| | | | |
Investment companies | | | 8,723,939 | | | | 0 | | | | 0 | | | | 8,723,939 | |
| | | | |
Municipal obligations | | | 0 | | | | 435,624 | | | | 0 | | | | 435,624 | |
| | | | |
Participation notes | | | | | | | | | | | | | | | | |
Financials | | | 0 | | | | 353,433 | | | | 0 | | | | 353,433 | |
| | | | |
Preferred stocks | | | | | | | | | | | | | | | | |
Financials | | | 30,038 | | | | 0 | | | | 0 | | | | 30,038 | |
Industrials | | | 0 | | | | 0 | | | | 40,514 | | | | 40,514 | |
| | | | |
Purchased put options | | | 0 | | | | 319,724 | | | | 0 | | | | 319,724 | |
| | | | |
Warrants | | | | | | | | | | | | | | | | |
Financials | | | 0 | | | | 113,927 | | | | 0 | | | | 113,927 | |
| | | | |
Yankee corporate bonds and notes | | | 0 | | | | 2,108,831 | | | | 0 | | | | 2,108,831 | |
| | | | |
Short-term investments | | | | | | | | | | | | | | | | |
Investment companies | | | 27,806,267 | | | | 0 | | | | 0 | | | | 27,806,267 | |
U.S. Treasury securities | | | 1,649,862 | | | | 0 | | | | 0 | | | | 1,649,862 | |
| | | | 91,229,002 | | | | 13,084,311 | | | | 40,514 | | | | 104,353,827 | |
| | | | |
Forward foreign currency contracts | | | 0 | | | | 39,541 | | | | 0 | | | | 39,541 | |
| | | | |
Futures contracts | | | 237,072 | | | | 0 | | | | 0 | | | | 237,072 | |
Total return swap contracts | | | 0 | | | | 40,497 | | | | 0 | | | | 40,497 | |
Total assets | | $ | 91,466,074 | | | $ | 13,164,349 | | | $ | 40,514 | | | $ | 104,670,937 | |
Liabilities | | | | | | | | | | | | | | | | |
| | | | |
Forward foreign currency contracts | | $ | 0 | | | $ | 27,738 | | | $ | 0 | | | $ | 27,738 | |
| | | | |
Futures contracts | | | 109,526 | | | | 0 | | | | 0 | | | | 109,526 | |
| | | | |
Securities sold short | | | 17,189,675 | | | | 274,003 | | | | 0 | | | | 17,463,678 | |
| | | | |
Total return swap contracts | | | 0 | | | | 39,841 | | | | 0 | | | | 39,841 | |
Written options | | | 0 | | | | 122,218 | | | | 0 | | | | 122,218 | |
Total liabilities | | $ | 17,299,201 | | | $ | 463,800 | | | $ | 0 | | | $ | 17,763,001 | |
Forward foreign currency contracts are reported at their unrealized gains (losses) at measurement date, which represents the change in the contract’s value from trade date. Futures contracts are reported at their variation margin at measurement date, which represents the amount due to/from the Fund at that date. Swap contracts consists of
| | | | | | |
| Notes to financial statements (unaudited) | | Wells Fargo Advantage Alternative Strategies Fund | | | 39 | |
unrealized gains (losses) and premiums paid or received on swap contracts, which represents the change in the contract’s value from trade date. All other assets and liabilities are reported at their market value at measurement date.
The Fund recognizes transfers between levels within the fair value hierarchy at the end of the reporting period. At January 31, 2015, fair value pricing was used in pricing certain foreign securities. Common stocks valued at $5,143,495 and securities sold short valued at $274,003 were transferred from Level 1 to Level 2 within the fair value hierarchy. The Fund did not have any transfers into/out of Level 3.
4. TRANSACTIONS WITH AFFILIATES AND OTHER EXPENSES
Advisory fee
The Trust has entered into an advisory contract with Funds Management, an indirect wholly owned subsidiary of Wells Fargo & Company (“Wells Fargo”). The adviser is responsible for implementing investment policies and guidelines and for supervising the subadvisers, who are responsible for day-to-day portfolio management of the Fund.
Pursuant to the contract, Funds Management is entitled to receive an annual advisory fee starting at 1.80% and declining to 1.65% as the average daily net assets of the Fund increase. For the six months ended January 31, 2015, the advisory fee was equivalent to an annual rate of 1.80% of the Fund’s average daily net assets.
Funds Management has engaged The Rock Creek Group, LP, Chilton Investment Company, LLC, Mellon Capital
Management Corporation, Passport Capital, LLC, Pine River Capital Management L.P., River Canyon Fund Management LLC, Sirios Capital Management, L.P. and Wellington Management Company, LLP (“WMC”) to serve as sub-advisers to the Fund. The fee for subadvisory services is borne by Funds Management. The subadvisers are each entitled to receive from Funds Management an annual subadvisory fee which is calculated based on the average daily net assets of each subadviser’s portion the Fund.
On January 1, 2015, WMC completed a corporate restructuring under which WMC, a Massachusetts limited liability partnership, became Wellington Management Group, LLP (“WMG”) and subsequently transferred its U.S. advisory business to a new subsidiary, Wellington Management Company LLP, a Delaware limited liability partnership (“Wellington”). Wellington became registered as an investment adviser with the SEC by succeeding to WMG’s SEC registration . In connection with this restructuring, there have been no changes in the management of Wellington and no changes in personnel related to the subadvisory services provided to the Fund. There was no assignment or subsequent termination of the Fund’s subadvisory arrangement with Wellington as a result of this restructuring.
The Rock Creek Group, LP, an indirect majority owned subsidiary of Wells Fargo and an affiliate of Funds Management, is entitled to receive a fee at an annual rate starting at 0.72% and declining to 0.60% as the average daily net assets of its portion of the Fund increase. For the six months ended January 31, 2015, the subadvisory fees paid to the remaining unaffiliated subadvisors was equivalent to an annual rate of 0.84% of the Fund’s average daily net assets.
Administration fees
The Trust has entered into an administration agreement with Funds Management. Under this agreement, for providing administrative services, which includes paying fees and expenses for services provided by the transfer agent, sub-transfer agents, omnibus account servicers and record-keepers, Funds Management is entitled to receive from the Fund an annual fund level administration fee starting at 0.05% and declining to 0.03% as the average daily net assets of the Fund increase and a class level administration fee which is calculated based on the average daily net assets of each class as follows:
| | | | |
| | | Class level administration fee | |
Class A, Class C | | | 0.26 | % |
Administrator Class | | | 0.10 | |
Institutional Class | | | 0.08 | |
Funds Management has contractually waived and/or reimbursed advisory and administration fees to the extent necessary to maintain certain net operating expense ratios for the Fund. Waiver of fees and/or reimbursement of expenses by Funds Management were made first from fund level expenses on a proportionate basis and then from class specific expenses. Funds Management has committed through November 30, 2015 to waive fees and/or reimburse expenses to the extent necessary to cap the Fund’s expenses at 2.50% for Class A shares, 3.25% for Class C shares, 2.35% for Administrator Class shares, and 2.25% for Institutional Class shares. After this time, the cap may be increased or the commitment to maintain the cap may be terminated only with the approval of the Board of Trustees. Fees for the prime broker and expenses from dividends and interest on short positions are excluded from the expense caps.
| | | | |
| 40 | | Wells Fargo Advantage Alternative Strategies Fund | | Notes to financial statements (unaudited) |
Distribution fee
The Trust has adopted a Distribution Plan for Class C shares of the Fund pursuant to Rule 12b-1 under the 1940 Act. A distribution fee is charged to Class C shares and paid to Wells Fargo Funds Distributor, LLC (“Funds Distributor”), the principal underwriter, at an annual rate of 0.75% of the average daily net assets of Class C shares.
In addition, Funds Distributor is entitled to receive the front-end sales charge from the purchase of Class A shares and a contingent deferred sales charge on the redemption of certain shares. Funds Distributor is also entitled to receive the contingent deferred sales charges from redemptions of Class C shares.
Shareholder servicing fees
The Trust has entered into contracts with one or more shareholder servicing agents, whereby Class A, Class C, and Administrator Class of the Fund is charged a fee at an annual rate of 0.25% of the average daily net assets of each respective class.
A portion of these total shareholder servicing fees were paid to affiliates of Wells Fargo.
5. INVESTMENT PORTFOLIO TRANSACTIONS
Purchases and sales of investments, excluding U.S. government obligations (if any) and short-term securities, for the six months ended January 31, 2015 were $136,233,436 and $126,756,274, respectively.
6. DERIVATIVE TRANSACTIONS
During the six months ended January 31, 2015, the Fund entered into futures contracts for speculative purposes.
At January 31, 2015, the Fund had long and short futures contracts outstanding as follows:
| | | | | | | | | | | | | | |
| Expiration date | | Contracts | | Counterparty | | Type | | Contract value at January 31, 2015 | | | Unrealized gains (losses) | |
2-20-2015 | | 19 Long | | Morgan Stanley | | Amsterdam Index | | $ | 1,929,294 | | | $ | 100,790 | |
2-20-2015 | | 5 Short | | Morgan Stanley | | CAC 40 Index | | | 260,324 | | | | 1,257 | |
2-26-2015 | | 8 Long | | Morgan Stanley | | Hang Seng Index | | | 1,265,947 | | | | (13,533 | ) |
3-6-2015 | | 40 Short | | Morgan Stanley | | Euro-Bund Futures | | | 7,204,426 | | | | (144,482 | ) |
3-12-2015 | | 45 Long | | Morgan Stanley | | TOPIX Index | | | 5,420,463 | | | | (49,908 | ) |
3-16-2015 | | 15 Short | | Morgan Stanley | | 10-Year Australian Treasury Bonds | | | 1,538,919 | | | | (32,989 | ) |
3-16-2015 | | 40 Short | | Morgan Stanley | | Australian Dollar Futures | | | 3,104,800 | | | | 109,087 | |
3-16-2015 | | 47 Short | | Morgan Stanley | | British Pound Futures | | | 4,421,819 | | | | 154,462 | |
3-16-2015 | | 29 Short | | Morgan Stanley | | Euro FX Futures | | | 4,094,800 | | | | 338,561 | |
3-16-2015 | | 8 Short | | Morgan Stanley | | Norwegian Krone Futures | | | 2,069,280 | | | | 5,215 | |
3-16-2015 | | 4 Long | | Morgan Stanley | | Swiss Franc Futures | | | 546,400 | | | | 2,100 | |
3-17-2015 | | 62 Short | | Morgan Stanley | | Canadian Dollar Futures | | | 4,886,220 | | | | 175,810 | |
3-19-2015 | | 2 Short | | Morgan Stanley | | S&P/TSX 60 Index | | | 269,300 | | | | (526 | ) |
3-19-2015 | | 13 Long | | Morgan Stanley | | ASX SPI 200 Index | | | 1,402,195 | | | | 72,892 | |
3-20-2015 | | 2 Short | | Morgan Stanley | | 10-Year Canadian Treasury Bonds | | | 229,291 | | | | (2,847 | ) |
3-20-2015 | | 44 Long | | Morgan Stanley | | 10-Year U.S. Treasury Notes | | | 5,758,500 | | | | 152,980 | |
3-20-2015 | | 9 Long | | Morgan Stanley | | DAX Index | | | 2,719,203 | | | | 270,300 | |
3-20-2015 | | 46 Short | | Morgan Stanley | | FTSE 100 Index | | | 4,646,269 | | | | (285,435 | ) |
3-20-2015 | | 5 Short | | Morgan Stanley | | FTSE MIB Index | | | 578,758 | | | | 2,726 | |
3-20-2015 | | 22 Short | | Morgan Stanley | | MSCI EAFE Index | | | 1,943,260 | | | | (23,734 | ) |
3-20-2015 | | 6 Short | | Morgan Stanley | | MSCI Emerging Markets Index | | | 285,450 | | | | (9,407 | ) |
3-20-2015 | | 44 Short | | Morgan Stanley | | S&P 500 Index | | | 4,374,480 | | | | 74,499 | |
3-20-2015 | | 15 Short | | Morgan Stanley | | S&P 500 Index | | | 1,491,300 | | | | 10,492 | |
3-20-2015 | | 2 Short | | Morgan Stanley | | S&P Midcap 400 Index | | | 286,280 | | | | (7,571 | ) |
3-27-2015 | | 5 Short | | Morgan Stanley | | Long Gilt Bonds | | | 932,866 | | | | (8,068 | ) |
| | | | | | |
| Notes to financial statements (unaudited) | | Wells Fargo Advantage Alternative Strategies Fund | | | 41 | |
The Fund had an average notional amount of $23,778,157 in long futures contracts and $38,592,192 in short future contracts during the six months ended January 31, 2015. As of January 31, 2015, the Fund had segregated $182,710 as cash collateral for open futures contracts.
During the six months ended January 31, 2015, the Fund entered into forward foreign currency contracts for economic hedging purposes.
At January 31, 2015, the Fund had forward foreign currency contracts outstanding as follows:
Forward foreign currency contracts to buy:
| | | | | | | | | | | | | | | | | | |
| Exchange date | | Counterparty | | Contracts to receive | | | U.S. value at January 31, 2015 | | | In exchange for U.S. $ | | | Unrealized losses | |
| 3-18-2015 | | Bank of America | | | 6,000 | EUR | | $ | 6,783 | | | $ | 6,965 | | | $ | (182 | ) |
| 4-23-2015 | | Morgan Stanley | | | 49,000 | EUR | | | 55,410 | | | | 56,636 | | | | (1,226 | ) |
| 4-23-2015 | | Morgan Stanley | | | 18,000 | EUR | | | 20,355 | | | | 20,565 | | | | (210 | ) |
| 4-23-2015 | | Morgan Stanley | | | 70,000 | EUR | | | 79,157 | | | | 81,337 | | | | (2,180 | ) |
Forward foreign currency contracts to sell:
| | | | | | | | | | | | | | | | | | |
| Exchange Date | | Counterparty | | Contracts to deliver | | | U.S. value at January 31, 2015 | | | In exchange for U.S. $ | | | Unrealized gains (losses) | |
| 2-20-2015 | | Morgan Stanley | | | 118,125 EUR | | | $ | 133,501 | | | $ | 137,305 | | | $ | 3,804 | |
| 2-20-2015 | | Morgan Stanley | | | 187,000 GBP | | | | 281,628 | | | | 283,569 | | | | 1,941 | |
| 3-18-2015 | | Citibank | | | 80,000 EUR | | | | 90,434 | | | | 93,658 | | | | 3,224 | |
| 3-18-2015 | | JPMorgan Chase & Company | | | 15,509,000 JPY | | | | 132,136 | | | | 129,773 | | | | (2,363 | ) |
| 3-18-2015 | | Morgan Stanley | | | 29,349 GBP | | | | 44,193 | | | | 46,109 | | | | 1,916 | |
| 3-18-2015 | | Morgan Stanley | | | 403,375 CHF | | | | 440,281 | | | | 418,756 | | | | (21,525 | ) |
| 3-18-2015 | | National Australia Bank | | | 74,000 EUR | | | | 83,651 | | | | 91,675 | | | | 8,024 | |
| 4-23-2015 | | Morgan Stanley | | | 390,000 EUR | | | | 441,018 | | | | 461,650 | | | | 20,632 | |
| 4-23-2015 | | Morgan Stanley | | | 20,000 EUR | | | | 22,616 | | | | 22,564 | | | | (52 | ) |
The Fund had average contract amounts of $495,765 and $2,024,573 in forward foreign currency contracts to buy and forward foreign currency contracts to sell, respectively, during the six months ended January 31, 2015.
During the six months ended January 31, 2015, the Fund entered into written options for speculative purposes.
During the six months ended January 31, 2015, the Fund had written option activities as follows:
| | | | | | | | | | | | | | | | |
| | | Call options | | | Put options | |
| | | Number of contracts | | | Premiums received | | | Number of contracts | | | Premiums received | |
Options outstanding at July 31, 2014 | | | 0 | | | $ | 0 | | | | 32 | | | $ | 111,903 | |
Options written | | | 4 | | | | 610 | | | | 364 | | | | 125,737 | |
Options expired | | | 0 | | | | 0 | | | | 0 | | | | 0 | |
Options closed | | | 0 | | | | 0 | | | | (34 | ) | | | (114,037 | ) |
Options exercised | | | (1 | ) | | | (173 | ) | | | 0 | | | | 0 | |
Options outstanding at January 31, 2015 | | | 3 | | | $ | 437 | | | | 362 | | | $ | 123,603 | |
| | | | |
| 42 | | Wells Fargo Advantage Alternative Strategies Fund | | Notes to financial statements (unaudited) |
Open put and call options written at January 31, 2015 were as follows:
| | | | | | | | | | | | | | | | | | | | |
| Expiration date | | Counterparty | | Description | | Number of contracts | | | Call/Put | | | Strike price | | | Value | |
2-20-2015 | | Morgan Stanley | | Boyd Gaming Corporation | | | 2 | | | | Call | | | $ | 13 | | | $ | (140 | ) |
3-20-2015 | | Morgan Stanley | | Energy Select Sector
SPDR Fund ETF | | | 336 | | | | Put | | | | 67 | | | | (34,608 | ) |
3-20-2015 | | Morgan Stanley | | S&P 500 Index | | | 8 | | | | Put | | | | 1,800 | | | | (11,120 | ) |
4-17-2015 | | Morgan Stanley | | PetSmart Incorporated | | | 1 | | | | Call | | | | 75 | | | | (750 | ) |
9-18-2015 | | Morgan Stanley | | S&P 500 Index | | | 18 | | | | Put | | | | 1,675 | | | | (75,600 | ) |
The Fund had an average of 52 written option contracts during the six months ended January 31, 2015. As of January 31, 2015, the Fund had segregated $218,835 as cash collateral for written options.
During the six months ended January 31, 2015, the Fund entered into purchased option contracts for speculative purposes and had an average of 392 purchased option contracts.
The Fund enters into total return swap contracts as a substitute for taking a position in the underlying security or basket of securities or to potentially enhance the Fund’s total return. At January 31, 2015, the Fund had the following total return swap contracts outstanding:
| | | | | | | | | | |
| Expiration | | Notional amount | | Counterparty | | Swap description | | Unrealized gains
(losses) | |
| 9-5-2015 | | $65,723 | | Morgan Stanley | | In an agreement dated 8-6-2014, the Fund makes monthly payments of 1 Month USD LIBOR +60 basis points. At expiration, the Fund will receive the positive return or pay the negative return of the referenced entity Inmarsat plc. | | $ | 3,191 | |
| 10-20-2016 | | 110,578 | | Morgan Stanley | | In an agreement dated 10-17-2014, the Fund makes monthly payments of 1 Month USD LIBOR. At expiration, the Fund will receive the positive return or pay the negative return of the referenced entity Ally Financial Incorporated. | | | (14,839 | ) |
| 10-20-2016 | | 278,098 | | Morgan Stanley | | In an agreement dated 10-17-2014, the Fund makes monthly payments of 1 Month USD LIBOR. At expiration, the Fund will receive the positive return or pay the negative return of the referenced entity Brookdale Senior Living Incorporated. | | | 20,623 | |
| 10-20-2016 | | 124,586 | | Morgan Stanley | | In an agreement dated 10-17-2014, the Fund makes monthly payments of 1 Month USD LIBOR. At expiration, the Fund will receive the positive return or pay the negative return of the referenced entity Chimera Investment Corporation. | | | 2,427 | |
| 10-20-2016 | | 119,199 | | Morgan Stanley | | In an agreement dated 10-17-2014, the Fund makes monthly payments of 1 Month USD LIBOR. At expiration, the Fund will receive the positive return or pay the negative return of the referenced entity Comcast Corporation Class A. | | | 5,798 | |
| 10-20-2016 | | 93,456 | | Morgan Stanley | | In an agreement dated 10-17-2014, the Fund makes monthly payments of 1 Month USD LIBOR. At expiration, the Fund will receive the positive return or pay the negative return of the referenced entity EP Energy Corporation Class A. | | | (25,002 | ) |
| 10-20-2016 | | 50,245 | | Morgan Stanley | | In an agreement dated 10-17-2014, the Fund makes monthly payments of 1 Month USD LIBOR. At expiration, the Fund will receive the positive return or pay the negative return of the referenced entity Marathon Petroleum Corporation. | | | 8,458 | |
The Fund had an average notional balance on total return swaps of $618,627 during the six months ended January 31, 2015. As of January 31, 2015, the Fund had segregated $210,610 as cash collateral for total return swaps.
| | | | | | |
| Notes to financial statements (unaudited) | | Wells Fargo Advantage Alternative Strategies Fund | | | 43 | |
A summary of derivative instruments by primary risk exposure is outlined in the following tables.
The fair value of derivative instruments as of January 31, 2015 was as follows for the Fund:
| | | | | | | | | | | | |
| | | Asset derivatives | | | Liability derivatives | |
| | | Statement of Assets and
Liabilities location | | Fair value | | | Statement of Assets and
Liabilities location | | Fair value | |
Equity risk | | Investments in unaffiliated securities, at value | | $ | 319,724 | ** | | Payable for written options | | $ | 122,218 | |
| | Receivable for daily variation margin on open futures contracts | | | 186,012 | * | | Payable for daily variation margin on open futures contracts | | | 25,293 | * |
Foreign currency risk | | Unrealized gains on forward foreign currency contracts | | | 39,541 | | | Unrealized losses on forward foreign currency contracts | | | 27,738 | |
| | Receivable for daily variation margin on open futures contracts | | | 23,098 | * | | Payable for daily variation margin on open futures contracts | | | 43,712 | * |
Interest rate risk | | Receivable for daily variation margin on open futures contracts | | | 27,962 | * | | Payable for daily variation margin on open futures contracts | | | 40,521 | * |
| | | Unrealized gains on total return swap transactions | | | 40,497 | | | Unrealized losses on total return swap transactions | | | 39,841 | |
| | | | | $ | 636,834 | | | | | $ | 299,323 | |
| * | Only the current day’s variation margin as of January 31, 2015 is reported separately on the Statement of Assets and Liabilities. |
| ** | Amount relates to purchased options |
The effect of derivative instruments on the Statement of Operations for the six months ended January 31, 2015 was as follows for the Fund:
| | | | | | | | | | | | | | | | | | | | | | | | |
| | | Amount of realized gains (losses) on derivatives | |
| | | Unaffiliated securities* | | | Futures contracts | | | Forward currency contracts | | | Written options | | | Total return swaps | | | Total | |
Interest rate risk | | $ | 0 | | | $ | 7,162 | | | $ | 0 | | | $ | 0 | | | $ | 12,759 | | | $ | 19,921 | |
Equity risk | | | (370,318 | ) | | | 1,077,873 | | | | 0 | | | | 79,213 | | | | 0 | | | | 786,768 | |
Foreign currency risk | | | 0 | | | | 1,551,629 | | | | 185,750 | | | | 0 | | | | 0 | | | | 1,737,379 | |
| | | $ | (370,318 | ) | | $ | 2,636,664 | | | $ | 185,750 | | | $ | 79,213 | | | $ | 12,759 | | | $ | 2,544,068 | |
| |
| | | Change in unrealized gains (losses) on derivatives | |
| | | Unaffiliated
securities* | | | Futures contracts | | | Forward
currency
contracts | | | Written
options | | | Total
return
swaps | | | Total | |
Interest rate risk | | $ | 0 | | | $ | 90,358 | | | $ | 0 | | | $ | 0 | | | $ | 2,069 | | | $ | 92,427 | |
Equity risk | | | 91,110 | | | | 150,518 | | | | 0 | | | | (38,081 | ) | | | 0 | | | | 203,547 | |
Foreign currency risk | | | 0 | | | | 620,647 | | | | (4,765 | ) | | | 0 | | | | 0 | | | | 615,882 | |
| | | $ | 91,110 | | | $ | 861,523 | | | $ | (4,765 | ) | | $ | (38,081 | ) | | $ | 2,069 | | | $ | 911,856 | |
| * | Amount relates to purchased options |
For certain types of derivative transactions, the Fund has entered into International Swaps and Derivatives Association, Inc. master agreements (“ISDA Master Agreements”) or similar agreements with approved counterparties. The ISDA Master Agreements or similar agreements may have requirements to deliver/deposit securities or cash to/with an exchange or broker-dealer as collateral and allows the Fund to offset, with each counterparty, certain derivative financial instrument’s assets and/or liabilities with collateral held or pledged. Collateral requirements differ by type of derivative. Collateral or margin requirements are set by the broker or exchange clearing house for exchange traded derivatives while
| | | | |
| 44 | | Wells Fargo Advantage Alternative Strategies Fund | | Notes to financial statements (unaudited) |
collateral terms are contract specific for over-the-counter traded derivatives. Cash collateral that has been pledged to cover obligations of the Fund under ISDA Master Agreements or similar agreements, if any, will be reported separately in the Statement of Assets and Liabilities. Securities pledged as collateral, if any, for the same purpose are noted in the Portfolio of Investments. With respect to balance sheet offsetting, absent an event of default by the counterparty or a termination of the agreement, the reported amounts of financial assets and financial liabilities in the Statement of Assets and Liabilities are not offset across transactions between the Fund and the applicable counterparty. A reconciliation of the gross amounts on the Statement of Assets and Liabilities to the net amounts by derivative type, including any collateral exposure, is as follows:
| | | | | | | | | | | | | | | | | | |
| Derivative type | | Counterparty | | Gross amounts of assets in the Statement of Assets and Liabilities | | | Amounts subject to netting agreements | | | Collateral received | | | Net amount of assets | |
Futures –variation margin | | Morgan Stanley | | $ | 237,072 | | | $ | (109,526 | ) | | $ | 0 | | | $ | 127,546 | |
Total return swaps | | Morgan Stanley | | | 40,497 | * | | | (39,841 | ) | | | 0 | | | | 656 | |
Forward foreign currency contracts | | Citibank | | | 3,224 | ** | | | 0 | | | | 0 | | | | 3,224 | |
Forward foreign currency contracts | | Morgan Stanley | | | 28,293 | ** | | | (25,193 | ) | | | 0 | | | | 3,100 | |
Forward foreign currency contracts | | National Australia Bank | | | 8,024 | ** | | | 0 | | | | 0 | | | | 8,024 | |
| * | The value of swap contracts consists of unrealized gains and premiums paid on swap contracts as reflected on the Statement of Assets and Liabilities. |
| ** | Amount represents net unrealized gains. |
| | | | | | | | | | | | | | | | | | |
| Derivative type | | Counterparty | | Gross amounts of liabilities in the Statement of Assets and Liabilities | | | Amounts subject to netting agreements | | | Collateral pledged1 | | | Net amount of liabilities | |
Futures – variation margin | | Morgan Stanley | | $ | 109,526 | | | $ | (109,526 | ) | | $ | 0 | | | $ | 0 | |
Total return swaps | | Morgan Stanley | | | 39,841 | * | | | (39,841 | ) | | | 0 | | | | 0 | |
Forward foreign currency contracts | | Bank of America | | | 182 | ** | | | 0 | | | | 0 | | | | 182 | |
Forward foreign currency contracts | | JPMorgan Chase & Company | | | 2,363 | ** | | | 0 | | | | 0 | | | | 2,363 | |
Forward foreign currency contracts | | Morgan Stanley | | | 25,193 | ** | | | (25,193 | ) | | | 0 | | | | 0 | |
Written options | | Morgan Stanley | | | 122,218 | | | | 0 | | | | (122,218 | ) | | | 0 | |
| 1 | Collateral pledged within this table is limited to the collateral for the net transaction with the counterparty by derivative type. |
| * | The value of swap contracts consists of unrealized losses and premiums received on swap contracts as reflected on the Statement of Assets and Liabilities. |
| ** | Amount represents net unrealized losses. |
7. BANK BORROWINGS
The Fund has a committed credit facility to provide leverage for investment purposes. The credit facility has a commitment amount of $10 million which expires on April 30, 2015, at which point it may be renegotiated and potentially renewed for another one-year term. The Fund’s borrowings under the Facility are generally charged interest at a rate determined by the type of loan elected by the Fund. The Fund also pays a commitment fee at an annual rate equal to 0.10% on the unutilized portion of the credit facility. During the six months ended January 31, 2015, the Fund paid $95 in commitment fees.
During the six months ended January 31, 2015, the Fund did not borrow under the credit facility.
8. INDEMNIFICATION
Under the Trust’s organizational documents, the officers and Trustees are indemnified against certain liabilities that may arise out of performance of their duties to the Trust. Additionally, in the normal course of business, the Trust may enter into contracts with service providers that contain a variety of indemnification clauses. The Trust’s maximum exposure under these arrangements is dependent on future claims that may be made against the Fund and, therefore, cannot be estimated.
| | | | | | |
| Other information (unaudited) | | Wells Fargo Advantage Alternative Strategies Fund | | | 45 | |
PROXY VOTING INFORMATION
A description of the policies and procedures that the Fund uses to determine how to vote proxies relating to portfolio securities, in addition to information regarding how the Fund voted proxies relating to portfolio securities during the most recent 12-month period ended June 30, is available on the Fund’s website at wellsfargoadvantagefunds.com or by visiting the SEC website at sec.gov.
PORTFOLIO HOLDINGS INFORMATION
The complete portfolio holdings for the Fund are publicly available at each fiscal quarter end on the Fund’s website (wellsfargoadvantagefunds.com), on a one-month delayed basis. As of each month end other than a month end that coincides with a fiscal quarter end, the Fund makes publicly available on the Fund’s website, on a one-month delayed basis (i) all portfolio holdings held long other than any put options on equity securities; (ii) portfolio holdings held short other than short positions in equity securities of single issuers; and (iii) the aggregate dollar value of equity securities of single issuers held short, and any put options on equity securities held long. In addition, top ten holdings information (excluding derivative positions and short positions) for the Fund is publicly available on the Fund’s website on a monthly, seven-day or more delayed basis. The Fund files its complete schedule of portfolio holdings with the SEC for the first and third quarters of each fiscal year on Form N-Q, which is available by visiting the SEC website at sec.gov. In addition, the Fund’s Form N-Q may be reviewed and copied at the SEC’s Public Reference Room in Washington, DC, and at regional offices in New York City, at 233 Broadway, and in Chicago, at 175 West Jackson Boulevard, Suite 900. Information about the Public Reference Room may be obtained by calling 1-800-SEC-0330.
| | | | |
| 46 | | Wells Fargo Advantage Alternative Strategies Fund | | Other information (unaudited) |
BOARD OF TRUSTEES AND OFFICERS
Each of the Trustees and Officers1 listed in the table below acts in identical capacities for each fund in the Wells Fargo Advantage family of funds, which consists of 134 mutual funds comprising the Wells Fargo Funds Trust, Wells Fargo Variable Trust, Wells Fargo Master Trust and four closed-end funds (collectively the “Fund Complex”). This table should be read in conjunction with the Prospectus and the Statement of Additional Information2. The mailing address of each Trustee and Officer is 525 Market Street, 12th Floor, San Francisco, CA 94105. Each Trustee and Officer serves an indefinite term, however, each Trustee serves such term until reaching the mandatory retirement age established by the Trustees.
Independent Trustees
| | | | | | |
Name and year of birth | | Position held and length of service* | | Principal occupations during past five years or longer | | Other directorships during past five years |
| William R. Ebsworth (Born 1957) | | Trustee, since 2015** | | Retired. From 1984 to 2013, equities analyst, portfolio manager, research director at Fidelity Management and Research Company and retired in 2013 as Chief Investment Officer of Fidelity Strategic Advisers, Inc. in Boston, Tokyo, and Hong Kong where he led a team of investment professionals managing client assets. Prior thereto, Board member of Hong Kong Securities Clearing Co., Hong Kong Options Clearing Corp., the Thailand International Fund, Ltd., Fidelity Investments Life Insurance Company, and Empire Fidelity Investments Life Insurance Company. Mr. Ebsworth is an Adjunct Lecturer, Finance, at Babson College and a Chartered Financial Analyst. | | Asset Allocation Trust |
| Jane A. Freeman (Born 1953) | | Trustee, since 2015** | | Retired. From 2012 to 2014 and 1999 to 2008, Chief Financial Officer of Scientific Learning Corporation. From 2008 to 2012, Ms. Freeman provided consulting services related to strategic business projects. Prior thereto, Portfolio Manager at Rockefeller & Co. and Scudder, Stevens & Clark. Board member of the Harding Loevner Funds from 1996 to 2014, serving as both Lead Independent Director and chair of the Audit Committee. Board member of the Russell Exchange Traded Funds Trust from 2011 to 2012 and the chair of the Audit Committee. Ms. Freeman is a Chartered Financial Analyst (inactive), Chair of Taproot Foundation (non-profit organization) and a Board Member of Ruth Bancroft Garden (non-profit organization). | | Asset Allocation Trust |
| Peter G. Gordon (Born 1942) | | Trustee, since 1998; Chairman, since 2005 | | Co-Founder, Retired Chairman, President and CEO of Crystal Geyser Water Company. Trustee Emeritus, Colby College. | | Asset Allocation Trust |
| Isaiah Harris, Jr. (Born 1952) | | Trustee, since 2009 | | Retired. Chairman of the Board of CIGNA Corporation since 2009, and Director since 2005. From 2003 to 2011, Director of Delux Corporation. Prior thereto, President and CEO of BellSouth Advertising and Publishing Corp. from 2005 to 2007, President and CEO of BellSouth Enterprises from 2004 to 2005 and President of BellSouth Consumer Services from 2000 to 2003. Emeritus member of the Iowa State University Foundation Board of Governors. Emeritus Member of the Advisory Board of Iowa State University School of Business. Advisory Board Member, Palm Harbor Academy. Mr. Harris is a certified public accountant. | | CIGNA Corporation; Asset Allocation Trust |
| Judith M. Johnson (Born 1949) | | Trustee, since 2008; Audit Committee Chairman, since 2008 | | Retired. Prior thereto, Chief Executive Officer and Chief Investment Officer of Minneapolis Employees Retirement Fund from 1996 to 2008. Ms. Johnson is an attorney, certified public accountant and a certified managerial accountant. | | Asset Allocation Trust |
| David F. Larcker (Born 1950) | | Trustee, since 2009 | | James Irvin Miller Professor of Accounting at the Graduate School of Business, Stanford University, Morgan Stanley Director of the Center for Leadership Development and Research and Senior Faculty of The Rock Center for Corporate Governance since 2006. From 2005 to 2008, Professor of Accounting at the Graduate School of Business, Stanford University. Prior thereto, Ernst & Young Professor of Accounting at The Wharton School, University of Pennsylvania from 1985 to 2005. | | Asset Allocation Trust |
| | | | | | |
| Other information (unaudited) | | Wells Fargo Advantage Alternative Strategies Fund | | | 47 | |
| | | | | | |
Name and year of birth | | Position held and length of service* | | Principal occupations during past five years or longer | | Other directorships during past five years |
| Olivia S. Mitchell (Born 1953) | | Trustee, since 2006 | | International Foundation of Employee Benefit Plans Professor, Wharton School of the University of Pennsylvania since 1993. Director of Wharton’s Pension Research Council and Boettner Center on Pensions & Retirement Research, and Research Associate at the National Bureau of Economic Research. Previously, Cornell University Professor from 1978 to 1993. | | Asset Allocation Trust |
| Timothy J. Penny (Born 1951) | | Trustee, since 1996 | | President and Chief Executive Officer of Southern Minnesota Initiative Foundation, a non-profit organization, since 2007 and Senior Fellow at the Humphrey Institute Policy Forum at the University of Minnesota since 1995. Member of the Board of Trustees of NorthStar Education Finance, Inc., a non-profit organization, since 2007. | | Asset Allocation Trust |
| Michael S. Scofield (Born 1943) | | Trustee, since 2010 | | Served on the Investment Company Institute’s Board of Governors and Executive Committee from 2008-2011 as well the Governing Council of the Independent Directors Council from 2006-2011 and the Independent Directors Council Executive Committee from 2008-2011. Chairman of the IDC from 2008-2010. Institutional Investor (Fund Directions) Trustee of Year in 2007. Trustee of the Evergreen Funds complex (and its predecessors) from 1984 to 2010. Chairman of the Evergreen Funds from 2000-2010. Former Trustee of the Mentor Funds. Retired Attorney, Law Offices of Michael S. Scofield. | | Asset Allocation Trust |
| Donald C. Willeke (Born 1940) | | Trustee, since 1996 | | Principal of the law firm of Willeke & Daniels. General Counsel of the Minneapolis Employees Retirement Fund from 1984 until its consolidation into the Minnesota Public Employees Retirement Association on June 30, 2010. Director and Vice Chair of The Tree Trust (non-profit corporation). Director of the American Chestnut Foundation (non-profit corporation). | | Asset Allocation Trust |
| * | Length of service dates reflect the Trustee’s commencement of service with the Trust’s predecessor entities, where applicable. |
| ** | William R. Ebsworth and Jane A. Freeman each became a Trustee effective January 1, 2015. |
Officers
| | | | | | |
Name and year of birth | | Position held and length of service | | Principal occupations during past five years or longer | | |
| Karla M. Rabusch (Born 1959) | | President, since 2003 | | Executive Vice President of Wells Fargo Bank, N.A. and President of Wells Fargo Funds Management, LLC since 2003. | | |
| Jeremy DePalma1 (Born 1974) | | Treasurer, since 2012 | | Senior Vice President of Wells Fargo Funds Management, LLC since 2009. Senior Vice President of Evergreen Investment Management Company, LLC from 2008 to 2010. Vice President, Evergreen Investment Services, Inc. from 2004 to 2007. Head of the Fund Reporting and Control Team within Fund Administration from 2005 to 2010. | | |
| C. David Messman (Born 1960) | | Secretary, since 2000; Chief Legal Officer, since 2003 | | Assistant General Counsel of Wells Fargo Bank, N.A. since 2013 and Vice President and Managing Counsel of Wells Fargo Bank N.A. from 1996 to 2013. Senior Vice President and Secretary of Wells Fargo Funds Management, LLC since 2001. | | |
| Debra Ann Early (Born 1964) | | Chief Compliance Officer, since 2007 | | Senior Vice President of Wells Fargo Funds Management, LLC since 2007 and Chief Compliance Officer from 2007 to 2014. Chief Compliance Officer of Parnassus Investments from 2005 to 2007. Chief Financial Officer of Parnassus Investments from 2004 to 2007 and Senior Audit Manager of PricewaterhouseCoopers LLP from 1998 to 2004. | | |
| David Berardi (Born 1975) | | Assistant Treasurer, since 2009 | | Vice President of Wells Fargo Funds Management, LLC since 2009. Vice President of Evergreen Investment Management Company, LLC from 2008 to 2010. Assistant Vice President of Evergreen Investment Services, Inc. from 2004 to 2008. Manager of Fund Reporting and Control for Evergreen Investment Management Company, LLC from 2004 to 2010. | | |
| 1 | Jeremy DePalma acts as Treasurer of 61 funds and Assistant Treasurer of 73 funds in the Fund Complex. |
| 2 | The Statement of Additional Information includes additional information about the Trustees and is available, without charge, upon request, by calling 1-800-222-8222 or by visiting the website at wellsfargoadvantagefunds.com. |
| | | | |
| 48 | | Wells Fargo Advantage Alternative Strategies Fund | | List of abbreviations |
The following is a list of common abbreviations for terms and entities that may have appeared in this report.
| ACA | — ACA Financial Guaranty Corporation |
| ADR | — American depositary receipt |
| ADS | — American depositary shares |
| AGC | — Assured Guaranty Corporation |
| AGM | — Assured Guaranty Municipal |
| Ambac | — Ambac Financial Group Incorporated |
| AMT | — Alternative minimum tax |
| BAN | — Bond anticipation notes |
| BHAC | — Berkshire Hathaway Assurance Corporation |
| CAB | — Capital appreciation bond |
| CCAB | — Convertible capital appreciation bond |
| CDA | — Community Development Authority |
| CDO | — Collateralized debt obligation |
| DRIVER | — Derivative inverse tax-exempt receipts |
| DW&P | — Department of Water & Power |
| DWR | — Department of Water Resources |
| ECFA | — Educational & Cultural Facilities Authority |
| EDA | — Economic Development Authority |
| EDFA | — Economic Development Finance Authority |
| ETF | — Exchange-traded fund |
| FDIC | — Federal Deposit Insurance Corporation |
| FFCB | — Federal Farm Credit Banks |
| FGIC | — Financial Guaranty Insurance Corporation |
| FHA | — Federal Housing Administration |
| FHLB | — Federal Home Loan Bank |
| FHLMC | — Federal Home Loan Mortgage Corporation |
| FICO | — The Financing Corporation |
| FNMA | — Federal National Mortgage Association |
| GDR | — Global depositary receipt |
| GNMA | — Government National Mortgage Association |
| HCFR | — Healthcare facilities revenue |
| HEFA | — Health & Educational Facilities Authority |
| HEFAR | — Higher education facilities authority revenue |
| HFA | — Housing Finance Authority |
| HFFA | — Health Facilities Financing Authority |
| HUD | — Department of Housing and Urban Development |
| IDA | — Industrial Development Authority |
| IDAG | — Industrial Development Agency |
| KRW | — Republic of Korea won |
| LIBOR | — London Interbank Offered Rate |
| LIFER | — Long Inverse Floating Exempt Receipts |
| LLC | — Limited liability company |
| LLLP | — Limited liability limited partnership |
| LLP | — Limited liability partnership |
| MBIA | — Municipal Bond Insurance Association |
| MFHR | — Multifamily housing revenue |
| MSTR | — Municipal securities trust receipts |
| MUD | — Municipal Utility District |
| National | — National Public Finance Guarantee Corporation |
| PCFA | — Pollution Control Financing Authority |
| PCL | — Public Company Limited |
| PCR | — Pollution control revenue |
| PFA | — Public Finance Authority |
| PFFA | — Public Facilities Financing Authority |
| PFOTER | — Puttable floating option tax-exempt receipts |
| plc | — Public limited company |
| PUTTER | — Puttable tax-exempt receipts |
| R&D | — Research & development |
| Radian | — Radian Asset Assurance |
| RAN | — Revenue anticipation notes |
| RDA | — Redevelopment Authority |
| RDFA | — Redevelopment Finance Authority |
| REIT | — Real estate investment trust |
| ROC | — Reset option certificates |
| SAVRS | — Select auction variable rate securities |
| SBA | — Small Business Authority |
| SFHR | — Single-family housing revenue |
| SFMR | — Single-family mortgage revenue |
| SPA | — Standby purchase agreement |
| SPDR | — Standard & Poor’s Depositary Receipts |
| SPEAR | — Short Puttable Exempt Adjustable Receipts |
| STRIPS | — Separate trading of registered interest and |
| TAN | — Tax anticipation notes |
| TIPS | — Treasury inflation-protected securities |
| TRAN | — Tax revenue anticipation notes |
| TTFA | — Transportation Trust Fund Authority |
| TVA | — Tennessee Valley Authority |


For more information
More information about Wells Fargo Advantage Funds is available free upon request. To obtain literature, please write, email, visit the Fund’s website, or call:
Wells Fargo Advantage Funds
P.O. Box 8266
Boston, MA 02266-8266
Email: wfaf@wellsfargo.com
Website: wellsfargoadvantagefunds.com
Individual investors: 1-800-222-8222
Retail investment professionals: 1-888-877-9275
Institutional investment professionals: 1-866-765-0778
This report and the financial statements contained herein are submitted for the general information of the shareholders of Wells Fargo Advantage Funds. If this report is used for promotional purposes, distribution of the report must be accompanied or preceded by a current prospectus. Before investing, please consider the investment objectives, risks, charges, and expenses of the investment. For a current prospectus and, if available, a summary prospectus, containing this information, call 1-800-222-8222 or visit the Fund’s website at wellsfargoadvantagefunds.com. Read the prospectus carefully before you invest or send money.
Wells Fargo Funds Management, LLC, a wholly owned subsidiary of Wells Fargo & Company, provides investment advisory and administrative services for Wells Fargo Advantage Funds. Other affiliates of Wells Fargo & Company provide subadvisory and other services for the Funds. The Funds are distributed by Wells Fargo Funds Distributor, LLC, Member FINRA/SIPC, an affiliate of Wells Fargo & Company.
NOT FDIC INSURED ¡ NO BANK GUARANTEE ¡ MAY LOSE VALUE
© 2015 Wells Fargo Funds Management, LLC. All rights reserved.
| | |
 | | 231595 03-15 SA267/SAR267 01-15 |

Wells Fargo Advantage Capital Growth Fund

Semi-Annual Report
January 31, 2015

Reduce clutter. Save trees.
Sign up for electronic delivery of prospectuses and shareholder reports at wellsfargo.com/advantagedelivery
Contents
The views expressed and any forward-looking statements are as of January 31, 2015, unless otherwise noted, and are those of the Fund managers and/or Wells Fargo Funds Management, LLC. Discussions of individual securities, or the markets generally, or any Wells Fargo Advantage Fund are not intended as individual recommendations. Future events or results may vary significantly from those expressed in any forward-looking statements; the views expressed are subject to change at any time in response to changing circumstances in the market. Wells Fargo Funds Management, LLC and the Fund disclaim any obligation to publicly update or revise any views expressed or forward-looking statements.
NOT FDIC INSURED ¡ NO BANK GUARANTEE ¡ MAY LOSE VALUE
| | | | |
| 2 | | Wells Fargo Advantage Capital Growth Fund | | Letter to shareholders (unaudited) |

Karla M. Rabusch
President
Wells Fargo Advantage Funds
As the U.S. churned forward, major economies elsewhere in the world faced significant ongoing challenges.
Dear Valued Shareholder:
We are pleased to offer you this semi-annual report for the Wells Fargo Advantage Capital Growth Fund for the six-month period that ended January 31, 2015. Generally improving U.S. economic data helped drive a positive return for U.S. stocks for the reporting period (as measured by the S&P 500 Index1); in contrast, many economies and markets elsewhere in the world faced ongoing challenges.
Positive U.S. economic data, but increased tensions abroad, led to heightened volatility during the third quarter of 2014.
When the reporting period began on August 1, 2014, the U.S. stock market was experiencing a series of surges interrupted by bouts of volatility as interest-rate concerns in the U.S. and increased tensions abroad triggered heightened investor uncertainty. An escalating Russia/Ukraine situation and a growing perception that the U.S. Federal Reserve (Fed) would raise short-term interest rates sooner than expected caused investors to pull back near the end of July. As a result, the S&P 500 Index dropped into negative territory for July’s monthly return. However, August brought a bounce-back; the S&P 500 Index delivered its largest monthly gain since February 2014 on a string of positive economic news, led by an upwardly revised 4.2% estimate of second-quarter 2014 gross domestic product (GDP) growth. Then, in September, stock market volatility increased as positive economic data became overshadowed at times by growing discomfort over escalating tensions in Ukraine and the Middle East. Slowing growth in Europe and China also concerned investors. Ultimately, U.S. stocks ended the third quarter up slightly overall, buoyed largely by another upward revision of second-quarter GDP growth to 4.6%. Strong corporate earnings also contributed to market gains.
The fourth quarter of 2014 brought continued improvement in the U.S.; international economies remained challenged.
Strong fourth-quarter results by the U.S. stock market helped the S&P 500 Index deliver more than 50 record closes in 2014. The last several, in December, were spurred by investor optimism following Fed Chair Janet Yellen’s comment that the Fed would be patient in its timing of an interest-rate increase. U.S. stocks also were boosted by positive economic data. November’s 5.8% unemployment rate was down from 7.0% a year earlier, and the number of jobs being added continued to expand, keeping U.S. employers on pace to hire nearly three million workers during 2014. In addition, the U.S. economy’s third-quarter growth rate was revised upward during the quarter, to 5.0%—its fastest pace in 11 years. Meanwhile, U.S. companies continued to report strong earnings. The steadily brightening U.S. economy energized consumers, who were further buoyed by much lower prices at the gasoline pump. During the fourth quarter, gasoline prices fell to their lowest levels in five years, according to the American Automobile Association.
As the U.S. churned forward, major economies elsewhere in the world faced significant ongoing challenges. In China, where growth had been slowing for some time, government regulators in December announced changes being made in an effort to stimulate growth. In Japan, which slid back into recession in the third quarter of 2014, Prime Minister Abe gained approval in late December for roughly $29 billion in fresh stimulus to help the economy. In the eurozone, growth remained sluggish, and member countries continued to face an environment of low demand, high unemployment, and weak business investment. This situation
| 1 | The S&P 500 Index consists of 500 stocks chosen for market size, liquidity, and industry group representation. It is a market-value-weighted index with each stock’s weight in the index proportionate to its market value. You cannot invest directly in an index. |
| | | | | | |
| Letter to shareholders (unaudited) | | Wells Fargo Advantage Capital Growth Fund | | | 3 | |
was exacerbated in December by renewed concerns about Greece after its parliament failed to avert a general election that could jeopardize the terms of the country’s financial agreement with its international creditors. In Russia, the economy contracted for the first time since October 2009 as the country struggled under the weight of slumping oil prices, international sanctions, and massive outflows of capital.
Market volatility increased in January 2015.
Markets fluctuated in January as investors reacted to geopolitical developments and new economic data. Mid-month, the World Bank lowered its outlook for global growth based on deepening problems in the eurozone and emerging markets, stating that a strengthening U.S. economy could not, by itself, support the global economy. Later in January, Greek voters gave control of their government to opposition party Syriza, which promised to end austerity and insisted that Greece’s massive debt be renegotiated. In the U.S., various data released in January, such as consumer confidence and December’s jobless rate, showed improvement. On the last trading day of the month, however, investors learned that fourth-quarter 2014 U.S. economic growth was estimated at 2.6%, which was below consensus and lower than the 4.6% and 5.0% growth rates, respectively, for the second and third quarters of 2014.
Don’t let short-term uncertainty derail long-term investment goals.
Periods of uncertainty can present challenges, but experience has taught us that maintaining long-term investment goals can be an effective way to plan for the future. To help you create a sound strategy based on your personal goals and risk tolerance, Wells Fargo Advantage Funds offers more than 100 mutual funds and other investments spanning a wide range of asset classes and investment styles. Although diversification cannot guarantee an investment profit or prevent losses, we believe it can be an effective way to manage investment risk and potentially smooth out overall portfolio performance. We encourage investors to know their investments and to understand that appropriate levels of risk-taking may unlock opportunities.
Thank you for choosing to invest with Wells Fargo Advantage Funds. We appreciate your confidence in us and remain committed to helping you meet your financial needs. For current information about your fund investments, contact your investment professional, visit our website at wellsfargoadvantagefunds.com, or call us directly at 1-800-222-8222. We are available 24 hours a day, 7 days a week.
Sincerely,

Karla M. Rabusch
President
Wells Fargo Advantage Funds
We encourage investors to know their investments and to understand that appropriate levels of risk-taking may unlock opportunities.
| | | | |
| 4 | | Wells Fargo Advantage Capital Growth Fund | | Performance highlights (unaudited) |
Investment objective
The Fund seeks long-term capital appreciation.
Adviser
Wells Fargo Funds Management, LLC
Subadviser
Wells Capital Management Incorporated
Portfolio managers
Thomas J. Pence, CFA
Michael T. Smith, CFA
Average annual total returns1 (%) as of January 31, 2015
| | | | | | | | | | | | | | | | | | | | | | | | | | | | | | | | | | |
| | | | | Including sales charge | | | Excluding sales charge | | | Expense ratios2 (%) | |
| | | Inception date | | 1 year | | | 5 year | | | 10 year | | | 1 year | | | 5 year | | | 10 year | | | Gross | | | Net3 | |
| Class A (WFCGX) | | 7-31-2007 | | | 2.72 | | | | 13.39 | | | | 6.11 | | | | 9.00 | | | | 14.73 | | | | 6.74 | | | | 1.26 | | | | 1.11 | |
| Class C (WFCCX) | | 7-31-2007 | | | 7.16 | | | | 13.88 | | | | 5.99 | | | | 8.16 | | | | 13.88 | | | | 5.99 | | | | 2.01 | | | | 1.86 | |
| Class R4 (WCGRX) | | 11-30-2012 | | | – | | | | – | | | | – | | | | 9.32 | | | | 15.21 | | | | 7.25 | | | | 0.93 | | | | 0.75 | |
| Class R6 (WFCRX) | | 11-30-2012 | | | – | | | | – | | | | – | | | | 9.51 | | | | 15.31 | | | | 7.30 | | | | 0.78 | | | | 0.60 | |
| Administrator Class (WFCDX) | | 6-30-2003 | | | – | | | | – | | | | – | | | | 9.15 | | | | 14.99 | | | | 7.06 | | | | 1.10 | | | | 0.90 | |
| Institutional Class (WWCIX) | | 4-8-2005 | | | – | | | | – | | | | – | | | | 9.52 | | | | 15.30 | | | | 7.30 | | | | 0.83 | | | | 0.65 | |
| Investor Class (SLGIX) | | 11-3-1997 | | | – | | | | – | | | | – | | | | 8.84 | | | | 14.65 | | | | 6.66 | | | | 1.32 | | | | 1.17 | |
| Russell 1000® Growth Index4 | | – | | | – | | | | – | | | | – | | | | 14.59 | | | | 16.49 | | | | 8.69 | | | | – | | | | – | |
Figures quoted represent past performance, which is no guarantee of future results, and do not reflect taxes that a shareholder may pay on fund distributions or the redemption of fund shares. Investment return and principal value of an investment will fluctuate so that an investor’s shares, when redeemed, may be worth more or less than their original cost. Performance shown without sales charges would be lower if sales charges were reflected. Current performance may be lower or higher than the performance data quoted, which assumes the reinvestment of dividends and capital gains. Current month-end performance is available on the Fund’s website, wellsfargoadvantagefunds.com.
Index returns do not include transaction costs associated with buying and selling securities, any mutual fund fees or expenses, or any taxes. It is not possible to invest directly in an index.
For Class A shares, the maximum front-end sales charge is 5.75%. For Class C shares, the maximum contingent deferred sales charge is 1.00%. Performance including a contingent deferred sales charge assumes the sales charge for the corresponding time period. Class R4, Class R6, Administrator Class, Institutional Class, and Investor Class shares are sold without a front-end sales charge or contingent deferred sales charge.
Stock values fluctuate in response to the activities of individual companies and general market and economic conditions. Certain investment strategies tend to increase the total risk of an investment (relative to the broader market). The Fund is exposed to foreign investment risk. Consult the Fund’s prospectus for additional information on these and other risks.
Please see footnotes on page 5.
| | | | | | |
| Performance highlights (unaudited) | | Wells Fargo Advantage Capital Growth Fund | | | 5 | |
| | | | |
| Ten largest equity holdings5 (%) as of January 31, 2015 | |
Apple Incorporated | | | 6.65 | |
Facebook Incorporated Class A | | | 3.90 | |
Gilead Sciences Incorporated | | | 2.83 | |
Biogen Idec Incorporated | | | 2.47 | |
Visa Incorporated Class A | | | 2.40 | |
Micron Technology Incorporated | | | 2.18 | |
Google Incorporated Class C | | | 2.12 | |
Celgene Corporation | | | 2.10 | |
Polaris Industries Incorporated | | | 2.10 | |
McKesson Corporation | | | 2.03 | |
|
| Sector distribution6 as of January 31, 2015 |
|
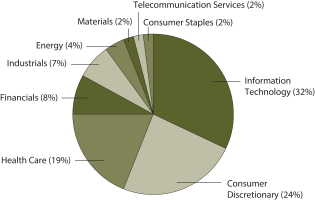 |
| 1 | Historical performance shown for Class A shares prior to their inception reflects the performance of Investor Class shares, and includes the higher expenses applicable to Investor Class shares. If these expenses had not been included, returns would be higher. Historical performance shown for Class C shares prior to their inception reflects the performance of Investor Class shares, adjusted to reflect the higher expenses applicable to Class C shares. Historical performance shown for Class R4 shares prior to their inception reflects the performance of Institutional Class shares, adjusted to reflect the higher expenses applicable to Class R4 shares. Historical performance shown for Class R6 shares prior to their inception reflects the performance of Institutional Class shares, and includes the higher expenses applicable to Institutional Class shares. If these expenses had not been included, returns would be higher. Historical performance shown for Institutional Class shares prior to their inception reflects the performance of Administrator Class shares, and includes the higher expenses applicable to Administrator Class shares. If these expenses had not been included, returns would be higher. |
| 2 | Reflects the expense ratios as stated in the most recent prospectuses. The expense ratios shown are subject to change and may differ from the annualized expense ratios shown in the financial highlights of this report. |
| 3 | The Adviser has committed through November 30, 2015, to waive fees and/or reimburse expenses to the extent necessary to cap the Fund’s Total Annual Fund Operating Expenses After Fee Waiver, excluding certain expenses, at the amounts shown. After this time, the cap may be increased or the commitment to maintain the cap may be terminated only with the approval of the Board of Trustees. Brokerage commissions, stamp duty fees, interest, taxes, acquired fund fees and expenses, and extraordinary expenses are excluded from the cap. Without this cap, the Fund’s returns would have been lower. |
| 4 | The Russell 1000® Growth Index measures the performance of those Russell 1000 Index companies with higher price-to-book ratios and higher forecasted growth values. You cannot invest directly in an index. |
| 5 | The ten largest equity holdings are calculated based on the value of the securities divided by total net assets of the Fund. Holdings are subject to change and may have changed since the date specified. |
| 6 | Amounts are calculated based on the total long-term investments of the Fund. These percentages are subject to change and may have changed since the date specified. |
| | | | |
| 6 | | Wells Fargo Advantage Capital Growth Fund | | Fund expenses (unaudited) |
As a shareholder of the Fund, you incur two types of costs: (1) transaction costs, including sales charges (loads) on purchase payments and contingent deferred sales charges (if any) on redemptions and (2) ongoing costs, including management fees, distribution (12b-1) and/or shareholder service fees, and other Fund expenses. This example is intended to help you understand your ongoing costs (in dollars) of investing in the Fund and to compare these costs with the ongoing costs of investing in other mutual funds.
The example is based on an investment of $1,000 invested at the beginning of the six-month period and held for the entire period from August 1, 2014 to January 31, 2015.
Actual expenses
The “Actual” line of the table below provides information about actual account values and actual expenses. You may use the information in this line, together with the amount you invested, to estimate the expenses that you paid over the period. Simply divide your account value by $1,000 (for example, an $8,600 account value divided by $1,000 = 8.6), then multiply the result by the number in the “Actual” line under the heading entitled “Expenses paid during period” for your applicable class of shares to estimate the expenses you paid on your account during this period.
Hypothetical example for comparison purposes
The “Hypothetical” line of the table below provides information about hypothetical account values and hypothetical expenses based on the Fund’s actual expense ratio and an assumed rate of return of 5% per year before expenses, which is not the Fund’s actual return. The hypothetical account values and expenses may not be used to estimate the actual ending account balance or expenses you paid for the period. You may use this information to compare the ongoing costs of investing in the Fund and other funds. To do so, compare this 5% hypothetical example with the 5% hypothetical examples that appear in the shareholder reports of the other funds.
Please note that the expenses shown in the table are meant to highlight your ongoing costs only and do not reflect any transactional costs, such as sales charges (loads) and contingent deferred sales charges. Therefore, the “Hypothetical” line of the table is useful in comparing ongoing costs only and will not help you determine the relative total costs of owning different funds. In addition, if these transactional costs were included, your costs would have been higher.
| | | | | | | | | | | | | | | | |
| | | Beginning
account value
8-1-2014 | | | Ending
account value
1-31-2015 | | | Expenses
paid during
the period¹ | | | Net annualized
expense ratio | |
Class A | | | | | | | | | | | | | | | | |
Actual | | $ | 1,000.00 | | | $ | 1,045.47 | | | $ | 5.72 | | | | 1.11 | % |
Hypothetical (5% return before expenses) | | $ | 1,000.00 | | | $ | 1,019.61 | | | $ | 5.65 | | | | 1.11 | % |
Class C | | | | | | | | | | | | | | | | |
Actual | | $ | 1,000.00 | | | $ | 1,041.32 | | | $ | 9.57 | | | | 1.86 | % |
Hypothetical (5% return before expenses) | | $ | 1,000.00 | | | $ | 1,015.83 | | | $ | 9.45 | | | | 1.86 | % |
Class R4 | | | | | | | | | | | | | | | | |
Actual | | $ | 1,000.00 | | | $ | 1,046.58 | | | $ | 3.87 | | | | 0.75 | % |
Hypothetical (5% return before expenses) | | $ | 1,000.00 | | | $ | 1,021.42 | | | $ | 3.82 | | | | 0.75 | % |
Class R6 | | | | | | | | | | | | | | | | |
Actual | | $ | 1,000.00 | | | $ | 1,047.98 | | | $ | 3.10 | | | | 0.60 | % |
Hypothetical (5% return before expenses) | | $ | 1,000.00 | | | $ | 1,022.18 | | | $ | 3.06 | | | | 0.60 | % |
Administrator Class | | | | | | | | | | | | | | | | |
Actual | | $ | 1,000.00 | | | $ | 1,045.82 | | | $ | 4.64 | | | | 0.90 | % |
Hypothetical (5% return before expenses) | | $ | 1,000.00 | | | $ | 1,020.67 | | | $ | 4.58 | | | | 0.90 | % |
Institutional Class | | | | | | | | | | | | | | | | |
Actual | | $ | 1,000.00 | | | $ | 1,047.57 | | | $ | 3.35 | | | | 0.65 | % |
Hypothetical (5% return before expenses) | | $ | 1,000.00 | | | $ | 1,021.93 | | | $ | 3.31 | | | | 0.65 | % |
Investor Class | | | | | | | | | | | | | | | | |
Actual | | $ | 1,000.00 | | | $ | 1,044.17 | | | $ | 6.03 | | | | 1.17 | % |
Hypothetical (5% return before expenses) | | $ | 1,000.00 | | | $ | 1,019.31 | | | $ | 5.96 | | | | 1.17 | % |
| 1 | Expenses paid is equal to the annualized expense ratio of each class multiplied by the average account value over the period, multiplied by the number of days in the most recent fiscal half-year divided by the number of days in the fiscal year (to reflect the one-half-year period). |
| | | | | | |
| Portfolio of investments—January 31, 2015 (unaudited) | | Wells Fargo Advantage Capital Growth Fund | | | 7 | |
| | | | | | | | | | | | |
| Security name | | | | | | Shares | | | Value | |
| | | | |
Common Stocks: 96.97% | | | | | | | | | | | | |
| | | | |
Consumer Discretionary: 23.18% | | | | | | | | | | | | |
| | | | |
| Auto Components: 0.70% | | | | | | | | | | | | |
Delphi Automotive plc | | | | | | | 34,470 | | | $ | 2,369,123 | |
| | | | | | | | | | | | |
| | | | |
| Hotels, Restaurants & Leisure: 3.11% | | | | | | | | | | | | |
Chipotle Mexican Grill Incorporated † | | | | | | | 7,500 | | | | 5,323,800 | |
Hilton Worldwide Holdings Incorporated † | | | | | | | 92,250 | | | | 2,395,733 | |
Starbucks Corporation | | | | | | | 32,350 | | | | 2,831,596 | |
| | | | |
| | | | | | | | | | | 10,551,129 | |
| | | | | | | | | | | | |
| | | | |
| Internet & Catalog Retail: 1.89% | | | | | | | | | | | | |
Amazon.com Incorporated † | | | | | | | 18,080 | | | | 6,409,902 | |
| | | | | | | | | | | | |
| | | | |
| Leisure Products: 2.10% | | | | | | | | | | | | |
Polaris Industries Incorporated | | | | | | | 49,300 | | | | 7,128,287 | |
| | | | | | | | | | | | |
| | | | |
| Media: 7.14% | | | | | | | | | | | | |
Comcast Corporation Class A | | | | | | | 126,950 | | | | 6,746,758 | |
Liberty Global plc Class C † | | | | | | | 150,423 | | | | 6,857,785 | |
Time Warner Incorporated | | | | | | | 63,750 | | | | 4,968,038 | |
Twenty-First Century Fox Incorporated | | | | | | | 170,900 | | | | 5,667,044 | |
| | | | |
| | | | | | | | | | | 24,239,625 | |
| | | | | | | | | | | | |
| | | | |
| Specialty Retail: 3.79% | | | | | | | | | | | | |
The Home Depot Incorporated | | | | | | | 32,800 | | | | 3,424,976 | |
TJX Companies Incorporated | | | | | | | 103,900 | | | | 6,851,166 | |
Williams-Sonoma Incorporated | | | | | | | 33,250 | | | | 2,601,813 | |
| | | | |
| | | | | | | | | | | 12,877,955 | |
| | | | | | | | | | | | |
| | | | |
| Textiles, Apparel & Luxury Goods: 4.45% | | | | | | | | | | | | |
lululemon athletica incorporated Ǡ | | | | | | | 26,950 | | | | 1,785,168 | |
Nike Incorporated Class B | | | | | | | 73,500 | | | �� | 6,780,375 | |
Under Armour Incorporated Class A † | | | | | | | 90,750 | | | | 6,541,260 | |
| | | | |
| | | | | | | | | | | 15,106,803 | |
| | | | | | | | | | | | |
| | | | |
Consumer Staples: 1.97% | | | | | | | | | | | | |
| | | | |
| Beverages: 1.97% | | | | | | | | | | | | |
Constellation Brands Incorporated Class A † | | | | | | | 60,330 | | | | 6,663,449 | |
| | | | | | | | | | | | |
| | | | |
Energy: 3.55% | | | | | | | | | | | | |
| | | | |
| Energy Equipment & Services: 1.31% | | | | | | | | | | | | |
Halliburton Company | | | | | | | 111,160 | | | | 4,445,288 | |
| | | | | | | | | | | | |
| | | | |
| Oil, Gas & Consumable Fuels: 2.24% | | | | | | | | | | | | |
Cheniere Energy Incorporated † | | | | | | | 34,300 | | | | 2,448,334 | |
Pioneer Natural Resources Company | | | | | | | 34,310 | | | | 5,164,684 | |
| | | | |
| | | | | | | | | | | 7,613,018 | |
| | | | | | | | | | | | |
The accompanying notes are an integral part of these financial statements.
| | | | |
| 8 | | Wells Fargo Advantage Capital Growth Fund | | Portfolio of investments—January 31, 2015 (unaudited) |
| | | | | | | | | | | | |
| Security name | | | | | | Shares | | | Value | |
| | | | |
Financials: 7.54% | | | | | | | | | | | | |
| | | | |
| Banks: 1.21% | | | | | | | | | | | | |
ICICI Bank Limited ADR | | | | | | | 342,274 | | | $ | 4,110,711 | |
| | | | | | | | | | | | |
| | | | |
| Capital Markets: 2.79% | | | | | | | | | | | | |
Affiliated Managers Group Incorporated † | | | | | | | 30,352 | | | | 6,237,943 | |
Raymond James Financial Incorporated | | | | | | | 61,450 | | | | 3,233,499 | |
| | | | |
| | | | | | | | | | | 9,471,442 | |
| | | | | | | | | | | | |
| | | | |
| Diversified Financial Services: 3.54% | | | | | | | | | | | | |
IntercontinentalExchange Group Incorporated | | | | | | | 27,480 | | | | 5,653,460 | |
McGraw Hill Financial Incorporated | | | | | | | 71,150 | | | | 6,363,656 | |
| | | | |
| | | | | | | | | | | 12,017,116 | |
| | | | | | | | | | | | |
| | | | |
Health Care: 18.60% | | | | | | | | | | | | |
| | | | |
| Biotechnology: 10.15% | | | | | | | | | | | | |
Biogen Idec Incorporated † | | | | | | | 21,500 | | | | 8,366,940 | |
Celgene Corporation † | | | | | | | 59,940 | | | | 7,142,450 | |
Gilead Sciences Incorporated † | | | | | | | 91,557 | | | | 9,597,920 | |
Regeneron Pharmaceuticals Incorporated † | | | | | | | 12,350 | | | | 5,145,751 | |
Vertex Pharmaceuticals Incorporated † | | | | | | | 38,050 | | | | 4,190,827 | |
| | | | |
| | | | | | | | | | | 34,443,888 | |
| | | | | | | | | | | | |
| | | | |
| Health Care Providers & Services: 3.43% | | | | | | | | | | | | |
Cardinal Health Incorporated | | | | | | | 56,950 | | | | 4,737,671 | |
McKesson Corporation | | | | | | | 32,450 | | | | 6,900,493 | |
| | | | |
| | | | | | | | | | | 11,638,164 | |
| | | | | | | | | | | | |
| | | | |
| Pharmaceuticals: 5.02% | | | | | | | | | | | | |
AbbVie Incorporated | | | | | | | 83,456 | | | | 5,036,570 | |
Bristol-Myers Squibb Company | | | | | | | 69,250 | | | | 4,173,698 | |
Eli Lilly & Company | | | | | | | 48,250 | | | | 3,474,000 | |
Perrigo Company plc | | | | | | | 28,800 | | | | 4,370,112 | |
| | | | |
| | | | | | | | | | | 17,054,380 | |
| | | | | | | | | | | | |
| | | | |
Industrials: 6.89% | | | | | | | | | | | | |
| | | | |
| Aerospace & Defense: 0.48% | | | | | | | | | | | | |
Lockheed Martin Corporation | | | | | | | 8,650 | | | | 1,629,401 | |
| | | | | | | | | | | | |
| | | | |
| Airlines: 1.20% | | | | | | | | | | | | |
Delta Air Lines Incorporated | | | | | | | 86,530 | | | | 4,093,734 | |
| | | | | | | | | | | | |
| | | | |
| Machinery: 1.09% | | | | | | | | | | | | |
Wabtec Corporation | | | | | | | 44,200 | | | | 3,688,490 | |
| | | | | | | | | | | | |
| | | | |
| Road & Rail: 4.12% | | | | | | | | | | | | |
Canadian Pacific Railway Limited | | | | | | | 19,050 | | | | 3,327,464 | |
Old Dominion Freight Line Incorporated † | | | | | | | 56,100 | | | | 3,933,732 | |
The accompanying notes are an integral part of these financial statements.
| | | | | | |
| Portfolio of investments—January 31, 2015 (unaudited) | | Wells Fargo Advantage Capital Growth Fund | | | 9 | |
| | | | | | | | | | | | |
| Security name | | | | | | Shares | | | Value | |
| | | | |
| Road & Rail (continued) | | | | | | | | | | | | |
Union Pacific Corporation | | | | | | | 57,300 | | | $ | 6,716,133 | |
| | | | |
| | | | | | | | | | | 13,977,329 | |
| | | | | | | | | | | �� | |
| | | | |
Information Technology: 30.86% | | | | | | | | | | | | |
| | | | |
| Communications Equipment: 1.30% | | | | | | | | | | | | |
Palo Alto Networks Incorporated † | | | | | | | 34,878 | | | | 4,408,230 | |
| | | | | | | | | | | | |
| | | | |
| Electronic Equipment, Instruments & Components: 1.82% | | | | | | | | | | | | |
TE Connectivity Limited | | | | | | | 92,800 | | | | 6,160,992 | |
| | | | | | | | | | | | |
| | | | |
| Internet Software & Services: 8.60% | | | | | | | | | | | | |
Alibaba Group Holding Limited ADR † | | | | | | | 41,052 | | | | 3,656,912 | |
Facebook Incorporated Class A † | | | | | | | 174,460 | | | | 13,243,259 | |
Google Incorporated Class A † | | | | | | | 4,680 | | | | 2,515,734 | |
Google Incorporated Class C † | | | | | | | 13,480 | | | | 7,205,330 | |
LinkedIn Corporation Class A † | | | | | | | 11,450 | | | | 2,573,273 | |
| | | | |
| | | | | | | | | | | 29,194,508 | |
| | | | | | | | | | | | |
| | | | |
| IT Services: 4.05% | | | | | | | | | | | | |
Alliance Data Systems Corporation † | | | | | | | 19,350 | | | | 5,588,861 | |
Visa Incorporated Class A | | | | | | | 31,970 | | | | 8,149,473 | |
| | | | |
| | | | | | | | | | | 13,738,334 | |
| | | | | | | | | | | | |
| | | | |
| Semiconductors & Semiconductor Equipment: 3.76% | | | | | | | | | | | | |
Applied Materials Incorporated | | | | | | | 235,150 | | | | 5,370,826 | |
Micron Technology Incorporated † | | | | | | | 253,050 | | | | 7,405,508 | |
| | | | |
| | | | | | | | | | | 12,776,334 | |
| | | | | | | | | | | | |
| | | | |
| Software: 3.15% | | | | | | | | | | | | |
Salesforce.com Incorporated † | | | | | | | 49,761 | | | | 2,809,008 | |
ServiceNow Incorporated † | | | | | | | 67,930 | | | | 4,952,097 | |
Workday Incorporated Class A † | | | | | | | 36,800 | | | | 2,924,128 | |
| | | | |
| | | | | | | | | | | 10,685,233 | |
| | | | | | | | | | | | |
| | | | |
| Technology Hardware, Storage & Peripherals: 8.18% | | | | | | | | | | | | |
Apple Incorporated | | | | | | | 192,675 | | | | 22,573,803 | |
Western Digital Corporation | | | | | | | 53,450 | | | | 5,196,944 | |
| | | | |
| | | | | | | | | | | 27,770,747 | |
| | | | | | | | | | | | |
| | | | |
Materials: 2.39% | | | | | | | | | | | | |
| | | | |
| Chemicals: 1.62% | | | | | | | | | | | | |
Monsanto Company | | | | | | | 46,720 | | | | 5,512,026 | |
| | | | | | | | | | | | |
| | | | |
| Construction Materials: 0.77% | | | | | | | | | | | | |
Vulcan Materials Company | | | | | | | 36,850 | | | | 2,598,294 | |
| | | | | | | | | | | | |
The accompanying notes are an integral part of these financial statements.
| | | | |
| 10 | | Wells Fargo Advantage Capital Growth Fund | | Portfolio of investments—January 31, 2015 (unaudited) |
| | | | | | | | | | | | | | |
| Security name | | | | | | | Shares | | | Value | |
| | | | |
Telecommunication Services: 1.99% | | | | | | | | | | | | | | |
| | | | |
| Wireless Telecommunication Services: 1.99% | | | | | | | | | | | | | | |
SBA Communications Corporation Class A † | | | | | | | | | 57,850 | | | $ | 6,751,090 | |
| | | | | | | | | | | | | | |
| | | | |
Total Common Stocks (Cost $253,370,371) | | | | | | | | | | | | | 329,125,022 | |
| | | | | | | | | | | | | | |
| | | | |
| | | Yield | | | | | | | | | |
| | | | |
Short-Term Investments: 1.81% | | | | | | | | | | | | | | |
| | | | |
| Investment Companies: 1.81% | | | | | | | | | | | | | | |
Securities Lending Cash Investments, LLC (l)(r)(u) | | | 0.13 | % | | | | | 1,718,750 | | | | 1,718,750 | |
Wells Fargo Advantage Cash Investment Money Market Fund, Select Class (l)(u) | | | 0.10 | | | | | | 4,405,856 | | | | 4,405,856 | |
| | | | |
Total Short-Term Investments (Cost $6,124,606) | | | | | | | | | | | | | 6,124,606 | |
| | | | | | | | | | | | | | |
| | | | | | | | |
| Total investments in securities (Cost $259,494,977) * | | | 98.78 | % | | | 335,249,628 | |
Other assets and liabilities, net | | | 1.22 | | | | 4,156,490 | |
| | | | | | | | |
| Total net assets | | | 100.00 | % | | $ | 339,406,118 | |
| | | | | | | | |
| † | Non-income-earning security |
| « | All or a portion of this security is on loan. |
| (l) | The security represents an affiliate of the Fund as defined in the Investment Company Act of 1940. |
| (r) | The investment is a non-registered investment vehicle purchased with cash collateral received from securities on loan. |
| (u) | The rate represents the 7-day annualized yield at period end. |
| * | Cost for federal income tax purposes is $260,401,207 and unrealized gains (losses) consists of: |
| | | | |
Gross unrealized gains | | $ | 79,110,122 | |
Gross unrealized losses | | | (4,261,701 | ) |
| | | | |
Net unrealized gains | | $ | 74,848,421 | |
The accompanying notes are an integral part of these financial statements.
| | | | | | |
| Statement of assets and liabilities—January 31, 2015 (unaudited) | | Wells Fargo Advantage Capital Growth Fund | | | 11 | |
| | | | |
| | | | |
| |
Assets | | | | |
Investments | | | | |
In unaffiliated securities (including $1,679,875 of securities loaned), at value (cost $253,370,371) | | $ | 329,125,022 | |
In affiliated securities, at value (cost $6,124,606) | | | 6,124,606 | |
| | | | |
Total investments, at value (cost $259,494,977) | | | 335,249,628 | |
Receivable for investments sold | | | 11,017,661 | |
Receivable for Fund shares sold | | | 266,253 | |
Receivable for dividends | | | 124,289 | |
Receivable for securities lending income | | | 201 | |
Prepaid expenses and other assets | | | 44,111 | |
| | | | |
Total assets | | | 346,702,143 | |
| | | | |
| |
Liabilities | | | | |
Payable for investments purchased | | | 5,100,979 | |
Payable for Fund shares redeemed | | | 186,732 | |
Payable upon receipt of securities loaned | | | 1,718,750 | |
Advisory fee payable | | | 139,177 | |
Distribution fee payable | | | 3,319 | |
Administration fees payable | | | 54,939 | |
Accrued expenses and other liabilities | | | 92,129 | |
| | | | |
Total liabilities | | | 7,296,025 | |
| | | | |
Total net assets | | $ | 339,406,118 | |
| | | | |
| |
NET ASSETS CONSIST OF | | | | |
Paid-in capital | | $ | 253,137,925 | |
Accumulated net investment loss | | | (127,376 | ) |
Accumulated net realized gains on investments | | | 10,641,498 | |
Net unrealized gains on investments | | | 75,754,071 | |
| | | | |
Total net assets | | $ | 339,406,118 | |
| | | | |
| |
COMPUTATION OF NET ASSET VALUE AND OFFERING PRICE PER SHARE | | | | |
Net assets – Class A | | $ | 17,692,797 | |
Shares outstanding – Class A1 | | | 1,081,003 | |
Net asset value per share – Class A | | | $16.37 | |
Maximum offering price per share – Class A2 | | | $17.37 | |
Net assets – Class C | | $ | 5,036,963 | |
Shares outstanding – Class C1 | | | 334,716 | |
Net asset value per share – Class C | | | $15.05 | |
Net assets – Class R4 | | $ | 14,626 | |
Share outstanding – Class R41 | | | 828 | |
Net asset value per share – Class R4 | | | $17.66 | |
Net assets – Class R6 | | $ | 145,641,078 | |
Shares outstanding – Class R61 | | | 8,215,072 | |
Net asset value per share – Class R6 | | | $17.73 | |
Net assets – Administrator Class | | $ | 35,826,132 | |
Shares outstanding – Administrator Class1 | | | 2,066,487 | |
Net asset value per share – Administrator Class | | | $17.34 | |
Net assets – Institutional Class | | $ | 48,815,396 | |
Shares outstanding – Institutional Class1 | | | 2,758,314 | |
Net asset value per share – Institutional Class | | | $17.70 | |
Net assets – Investor Class | | $ | 86,379,126 | |
Shares outstanding – Investor Class1 | | | 5,330,300 | |
Net asset value per share – Investor Class | | | $16.21 | |
| 1 | The Fund has an unlimited number of authorized shares. |
| 2 | Maximum offering price is computed as 100/94.25 of net asset value. On investments of $50,000 or more, the offering price is reduced. |
The accompanying notes are an integral part of these financial statements.
| | | | |
| 12 | | Wells Fargo Advantage Capital Growth Fund | | Statement of operations—six months ended January 31, 2015 (unaudited) |
| | | | |
| | | | |
| |
Investment income | | | | |
Dividends (net of foreign withholding taxes of $2,412) | | $ | 1,332,409 | |
Securities lending income, net | | | 31,403 | |
Income from affiliated securities | | | 1,403 | |
| | | | |
Total investment income | | | 1,365,215 | |
| | | | |
| |
Expenses | | | | |
Advisory fee | | | 1,164,161 | |
Administration fees | | | | |
Fund level | | | 89,551 | |
Class A | | | 23,842 | |
Class C | | | 6,374 | |
Class R4 | | | 6 | |
Class R6 | | | 22,180 | |
Administrator Class | | | 22,948 | |
Institutional Class | | | 20,140 | |
Investor Class | | | 145,335 | |
Shareholder servicing fees | | | | |
Class A | | | 22,926 | |
Class C | | | 6,129 | |
Class R4 | | | 7 | |
Administrator Class | | | 57,371 | |
Investor Class | | | 113,543 | |
Distribution fee | | | | |
Class C | | | 18,388 | |
Custody and accounting fees | | | 16,471 | |
Professional fees | | | 24,744 | |
Registration fees | | | 32,196 | |
Shareholder report expenses | | | 18,198 | |
Trustees’ fees and expenses | | | 5,709 | |
Other fees and expenses | | | 9,047 | |
| | | | |
Total expenses | | | 1,819,266 | |
Less: Fee waivers and/or expense reimbursements | | | (326,675 | ) |
| | | | |
Net expenses | | | 1,492,591 | |
| | | | |
Net investment loss | | | (127,376 | ) |
| | | | |
| |
REALIZED AND UNREALIZED GAINS (LOSSES) ON INVESTMENTS | | | | |
Net realized gains on investments | | | 29,783,783 | |
Net change in unrealized gains (losses) on investments | | | (12,943,341 | ) |
| | | | |
Net realized and unrealized gains (losses) on investments | | | 16,840,442 | |
| | | | |
Net increase in net assets resulting from operations | | $ | 16,713,066 | |
| | | | |
The accompanying notes are an integral part of these financial statements.
| | | | | | |
| Statement of changes in net assets (unaudited) | | Wells Fargo Advantage Capital Growth Fund | | | 13 | |
| | | | | | | | | | | | | | | | |
| | | Six months ended
January 31, 2015
(unaudited) | | | Year ended
July 31, 2014 | |
| | | | |
Operations | | | | | | | | | | | | | | | | |
Net investment loss | | | | | | $ | (127,376 | ) | | | | | | $ | (663,368 | ) |
Net realized gains on investments | | | | | | | 29,783,783 | | | | | | | | 88,987,193 | |
Net change in unrealized gains (losses) on investments | | | | | | | (12,943,341 | ) | | | | | | | (1,646,000 | ) |
| | | | |
Net increase in net assets resulting from operations | | | | | | | 16,713,066 | | | | | | | | 86,677,825 | |
| | | | |
| | | | |
Distributions to shareholders from | | | | | | | | | | | | | | | | |
Net investment income | | | | | | | | | | | | | | | | |
Class A | | | | | | | 0 | | | | | | | | (22,340 | ) |
Class R4 | | | | | | | 0 | | | | | | | | (30 | ) |
Class R6 | | | | | | | 0 | | | | | | | | (188,590 | ) |
Administrator Class | | | | | | | 0 | | | | | | | | (150,185 | ) |
Institutional Class | | | | | | | 0 | | | | | | | | (1,022,514 | ) |
Investor Class | | | | | | | 0 | | | | | | | | (86,333 | ) |
Net realized gains | | | | | | | | | | | | | | | | |
Class A | | | | | | | (4,805,732 | ) | | | | | | | (1,873,636 | ) |
Class C | | | | | | | (1,397,806 | ) | | | | | | | (492,729 | ) |
Class R4 | | | | | | | (3,693 | ) | | | | | | | (1,251 | ) |
Class R6 | | | | | | | (36,912,629 | ) | | | | | | | (6,224,341 | ) |
Administrator Class | | | | | | | (9,378,629 | ) | | | | | | | (6,836,708 | ) |
Institutional Class | | | | | | | (12,743,781 | ) | | | | | | | (27,083,256 | ) |
Investor Class | | | | | | | (24,364,369 | ) | | | | | | | (9,335,586 | ) |
| | | | |
Total distributions to shareholders | | | | | | | (89,606,639 | ) | | | | | | | (53,317,499 | ) |
| | | | |
| | | | |
Capital share transactions | | | Shares | | | | | | | | Shares | | | | | |
Proceeds from shares sold | | | | | | | | | | | | | | | | |
Class A | | | 65,912 | | | | 1,245,852 | | | | 123,316 | | | | 2,574,382 | |
Class C | | | 59,917 | | | | 1,014,459 | | | | 64,888 | | | | 1,284,758 | |
Class R6 | | | 265,012 | | | | 5,511,470 | | | | 6,758,171 | | | | 147,435,533 | |
Administrator Class | | | 109,408 | | | | 2,268,554 | | | | 387,977 | | | | 8,509,901 | |
Institutional Class | | | 529,241 | | | | 10,625,738 | | | | 1,004,161 | | | | 22,242,288 | |
Investor Class | | | 221,110 | | | | 4,381,287 | | | | 410,708 | | | | 8,576,959 | |
| | | | |
| | | | | | | 25,047,360 | | | | | | | | 190,623,821 | |
| | | | |
Reinvestment of distributions | | | | | | | | | | | | | | | | |
Class A | | | 283,053 | | | | 4,667,546 | | | | 90,669 | | | | 1,852,251 | |
Class C | | | 78,077 | | | | 1,185,209 | | | | 21,836 | | | | 422,743 | |
Class R4 | | | 208 | | | | 3,693 | | | | 59 | | | | 1,281 | |
Class R6 | | | 2,067,934 | | | | 36,912,629 | | | | 297,090 | | | | 6,412,931 | |
Administrator Class | | | 533,599 | | | | 9,316,635 | | | | 313,298 | | | | 6,669,291 | |
Institutional Class | | | 349,997 | | | | 6,236,949 | | | | 1,194,493 | | | | 25,770,101 | |
Investor Class | | | 1,450,130 | | | | 23,680,615 | | | | 451,521 | | | | 9,160,992 | |
| | | | |
| | | | | | | 82,003,276 | | | | | | | | 50,289,590 | |
| | | | |
Payment for shares redeemed | | | | | | | | | | | | | | | | |
Class A | | | (138,781 | ) | | | (2,804,550 | ) | | | (168,093 | ) | | | (3,543,654 | ) |
Class C | | | (33,253 | ) | | | (585,583 | ) | | | (94,005 | ) | | | (1,847,699 | ) |
Class R6 | | | (444,818 | ) | | | (9,414,533 | ) | | | (731,122 | ) | | | (16,244,245 | ) |
Administrator Class | | | (1,628,804 | ) | | | (36,799,721 | ) | | | (744,267 | ) | | | (16,283,626 | ) |
Institutional Class | | | (331,182 | ) | | | (7,426,937 | ) | | | (15,885,091 | ) | | | (344,673,814 | ) |
Investor Class | | | (546,294 | ) | | | (10,330,930 | ) | | | (976,512 | ) | | | (20,433,813 | ) |
| | | | |
| | | | | | | (67,362,254 | ) | | | | | | | (403,026,851 | ) |
| | | | |
Net increase (decrease) in net assets resulting from capital share transactions | | | | | | | 39,688,382 | | | | | | | | (162,113,440 | ) |
| | | | |
Total decrease in net assets | | | | | | | (33,205,191 | ) | | | | | | | (128,753,114 | ) |
| | | | |
| | | | |
Net assets | | | | | | | | | | | | | | | | |
Beginning of period | | | | | | | 372,611,309 | | | | | | | | 501,364,423 | |
| | | | |
End of period | | | | | | $ | 339,406,118 | | | | | | | $ | 372,611,309 | |
| | | | |
Undistributed (accumulated) net investment income (loss) | | | | | | $ | (127,376 | ) | | | | | | $ | 0 | |
| | | | |
The accompanying notes are an integral part of these financial statements.
| | | | |
| 14 | | Wells Fargo Advantage Capital Growth Fund | | Financial highlights |
(For a share outstanding throughout each period)
| | | | | | | | | | | | | | | | | | | | | | | | |
| | | Six months ended
January 31, 2015 (unaudited) | | | Year ended July 31 | |
| CLASS A | | | 2014 | | | 2013 | | | 2012 | | | 2011 | | | 2010 | |
Net asset value, beginning of period | | | $21.31 | | | | $19.87 | | | | $16.74 | | | | $16.25 | | | | $13.07 | | | | $11.83 | |
Net investment income (loss) | | | (0.04 | )1 | | | (0.10 | )1 | | | 0.00 | 1,2 | | | (0.05 | )1 | | | (0.07 | )1 | | | (0.06 | )1 |
Net realized and unrealized gains (losses) on investments | | | 1.05 | | | | 3.79 | | | | 3.43 | | | | 0.54 | | | | 3.25 | | | | 1.30 | |
| | | | | | | | | | | | | | | | | | | | | | | | |
Total from investment operations | | | 1.01 | | | | 3.69 | | | | 3.43 | | | | 0.49 | | | | 3.18 | | | | 1.24 | |
Distributions to shareholders from | | | | | | | | | | | | | | | | | | | | | | | | |
Net investment income | | | 0.00 | | | | (0.02 | ) | | | 0.00 | | | | 0.00 | | | | 0.00 | | | | 0.00 | |
Net realized gains | | | (5.95 | ) | | | (2.23 | ) | | | (0.30 | ) | | | 0.00 | | | | 0.00 | | | | 0.00 | |
| | | | | | | | | | | | | | | | | | | | | | | | |
Total distributions to shareholders | | | (5.95 | ) | | | (2.25 | ) | | | (0.30 | ) | | | 0.00 | | | | 0.00 | | | | 0.00 | |
Net asset value, end of period | | | $16.37 | | | | $21.31 | | | | $19.87 | | | | $16.74 | | | | $16.25 | | | | $13.07 | |
Total return3 | | | 4.55 | % | | | 19.09 | % | | | 20.85 | % | | | 3.02 | % | | | 24.43 | % | | | 10.40 | % |
Ratios to average net assets (annualized) | | | | | | | | | | | | | | | | | | | | | | | | |
Gross expenses | | | 1.27 | % | | | 1.26 | % | | | 1.26 | % | | | 1.21 | % | | | 1.21 | % | | | 1.27 | % |
Net expenses | | | 1.11 | % | | | 1.11 | % | | | 1.14 | % | | | 1.20 | % | | | 1.20 | % | | | 1.25 | % |
Net investment income (loss) | | | (0.35 | )% | | | (0.46 | )% | | | 0.01 | % | | | (0.30 | )% | | | (0.48 | )% | | | (0.55 | )% |
Supplemental data | | | | | | | | | | | | | | | | | | | | | | | | |
Portfolio turnover rate | | | 43 | % | | | 94 | % | | | 107 | % | | | 116 | % | | | 116 | % | | | 128 | % |
Net assets, end of period (000s omitted) | | | $17,693 | | | | $18,561 | | | | $16,390 | | | | $17,784 | | | | $20,693 | | | | $24,222 | |
| 1 | Calculated based upon average shares outstanding |
| 2 | Amount is less than $0.005. |
| 3 | Total return calculations do not include any sales charges. Returns for periods of less than one year are not annualized. |
The accompanying notes are an integral part of these financial statements.
| | | | | | |
| Financial highlights | | Wells Fargo Advantage Capital Growth Fund | | | 15 | |
(For a share outstanding throughout each period)
| | | | | | | | | | | | | | | | | | | | | | | | |
| | | Six months ended
January 31, 2015 (unaudited) | | | Year ended July 31 | |
| CLASS C | | | 2014 | | | 2013 | | | 2012 | | | 2011 | | | 2010 | |
Net asset value, beginning of period | | | $20.12 | | | | $18.98 | | | | $16.12 | | | | $15.77 | | | | $12.77 | | | | $11.65 | |
Net investment loss | | | (0.10 | )1 | | | (0.24 | )1 | | | (0.13 | )1 | | | (0.16 | )1 | | | (0.19 | )1 | | | (0.17 | ) |
Net realized and unrealized gains (losses) on investments | | | 0.98 | | | | 3.61 | | | | 3.29 | | | | 0.51 | | | | 3.19 | | | | 1.29 | |
| | | | | | | | | | | | | | | | | | | | | | | | |
Total from investment operations | | | 0.88 | | | | 3.37 | | | | 3.16 | | | | 0.35 | | | | 3.00 | | | | 1.12 | |
Distributions to shareholders from | | | | | | | | | | | | | | | | | | | | | | | | |
Net realized gains | | | (5.95 | ) | | | (2.23 | ) | | | (0.30 | ) | | | 0.00 | | | | 0.00 | | | | 0.00 | |
Net asset value, end of period | | | $15.05 | | | | $20.12 | | | | $18.98 | | | | $16.12 | | | | $15.77 | | | | $12.77 | |
Total return2 | | | 4.13 | % | | | 18.21 | % | | | 19.97 | % | | | 2.22 | % | | | 23.49 | % | | | 9.61 | % |
Ratios to average net assets (annualized) | | | | | | | | | | | | | | | | | | | | | | | | |
Gross expenses | | | 2.02 | % | | | 2.01 | % | | | 2.01 | % | | | 1.96 | % | | | 1.96 | % | | | 2.02 | % |
Net expenses | | | 1.86 | % | | | 1.86 | % | | | 1.89 | % | | | 1.95 | % | | | 1.95 | % | | | 2.00 | % |
Net investment loss | | | (1.10 | )% | | | (1.20 | )% | | | (0.73 | )% | | | (1.05 | )% | | | (1.23 | )% | | | (1.31 | )% |
Supplemental data | | | | | | | | | | | | | | | | | | | | | | | | |
Portfolio turnover rate | | | 43 | % | | | 94 | % | | | 107 | % | | | 116 | % | | | 116 | % | | | 128 | % |
Net assets, end of period (000s omitted) | | | $5,037 | | | | $4,628 | | | | $4,503 | | | | $6,042 | | | | $8,272 | | | | $7,127 | |
| 1 | Calculated based upon average shares outstanding |
| 2 | Total return calculations do not include any sales charges. Returns for periods of less than one year are not annualized. |
The accompanying notes are an integral part of these financial statements.
| | | | |
| 16 | | Wells Fargo Advantage Capital Growth Fund | | Financial highlights |
(For a share outstanding throughout each period)
| | | | | | | | | | | | |
| | | Six months ended
January 31, 2015 (unaudited) | | | Year ended July 31 | |
| CLASS R4 | | | 2014 | | | 20131 | |
Net asset value, beginning of period | | | $22.52 | | | | $20.83 | | | | $18.22 | |
Net investment income (loss) | | | 0.00 | 2,3 | | | (0.02 | ) | | | 0.05 | |
Net realized and unrealized gains (losses) on investments | | | 1.09 | | | | 3.99 | | | | 2.95 | |
| | | | | | | | | | | | |
Total from investment operations | | | 1.09 | | | | 3.97 | | | | 3.00 | |
Distributions to shareholders from | | | | | | | | | | | | |
Net investment income | | | 0.00 | | | | (0.05 | ) | | | (0.09 | ) |
Net realized gains | | | (5.95 | ) | | | (2.23 | ) | | | (0.30 | ) |
| | | | | | | | | | | | |
Total distributions to shareholders | | | (5.95 | ) | | | (2.28 | ) | | | (0.39 | ) |
Net asset value, end of period | | | $17.66 | | | | $22.52 | | | | $20.83 | |
Total return4 | | | 4.66 | % | | | 19.56 | % | | | 16.86 | % |
Ratios to average net assets (annualized) | | | | | | | | | | | | |
Gross expenses | | | 0.91 | % | | | 0.91 | % | | | 0.90 | % |
Net expenses | | | 0.75 | % | | | 0.75 | % | | | 0.75 | % |
Net investment income (loss) | | | 0.00 | % | | | (0.10 | )% | | | 0.37 | % |
Supplemental data | | | | | | | | | | | | |
Portfolio turnover rate | | | 43 | % | | | 94 | % | | | 107 | % |
Net assets, end of period (000s omitted) | | | $15 | | | | $14 | | | | $12 | |
| 1 | For the period from November 30, 2012 (commencement of class operations) to July 31, 2013 |
| 2 | Calculated based upon average shares outstanding |
| 3 | Amount is less than $0.005. |
| 4 | Returns for periods of less than one year are not annualized. |
The accompanying notes are an integral part of these financial statements.
| | | | | | |
| Financial highlights | | Wells Fargo Advantage Capital Growth Fund | | | 17 | |
(For a share outstanding throughout each period)
| | | | | | | | | | | | |
| | | Six months ended
January 31, 2015 (unaudited) | | | Year ended July 31 | |
| CLASS R6 | | | 2014 | | | 20131 | |
Net asset value, beginning of period | | | $22.56 | | | | $20.85 | | | | $18.22 | |
Net investment income | | | 0.02 | | | | 0.00 | 2,3 | | | 0.07 | |
Net realized and unrealized gains (losses) on investments | | | 1.10 | | | | 4.00 | | | | 2.95 | |
| | | | | | | | | | | | |
Total from investment operations | | | 1.12 | | | | 4.00 | | | | 3.02 | |
Distributions to shareholders from | | | | | | | | | | | | |
Net investment income | | | 0.00 | | | | (0.06 | ) | | | (0.09 | ) |
Net realized gains | | | (5.95 | ) | | | (2.23 | ) | | | (0.30 | ) |
| | | | | | | | | | | | |
Total distributions to shareholders | | | (5.95 | ) | | | (2.29 | ) | | | (0.39 | ) |
Net asset value, end of period | | | $17.73 | | | | $22.56 | | | | $20.85 | |
Total return4 | | | 4.80 | % | | | 19.71 | % | | | 16.99 | % |
Ratios to average net assets (annualized) | | | | | | | | | | | | |
Gross expenses | | | 0.79 | % | | | 0.78 | % | | | 0.79 | % |
Net expenses | | | 0.60 | % | | | 0.60 | % | | | 0.60 | % |
Net investment income | | | 0.16 | % | | | 0.01 | % | | | 0.52 | % |
Supplemental data | | | | | | | | | | | | |
Portfolio turnover rate | | | 43 | % | | | 94 | % | | | 107 | % |
Net assets, end of period (000s omitted) | | | $145,641 | | | | $142,754 | | | | $58 | |
| 1 | For the period from November 30, 2012 (commencement of class operations) to July 31, 2013 |
| 2 | Calculated based upon average shares outstanding |
| 3 | Amount is less than $0.005. |
| 4 | Returns for periods of less than one year are not annualized. |
The accompanying notes are an integral part of these financial statements.
| | | | |
| 18 | | Wells Fargo Advantage Capital Growth Fund | | Financial highlights |
(For a share outstanding throughout each period)
| | | | | | | | | | | | | | | | | | | | | | | | |
| | | Six months ended
January 31, 2015 (unaudited) | | | Year ended July 31 | |
| ADMINISTRATOR CLASS | | | 2014 | | | 2013 | | | 2012 | | | 2011 | | | 2010 | |
Net asset value, beginning of period | | | $22.22 | | | | $20.61 | | | | $17.32 | | | | $16.77 | | | | $13.45 | | | | $12.17 | |
Net investment income (loss) | | | (0.01 | )1 | | | (0.05 | )1 | | | 0.04 | 1 | | | (0.00 | )1,2 | | | (0.03 | )1 | | | (0.03 | )1 |
Net realized and unrealized gains (losses) on investments | | | 1.08 | | | | 3.93 | | | | 3.55 | | | | 0.55 | | | | 3.35 | | | | 1.35 | |
| | | | | | | | | | | | | | | | | | | | | | | | |
Total from investment operations | | | 1.07 | | | | 3.88 | | | | 3.59 | | | | 0.55 | | | | 3.32 | | | | 1.32 | |
Distributions to shareholders from | | | | | | | | | | | | | | | | | | | | | | | | |
Net investment income | | | 0.00 | | | | (0.04 | ) | | | 0.00 | | | | 0.00 | | | | 0.00 | | | | (0.04 | ) |
Net realized gains | | | (5.95 | ) | | | (2.23 | ) | | | (0.30 | ) | | | 0.00 | | | | 0.00 | | | | 0.00 | |
| | | | | | | | | | | | | | | | | | | | | | | | |
Total distributions to shareholders | | | (5.95 | ) | | | (2.27 | ) | | | (0.30 | ) | | | 0.00 | | | | 0.00 | | | | (0.04 | ) |
Net asset value, end of period | | | $17.34 | | | | $22.22 | | | | $20.61 | | | | $17.32 | | | | $16.77 | | | | $13.45 | |
Total return3 | | | 4.58 | % | | | 19.35 | % | | | 21.15 | % | | | 3.22 | % | | | 24.68 | % | | | 10.81 | % |
Ratios to average net assets (annualized) | | | | | | | | | | | | | | | | | | | | | | | | |
Gross expenses | | | 1.11 | % | | | 1.09 | % | | | 1.09 | % | | | 1.05 | % | | | 1.05 | % | | | 1.09 | % |
Net expenses | | | 0.90 | % | | | 0.90 | % | | | 0.91 | % | | | 0.94 | % | | | 0.94 | % | | | 0.94 | % |
Net investment income (loss) | | | (0.11 | )% | | | (0.24 | )% | | | 0.24 | % | | | (0.01 | )% | | | (0.21 | )% | | | (0.25 | )% |
Supplemental data | | | | | | | | | | | | | | | | | | | | | | | | |
Portfolio turnover rate | | | 43 | % | | | 94 | % | | | 107 | % | | | 116 | % | | | 116 | % | | | 128 | % |
Net assets, end of period (000s omitted) | | | $35,826 | | | | $67,830 | | | | $63,786 | | | | $74,529 | | | | $372,178 | | | | $684,207 | |
| 1 | Calculated based upon average shares outstanding |
| 2 | Amount is less than $0.005. |
| 3 | Returns for periods of less than one year are not annualized. |
The accompanying notes are an integral part of these financial statements.
| | | | | | |
| Financial highlights | | Wells Fargo Advantage Capital Growth Fund | | | 19 | |
(For a share outstanding throughout each period)
| | | | | | | | | | | | | | | | | | | | | | | | |
| | | Six months ended
January 31, 2015 (unaudited) | | | Year ended July 31 | |
| INSTITUTIONAL CLASS | | | 2014 | | | 2013 | | | 2012 | | | 2011 | | | 2010 | |
Net asset value, beginning of period | | | $22.54 | | | | $20.84 | | | | $17.56 | | | | $16.96 | | | | $13.57 | | | | $12.27 | |
Net investment income (loss) | | | 0.01 | 1 | | | 0.01 | 1 | | | 0.09 | 1 | | | 0.03 | 1 | | | 0.00 | 1,2 | | | (0.00 | )1,2 |
Net realized and unrealized gains (losses) on investments | | | 1.10 | | | | 4.00 | | | | 3.58 | | | | 0.57 | | | | 3.39 | | | | 1.36 | |
| | | | | | | | | | | | | | | | | | | | | | | | |
Total from investment operations | | | 1.11 | | | | 4.01 | | | | 3.67 | | | | 0.60 | | | | 3.39 | | | | 1.36 | |
Distributions to shareholders from | | | | | | | | | | | | | | | | | | | | | | | | |
Net investment income | | | 0.00 | | | | (0.08 | ) | | | (0.09 | ) | | | 0.00 | | | | 0.00 | | | | (0.06 | ) |
Net realized gains | | | (5.95 | ) | | | (2.23 | ) | | | (0.30 | ) | | | 0.00 | | | | 0.00 | | | | 0.00 | |
| | | | | | | | | | | | | | | | | | | | | | | | |
Total distributions to shareholders | | | (5.95 | ) | | | (2.31 | ) | | | (0.39 | ) | | | 0.00 | | | | 0.00 | | | | (0.06 | ) |
Net asset value, end of period | | | $17.70 | | | | $22.54 | | | | $20.84 | | | | $17.56 | | | | $16.96 | | | | $13.57 | |
Total return3 | | | 4.76 | % | | | 19.76 | % | | | 21.42 | % | | | 3.48 | % | | | 25.07 | % | | | 10.97 | % |
Ratios to average net assets (annualized) | | | | | | | | | | | | | | | | | | | | | | | | |
Gross expenses | | | 0.84 | % | | | 0.82 | % | | | 0.82 | % | | | 0.78 | % | | | 0.78 | % | | | 0.82 | % |
Net expenses | | | 0.65 | % | | | 0.65 | % | | | 0.67 | % | | | 0.70 | % | | | 0.70 | % | | | 0.75 | % |
Net investment income (loss) | | | 0.11 | % | | | 0.05 | % | | | 0.46 | % | | | 0.21 | % | | | 0.00 | % | | | (0.06 | )% |
Supplemental data | | | | | | | | | | | | | | | | | | | | | | | | |
Portfolio turnover rate | | | 43 | % | | | 94 | % | | | 107 | % | | | 116 | % | | | 116 | % | | | 128 | % |
Net assets, end of period (000s omitted) | | | $48,815 | | | | $49,816 | | | | $331,310 | | | | $543,933 | | | | $988,633 | | | | $473,777 | |
| 1 | Calculated based upon average shares outstanding |
| 2 | Amount is less than $0.005. |
| 3 | Returns for periods of less than one year are not annualized. |
The accompanying notes are an integral part of these financial statements.
| | | | |
| 20 | | Wells Fargo Advantage Capital Growth Fund | | Financial highlights |
(For a share outstanding throughout each period)
| | | | | | | | | | | | | | | | | | | | | | | | |
| | | Six months ended
January 31, 2015 (unaudited) | | | Year ended July 31 | |
| INVESTOR CLASS | | | 2014 | | | 2013 | | | 2012 | | | 2011 | | | 2010 | |
Net asset value, beginning of period | | | $21.17 | | | | $19.75 | | | | $16.65 | | | | $16.18 | | | | $13.02 | | | | $11.79 | |
Net investment loss | | | (0.04 | )1 | | | (0.11 | )1 | | | (0.01 | )1 | | | (0.06 | )1 | | | (0.08 | )1 | | | (0.08 | )1 |
Net realized and unrealized gains (losses) on investments | | | 1.03 | | | | 3.78 | | | | 3.41 | | | | 0.53 | | | | 3.24 | | | | 1.31 | |
| | | | | | | | | | | | | | | | | | | | | | | | |
Total from investment operations | | | 0.99 | | | | 3.67 | | | | 3.40 | | | | 0.47 | | | | 3.16 | | | | 1.23 | |
Distributions to shareholders from | | | | | | | | | | | | | | | | | | | | | | | | |
Net investment income | | | 0.00 | | | | (0.02 | ) | | | 0.00 | | | | 0.00 | | | | 0.00 | | | | 0.00 | |
Net realized gains | | | (5.95 | ) | | | (2.23 | ) | | | (0.30 | ) | | | 0.00 | | | | 0.00 | | | | 0.00 | |
| | | | | | | | | | | | | | | | | | | | | | | | |
Total distributions to shareholders | | | (5.95 | ) | | | (2.25 | ) | | | (0.30 | ) | | | 0.00 | | | | 0.00 | | | | 0.00 | |
Net asset value, end of period | | | $16.21 | | | | $21.17 | | | | $19.75 | | | | $16.65 | | | | $16.18 | | | | $13.02 | |
Total return2 | | | 4.42 | % | | | 19.08 | % | | | 20.78 | % | | | 2.90 | % | | | 24.37 | % | | | 10.35 | % |
Ratios to average net assets (annualized) | | | | | | | | | | | | | | | | | | | | | | | | |
Gross expenses | | | 1.33 | % | | | 1.32 | % | | | 1.32 | % | | | 1.28 | % | | | 1.28 | % | | | 1.36 | % |
Net expenses | | | 1.17 | % | | | 1.17 | % | | | 1.20 | % | | | 1.27 | % | | | 1.27 | % | | | 1.35 | % |
Net investment loss | | | (0.41 | )% | | | (0.51 | )% | | | (0.06 | )% | | | (0.37 | )% | | | (0.55 | )% | | | (0.64 | )% |
Supplemental data | | | | | | | | | | | | | | | | | | | | | | | | |
Portfolio turnover rate | | | 43 | % | | | 94 | % | | | 107 | % | | | 116 | % | | | 116 | % | | | 128 | % |
Net assets, end of period (000s omitted) | | | $86,379 | | | �� | $89,008 | | | | $85,306 | | | | $81,199 | | | | $96,941 | | | | $104,200 | |
| 1 | Calculated based upon average shares outstanding |
| 2 | Returns for periods of less than one year are not annualized. |
The accompanying notes are an integral part of these financial statements.
| | | | | | |
| Notes to financial statements (unaudited) | | Wells Fargo Advantage Capital Growth Fund | | | 21 | |
1. ORGANIZATION
Wells Fargo Funds Trust (the “Trust”), a Delaware statutory trust organized on March 10, 1999, is an open-end management investment company registered under the Investment Company Act of 1940, as amended (the “1940 Act”). As an investment company, the Trust follows the accounting and reporting guidance in Financial Accounting Standards Board (“FASB”) Accounting Standards Codification Topic 946, Financial Services – Investment Companies. These financial statements report on the Wells Fargo Advantage Capital Growth Fund (the “Fund”) which is a diversified series of the Trust.
2. SIGNIFICANT ACCOUNTING POLICIES
The following significant accounting policies, which are consistently followed in the preparation of the financial statements of the Fund, are in conformity with U.S. generally accepted accounting principles which require management to make estimates and assumptions that affect the reported amounts of assets and liabilities, disclosure of contingent assets and liabilities at the date of the financial statements, and the reported amounts of revenues and expenses during the reporting period. Actual results could differ from those estimates.
Securities valuation
All investments are valued each business day as of the close of regular trading on the New York Stock Exchange (generally 4 p.m. Eastern Time).
Equity securities that are listed on a foreign or domestic exchange or market are valued at the official closing price or, if none, the last sales price. If no sale occurs on the primary exchange or market for the security that day, the prior day’s price will be deemed “stale” and fair values will be determined in accordance with the Fund’s Valuation Procedures.
Investments in registered open-end investment companies are valued at net asset value. Non-registered investment vehicles are fair valued at net asset value.
Investments which are not valued using any of the methods discussed above are valued at their fair value, as determined in good faith by the Board of Trustees of the Fund. The Board of Trustees has established a Valuation Committee comprised of the Trustees and has delegated to it the authority to take any actions regarding the valuation of portfolio securities that the Valuation Committee deems necessary or appropriate, including determining the fair value of portfolio securities, unless the determination has been delegated to the Management Valuation Team of Wells Fargo Funds Management, LLC (“Funds Management”). The Board of Trustees retains the authority to make or ratify any valuation decisions or approve any changes to the Valuation Procedures as it deems appropriate. On a quarterly basis, the Board of Trustees receives reports on any valuation actions taken by the Valuation Committee or the Management Valuation Team which may include items for ratification.
Valuations of fair valued securities are compared to the next actual sales price when available, or other appropriate market values, to assess the continued appropriateness of the fair valuation methodologies used. These securities are fair valued on a day-to-day basis, taking into consideration changes to appropriate market information and any significant changes to the inputs considered in the valuation process until there is a readily available price provided on an exchange or by an independent pricing service. Valuations received from an independent pricing service or independent broker-dealer quotes are periodically validated by comparisons to most recent trades and valuations provided by other independent pricing services in addition to the review of prices by the adviser and/or subadviser. Unobservable inputs used in determining fair valuations are identified based on the type of security, taking into consideration factors utilized by market participants in valuing the investment, knowledge about the issuer and the current market environment.
Security loans
The Fund may lend its securities from time to time in order to earn additional income in the form of fees or interest on securities received as collateral or the investment of any cash received as collateral. The Fund continues to receive interest or dividends on the securities loaned. The Fund receives collateral in the form of cash or securities with a value at least equal to the value of the securities on loan. The value of the loaned securities is determined at the close of each business day and any additional required collateral is delivered to the Fund on the next business day. In a securities lending transaction, the net asset value of the Fund will be affected by an increase or decrease in the value of the securities loaned and by an increase or decrease in the value of the instrument in which collateral is invested. The amount of securities lending activity undertaken by the Fund fluctuates from time to time. In the event of default or bankruptcy by the borrower, the Fund may be prevented from recovering the loaned securities or gaining access to the collateral or may experience delays or costs in doing so. In addition, the investment of any cash collateral received may lose all or part of its value. The Fund has the right under the lending agreement to recover the securities from the borrower on demand.
| | | | |
| 22 | | Wells Fargo Advantage Capital Growth Fund | | Notes to financial statements (unaudited) |
The Fund lends its securities through an unaffiliated securities lending agent. Cash collateral received in connection with its securities lending transactions is invested in Securities Lending Cash Investments, LLC (the “Securities Lending Fund”). The Securities Lending Fund is exempt from registration under Section 3(c)(7) of the 1940 Act and is managed by Funds Management and is subadvised by Wells Capital Management Incorporated (“WellsCap”). Funds Management receives an advisory fee starting at 0.05% and declining to 0.01% as the average daily net assets of the Securities Lending Fund increase. All of the fees received by Funds Management are paid to WellsCap for its services as subadviser. The Securities Lending Fund seeks to provide a positive return compared to the daily Fed Funds Open rate by investing in high-quality, U.S. dollar-denominated short-term money market instruments. Securities Lending Fund investments are fair valued based upon the amortized cost valuation technique. Income earned from investment in the Securities Lending Fund is included in securities lending income on the Statement of Operations.
Security transactions and income recognition
Securities transactions are recorded on a trade date basis. Realized gains or losses are recorded on the basis of identified cost.
Dividend income is recognized on the ex-dividend date. Dividend Income is recorded net of foreign taxes withheld where recovery of such taxes is not assured.
Distributions to shareholders
Distributions to shareholders from net investment income and net realized gains, if any, are recorded on the ex-dividend date. Such distributions are determined in conformity with federal income tax regulations, which may differ in amount or character from net investment income and realized gains recognized for purposes of U.S. generally accepted accounting principles.
Federal and other taxes
The Fund intends to continue to qualify as a regulated investment company by distributing substantially all of its investment company taxable income and any net realized capital gains (after reduction for capital loss carryforwards) sufficient to relieve it from all, or substantially all, federal income taxes. Accordingly, no provision for federal income taxes was required.
The Fund’s income and federal excise tax returns and all financial records supporting those returns for the prior three fiscal years are subject to examination by the federal and Delaware revenue authorities. Management has analyzed the Fund’s tax positions taken on federal, state, and foreign tax returns for all open tax years and does not believe that there are any uncertain tax positions that require recognition of a tax liability.
As of July 31 2014, the Fund had capital loss carryforwards available to offset future net realized capital gains in the amount of $2,250,820 expiring in 2016.
Class allocations
The separate classes of shares offered by the Fund differ principally in applicable sales charges, distribution, shareholder servicing, and administration fees. Class specific expenses are charged directly to that share class. Investment income, common expenses, and realized and unrealized gains (losses) on investments are allocated daily to each class of shares based on the relative proportion of net assets of each class.
3. FAIR VALUATION MEASUREMENTS
Fair value measurements of investments are determined within a framework that has established a fair value hierarchy based upon the various data inputs utilized in determining the value of the Fund’s investments. The three-level hierarchy gives the highest priority to unadjusted quoted prices in active markets for identical assets or liabilities (Level 1) and the lowest priority to significant unobservable inputs (Level 3). The Fund’s investments are classified within the fair value hierarchy based on the lowest level of input that is significant to the fair value measurement. The inputs are summarized into three broad levels as follows:
| n | | Level 1 – quoted prices in active markets for identical securities |
| n | | Level 2 – other significant observable inputs (including quoted prices for similar securities, interest rates, prepayment speeds, credit risk, use of amortized cost, etc.) |
| n | | Level 3 – significant unobservable inputs (including the Fund’s own assumptions in determining the fair value of investments) |
| | | | | | |
| Notes to financial statements (unaudited) | | Wells Fargo Advantage Capital Growth Fund | | | 23 | |
The inputs or methodologies used for valuing investments in securities are not necessarily an indication of the risk associated with investing in those securities.
The following is a summary of the inputs used in valuing the Fund’s assets and liabilities as of January 31, 2015:
| | | | | | | | | | | | | | | | |
| | | Quoted prices
(Level 1) | | | Other significant
observable inputs
(Level 2) | | | Significant
unobservable inputs
(Level 3) | | | Total | |
Assets | | | | | | | | | | | | | | | | |
Investments in : | | | | | | | | | | | | | | | | |
| | | | |
Common stocks | | | | | | | | | | | | | | | | |
Consumer discretionary | | $ | 78,682,824 | | | $ | 0 | | | $ | 0 | | | $ | 78,682,824 | |
Consumer staples | | | 6,663,449 | | | | 0 | | | | 0 | | | | 6,663,449 | |
Energy | | | 12,058,306 | | | | 0 | | | | 0 | | | | 12,058,306 | |
Financials | | | 25,599,269 | | | | 0 | | | | 0 | | | | 25,599,269 | |
Health care | | | 63,136,432 | | | | 0 | | | | 0 | | | | 63,136,432 | |
Industrials | | | 23,388,954 | | | | 0 | | | | 0 | | | | 23,388,954 | |
Information technology | | | 104,734,378 | | | | 0 | | | | 0 | | | | 104,734,378 | |
Materials | | | 8,110,320 | | | | 0 | | | | 0 | | | | 8,110,320 | |
Telecommunication services | | | 6,751,090 | | | | 0 | | | | 0 | | | | 6,751,090 | |
| | | | |
Short-term investments | | | | | | | | | | | | | | | | |
Investment companies | | | 4,405,856 | | | | 1,718,750 | | | | 0 | | | | 6,124,606 | |
Total assets | | $ | 333,530,878 | | | $ | 1,718,750 | | | $ | 0 | | | $ | 335,249,628 | |
The Fund recognizes transfers between levels within the fair value hierarchy at the end of the reporting period. At January 31, 2015, the Fund did not have any transfers into/out of Level 1, Level 2, or Level 3.
4. TRANSACTIONS WITH AFFILIATES
Advisory fee
The Trust has entered into an advisory contract with Funds Management, an indirect wholly owned subsidiary of Wells Fargo & Company (“Wells Fargo”). The adviser is responsible for implementing investment policies and guidelines and for supervising the subadviser, who is responsible for day-to-day portfolio management of the Fund.
Pursuant to the contract, Funds Management is entitled to receive an annual advisory fee starting at 0.65% and declining to 0.475% as the average daily net assets of the Fund increase. Prior to December 1, 2014, Funds Management was entitled to receive an annual advisory fee which started at 0.65% and declined to 0.55% as the average daily net assets of the Fund increased. For the six months ended January 31, 2015, the advisory fee was equivalent to an annual rate of 0.65% of the Fund’s average daily net assets.
Funds Management has retained the services of a subadviser to provide daily portfolio management to the Fund. The fee for subadvisory services is borne by Funds Management. WellsCap, an affiliate of Funds Management and an indirect wholly owned subsidiary of Wells Fargo, is the subadviser to the Fund and is entitled to receive a fee from Funds Management at an annual rate starting at 0.30% and declining to 0.20% as the average daily net assets of the Fund increase.
Administration fees
The Trust has entered into an administration agreement with Funds Management. Under this agreement, for providing administrative services, which includes paying fees and expenses for services provided by the transfer agent, sub-transfer agents, omnibus account servicers and record-keepers, Funds Management is entitled to receive from the Fund an
| | | | |
| 24 | | Wells Fargo Advantage Capital Growth Fund | | Notes to financial statements (unaudited) |
annual fund level administration fee starting at 0.05% and declining to 0.03% as the average daily net assets of the Fund increase and a class level administration fee which is calculated based on the average daily net assets of each class as follows:
| | | | |
| | | Class level
administration fee | |
Class A, Class C | | | 0.26 | % |
Class R4, Institutional Class | | | 0.08 | |
Class R6 | | | 0.03 | |
Administrator Class | | | 0.10 | |
Investor Class | | | 0.32 | |
Funds Management has contractually waived and/or reimbursed advisory and administration fees to the extent necessary to maintain certain net operating expense ratios for the Fund. Waiver of fees and/or reimbursement of expenses by Funds Management were made first from fund level expenses on a proportionate basis and then from class specific expenses. Funds Management has committed through November 30, 2015 to waive fees and/or reimburse expenses to the extent necessary to cap the Fund’s expenses at 1.11% for Class A shares, 1.86% for Class C shares, 0.75% for Class R4 shares, 0.60% for Class R6 shares, 0.90% for Administrator Class shares, 0.65% for Institutional Class shares, and 1.17% for Investor Class shares. After this time, the cap may be increased or the commitment to maintain the cap may be terminated only with the approval of the Board of Trustees.
Distribution fee
The Trust has adopted a Distribution Plan for Class C shares of the Fund pursuant to Rule 12b-1 under the 1940 Act. A distribution fee is charged to Class C shares and paid to Wells Fargo Funds Distributor, LLC (“Funds Distributor”), the principal underwriter, at an annual rate of 0.75% of the average daily net assets of Class C shares.
In addition, Funds Distributor is entitled to receive the front-end sales charge from the purchase of Class A shares and a contingent deferred sales charge on the redemption of certain shares. Funds Distributor is also entitled to receive the contingent deferred sales charges from redemptions of Class C shares. For the six months ended January 31, 2015, Funds Distributor received $3,050 from the sale of Class A shares.
Shareholder servicing fees
The Trust has entered into contracts with one or more shareholder servicing agents, whereby Class A, Class C, Administrator Class, and Investor Class of the Fund is charged a fee at an annual rate of 0.25% of the average daily net assets of each respective class. Class R4 shares are charged a fee at an annual rate of 0.10% of its average daily net assets.
A portion of these total shareholder servicing fees were paid to affiliates of Wells Fargo.
5. INVESTMENT PORTFOLIO TRANSACTIONS
Purchases and sales of investments, excluding U.S. government obligations (if any) and short-term securities, for the six months ended January 31, 2015 were $151,431,008 and $213,520,216, respectively.
6. BANK BORROWINGS
The Trust (excluding the money market funds and certain other funds in the Trust) and Wells Fargo Variable Trust are parties to a $150,000,000 revolving credit agreement, whereby the Fund is permitted to use bank borrowings for temporary or emergency purposes, such as to fund shareholder redemption requests. Interest under the credit agreement is charged to the Fund based on a borrowing rate equal to the higher of the Federal Funds rate in effect on that day plus 1.25% or the overnight LIBOR rate in effect on that day plus 1.25%. In addition, an annual commitment fee equal to 0.10% of the unused balance is allocated to each participating fund. For the six months ended January 31, 2015, the Fund paid $269 in commitment fees.
For the six months ended January 31, 2015, there were no borrowings by the Fund under the agreement.
7. CONCENTRATION RISK
Concentration risks result from exposure to a limited number of sectors. A fund that invests a substantial portion of its assets in any sector may be more affected by changes in that sector than would be a fund whose investments are not heavily weighted in any sector.
| | | | | | |
| Notes to financial statements (unaudited) | | Wells Fargo Advantage Capital Growth Fund | | | 25 | |
8. INDEMNIFICATION
Under the Trust’s organizational documents, the officers and Trustees are indemnified against certain liabilities that may arise out of performance of their duties to the Trust. Additionally, in the normal course of business, the Trust may enter into contracts with service providers that contain a variety of indemnification clauses. The Trust’s maximum exposure under these arrangements is dependent on future claims that may be made against the Fund and, therefore, cannot be estimated.
| | | | |
| 26 | | Wells Fargo Advantage Capital Growth Fund | | Other information (unaudited) |
PROXY VOTING INFORMATION
A description of the policies and procedures that the Fund uses to determine how to vote proxies relating to portfolio securities, in addition to information regarding how the Fund voted proxies relating to portfolio securities during the most recent 12-month period ended June 30, is available on the Fund’s website at wellsfargoadvantagefunds.com or by visiting the SEC website at sec.gov.
PORTFOLIO HOLDINGS INFORMATION
The complete portfolio holdings for the Fund are publicly available monthly on the Fund’s website (wellsfargoadvantagefunds.com), on a one-month delayed basis. In addition, top ten holdings information (excluding derivative positions) for the Fund is publicly available on the Fund’s website on a monthly, seven-day or more delayed basis. The Fund files its complete schedule of portfolio holdings with the SEC for the first and third quarters of each fiscal year on Form N-Q, which is available by visiting the SEC website at sec.gov. In addition, the Fund’s Form N-Q may be reviewed and copied at the SEC’s Public Reference Room in Washington, DC, and at regional offices in New York City, at 233 Broadway, and in Chicago, at 175 West Jackson Boulevard, Suite 900. Information about the Public Reference Room may be obtained by calling 1-800-SEC-0330.
| | | | | | |
| Other information (unaudited) | | Wells Fargo Advantage Capital Growth Fund | | | 27 | |
BOARD OF TRUSTEES AND OFFICERS
Each of the Trustees and Officers1 listed in the table below acts in identical capacities for each fund in the Wells Fargo Advantage family of funds, which consists of 134 mutual funds comprising the Wells Fargo Funds Trust, Wells Fargo Variable Trust, Wells Fargo Master Trust and four closed-end funds (collectively the “Fund Complex”). This table should be read in conjunction with the Prospectus and the Statement of Additional Information2. The mailing address of each Trustee and Officer is 525 Market Street, 12th Floor, San Francisco, CA 94105. Each Trustee and Officer serves an indefinite term, however, each Trustee serves such term until reaching the mandatory retirement age established by the Trustees.
Independent Trustees
| | | | | | |
Name and
year of birth | | Position held and
length of service* | | Principal occupations during past five years or longer | | Other
directorships during
past five years |
| William R. Ebsworth (Born 1957) | | Trustee, since 2015** | | Retired. From 1984 to 2013, equities analyst, portfolio manager, research director at Fidelity Management and Research Company and retired in 2013 as Chief Investment Officer of Fidelity Strategic Advisers, Inc. in Boston, Tokyo, and Hong Kong where he led a team of investment professionals managing client assets. Prior thereto, Board member of Hong Kong Securities Clearing Co., Hong Kong Options Clearing Corp., the Thailand International Fund, Ltd., Fidelity Investments Life Insurance Company, and Empire Fidelity Investments Life Insurance Company. Mr. Ebsworth is an Adjunct Lecturer, Finance, at Babson College and a Chartered Financial Analyst. | | Asset Allocation Trust |
| Jane A. Freeman (Born 1953) | | Trustee, since 2015** | | Retired. From 2012 to 2014 and 1999 to 2008, Chief Financial Officer of Scientific Learning Corporation. From 2008 to 2012, Ms. Freeman provided consulting services related to strategic business projects. Prior thereto, Portfolio Manager at Rockefeller & Co. and Scudder, Stevens & Clark. Board member of the Harding Loevner Funds from 1996 to 2014, serving as both Lead Independent Director and chair of the Audit Committee. Board member of the Russell Exchange Traded Funds Trust from 2011 to 2012 and the chair of the Audit Committee. Ms. Freeman is a Chartered Financial Analyst (inactive), Chair of Taproot Foundation (non-profit organization) and a Board Member of Ruth Bancroft Garden (non-profit organization). | | Asset Allocation Trust |
| Peter G. Gordon (Born 1942) | | Trustee, since 1998; Chairman, since 2005 | | Co-Founder, Retired Chairman, President and CEO of Crystal Geyser Water Company. Trustee Emeritus, Colby College. | | Asset Allocation Trust |
| Isaiah Harris, Jr. (Born 1952) | | Trustee, since 2009 | | Retired. Chairman of the Board of CIGNA Corporation since 2009, and Director since 2005. From 2003 to 2011, Director of Delux Corporation. Prior thereto, President and CEO of BellSouth Advertising and Publishing Corp. from 2005 to 2007, President and CEO of BellSouth Enterprises from 2004 to 2005 and President of BellSouth Consumer Services from 2000 to 2003. Emeritus member of the Iowa State University Foundation Board of Governors. Emeritus Member of the Advisory Board of Iowa State University School of Business. Advisory Board Member, Palm Harbor Academy. Mr. Harris is a certified public accountant. | | CIGNA Corporation; Asset Allocation Trust |
| Judith M. Johnson (Born 1949) | | Trustee, since 2008; Audit Committee Chairman, since 2008 | | Retired. Prior thereto, Chief Executive Officer and Chief Investment Officer of Minneapolis Employees Retirement Fund from 1996 to 2008. Ms. Johnson is an attorney, certified public accountant and a certified managerial accountant. | | Asset Allocation Trust |
| David F. Larcker (Born 1950) | | Trustee, since 2009 | | James Irvin Miller Professor of Accounting at the Graduate School of Business, Stanford University, Morgan Stanley Director of the Center for Leadership Development and Research and Senior Faculty of The Rock Center for Corporate Governance since 2006. From 2005 to 2008, Professor of Accounting at the Graduate School of Business, Stanford University. Prior thereto, Ernst & Young Professor of Accounting at The Wharton School, University of Pennsylvania from 1985 to 2005. | | Asset Allocation Trust |
| | | | |
| 28 | | Wells Fargo Advantage Capital Growth Fund | | Other information (unaudited) |
| | | | | | |
Name and
year of birth | | Position held and
length of service* | | Principal occupations during past five years or longer | | Other
directorships during
past five years |
| Olivia S. Mitchell (Born 1953) | | Trustee, since 2006 | | International Foundation of Employee Benefit Plans Professor, Wharton School of the University of Pennsylvania since 1993. Director of Wharton’s Pension Research Council and Boettner Center on Pensions & Retirement Research, and Research Associate at the National Bureau of Economic Research. Previously, Cornell University Professor from 1978 to 1993. | | Asset Allocation Trust |
| Timothy J. Penny (Born 1951) | | Trustee, since 1996 | | President and Chief Executive Officer of Southern Minnesota Initiative Foundation, a non-profit organization, since 2007 and Senior Fellow at the Humphrey Institute Policy Forum at the University of Minnesota since 1995. Member of the Board of Trustees of NorthStar Education Finance, Inc., a non-profit organization, since 2007. | | Asset Allocation Trust |
| Michael S. Scofield (Born 1943) | | Trustee, since 2010 | | Served on the Investment Company Institute’s Board of Governors and Executive Committee from 2008-2011 as well the Governing Council of the Independent Directors Council from 2006-2011 and the Independent Directors Council Executive Committee from 2008-2011. Chairman of the IDC from 2008-2010. Institutional Investor (Fund Directions) Trustee of Year in 2007. Trustee of the Evergreen Funds complex (and its predecessors) from 1984 to 2010. Chairman of the Evergreen Funds from 2000-2010. Former Trustee of the Mentor Funds. Retired Attorney, Law Offices of Michael S. Scofield. | | Asset Allocation Trust |
| Donald C. Willeke (Born 1940) | | Trustee, since 1996 | | Principal of the law firm of Willeke & Daniels. General Counsel of the Minneapolis Employees Retirement Fund from 1984 until its consolidation into the Minnesota Public Employees Retirement Association on June 30, 2010. Director and Vice Chair of The Tree Trust (non-profit corporation). Director of the American Chestnut Foundation (non-profit corporation). | | Asset Allocation Trust |
| * | Length of service dates reflect the Trustee’s commencement of service with the Trust’s predecessor entities, where applicable. |
| ** | William R. Ebsworth and Jane A. Freeman each became a Trustee effective January 1, 2015. |
Officers
| | | | | | |
Name and
year of birth | | Position held and
length of service | | Principal occupations during past five years or longer | | |
| Karla M. Rabusch (Born 1959) | | President, since 2003 | | Executive Vice President of Wells Fargo Bank, N.A. and President of Wells Fargo Funds Management, LLC since 2003. | | |
| Jeremy DePalma1 (Born 1974) | | Treasurer, since 2012 | | Senior Vice President of Wells Fargo Funds Management, LLC since 2009. Senior Vice President of Evergreen Investment Management Company, LLC from 2008 to 2010. Vice President, Evergreen Investment Services, Inc. from 2004 to 2007. Head of the Fund Reporting and Control Team within Fund Administration from 2005 to 2010. | | |
| C. David Messman (Born 1960) | | Secretary, since 2000; Chief Legal Officer, since 2003 | | Assistant General Counsel of Wells Fargo Bank, N.A. since 2013 and Vice President and Managing Counsel of Wells Fargo Bank N.A. from 1996 to 2013. Senior Vice President and Secretary of Wells Fargo Funds Management, LLC since 2001. | | |
| Debra Ann Early (Born 1964) | | Chief Compliance Officer, since 2007 | | Senior Vice President of Wells Fargo Funds Management, LLC since 2007 and Chief Compliance Officer from 2007 to 2014. Chief Compliance Officer of Parnassus Investments from 2005 to 2007. Chief Financial Officer of Parnassus Investments from 2004 to 2007 and Senior Audit Manager of PricewaterhouseCoopers LLP from 1998 to 2004. | | |
| David Berardi (Born 1975) | | Assistant Treasurer, since 2009 | | Vice President of Wells Fargo Funds Management, LLC since 2009. Vice President of Evergreen Investment Management Company, LLC from 2008 to 2010. Assistant Vice President of Evergreen Investment Services, Inc. from 2004 to 2008. Manager of Fund Reporting and Control for Evergreen Investment Management Company, LLC from 2004 to 2010. | | |
| 1 | Jeremy DePalma acts as Treasurer of 61 funds and Assistant Treasurer of 73 funds in the Fund Complex. |
| 2 | The Statement of Additional Information includes additional information about the Trustees and is available, without charge, upon request, by calling 1-800-222-8222 or by visiting the website at wellsfargoadvantagefunds.com. |
| | | | | | |
| List of abbreviations | | Wells Fargo Advantage Capital Growth Fund | | | 29 | |
The following is a list of common abbreviations for terms and entities that may have appeared in this report.
| ACA | — ACA Financial Guaranty Corporation |
| ADR | — American depositary receipt |
| ADS | — American depositary shares |
| AGC | — Assured Guaranty Corporation |
| AGM | — Assured Guaranty Municipal |
| Ambac | — Ambac Financial Group Incorporated |
| AMT | — Alternative minimum tax |
| BAN | — Bond anticipation notes |
| BHAC | — Berkshire Hathaway Assurance Corporation |
| CAB | — Capital appreciation bond |
| CCAB | — Convertible capital appreciation bond |
| CDA | — Community Development Authority |
| CDO | — Collateralized debt obligation |
| DRIVER | — Derivative inverse tax-exempt receipts |
| DW&P | — Department of Water & Power |
| DWR | — Department of Water Resources |
| ECFA | — Educational & Cultural Facilities Authority |
| EDA | — Economic Development Authority |
| EDFA | — Economic Development Finance Authority |
| ETF | — Exchange-traded fund |
| FDIC | — Federal Deposit Insurance Corporation |
| FFCB | — Federal Farm Credit Banks |
| FGIC | — Financial Guaranty Insurance Corporation |
| FHA | — Federal Housing Administration |
| FHLB | — Federal Home Loan Bank |
| FHLMC | — Federal Home Loan Mortgage Corporation |
| FICO | — The Financing Corporation |
| FNMA | — Federal National Mortgage Association |
| GDR | — Global depositary receipt |
| GNMA | — Government National Mortgage Association |
| HCFR | — Healthcare facilities revenue |
| HEFA | — Health & Educational Facilities Authority |
| HEFAR | — Higher education facilities authority revenue |
| HFA | — Housing Finance Authority |
| HFFA | — Health Facilities Financing Authority |
| HUD | — Department of Housing and Urban Development |
| IDA | — Industrial Development Authority |
| IDAG | — Industrial Development Agency |
| KRW | — Republic of Korea won |
| LIBOR | — London Interbank Offered Rate |
| LIFER | — Long Inverse Floating Exempt Receipts |
| LLC | — Limited liability company |
| LLLP | — Limited liability limited partnership |
| LLP | — Limited liability partnership |
| MBIA | — Municipal Bond Insurance Association |
| MFHR | — Multifamily housing revenue |
| MSTR | — Municipal securities trust receipts |
| MUD | — Municipal Utility District |
| National | — National Public Finance Guarantee Corporation |
| PCFA | — Pollution Control Financing Authority |
| PCL | — Public Company Limited |
| PCR | — Pollution control revenue |
| PFA | — Public Finance Authority |
| PFFA | — Public Facilities Financing Authority |
| PFOTER | — Puttable floating option tax-exempt receipts |
| plc | — Public limited company |
| PUTTER | — Puttable tax-exempt receipts |
| R&D | — Research & development |
| Radian | — Radian Asset Assurance |
| RAN | — Revenue anticipation notes |
| RDA | — Redevelopment Authority |
| RDFA | — Redevelopment Finance Authority |
| REIT | — Real estate investment trust |
| ROC | — Reset option certificates |
| SAVRS | — Select auction variable rate securities |
| SBA | — Small Business Authority |
| SFHR | — Single-family housing revenue |
| SFMR | — Single-family mortgage revenue |
| SPA | — Standby purchase agreement |
| SPDR | — Standard & Poor’s Depositary Receipts |
| SPEAR | — Short Puttable Exempt Adjustable Receipts |
| STRIPS | — Separate trading of registered interest and |
| TAN | — Tax anticipation notes |
| TIPS | — Treasury inflation-protected securities |
| TRAN | — Tax revenue anticipation notes |
| TTFA | — Transportation Trust Fund Authority |
| TVA | — Tennessee Valley Authority |
This page is intentionally left blank.
This page is intentionally left blank.
This page is intentionally left blank.


For more information
More information about Wells Fargo Advantage Funds is available free upon request. To obtain literature, please write, email, visit the Fund’s website, or call:
Wells Fargo Advantage Funds
P.O. Box 8266
Boston, MA 02266-8266
Email: wfaf@wellsfargo.com
Website: wellsfargoadvantagefunds.com
Individual investors: 1-800-222-8222
Retail investment professionals: 1-888-877-9275
Institutional investment professionals: 1-866-765-0778
This report and the financial statements contained herein are submitted for the general information of the shareholders of Wells Fargo Advantage Funds. If this report is used for promotional purposes, distribution of the report must be accompanied or preceded by a current prospectus. Before investing, please consider the investment objectives, risks, charges, and expenses of the investment. For a current prospectus and, if available, a summary prospectus, containing this information, call 1-800-222-8222 or visit the Fund’s website at wellsfargoadvantagefunds.com. Read the prospectus carefully before you invest or send money.
Wells Fargo Funds Management, LLC, a wholly owned subsidiary of Wells Fargo & Company, provides investment advisory and administrative services for Wells Fargo Advantage Funds. Other affiliates of Wells Fargo & Company provide subadvisory and other services for the Funds. The Funds are distributed by Wells Fargo Funds Distributor, LLC, Member FINRA/SIPC, an affiliate of Wells Fargo & Company.
NOT FDIC INSURED ¡ NO BANK GUARANTEE ¡ MAY LOSE VALUE
© 2015 Wells Fargo Funds Management, LLC. All rights reserved.
| | |
 | | 231596 03-15 SA200/SAR200 01-15 |

Wells Fargo Advantage Disciplined U.S. Core Fund

Semi-Annual Report
January 31, 2015

Reduce clutter. Save trees.
Sign up for electronic delivery of prospectuses and shareholder reports at wellsfargo.com/advantagedelivery
Contents
The views expressed and any forward-looking statements are as of January 31, 2015, unless otherwise noted, and are those of the Fund managers and/or Wells Fargo Funds Management, LLC. Discussions of individual securities, or the markets generally, or any Wells Fargo Advantage Fund are not intended as individual recommendations. Future events or results may vary significantly from those expressed in any forward-looking statements; the views expressed are subject to change at any time in response to changing circumstances in the market. Wells Fargo Funds Management, LLC and the Fund disclaim any obligation to publicly update or revise any views expressed or forward-looking statements.
NOT FDIC INSURED ¡ NO BANK GUARANTEE ¡ MAY LOSE VALUE
| | | | |
| 2 | | Wells Fargo Advantage Disciplined U.S. Core Fund | | Letter to shareholders (unaudited) |

Karla M. Rabusch
President
Wells Fargo Advantage Funds
As the U.S. churned forward, major economies elsewhere in the world faced significant ongoing challenges.
Dear Valued Shareholder:
We are pleased to offer you this semi-annual report for the Wells Fargo Advantage Disciplined U.S. Core Fund for the six-month period that ended January 31, 2015. Generally improving U.S. economic data helped drive a positive return for U.S. stocks for the reporting period (as measured by the S&P 500 Index1); in contrast, many economies and markets elsewhere in the world faced ongoing challenges.
Positive U.S. economic data, but increased tensions abroad, led to heightened volatility during the third quarter of 2014.
When the reporting period began on August 1, 2014, the U.S. stock market was experiencing a series of surges interrupted by bouts of volatility as interest-rate concerns in the U.S. and increased tensions abroad triggered heightened investor uncertainty. An escalating Russia/Ukraine situation and a growing perception that the U.S. Federal Reserve (Fed) would raise short-term interest rates sooner than expected caused investors to pull back near the end of July. As a result, the S&P 500 Index dropped into negative territory for July’s monthly return. However, August brought a bounce-back; the S&P 500 Index delivered its largest monthly gain since February 2014 on a string of positive economic news, led by an upwardly revised 4.2% estimate of second-quarter 2014 gross domestic product (GDP) growth. Then, in September, stock market volatility increased as positive economic data became overshadowed at times by growing discomfort over escalating tensions in Ukraine and the Middle East. Slowing growth in Europe and China also concerned investors. Ultimately, U.S. stocks ended the third quarter up slightly overall, buoyed largely by another upward revision of second-quarter GDP growth to 4.6%. Strong corporate earnings also contributed to market gains.
The fourth quarter of 2014 brought continued improvement in the U.S.; international economies remained challenged.
Strong fourth-quarter results by the U.S. stock market helped the S&P 500 Index deliver more than 50 record closes in 2014. The last several, in December, were spurred by investor optimism following Fed Chair Janet Yellen’s comment that the Fed would be patient in its timing of an interest-rate increase. U.S. stocks also were boosted by positive economic data. November’s 5.8% unemployment rate was down from 7.0% a year earlier, and the number of jobs being added continued to expand, keeping U.S. employers on pace to hire nearly three million workers during 2014. In addition, the U.S. economy’s third-quarter growth rate was revised upward during the quarter, to 5.0%—its fastest pace in 11 years. Meanwhile, U.S. companies continued to report strong earnings. The steadily brightening U.S. economy energized consumers, who were further buoyed by much lower prices at the gasoline pump. During the fourth quarter, gasoline prices fell to their lowest levels in five years, according to the American Automobile Association.
As the U.S. churned forward, major economies elsewhere in the world faced significant ongoing challenges. In China, where growth had been slowing for some time, government regulators in December announced changes being made in an effort to stimulate growth. In Japan, which slid back into recession in the third quarter of 2014, Prime Minister Abe gained approval in late December for roughly $29 billion in fresh stimulus to help the economy. In the eurozone, growth remained sluggish, and member countries continued to face an environment of low demand, high unemployment, and weak business investment. This situation
| 1 | The S&P 500 Index consists of 500 stocks chosen for market size, liquidity, and industry group representation. It is a market-value-weighted index with each stock’s weight in the index proportionate to its market value. You cannot invest directly in an index. |
| | | | | | |
| Letter to shareholders (unaudited) | | Wells Fargo Advantage Disciplined U.S. Core Fund | | | 3 | |
was exacerbated in December by renewed concerns about Greece after its parliament failed to avert a general election that could jeopardize the terms of the country’s financial agreement with its international creditors. In Russia, the economy contracted for the first time since October 2009 as the country struggled under the weight of slumping oil prices, international sanctions, and massive outflows of capital.
Market volatility increased in January 2015.
Markets fluctuated in January as investors reacted to geopolitical developments and new economic data. Mid-month, the World Bank lowered its outlook for global growth based on deepening problems in the eurozone and emerging markets, stating that a strengthening U.S. economy could not, by itself, support the global economy. Later in January, Greek voters gave control of their government to opposition party Syriza, which promised to end austerity and insisted that Greece’s massive debt be renegotiated. In the U.S., various data released in January, such as consumer confidence and December’s jobless rate, showed improvement. On the last trading day of the month, however, investors learned that fourth-quarter 2014 U.S. economic growth was estimated at 2.6%, which was below consensus and lower than the 4.6% and 5.0% growth rates, respectively, for the second and third quarters of 2014.
Don’t let short-term uncertainty derail long-term investment goals.
Periods of uncertainty can present challenges, but experience has taught us that maintaining long-term investment goals can be an effective way to plan for the future. To help you create a sound strategy based on your personal goals and risk tolerance, Wells Fargo Advantage Funds offers more than 100 mutual funds and other investments spanning a wide range of asset classes and investment styles. Although diversification cannot guarantee an investment profit or prevent losses, we believe it can be an effective way to manage investment risk and potentially smooth out overall portfolio performance. We encourage investors to know their investments and to understand that appropriate levels of risk-taking may unlock opportunities.
Thank you for choosing to invest with Wells Fargo Advantage Funds. We appreciate your confidence in us and remain committed to helping you meet your financial needs. For current information about your fund investments, contact your investment professional, visit our website at wellsfargoadvantagefunds.com, or call us directly at 1-800-222-8222. We are available 24 hours a day, 7 days a week.
Sincerely,

Karla M. Rabusch
President
Wells Fargo Advantage Funds
We encourage investors to know their investments and to understand that appropriate levels of risk-taking may unlock opportunities.
| | | | |
| 4 | | Wells Fargo Advantage Disciplined U.S. Core Fund | | Performance highlights (unaudited) |
Investment objective
The Fund seeks long-term capital appreciation.
Adviser
Wells Fargo Funds Management, LLC
Subadviser
Golden Capital Management, LLC
Portfolio manager
Greg Golden, CFA
Average annual total returns1 (%) as of January 31, 2015
| | | | | | | | | | | | | | | | | | | | | | | | | | | | | | | | | | |
| | | | | Including sales charge | | | Excluding sales charge | | | Expense ratios2 (%) | |
| | | Inception date | | 1 year | | | 5 year | | | 10 year | | | 1 year | | | 5 year | | | 10 year | | | Gross | | | Net3 | |
| Class A (EVSAX) | | 2-28-1990 | | | 9.71 | | | | 14.28 | | | | 7.28 | | | | 16.42 | | | | 15.65 | | | | 7.92 | | | | 0.93 | | | | 0.92 | |
| Class C (EVSTX) | | 6-30-1999 | | | 14.50 | | | | 14.78 | | | | 7.12 | | | | 15.50 | | | | 14.78 | | | | 7.12 | | | | 1.68 | | | | 1.67 | |
| Administrator Class (EVSYX) | | 2-21-1995 | | | – | | | | – | | | | – | | | | 16.54 | | | | 15.85 | | | | 8.15 | | | | 0.77 | | | | 0.74 | |
| Institutional Class (EVSIX) | | 7-30-2010 | | | – | | | | – | | | | – | | | | 16.86 | | | | 16.12 | | | | 8.28 | | | | 0.50 | | | | 0.48 | |
| S&P 500 Index4 | | – | | | – | | | | – | | | | – | | | | 14.22 | | | | 15.60 | | | | 7.61 | | | | – | | | | – | |
Figures quoted represent past performance, which is no guarantee of future results, and do not reflect taxes that a shareholder may pay on fund distributions or the redemption of fund shares. Investment return and principal value of an investment will fluctuate so that an investor’s shares, when redeemed, may be worth more or less than their original cost. Performance shown without sales charges would be lower if sales charges were reflected. Current performance may be lower or higher than the performance data quoted, which assumes the reinvestment of dividends and capital gains. Current month-end performance is available on the Fund’s website, wellsfargoadvantagefunds.com.
Index returns do not include transaction costs associated with buying and selling securities, any mutual fund fees or expenses, or any taxes. It is not possible to invest directly in an index.
For Class A shares, the maximum front-end sales charge is 5.75%. For Class C shares, the maximum contingent deferred sales charge is 1.00%. Performance including a contingent deferred sales charge assumes the sales charge for the corresponding time period. Administrator Class and Institutional Class shares are sold without a front-end sales charge or contingent deferred sales charge.
Stock values fluctuate in response to the activities of individual companies and general market and economic conditions. The use of derivatives may reduce returns and/or increase volatility. Consult the Fund’s prospectus for additional information on these and other risks.
Please see footnotes on page 5.
| | | | | | |
| Performance highlights (unaudited) | | Wells Fargo Advantage Disciplined U.S. Core Fund | | | 5 | |
| | | | |
| Ten largest equity holdings5 (%) as of January 31, 2015 | |
Apple Incorporated | | | 4.05 | |
Exxon Mobil Corporation | | | 2.42 | |
Johnson & Johnson | | | 2.23 | |
General Electric Company | | | 1.90 | |
Pfizer Incorporated | | | 1.83 | |
Gilead Sciences Incorporated | | | 1.67 | |
Chevron Corporation | | | 1.58 | |
The Home Depot Incorporated | | | 1.58 | |
The Walt Disney Company | | | 1.56 | |
Intel Corporation | | | 1.44 | |
|
| Sector distribution6 as of January 31, 2015 |
|
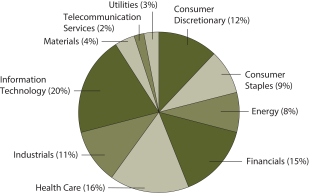 |
| 1 | Historical performance shown for Institutional Class shares prior to their inception reflects the performance of Administrator Class shares, and includes the higher expenses applicable to Administrator Class shares. If these expenses had not been included, returns would be higher. Historical performance shown for all classes of the Fund prior to July 19, 2010, is based on the performance of the Fund’s predecessor, Evergreen Enhanced S&P 500 Fund. |
| 2 | Reflects the expense ratios as stated in the most recent prospectuses. The expense ratios shown are subject to change and may differ from the annualized expense ratios shown in the financial highlights of this report. |
| 3 | The Adviser has committed through November 30, 2015, to waive fees and/or reimburse expenses to the extent necessary to cap the Fund’s Total Annual Fund Operating Expenses After Fee Waiver, excluding certain expenses, at the amounts shown. After this time, the cap may be increased or the commitment to maintain the cap may be terminated only with the approval of the Board of Trustees. Brokerage commissions, stamp duty fees, interest, taxes, acquired fund fees and expenses, and extraordinary expenses are excluded from the cap. Without this cap, the Fund’s returns would have been lower. |
| 4 | The S&P 500 Index consists of 500 stocks chosen for market size, liquidity, and industry group representation. It is a market-value weighted index with each stock’s weight in the index proportionate to its market value. You cannot invest directly in an index. |
| 5 | The ten largest equity holdings are calculated based on the value of the securities divided by total net assets of the Fund. Holdings are subject to change and may have changed since the date specified. |
| 6 | Amounts are calculated based on the total long-term investments of the Fund. These percentages are subject to change and may have changed since the date specified. |
| | | | |
| 6 | | Wells Fargo Advantage Disciplined U.S. Core Fund | | Fund expenses (unaudited) |
As a shareholder of the Fund, you incur two types of costs: (1) transaction costs, including sales charges (loads) on purchase payments and contingent deferred sales charges (if any) on redemptions and (2) ongoing costs, including management fees, distribution (12b-1) and/or shareholder service fees, and other Fund expenses. This example is intended to help you understand your ongoing costs (in dollars) of investing in the Fund and to compare these costs with the ongoing costs of investing in other mutual funds.
The example is based on an investment of $1,000 invested at the beginning of the six-month period and held for the entire period from August 1, 2014 to January 31, 2015.
Actual expenses
The “Actual” line of the table below provides information about actual account values and actual expenses. You may use the information in this line, together with the amount you invested, to estimate the expenses that you paid over the period. Simply divide your account value by $1,000 (for example, an $8,600 account value divided by $1,000 = 8.6), then multiply the result by the number in the “Actual” line under the heading entitled “Expenses paid during period” for your applicable class of shares to estimate the expenses you paid on your account during this period.
Hypothetical example for comparison purposes
The “Hypothetical” line of the table below provides information about hypothetical account values and hypothetical expenses based on the Fund’s actual expense ratio and an assumed rate of return of 5% per year before expenses, which is not the Fund’s actual return. The hypothetical account values and expenses may not be used to estimate the actual ending account balance or expenses you paid for the period. You may use this information to compare the ongoing costs of investing in the Fund and other funds. To do so, compare this 5% hypothetical example with the 5% hypothetical examples that appear in the shareholder reports of the other funds.
Please note that the expenses shown in the table are meant to highlight your ongoing costs only and do not reflect any transactional costs, such as sales charges (loads) and contingent deferred sales charges. Therefore, the “Hypothetical” line of the table is useful in comparing ongoing costs only and will not help you determine the relative total costs of owning different funds. In addition, if these transactional costs were included, your costs would have been higher.
| | | | | | | | | | | | | | | | |
| | | Beginning account value 8-1-2014 | | | Ending account value 1-31-2015 | | | Expenses paid during the period¹ | | | Net annualized expense ratio | |
Class A | | | | | | | | | | | | | | | | |
Actual | | $ | 1,000.00 | | | $ | 1,052.68 | | | $ | 4.71 | | | | 0.91 | % |
Hypothetical (5% return before expenses) | | $ | 1,000.00 | | | $ | 1,020.62 | | | $ | 4.63 | | | | 0.91 | % |
Class C | | | | | | | | | | | | | | | | |
Actual | | $ | 1,000.00 | | | $ | 1,048.94 | | | $ | 8.57 | | | | 1.66 | % |
Hypothetical (5% return before expenses) | | $ | 1,000.00 | | | $ | 1,016.84 | | | $ | 8.44 | | | | 1.66 | % |
Administrator Class | | | | | | | | | | | | | | | | |
Actual | | $ | 1,000.00 | | | $ | 1,053.78 | | | $ | 3.83 | | | | 0.74 | % |
Hypothetical (5% return before expenses) | | $ | 1,000.00 | | | $ | 1,021.48 | | | $ | 3.77 | | | | 0.74 | % |
Institutional Class | | | | | | | | | | | | | | | | |
Actual | | $ | 1,000.00 | | | $ | 1,055.10 | | | $ | 2.49 | | | | 0.48 | % |
Hypothetical (5% return before expenses) | | $ | 1,000.00 | | | $ | 1,022.79 | | | $ | 2.45 | | | | 0.48 | % |
| 1 | Expenses paid is equal to the annualized expense ratio of each class multiplied by the average account value over the period, multiplied by the number of days in the most recent fiscal half-year divided by the number of days in the fiscal year (to reflect the one-half-year period). |
| | | | | | |
| Portfolio of investments—January 31, 2015 (unaudited) | | Wells Fargo Advantage Disciplined U.S. Core Fund | | | 7 | |
| | | | | | | | | | | | |
| Security name | | | | | | Shares | | | Value | |
| | | | | | | | | | | | |
| | | | |
Common Stocks: 98.54% | | | | | | | | | | | | |
| | | | |
Consumer Discretionary: 11.39% | | | | | | | | | | | | |
| | | | |
| Automobiles: 1.65% | | | | | | | | | | | | |
Ford Motor Company | | | | | | | 270,286 | | | $ | 3,975,907 | |
General Motors Company | | | | | | | 122,131 | | | | 3,983,913 | |
| | | | |
| | | | | | | | | | | 7,959,820 | |
| | | | | | | | | | | | |
| | | | |
| Diversified Consumer Services: 0.35% | | | | | | | | | | | | |
H&R Block Incorporated | | | | | | | 49,071 | | | | 1,682,154 | |
| | | | | | | | | | | | |
| | | | |
| Hotels, Restaurants & Leisure: 1.31% | | | | | | | | | | | | |
Chipotle Mexican Grill Incorporated † | | | | | | | 6,251 | | | | 4,437,210 | |
Starbucks Corporation | | | | | | | 21,868 | | | | 1,914,106 | |
| | | | |
| | | | | | | | | | | 6,351,316 | |
| | | | | | | | | | | | |
| | | | |
| Household Durables: 0.45% | | | | | | | | | | | | |
Pulte Homes Incorporated | | | | | | | 106,712 | | | | 2,197,200 | |
| | | | | | | | | | | | |
| | | | |
| Internet & Catalog Retail: 0.37% | | | | | | | | | | | | |
Expedia Incorporated | | | | | | | 14,726 | | | | 1,265,405 | |
The Priceline Group Incorporated † | | | | | | | 514 | | | | 518,873 | |
| | | | |
| | | | | | | | | | | 1,784,278 | |
| | | | | | | | | | | | |
| | | | |
| Media: 3.13% | | | | | | | | | | | | |
Comcast Corporation Class A | | | | | | | 123,219 | | | | 6,548,474 | |
DIRECTV Group Incorporated † | | | | | | | 12,357 | | | | 1,053,805 | |
The Walt Disney Company | | | | | | | 83,017 | | | | 7,551,226 | |
| | | | |
| | | | | | | | | | | 15,153,505 | |
| | | | | | | | | | | | |
| | | | |
| Multiline Retail: 1.31% | | | | | | | | | | | | |
Dollar General Corporation † | | | | | | | 37,936 | | | | 2,543,988 | |
Macy’s Incorporated | | | | | | | 30,973 | | | | 1,978,555 | |
Target Corporation | | | | | | | 24,401 | | | | 1,796,158 | |
| | | | |
| | | | | | | | | | | 6,318,701 | |
| | | | | | | | | | | | |
| | | | |
| Specialty Retail: 2.82% | | | | | | | | | | | | |
Best Buy Company Incorporated | | | | | | | 50,294 | | | | 1,770,349 | |
Lowe’s Companies Incorporated | | | | | | | 62,787 | | | | 4,254,447 | |
The Home Depot Incorporated | | | | | | | 72,985 | | | | 7,621,094 | |
| | | | |
| | | | | | | | | | | 13,645,890 | |
| | | | | | | | | | | | |
| | | | |
Consumer Staples: 9.28% | | | | | | | | | | | | |
| | | | |
| Beverages: 2.28% | | | | | | | | | | | | |
Constellation Brands Incorporated Class A † | | | | | | | 20,964 | | | | 2,315,474 | |
Dr Pepper Snapple Group Incorporated | | | | | | | 50,624 | | | | 3,911,716 | |
PepsiCo Incorporated | | | | | | | 45,448 | | | | 4,262,113 | |
The Coca-Cola Company | | | | | | | 13,035 | | | | 536,651 | |
| | | | |
| | | | | | | | | | | 11,025,954 | |
| | | | | | | | | | | | |
The accompanying notes are an integral part of these financial statements.
| | | | |
| 8 | | Wells Fargo Advantage Disciplined U.S. Core Fund | | Portfolio of investments—January 31, 2015 (unaudited) |
| | | | | | | | | | | | |
| Security name | | | | | | Shares | | | Value | |
| | | | | | | | | | | | |
| | | | |
| Food & Staples Retailing: 3.40% | | | | | | | | | | | | |
CVS Health Corporation | | | | | | | 68,527 | | | $ | 6,726,610 | |
Sysco Corporation | | | | | | | 37,732 | | | | 1,477,962 | |
The Kroger Company | | | | | | | 18,372 | | | | 1,268,587 | |
Wal-Mart Stores Incorporated | | | | | | | 58,385 | | | | 4,961,557 | |
Walgreens Boots Alliance Incorporated | | | | | | | 26,953 | | | | 1,987,784 | |
| | | | |
| | | | | | | | | | | 16,422,500 | |
| | | | | | | | | | | | |
| | | | |
| Food Products: 0.83% | | | | | | | | | | | | |
Archer Daniels Midland Company | | | | | | | 85,830 | | | | 4,002,253 | |
| | | | | | | | | | | | |
| | | | |
| Household Products: 1.11% | | | | | | | | | | | | |
Clorox Company | | | | | | | 8,646 | | | | 922,615 | |
Kimberly-Clark Corporation | | | | | | | 15,203 | | | | 1,641,316 | |
The Procter & Gamble Company | | | | | | | 33,367 | | | | 2,812,504 | |
| | | | |
| | | | | | | | | | | 5,376,435 | |
| | | | | | | | | | | | |
| | | | |
| Tobacco: 1.66% | | | | | | | | | | | | |
Altria Group Incorporated | | | | | | | 126,684 | | | | 6,726,920 | |
Philip Morris International | | | | | | | 16,101 | | | | 1,291,944 | |
| | | | |
| | | | | | | | | | | 8,018,864 | |
| | | | | | | | | | | | |
| | | | |
Energy: 7.39% | | | | | | | | | | | | |
| | | | |
| Energy Equipment & Services: 0.28% | | | | | | | | | | | | |
Nabors Industries Limited | | | | | | | 91,482 | | | | 1,052,958 | |
National Oilwell Varco Incorporated | | | | | | | 5,220 | | | | 284,125 | |
| | | | |
| | | | | | | | | | | 1,337,083 | |
| | | | | | | | | | | | |
| | | | |
| Oil, Gas & Consumable Fuels: 7.11% | | | | | | | | | | | | |
Chevron Corporation | | | | | | | 74,550 | | | | 7,643,612 | |
ConocoPhillips Company | | | | | | | 58,651 | | | | 3,693,840 | |
Devon Energy Corporation | | | | | | | 16,174 | | | | 974,807 | |
EOG Resources Incorporated | | | | | | | 32,619 | | | | 2,904,070 | |
Exxon Mobil Corporation | | | | | | | 133,720 | | | | 11,689,802 | |
Kinder Morgan Incorporated | | | | | | | 23,903 | | | | 981,218 | |
Tesoro Corporation | | | | | | | 50,541 | | | | 4,130,716 | |
Valero Energy Corporation | | | | | | | 45,133 | | | | 2,386,633 | |
| | | | |
| | | | | | | | | | | 34,404,698 | |
| | | | | | | | | | | | |
| | | | |
Financials: 14.96% | | | | | | | | | | | | |
| | | | |
| Banks: 4.27% | | | | | | | | | | | | |
Bank of America Corporation | | | | | | | 208,306 | | | | 3,155,836 | |
Citigroup Incorporated | | | | | | | 143,417 | | | | 6,733,428 | |
Huntington Bancshares Incorporated | | | | | | | 127,548 | | | | 1,278,031 | |
JPMorgan Chase & Company | | | | | | | 90,379 | | | | 4,914,810 | |
PNC Financial Services Group Incorporated | | | | | | | 24,396 | | | | 2,062,438 | |
SunTrust Banks Incorporated | | | | | | | 64,796 | | | | 2,489,462 | |
| | | | |
| | | | | | | | | | | 20,634,005 | |
| | | | | | | | | | | | |
The accompanying notes are an integral part of these financial statements.
| | | | | | |
| Portfolio of investments—January 31, 2015 (unaudited) | | Wells Fargo Advantage Disciplined U.S. Core Fund | | | 9 | |
| | | | | | | | | | | | |
| Security name | | | | | | Shares | | | Value | |
| | | | | | | | | | | | |
| | | | |
| Capital Markets: 2.76% | | | | | | | | | | | | |
Ameriprise Financial Incorporated | | | | | | | 7,581 | | | $ | 947,170 | |
BlackRock Incorporated | | | | | | | 4,201 | | | | 1,430,483 | |
Goldman Sachs Group Incorporated | | | | | | | 27,122 | | | | 4,676,104 | |
Morgan Stanley | | | | | | | 134,850 | | | | 4,559,279 | |
T. Rowe Price Group Incorporated | | | | | | | 22,216 | | | | 1,748,844 | |
| | | | |
| | | | | | | | | | | 13,361,880 | |
| | | | | | | | | | | | |
| | | | |
| Consumer Finance: 0.33% | | | | | | | | | | | | |
Capital One Financial Corporation | | | | | | | 21,674 | | | | 1,586,754 | |
| | | | | | | | | | | | |
| | | | |
| Diversified Financial Services: 0.95% | | | | | | | | | | | | |
Berkshire Hathaway Incorporated Class B † | | | | | | | 31,933 | | | | 4,595,478 | |
| | | | | | | | | | | | |
| | | | |
| Insurance: 2.68% | | | | | | | | | | | | |
ACE Limited | | | | | | | 17,926 | | | | 1,935,291 | |
American Financial Group Incorporated | | | | | | | 22,022 | | | | 1,278,157 | |
American International Group Incorporated | | | | | | | 52,992 | | | | 2,589,719 | |
Assurant Incorporated | | | | | | | 30,124 | | | | 1,913,175 | |
The Hartford Financial Services Group Incorporated | | | | | | | 102,725 | | | | 3,996,003 | |
The Travelers Companies Incorporated | | | | | | | 12,081 | | | | 1,242,168 | |
| | | | |
| | | | | | | | | | | 12,954,513 | |
| | | | | | | | | | | | |
| | | | |
| Real Estate Management & Development: 0.09% | | | | | | | | | | | | |
CBRE Group Incorporated † | | | | | | | 13,397 | | | | 433,259 | |
| | | | | | | | | | | | |
| | | | |
| REITs: 3.88% | | | | | | | | | | | | |
American Tower Corporation | | | | | | | 42,350 | | | | 4,105,833 | |
AvalonBay Communities Incorporated | | | | | | | 20,954 | | | | 3,624,832 | |
Crown Castle International Corporation | | | | | | | 19,541 | | | | 1,690,492 | |
General Growth Properties Incorporated | | | | | | | 138,195 | | | | 4,170,725 | |
Host Hotels & Resorts Incorporated | | | | | | | 32,933 | | | | 753,836 | |
Simon Property Group Incorporated | | | | | | | 22,175 | | | | 4,405,286 | |
| | | | |
| | | | | | | | | | | 18,751,004 | |
| | | | | | | | | | | | |
| | | | |
Health Care: 15.52% | | | | | | | | | | | | |
| | | | |
| Biotechnology: 3.30% | | | | | | | | | | | | |
Amgen Incorporated | | | | | | | 37,791 | | | | 5,754,058 | |
Biogen Idec Incorporated † | | | | | | | 5,478 | | | | 2,131,818 | |
Gilead Sciences Incorporated † | | | | | | | 77,088 | | | | 8,081,135 | |
| | | | |
| | | | | | | | | | | 15,967,011 | |
| | | | | | | | | | | | |
| | | | |
| Health Care Equipment & Supplies: 2.51% | | | | | | | | | | | | |
Boston Scientific Corporation † | | | | | | | 184,507 | | | | 2,732,549 | |
DexCom Incorporated † | | | | | | | 58,104 | | | | 3,473,457 | |
Medtronic plc | | | | | | | 83,306 | | | | 5,948,081 | |
| | | | |
| | | | | | | | | | | 12,154,087 | |
| | | | | | | | | | | | |
The accompanying notes are an integral part of these financial statements.
| | | | |
| 10 | | Wells Fargo Advantage Disciplined U.S. Core Fund | | Portfolio of investments—January 31, 2015 (unaudited) |
| | | | | | | | | | | | |
| Security name | | | | | | Shares | | | Value | |
| | | | | | | | | | | | |
| | | | |
| Health Care Providers & Services: 2.66% | | | | | | | | | | | | |
Aetna Incorporated | | | | | | | 45,398 | | | $ | 4,168,444 | |
AmerisourceBergen Corporation | | | | | | | 46,403 | | | | 4,410,605 | |
Humana Incorporated | | | | | | | 7,377 | | | | 1,080,288 | |
McKesson Corporation | | | | | | | 4,949 | | | | 1,052,405 | |
UnitedHealth Group Incorporated | | | | | | | 20,069 | | | | 2,132,331 | |
| | | | |
| | | | | | | | | | | 12,844,073 | |
| | | | | | | | | | | | |
| | | | |
| Life Sciences Tools & Services: 0.16% | | | | | | | | | | | | |
Thermo Fisher Scientific Incorporated | | | | | | | 6,059 | | | | 758,647 | |
| | | | | | | | | | | | |
| | | | |
| Pharmaceuticals: 6.89% | | | | | | | | | | | | |
AbbVie Incorporated | | | | | | | 86,912 | | | | 5,245,139 | |
Bristol-Myers Squibb Company | | | | | | | 31,336 | | | | 1,888,621 | |
Eli Lilly & Company | | | | | | | 34,199 | | | | 2,462,328 | |
Johnson & Johnson | | | | | | | 107,794 | | | | 10,794,491 | |
Merck & Company Incorporated | | | | | | | 67,069 | | | | 4,042,919 | |
Pfizer Incorporated | | | | | | | 283,833 | | | | 8,869,781 | |
| | | | |
| | | | | | | | | | | 33,303,279 | |
| | | | | | | | | | | | |
| | | | |
Industrials: 11.23% | | | | | | | | | | | | |
| | | | |
| Aerospace & Defense: 3.94% | | | | | | | | | | | | |
General Dynamics Corporation | | | | | | | 34,554 | | | | 4,602,938 | |
L-3 Communications Holdings Incorporated | | | | | | | 32,104 | | | | 3,952,644 | |
Lockheed Martin Corporation | | | | | | | 25,495 | | | | 4,802,493 | |
The Boeing Company | | | | | | | 39,316 | | | | 5,715,367 | |
| | | | |
| | | | | | | | | | | 19,073,442 | |
| | | | | | | | | | | | |
| | | | |
| Airlines: 1.01% | | | | | | | | | | | | |
Southwest Airlines Company | | | | | | | 107,698 | | | | 4,865,796 | |
| | | | | | | | | | | | |
| | | | |
| Building Products: 0.23% | | | | | | | | | | | | |
Allegion plc | | | | | | | 20,722 | | | | 1,119,195 | |
| | | | | | | | | | | | |
| | | | |
| Commercial Services & Supplies: 0.59% | | | | | | | | | | | | |
RR Donnelley & Sons Company | | | | | | | 94,569 | | | | 1,557,551 | |
The ADT Corporation | | | | | | | 36,955 | | | | 1,271,252 | |
| | | | |
| | | | | | | | | | | 2,828,803 | |
| | | | | | | | | | | | |
| | | | |
| Industrial Conglomerates: 2.13% | | | | | | | | | | | | |
3M Company | | | | | | | 6,863 | | | | 1,113,865 | |
General Electric Company | | | | | | | 383,958 | | | | 9,172,757 | |
| | | | |
| | | | | | | | | | | 10,286,622 | |
| | | | | | | | | | | | |
| | | | |
| Machinery: 1.54% | | | | | | | | | | | | |
Caterpillar Incorporated | | | | | | | 47,843 | | | | 3,826,005 | |
Snap-on Incorporated | | | | | | | 27,278 | | | | 3,620,063 | |
| | | | |
| | | | | | | | | | | 7,446,068 | |
| | | | | | | | | | | | |
The accompanying notes are an integral part of these financial statements.
| | | | | | |
| Portfolio of investments—January 31, 2015 (unaudited) | | Wells Fargo Advantage Disciplined U.S. Core Fund | | | 11 | |
| | | | | | | | | | | | |
| Security name | | | | | | Shares | | | Value | |
| | | | | | | | | | | | |
| | | | |
| Road & Rail: 1.79% | | | | | | | | | | | | |
CSX Corporation | | | | | | | 62,098 | | | $ | 2,067,863 | |
Union Pacific Corporation | | | | | | | 56,315 | | | | 6,600,681 | |
| | | | |
| | | | | | | | | | | 8,668,544 | |
| | | | | | | | | | | | |
| | | | |
Information Technology: 19.71% | | | | | | | | | | | | |
| | | | |
| Communications Equipment: 2.81% | | | | | | | | | | | | |
Cisco Systems Incorporated | | | | | | | 244,855 | | | | 6,455,602 | |
F5 Networks Incorporated † | | | | | | | 17,184 | | | | 1,918,078 | |
QUALCOMM Incorporated | | | | | | | 83,714 | | | | 5,228,776 | |
| | | | |
| | | | | | | | | | | 13,602,456 | |
| | | | | | | | | | | | |
| | | | |
| Electronic Equipment, Instruments & Components: 0.95% | | | | | | | | | | | | |
Corning Incorporated | | | | | | | 192,509 | | | | 4,575,939 | |
| | | | | | | | | | | | |
| | | | |
| Internet Software & Services: 2.04% | | | | | | | | | | | | |
Facebook Incorporated Class A † | | | | | | | 64,300 | | | | 4,881,013 | |
Google Incorporated Class A † | | | | | | | 7,145 | | | | 3,840,795 | |
Google Incorporated Class C † | | | | | | | 2,133 | | | | 1,140,131 | |
| | | | |
| | | | | | | | | | | 9,861,939 | |
| | | | | | | | | | | | |
| | | | |
| IT Services: 2.03% | | | | | | | | | | | | |
International Business Machines Corporation | | | | | | | 13,608 | | | | 2,086,242 | |
MasterCard Incorporated Class A | | | | | | | 19,768 | | | | 1,621,569 | |
Paychex Incorporated | | | | | | | 5,054 | | | | 228,744 | |
Western Union Company | | | | | | | 128,172 | | | | 2,178,924 | |
Xerox Corporation | | | | | | | 282,026 | | | | 3,714,282 | |
| | | | |
| | | | | | | | | | | 9,829,761 | |
| | | | | | | | | | | | |
| | | | |
| Semiconductors & Semiconductor Equipment: 3.30% | | | | | | | | | | | | |
Intel Corporation | | | | | | | 211,336 | | | | 6,982,541 | |
Micron Technology Incorporated † | | | | | | | 128,540 | | | | 3,761,723 | |
Texas Instruments Incorporated | | | | | | | 97,279 | | | | 5,199,563 | |
| | | | |
| | | | | | | | | | | 15,943,827 | |
| | | | | | | | | | | | |
| | | | |
| Software: 3.60% | | | | | | | | | | | | |
CA Incorporated | | | | | | | 60,688 | | | | 1,838,846 | |
Intuit Incorporated | | | | | | | 43,806 | | | | 3,803,237 | |
Microsoft Corporation | | | | | | | 139,068 | | | | 5,618,347 | |
Oracle Corporation | | | | | | | 146,599 | | | | 6,141,032 | |
| | | | |
| | | | | | | | | | | 17,401,462 | |
| | | | | | | | | | | | |
| | | | |
| Technology Hardware, Storage & Peripherals: 4.98% | | | | | | | | | | | | |
Apple Incorporated | | | | | | | 167,165 | | | | 19,585,051 | |
EMC Corporation | | | | | | | 35,036 | | | | 908,483 | |
Hewlett-Packard Company | | | | | | | 58,233 | | | | 2,103,958 | |
SanDisk Corporation | | | | | | | 19,266 | | | | 1,462,482 | |
| | | | |
| | | | | | | | | | | 24,059,974 | |
| | | | | | | | | | | | |
The accompanying notes are an integral part of these financial statements.
| | | | |
| 12 | | Wells Fargo Advantage Disciplined U.S. Core Fund | | Portfolio of investments—January 31, 2015 (unaudited) |
| | | | | | | | | | | | | | |
| Security name | | | | | | | Shares | | | Value | |
| | | | | | | | | | | | | | |
| | | | |
Materials: 3.39% | | | | | | | | | | | | | | |
| | | | |
| Chemicals: 2.20% | | | | | | | | | | | | | | |
Air Products & Chemicals Incorporated | | | | | | | | | 12,031 | | | $ | 1,751,834 | |
Dow Chemical Company | | | | | | | | | 91,771 | | | | 4,144,378 | |
LyondellBasell Industries NV Class A | | | | | | | | | 47,850 | | | | 3,784,457 | |
The Sherwin-Williams Company | | | | | | | | | 3,560 | | | | 965,721 | |
| | | | |
| | | | | | | | | | | | | 10,646,390 | |
| | | | | | | | | | | | | | |
| | | | |
| Containers & Packaging: 0.10% | | | | | | | | | | | | | | |
Avery Dennison Corporation | | | | | | | | | 9,663 | | | | 505,085 | |
| | | | | | | | | | | | | | |
| | | | |
| Metals & Mining: 1.09% | | | | | | | | | | | | | | |
Alcoa Incorporated | | | | | | | | | 270,402 | | | | 4,231,791 | |
Freeport-McMoRan Copper & Gold Incorporated Class B | | | | | | | | | 61,050 | | | | 1,026,251 | |
| | | | |
| | | | | | | | | | | | | 5,258,042 | |
| | | | | | | | | | | | | | |
| | | | |
Telecommunication Services: 2.33% | | | | | | | | | | | | | | |
| | | | |
| Diversified Telecommunication Services: 2.33% | | | | | | | | | | | | | | |
AT&T Incorporated | | | | | | | | | 173,948 | | | | 5,726,368 | |
Verizon Communications Incorporated | | | | | | | | | 121,414 | | | | 5,549,834 | |
| | | | |
| | | | | | | | | | | | | 11,276,202 | |
| | | | | | | | | | | | | | |
| | | | |
Utilities: 3.34% | | | | | | | | | | | | | | |
| | | | |
| Electric Utilities: 2.05% | | | | | | | | | | | | | | |
Edison International | | | | | | | | | 65,367 | | | | 4,454,761 | |
Entergy Corporation | | | | | | | | | 39,403 | | | | 3,448,157 | |
Exelon Corporation | | | | | | | | | 56,095 | | | | 2,021,664 | |
| | | | |
| | | | | | | | | | | | | 9,924,582 | |
| | | | | | | | | | | | | | |
| | | | |
| Multi-Utilities: 1.29% | | | | | | | | | | | | | | |
CMS Energy Corporation | | | | | | | | | 74,844 | | | | 2,823,867 | |
Public Service Enterprise Group Incorporated | | | | | | | | | 79,857 | | | | 3,408,297 | |
| | | | |
| | | | | | | | | | | | | 6,232,164 | |
| | | | | | | | | | | | | | |
| | | | |
Total Common Stocks (Cost $330,690,283) | | | | | | | | | | | | | 476,430,934 | |
| | | | | | | | | | | | | | |
| | | | |
| | | Yield | | | | | | | | | |
| Short-Term Investments: 2.78% | | | | | | | | | | | | | | |
| | | | |
| Investment Companies: 2.78% | | | | | | | | | | | | | | |
Wells Fargo Advantage Cash Investment Money Market Fund, Select Class (l)(u) | | | 0.10 | % | | | | | 13,416,501 | | | | 13,416,501 | |
| | | | | | | | | | | | | | |
| | | | |
Total Short-Term Investments (Cost $13,416,501) | | | | | | | | | | | | | 13,416,501 | |
| | | | | | | | | | | | | | |
| | | | | | | | |
| Total investments in securities (Cost $344,106,784) * | | | 101.32 | % | | | 489,847,435 | |
Other assets and liabilities, net | | | (1.32 | ) | | | (6,381,522 | ) |
| | | | | | | | |
| Total net assets | | | 100.00 | % | | $ | 483,465,913 | |
| | | | | | | | |
The accompanying notes are an integral part of these financial statements.
| | | | | | |
| Portfolio of investments—January 31, 2015 (unaudited) | | Wells Fargo Advantage Disciplined U.S. Core Fund | | | 13 | |
| † | Non-income-earning security |
| (l) | The security represents an affiliate of the Fund as defined in the Investment Company Act of 1940. |
| (u) | The rate represents the 7-day annualized yield at period end. |
| * | Cost for federal income tax purposes is $345,235,822 and unrealized gains (losses) consists of: |
| | | | |
Gross unrealized gains | | $ | 151,142,366 | |
Gross unrealized losses | | | (6,530,753 | ) |
| | | | |
Net unrealized gains | | $ | 144,611,613 | |
The accompanying notes are an integral part of these financial statements.
| | | | |
| 14 | | Wells Fargo Advantage Disciplined U.S. Core Fund | | Statement of assets and liabilities—January 31, 2015 (unaudited) |
| | | | |
| | | | |
| |
Assets | | | | |
Investments | | | | |
In unaffiliated securities, at value (cost $330,690,283) | | $ | 476,430,934 | |
In affiliated securities, at value (cost $13,416,501) | | | 13,416,501 | |
| | | | |
Total investments, at value (cost $344,106,784) | | | 489,847,435 | |
Receivable for Fund shares sold | | | 847,777 | |
Receivable for dividends | | | 562,181 | |
Receivable for securities lending income | | | 6,203 | |
Prepaid expenses and other assets | | | 158,044 | |
| | | | |
Total assets | | | 491,421,640 | |
| | | | |
| |
Liabilities | | | | |
Payable for investments purchased | | | 5,142,457 | |
Payable for Fund shares redeemed | | | 2,183,449 | |
Advisory fee payable | | | 128,065 | |
Distribution fee payable | | | 8,185 | |
Administration fees payable | | | 109,134 | |
Accrued expenses and other liabilities | | | 384,437 | |
| | | | |
Total liabilities | | | 7,955,727 | |
| | | | |
Total net assets | | $ | 483,465,913 | |
| | | | |
| |
NET ASSETS CONSIST OF | | | | |
Paid-in capital | | $ | 309,378,216 | |
Undistributed net investment income | | | 3,280,334 | |
Accumulated net realized gains on investments | | | 25,066,712 | |
Net unrealized gains on investments | | | 145,740,651 | |
| | | | |
Total net assets | | $ | 483,465,913 | |
| | | | |
| |
COMPUTATION OF NET ASSET VALUE AND OFFERING PRICE PER SHARE | | | | |
Net assets – Class A | | $ | 314,022,893 | |
Shares outstanding – Class A1 | | | 21,624,287 | |
Net asset value per share – Class A | | | $14.52 | |
Maximum offering price per share – Class A2 | | | $15.41 | |
Net assets – Class C | | $ | 16,308,256 | |
Shares outstanding – Class C1 | | | 1,192,020 | |
Net asset value per share – Class C | | | $13.68 | |
Net assets – Administrator Class | | $ | 53,138,085 | |
Shares outstanding – Administrator Class1 | | | 3,579,961 | |
Net asset value per share – Administrator Class | | | $14.84 | |
Net assets – Institutional Class | | $ | 99,996,679 | |
Shares outstanding – Institutional Class1 | | | 6,809,839 | |
Net asset value per share – Institutional Class | | | $14.68 | |
| 1 | The Fund has an unlimited number of authorized shares. |
| 2 | Maximum offering price is computed as 100/94.25 of net asset value. On investments of $50,000 or more, the offering price is reduced. |
The accompanying notes are an integral part of these financial statements.
| | | | | | |
| Statement of operations—six months ended January 31, 2015 (unaudited) | | Wells Fargo Advantage Disciplined U.S. Core Fund | | | 15 | |
| | | | |
| | | | |
| |
Investment income | | | | |
Dividends | | $ | 5,305,236 | |
Securities lending income, net | | | 27,626 | |
Income from affiliated securities | | | 2,626 | |
| | | | |
Total investment income | | | 5,335,488 | |
| | | | |
| |
Expenses | | | | |
Advisory fee | | | 730,437 | |
Administration fees | | | | |
Fund level | | | 121,739 | |
Class A | | | 416,286 | |
Class C | | | 16,542 | |
Administrator Class | | | 26,566 | |
Institutional Class | | | 40,353 | |
Shareholder servicing fees | | | | |
Class A | | | 400,276 | |
Class C | | | 15,906 | |
Administrator Class | | | 66,414 | |
Distribution fee | | | | |
Class C | | | 47,719 | |
Custody and accounting fees | | | 13,424 | |
Professional fees | | | 26,723 | |
Registration fees | | | 26,276 | |
Shareholder report expenses | | | 26,031 | |
Trustees’ fees and expenses | | | 5,010 | |
Other fees and expenses | | | 16,624 | |
| | | | |
Total expenses | | | 1,996,326 | |
Less: Fee waivers and/or expense reimbursements | | | (1,961 | ) |
| | | | |
Net expenses | | | 1,994,365 | |
| | | | |
Net investment income | | | 3,341,123 | |
| | | | |
| |
REALIZED AND UNREALIZED GAINS (LOSSES) ON INVESTMENTS | | | | |
Net realized gains on investments | | | 26,095,620 | |
Net change in unrealized gains (losses) on investments | | | (4,953,793 | ) |
| | | | |
Net realized and unrealized gains (losses) on investments | | | 21,141,827 | |
| | | | |
Net increase in net assets resulting from operations | | $ | 24,482,950 | |
| | | | |
The accompanying notes are an integral part of these financial statements.
| | | | |
| 16 | | Wells Fargo Advantage Disciplined U.S. Core Fund | | Statement of changes in net assets |
| | | | | | | | | | | | | | | | |
| | | Six months ended
January 31, 2015
(unaudited) | | | Year ended
July 31, 2014 | |
| | | | |
Operations | | | | | | | | | | | | | | | | |
Net investment income | | | | | | $ | 3,341,123 | | | | | | | $ | 5,821,768 | |
Net realized gains on investments | | | | | | | 26,095,620 | | | | | | | | 71,674,199 | |
Net change in unrealized gains (losses) on investments | | | | | | | (4,953,793 | ) | | | | | | | (9,441,808 | ) |
| | | | |
Net increase in net assets resulting from operations | | | | | | | 24,482,950 | | | | | | | | 68,054,159 | |
| | | | |
| | | | |
Distributions to shareholders from | | | | | | | | | | | | | | | | |
Net investment income | | | | | | | | | | | | | | | | |
Class A | | | | | | | (3,522,119 | ) | | | | | | | (4,752,589 | ) |
Class C | | | | | | | (84,291 | ) | | | | | | | (97,722 | ) |
Administrator Class | | | | | | | (647,073 | ) | | | | | | | (634,126 | ) |
Institutional Class | | | | | | | (1,537,331 | ) | | | | | | | (1,401,931 | ) |
Net realized gains | | | | | | | | | | | | | | | | |
Class A | | | | | | | (46,161,619 | ) | | | | | | | (38,995,790 | ) |
Class C | | | | | | | (2,082,924 | ) | | | | | | | (1,394,806 | ) |
Administrator Class | | | | | | | (7,515,200 | ) | | | | | | | (6,776,357 | ) |
Institutional Class | | | | | | | (15,983,371 | ) | | | | | | | (9,948,253 | ) |
| | | | |
Total distributions to shareholders | | | | | | | (77,533,928 | ) | | | | | | | (64,001,574 | ) |
| | | | |
| | | | |
Capital share transactions | | | Shares | | | | | | | | Shares | | | | | |
Proceeds from shares sold | | | | | | | | | | | | | | | | |
Class A | | | 1,063,286 | | | | 16,732,861 | | | | 678,932 | | | | 10,775,202 | |
Class C | | | 490,419 | | | | 7,285,252 | | | | 94,568 | | | | 1,412,231 | |
Administrator Class | | | 441,623 | | | | 7,136,247 | | | | 242,716 | | | | 3,925,319 | |
Institutional Class | | | 1,511,259 | | | | 25,351,910 | | | | 6,582,647 | | | | 106,283,524 | |
| | | | |
| | | | | | | 56,506,270 | | | | | | | | 122,396,276 | |
| | | | |
Reinvestment of distributions | | | | | | | | | | | | | | | | |
Class A | | | 3,224,975 | | | | 47,843,154 | | | | 2,774,700 | | | | 42,042,332 | |
Class C | | | 105,097 | | | | 1,464,972 | | | | 73,060 | | | | 1,051,887 | |
Administrator Class | | | 491,872 | | | | 7,465,466 | | | | 399,637 | | | | 6,149,295 | |
Institutional Class | | | 561,645 | | | | 8,449,624 | | | | 96,268 | | | | 1,480,716 | |
| | | | |
| | | | | | | 65,223,216 | | | | | | | | 50,724,230 | |
| | | | |
Payment for shares redeemed | | | | | | | | | | | | | | | | |
Class A | | | (1,425,803 | ) | | | (22,618,676 | ) | | | (2,255,673 | ) | | | (35,863,720 | ) |
Class C | | | (108,900 | ) | | | (1,664,197 | ) | | | (74,785 | ) | | | (1,139,432 | ) |
Administrator Class | | | (395,231 | ) | | | (6,599,042 | ) | | | (5,335,919 | ) | | | (86,377,733 | ) |
Institutional Class | | | (796,589 | ) | | | (12,462,536 | ) | | | (1,259,512 | ) | | | (20,243,867 | ) |
| | | | |
| | | | | | | (43,344,451 | ) | | | | | | | (143,624,752 | ) |
| | | | |
Net increase in net assets resulting from capital share transactions | | | | | | | 78,385,035 | | | | | | | | 29,495,754 | |
| | | | |
Total increase in net assets | | | | | | | 25,334,057 | | | | | | | | 33,548,339 | |
| | | | |
| | | | |
Net assets | | | | | | | | | | | | | | | | |
Beginning of period | | | | | | | 458,131,856 | | | | | | | | 424,583,517 | |
| | | | |
End of period | | | | | | $ | 483,465,913 | | | | | | | $ | 458,131,856 | |
| | | | |
Undistributed net investment income | | | | | | $ | 3,280,334 | | | | | | | $ | 5,730,025 | |
| | | | |
The accompanying notes are an integral part of these financial statements.
| | | | | | |
| Financial highlights | | Wells Fargo Advantage Disciplined U.S. Core Fund | | | 17 | |
(For a share outstanding throughout each period)
| | | | | | | | | | | | | | | | | | | | | | | | |
| | | Six months ended
January 31, 2015
(unaudited) | | | Year ended July 31 | |
| CLASS A | | | 2014 | | | 2013 | | | 2012 | | | 2011 | | | 20101 | |
Net asset value, beginning of period | | | $16.29 | | | | $16.27 | | | | $14.65 | | | | $14.25 | | | | $11.93 | | | | $10.85 | |
Net investment income | | | 0.09 | | | | 0.19 | | | | 0.24 | | | | 0.20 | | | | 0.16 | | | | 0.15 | |
Net realized and unrealized gains (losses) on investments | | | 0.79 | | | | 2.35 | | | | 3.25 | | | | 0.93 | | | | 2.17 | | | | 1.09 | |
| | | | | | | | | | | | | | | | | | | | | | | | |
Total from investment operations | | | 0.88 | | | | 2.54 | | | | 3.49 | | | | 1.13 | | | | 2.33 | | | | 1.24 | |
Distributions to shareholders from | | | | | | | | | | | | | | | | | | | | | | | | |
Net investment income | | | (0.16 | ) | | | (0.24 | ) | | | (0.24 | ) | | | (0.23 | ) | | | (0.01 | ) | | | (0.16 | ) |
Net realized gains | | | (2.49 | ) | | | (2.28 | ) | | | (1.63 | ) | | | (0.50 | ) | | | 0.00 | | | | 0.00 | |
| | | | | | | | | | | | | | | | | | | | | | | | |
Total distributions to shareholders | | | (2.65 | ) | | | (2.52 | ) | | | (1.87 | ) | | | (0.73 | ) | | | (0.01 | ) | | | (0.16 | ) |
Net asset value, end of period | | | $14.52 | | | | $16.29 | | | | $16.27 | | | | $14.65 | | | | $14.25 | | | | $11.93 | |
Total return2 | | | 5.27 | % | | | 17.00 | % | | | 26.62 | % | | | 8.54 | % | | | 19.50 | % | | | 11.39 | % |
Ratios to average net assets (annualized) | | | | | | | | | | | | | | | | | | | | | | | | |
Gross expenses | | | 0.91 | % | | | 0.93 | % | | | 0.94 | % | | | 0.92 | % | | | 0.93 | % | | | 0.76 | % |
Net expenses | | | 0.91 | % | | | 0.92 | % | | | 0.92 | % | | | 0.92 | % | | | 0.92 | % | | | 0.76 | % |
Net investment income | | | 1.28 | % | | | 1.27 | % | | | 1.66 | % | | | 1.43 | % | | | 1.18 | % | | | 1.27 | % |
Supplemental data | | | | | | | | | | | | | | | | | | | | | | | | |
Portfolio turnover rate | | | 28 | % | | | 71 | % | | | 64 | % | | | 82 | % | | | 64 | % | | | 63 | % |
Net assets, end of period (000s omitted) | | | $314,023 | | | | $305,577 | | | | $285,780 | | | | $254,272 | | | | $268,460 | | | | $265,835 | |
| 1 | After the close of business on July 16, 2010, the Fund acquired the net assets of Evergreen Enhanced S&P 500 Fund which became the accounting and performance survivor in the transaction. The information for the period prior to July 19, 2010 is that of Class A of Evergreen Enhanced S&P 500 Fund. |
| 2 | Total return calculations do not include any sales charges. Returns for periods of less than one year are not annualized. |
The accompanying notes are an integral part of these financial statements.
| | | | |
| 18 | | Wells Fargo Advantage Disciplined U.S. Core Fund | | Financial highlights |
(For a share outstanding throughout each period)
| | | | | | | | | | | | | | | | | | | | | | | | |
| | | Six months ended
January 31, 2015
(unaudited) | | | Year ended July 31 | |
| CLASS C | | | 2014 | | | 2013 | | | 2012 | | | 2011 | | | 20101 | |
Net asset value, beginning of period | | | $15.47 | | | | $15.58 | | | | $14.10 | | | | $13.69 | | | | $11.54 | | | | $10.50 | |
Net investment income | | | 0.07 | | | | 0.08 | | | | 0.12 | | | | 0.09 | | | | 0.05 | | | | 0.06 | |
Net realized and unrealized gains (losses) on investments | | | 0.72 | | | | 2.23 | | | | 3.12 | | | | 0.90 | | | | 2.10 | | | | 1.04 | |
| | | | | | | | | | | | | | | | | | | | | | | | |
Total from investment operations | | | 0.79 | | | | 2.31 | | | | 3.24 | | | | 0.99 | | | | 2.15 | | | | 1.10 | |
Distributions to shareholders from | | | | | | | | | | | | | | | | | | | | | | | | |
Net investment income | | | (0.09 | ) | | | (0.14 | ) | | | (0.13 | ) | | | (0.08 | ) | | | 0.00 | | | | (0.06 | ) |
Net realized gains | | | (2.49 | ) | | | (2.28 | ) | | | (1.63 | ) | | | (0.50 | ) | | | 0.00 | | | | 0.00 | |
| | | | | | | | | | | | | | | | | | | | | | | | |
Total distributions to shareholders | | | (2.58 | ) | | | (2.42 | ) | | | (1.76 | ) | | | (0.58 | ) | | | 0.00 | | | | (0.06 | ) |
Net asset value, end of period | | | $13.68 | | | | $15.47 | | | | $15.58 | | | | $14.10 | | | | $13.69 | | | | $11.54 | |
Total return2 | | | 4.89 | % | | | 16.10 | % | | | 25.65 | % | | | 7.75 | % | | | 18.63 | % | | | 10.51 | % |
Ratios to average net assets (annualized) | | | | | | | | | | | | | | | | | | | | | | | | |
Gross expenses | | | 1.66 | % | | | 1.68 | % | | | 1.69 | % | | | 1.67 | % | | | 1.68 | % | | | 1.51 | % |
Net expenses | | | 1.66 | % | | | 1.67 | % | | | 1.67 | % | | | 1.67 | % | | | 1.67 | % | | | 1.51 | % |
Net investment income | | | 0.51 | % | | | 0.51 | % | | | 0.92 | % | | | 0.68 | % | | | 0.44 | % | | | 0.52 | % |
Supplemental data | | | | | | | | | | | | | | | | | | | | | | | | |
Portfolio turnover rate | | | 28 | % | | | 71 | % | | | 64 | % | | | 82 | % | | | 64 | % | | | 63 | % |
Net assets, end of period (000s omitted) | | | $16,308 | | | | $10,913 | | | | $9,544 | | | | $8,590 | | | | $8,768 | | | | $11,613 | |
| 1 | After the close of business on July 16, 2010, the Fund acquired the net assets of Evergreen Enhanced S&P 500 Fund which became the accounting and performance survivor in the transaction. The information for the period prior to July 19, 2010 is that of Class C of Evergreen Enhanced S&P 500 Fund. |
| 2 | Total return calculations do not include any sales charges. Returns for periods of less than one year are not annualized. |
The accompanying notes are an integral part of these financial statements.
| | | | | | |
| Financial highlights | | Wells Fargo Advantage Disciplined U.S. Core Fund | | | 19 | |
(For a share outstanding throughout each period)
| | | | | | | | | | | | | | | | | | | | | | | | |
| | | Six months ended
January 31, 2015
(unaudited) | | | Year ended July 31 | |
| ADMINISTRATOR CLASS | | | 2014 | | | 2013 | | | 2012 | | | 2011 | | | 20101 | |
Net asset value, beginning of period | | | $16.60 | | | | $16.47 | | | | $14.79 | | | | $14.36 | | | | $11.99 | | | | $10.92 | |
Net investment income | | | 0.12 | 2 | | | 0.25 | 2 | | | 0.28 | 2 | | | 0.23 | 2 | | | 0.19 | 2 | | | 0.20 | |
Net realized and unrealized gains (losses) on investments | | | 0.80 | | | | 2.35 | | | | 3.27 | | | | 0.93 | | | | 2.19 | | | | 1.06 | |
| | | | | | | | | | | | | | | | | | | | | | | | |
Total from investment operations | | | 0.92 | | | | 2.60 | | | | 3.55 | | | | 1.16 | | | | 2.38 | | | | 1.26 | |
Distributions to shareholders from | | | | | | | | | | | | | | | | | | | | | | | | |
Net investment income | | | (0.19 | ) | | | (0.19 | ) | | | (0.24 | ) | | | (0.23 | ) | | | (0.01 | ) | | | (0.19 | ) |
Net realized gains | | | (2.49 | ) | | | (2.28 | ) | | | (1.63 | ) | | | (0.50 | ) | | | 0.00 | | | | 0.00 | |
| | | | | | | | | | | | | | | | | | | | | | | | |
Total distributions to shareholders | | | (2.68 | ) | | | (2.47 | ) | | | (1.87 | ) | | | (0.73 | ) | | | (0.01 | ) | | | (0.19 | ) |
Net asset value, end of period | | | $14.84 | | | | $16.60 | | | | $16.47 | | | | $14.79 | | | | $14.36 | | | | $11.99 | |
Total return3 | | | 5.38 | % | | | 17.12 | % | | | 26.82 | % | | | 8.72 | % | | | 19.84 | % | | | 11.51 | % |
Ratios to average net assets (annualized) | | | | | | | | | | | | | | | | | | | | | | | | |
Gross expenses | | | 0.75 | % | | | 0.76 | % | | | 0.78 | % | | | 0.75 | % | | | 0.77 | % | | | 0.52 | % |
Net expenses | | | 0.74 | % | | | 0.74 | % | | | 0.74 | % | | | 0.74 | % | | | 0.74 | % | | | 0.52 | % |
Net investment income | | | 1.45 | % | | | 1.56 | % | | | 1.87 | % | | | 1.63 | % | | | 1.37 | % | | | 1.53 | % |
Supplemental data | | | | | | | | | | | | | | | | | | | | | | | | |
Portfolio turnover rate | | | 28 | % | | | 71 | % | | | 64 | % | | | 82 | % | | | 64 | % | | | 63 | % |
Net assets, end of period (000s omitted) | | | $53,138 | | | | $50,498 | | | | $127,384 | | | | $150,408 | | | | $244,716 | | | | $371,389 | |
| 1 | After the close of business on July 16, 2010, the Fund acquired the net assets of Evergreen Enhanced S&P 500 Fund which became the accounting and performance survivor in the transaction. The information for the period prior to July 19, 2010 is that of Class I of Evergreen Enhanced S&P 500 Fund. |
| 2 | Calculated based upon average shares outstanding |
| 3 | Returns for periods of less than one year are not annualized. |
The accompanying notes are an integral part of these financial statements.
| | | | |
| 20 | | Wells Fargo Advantage Disciplined U.S. Core Fund | | Financial highlights |
(For a share outstanding throughout each period)
| | | | | | | | | | | | | | | | | | | | | | | | |
| | | Six months ended
January 31, 2015
(unaudited) | | | Year ended July 31 | |
| INSTITUTIONAL CLASS | | | 2014 | | | 2013 | | | 2012 | | | 2011 | | | 20101 | |
Net asset value, beginning of period | | | $16.47 | | | | $16.43 | | | | $14.78 | | | | $14.39 | | | | $11.99 | | | | $11.99 | |
Net investment income | | | 0.14 | | | | 0.26 | 2 | | | 0.35 | | | | 0.26 | 2 | | | 0.22 | | | | 0.00 | |
Net realized and unrealized gains (losses) on investments | | | 0.79 | | | | 2.37 | | | | 3.23 | | | | 0.93 | | | | 2.19 | | | | 0.00 | |
| | | | | | | | | | | | | | | | | | | | | | | | |
Total from investment operations | | | 0.93 | | | | 2.63 | | | | 3.58 | | | | 1.19 | | | | 2.41 | | | | 0.00 | |
Distributions to shareholders from | | | | | | | | | | | | | | | | | | | | | | | | |
Net investment income | | | (0.23 | ) | | | (0.31 | ) | | | (0.30 | ) | | | (0.30 | ) | | | (0.01 | ) | | | 0.00 | |
Net realized gains | | | (2.49 | ) | | | (2.28 | ) | | | (1.63 | ) | | | (0.50 | ) | | | 0.00 | | | | 0.00 | |
| | | | | | | | | | | | | | | | | | | | | | | | |
Total distributions to shareholders | | | (2.72 | ) | | | (2.59 | ) | | | (1.93 | ) | | | (0.80 | ) | | | (0.01 | ) | | | 0.00 | |
Net asset value, end of period | | | $14.68 | | | | $16.47 | | | | $16.43 | | | | $14.78 | | | | $14.39 | | | | $11.99 | |
Total return3 | | | 5.51 | % | | | 17.48 | % | | | 27.16 | % | | | 9.02 | % | | | 20.10 | % | | | 0.00 | % |
Ratios to average net assets (annualized) | | | | | | | | | | | | | | | | | | | | | | | | |
Gross expenses | | | 0.48 | % | | | 0.50 | % | | | 0.51 | % | | | 0.49 | % | | | 0.51 | % | | | 0.00 | % |
Net expenses | | | 0.48 | % | | | 0.48 | % | | | 0.48 | % | | | 0.48 | % | | | 0.47 | % | | | 0.00 | % |
Net investment income | | | 1.72 | % | | | 1.63 | % | | | 2.08 | % | | | 1.80 | % | | | 1.62 | % | | | 0.00 | % |
Supplemental data | | | | | | | | | | | | | | | | | | | | | | | | |
Portfolio turnover rate | | | 28 | % | | | 71 | % | | | 64 | % | | | 82 | % | | | 64 | % | | | 63 | % |
Net assets, end of period (000s omitted) | | | $99,997 | | | | $91,144 | | | | $1,875 | | | | $1,215 | | | | $12 | | | | $10 | |
| 1 | For the period from July 30, 2010 (commencement of class operations) to July 31, 2010 |
| 2 | Calculated based upon average shares outstanding |
| 3 | Returns for periods of less than one year are not annualized. |
The accompanying notes are an integral part of these financial statements.
| | | | | | |
| Notes to financial statements (unaudited) | | Wells Fargo Advantage Disciplined U.S. Core Fund | | | 21 | |
1. ORGANIZATION
Wells Fargo Funds Trust (the “Trust”), a Delaware statutory trust organized on March 10, 1999, is an open-end management investment company registered under the Investment Company Act of 1940, as amended (the “1940 Act”). As an investment company, the Trust follows the accounting and reporting guidance in Financial Accounting Standards Board (“FASB”) Accounting Standards Codification Topic 946, Financial Services – Investment Companies. These financial statements report on the Wells Fargo Advantage Disciplined U.S. Core Fund (the “Fund”) which is a diversified series of the Trust.
2. SIGNIFICANT ACCOUNTING POLICIES
The following significant accounting policies, which are consistently followed in the preparation of the financial statements of the Fund, are in conformity with U.S. generally accepted accounting principles which require management to make estimates and assumptions that affect the reported amounts of assets and liabilities, disclosure of contingent assets and liabilities at the date of the financial statements, and the reported amounts of revenues and expenses during the reporting period. Actual results could differ from those estimates.
Securities valuation
All investments are valued each business day as of the close of regular trading on the New York Stock Exchange (generally 4 p.m. Eastern Time).
Equity securities that are listed on a foreign or domestic exchange or market are valued at the official closing price or, if none, the last sales price. If no sale occurs on the primary exchange or market for the security that day, the prior day’s price will be deemed “stale” and fair values will be determined in accordance with the Fund’s Valuation Procedures.
Investments in registered open-end investment companies are valued at net asset value. Non-registered investment vehicles are fair valued at net asset value.
Investments which are not valued using any of the methods discussed above are valued at their fair value, as determined in good faith by the Board of Trustee of the Fund. The Board of Trustees has established a Valuation Committee comprised of the Trustees and has delegated to it the authority to take any actions regarding the valuation of portfolio securities that the Valuation Committee deems necessary or appropriate, including determining the fair value of portfolio securities, unless the determination has been delegated to the Management Valuation Team of Wells Fargo Funds Management, LLC (“Funds Management”). The Board of Trustees retains the authority to make or ratify any valuation decisions or approve any changes to the Valuation Procedures as it deems appropriate. On a quarterly basis, the Board of Trustees receives reports on any valuation actions taken by the Valuation Committee or the Management Valuation Team which may include items for ratification.
Valuations of fair valued securities are compared to the next actual sales price when available, or other appropriate market values, to assess the continued appropriateness of the fair valuation methodologies used. These securities are fair valued on a day-to-day basis, taking into consideration changes to appropriate market information and any significant changes to the inputs considered in the valuation process until there is a readily available price provided on an exchange or by an independent pricing service. Valuations received from an independent pricing service or independent broker-dealer quotes are periodically validated by comparisons to most recent trades and valuations provided by other independent pricing services in addition to the review of prices by the adviser and/or subadviser. Unobservable inputs used in determining fair valuations are identified based on the type of security, taking into consideration factors utilized by market participants in valuing the investment, knowledge about the issuer and the current market environment.
Security loans
The Fund may lend its securities from time to time in order to earn additional income in the form of fees or interest on securities received as collateral or the investment of any cash received as collateral. The Fund continues to receive interest or dividends on the securities loaned. The Fund receives collateral in the form of cash or securities with a value at least equal to the value of the securities on loan. The value of the loaned securities is determined at the close of each business day and any additional required collateral is delivered to the Fund on the next business day. In a securities lending transaction, the net asset value of the Fund will be affected by an increase or decrease in the value of the securities loaned and by an increase or decrease in the value of the instrument in which collateral is invested. The amount of securities lending activity undertaken by the Fund fluctuates from time to time. In the event of default or bankruptcy by the borrower, the Fund may be prevented from recovering the loaned securities or gaining access to the collateral or may experience delays or costs in doing so. In addition, the investment of any cash collateral received may lose all or part of its value. The Fund has the right under the lending agreement to recover the securities from the borrower on demand.
| | | | |
| 22 | | Wells Fargo Advantage Disciplined U.S. Core Fund | | Notes to financial statements (unaudited) |
The Fund lends its securities through an unaffiliated securities lending agent. Cash collateral received in connection with its securities lending transactions is invested in Securities Lending Cash Investments, LLC (the “Securities Lending Fund”). The Securities Lending Fund is exempt from registration under Section 3(c)(7) of the 1940 Act and is managed by Funds Management and is subadvised by Wells Capital Management Incorporated (“WellsCap”). Funds Management receives an advisory fee starting at 0.05% and declining to 0.01% as the average daily net assets of the Securities Lending Fund increase. All of the fees received by Funds Management are paid to WellsCap for its services as subadviser. The Securities Lending Fund seeks to provide a positive return compared to the daily Fed Funds Open rate by investing in high-quality, U.S. dollar-denominated short-term money market instruments. Securities Lending Fund investments are fair valued based upon the amortized cost valuation technique. Income earned from investment in the Securities Lending Fund is included in securities lending income on the Statement of Operations.
Security transactions and income recognition
Securities transactions are recorded on a trade date basis. Realized gains or losses are recorded on the basis of identified cost.
Dividend income is recognized on the ex-dividend date.
Distributions to shareholders
Distributions to shareholders from net investment income and net realized gains, if any, are recorded on the ex-dividend date. Such distributions are determined in conformity with federal income tax regulations, which may differ in amount or character from net investment income and realized gains recognized for purposes of U.S. generally accepted accounting principles.
Federal and other taxes
The Fund intends to continue to qualify as a regulated investment company by distributing substantially all of its investment company taxable income and any net realized capital gains (after reduction for capital loss carryforwards) sufficient to relieve it from all, or substantially all, federal income taxes. Accordingly, no provision for federal income taxes was required.
The Fund’s income and federal excise tax returns and all financial records supporting those returns for the prior three fiscal years are subject to examination by the federal and Delaware revenue authorities. Management has analyzed the Fund’s tax positions taken on federal, state, and foreign tax returns for all open tax years and does not believe that there are any uncertain tax positions that require recognition of a tax liability.
Class allocations
The separate classes of shares offered by the Fund differ principally in applicable sales charges, distribution, shareholder servicing, and administration fees. Class specific expenses are charged directly to that share class. Investment income, common expenses, and realized and unrealized gains (losses) on investments are allocated daily to each class of shares based on the relative proportion of net assets of each class.
3. FAIR VALUATION MEASUREMENTS
Fair value measurements of investments are determined within a framework that has established a fair value hierarchy based upon the various data inputs utilized in determining the value of the Fund’s investments. The three-level hierarchy gives the highest priority to unadjusted quoted prices in active markets for identical assets or liabilities (Level 1) and the lowest priority to significant unobservable inputs (Level 3). The Fund’s investments are classified within the fair value hierarchy based on the lowest level of input that is significant to the fair value measurement. The inputs are summarized into three broad levels as follows:
| n | | Level 1 – quoted prices in active markets for identical securities |
| n | | Level 2 – other significant observable inputs (including quoted prices for similar securities, interest rates, prepayment speeds, credit risk, use of amortized cost, etc.) |
| n | | Level 3 – significant unobservable inputs (including the Fund’s own assumptions in determining the fair value of investments) |
The inputs or methodologies used for valuing investments in securities are not necessarily an indication of the risk associated with investing in those securities.
| | | | | | |
| Notes to financial statements (unaudited) | | Wells Fargo Advantage Disciplined U.S. Core Fund | | | 23 | |
The following is a summary of the inputs used in valuing the Fund’s assets and liabilities as of January 31, 2015:
| | | | | | | | | | | | | | | | |
| | | Quoted prices
(Level 1) | | | Other significant
observable inputs
(Level 2) | | | Significant
unobservable inputs
(Level 3) | | | Total | |
Assets | | | | | | | | | | | | | | | | |
Investments in: | | | | | | | | | | | | | | | | |
| | | | |
Common stocks | | | | | | | | | | | | | | | | |
Consumer discretionary | | $ | 55,092,864 | | | $ | 0 | | | $ | 0 | | | $ | 55,092,864 | |
Consumer staples | | | 44,846,006 | | | | 0 | | | | 0 | | | | 44,846,006 | |
Energy | | | 35,741,781 | | | | 0 | | | | 0 | | | | 35,741,781 | |
Financials | | | 72,316,893 | | | | 0 | | | | 0 | | | | 72,316,893 | |
Health care | | | 75,027,097 | | | | 0 | | | | 0 | | | | 75,027,097 | |
Industrials | | | 54,288,470 | | | | 0 | | | | 0 | | | | 54,288,470 | |
Information technology | | | 95,275,358 | | | | 0 | | | | 0 | | | | 95,275,358 | |
Materials | | | 16,409,517 | | | | 0 | | | | 0 | | | | 16,409,517 | |
Telecommunication services | | | 11,276,202 | | | | 0 | | | | 0 | | | | 11,276,202 | |
Utilities | | | 16,156,746 | | | | 0 | | | | 0 | | | | 16,156,746 | |
| | | | |
Short-term investments | | | | | | | | | | | | | | | | |
Investment companies | | | 13,416,501 | | | | 0 | | | | 0 | | | | 13,416,501 | |
Total assets | | $ | 489,847,435 | | | $ | 0 | | | $ | 0 | | | $ | 489,847,435 | |
The Fund recognizes transfers between levels within the fair value hierarchy at the end of the reporting period. At January 31, 2015, the Fund did not have any transfers into/out of Level 1, Level 2, or Level 3.
4. TRANSACTIONS WITH AFFILIATES
Advisory fee
The Trust has entered into an advisory contract with Funds Management, an indirect wholly owned subsidiary of Wells Fargo & Company (“Wells Fargo”). The adviser is responsible for implementing investment policies and guidelines and for supervising the subadviser, who is responsible for day-to-day portfolio management of the Fund.
Pursuant to the contract, Funds Management is entitled to receive an annual advisory fee starting at 0.30% and declining to 0.25% as the average daily net assets of the Fund increase. For the six months ended January 31, 2015, the advisory fee was equivalent to an annual rate of 0.30% of the Fund’s average daily net assets.
Funds Management has retained the services of a subadviser to provide daily portfolio management to the Fund. The fee for subadvisory services is borne by Funds Management. Golden Capital Management, LLC, an affiliate of Funds Management, is the subadviser to the Fund and is entitled to receive a fee from Funds Management at an annual rate starting at 0.25% and declining to 0.15% as the average daily net assets of the Fund increase.
Administration fees
The Trust has entered into an administration agreement with Funds Management. Under this agreement, for providing administrative services, which includes paying fees and expenses for services provided by the transfer agent, sub-transfer agents, omnibus account servicers and record-keepers, Funds Management is entitled to receive from the Fund an annual fund level administration fee starting at 0.05% and declining to 0.03% as the average daily net assets of the Fund increase and a class level administration fee which is calculated based on the average daily net assets of each class as follows:
| | | | |
| | | Class level
administration fee | |
Class A, Class C | | | 0.26 | % |
Administrator Class | | | 0.10 | |
Institutional Class | | | 0.08 | |
| | | | |
| 24 | | Wells Fargo Advantage Disciplined U.S. Core Fund | | Notes to financial statements (unaudited) |
Funds Management has contractually waived and/or reimbursed advisory and administration fees to the extent necessary to maintain certain net operating expense ratios for the Fund. Waiver of fees and/or reimbursement of expenses by Funds Management were made first from fund level expenses on a proportionate basis and then from class specific expenses. Funds Management has committed through November 30, 2015 to waive fees and/or reimburse expenses to the extent necessary to cap the Fund’s expenses at 0.92% for Class A shares, 1.67% for Class C shares, 0.74% for Administrator Class shares, and 0.48% for Institutional Class shares. After this time, the cap may be increased or the commitment to maintain the cap may be terminated only with the approval of the Board of Trustees.
Distribution fee
The Trust has adopted a Distribution Plan for Class C shares of the Fund pursuant to Rule 12b-1 under the 1940 Act. A distribution fee is charged to Class C shares and paid to Wells Fargo Funds Distributor, LLC (“Funds Distributor”), the principal underwriter, at an annual rate of 0.75% of the average daily net assets of Class C shares.
In addition, Funds Distributor is entitled to receive the front-end sales charge from the purchase of Class A shares and a contingent deferred sales charge on the redemption of certain shares. Funds Distributor is also entitled to receive the contingent deferred sales charges from redemptions of Class C shares. For the six months ended January 31, 2015, Funds Distributor received $10,818 from the sale of Class A shares and $500 in contingent deferred sales charges from redemptions of Class C shares.
Shareholder servicing fees
The Trust has entered into contracts with one or more shareholder servicing agents, whereby Class A, Class C, and Administrator Class of the Fund is charged a fee at an annual rate of 0.25% of the average daily net assets of each respective class.
A portion of these total shareholder servicing fees were paid to affiliates of Wells Fargo.
5. INVESTMENT PORTFOLIO TRANSACTIONS
Purchases and sales of investments, excluding U.S. government obligations (if any) and short-term securities, for the six months ended January 31, 2015 were $143,243,489 and $133,642,593, respectively.
6. BANK BORROWINGS
The Trust (excluding the money market funds and certain other funds in the Trust) and Wells Fargo Variable Trust are parties to a $150,000,000 revolving credit agreement, whereby the Fund is permitted to use bank borrowings for temporary or emergency purposes, such as to fund shareholder redemption requests. Interest under the credit agreement is charged to the Fund based on a borrowing rate equal to the higher of the Federal Funds rate in effect on that day plus 1.25% or the overnight LIBOR rate in effect on that day plus 1.25%. In addition, an annual commitment fee equal to 0.10% of the unused balance is allocated to each participating fund. For the six months ended January 31, 2015, the Fund paid $350 in commitment fees.
For the six months ended January 31, 2015, there were no borrowings by the Fund under the agreement.
7. INDEMNIFICATION
Under the Trust’s organizational documents, the officers and Trustees are indemnified against certain liabilities that may arise out of performance of their duties to the Trust. Additionally, in the normal course of business, the Trust may enter into contracts with service providers that contain a variety of indemnification clauses. The Trust’s maximum exposure under these arrangements is dependent on future claims that may be made against the Fund and, therefore, cannot be estimated.
| | | | | | |
| Other information (unaudited) | | Wells Fargo Advantage Disciplined U.S. Core Fund | | | 25 | |
PROXY VOTING INFORMATION
A description of the policies and procedures that the Fund uses to determine how to vote proxies relating to portfolio securities, in addition to information regarding how the Fund voted proxies relating to portfolio securities during the most recent 12-month period ended June 30, is available on the Fund’s website at wellsfargoadvantagefunds.com or by visiting the SEC website at sec.gov.
PORTFOLIO HOLDINGS INFORMATION
The complete portfolio holdings for the Fund are publicly available monthly on the Fund’s website (wellsfargoadvantagefunds.com), on a one-month delayed basis. In addition, top ten holdings information (excluding derivative positions) for the Fund is publicly available on the Fund’s website on a monthly, seven-day or more delayed basis. The Fund files its complete schedule of portfolio holdings with the SEC for the first and third quarters of each fiscal year on Form N-Q, which is available by visiting the SEC website at sec.gov. In addition, the Fund’s Form N-Q may be reviewed and copied at the SEC’s Public Reference Room in Washington, DC, and at regional offices in New York City, at 233 Broadway, and in Chicago, at 175 West Jackson Boulevard, Suite 900. Information about the Public Reference Room may be obtained by calling 1-800-SEC-0330.
| | | | |
| 26 | | Wells Fargo Advantage Disciplined U.S. Core Fund | | Other information (unaudited) |
BOARD OF TRUSTEES AND OFFICERS
Each of the Trustees and Officers1 listed in the table below acts in identical capacities for each fund in the Wells Fargo Advantage family of funds, which consists of 134 mutual funds comprising the Wells Fargo Funds Trust, Wells Fargo Variable Trust, Wells Fargo Master Trust and four closed-end funds (collectively the “Fund Complex”). This table should be read in conjunction with the Prospectus and the Statement of Additional Information2. The mailing address of each Trustee and Officer is 525 Market Street, 12th Floor, San Francisco, CA 94105. Each Trustee and Officer serves an indefinite term, however, each Trustee serves such term until reaching the mandatory retirement age established by the Trustees.
Independent Trustees
| | | | | | |
Name and
year of birth | | Position held and
length of service* | | Principal occupations during past five years or longer | | Other
directorships during
past five years |
William R. Ebsworth
(Born 1957) | | Trustee, since 2015** | | Retired. From 1984 to 2013, equities analyst, portfolio manager, research director at Fidelity Management and Research Company and retired in 2013 as Chief Investment Officer of Fidelity Strategic Advisers, Inc. in Boston, Tokyo, and Hong Kong where he led a team of investment professionals managing client assets. Prior thereto, Board member of Hong Kong Securities Clearing Co., Hong Kong Options Clearing Corp., the Thailand International Fund, Ltd., Fidelity Investments Life Insurance Company, and Empire Fidelity Investments Life Insurance Company. Mr. Ebsworth is an Adjunct Lecturer, Finance, at Babson College and a Chartered Financial Analyst. | | Asset Allocation Trust |
Jane A. Freeman
(Born 1953) | | Trustee, since 2015** | | Retired. From 2012 to 2014 and 1999 to 2008, Chief Financial Officer of Scientific Learning Corporation. From 2008 to 2012, Ms. Freeman provided consulting services related to strategic business projects. Prior thereto, Portfolio Manager at Rockefeller & Co. and Scudder, Stevens & Clark. Board member of the Harding Loevner Funds from 1996 to 2014, serving as both Lead Independent Director and chair of the Audit Committee. Board member of the Russell Exchange Traded Funds Trust from 2011 to 2012 and the chair of the Audit Committee. Ms. Freeman is a Chartered Financial Analyst (inactive), Chair of Taproot Foundation (non-profit organization) and a Board Member of Ruth Bancroft Garden (non-profit organization). | | Asset Allocation Trust |
Peter G. Gordon
(Born 1942) | | Trustee, since 1998; Chairman, since 2005 | | Co-Founder, Retired Chairman, President and CEO of Crystal Geyser Water Company. Trustee Emeritus, Colby College. | | Asset Allocation Trust |
Isaiah Harris, Jr.
(Born 1952) | | Trustee, since 2009 | | Retired. Chairman of the Board of CIGNA Corporation since 2009, and Director since 2005. From 2003 to 2011, Director of Delux Corporation. Prior thereto, President and CEO of BellSouth Advertising and Publishing Corp. from 2005 to 2007, President and CEO of BellSouth Enterprises from 2004 to 2005 and President of BellSouth Consumer Services from 2000 to 2003. Emeritus member of the Iowa State University Foundation Board of Governors. Emeritus Member of the Advisory Board of Iowa State University School of Business. Advisory Board Member, Palm Harbor Academy. Mr. Harris is a certified public accountant. | | CIGNA Corporation; Asset Allocation Trust |
Judith M. Johnson
(Born 1949) | | Trustee, since 2008;
Audit Committee Chairman, since 2008 | | Retired. Prior thereto, Chief Executive Officer and Chief Investment Officer of Minneapolis Employees Retirement Fund from 1996 to 2008. Ms. Johnson is an attorney, certified public accountant and a certified managerial accountant. | | Asset Allocation Trust |
David F. Larcker
(Born 1950) | | Trustee, since 2009 | | James Irvin Miller Professor of Accounting at the Graduate School of Business, Stanford University, Morgan Stanley Director of the Center for Leadership Development and Research and Senior Faculty of The Rock Center for Corporate Governance since 2006. From 2005 to 2008, Professor of Accounting at the Graduate School of Business, Stanford University. Prior thereto, Ernst & Young Professor of Accounting at The Wharton School, University of Pennsylvania from 1985 to 2005. | | Asset Allocation Trust |
Olivia S. Mitchell
(Born 1953) | | Trustee, since 2006 | | International Foundation of Employee Benefit Plans Professor, Wharton School of the University of Pennsylvania since 1993. Director of Wharton’s Pension Research Council and Boettner Center on Pensions & Retirement Research, and Research Associate at the National Bureau of Economic Research. Previously, Cornell University Professor from 1978 to 1993. | | Asset Allocation Trust |
| | | | | | |
| Other information (unaudited) | | Wells Fargo Advantage Disciplined U.S. Core Fund | | | 27 | |
| | | | | | |
Name and
year of birth | | Position held and
length of service* | | Principal occupations during past five years or longer | | Other
directorships during
past five years |
Timothy J. Penny
(Born 1951) | | Trustee, since 1996 | | President and Chief Executive Officer of Southern Minnesota Initiative Foundation, a non-profit organization, since 2007 and Senior Fellow at the Humphrey Institute Policy Forum at the University of Minnesota since 1995. Member of the Board of Trustees of NorthStar Education Finance, Inc., a non-profit organization, since 2007. | | Asset Allocation Trust |
Michael S. Scofield
(Born 1943) | | Trustee, since 2010 | | Served on the Investment Company Institute’s Board of Governors and Executive Committee from 2008-2011 as well the Governing Council of the Independent Directors Council from 2006-2011 and the Independent Directors Council Executive Committee from 2008-2011. Chairman of the IDC from 2008-2010. Institutional Investor (Fund Directions) Trustee of Year in 2007. Trustee of the Evergreen Funds complex (and its predecessors) from 1984 to 2010. Chairman of the Evergreen Funds from 2000-2010. Former Trustee of the Mentor Funds. Retired Attorney, Law Offices of Michael S. Scofield. | | Asset Allocation Trust |
Donald C. Willeke
(Born 1940) | | Trustee, since 1996 | | Principal of the law firm of Willeke & Daniels. General Counsel of the Minneapolis Employees Retirement Fund from 1984 until its consolidation into the Minnesota Public Employees Retirement Association on June 30, 2010. Director and Vice Chair of The Tree Trust (non-profit corporation). Director of the American Chestnut Foundation (non-profit corporation). | | Asset Allocation Trust |
| * | Length of service dates reflect the Trustee’s commencement of service with the Trust’s predecessor entities, where applicable. |
| ** | William R. Ebsworth and Jane A. Freeman each became a Trustee effective January 1, 2015. |
Officers
| | | | | | |
Name and
year of birth | | Position held and
length of service | | Principal occupations during past five years or longer | | |
Karla M. Rabusch
(Born 1959) | | President, since 2003 | | Executive Vice President of Wells Fargo Bank, N.A. and President of Wells Fargo Funds Management, LLC since 2003. | | |
Jeremy DePalma1
(Born 1974) | | Treasurer, since 2012 | | Senior Vice President of Wells Fargo Funds Management, LLC since 2009. Senior Vice President of Evergreen Investment Management Company, LLC from 2008 to 2010. Vice President, Evergreen Investment Services, Inc. from 2004 to 2007. Head of the Fund Reporting and Control Team within Fund Administration from 2005 to 2010. | | |
C. David Messman
(Born 1960) | | Secretary, since 2000; Chief Legal Officer, since 2003 | | Assistant General Counsel of Wells Fargo Bank, N.A. since 2013 and Vice President and Managing Counsel of Wells Fargo Bank N.A. from 1996 to 2013. Senior Vice President and Secretary of Wells Fargo Funds Management, LLC since 2001. | | |
Debra Ann Early
(Born 1964) | | Chief Compliance Officer, since 2007 | | Senior Vice President of Wells Fargo Funds Management, LLC since 2007 and Chief Compliance Officer from 2007 to 2014. Chief Compliance Officer of Parnassus Investments from 2005 to 2007. Chief Financial Officer of Parnassus Investments from 2004 to 2007 and Senior Audit Manager of PricewaterhouseCoopers LLP from 1998 to 2004. | | |
David Berardi
(Born 1975) | | Assistant Treasurer, since 2009 | | Vice President of Wells Fargo Funds Management, LLC since 2009. Vice President of Evergreen Investment Management Company, LLC from 2008 to 2010. Assistant Vice President of Evergreen Investment Services, Inc. from 2004 to 2008. Manager of Fund Reporting and Control for Evergreen Investment Management Company, LLC from 2004 to 2010. | | |
| 1 | Jeremy DePalma acts as Treasurer of 61 funds and Assistant Treasurer of 73 funds in the Fund Complex. |
| 2 | The Statement of Additional Information includes additional information about the Trustees and is available, without charge, upon request, by calling 1-800-222-8222 or by visiting the website at wellsfargoadvantagefunds.com. |
| | | | |
| 28 | | Wells Fargo Advantage Disciplined U.S. Core Fund | | List of abbreviations |
The following is a list of common abbreviations for terms and entities that may have appeared in this report.
| ACA | — ACA Financial Guaranty Corporation |
| ADR | — American depositary receipt |
| ADS | — American depositary shares |
| AGC | — Assured Guaranty Corporation |
| AGM | — Assured Guaranty Municipal |
| Ambac | — Ambac Financial Group Incorporated |
| AMT | — Alternative minimum tax |
| BAN | — Bond anticipation notes |
| BHAC | — Berkshire Hathaway Assurance Corporation |
| CAB | — Capital appreciation bond |
| CCAB | — Convertible capital appreciation bond |
| CDA | — Community Development Authority |
| CDO | — Collateralized debt obligation |
| DRIVER | — Derivative inverse tax-exempt receipts |
| DW&P | — Department of Water & Power |
| DWR | — Department of Water Resources |
| ECFA | — Educational & Cultural Facilities Authority |
| EDA | — Economic Development Authority |
| EDFA | — Economic Development Finance Authority |
| ETF | — Exchange-traded fund |
| FDIC | — Federal Deposit Insurance Corporation |
| FFCB | — Federal Farm Credit Banks |
| FGIC | — Financial Guaranty Insurance Corporation |
| FHA | — Federal Housing Administration |
| FHLB | — Federal Home Loan Bank |
| FHLMC | — Federal Home Loan Mortgage Corporation |
| FICO | — The Financing Corporation |
| FNMA | — Federal National Mortgage Association |
| GDR | — Global depositary receipt |
| GNMA | — Government National Mortgage Association |
| HCFR | — Healthcare facilities revenue |
| HEFA | — Health & Educational Facilities Authority |
| HEFAR | — Higher education facilities authority revenue |
| HFA | — Housing Finance Authority |
| HFFA | — Health Facilities Financing Authority |
| HUD | — Department of Housing and Urban Development |
| IDA | — Industrial Development Authority |
| IDAG | — Industrial Development Agency |
| KRW | — Republic of Korea won |
| LIBOR | — London Interbank Offered Rate |
| LIFER | — Long Inverse Floating Exempt Receipts |
| LLC | — Limited liability company |
| LLLP | — Limited liability limited partnership |
| LLP | — Limited liability partnership |
| MBIA | — Municipal Bond Insurance Association |
| MFHR | — Multifamily housing revenue |
| MSTR | — Municipal securities trust receipts |
| MUD | — Municipal Utility District |
| National | — National Public Finance Guarantee Corporation |
| PCFA | — Pollution Control Financing Authority |
| PCL | — Public Company Limited |
| PCR | — Pollution control revenue |
| PFA | — Public Finance Authority |
| PFFA | — Public Facilities Financing Authority |
| PFOTER | — Puttable floating option tax-exempt receipts |
| plc | — Public limited company |
| PUTTER | — Puttable tax-exempt receipts |
| R&D | — Research & development |
| Radian | — Radian Asset Assurance |
| RAN | — Revenue anticipation notes |
| RDA | — Redevelopment Authority |
| RDFA | — Redevelopment Finance Authority |
| REIT | — Real estate investment trust |
| ROC | — Reset option certificates |
| SAVRS | — Select auction variable rate securities |
| SBA | — Small Business Authority |
| SFHR | — Single-family housing revenue |
| SFMR | — Single-family mortgage revenue |
| SPA | — Standby purchase agreement |
| SPDR | — Standard & Poor’s Depositary Receipts |
| SPEAR | — Short Puttable Exempt Adjustable Receipts |
| STRIPS | — Separate trading of registered interest and |
| TAN | — Tax anticipation notes |
| TIPS | — Treasury inflation-protected securities |
| TRAN | — Tax revenue anticipation notes |
| TTFA | — Transportation Trust Fund Authority |
| TVA | — Tennessee Valley Authority |


For more information
More information about Wells Fargo Advantage Funds is available free upon request. To obtain literature, please write, email, visit the Fund’s website, or call:
Wells Fargo Advantage Funds
P.O. Box 8266
Boston, MA 02266-8266
Email: wfaf@wellsfargo.com
Website: wellsfargoadvantagefunds.com
Individual investors: 1-800-222-8222
Retail investment professionals: 1-888-877-9275
Institutional investment professionals: 1-866-765-0778
This report and the financial statements contained herein are submitted for the general information of the shareholders of Wells Fargo Advantage Funds. If this report is used for promotional purposes, distribution of the report must be accompanied or preceded by a current prospectus. Before investing, please consider the investment objectives, risks, charges, and expenses of the investment. For a current prospectus and, if available, a summary prospectus, containing this information, call 1-800-222-8222 or visit the Fund’s website at wellsfargoadvantagefunds.com. Read the prospectus carefully before you invest or send money.
Wells Fargo Funds Management, LLC, a wholly owned subsidiary of Wells Fargo & Company, provides investment advisory and administrative services for Wells Fargo Advantage Funds. Other affiliates of Wells Fargo & Company provide subadvisory and other services for the Funds. The Funds are distributed by Wells Fargo Funds Distributor, LLC, Member FINRA/SIPC, an affiliate of Wells Fargo & Company.
NOT FDIC INSURED ¡ NO BANK GUARANTEE ¡ MAY LOSE VALUE
© 2015 Wells Fargo Funds Management, LLC. All rights reserved.
| | |
 | | 231597 03-15 SA203/SAR203 01-15 |

Wells Fargo Advantage Endeavor Select Fund

Semi-Annual Report
January 31, 2015

Reduce clutter. Save trees.
Sign up for electronic delivery of prospectuses and shareholder reports at wellsfargo.com/advantagedelivery
Contents
The views expressed and any forward-looking statements are as of January 31, 2015, unless otherwise noted, and are those of the Fund managers and/or Wells Fargo Funds Management, LLC. Discussions of individual securities, or the markets generally, or any Wells Fargo Advantage Fund are not intended as individual recommendations. Future events or results may vary significantly from those expressed in any forward-looking statements; the views expressed are subject to change at any time in response to changing circumstances in the market. Wells Fargo Funds Management, LLC and the Fund disclaim any obligation to publicly update or revise any views expressed or forward-looking statements.
NOT FDIC INSURED ¡ NO BANK GUARANTEE ¡ MAY LOSE VALUE
| | | | |
| 2 | | Wells Fargo Advantage Endeavor Select Fund | | Letter to shareholders (unaudited) |

Karla M. Rabusch
President
Wells Fargo Advantage Funds
As the U.S. churned forward, major economies elsewhere in the world faced significant ongoing challenges.
Dear Valued Shareholder:
We are pleased to offer you this semi-annual report for the Wells Fargo Advantage Endeavor Select Fund for the six-month period that ended January 31, 2015. Generally improving U.S. economic data helped drive a positive return for U.S. stocks for the reporting period (as measured by the S&P 500 Index1); in contrast, many economies and markets elsewhere in the world faced ongoing challenges.
Positive U.S. economic data, but increased tensions abroad, led to heightened volatility during the third quarter of 2014.
When the reporting period began on August 1, 2014, the U.S. stock market was experiencing a series of surges interrupted by bouts of volatility as interest-rate concerns in the U.S. and increased tensions abroad triggered heightened investor uncertainty. An escalating Russia/Ukraine situation and a growing perception that the U.S. Federal Reserve (Fed) would raise short-term interest rates sooner than expected caused investors to pull back near the end of July. As a result, the S&P 500 Index dropped into negative territory for July’s monthly return. However, August brought a bounce-back; the S&P 500 Index delivered its largest monthly gain since February 2014 on a string of positive economic news, led by an upwardly revised 4.2% estimate of second-quarter 2014 gross domestic product (GDP) growth. Then, in September, stock market volatility increased as positive economic data became overshadowed at times by growing discomfort over escalating tensions in Ukraine and the Middle East. Slowing growth in Europe and China also concerned investors. Ultimately, U.S. stocks ended the third quarter up slightly overall, buoyed largely by another upward revision of second-quarter GDP growth to 4.6%. Strong corporate earnings also contributed to market gains.
The fourth quarter of 2014 brought continued improvement in the U.S.; international economies remained challenged.
Strong fourth-quarter results by the U.S. stock market helped the S&P 500 Index deliver more than 50 record closes in 2014. The last several, in December, were spurred by investor optimism following Fed Chair Janet Yellen’s comment that the Fed would be patient in its timing of an interest-rate increase. U.S. stocks also were boosted by positive economic data. November’s 5.8% unemployment rate was down from 7.0% a year earlier, and the number of jobs being added continued to expand, keeping U.S. employers on pace to hire nearly three million workers during 2014. In addition, the U.S. economy’s third-quarter growth rate was revised upward during the quarter, to 5.0%—its fastest pace in 11 years. Meanwhile, U.S. companies continued to report strong earnings. The steadily brightening U.S. economy energized consumers, who were further buoyed by much lower prices at the gasoline pump. During the fourth quarter, gasoline prices fell to their lowest levels in five years, according to the American Automobile Association.
As the U.S. churned forward, major economies elsewhere in the world faced significant ongoing challenges. In China, where growth had been slowing for some time, government regulators in December announced changes being made in an effort to stimulate growth. In Japan, which slid back into recession in the third quarter of 2014, Prime Minister Abe gained approval in late December for roughly $29 billion in fresh stimulus to help the economy. In the eurozone, growth remained sluggish, and member countries continued to face an environment of low demand, high unemployment, and weak business investment. This situation
| 1 | The S&P 500 Index consists of 500 stocks chosen for market size, liquidity, and industry group representation. It is a market-value-weighted index with each stock’s weight in the index proportionate to its market value. You cannot invest directly in an index. |
| | | | | | |
| Letter to shareholders (unaudited) | | Wells Fargo Advantage Endeavor Select Fund | | | 3 | |
was exacerbated in December by renewed concerns about Greece after its parliament failed to avert a general election that could jeopardize the terms of the country’s financial agreement with its international creditors. In Russia, the economy contracted for the first time since October 2009 as the country struggled under the weight of slumping oil prices, international sanctions, and massive outflows of capital.
Market volatility increased in January 2015.
Markets fluctuated in January as investors reacted to geopolitical developments and new economic data. Mid-month, the World Bank lowered its outlook for global growth based on deepening problems in the eurozone and emerging markets, stating that a strengthening U.S. economy could not, by itself, support the global economy. Later in January, Greek voters gave control of their government to opposition party Syriza, which promised to end austerity and insisted that Greece’s massive debt be renegotiated. In the U.S., various data released in January, such as consumer confidence and December’s jobless rate, showed improvement. On the last trading day of the month, however, investors learned that fourth-quarter 2014 U.S. economic growth was estimated at 2.6%, which was below consensus and lower than the 4.6% and 5.0% growth rates, respectively, for the second and third quarters of 2014.
Don’t let short-term uncertainty derail long-term investment goals.
Periods of uncertainty can present challenges, but experience has taught us that maintaining long-term investment goals can be an effective way to plan for the future. To help you create a sound strategy based on your personal goals and risk tolerance, Wells Fargo Advantage Funds offers more than 100 mutual funds spanning a wide range of asset classes and investment styles. Although diversification cannot guarantee an investment profit or prevent losses, we believe it can be an effective way to manage investment risk and potentially smooth out overall portfolio performance. We encourage investors to know their investments and to understand that appropriate levels of risk-taking may unlock opportunities.
Thank you for choosing to invest with Wells Fargo Advantage Funds. We appreciate your confidence in us and remain committed to helping you meet your financial needs. For current information about your fund investments, contact your investment professional, visit our website at wellsfargoadvantagefunds.com, or call us directly at 1-800-222-8222. We are available 24 hours a day, 7 days a week.
Sincerely,

Karla M. Rabusch
President
Wells Fargo Advantage Funds
We encourage investors to know their investments and to understand that appropriate levels of risk-taking may unlock opportunities.
| | | | |
| 4 | | Wells Fargo Advantage Endeavor Select Fund | | Performance highlights (unaudited) |
Investment objective
The Fund seeks long-term capital appreciation.
Adviser
Wells Fargo Funds Management, LLC
Subadviser
Wells Capital Management Incorporated
Portfolio managers
Thomas J. Pence, CFA
Michael T. Smith, CFA
Average annual total returns1 (%) as of January 31, 2015
| | | | | | | | | | | | | | | | | | | | | | | | | | | | | | | | | | |
| | | | | Including sales charge | | | Excluding sales charge | | | Expense ratios2 (%) | |
| | | Inception date | | 1 year | | | 5 year | | | 10 year | | | 1 year | | | 5 year | | | 10 year | | | Gross | | | Net3 | |
| Class A (STAEX) | | 12-29-2000 | | | 1.62 | | | | 13.49 | | | | 5.98 | | | | 7.80 | | | | 14.83 | | | | 6.61 | | | | 1.25 | | | | 1.25 | |
| Class B (WECBX)* | | 12-29-2000 | | | 1.88 | | | | 13.71 | | | | 6.04 | | | | 6.88 | | | | 13.95 | | | | 6.04 | | | | 2.00 | | | | 2.00 | |
| Class C (WECCX) | | 12-29-2000 | | | 5.96 | | | | 13.97 | | | | 5.80 | | | | 6.96 | | | | 13.97 | | | | 5.80 | | | | 2.00 | | | | 2.00 | |
| Administrator Class (WECDX) | | 4-8-2005 | | | – | | | | – | | | | – | | | | 8.00 | | | | 15.11 | | | | 6.87 | | | | 1.09 | | | | 1.00 | |
| Institutional Class (WFCIX) | | 4-8-2005 | | | – | | | | – | | | | – | | | | 8.25 | | | | 15.34 | | | | 7.07 | | | | 0.82 | | | | 0.80 | |
| Russell 1000® Growth Index4 | | – | | | – | | | | – | | | | – | | | | 14.59 | | | | 16.49 | | | | 8.69 | | | | – | | | | – | |
| * | | Class B shares are closed to investment, except in connection with the reinvestment of any distributions and permitted exchanges. |
Figures quoted represent past performance, which is no guarantee of future results, and do not reflect taxes that a shareholder may pay on fund distributions or the redemption of fund shares. Investment return and principal value of an investment will fluctuate so that an investor’s shares, when redeemed, may be worth more or less than their original cost. Performance shown without sales charges would be lower if sales charges were reflected. Current performance may be lower or higher than the performance data quoted, which assumes the reinvestment of dividends and capital gains. Current month-end performance is available on the Fund’s website, wellsfargoadvantagefunds.com.
Index returns do not include transaction costs associated with buying and selling securities, any mutual fund fees or expenses, or any taxes. It is not possible to invest directly in an index.
For Class A shares, the maximum front-end sales charge is 5.75%. For Class B shares, the maximum contingent deferred sales charge is 5.00%. For Class C shares, the maximum contingent deferred sales charge is 1.00%. Performance including a contingent deferred sales charge assumes the sales charge for the corresponding time period. Administrator Class and Institutional Class shares are sold without a front-end sales charge or contingent deferred sales charge.
Stock values fluctuate in response to the activities of individual companies and general market and economic conditions. Certain investment strategies tend to increase the total risk of an investment (relative to the broader market). The Fund is exposed to foreign investment risk and focused portfolio risk. Consult the Fund’s prospectus for additional information on these and other risks.
Please see footnotes on page 5.
| | | | | | |
| Performance highlights (unaudited) | | Wells Fargo Advantage Endeavor Select Fund | | | 5 | |
| | | | |
| Ten largest equity holdings5 (%) as of January 31, 2015 | |
Apple Incorporated | | | 6.64 | |
Facebook Incorporated Class A | | | 4.73 | |
SBA Communications Corporation Class A | | | 3.33 | |
Comcast Corporation Class A | | | 3.32 | |
TJX Companies Incorporated | | | 3.21 | |
Visa Incorporated Class A | | | 3.03 | |
Liberty Global plc Class C | | | 3.01 | |
McKesson Corporation | | | 2.94 | |
Biogen Idec Incorporated | | | 2.92 | |
Gilead Sciences Incorporated | | | 2.86 | |
|
| Sector distribution6 as of January 31, 2015 |
|
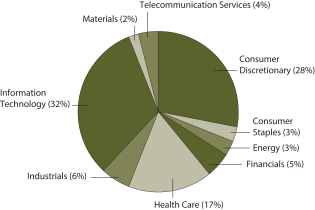 |
| 1 | Historical performance shown for Administrator Class shares and Institutional Class shares prior to their inception reflects the performance of Class A shares, and includes the higher expenses applicable to Class A shares. If these expenses had not been included, returns would be higher. |
| 2 | Reflects the expense ratios as stated in the most recent prospectuses. The expense ratios shown are subject to change and may differ from the annualized expense ratios shown in the financial highlights of this report. |
| 3 | The Adviser has committed through November 30, 2015, to waive fees and/or reimburse expenses to the extent necessary to cap the Fund’s Total Annual Fund Operating Expenses After Fee Waiver, excluding certain expenses, at the amounts shown. After this time, the cap may be increased or the commitment to maintain the cap may be terminated only with the approval of the Board of Trustees. Brokerage commissions, stamp duty fees, interest, taxes, acquired fund fees and expenses, and extraordinary expenses are excluded from the cap. Without this cap, the Fund’s returns would have been lower. |
| 4 | The Russell 1000® Growth Index measures the performance of those Russell 1000 Index companies with higher price-to-book ratios and higher forecasted growth values. You cannot invest directly in an index. |
| 5 | The ten largest equity holdings are calculated based on the value of the securities divided by total net assets of the Fund. Holdings are subject to change and may have changed since the date specified. |
| 6 | Amounts are calculated based on the total long-term investments of the Fund. These percentages are subject to change and may have changed since the date specified. |
| | | | |
| 6 | | Wells Fargo Advantage Endeavor Select Fund | | Fund expenses (unaudited) |
As a shareholder of the Fund, you incur two types of costs: (1) transaction costs, including sales charges (loads) on purchase payments and contingent deferred sales charges (if any) on redemptions and (2) ongoing costs, including management fees, distribution (12b-1) and/or shareholder service fees, and other Fund expenses. This example is intended to help you understand your ongoing costs (in dollars) of investing in the Fund and to compare these costs with the ongoing costs of investing in other mutual funds.
The example is based on an investment of $1,000 invested at the beginning of the six-month period and held for the entire period from August 1, 2014 to January 31, 2015.
Actual expenses
The “Actual” line of the table below provides information about actual account values and actual expenses. You may use the information in this line, together with the amount you invested, to estimate the expenses that you paid over the period. Simply divide your account value by $1,000 (for example, an $8,600 account value divided by $1,000 = 8.6), then multiply the result by the number in the “Actual” line under the heading entitled “Expenses paid during period” for your applicable class of shares to estimate the expenses you paid on your account during this period.
Hypothetical example for comparison purposes
The “Hypothetical” line of the table below provides information about hypothetical account values and hypothetical expenses based on the Fund’s actual expense ratio and an assumed rate of return of 5% per year before expenses, which is not the Fund’s actual return. The hypothetical account values and expenses may not be used to estimate the actual ending account balance or expenses you paid for the period. You may use this information to compare the ongoing costs of investing in the Fund and other funds. To do so, compare this 5% hypothetical example with the 5% hypothetical examples that appear in the shareholder reports of the other funds.
Please note that the expenses shown in the table are meant to highlight your ongoing costs only and do not reflect any transactional costs, such as sales charges (loads) and contingent deferred sales charges. Therefore, the “Hypothetical” line of the table is useful in comparing ongoing costs only and will not help you determine the relative total costs of owning different funds. In addition, if these transactional costs were included, your costs would have been higher.
| | | | | | | | | | | | | | | | |
| | | Beginning account value 8-1-2014 | | | Ending account value 1-31-2015 | | | Expenses paid during the period¹ | | | Net annualized expense ratio | |
Class A | | | | | | | | | | | | | | | | |
Actual | | $ | 1,000.00 | | | $ | 1,041.37 | | | $ | 6.33 | | | | 1.23 | % |
Hypothetical (5% return before expenses) | | $ | 1,000.00 | | | $ | 1,019.00 | | | $ | 6.26 | | | | 1.23 | % |
Class B | | | | | | | | | | | | | | | | |
Actual | | $ | 1,000.00 | | | $ | 1,036.58 | | | $ | 10.22 | | | | 1.99 | % |
Hypothetical (5% return before expenses) | | $ | 1,000.00 | | | $ | 1,015.17 | | | $ | 10.11 | | | | 1.99 | % |
Class C | | | | | | | | | | | | | | | | |
Actual | | $ | 1,000.00 | | | $ | 1,036.55 | | | $ | 10.22 | | | | 1.99 | % |
Hypothetical (5% return before expenses) | | $ | 1,000.00 | | | $ | 1,015.17 | | | $ | 10.11 | | | | 1.99 | % |
Administrator Class | | | | | | | | | | | | | | | | |
Actual | | $ | 1,000.00 | | | $ | 1,041.84 | | | $ | 5.15 | | | | 1.00 | % |
Hypothetical (5% return before expenses) | | $ | 1,000.00 | | | $ | 1,020.16 | | | $ | 5.09 | | | | 1.00 | % |
Institutional Class | | | | | | | | | | | | | | | | |
Actual | | $ | 1,000.00 | | | $ | 1,043.32 | | | $ | 4.12 | | | | 0.80 | % |
Hypothetical (5% return before expenses) | | $ | 1,000.00 | | | $ | 1,021.17 | | | $ | 4.08 | | | | 0.80 | % |
| 1 | Expenses paid is equal to the annualized expense ratio of each class multiplied by the average account value over the period, multiplied by the number of days in the most recent fiscal half-year divided by the number of days in the fiscal year (to reflect the one-half-year period). |
| | | | | | |
| Portfolio of investments—January 31, 2015 (unaudited) | | Wells Fargo Advantage Endeavor Select Fund | | | 7 | |
| | | | | | | | | | | | |
| Security name | | | | | | Shares | | | Value | |
| | | | |
Common Stocks: 93.54% | | | | | | | | | | | | |
| | | | |
Consumer Discretionary: 26.50% | | | | | | | | | | | | |
| | | | |
| Auto Components: 1.51% | | | | | | | | | | | | |
Delphi Automotive plc | | | | | | | 148,800 | | | $ | 10,227,024 | |
| | | | | | | | | | | | |
| | | | |
| Hotels, Restaurants & Leisure: 2.58% | | | | | | | | | | | | |
Chipotle Mexican Grill Incorporated † | | | | | | | 24,700 | | | | 17,533,048 | |
| | | | | | | | | | | | |
| | | | |
| Internet & Catalog Retail: 1.84% | | | | | | | | | | | | |
Amazon.com Incorporated † | | | | | | | 35,300 | | | | 12,514,909 | |
| | | | | | | | | | | | |
| | | | |
| Leisure Products: 2.29% | | | | | | | | | | | | |
Polaris Industries Incorporated | | | | | | | 107,500 | | | | 15,543,425 | |
| | | | | | | | | | | | |
| | | | |
| Media: 10.25% | | | | | | | | | | | | |
Comcast Corporation Class A | | | | | | | 423,600 | | | | 22,512,222 | |
Liberty Global plc Class C † | | | | | | | 447,800 | | | | 20,415,202 | |
Time Warner Incorporated | | | | | | | 175,800 | | | | 13,700,094 | |
Twenty-First Century Fox Incorporated | | | | | | | 390,300 | | | | 12,942,348 | |
| | | | |
| | | | | | | | | | | 69,569,866 | |
| | | | | | | | | | | | |
| | | | |
| Specialty Retail: 3.21% | | | | | | | | | | | | |
TJX Companies Incorporated | | | | | | | 331,000 | | | | 21,826,140 | |
| | | | | | | | | | | | |
| | | | |
| Textiles, Apparel & Luxury Goods: 4.82% | | | | | | | | | | | | |
Nike Incorporated Class B | | | | | | | 158,200 | | | | 14,593,950 | |
Under Armour Incorporated Class A † | | | | | | | 251,500 | | | | 18,128,120 | |
| | | | |
| | | | | | | | | | | 32,722,070 | |
| | | | | | | | | | | | |
| | | | |
Consumer Staples: 2.43% | | | | | | | | | | | | |
| | | | |
| Beverages: 2.43% | | | | | | | | | | | | |
Constellation Brands Incorporated Class A † | | | | | | | 149,300 | | | | 16,490,185 | |
| | | | | | | | | | | | |
| | | | |
Energy: 2.44% | | | | | | | | | | | | |
| | | | |
| Oil, Gas & Consumable Fuels: 2.44% | | | | | | | | | | | | |
Pioneer Natural Resources Company | | | | | | | 110,000 | | | | 16,558,300 | |
| | | | | | | | | | | | |
| | | | |
Financials: 4.87% | | | | | | | | | | | | |
| | | | |
| Capital Markets: 2.31% | | | | | | | | | | | | |
Affiliated Managers Group Incorporated † | | | | | | | 76,400 | | | | 15,701,728 | |
| | | | | | | | | | | | |
| | | | |
| Diversified Financial Services: 2.56% | | | | | | | | | | | | |
IntercontinentalExchange Group Incorporated | | | | | | | 84,500 | | | | 17,384,185 | |
| | | | | | | | | | | | |
| | | | |
Health Care: 15.52% | | | | | | | | | | | | |
| | | | |
| Biotechnology: 8.56% | | | | | | | | | | | | |
Biogen Idec Incorporated † | | | | | | | 51,000 | | | | 19,847,160 | |
Celgene Corporation † | | | | | | | 158,800 | | | | 18,922,608 | |
Gilead Sciences Incorporated † | | | | | | | 185,000 | | | | 19,393,550 | |
| | | | |
| | | | | | | | | | | 58,163,318 | |
| | | | | | | | | | | | |
The accompanying notes are an integral part of these financial statements.
| | | | |
| 8 | | Wells Fargo Advantage Endeavor Select Fund | | Portfolio of investments—January 31, 2015 (unaudited) |
| | | | | | | | | | | | |
| Security name | | | | | | Shares | | | Value | |
| | | | |
| Health Care Providers & Services: 2.94% | | | | | | | | | | | | |
McKesson Corporation | | | | | | | 93,800 | | | $ | 19,946,570 | |
| | | | | | | | | | | | |
| | | | |
| Pharmaceuticals: 4.02% | | | | | | | | | | | | |
AbbVie Incorporated | | | | | | | 186,679 | | | | 11,266,078 | |
Perrigo Company plc | | | | | | | 105,500 | | | | 16,008,570 | |
| | | | |
| | | | | | | | | | | 27,274,648 | |
| | | | | | | | | | | | |
| | | | |
Industrials: 6.08% | | | | | | | | | | | | |
| | | | |
| Airlines: 2.15% | | | | | | | | | | | | |
Delta Air Lines Incorporated | | | | | | | 309,200 | | | | 14,628,252 | |
| | | | | | | | | | | | |
| | | | |
| Road & Rail: 3.93% | | | | | | | | | | | | |
Canadian Pacific Railway Limited | | | | | | | 56,400 | | | | 9,851,388 | |
Union Pacific Corporation | | | | | | | 143,300 | | | | 16,796,193 | |
| | | | |
| | | | | | | | | | | 26,647,581 | |
| | | | | | | | | | | | |
| | | | |
Information Technology: 30.31% | | | | | | | | | | | | |
| | | | |
| Communications Equipment: 1.78% | | | | | | | | | | | | |
Palo Alto Networks Incorporated † | | | | | | | 95,836 | | | | 12,112,712 | |
| | | | | | | | | | | | |
| | | | |
| Electronic Equipment, Instruments & Components: 2.43% | | | | | | | | | | | | |
TE Connectivity Limited | | | | | | | 248,300 | | | | 16,484,637 | |
| | | | | | | | | | | | |
| | | | |
| Internet Software & Services: 8.76% | | | | | | | | | | | | |
Alibaba Group Holding Limited ADR † | | | | | | | 89,000 | | | | 7,928,120 | |
Facebook Incorporated Class A † | | | | | | | 423,200 | | | | 32,125,112 | |
Google Incorporated Class A † | | | | | | | 15,175 | | | | 8,157,321 | |
Google Incorporated Class C † | | | | | | | 21,075 | | | | 11,265,009 | |
| | | | |
| | | | | | | | | | | 59,475,562 | |
| | | | | | | | | | | | |
| | | | |
| IT Services: 3.03% | | | | | | | | | | | | |
Visa Incorporated Class A | | | | | | | 80,800 | | | | 20,596,728 | |
| | | | | | | | | | | | |
| | | | |
| Semiconductors & Semiconductor Equipment: 2.66% | | | | | | | | | | | | |
Micron Technology Incorporated † | | | | | | | 617,100 | | | | 18,059,432 | |
| | | | | | | | | | | | |
| | | | |
| Software: 3.05% | | | | | | | | | | | | |
ServiceNow Incorporated † | | | | | | | 150,300 | | | | 10,956,870 | |
Workday Incorporated Class A † | | | | | | | 123,100 | | | | 9,781,526 | |
| | | | |
| | | | | | | | | | | 20,738,396 | |
| | | | | | | | | | | | |
| | | | |
| Technology Hardware, Storage & Peripherals: 8.60% | | | | | | | | | | | | |
Apple Incorporated | | | | | | | 384,643 | | | | 45,064,774 | |
Western Digital Corporation | | | | | | | 136,800 | | | | 13,301,064 | |
| | | | |
| | | | | | | | | | | 58,365,838 | |
| | | | | | | | | | | | |
| | | | |
Materials: 2.06% | | | | | | | | | | | | |
| | | | |
| Chemicals: 2.06% | | | | | | | | | | | | |
Monsanto Company | | | | | | | 118,800 | | | | 14,016,024 | |
| | | | | | | | | | | | |
The accompanying notes are an integral part of these financial statements.
| | | | | | |
| Portfolio of investments—January 31, 2015 (unaudited) | | Wells Fargo Advantage Endeavor Select Fund | | | 9 | |
| | | | | | | | | | | | | | |
| Security name | | | | | | | Shares | | | Value | |
| | | | |
Telecommunication Services: 3.33% | | | | | | | | | | | | | | |
| | | | |
| Wireless Telecommunication Services: 3.33% | | | | | | | | | | | | | | |
SBA Communications Corporation Class A † | | | | | | | | | 193,779 | | | $ | 22,614,009 | |
| | | | | | | | | | | | | | |
| | | | |
Total Common Stocks (Cost $489,917,570) | | | | | | | | | | | | | 635,194,587 | |
| | | | | | | | | | | | | | |
| | | | |
| | | Yield | | | | | | | | | |
| Short-Term Investments: 4.12% | | | | | | | | | | | | | | |
| | | | |
| Investment Companies: 4.12% | | | | | | | | | | | | | | |
Wells Fargo Advantage Cash Investment Money Market Fund, Select Class (l)(u) | | | 0.10 | % | | | | | 27,995,586 | | | | 27,995,586 | |
| | | | | | | | | | | | | | |
| | | | |
Total Short-Term Investments (Cost $27,995,586) | | | | | | | | | | | | | 27,995,586 | |
| | | | | | | | | | | | | | |
| | | | | | | | |
| Total investments in securities (Cost $517,913,156) * | | | 97.66 | % | | | 663,190,173 | |
Other assets and liabilities, net | | | 2.34 | | | | 15,857,035 | |
| | | | | | | | |
| Total net assets | | | 100.00 | % | | $ | 679,047,208 | |
| | | | | | | | |
| † | Non-income-earning security |
| (u) | The rate represents the 7-day annualized yield at period end. |
| (l) | The security represents an affiliate of the Fund as defined in the Investment Company Act of 1940. |
| * | Cost for federal income tax purposes is $518,457,925 and unrealized gains (losses) consists of: |
| | | | |
Gross unrealized gains | | $ | 152,449,600 | |
Gross unrealized losses | | | (7,717,352 | ) |
| | | | |
Net unrealized gains | | $ | 144,732,248 | |
The accompanying notes are an integral part of these financial statements.
| | | | |
| 10 | | Wells Fargo Advantage Endeavor Select Fund | | Statement of assets and liabilities—January 31, 2015 (unaudited) |
| | | | |
| | | | |
| |
Assets | | | | |
Investments | | | | |
In unaffiliated securities, at value (cost $489,917,570) | | $ | 635,194,587 | |
In affiliated securities, at value (cost $27,995,586) | | | 27,995,586 | |
| | | | |
Total investments, at value (cost $517,913,156) | | | 663,190,173 | |
Receivable for investments sold | | | 16,022,354 | |
Receivable for Fund shares sold | | | 607,141 | |
Receivable for dividends | | | 320,298 | |
Receivable for securities lending income | | | 266 | |
Prepaid expenses and other assets | | | 35,550 | |
| | | | |
Total assets | | | 680,175,782 | |
| | | | |
| |
Liabilities | | | | |
Payable for Fund shares redeemed | | | 542,299 | |
Advisory fee payable | | | 391,444 | |
Distribution fees payable | | | 4,798 | |
Administration fees payable | | | 86,521 | |
Accrued expenses and other liabilities | | | 103,512 | |
| | | | |
Total liabilities | | | 1,128,574 | |
| | | | |
Total net assets | | $ | 679,047,208 | |
| | | | |
| |
NET ASSETS CONSIST OF | | | | |
Paid-in capital | | $ | 518,179,940 | |
Accumulated net investment loss | | | (453,974 | ) |
Accumulated net realized gains on investments | | | 16,045,985 | |
Net unrealized gains on investments | | | 145,275,257 | |
| | | | |
Total net assets | | $ | 679,047,208 | |
| | | | |
| |
COMPUTATION OF NET ASSET VALUE AND OFFERING PRICE PER SHARE | | | | |
Net assets – Class A | | $ | 29,228,534 | |
Shares outstanding – Class A1 | | | 2,291,287 | |
Net asset value per share – Class A | | | $12.76 | |
Maximum offering price per share – Class A2 | | | $13.54 | |
Net assets – Class B | | $ | 144,975 | |
Shares outstanding – Class B1 | | | 13,042 | |
Net asset value per share – Class B | | | $11.12 | |
Net assets – Class C | | $ | 6,846,873 | |
Shares outstanding – Class C1 | | | 615,726 | |
Net asset value per share – Class C | | | $11.12 | |
Net assets – Administrator Class | | $ | 45,842,754 | |
Shares outstanding – Administrator Class1 | | | 3,499,418 | |
Net asset value per share – Administrator Class | | | $13.10 | |
Net assets – Institutional Class | | $ | 596,984,072 | |
Shares outstanding – Institutional Class1 | | | 44,791,861 | |
Net asset value per share – Institutional Class | | | $13.33 | |
| 1 | The Fund has an unlimited number of authorized shares. |
| 2 | Maximum offering price is computed as 100/94.25 of net asset value. On investments of $50,000 or more, the offering price is reduced. |
The accompanying notes are an integral part of these financial statements.
| | | | | | |
| Statement of operations—six months ended January 31, 2015 (unaudited) | | Wells Fargo Advantage Endeavor Select Fund | | | 11 | |
| | | | |
| | | | |
| |
Investment income | | | | |
Dividends (net of foreign withholding taxes of $7,528) | | $ | 2,602,402 | |
Securities lending income, net | | | 6,225 | |
Income from affiliated securities | | | 3,502 | |
| | | | |
Total investment income | | | 2,612,129 | |
| | | | |
| |
Expenses | | | | |
Advisory fee | | | 2,329,082 | |
Administration fees | | | | |
Fund level | | | 181,258 | |
Class A | | | 43,995 | |
Class B | | | 283 | |
Class C | | | 9,094 | |
Administrator Class | | | 24,572 | |
Institutional Class | | | 253,933 | |
Shareholder servicing fees | | | | |
Class A | | | 42,303 | |
Class B | | | 272 | |
Class C | | | 8,744 | |
Administrator Class | | | 58,926 | |
Distribution fees | | | | |
Class B | | | 817 | |
Class C | | | 26,233 | |
Custody and accounting fees | | | 22,129 | |
Professional fees | | | 21,822 | |
Registration fees | | | 31,852 | |
Shareholder report expenses | | | 31,093 | |
Trustees’ fees and expenses | | | 6,053 | |
Interest expense | | | 1,146 | |
Other fees and expenses | | | 6,770 | |
| | | | |
Total expenses | | | 3,100,377 | |
Less: Fee waivers and/or expense reimbursements | | | (34,274 | ) |
| | | | |
Net expenses | | | 3,066,103 | |
| | | | |
Net investment loss | | | (453,974 | ) |
| | | | |
| |
REALIZED AND UNREALIZED GAINS (LOSSES) ON INVESTMENTS | | | | |
Net realized gains on investments | | | 27,180,115 | |
Net change in unrealized gains (losses) on investments | | | 3,197,326 | |
| | | | |
Net realized and unrealized gains (losses) on investments | | | 30,377,441 | |
| | | | |
Net increase in net assets resulting from operations | | $ | 29,923,467 | |
| | | | |
The accompanying notes are an integral part of these financial statements.
| | | | |
| 12 | | Wells Fargo Advantage Endeavor Select Fund | | Statement of changes in net assets |
| | | | | | | | | | | | | | | | |
| | | Six months ended
January 31, 2015
(unaudited) | | | Year ended
July 31, 2014 | |
| | | |
Operations | | | | | | | | | | | | |
Net investment loss | | | | | | $ | (453,974 | ) | | | | | | $ | (1,901,929 | ) |
Net realized gains on investments | | | | | | | 27,180,115 | | | | | | | | 115,526,129 | |
Net change in unrealized gains (losses) on investments | | | | | | | 3,197,326 | | | | | | | | 3,258,076 | |
| | | | |
Net increase in net assets resulting from operations | | | | | | | 29,923,467 | | | | | | | | 116,882,276 | |
| | | | |
| | | |
Distributions to shareholders from | | | | | | | | | | | | |
Net investment income | | | | | | | | | | | | | | | | |
Administrator Class | | | | | | | 0 | | | | | | | | (97,085 | ) |
Institutional Class | | | | | | | 0 | | | | | | | | (2,001,641 | ) |
Net realized gains | | | | | | | | | | | | | | | | |
Class A | | | | | | | (4,180,367 | ) | | | | | | | (2,203,445 | ) |
Class B | | | | | | | (29,782 | ) | | | | | | | (22,001 | ) |
Class C | | | | | | | (1,041,460 | ) | | | | | | | (364,783 | ) |
Administrator Class | | | | | | | (6,299,282 | ) | | | | | | | (2,987,418 | ) |
Institutional Class | | | | | | | (81,434,953 | ) | | | | | | | (26,344,957 | ) |
| | | | |
Total distributions to shareholders | | | | | | | (92,985,844 | ) | | | | | | | (34,021,330 | ) |
| | | | |
| | | | |
Capital share transactions | | | Shares | | | | | | | | Shares | | | | | |
Proceeds from shares sold | | | | | | | | | | | | | | | | |
Class A | | | 90,947 | | | | 1,266,080 | | | | 262,020 | | | | 3,578,072 | |
Class B | | | 0 | | | | 0 | | | | 2,013 | | | | 24,431 | |
Class C | | | 51,262 | | | | 603,879 | | | | 57,270 | | | | 710,640 | |
Administrator Class | | | 257,860 | | | | 3,638,589 | | | | 487,193 | | | | 6,799,164 | |
Institutional Class | | | 3,362,165 | | | | 48,878,991 | | | | 9,878,304 | | | | 139,039,120 | |
| | | | |
| | | | | | | 54,387,539 | | | | | | | | 150,151,427 | |
| | | | |
Reinvestment of distributions | | | | | | | | | | | | | | | | |
Class A | | | 314,153 | | | | 4,011,740 | | | | 158,036 | | | | 2,144,550 | |
Class B | | | 2,673 | | | | 29,782 | | | | 1,707 | | | | 20,756 | |
Class C | | | 91,245 | | | | 1,017,377 | | | | 29,369 | | | | 357,128 | |
Administrator Class | | | 479,088 | | | | 6,280,838 | | | | 194,103 | | | | 2,691,721 | |
Institutional Class | | | 5,829,180 | | | | 77,761,267 | | | | 1,890,146 | | | | 26,598,582 | |
| | | | |
| | | | | | | 89,101,004 | | | | | | | | 31,812,737 | |
| | | | |
Payment for shares redeemed | | | | | | | | | | | | | | | | |
Class A | | | (1,064,799 | ) | | | (15,047,007 | ) | | | (985,474 | ) | | | (13,604,809 | ) |
Class B | | | (9,306 | ) | | | (111,588 | ) | | | (27,816 | ) | | | (338,489 | ) |
Class C | | | (62,006 | ) | | | (723,428 | ) | | | (109,981 | ) | | | (1,352,148 | ) |
Administrator Class | | | (599,000 | ) | | | (8,356,802 | ) | | | (2,689,608 | ) | | | (37,603,302 | ) |
Institutional Class | | | (6,618,237 | ) | | | (92,905,507 | ) | | | (8,839,212 | ) | | | (124,313,851 | ) |
| | | | |
| | | | | | | (117,144,332 | ) | | | | | | | (177,212,599 | ) |
| | | | |
Net increase in net assets resulting from capital share transactions | | | | | | | 26,344,211 | | | | | | | | 4,751,565 | |
| | | | |
Total increase (decrease) in net assets | | | | | | | (36,718,166 | ) | | | | | | | 87,612,511 | |
| | | | |
| | |
Net assets | | | | | | | | |
Beginning of period | | | | | | | 715,765,374 | | | | | | | | 628,152,863 | |
| | | | |
End of period | | | | | | $ | 679,047,208 | | | | | | | $ | 715,765,374 | |
| | | | |
Undistributed (accumulated) net investment income (loss) | | | | | | $ | (453,974 | ) | | | | | | $ | 0 | |
| | | | |
The accompanying notes are an integral part of these financial statements.
| | | | | | |
| Financial highlights | | Wells Fargo Advantage Endeavor Select Fund | | | 13 | |
(For a share outstanding throughout each period)
| | | | | | | | | | | | | | | | | | | | | | | | |
| | | Six months ended
January 31, 2015 (unaudited) | | | Year ended July 31 | |
| CLASS A | | | 2014 | | | 2013 | | | 2012 | | | 2011 | | | 2010 | |
Net asset value, beginning of period | | | $14.13 | | | | $12.52 | | | | $10.45 | | | | $10.12 | | | | $8.12 | | | | $7.25 | |
Net investment income (loss) | | | (0.04 | )1 | | | (0.09 | )1 | | | 0.00 | 1,2 | | | (0.05 | )1 | | | (0.05 | )1 | | | (0.04 | )1 |
Net realized and unrealized gains (losses) on investments | | | 0.63 | | | | 2.37 | | | | 2.07 | | | | 0.38 | | | | 2.05 | | | | 0.91 | |
| | | | | | | | | | | | | | | | | | | | | | | | |
Total from investment operations | | | 0.59 | | | | 2.28 | | | | 2.07 | | | | 0.33 | | | | 2.00 | | | | 0.87 | |
Distributions to shareholders from | | | | | | | | | | | | | | | | | | | | | | | | |
Net realized gains | | | (1.96 | ) | | | (0.67 | ) | | | 0.00 | | | | 0.00 | | | | 0.00 | | | | 0.00 | |
Net asset value, end of period | | | $12.76 | | | | $14.13 | | | | $12.52 | | | | $10.45 | | | | $10.12 | | | | $8.12 | |
Total return3 | | | 4.14 | % | | | 18.40 | % | | | 19.81 | % | | | 3.26 | % | | | 24.63 | % | | | 12.00 | % |
Ratios to average net assets (annualized) | | | | | | | | | | | | | | | | | | | | | | | | |
Gross expenses | | | 1.23 | % | | | 1.25 | % | | | 1.26 | % | | | 1.23 | % | | | 1.23 | % | | | 1.28 | % |
Net expenses | | | 1.23 | % | | | 1.24 | % | | | 1.25 | % | | | 1.23 | % | | | 1.23 | % | | | 1.25 | % |
Net investment income (loss) | | | (0.50 | )% | | | (0.66 | )% | | | 0.03 | % | | | (0.49 | )% | | | (0.52 | )% | | | (0.51 | )% |
Supplemental data | | | | | | | | | | | | | | | | | | | | | | | | |
Portfolio turnover rate | | | 38 | % | | | 100 | % | | | 97 | % | | | 94 | % | | | 100 | % | | | 139 | % |
Net assets, end of period (000s omitted) | | $ | 29,229 | | | $ | 41,708 | | | $ | 44,041 | | | $ | 47,233 | | | $ | 94,704 | | | $ | 125,266 | |
| 1 | Calculated based upon average shares outstanding |
| 2 | Amount is less than $0.005. |
| 3 | Total return calculations do not include any sales charges. Returns for periods of less than one year are not annualized. |
The accompanying notes are an integral part of these financial statements.
| | | | |
| 14 | | Wells Fargo Advantage Endeavor Select Fund | | Financial highlights |
(For a share outstanding throughout each period)
| | | | | | | | | | | | | | | | | | | | | | | | |
| | | Six months ended
January 31, 2015 (unaudited) | | | Year ended July 31 | |
| CLASS B | | | 2014 | | | 2013 | | | 2012 | | | 2011 | | | 2010 | |
Net asset value, beginning of period | | | $12.60 | | | | $11.31 | | | | $9.51 | | | | $9.28 | | | | $7.50 | | | | $6.75 | |
Net investment loss | | | (0.08 | )1 | | | (0.17 | )1 | | | (0.07 | )1 | | | (0.11 | )1 | | | (0.11 | )1 | | | (0.09 | )1 |
Net realized and unrealized gains (losses) on investments | | | 0.56 | | | | 2.13 | | | | 1.87 | | | | 0.34 | | | | 1.89 | | | | 0.84 | |
| | | | | | | | | | | | | | | | | | | | | | | | |
Total from investment operations | | | 0.48 | | | | 1.96 | | | | 1.80 | | | | 0.23 | | | | 1.78 | | | | 0.75 | |
Distributions to shareholders from | | | | | | | | | | | | | | | | | | | | | | | | |
Net realized gains | | | (1.96 | ) | | | (0.67 | ) | | | 0.00 | | | | 0.00 | | | | 0.00 | | | | 0.00 | |
Net asset value, end of period | | | $11.12 | | | | $12.60 | | | | $11.31 | | | | $9.51 | | | | $9.28 | | | | $7.50 | |
Total return2 | | | 3.66 | % | | | 17.50 | % | | | 18.93 | % | | | 2.48 | % | | | 23.73 | % | | | 11.11 | % |
Ratios to average net assets (annualized) | | | | | | | | | | | | | | | | | | | | | | | | |
Gross expenses | | | 1.99 | % | | | 2.00 | % | | | 2.00 | % | | | 1.98 | % | | | 1.98 | % | | | 2.02 | % |
Net expenses | | | 1.99 | % | | | 1.99 | % | | | 2.00 | % | | | 1.98 | % | | | 1.98 | % | | | 2.00 | % |
Net investment loss | | | (1.24 | )% | | | (1.41 | )% | | | (0.67 | )% | | | (1.24 | )% | | | (1.26 | )% | | | (1.25 | )% |
Supplemental data | | | | | | | | | | | | | | | | | | | | | | | | |
Portfolio turnover rate | | | 38 | % | | | 100 | % | | | 97 | % | | | 94 | % | | | 100 | % | | | 139 | % |
Net assets, end of period (000s omitted) | | $ | 145 | | | $ | 248 | | | $ | 495 | | | $ | 1,095 | | | $ | 1,633 | | | $ | 2,622 | |
| 1 | Calculated based upon average shares outstanding |
| 2 | Total return calculations do not include any sales charges. Returns for periods of less than one year are not annualized. |
The accompanying notes are an integral part of these financial statements.
| | | | | | |
| Financial highlights | | Wells Fargo Advantage Endeavor Select Fund | | | 15 | |
(For a share outstanding throughout each period)
| | | | | | | | | | | | | | | | | | | | | | | | |
| | | Six months ended
January 31, 2015 (unaudited) | | | Year ended July 31 | |
| CLASS C | | | 2014 | | | 2013 | | | 2012 | | | 2011 | | | 2010 | |
Net asset value, beginning of period | | | $12.61 | | | | $11.32 | | | | $9.51 | | | | $9.28 | | | | $7.50 | | | | $6.75 | |
Net investment loss | | | (0.08 | )1 | | | (0.17 | )1 | | | (0.07 | )1 | | | (0.11 | )1 | | | (0.11 | )1 | | | (0.09 | )1 |
Net realized and unrealized gains (losses) on investments | | | 0.55 | | | | 2.13 | | | | 1.88 | | | | 0.34 | | | | 1.89 | | | | 0.84 | |
| | | | | | | | | | | | | | | | | | | | | | | | |
Total from investment operations | | | 0.47 | | | | 1.96 | | | | 1.81 | | | | 0.23 | | | | 1.78 | | | | 0.75 | |
Distributions to shareholders from | | | | | | | | | | | | | | | | | | | | | | | | |
Net realized gains | | | (1.96 | ) | | | (0.67 | ) | | | 0.00 | | | | 0.00 | | | | 0.00 | | | | 0.00 | |
Net asset value, end of period | | | $11.12 | | | | $12.61 | | | | $11.32 | | | | $9.51 | | | | $9.28 | | | | $7.50 | |
Total return2 | | | 3.65 | % | | | 17.60 | % | | | 18.93 | % | | | 2.48 | % | | | 23.73 | % | | | 11.11 | % |
Ratios to average net assets (annualized) | | | | | | | | | | | | | | | | | | | | | | | | |
Gross expenses | | | 1.99 | % | | | 2.00 | % | | | 2.01 | % | | | 1.98 | % | | | 1.98 | % | | | 2.03 | % |
Net expenses | | | 1.99 | % | | | 1.99 | % | | | 2.00 | % | | | 1.98 | % | | | 1.98 | % | | | 2.00 | % |
Net investment loss | | | (1.27 | )% | | | (1.41 | )% | | | (0.72 | )% | | | (1.25 | )% | | | (1.27 | )% | | | (1.26 | )% |
Supplemental data | | | | | | | | | | | | | | | | | | | | | | | | |
Portfolio turnover rate | | | 38 | % | | | 100 | % | | | 97 | % | | | 94 | % | | | 100 | % | | | 139 | % |
Net assets, end of period (000s omitted) | | $ | 6,847 | | | $ | 6,747 | | | $ | 6,320 | | | $ | 6,199 | | | $ | 7,448 | | | $ | 7,825 | |
| 1 | Calculated based upon average shares outstanding |
| 2 | Total return calculations do not include any sales charges. Returns for periods of less than one year are not annualized. |
The accompanying notes are an integral part of these financial statements.
| | | | |
| 16 | | Wells Fargo Advantage Endeavor Select Fund | | Financial highlights |
(For a share outstanding throughout each period)
| | | | | | | | | | | | | | | | | | | | | | | | |
| | | Six months ended
January 31, 2015 (unaudited) | | | Year ended July 31 | |
| ADMINISTRATOR CLASS | | | 2014 | | | 2013 | | | 2012 | | | 2011 | | | 2010 | |
Net asset value, beginning of period | | | $14.45 | | | | $12.78 | | | | $10.63 | | | | $10.26 | | | | $8.22 | | | | $7.34 | |
Net investment income (loss) | | | (0.02 | )1 | | | (0.06 | )1 | | | 0.03 | 1 | | | (0.03 | )1 | | | (0.03 | )1 | | | (0.02 | )1 |
Net realized and unrealized gains (losses) on investments | | | 0.63 | | | | 2.42 | | | | 2.12 | | | | 0.40 | | | | 2.07 | | | | 0.91 | |
| | | | | | | | | | | | | | | | | | | | | | | | |
Total from investment operations | | | 0.61 | | | | 2.36 | | | | 2.15 | | | | 0.37 | | | | 2.04 | | | | 0.89 | |
Distributions to shareholders from | | | | | | | | | | | | | | | | | | | | | | | | |
Net investment income | | | 0.00 | | | | (0.02 | ) | | | 0.00 | | | | 0.00 | | | | 0.00 | | | | (0.01 | ) |
Net realized gains | | | (1.96 | ) | | | (0.67 | ) | | | 0.00 | | | | 0.00 | | | | 0.00 | | | | 0.00 | |
| | | | | | | | | | | | | | | | | | | | | | | | |
Total distributions to shareholders | | | (1.96 | ) | | | (0.69 | ) | | | 0.00 | | | | 0.00 | | | | 0.00 | | | | (0.01 | ) |
Net asset value, end of period | | | $13.10 | | | | $14.45 | | | | $12.78 | | | | $10.63 | | | | $10.26 | | | | $8.22 | |
Total return2 | | | 4.18 | % | | | 18.77 | % | | | 20.13 | % | | | 3.51 | % | | | 24.94 | % | | | 12.16 | % |
Ratios to average net assets (annualized) | | | | | | | | | | | | | | | | | | | | | | | | |
Gross expenses | | | 1.07 | % | | | 1.06 | % | | | 1.08 | % | | | 1.07 | % | | | 1.07 | % | | | 1.10 | % |
Net expenses | | | 1.00 | % | | | 1.00 | % | | | 1.00 | % | | | 1.00 | % | | | 1.00 | % | | | 1.00 | % |
Net investment income (loss) | | | (0.28 | )% | | | (0.42 | )% | | | 0.23 | % | | | (0.27 | )% | | | (0.29 | )% | | | (0.26 | )% |
Supplemental data | | | | | | | | | | | | | | | | | | | | | | | | |
Portfolio turnover rate | | | 38 | % | | | 100 | % | | | 97 | % | | | 94 | % | | | 100 | % | | | 139 | % |
Net assets, end of period (000s omitted) | | $ | 45,843 | | | $ | 48,560 | | | $ | 68,611 | | | $ | 57,533 | | | $ | 232,954 | | | $ | 223,320 | |
| 1 | Calculated based upon average shares outstanding |
| 2 | Returns for periods of less than one year are not annualized. |
The accompanying notes are an integral part of these financial statements.
| | | | | | |
| Financial highlights | | Wells Fargo Advantage Endeavor Select Fund | | | 17 | |
(For a share outstanding throughout each period)
| | | | | | | | | | | | | | | | | | | | | | | | |
| | | Six months ended
January 31, 2015 (unaudited) | | | Year ended July 31 | |
| INSTITUTIONAL CLASS | | | 2014 | | | 2013 | | | 2012 | | | 2011 | | | 2010 | |
Net asset value, beginning of period | | | $14.65 | | | | $12.95 | | | | $10.75 | | | | $10.37 | | | | $8.28 | | | | $7.39 | |
Net investment income (loss) | | | (0.01 | ) | | | (0.03 | )1 | | | 0.06 | 1 | | | (0.01 | )1 | | | (0.01 | )1 | | | (0.01 | )1 |
Net realized and unrealized gains (losses) on investments | | | 0.65 | | | | 2.45 | | | | 2.14 | | | | 0.39 | | | | 2.10 | | | | 0.93 | |
| | | | | | | | | | | | | | | | | | | | | | | | |
Total from investment operations | | | 0.64 | | | | 2.42 | | | | 2.20 | | | | 0.38 | | | | 2.09 | | | | 0.92 | |
Distributions to shareholders from | | | | | | | | | | | | | | | | | | | | | | | | |
Net investment income | | | 0.00 | | | | (0.05 | ) | | | 0.00 | | | | 0.00 | | | | 0.00 | | | | (0.03 | ) |
Net realized gains | | | (1.96 | ) | | | (0.67 | ) | | | 0.00 | | | | 0.00 | | | | 0.00 | | | | 0.00 | |
| | | | | | | | | | | | | | | | | | | | | | | | |
Total distributions to shareholders | | | (1.96 | ) | | | (0.72 | ) | | | 0.00 | | | | 0.00 | | | | 0.00 | | | | (0.03 | ) |
Net asset value, end of period | | | $13.33 | | | | $14.65 | | | | $12.95 | | | | $10.75 | | | | $10.37 | | | | $8.28 | |
Total return2 | | | 4.33 | % | | | 18.98 | % | | | 20.37 | % | | | 3.66 | % | | | 25.24 | % | | | 12.41 | % |
Ratios to average net assets (annualized) | | | | | | | | | | | | | | | | | | | | | | | | |
Gross expenses | | | 0.81 | % | | | 0.82 | % | | | 0.83 | % | | | 0.80 | % | | | 0.80 | % | | | 0.83 | % |
Net expenses | | | 0.80 | % | | | 0.80 | % | | | 0.80 | % | | | 0.79 | % | | | 0.80 | % | | | 0.80 | % |
Net investment income (loss) | | | (0.08 | )% | | | (0.22 | )% | | | 0.50 | % | | | (0.06 | )% | | | (0.08 | )% | | | (0.07 | )% |
Supplemental data | | | | | | | | | | | | | | | | | | | | | | | | |
Portfolio turnover rate | | | 38 | % | | | 100 | % | | | 97 | % | | | 94 | % | | | 100 | % | | | 139 | % |
Net assets, end of period (000s omitted) | | $ | 596,984 | | | $ | 618,502 | | | $ | 508,685 | | | $ | 735,633 | | | $ | 853,494 | | | $ | 933,587 | |
| 1 | Calculated based upon average shares outstanding |
| 2 | Returns for periods of less than one year are not annualized. |
The accompanying notes are an integral part of these financial statements.
| | | | |
| 18 | | Wells Fargo Advantage Endeavor Select Fund | | Notes to financial statements (unaudited) |
1. ORGANIZATION
Wells Fargo Funds Trust (the “Trust”), a Delaware statutory trust organized on March 10, 1999, is an open-end management investment company registered under the Investment Company Act of 1940, as amended (the “1940 Act”). As an investment company, the Trust follows the accounting and reporting guidance in Financial Accounting Standards Board (“FASB”) Accounting Standards Codification Topic 946, Financial Services – Investment Companies. These financial statements report on the Wells Fargo Advantage Endeavor Select Fund (the “Fund”), a series of the Trust. Originally classified as non-diversified, the Fund now is classified as a diversified open-end management investment company.
2. SIGNIFICANT ACCOUNTING POLICIES
The following significant accounting policies, which are consistently followed in the preparation of the financial statements of the Fund, are in conformity with U.S. generally accepted accounting principles which require management to make estimates and assumptions that affect the reported amounts of assets and liabilities, disclosure of contingent assets and liabilities at the date of the financial statements, and the reported amounts of revenues and expenses during the reporting period. Actual results could differ from those estimates.
Securities valuation
All investments are valued each business day as of the close of regular trading on the New York Stock Exchange (generally 4 p.m. Eastern Time).
Equity securities that are listed on a foreign or domestic exchange or market are valued at the official closing price or, if none, the last sales price. If no sale occurs on the primary exchange or market for the security that day, the prior day’s price will be deemed “stale” and fair values will be determined in accordance with the Fund’s Valuation Procedures.
Investments in registered open-end investment companies are valued at net asset value. Non-registered investment vehicles are fair valued at net asset value.
Investments which are not valued using any of the methods discussed above are valued at their fair value, as determined in good faith by the Board of Trustees of the Fund. The Board of Trustees has established a Valuation Committee comprised of the Trustees and has delegated to it the authority to take any actions regarding the valuation of portfolio securities that the Valuation Committee deems necessary or appropriate, including determining the fair value of portfolio securities, unless the determination has been delegated to the Management Valuation Team of Wells Fargo Funds Management, LLC (“Funds Management”). The Board of Trustees retains the authority to make or ratify any valuation decisions or approve any changes to the Valuation Procedures as it deems appropriate. On a quarterly basis, the Board of Trustees receives reports on any valuation actions taken by the Valuation Committee or the Management Valuation Team which may include items for ratification.
Valuations of fair valued securities are compared to the next actual sales price when available, or other appropriate market values, to assess the continued appropriateness of the fair valuation methodologies used. These securities are fair valued on a day-to-day basis, taking into consideration changes to appropriate market information and any significant changes to the inputs considered in the valuation process until there is a readily available price provided on an exchange or by an independent pricing service. Valuations received from an independent pricing service or independent broker-dealer quotes are periodically validated by comparisons to most recent trades and valuations provided by other independent pricing services in addition to the review of prices by the adviser and/or subadviser. Unobservable inputs used in determining fair valuations are identified based on the type of security, taking into consideration factors utilized by market participants in valuing the investment, knowledge about the issuer and the current market environment.
Security loans
The Fund may lend its securities from time to time in order to earn additional income in the form of fees or interest on securities received as collateral or the investment of any cash received as collateral. The Fund continues to receive interest or dividends on the securities loaned. The Fund receives collateral in the form of cash or securities with a value at least equal to the value of the securities on loan. The value of the loaned securities is determined at the close of each business day and any additional required collateral is delivered to the Fund on the next business day. In a securities lending transaction, the net asset value of the Fund will be affected by an increase or decrease in the value of the securities loaned and by an increase or decrease in the value of the instrument in which collateral is invested. The amount of securities lending activity undertaken by the Fund fluctuates from time to time. In the event of default or bankruptcy by the borrower, the Fund may be prevented from recovering the loaned securities or gaining access to the collateral or may experience delays or costs in doing so. In addition, the investment of any cash collateral received may lose all or part of its value. The Fund has the right under the lending agreement to recover the securities from the borrower on demand.
| | | | | | |
| Notes to financial statements (unaudited) | | Wells Fargo Advantage Endeavor Select Fund | | | 19 | |
The Fund lends its securities through an unaffiliated securities lending agent. Cash collateral received in connection with its securities lending transactions is invested in Securities Lending Cash Investments, LLC (the “Securities Lending Fund”). The Securities Lending Fund is exempt from registration under Section 3(c)(7) of the 1940 Act and is managed by Funds Management and is subadvised by Wells Capital Management Incorporated (“WellsCap”). Funds Management receives an advisory fee starting at 0.05% and declining to 0.01% as the average daily net assets of the Securities Lending Fund increase. All of the fees received by Funds Management are paid to WellsCap for its services as subadviser. The Securities Lending Fund seeks to provide a positive return compared to the daily Fed Funds Open rate by investing in high-quality, U.S. dollar-denominated short-term money market instruments. Securities Lending Fund investments are fair valued based upon the amortized cost valuation technique. Income earned from investment in the Securities Lending Fund is included in securities lending income on the Statement of Operations.
Security transactions and income recognition
Securities transactions are recorded on a trade date basis. Realized gains or losses are recorded on the basis of identified cost.
Dividend income is recognized on the ex-dividend date. Dividend income is recorded net of foreign taxes withheld where recovery of such taxes is not assured.
Distributions to shareholders
Distributions to shareholders from net investment income and net realized gains, if any, are recorded on the ex-dividend date. Such distributions are determined in conformity with federal income tax regulations, which may differ in amount or character from net investment income and realized gains recognized for purposes of U.S. generally accepted accounting principles.
Federal and other taxes
The Fund intends to continue to qualify as a regulated investment company by distributing substantially all of its investment company taxable income and any net realized capital gains (after reduction for capital loss carryforwards) sufficient to relieve it from all, or substantially all, federal income taxes. Accordingly, no provision for federal income taxes was required.
The Fund’s income and federal excise tax returns and all financial records supporting those returns for the prior three fiscal years are subject to examination by the federal and Delaware revenue authorities. Management has analyzed the Fund’s tax positions taken on federal, state, and foreign tax returns for all open tax years and does not believe that there are any uncertain tax positions that require recognition of a tax liability.
Class allocations
The separate classes of shares offered by the Fund differ principally in applicable sales charges, distribution, shareholder servicing, and administration fees. Class specific expenses are charged directly to that share class. Investment income, common expenses, and realized and unrealized gains (losses) on investments are allocated daily to each class of shares based on the relative proportion of net assets of each class.
3. FAIR VALUATION MEASUREMENTS
Fair value measurements of investments are determined within a framework that has established a fair value hierarchy based upon the various data inputs utilized in determining the value of the Fund’s investments. The three-level hierarchy gives the highest priority to unadjusted quoted prices in active markets for identical assets or liabilities (Level 1) and the lowest priority to significant unobservable inputs (Level 3). The Fund’s investments are classified within the fair value hierarchy based on the lowest level of input that is significant to the fair value measurement. The inputs are summarized into three broad levels as follows:
| n | | Level 1 – quoted prices in active markets for identical securities |
| n | | Level 2 – other significant observable inputs (including quoted prices for similar securities, interest rates, prepayment speeds, credit risk, use of amortized cost, etc.) |
| n | | Level 3 – significant unobservable inputs (including the Fund’s own assumptions in determining the fair value of investments) |
The inputs or methodologies used for valuing investments in securities are not necessarily an indication of the risk associated with investing in those securities.
| | | | |
| 20 | | Wells Fargo Advantage Endeavor Select Fund | | Notes to financial statements (unaudited) |
The following is a summary of the inputs used in valuing the Fund’s assets and liabilities as of January 31, 2015:
| | | | | | | | | | | | | | | | |
| | | Quoted prices
(Level 1) | | | Other significant
observable inputs
(Level 2) | | | Significant
unobservable inputs
(Level 3) | | | Total | |
Assets | | | | | | | | | | | | | | | | |
Investments in : | | | | | | | | | | | | | | | | |
| | | | |
Common stocks | | | | | | | | | | | | | | | | |
Consumer discretionary | | $ | 179,936,482 | | | $ | 0 | | | $ | 0 | | | $ | 179,936,482 | |
Consumer staples | | | 16,490,185 | | | | 0 | | | | 0 | | | | 16,490,185 | |
Energy | | | 16,558,300 | | | | 0 | | | | 0 | | | | 16,558,300 | |
Financials | | | 33,085,913 | | | | 0 | | | | 0 | | | | 33,085,913 | |
Health care | | | 105,384,536 | | | | 0 | | | | 0 | | | | 105,384,536 | |
Industrials | | | 41,275,833 | | | | 0 | | | | 0 | | | | 41,275,833 | |
Information technology | | | 205,833,305 | | | | 0 | | | | 0 | | | | 205,833,305 | |
Materials | | | 14,016,024 | | | | 0 | | | | 0 | | | | 14,016,024 | |
Telecommunication services | | | 22,614,009 | | | | 0 | | | | 0 | | | | 22,614,009 | |
| | | | |
Short-term investments | | | | | | | | | | | | | | | | |
Investment companies | | | 27,995,586 | | | | 0 | | | | 0 | | | | 27,995,586 | |
Total assets | | $ | 663,190,173 | | | $ | 0 | | | $ | 0 | | | $ | 663,190,173 | |
The Fund recognizes transfers between levels within the fair value hierarchy at the end of the reporting period. At January 31, 2015, the Fund did not have any transfers into/out of Level 1, Level 2, or Level 3.
4. TRANSACTIONS WITH AFFILIATES
Advisory fee
The Trust has entered into an advisory contract with Funds Management, an indirect wholly owned subsidiary of Wells Fargo & Company (“Wells Fargo”). The adviser is responsible for implementing investment policies and guidelines and for supervising the subadviser, who is responsible for day-to-day portfolio management of the Fund.
Pursuant to the contract, Funds Management is entitled to receive an annual advisory fee starting at 0.65% and declining to 0.475% as the average daily net assets of the Fund increase. Prior to December 1, 2014, Funds Management was entitled to receive an annual advisory fee which started at 0.65% and declined to 0.55% as the average daily net assets of the Fund increased. For the six months ended January 31, 2015, the advisory fee was equivalent to an annual rate of 0.64% of the Fund’s average daily net assets.
Funds Management has retained the services of a subadviser to provide daily portfolio management to the Fund. The fee for subadvisory services is borne by Funds Management. WellsCap, an affiliate of Funds Management and an indirect wholly owned subsidiary of Wells Fargo, is the subadviser to the Fund and is entitled to receive a fee from Funds Management at an annual rate starting at 0.30% and declining to 0.20% as the average daily net assets of the Fund increase.
Administration fees
The Trust has entered into an administration agreement with Funds Management. Under this agreement, for providing administrative services, which includes paying fees and expenses for services provided by the transfer agent, sub-transfer agents, omnibus account servicers and record-keepers, Funds Management is entitled to receive from the Fund an annual fund level administration fee starting at 0.05% and declining to 0.03% as the average daily net assets of the Fund increase and a class level administration fee which is calculated based on the average daily net assets of each class as follows:
| | |
| | | Class level
administration fee |
| Class A, Class B, Class C | | 0.26% |
| Administrator Class | | 0.10 |
| Institutional Class | | 0.08 |
| | | | | | |
| Notes to financial statements (unaudited) | | Wells Fargo Advantage Endeavor Select Fund | | | 21 | |
Funds Management has contractually waived and/or reimbursed advisory and administration fees to the extent necessary to maintain certain net operating expense ratios for the Fund. Waiver of fees and/or reimbursement of expenses by Funds Management were made first from fund level expenses on a proportionate basis and then from class specific expenses. Funds Management has committed through November 30, 2015 to waive fees and/or reimburse expenses to the extent necessary to cap the Fund’s expenses at 1.25% for Class A shares, 2.00% for Class B shares, 2.00% for Class C shares, 1.00% for Administrator Class shares, and 0.80% for Institutional Class shares. After this time, the cap may be increased or the commitment to maintain the cap may be terminated only with the approval of the Board of Trustees.
Distribution fees
The Trust has adopted a Distribution Plan for Class B and Class C shares of the Fund pursuant to Rule 12b-1 under the 1940 Act. Distribution fees are charged to Class B and Class C shares and paid to Wells Fargo Funds Distributor, LLC (“Funds Distributor”), the principal underwriter, at an annual rate of 0.75% of the average daily net assets of Class B and Class C shares.
In addition, Funds Distributor is entitled to receive the front-end sales charge from the purchase of Class A shares and a contingent deferred sales charge on the redemption of certain shares. Funds Distributor is also entitled to receive the contingent deferred sales charges from redemptions of Class B and Class C shares. For the six months ended January 31, 2015, Funds Distributor received $2,040 from the sale of Class A shares.
Shareholder servicing fees
The Trust has entered into contracts with one or more shareholder servicing agents, whereby Class A, Class B, Class C, and Administrator Class of the Fund is charged a fee at an annual rate of 0.25% of the average daily net assets of each respective class.
A portion of these total shareholder servicing fees were paid to affiliates of Wells Fargo.
5. INVESTMENT PORTFOLIO TRANSACTIONS
Purchases and sales of investments, excluding U.S. government obligations (if any) and short-term securities, for the six months ended January 31, 2015 were $269,197,881 and $372,635,012, respectively.
6. BANK BORROWINGS
The Trust (excluding the money market funds and certain other funds in the Trust) and Wells Fargo Variable Trust are parties to a $150,000,000 revolving credit agreement, whereby the Fund is permitted to use bank borrowings for temporary or emergency purposes, such as to fund shareholder redemption requests. Interest under the credit agreement is charged to the Fund based on a borrowing rate equal to the higher of the Federal Funds rate in effect on that day plus 1.25% or the overnight LIBOR rate in effect on that day plus 1.25%. In addition, an annual commitment fee equal to 0.10% of the unused balance is allocated to each participating fund. For the six months ended January 31, 2015, the Fund paid $533 in commitment fees.
During the six months ended January 31, 2015, the Fund had average borrowings outstanding of $81,277 (on an annualized basis) at a rate of 1.41% and paid interest in the amount of $1,146.
7. CONCENTRATION RISK
Concentration risks result from exposure to a limited number of sectors. A fund that invests a substantial portion of its assets in any sector may be more affected by changes in that sector than would be a fund whose investments are not heavily weighted in any sector.
8. INDEMNIFICATION
Under the Trust’s organizational documents, the officers and Trustees are indemnified against certain liabilities that may arise out of performance of their duties to the Trust. Additionally, in the normal course of business, the Trust may enter into contracts with service providers that contain a variety of indemnification clauses. The Trust’s maximum exposure under these arrangements is dependent on future claims that may be made against the Fund and, therefore, cannot be estimated.
| | | | |
| 22 | | Wells Fargo Advantage Endeavor Select Fund | | Other information (unaudited) |
PROXY VOTING INFORMATION
A description of the policies and procedures that the Fund uses to determine how to vote proxies relating to portfolio securities, in addition to information regarding how the Fund voted proxies relating to portfolio securities during the most recent 12-month period ended June 30, is available on the Fund’s website at wellsfargoadvantagefunds.com or by visiting the SEC website at sec.gov.
PORTFOLIO HOLDINGS INFORMATION
The complete portfolio holdings for the Fund are publicly available monthly on the Fund’s website (wellsfargoadvantagefunds.com), on a one-month delayed basis. In addition, top ten holdings information (excluding derivative positions) for the Fund is publicly available on the Fund’s website on a monthly, seven-day or more delayed basis. The Fund files its complete schedule of portfolio holdings with the SEC for the first and third quarters of each fiscal year on Form N-Q, which is available by visiting the SEC website at sec.gov. In addition, the Fund’s Form N-Q may be reviewed and copied at the SEC’s Public Reference Room in Washington, DC, and at regional offices in New York City, at 233 Broadway, and in Chicago, at 175 West Jackson Boulevard, Suite 900. Information about the Public Reference Room may be obtained by calling 1-800-SEC-0330.
| | | | | | |
| Other information (unaudited) | | Wells Fargo Advantage Endeavor Select Fund | | | 23 | |
BOARD OF TRUSTEES AND OFFICERS
Each of the Trustees and Officers1 listed in the table below acts in identical capacities for each fund in the Wells Fargo Advantage family of funds, which consists of 134 mutual funds comprising the Wells Fargo Funds Trust, Wells Fargo Variable Trust, Wells Fargo Master Trust and four closed-end funds (collectively the “Fund Complex”). This table should be read in conjunction with the Prospectus and the Statement of Additional Information2. The mailing address of each Trustee and Officer is 525 Market Street, 12th Floor, San Francisco, CA 94105. Each Trustee and Officer serves an indefinite term, however, each Trustee serves such term until reaching the mandatory retirement age established by the Trustees.
Independent Trustees
| | | | | | |
Name and
year of birth | | Position held and
length of service* | | Principal occupations during past five years or longer | | Other
directorships during
past five years |
William R. Ebsworth
(Born 1957) | | Trustee, since 2015** | | Retired. From 1984 to 2013, equities analyst, portfolio manager, research director at Fidelity Management and Research Company and retired in 2013 as Chief Investment Officer of Fidelity Strategic Advisers, Inc. in Boston, Tokyo, and Hong Kong where he led a team of investment professionals managing client assets. Prior thereto, Board member of Hong Kong Securities Clearing Co., Hong Kong Options Clearing Corp., the Thailand International Fund, Ltd., Fidelity Investments Life Insurance Company, and Empire Fidelity Investments Life Insurance Company. Mr. Ebsworth is an Adjunct Lecturer, Finance, at Babson College and a Chartered Financial Analyst. | | Asset Allocation Trust |
Jane A. Freeman
(Born 1953) | | Trustee, since 2015** | | Retired. From 2012 to 2014 and 1999 to 2008, Chief Financial Officer of Scientific Learning Corporation. From 2008 to 2012, Ms. Freeman provided consulting services related to strategic business projects. Prior thereto, Portfolio Manager at Rockefeller & Co. and Scudder, Stevens & Clark. Board member of the Harding Loevner Funds from 1996 to 2014, serving as both Lead Independent Director and chair of the Audit Committee. Board member of the Russell Exchange Traded Funds Trust from 2011 to 2012 and the chair of the Audit Committee. Ms. Freeman is a Chartered Financial Analyst (inactive), Chair of Taproot Foundation (non-profit organization) and a Board Member of Ruth Bancroft Garden (non-profit organization). | | Asset Allocation Trust |
Peter G. Gordon
(Born 1942) | | Trustee, since 1998; Chairman, since 2005 | | Co-Founder, Retired Chairman, President and CEO of Crystal Geyser Water Company. Trustee Emeritus, Colby College. | | Asset Allocation Trust |
Isaiah Harris, Jr.
(Born 1952) | | Trustee, since 2009 | | Retired. Chairman of the Board of CIGNA Corporation since 2009, and Director since 2005. From 2003 to 2011, Director of Delux Corporation. Prior thereto, President and CEO of BellSouth Advertising and Publishing Corp. from 2005 to 2007, President and CEO of BellSouth Enterprises from 2004 to 2005 and President of BellSouth Consumer Services from 2000 to 2003. Emeritus member of the Iowa State University Foundation Board of Governors. Emeritus Member of the Advisory Board of Iowa State University School of Business. Advisory Board Member, Palm Harbor Academy. Mr. Harris is a certified public accountant. | | CIGNA Corporation; Asset Allocation Trust |
Judith M. Johnson
(Born 1949) | | Trustee, since 2008; Audit Committee Chairman, since 2008 | | Retired. Prior thereto, Chief Executive Officer and Chief Investment Officer of Minneapolis Employees Retirement Fund from 1996 to 2008. Ms. Johnson is an attorney, certified public accountant and a certified managerial accountant. | | Asset Allocation Trust |
David F. Larcker
(Born 1950) | | Trustee, since 2009 | | James Irvin Miller Professor of Accounting at the Graduate School of Business, Stanford University, Morgan Stanley Director of the Center for Leadership Development and Research and Senior Faculty of The Rock Center for Corporate Governance since 2006. From 2005 to 2008, Professor of Accounting at the Graduate School of Business, Stanford University. Prior thereto, Ernst & Young Professor of Accounting at The Wharton School, University of Pennsylvania from 1985 to 2005. | | Asset Allocation Trust |
Olivia S. Mitchell
(Born 1953) | | Trustee, since 2006 | | International Foundation of Employee Benefit Plans Professor, Wharton School of the University of Pennsylvania since 1993. Director of Wharton’s Pension Research Council and Boettner Center on Pensions & Retirement Research, and Research Associate at the National Bureau of Economic Research. Previously, Cornell University Professor from 1978 to 1993. | | Asset Allocation Trust |
| | | | |
| 24 | | Wells Fargo Advantage Endeavor Select Fund | | Other information (unaudited) |
| | | | | | |
Name and
year of birth | | Position held and
length of service* | | Principal occupations during past five years or longer | | Other
directorships during
past five years |
Timothy J. Penny
(Born 1951) | | Trustee, since 1996 | | President and Chief Executive Officer of Southern Minnesota Initiative Foundation, a non-profit organization, since 2007 and Senior Fellow at the Humphrey Institute Policy Forum at the University of Minnesota since 1995. Member of the Board of Trustees of NorthStar Education Finance, Inc., a non-profit organization, since 2007. | | Asset Allocation Trust |
Michael S. Scofield
(Born 1943) | | Trustee, since 2010 | | Served on the Investment Company Institute’s Board of Governors and Executive Committee from 2008-2011 as well the Governing Council of the Independent Directors Council from 2006-2011 and the Independent Directors Council Executive Committee from 2008-2011. Chairman of the IDC from 2008-2010. Institutional Investor (Fund Directions) Trustee of Year in 2007. Trustee of the Evergreen Funds complex (and its predecessors) from 1984 to 2010. Chairman of the Evergreen Funds from 2000-2010. Former Trustee of the Mentor Funds. Retired Attorney, Law Offices of Michael S. Scofield. | | Asset Allocation Trust |
Donald C. Willeke
(Born 1940) | | Trustee, since 1996 | | Principal of the law firm of Willeke & Daniels. General Counsel of the Minneapolis Employees Retirement Fund from 1984 until its consolidation into the Minnesota Public Employees Retirement Association on June 30, 2010. Director and Vice Chair of The Tree Trust (non-profit corporation). Director of the American Chestnut Foundation (non-profit corporation). | | Asset Allocation Trust |
| * | Length of service dates reflect the Trustee’s commencement of service with the Trust’s predecessor entities, where applicable. |
| ** | William R. Ebsworth and Jane A. Freeman each became a Trustee effective January 1, 2015. |
Officers
| | | | | | |
Name and
year of birth | | Position held and
length of service | | Principal occupations during past five years or longer | | |
Karla M. Rabusch
(Born 1959) | | President, since 2003 | | Executive Vice President of Wells Fargo Bank, N.A. and President of Wells Fargo Funds Management, LLC since 2003. | | |
Jeremy DePalma1
(Born 1974) | | Treasurer, since 2012 | | Senior Vice President of Wells Fargo Funds Management, LLC since 2009. Senior Vice President of Evergreen Investment Management Company, LLC from 2008 to 2010. Vice President, Evergreen Investment Services, Inc. from 2004 to 2007. Head of the Fund Reporting and Control Team within Fund Administration from 2005 to 2010. | | |
C. David Messman
(Born 1960) | | Secretary, since 2000; Chief Legal Officer, since 2003 | | Assistant General Counsel of Wells Fargo Bank, N.A. since 2013 and Vice President and Managing Counsel of Wells Fargo Bank N.A. from 1996 to 2013. Senior Vice President and Secretary of Wells Fargo Funds Management , LLC since 2001. | | |
Debra Ann Early
(Born 1964) | | Chief Compliance Officer, since 2007 | | Senior Vice President of Wells Fargo Funds Management, LLC since 2007 and Chief Compliance Officer from 2007 to 2014. Chief Compliance Officer of Parnassus Investments from 2005 to 2007. Chief Financial Officer of Parnassus Investments from 2004 to 2007 and Senior Audit Manager of PricewaterhouseCoopers LLP from 1998 to 2004. | | |
David Berardi
(Born 1975) | | Assistant Treasurer, since 2009 | | Vice President of Wells Fargo Funds Management, LLC since 2009. Vice President of Evergreen Investment Management Company, LLC from 2008 to 2010. Assistant Vice President of Evergreen Investment Services, Inc. from 2004 to 2008. Manager of Fund Reporting and Control for Evergreen Investment Management Company, LLC from 2004 to 2010. | | |
| 1 | Jeremy DePalma acts as Treasurer of 61 funds and Assistant Treasurer of 73 funds in the Fund Complex. |
| 2 | The Statement of Additional Information includes additional information about the Trustees and is available, without charge, upon request, by calling 1-800-222-8222 or by visiting the website at wellsfargoadvantagefunds.com. |
| | | | | | |
| List of abbreviations | | Wells Fargo Advantage Endeavor Select Fund | | | 25 | |
The following is a list of common abbreviations for terms and entities that may have appeared in this report.
| ACA | — ACA Financial Guaranty Corporation |
| ADR | — American depositary receipt |
| ADS | — American depositary shares |
| AGC | — Assured Guaranty Corporation |
| AGM | — Assured Guaranty Municipal |
| Ambac | — Ambac Financial Group Incorporated |
| AMT | — Alternative minimum tax |
| BAN | — Bond anticipation notes |
| BHAC | — Berkshire Hathaway Assurance Corporation |
| CAB | — Capital appreciation bond |
| CCAB | — Convertible capital appreciation bond |
| CDA | — Community Development Authority |
| CDO | — Collateralized debt obligation |
| DRIVER | — Derivative inverse tax-exempt receipts |
| DW&P | — Department of Water & Power |
| DWR | — Department of Water Resources |
| ECFA | — Educational & Cultural Facilities Authority |
| EDA | — Economic Development Authority |
| EDFA | — Economic Development Finance Authority |
| ETF | — Exchange-traded fund |
| FDIC | — Federal Deposit Insurance Corporation |
| FFCB | — Federal Farm Credit Banks |
| FGIC | — Financial Guaranty Insurance Corporation |
| FHA | — Federal Housing Administration |
| FHLB | — Federal Home Loan Bank |
| FHLMC | — Federal Home Loan Mortgage Corporation |
| FICO | — The Financing Corporation |
| FNMA | — Federal National Mortgage Association |
| GDR | — Global depositary receipt |
| GNMA | — Government National Mortgage Association |
| HCFR | — Healthcare facilities revenue |
| HEFA | — Health & Educational Facilities Authority |
| HEFAR | — Higher education facilities authority revenue |
| HFA | — Housing Finance Authority |
| HFFA | — Health Facilities Financing Authority |
| HUD | — Department of Housing and Urban Development |
| IDA | — Industrial Development Authority |
| IDAG | — Industrial Development Agency |
| KRW | — Republic of Korea won |
| LIBOR | — London Interbank Offered Rate |
| LIFER | — Long Inverse Floating Exempt Receipts |
| LLC | — Limited liability company |
| LLLP | — Limited liability limited partnership |
| LLP | — Limited liability partnership |
| MBIA | — Municipal Bond Insurance Association |
| MFHR | — Multifamily housing revenue |
| MSTR | — Municipal securities trust receipts |
| MUD | — Municipal Utility District |
| National | — National Public Finance Guarantee Corporation |
| PCFA | — Pollution Control Financing Authority |
| PCL | — Public Company Limited |
| PCR | — Pollution control revenue |
| PFA | — Public Finance Authority |
| PFFA | — Public Facilities Financing Authority |
| PFOTER | — Puttable floating option tax-exempt receipts |
| plc | — Public limited company |
| PUTTER | — Puttable tax-exempt receipts |
| R&D | — Research & development |
| Radian | — Radian Asset Assurance |
| RAN | — Revenue anticipation notes |
| RDA | — Redevelopment Authority |
| RDFA | — Redevelopment Finance Authority |
| REIT | — Real estate investment trust |
| ROC | — Reset option certificates |
| SAVRS | — Select auction variable rate securities |
| SBA | — Small Business Authority |
| SFHR | — Single-family housing revenue |
| SFMR | — Single-family mortgage revenue |
| SPA | — Standby purchase agreement |
| SPDR | — Standard & Poor’s Depositary Receipts |
| SPEAR | — Short Puttable Exempt Adjustable Receipts |
| STRIPS | — Separate trading of registered interest and |
| TAN | — Tax anticipation notes |
| TIPS | — Treasury inflation-protected securities |
| TRAN | — Tax revenue anticipation notes |
| TTFA | — Transportation Trust Fund Authority |
| TVA | — Tennessee Valley Authority |
This page is intentionally left blank.
This page is intentionally left blank.
This page is intentionally left blank.


For more information
More information about Wells Fargo Advantage Funds is available free upon request. To obtain literature, please write, email, visit the Fund’s website, or call:
Wells Fargo Advantage Funds
P.O. Box 8266
Boston, MA 02266-8266
Email: wfaf@wellsfargo.com
Website: wellsfargoadvantagefunds.com
Individual investors: 1-800-222-8222
Retail investment professionals: 1-888-877-9275
Institutional investment professionals: 1-866-765-0778
This report and the financial statements contained herein are submitted for the general information of the shareholders of Wells Fargo Advantage Funds. If this report is used for promotional purposes, distribution of the report must be accompanied or preceded by a current prospectus. Before investing, please consider the investment objectives, risks, charges, and expenses of the investment. For a current prospectus and, if available, a summary prospectus, containing this information, call 1-800-222-8222 or visit the Fund’s website at wellsfargoadvantagefunds.com. Read the prospectus carefully before you invest or send money.
Wells Fargo Funds Management, LLC, a wholly owned subsidiary of Wells Fargo & Company, provides investment advisory and administrative services for Wells Fargo Advantage Funds. Other affiliates of Wells Fargo & Company provide subadvisory and other services for the Funds. The Funds are distributed by Wells Fargo Funds Distributor, LLC, Member FINRA/SIPC, an affiliate of Wells Fargo & Company.
NOT FDIC INSURED ¡ NO BANK GUARANTEE ¡ MAY LOSE VALUE
© 2015 Wells Fargo Funds Management, LLC. All rights reserved.
| | |
| | 231598 03-15 SA205/SAR205 01-15 |

Wells Fargo Advantage Growth Fund

Semi-Annual Report
January 31, 2015

Reduce clutter. Save trees.
Sign up for electronic delivery of prospectuses and shareholder reports at wellsfargo.com/advantagedelivery
Contents
The views expressed and any forward-looking statements are as of January 31, 2015, unless otherwise noted, and are those of the Fund managers and/or Wells Fargo Funds Management, LLC. Discussions of individual securities, or the markets generally, or any Wells Fargo Advantage Fund are not intended as individual recommendations. Future events or results may vary significantly from those expressed in any forward-looking statements; the views expressed are subject to change at any time in response to changing circumstances in the market. Wells Fargo Funds Management, LLC and the Fund disclaim any obligation to publicly update or revise any views expressed or forward-looking statements.
NOT FDIC INSURED ¡ NO BANK GUARANTEE ¡ MAY LOSE VALUE
| | | | |
| 2 | | Wells Fargo Advantage Growth Fund | | Letter to shareholders (unaudited) |

Karla M. Rabusch
President
Wells Fargo Advantage Funds
As the U.S. churned forward, major economies elsewhere in the world faced significant ongoing challenges.
Dear Valued Shareholder:
We are pleased to offer you this semi-annual report for the Wells Fargo Advantage Growth Fund for the six-month period that ended January 31, 2015. Generally improving U.S. economic data helped drive a positive return for U.S. stocks for the reporting period (as measured by the S&P 500 Index1); in contrast, many economies and markets elsewhere in the world faced ongoing challenges.
Positive U.S. economic data, but increased tensions abroad, led to heightened volatility during the third quarter of 2014.
When the reporting period began on August 1, 2014, the U.S. stock market was experiencing a series of surges interrupted by bouts of volatility as interest-rate concerns in the U.S. and increased tensions abroad triggered heightened investor uncertainty. An escalating Russia/Ukraine situation and a growing perception that the U.S. Federal Reserve (Fed) would raise short-term interest rates sooner than expected caused investors to pull back near the end of July. As a result, the S&P 500 Index dropped into negative territory for July’s monthly return. However, August brought a bounce-back; the S&P 500 Index delivered its largest monthly gain since February 2014 on a string of positive economic news, led by an upwardly revised 4.2% estimate of second-quarter 2014 gross domestic product (GDP) growth. Then, in September, stock market volatility increased as positive economic data became overshadowed at times by growing discomfort over escalating tensions in Ukraine and the Middle East. Slowing growth in Europe and China also concerned investors. Ultimately, U.S. stocks ended the third quarter up slightly overall, buoyed largely by another upward revision of second-quarter GDP growth to 4.6%. Strong corporate earnings also contributed to market gains.
The fourth quarter of 2014 brought continued improvement in the U.S.; international economies remained challenged.
Strong fourth-quarter results by the U.S. stock market helped the S&P 500 Index deliver more than 50 record closes in 2014. The last several, in December, were spurred by investor optimism following Fed Chair Janet Yellen’s comment that the Fed would be patient in its timing of an interest-rate increase. U.S. stocks also were boosted by positive economic data. November’s 5.8% unemployment rate was down from 7.0% a year earlier, and the number of jobs being added continued to expand, keeping U.S. employers on pace to hire nearly three million workers during 2014. In addition, the U.S. economy’s third-quarter growth rate was revised upward during the quarter, to 5.0%—its fastest pace in 11 years. Meanwhile, U.S. companies continued to report strong earnings. The steadily brightening U.S. economy energized consumers, who were further buoyed by much lower prices at the gasoline pump. During the fourth quarter, gasoline prices fell to their lowest levels in five years, according to the American Automobile Association.
As the U.S. churned forward, major economies elsewhere in the world faced significant ongoing challenges. In China, where growth had been slowing for some time, government regulators in December announced changes being made in an effort to stimulate growth. In Japan, which slid back into recession in the third quarter of 2014, Prime Minister Abe gained approval in late December for roughly $29 billion in fresh stimulus to help the economy. In the eurozone, growth remained sluggish, and member countries continued to face an environment of low demand, high unemployment, and weak business investment. This situation
| 1 | The S&P 500 Index consists of 500 stocks chosen for market size, liquidity, and industry group representation. It is a market-value-weighted index with each stock’s weight in the index proportionate to its market value. You cannot invest directly in an index. |
| | | | | | |
| Letter to shareholders (unaudited) | | Wells Fargo Advantage Growth Fund | | | 3 | |
was exacerbated in December by renewed concerns about Greece after its parliament failed to avert a general election that could jeopardize the terms of the country’s financial agreement with its international creditors. In Russia, the economy contracted for the first time since October 2009 as the country struggled under the weight of slumping oil prices, international sanctions, and massive outflows of capital.
Market volatility increased in January 2015.
Markets fluctuated in January as investors reacted to geopolitical developments and new economic data. Mid-month, the World Bank lowered its outlook for global growth based on deepening problems in the eurozone and emerging markets, stating that a strengthening U.S. economy could not, by itself, support the global economy. Later in January, Greek voters gave control of their government to opposition party Syriza, which promised to end austerity and insisted that Greece’s massive debt be renegotiated. In the U.S., various data released in January, such as consumer confidence and December’s jobless rate, showed improvement. On the last trading day of the month, however, investors learned that fourth-quarter 2014 U.S. economic growth was estimated at 2.6%, which was below consensus and lower than the 4.6% and 5.0% growth rates, respectively, for the second and third quarters of 2014.
Don’t let short-term uncertainty derail long-term investment goals.
Periods of uncertainty can present challenges, but experience has taught us that maintaining long-term investment goals can be an effective way to plan for the future. To help you create a sound strategy based on your personal goals and risk tolerance, Wells Fargo Advantage Funds offers more than 100 mutual funds and other investments spanning a wide range of asset classes and investment styles. Although diversification cannot guarantee an investment profit or prevent losses, we believe it can be an effective way to manage investment risk and potentially smooth out overall portfolio performance. We encourage investors to know their investments and to understand that appropriate levels of risk-taking may unlock opportunities.
Thank you for choosing to invest with Wells Fargo Advantage Funds. We appreciate your confidence in us and remain committed to helping you meet your financial needs. For current information about your fund investments, contact your investment professional, visit our website at wellsfargoadvantagefunds.com, or call us directly at 1-800-222-8222. We are available 24 hours a day, 7 days a week.
Sincerely,

Karla M. Rabusch
President
Wells Fargo Advantage Funds
We encourage investors to know their investments and to understand that appropriate levels of risk-taking may unlock opportunities.
| | | | |
| 4 | | Wells Fargo Advantage Growth Fund | | Performance highlights (unaudited) |
The Fund is currently closed to most new investors1.
Investment objective
The Fund seeks long-term capital appreciation.
Adviser
Wells Fargo Funds Management, LLC
Subadviser
Wells Capital Management Incorporated
Portfolio managers
Thomas C. Ognar, CFA
Bruce C. Olson, CFA
Joseph M. Eberhardy, CFA, CPA
Average annual total returns (%) as of January 31, 2015
| | | | | | | | | | | | | | | | | | | | | | | | | | | | | | | | | | |
| | | | | Including sales charge | | | Excluding sales charge | | | Expense ratios3 (%) | |
| | | Inception date | | 1 year | | | 5 year | | | 10 year | | | 1 year | | | 5 year | | | 10 year | | | Gross | | | Net4 | |
| Class A (SGRAX)2 | | 2-24-2000 | | | (1.03 | ) | | | 16.73 | | | | 10.92 | | | | 5.01 | | | | 18.11 | | | | 11.58 | | | | 1.18 | | | | 1.18 | |
| Class C (WGFCX) | | 12-26-2002 | | | 3.22 | | | | 17.25 | | | | 10.78 | | | | 4.22 | | | | 17.25 | | | | 10.78 | | | | 1.93 | | | | 1.93 | |
| Administrator Class (SGRKX) | | 8-30-2002 | | | – | | | | – | | | | – | | | | 5.22 | | | | 18.41 | | | | 11.91 | | | | 1.02 | | | | 0.96 | |
| Institutional Class (SGRNX) | | 2-24-2000 | | | – | | | | – | | | | – | | | | 5.45 | | | | 18.64 | | | | 12.09 | | | | 0.75 | | | | 0.75 | |
| Investor Class (SGROX) | | 12-31-1993 | | | – | | | | – | | | | – | | | | 4.94 | | | | 18.04 | | | | 11.46 | | | | 1.24 | | | | 1.24 | |
| Russell 3000® Growth Index5 | | – | | | – | | | | – | | | | – | | | | 13.80 | | | | 16.55 | | | | 8.70 | | | | – | | | | – | |
Figures quoted represent past performance, which is no guarantee of future results, and do not reflect taxes that a shareholder may pay on fund distributions or the redemption of fund shares. Investment return and principal value of an investment will fluctuate so that an investor’s shares, when redeemed, may be worth more or less than their original cost. Performance shown without sales charges would be lower if sales charges were reflected. Current performance may be lower or higher than the performance data quoted, which assumes the reinvestment of dividends and capital gains. Current month-end performance is available on the Fund’s website, wellsfargoadvantagefunds.com.
Index returns do not include transaction costs associated with buying and selling securities, any mutual fund fees or expenses, or any taxes. It is not possible to invest directly in an index.
For Class A shares, the maximum front-end sales charge is 5.75%. For Class C shares, the maximum contingent deferred sales charge is 1.00%. Performance including a contingent deferred sales charge assumes the sales charge for the corresponding time period. Administrator Class, Institutional Class, and Investor Class shares are sold without a front-end sales charge or contingent deferred sales charge.
Stock values fluctuate in response to the activities of individual companies and general market and economic conditions. Certain investment strategies tend to increase the total risk of an investment (relative to the broader market). The Fund is exposed to foreign investment risk. Consult the Fund’s prospectus for additional information on these and other risks.
Please see footnotes on page 5.
| | | | | | |
| Performance highlights (unaudited) | | Wells Fargo Advantage Growth Fund | | | 5 | |
| | | | |
| Ten largest equity holdings6 (%) as of January 31, 2015 | |
Alexion Pharmaceuticals Incorporated | | | 2.99 | |
Union Pacific Corporation | | | 2.80 | |
Google Incorporated Class A | | | 2.46 | |
Dollar Tree Incorporated | | | 2.42 | |
Apple Incorporated | | | 2.40 | |
Microchip Technology Incorporated | | | 2.18 | |
Biogen Idec Incorporated | | | 2.06 | |
Facebook Incorporated Class A | | | 2.03 | |
Alliance Data Systems Corporation | | | 2.01 | |
Google Incorporated Class C | | | 2.00 | |
|
| Sector distribution7 as of January 31, 2015 |
|
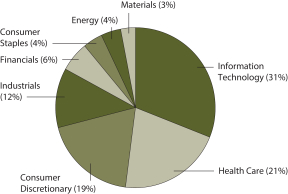 |
| 1 | Please see the Fund’s current Statement of Additional Information for further details. |
| 2 | Effective June 20, 2008, Advisor Class was renamed Class A and modified to assume the features and attributes of Class A. Historical performance shown for Class A shares through June 20, 2008, includes Advisor Class expenses. |
| 3 | Reflects the expense ratios as stated in the most recent prospectuses. The expense ratios shown are subject to change and may differ from the annualized expense ratios shown in the financial highlights of this report. |
| 4 | The Adviser has committed through November 30, 2015, to waive fees and/or reimburse expenses to the extent necessary to cap the Fund’s Total Annual Fund Operating Expenses After Fee Waiver, excluding certain expenses, at 1.21% for Class A, 1.96% for Class C, 0.96% for Administrator Class, 0.75% for Institutional Class, and 1.27% for Investor Class. After this time, the cap may be increased or the commitment to maintain the cap may be terminated only with the approval of the Board of Trustees. Brokerage commissions, stamp duty fees, interest, taxes, acquired fund fees and expenses, and extraordinary expenses are excluded from the cap. Without this cap, the Fund’s returns would have been lower. |
| 5 | The Russell 3000® Growth Index measures the performance of those Russell 3000 Index companies with higher price-to-book ratios and higher forecasted growth values. You cannot invest directly in an index. |
| 6 | The ten largest equity holdings are calculated based on the value of the securities divided by total net assets of the Fund. Holdings are subject to change and may have changed since the date specified. |
| 7 | Amounts are calculated based on the total long-term investments of the Fund. These percentages are subject to change and may have changed since the date specified. |
| | | | |
| 6 | | Wells Fargo Advantage Growth Fund | | Fund expenses (unaudited) |
As a shareholder of the Fund, you incur two types of costs: (1) transaction costs, including sales charges (loads) on purchase payments and contingent deferred sales charges (if any) on redemptions and (2) ongoing costs, including management fees, distribution (12b-1) and/or shareholder service fees, and other Fund expenses. This example is intended to help you understand your ongoing costs (in dollars) of investing in the Fund and to compare these costs with the ongoing costs of investing in other mutual funds.
The example is based on an investment of $1,000 invested at the beginning of the six-month period and held for the entire period from August 1, 2014 to January 31, 2015.
Actual expenses
The “Actual” line of the table below provides information about actual account values and actual expenses. You may use the information in this line, together with the amount you invested, to estimate the expenses that you paid over the period. Simply divide your account value by $1,000 (for example, an $8,600 account value divided by $1,000 = 8.6), then multiply the result by the number in the “Actual” line under the heading entitled “Expenses paid during period” for your applicable class of shares to estimate the expenses you paid on your account during this period.
Hypothetical example for comparison purposes
The “Hypothetical” line of the table below provides information about hypothetical account values and hypothetical expenses based on the Fund’s actual expense ratio and an assumed rate of return of 5% per year before expenses, which is not the Fund’s actual return. The hypothetical account values and expenses may not be used to estimate the actual ending account balance or expenses you paid for the period. You may use this information to compare the ongoing costs of investing in the Fund and other funds. To do so, compare this 5% hypothetical example with the 5% hypothetical examples that appear in the shareholder reports of the other funds.
Please note that the expenses shown in the table are meant to highlight your ongoing costs only and do not reflect any transactional costs, such as sales charges (loads) and contingent deferred sales charges. Therefore, the “Hypothetical” line of the table is useful in comparing ongoing costs only and will not help you determine the relative total costs of owning different funds. In addition, if these transactional costs were included, your costs would have been higher.
| | | | | | | | | | | | | | | | |
| | | Beginning account value 8-1-2014 | | | Ending account value 1-31-2015 | | | Expenses paid during the period¹ | | | Net annualized expense ratio | |
Class A | | | | | | | | | | | | | | | | |
Actual | | $ | 1,000.00 | | | $ | 1,050.70 | | | $ | 6.10 | | | | 1.18 | % |
Hypothetical (5% return before expenses) | | $ | 1,000.00 | | | $ | 1,019.26 | | | $ | 6.01 | | | | 1.18 | % |
Class C | | | | | | | | | | | | | | | | |
Actual | | $ | 1,000.00 | | | $ | 1,046.71 | | | $ | 9.96 | | | | 1.93 | % |
Hypothetical (5% return before expenses) | | $ | 1,000.00 | | | $ | 1,015.48 | | | $ | 9.80 | | | | 1.93 | % |
Administrator Class | | | | | | | | | | | | | | | | |
Actual | | $ | 1,000.00 | | | $ | 1,051.84 | | | $ | 4.96 | | | | 0.96 | % |
Hypothetical (5% return before expenses) | | $ | 1,000.00 | | | $ | 1,020.37 | | | $ | 4.89 | | | | 0.96 | % |
Institutional Class | | | | | | | | | | | | | | | | |
Actual | | $ | 1,000.00 | | | $ | 1,053.15 | | | $ | 3.88 | | | | 0.75 | % |
Hypothetical (5% return before expenses) | | $ | 1,000.00 | | | $ | 1,021.42 | | | $ | 3.82 | | | | 0.75 | % |
Investor Class | | | | | | | | | | | | | | | | |
Actual | | $ | 1,000.00 | | | $ | 1,050.48 | | | $ | 6.41 | | | | 1.24 | % |
Hypothetical (5% return before expenses) | | $ | 1,000.00 | | | $ | 1,018.95 | | | $ | 6.31 | | | | 1.24 | % |
| 1 | Expenses paid is equal to the annualized expense ratio of each class multiplied by the average account value over the period, multiplied by the number of days in the most recent fiscal half-year divided by the number of days in the fiscal year (to reflect the one-half-year period). |
| | | | | | |
| Portfolio of investments—January 31, 2015 (unaudited) | | Wells Fargo Advantage Growth Fund | | | 7 | |
| | | | | | | | | | | | |
| Security name | | | | | | Shares | | | Value | |
| | | | |
Common Stocks: 99.16% | | | | | | | | | | | | |
| | | | |
Consumer Discretionary: 18.80% | | | | | | | | | | | | |
| | | | |
| Auto Components: 0.70% | | | | | | | | | | | | |
BorgWarner Incorporated | | | | | | | 166,690 | | | $ | 9,002,927 | |
Delphi Automotive plc | | | | | | | 912,510 | | | | 62,716,812 | |
| |
| | | | 71,719,739 | |
| | | | | | | | | | | | |
| | | | |
| Distributors: 1.85% | | | | | | | | | | | | |
LKQ Corporation † | | | | | | | 7,340,000 | | | | 189,445,400 | |
| | | | | | | | | | | | |
| | | | |
| Diversified Consumer Services: 1.64% | | | | | | | | | | | | |
Grand Canyon Education Incorporated †(l) | | | | | | | 3,820,371 | | | | 167,408,657 | |
| | | | | | | | | | | | |
| | | | |
| Hotels, Restaurants & Leisure: 3.15% | | | | | | | | | | | | |
Chipotle Mexican Grill Incorporated † | | | | | | | 197,160 | | | | 139,952,054 | |
Fiesta Restaurant Group Incorporated † | | | | | | | 68,083 | | | | 4,021,663 | |
Starbucks Corporation | | | | | | | 2,037,510 | | | | 178,343,250 | |
| |
| | | | 322,316,967 | |
| | | | | | | | | | | | |
| | | | |
| Internet & Catalog Retail: 1.96% | | | | | | | | | | | | |
Amazon.com Incorporated † | | | | | | | 353,910 | | | | 125,471,712 | |
RetailMeNot Incorporated †« | | | | | | | 1,313,800 | | | | 20,403,314 | |
The Priceline Group Incorporated † | | | | | | | 54,050 | | | | 54,562,394 | |
| |
| | | | 200,437,420 | |
| | | | | | | | | | | | |
| | | | |
| Media: 1.04% | | | | | | | | | | | | |
The Walt Disney Company | | | | | | | 1,164,100 | | | | 105,886,536 | |
| | | | | | | | | | | | |
| | | | |
| Multiline Retail: 2.50% | | | | | | | | | | | | |
Burlington Stores Incorporated † | | | | | | | 152,000 | | | | 7,583,280 | |
Dollar Tree Incorporated † | | | | | | | 3,482,320 | | | | 247,592,952 | |
| |
| | | | 255,176,232 | |
| | | | | | | | | | | | |
| | | | |
| Specialty Retail: 5.31% | | | | | | | | | | | | |
Boot Barn Holdings Incorporated † | | | | | | | 57,300 | | | | 1,156,314 | |
Cabela’s Incorporated † | | | | | | | 878,940 | | | | 48,297,753 | |
CarMax Incorporated † | | | | | | | 2,901,800 | | | | 180,201,780 | |
Five Below Incorporated †(l)« | | | | | | | 3,485,130 | | | | 116,124,532 | |
Tractor Supply Company | | | | | | | 2,422,700 | | | | 196,650,559 | |
| |
| | | | 542,430,938 | |
| | | | | | | | | | | | |
| | | | |
| Textiles, Apparel & Luxury Goods: 0.65% | | | | | | | | | | | | |
Under Armour Incorporated Class A † | | | | | | | 929,210 | | | | 66,977,457 | |
| | | | | | | | | | | | |
| | | | |
Consumer Staples: 4.43% | | | | | | | | | | | | |
| | | | |
| Food & Staples Retailing: 3.83% | | | | | | | | | | | | |
Costco Wholesale Corporation | | | | | | | 667,940 | | | | 95,508,741 | |
Sprouts Farmers Market Incorporated † | | | | | | | 5,312,319 | | | | 193,421,535 | |
United Natural Foods Incorporated † | | | | | | | 1,330,000 | | | | 102,782,400 | |
| |
| | | | 391,712,676 | |
| | | | | | | | | | | | |
The accompanying notes are an integral part of these financial statements.
| | | | |
| 8 | | Wells Fargo Advantage Growth Fund | | Portfolio of investments—January 31, 2015 (unaudited) |
| | | | | | | | | | | | |
| Security name | | | | | | Shares | | | Value | |
| | | | |
| Personal Products: 0.60% | | | | | | | | | | | | |
Estee Lauder Companies Incorporated Class A | | | | | | | 864,410 | | | $ | 61,018,702 | |
| | | | | | | | | | | | |
| | | | |
Energy: 3.82% | | | | | | | | | | | | |
| | | | |
| Energy Equipment & Services: 0.09% | | | | | | | | | | | | |
Oil States International Incorporated | | | | | | | 239,000 | | | | 9,815,730 | |
| | | | | | | | | | | | |
| | | | |
| Oil, Gas & Consumable Fuels: 3.73% | | | | | | | | | | | | |
Concho Resources Incorporated † | | | | | | | 1,568,260 | | | | 173,841,621 | |
Memorial Resource Development Corporation † | | | | | | | 1,483,000 | | | | 28,399,450 | |
Oasis Petroleum Incorporated † | | | | | | | 1,242,300 | | | | 16,696,512 | |
Parsley Energy Incorporated Class A † | | | | | | | 1,081,069 | | | | 18,129,527 | |
Pioneer Natural Resources Company | | | | | | | 881,000 | | | | 132,616,930 | |
Whiting Petroleum Corporation † | | | | | | | 373,000 | | | | 11,197,460 | |
| |
| | | | 380,881,500 | |
| | | | | | | | | | | | |
| | | | |
Financials: 5.49% | | | | | | | | | | | | |
| | | | |
| Capital Markets: 2.56% | | | | | | | | | | | | |
Financial Engines Incorporated « | | | | | | | 2,267,460 | | | | 81,401,814 | |
TD Ameritrade Holding Corporation | | | | | | | 5,546,020 | | | | 179,635,588 | |
| |
| | | | 261,037,402 | |
| | | | | | | | | | | | |
| | | | |
| Consumer Finance: 1.60% | | | | | | | | | | | | |
American Express Company | | | | | | | 2,031,570 | | | | 163,927,383 | |
| | | | | | | | | | | | |
| | | | |
| Diversified Financial Services: 1.33% | | | | | | | | | | | | |
MarketAxess Holdings Incorporated | | | | | | | 1,788,060 | | | | 135,838,918 | |
| | | | | | | | | | | | |
| | | | |
Health Care: 21.20% | | | | | | | | | | | | |
| | | | |
| Biotechnology: 11.96% | | | | | | | | | | | | |
Alexion Pharmaceuticals Incorporated † | | | | | | | 1,666,490 | | | | 305,367,628 | |
Biogen Idec Incorporated † | | | | | | | 541,640 | | | | 210,784,622 | |
BioMarin Pharmaceutical Incorporated † | | | | | | | 21,230 | | | | 2,062,707 | |
Celgene Corporation † | | | | | | | 1,546,940 | | | | 184,333,370 | |
Gilead Sciences Incorporated † | | | | | | | 1,262,320 | | | | 132,329,006 | |
Medivation Incorporated † | | | | | | | 776,320 | | | | 84,479,142 | |
NPS Pharmaceuticals Incorporated † | | | | | | | 1,441,175 | | | | 66,092,286 | |
Regeneron Pharmaceuticals Incorporated † | | | | | | | 474,490 | | | | 197,701,003 | |
Spark Therapeutics Incorporated † | | | | | | | 17,040 | | | | 391,920 | |
Synageva BioPharma Corporation †« | | | | | | | 340,000 | | | | 39,174,800 | |
| |
| | | | 1,222,716,484 | |
| | | | | | | | | | | | |
| | | | |
| Health Care Equipment & Supplies: 0.68% | | | | | | | | | | | | |
Medtronic plc | | | | | | | 982,472 | | | | 70,148,475 | |
| | | | | | | | | | | | |
| | | | |
| Health Care Providers & Services: 3.34% | | | | | | | | | | | | |
AmerisourceBergen Corporation | | | | | | | 1,288,070 | | | | 122,431,054 | |
Catamaran Corporation † | | | | | | | 2,593,350 | | | | 129,434,099 | |
Envision Healthcare Holdings Incorporated † | | | | | | | 2,596,690 | | | | 89,274,202 | |
| |
| | | | 341,139,355 | |
| | | | | | | | | | | | |
The accompanying notes are an integral part of these financial statements.
| | | | | | |
| Portfolio of investments—January 31, 2015 (unaudited) | | Wells Fargo Advantage Growth Fund | | | 9 | |
| | | | | | | | | | | | |
| Security name | | | | | | Shares | | | Value | |
| | | | |
| Health Care Technology: 2.37% | | | | | | | | | | | | |
Cerner Corporation † | | | | | | | 2,955,920 | | | $ | 196,125,292 | |
Veeva Systems Incorporated Class A †« | | | | | | | 1,591,900 | | | | 45,783,044 | |
| |
| | | | 241,908,336 | |
| | | | | | | | | | | | |
| | | | |
| Life Sciences Tools & Services: 1.33% | | | | | | | | | | | | |
Mettler-Toledo International Incorporated † | | | | | | | 380,780 | | | | 115,738,081 | |
Quintiles Transnational Holdings Incorporated † | | | | | | | 335,640 | | | | 20,306,220 | |
| |
| | | | 136,044,301 | |
| | | | | | | | | | | | |
|
| Pharmaceuticals: 1.52% | |
Jazz Pharmaceuticals plc † | | | | | | | 23,740 | | | | 4,020,132 | |
Pacira Pharmaceuticals Incorporated † | | | | | | | 315,500 | | | | 33,868,925 | |
Perrigo Company plc | | | | | | | 771,750 | | | | 117,105,345 | |
| |
| | | | 154,994,402 | |
| | | | | | | | | | | | |
| | | | |
Industrials: 11.64% | | | | | | | | | | | | |
|
| Aerospace & Defense: 0.71% | |
The Boeing Company | | | | | | | 184,350 | | | | 26,798,960 | |
United Technologies Corporation | | | | | | | 393,410 | | | | 45,155,600 | |
| |
| | | | 71,954,560 | |
| | | | | | | | | | | | |
|
| Air Freight & Logistics: 0.91% | |
United Parcel Service Incorporated Class B | | | | | | | 944,270 | | | | 93,331,647 | |
| | | | | | | | | | | | |
|
| Building Products: 0.50% | |
A.O. Smith Corporation | | | | | | | 860,000 | | | | 51,092,600 | |
| | | | | | | | | | | | |
|
| Commercial Services & Supplies: 0.90% | |
Tyco International plc | | | | | | | 340,580 | | | | 13,899,070 | |
Waste Connections Incorporated | | | | | | | 1,806,400 | | | | 78,072,608 | |
| |
| | | | 91,971,678 | |
| | | | | | | | | | | | |
|
| Industrial Conglomerates: 0.15% | |
Danaher Corporation | | | | | | | 182,470 | | | | 15,031,879 | |
| | | | | | | | | | | | |
|
| Machinery: 0.47% | |
Flowserve Corporation | | | | | | | 227,380 | | | | 12,389,936 | |
ITT Corporation | | | | | | | 993,500 | | | | 35,577,235 | |
| |
| | | | 47,967,171 | |
| | | | | | | | | | | | |
|
| Professional Services: 0.28% | |
Paylocity Holding Corporation † | | | | | | | 1,230,855 | | | | 28,998,944 | |
| | | | | | | | | | | | |
|
| Road & Rail: 7.72% | |
Genesee & Wyoming Incorporated Class A † | | | | | | | 1,984,990 | | | | 163,662,426 | |
Kansas City Southern | | | | | | | 1,541,346 | | | | 169,686,781 | |
Norfolk Southern Corporation | | | | | | | 1,663,570 | | | | 169,634,233 | |
Union Pacific Corporation | | | | | | | 2,438,530 | | | | 285,820,101 | |
| |
| | | | 788,803,541 | |
| | | | | | | | | | | | |
The accompanying notes are an integral part of these financial statements.
| | | | |
| 10 | | Wells Fargo Advantage Growth Fund | | Portfolio of investments—January 31, 2015 (unaudited) |
| | | | | | | | | | | | |
| Security name | | | | | | Shares | | | Value | |
| | | | |
Information Technology: 31.17% | | | | | | | | | | | | |
|
| Communications Equipment: 0.91% | |
QUALCOMM Incorporated | | | | | | | 1,479,520 | | | $ | 92,410,819 | |
| | | | | | | | | | | | |
|
| Internet Software & Services: 13.58% | |
Akamai Technologies Incorporated † | | | | | | | 3,007,500 | | | | 174,901,163 | |
CoStar Group Incorporated † | | | | | | | 633,030 | | | | 116,800,365 | |
Demandware Incorporated † | | | | | | | 615,350 | | | | 32,958,146 | |
Envestnet Incorporated †(l) | | | | | | | 2,547,460 | | | | 131,117,766 | |
Everyday Health Incorporated † | | | | | | | 159,274 | | | | 2,210,723 | |
Facebook Incorporated Class A † | | | | | | | 2,738,410 | | | | 207,872,703 | |
Google Incorporated Class A † | | | | | | | 468,000 | | | | 251,573,400 | |
Google Incorporated Class C † | | | | | | | 382,200 | | | | 204,293,544 | |
HomeAway Incorporated † | | | | | | | 4,105,340 | | | | 104,645,117 | |
New Relic Incorporated † | | | | | | | 158,446 | | | | 4,921,333 | |
Pandora Media Incorporated † | | | | | | | 5,541,000 | | | | 91,980,600 | |
Shutterstock Incorporated †« | | | | | | | 1,154,928 | | | | 65,010,897 | |
| |
| | | | 1,388,285,757 | |
| | | | | | | | | | | | |
| | | | |
| IT Services: 5.88% | | | | | | | | | | | | |
Alliance Data Systems Corporation † | | | | | | | 710,603 | | | | 205,243,464 | |
MasterCard Incorporated Class A | | | | | | | 2,452,650 | | | | 201,190,880 | |
Vantiv Incorporated Class A † | | | | | | | 1,271,690 | | | | 43,733,419 | |
Visa Incorporated Class A | | | | | | | 592,660 | | | | 151,074,961 | |
| |
| | | | 601,242,724 | |
| | | | | | | | | | | | |
| | | | |
| Semiconductors & Semiconductor Equipment: 2.57% | | | | | | | | | | | | |
Microchip Technology Incorporated « | | | | | | | 4,939,080 | | | | 222,752,508 | |
Silicon Laboratories Incorporated † | | | | | | | 908,797 | | | | 39,768,957 | |
| |
| | | | 262,521,465 | |
| | | | | | | | | | | | |
| | | | |
| Software: 5.70% | | | | | | | | | | | | |
Adobe Systems Incorporated † | | | | | | | 164,000 | | | | 11,501,320 | |
Fleetmatics Group plc †« | | | | | | | 1,408,500 | | | | 49,874,985 | |
Fortinet Incorporated † | | | | | | | 529,000 | | | | 15,814,455 | |
Paycom Software Incorporated † | | | | | | | 1,736,657 | | | | 45,448,314 | |
Proofpoint Incorporated † | | | | | | | 123,000 | | | | 6,174,755 | |
Salesforce.com Incorporated † | | | | | | | 1,069,330 | | | | 60,363,679 | |
ServiceNow Incorporated † | | | | | | | 1,293,000 | | | | 94,259,700 | |
SolarWinds Incorporated † | | | | | | | 863,000 | | | | 41,553,450 | |
Splunk Incorporated † | | | | | | | 1,392,750 | | | | 71,935,538 | |
Synchronoss Technologies Incorporated † | | | | | | | 430,000 | | | | 18,262,100 | |
Tableau Software Incorporated Class A † | | | | | | | 729,040 | | | | 58,877,270 | |
Ultimate Software Group Incorporated † | | | | | | | 593,700 | | | | 87,873,537 | |
VMware Incorporated † | | | | | | | 271,000 | | | | 20,894,100 | |
| |
| | | | 582,833,203 | |
| | | | | | | | | | | | |
| | | | |
| Technology Hardware, Storage & Peripherals: 2.53% | | | | | | | | | | | | |
Apple Incorporated | | | | | | | 2,097,400 | | | | 245,731,384 | |
Stratasys Limited †« | | | | | | | 166,930 | | | | 13,269,266 | |
| |
| | | | 259,000,650 | |
| | | | | | | | | | | | |
The accompanying notes are an integral part of these financial statements.
| | | | | | |
| Portfolio of investments—January 31, 2015 (unaudited) | | Wells Fargo Advantage Growth Fund | | | 11 | |
| | | | | | | | | | | | | | |
| Security name | | | | | | | Shares | | | Value | |
| | | | |
Materials: 2.61% | | | | | | | | | | | | | | |
| | | | |
| Chemicals: 2.61% | | | | | | | | | | | | | | |
Airgas Incorporated | | | | | | | | | 627,140 | | | $ | 70,641,050 | |
Monsanto Company | | | | | | | | | 278,560 | | | | 32,864,509 | |
Praxair Incorporated | | | | | | | | | 1,354,280 | | | | 163,312,620 | |
| | | | |
| | | | | | | | | | | | | 266,818,179 | |
| | | | | | | | | | | | | | |
| | | | |
Total Common Stocks (Cost $6,539,085,121) | | | | | | | | | | | | | 10,135,247,827 | |
| | | | | | | | | | | | | | |
| | | | |
| | | Yield | | | | | | | | | |
| Short-Term Investments: 2.85% | | | | | | | | | | | | | | |
| | | | |
| Investment Companies: 2.85% | | | | | | | | | | | | | | |
Securities Lending Cash Investments, LLC (l)(r)(u) | | | 0.13 | % | | | | | 203,031,615 | | | | 203,031,615 | |
Wells Fargo Advantage Cash Investment Money Market Fund, Select Class (l)(u) | | | 0.10 | | | | | | 87,982,138 | | | | 87,982,138 | |
| | | | |
Total Short-Term Investments (Cost $291,013,753) | | | | | | | | | | | | | 291,013,753 | |
| | | | | | | | | | | | | | |
| | | | | | | | |
| Total investments in securities (Cost $6,830,098,874) * | | | 102.01 | % | | | 10,426,261,580 | |
Other assets and liabilities, net | | | (2.01 | ) | | | (205,004,739 | ) |
| | | | | | | | |
| Total net assets | | | 100.00 | % | | $ | 10,221,256,841 | |
| | | | | | | | |
| † | Non-income-earning security |
| (l) | The security represents an affiliate of the Fund as defined in the Investment Company Act of 1940. |
| « | All or a portion of this security is on loan. |
| (r) | The investment is a non-registered investment vehicle purchased with cash collateral received from securities on loan. |
| (u) | The rate represents the 7-day annualized yield at period end. |
| * | Cost for federal income tax purposes is $6,866,929,948 and unrealized gains (losses) consists of: |
| | | | |
Gross unrealized gains | | $ | 3,760,445,361 | |
Gross unrealized losses | | | (201,113,729 | ) |
| | | | |
Net unrealized gains | | $ | 3,559,331,632 | |
The accompanying notes are an integral part of these financial statements.
| | | | |
| 12 | | Wells Fargo Advantage Growth Fund | | Statement of assets and liabilities—January 31, 2015 (unaudited) |
| | | | |
| | | | |
| |
Assets | | | | |
Investments | | | | |
In unaffiliated securities (including $198,569,793 of securities loaned), at value (cost $6,140,826,043) | | $ | 9,720,596,872 | |
In affiliated securities, at value (cost $689,272,831) | | | 705,664,708 | |
| | | | |
Total investments, at value (cost $6,830,098,874) | | | 10,426,261,580 | |
Receivable for investments sold | | | 93,713,492 | |
Receivable for Fund shares sold | | | 10,315,724 | |
Receivable for dividends | | | 980,306 | |
Receivable for securities lending income | | | 61,580 | |
Prepaid expenses and other assets | | | 116,427 | |
| | | | |
Total assets | | | 10,531,449,109 | |
| | | | |
| |
Liabilities | | | | |
Payable for investments purchased | | | 78,239,272 | |
Payable for Fund shares redeemed | | | 19,411,372 | |
Payable upon receipt of securities loaned | | | 203,031,615 | |
Advisory fee payable | | | 5,447,063 | |
Distribution fee payable | | | 315,397 | |
Administration fees payable | | | 1,944,531 | |
Accrued expenses and other liabilities | | | 1,803,018 | |
| | | | |
Total liabilities | | | 310,192,268 | |
| | | | |
Total net assets | | $ | 10,221,256,841 | |
| | | | |
| |
NET ASSETS CONSIST OF | | | | |
Paid-in capital | | $ | 6,405,060,207 | |
Accumulated net investment loss | | | (41,711,090 | ) |
Accumulated net realized gains on investments | | | 261,745,018 | |
Net unrealized gains on investments | | | 3,596,162,706 | |
| | | | |
Total net assets | | $ | 10,221,256,841 | |
| | | | |
| |
COMPUTATION OF NET ASSET VALUE AND OFFERING PRICE PER SHARE | | | | |
Net assets – Class A | | $ | 1,544,008,485 | |
Shares outstanding – Class A1 | | | 34,143,216 | |
Net asset value per share – Class A | | | $45.22 | |
Maximum offering price per share – Class A2 | | | $47.98 | |
Net assets – Class C | | $ | 474,053,883 | |
Shares outstanding – Class C1 | | | 11,615,916 | |
Net asset value per share – Class C | | | $40.81 | |
Net assets – Administrator Class | | $ | 2,475,741,366 | |
Shares outstanding – Administrator Class1 | | | 51,328,994 | |
Net asset value per share – Administrator Class | | | $48.23 | |
Net assets – Institutional Class | | $ | 3,630,069,087 | |
Shares outstanding – Institutional Class1 | | | 72,409,745 | |
Net asset value per share – Institutional Class | | | $50.13 | |
Net assets – Investor Class | | $ | 2,097,384,020 | |
Shares outstanding – Investor Class1 | | | 46,577,275 | |
Net asset value per share – Investor Class | | | $45.03 | |
| 1 | The Fund has an unlimited number of authorized shares. |
| 2 | Maximum offering price is computed as 100/94.25 of net asset value. On investments of $50,000 or more, the offering price is reduced. |
The accompanying notes are an integral part of these financial statements.
| | | | | | |
| Statement of operations—six months ended January 31, 2015 (unaudited) | | Wells Fargo Advantage Growth Fund | | | 13 | |
| | | | |
| | | | |
| |
Investment income | | | | |
Dividends | | $ | 26,891,779 | |
Securities lending income, net | | | 1,076,292 | |
Income from affiliated securities | | | 35,320 | |
| | | | |
Total investment income | | | 28,003,391 | |
| | | | |
| |
Expenses | | | | |
Advisory fee | | | 33,855,972 | |
Administration fees | | | | |
Fund level | | | 2,414,284 | |
Class A | | | 2,321,958 | |
Class C | | | 680,637 | |
Administrator Class | | | 1,373,418 | |
Institutional Class | | | 1,500,666 | |
Investor Class | | | 3,549,674 | |
Shareholder servicing fees | | | | |
Class A | | | 2,232,652 | |
Class C | | | 654,459 | |
Administrator Class | | | 3,433,544 | |
Investor Class | | | 2,769,567 | |
Distribution fee | | | | |
Class C | | | 1,963,376 | |
Custody and accounting fees | | | 276,766 | |
Professional fees | | | 20,637 | |
Registration fees | | | 49,480 | |
Shareholder report expenses | | | 235,980 | |
Trustees’ fees and expenses | | | 5,199 | |
Other fees and expenses | | | 94,774 | |
| | | | |
Total expenses | | | 57,433,043 | |
Less: Fee waivers and/or expense reimbursements | | | (853,880 | ) |
| | | | |
Net expenses | | | 56,579,163 | |
| | | | |
Net investment loss | | | (28,575,772 | ) |
| | | | |
| |
REALIZED AND UNREALIZED GAINS (LOSSES) ON INVESTMENTS | | | | |
| |
Net realized gains (losses) on: | | | | |
Unaffiliated securities | | | 629,656,993 | |
Affiliated securities | | | (763,906 | ) |
| | | | |
Net realized gains on investments | | | 628,893,087 | |
| | | | |
| |
Net change in unrealized gains (losses) on: | | | | |
Unaffiliated securities | | | (72,341,634 | ) |
Affiliated securities | | | 22,756,067 | |
| | | | |
Net change in unrealized gains (losses) on investments | | | (49,585,567 | ) |
| | | | |
Net realized and unrealized gains (losses) on investments | | | 579,307,520 | |
| | | | |
Net increase in net assets resulting from operations | | $ | 550,731,748 | |
| | | | |
The accompanying notes are an integral part of these financial statements.
| | | | |
| 14 | | Wells Fargo Advantage Growth Fund | | Statement of changes in net assets |
| | | | | | | | | | | | | | | | |
| | | Six months ended
January 31, 2015
(unaudited) | | | Year ended
July 31, 2014 | |
| | | |
Operations | | | | | | | | | | | | |
Net investment loss | | | | | | $ | (28,575,772 | ) | | | | | | $ | (62,366,268 | ) |
Net realized gains on investments | | | | | | | 628,893,087 | | | | | | | | 1,343,449,019 | |
Net change in unrealized gains (losses) on investments | | | | | | | (49,585,567 | ) | | | | | | | (75,757,847 | ) |
| | | | |
Net increase in net assets resulting from operations | | | | | | | 550,731,748 | | | | | | | | 1,205,324,904 | |
| | | | |
| | | |
Distributions to shareholders from | | | | | | | | | | | | |
Net realized gains | | | | | | | | | | | | | | | | |
Class A | | | | | | | (231,582,982 | ) | | | | | | | (89,729,152 | ) |
Class C | | | | | | | (75,250,933 | ) | | | | | | | (23,545,922 | ) |
Administrator Class | | | | | | | (343,165,486 | ) | | | | | | | (118,713,858 | ) |
Institutional Class | | | | | | | (470,228,817 | ) | | | | | | | (93,848,760 | ) |
Investor Class | | | | | | | (300,177,941 | ) | | | | | | | (85,239,966 | ) |
| | | | |
Total distributions to shareholders | | | | | | | (1,420,406,159 | ) | | | | | | | (411,077,658 | ) |
| | | | |
| | | | |
Capital share transactions | | | Shares | | | | | | | | Shares | | | | | |
Proceeds from shares sold | | | | | | | | | | | | | | | | |
Class A | | | 1,804,075 | | | | 86,656,811 | | | | 6,002,013 | | | | 300,443,610 | |
Class C | | | 563,650 | | | | 23,357,835 | | | | 807,695 | | | | 37,350,141 | |
Administrator Class | | | 4,963,939 | | | | 256,284,989 | | | | 14,056,652 | | | | 739,933,638 | |
Institutional Class | | | 21,034,774 | | | | 1,142,541,002 | | | | 15,992,448 | | | | 869,345,348 | |
Investor Class | | | 809,589 | | | | 39,337,169 | | | | 3,721,720 | | | | 184,011,064 | |
| | | | |
| | | | | | | 1,548,177,806 | | | | | | | | 2,131,083,801 | |
| | | | |
Reinvestment of distributions | | | | | | | | | | | | | | | | |
Class A | | | 4,653,340 | | | | 208,236,915 | | | | 1,674,679 | | | | 83,231,553 | |
Class C | | | 1,331,646 | | | | 53,838,455 | | | | 351,793 | | | | 16,150,797 | |
Administrator Class | | | 6,824,589 | | | | 325,601,160 | | | | 2,144,767 | | | | 112,428,674 | |
Institutional Class | | | 9,196,950 | | | | 455,984,759 | | | | 1,666,975 | | | | 90,150,024 | |
Investor Class | | | 6,596,023 | | | | 293,918,763 | | | | 1,690,907 | | | | 83,784,433 | |
| | | | |
| | | | | | | 1,337,580,052 | | | | | | | | 385,745,481 | |
| | | | |
Payment for shares redeemed | | | | | | | | | | | | | | | | |
Class A | | | (13,274,180 | ) | | | (659,495,872 | ) | | | (19,450,696 | ) | | | (960,828,794 | ) |
Class C | | | (2,475,695 | ) | | | (112,260,113 | ) | | | (2,539,818 | ) | | | (116,715,446 | ) |
Administrator Class | | | (24,091,160 | ) | | | (1,249,034,883 | ) | | | (19,888,444 | ) | | | (1,043,440,117 | ) |
Institutional Class | | | (12,378,684 | ) | | | (673,004,730 | ) | | | (15,421,161 | ) | | | (835,534,173 | ) |
Investor Class | | | (6,131,506 | ) | | | (301,068,089 | ) | | | (9,522,188 | ) | | | (470,424,557 | ) |
| | | | |
| | | | | | | (2,994,863,687 | ) | | | | | | | (3,426,943,087 | ) |
| | | | |
Net decrease in net assets resulting from capital share transactions | | | | | | | (109,105,829 | ) | | | | | | | (910,113,805 | ) |
| | | | |
Total decrease in net assets | | | | | | | (978,780,240 | ) | | | | | | | (115,866,559 | ) |
| | | | |
| | |
Net assets | | | | | | | | |
Beginning of period | | | | | | | 11,200,037,081 | | | | | | | | 11,315,903,640 | |
| | | | |
End of period | | | | | | $ | 10,221,256,841 | | | | | | | $ | 11,200,037,081 | |
| | | | |
Accumulated net investment loss | | | | | | $ | (41,711,090 | ) | | | | | | $ | (13,135,318 | ) |
| | | | |
The accompanying notes are an integral part of these financial statements.
| | | | | | |
| Financial highlights | | Wells Fargo Advantage Growth Fund | | | 15 | |
(For a share outstanding throughout each period)
| | | | | | | | | | | | | | | | | | | | | | | | |
| | | Six months ended
January 31, 2015 (unaudited) | | | Year ended July 31 | |
| CLASS A | | | 2014 | | | 2013 | | | 2012 | | | 2011 | | | 2010 | |
Net asset value, beginning of period | | | $49.99 | | | | $46.74 | | | | $37.85 | | | | $35.88 | | | | $26.10 | | | | $21.13 | |
Net investment loss | | | (0.17 | )1 | | | (0.32 | )1 | | | (0.17 | )1 | | | (0.21 | )1 | | | (0.27 | )1 | | | (0.16 | )1 |
Net realized and unrealized gains (losses) on investments | | | 2.63 | | | | 5.34 | | | | 9.06 | | | | 2.65 | | | | 10.05 | | | | 5.13 | |
| | | | | | | | | | | | | | | | | | | | | | | | |
Total from investment operations | | | 2.46 | | | | 5.02 | | | | 8.89 | | | | 2.44 | | | | 9.78 | | | | 4.97 | |
Distributions to shareholders from | | | | | | | | | | | | | | | | | | | | | | | | |
Net realized gains | | | (7.23 | ) | | | (1.77 | ) | | | 0.00 | | | | (0.47 | ) | | | 0.00 | | | | 0.00 | |
Net asset value, end of period | | | $45.22 | | | | $49.99 | | | | $46.74 | | | | $37.85 | | | | $35.88 | | | | $26.10 | |
Total return2 | | | 5.07 | % | | | 10.77 | % | | | 23.49 | % | | | 6.93 | % | | | 37.43 | % | | | 23.52 | % |
Ratios to average net assets (annualized) | | | | | | | | | | | | | | | | | | | | | | | | |
Gross expenses | | | 1.18 | % | | | 1.18 | % | | | 1.19 | % | | | 1.20 | % | | | 1.24 | % | | | 1.31 | % |
Net expenses | | | 1.18 | % | | | 1.18 | % | | | 1.19 | % | | | 1.20 | % | | | 1.24 | % | | | 1.30 | % |
Net investment loss | | | (0.66 | )% | | | (0.64 | )% | | | (0.41 | )% | | | (0.56 | )% | | | (0.81 | )% | | | (0.64 | )% |
Supplemental data | | | | | | | | | | | | | | | | | | | | | | | | |
Portfolio turnover rate | | | 15 | % | | | 42 | % | | | 38 | % | | | 47 | % | | | 54 | % | | | 72 | % |
Net assets, end of period (000s omitted) | | | $1,544,008 | | | | $2,047,410 | | | | $2,464,533 | | | | $2,265,845 | | | | $1,204,675 | | | | $163,485 | |
| 1 | Calculated based upon average shares outstanding |
| 2 | Total return calculations do not include any sales charges. Returns for periods of less than one year are not annualized. |
The accompanying notes are an integral part of these financial statements.
| | | | |
| 16 | | Wells Fargo Advantage Growth Fund | | Financial highlights |
(For a share outstanding throughout each period)
| | | | | | | | | | | | | | | | | | | | | | | | |
| | | Six months ended
January 31, 2015 (unaudited) | | | Year ended July 31 | |
| CLASS C | | | 2014 | | | 2013 | | | 2012 | | | 2011 | | | 2010 | |
Net asset value, beginning of period | | | $45.95 | | | | $43.41 | | | | $35.42 | | | | $33.86 | | | | $24.81 | | | | $20.24 | |
Net investment loss | | | (0.33 | )1 | | | (0.64 | )1 | | | (0.45 | )1 | | | (0.46 | )1 | | | (0.51 | )1 | | | (0.34 | )1 |
Net realized and unrealized gains (losses) on investments | | | 2.42 | | | | 4.95 | | | | 8.44 | | | | 2.49 | | | | 9.56 | | | | 4.91 | |
| | | | | | | | | | | | | | | | | | | | | | | | |
Total from investment operations | | | 2.09 | | | | 4.31 | | | | 7.99 | | | | 2.03 | | | | 9.05 | | | | 4.57 | |
Distributions to shareholders from | | | | | | | | | | | | | | | | | | | | | | | | |
Net realized gains | | | (7.23 | ) | | | (1.77 | ) | | | 0.00 | | | | (0.47 | ) | | | 0.00 | | | | 0.00 | |
Net asset value, end of period | | | $40.81 | | | | $45.95 | | | | $43.41 | | | | $35.42 | | | | $33.86 | | | | $24.81 | |
Total return2 | | | 4.67 | % | | | 9.96 | % | | | 22.56 | % | | | 6.12 | % | | | 36.44 | % | | | 22.58 | % |
Ratios to average net assets (annualized) | | | | | | | | | | | | | | | | | | | | | | | | |
Gross expenses | | | 1.93 | % | | | 1.93 | % | | | 1.94 | % | | | 1.95 | % | | | 1.99 | % | | | 2.06 | % |
Net expenses | | | 1.93 | % | | | 1.93 | % | | | 1.94 | % | | | 1.95 | % | | | 1.99 | % | | | 2.05 | % |
Net investment loss | | | (1.42 | )% | | | (1.39 | )% | | | (1.16 | )% | | | (1.32 | )% | | | (1.57 | )% | | | (1.40 | )% |
Supplemental data | | | | | | | | | | | | | | | | | | | | | | | | |
Portfolio turnover rate | | | 15 | % | | | 42 | % | | | 38 | % | | | 47 | % | | | 54 | % | | | 72 | % |
Net assets, end of period (000s omitted) | | | $474,054 | | | | $560,481 | | | | $589,402 | | | | $525,285 | | | | $233,114 | | | | $14,737 | |
| 1 | Calculated based upon average shares outstanding |
| 2 | Total return calculations do not include any sales charges. Returns for periods of less than one year are not annualized. |
The accompanying notes are an integral part of these financial statements.
| | | | | | |
| Financial highlights | | Wells Fargo Advantage Growth Fund | | | 17 | |
(For a share outstanding throughout each period)
| | | | | | | | | | | | | | | | | | | | | | | | |
| | | Six months ended
January 31, 2015 (unaudited) | | | Year ended July 31 | |
| ADMINISTRATOR CLASS | | | 2014 | | | 2013 | | | 2012 | | | 2011 | | | 2010 | |
Net asset value, beginning of period | | | $52.80 | | | | $49.16 | | | | $39.72 | | | | $37.54 | | | | $27.24 | | | | $21.98 | |
Net investment loss | | | (0.12 | )1 | | | (0.23 | ) | | | (0.08 | )1 | | | (0.13 | )1 | | | (0.18 | )1 | | | (0.08 | )1 |
Net realized and unrealized gains (losses) on investments | | | 2.78 | | | | 5.64 | | | | 9.52 | | | | 2.78 | | | | 10.48 | | | | 5.34 | |
| | | | | | | | | | | | | | | | | | | | | | | | |
Total from investment operations | | | 2.66 | | | | 5.41 | | | | 9.44 | | | | 2.65 | | | | 10.30 | | | | 5.26 | |
Distributions to shareholders from | | | | | | | | | | | | | | | | | | | | | | | | |
Net realized gains | | | (7.23 | ) | | | (1.77 | ) | | | 0.00 | | | | (0.47 | ) | | | 0.00 | | | | 0.00 | |
Net asset value, end of period | | | $48.23 | | | | $52.80 | | | | $49.16 | | | | $39.72 | | | | $37.54 | | | | $27.24 | |
Total return2 | | | 5.18 | % | | | 11.04 | % | | | 23.77 | % | | | 7.15 | % | | | 37.81 | % | | | 23.93 | % |
Ratios to average net assets (annualized) | | | | | | | | | | | | | | | | | | | | | | | | |
Gross expenses | | | 1.02 | % | | | 1.02 | % | | | 1.03 | % | | | 1.03 | % | | | 1.08 | % | | | 1.13 | % |
Net expenses | | | 0.96 | % | | | 0.96 | % | | | 0.96 | % | | | 0.96 | % | | | 0.96 | % | | | 0.96 | % |
Net investment loss | | | (0.45 | )% | | | (0.42 | )% | | | (0.18 | )% | | | (0.33 | )% | | | (0.51 | )% | | | (0.29 | )% |
Supplemental data | | | | | | | | | | | | | | | | | | | | | | | | |
Portfolio turnover rate | | | 15 | % | | | 42 | % | | | 38 | % | | | 47 | % | | | 54 | % | | | 72 | % |
Net assets, end of period (000s omitted) | | | $2,475,741 | | | | $3,359,480 | | | | $3,309,683 | | | | $2,984,775 | | | | $1,339,245 | | | | $414,489 | |
| 1 | Calculated based upon average shares outstanding |
| 2 | Returns for periods of less than one year are not annualized. |
The accompanying notes are an integral part of these financial statements.
| | | | |
| 18 | | Wells Fargo Advantage Growth Fund | | Financial highlights |
(For a share outstanding throughout each period)
| | | | | | | | | | | | | | | | | | | | | | | | |
| | | Six months ended
January 31, 2015 (unaudited) | | | Year ended July 31 | |
| INSTITUTIONAL CLASS | | | 2014 | | | 2013 | | | 2012 | | | 2011 | | | 2010 | |
Net asset value, beginning of period | | | $54.54 | | | | $50.63 | | | | $40.83 | | | | $38.49 | | | | $27.88 | | | | $22.46 | |
Net investment income (loss) | | | (0.07 | )1 | | | (0.13 | ) | | | 0.01 | 1 | | | (0.05 | )1 | | | (0.12 | )1 | | | (0.03 | )1 |
Net realized and unrealized gains (losses) on investments | | | 2.89 | | | | 5.81 | | | | 9.79 | | | | 2.86 | | | | 10.73 | | | | 5.45 | |
| | | | | | | | | | | | | | | | | | | | | | | | |
Total from investment operations | | | 2.82 | | | | 5.68 | | | | 9.80 | | | | 2.81 | | | | 10.61 | | | | 5.42 | |
Distributions to shareholders from | | | | | | | | | | | | | | | | | | | | | | | | |
Net realized gains | | | (7.23 | ) | | | (1.77 | ) | | | 0.00 | | | | (0.47 | ) | | | 0.00 | | | | 0.00 | |
Net asset value, end of period | | | $50.13 | | | | $54.54 | | | | $50.63 | | | | $40.83 | | | | $38.49 | | | | $27.88 | |
Total return2 | | | 5.32 | % | | | 11.26 | % | | | 24.03 | % | | | 7.37 | % | | | 38.06 | % | | | 24.13 | % |
Ratios to average net assets (annualized) | | | | | | | | | | | | | | | | | | | | | | | | |
Gross expenses | | | 0.75 | % | | | 0.75 | % | | | 0.76 | % | | | 0.77 | % | | | 0.81 | % | | | 0.86 | % |
Net expenses | | | 0.75 | % | | | 0.75 | % | | | 0.75 | % | | | 0.76 | % | | | 0.80 | % | | | 0.80 | % |
Net investment income (loss) | | | (0.25 | )% | | | (0.21 | )% | | | 0.02 | % | | | (0.13 | )% | | | (0.35 | )% | | | (0.12 | )% |
Supplemental data | | | | | | | | | | | | | | | | | | | | | | | | |
Portfolio turnover rate | | | 15 | % | | | 42 | % | | | 38 | % | | | 47 | % | | | 54 | % | | | 72 | % |
Net assets, end of period (000s omitted) | | | $3,630,069 | | | | $2,975,721 | | | | $2,649,095 | | | | $2,312,074 | | | | $992,748 | | | | $367,360 | |
| 1 | Calculated based upon average shares outstanding |
| 2 | Returns for periods of less than one year are not annualized. |
The accompanying notes are an integral part of these financial statements.
| | | | | | |
| Financial highlights | | Wells Fargo Advantage Growth Fund | | | 19 | |
(For a share outstanding throughout each period)
| | | | | | | | | | | | | | | | | | | | | | | | |
| | | Six months ended
January 31, 2015 (unaudited) | | | Year ended July 31 | |
| INVESTOR CLASS | | | 2014 | | | 2013 | | | 2012 | | | 2011 | | | 2010 | |
Net asset value, beginning of period | | | $49.82 | �� | | | $46.61 | | | | $37.77 | | | | $35.83 | | | | $26.09 | | | | $21.14 | |
Net investment loss | | | (0.18 | )1 | | | (0.43 | ) | | | (0.19 | )1 | | | (0.23 | )1 | | | (0.28 | )1 | | | (0.17 | )1 |
Net realized and unrealized gains (losses) on investments | | | 2.62 | | | | 5.41 | | | | 9.03 | | | | 2.64 | | | | 10.02 | | | | 5.12 | |
| | | | | | | | | | | | | | | | | | | | | | | | |
Total from investment operations | | | 2.44 | | | | 4.98 | | | | 8.84 | | | | 2.41 | | | | 9.74 | | | | 4.95 | |
Distributions to shareholders from | | | | | | | | | | | | | | | | | | | | | | | | |
Net realized gains | | | (7.23 | ) | | | (1.77 | ) | | | 0.00 | | | | (0.47 | ) | | | 0.00 | | | | 0.00 | |
Net asset value, end of period | | | $45.03 | | | | $49.82 | | | | $46.61 | | | | $37.77 | | | | $35.83 | | | | $26.09 | |
Total return2 | | | 5.05 | % | | | 10.71 | % | | | 23.40 | % | | | 6.85 | % | | | 37.29 | % | | | 23.42 | % |
Ratios to average net assets (annualized) | | | | | | | | | | | | | | | | | | | | | | | | |
Gross expenses | | | 1.24 | % | | | 1.24 | % | | | 1.25 | % | | | 1.26 | % | | | 1.31 | % | | | 1.41 | % |
Net expenses | | | 1.24 | % | | | 1.24 | % | | | 1.25 | % | | | 1.26 | % | | | 1.31 | % | | | 1.40 | % |
Net investment loss | | | (0.73 | )% | | | (0.70 | )% | | | (0.47 | )% | | | (0.64 | )% | | | (0.85 | )% | | | (0.71 | )% |
Supplemental data | | | | | | | | | | | | | | | | | | | | | | | | |
Portfolio turnover rate | | | 15 | % | | | 42 | % | | | 38 | % | | | 47 | % | | | 54 | % | | | 72 | % |
Net assets, end of period (000s omitted) | | | $2,097,384 | | | | $2,256,945 | | | | $2,303,191 | | | | $2,207,964 | | | | $1,707,285 | | | | $941,660 | |
| 1 | Calculated based upon average shares outstanding |
| 2 | Returns for periods of less than one year are not annualized. |
The accompanying notes are an integral part of these financial statements.
| | | | |
| 20 | | Wells Fargo Advantage Growth Fund | | Notes to financial statements (unaudited) |
1. ORGANIZATION
Wells Fargo Funds Trust (the “Trust”), a Delaware statutory trust organized on March 10, 1999, is an open-end management investment company registered under the Investment Company Act of 1940, as amended (the “1940 Act”). As an investment company, the Trust follows the accounting and reporting guidance in Financial Accounting Standards Board (“FASB”) Accounting Standards Codification Topic 946, Financial Services – Investment Companies. These financial statements report on the Wells Fargo Advantage Growth Fund (the “Fund”) which is a diversified series of the Trust.
2. SIGNIFICANT ACCOUNTING POLICIES
The following significant accounting policies, which are consistently followed in the preparation of the financial statements of the Fund, are in conformity with U.S. generally accepted accounting principles which require management to make estimates and assumptions that affect the reported amounts of assets and liabilities, disclosure of contingent assets and liabilities at the date of the financial statements, and the reported amounts of revenues and expenses during the reporting period. Actual results could differ from those estimates.
Securities valuation
All investments are valued each business day as of the close of regular trading on the New York Stock Exchange (generally 4 p.m. Eastern Time).
Equity securities that are listed on a foreign or domestic exchange or market are valued at the official closing price or, if none, the last sales price. If no sale occurs on the primary exchange or market for the security that day, the prior day’s price will be deemed “stale” and fair values will be determined in accordance with the Fund’s Valuation Procedures.
Investments in registered open-end investment companies are valued at net asset value. Non-registered investment vehicles are fair valued at net asset value.
Investments which are not valued using any of the methods discussed above are valued at their fair value, as determined in good faith by the Board of Trustees of the Fund. The Board of Trustees has established a Valuation Committee comprised of the Trustees and has delegated to it the authority to take any actions regarding the valuation of portfolio securities that the Valuation Committee deems necessary or appropriate, including determining the fair value of portfolio securities, unless the determination has been delegated to the Management Valuation Team of Wells Fargo Funds Management, LLC (“Funds Management”). The Board of Trustees retains the authority to make or ratify any valuation decisions or approve any changes to the Valuation Procedures as it deems appropriate. On a quarterly basis, the Board of Trustees receives reports on any valuation actions taken by the Valuation Committee or the Management Valuation Team which may include items for ratification.
Valuations of fair valued securities are compared to the next actual sales price when available, or other appropriate market values, to assess the continued appropriateness of the fair valuation methodologies used. These securities are fair valued on a day-to-day basis, taking into consideration changes to appropriate market information and any significant changes to the inputs considered in the valuation process until there is a readily available price provided on an exchange or by an independent pricing service. Valuations received from an independent pricing service or independent broker-dealer quotes are periodically validated by comparisons to most recent trades and valuations provided by other independent pricing services in addition to the review of prices by the adviser and/or subadviser. Unobservable inputs used in determining fair valuations are identified based on the type of security, taking into consideration factors utilized by market participants in valuing the investment, knowledge about the issuer and the current market environment.
Security loans
The Fund may lend its securities from time to time in order to earn additional income in the form of fees or interest on securities received as collateral or the investment of any cash received as collateral. The Fund continues to receive interest or dividends on the securities loaned. The Fund receives collateral in the form of cash or securities with a value at least equal to the value of the securities on loan. The value of the loaned securities is determined at the close of each business day and any additional required collateral is delivered to the Fund on the next business day. In a securities lending transaction, the net asset value of the Fund will be affected by an increase or decrease in the value of the securities loaned and by an increase or decrease in the value of the instrument in which collateral is invested. The amount of securities lending activity undertaken by the Fund fluctuates from time to time. In the event of default or bankruptcy by the borrower, the Fund may be prevented from recovering the loaned securities or gaining access to the collateral or may experience delays or costs in doing so. In addition, the investment of any cash collateral received may lose all or part of its value. The Fund has the right under the lending agreement to recover the securities from the borrower on demand.
| | | | | | |
| Notes to financial statements (unaudited) | | Wells Fargo Advantage Growth Fund | | | 21 | |
The Fund lends its securities through an unaffiliated securities lending agent. Cash collateral received in connection with its securities lending transactions is invested in Securities Lending Cash Investments, LLC (the “Securities Lending Fund”). The Securities Lending Fund is exempt from registration under Section 3(c)(7) of the 1940 Act and is managed by Funds Management and is subadvised by Wells Capital Management Incorporated (“WellsCap”). Funds Management receives an advisory fee starting at 0.05% and declining to 0.01% as the average daily net assets of the Securities Lending Fund increase. All of the fees received by Funds Management are paid to WellsCap for its services as subadviser. The Securities Lending Fund seeks to provide a positive return compared to the daily Fed Funds Open rate by investing in high-quality, U.S. dollar-denominated short-term money market instruments. Securities Lending Fund investments are fair valued based upon the amortized cost valuation technique. Income earned from investment in the Securities Lending Fund is included in securities lending income on the Statement of Operations.
Security transactions and income recognition
Securities transactions are recorded on a trade date basis. Realized gains or losses are recorded on the basis of identified cost.
Dividend income is recognized on the ex-dividend date.
Distributions to shareholders
Distributions to shareholders from net investment income and net realized gains, if any, are recorded on the ex-dividend date. Such distributions are determined in conformity with federal income tax regulations, which may differ in amount or character from net investment income and realized gains recognized for purposes of U.S. generally accepted accounting principles.
Federal and other taxes
The Fund intends to continue to qualify as a regulated investment company by distributing substantially all of its investment company taxable income and any net realized capital gains (after reduction for capital loss carryforwards) sufficient to relieve it from all, or substantially all, federal income taxes. Accordingly, no provision for federal income taxes was required.
The Fund’s income and federal excise tax returns and all financial records supporting those returns for the prior three fiscal years are subject to examination by the federal and Delaware revenue authorities. Management has analyzed the Fund’s tax positions taken on federal, state, and foreign tax returns for all open tax years and does not believe that there are any uncertain tax positions that require recognition of a tax liability.
As of July 31, 2014, the Fund had a qualified late-year ordinary loss of $13,135,318 which was recognized on the first day of the current fiscal year.
Class allocations
The separate classes of shares offered by the Fund differ principally in applicable sales charges, distribution, shareholder servicing, and administration fees. Class specific expenses are charged directly to that share class. Investment income, common expenses, and realized and unrealized gains (losses) on investments are allocated daily to each class of shares based on the relative proportion of net assets of each class.
3. FAIR VALUATION MEASUREMENTS
Fair value measurements of investments are determined within a framework that has established a fair value hierarchy based upon the various data inputs utilized in determining the value of the Fund’s investments. The three-level hierarchy gives the highest priority to unadjusted quoted prices in active markets for identical assets or liabilities (Level 1) and the lowest priority to significant unobservable inputs (Level 3). The Fund’s investments are classified within the fair value hierarchy based on the lowest level of input that is significant to the fair value measurement. The inputs are summarized into three broad levels as follows:
| n | | Level 1 – quoted prices in active markets for identical securities |
| n | | Level 2 – other significant observable inputs (including quoted prices for similar securities, interest rates, prepayment speeds, credit risk, use of amortized cost, etc.) |
| n | | Level 3 – significant unobservable inputs (including the Fund’s own assumptions in determining the fair value of investments) |
The inputs or methodologies used for valuing investments in securities are not necessarily an indication of the risk associated with investing in those securities.
| | | | |
| 22 | | Wells Fargo Advantage Growth Fund | | Notes to financial statements (unaudited) |
The following is a summary of the inputs used in valuing the Fund’s assets and liabilities as of January 31, 2015:
| | | | | | | | | | | | | | | | |
| | | Quoted prices (Level 1) | | | Other significant observable inputs (Level 2) | | | Significant unobservable inputs (Level 3) | | | Total | |
Assets | | | | | | | | | | | | | | | | |
Investments in: | | | | | | | | | | | | | | | | |
| | | | |
Common stocks | | | | | | | | | | | | | | | | |
Consumer discretionary | | $ | 1,921,799,346 | | | $ | 0 | | | $ | 0 | | | $ | 1,921,799,346 | |
Consumer staples | | | 452,731,378 | | | | 0 | | | | 0 | | | | 452,731,378 | |
Energy | | | 390,697,230 | | | | 0 | | | | 0 | | | | 390,697,230 | |
Financials | | | 560,803,703 | | | | 0 | | | | 0 | | | | 560,803,703 | |
Health care | | | 2,166,951,353 | | | | 0 | | | | 0 | | | | 2,166,951,353 | |
Industrials | | | 1,189,152,020 | | | | 0 | | | | 0 | | | | 1,189,152,020 | |
Information technology | | | 3,186,294,618 | | | | 0 | | | | 0 | | | | 3,186,294,618 | |
Materials | | | 266,818,179 | | | | 0 | | | | 0 | | | | 266,818,179 | |
| | | | |
Short-term investments | | | | | | | | | | | | | | | | |
Investment companies | | | 87,982,138 | | | | 203,031,615 | | | | 0 | | | | 291,013,753 | |
Total assets | | $ | 10,223,229,965 | | | $ | 203,031,615 | | | $ | 0 | | | $ | 10,426,261,580 | |
The Fund recognizes transfers between levels within the fair value hierarchy at the end of the reporting period. At January 31, 2015, the Fund did not have any transfers into/out of Level 1, Level 2, or Level 3.
4. TRANSACTIONS WITH AFFILIATES
Advisory fee
The Trust has entered into an advisory contract with Funds Management, an indirect wholly owned subsidiary of Wells Fargo & Company (“Wells Fargo”). The adviser is responsible for implementing investment policies and guidelines and for supervising the subadviser, who is responsible for day-to-day portfolio management of the Fund.
Pursuant to the contract, Funds Management is entitled to receive an annual advisory fee starting at 0.75% and declining to 0.525% as the average daily net assets of the Fund increase. Prior to December 1, 2014, Funds Management was entitled to receive an annual advisory fee which started at 0.75% and declined to 0.55% as the average daily net assets of the Fund increased. For the six months ended January 31, 2015, the advisory fee was equivalent to an annual rate of 0.61% of the Fund’s average daily net assets.
Funds Management has retained the services of a subadviser to provide daily portfolio management to the Fund. The fee for subadvisory services is borne by Funds Management. WellsCap, an affiliate of Funds Management and an indirect wholly owned subsidiary of Wells Fargo, is the subadviser to the Fund and is entitled to receive a fee from Funds Management at an annual rate starting at 0.45% and declining to 0.30% as the average daily net assets of the Fund increase.
Administration fees
The Trust has entered into an administration agreement with Funds Management. Under this agreement, for providing administrative services, which includes paying fees and expenses for services provided by the transfer agent, sub-transfer agents, omnibus account servicers and record-keepers, Funds Management is entitled to receive from the Fund an annual fund level administration fee starting at 0.05% and declining to 0.03% as the average daily net assets of the Fund increase and a class level administration fee which is calculated based on the average daily net assets of each class as follows:
| | | | |
| | | Class level administration fee | |
Class A, Class C | | | 0.26 | % |
Administrator Class | | | 0.10 | |
Institutional Class | | | 0.08 | |
Investor Class | | | 0.32 | |
| | | | | | |
| Notes to financial statements (unaudited) | | Wells Fargo Advantage Growth Fund | | | 23 | |
Funds Management has contractually waived and/or reimbursed advisory and administration fees to the extent necessary to maintain certain net operating expense ratios for the Fund. Waiver of fees and/or reimbursement of expenses by Funds Management were made first from fund level expenses on a proportionate basis and then from class specific expenses. Funds Management has committed through November 30, 2015 to waive fees and/or reimburse expenses to the extent necessary to cap the Fund’s expenses at 1.21% for Class A shares, 1.96% for Class C shares, 0.96% for Administrator Class shares, 0.75% for Institutional Class shares, and 1.27% for Investor Class shares. After this time, the cap may be increased or the commitment to maintain the cap may be terminated only with the approval of the Board of Trustees.
Distribution fee
The Trust has adopted a Distribution Plan for Class C shares of the Fund pursuant to Rule 12b-1 under the 1940 Act. A distribution fee is charged to Class C shares and paid to Wells Fargo Funds Distributor, LLC (“Funds Distributor”), the principal underwriter, at an annual rate of 0.75% of the average daily net assets of Class C shares.
In addition, Funds Distributor is entitled to receive the front-end sales charge from the purchase of Class A shares and a contingent deferred sales charge on the redemption of certain shares. Funds Distributor is also entitled to receive the contingent deferred sales charges from redemptions of Class C shares. For the six months ended January 31, 2015, Funds Distributor received $14,023 from the sale of Class A shares and $1,330 in contingent deferred sales charges from redemptions of Class C shares.
Shareholder servicing fees
The Trust has entered into contracts with one or more shareholder servicing agents, whereby Class A, Class C, Administrator Class, and Investor Class of the Fund is charged a fee at an annual rate of 0.25% of the average daily net assets of each respective class.
A portion of these total shareholder servicing fees were paid to affiliates of Wells Fargo.
5. INVESTMENT PORTFOLIO TRANSACTIONS
Purchases and sales of investments, excluding U.S. government obligations (if any) and short-term securities, for the six months ended January 31, 2015 were $1,595,371,702 and $3,166,518,946, respectively.
6. INVESTMENTS IN AFFILIATES
An affiliated investment is a company in which the Fund has ownership of at least 5% of the outstanding voting shares. The following is a summary of transactions for the long-term holdings of issuers that were either affiliates of the Fund at the beginning of the period or the end of the period.
| | | | | | | | | | | | | | | | | | | | | | | | | | | | |
| | | Shares, beginning of period | | | Shares purchased | | | Shares sold | | | Shares, end of period | | | Value, end of period | | | Income from
affiliated securities | | | Realized gains (losses) | |
Annie’s Incorporated* | | | 909,470 | | | | 0 | | | | 909,470 | | | | 0 | | | $ | 0 | | | $ | 0 | | | $ | 222,642 | |
Envestnet Incorporated | | | 2,546,800 | | | | 36,000 | | | | 35,340 | | | | 2,547,460 | | | | 131,117,766 | | | | 0 | | | | (15,365 | ) |
Five Below Incorporated | | | 3,193,226 | | | | 422,000 | | | | 130,096 | | | | 3,485,130 | | | | 116,124,532 | | | | 0 | | | | (292,272 | ) |
Fleetmatics Group plc* | | | 2,214,300 | | | | 0 | | | | 805,800 | | | | 1,408,500 | | | | 49,874,985 | | | | 0 | | | | (622,971 | ) |
Grand Canyon Education Incorporated | | | 2,459,000 | | | | 1,431,000 | | | | 69,629 | | | | 3,820,371 | | | | 167,408,657 | | | | 0 | | | | (55,940 | ) |
| | | | | | | | | | | | | | | $ | 0 | | | $ | (763,906 | ) |
| * | No longer an affiliate of the Fund at the end of the period. |
7. BANK BORROWINGS
The Trust (excluding the money market funds and certain other funds in the Trust) and Wells Fargo Variable Trust are parties to a $150,000,000 revolving credit agreement whereby the Fund is permitted to use bank borrowings for temporary or emergency purposes, such as to fund shareholder redemption requests. Interest under the credit agreement is charged to the Fund based on a borrowing rate equal to the higher of the Federal Funds rate in effect on that day plus 1.25% or the overnight LIBOR rate in effect on that day plus 1.25%. In addition, an annual commitment fee equal to 0.10% of the unused balance is allocated to each participating fund. For the six months ended January 31, 2015, the Fund paid $8,231 in commitment fees.
For the six months ended January 31, 2015, there were no borrowings by the Fund under the agreement.
| | | | |
| 24 | | Wells Fargo Advantage Growth Fund | | Notes to financial statements (unaudited) |
8. CONCENTRATION RISK
Concentration risks result from exposure to a limited number of sectors. A fund that invests a substantial portion of its assets in any sector may be more affected by changes in that sector than would be a fund whose investments are not heavily weighted in any sector.
9. INDEMNIFICATION
Under the Trust’s organizational documents, the officers and Trustees are indemnified against certain liabilities that may arise out of performance of their duties to the Trust. Additionally, in the normal course of business, the Trust may enter into contracts with service providers that contain a variety of indemnification clauses. The Trust’s maximum exposure under these arrangements is dependent on future claims that may be made against the Fund and, therefore, cannot be estimated.
| | | | | | |
| Other information (unaudited) | | Wells Fargo Advantage Growth Fund | | | 25 | |
PROXY VOTING INFORMATION
A description of the policies and procedures that the Fund uses to determine how to vote proxies relating to portfolio securities, in addition to information regarding how the Fund voted proxies relating to portfolio securities during the most recent 12-month period ended June 30, is available on the Fund’s website at wellsfargoadvantagefunds.com or by visiting the SEC website at sec.gov.
PORTFOLIO HOLDINGS INFORMATION
The complete portfolio holdings for the Fund are publicly available monthly on the Fund’s website (wellsfargoadvantagefunds.com), on a one-month delayed basis. In addition, top ten holdings information (excluding derivative positions) for the Fund is publicly available on the Fund’s website on a monthly, seven-day or more delayed basis. The Fund files its complete schedule of portfolio holdings with the SEC for the first and third quarters of each fiscal year on Form N-Q, which is available by visiting the SEC website at sec.gov. In addition, the Fund’s Form N-Q may be reviewed and copied at the SEC’s Public Reference Room in Washington, DC, and at regional offices in New York City, at 233 Broadway, and in Chicago, at 175 West Jackson Boulevard, Suite 900. Information about the Public Reference Room may be obtained by calling 1-800-SEC-0330.
| | | | |
| 26 | | Wells Fargo Advantage Growth Fund | | Other information (unaudited) |
BOARD OF TRUSTEES AND OFFICERS
Each of the Trustees and Officers1 listed in the table below acts in identical capacities for each fund in the Wells Fargo Advantage family of funds, which consists of 134 mutual funds comprising the Wells Fargo Funds Trust, Wells Fargo Variable Trust, Wells Fargo Master Trust and four closed-end funds (collectively the “Fund Complex”). This table should be read in conjunction with the Prospectus and the Statement of Additional Information2. The mailing address of each Trustee and Officer is 525 Market Street, 12th Floor, San Francisco, CA 94105. Each Trustee and Officer serves an indefinite term, however, each Trustee serves such term until reaching the mandatory retirement age established by the Trustees.
Independent Trustees
| | | | | | |
Name and year of birth | | Position held and length of service* | | Principal occupations during past five years or longer | | Other directorships during past five years |
William R. Ebsworth (Born 1957) | | Trustee, since 2015** | | Retired. From 1984 to 2013, equities analyst, portfolio manager, research director at Fidelity Management and Research Company and retired in 2013 as Chief Investment Officer of Fidelity Strategic Advisers, Inc. in Boston, Tokyo, and Hong Kong where he led a team of investment professionals managing client assets. Prior thereto, Board member of Hong Kong Securities Clearing Co., Hong Kong Options Clearing Corp., the Thailand International Fund, Ltd., Fidelity Investments Life Insurance Company, and Empire Fidelity Investments Life Insurance Company. Mr. Ebsworth is an Adjunct Lecturer, Finance, at Babson College and a Chartered Financial Analyst. | | Asset Allocation Trust |
Jane A. Freeman (Born 1953) | | Trustee, since 2015** | | Retired. From 2012 to 2014 and 1999 to 2008, Chief Financial Officer of Scientific Learning Corporation. From 2008 to 2012, Ms. Freeman provided consulting services related to strategic business projects. Prior thereto, Portfolio Manager at Rockefeller & Co. and Scudder, Stevens & Clark. Board member of the Harding Loevner Funds from 1996 to 2014, serving as both Lead Independent Director and chair of the Audit Committee. Board member of the Russell Exchange Traded Funds Trust from 2011 to 2012 and the chair of the Audit Committee. Ms. Freeman is a Chartered Financial Analyst (inactive), Chair of Taproot Foundation (non-profit organization) and a Board Member of Ruth Bancroft Garden (non-profit organization). | | Asset Allocation Trust |
Peter G. Gordon (Born 1942) | | Trustee, since 1998; Chairman, since 2005 | | Co-Founder, Retired Chairman, President and CEO of Crystal Geyser Water Company. Trustee Emeritus, Colby College. | | Asset Allocation Trust |
Isaiah Harris, Jr. (Born 1952) | | Trustee, since 2009 | | Retired. Chairman of the Board of CIGNA Corporation since 2009, and Director since 2005. From 2003 to 2011, Director of Delux Corporation. Prior thereto, President and CEO of BellSouth Advertising and Publishing Corp. from 2005 to 2007, President and CEO of BellSouth Enterprises from 2004 to 2005 and President of BellSouth Consumer Services from 2000 to 2003. Emeritus member of the Iowa State University Foundation Board of Governors. Emeritus Member of the Advisory Board of Iowa State University School of Business. Advisory Board Member, Palm Harbor Academy. Mr. Harris is a certified public accountant. | | CIGNA Corporation; Asset Allocation Trust |
Judith M. Johnson (Born 1949) | | Trustee, since 2008;
Audit Committee Chairman, since 2008 | | Retired. Prior thereto, Chief Executive Officer and Chief Investment Officer of Minneapolis Employees Retirement Fund from 1996 to 2008. Ms. Johnson is an attorney, certified public accountant and a certified managerial accountant. | | Asset Allocation Trust |
David F. Larcker (Born 1950) | | Trustee, since 2009 | | James Irvin Miller Professor of Accounting at the Graduate School of Business, Stanford University, Morgan Stanley Director of the Center for Leadership Development and Research and Senior Faculty of The Rock Center for Corporate Governance since 2006. From 2005 to 2008, Professor of Accounting at the Graduate School of Business, Stanford University. Prior thereto, Ernst & Young Professor of Accounting at The Wharton School, University of Pennsylvania from 1985 to 2005. | | Asset Allocation Trust |
| | | | | | |
| Other information (unaudited) | | Wells Fargo Advantage Growth Fund | | | 27 | |
| | | | | | |
Name and year of birth | | Position held and length of service* | | Principal occupations during past five years or longer | | Other directorships during past five years |
Olivia S. Mitchell (Born 1953) | | Trustee, since 2006 | | International Foundation of Employee Benefit Plans Professor, Wharton School of the University of Pennsylvania since 1993. Director of Wharton’s Pension Research Council and Boettner Center on Pensions & Retirement Research, and Research Associate at the National Bureau of Economic Research. Previously, Cornell University Professor from 1978 to 1993. | | Asset Allocation Trust |
Timothy J. Penny (Born 1951) | | Trustee, since 1996 | | President and Chief Executive Officer of Southern Minnesota Initiative Foundation, a non-profit organization, since 2007 and Senior Fellow at the Humphrey Institute Policy Forum at the University of Minnesota since 1995. Member of the Board of Trustees of NorthStar Education Finance, Inc., a non-profit organization, since 2007. | | Asset Allocation Trust |
Michael S. Scofield (Born 1943) | | Trustee, since 2010 | | Served on the Investment Company Institute’s Board of Governors and Executive Committee from 2008-2011 as well the Governing Council of the Independent Directors Council from 2006-2011 and the Independent Directors Council Executive Committee from 2008-2011. Chairman of the IDC from 2008-2010. Institutional Investor (Fund Directions) Trustee of Year in 2007. Trustee of the Evergreen Funds complex (and its predecessors) from 1984 to 2010. Chairman of the Evergreen Funds from 2000-2010. Former Trustee of the Mentor Funds. Retired Attorney, Law Offices of Michael S. Scofield. | | Asset Allocation Trust |
Donald C. Willeke (Born 1940) | | Trustee, since 1996 | | Principal of the law firm of Willeke & Daniels. General Counsel of the Minneapolis Employees Retirement Fund from 1984 until its consolidation into the Minnesota Public Employees Retirement Association on June 30, 2010. Director and Vice Chair of The Tree Trust (non-profit corporation). Director of the American Chestnut Foundation (non-profit corporation). | | Asset Allocation Trust |
| * | Length of service dates reflect the Trustee’s commencement of service with the Trust’s predecessor entities, where applicable. |
| ** | William R. Ebsworth and Jane A. Freeman each became a Trustee effective January 1, 2015. |
Officers
| | | | | | |
Name and year of birth | | Position held and length of service | | Principal occupations during past five years or longer | | |
Karla M. Rabusch (Born 1959) | | President, since 2003 | | Executive Vice President of Wells Fargo Bank, N.A. and President of Wells Fargo Funds Management, LLC since 2003. | | |
Jeremy DePalma1 (Born 1974) | | Treasurer, since 2012 | | Senior Vice President of Wells Fargo Funds Management, LLC since 2009. Senior Vice President of Evergreen Investment Management Company, LLC from 2008 to 2010. Vice President, Evergreen Investment Services, Inc. from 2004 to 2007. Head of the Fund Reporting and Control Team within Fund Administration from 2005 to 2010. | | |
C. David Messman (Born 1960) | | Secretary, since 2000; Chief Legal Officer,
since 2003 | | Assistant General Counsel of Wells Fargo Bank, N.A. since 2013 and Vice President and Managing Counsel of Wells Fargo Bank N.A. from 1996 to 2013. Senior Vice President and Secretary of Wells Fargo Funds Management, LLC since 2001. | | |
Debra Ann Early (Born 1964) | | Chief Compliance Officer, since 2007 | | Senior Vice President of Wells Fargo Funds Management, LLC since 2007 and Chief Compliance Officer from 2007 to 2014. Chief Compliance Officer of Parnassus Investments from 2005 to 2007. Chief Financial Officer of Parnassus Investments from 2004 to 2007 and Senior Audit Manager of PricewaterhouseCoopers LLP from 1998 to 2004. | | |
David Berardi (Born 1975) | | Assistant Treasurer,
since 2009 | | Vice President of Wells Fargo Funds Management, LLC since 2009. Vice President of Evergreen Investment Management Company, LLC from 2008 to 2010. Assistant Vice President of Evergreen Investment Services, Inc. from 2004 to 2008. Manager of Fund Reporting and Control for Evergreen Investment Management Company, LLC from 2004 to 2010. | | |
| 1 | Jeremy DePalma acts as Treasurer of 61 funds and Assistant Treasurer of 73 funds in the Fund Complex. |
| 2 | The Statement of Additional Information includes additional information about the Trustees and is available, without charge, upon request, by calling 1-800-222-8222 or by visiting the website at wellsfargoadvantagefunds.com. |
| | | | |
| 28 | | Wells Fargo Advantage Growth Fund | | List of abbreviations |
The following is a list of common abbreviations for terms and entities that may have appeared in this report.
| ACA | — ACA Financial Guaranty Corporation |
| ADR | — American depositary receipt |
| ADS | — American depositary shares |
| AGC | — Assured Guaranty Corporation |
| AGM | — Assured Guaranty Municipal |
| Ambac | — Ambac Financial Group Incorporated |
| AMT | — Alternative minimum tax |
| BAN | — Bond anticipation notes |
| BHAC | — Berkshire Hathaway Assurance Corporation |
| CAB | — Capital appreciation bond |
| CCAB | — Convertible capital appreciation bond |
| CDA | — Community Development Authority |
| CDO | — Collateralized debt obligation |
| DRIVER | — Derivative inverse tax-exempt receipts |
| DW&P | — Department of Water & Power |
| DWR | — Department of Water Resources |
| ECFA | — Educational & Cultural Facilities Authority |
| EDA | — Economic Development Authority |
| EDFA | — Economic Development Finance Authority |
| ETF | — Exchange-traded fund |
| FDIC | — Federal Deposit Insurance Corporation |
| FFCB | — Federal Farm Credit Banks |
| FGIC | — Financial Guaranty Insurance Corporation |
| FHA | — Federal Housing Administration |
| FHLB | — Federal Home Loan Bank |
| FHLMC | — Federal Home Loan Mortgage Corporation |
| FICO | — The Financing Corporation |
| FNMA | — Federal National Mortgage Association |
| GDR | — Global depositary receipt |
| GNMA | — Government National Mortgage Association |
| HCFR | — Healthcare facilities revenue |
| HEFA | — Health & Educational Facilities Authority |
| HEFAR | — Higher education facilities authority revenue |
| HFA | — Housing Finance Authority |
| HFFA | — Health Facilities Financing Authority |
| HUD | — Department of Housing and Urban Development |
| IDA | — Industrial Development Authority |
| IDAG | — Industrial Development Agency |
| KRW | — Republic of Korea won |
| LIBOR | — London Interbank Offered Rate |
| LIFER | — Long Inverse Floating Exempt Receipts |
| LLC | — Limited liability company |
| LLLP | — Limited liability limited partnership |
| LLP | — Limited liability partnership |
| MBIA | — Municipal Bond Insurance Association |
| MFHR | — Multifamily housing revenue |
| MSTR | — Municipal securities trust receipts |
| MUD | — Municipal Utility District |
| National | — National Public Finance Guarantee Corporation |
| PCFA | — Pollution Control Financing Authority |
| PCL | — Public Company Limited |
| PCR | — Pollution control revenue |
| PFA | — Public Finance Authority |
| PFFA | — Public Facilities Financing Authority |
| PFOTER | — Puttable floating option tax-exempt receipts |
| plc | — Public limited company |
| PUTTER | — Puttable tax-exempt receipts |
| R&D | — Research & development |
| Radian | — Radian Asset Assurance |
| RAN | — Revenue anticipation notes |
| RDA | — Redevelopment Authority |
| RDFA | — Redevelopment Finance Authority |
| REIT | — Real estate investment trust |
| ROC | — Reset option certificates |
| SAVRS | — Select auction variable rate securities |
| SBA | — Small Business Authority |
| SFHR | — Single-family housing revenue |
| SFMR | — Single-family mortgage revenue |
| SPA | — Standby purchase agreement |
| SPDR | — Standard & Poor’s Depositary Receipts |
| SPEAR | — Short Puttable Exempt Adjustable Receipts |
| STRIPS | — Separate trading of registered interest and |
| TAN | — Tax anticipation notes |
| TIPS | — Treasury inflation-protected securities |
| TRAN | — Tax revenue anticipation notes |
| TTFA | — Transportation Trust Fund Authority |
| TVA | — Tennessee Valley Authority |


For more information
More information about Wells Fargo Advantage Funds is available free upon request. To obtain literature, please write, email, visit the Fund’s website, or call:
Wells Fargo Advantage Funds
P.O. Box 8266
Boston, MA 02266-8266
Email: wfaf@wellsfargo.com
Website: wellsfargoadvantagefunds.com
Individual investors: 1-800-222-8222
Retail investment professionals: 1-888-877-9275
Institutional investment professionals: 1-866-765-0778
This report and the financial statements contained herein are submitted for the general information of the shareholders of Wells Fargo Advantage Funds. If this report is used for promotional purposes, distribution of the report must be accompanied or preceded by a current prospectus. Before investing, please consider the investment objectives, risks, charges, and expenses of the investment. For a current prospectus and, if available, a summary prospectus, containing this information, call 1-800-222-8222 or visit the Fund’s website at wellsfargoadvantagefunds.com. Read the prospectus carefully before you invest or send money.
Wells Fargo Funds Management, LLC, a wholly owned subsidiary of Wells Fargo & Company, provides investment advisory and administrative services for Wells Fargo Advantage Funds. Other affiliates of Wells Fargo & Company provide subadvisory and other services for the Funds. The Funds are distributed by Wells Fargo Funds Distributor, LLC, Member FINRA/SIPC, an affiliate of Wells Fargo & Company.
NOT FDIC INSURED ¡ NO BANK GUARANTEE ¡ MAY LOSE VALUE
© 2015 Wells Fargo Funds Management, LLC. All rights reserved.
| | |
 | | 231599 03-15 SA206/SAR206 01-15 |

Wells Fargo Advantage Intrinsic Value Fund

Semi-Annual Report
January 31, 2015

Reduce clutter. Save trees.
Sign up for electronic delivery of prospectuses and shareholder reports at wellsfargo.com/advantagedelivery
Contents
The views expressed and any forward-looking statements are as of January 31, 2015, unless otherwise noted, and are those of the Fund managers and/or Wells Fargo Funds Management, LLC. Discussions of individual securities, or the markets generally, or any Wells Fargo Advantage Fund are not intended as individual recommendations. Future events or results may vary significantly from those expressed in any forward-looking statements; the views expressed are subject to change at any time in response to changing circumstances in the market. Wells Fargo Funds Management, LLC and the Fund disclaim any obligation to publicly update or revise any views expressed or forward-looking statements.
NOT FDIC INSURED ¡ NO BANK GUARANTEE ¡ MAY LOSE VALUE
| | | | |
| 2 | | Wells Fargo Advantage Intrinsic Value Fund | | Letter to shareholders (unaudited) |

Karla M. Rabusch
President
Wells Fargo Advantage Funds
As the U.S. churned forward, major economies elsewhere in the world faced significant ongoing challenges.
Dear Valued Shareholder:
We are pleased to offer you this semi-annual report for the Wells Fargo Advantage Intrinsic Value Fund for the six-month period that ended January 31, 2015. Generally improving U.S. economic data helped drive a positive return for U.S. stocks for the reporting period (as measured by the S&P 500 Index1); in contrast, many economies and markets elsewhere in the world faced ongoing challenges.
Positive U.S. economic data, but increased tensions abroad, led to heightened volatility during the third quarter of 2014.
When the reporting period began on August 1, 2014, the U.S. stock market was experiencing a series of surges interrupted by bouts of volatility as interest-rate concerns in the U.S. and increased tensions abroad triggered heightened investor uncertainty. An escalating Russia/Ukraine situation and a growing perception that the U.S. Federal Reserve (Fed) would raise short-term interest rates sooner than expected caused investors to pull back near the end of July. As a result, the S&P 500 Index dropped into negative territory for July’s monthly return. However, August brought a bounce-back; the S&P 500 Index delivered its largest monthly gain since February 2014 on a string of positive economic news, led by an upwardly revised 4.2% estimate of second-quarter 2014 gross domestic product (GDP) growth. Then, in September, stock market volatility increased as positive economic data became overshadowed at times by growing discomfort over escalating tensions in Ukraine and the Middle East. Slowing growth in Europe and China also concerned investors. Ultimately, U.S. stocks ended the third quarter up slightly overall, buoyed largely by another upward revision of second-quarter GDP growth to 4.6%. Strong corporate earnings also contributed to market gains.
The fourth quarter of 2014 brought continued improvement in the U.S.; international economies remained challenged.
Strong fourth-quarter results by the U.S. stock market helped the S&P 500 Index deliver more than 50 record closes in 2014. The last several, in December, were spurred by investor optimism following Fed Chair Janet Yellen’s comment that the Fed would be patient in its timing of an interest-rate increase. U.S. stocks also were boosted by positive economic data. November’s 5.8% unemployment rate was down from 7.0% a year earlier, and the number of jobs being added continued to expand, keeping U.S. employers on pace to hire nearly three million workers during 2014. In addition, the U.S. economy’s third-quarter growth rate was revised upward during the quarter, to 5.0%—its fastest pace in 11 years. Meanwhile, U.S. companies continued to report strong earnings. The steadily brightening U.S. economy energized consumers, who were further buoyed by much lower prices at the gasoline pump. During the fourth quarter, gasoline prices fell to their lowest levels in five years, according to the American Automobile Association.
As the U.S. churned forward, major economies elsewhere in the world faced significant ongoing challenges. In China, where growth had been slowing for some time, government regulators in December announced changes being made in an effort to stimulate growth. In Japan, which slid back into recession in the third quarter of 2014, Prime Minister Abe gained approval in late December for roughly $29 billion in fresh stimulus to help the economy. In the eurozone, growth remained sluggish, and member countries continued to face an environment of low demand, high unemployment, and weak business investment. This situation
| 1 | The S&P 500 Index consists of 500 stocks chosen for market size, liquidity, and industry group representation. It is a market-value-weighted index with each stock’s weight in the index proportionate to its market value. You cannot invest directly in an index. |
| | | | | | |
| Letter to shareholders (unaudited) | | Wells Fargo Advantage Intrinsic Value Fund | | | 3 | |
was exacerbated in December by renewed concerns about Greece after its parliament failed to avert a general election that could jeopardize the terms of the country’s financial agreement with its international creditors. In Russia, the economy contracted for the first time since October 2009 as the country struggled under the weight of slumping oil prices, international sanctions, and massive outflows of capital.
Market volatility increased in January 2015.
Markets fluctuated in January as investors reacted to geopolitical developments and new economic data. Mid-month, the World Bank lowered its outlook for global growth based on deepening problems in the eurozone and emerging markets, stating that a strengthening U.S. economy could not, by itself, support the global economy. Later in January, Greek voters gave control of their government to opposition party Syriza, which promised to end austerity and insisted that Greece’s massive debt be renegotiated. In the U.S., various data released in January, such as consumer confidence and December’s jobless rate, showed improvement. On the last trading day of the month, however, investors learned that fourth-quarter 2014 U.S. economic growth was estimated at 2.6%, which was below consensus and lower than the 4.6% and 5.0% growth rates, respectively, for the second and third quarters of 2014.
Don’t let short-term uncertainty derail long-term investment goals.
Periods of uncertainty can present challenges, but experience has taught us that maintaining long-term investment goals can be an effective way to plan for the future. To help you create a sound strategy based on your personal goals and risk tolerance, Wells Fargo Advantage Funds offers more than 100 mutual funds and other investments spanning a wide range of asset classes and investment styles. Although diversification cannot guarantee an investment profit or prevent losses, we believe it can be an effective way to manage investment risk and potentially smooth out overall portfolio performance. We encourage investors to know their investments and to understand that appropriate levels of risk-taking may unlock opportunities.
Thank you for choosing to invest with Wells Fargo Advantage Funds. We appreciate your confidence in us and remain committed to helping you meet your financial needs. For current information about your fund investments, contact your investment professional, visit our website at wellsfargoadvantagefunds.com, or call us directly at 1-800-222-8222. We are available 24 hours a day, 7 days a week.
Sincerely,

Karla M. Rabusch
President
Wells Fargo Advantage Funds
We encourage investors to know their investments and to understand that appropriate levels of risk-taking may unlock opportunities.
| | | | |
| 4 | | Wells Fargo Advantage Intrinsic Value Fund | | Performance highlights (unaudited) |
Investment objective
The Fund seeks long-term capital appreciation.
Adviser
Wells Fargo Funds Management, LLC
Subadviser
Metropolitan West Capital Management, LLC
Portfolio managers
Jeffrey Peck
Jean-Baptiste Nadal, CFA
Miguel. E. Giaconi, CFA
Average annual total returns1 (%) as of January 31, 2015
| | | | | | | | | | | | | | | | | | | | | | | | | | | | | | | | | | |
| | | | | Including sales charge | | | Excluding sales charge | | | Expense ratios2 (%) | |
| | | Inception date | | 1 year | | | 5 year | | | Since Inception | | | 1 year | | | 5 year | | | Since Inception | | | Gross | | | Net3 | |
| Class A (EIVAX) | | 8-1-2006 | | | 3.89 | | | | 12.85 | | | | 7.13 | | | | 10.22 | | | | 14.20 | | | | 7.88 | | | | 1.22 | | | | 1.16 | |
| Class B (EIVBX)* | | 8-1-2006 | | | 4.45 | | | | 13.09 | | | | 7.22 | | | | 9.45 | | | | 13.33 | | | | 7.22 | | | | 1.97 | | | | 1.91 | |
| Class C (EIVCX) | | 8-1-2006 | | | 8.43 | | | | 13.35 | | | | 7.09 | | | | 9.43 | | | | 13.35 | | | | 7.09 | | | | 1.97 | | | | 1.91 | |
| Class R (EIVTX) | | 3-1-2013 | | | – | | | | – | | | | – | | | | 10.00 | | | | 13.95 | | | | 7.64 | | | | 1.47 | | | | 1.41 | |
| Class R4 (EIVRX) | | 11-30-2012 | | | – | | | | – | | | | – | | | | 10.66 | | | | 14.58 | | | | 8.19 | | | | 0.89 | | | | 0.80 | |
| Class R6 (EIVFX) | | 11-30-2012 | | | – | | | | – | | | | – | | | | 10.36 | | | | 14.55 | | | | 8.18 | | | | 0.74 | | | | 0.65 | |
| Administrator Class (EIVDX) | | 7-30-2010 | | | – | | | | – | | | | – | | | | 10.53 | | | | 14.45 | | | | 8.08 | | | | 1.06 | | | | 0.95 | |
| Institutional Class (EIVIX) | | 8-1-2006 | | | – | | | | – | | | | – | | | | 10.78 | | | | 14.63 | | | | 8.22 | | | | 0.79 | | | | 0.70 | |
| Russell 1000® Value Index4 | | – | | | – | | | | – | | | | – | | | | 12.93 | | | | 15.14 | | | | 6.19 | | | | – | | | | – | |
| * | | Class B shares are closed to investment, except in connection with the reinvestment of any distributions and permitted exchanges. |
Figures quoted represent past performance, which is no guarantee of future results, and do not reflect taxes that a shareholder may pay on fund distributions or the redemption of fund shares. Investment return and principal value of an investment will fluctuate so that an investor’s shares, when redeemed, may be worth more or less than their original cost. Performance shown without sales charges would be lower if sales charges were reflected. Current performance may be lower or higher than the performance data quoted, which assumes the reinvestment of dividends and capital gains. Current month-end performance is available on the Fund’s website, wellsfargoadvantagefunds.com.
Index returns do not include transaction costs associated with buying and selling securities, any mutual fund fees or expenses, or any taxes. It is not possible to invest directly in an index.
For Class A shares, the maximum front-end sales charge is 5.75%. For Class B shares, the maximum contingent deferred sales charge is 5.00%. For Class C shares, the maximum contingent deferred sales charge is 1.00%. Performance including a contingent deferred sales charge assumes the sales charge for the corresponding time period. Class R, Class R4, Class R6, Administrator Class, and Institutional Class shares are sold without a front-end sales charge or contingent deferred sales charge.
Stock values fluctuate in response to the activities of individual companies and general market and economic conditions. Certain investment strategies tend to increase the total risk of an investment (relative to the broader market). The Fund is exposed to foreign investment risk. Consult the Fund’s prospectus for additional information on these and other risks.
Please see footnotes on page 5.
| | | | | | |
| Performance highlights (unaudited) | | Wells Fargo Advantage Intrinsic Value Fund | | | 5 | |
| | | | |
| Ten largest equity holdings5 (%) as of January 31, 2015 | |
The Walt Disney Company | | | 3.25 | |
Express Scripts Holding Company | | | 3.17 | |
The Boeing Company | | | 3.04 | |
TRW Automotive Holdings Corporation | | | 2.94 | |
Anheuser-Busch InBev ADR | | | 2.94 | |
Goldman Sachs Group Incorporated | | | 2.93 | |
Cigna Corporation | | | 2.90 | |
NextEra Energy Incorporated | | | 2.72 | |
Branch Banking & Trust Corporation | | | 2.67 | |
The Procter & Gamble Company | | | 2.63 | |
|
| Sector distribution6 as of January 31, 2015 |
|
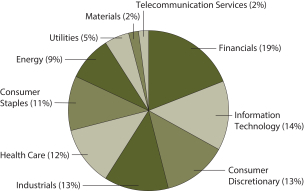 |
| 1 | Historical performance shown for Class R shares prior to their inception reflects the performance of Institutional Class shares, adjusted to reflect the higher expenses applicable to Class R shares. Historical performance shown for Class R4 shares prior to their inception reflects the performance of Institutional Class shares, adjusted to reflect the higher expenses applicable to Class R4 shares. Historical performance shown for Class R6 shares prior to their inception reflects the performance of Institutional Class shares, and includes the higher expenses applicable to Institutional Class shares. If these expenses had not been included, returns would be higher. Historical performance shown for Administrator Class shares prior to their inception reflects the performance of Institutional Class shares, adjusted to reflect the higher expenses applicable to Administrator Class shares. Historical performance shown for all classes of the Fund prior to July 19, 2010, is based on the performance of the Fund’s predecessor, Evergreen Intrinsic Value Fund. |
| 2 | Reflects the expense ratios as stated in the most recent prospectuses. The expense ratios shown are subject to change and may differ from the annualized expense ratios shown in the financial highlights of this report. |
| 3 | The Adviser has committed through November 30, 2015, to waive fees and/or reimburse expenses to the extent necessary to cap the Fund’s Total Annual Fund Operating Expenses After Fee Waiver, excluding certain expenses, at the amounts shown. After this time, the cap may be increased or the commitment to maintain the cap may be terminated only with the approval of the Board of Trustees. Brokerage commissions, stamp duty fees, interest, taxes, acquired fund fees and expenses, and extraordinary expenses are excluded from the cap. Without this cap, the Fund’s returns would have been lower. |
| 4 | The Russell 1000® Value Index measures the performance of those Russell 1000 Index companies with lower price-to-book ratios and lower forecasted growth values. You cannot invest directly in an index. |
| 5 | The ten largest equity holdings are calculated based on the value of the securities divided by total net assets of the Fund. Holdings are subject to change and may have changed since the date specified. |
| 6 | Amounts are calculated based on the total long-term investments of the Fund. These percentages are subject to change and may have changed since the date specified. |
| | | | |
| 6 | | Wells Fargo Advantage Intrinsic Value Fund | | Fund expenses (unaudited) |
As a shareholder of the Fund, you incur two types of costs: (1) transaction costs, including sales charges (loads) on purchase payments and contingent deferred sales charges (if any) on redemptions and (2) ongoing costs, including management fees, distribution (12b-1) and/or shareholder service fees, and other Fund expenses. This example is intended to help you understand your ongoing costs (in dollars) of investing in the Fund and to compare these costs with the ongoing costs of investing in other mutual funds.
The example is based on an investment of $1,000 invested at the beginning of the six-month period and held for the entire period from August 1, 2014 to January 31, 2015.
Actual expenses
The “Actual” line of the table below provides information about actual account values and actual expenses. You may use the information in this line, together with the amount you invested, to estimate the expenses that you paid over the period. Simply divide your account value by $1,000 (for example, an $8,600 account value divided by $1,000 = 8.6), then multiply the result by the number in the “Actual” line under the heading entitled “Expenses paid during period” for your applicable class of shares to estimate the expenses you paid on your account during this period.
Hypothetical example for comparison purposes
The “Hypothetical” line of the table below provides information about hypothetical account values and hypothetical expenses based on the Fund’s actual expense ratio and an assumed rate of return of 5% per year before expenses, which is not the Fund’s actual return. The hypothetical account values and expenses may not be used to estimate the actual ending account balance or expenses you paid for the period. You may use this information to compare the ongoing costs of investing in the Fund and other funds. To do so, compare this 5% hypothetical example with the 5% hypothetical examples that appear in the shareholder reports of the other funds.
Please note that the expenses shown in the table are meant to highlight your ongoing costs only and do not reflect any transactional costs, such as sales charges (loads) and contingent deferred sales charges. Therefore, the “Hypothetical” line of the table is useful in comparing ongoing costs only and will not help you determine the relative total costs of owning different funds. In addition, if these transactional costs were included, your costs would have been higher.
| | | | | | | | | | | | | | | | |
| | | Beginning account value 8-1-2014 | | | Ending account value 1-31-2015 | | | Expenses paid during the period¹ | | | Net annualized expense ratio | |
Class A | | | | | | | | | | | | | | | | |
Actual | | $ | 1,000.00 | | | $ | 1,016.32 | | | $ | 5.90 | | | | 1.16 | % |
Hypothetical (5% return before expenses) | | $ | 1,000.00 | | | $ | 1,019.36 | | | $ | 5.90 | | | | 1.16 | % |
Class B | | | | | | | | | | | | | | | | |
Actual | | $ | 1,000.00 | | | $ | 1,013.17 | | | $ | 9.69 | | | | 1.91 | % |
Hypothetical (5% return before expenses) | | $ | 1,000.00 | | | $ | 1,015.58 | | | $ | 9.70 | | | | 1.91 | % |
Class C | | | | | | | | | | | | | | | | |
Actual | | $ | 1,000.00 | | | $ | 1,013.25 | | | $ | 9.69 | | | | 1.91 | % |
Hypothetical (5% return before expenses) | | $ | 1,000.00 | | | $ | 1,015.58 | | | $ | 9.70 | | | | 1.91 | % |
Class R | | | | | | | | | | | | | | | | |
Actual | | $ | 1,000.00 | | | $ | 1,015.44 | | | $ | 7.16 | | | | 1.41 | % |
Hypothetical (5% return before expenses) | | $ | 1,000.00 | | | $ | 1,018.10 | | | $ | 7.17 | | | | 1.41 | % |
Class R4 | | | | | | | | | | | | | | | | |
Actual | | $ | 1,000.00 | | | $ | 1,018.19 | | | $ | 4.07 | | | | 0.80 | % |
Hypothetical (5% return before expenses) | | $ | 1,000.00 | | | $ | 1,021.17 | | | $ | 4.08 | | | | 0.80 | % |
Class R6 | | | | | | | | | | | | | | | | |
Actual | | $ | 1,000.00 | | | $ | 1,019.22 | | | $ | 3.31 | | | | 0.65 | % |
Hypothetical (5% return before expenses) | | $ | 1,000.00 | | | $ | 1,021.93 | | | $ | 3.31 | | | | 0.65 | % |
Administrator Class | | | | | | | | | | | | | | | | |
Actual | | $ | 1,000.00 | | | $ | 1,018.16 | | | $ | 4.83 | | | | 0.95 | % |
Hypothetical (5% return before expenses) | | $ | 1,000.00 | | | $ | 1,020.42 | | | $ | 4.84 | | | | 0.95 | % |
Institutional Class | | | | | | | | | | | | | | | | |
Actual | | $ | 1,000.00 | | | $ | 1,018.68 | | | $ | 3.56 | | | | 0.70 | % |
Hypothetical (5% return before expenses) | | $ | 1,000.00 | | | $ | 1,021.68 | | | $ | 3.57 | | | | 0.70 | % |
| 1 | Expenses paid is equal to the annualized expense ratio of each class multiplied by the average account value over the period, multiplied by the number of days in the most recent fiscal half-year divided by the number of days in the fiscal year (to reflect the one-half-year period). |
| | | | | | |
| Portfolio of investments—January 31, 2015 (unaudited) | | Wells Fargo Advantage Intrinsic Value Fund | | | 7 | |
| | | | | | | | | | | | |
| Security name | | | | | | Shares | | | Value | |
| | | | |
Common Stocks: 98.09% | | | | | | | | | | | | |
| | | | |
Consumer Discretionary: 12.77% | | | | | | | | | | | | |
| | | | |
| Auto Components: 2.94% | | | | | | | | | | | | |
TRW Automotive Holdings Corporation † | | | | | | | 331,128 | | | $ | 34,162,476 | |
| | | | | | | | | | | | |
| | | | |
| Hotels, Restaurants & Leisure: 1.98% | | | | | | | | | | | | |
Marriott International Incorporated Class A | | | | | | | 308,396 | | | | 22,975,503 | |
| | | | | | | | | | | | |
| | | | |
| Media: 5.85% | | | | | | | | | | | | |
The Walt Disney Company | | | | | | | 415,258 | | | | 37,771,868 | |
Time Warner Incorporated | | | | | | | 387,069 | | | | 30,164,287 | |
| | | | |
| | | | | | | | | | | 67,936,155 | |
| | | | | | | | | | | | |
| | | | |
| Textiles, Apparel & Luxury Goods: 2.00% | | | | | | | | | | | | |
Kering Unsponsored ADR | | | | | | | 1,139,153 | | | | 23,193,155 | |
| | | | | | | | | | | | |
| | | | |
Consumer Staples: 11.13% | | | | | | | | | | | | |
| | | | |
| Beverages: 6.31% | | | | | | | | | | | | |
Anheuser-Busch InBev ADR | | | | | | | 279,827 | | | | 34,158,482 | |
Diageo plc ADR | | | | | | | 109,873 | | | | 12,979,297 | |
PepsiCo Incorporated | | | | | | | 278,647 | | | | 26,131,516 | |
| | | | |
| | | | | | | | | | | 73,269,295 | |
| | | | | | | | | | | | |
| | | | |
| Food Products: 2.19% | | | | | | | | | | | | |
Unilever NV ADR | | | | | | | 586,201 | | | | 25,423,537 | |
| | | | | | | | | | | | |
| | | | |
| Household Products: 2.63% | | | | | | | | | | | | |
The Procter & Gamble Company | | | | | | | 362,460 | | | | 30,551,753 | |
| | | | | | | | | | | | |
| | | | |
Energy: 8.55% | | | | | | | | | | | | |
| | | | |
| Energy Equipment & Services: 3.99% | | | | | | | | | | | | |
FMC Technologies Incorporated † | | | | | | | 559,043 | | | | 20,952,932 | |
Schlumberger Limited | | | | | | | 307,296 | | | | 25,318,117 | |
| | | | |
| | | | | | | | | | | 46,271,049 | |
| | | | | | | | | | | | |
| | | | |
| Oil, Gas & Consumable Fuels: 4.56% | | | | | | | | | | | | |
BG Group plc ADR « | | | | | | | 976,265 | | | | 13,282,085 | |
EOG Resources Incorporated | | | | | | | 250,982 | | | | 22,344,927 | |
Occidental Petroleum Corporation | | | | | | | 217,203 | | | | 17,376,240 | |
| | | | |
| | | | | | | | | | | 53,003,252 | |
| | | | | | | | | | | | |
| | | | |
Financials: 18.92% | | | | | | | | | | | | |
| | | | |
| Banks: 6.09% | | | | | | | | | | | | |
Branch Banking & Trust Corporation | | | | | | | 878,554 | | | | 31,004,171 | |
JPMorgan Chase & Company | | | | | | | 247,947 | | | | 13,483,358 | |
SunTrust Banks Incorporated | | | | | | | 682,374 | | | | 26,216,809 | |
| | | | |
| | | | | | | | | | | 70,704,338 | |
| | | | | | | | | | | | |
The accompanying notes are an integral part of these financial statements.
| | | | |
| 8 | | Wells Fargo Advantage Intrinsic Value Fund | | Portfolio of investments—January 31, 2015 (unaudited) |
| | | | | | | | | | | | |
| Security name | | | | | | Shares | | | Value | |
| | | | |
| Capital Markets: 10.22% | | | | | | | | | | | | |
Charles Schwab Corporation | | | | | | | 686,570 | | | $ | 17,837,089 | |
Franklin Resources Incorporated | | | | | | | 410,242 | | | | 21,139,770 | |
Goldman Sachs Group Incorporated | | | | | | | 197,172 | | | | 33,994,425 | |
Northern Trust Corporation | | | | | | | 405,772 | | | | 26,529,373 | |
UBS Group AG | | | | | | | 1,152,838 | | | | 19,229,338 | |
| | | | |
| | | | | | | | | | | 118,729,995 | |
| | | | | | | | | | | | |
| | | | |
| Insurance: 2.61% | | | | | | | | | | | | |
Chubb Corporation | | | | | | | 309,390 | | | | 30,289,281 | |
| | | | | | | | | | | | |
| | | | |
Health Care: 11.82% | | | | | | | | | | | | |
| | | | |
| Health Care Equipment & Supplies: 4.50% | | | | | | | | | | | | |
Abbott Laboratories | | | | | | | 682,543 | | | | 30,550,625 | |
Baxter International Incorporated | | | | | | | 308,399 | | | | 21,683,534 | |
| | | | |
| | | | | | | | | | | 52,234,159 | |
| | | | | | | | | | | | |
| | | | |
| Health Care Providers & Services: 6.07% | | | | | | | | | | | | |
Cigna Corporation | | | | | | | 314,700 | | | | 33,619,401 | |
Express Scripts Holding Company † | | | | | | | 455,892 | | | | 36,795,043 | |
| | | | |
| | | | | | | | | | | 70,414,444 | |
| | | | | | | | | | | | |
| | | | |
| Pharmaceuticals: 1.25% | | | | | | | | | | | | |
AbbVie Incorporated | | | | | | | 241,135 | | | | 14,552,497 | |
| | | | | | | | | | | | |
| | | | |
Industrials: 12.27% | | | | | | | | | | | | |
| | | | |
| Aerospace & Defense: 7.54% | | | | | | | | | | | | |
Honeywell International Incorporated | | | | | | | 303,630 | | | | 29,682,869 | |
Huntington Ingalls Industries Incorporated | | | | | | | 192,954 | | | | 22,498,436 | |
The Boeing Company | | | | | | | 242,969 | | | | 35,320,404 | |
| | | | |
| | | | | | | | | | | 87,501,709 | |
| | | | | | | | | | | | |
| | | | |
| Air Freight & Logistics: 2.19% | | | | | | | | | | | | |
United Parcel Service Incorporated Class B | | | | | | | 257,517 | | | | 25,452,980 | |
| | | | | | | | | | | | |
| | | | |
| Electrical Equipment: 2.54% | | | | | | | | | | | | |
Sensata Technologies Holding NV † | | | | | | | 597,526 | | | | 29,469,982 | |
| | | | | | | | | | | | |
| | | | |
Information Technology: 13.98% | | | | | | | | | | | | |
| | | | |
| Communications Equipment: 1.45% | | | | | | | | | | | | |
QUALCOMM Incorporated | | | | | | | 269,810 | | | | 16,852,333 | |
| | | | | | | | | | | | |
| | | | |
| IT Services: 2.13% | | | | | | | | | | | | |
Western Union Company | | | | | | | 1,455,037 | | | | 24,735,629 | |
| | | | | | | | | | | | |
| | | | |
| Semiconductors & Semiconductor Equipment: 2.17% | | | | | | | | | | | | |
Texas Instruments Incorporated | | | | | | | 471,748 | | | | 25,214,931 | |
| | | | | | | | | | | | |
The accompanying notes are an integral part of these financial statements.
| | | | | | |
| Portfolio of investments—January 31, 2015 (unaudited) | | Wells Fargo Advantage Intrinsic Value Fund | | | 9 | |
| | | | | | | | | | | | | | |
| Security name | | | | | | | Shares | | | Value | |
| | | | |
| Software: 4.30% | | | | | | | | | | | | | | |
Microsoft Corporation | | | | | | | | | 529,100 | | | $ | 21,375,640 | |
Oracle Corporation | | | | | | | | | 680,625 | | | | 28,511,381 | |
| | | | |
| | | | | | | | | | | | | 49,887,021 | |
| | | | | | | | | | | | | | |
| | | | |
| Technology Hardware, Storage & Peripherals: 3.93% | | | | | | | | | | | | | | |
Apple Incorporated | | | | | | | | | 213,808 | | | | 25,049,745 | |
EMC Corporation | | | | | | | | | 794,697 | | | | 20,606,493 | |
| | | | |
| | | | | | | | | | | | | 45,656,238 | |
| | | | | | | | | | | | | | |
| | | | |
Materials: 1.96% | | | | | | | | | | | | | | |
| | | | |
| Chemicals: 1.96% | | | | | | | | | | | | | | |
E.I. du Pont de Nemours & Company | | | | | | | | | 319,571 | | | | 22,756,651 | |
| | | | | | | | | | | | | | |
| | | | |
Telecommunication Services: 1.93% | | | | | | | | | | | | | | |
| | | | |
| Diversified Telecommunication Services: 1.93% | | | | | | | | | | | | | | |
Verizon Communications Incorporated | | | | | | | | | 491,140 | | | | 22,450,009 | |
| | | | | | | | | | | | | | |
| | | | |
Utilities: 4.76% | | | | | | | | | | | | | | |
| | | | |
| Electric Utilities: 4.76% | | | | | | | | | | | | | | |
NextEra Energy Incorporated | | | | | | | | | 288,978 | | | | 31,567,957 | |
Northeast Utilities | | | | | | | | | 427,319 | | | | 23,750,390 | |
| | | | |
| | | | | | | | | | | | | 55,318,347 | |
| | | | | | | | | | | | | | |
| | | | |
Total Common Stocks (Cost $894,769,523) | | | | | | | | | | | | | 1,139,006,719 | |
| | | | | | | | | | | | | | |
| | | | |
| | | Yield | | | | | | | | | |
| Short-Term Investments: 2.51% | | | | | | | | | | | | | | |
| | | | |
| Investment Companies: 2.51% | | | | | | | | | | | | | | |
Securities Lending Cash Investments, LLC (l)(r)(u) | | | 0.13 | % | | | | | 2,244,000 | | | | 2,244,000 | |
Wells Fargo Advantage Cash Investment Money Market Fund, Select Class (l)(u) | | | 0.10 | | | | | | 26,856,448 | | | | 26,856,448 | |
| | | | |
Total Short-Term Investments (Cost $29,100,448) | | | | | | | | | | | | | 29,100,448 | |
| | | | | | | | | | | | | | |
| | | | | | | | |
| Total investments in securities (Cost $923,869,971) * | | | 100.60 | % | | | 1,168,107,167 | |
Other assets and liabilities, net | | | (0.60 | ) | | | (6,949,660 | ) |
| | | | | | | | |
| Total net assets | | | 100.00 | % | | $ | 1,161,157,507 | |
| | | | | | | | |
| † | Non-income-earning security |
| « | All or a portion of this security is on loan. |
| (l) | The security represents an affiliate of the Fund as defined in the Investment Company Act of 1940. |
| (r) | The investment is a non-registered investment vehicle purchased with cash collateral received from securities on loan. |
| (u) | The rate represents the 7-day annualized yield at period end. |
| * | Cost for federal income tax purposes is $924,153,218 and unrealized gains (losses) consists of: |
| | | | |
Gross unrealized gains | | $ | 265,461,129 | |
Gross unrealized losses | | | (21,507,180 | ) |
| | | | |
Net unrealized gains | | $ | 243,953,949 | |
The accompanying notes are an integral part of these financial statements.
| | | | |
| 10 | | Wells Fargo Advantage Intrinsic Value Fund | | Statement of assets and liabilities—January 31, 2015 (unaudited) |
| | | | |
| | | | |
| |
Assets | | | | |
Investments | | | | |
In unaffiliated securities (including $2,167,361 of securities loaned), at value (cost $894,769,523) | | $ | 1,139,006,719 | |
In affiliated securities, at value (cost $29,100,448) | | | 29,100,448 | |
| | | | |
Total investments, at value (cost $923,869,971) | | | 1,168,107,167 | |
Receivable for Fund shares sold | | | 416,955 | |
Receivable for dividends | | | 1,340,115 | |
Receivable for securities lending income | | | 605 | |
Prepaid expenses and other assets | | | 52,447 | |
| | | | |
Total assets | | | 1,169,917,289 | |
| | | | |
| |
Liabilities | | | | |
Payable for investments purchased | | | 4,896,825 | |
Payable for Fund shares redeemed | | | 404,234 | |
Payable upon receipt of securities loaned | | | 2,244,000 | |
Advisory fee payable | | | 570,137 | |
Distribution fees payable | | | 25,709 | |
Administration fees payable | | | 211,326 | |
Accrued expenses and other liabilities | | | 407,551 | |
| | | | |
Total liabilities | | | 8,759,782 | |
| | | | |
Total net assets | | $ | 1,161,157,507 | |
| | | | |
| |
NET ASSETS CONSIST OF | | | | |
Paid-in capital | | $ | 919,110,344 | |
Undistributed net investment income | | | 154,284 | |
Accumulated net realized losses on investments | | | (2,344,317 | ) |
Net unrealized gains on investments | | | 244,237,196 | |
| | | | |
Total net assets | | $ | 1,161,157,507 | |
| | | | |
| |
COMPUTATION OF NET ASSET VALUE AND OFFERING PRICE PER SHARE | | | | |
Net assets – Class A | | $ | 373,505,890 | |
Shares outstanding – Class A1 | | | 29,221,667 | |
Net asset value per share – Class A | | | $12.78 | |
Maximum offering price per share – Class A2 | | | $13.56 | |
Net assets – Class B | | $ | 2,723,185 | |
Shares outstanding – Class B1 | | | 215,164 | |
Net asset value per share – Class B | | | $12.66 | |
Net assets – Class C | | $ | 35,317,370 | |
Shares outstanding – Class C1 | | | 2,810,009 | |
Net asset value per share – Class C | | | $12.57 | |
Net assets – Class R | | $ | 32,026 | |
Shares outstanding – Class R1 | | | 2,488 | |
Net asset value per share – Class R | | | $12.87 | |
Net assets – Class R4 | | $ | 14,074 | |
Share outstanding – Class R41 | | | 1,099 | |
Net asset value per share – Class R4 | | | $12.81 | |
Net assets – Class R6 | | $ | 155,039 | |
Shares outstanding – Class R61 | | | 12,258 | |
Net asset value per share – Class R6 | | | $12.65 | |
Net assets – Administrator Class | | $ | 511,776,359 | |
Shares outstanding – Administrator Class1 | | | 38,607,974 | |
Net asset value per share – Administrator Class | | | $13.26 | |
Net assets – Institutional Class | | $ | 237,633,564 | |
Shares outstanding – Institutional Class1 | | | 18,529,593 | |
Net asset value per share – Institutional Class | | | $12.82 | |
| 1 | The Fund has an unlimited number of authorized shares. |
| 2 | Maximum offering price is computed as 100/94.25 of net asset value. On investments of $50,000 or more, the offering price is reduced. |
The accompanying notes are an integral part of these financial statements.
| | | | | | |
| Statement of operations—six months ended January 31, 2015 (unaudited) | | Wells Fargo Advantage Intrinsic Value Fund | | | 11 | |
| | | | |
| | | | |
| |
Investment income | | | | |
Dividends (net of foreign withholding taxes of $151,856) | | $ | 11,222,648 | |
Securities lending income, net | | | 17,897 | |
Income from affiliated securities | | | 11,053 | |
| | | | |
Total investment income | | | 11,251,598 | |
| | | | |
| |
Expenses | | | | |
Advisory fee | | | 3,867,203 | |
Administration fees | | | | |
Fund level | | | 306,428 | |
Class A | | | 512,550 | |
Class B | | | 4,404 | |
Class C | | | 48,178 | |
Class R | | | 40 | |
Class R4 | | | 6 | |
Class R6 | | | 24 | |
Administrator Class | | | 270,747 | |
Institutional Class | | | 99,719 | |
Shareholder servicing fees | | | | |
Class A | | | 472,845 | |
Class B | | | 4,235 | |
Class C | | | 46,325 | |
Class R | | | 38 | |
Class R4 | | | 7 | |
Administrator Class | | | 676,134 | |
Distribution fees | | | | |
Class B | | | 12,705 | |
Class C | | | 138,975 | |
Class R | | | 38 | |
Custody and accounting fees | | | 30,756 | |
Professional fees | | | 21,630 | |
Registration fees | | | 49,563 | |
Shareholder report expenses | | | 53,641 | |
Trustees’ fees and expenses | | | 5,054 | |
Other fees and expenses | | | 11,577 | |
| | | | |
Total expenses | | | 6,632,822 | |
Less: Fee waivers and/or expense reimbursements | | | (514,357 | ) |
| | | | |
Net expenses | | | 6,118,465 | |
| | | | |
Net investment income | | | 5,133,133 | |
| | | | |
| |
REALIZED AND UNREALIZED GAINS (LOSSES) ON INVESTMENTS | | | | |
Net realized gains on investments | | | 48,150,576 | |
Net change in unrealized gains (losses) on investments | | | (31,329,569 | ) |
| | | | |
Net realized and unrealized gains (losses) on investments | | | 16,821,007 | |
| | | | |
Net increase in net assets resulting from operations | | $ | 21,954,140 | |
| | | | |
The accompanying notes are an integral part of these financial statements.
| | | | |
| 12 | | Wells Fargo Advantage Intrinsic Value Fund | | Statement of changes in net assets |
| | | | | | | | | | | | | | | | |
| | | Six months ended
January 31, 2015
(unaudited) | | | Year ended
July 31, 2014 | |
| | | | |
Operations | | | | | | | | | | | | | | | | |
Net investment income | | | | | | $ | 5,133,133 | | | | | | | $ | 8,246,287 | |
Net realized gains on investments | | | | | | | 48,150,576 | | | | | | | | 77,209,900 | |
Net change in unrealized gains (losses) on investments | | | | | | | (31,329,569 | ) | | | | | | | 63,456,026 | |
| | | | |
Net increase in net assets resulting from operations | | | | | | | 21,954,140 | | | | | | | | 148,912,213 | |
| | | | |
| | | | |
Distributions to shareholders from | | | | | | | | | | | | | | | | |
Net investment income | | | | | | | | | | | | | | | | |
Class A | | | | | | | (2,172,530 | ) | | | | | | | (1,863,705 | ) |
Class R | | | | | | | (81 | ) | | | | | | | 0 | |
Class R4 | | | | | | | (130 | ) | | | | | | | (108 | ) |
Class R6 | | | | | | | (2,896 | ) | | | | | | | (33,391 | ) |
Administrator Class | | | | | | | (4,135,495 | ) | | | | | | | (3,445,927 | ) |
Institutional Class | | | | | | | (2,556,860 | ) | | | | | | | (1,982,826 | ) |
Net realized gains | | | | | | | | | | | | | | | | |
Class A | | | | | | | (27,285,622 | ) | | | | | | | (13,761,999 | ) |
Class B | | | | | | | (212,769 | ) | | | | | | | (178,855 | ) |
Class C | | | | | | | (2,625,364 | ) | | | | | | | (1,277,956 | ) |
Class R | | | | | | | (2,211 | ) | | | | | | | (749 | ) |
Class R4 | | | | | | | (1,003 | ) | | | | | | | (494 | ) |
Class R6 | | | | | | | (11,038 | ) | | | | | | | (129,126 | ) |
Administrator Class | | | | | | | (36,136,387 | ) | | | | | | | (17,781,237 | ) |
Institutional Class | | | | | | | (17,741,411 | ) | | | | | | | (8,059,479 | ) |
| | | | |
Total distributions to shareholders | | | | | | | (92,883,797 | ) | | | | | | | (48,515,852 | ) |
| | | | |
| | | | |
Capital share transactions | | | Shares | | | | | | | | Shares | | | | | |
Proceeds from shares sold | | | | | | | | | | | | | | | | |
Class A | | | 381,074 | | | | 5,178,777 | | | | 1,536,744 | | | | 19,747,759 | |
Class B | | | 1,988 | | | | 26,709 | | | | 6,639 | | | | 83,868 | |
Class C | | | 127,279 | | | | 1,687,099 | | | | 248,479 | | | | 3,177,380 | |
Class R | | | 343 | | | | 4,699 | | | | 541 | | | | 7,094 | |
Class R6 | | | 162 | | | | 2,204 | | | | 28,088 | | | | 358,736 | |
Administrator Class | | | 332,900 | | | | 4,657,771 | | | | 1,447,515 | | | | 19,486,524 | |
Institutional Class | | | 1,376,162 | | | | 19,065,421 | | | | 3,266,904 | | | | 42,230,313 | |
| | | | |
| | | | | | | 30,622,680 | | | | | | | | 85,091,674 | |
| | | | |
Reinvestment of distributions | | | | | | | | | | | | | | | | |
Class A | | | 2,128,410 | | | | 27,919,055 | | | | 1,176,653 | | | | 14,917,979 | |
Class B | | | 15,779 | | | | 204,497 | | | | 13,464 | | | | 169,111 | |
Class C | | | 174,638 | | | | 2,247,594 | | | | 88,113 | | | | 1,099,654 | |
Class R | | | 174 | | | | 2,292 | | | | 58 | | | | 749 | |
Class R4 | | | 87 | | | | 1,133 | | | | 46 | | | | 602 | |
Class R6 | | | 1,067 | | | | 13,934 | | | | 12,774 | | | | 162,517 | |
Administrator Class | | | 2,787,353 | | | | 37,937,309 | | | | 1,521,594 | | | | 19,958,784 | |
Institutional Class | | | 1,210,531 | | | | 15,960,088 | | | | 652,707 | | | | 8,311,426 | |
| | | | |
| | | | | | | 84,285,902 | | | | | | | | 44,620,822 | |
| | | | |
Payment for shares redeemed | | | | | | | | | | | | | | | | |
Class A | | | (2,047,008 | ) | | | (27,881,757 | ) | | | (4,839,117 | ) | | | (63,094,781 | ) |
Class B | | | (91,753 | ) | | | (1,248,664 | ) | | | (180,860 | ) | | | (2,324,814 | ) |
Class C | | | (234,741 | ) | | | (3,134,680 | ) | | | (478,767 | ) | | | (6,118,561 | ) |
Class R | | | (79 | ) | | | (1,060 | ) | | | 0 | | | | 0 | |
Class R4 | | | (111 | ) | | | (1,553 | ) | | | 0 | | | | 0 | |
Class R6 | | | 0 | | | | 0 | | | | (297,213 | ) | | | (4,116,495 | ) |
Administrator Class | | | (2,482,415 | ) | | | (35,246,315 | ) | | | (4,780,073 | ) | | | (63,850,413 | ) |
Institutional Class | | | (1,934,683 | ) | | | (26,089,815 | ) | | | (3,626,645 | ) | | | (47,212,305 | ) |
| | | | |
| | | | | | | (93,603,844 | ) | | | | | | | (186,717,369 | ) |
| | | | |
Net increase (decrease) in net assets resulting from capital share transactions | | | | | | | 21,304,738 | | | | | | | | (57,004,873 | ) |
| | | | |
Total increase (decrease) in net assets | | | | | | | (49,624,919 | ) | | | | | | | 43,391,488 | |
| | | | |
| | | | |
Net assets | | | | | | | | | | | | | | | | |
Beginning of period | | | | | | | 1,210,782,426 | | | | | | | | 1,167,390,938 | |
| | | | |
End of period | | | | | | $ | 1,161,157,507 | | | | | | | $ | 1,210,782,426 | |
| | | | |
Undistributed net investment income | | | | | | $ | 154,284 | | | | | | | $ | 3,889,143 | |
| | | | |
The accompanying notes are an integral part of these financial statements.
| | | | | | |
| Financial highlights | | Wells Fargo Advantage Intrinsic Value Fund | | | 13 | |
(For a share outstanding throughout each period)
| | | | | | | | | | | | | | | | | | | | | | | | |
| | | Six months ended
January 31, 2015 (unaudited) | | | Year ended July 31 | |
| CLASS A | | | 2014 | | | 2013 | | | 2012 | | | 2011 | | | 20101 | |
Net asset value, beginning of period | | | $13.60 | | | | $12.52 | | | | $10.44 | | | | $11.50 | | | | $9.84 | | | | $8.48 | |
Net investment income | | | 0.04 | | | | 0.07 | | | | 0.07 | 2 | | | 0.11 | 2 | | | 0.10 | | | | 0.10 | 2 |
Net realized and unrealized gains (losses) on investments | | | 0.20 | | | | 1.53 | | | | 2.75 | | | | 0.24 | | | | 1.65 | | | | 1.31 | |
| | | | | | | | | | | | | | | | | | | | | | | | |
Total from investment operations | | | 0.24 | | | | 1.60 | | | | 2.82 | | | | 0.35 | | | | 1.75 | | | | 1.41 | |
Distributions to shareholders from | | | | | | | | | | | | | | | | | | | | | | | | |
Net investment income | | | (0.07 | ) | | | (0.06 | ) | | | (0.10 | ) | | | (0.28 | ) | | | (0.09 | ) | | | (0.05 | ) |
Net realized gains | | | (0.99 | ) | | | (0.46 | ) | | | (0.64 | ) | | | (1.13 | ) | | | 0.00 | | | | 0.00 | |
| | | | | | | | | | | | | | | | | | | | | | | | |
Total distributions to shareholders | | | (1.06 | ) | | | (0.52 | ) | | | (0.74 | ) | | | (1.41 | ) | | | (0.09 | ) | | | (0.05 | ) |
Net asset value, end of period | | | $12.78 | | | | $13.60 | | | | $12.52 | | | | $10.44 | | | | $11.50 | | | | $9.84 | |
Total return3 | | | 1.63 | % | | | 13.09 | % | | | 28.53 | % | | | 4.38 | % | | | 17.88 | % | | | 16.67 | % |
Ratios to average net assets (annualized) | | | | | | | | | | | | | | | | | | | | | | | | |
Gross expenses | | | 1.21 | % | | | 1.21 | % | | | 1.20 | % | | | 1.24 | % | | | 1.24 | % | | | 1.17 | % |
Net expenses | | | 1.16 | % | | | 1.16 | % | | | 1.16 | % | | | 1.17 | % | | | 1.17 | % | | | 1.11 | % |
Net investment income | | | 0.68 | % | | | 0.53 | % | | | 0.57 | % | | | 1.05 | % | | | 0.81 | % | | | 1.05 | % |
Supplemental data | | | | | | | | | | | | | | | | | | | | | | | | |
Portfolio turnover rate | | | 13 | % | | | 23 | % | | | 28 | % | | | 34 | % | | | 25 | % | | | 23 | % |
Net assets, end of period (000s omitted) | | | $373,506 | | | | $391,028 | | | | $386,655 | | | | $87,784 | | | | $159,178 | | | | $147,957 | |
| 1 | After the close of business on July 16, 2010, the Fund acquired the net assets of Evergreen Intrinsic Value Fund which became the accounting and performance survivor in the transaction. The information for the period prior to July 19, 2010 is that of Class A of Evergreen Intrinsic Value Fund. |
| 2 | Calculated based upon average shares outstanding |
| 3 | Total return calculations do not include any sales charges. Returns for periods of less than one year are not annualized. |
The accompanying notes are an integral part of these financial statements.
| | | | |
| 14 | | Wells Fargo Advantage Intrinsic Value Fund | | Financial highlights |
(For a share outstanding throughout each period)
| | | | | | | | | | | | | | | | | | | | | | | | |
| | | Six months ended
January 31, 2015 (unaudited) | | | Year ended July 31 | |
| CLASS B | | | 2014 | | | 2013 | | | 2012 | | | 2011 | | | 20101 | |
Net asset value, beginning of period | | | $13.45 | | | | $12.42 | | | | $10.34 | | | | $11.37 | | | | $9.72 | | | | $8.40 | |
Net investment income (loss) | | | (0.00 | )2 | | | (0.03 | )3 | | | (0.02 | ) | | | 0.03 | 3 | | | 0.01 | 3 | | | 0.03 | 3 |
Net realized and unrealized gains (losses) on investments | | | 0.20 | | | | 1.52 | | | | 2.74 | | | | 0.24 | | | | 1.64 | | | | 1.29 | |
| | | | | | | | | | | | | | | | | | | | | | | | |
Total from investment operations | | | 0.20 | | | | 1.49 | | | | 2.72 | | | | 0.27 | | | | 1.65 | | | | 1.32 | |
Distributions to shareholders from | | | | | | | | | | | | | | | | | | | | | | | | |
Net investment income | | | 0.00 | | | | 0.00 | | | | 0.00 | | | | (0.17 | ) | | | (0.00 | )2 | | | 0.00 | |
Net realized gains | | | (0.99 | ) | | | (0.46 | ) | | | (0.64 | ) | | | (1.13 | ) | | | 0.00 | | | | 0.00 | |
| | | | | | | | | | | | | | | | | | | | | | | | |
Total distributions to shareholders | | | (0.99 | ) | | | (0.46 | ) | | | (0.64 | ) | | | (1.30 | ) | | | (0.00 | )2 | | | 0.00 | |
Net asset value, end of period | | | $12.66 | | | | $13.45 | | | | $12.42 | | | | $10.34 | | | | $11.37 | | | | $9.72 | |
Total return4 | | | 1.32 | % | | | 12.25 | % | | | 27.57 | % | | | 3.56 | % | | | 17.03 | % | | | 15.71 | % |
Ratios to average net assets (annualized) | | | | | | | | | | | | | | | | | | | | | | | | |
Gross expenses | | | 1.97 | % | | | 1.97 | % | | | 1.97 | % | | | 2.01 | % | | | 1.99 | % | | | 1.93 | % |
Net expenses | | | 1.91 | % | | | 1.91 | % | | | 1.91 | % | | | 1.92 | % | | | 1.91 | % | | | 1.88 | % |
Net investment income (loss) | | | (0.06 | )% | | | (0.20 | )% | | | (0.03 | )% | | | 0.27 | % | | | 0.07 | % | | | 0.30 | % |
Supplemental data | | | | | | | | | | | | | | | | | | | | | | | | |
Portfolio turnover rate | | | 13 | % | | | 23 | % | | | 28 | % | | | 34 | % | | | 25 | % | | | 23 | % |
Net assets, end of period (000s omitted) | | | $2,723 | | | | $3,889 | | | | $5,589 | | | | $4,323 | | | | $7,666 | | | | $9,206 | |
| 1 | After the close of business on July 16, 2010, the Fund acquired the net assets of Evergreen Intrinsic Value Fund which became the accounting and performance survivor in the transaction. The information for the period prior to July 19, 2010 is that of Class B of Evergreen Intrinsic Value Fund. |
| 2 | Amount is less than $0.005. |
| 3 | Calculated based upon average shares outstanding |
| 4 | Total return calculations do not include any sales charges. Returns for periods of less than one year are not annualized. |
The accompanying notes are an integral part of these financial statements.
| | | | | | |
| Financial highlights | | Wells Fargo Advantage Intrinsic Value Fund | | | 15 | |
(For a share outstanding throughout each period)
| | | | | | | | | | | | | | | | | | | | | | | | |
| | | Six months ended
January 31, 2015 (unaudited) | | | Year ended July 31 | |
| CLASS C | | | 2014 | | | 2013 | | | 2012 | | | 2011 | | | 20101 | |
Net asset value, beginning of period | | | $13.36 | | | | $12.35 | | | | $10.30 | | | | $11.35 | | | | $9.72 | | | | $8.40 | |
Net investment income (loss) | | | (0.01 | )2 | | | (0.03 | ) | | | (0.01 | )2 | | | 0.03 | 2 | | | 0.02 | | | | 0.03 | 2 |
Net realized and unrealized gains (losses) on investments | | | 0.21 | | | | 1.50 | | | | 2.72 | | | | 0.24 | | | | 1.63 | | | | 1.29 | |
| | | | | | | | | | | | | | | | | | | | | | | | |
Total from investment operations | | | 0.20 | | | | 1.47 | | | | 2.71 | | | | 0.27 | | | | 1.65 | | | | 1.32 | |
Distributions to shareholders from | | | | | | | | | | | | | | | | | | | | | | | | |
Net investment income | | | 0.00 | | | | 0.00 | | | | (0.02 | ) | | | (0.19 | ) | | | (0.02 | ) | | | 0.00 | |
Net realized gains | | | (0.99 | ) | | | (0.46 | ) | | | (0.64 | ) | | | (1.13 | ) | | | 0.00 | | | | 0.00 | |
| | | | | | | | | | | | | | | | | | | | | | | | |
Total distributions to shareholders | | | (0.99 | ) | | | (0.46 | ) | | | (0.66 | ) | | | (1.32 | ) | | | (0.02 | ) | | | 0.00 | |
Net asset value, end of period | | | $12.57 | | | | $13.36 | | | | $12.35 | | | | $10.30 | | | | $11.35 | | | | $9.72 | |
Total return3 | | | 1.32 | % | | | 12.24 | % | | | 27.50 | % | | | 3.62 | % | | | 16.98 | % | | | 15.71 | % |
Ratios to average net assets (annualized) | | | | | | | | | | | | | | | | | | | | | | | | |
Gross expenses | | | 1.97 | % | | | 1.97 | % | | | 1.97 | % | | | 2.01 | % | | | 1.97 | % | | | 1.94 | % |
Net expenses | | | 1.91 | % | | | 1.91 | % | | | 1.91 | % | | | 1.92 | % | | | 1.92 | % | | | 1.88 | % |
Net investment income (loss) | | | (0.07 | )% | | | (0.22 | )% | | | (0.05 | )% | | | 0.26 | % | | | 0.07 | % | | | 0.29 | % |
Supplemental data | | | | | | | | | | | | | | | | | | | | | | | | |
Portfolio turnover rate | | | 13 | % | | | 23 | % | | | 28 | % | | | 34 | % | | | 25 | % | | | 23 | % |
Net assets, end of period (000s omitted) | | | $35,317 | | | | $36,654 | | | | $35,616 | | | | $20,187 | | | | $28,230 | | | | $26,934 | |
| 1 | After the close of business on July 16, 2010, the Fund acquired the net assets of Evergreen Intrinsic Value Fund which became the accounting and performance survivor in the transaction. The information for the period prior to July 19, 2010 is that of Class C of Evergreen Intrinsic Value Fund. |
| 2 | Calculated based upon average shares outstanding |
| 3 | Total return calculations do not include any sales charges. Returns for periods of less than one year are not annualized. |
The accompanying notes are an integral part of these financial statements.
| | | | |
| 16 | | Wells Fargo Advantage Intrinsic Value Fund | | Financial highlights |
(For a share outstanding throughout each period)
| | | | | | | | | | | | |
| | | Six months ended
January 31, 2015 (unaudited) | | | Year ended July 31 | |
| CLASS R | | | 2014 | | | 20131 | |
Net asset value, beginning of period | | | $13.66 | | | | $12.55 | | | | $11.20 | |
Net investment income | | | 0.02 | | | | 0.03 | | | | 0.00 | 2 |
Net realized and unrealized gains (losses) on investments | | | 0.21 | | | | 1.54 | | | | 1.35 | |
| | | | | | | | | | | | |
Total from investment operations | | | 0.23 | | | | 1.57 | | | | 1.35 | |
Distributions to shareholders from | | | | | | | | | | | | |
Net investment income | | | (0.03 | ) | | | 0.00 | | | | 0.00 | |
Net realized gains | | | (0.99 | ) | | | (0.46 | ) | | | 0.00 | |
| | | | | | | | | | | | |
Total distributions to shareholders | | | (1.02 | ) | | | (0.46 | ) | | | 0.00 | |
Net asset value, end of period | | | $12.87 | | | | $13.66 | | | | $12.55 | |
Total return3 | | | 1.54 | % | | | 12.77 | % | | | 12.05 | % |
Ratios to average net assets (annualized) | | | | | | | | | | | | |
Gross expenses | | | 1.48 | % | | | 1.49 | % | | | 1.46 | % |
Net expenses | | | 1.41 | % | | | 1.41 | % | | | 1.41 | % |
Net investment income | | | 0.42 | % | | | 0.26 | % | | | 0.01 | % |
Supplemental data | | | | | | | | | | | | |
Portfolio turnover rate | | | 13 | % | | | 23 | % | | | 28 | % |
Net assets, end of period (000s omitted) | | | $32 | | | | $28 | | | | $18 | |
| 1 | For the period from March 1, 2013 (commencement of class operations) to July 31, 2013 |
| 2 | Amount is less than $0.005. |
| 3 | Returns for periods of less than one year are not annualized. |
The accompanying notes are an integral part of these financial statements.
| | | | | | |
| Financial highlights | | Wells Fargo Advantage Intrinsic Value Fund | | | 17 | |
(For a share outstanding throughout each period)
| | | | | | | | | | | | |
| | | Six months ended
January 31, 2015 (unaudited) | | | Year ended July 31 | |
| CLASS R4 | | | 2014 | | | 20131 | |
Net asset value, beginning of period | | | $13.65 | | | | $12.55 | | | | $11.10 | |
Net investment income | | | 0.07 | | | | 0.12 | | | | 0.09 | |
Net realized and unrealized gains (losses) on investments | | | 0.20 | | | | 1.54 | | | | 2.15 | |
| | | | | | | | | | | | |
Total from investment operations | | | 0.27 | | | | 1.66 | | | | 2.24 | |
Distributions to shareholders from | | | | | | | | | | | | |
Net investment income | | | (0.12 | ) | | | (0.10 | ) | | | (0.15 | ) |
Net realized gains | | | (0.99 | ) | | | (0.46 | ) | | | (0.64 | ) |
| | | | | | | | | | | | |
Total distributions to shareholders | | | (1.11 | ) | | | (0.56 | ) | | | (0.79 | ) |
Net asset value, end of period | | | $12.81 | | | | $13.65 | | | | $12.55 | |
Total return2 | | | 1.82 | % | | | 13.55 | % | | | 21.73 | % |
Ratios to average net assets (annualized) | | | | | | | | | | | | |
Gross expenses | | | 0.87 | % | | | 0.87 | % | | | 0.88 | % |
Net expenses | | | 0.80 | % | | | 0.80 | % | | | 0.80 | % |
Net investment income | | | 1.04 | % | | | 0.88 | % | | | 0.99 | % |
Supplemental data | | | | | | | | | | | | |
Portfolio turnover rate | | | 13 | % | | | 23 | % | | | 28 | % |
Net assets, end of period (000s omitted) | | | $14 | | | | $15 | | | | $14 | |
| 1 | For the period from November 30, 2012 (commencement of class operations) to July 31, 2013 |
| 2 | Returns for periods of less than one year are not annualized. |
The accompanying notes are an integral part of these financial statements.
| | | | |
| 18 | | Wells Fargo Advantage Intrinsic Value Fund | | Financial highlights |
(For a share outstanding throughout each period)
| | | | | | | | | | | | |
| | | Six months ended
January 31, 2015 (unaudited) | | | Year ended July 31 | |
| CLASS R6 | | | 2014 | | | 20131 | |
Net asset value, beginning of period | | | $13.60 | | | | $12.56 | | | | $11.10 | |
Net investment income | | | 0.08 | 2 | | | 0.14 | 2 | | | 0.19 | |
Net realized and unrealized gains (losses) on investments | | | 0.20 | | | | 1.47 | | | | 2.06 | |
| | | | | | | | | | | | |
Total from investment operations | | | 0.28 | | | | 1.61 | | | | 2.25 | |
Distributions to shareholders from | | | | | | | | | | | | |
Net investment income | | | (0.24 | ) | | | (0.11 | ) | | | (0.15 | ) |
Net realized gains | | | (0.99 | ) | | | (0.46 | ) | | | (0.64 | ) |
| | | | | | | | | | | | |
Total distributions to shareholders | | | (1.23 | ) | | | (0.57 | ) | | | (0.79 | ) |
Net asset value, end of period | | | $12.65 | | | | $13.60 | | | | $12.56 | |
Total return3 | | | 1.92 | % | | | 13.19 | % | | | 21.84 | % |
Ratios to average net assets (annualized) | | | | | | | | | | | | |
Gross expenses | | | 0.74 | % | | | 0.74 | % | | | 0.73 | % |
Net expenses | | | 0.65 | % | | | 0.65 | % | | | 0.65 | % |
Net investment income | | | 1.18 | % | | | 1.10 | % | | | 0.85 | % |
Supplemental data | | | | | | | | | | | | |
Portfolio turnover rate | | | 13 | % | | | 23 | % | | | 28 | % |
Net assets, end of period (000s omitted) | | | $155 | | | | $150 | | | | $3,359 | |
| 1 | For the period from November 30, 2012 (commencement of class operations) to July 31, 2013 |
| 2 | Calculated based upon average shares outstanding |
| 3 | Returns for periods of less than one year are not annualized. |
The accompanying notes are an integral part of these financial statements.
| | | | | | |
| Financial highlights | | Wells Fargo Advantage Intrinsic Value Fund | | | 19 | |
(For a share outstanding throughout each period)
| | | | | | | | | | | | | | | | | | | | | | | | |
| | | Six months ended
January 31, 2015 (unaudited) | | | Year ended July 31 | |
| ADMINISTRATOR CLASS | | | 2014 | | | 2013 | | | 2012 | | | 2011 | | | 20101 | |
Net asset value, beginning of period | | | $14.08 | | | | $12.95 | | | | $10.78 | | | | $11.55 | | | | $9.87 | | | | $9.87 | |
Net investment income | | | 0.06 | | | | 0.10 | | | | 0.08 | 2 | | | 0.12 | 2 | | | 0.11 | 2 | | | 0.00 | |
Net realized and unrealized gains (losses) on investments | | | 0.22 | | | | 1.58 | | | | 2.87 | | | | 0.28 | | | | 1.68 | | | | 0.00 | |
| | | | | | | | | | | | | | | | | | | | | | | | |
Total from investment operations | | | 0.28 | | | | 1.68 | | | | 2.95 | | | | 0.40 | | | | 1.79 | | | | 0.00 | |
Distributions to shareholders from | | | | | | | | | | | | | | | | | | | | | | | | |
Net investment income | | | (0.11 | ) | | | (0.09 | ) | | | (0.14 | ) | | | (0.04 | ) | | | (0.11 | ) | | | 0.00 | |
Net realized gains | | | (0.99 | ) | | | (0.46 | ) | | | (0.64 | ) | | | (1.13 | ) | | | 0.00 | | | | 0.00 | |
| | | | | | | | | | | | | | | | | | | | | | | | |
Total distributions to shareholders | | | (1.10 | ) | | | (0.55 | ) | | | (0.78 | ) | | | (1.17 | ) | | | (0.11 | ) | | | 0.00 | |
Net asset value, end of period | | | $13.26 | | | | $14.08 | | | | $12.95 | | | | $10.78 | | | | $11.55 | | | | $9.87 | |
Total return3 | | | 1.82 | % | | | 13.36 | % | | | 28.77 | % | | | 4.57 | % | | | 18.23 | % | | | 0.00 | % |
Ratios to average net assets (annualized) | | | | | | | | | | | | | | | | | | | | | | | | |
Gross expenses | | | 1.06 | % | | | 1.06 | % | | | 1.05 | % | | | 1.09 | % | | | 1.06 | % | | | 0.00 | % |
Net expenses | | | 0.95 | % | | | 0.95 | % | | | 0.95 | % | | | 0.95 | % | | | 0.95 | % | | | 0.00 | % |
Net investment income | | | 0.88 | % | | | 0.74 | % | | | 0.68 | % | | | 1.13 | % | | | 1.04 | % | | | 0.00 | % |
Supplemental data | | | | | | | | | | | | | | | | | | | | | | | | |
Portfolio turnover rate | | | 13 | % | | | 23 | % | | | 28 | % | | | 34 | % | | | 25 | % | | | 23 | % |
Net assets, end of period (000s omitted) | | | $511,776 | | | | $534,641 | | | | $515,012 | | | | $26,687 | | | | $9,693 | | | | $10 | |
| 1 | For the period from July 30, 2010 (commencement of class operations) to July 31, 2010 |
| 2 | Calculated based upon average shares outstanding |
| 3 | Returns for periods of less than one year are not annualized. |
The accompanying notes are an integral part of these financial statements.
| | | | |
| 20 | | Wells Fargo Advantage Intrinsic Value Fund | | Financial highlights |
(For a share outstanding throughout each period)
| | | | | | | | | | | | | | | | | | | | | | | | |
| | | Six months ended
January 31, 2015 (unaudited) | | | Year ended July 31 | |
| INSTITUTIONAL CLASS | | | 2014 | | | 2013 | | | 2012 | | | 2011 | | | 20101 | |
Net asset value, beginning of period | | | $13.67 | | | | $12.58 | | | | $10.48 | | | | $11.56 | | | | $9.87 | | | | $8.51 | |
Net investment income | | | 0.07 | | | | 0.13 | | | | 0.16 | | | | 0.14 | 2 | | | 0.13 | 2 | | | 0.12 | 2 |
Net realized and unrealized gains (losses) on investments | | | 0.21 | | | | 1.53 | | | | 2.73 | | | | 0.24 | | | | 1.67 | | | | 1.32 | |
| | | | | | | | | | | | | | | | | | | | | | | | |
Total from investment operations | | | 0.28 | | | | 1.66 | | | | 2.89 | | | | 0.38 | | | | 1.80 | | | | 1.44 | |
Distributions to shareholders from | | | | | | | | | | | | | | | | | | | | | | | | |
Net investment income | | | (0.14 | ) | | | (1.11 | ) | | | (0.15 | ) | | | (0.33 | ) | | | (0.11 | ) | | | (0.08 | ) |
Net realized gains | | | (0.99 | ) | | | (0.46 | ) | | | (0.64 | ) | | | (1.13 | ) | | | 0.00 | | | | 0.00 | |
| | | | | | | | | | | | | | | | | | | | | | | | |
Total distributions to shareholders | | | (1.13 | ) | | | (0.57 | ) | | | (0.79 | ) | | | (1.46 | ) | | | (0.11 | ) | | | (0.08 | ) |
Net asset value, end of period | | | $12.82 | | | | $13.67 | | | | $12.58 | | | | $10.48 | | | | $11.56 | | | | $9.87 | |
Total return3 | | | 1.87 | % | | | 13.64 | % | | | 29.04 | % | | | 4.71 | % | | | 18.32 | % | | | 16.93 | % |
Ratios to average net assets (annualized) | | | | | | | | | | | | | | | | | | | | | | | | |
Gross expenses | | | 0.79 | % | | | 0.79 | % | | | 0.79 | % | | | 0.83 | % | | | 0.79 | % | | | 0.94 | % |
Net expenses | | | 0.70 | % | | | 0.70 | % | | | 0.73 | % | | | 0.82 | % | | | 0.79 | % | | | 0.88 | % |
Net investment income | | | 1.14 | % | | | 0.99 | % | | | 1.21 | % | | | 1.35 | % | | | 1.16 | % | | | 1.27 | % |
Supplemental data | | | | | | | | | | | | | | | | | | | | | | | | |
Portfolio turnover rate | | | 13 | % | | | 23 | % | | | 28 | % | | | 34 | % | | | 25 | % | | | 23 | % |
Net assets, end of period (000s omitted) | | | $237,634 | | | | $244,378 | | | | $221,128 | | | | $222,949 | | | | $277,329 | | | | $1,109,507 | |
| 1 | After the close of business on July 16, 2010, the Fund acquired the net assets of Evergreen Intrinsic Value Fund which became the accounting and performance survivor in the transaction. The information for the period prior to July 19, 2010 is that of Class I of Evergreen Intrinsic Value Fund. |
| 2 | Calculated based upon average shares outstanding |
| 3 | Returns for periods of less than one year are not annualized. |
The accompanying notes are an integral part of these financial statements.
| | | | | | |
| Notes to financial statements (unaudited) | | Wells Fargo Advantage Intrinsic Value Fund | | | 21 | |
1. ORGANIZATION
Wells Fargo Funds Trust (the “Trust”), a Delaware statutory trust organized on March 10, 1999, is an open-end management investment company registered under the Investment Company Act of 1940, as amended (the “1940 Act”). As an investment company, the Trust follows the accounting and reporting guidance in Financial Accounting Standards Board (“FASB”) Accounting Standards Codification Topic 946, Financial Services – Investment Companies. These financial statements report on the Wells Fargo Advantage Intrinsic Value Fund (the “Fund”) which is a diversified series of the Trust.
2. SIGNIFICANT ACCOUNTING POLICIES
The following significant accounting policies, which are consistently followed in the preparation of the financial statements of the Fund, are in conformity with U.S. generally accepted accounting principles which require management to make estimates and assumptions that affect the reported amounts of assets and liabilities, disclosure of contingent assets and liabilities at the date of the financial statements, and the reported amounts of revenues and expenses during the reporting period. Actual results could differ from those estimates.
Securities valuation
All investments are valued each business day as of the close of regular trading on the New York Stock Exchange (generally 4 p.m. Eastern Time).
Equity securities that are listed on a foreign or domestic exchange or market are valued at the official closing price or, if none, the last sales price. If no sale occurs on the primary exchange or market for the security that day, the prior day’s price will be deemed “stale” and fair values will be determined in accordance with the Fund’s Valuation Procedures.
Investments in registered open-end investment companies are valued at net asset value. Non-registered investment vehicles are fair valued at net asset value.
Investments which are not valued using any of the methods discussed above are valued at their fair value, as determined in good faith by the Board of Trustees of the Fund. The Board of Trustees has established a Valuation Committee comprised of the Trustees and has delegated to it the authority to take any actions regarding the valuation of portfolio securities that the Valuation Committee deems necessary or appropriate, including determining the fair value of portfolio securities, unless the determination has been delegated to the Management Valuation Team of Wells Fargo Funds Management, LLC (“Funds Management”). The Board of Trustees retains the authority to make or ratify any valuation decisions or approve any changes to the Valuation Procedures as it deems appropriate. On a quarterly basis, the Board of Trustees receives reports on any valuation actions taken by the Valuation Committee or the Management Valuation Team which may include items for ratification.
Valuations of fair valued securities are compared to the next actual sales price when available, or other appropriate market values, to assess the continued appropriateness of the fair valuation methodologies used. These securities are fair valued on a day-to-day basis, taking into consideration changes to appropriate market information and any significant changes to the inputs considered in the valuation process until there is a readily available price provided on an exchange or by an independent pricing service. Valuations received from an independent pricing service or independent broker-dealer quotes are periodically validated by comparisons to most recent trades and valuations provided by other independent pricing services in addition to the review of prices by the adviser and/or subadviser. Unobservable inputs used in determining fair valuations are identified based on the type of security, taking into consideration factors utilized by market participants in valuing the investment, knowledge about the issuer and the current market environment.
Security loans
The Fund may lend its securities from time to time in order to earn additional income in the form of fees or interest on securities received as collateral or the investment of any cash received as collateral. The Fund continues to receive interest or dividends on the securities loaned. The Fund receives collateral in the form of cash or securities with a value at least equal to the value of the securities on loan. The value of the loaned securities is determined at the close of each business day and any additional required collateral is delivered to the Fund on the next business day. In a securities lending transaction, the net asset value of the Fund will be affected by an increase or decrease in the value of the securities loaned and by an increase or decrease in the value of the instrument in which collateral is invested. The amount of securities lending activity undertaken by the Fund fluctuates from time to time. In the event of default or bankruptcy by the borrower, the Fund may be prevented from recovering the loaned securities or gaining access to the collateral or may experience delays or costs in doing so. In addition, the investment of any cash collateral received may lose all or part of its value. The Fund has the right under the lending agreement to recover the securities from the borrower on demand.
The Fund lends its securities through an unaffiliated securities lending agent. Cash collateral received in connection with its securities lending transactions is invested in Securities Lending Cash Investments, LLC (the “Securities Lending Fund”).
| | | | |
| 22 | | Wells Fargo Advantage Intrinsic Value Fund | | Notes to financial statements (unaudited) |
The Securities Lending Fund is exempt from registration under Section 3(c)(7) of the 1940 Act and is managed by Funds Management and is subadvised by Wells Capital Management Incorporated (“WellsCap”). Funds Management receives an advisory fee starting at 0.05% and declining to 0.01% as the average daily net assets of the Securities Lending Fund increase. All of the fees received by Funds Management are paid to WellsCap for its services as subadviser. The Securities Lending Fund seeks to provide a positive return compared to the daily Fed Funds Open rate by investing in high-quality, U.S. dollar-denominated short-term money market instruments. Securities Lending Fund investments are fair valued based upon the amortized cost valuation technique. Income earned from investment in the Securities Lending Fund is included in securities lending income on the Statement of Operations.
Security transactions and income recognition
Securities transactions are recorded on a trade date basis. Realized gains or losses are recorded on the basis of identified cost.
Dividend income is recognized on the ex-dividend date. Dividend income is recorded net of foreign taxes withheld where recovery of such taxes is not assured.
Distributions to shareholders
Distributions to shareholders from net investment income and net realized gains, if any, are recorded on the ex-dividend date. Such distributions are determined in conformity with federal income tax regulations, which may differ in amount or character from net investment income and realized gains recognized for purposes of U.S. generally accepted accounting principles.
Federal and other taxes
The Fund intends to continue to qualify as a regulated investment company by distributing substantially all of its investment company taxable income and any net realized capital gains (after reduction for capital loss carryforwards) sufficient to relieve it from all, or substantially all, federal income taxes. Accordingly, no provision for federal income taxes was required.
The Fund’s income and federal excise tax returns and all financial records supporting those returns for the prior three fiscal years are subject to examination by the federal and Delaware revenue authorities. Management has analyzed the Fund’s tax positions taken on federal, state, and foreign tax returns for all open tax years and does not believe that there are any uncertain tax positions that require recognition of a tax liability.
As of July 31, 2014, capital loss carryforwards available to offset future net realized capital gains were in the amount of $23,482,402 with $3,137,764 expiring in 2015 and $20,344,638 expiring in 2017.
Class allocations
The separate classes of shares offered by the Fund differ principally in applicable sales charges, distribution, shareholder servicing, and administration fees. Class specific expenses are charged directly to that share class. Investment income, common expenses, and realized and unrealized gains (losses) on investments are allocated daily to each class of shares based on the relative proportion of net assets of each class.
3. FAIR VALUATION MEASUREMENTS
Fair value measurements of investments are determined within a framework that has established a fair value hierarchy based upon the various data inputs utilized in determining the value of the Fund’s investments. The three-level hierarchy gives the highest priority to unadjusted quoted prices in active markets for identical assets or liabilities (Level 1) and the lowest priority to significant unobservable inputs (Level 3). The Fund’s investments are classified within the fair value hierarchy based on the lowest level of input that is significant to the fair value measurement. The inputs are summarized into three broad levels as follows:
| n | | Level 1 – quoted prices in active markets for identical securities |
| n | | Level 2 – other significant observable inputs (including quoted prices for similar securities, interest rates, prepayment speeds, credit risk, use of amortized cost, etc.) |
| n | | Level 3 – significant unobservable inputs (including the Fund’s own assumptions in determining the fair value of investments) |
The inputs or methodologies used for valuing investments in securities are not necessarily an indication of the risk associated with investing in those securities.
| | | | | | |
| Notes to financial statements (unaudited) | | Wells Fargo Advantage Intrinsic Value Fund | | | 23 | |
The following is a summary of the inputs used in valuing the Fund’s assets and liabilities as of January 31, 2015:
| | | | | | | | | | | | | | | | |
| | | Quoted prices
(Level 1) | | | Other significant
observable inputs
(Level 2) | | | Significant
unobservable inputs
(Level 3) | | | Total | |
Assets | | | | | | | | | | | | | | | | |
Investments in: | | | | | | | | | | | | | | | | |
| | | | |
Common stocks | | | | | | | | | | | | | | | | |
Consumer discretionary | | $ | 148,267,289 | | | $ | 0 | | | $ | 0 | | | $ | 148,267,289 | |
Consumer staples | | | 129,244,585 | | | | 0 | | | | 0 | | | | 129,244,585 | |
Energy | | | 99,274,301 | | | | 0 | | | | 0 | | | | 99,274,301 | |
Financials | | | 219,723,614 | | | | 0 | | | | 0 | | | | 219,723,614 | |
Health care | | | 137,201,100 | | | | 0 | | | | 0 | | | | 137,201,100 | |
Industrials | | | 142,424,671 | | | | 0 | | | | 0 | | | | 142,424,671 | |
Information technology | | | 162,346,152 | | | | 0 | | | | 0 | | | | 162,346,152 | |
Materials | | | 22,756,651 | | | | 0 | | | | 0 | | | | 22,756,651 | |
Telecommunication services | | | 22,450,009 | | | | 0 | | | | 0 | | | | 22,450,009 | |
Utilities | | | 55,318,347 | | | | 0 | | | | 0 | | | | 55,318,347 | |
| | | | |
Short-term investments | | | | | | | | | | | | | | | | |
Investment companies | | | 26,856,448 | | | | 2,244,000 | | | | 0 | | | | 29,100,448 | |
Total assets | | $ | 1,165,863,167 | | | $ | 2,244,000 | | | $ | 0 | | | $ | 1,168,107,167 | |
The Fund recognizes transfers between levels within the fair value hierarchy at the end of the reporting period. At January 31, 2015, common stocks with a market value of $13,282,085 were transferred from Level 2 to Level 1 because of an increase in the market activity of these securities. At January 31, 2015, there were no transfers into/out of Level 3.
4. TRANSACTIONS WITH AFFILIATES
Advisory fee
The Trust has entered into an advisory contract with Funds Management, an indirect wholly owned subsidiary of Wells Fargo & Company (“Wells Fargo”). The adviser is responsible for implementing investment policies and guidelines and for supervising the subadviser, who is responsible for day-to-day portfolio management of the Fund.
Pursuant to the contract, Funds Management is entitled to receive an annual advisory fee starting at 0.65% and declining to 0.475% as the average daily net assets of the Fund increase. Prior to December 1, 2014, Funds Management was entitled to receive an annual advisory fee which started at 0.65% and declined to 0.55% as the average daily net assets of the Fund increased. For the six months ended January 31, 2015, the advisory fee was equivalent to an annual rate of 0.63% of the Fund’s average daily net assets.
Funds Management has retained the services of a subadviser to provide daily portfolio management to the Fund. The fee for subadvisory services is borne by Funds Management. Metropolitan West Capital Management, LLC, an affiliate of Funds Management and an indirect wholly owned subsidiary of Wells Fargo, is the subadviser to the Fund and is entitled to receive a fee from Funds Management at an annual rate starting at 0.35% and declining to 0.25% as the average daily net assets of the Fund increase.
Administration fees
The Trust has entered into an administration agreement with Funds Management. Under this agreement, for providing administrative services, which includes paying fees and expenses for services provided by the transfer agent, sub-transfer agents, omnibus account servicers and record-keepers, Funds Management is entitled to receive from the Fund an annual fund level administration fee starting at 0.05% and declining to 0.03% as the average daily net assets of the Fund increase and a class level administration fee which is calculated based on the average daily net assets of each class as follows:
| | | | |
| | | Class level
administration fee | |
Class A, Class B, Class C, Class R | | | 0.26 | % |
Class R4, Institutional Class | | | 0.08 | |
Class R6 | | | 0.03 | |
Administrator Class | | | 0.10 | |
| | | | |
| 24 | | Wells Fargo Advantage Intrinsic Value Fund | | Notes to financial statements (unaudited) |
Funds Management has contractually waived and/or reimbursed advisory and administration fees to the extent necessary to maintain certain net operating expense ratios for the Fund. Waiver of fees and/or reimbursement of expenses by Funds Management were made first from fund level expenses on a proportionate basis and then from class specific expenses. Funds Management has committed through November 30, 2015 to waive fees and/or reimburse expenses to the extent necessary to cap the Fund’s expenses at 1.16% for Class A shares, 1.91% for Class B shares, 1.91% for Class C shares, 1.41% for Class R shares, 0.80% for Class R4 shares, 0.65% for Class R6 shares, 0.95% for Administrator Class shares, and 0.70% for Institutional Class shares. After this time, the cap may be increased or the commitment to maintain the cap may be terminated only with the approval of the Board of Trustees.
Distribution fees
The Trust has adopted a Distribution Plan for Class B, Class C, and Class R shares of the Fund pursuant to Rule 12b-1 under the 1940 Act. Distribution fees are charged to Class B, Class C, and Class R shares and paid to Wells Fargo Funds Distributor, LLC (“Funds Distributor”), the principal underwriter, at an annual rate of 0.75% of the average daily net assets of Class B and Class C shares and 0.25% of the average daily net assets for Class R shares.
In addition, Funds Distributor is entitled to receive the front-end sales charge from the purchase of Class A shares and a contingent deferred sales charge on the redemption of certain shares. Funds Distributor is also entitled to receive the contingent deferred sales charges from redemptions of Class B and Class C shares. For the six months ended January 31, 2015, Funds Distributor received $8,128 from the sale of Class A shares and $10 in contingent deferred sales charges from redemptions of Class B shares.
Shareholder servicing fees
The Trust has entered into contracts with one or more shareholder servicing agents, whereby Class A, Class B, Class C, Class R, and Administrator Class of the Fund is charged a fee at an annual rate of 0.25% of the average daily net assets of each respective class. Class R4 shares are charged a fee at an annual rate of 0.10% of its average daily net assets.
A portion of these total shareholder servicing fees were paid to affiliates of Wells Fargo.
5. INVESTMENT PORTFOLIO TRANSACTIONS
Purchases and sales of investments, excluding U.S. government obligations (if any) and short-term securities, for the six months ended January 31, 2015 were $152,864,776 and $214,827,372, respectively.
6. BANK BORROWINGS
The Trust (excluding the money market funds and certain other funds in the Trust) and Wells Fargo Variable Trust are parties to a $150,000,000 revolving credit agreement, whereby the Fund is permitted to use bank borrowings for temporary or emergency purposes, such as to fund shareholder redemption requests. Interest under the credit agreement is charged to the Fund based on a borrowing rate equal to the higher of the Federal Funds rate in effect on that day plus 1.25% or the overnight LIBOR rate in effect on that day plus 1.25%. In addition, an annual commitment fee equal to 0.10% of the unused balance is allocated to each participating fund. For the six months ended January 31, 2015, the Fund paid $898 in commitment fees.
For the six months ended January 31, 2015, there were no borrowings by the Fund under the agreement.
7. INDEMNIFICATION
Under the Trust’s organizational documents, the officers and Trustees are indemnified against certain liabilities that may arise out of performance of their duties to the Trust. Additionally, in the normal course of business, the Trust may enter into contracts with service providers that contain a variety of indemnification clauses. The Trust’s maximum exposure under these arrangements is dependent on future claims that may be made against the Fund and, therefore, cannot be estimated.
| | | | | | |
| Other information (unaudited) | | Wells Fargo Advantage Intrinsic Value Fund | | | 25 | |
PROXY VOTING INFORMATION
A description of the policies and procedures that the Fund uses to determine how to vote proxies relating to portfolio securities, in addition to information regarding how the Fund voted proxies relating to portfolio securities during the most recent 12-month period ended June 30, is available on the Fund’s website at wellsfargoadvantagefunds.com or by visiting the SEC website at sec.gov.
PORTFOLIO HOLDINGS INFORMATION
The complete portfolio holdings for the Fund are publicly available monthly on the Fund’s website (wellsfargoadvantagefunds.com), on a one-month delayed basis. In addition, top ten holdings information (excluding derivative positions) for the Fund is publicly available on the Fund’s website on a monthly, seven-day or more delayed basis. The Fund files its complete schedule of portfolio holdings with the SEC for the first and third quarters of each fiscal year on Form N-Q, which is available by visiting the SEC website at sec.gov. In addition, the Fund’s Form N-Q may be reviewed and copied at the SEC’s Public Reference Room in Washington, DC, and at regional offices in New York City, at 233 Broadway, and in Chicago, at 175 West Jackson Boulevard, Suite 900. Information about the Public Reference Room may be obtained by calling 1-800-SEC-0330.
| | | | |
| 26 | | Wells Fargo Advantage Intrinsic Value Fund | | Other information (unaudited) |
BOARD OF TRUSTEES AND OFFICERS
Each of the Trustees and Officers1 listed in the table below acts in identical capacities for each fund in the Wells Fargo Advantage family of funds, which consists of 134 mutual funds comprising the Wells Fargo Funds Trust, Wells Fargo Variable Trust, Wells Fargo Master Trust and four closed-end funds (collectively the “Fund Complex”). This table should be read in conjunction with the Prospectus and the Statement of Additional Information2. The mailing address of each Trustee and Officer is 525 Market Street, 12th Floor, San Francisco, CA 94105. Each Trustee and Officer serves an indefinite term, however, each Trustee serves such term until reaching the mandatory retirement age established by the Trustees.
Independent Trustees
| | | | | | |
Name and
year of birth | | Position held and
length of service* | | Principal occupations during past five years or longer | | Other
directorships during
past five years |
William R. Ebsworth
(Born 1957) | | Trustee, since 2015** | | Retired. From 1984 to 2013, equities analyst, portfolio manager, research director at Fidelity Management and Research Company and retired in 2013 as Chief Investment Officer of Fidelity Strategic Advisers, Inc. in Boston, Tokyo, and Hong Kong where he led a team of investment professionals managing client assets. Prior thereto, Board member of Hong Kong Securities Clearing Co., Hong Kong Options Clearing Corp., the Thailand International Fund, Ltd., Fidelity Investments Life Insurance Company, and Empire Fidelity Investments Life Insurance Company. Mr. Ebsworth is an Adjunct Lecturer, Finance, at Babson College and a Chartered Financial Analyst. | | Asset Allocation Trust |
Jane A. Freeman
(Born 1953) | | Trustee, since 2015** | | Retired. From 2012 to 2014 and 1999 to 2008, Chief Financial Officer of Scientific Learning Corporation. From 2008 to 2012, Ms. Freeman provided consulting services related to strategic business projects. Prior thereto, Portfolio Manager at Rockefeller & Co. and Scudder, Stevens & Clark. Board member of the Harding Loevner Funds from 1996 to 2014, serving as both Lead Independent Director and chair of the Audit Committee. Board member of the Russell Exchange Traded Funds Trust from 2011 to 2012 and the chair of the Audit Committee. Ms. Freeman is a Chartered Financial Analyst (inactive), Chair of Taproot Foundation (non-profit organization) and a Board Member of Ruth Bancroft Garden (non-profit organization). | | Asset Allocation Trust |
Peter G. Gordon
(Born 1942) | | Trustee, since 1998; Chairman, since 2005 | | Co-Founder, Retired Chairman, President and CEO of Crystal Geyser Water Company. Trustee Emeritus, Colby College. | | Asset Allocation Trust |
Isaiah Harris, Jr.
(Born 1952) | | Trustee, since 2009 | | Retired. Chairman of the Board of CIGNA Corporation since 2009, and Director since 2005. From 2003 to 2011, Director of Delux Corporation. Prior thereto, President and CEO of BellSouth Advertising and Publishing Corp. from 2005 to 2007, President and CEO of BellSouth Enterprises from 2004 to 2005 and President of BellSouth Consumer Services from 2000 to 2003. Emeritus member of the Iowa State University Foundation Board of Governors. Emeritus Member of the Advisory Board of Iowa State University School of Business. Advisory Board Member, Palm Harbor Academy. Mr. Harris is a certified public accountant. | | CIGNA Corporation; Asset Allocation Trust |
Judith M. Johnson
(Born 1949) | | Trustee, since 2008;
Audit Committee Chairman, since 2008 | | Retired. Prior thereto, Chief Executive Officer and Chief Investment Officer of Minneapolis Employees Retirement Fund from 1996 to 2008. Ms. Johnson is an attorney, certified public accountant and a certified managerial accountant. | | Asset Allocation Trust |
David F. Larcker
(Born 1950) | | Trustee, since 2009 | | James Irvin Miller Professor of Accounting at the Graduate School of Business, Stanford University, Morgan Stanley Director of the Center for Leadership Development and Research and Senior Faculty of The Rock Center for Corporate Governance since 2006. From 2005 to 2008, Professor of Accounting at the Graduate School of Business, Stanford University. Prior thereto, Ernst & Young Professor of Accounting at The Wharton School, University of Pennsylvania from 1985 to 2005. | | Asset Allocation Trust |
Olivia S. Mitchell
(Born 1953) | | Trustee, since 2006 | | International Foundation of Employee Benefit Plans Professor, Wharton School of the University of Pennsylvania since 1993. Director of Wharton’s Pension Research Council and Boettner Center on Pensions & Retirement Research, and Research Associate at the National Bureau of Economic Research. Previously, Cornell University Professor from 1978 to 1993. | | Asset Allocation Trust |
| | | | | | |
| Other information (unaudited) | | Wells Fargo Advantage Intrinsic Value Fund | | | 27 | |
| | | | | | |
Name and
year of birth | | Position held and
length of service* | | Principal occupations during past five years or longer | | Other
directorships during
past five years |
Timothy J. Penny
(Born 1951) | | Trustee, since 1996 | | President and Chief Executive Officer of Southern Minnesota Initiative Foundation, a non-profit organization, since 2007 and Senior Fellow at the Humphrey Institute Policy Forum at the University of Minnesota since 1995. Member of the Board of Trustees of NorthStar Education Finance, Inc., a non-profit organization, since 2007. | | Asset Allocation Trust |
Michael S. Scofield
(Born 1943) | | Trustee, since 2010 | | Served on the Investment Company Institute’s Board of Governors and Executive Committee from 2008-2011 as well the Governing Council of the Independent Directors Council from 2006-2011 and the Independent Directors Council Executive Committee from 2008-2011. Chairman of the IDC from 2008-2010. Institutional Investor (Fund Directions) Trustee of Year in 2007. Trustee of the Evergreen Funds complex (and its predecessors) from 1984 to 2010. Chairman of the Evergreen Funds from 2000-2010. Former Trustee of the Mentor Funds. Retired Attorney, Law Offices of Michael S. Scofield. | | Asset Allocation Trust |
Donald C. Willeke
(Born 1940) | | Trustee, since 1996 | | Principal of the law firm of Willeke & Daniels. General Counsel of the Minneapolis Employees Retirement Fund from 1984 until its consolidation into the Minnesota Public Employees Retirement Association on June 30, 2010. Director and Vice Chair of The Tree Trust (non-profit corporation). Director of the American Chestnut Foundation (non-profit corporation). | | Asset Allocation Trust |
| * | Length of service dates reflect the Trustee’s commencement of service with the Trust’s predecessor entities, where applicable. |
| ** | William R. Ebsworth and Jane A. Freeman each became a Trustee effective January 1, 2015. |
Officers
| | | | | | |
Name and
year of birth | | Position held and
length of service | | Principal occupations during past five years or longer | | |
Karla M. Rabusch
(Born 1959) | | President, since 2003 | | Executive Vice President of Wells Fargo Bank, N.A. and President of Wells Fargo Funds Management, LLC since 2003. | | |
Jeremy DePalma1
(Born 1974) | | Treasurer, since 2012 | | Senior Vice President of Wells Fargo Funds Management, LLC since 2009. Senior Vice President of Evergreen Investment Management Company, LLC from 2008 to 2010. Vice President, Evergreen Investment Services, Inc. from 2004 to 2007. Head of the Fund Reporting and Control Team within Fund Administration from 2005 to 2010. | | |
C. David Messman
(Born 1960) | | Secretary, since 2000; Chief Legal Officer, since 2003 | | Assistant General Counsel of Wells Fargo Bank, N.A. since 2013 and Vice President and Managing Counsel of Wells Fargo Bank N.A. from 1996 to 2013. Senior Vice President and Secretary of Wells Fargo Funds Management, LLC since 2001. | | |
Debra Ann Early
(Born 1964) | | Chief Compliance Officer, since 2007 | | Senior Vice President of Wells Fargo Funds Management, LLC since 2007 and Chief Compliance Officer from 2007 to 2014. Chief Compliance Officer of Parnassus Investments from 2005 to 2007. Chief Financial Officer of Parnassus Investments from 2004 to 2007 and Senior Audit Manager of PricewaterhouseCoopers LLP from 1998 to 2004. | | |
David Berardi
(Born 1975) | | Assistant Treasurer, since 2009 | | Vice President of Wells Fargo Funds Management, LLC since 2009. Vice President of Evergreen Investment Management Company, LLC from 2008 to 2010. Assistant Vice President of Evergreen Investment Services, Inc. from 2004 to 2008. Manager of Fund Reporting and Control for Evergreen Investment Management Company, LLC from 2004 to 2010. | | |
| 1 | Jeremy DePalma acts as Treasurer of 61 funds and Assistant Treasurer of 73 funds in the Fund Complex. |
| 2 | The Statement of Additional Information includes additional information about the Trustees and is available, without charge, upon request, by calling 1-800-222-8222 or by visiting the website at wellsfargoadvantagefunds.com. |
| | | | |
| 28 | | Wells Fargo Advantage Intrinsic Value Fund | | List of abbreviations |
The following is a list of common abbreviations for terms and entities that may have appeared in this report.
| ACA | — ACA Financial Guaranty Corporation |
| ADR | — American depositary receipt |
| ADS | — American depositary shares |
| AGC | — Assured Guaranty Corporation |
| AGM | — Assured Guaranty Municipal |
| Ambac | — Ambac Financial Group Incorporated |
| AMT | — Alternative minimum tax |
| BAN | — Bond anticipation notes |
| BHAC | — Berkshire Hathaway Assurance Corporation |
| CAB | — Capital appreciation bond |
| CCAB | — Convertible capital appreciation bond |
| CDA | — Community Development Authority |
| CDO | — Collateralized debt obligation |
| DRIVER | — Derivative inverse tax-exempt receipts |
| DW&P | — Department of Water & Power |
| DWR | — Department of Water Resources |
| ECFA | — Educational & Cultural Facilities Authority |
| EDA | — Economic Development Authority |
| EDFA | — Economic Development Finance Authority |
| ETF | — Exchange-traded fund |
| FDIC | — Federal Deposit Insurance Corporation |
| FFCB | — Federal Farm Credit Banks |
| FGIC | — Financial Guaranty Insurance Corporation |
| FHA | — Federal Housing Administration |
| FHLB | — Federal Home Loan Bank |
| FHLMC | — Federal Home Loan Mortgage Corporation |
| FICO | — The Financing Corporation |
| FNMA | — Federal National Mortgage Association |
| GDR | — Global depositary receipt |
| GNMA | — Government National Mortgage Association |
| HCFR | — Healthcare facilities revenue |
| HEFA | — Health & Educational Facilities Authority |
| HEFAR | — Higher education facilities authority revenue |
| HFA | — Housing Finance Authority |
| HFFA | — Health Facilities Financing Authority |
| HUD | — Department of Housing and Urban Development |
| IDA | — Industrial Development Authority |
| IDAG | — Industrial Development Agency |
| KRW | — Republic of Korea won |
| LIBOR | — London Interbank Offered Rate |
| LIFER | — Long Inverse Floating Exempt Receipts |
| LLC | — Limited liability company |
| LLLP | — Limited liability limited partnership |
| LLP | — Limited liability partnership |
| MBIA | — Municipal Bond Insurance Association |
| MFHR | — Multifamily housing revenue |
| MSTR | — Municipal securities trust receipts |
| MUD | — Municipal Utility District |
| National | — National Public Finance Guarantee Corporation |
| PCFA | — Pollution Control Financing Authority |
| PCL | — Public Company Limited |
| PCR | — Pollution control revenue |
| PFA | — Public Finance Authority |
| PFFA | — Public Facilities Financing Authority |
| PFOTER | — Puttable floating option tax-exempt receipts |
| plc | — Public limited company |
| PUTTER | — Puttable tax-exempt receipts |
| R&D | — Research & development |
| Radian | — Radian Asset Assurance |
| RAN | — Revenue anticipation notes |
| RDA | — Redevelopment Authority |
| RDFA | — Redevelopment Finance Authority |
| REIT | — Real estate investment trust |
| ROC | — Reset option certificates |
| SAVRS | — Select auction variable rate securities |
| SBA | — Small Business Authority |
| SFHR | — Single-family housing revenue |
| SFMR | — Single-family mortgage revenue |
| SPA | — Standby purchase agreement |
| SPDR | — Standard & Poor’s Depositary Receipts |
| SPEAR | — Short Puttable Exempt Adjustable Receipts |
| STRIPS | — Separate trading of registered interest and |
| TAN | — Tax anticipation notes |
| TIPS | — Treasury inflation-protected securities |
| TRAN | — Tax revenue anticipation notes |
| TTFA | — Transportation Trust Fund Authority |
| TVA | — Tennessee Valley Authority |


For more information
More information about Wells Fargo Advantage Funds is available free upon request. To obtain literature, please write, email, visit the Fund’s website, or call:
Wells Fargo Advantage Funds
P.O. Box 8266
Boston, MA 02266-8266
Email: wfaf@wellsfargo.com
Website: wellsfargoadvantagefunds.com
Individual investors: 1-800-222-8222
Retail investment professionals: 1-888-877-9275
Institutional investment professionals: 1-866-765-0778
This report and the financial statements contained herein are submitted for the general information of the shareholders of Wells Fargo Advantage Funds. If this report is used for promotional purposes, distribution of the report must be accompanied or preceded by a current prospectus. Before investing, please consider the investment objectives, risks, charges, and expenses of the investment. For a current prospectus and, if available, a summary prospectus, containing this information, call 1-800-222-8222 or visit the Fund’s website at wellsfargoadvantagefunds.com. Read the prospectus carefully before you invest or send money.
Wells Fargo Funds Management, LLC, a wholly owned subsidiary of Wells Fargo & Company, provides investment advisory and administrative services for Wells Fargo Advantage Funds. Other affiliates of Wells Fargo & Company provide subadvisory and other services for the Funds. The Funds are distributed by Wells Fargo Funds Distributor, LLC, Member FINRA/SIPC, an affiliate of Wells Fargo & Company.
NOT FDIC INSURED ¡ NO BANK GUARANTEE ¡ MAY LOSE VALUE
© 2015 Wells Fargo Funds Management, LLC. All rights reserved.
| | |
 | | 231600 03-15 SA207/SAR207 01-15 |

Wells Fargo Advantage Large Cap Core Fund

Semi-Annual Report
January 31, 2015

Reduce clutter. Save trees.
Sign up for electronic delivery of prospectuses and shareholder reports at wellsfargo.com/advantagedelivery
Contents
The views expressed and any forward-looking statements are as of January 31, 2015, unless otherwise noted, and are those of the Fund managers and/or Wells Fargo Funds Management, LLC. Discussions of individual securities, or the markets generally, or any Wells Fargo Advantage Fund are not intended as individual recommendations. Future events or results may vary significantly from those expressed in any forward-looking statements; the views expressed are subject to change at any time in response to changing circumstances in the market. Wells Fargo Funds Management, LLC and the Fund disclaim any obligation to publicly update or revise any views expressed or forward-looking statements.
NOT FDIC INSURED ¡ NO BANK GUARANTEE ¡ MAY LOSE VALUE
| | | | |
| 2 | | Wells Fargo Advantage Large Cap Core Fund | | Letter to shareholders (unaudited) |

Karla M. Rabusch
President
Wells Fargo Advantage Funds
As the U.S. churned forward, major economies elsewhere in the world faced significant ongoing challenges.
Dear Valued Shareholder:
We are pleased to offer you this semi-annual report for the Wells Fargo Advantage Large Cap Core Fund for the six-month period that ended January 31, 2015. Generally improving U.S. economic data helped drive a positive return for U.S. stocks for the reporting period (as measured by the S&P 500 Index1); in contrast, many economies and markets elsewhere in the world faced ongoing challenges.
Positive U.S. economic data, but increased tensions abroad, led to heightened volatility during the third quarter of 2014.
When the reporting period began on August 1, 2014, the U.S. stock market was experiencing a series of surges interrupted by bouts of volatility as interest-rate concerns in the U.S. and increased tensions abroad triggered heightened investor uncertainty. An escalating Russia/Ukraine situation and a growing perception that the U.S. Federal Reserve (Fed) would raise short-term interest rates sooner than expected caused investors to pull back near the end of July. As a result, the S&P 500 Index dropped into negative territory for July’s monthly return. However, August brought a bounce-back; the S&P 500 Index delivered its largest monthly gain since February 2014 on a string of positive economic news, led by an upwardly revised 4.2% estimate of second-quarter 2014 gross domestic product (GDP) growth. Then, in September, stock market volatility increased as positive economic data became overshadowed at times by growing discomfort over escalating tensions in Ukraine and the Middle East. Slowing growth in Europe and China also concerned investors. Ultimately, U.S. stocks ended the third quarter up slightly overall, buoyed largely by another upward revision of second-quarter GDP growth to 4.6%. Strong corporate earnings also contributed to market gains.
The fourth quarter of 2014 brought continued improvement in the U.S.; international economies remained challenged.
Strong fourth-quarter results by the U.S. stock market helped the S&P 500 Index deliver more than 50 record closes in 2014. The last several, in December, were spurred by investor optimism following Fed Chair Janet Yellen’s comment that the Fed would be patient in its timing of an interest-rate increase. U.S. stocks also were boosted by positive economic data. November’s 5.8% unemployment rate was down from 7.0% a year earlier, and the number of jobs being added continued to expand, keeping U.S. employers on pace to hire nearly three million workers during 2014. In addition, the U.S. economy’s third-quarter growth rate was revised upward during the quarter, to 5.0%—its fastest pace in 11 years. Meanwhile, U.S. companies continued to report strong earnings. The steadily brightening U.S. economy energized consumers, who were further buoyed by much lower prices at the gasoline pump. During the fourth quarter, gasoline prices fell to their lowest levels in five years, according to the American Automobile Association.
As the U.S. churned forward, major economies elsewhere in the world faced significant ongoing challenges. In China, where growth had been slowing for some time, government regulators in December announced changes being made in an effort to stimulate growth. In Japan, which slid back into recession in the third quarter of 2014, Prime Minister Abe gained approval in late December for roughly $29 billion in fresh stimulus to help the economy. In the eurozone, growth remained sluggish, and member countries continued to face an environment of low demand, high unemployment, and weak business investment. This situation
| 1 | The S&P 500 Index consists of 500 stocks chosen for market size, liquidity, and industry group representation. It is a market-value-weighted index with each stock’s weight in the index proportionate to its market value. You cannot invest directly in an index. |
| | | | | | |
| Letter to shareholders (unaudited) | | Wells Fargo Advantage Large Cap Core Fund | | | 3 | |
was exacerbated in December by renewed concerns about Greece after its parliament failed to avert a general election that could jeopardize the terms of the country’s financial agreement with its international creditors. In Russia, the economy contracted for the first time since October 2009 as the country struggled under the weight of slumping oil prices, international sanctions, and massive outflows of capital.
Market volatility increased in January 2015.
Markets fluctuated in January as investors reacted to geopolitical developments and new economic data. Mid-month, the World Bank lowered its outlook for global growth based on deepening problems in the eurozone and emerging markets, stating that a strengthening U.S. economy could not, by itself, support the global economy. Later in January, Greek voters gave control of their government to opposition party Syriza, which promised to end austerity and insisted that Greece’s massive debt be renegotiated. In the U.S., various data released in January, such as consumer confidence and December’s jobless rate, showed improvement. On the last trading day of the month, however, investors learned that fourth-quarter 2014 U.S. economic growth was estimated at 2.6%, which was below consensus and lower than the 4.6% and 5.0% growth rates, respectively, for the second and third quarters of 2014.
Don’t let short-term uncertainty derail long-term investment goals.
Periods of uncertainty can present challenges, but experience has taught us that maintaining long-term investment goals can be an effective way to plan for the future. To help you create a sound strategy based on your personal goals and risk tolerance, Wells Fargo Advantage Funds offers more than 100 mutual funds spanning a wide range of asset classes and investment styles. Although diversification cannot guarantee an investment profit or prevent losses, we believe it can be an effective way to manage investment risk and potentially smooth out overall portfolio performance. We encourage investors to know their investments and to understand that appropriate levels of risk-taking may unlock opportunities.
Thank you for choosing to invest with Wells Fargo Advantage Funds. We appreciate your confidence in us and remain committed to helping you meet your financial needs. For current information about your fund investments, contact your investment professional, visit our website at wellsfargoadvantagefunds.com, or call us directly at 1-800-222-8222. We are available 24 hours a day, 7 days a week.
Sincerely,

Karla M. Rabusch
President
Wells Fargo Advantage Funds
We encourage investors to know their investments and to understand that appropriate levels of risk-taking may unlock opportunities.
| | | | |
| 4 | | Wells Fargo Advantage Large Cap Core Fund | | Performance highlights (unaudited) |
Investment objective
The Fund seeks long-term capital appreciation.
Adviser
Wells Fargo Funds Management, LLC
Subadviser
Golden Capital Management, LLC
Portfolio manager
Jeff C. Moser, CFA
Average annual total returns1 (%) as of January 31, 2015
| | | | | | | | | | | | | | | | | | | | | | | | | | | | | | | | | | |
| | | | | Including sales charge | | | Excluding sales charge | | | Expense ratios2 (%) | |
| | | Inception date | | 1 year | | | 5 year | | | Since
inception | | | 1 year | | | 5 year | | | Since
inception | | | Gross | | | Net3 | |
| Class A (EGOAX) | | 12-17-2007 | | | 6.96 | | | | 14.43 | | | | 5.59 | | | | 13.50 | | | | 15.80 | | | | 6.47 | | | | 1.29 | | | | 1.14 | |
| Class C (EGOCX) | | 12-17-2007 | | | 11.66 | | | | 14.92 | | | | 5.70 | | | | 12.66 | | | | 14.92 | | | | 5.70 | | | | 2.04 | | | | 1.89 | |
| Administrator Class (WFLLX) | | 7-16-2010 | | | – | | | | – | | | | – | | | | 13.81 | | | | 16.11 | | | | 6.67 | | | | 1.13 | | | | 0.90 | |
| Institutional Class (EGOIX) | | 12-17-2007 | | | – | | | | – | | | | – | | | | 14.08 | | | | 16.36 | | | | 6.91 | | | | 0.86 | | | | 0.66 | |
| Investor Class (WFLNX) | | 7-16-2010 | | | – | | | | – | | | | – | | | | 13.49 | | | | 15.71 | | | | 6.32 | | | | 1.35 | | | | 1.20 | |
| S&P 500 Index4 | | – | | | – | | | | – | | | | – | | | | 14.22 | | | | 15.60 | | | | 6.93 | | | | – | | | | – | |
Figures quoted represent past performance, which is no guarantee of future results, and do not reflect taxes that a shareholder may pay on fund distributions or the redemption of fund shares. Investment return and principal value of an investment will fluctuate so that an investor’s shares, when redeemed, may be worth more or less than their original cost. Performance shown without sales charges would be lower if sales charges were reflected. Current performance may be lower or higher than the performance data quoted, which assumes the reinvestment of dividends and capital gains. Current month-end performance is available on the Fund’s website, wellsfargoadvantagefunds.com.
Index returns do not include transaction costs associated with buying and selling securities, any mutual fund fees or expenses, or any taxes. It is not possible to invest directly in an index.
For Class A shares, the maximum front-end sales charge is 5.75%. For Class C shares, the maximum contingent deferred sales charge is 1.00%. Performance including a contingent deferred sales charge assumes the sales charge for the corresponding time period. Administrator Class, Institutional Class, and Investor Class shares are sold without a front-end sales charge or contingent deferred sales charge.
Stock values fluctuate in response to the activities of individual companies and general market and economic conditions. Certain investment strategies tend to increase the total risk of an investment (relative to the broader market). The Fund is exposed to foreign investment risk. Consult the Fund’s prospectus for additional information on these and other risks.
Please see footnotes on page 5.
| | | | | | |
| Performance highlights (unaudited) | | Wells Fargo Advantage Large Cap Core Fund | | | 5 | |
| | | | |
| Ten largest equity holdings5 (%) as of January 31, 2015 | |
CVS Health Corporation | | | 2.86 | |
Southwest Airlines Company | | | 2.76 | |
McKesson Corporation | | | 2.58 | |
Apple Incorporated | | | 2.46 | |
Delta Air Lines Incorporated | | | 2.42 | |
Gilead Sciences Incorporated | | | 2.34 | |
Hanesbrands Incorporated | | | 2.31 | |
Northrop Grumman Corporation | | | 2.31 | |
The Home Depot Incorporated | | | 2.30 | |
Spirit AeroSystems Holdings Incorporated Class A | | | 2.29 | |
|
| Sector distribution6 as of January 31, 2015 |
|
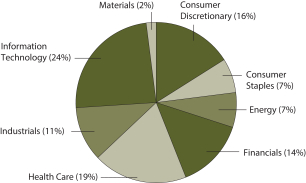 |
| 1 | Historical performance shown for Administrator Class and Investor Class shares prior to their inception reflects the performance of Institutional Class shares, adjusted to reflect higher expenses applicable to Administrator Class and Investor Class shares. Historical performance shown for all classes of the Fund prior to July 19, 2010, is based on the performance of the Fund’s predecessor, Evergreen Golden Large Cap Core Fund. |
| 2 | Reflects the expense ratios as stated in the most recent prospectuses. The expense ratios shown are subject to change and may differ from the annualized expense ratios shown in the financial highlights of this report. |
| 3 | The Adviser has committed through November 30, 2015, to waive fees and/or reimburse expenses to the extent necessary to cap the Fund’s Total Annual Fund Operating Expenses After Fee Waiver, excluding certain expenses, at the amounts shown. After this time, the cap may be increased or the commitment to maintain the cap may be terminated only with the approval of the Board of Trustees. Brokerage commissions, stamp duty fees, interest, taxes, acquired fund fees and expenses, and extraordinary expenses are excluded from the cap. Without this cap, the Fund’s returns would have been lower. |
| 4 | The S&P 500 Index consists of 500 stocks chosen for market size, liquidity, and industry group representation. It is a market-value weighted index with each stock’s weight in the index proportionate to its market value. You cannot invest directly in an index. |
| 5 | The ten largest equity holdings are calculated based on the value of the securities divided by total net assets of the Fund. Holdings are subject to change and may have changed since the date specified. |
| 6 | Amounts are calculated based on the total long-term investments of the Fund. These percentages are subject to change and may have changed since the date specified. |
| | | | |
| 6 | | Wells Fargo Advantage Large Cap Core Fund | | Fund expenses (unaudited) |
As a shareholder of the Fund, you incur two types of costs: (1) transaction costs, including sales charges (loads) on purchase payments and contingent deferred sales charges (if any) on redemptions and (2) ongoing costs, including management fees, distribution (12b-1) and/or shareholder service fees, and other Fund expenses. This example is intended to help you understand your ongoing costs (in dollars) of investing in the Fund and to compare these costs with the ongoing costs of investing in other mutual funds.
The example is based on an investment of $1,000 invested at the beginning of the six-month period and held for the entire period from August 1, 2014 to January 31, 2015.
Actual expenses
The “Actual” line of the table below provides information about actual account values and actual expenses. You may use the information in this line, together with the amount you invested, to estimate the expenses that you paid over the period. Simply divide your account value by $1,000 (for example, an $8,600 account value divided by $1,000 = 8.6), then multiply the result by the number in the “Actual” line under the heading entitled “Expenses paid during period” for your applicable class of shares to estimate the expenses you paid on your account during this period.
Hypothetical example for comparison purposes
The “Hypothetical” line of the table below provides information about hypothetical account values and hypothetical expenses based on the Fund’s actual expense ratio and an assumed rate of return of 5% per year before expenses, which is not the Fund’s actual return. The hypothetical account values and expenses may not be used to estimate the actual ending account balance or expenses you paid for the period. You may use this information to compare the ongoing costs of investing in the Fund and other funds. To do so, compare this 5% hypothetical example with the 5% hypothetical examples that appear in the shareholder reports of the other funds.
Please note that the expenses shown in the table are meant to highlight your ongoing costs only and do not reflect any transactional costs, such as sales charges (loads) and contingent deferred sales charges. Therefore, the “Hypothetical” line of the table is useful in comparing ongoing costs only and will not help you determine the relative total costs of owning different funds. In addition, if these transactional costs were included, your costs would have been higher.
| | | | | | | | | | | | | | | | |
| | | Beginning
account value
8-1-2014 | | | Ending
account value
1-31-2015 | | | Expenses
paid during
the period¹ | | | Net annualized
expense ratio | |
Class A | | | | | | | | | | | | | | | | |
Actual | | $ | 1,000.00 | | | $ | 1,040.45 | | | $ | 5.86 | | | | 1.14 | % |
Hypothetical (5% return before expenses) | | $ | 1,000.00 | | | $ | 1,019.46 | | | $ | 5.80 | | | | 1.14 | % |
Class C | | | | | | | | | | | | | | | | |
Actual | | $ | 1,000.00 | | | $ | 1,035.99 | | | $ | 9.70 | | | | 1.89 | % |
Hypothetical (5% return before expenses) | | $ | 1,000.00 | | | $ | 1,015.68 | | | $ | 9.60 | | | | 1.89 | % |
Administrator Class | | | | | | | | | | | | | | | | |
Actual | | $ | 1,000.00 | | | $ | 1,041.97 | | | $ | 4.63 | | | | 0.90 | % |
Hypothetical (5% return before expenses) | | $ | 1,000.00 | | | $ | 1,020.67 | | | $ | 4.58 | | | | 0.90 | % |
Institutional Class | | | | | | | | | | | | | | | | |
Actual | | $ | 1,000.00 | | | $ | 1,042.22 | | | $ | 3.40 | | | | 0.66 | % |
Hypothetical (5% return before expenses) | | $ | 1,000.00 | | | $ | 1,021.88 | | | $ | 3.36 | | | | 0.66 | % |
Investor Class | | | | | | | | | | | | | | | | |
Actual | | $ | 1,000.00 | | | $ | 1,039.75 | | | $ | 6.17 | | | | 1.20 | % |
Hypothetical (5% return before expenses) | | $ | 1,000.00 | | | $ | 1,019.16 | | | $ | 6.11 | | | | 1.20 | % |
| 1 | Expenses paid is equal to the annualized expense ratio of each class multiplied by the average account value over the period, multiplied by the number of days in the most recent fiscal half-year divided by the number of days in the fiscal year (to reflect the one-half-year period). |
| | | | | | |
| Portfolio of investments—January 31, 2015 (unaudited) | | Wells Fargo Advantage Large Cap Core Fund | | | 7 | |
| | | | | | | | | | | | |
| Security name | | | | | | Shares | | | Value | |
| | | | |
Common Stocks: 97.54% | | | | | | | | | | | | |
| | | | |
Consumer Discretionary: 16.04% | | | | | | | | | | | | |
| | | | |
| Auto Components: 4.25% | | | | | | | | | | | | |
Lear Corporation | | | | | | | 84,721 | | | $ | 8,501,752 | |
Magna International Incorporated Class A | | | | | | | 88,166 | | | | 8,465,699 | |
| | | | |
| | | | | | | | | | | 16,967,451 | |
| | | | | | | | | | | | |
| | | | |
| Automobiles: 1.34% | | | | | | | | | | | | |
Ford Motor Company | | | | | | | 361,911 | | | | 5,323,711 | |
| | | | | | | | | | | | |
| | | | |
| Media: 1.81% | | | | | | | | | | | | |
Comcast Corporation Class A | | | | | | | 136,069 | | | | 7,231,387 | |
| | | | | | | | | | | | |
| | | | |
| Specialty Retail: 6.33% | | | | | | | | | | | | |
Foot Locker Incorporated | | | | | | | 143,072 | | | | 7,614,292 | |
Lowe’s Companies Incorporated | | | | | | | 124,760 | | | | 8,453,738 | |
The Home Depot Incorporated | | | | | | | 87,727 | | | | 9,160,453 | |
| | | | |
| | | | | | | | | | | 25,228,483 | |
| | | | | | | | | | | | |
| | | | |
| Textiles, Apparel & Luxury Goods: 2.31% | | | | | | | | | | | | |
Hanesbrands Incorporated | | | | | | | 82,763 | | | | 9,218,143 | |
| | | | | | | | | | | | |
| | | | |
Consumer Staples: 6.90% | | | | | | | | | | | | |
| | | | |
| Food & Staples Retailing: 2.86% | | | | | | | | | | | | |
CVS Health Corporation | | | | | | | 116,386 | | | | 11,424,450 | |
| | | | | | | | | | | | |
| | | | |
| Food Products: 4.04% | | | | | | | | | | | | |
Archer Daniels Midland Company | | | | | | | 169,026 | | | | 7,881,682 | |
Pinnacle Foods Incorporated | | | | | | | 228,744 | | | | 8,227,922 | |
| | | | |
| | | | | | | | | | | 16,109,604 | |
| | | | | | | | | | | | |
| | | | |
Energy: 6.96% | | | | | | | | | | | | |
| | | | |
| Energy Equipment & Services: 2.50% | | | | | | | | | | | | |
Halliburton Company | | | | | | | 111,259 | | | | 4,449,247 | |
National Oilwell Varco Incorporated | | | | | | | 101,514 | | | | 5,525,407 | |
| | | | |
| | | | | | | | | | | 9,974,654 | |
| | | | | | | | | | | | |
| | | | |
| Oil, Gas & Consumable Fuels: 4.46% | | | | | | | | | | | | |
ConocoPhillips Company | | | | | | | 88,702 | | | | 5,586,452 | |
Exxon Mobil Corporation | | | | | | | 66,221 | | | | 5,789,040 | |
Valero Energy Corporation | | | | | | | 121,372 | | | | 6,418,151 | |
| | | | |
| | | | | | | | | | | 17,793,643 | |
| | | | | | | | | | | | |
| | | | |
Financials: 13.41% | | | | | | | | | | | | |
| | | | |
| Capital Markets: 5.68% | | | | | | | | | | | | |
Ameriprise Financial Incorporated | | | | | | | 62,815 | | | | 7,848,106 | |
Goldman Sachs Group Incorporated | | | | | | | 43,702 | | | | 7,534,662 | |
Morgan Stanley | | | | | | | 215,767 | | | | 7,295,082 | |
| | | | |
| | | | | | | | | | | 22,677,850 | |
| | | | | | | | | | | | |
The accompanying notes are an integral part of these financial statements.
| | | | |
| 8 | | Wells Fargo Advantage Large Cap Core Fund | | Portfolio of investments—January 31, 2015 (unaudited) |
| | | | | | | | | | | | |
| Security name | | | | | | Shares | | | Value | |
| | | | |
| Consumer Finance: 1.68% | | | | | | | | | | | | |
Capital One Financial Corporation | | | | | | | 91,276 | | | $ | 6,682,316 | |
| | | | | | | | | | | | |
| | | | |
| Diversified Financial Services: 3.87% | | | | | | | | | | | | |
Berkshire Hathaway Incorporated Class B † | | | | | | | 56,359 | | | | 8,110,624 | |
Voya Financial Incorporated | | | | | | | 188,031 | | | | 7,335,089 | |
| | | | |
| | | | | | | | | | | 15,445,713 | |
| | | | | | | | | | | | |
| | | | |
| Insurance: 2.18% | | | | | | | | | | | | |
Lincoln National Corporation | | | | | | | 173,932 | | | | 8,693,121 | |
| | | | | | | | | | | | |
| | | | |
Health Care: 18.72% | | | | | | | | | | | | |
| | | | |
| Biotechnology: 6.45% | | | | | | | | | | | | |
Amgen Incorporated | | | | | | | 49,886 | | | | 7,595,642 | |
Biogen Idec Incorporated † | | | | | | | 22,649 | | | | 8,814,085 | |
Gilead Sciences Incorporated † | | | | | | | 88,953 | | | | 9,324,943 | |
| | | | |
| | | | | | | | | | | 25,734,670 | |
| | | | | | | | | | | | |
| | | | |
| Health Care Providers & Services: 8.87% | | | | | | | | | | | | |
Aetna Incorporated | | | | | | | 90,880 | | | | 8,344,602 | |
AmerisourceBergen Corporation | | | | | | | 85,049 | | | | 8,083,907 | |
Centene Corporation † | | | | | | | 79,137 | | | | 8,638,595 | |
McKesson Corporation | | | | | | | 48,407 | | | | 10,293,749 | |
| | | | |
| | | | | | | | | | | 35,360,853 | |
| | | | | | | | | | | | |
| | | | |
| Pharmaceuticals: 3.40% | | | | | | | | | | | | |
Johnson & Johnson | | | | | | | 58,531 | | | | 5,861,294 | |
Merck & Company Incorporated | | | | | | | 127,955 | | | | 7,713,127 | |
| | | | |
| | | | | | | | | | | 13,574,421 | |
| | | | | | | | | | | | |
| | | | |
Industrials: 10.95% | | | | | | | | | | | | |
| | | | |
| Aerospace & Defense: 4.60% | | | | | | | | | | | | |
Northrop Grumman Corporation | | | | | | | 58,642 | | | | 9,203,862 | |
Spirit AeroSystems Holdings Incorporated Class A † | | | | | | | 202,919 | | | | 9,139,472 | |
| | | | |
| | | | | | | | | | | 18,343,334 | |
| | | | | | | | | | | | |
| | | | |
| Airlines: 5.18% | | | | | | | | | | | | |
Delta Air Lines Incorporated | | | | | | | 203,877 | | | | 9,645,421 | |
Southwest Airlines Company | | | | | | | 244,107 | | | | 11,028,754 | |
| | | | |
| | | | | | | | | | | 20,674,175 | |
| | | | | | | | | | | | |
| | | | |
| Machinery: 1.17% | | | | | | | | | | | | |
Trinity Industries Incorporated | | | | | | | 176,580 | | | | 4,674,073 | |
| | | | | | | | | | | | |
| | | | |
Information Technology: 22.78% | | | | | | | | | | | | |
| | | | |
| Communications Equipment: 3.13% | | | | | | | | | | | | |
ARRIS Group Incorporated † | | | | | | | 211,525 | | | | 5,546,186 | |
Cisco Systems Incorporated | | | | | | | 263,498 | | | | 6,947,125 | |
| | | | |
| | | | | | | | | | | 12,493,311 | |
| | | | | | | | | | | | |
The accompanying notes are an integral part of these financial statements.
| | | | | | |
| Portfolio of investments—January 31, 2015 (unaudited) | | Wells Fargo Advantage Large Cap Core Fund | | | 9 | |
| | | | | | | | | | | | | | |
| Security name | | | | | | | Shares | | | Value | |
| | | | |
| Internet Software & Services: 2.01% | | | | | | | | | | | | | | |
Facebook Incorporated Class A † | | | | | | | | | 105,783 | | | $ | 8,029,988 | |
| | | | | | | | | | | | | | |
| | | | |
| IT Services: 1.94% | | | | | | | | | | | | | | |
DST Systems Incorporated | | | | | | | | | 79,817 | | | | 7,718,304 | |
| | | | | | | | | | | | | | |
| | | | |
| Semiconductors & Semiconductor Equipment: 6.03% | | | | | | | | | | | | | | |
Intel Corporation | | | | | | | | | 217,843 | | | | 7,197,533 | |
Marvell Technology Group Limited | | | | | | | | | 544,454 | | | | 8,433,592 | |
Micron Technology Incorporated † | | | | | | | | | 287,454 | | | | 8,412,341 | |
| | | | |
| | | | | | | | | | | | | 24,043,466 | |
| | | | | | | | | | | | | | |
| | | | |
| Software: 3.46% | | | | | | | | | | | | | | |
Microsoft Corporation | | | | | | | | | 178,615 | | | | 7,216,046 | |
Oracle Corporation | | | | | | | | | 157,181 | | | | 6,584,312 | |
| | | | |
| | | | | | | | | | | | | 13,800,358 | |
| | | | | | | | | | | | | | |
| | | | |
| Technology Hardware, Storage & Peripherals: 6.21% | | | | | | | | | | | | | | |
Apple Incorporated | | | | | | | | | 83,763 | | | | 9,813,673 | |
Hewlett-Packard Company | | | | | | | | | 204,390 | | | | 7,384,611 | |
SanDisk Corporation | | | | | | | | | 99,667 | | | | 7,565,722 | |
| | | | |
| | | | | | | | | | | | | 24,764,006 | |
| | | | | | | | | | | | | | |
| | | | |
Materials: 1.78% | | | | | | | | | | | | | | |
| | | | |
| Chemicals: 1.78% | | | | | | | | | | | | | | |
Dow Chemical Company | | | | | | | | | 157,539 | | | | 7,114,461 | |
| | | | | | | | | | | | | | |
| | | | |
Total Common Stocks (Cost $329,651,837) | | | | | | | | | | | | | 389,095,946 | |
| | | | | | | | | | | | | | |
| | | | |
| | | Yield | | | | | | | | | |
| | | | |
Short-Term Investments: 3.38% | | | | | | | | | | | | | | |
| | | | |
| Investment Companies: 3.38% | | | | | | | | | | | | | | |
Wells Fargo Advantage Cash Investment Money Market Fund, Select Class (l)(u) | | | 0.10 | % | | | | | 13,474,222 | | | | 13,474,222 | |
| | | | | | | | | | | | | | |
| | | | |
Total Short-Term Investments (Cost $13,474,222) | | | | | | | | | | | | | 13,474,222 | |
| | | | | | | | | | | | | | |
| | | | | | | | |
| Total investments in securities (Cost $343,126,059) * | | | 100.92 | % | | | 402,570,168 | |
Other assets and liabilities, net | | | (0.92 | ) | | | (3,654,398 | ) |
| | | | | | | | |
| Total net assets | | | 100.00 | % | | $ | 398,915,770 | |
| | | | | | | | |
| † | Non-income-earning security |
| (l) | The security represents an affiliate of the Fund as defined in the Investment Company Act of 1940. |
| (u) | The rate represents the 7-day annualized yield at period end. |
| * | Cost for federal income tax purposes is $343,158,404 and unrealized gains (losses) consists of: |
| | | | |
Gross unrealized gains | | $ | 72,562,968 | |
Gross unrealized losses | | | (13,151,204 | ) |
| | | | |
Net unrealized gains | | $ | 59,411,764 | |
The accompanying notes are an integral part of these financial statements.
| | | | |
| 10 | | Wells Fargo Advantage Large Cap Core Fund | | Statement of assets and liabilities—January 31, 2015 (unaudited) |
| | | | |
| | | | |
| |
Assets | | | | |
Investments | | | | |
In unaffiliated securities, at value (cost $329,651,837) | | $ | 389,095,946 | |
In affiliated securities, at value (cost $13,474,222) | | | 13,474,222 | |
| | | | |
Total investments, at value (cost $343,126,059) | | | 402,570,168 | |
Receivable for Fund shares sold | | | 3,949,556 | |
Receivable for dividends | | | 175,312 | |
Prepaid expenses and other assets | | | 40,292 | |
| | | | |
Total assets | | | 406,735,328 | |
| | | | |
| |
Liabilities | | | | |
Payable for investments purchased | | | 6,607,147 | |
Payable for Fund shares redeemed | | | 788,455 | |
Advisory fee payable | | | 177,101 | |
Distribution fee payable | | | 15,408 | |
Administration fees payable | | | 111,911 | |
Accrued expenses and other liabilities | | | 119,536 | |
| | | | |
Total liabilities | | | 7,819,558 | |
| | | | |
Total net assets | | $ | 398,915,770 | |
| | | | |
| |
NET ASSETS CONSIST OF | | | | |
Paid-in capital | | $ | 341,590,028 | |
Overdistributed net investment income | | | (55,601 | ) |
Accumulated net realized losses on investments | | | (2,062,766 | ) |
Net unrealized gains on investments | | | 59,444,109 | |
| | | | |
Total net assets | | $ | 398,915,770 | |
| | | | |
| |
COMPUTATION OF NET ASSET VALUE AND OFFERING PRICE PER SHARE | | | | |
Net assets – Class A | | $ | 62,430,152 | |
Shares outstanding – Class A1 | | | 4,213,316 | |
Net asset value per share – Class A | | | $14.82 | |
Maximum offering price per share – Class A2 | | | $15.72 | |
Net assets – Class C | | $ | 29,357,993 | |
Shares outstanding – Class C1 | | | 1,999,720 | |
Net asset value per share – Class C | | | $14.68 | |
Net assets – Administrator Class | | $ | 32,616,329 | |
Shares outstanding – Administrator Class1 | | | 2,195,552 | |
Net asset value per share – Administrator Class | | | $14.86 | |
Net assets – Institutional Class | | $ | 21,947,135 | |
Shares outstanding – Institutional Class1 | | | 1,475,866 | |
Net asset value per share – Institutional Class | | | $14.87 | |
Net assets – Investor Class | | $ | 252,564,161 | |
Shares outstanding – Investor Class1 | | | 17,001,294 | |
Net asset value per share – Investor Class | | | $14.86 | |
| 1 | The Fund has an unlimited number of authorized shares. |
| 2 | Maximum offering price is computed as 100/94.25 of net asset value. On investments of $50,000 or more, the offering price is reduced. |
The accompanying notes are an integral part of these financial statements.
| | | | | | |
| Statement of operations—six months ended January 31, 2015 (unaudited) | | Wells Fargo Advantage Large Cap Core Fund | | | 11 | |
| | | | |
| | | | |
| |
Investment income | | | | |
Dividends (net of foreign withholding taxes of $8,282) | | $ | 2,229,119 | |
Income from affiliated securities | | | 2,847 | |
Securities lending income, net | | | 1,918 | |
| | | | |
Total investment income | | | 2,233,884 | |
| | | | |
| |
Expenses | | | | |
Advisory fee | | | 1,110,537 | |
Administration fees | | | | |
Fund level | | | 85,426 | |
Class A | | | 59,653 | |
Class C | | | 20,595 | |
Administrator Class | | | 10,143 | |
Institutional Class | | | 5,072 | |
Investor Class | | | 395,216 | |
Shareholder servicing fees | | | | |
Class A | | | 57,359 | |
Class C | | | 19,803 | |
Administrator Class | | | 25,148 | |
Investor Class | | | 308,763 | |
Distribution fee | | | | |
Class C | | | 59,409 | |
Custody and accounting fees | | | 10,910 | |
Professional fees | | | 24,041 | |
Registration fees | | | 29,104 | |
Shareholder report expenses | | | 27,874 | |
Trustees’ fees and expenses | | | 5,981 | |
Other fees and expenses | | | 5,578 | |
| | | | |
Total expenses | | | 2,260,612 | |
Less: Fee waivers and/or expense reimbursements | | | (234,161 | ) |
| | | | |
Net expenses | | | 2,026,451 | |
| | | | |
Net investment income | | | 207,433 | |
| | | | |
| |
REALIZED AND UNREALIZED GAINS (LOSSES) ON INVESTMENTS | | | | |
Net realized gains on investments | | | 15,969,185 | |
Net change in unrealized gains (losses) on investments | | | (4,714,733 | ) |
| | | | |
Net realized and unrealized gains (losses) on investments | | | 11,254,452 | |
| | | | |
Net increase in net assets resulting from operations | | $ | 11,461,885 | |
| | | | |
The accompanying notes are an integral part of these financial statements.
| | | | |
| 12 | | Wells Fargo Advantage Large Cap Core Fund | | Statement of changes in net assets |
| | | | | | | | | | | | | | | | |
| | | Six months ended
January 31, 2015
(unaudited) | | | Year ended
July 31, 2014 | |
| | | | |
Operations | | | | | | | | | | | | | | | | |
Net investment income | | | | | | $ | 207,433 | | | | | | | $ | 1,039,386 | |
Net realized gains on investments | | | | | | | 15,969,185 | | | | | | | | 28,939,604 | |
Net change in unrealized gains (losses) on investments | | | | | | | (4,714,733 | ) | | | | | | | 10,631,186 | |
| | | | |
Net increase in net assets resulting from operations | | | | | | | 11,461,885 | | | | | | | | 40,610,176 | |
| | | | |
| | | | |
Distributions to shareholders from | | | | | | | | | | | | | | | | |
Net investment income | | | | | | | | | | | | | | | | |
Class A | | | | | | | (183,035 | ) | | | | | | | (146,205 | ) |
Class C | | | | | | | 0 | | | | | | | | (6,279 | ) |
Administrator Class | | | | | | | (122,314 | ) | | | | | | | (28,910 | ) |
Institutional Class | | | | | | | (94,797 | ) | | | | | | | (5,938 | ) |
Investor Class | | | | | | | (308,152 | ) | | | | | | | (1,041,373 | ) |
| | | | |
Total distributions to shareholders | | | | | | | (708,298 | ) | | | | | | | (1,228,705 | ) |
| | | | |
| | | | |
Capital share transactions | | | Shares | | | | | | | | Shares | | | | | |
Proceeds from shares sold | | | | | | | | | | | | | | | | |
Class A | | | 2,742,074 | | | | 40,336,774 | | | | 1,247,306 | | | | 16,588,541 | |
Class C | | | 1,553,049 | | | | 22,885,719 | | | | 345,172 | | | | 4,598,982 | |
Administrator Class | | | 2,315,625 | | | | 34,138,734 | | | | 412,731 | | | | 5,556,845 | |
Institutional Class | | | 1,178,275 | | | | 17,653,652 | | | | 366,712 | | | | 5,140,707 | |
Investor Class | | | 1,796,653 | | | | 26,751,448 | | | | 1,798,050 | | | | 24,364,843 | |
| | | | |
| | | | | | | 141,766,327 | | | | | | | | 56,249,918 | |
| | | | |
Reinvestment of distributions | | | | | | | | | | | | | | | | |
Class A | | | 11,869 | | | | 173,408 | | | | 10,833 | | | | 140,173 | |
Class C | | | 0 | | | | 0 | | | | 372 | | | | 4,789 | |
Administrator Class | | | 8,331 | | | | 122,042 | | | | 2,030 | | | | 26,308 | |
Institutional Class | | | 5,103 | | | | 74,803 | | | | 445 | | | | 5,766 | |
Investor Class | | | 20,620 | | | | 302,078 | | | | 78,721 | | | | 1,020,228 | |
| | | | |
| | | | | | | 672,331 | | | | | | | | 1,197,264 | |
| | | | |
Payment for shares redeemed | | | | | | | | | | | | | | | | |
Class A | | | (407,035 | ) | | | (5,992,327 | ) | | | (650,098 | ) | | | (8,833,379 | ) |
Class C | | | (161,848 | ) | | | (2,385,812 | ) | | | (51,205 | ) | | | (689,445 | ) |
Administrator Class | | | (606,157 | ) | | | (9,083,905 | ) | | | (35,053 | ) | | | (487,058 | ) |
Institutional Class | | | (109,882 | ) | | | (1,659,476 | ) | | | (8,935 | ) | | | (120,053 | ) |
Investor Class | | | (883,131 | ) | | | (13,030,226 | ) | | | (1,522,071 | ) | | | (20,267,093 | ) |
| | | | |
| | | | | | | (32,151,746 | ) | | | | | | | (30,397,028 | ) |
| | | | |
Net increase in net assets resulting from capital share transactions | | | | | | | 110,286,912 | | | | | | | | 27,050,154 | |
| | | | |
Total increase in net assets | | | | | | | 121,040,499 | | | | | | | | 66,431,625 | |
| | | | |
| | | | |
Net assets | | | | | | | | | | | | | | | | |
Beginning of period | | | | | | | 277,875,271 | | | | | | | | 211,443,646 | |
| | | | |
End of period | | | | | | $ | 398,915,770 | | | | | | | $ | 277,875,271 | |
| | | | |
Undistributed (overdistributed) net investment income | | | | | | $ | (55,601 | ) | | | | | | $ | 445,264 | |
| | | | |
The accompanying notes are an integral part of these financial statements.
| | | | | | |
| Financial highlights | | Wells Fargo Advantage Large Cap Core Fund | | | 13 | |
(For a share outstanding throughout each period)
| | | | | | | | | | | | | | | | | | | | | | | | |
| | | Six months ended
January 31, 2015 (unaudited) | | | Year ended July 31 | |
| CLASS A | | | 2014 | | | 2013 | | | 2012 | | | 2011 | | | 20101 | |
Net asset value, beginning of period | | | $14.30 | | | | $12.13 | | | | $9.50 | | | | $8.75 | | | | $7.37 | | | | $6.96 | |
Net investment income | | | 0.01 | | | | 0.06 | 2 | | | 0.07 | | | | 0.06 | | | | 0.05 | | | | 0.06 | |
Net realized and unrealized gains (losses) on investments | | | 0.56 | | | | 2.20 | | | | 2.64 | | | | 0.74 | | | | 1.36 | | | | 0.46 | |
| | | | | | | | | | | | | | | | | | | | | | | | |
Total from investment operations | | | 0.57 | | | | 2.26 | | | | 2.71 | | | | 0.80 | | | | 1.41 | | | | 0.52 | |
Distributions to shareholders from | | | | | | | | | | | | | | | | | | | | | | | | |
Net investment income | | | (0.05 | ) | | | (0.09 | ) | | | (0.08 | ) | | | (0.05 | ) | | | (0.03 | ) | | | (0.11 | ) |
Net asset value, end of period | | | $14.82 | | | | $14.30 | | | | $12.13 | | | | $9.50 | | | | $8.75 | | | | $7.37 | |
Total return3 | | | 4.04 | % | | | 18.58 | % | | | 28.76 | % | | | 9.27 | % | | | 19.16 | % | | | 7.43 | % |
Ratios to average net assets (annualized) | | | | | | | | | | | | | | | | | | | | | | | | |
Gross expenses | | | 1.27 | % | | | 1.29 | % | | | 1.33 | % | | | 1.37 | % | | | 1.30 | % | | | 2.55 | % |
Net expenses | | | 1.14 | % | | | 1.14 | % | | | 1.14 | % | | | 1.14 | % | | | 1.14 | % | | | 1.15 | % |
Net investment income | | | 0.16 | % | | | 0.47 | % | | | 0.75 | % | | | 0.71 | % | | | 0.61 | % | | | 0.91 | % |
Supplemental data | | | | | | | | | | | | | | | | | | | | | | | | |
Portfolio turnover rate | | | 27 | % | | | 61 | % | | | 67 | % | | | 41 | % | | | 43 | % | | | 18 | % |
Net assets, end of period (000s omitted) | | | $62,430 | | | | $26,685 | | | | $15,267 | | | | $8,277 | | | | $7,495 | | | | $8,501 | |
| 1 | After the close of business on July 16, 2010, the Fund acquired the net assets of Evergreen Golden Large Cap Core Fund and Wells Fargo Advantage Large Company Core Fund. Evergreen Golden Large Cap Core Fund was the accounting and performance survivor in the transaction. The information for the period prior to July 19, 2010 is that of Class A of Evergreen Golden Large Cap Core Fund. |
| 2 | Calculated based upon average shares outstanding |
| 3 | Total return calculations do not include any sales charges. Returns for periods of less than one year are not annualized. |
The accompanying notes are an integral part of these financial statements.
| | | | |
| 14 | | Wells Fargo Advantage Large Cap Core Fund | | Financial highlights |
(For a share outstanding throughout each period)
| | | | | | | | | | | | | | | | | | | | | | | | |
| | | Six months ended
January 31, 2015 (unaudited) | | | Year ended July 31 | |
| CLASS C | | | 2014 | | | 2013 | | | 2012 | | | 2011 | | | 20101 | |
Net asset value, beginning of period | | | $14.17 | | | | $12.05 | | | | $9.45 | | | | $8.71 | | | | $7.37 | | | | $6.94 | |
Net investment income (loss) | | | (0.05 | )2 | | | (0.01 | ) | | | (0.00 | )3 | | | (0.00 | )3 | | | (0.01 | ) | | | 0.01 | |
Net realized and unrealized gains (losses) on investments | | | 0.56 | | | | 2.15 | | | | 2.62 | | | | 0.74 | | | | 1.35 | | | | 0.44 | |
| | | | | | | | | | | | | | | | | | | | | | | | |
Total from investment operations | | | 0.51 | | | | 2.14 | | | | 2.62 | | | | 0.74 | | | | 1.34 | | | | 0.45 | |
Distributions to shareholders from | | | | | | | | | | | | | | | | | | | | | | | | |
Net investment income | | | 0.00 | | | | (0.02 | ) | | | (0.02 | ) | | | 0.00 | | | | 0.00 | | | | (0.02 | ) |
Net asset value, end of period | | | $14.68 | | | | $14.17 | | | | $12.05 | | | | $9.45 | | | | $8.71 | | | | $7.37 | |
Total return4 | | | 3.60 | % | | | 17.73 | % | | | 27.82 | % | | | 8.50 | % | | | 18.18 | % | | | 6.54 | % |
Ratios to average net assets (annualized) | | | | | | | | | | | | | | | | | | | | | | | | |
Gross expenses | | | 2.03 | % | | | 2.04 | % | | | 2.08 | % | | | 2.12 | % | | | 2.05 | % | | | 3.75 | % |
Net expenses | | | 1.89 | % | | | 1.89 | % | | | 1.89 | % | | | 1.89 | % | | | 1.89 | % | | | 1.90 | % |
Net investment income (loss) | | | (0.61 | )% | | | (0.30 | )% | | | (0.01 | )% | | | (0.04 | )% | | | (0.13 | )% | | | 0.09 | % |
Supplemental data | | | | | | | | | | | | | | | | | | | | | | | | |
Portfolio turnover rate | | | 27 | % | | | 61 | % | | | 67 | % | | | 41 | % | | | 43 | % | | | 18 | % |
Net assets, end of period (000s omitted) | | | $29,358 | | | | $8,624 | | | | $3,786 | | | | $2,041 | | | | $1,750 | | | | $1,947 | |
| 1 | After the close of business on July 16, 2010, the Fund acquired the net assets of Evergreen Golden Large Cap Core Fund and Wells Fargo Advantage Large Company Core Fund. Evergreen Golden Large Cap Core Fund was the accounting and performance survivor in the transaction. The information for the period prior to July 19, 2010 is that of Class C of Evergreen Golden Large Cap Core Fund. |
| 2 | Calculated based upon average shares outstanding |
| 3 | Amount is less than $0.005. |
| 4 | Total return calculations do not include any sales charges. Returns for periods of less than one year are not annualized. |
The accompanying notes are an integral part of these financial statements.
| | | | | | |
| Financial highlights | | Wells Fargo Advantage Large Cap Core Fund | | | 15 | |
(For a share outstanding throughout each period)
| | | | | | | | | | | | | | | | | | | | | | | | |
| | | Six months ended
January 31, 2015 (unaudited) | | | Year ended July 31 | |
| ADMINISTRATOR CLASS | | | 2014 | | | 2013 | | | 2012 | | | 2011 | | | 20101 | |
Net asset value, beginning of period | | | $14.34 | | | | $12.16 | | | | $9.52 | | | | $8.77 | | | | $7.38 | | | | $7.22 | |
Net investment income | | | 0.04 | | | | 0.09 | | | | 0.10 | | | | 0.09 | | | | 0.07 | 2 | | | 0.00 | 3 |
Net realized and unrealized gains (losses) on investments | | | 0.55 | | | | 2.20 | | | | 2.64 | | | | 0.74 | | | | 1.36 | | | | 0.16 | |
| | | | | | | | | | | | | | | | | | | | | | | | |
Total from investment operations | | | 0.59 | | | | 2.29 | | | | 2.74 | | | | 0.83 | | | | 1.43 | | | | 0.16 | |
Distributions to shareholders from | | | | | | | | | | | | | | | | | | | | | | | | |
Net investment income | | | (0.07 | ) | | | (0.11 | ) | | | (0.10 | ) | | | (0.08 | ) | | | (0.04 | ) | | | 0.00 | |
Net asset value, end of period | | | $14.86 | | | | $14.34 | | | | $12.16 | | | | $9.52 | | | | $8.77 | | | | $7.38 | |
Total return4 | | | 4.20 | % | | | 18.83 | % | | | 29.12 | % | | | 9.61 | % | | | 19.44 | % | | | 2.22 | % |
Ratios to average net assets (annualized) | | | | | | | | | | | | | | | | | | | | | | | | |
Gross expenses | | | 1.11 | % | | | 1.11 | % | | | 1.14 | % | | | 1.16 | % | | | 1.08 | % | | | 1.12 | % |
Net expenses | | | 0.90 | % | | | 0.90 | % | | | 0.89 | % | | | 0.87 | % | | | 0.86 | % | | | 0.89 | % |
Net investment income | | | 0.38 | % | | | 0.63 | % | | | 1.00 | % | | | 0.97 | % | | | 0.76 | % | | | 1.12 | % |
Supplemental data | | | | | | | | | | | | | | | | | | | | | | | | |
Portfolio turnover rate | | | 27 | % | | | 61 | % | | | 67 | % | | | 41 | % | | | 43 | % | | | 18 | % |
Net assets, end of period (000s omitted) | | | $32,616 | | | | $6,849 | | | | $1,192 | | | | $522 | | | | $477 | | | | $42 | |
| 1 | For the period from July 16, 2010 (commencement of class operations) to July 31, 2010 |
| 2 | Calculated based upon average shares outstanding |
| 3 | Amount is less than $0.005. |
| 4 | Returns for periods of less than one year are not annualized. |
The accompanying notes are an integral part of these financial statements.
| | | | |
| 16 | | Wells Fargo Advantage Large Cap Core Fund | | Financial highlights |
(For a share outstanding throughout each period)
| | | | | | | | | | | | | | | | | | | | | | | | |
| | | Six months ended
January 31, 2015 (unaudited) | | | Year ended July 31 | |
| INSTITUTIONAL CLASS | | | 2014 | | | 2013 | | | 2012 | | | 2011 | | | 20101 | |
Net asset value, beginning of period | | | $14.35 | | | | $12.16 | | | | $9.52 | | | | $8.77 | | | | $7.38 | | | | $6.97 | |
Net investment income | | | 0.05 | 2 | | | 0.11 | 2 | | | 0.13 | 2 | | | 0.12 | | | | 0.10 | 2 | | | 0.08 | |
Net realized and unrealized gains (losses) on investments | | | 0.55 | | | | 2.21 | | | | 2.63 | | | | 0.73 | | | | 1.35 | | | | 0.46 | |
| | | | | | | | | | | | | | | | | | | | | | | | |
Total from investment operations | | | 0.60 | | | | 2.32 | | | | 2.76 | | | | 0.85 | | | | 1.45 | | | | 0.54 | |
Distributions to shareholders from | | | | | | | | | | | | | | | | | | | | | | | | |
Net investment income | | | (0.08 | ) | | | (0.13 | ) | | | (0.12 | ) | | | (0.10 | ) | | | (0.06 | ) | | | (0.13 | ) |
Net asset value, end of period | | | $14.87 | | | | $14.35 | | | | $12.16 | | | | $9.52 | | | | $8.77 | | | | $7.38 | |
Total return3 | | | 4.22 | % | | | 19.21 | % | | | 29.38 | % | | | 9.88 | % | | | 19.65 | % | | | 7.79 | % |
Ratios to average net assets (annualized) | | | | | | | | | | | | | | | | | | | | | | | | |
Gross expenses | | | 0.84 | % | | | 0.85 | % | | | 0.90 | % | | | 0.94 | % | | | 0.86 | % | | | 2.80 | % |
Net expenses | | | 0.66 | % | | | 0.66 | % | | | 0.66 | % | | | 0.66 | % | | | 0.66 | % | | | 0.89 | % |
Net investment income | | | 0.63 | % | | | 0.83 | % | | | 1.24 | % | | | 1.19 | % | | | 1.32 | % | | | 1.09 | % |
Supplemental data | | | | | | | | | | | | | | | | | | | | | | | | |
Portfolio turnover rate | | | 27 | % | | | 61 | % | | | 67 | % | | | 41 | % | | | 43 | % | | | 18 | % |
Net assets, end of period (000s omitted) | | | $21,947 | | | | $5,775 | | | | $537 | | | | $480 | | | | $478 | | | | $3,132 | |
| 1 | After the close of business on July 16, 2010, the Fund acquired the net assets of Evergreen Golden Large Cap Core Fund and Wells Fargo Advantage Large Company Core Fund. Evergreen Golden Large Cap Core Fund was the accounting and performance survivor in the transaction. The information for the period prior to July 19, 2010 is that of Class I of Evergreen Golden Large Cap Core Fund. |
| 2 | Calculated based upon average shares outstanding |
| 3 | Returns for periods of less than one year are not annualized. |
The accompanying notes are an integral part of these financial statements.
| | | | | | |
| Financial highlights | | Wells Fargo Advantage Large Cap Core Fund | | | 17 | |
(For a share outstanding throughout each period)
| | | | | | | | | | | | | | | | | | | | | | | | |
| | | Six months ended
January 31, 2015 (unaudited) | | | Year ended July 31 | |
| INVESTOR CLASS | | | 2014 | | | 2013 | | | 2012 | | | 2011 | | | 20101 | |
Net asset value, beginning of period | | | $14.31 | | | | $12.13 | | | | $9.50 | | | | $8.75 | | | | $7.38 | | | | $7.22 | |
Net investment income | | | 0.01 | | | | 0.06 | | | | 0.07 | | | | 0.06 | | | | 0.05 | | | | 0.00 | 2 |
Net realized and unrealized gains (losses) on investments | | | 0.56 | | | | 2.19 | | | | 2.63 | | | | 0.74 | | | | 1.35 | | | | 0.16 | |
| | | | | | | | | | | | | | | | | | | | | | | | |
Total from investment operations | | | 0.57 | | | | 2.25 | | | | 2.70 | | | | 0.80 | | | | 1.40 | | | | 0.16 | |
Distributions to shareholders from | | | | | | | | | | | | | | | | | | | | | | | | |
Net investment income | | | (0.02 | ) | | | (0.07 | ) | | | (0.07 | ) | | | (0.05 | ) | | | (0.03 | ) | | | 0.00 | |
Net asset value, end of period | | | $14.86 | | | | $14.31 | | | | $12.13 | | | | $9.50 | | | | $8.75 | | | | $7.38 | |
Total return3 | | | 3.97 | % | | | 18.58 | % | | | 28.63 | % | | | 9.21 | % | | | 18.97 | % | | | 2.22 | % |
Ratios to average net assets (annualized) | | | | | | | | | | | | | | | | | | | | | | | | |
Gross expenses | | | 1.33 | % | | | 1.35 | % | | | 1.38 | % | | | 1.43 | % | | | 1.37 | % | | | 1.37 | % |
Net expenses | | | 1.20 | % | | | 1.20 | % | | | 1.20 | % | | | 1.21 | % | | | 1.21 | % | | | 1.21 | % |
Net investment income | | | 0.11 | % | | | 0.44 | % | | | 0.69 | % | | | 0.64 | % | | | 0.53 | % | | | 1.03 | % |
Supplemental data | | | | | | | | | | | | | | | | | | | | | | | | |
Portfolio turnover rate | | | 27 | % | | | 61 | % | | | 67 | % | | | 41 | % | | | 43 | % | | | 18 | % |
Net assets, end of period (000s omitted) | | | $252,564 | | | | $229,941 | | | | $190,661 | | | | $159,422 | | | | $158,966 | | | | $150,157 | |
| 1 | For the period from July 16, 2010 (commencement of class operations) to July 31, 2010 |
| 2 | Amount is less than $0.005. |
| 3 | Returns for periods of less than one year are not annualized. |
The accompanying notes are an integral part of these financial statements.
| | | | |
| 18 | | Wells Fargo Advantage Large Cap Core Fund | | Notes to financial statements (unaudited) |
1. ORGANIZATION
Wells Fargo Funds Trust (the “Trust”), a Delaware statutory trust organized on March 10, 1999, is an open-end management investment company registered under the Investment Company Act of 1940, as amended (the “1940 Act”). As an investment company, the Trust follows the accounting and reporting guidance in Financial Accounting Standards Board (“FASB”) Accounting Standards Codification Topic 946, Financial Services – Investment Companies. These financial statements report on the Wells Fargo Advantage Large Cap Core Fund (the “Fund”) which is a diversified series of the Trust.
2. SIGNIFICANT ACCOUNTING POLICIES
The following significant accounting policies, which are consistently followed in the preparation of the financial statements of the Fund, are in conformity with U.S. generally accepted accounting principles which require management to make estimates and assumptions that affect the reported amounts of assets and liabilities, disclosure of contingent assets and liabilities at the date of the financial statements, and the reported amounts of revenues and expenses during the reporting period. Actual results could differ from those estimates.
Securities valuation
All investments are valued each business day as of the close of regular trading on the New York Stock Exchange (generally 4 p.m. Eastern Time).
Equity securities that are listed on a foreign or domestic exchange or market are valued at the official closing price or, if none, the last sales price. If no sale occurs on the primary exchange or market for the security that day, the prior day’s price will be deemed “stale” and fair values will be determined in accordance with the Fund’s Valuation Procedures.
Investments in registered open-end investment companies are valued at net asset value. Non-registered investment vehicles are fair valued at net asset value.
Investments which are not valued using any of the methods discussed above are valued at their fair value, as determined in good faith by the Board of Trustees of the Fund. The Board of Trustees has established a Valuation Committee comprised of the Trustees and has delegated to it the authority to take any actions regarding the valuation of portfolio securities that the Valuation Committee deems necessary or appropriate, including determining the fair value of portfolio securities, unless the determination has been delegated to the Management Valuation Team of Wells Fargo Funds Management, LLC (“Funds Management”). The Board of Trustees retains the authority to make or ratify any valuation decisions or approve any changes to the Valuation Procedures as it deems appropriate. On a quarterly basis, the Board of Trustees receives reports on any valuation actions taken by the Valuation Committee or the Management Valuation Team which may include items for ratification.
Valuations of fair valued securities are compared to the next actual sales price when available, or other appropriate market values, to assess the continued appropriateness of the fair valuation methodologies used. These securities are fair valued on a day-to-day basis, taking into consideration changes to appropriate market information and any significant changes to the inputs considered in the valuation process until there is a readily available price provided on an exchange or by an independent pricing service. Valuations received from an independent pricing service or independent broker-dealer quotes are periodically validated by comparisons to most recent trades and valuations provided by other independent pricing services in addition to the review of prices by the adviser and/or subadviser. Unobservable inputs used in determining fair valuations are identified based on the type of security, taking into consideration factors utilized by market participants in valuing the investment, knowledge about the issuer and the current market environment.
Security loans
The Fund may lend its securities from time to time in order to earn additional income in the form of fees or interest on securities received as collateral or the investment of any cash received as collateral. The Fund continues to receive interest or dividends on the securities loaned. The Fund receives collateral in the form of cash or securities with a value at least equal to the value of the securities on loan. The value of the loaned securities is determined at the close of each business day and any additional required collateral is delivered to the Fund on the next business day. In a securities lending transaction, the net asset value of the Fund will be affected by an increase or decrease in the value of the securities loaned and by an increase or decrease in the value of the instrument in which collateral is invested. The amount of securities lending activity undertaken by the Fund fluctuates from time to time. In the event of default or bankruptcy by the borrower, the Fund may be prevented from recovering the loaned securities or gaining access to the collateral or may experience delays or costs in doing so. In addition, the investment of any cash collateral received may lose all or part of its value. The Fund has the right under the lending agreement to recover the securities from the borrower on demand.
| | | | | | |
| Notes to financial statements (unaudited) | | Wells Fargo Advantage Large Cap Core Fund | | | 19 | |
The Fund lends its securities through an unaffiliated securities lending agent. Cash collateral received in connection with its securities lending transactions is invested in Securities Lending Cash Investments, LLC (the “Securities Lending Fund”). The Securities Lending Fund is exempt from registration under Section 3(c)(7) of the 1940 Act and is managed by Funds Management and is subadvised by Wells Capital Management Incorporated (“WellsCap”). Funds Management receives an advisory fee starting at 0.05% and declining to 0.01% as the average daily net assets of the Securities Lending Fund increase. All of the fees received by Funds Management are paid to WellsCap for its services as subadviser. The Securities Lending Fund seeks to provide a positive return compared to the daily Fed Funds Open rate by investing in high-quality, U.S. dollar-denominated short-term money market instruments. Securities Lending Fund investments are fair valued based upon the amortized cost valuation technique. Income earned from investment in the Securities Lending Fund is included in securities lending income on the Statement of Operations.
Security transactions and income recognition
Securities transactions are recorded on a trade date basis. Realized gains or losses are recorded on the basis of identified cost.
Dividend income is recognized on the ex-dividend date. Dividend income is recorded net of foreign taxes withheld where recovery of such taxes is not assured.
Distributions to shareholders
Distributions to shareholders from net investment income and net realized gains, if any, are recorded on the ex-dividend date. Such distributions are determined in conformity with federal income tax regulations, which may differ in amount or character from net investment income and realized gains recognized for purposes of U.S. generally accepted accounting principles.
Federal and other taxes
The Fund intends to continue to qualify as a regulated investment company by distributing substantially all of its investment company taxable income and any net realized capital gains (after reduction for capital loss carryforwards) sufficient to relieve it from all, or substantially all, federal income taxes. Accordingly, no provision for federal income taxes was required.
The Fund’s income and federal excise tax returns and all financial records supporting those returns for the prior three fiscal years are subject to examination by the federal and Delaware revenue authorities. Management has analyzed the Fund’s tax positions taken on federal, state, and foreign tax returns for all open tax years and does not believe that there are any uncertain tax positions that require recognition of a tax liability.
As of July 31, 2014, the Fund had capital loss carryforwards available to offset future net realized capital gains in the amount of $18,009,001 with $508,161 expiring in 2017 and $17,500,840 expiring in 2018.
Class allocations
The separate classes of shares offered by the Fund differ principally in applicable sales charges, distribution, shareholder servicing, and administration fees. Class specific expenses are charged directly to that share class. Investment income, common expenses, and realized and unrealized gains (losses) on investments are allocated daily to each class of shares based on the relative proportion of net assets of each class.
3. FAIR VALUATION MEASUREMENTS
Fair value measurements of investments are determined within a framework that has established a fair value hierarchy based upon the various data inputs utilized in determining the value of the Fund’s investments. The three-level hierarchy gives the highest priority to unadjusted quoted prices in active markets for identical assets or liabilities (Level 1) and the lowest priority to significant unobservable inputs (Level 3). The Fund’s investments are classified within the fair value hierarchy based on the lowest level of input that is significant to the fair value measurement. The inputs are summarized into three broad levels as follows:
| n | | Level 1 – quoted prices in active markets for identical securities |
| n | | Level 2 – other significant observable inputs (including quoted prices for similar securities, interest rates, prepayment speeds, credit risk, use of amortized cost, etc.) |
| n | | Level 3 – significant unobservable inputs (including the Fund’s own assumptions in determining the fair value of investments) |
| | | | |
| 20 | | Wells Fargo Advantage Large Cap Core Fund | | Notes to financial statements (unaudited) |
The inputs or methodologies used for valuing investments in securities are not necessarily an indication of the risk associated with investing in those securities.
The following is a summary of the inputs used in valuing the Fund’s assets and liabilities as of January 31, 2015:
| | | | | | | | | | | | | | | | |
| | | Quoted prices
(Level 1) | | | Other significant
observable inputs
(Level 2) | | | Significant
unobservable inputs
(Level 3) | | | Total | |
Assets | | | | | | | | | | | | | | | | |
Investments in: | | | | | | | | | | | | | | | | |
| | | | |
Common stocks | | | | | | | | | | | | | | | | |
Consumer discretionary | | $ | 63,969,175 | | | $ | 0 | | | $ | 0 | | | $ | 63,969,175 | |
Consumer staples | | | 27,534,054 | | | | 0 | | | | 0 | | | | 27,534,054 | |
Energy | | | 27,768,297 | | | | 0 | | | | 0 | | | | 27,768,297 | |
Financials | | | 53,499,000 | | | | 0 | | | | 0 | | | | 53,499,000 | |
Health care | | | 74,669,944 | | | | 0 | | | | 0 | | | | 74,669,944 | |
Industrials | | | 43,691,582 | | | | 0 | | | | 0 | | | | 43,691,582 | |
Information technology | | | 90,849,433 | | | | 0 | | | | 0 | | | | 90,849,433 | |
Materials | | | 7,114,461 | | | | 0 | | | | 0 | | | | 7,114,461 | |
| | | | |
Short-term investments | | | | | | | | | | | | | | | | |
Investment companies | | | 13,474,222 | | | | 0 | | | | 0 | | | | 13,474,222 | |
Total assets | | $ | 402,570,168 | | | $ | 0 | | | $ | 0 | | | $ | 402,570,168 | |
The Fund recognizes transfers between levels within the fair value hierarchy at the end of the reporting period. At January 31, 2015, the Fund did not have any transfers into/out of Level 1, Level 2, or Level 3.
4. TRANSACTIONS WITH AFFILIATES
Advisory fee
The Trust has entered into an advisory contract with Funds Management, an indirect wholly owned subsidiary of Wells Fargo & Company (“Wells Fargo”). The adviser is responsible for implementing investment policies and guidelines and for supervising the subadviser, who is responsible for day-to-day portfolio management of the Fund.
Pursuant to the contract, Funds Management is entitled to receive an annual advisory fee starting at 0.65% and declining to 0.475% as the average daily net assets of the Fund increase. Prior to December 1, 2014, Funds Management was entitled to receive an annual advisory fee which started at 0.65% and declined to 0.55% as the average daily net assets of the Fund increased. For the six months ended January 31, 2015, the advisory fee was equivalent to an annual rate of 0.65% of the Fund’s average daily net assets.
Funds Management has retained the services of a subadviser to provide daily portfolio management to the Fund. The fee for subadvisory services is borne by Funds Management. Golden Capital Management, LLC, an affiliate of Funds Management, is the subadviser to the Fund and is entitled to receive a fee from Funds Management at an annual rate starting at 0.35% and declining to 0.30% as the average daily net assets of the Fund increase.
Administration fees
The Trust has entered into an administration agreement with Funds Management. Under this agreement, for providing administrative services, which includes paying fees and expenses for services provided by the transfer agent, sub-transfer agents, omnibus account servicers and record-keepers, Funds Management is entitled to receive from the Fund an annual fund level administration fee starting at 0.05% and declining to 0.03% as the average daily net assets of the Fund increase and a class level administration fee which is calculated based on the average daily net assets of each class as follows:
| | | | |
| | | Class level
administration fee | |
Class A, Class C | | | 0.26 | % |
Administrator Class | | | 0.10 | |
Institutional Class | | | 0.08 | |
Investor Class | | | 0.32 | |
| | | | | | |
| Notes to financial statements (unaudited) | | Wells Fargo Advantage Large Cap Core Fund | | | 21 | |
Funds Management has contractually waived and/or reimbursed advisory and administration fees to the extent necessary to maintain certain net operating expense ratios for the Fund. Waiver of fees and/or reimbursement of expenses by Funds Management were made first from fund level expenses on a proportionate basis and then from class specific expenses. Funds Management has committed through November 30, 2015 to waive fees and/or reimburse expenses to the extent necessary to cap the Fund’s expenses at 1.14% for Class A shares, 1.89% for Class C shares, 0.90% for Administrator Class shares, 0.66% for Institutional Class shares, and 1.20% for Investor Class shares. After this time, the cap may be increased or the commitment to maintain the cap may be terminated only with the approval of the Board of Trustees.
Distribution fee
The Trust has adopted a Distribution Plan for Class C shares of the Fund pursuant to Rule 12b-1 under the 1940 Act. A distribution fee is charged to Class C shares and paid to Wells Fargo Funds Distributor, LLC (“Funds Distributor”), the principal underwriter, at an annual rate of 0.75% of the average daily net assets of Class C shares.
In addition, Funds Distributor is entitled to receive the front-end sales charge from the purchase of Class A shares and a contingent deferred sales charge on the redemption of certain shares. Funds Distributor is also entitled to receive the contingent deferred sales charges from redemptions of Class C shares. For the six months ended January 31, 2015, Funds Distributor received $24,719 from the sale of Class A shares.
Shareholder servicing fees
The Trust has entered into contracts with one or more shareholder servicing agents, whereby Class A, Class C, Administrator Class, and Investor Class of the Fund is charged a fee at an annual rate of 0.25% of the average daily net assets of each respective class.
A portion of these total shareholder servicing fees were paid to affiliates of Wells Fargo.
5. INVESTMENT PORTFOLIO TRANSACTIONS
Purchases and sales of investments, excluding U.S. government obligations (if any) and short-term securities, for the six months ended January 31, 2015 were $196,170,679 and $90,512,232, respectively.
6. BANK BORROWINGS
The Trust (excluding the money market funds and certain other funds in the Trust) and Wells Fargo Variable Trust are parties to a $150,000,000 revolving credit agreement, whereby the Fund is permitted to use bank borrowings for temporary or emergency purposes, such as to fund shareholder redemption requests. Interest under the credit agreement is charged to the Fund based on a borrowing rate equal to the higher of the Federal Funds rate in effect on that day plus 1.25% or the overnight LIBOR rate in effect on that day plus 1.25%. In addition, an annual commitment fee equal to 0.10% of the unused balance is allocated to each participating fund. For the six months ended January 31, 2015, the Fund paid $228 in commitment fees.
For the six months ended January 31, 2015, there were no borrowings by the Fund under the agreement.
7. INDEMNIFICATION
Under the Trust’s organizational documents, the officers and Trustees are indemnified against certain liabilities that may arise out of performance of their duties to the Trust. Additionally, in the normal course of business, the Trust may enter into contracts with service providers that contain a variety of indemnification clauses. The Trust’s maximum exposure under these arrangements is dependent on future claims that may be made against the Fund and, therefore, cannot be estimated.
| | | | |
| 22 | | Wells Fargo Advantage Large Cap Core Fund | | Other information (unaudited) |
PROXY VOTING INFORMATION
A description of the policies and procedures that the Fund uses to determine how to vote proxies relating to portfolio securities, in addition to information regarding how the Fund voted proxies relating to portfolio securities during the most recent 12-month period ended June 30, is available on the Fund’s website at wellsfargoadvantagefunds.com or by visiting the SEC website at sec.gov.
PORTFOLIO HOLDINGS INFORMATION
The complete portfolio holdings for the Fund are publicly available monthly on the Fund’s website (wellsfargoadvantagefunds.com), on a one-month delayed basis. In addition, top ten holdings information (excluding derivative positions) for the Fund is publicly available on the Fund’s website on a monthly, seven-day or more delayed basis. The Fund files its complete schedule of portfolio holdings with the SEC for the first and third quarters of each fiscal year on Form N-Q, which is available by visiting the SEC website at sec.gov. In addition, the Fund’s Form N-Q may be reviewed and copied at the SEC’s Public Reference Room in Washington, DC, and at regional offices in New York City, at 233 Broadway, and in Chicago, at 175 West Jackson Boulevard, Suite 900. Information about the Public Reference Room may be obtained by calling 1-800-SEC-0330.
| | | | | | |
| Other information (unaudited) | | Wells Fargo Advantage Large Cap Core Fund | | | 23 | |
BOARD OF TRUSTEES AND OFFICERS
Each of the Trustees and Officers1 listed in the table below acts in identical capacities for each fund in the Wells Fargo Advantage family of funds, which consists of 134 mutual funds comprising the Wells Fargo Funds Trust, Wells Fargo Variable Trust, Wells Fargo Master Trust and four closed-end funds (collectively the “Fund Complex”). This table should be read in conjunction with the Prospectus and the Statement of Additional Information2. The mailing address of each Trustee and Officer is 525 Market Street, 12th Floor, San Francisco, CA 94105. Each Trustee and Officer serves an indefinite term, however, each Trustee serves such term until reaching the mandatory retirement age established by the Trustees.
Independent Trustees
| | | | | | |
Name and
year of birth | | Position held and
length of service* | | Principal occupations during past five years or longer | | Other
directorships during
past five years |
William R. Ebsworth
(Born 1957) | | Trustee, since 2015** | | Retired. From 1984 to 2013, equities analyst, portfolio manager, research director at Fidelity Management and Research Company and retired in 2013 as Chief Investment Officer of Fidelity Strategic Advisers, Inc. in Boston, Tokyo, and Hong Kong where he led a team of investment professionals managing client assets. Prior thereto, Board member of Hong Kong Securities Clearing Co., Hong Kong Options Clearing Corp., the Thailand International Fund, Ltd., Fidelity Investments Life Insurance Company, and Empire Fidelity Investments Life Insurance Company. Mr. Ebsworth is an Adjunct Lecturer, Finance, at Babson College and a Chartered Financial Analyst. | | Asset Allocation Trust |
Jane A. Freeman
(Born 1953) | | Trustee, since 2015** | | Retired. From 2012 to 2014 and 1999 to 2008, Chief Financial Officer of Scientific Learning Corporation. From 2008 to 2012, Ms. Freeman provided consulting services related to strategic business projects. Prior thereto, Portfolio Manager at Rockefeller & Co. and Scudder, Stevens & Clark. Board member of the Harding Loevner Funds from 1996 to 2014, serving as both Lead Independent Director and chair of the Audit Committee. Board member of the Russell Exchange Traded Funds Trust from 2011 to 2012 and the chair of the Audit Committee. Ms. Freeman is a Chartered Financial Analyst (inactive), Chair of Taproot Foundation (non-profit organization) and a Board Member of Ruth Bancroft Garden (non-profit organization). | | Asset Allocation Trust |
Peter G. Gordon
(Born 1942) | | Trustee, since 1998; Chairman, since 2005 | | Co-Founder, Retired Chairman, President and CEO of Crystal Geyser Water Company. Trustee Emeritus, Colby College. | | Asset Allocation Trust |
Isaiah Harris, Jr.
(Born 1952) | | Trustee, since 2009 | | Retired. Chairman of the Board of CIGNA Corporation since 2009, and Director since 2005. From 2003 to 2011, Director of Delux Corporation. Prior thereto, President and CEO of BellSouth Advertising and Publishing Corp. from 2005 to 2007, President and CEO of BellSouth Enterprises from 2004 to 2005 and President of BellSouth Consumer Services from 2000 to 2003. Emeritus member of the Iowa State University Foundation Board of Governors. Emeritus Member of the Advisory Board of Iowa State University School of Business. Advisory Board Member, Palm Harbor Academy. Mr. Harris is a certified public accountant. | | CIGNA Corporation; Asset Allocation Trust |
Judith M. Johnson
(Born 1949) | | Trustee, since 2008; Audit Committee Chairman, since 2008 | | Retired. Prior thereto, Chief Executive Officer and Chief Investment Officer of Minneapolis Employees Retirement Fund from 1996 to 2008. Ms. Johnson is an attorney, certified public accountant and a certified managerial accountant. | | Asset Allocation Trust |
David F. Larcker
(Born 1950) | | Trustee, since 2009 | | James Irvin Miller Professor of Accounting at the Graduate School of Business, Stanford University, Morgan Stanley Director of the Center for Leadership Development and Research and Senior Faculty of The Rock Center for Corporate Governance since 2006. From 2005 to 2008, Professor of Accounting at the Graduate School of Business, Stanford University. Prior thereto, Ernst & Young Professor of Accounting at The Wharton School, University of Pennsylvania from 1985 to 2005. | | Asset Allocation Trust |
Olivia S. Mitchell
(Born 1953) | | Trustee, since 2006 | | International Foundation of Employee Benefit Plans Professor, Wharton School of the University of Pennsylvania since 1993. Director of Wharton’s Pension Research Council and Boettner Center on Pensions & Retirement Research, and Research Associate at the National Bureau of Economic Research. Previously, Cornell University Professor from 1978 to 1993. | | Asset Allocation Trust |
| | | | |
| 24 | | Wells Fargo Advantage Large Cap Core Fund | | Other information (unaudited) |
| | | | | | |
Name and
year of birth | | Position held and
length of service* | | Principal occupations during past five years or longer | | Other
directorships during
past five years |
Timothy J. Penny
(Born 1951) | | Trustee, since 1996 | | President and Chief Executive Officer of Southern Minnesota Initiative Foundation, a non-profit organization, since 2007 and Senior Fellow at the Humphrey Institute Policy Forum at the University of Minnesota since 1995. Member of the Board of Trustees of NorthStar Education Finance, Inc., a non-profit organization, since 2007. | | Asset Allocation Trust |
Michael S. Scofield
(Born 1943) | | Trustee, since 2010 | | Served on the Investment Company Institute’s Board of Governors and Executive Committee from 2008-2011 as well the Governing Council of the Independent Directors Council from 2006-2011 and the Independent Directors Council Executive Committee from 2008-2011. Chairman of the IDC from 2008-2010. Institutional Investor (Fund Directions) Trustee of Year in 2007. Trustee of the Evergreen Funds complex (and its predecessors) from 1984 to 2010. Chairman of the Evergreen Funds from 2000-2010. Former Trustee of the Mentor Funds. Retired Attorney, Law Offices of Michael S. Scofield. | | Asset Allocation Trust |
Donald C. Willeke
(Born 1940) | | Trustee, since 1996 | | Principal of the law firm of Willeke & Daniels. General Counsel of the Minneapolis Employees Retirement Fund from 1984 until its consolidation into the Minnesota Public Employees Retirement Association on June 30, 2010. Director and Vice Chair of The Tree Trust (non-profit corporation). Director of the American Chestnut Foundation (non-profit corporation). | | Asset Allocation Trust |
| * | Length of service dates reflect the Trustee’s commencement of service with the Trust’s predecessor entities, where applicable. |
| ** | William R. Ebsworth and Jane A. Freeman each became a Trustee effective January 1, 2015. |
Officers
| | | | | | |
Name and
year of birth | | Position held and length
of service | | Principal occupations during past five years or longer | | |
Karla M. Rabusch
(Born 1959) | | President, since 2003 | | Executive Vice President of Wells Fargo Bank, N.A. and President of Wells Fargo Funds Management, LLC since 2003. | | |
Jeremy DePalma1
(Born 1974) | | Treasurer, since 2012 | | Senior Vice President of Wells Fargo Funds Management, LLC since 2009. Senior Vice President of Evergreen Investment Management Company, LLC from 2008 to 2010. Vice President, Evergreen Investment Services, Inc. from 2004 to 2007. Head of the Fund Reporting and Control Team within Fund Administration from 2005 to 2010. | | |
C. David Messman
(Born 1960) | | Secretary, since 2000; Chief Legal Officer, since 2003 | | Assistant General Counsel of Wells Fargo Bank, N.A. since 2013 and Vice President and Managing Counsel of Wells Fargo Bank N.A. from 1996 to 2013. Senior Vice President and Secretary of Wells Fargo Funds Management, LLC since 2001. | | |
Debra Ann Early
(Born 1964) | | Chief Compliance Officer, since 2007 | | Senior Vice President of Wells Fargo Funds Management, LLC since 2007 and Chief Compliance Officer from 2007 to 2014. Chief Compliance Officer of Parnassus Investments from 2005 to 2007. Chief Financial Officer of Parnassus Investments from 2004 to 2007 and Senior Audit Manager of PricewaterhouseCoopers LLP from 1998 to 2004. | | |
David Berardi
(Born 1975) | | Assistant Treasurer, since 2009 | | Vice President of Wells Fargo Funds Management, LLC since 2009. Vice President of Evergreen Investment Management Company, LLC from 2008 to 2010. Assistant Vice President of Evergreen Investment Services, Inc. from 2004 to 2008. Manager of Fund Reporting and Control for Evergreen Investment Management Company, LLC from 2004 to 2010. | | |
| 1 | Jeremy DePalma acts as Treasurer of 61 funds and Assistant Treasurer of 73 funds in the Fund Complex. |
| 2 | The Statement of Additional Information includes additional information about the Trustees and is available, without charge, upon request, by calling 1-800-222-8222 or by visiting the website at wellsfargoadvantagefunds.com. |
| | | | | | |
| List of abbreviations | | Wells Fargo Advantage Large Cap Core Fund | | | 25 | |
The following is a list of common abbreviations for terms and entities that may have appeared in this report.
| ACA | — ACA Financial Guaranty Corporation |
| ADR | — American depositary receipt |
| ADS | — American depositary shares |
| AGC | — Assured Guaranty Corporation |
| AGM | — Assured Guaranty Municipal |
| Ambac | — Ambac Financial Group Incorporated |
| AMT | — Alternative minimum tax |
| BAN | — Bond anticipation notes |
| BHAC | — Berkshire Hathaway Assurance Corporation |
| CAB | — Capital appreciation bond |
| CCAB | — Convertible capital appreciation bond |
| CDA | — Community Development Authority |
| CDO | — Collateralized debt obligation |
| DRIVER | — Derivative inverse tax-exempt receipts |
| DW&P | — Department of Water & Power |
| DWR | — Department of Water Resources |
| ECFA | — Educational & Cultural Facilities Authority |
| EDA | — Economic Development Authority |
| EDFA | — Economic Development Finance Authority |
| ETF | — Exchange-traded fund |
| FDIC | — Federal Deposit Insurance Corporation |
| FFCB | — Federal Farm Credit Banks |
| FGIC | — Financial Guaranty Insurance Corporation |
| FHA | — Federal Housing Administration |
| FHLB | — Federal Home Loan Bank |
| FHLMC | — Federal Home Loan Mortgage Corporation |
| FICO | — The Financing Corporation |
| FNMA | — Federal National Mortgage Association |
| GDR | — Global depositary receipt |
| GNMA | — Government National Mortgage Association |
| HCFR | — Healthcare facilities revenue |
| HEFA | — Health & Educational Facilities Authority |
| HEFAR | — Higher education facilities authority revenue |
| HFA | — Housing Finance Authority |
| HFFA | — Health Facilities Financing Authority |
| HUD | — Department of Housing and Urban Development |
| IDA | — Industrial Development Authority |
| IDAG | — Industrial Development Agency |
| KRW | — Republic of Korea won |
| LIBOR | — London Interbank Offered Rate |
| LIFER | — Long Inverse Floating Exempt Receipts |
| LLC | — Limited liability company |
| LLLP | — Limited liability limited partnership |
| LLP | — Limited liability partnership |
| MBIA | — Municipal Bond Insurance Association |
| MFHR | — Multifamily housing revenue |
| MSTR | — Municipal securities trust receipts |
| MUD | — Municipal Utility District |
| National | — National Public Finance Guarantee Corporation |
| PCFA | — Pollution Control Financing Authority |
| PCL | — Public Company Limited |
| PCR | — Pollution control revenue |
| PFA | — Public Finance Authority |
| PFFA | — Public Facilities Financing Authority |
| PFOTER | — Puttable floating option tax-exempt receipts |
| plc | — Public limited company |
| PUTTER | — Puttable tax-exempt receipts |
| R&D | — Research & development |
| Radian | — Radian Asset Assurance |
| RAN | — Revenue anticipation notes |
| RDA | — Redevelopment Authority |
| RDFA | — Redevelopment Finance Authority |
| REIT | — Real estate investment trust |
| ROC | — Reset option certificates |
| SAVRS | — Select auction variable rate securities |
| SBA | — Small Business Authority |
| SFHR | — Single-family housing revenue |
| SFMR | — Single-family mortgage revenue |
| SPA | — Standby purchase agreement |
| SPDR | — Standard & Poor’s Depositary Receipts |
| SPEAR | — Short Puttable Exempt Adjustable Receipts |
| STRIPS | — Separate trading of registered interest and |
| TAN | — Tax anticipation notes |
| TIPS | — Treasury inflation-protected securities |
| TRAN | — Tax revenue anticipation notes |
| TTFA | — Transportation Trust Fund Authority |
| TVA | — Tennessee Valley Authority |
This page is intentionally left blank.
This page is intentionally left blank.
This page is intentionally left blank.


For more information
More information about Wells Fargo Advantage Funds is available free upon request. To obtain literature, please write, email, visit the Fund’s website, or call:
Wells Fargo Advantage Funds
P.O. Box 8266
Boston, MA 02266-8266
Email: wfaf@wellsfargo.com
Website: wellsfargoadvantagefunds.com
Individual investors: 1-800-222-8222
Retail investment professionals: 1-888-877-9275
Institutional investment professionals: 1-866-765-0778
This report and the financial statements contained herein are submitted for the general information of the shareholders of Wells Fargo Advantage Funds. If this report is used for promotional purposes, distribution of the report must be accompanied or preceded by a current prospectus. Before investing, please consider the investment objectives, risks, charges, and expenses of the investment. For a current prospectus and, if available, a summary prospectus, containing this information, call 1-800-222-8222 or visit the Fund’s website at wellsfargoadvantagefunds.com. Read the prospectus carefully before you invest or send money.
Wells Fargo Funds Management, LLC, a wholly owned subsidiary of Wells Fargo & Company, provides investment advisory and administrative services for Wells Fargo Advantage Funds. Other affiliates of Wells Fargo & Company provide subadvisory and other services for the Funds. The Funds are distributed by Wells Fargo Funds Distributor, LLC, Member FINRA/SIPC, an affiliate of Wells Fargo & Company.
NOT FDIC INSURED ¡ NO BANK GUARANTEE ¡ MAY LOSE VALUE
© 2015 Wells Fargo Funds Management, LLC. All rights reserved.
| | |
 | | 231601 03-15 SA208/SAR208 01-15 |

Wells Fargo Advantage Large Cap Growth Fund

Semi-Annual Report
January 31, 2015

Reduce clutter. Save trees.
Sign up for electronic delivery of prospectuses and shareholder reports at wellsfargo.com/advantagedelivery
Contents
The views expressed and any forward-looking statements are as of January 31, 2015, unless otherwise noted, and are those of the Fund managers and/or Wells Fargo Funds Management, LLC. Discussions of individual securities, or the markets generally, or any Wells Fargo Advantage Fund are not intended as individual recommendations. Future events or results may vary significantly from those expressed in any forward-looking statements; the views expressed are subject to change at any time in response to changing circumstances in the market. Wells Fargo Funds Management, LLC and the Fund disclaim any obligation to publicly update or revise any views expressed or forward-looking statements.
NOT FDIC INSURED ¡ NO BANK GUARANTEE ¡ MAY LOSE VALUE
| | | | |
| 2 | | Wells Fargo Advantage Large Cap Growth Fund | | Letter to shareholders (unaudited) |

Karla M. Rabusch
President
Wells Fargo Advantage Funds
As the U.S. churned forward, major economies elsewhere in the world faced significant ongoing challenges.
Dear Valued Shareholder:
We are pleased to offer you this semi-annual report for the Wells Fargo Advantage Large Cap Growth Fund for the six-month period that ended January 31, 2015. Generally improving U.S. economic data helped drive a positive return for U.S. stocks for the reporting period (as measured by the S&P 500 Index1); in contrast, many economies and markets elsewhere in the world faced ongoing challenges.
Positive U.S. economic data, but increased tensions abroad, led to heightened volatility during the third quarter of 2014.
When the reporting period began on August 1, 2014, the U.S. stock market was experiencing a series of surges interrupted by bouts of volatility as interest-rate concerns in the U.S. and increased tensions abroad triggered heightened investor uncertainty. An escalating Russia/Ukraine situation and a growing perception that the U.S. Federal Reserve (Fed) would raise short-term interest rates sooner than expected caused investors to pull back near the end of July. As a result, the S&P 500 Index dropped into negative territory for July’s monthly return. However, August brought a bounce-back; the S&P 500 Index delivered its largest monthly gain since February 2014 on a string of positive economic news, led by an upwardly revised 4.2% estimate of second-quarter 2014 gross domestic product (GDP) growth. Then, in September, stock market volatility increased as positive economic data became overshadowed at times by growing discomfort over escalating tensions in Ukraine and the Middle East. Slowing growth in Europe and China also concerned investors. Ultimately, U.S. stocks ended the third quarter up slightly overall, buoyed largely by another upward revision of second-quarter GDP growth to 4.6%. Strong corporate earnings also contributed to market gains.
The fourth quarter of 2014 brought continued improvement in the U.S.; international economies remained challenged.
Strong fourth-quarter results by the U.S. stock market helped the S&P 500 Index deliver more than 50 record closes in 2014. The last several, in December, were spurred by investor optimism following Fed Chair Janet Yellen’s comment that the Fed would be patient in its timing of an interest-rate increase. U.S. stocks also were boosted by positive economic data. November’s 5.8% unemployment rate was down from 7.0% a year earlier, and the number of jobs being added continued to expand, keeping U.S. employers on pace to hire nearly three million workers during 2014. In addition, the U.S. economy’s third-quarter growth rate was revised upward during the quarter, to 5.0%—its fastest pace in 11 years. Meanwhile, U.S. companies continued to report strong earnings. The steadily brightening U.S. economy energized consumers, who were further buoyed by much lower prices at the gasoline pump. During the fourth quarter, gasoline prices fell to their lowest levels in five years, according to the American Automobile Association.
As the U.S. churned forward, major economies elsewhere in the world faced significant ongoing challenges. In China, where growth had been slowing for some time, government regulators in December announced changes being made in an effort to stimulate growth. In Japan, which slid back into recession in the third quarter of 2014, Prime Minister Abe gained approval in late December for roughly $29 billion in fresh stimulus to help the economy. In the eurozone, growth remained sluggish, and member countries continued to face an environment of low demand, high unemployment, and weak business investment. This situation was exacerbated in December by renewed concerns about Greece after its
| 1 | The S&P 500 Index consists of 500 stocks chosen for market size, liquidity, and industry group representation. It is a market-value-weighted index with each stock’s weight in the index proportionate to its market value. You cannot invest directly in an index. |
| | | | | | |
| Letter to shareholders (unaudited) | | Wells Fargo Advantage Large Cap Growth Fund | | | 3 | |
parliament failed to avert a general election that could jeopardize the terms of the country’s financial agreement with its international creditors. In Russia, the economy contracted for the first time since October 2009 as the country struggled under the weight of slumping oil prices, international sanctions, and massive outflows of capital.
Market volatility increased in January 2015.
Markets fluctuated in January as investors reacted to geopolitical developments and new economic data. Mid-month, the World Bank lowered its outlook for global growth based on deepening problems in the eurozone and emerging markets, stating that a strengthening U.S. economy could not, by itself, support the global economy. Later in January, Greek voters gave control of their government to opposition party Syriza, which promised to end austerity and insisted that Greece’s massive debt be renegotiated. In the U.S., various data released in January, such as consumer confidence and December’s jobless rate, showed improvement. On the last trading day of the month, however, investors learned that fourth-quarter 2014 U.S. economic growth was estimated at 2.6%, which was below consensus and lower than the 4.6% and 5.0% growth rates, respectively, for the second and third quarters of 2014.
Don’t let short-term uncertainty derail long-term investment goals.
Periods of uncertainty can present challenges, but experience has taught us that maintaining long-term investment goals can be an effective way to plan for the future. To help you create a sound strategy based on your personal goals and risk tolerance, Wells Fargo Advantage Funds offers more than 100 mutual funds spanning a wide range of asset classes and investment styles. Although diversification cannot guarantee an investment profit or prevent losses, we believe it can be an effective way to manage investment risk and potentially smooth out overall portfolio performance. We encourage investors to know their investments and to understand that appropriate levels of risk-taking may unlock opportunities.
Thank you for choosing to invest with Wells Fargo Advantage Funds. We appreciate your confidence in us and remain committed to helping you meet your financial needs. For current information about your fund investments, contact your investment professional, visit our website at wellsfargoadvantagefunds.com, or call us directly at 1-800-222-8222. We are available 24 hours a day, 7 days a week.
Sincerely,

Karla M. Rabusch
President
Wells Fargo Advantage Funds
We encourage investors to know their investments and to understand that appropriate levels of risk-taking may unlock opportunities.
| | | | |
| 4 | | Wells Fargo Advantage Large Cap Growth Fund | | Performance highlights (unaudited) |
Investment objective
The Fund seeks long-term capital appreciation.
Adviser
Wells Fargo Funds Management, LLC
Subadviser
Wells Capital Management Incorporated
Portfolio managers
Thomas C. Ognar, CFA
Bruce C. Olson, CFA
Joseph M. Eberhardy, CFA, CPA
Average annual total returns1 (%) as of January 31, 2015
| | | | | | | | | | | | | | | | | | | | | | | | | | | | | | | | | | |
| | | | | Including sales charge | | | Excluding sales charge | | | Expense ratios2 (%) | |
| | | Inception date | | 1 year | | | 5 year | | | 10 year | | | 1 year | | | 5 year | | | 10 year | | | Gross | | | Net3 | |
| Class A (STAFX) | | 7-30-2010 | | | 3.89 | | | | 14.22 | | | | 7.87 | | | | 10.22 | | | | 15.59 | | | | 8.51 | | | | 1.22 | | | | 1.07 | |
| Class C (STOFX) | | 7-30-2010 | | | 8.39 | | | | 14.74 | | | | 7.74 | | | | 9.39 | | | | 14.74 | | | | 7.74 | | | | 1.97 | | | | 1.82 | |
| Class R (STMFX) | | 6-15-2012 | | | – | | | | – | | | | – | | | | 9.95 | | | | 15.33 | | | | 8.32 | | | | 1.47 | | | | 1.32 | |
| Class R4 (SLGRX) | | 11-30-2012 | | | – | | | | – | | | | – | | | | 10.55 | | | | 15.95 | | | | 8.68 | | | | 0.89 | | | | 0.75 | |
| Class R6 (STFFX) | | 11-30-2012 | | | – | | | | – | | | | – | | | | 10.73 | | | | 16.02 | | | | 8.71 | | | | 0.74 | | | | 0.60 | |
| Administrator Class (STDFX) | | 7-30-2010 | | | – | | | | – | | | | – | | | | 10.35 | | | | 15.73 | | | | 8.58 | | | | 1.06 | | | | 0.95 | |
| Institutional Class (STNFX) | | 7-30-2010 | | | – | | | | – | | | | – | | | | 10.66 | | | | 15.99 | | | | 8.70 | | | | 0.79 | | | | 0.65 | |
| Investor Class (STRFX) | | 12-30-1981 | | | – | | | | – | | | | – | | | | 10.14 | | | | 15.51 | | | | 8.47 | | | | 1.28 | | | | 1.13 | |
| Russell 1000® Growth Index4 | | – | | | – | | | | – | | | | – | | | | 14.59 | | | | 16.49 | | | | 8.69 | | | | – | | | | – | |
Figures quoted represent past performance, which is no guarantee of future results, and do not reflect taxes that a shareholder may pay on fund distributions or the redemption of fund shares. Investment return and principal value of an investment will fluctuate so that an investor’s shares, when redeemed, may be worth more or less than their original cost. Performance shown without sales charges would be lower if sales charges were reflected. Current performance may be lower or higher than the performance data quoted, which assumes the reinvestment of dividends and capital gains. Current month-end performance is available on the Fund’s website, wellsfargoadvantagefunds.com.
Index returns do not include transaction costs associated with buying and selling securities, any mutual fund fees or expenses, or any taxes. It is not possible to invest directly in an index.
For Class A shares, the maximum front-end sales charge is 5.75%. For Class C shares, the maximum contingent deferred sales charge is 1.00%. Performance including a contingent deferred sales charge assumes the sales charge for the corresponding time period. Class R, Class R4, Class R6, Administrator Class, Institutional Class, and Investor Class shares are sold without a front-end sales charge or contingent deferred sales charge.
Stock values fluctuate in response to the activities of individual companies and general market and economic conditions. Certain investment strategies tend to increase the total risk of an investment (relative to the broader market). The Fund is exposed to foreign investment risk. Consult the Fund’s prospectus for additional information on these and other risks.
Please see footnotes on page 5.
| | | | | | |
| Performance highlights (unaudited) | | Wells Fargo Advantage Large Cap Growth Fund | | | 5 | |
| | | | |
| Ten largest equity holdings5 (%) as of January 31, 2015 | |
Apple Incorporated | | | 3.08 | |
Union Pacific Corporation | | | 2.68 | |
Facebook Incorporated Class A | | | 2.67 | |
Alexion Pharmaceuticals Incorporated | | | 2.56 | |
Dollar Tree Incorporated | | | 2.43 | |
Google Incorporated Class A | | | 2.29 | |
Biogen Idec Incorporated | | | 2.23 | |
MasterCard Incorporated Class A | | | 2.22 | |
Costco Wholesale Corporation | | | 2.21 | |
Google Incorporated Class C | | | 2.21 | |
|
| Sector distribution6 as of January 31, 2015 |
|
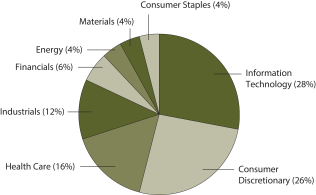 |
| 1 | Historical performance shown for Class A and Administrator shares prior to their inception reflects the performance of Investor Class shares, and includes the higher expenses applicable to Investor Class shares. If these expenses had not been included, returns would be higher. Historical performance shown for Class C shares prior to their inception reflects the performance of Investor Class shares, adjusted to reflect the higher expenses applicable to Class C shares. Historical performance shown for Class R shares prior to their inception reflects the performance of Investor Class shares, adjusted to reflect the higher expenses applicable to Class R shares. Historical performance shown for Class R4 shares prior to their inception reflects the performance of Institutional Class shares, adjusted to reflect the higher expenses applicable to Class R4 shares. Historical performance shown for Class R6 shares prior to their inception reflects the performance of Institutional Class shares, and includes the higher expenses applicable to Institutional Class shares. If these expenses had not been included, returns would be higher. Historical performance for Institutional Class shares prior to their inception reflects the performance of Investor Class shares, and includes the higher expenses applicable to Investor Class shares. If these expenses had not been included, returns would be higher. |
| 2 | Reflects the expense ratios as stated in the most recent prospectuses. The expense ratios shown are subject to change and may differ from the annualized expense ratios shown in the financial highlights of this report. |
| 3 | The Adviser has committed through November 30, 2015, to waive fees and/or reimburse expenses to the extent necessary to cap the Fund’s Total Annual Fund Operating Expenses After Fee Waiver, excluding certain expenses, at the amounts shown. After this time, the cap may be increased or the commitment to maintain the cap may be terminated only with the approval of the Board of Trustees. Brokerage commissions, stamp duty fees, interest, taxes, acquired fund fees and expenses, and extraordinary expenses are excluded from the cap. Without this cap, the Fund’s returns would have been lower. |
| 4 | The Russell 1000® Growth Index measures the performance of those Russell 1000 Index companies with higher price-to-book ratios and higher forecasted growth values. You cannot invest directly in an index. |
| 5 | The ten largest equity holdings are calculated based on the value of the securities divided by total net assets of the Fund. Holdings are subject to change and may have changed since the date specified. |
| 6 | Amounts are calculated based on the total long-term investments of the Fund. These percentages are subject to change and may have changed since the date specified. |
| | | | |
| 6 | | Wells Fargo Advantage Large Cap Growth Fund | | Fund expenses (unaudited) |
As a shareholder of the Fund, you incur two types of costs: (1) transaction costs, including sales charges (loads) on purchase payments and contingent deferred sales charges (if any) on redemptions and (2) ongoing costs, including management fees, distribution (12b-1) and/or shareholder service fees, and other Fund expenses. This example is intended to help you understand your ongoing costs (in dollars) of investing in the Fund and to compare these costs with the ongoing costs of investing in other mutual funds.
The example is based on an investment of $1,000 invested at the beginning of the six-month period and held for the entire period from August 1, 2014 to January 31, 2015.
Actual expenses
The “Actual” line of the table below provides information about actual account values and actual expenses. You may use the information in this line, together with the amount you invested, to estimate the expenses that you paid over the period. Simply divide your account value by $1,000 (for example, an $8,600 account value divided by $1,000 = 8.6), then multiply the result by the number in the “Actual” line under the heading entitled “Expenses paid during period” for your applicable class of shares to estimate the expenses you paid on your account during this period.
Hypothetical example for comparison purposes
The “Hypothetical” line of the table below provides information about hypothetical account values and hypothetical expenses based on the Fund’s actual expense ratio and an assumed rate of return of 5% per year before expenses, which is not the Fund’s actual return. The hypothetical account values and expenses may not be used to estimate the actual ending account balance or expenses you paid for the period. You may use this information to compare the ongoing costs of investing in the Fund and other funds. To do so, compare this 5% hypothetical example with the 5% hypothetical examples that appear in the shareholder reports of the other funds.
Please note that the expenses shown in the table are meant to highlight your ongoing costs only and do not reflect any transactional costs, such as sales charges (loads) and contingent deferred sales charges. Therefore, the “Hypothetical” line of the table is useful in comparing ongoing costs only and will not help you determine the relative total costs of owning different funds. In addition, if these transactional costs were included, your costs would have been higher.
| | | | | | | | | | | | | | | | |
| | | Beginning account value 8-1-2014 | | | Ending account value 1-31-2015 | | | Expenses paid during the period¹ | | | Net annualized expense ratio | |
Class A | | | | | | | | | | | | | | | | |
Actual | | $ | 1,000.00 | | | $ | 1,051.15 | | | $ | 5.53 | | | | 1.07 | % |
Hypothetical (5% return before expenses) | | $ | 1,000.00 | | | $ | 1,019.81 | | | $ | 5.45 | | | | 1.07 | % |
Class C | | | | | | | | | | | | | | | | |
Actual | | $ | 1,000.00 | | | $ | 1,047.17 | | | $ | 9.39 | | | | 1.82 | % |
Hypothetical (5% return before expenses) | | $ | 1,000.00 | | | $ | 1,016.03 | | | $ | 9.25 | | | | 1.82 | % |
Class R | | | | | | | | | | | | | | | | |
Actual | | $ | 1,000.00 | | | $ | 1,049.65 | | | $ | 6.82 | | | | 1.32 | % |
Hypothetical (5% return before expenses) | | $ | 1,000.00 | | | $ | 1,018.55 | | | $ | 6.72 | | | | 1.32 | % |
Class R4 | | | | | | | | | | | | | | | | |
Actual | | $ | 1,000.00 | | | $ | 1,052.62 | | | $ | 3.88 | | | | 0.75 | % |
Hypothetical (5% return before expenses) | | $ | 1,000.00 | | | $ | 1,021.42 | | | $ | 3.82 | | | | 0.75 | % |
Class R6 | | | | | | | | | | | | | | | | |
Actual | | $ | 1,000.00 | | | $ | 1,053.39 | | | $ | 3.11 | | | | 0.60 | % |
Hypothetical (5% return before expenses) | | $ | 1,000.00 | | | $ | 1,022.18 | | | $ | 3.06 | | | | 0.60 | % |
Administrator Class | | | | | | | | | | | | | | | | |
Actual | | $ | 1,000.00 | | | $ | 1,051.81 | | | $ | 4.91 | | | | 0.95 | % |
Hypothetical (5% return before expenses) | | $ | 1,000.00 | | | $ | 1,020.42 | | | $ | 4.84 | | | | 0.95 | % |
Institutional Class | | | | | | | | | | | | | | | | |
Actual | | $ | 1,000.00 | | | $ | 1,053.23 | | | $ | 3.36 | | | | 0.65 | % |
Hypothetical (5% return before expenses) | | $ | 1,000.00 | | | $ | 1,021.93 | | | $ | 3.31 | | | | 0.65 | % |
Investor Class | | | | | | | | | | | | | | | | |
Actual | | $ | 1,000.00 | | | $ | 1,050.55 | | | $ | 5.84 | | | | 1.13 | % |
Hypothetical (5% return before expenses) | | $ | 1,000.00 | | | $ | 1,019.51 | | | $ | 5.75 | | | | 1.13 | % |
| 1 | Expenses paid is equal to the annualized expense ratio of each class multiplied by the average account value over the period, multiplied by the number of days in the most recent fiscal half-year divided by the number of days in the fiscal year (to reflect the one-half-year period). |
| | | | | | |
| Portfolio of investments—January 31, 2015 (unaudited) | | Wells Fargo Advantage Large Cap Growth Fund | | | 7 | |
| | | | | | | | | | | | |
| Security name | | | | | | Shares | | | Value | |
| | | | |
Common Stocks: 98.69% | | | | | | | | | | | | |
| | | | |
Consumer Discretionary: 25.33% | | | | | | | | | | | | |
| | | | |
| Auto Components: 0.44% | | | | | | | | | | | | |
Delphi Automotive plc | | | | | | | 100,000 | | | $ | 6,873,000 | |
| | | | | | | | | | | | |
| | | | |
| Hotels, Restaurants & Leisure: 6.87% | | | | | | | | | | | | |
Chipotle Mexican Grill Incorporated † | | | | | | | 37,000 | | | | 26,264,080 | |
Hilton Worldwide Holdings Incorporated † | | | | | | | 400,000 | | | | 10,388,000 | |
Marriott International Incorporated Class A | | | | | | | 285,000 | | | | 21,232,500 | |
Starbucks Corporation | | | | | | | 320,000 | | | | 28,009,600 | |
Wynn Resorts Limited | | | | | | | 150,000 | | | | 22,192,500 | |
| | | | |
| | | | | | | | | | | 108,086,680 | |
| | | | | | | | | | | | |
| | | | |
| Internet & Catalog Retail: 2.41% | | | | | | | | | | | | |
Amazon.com Incorporated † | | | | | | | 61,000 | | | | 21,626,330 | |
Netflix Incorporated † | | | | | | | 14,000 | | | | 6,185,200 | |
The Priceline Group Incorporated † | | | | | | | 10,000 | | | | 10,094,800 | |
| | | | |
| | | | | | | | | | | 37,906,330 | |
| | | | | | | | | | | | |
| | | | |
| Media: 2.89% | | | | | | | | | | | | |
CBS Corporation Class B | | | | | | | 385,000 | | | | 21,101,850 | |
The Walt Disney Company | | | | | | | 267,000 | | | | 24,286,320 | |
| | | | |
| | | | | | | | | | | 45,388,170 | |
| | | | | | | | | | | | |
| | | | |
| Multiline Retail: 3.86% | | | | | | | | | | | | |
Dollar Tree Incorporated † | | | | | | | 538,000 | | | | 38,251,800 | |
Nordstrom Incorporated | | | | | | | 295,000 | | | | 22,479,000 | |
| | | | |
| | | | | | | | | | | 60,730,800 | |
| | | | | | | | | | | | |
| | | | |
| Specialty Retail: 5.01% | | | | | | | | | | | | |
CarMax Incorporated † | | | | | | | 429,000 | | | | 26,640,900 | |
O’Reilly Automotive Incorporated † | | | | | | | 131,000 | | | | 24,544,160 | |
Tractor Supply Company | | | | | | | 340,000 | | | | 27,597,800 | |
| | | | |
| | | | | | | | | | | 78,782,860 | |
| | | | | | | | | | | | |
| | | | |
| Textiles, Apparel & Luxury Goods: 3.85% | | | | | | | | | | | | |
Nike Incorporated Class B | | | | | | | 345,000 | | | | 31,826,250 | |
VF Corporation | | | | | | | 415,000 | | | | 28,788,550 | |
| | | | |
| | | | | | | | | | | 60,614,800 | |
| | | | | | | | | | | | |
| | | | |
Consumer Staples: 4.02% | | | | | | | | | | | | |
| | | | |
| Food & Staples Retailing: 2.21% | | | | | | | | | | | | |
Costco Wholesale Corporation | | | | | | | 243,000 | | | | 34,746,570 | |
| | | | | | | | | | | | |
| | | | |
| Household Products: 0.79% | | | | | | | | | | | | |
Colgate-Palmolive Company | | | | | | | 185,000 | | | | 12,491,200 | |
| | | | | | | | | | | | |
| | | | |
| Personal Products: 1.02% | | | | | | | | | | | | |
Estee Lauder Companies Incorporated Class A | | | | | | | 226,660 | | | | 15,999,929 | |
| | | | | | | | | | | | |
The accompanying notes are an integral part of these financial statements.
| | | | |
| 8 | | Wells Fargo Advantage Large Cap Growth Fund | | Portfolio of investments—January 31, 2015 (unaudited) |
| | | | | | | | | | | | |
| Security name | | | | | | Shares | | | Value | |
| | | | |
Energy: 4.15% | | | | | | | | | | | | |
| | | | |
| Energy Equipment & Services: 1.23% | | | | | | | | | | | | |
Schlumberger Limited | | | | | | | 235,000 | | | $ | 19,361,650 | |
| | | | | | | | | | | | |
| | | | |
| Oil, Gas & Consumable Fuels: 2.92% | | | | | | | | | | | | |
Concho Resources Incorporated † | | | | | | | 210,000 | | | | 23,278,500 | |
Pioneer Natural Resources Company | | | | | | | 150,000 | | | | 22,579,500 | |
| | | | |
| | | | | | | | | | | 45,858,000 | |
| | | | | | | | | | | | |
| | | | |
Financials: 5.59% | | | | | | | | | | | | |
| | | | |
| Capital Markets: 2.25% | | | | | | | | | | | | |
Ameriprise Financial Incorporated | | | | | | | 60,000 | | | | 7,496,400 | |
Northern Trust Corporation | | | | | | | 71,000 | | | | 4,641,980 | |
TD Ameritrade Holding Corporation | | | | | | | 719,000 | | | | 23,288,410 | |
| | | | |
| | | | | | | | | | | 35,426,790 | |
| | | | | | | | | | | | |
| | | | |
| Consumer Finance: 2.84% | | | | | | | | | | | | |
American Express Company | | | | | | | 309,340 | | | | 24,960,645 | |
Discover Financial Services | | | | | | | 363,000 | | | | 19,739,940 | |
| | | | |
| | | | | | | | | | | 44,700,585 | |
| | | | | | | | | | | | |
| | | | |
| REITs: 0.50% | | | | | | | | | | | | |
American Tower Corporation | | | | | | | 80,000 | | | | 7,756,000 | |
| | | | | | | | | | | | |
| | | | |
Health Care: 15.64% | | | | | | | | | | | | |
| | | | |
| Biotechnology: 9.96% | | | | | | | | | | | | |
Alexion Pharmaceuticals Incorporated † | | | | | | | 220,000 | | | | 40,312,800 | |
Biogen Idec Incorporated † | | | | | | | 89,960 | | | | 35,008,834 | |
Celgene Corporation † | | | | | | | 235,000 | | | | 28,002,600 | |
Gilead Sciences Incorporated † | | | | | | | 230,000 | | | | 24,110,900 | |
Regeneron Pharmaceuticals Incorporated † | | | | | | | 70,180 | | | | 29,241,199 | |
| | | | |
| | | | | | | | | | | 156,676,333 | |
| | | | | | | | | | | | |
| | | | |
| Health Care Equipment & Supplies: 0.89% | | | | | | | | | | | | |
Medtronic plc | | | | | | | 195,148 | | | | 13,933,587 | |
| | | | | | | | | | | | |
| | | | |
| Health Care Providers & Services: 1.21% | | | | | | | | | | | | |
AmerisourceBergen Corporation | | | | | | | 200,050 | | | | 19,014,753 | |
| | | | | | | | | | | | |
| | | | |
| Health Care Technology: 1.60% | | | | | | | | | | | | |
Cerner Corporation † | | | | | | | 380,000 | | | | 25,213,000 | |
| | | | | | | | | | | | |
| | | | |
| Pharmaceuticals: 1.98% | | | | | | | | | | | | |
Merck & Company Incorporated | | | | | | | 128,000 | | | | 7,715,840 | |
Perrigo Company plc | | | | | | | 155,000 | | | | 23,519,700 | |
| | | | |
| | | | | | | | | | | 31,235,540 | |
| | | | | | | | | | | | |
| | | | |
Industrials: 11.78% | | | | | | | | | | | | |
| | | | |
| Aerospace & Defense: 1.98% | | | | | | | | | | | | |
The Boeing Company | | | | | | | 120,000 | | | | 17,444,400 | |
United Technologies Corporation | | | | | | | 118,690 | | | | 13,623,238 | |
| | | | |
| | | | | | | | | | | 31,067,638 | |
| | | | | | | | | | | | |
The accompanying notes are an integral part of these financial statements.
| | | | | | |
| Portfolio of investments—January 31, 2015 (unaudited) | | Wells Fargo Advantage Large Cap Growth Fund | | | 9 | |
| | | | | | | | | | | | |
| Security name | | | | | | Shares | | | Value | |
| | | | |
| Air Freight & Logistics: 0.88% | | | | | | | | | | | | |
United Parcel Service Incorporated Class B | | | | | | | 140,050 | | | $ | 13,842,542 | |
| | | | | | | | | | | | |
| | | | |
| Airlines: 0.81% | | | | | | | | | | | | |
Southwest Airlines Company | | | | | | | 282,000 | | | | 12,740,760 | |
| | | | | | | | | | | | |
| | | | |
| Commercial Services & Supplies: 0.20% | | | | | | | | | | | | |
Tyco International plc | | | | | | | 76,000 | | | | 3,101,560 | |
| | | | | | | | | | | | |
| | | | |
| Industrial Conglomerates: 2.01% | | | | | | | | | | | | |
3M Company | | | | | | | 124,000 | | | | 20,125,200 | |
Danaher Corporation | | | | | | | 140,240 | | | | 11,552,971 | |
| | | | |
| | | | | | | | | | | 31,678,171 | |
| | | | | | | | | | | | |
| | | | |
| Road & Rail: 4.30% | | | | | | | | | | | | |
Kansas City Southern | | | | | | | 105,680 | | | | 11,634,311 | |
Norfolk Southern Corporation | | | | | | | 135,000 | | | | 13,765,950 | |
Union Pacific Corporation | | | | | | | 360,000 | | | | 42,195,600 | |
| | | | |
| | | | | | | | | | | 67,595,861 | |
| | | | | | | | | | | | |
| | | | |
| Trading Companies & Distributors: 1.60% | | | | | | | | | | | | |
W.W. Grainger Incorporated | | | | | | | 107,000 | | | | 25,234,880 | |
| | | | | | | | | | | | |
| | | | |
Information Technology: 28.08% | | | | | | | | | | | | |
| | | | |
| Communications Equipment: 0.87% | | | | | | | | | | | | |
QUALCOMM Incorporated | | | | | | | 220,080 | | | | 13,746,197 | |
| | | | | | | | | | | | |
| | | | |
| Internet Software & Services: 8.10% | | | | | | | | | | | | |
Akamai Technologies Incorporated † | | | | | | | 198,000 | | | | 11,514,690 | |
Facebook Incorporated Class A † | | | | | | | 554,000 | | | | 42,054,140 | |
Google Incorporated Class A † | | | | | | | 67,000 | | | | 36,015,850 | |
Google Incorporated Class C † | | | | | | | 65,000 | | | | 34,743,800 | |
Pandora Media Incorporated † | | | | | | | 187,000 | | | | 3,104,200 | |
| | | | |
| | | | | | | | | | | 127,432,680 | |
| | | | | | | | | | | | |
| | | | |
| IT Services: 6.28% | | | | | | | | | | | | |
Accenture plc | | | | | | | 145,000 | | | | 12,184,350 | |
Alliance Data Systems Corporation † | | | | | | | 88,000 | | | | 25,417,040 | |
MasterCard Incorporated Class A | | | | | | | 425,000 | | | | 34,862,750 | |
Visa Incorporated Class A | | | | | | | 103,000 | | | | 26,255,730 | |
| | | | |
| | | | | | | | | | | 98,719,870 | |
| | | | | | | | | | | | |
| | | | |
| Semiconductors & Semiconductor Equipment: 3.30% | | | | | | | | | | | | |
ARM Holdings plc ADR | | | | | | | 318,000 | | | | 14,895,120 | |
Microchip Technology Incorporated « | | | | | | | 490,000 | | | | 22,099,000 | |
Texas Instruments Incorporated | | | | | | | 280,000 | | | | 14,966,000 | |
| | | | |
| | | | | | | | | | | 51,960,120 | |
| | | | | | | | | | | | |
| | | | |
| Software: 6.44% | | | | | | | | | | | | |
Adobe Systems Incorporated † | | | | | | | 177,000 | | | | 12,413,010 | |
Microsoft Corporation | | | | | | | 813,000 | | | | 32,845,200 | |
The accompanying notes are an integral part of these financial statements.
| | | | |
| 10 | | Wells Fargo Advantage Large Cap Growth Fund | | Portfolio of investments—January 31, 2015 (unaudited) |
| | | | | | | | | | | | | | |
| Security name | | | | | | | Shares | | | Value | |
| | | | |
| Software (continued) | | | | | | | | | | | | | | |
Salesforce.com Incorporated † | | | | | | | | | 420,000 | | | $ | 23,709,000 | |
ServiceNow Incorporated † | | | | | | | | | 256,300 | | | | 18,684,270 | |
Splunk Incorporated † | | | | | | | | | 219,000 | | | | 11,311,350 | |
VMware Incorporated † | | | | | | | | | 31,000 | | | | 2,390,100 | |
| | | | |
| | | | | | | | | | | | | 101,352,930 | |
| | | | | | | | | | | | | | |
| | | | |
| Technology Hardware, Storage & Peripherals: 3.09% | | | | | | | | | | | | | | |
Apple Incorporated | | | | | | | | | 414,090 | | | | 48,514,784 | |
| | | | | | | | | | | | | | |
| | | | |
Materials: 4.10% | | | | | | | | | | | | | | |
| | | | |
| Chemicals: 4.10% | | | | | | | | | | | | | | |
Ecolab Incorporated | | | | | | | | | 231,760 | | | | 24,049,735 | |
Monsanto Company | | | | | | | | | 89,000 | | | | 10,500,220 | |
Praxair Incorporated | | | | | | | | | 249,000 | | | | 30,026,910 | |
| | | | |
| | | | | | | | | | | | | 64,576,865 | |
| | | | | | | | | | | | | | |
| | | | |
Total Common Stocks (Cost $1,053,613,657) | | | | | | | | | | | | | 1,552,361,435 | |
| | | | | | | | | | | | | | |
| | | | |
| | | Yield | | | | | | | | | |
| Short-Term Investments: 2.31% | | | | | | | | | | | | | | |
| | | | |
| Investment Companies: 2.31% | | | | | | | | | | | | | | |
Securities Lending Cash Investments, LLC (l)(u)(r) | | | 0.13 | % | | | | | 20,727,000 | | | | 20,727,000 | |
Wells Fargo Advantage Cash Investment Money Market Fund, Select Class (l)(u) | | | 0.10 | | | | | | 15,690,756 | | | | 15,690,756 | |
| | | | |
Total Short-Term Investments (Cost $36,417,756) | | | | | | | | | | | | | 36,417,756 | |
| | | | | | | | | | | | | | |
| | | | | | | | |
| Total investments in securities (Cost $1,090,031,413) * | | | 101.00 | % | | | 1,588,779,191 | |
Other assets and liabilities, net | | | (1.00 | ) | | | (15,784,349 | ) |
| | | | | | | | |
| Total net assets | | | 100.00 | % | | $ | 1,572,994,842 | |
| | | | | | | | |
| † | Non-income-earning security |
| « | All or a portion of this security is on loan. |
| (l) | The security represents an affiliate of the Fund as defined in the Investment Company Act of 1940. |
| (u) | The rate represents the 7-day annualized yield at period end. |
| (r) | The investment is a non-registered investment vehicle purchased with cash collateral received from securities on loan. |
| * | Cost for federal income tax purposes is $1,091,472,520 and unrealized gains (losses) consists of: |
| | | | |
Gross unrealized gains | | $ | 505,701,323 | |
Gross unrealized losses | | | (8,394,652 | ) |
| | | | |
Net unrealized gains | | $ | 497,306,671 | |
The accompanying notes are an integral part of these financial statements.
| | | | | | |
| Statement of assets and liabilities—January 31, 2015 (unaudited) | | Wells Fargo Advantage Large Cap Growth Fund | | | 11 | |
| | | | |
| | | | |
| |
Assets | | | | |
Investments | | | | |
In unaffiliated securities (including $20,219,850 of securities loaned), at value (cost $1,053,613,657) | | $ | 1,552,361,435 | |
In affiliated securities, at value (cost $36,417,756) | | | 36,417,756 | |
| | | | |
Total investments, at value (cost $1,090,031,413) | | | 1,588,779,191 | |
Receivable for investments sold | | | 19,538,966 | |
Receivable for Fund shares sold | | | 1,121,381 | |
Receivable for dividends | | | 347,200 | |
Receivable for securities lending income | | | 4,161 | |
Prepaid expenses and other assets | | | 46,759 | |
| | | | |
Total assets | | | 1,609,837,658 | |
| | | | |
| |
Liabilities | | | | |
Payable for investments purchased | | | 13,204,588 | |
Payable for Fund shares redeemed | | | 1,577,579 | |
Payable upon receipt of securities loaned | | | 20,727,000 | |
Advisory fee payable | | | 696,443 | |
Distribution fees payable | | | 17,502 | |
Administration fees payable | | | 320,214 | |
Accrued expenses and other liabilities | | | 299,490 | |
| | | | |
Total liabilities | | | 36,842,816 | |
| | | | |
Total net assets | | $ | 1,572,994,842 | |
| | | | |
| |
NET ASSETS CONSIST OF | | | | |
Paid-in capital | | $ | 1,043,162,001 | |
Overdistributed net investment income | | | (785,580 | ) |
Accumulated net realized gains on investments | | | 31,870,643 | |
Net unrealized gains on investments | | | 498,747,778 | |
| | | | |
Total net assets | | $ | 1,572,994,842 | |
| | | | |
| |
COMPUTATION OF NET ASSET VALUE AND OFFERING PRICE PER SHARE | | | | |
Net assets – Class A | | $ | 191,406,435 | |
Shares outstanding – Class A1 | | | 4,202,539 | |
Net asset value per share – Class A | | | $45.55 | |
Maximum offering price per share – Class A2 | | | $48.33 | |
Net assets – Class C | | $ | 22,548,608 | |
Shares outstanding – Class C1 | | | 512,528 | |
Net asset value per share – Class C | | | $43.99 | |
Net assets – Class R | | $ | 11,193,112 | |
Shares outstanding – Class R1 | | | 247,652 | |
Net asset value per share – Class R | | | $45.20 | |
Net assets – Class R4 | | $ | 2,228,130 | |
Share outstanding – Class R41 | | | 48,333 | |
Net asset value per share – Class R4 | | | $46.10 | |
Net assets – Class R6 | | $ | 9,547,125 | |
Shares outstanding – Class R61 | | | 206,811 | |
Net asset value per share – Class R6 | | | $46.16 | |
Net assets – Administrator Class | | $ | 254,868,221 | |
Shares outstanding – Administrator Class1 | | | 5,566,659 | |
Net asset value per share – Administrator Class | | | $45.78 | |
Net assets – Institutional Class | | $ | 617,160,130 | |
Shares outstanding – Institutional Class1 | | | 13,374,828 | |
Net asset value per share – Institutional Class | | | $46.14 | |
Net assets – Investor Class | | $ | 464,043,081 | |
Shares outstanding – Investor Class1 | | | 10,209,537 | |
Net asset value per share – Investor Class | | | $45.45 | |
| 1 | The Fund has an unlimited number of authorized shares. |
| 2 | Maximum offering price is computed as 100/94.25 of net asset value. On investments of $50,000 or more, the offering price is reduced. |
The accompanying notes are an integral part of these financial statements.
| | | | |
| 12 | | Wells Fargo Advantage Large Cap Growth Fund | | Statement of operations—six months ended January 31, 2015 (unaudited) |
| | | | |
| | | | |
| |
Investment income | | | | |
Dividends | | $ | 7,483,451 | |
Securities lending income, net | | | 173,030 | |
Income from affiliated securities | | | 8,394 | |
| | | | |
Total investment income | | | 7,664,875 | |
| | | | |
| |
Expenses | | | | |
Advisory fee | | | 5,026,776 | |
Administration fees | | | | |
Fund level | | | 403,059 | |
Class A | | | 275,534 | |
Class C | | | 29,977 | |
Class R | | | 16,131 | |
Class R4 | | | 885 | |
Class R6 | | | 1,033 | |
Administrator Class | | | 126,877 | |
Institutional Class | | | 249,085 | |
Investor Class | | | 766,807 | |
Shareholder servicing fees | | | | |
Class A | | | 264,937 | |
Class C | | | 28,824 | |
Class R | | | 15,511 | |
Class R4 | | | 1,106 | |
Administrator Class | | | 317,192 | |
Investor Class | | | 598,733 | |
Distribution fees | | | | |
Class C | | | 86,472 | |
Class R | | | 15,511 | |
Custody and accounting fees | | | 42,808 | |
Professional fees | | | 23,114 | |
Registration fees | | | 33,522 | |
Shareholder report expenses | | | 45,175 | |
Trustees’ fees and expenses | | | 5,334 | |
Other fees and expenses | | | 14,101 | |
| | | | |
Total expenses | | | 8,388,504 | |
Less: Fee waivers and/or expense reimbursements | | | (996,954 | ) |
| | | | |
Net expenses | | | 7,391,550 | |
| | | | |
Net investment income | | | 273,325 | |
| | | | |
| |
REALIZED AND UNREALIZED GAINS (LOSSES) ON INVESTMENTS | | | | |
Net realized gains on investments | | | 49,767,454 | |
Net change in unrealized gains (losses) on investments | | | 30,684,169 | |
| | | | |
Net realized and unrealized gains (losses) on investments | | | 80,451,623 | |
| | | | |
Net increase in net assets resulting from operations | | $ | 80,724,948 | |
| | | | |
The accompanying notes are an integral part of these financial statements.
| | | | | | |
| Statement of changes in net assets | | Wells Fargo Advantage Large Cap Growth Fund | | | 13 | |
| | | | | | | | | | | | | | | | |
| | | Six months ended
January 31, 2015
(unaudited) | | | Year ended
July 31, 2014 | |
| | | | |
Operations | | | | | | | | | | | | | | | | |
Net investment income | | | | | | $ | 273,325 | | | | | | | $ | 172,848 | |
Net realized gains on investments | | | | | | | 49,767,454 | | | | | | | | 60,654,948 | |
Net change in unrealized gains (losses) on investments | | | | | | | 30,684,169 | | | | | | | | 174,376,667 | |
| | | | |
Net increase in net assets resulting from operations | | | | | | | 80,724,948 | | | | | | | | 235,204,463 | |
| | | | |
| | | | |
Distributions to shareholders from | | | | | | | | | | | | | | | | |
Net investment income | | | | | | | | | | | | | | | | |
Class R4 | | | | | | | 0 | | | | | | | | (4,387 | ) |
Class R6 | | | | | | | (5,386 | ) | | | | | | | (7,794 | ) |
Administrator Class | | | | | | | 0 | | | | | | | | (59,550 | ) |
Institutional Class | | | | | | | (392,482 | ) | | | | | | | (1,868,612 | ) |
Net realized gains | | | | | | | | | | | | | | | | |
Class A | | | | | | | (9,083,839 | ) | | | | | | | (4,658,059 | ) |
Class C | | | | | | | (1,024,180 | ) | | | | | | | (653,384 | ) |
Class R | | | | | | | (537,456 | ) | | | | | | | (306,050 | ) |
Class R4 | | | | | | | (95,079 | ) | | | | | | | (60,168 | ) |
Class R6 | | | | | | | (286,515 | ) | | | | | | | (74,852 | ) |
Administrator Class | | | | | | | (10,809,645 | ) | | | | | | | (7,171,992 | ) |
Institutional Class | | | | | | | (26,749,729 | ) | | | | | | | (19,978,900 | ) |
Investor Class | | | | | | | (21,002,276 | ) | | | | | | | (14,255,159 | ) |
| | | | |
Total distributions to shareholders | | | | | | | (69,986,587 | ) | | | | | | | (49,098,907 | ) |
| | | | |
| | | | |
Capital share transactions | | | Shares | | | | | | | | Shares | | | | | |
Proceeds from shares sold | | | | | | | | | | | | | | | | |
Class A | | | 376,090 | | | | 17,297,890 | | | | 2,384,131 | | | | 107,006,712 | |
Class C | | | 48,540 | | | | 2,169,282 | | | | 170,033 | | | | 7,224,612 | |
Class R | | | 38,485 | | | | 1,773,444 | | | | 136,101 | | | | 5,915,209 | |
Class R4 | | | 941 | | | | 43,753 | | | | 48,161 | | | | 2,121,409 | |
Class R6 | | | 81,984 | | | | 3,785,685 | | | | 83,639 | | | | 3,865,129 | |
Administrator Class | | | 636,037 | | | | 29,628,269 | | | | 1,144,191 | | | | 50,164,994 | |
Institutional Class | | | 993,770 | | | | 46,562,077 | | | | 4,448,404 | | | | 195,300,403 | |
Investor Class | | | 550,396 | | | | 25,339,734 | | | | 987,838 | | | | 42,995,980 | |
| | | | |
| | | | | | | 126,600,134 | | | | | | | | 414,594,448 | |
| | | | |
Reinvestment of distributions | | | | | | | | | | | | | | | | |
Class A | | | 162,602 | | | | 7,413,044 | | | | 82,404 | | | | 3,548,337 | |
Class C | | | 17,563 | | | | 774,161 | | | | 11,441 | | | | 480,638 | |
Class R | | | 4,110 | | | | 186,032 | | | | 2,882 | | | | 123,532 | |
Class R4 | | | 2,062 | | | | 95,079 | | | | 1,485 | | | | 64,555 | |
Class R6 | | | 6,321 | | | | 291,901 | | | | 1,899 | | | | 82,646 | |
Administrator Class | | | 235,753 | | | | 10,802,180 | | | | 162,979 | | | | 7,043,571 | |
Institutional Class | | | 511,339 | | | | 23,607,761 | | | | 431,004 | | | | 18,751,184 | |
Investor Class | | | 448,656 | | | | 20,413,846 | | | | 322,257 | | | | 13,857,073 | |
| | | | |
| | | | | | | 63,584,004 | | | | | | | | 43,951,536 | |
| | | | |
Payment for shares redeemed | | | | | | | | | | | | | | | | |
Class A | | | (1,021,836 | ) | | | (47,424,286 | ) | | | (1,093,357 | ) | | | (48,066,527 | ) |
Class C | | | (71,119 | ) | | | (3,180,273 | ) | | | (120,153 | ) | | | (5,074,286 | ) |
Class R | | | (67,997 | ) | | | (3,124,720 | ) | | | (71,737 | ) | | | (3,119,078 | ) |
Class R4 | | | (1,190 | ) | | | (55,587 | ) | | | (3,419 | ) | | | (151,575 | ) |
Class R6 | | | (11,187 | ) | | | (522,396 | ) | | | (12,634 | ) | | | (551,207 | ) |
Administrator Class | | | (697,488 | ) | | | (32,648,123 | ) | | | (1,133,872 | ) | | | (49,716,022 | ) |
Institutional Class | | | (1,142,635 | ) | | | (53,459,052 | ) | | | (4,554,967 | ) | | | (204,052,931 | ) |
Investor Class | | | (1,119,846 | ) | | | (51,494,260 | ) | | | (1,219,233 | ) | | | (53,051,196 | ) |
| | | | |
| | | | | | | (191,908,697 | ) | | | | | | | (363,782,822 | ) |
| | | | |
Net increase (decrease) in net assets resulting from capital share transactions | | | | | | | (1,724,559 | ) | | | | | | | 94,763,162 | |
| | | | |
Total increase in net assets | | | | | | | 9,013,802 | | | | | | | | 280,868,718 | |
| | | | |
| | | | |
Net assets | | | | | | | | | | | | | | | | |
Beginning of period | | | | | | | 1,563,981,040 | | | | | | | | 1,283,112,322 | |
| | | | |
End of period | | | | | | $ | 1,572,994,842 | | | | | | | $ | 1,563,981,040 | |
| | | | |
Overdistributed net investment income | | | | | | $ | (785,580 | ) | | | | | | $ | (661,037 | ) |
| | | | |
The accompanying notes are an integral part of these financial statements.
| | | | |
| 14 | | Wells Fargo Advantage Large Cap Growth Fund | | Financial highlights |
(For a share outstanding throughout each period)
| | | | | | | | | | | | | | | | | | | | | | | | |
| | | Six months ended
January 31, 2015 (unaudited) | | | Year ended July 31 | |
| CLASS A | | | 2014 | | | 2013 | | | 2012 | | | 2011 | | | 20101 | |
Net asset value, beginning of period | | | $45.30 | | | | $39.73 | | | | $32.92 | | | | $31.62 | | | | $24.54 | | | | $24.54 | |
Net investment income (loss) | | | (0.04 | ) | | | (0.06 | ) | | | 0.04 | | | | (0.12 | )2 | | | (0.10 | )2 | | | 0.00 | 3 |
Net realized and unrealized gains (losses) on investments | | | 2.36 | | | | 7.01 | | | | 6.81 | | | | 1.42 | | | | 7.18 | | | | 0.00 | 3 |
| | | | | | | | | | | | | | | | | | | | | | | | |
Total from investment operations | | | 2.32 | | | | 6.95 | | | | 6.85 | | | | 1.30 | | | | 7.08 | | | | 0.00 | 3 |
Distributions to shareholders from | | | | | | | | | | | | | | | | | | | | | | | | |
Net investment income | | | 0.00 | | | | 0.00 | | | | (0.04 | ) | | | 0.00 | | | | 0.00 | | | | 0.00 | |
Net realized gains | | | (2.07 | ) | | | (1.38 | ) | | | 0.00 | | | | 0.00 | | | | 0.00 | | | | 0.00 | |
| | | | | | | | | | | | | | | | | | | | | | | | |
Total distributions to shareholders | | | (2.07 | ) | | | (1.38 | ) | | | (0.04 | ) | | | 0.00 | | | | 0.00 | | | | 0.00 | |
Net asset value, end of period | | | $45.55 | | | | $45.30 | | | | $39.73 | | | | $32.92 | | | | $31.62 | | | | $24.54 | |
Total return4 | | | 5.11 | % | | | 17.69 | % | | | 20.84 | % | | | 4.08 | % | | | 28.89 | % | | | 0.00 | % |
Ratios to average net assets (annualized) | | | | | | | | | | | | | | | | | | | | | | | | |
Gross expenses | | | 1.20 | % | | | 1.22 | % | | | 1.23 | % | | | 1.24 | % | | | 1.25 | % | | | 0.00 | % |
Net expenses | | | 1.07 | % | | | 1.07 | % | | | 1.07 | % | | | 1.10 | % | | | 1.12 | % | | | 0.00 | % |
Net investment income (loss) | | | (0.11 | )% | | | (0.17 | )% | | | 0.09 | % | | | (0.37 | )% | | | (0.33 | )% | | | 0.00 | % |
Supplemental data | | | | | | | | | | | | | | | | | | | | | | | | |
Portfolio turnover rate | | | 14 | % | | | 35 | % | | | 57 | % | | | 46 | % | | | 47 | % | | | 60 | % |
Net assets, end of period (000s omitted) | | | $191,406 | | | | $212,273 | | | | $131,616 | | | | $75,149 | | | | $2,368 | | | | $10 | |
| 1 | For the period from July 30, 2010 (commencement of class operations) to July 31, 2010 |
| 2 | Calculated based upon average shares outstanding |
| 3 | Amount is less than $0.005. |
| 4 | Total return calculations do not include any sales charges. Returns for periods of less than one year are not annualized. |
The accompanying notes are an integral part of these financial statements.
| | | | | | |
| Financial highlights | | Wells Fargo Advantage Large Cap Growth Fund | | | 15 | |
(For a share outstanding throughout each period)
| | | | | | | | | | | | | | | | | | | | | | | | |
| | | Six months ended
January 31, 2015 (unaudited) | | | Year ended July 31 | |
| CLASS C | | | 2014 | | | 2013 | | | 2012 | | | 2011 | | | 20101 | |
Net asset value, beginning of period | | | $43.99 | | | | $38.90 | | | | $32.43 | | | | $31.38 | | | | $24.54 | | | | $24.54 | |
Net investment income (loss) | | | (0.20 | ) | | | (0.33 | ) | | | (0.20 | ) | | | (0.37 | )2 | | | (0.32 | )2 | | | 0.00 | 3 |
Net realized and unrealized gains (losses) on investments | | | 2.27 | | | | 6.80 | | | | 6.67 | | | | 1.42 | | | | 7.16 | | | | 0.00 | 3 |
| | | | | | | | | | | | | | | | | | | | | | | | |
Total from investment operations | | | 2.07 | | | | 6.47 | | | | 6.47 | | | | 1.05 | | | | 6.84 | | | | 0.00 | 3 |
Distributions to shareholders from | | | | | | | | | | | | | | | | | | | | | | | | |
Net realized gains | | | (2.07 | ) | | | (1.38 | ) | | | 0.00 | | | | 0.00 | | | | 0.00 | | | | 0.00 | |
Net asset value, end of period | | | $43.99 | | | | $43.99 | | | | $38.90 | | | | $32.43 | | | | $31.38 | | | | $24.54 | |
Total return4 | | | 4.72 | % | | | 16.81 | % | | | 19.95 | % | | | 3.31 | % | | | 27.91 | % | | | 0.00 | % |
Ratios to average net assets (annualized) | | | | | | | | | | | | | | | | | | | | | | | | |
Gross expenses | | | 1.95 | % | | | 1.97 | % | | | 1.98 | % | | | 1.99 | % | | | 2.00 | % | | | 0.00 | % |
Net expenses | | | 1.82 | % | | | 1.82 | % | | | 1.82 | % | | | 1.84 | % | | | 1.87 | % | | | 0.00 | % |
Net investment income (loss) | | | (0.87 | )% | | | (0.89 | )% | | | (0.65 | )% | | | (1.16 | )% | | | (1.04 | )% | | | 0.00 | % |
Supplemental data | | | | | | | | | | | | | | | | | | | | | | | | |
Portfolio turnover rate | | | 14 | % | | | 35 | % | | | 57 | % | | | 46 | % | | | 47 | % | | | 60 | % |
Net assets, end of period (000s omitted) | | | $22,549 | | | | $22,767 | | | | $17,748 | | | | $11,829 | | | | $272 | | | | $10 | |
| 1 | For the period from July 30, 2010 (commencement of class operations) to July 31, 2010 |
| 2 | Calculated based upon average shares outstanding |
| 3 | Amount is less than $0.005. |
| 4 | Total return calculations do not include any sales charges. Returns for periods of less than one year are not annualized. |
The accompanying notes are an integral part of these financial statements.
| | | | |
| 16 | | Wells Fargo Advantage Large Cap Growth Fund | | Financial highlights |
(For a share outstanding throughout each period)
| | | | | | | | | | | | | | | | |
| | | Six months ended
January 31, 2015 (unaudited) | | | Year ended July 31 | |
| CLASS R | | | 2014 | | | 2013 | | | 20121 | |
Net asset value, beginning of period | | | $45.03 | | | | $39.59 | | | | $32.86 | | | | $32.91 | |
Net investment loss | | | (0.11 | ) | | | (0.15 | ) | | | (0.06 | )2 | | | (0.05 | )2 |
Net realized and unrealized gains (losses) on investments | | | 2.35 | | | | 6.97 | | | | 6.80 | | | | 0.00 | 3 |
| | | | | | | | | | | | | | | | |
Total from investment operations | | | 2.24 | | | | 6.82 | | | | 6.74 | | | | (0.05 | ) |
Distributions to shareholders from | | | | | | | | | | | | | | | | |
Net investment income | | | 0.00 | | | | 0.00 | | | | (0.01 | ) | | | 0.00 | |
Net realized gains | | | (2.07 | ) | | | (1.38 | ) | | | 0.00 | | | | 0.00 | |
| | | | | | | | | | | | | | | | |
Total distributions to shareholders | | | (2.07 | ) | | | (1.38 | ) | | | (0.01 | ) | | | 0.00 | |
Net asset value, end of period | | | $45.20 | | | | $45.03 | | | | $39.59 | | | | $32.86 | |
Total return4 | | | 4.97 | % | | | 17.42 | % | | | 20.53 | % | | | (0.15 | )% |
Ratios to average net assets (annualized) | | | | | | | | | | | | | | | | |
Gross expenses | | | 1.45 | % | | | 1.47 | % | | | 1.47 | % | | | 1.47 | % |
Net expenses | | | 1.32 | % | | | 1.32 | % | | | 1.32 | % | | | 1.32 | % |
Net investment loss | | | (0.36 | )% | | | (0.41 | )% | | | (0.16 | )% | | | (0.95 | )% |
Supplemental data | | | | | | | | | | | | | | | | |
Portfolio turnover rate | | | 14 | % | | | 35 | % | | | 57 | % | | | 46 | % |
Net assets, end of period (000s omitted) | | | $11,193 | | | | $12,295 | | | | $8,149 | | | | $5,065 | |
| 1 | For the period from June 15, 2012 (commencement of class operations) to July 31, 2012 |
| 2 | Calculated based upon average shares outstanding |
| 3 | Amount is less than $0.005. |
| 4 | Returns for periods of less than one year are not annualized. |
The accompanying notes are an integral part of these financial statements.
| | | | | | |
| Financial highlights | | Wells Fargo Advantage Large Cap Growth Fund | | | 17 | |
(For a share outstanding throughout each period)
| | | | | | | | | | | | |
| | | Six months ended
January 31, 2015 (unaudited) | | | Year ended July 31 | |
| CLASS R4 | | | 2014 | | | 20131 | |
Net asset value, beginning of period | | | $45.76 | | | | $40.05 | | | | $34.26 | |
Net investment income | | | 0.05 | | | | 0.08 | | | | 0.09 | |
Net realized and unrealized gains (losses) on investments | | | 2.36 | | | | 7.11 | | | | 5.81 | |
| | | | | | | | | | | | |
Total from investment operations | | | 2.41 | | | | 7.19 | | | | 5.90 | |
Distributions to shareholders from | | | | | | | | | | | | |
Net investment income | | | 0.00 | | | | (0.10 | ) | | | (0.11 | ) |
Net realized gains | | | (2.07 | ) | | | (1.38 | ) | | | 0.00 | |
| | | | | | | | | | | | |
Total distributions to shareholders | | | (2.07 | ) | | | (1.48 | ) | | | (0.11 | ) |
Net asset value, end of period | | | $46.10 | | | | $45.76 | | | | $40.05 | |
Total return2 | | | 5.26 | % | | | 18.07 | % | | | 17.37 | % |
Ratios to average net assets (annualized) | | | | | | | | | | | | |
Gross expenses | | | 0.87 | % | | | 0.89 | % | | | 0.87 | % |
Net expenses | | | 0.75 | % | | | 0.75 | % | | | 0.75 | % |
Net investment income | | | 0.20 | % | | | 0.17 | % | | | 0.39 | % |
Supplemental data | | | | | | | | | | | | |
Portfolio turnover rate | | | 14 | % | | | 35 | % | | | 57 | % |
Net assets, end of period (000s omitted) | | | $2,228 | | | | $2,129 | | | | $12 | |
| 1 | For the period from November 30, 2012 (commencement of class operations) to July 31, 2013 |
| 2 | Returns for periods of less than one year are not annualized. |
The accompanying notes are an integral part of these financial statements.
| | | | |
| 18 | | Wells Fargo Advantage Large Cap Growth Fund | | Financial highlights |
(For a share outstanding throughout each period)
| | | | | | | | | | | | |
| | | Six months ended
January 31, 2015 (unaudited) | | | Year ended July 31 | |
| CLASS R6 | | | 2014 | | | 20131 | |
Net asset value, beginning of period | | | $45.82 | | | | $40.11 | | | | $34.26 | |
Net investment income | | | 0.07 | | | | 0.12 | | | | 0.15 | |
Net realized and unrealized gains (losses) on investments | | | 2.38 | | | | 7.11 | | | | 5.82 | |
| | | | | | | | | | | | |
Total from investment operations | | | 2.45 | | | | 7.23 | | | | 5.97 | |
Distributions to shareholders from | | | | | | | | | | | | |
Net investment income | | | (0.04 | ) | | | (0.14 | ) | | | (0.12 | ) |
Net realized gains | | | (2.07 | ) | | | (1.38 | ) | | | 0.00 | |
| | | | | | | | | | | | |
Total distributions to shareholders | | | (2.11 | ) | | | (1.52 | ) | | | (0.12 | ) |
Net asset value, end of period | | | $46.16 | | | | $45.82 | | | | $40.11 | |
Total return2 | | | 5.34 | % | | | 18.25 | % | | | 17.48 | % |
Ratios to average net assets (annualized) | | | | | | | | | | | | |
Gross expenses | | | 0.72 | % | | | 0.74 | % | | | 0.75 | % |
Net expenses | | | 0.60 | % | | | 0.60 | % | | | 0.60 | % |
Net investment income | | | 0.31 | % | | | 0.29 | % | | | 0.26 | % |
Supplemental data | | | | | | | | | | | | |
Portfolio turnover rate | | | 14 | % | | | 35 | % | | | 57 | % |
Net assets, end of period (000s omitted) | | | $9,547 | | | | $5,942 | | | | $2,278 | |
| 1 | For the period from November 30, 2012 (commencement of class operations) to July 31, 2013 |
| 2 | Returns for periods of less than one year are not annualized. |
The accompanying notes are an integral part of these financial statements.
| | | | | | |
| Financial highlights | | Wells Fargo Advantage Large Cap Growth Fund | | | 19 | |
(For a share outstanding throughout each period)
| | | | | | | | | | | | | | | | | | | | | | | | |
| | | Six months ended
January 31, 2015 (unaudited) | | | Year ended July 31 | |
| ADMINISTRATOR CLASS | | | 2014 | | | 2013 | | | 2012 | | | 2011 | | | 20101 | |
Net asset value, beginning of period | | | $45.50 | | | | $39.86 | | | | $33.02 | | | | $31.67 | | | | $24.54 | | | | $24.54 | |
Net investment income (loss) | | | (0.00 | )2,3 | | | (0.01 | ) | | | 0.09 | 2 | | | (0.06 | )2 | | | (0.06 | )2 | | | 0.00 | 3 |
Net realized and unrealized gains (losses) on investments | | | 2.35 | | | | 7.04 | | | | 6.83 | | | | 1.41 | | | | 7.19 | | | | 0.00 | 3 |
| | | | | | | | | | | | | | | | | | | | | | | | |
Total from investment operations | | | 2.35 | | | | 7.03 | | | | 6.92 | | | | 1.35 | | | | 7.13 | | | | 0.00 | 3 |
Distributions to shareholders from | | | | | | | | | | | | | | | | | | | | | | | | |
Net investment income | | | 0.00 | | | | (0.01 | ) | | | (0.08 | ) | | | 0.00 | | | | 0.00 | | | | 0.00 | |
Net realized gains | | | (2.07 | ) | | | (1.38 | ) | | | 0.00 | | | | 0.00 | | | | 0.00 | | | | 0.00 | |
| | | | | | | | | | | | | | | | | | | | | | | | |
Total distributions to shareholders | | | (2.07 | ) | | | (1.39 | ) | | | (0.08 | ) | | | 0.00 | | | | 0.00 | | | | 0.00 | |
Net asset value, end of period | | | $45.78 | | | | $45.50 | | | | $39.86 | | | | $33.02 | | | | $31.67 | | | | $24.54 | |
Total return4 | | | 5.18 | % | | | 17.84 | % | | | 21.00 | % | | | 4.26 | % | | | 29.05 | % | | | 0.00 | % |
Ratios to average net assets (annualized) | | | | | | | | | | | | | | | | | | | | | | | | |
Gross expenses | | | 1.04 | % | | | 1.06 | % | | | 1.07 | % | | | 1.08 | % | | | 1.07 | % | | | 0.00 | % |
Net expenses | | | 0.95 | % | | | 0.95 | % | | | 0.95 | % | | | 0.95 | % | | | 0.94 | % | | | 0.00 | % |
Net investment income (loss) | | | (0.00 | )% | | | (0.02 | )% | | | 0.24 | % | | | (0.17 | )% | | | (0.19 | )% | | | 0.00 | % |
Supplemental data | | | | | | | | | | | | | | | | | | | | | | | | |
Portfolio turnover rate | | | 14 | % | | | 35 | % | | | 57 | % | | | 46 | % | | | 47 | % | | | 60 | % |
Net assets, end of period (000s omitted) | | | $254,868 | | | | $245,364 | | | | $208,053 | | | | $75,099 | | | | $1,379 | | | | $10 | |
| 1 | For the period from July 30, 2010 (commencement of class operations) to July 31, 2010 |
| 2 | Calculated based upon average shares outstanding |
| 3 | Amount is less than $0.005. |
| 4 | Returns for periods of less than one year are not annualized. |
The accompanying notes are an integral part of these financial statements.
| | | | |
| 20 | | Wells Fargo Advantage Large Cap Growth Fund | | Financial highlights |
(For a share outstanding throughout each period)
| | | | | | | | | | | | | | | | | | | | | | | | |
| | | Six months ended
January 31, 2015 (unaudited) | | | Year ended July 31 | |
| INSTITUTIONAL CLASS | | | 2014 | | | 2013 | | | 2012 | | | 2011 | | | 20101 | |
Net asset value, beginning of period | | | $45.80 | | | | $40.11 | | | | $33.16 | | | | $31.73 | | | | $24.54 | | | | $24.54 | |
Net investment income (loss) | | | 0.07 | | | | 0.11 | | | | 0.20 | | | | (0.08 | )2 | | | (0.00 | )3 | | | 0.00 | 3 |
Net realized and unrealized gains (losses) on investments | | | 2.37 | | | | 7.09 | | | | 6.86 | | | | 1.51 | | | | 7.19 | | | | 0.00 | 3 |
| | | | | | | | | | | | | | | | | | | | | | | | |
Total from investment operations | | | 2.44 | | | | 7.20 | | | | 7.06 | | | | 1.43 | | | | 7.19 | | | | 0.00 | 3 |
Distributions to shareholders from | | | | | | | | | | | | | | | | | | | | | | | | |
Net investment income | | | (0.03 | ) | | | (0.13 | ) | | | (0.11 | ) | | | 0.00 | | | | 0.00 | | | | 0.00 | |
Net realized gains | | | (2.07 | ) | | | (1.38 | ) | | | 0.00 | | | | 0.00 | | | | 0.00 | | | | 0.00 | |
| | | | | | | | | | | | | | | | | | | | | | | | |
Total distributions to shareholders | | | (2.10 | ) | | | (1.51 | ) | | | (0.11 | ) | | | 0.00 | | | | 0.00 | | | | 0.00 | |
Net asset value, end of period | | | $46.14 | | | | $45.80 | | | | $40.11 | | | | $33.16 | | | | $31.73 | | | | $24.54 | |
Total return4 | | | 5.32 | % | | | 18.16 | % | | | 21.34 | % | | | 4.47 | % | | | 29.34 | % | | | 0.00 | % |
Ratios to average net assets (annualized) | | | | | | | | | | | | | | | | | | | | | | | | |
Gross expenses | | | 0.77 | % | | | 0.79 | % | | | 0.79 | % | | | 0.80 | % | | | 0.81 | % | | | 0.00 | % |
Net expenses | | | 0.65 | % | | | 0.65 | % | | | 0.69 | % | | | 0.75 | % | | | 0.75 | % | | | 0.00 | % |
Net investment income (loss) | | | 0.30 | % | | | 0.28 | % | | | 0.53 | % | | | (0.25 | )% | | | (0.01 | )% | | | 0.00 | % |
Supplemental data | | | | | | | | | | | | | | | | | | | | | | | | |
Portfolio turnover rate | | | 14 | % | | | 35 | % | | | 57 | % | | | 46 | % | | | 47 | % | | | 60 | % |
Net assets, end of period (000s omitted) | | | $617,160 | | | | $596,006 | | | | $508,853 | | | | $601,684 | | | | $846 | | | | $10 | |
| 1 | For the period from July 30, 2010 (commencement of class operations) to July 31, 2010 |
| 2 | Calculated based upon average shares outstanding |
| 3 | Amount is less than $0.005. |
| 4 | Returns for periods of less than one year are not annualized. |
The accompanying notes are an integral part of these financial statements.
| | | | | | |
| Financial highlights | | Wells Fargo Advantage Large Cap Growth Fund | | | 21 | |
(For a share outstanding throughout each period)
| | | | | | | | | | | | | | | | | | | | | | | | |
| | | Six months ended
January 31, 2015 (unaudited) | | | Year ended July 31 | |
| INVESTOR CLASS | | | 2014 | | | 2013 | | | 2012 | | | 2011 | | | 2010 | |
Net asset value, beginning of period | | | $45.23 | | | | $39.69 | | | | $32.86 | | | | $31.59 | | | | $24.54 | | | | $21.77 | |
Net investment income (loss) | | | (0.04 | ) | | | (0.09 | ) | | | 0.02 | | | | (0.07 | ) | | | (0.06 | ) | | | (0.02 | )1 |
Net realized and unrealized gains (losses) on investments | | | 2.33 | | | | 7.01 | | | | 6.81 | | | | 1.34 | | | | 7.11 | | | | 2.81 | |
| | | | | | | | | | | | | | | | | | | | | | | | |
Total from investment operations | | | 2.29 | | | | 6.92 | | | | 6.83 | | | | 1.27 | | | | 7.05 | | | | 2.79 | |
Distributions to shareholders from | | | | | | | | | | | | | | | | | | | | | | | | |
Net investment income | | | 0.00 | | | | 0.00 | | | | 0.00 | | | | 0.00 | | | | 0.00 | | | | (0.02 | ) |
Net realized gains | | | (2.07 | ) | | | (1.38 | ) | | | 0.00 | | | | 0.00 | | | | 0.00 | | | | 0.00 | |
| | | | | | | | | | | | | | | | | | | | | | | | |
Total distributions to shareholders | | | (2.07 | ) | | | (1.38 | ) | | | 0.00 | | | | 0.00 | | | | 0.00 | | | | (0.02 | ) |
Net asset value, end of period | | | $45.45 | | | | $45.23 | | | | $39.69 | | | | $32.86 | | | | $31.59 | | | | $24.54 | |
Total return2 | | | 5.05 | % | | | 17.63 | % | | | 20.79 | % | | | 4.02 | % | | | 28.73 | % | | | 12.80 | % |
Ratios to average net assets (annualized) | | | | | | | | | | | | | | | | | | | | | | | | |
Gross expenses | | | 1.26 | % | | | 1.28 | % | | | 1.28 | % | | | 1.32 | % | | | 1.32 | % | | | 1.43 | % |
Net expenses | | | 1.13 | % | | | 1.13 | % | | | 1.13 | % | | | 1.18 | % | | | 1.19 | % | | | 1.19 | % |
Net investment income (loss) | | | (0.18 | )% | | | (0.20 | )% | | | 0.06 | % | | | (0.23 | )% | | | (0.19 | )% | | | (0.07 | )% |
Supplemental data | | | | | | | | | | | | | | | | | | | | | | | | |
Portfolio turnover rate | | | 14 | % | | | 35 | % | | | 57 | % | | | 46 | % | | | 47 | % | | | 60 | % |
Net assets, end of period (000s omitted) | | | $464,043 | | | | $467,205 | | | | $406,405 | | | | $358,017 | | | | $336,128 | | | | $278,585 | |
| 1 | Calculated based upon average shares outstanding |
| 2 | Returns for periods of less than one year are not annualized. |
The accompanying notes are an integral part of these financial statements.
| | | | |
| 22 | | Wells Fargo Advantage Large Cap Growth Fund | | Notes to financial statements (unaudited) |
1. ORGANIZATION
Wells Fargo Funds Trust (the “Trust”), a Delaware statutory trust organized on March 10, 1999, is an open-end management investment company registered under the Investment Company Act of 1940, as amended (the “1940 Act”). As an investment company, the Trust follows the accounting and reporting guidance in Financial Accounting Standards Board (“FASB”) Accounting Standards Codification Topic 946, Financial Services – Investment Companies. These financial statements report on the Wells Fargo Advantage Large Cap Growth Fund (the “Fund”) which is a diversified series of the Trust.
2. SIGNIFICANT ACCOUNTING POLICIES
The following significant accounting policies, which are consistently followed in the preparation of the financial statements of the Fund, are in conformity with U.S. generally accepted accounting principles which require management to make estimates and assumptions that affect the reported amounts of assets and liabilities, disclosure of contingent assets and liabilities at the date of the financial statements, and the reported amounts of revenues and expenses during the reporting period. Actual results could differ from those estimates.
Securities valuation
All investments are valued each business day as of the close of regular trading on the New York Stock Exchange (generally 4 p.m. Eastern Time).
Equity securities that are listed on a foreign or domestic exchange or market are valued at the official closing price or, if none, the last sales price. If no sale occurs on the primary exchange or market for the security that day, the prior day’s price will be deemed “stale” and fair values will be determined in accordance with the Fund’s Valuation Procedures.
Investments in registered open-end investment companies are valued at net asset value. Non-registered investment vehicles are fair valued at net asset value.
Investments which are not valued using any of the methods discussed above are valued at their fair value, as determined in good faith by the Board of Trustees of the Fund. The Board of Trustees has established a Valuation Committee comprised of the Trustees and has delegated to it the authority to take any actions regarding the valuation of portfolio securities that the Valuation Committee deems necessary or appropriate, including determining the fair value of portfolio securities, unless the determination has been delegated to the Management Valuation Team of Wells Fargo Funds Management, LLC (“Funds Management”). The Board of Trustees retains the authority to make or ratify any valuation decisions or approve any changes to the Valuation Procedures as it deems appropriate. On a quarterly basis, the Board of Trustees receives reports on any valuation actions taken by the Valuation Committee or the Management Valuation Team which may include items for ratification.
Valuations of fair valued securities are compared to the next actual sales price when available, or other appropriate market values, to assess the continued appropriateness of the fair valuation methodologies used. These securities are fair valued on a day-to-day basis, taking into consideration changes to appropriate market information and any significant changes to the inputs considered in the valuation process until there is a readily available price provided on an exchange or by an independent pricing service. Valuations received from an independent pricing service or independent broker-dealer quotes are periodically validated by comparisons to most recent trades and valuations provided by other independent pricing services in addition to the review of prices by the adviser and/or subadviser. Unobservable inputs used in determining fair valuations are identified based on the type of security, taking into consideration factors utilized by market participants in valuing the investment, knowledge about the issuer and the current market environment.
Security loans
The Fund may lend its securities from time to time in order to earn additional income in the form of fees or interest on securities received as collateral or the investment of any cash received as collateral. The Fund continues to receive interest or dividends on the securities loaned. The Fund receives collateral in the form of cash or securities with a value at least equal to the value of the securities on loan. The value of the loaned securities is determined at the close of each business day and any additional required collateral is delivered to the Fund on the next business day. In a securities lending transaction, the net asset value of the Fund will be affected by an increase or decrease in the value of the securities loaned and by an increase or decrease in the value of the instrument in which collateral is invested. The amount of securities lending activity undertaken by the Fund fluctuates from time to time. In the event of default or bankruptcy by the borrower, the Fund may be prevented from recovering the loaned securities or gaining access to the collateral or may experience delays or costs in doing so. In addition, the investment of any cash collateral received may lose all or part of its value. The Fund has the right under the lending agreement to recover the securities from the borrower on demand.
| | | | | | |
| Notes to financial statements (unaudited) | | Wells Fargo Advantage Large Cap Growth Fund | | | 23 | |
The Fund lends its securities through an unaffiliated securities lending agent. Cash collateral received in connection with its securities lending transactions is invested in Securities Lending Cash Investments, LLC (the “Securities Lending Fund”). The Securities Lending Fund is exempt from registration under Section 3(c)(7) of the 1940 Act and is managed by Funds Management and is subadvised by Wells Capital Management Incorporated (“WellsCap”). Funds Management receives an advisory fee starting at 0.05% and declining to 0.01% as the average daily net assets of the Securities Lending Fund increase. All of the fees received by Funds Management are paid to WellsCap for its services as subadviser. The Securities Lending Fund seeks to provide a positive return compared to the daily Fed Funds Open rate by investing in high-quality, U.S. dollar-denominated short-term money market instruments. Securities Lending Fund investments are fair valued based upon the amortized cost valuation technique. Income earned from investment in the Securities Lending Fund is included in securities lending income on the Statement of Operations.
Security transactions and income recognition
Securities transactions are recorded on a trade date basis. Realized gains or losses are recorded on the basis of identified cost.
Dividend income is recognized on the ex-dividend date.
Distributions to shareholders
Distributions to shareholders from net investment income and net realized gains, if any, are recorded on the ex-dividend date. Such distributions are determined in conformity with federal income tax regulations, which may differ in amount or character from net investment income and realized gains recognized for purposes of U.S. generally accepted accounting principles.
Federal and other taxes
The Fund intends to continue to qualify as a regulated investment company by distributing substantially all of its investment company taxable income and any net realized capital gains (after reduction for capital loss carryforwards) sufficient to relieve it from all, or substantially all, federal income taxes. Accordingly, no provision for federal income taxes was required.
The Fund’s income and federal excise tax returns and all financial records supporting those returns for the prior three fiscal years are subject to examination by the federal and Delaware revenue authorities. Management has analyzed the Fund’s tax positions taken on federal, state, and foreign tax returns for all open tax years and does not believe that there are any uncertain tax positions that require recognition of a tax liability.
As of July 31, 2014, the Fund had a qualified late-year ordinary loss of $629,183 which was recognized on the first day of the current fiscal year.
Class allocations
The separate classes of shares offered by the Fund differ principally in applicable sales charges, distribution, shareholder servicing, and administration fees. Class specific expenses are charged directly to that share class. Investment income, common expenses, and realized and unrealized gains (losses) on investments are allocated daily to each class of shares based on the relative proportion of net assets of each class.
3. FAIR VALUATION MEASUREMENTS
Fair value measurements of investments are determined within a framework that has established a fair value hierarchy based upon the various data inputs utilized in determining the value of the Fund’s investments. The three-level hierarchy gives the highest priority to unadjusted quoted prices in active markets for identical assets or liabilities (Level 1) and the lowest priority to significant unobservable inputs (Level 3). The Fund’s investments are classified within the fair value hierarchy based on the lowest level of input that is significant to the fair value measurement. The inputs are summarized into three broad levels as follows:
| n | | Level 1 – quoted prices in active markets for identical securities |
| n | | Level 2 – other significant observable inputs (including quoted prices for similar securities, interest rates, prepayment speeds, credit risk, use of amortized cost, etc.) |
| n | | Level 3 – significant unobservable inputs (including the Fund’s own assumptions in determining the fair value of investments) |
The inputs or methodologies used for valuing investments in securities are not necessarily an indication of the risk associated with investing in those securities.
| | | | |
| 24 | | Wells Fargo Advantage Large Cap Growth Fund | | Notes to financial statements (unaudited) |
The following is a summary of the inputs used in valuing the Fund’s assets and liabilities as of January 31, 2015:
| | | | | | | | | | | | | | | | |
| | | Quoted prices
(Level 1) | | | Other significant
observable inputs
(Level 2) | | | Significant
unobservable inputs
(Level 3) | | | Total | |
Assets | | | | | | | | | | | | | | | | |
Investments in: | | | | | | | | | | | | | | | | |
| | | | |
Common stocks | | | | | | | | | | | | | | | | |
Consumer discretionary | | $ | 398,382,640 | | | $ | 0 | | | $ | 0 | | | $ | 398,382,640 | |
Consumer staples | | | 63,237,699 | | | | 0 | | | | 0 | | | | 63,237,699 | |
Energy | | | 65,219,650 | | | | 0 | | | | 0 | | | | 65,219,650 | |
Financials | | | 87,883,375 | | | | 0 | | | | 0 | | | | 87,883,375 | |
Health care | | | 246,073,213 | | | | 0 | | | | 0 | | | | 246,073,213 | |
Industrials | | | 185,261,412 | | | | 0 | | | | 0 | | | | 185,261,412 | |
Information technology | | | 441,726,581 | | | | 0 | | | | 0 | | | | 441,726,581 | |
Materials | | | 64,576,865 | | | | 0 | | | | 0 | | | | 64,576,865 | |
| | | | |
Short-term investments | | | | | | | | | | | | | | | | |
Investment companies | | | 15,690,756 | | | | 20,727,000 | | | | 0 | | | | 36,417,756 | |
Total assets | | $ | 1,568,052,191 | | | $ | 20,727,000 | | | $ | 0 | | | $ | 1,588,779,191 | |
The Fund recognizes transfers between levels within the fair value hierarchy at the end of the reporting period. At January 31, 2015, the Fund did not have any transfers into/out of Level 1, Level 2, or Level 3.
4. TRANSACTIONS WITH AFFILIATES
Advisory fee
The Trust has entered into an advisory contract with Funds Management, an indirect wholly owned subsidiary of Wells Fargo & Company (“Wells Fargo”). The adviser is responsible for implementing investment policies and guidelines and for supervising the subadviser, who is responsible for day-to-day portfolio management of the Fund.
Pursuant to the contract, Funds Management is entitled to receive an annual advisory fee starting at 0.65% and declining to 0.475% as the average daily net assets of the Fund increase. Prior to December 1, 2014, Funds Management was entitled to receive an annual advisory fee which started at 0.65% and declined to 0.55% as the average daily net assets of the Fund increased. For the six months ended January 31, 2015, the advisory fee was equivalent to an annual rate of 0.62% of the Fund’s average daily net assets.
Funds Management has retained the services of a subadviser to provide daily portfolio management to the Fund. The fee for subadvisory services is borne by Funds Management. WellsCap, an affiliate of Funds Management and an indirect wholly owned subsidiary of Wells Fargo, is the subadviser to the Fund and is entitled to receive a fee from Funds Management at an annual rate starting at 0.30% and declining to 0.20% as the average daily net assets of the Fund increase.
Administration fees
The Trust has entered into an administration agreement with Funds Management. Under this agreement, for providing administrative services, which includes paying fees and expenses for services provided by the transfer agent, sub-transfer agents, omnibus account servicers and record-keepers, Funds Management is entitled to receive from the Fund an annual fund level administration fee starting at 0.05% and declining to 0.03% as the average daily net assets of the Fund increase and a class level administration fee which is calculated based on the average daily net assets of each class as follows:
| | | | |
| | | Class level
administration fee | |
Class A, Class C, Class R | | | 0.26 | % |
Class R4, Institutional Class | | | 0.08 | |
Class R6 | | | 0.03 | |
Administrator Class | | | 0.10 | |
Investor Class | | | 0.32 | |
| | | | | | |
| Notes to financial statements (unaudited) | | Wells Fargo Advantage Large Cap Growth Fund | | | 25 | |
Funds Management has contractually waived and/or reimbursed advisory and administration fees to the extent necessary to maintain certain net operating expense ratios for the Fund. Waiver of fees and/or reimbursement of expenses by Funds Management were made first from fund level expenses on a proportionate basis and then from class specific expenses. Funds Management has committed through November 30, 2015 to waive fees and/or reimburse expenses to the extent necessary to cap the Fund’s expenses at 1.07% for Class A shares, 1.82% for Class C shares, 1.32% for Class R shares, 0.75% for Class R4 shares, 0.60% for Class R6 shares, 0.95% for Administrator Class shares, 0.65% for Institutional Class shares, and 1.13% for Investor Class shares. After this time, the cap may be increased or the commitment to maintain the cap may be terminated only with the approval of the Board of Trustees.
Distribution fees
The Trust has adopted a Distribution Plan for Class C and Class R shares of the Fund pursuant to Rule 12b-1 under the 1940 Act. Distribution fees are charged to Class C and Class R shares and paid to Wells Fargo Funds Distributor, LLC (“Funds Distributor”), the principal underwriter, at an annual rate of 0.75% of the average daily net assets of Class C shares and 0.25% of the average daily net assets of Class R shares.
In addition, Funds Distributor is entitled to receive the front-end sales charge from the purchase of Class A shares and a contingent deferred sales charge on the redemption of certain shares. Funds Distributor is also entitled to receive the contingent deferred sales charges from redemptions of Class C shares. For the six months ended January 31, 2015, Funds Distributor received $3,422 from the sale of Class A shares and $336 in contingent deferred sales charges from redemptions of Class C shares.
Shareholder servicing fees
The Trust has entered into contracts with one or more shareholder servicing agents, whereby Class A, Class C, Class R, Administrator Class, and Investor Class of the Fund is charged a fee at an annual rate of 0.25% of the average daily net assets of each respective class. Class R4 shares are charged a fee at an annual rate of 0.10% of its average daily net assets.
A portion of these total shareholder servicing fees were paid to affiliates of Wells Fargo.
5. INVESTMENT PORTFOLIO TRANSACTIONS
Purchases and sales of investments, excluding U.S. government obligations (if any) and short-term securities, for the six months ended January 31, 2015 were $220,413,421 and $276,325,300, respectively.
6. BANK BORROWINGS
The Trust (excluding the money market funds and certain other funds in the Trust) and Wells Fargo Variable Trust are parties to a $150,000,000 revolving credit agreement whereby the Fund is permitted to use bank borrowings for temporary or emergency purposes, such as to fund shareholder redemption requests. Interest under the credit agreement is charged to the Fund based on a borrowing rate equal to the higher of the Federal Funds rate in effect on that day plus 1.25% or the overnight LIBOR rate in effect on that day plus 1.25%. In addition, an annual commitment fee equal to 0.10% of the unused balance is allocated to each participating fund. For the six months ended January 31, 2015, the Fund paid $1,171 in commitment fees.
For the six months ended January 31, 2015, there were no borrowings by the Fund under the agreement.
7. CONCENTRATION RISK
Concentration risks result from exposure to a limited number of sectors. Funds that invest a substantial portion of their assets in any sector may be more affected by changes in that sector than would be a fund whose investments are not heavily weighted in any sector.
8. INDEMNIFICATION
Under the Trust’s organizational documents, the officers and Trustees are indemnified against certain liabilities that may arise out of performance of their duties to the Trust. Additionally, in the normal course of business, the Trust may enter into contracts with service providers that contain a variety of indemnification clauses. The Trust’s maximum exposure under these arrangements is dependent on future claims that may be made against the Fund and, therefore, cannot be estimated.
| | | | |
| 26 | | Wells Fargo Advantage Large Cap Growth Fund | | Other information (unaudited) |
PROXY VOTING INFORMATION
A description of the policies and procedures that the Fund uses to determine how to vote proxies relating to portfolio securities, in addition to information regarding how the Fund voted proxies relating to portfolio securities during the most recent 12-month period ended June 30, is available on the Fund’s website at wellsfargoadvantagefunds.com or by visiting the SEC website at sec.gov.
PORTFOLIO HOLDINGS INFORMATION
The complete portfolio holdings for the Fund are publicly available monthly on the Fund’s website (wellsfargoadvantagefunds.com), on a one-month delayed basis. In addition, top ten holdings information (excluding derivative positions) for the Fund is publicly available on the Fund’s website on a monthly, seven-day or more delayed basis. The Fund files its complete schedule of portfolio holdings with the SEC for the first and third quarters of each fiscal year on Form N-Q, which is available by visiting the SEC website at sec.gov. In addition, the Fund’s Form N-Q may be reviewed and copied at the SEC’s Public Reference Room in Washington, DC, and at regional offices in New York City, at 233 Broadway, and in Chicago, at 175 West Jackson Boulevard, Suite 900. Information about the Public Reference Room may be obtained by calling 1-800-SEC-0330.
| | | | | | |
| Other information (unaudited) | | Wells Fargo Advantage Large Cap Growth Fund | | | 27 | |
BOARD OF TRUSTEES AND OFFICERS
Each of the Trustees and Officers1 listed in the table below acts in identical capacities for each fund in the Wells Fargo Advantage family of funds, which consists of 134 mutual funds comprising the Wells Fargo Funds Trust, Wells Fargo Variable Trust, Wells Fargo Master Trust and four closed-end funds (collectively the “Fund Complex”). This table should be read in conjunction with the Prospectus and the Statement of Additional Information2. The mailing address of each Trustee and Officer is 525 Market Street, 12th Floor, San Francisco, CA 94105. Each Trustee and Officer serves an indefinite term, however, each Trustee serves such term until reaching the mandatory retirement age established by the Trustees.
Independent Trustees
| | | | | | |
Name and
year of birth | | Position held and
length of service* | | Principal occupations during past five years or longer | | Other
directorships during
past five years |
| William R. Ebsworth (Born 1957) | | Trustee, since 2015** | | Retired. Prior thereto he joined Fidelity Management and Research Company in 1984 with assignments including equities analyst, portfolio manager, research director, and retired in 2013 as Chief Investment Officer of Fidelity Strategic Advisers, Inc. Served on the boards of Hong Kong Securities Clearing Co., Hong Kong Options Clearing Corp., the Thailand International Fund, Ltd., Fidelity Investments Life Insurance Company, and Empire Fidelity Investments Life Insurance Company. Mr. Ebsworth is an Adjunct Lecturer, Finance, at Babson College and a Chartered Financial Analyst. | | Asset Allocation Trust |
| Jane A. Freeman (Born 1953) | | Trustee, since 2015** | | Retired. From 2012 to 2014 and 1999 to 2008, Ms. Freeman served as the Chief Financial Officer of Scientific Learning Corporation. From 2008 to 2012, Ms. Freeman provided consulting services related to strategic business projects. Prior thereto, Portfolio Manager at Rockefeller & Co. and Scudder, Stevens & Clark. Board member of the Harding Loevner Funds from 1996 to 2014, serving as both Lead Independent Director and chair of the Audit Committee. Board member of the Russell Exchange Traded Funds Trust from 2011 to 2012 and the chair of the Audit Committee. Ms. Freeman is a Chartered Financial Analyst (inactive). | | Asset Allocation Trust |
| Peter G. Gordon (Born 1942) | | Trustee, since 1998; Chairman, since 2005 | | Co-Founder, Retired Chairman, President and CEO of Crystal Geyser Water Company. Trustee Emeritus, Colby College. | | Asset Allocation Trust |
| Isaiah Harris, Jr. (Born 1952) | | Trustee, since 2009 | | Retired. Prior thereto, President and CEO of BellSouth Advertising and Publishing Corp. from 2005 to 2007, President and CEO of BellSouth Enterprises from 2004 to 2005 and President of BellSouth Consumer Services from 2000 to 2003. Emeritus member of the Iowa State University Foundation Board of Governors. Emeritus Member of the Advisory Board of Iowa State University School of Business. Advisory Board Member, Palm Harbor Academy. Mr. Harris is a certified public accountant. | | CIGNA Corporation; Asset Allocation Trust |
| Judith M. Johnson (Born 1949) | | Trustee, since 2008; Audit Committee Chairman, since 2008 | | Retired. Prior thereto, Chief Executive Officer and Chief Investment Officer of Minneapolis Employees Retirement Fund from 1996 to 2008. Ms. Johnson is an attorney, certified public accountant and a certified managerial accountant. | | Asset Allocation Trust |
| David F. Larcker (Born 1950) | | Trustee, since 2009 | | James Irvin Miller Professor of Accounting at the Graduate School of Business, Stanford University, Morgan Stanley Director of the Center for Leadership Development and Research and Senior Faculty of The Rock Center for Corporate Governance since 2006. From 2005 to 2008, Professor of Accounting at the Graduate School of Business, Stanford University. Prior thereto, Ernst & Young Professor of Accounting at The Wharton School, University of Pennsylvania from 1985 to 2005. | | Asset Allocation Trust |
| Olivia S. Mitchell (Born 1953) | | Trustee, since 2006 | | International Foundation of Employee Benefit Plans Professor, Wharton School of the University of Pennsylvania since 1993. Director of Wharton’s Pension Research Council and Boettner Center on Pensions & Retirement Research, and Research Associate at the National Bureau of Economic Research. Previously, Cornell University Professor from 1978 to 1993. | | Asset Allocation Trust |
| | | | |
| 28 | | Wells Fargo Advantage Large Cap Growth Fund | | Other information (unaudited) |
| | | | | | |
Name and
year of birth | | Position held and
length of service* | | Principal occupations during past five years or longer | | Other
directorships during
past five years |
| Timothy J. Penny (Born 1951) | | Trustee, since 1996 | | President and CEO of Southern Minnesota Initiative Foundation, a non-profit organization, since 2007 and Senior Fellow at the Humphrey Institute Policy Forum at the University of Minnesota since 1995. Member of the Board of Trustees of NorthStar Education Finance, Inc., a non-profit organization, since 2007. | | Asset Allocation Trust |
| Michael S. Scofield (Born 1943) | | Trustee, since 2010 | | Served on the Investment Company Institute’s Board of Governors and Executive Committee from 2008-2011 as well the Governing Council of the Independent Directors Council from 2006-2011 and the Independent Directors Council Executive Committee from 2008-2011. Chairman of the IDC from 2008-2010. Institutional Investor (Fund Directions) Trustee of Year in 2007. Trustee of the Evergreen Funds complex (and its predecessors) from 1984 to 2010. Chairman of the Evergreen Funds from 2000-2010. Former Trustee of the Mentor Funds. Retired Attorney, Law Offices of Michael S. Scofield. | | Asset Allocation Trust |
| Donald C. Willeke (Born 1940) | | Trustee, since 1996 | | Principal of the law firm of Willeke & Daniels. General Counsel of the Minneapolis Employees Retirement Fund from 1984 until its consolidation into the Minnesota Public Employees Retirement Association on June 30, 2010. Director and Vice Chair of The Tree Trust (non-profit corporation). Director of the American Chestnut Foundation (non-profit corporation). | | Asset Allocation Trust |
| * | Length of service dates reflect the Trustee’s commencement of service with the Trust’s predecessor entities, where applicable. |
| ** | William R. Ebsworth and Jane A. Freeman each became a Trustee effective January 1, 2015. |
Officers
| | | | | | |
Name and
year of birth | | Position held and
length of service | | Principal occupations during past five years or longer | | |
Karla M. Rabusch
(Born 1959) | | President, since 2003 | | Executive Vice President of Wells Fargo Bank, N.A. and President of Wells Fargo Funds Management, LLC since 2003. | | |
Jeremy DePalma1
(Born 1974) | | Treasurer, since 2012 | | Senior Vice President of Wells Fargo Funds Management, LLC since 2009. Senior Vice President of Evergreen Investment Management Company, LLC from 2008 to 2010. Vice President, Evergreen Investment Services, Inc. from 2004 to 2007. Head of the Fund Reporting and Control Team within Fund Administration from 2005 to 2010. | | |
C. David Messman
(Born 1960) | | Secretary, since 2000; Chief Legal Officer, since 2003 | | Assistant General Counsel of Wells Fargo Bank, N.A. since 2013 and Vice President and Managing Counsel of Wells Fargo Bank N.A. from 1996 to 2013. Senior Vice President and Secretary of Wells Fargo Funds Management, LLC since 2001. | | |
| Debra Ann Early (Born 1964) | | Chief Compliance Officer, since 2007 | | Senior Vice President of Wells Fargo Funds Management, LLC since 2007 and Chief Compliance Officer from 2007 to 2014. Chief Compliance Officer of Parnassus Investments from 2005 to 2007. Chief Financial Officer of Parnassus Investments from 2004 to 2007 and Senior Audit Manager of PricewaterhouseCoopers LLP from 1998 to 2004. | | |
| David Berardi (Born 1975) | | Assistant Treasurer, since 2009 | | Vice President of Wells Fargo Funds Management, LLC since 2009. Vice President of Evergreen Investment Management Company, LLC from 2008 to 2010. Assistant Vice President of Evergreen Investment Services, Inc. from 2004 to 2008. Manager of Fund Reporting and Control for Evergreen Investment Management Company, LLC from 2004 to 2010. | | |
| 1 | Jeremy DePalma acts as Treasurer of 61 funds and Assistant Treasurer of 73 funds in the Fund Complex. |
| 2 | The Statement of Additional Information includes additional information about the Trustees and is available, without charge, upon request, by calling 1-800-222-8222 or by visiting the website at wellsfargoadvantagefunds.com. |
| | | | | | |
| List of abbreviations | | Wells Fargo Advantage Large Cap Growth Fund | | | 29 | |
The following is a list of common abbreviations for terms and entities that may have appeared in this report.
| ACA | — ACA Financial Guaranty Corporation |
| ADR | — American depositary receipt |
| ADS | — American depositary shares |
| AGC | — Assured Guaranty Corporation |
| AGM | — Assured Guaranty Municipal |
| Ambac | — Ambac Financial Group Incorporated |
| AMT | — Alternative minimum tax |
| BAN | — Bond anticipation notes |
| BHAC | — Berkshire Hathaway Assurance Corporation |
| CAB | — Capital appreciation bond |
| CCAB | — Convertible capital appreciation bond |
| CDA | — Community Development Authority |
| CDO | — Collateralized debt obligation |
| DRIVER | — Derivative inverse tax-exempt receipts |
| DW&P | — Department of Water & Power |
| DWR | — Department of Water Resources |
| ECFA | — Educational & Cultural Facilities Authority |
| EDA | — Economic Development Authority |
| EDFA | — Economic Development Finance Authority |
| ETF | — Exchange-traded fund |
| FDIC | — Federal Deposit Insurance Corporation |
| FFCB | — Federal Farm Credit Banks |
| FGIC | — Financial Guaranty Insurance Corporation |
| FHA | — Federal Housing Administration |
| FHLB | — Federal Home Loan Bank |
| FHLMC | — Federal Home Loan Mortgage Corporation |
| FICO | — The Financing Corporation |
| FNMA | — Federal National Mortgage Association |
| GDR | — Global depositary receipt |
| GNMA | — Government National Mortgage Association |
| HCFR | — Healthcare facilities revenue |
| HEFA | — Health & Educational Facilities Authority |
| HEFAR | — Higher education facilities authority revenue |
| HFA | — Housing Finance Authority |
| HFFA | — Health Facilities Financing Authority |
| HUD | — Department of Housing and Urban Development |
| IDA | — Industrial Development Authority |
| IDAG | — Industrial Development Agency |
| KRW | — Republic of Korea won |
| LIBOR | — London Interbank Offered Rate |
| LIFER | — Long Inverse Floating Exempt Receipts |
| LLC | — Limited liability company |
| LLLP | — Limited liability limited partnership |
| LLP | — Limited liability partnership |
| MBIA | — Municipal Bond Insurance Association |
| MFHR | — Multifamily housing revenue |
| MSTR | — Municipal securities trust receipts |
| MUD | — Municipal Utility District |
| National | — National Public Finance Guarantee Corporation |
| PCFA | — Pollution Control Financing Authority |
| PCL | — Public Company Limited |
| PCR | — Pollution control revenue |
| PFA | — Public Finance Authority |
| PFFA | — Public Facilities Financing Authority |
| PFOTER | — Puttable floating option tax-exempt receipts |
| plc | — Public limited company |
| PUTTER | — Puttable tax-exempt receipts |
| R&D | — Research & development |
| Radian | — Radian Asset Assurance |
| RAN | — Revenue anticipation notes |
| RDA | — Redevelopment Authority |
| RDFA | — Redevelopment Finance Authority |
| REIT | — Real estate investment trust |
| ROC | — Reset option certificates |
| SAVRS | — Select auction variable rate securities |
| SBA | — Small Business Authority |
| SFHR | — Single-family housing revenue |
| SFMR | — Single-family mortgage revenue |
| SPA | — Standby purchase agreement |
| SPDR | — Standard & Poor’s Depositary Receipts |
| SPEAR | — Short Puttable Exempt Adjustable Receipts |
| STRIPS | — Separate trading of registered interest and |
| TAN | — Tax anticipation notes |
| TIPS | — Treasury inflation-protected securities |
| TRAN | — Tax revenue anticipation notes |
| TTFA | — Transportation Trust Fund Authority |
| TVA | — Tennessee Valley Authority |
This page is intentionally left blank.
This page is intentionally left blank.
This page is intentionally left blank.


For more information
More information about Wells Fargo Advantage Funds is available free upon request. To obtain literature, please write, email, visit the Fund’s website, or call:
Wells Fargo Advantage Funds
P.O. Box 8266
Boston, MA 02266-8266
Email: wfaf@wellsfargo.com
Website: wellsfargoadvantagefunds.com
Individual investors: 1-800-222-8222
Retail investment professionals: 1-888-877-9275
Institutional investment professionals: 1-866-765-0778
This report and the financial statements contained herein are submitted for the general information of the shareholders of Wells Fargo Advantage Funds. If this report is used for promotional purposes, distribution of the report must be accompanied or preceded by a current prospectus. Before investing, please consider the investment objectives, risks, charges, and expenses of the investment. For a current prospectus and, if available, a summary prospectus, containing this information, call 1-800-222-8222 or visit the Fund’s website at wellsfargoadvantagefunds.com. Read the prospectus carefully before you invest or send money.
Wells Fargo Funds Management, LLC, a wholly owned subsidiary of Wells Fargo & Company, provides investment advisory and administrative services for Wells Fargo Advantage Funds. Other affiliates of Wells Fargo & Company provide subadvisory and other services for the Funds. The Funds are distributed by Wells Fargo Funds Distributor, LLC, Member FINRA/SIPC, an affiliate of Wells Fargo & Company.
NOT FDIC INSURED ¡ NO BANK GUARANTEE ¡ MAY LOSE VALUE
© 2015 Wells Fargo Funds Management, LLC. All rights reserved.
| | |
 | | 231602 03-15 SA209/SAR209 01-15 |

Wells Fargo Advantage Large Company Value Fund

Semi-Annual Report
January 31, 2015

Reduce clutter. Save trees.
Sign up for electronic delivery of prospectuses and shareholder reports at wellsfargo.com/advantagedelivery
Contents
The views expressed and any forward-looking statements are as of January 31, 2015, unless otherwise noted, and are those of the Fund managers and/or Wells Fargo Funds Management, LLC. Discussions of individual securities, or the markets generally, or any Wells Fargo Advantage Fund are not intended as individual recommendations. Future events or results may vary significantly from those expressed in any forward-looking statements; the views expressed are subject to change at any time in response to changing circumstances in the market. Wells Fargo Funds Management, LLC and the Fund disclaim any obligation to publicly update or revise any views expressed or forward-looking statements.
NOT FDIC INSURED ¡ NO BANK GUARANTEE ¡ MAY LOSE VALUE
| | | | |
| 2 | | Wells Fargo Advantage Large Company Value Fund | | Letter to shareholders (unaudited) |

Karla M. Rabusch
President
Wells Fargo Advantage Funds
As the U.S. churned forward, major economies elsewhere in the world faced significant ongoing challenges.
Dear Valued Shareholder:
We are pleased to offer you this semi-annual report for the Wells Fargo Advantage Large Company Value Fund for the six-month period that ended January 31, 2015. Generally improving U.S. economic data helped drive a positive return for U.S. stocks for the reporting period (as measured by the S&P 500 Index1); in contrast, many economies and markets elsewhere in the world faced ongoing challenges.
Positive U.S. economic data, but increased tensions abroad, led to heightened volatility during the third quarter of 2014.
When the reporting period began on August 1, 2014, the U.S. stock market was experiencing a series of surges interrupted by bouts of volatility as interest-rate concerns in the U.S. and increased tensions abroad triggered heightened investor uncertainty. An escalating Russia/Ukraine situation and a growing perception that the U.S. Federal Reserve (Fed) would raise short-term interest rates sooner than expected caused investors to pull back near the end of July. As a result, the S&P 500 Index dropped into negative territory for July’s monthly return. However, August brought a bounce-back; the S&P 500 Index delivered its largest monthly gain since February 2014 on a string of positive economic news, led by an upwardly revised 4.2% estimate of second-quarter 2014 gross domestic product (GDP) growth. Then, in September, stock market volatility increased as positive economic data became overshadowed at times by growing discomfort over escalating tensions in Ukraine and the Middle East. Slowing growth in Europe and China also concerned investors. Ultimately, U.S. stocks ended the third quarter up slightly overall, buoyed largely by another upward revision of second-quarter GDP growth to 4.6%. Strong corporate earnings also contributed to market gains.
The fourth quarter of 2014 brought continued improvement in the U.S.; international economies remained challenged.
Strong fourth-quarter results by the U.S. stock market helped the S&P 500 Index deliver more than 50 record closes in 2014. The last several, in December, were spurred by investor optimism following Fed Chair Janet Yellen’s comment that the Fed would be patient in its timing of an interest-rate increase. U.S. stocks also were boosted by positive economic data. November’s 5.8% unemployment rate was down from 7.0% a year earlier, and the number of jobs being added continued to expand, keeping U.S. employers on pace to hire nearly three million workers during 2014. In addition, the U.S. economy’s third-quarter growth rate was revised upward during the quarter, to 5.0%—its fastest pace in 11 years. Meanwhile, U.S. companies continued to report strong earnings. The steadily brightening U.S. economy energized consumers, who were further buoyed by much lower prices at the gasoline pump. During the fourth quarter, gasoline prices fell to their lowest levels in five years, according to the American Automobile Association.
As the U.S. churned forward, major economies elsewhere in the world faced significant ongoing challenges. In China, where growth had been slowing for some time, government regulators in December announced changes being made in an effort to stimulate growth. In Japan, which slid back into recession in the third quarter of 2014, Prime Minister Abe gained approval in late December for roughly $29 billion in fresh stimulus to help the economy. In the eurozone, growth remained sluggish, and member countries continued to face an environment of low demand, high unemployment, and weak business investment. This situation
| 1 | The S&P 500 Index consists of 500 stocks chosen for market size, liquidity, and industry group representation. It is a market-value-weighted index with each stock’s weight in the index proportionate to its market value. You cannot invest directly in an index. |
| | | | | | |
| Letter to shareholders (unaudited) | | Wells Fargo Advantage Large Company Value Fund | | | 3 | |
was exacerbated in December by renewed concerns about Greece after its parliament failed to avert a general election that could jeopardize the terms of the country’s financial agreement with its international creditors. In Russia, the economy contracted for the first time since October 2009 as the country struggled under the weight of slumping oil prices, international sanctions, and massive outflows of capital.
Market volatility increased in January 2015.
Markets fluctuated in January as investors reacted to geopolitical developments and new economic data. Mid-month, the World Bank lowered its outlook for global growth based on deepening problems in the eurozone and emerging markets, stating that a strengthening U.S. economy could not, by itself, support the global economy. Later in January, Greek voters gave control of their government to opposition party Syriza, which promised to end austerity and insisted that Greece’s massive debt be renegotiated. In the U.S., various data released in January, such as consumer confidence and December’s jobless rate, showed improvement. On the last trading day of the month, however, investors learned that fourth-quarter 2014 U.S. economic growth was estimated at 2.6%, which was below consensus and lower than the 4.6% and 5.0% growth rates, respectively, for the second and third quarters of 2014.
Don’t let short-term uncertainty derail long-term investment goals.
Periods of uncertainty can present challenges, but experience has taught us that maintaining long-term investment goals can be an effective way to plan for the future. To help you create a sound strategy based on your personal goals and risk tolerance, Wells Fargo Advantage Funds offers more than 100 mutual funds and other investments spanning a wide range of asset classes and investment styles. Although diversification cannot guarantee an investment profit or prevent losses, we believe it can be an effective way to manage investment risk and potentially smooth out overall portfolio performance. We encourage investors to know their investments and to understand that appropriate levels of risk-taking may unlock opportunities.
Thank you for choosing to invest with Wells Fargo Advantage Funds. We appreciate your confidence in us and remain committed to helping you meet your financial needs. For current information about your fund investments, contact your investment professional, visit our website at wellsfargoadvantagefunds.com, or call us directly at 1-800-222-8222. We are available 24 hours a day, 7 days a week.
Sincerely,

Karla M. Rabusch
President
Wells Fargo Advantage Funds
We encourage investors to know their investments and to understand that appropriate levels of risk-taking may unlock opportunities.
| | | | |
| 4 | | Wells Fargo Advantage Large Company Value Fund | | Performance highlights (unaudited) |
Investment objective
The Fund seeks long-term capital appreciation.
Adviser
Wells Fargo Funds Management, LLC
Subadviser
Phocas Financial Corporation
Portfolio managers
Stephen L. Block, CFA
William F.K. Schaff, CFA
Average annual total returns1 (%) as of January 31, 2015
| | | | | | | | | | | | | | | | | | | | | | | | | | | | | | | | | | |
| | | | | Including sales charge | | | Excluding sales charge | | | Expense ratios2 (%) | |
| | | Inception date | | 1 year | | | 5 year | | | 10 year | | | 1 year | | | 5 year | | | 10 year | | | Gross | | | Net3 | |
| Class A (WLCAX) | | 3-31-2008 | | | 0.99 | | | | 10.90 | | | | 5.55 | | | | 7.14 | | | | 12.21 | | | | 6.18 | | | | 1.28 | | | | 1.10 | |
| Class C (WFLVX) | | 3-31-2008 | | | 5.46 | | | | 11.40 | | | | 5.44 | | | | 6.46 | | | | 11.40 | | | | 5.44 | | | | 2.03 | | | | 1.85 | �� |
| Administrator Class (WWIDX) | | 12-31-2001 | | | – | | | | – | | | | – | | | | 7.51 | | | | 12.52 | | | | 6.52 | | | | 1.12 | | | | 0.85 | |
| Institutional Class (WLCIX) | | 3-31-2008 | | | – | | | | – | | | | – | | | | 7.64 | | | | 12.75 | | | | 6.67 | | | | 0.85 | | | | 0.65 | |
| Investor Class (SDVIX) | | 7-1-1993 | | | – | | | | – | | | | – | | | | 7.15 | | | | 12.14 | | | | 6.13 | | | | 1.34 | | | | 1.16 | |
| Russell 1000® Value Index4 | | – | | | – | | | | – | | | | – | | | | 12.93 | | | | 15.14 | | | | 7.06 | | | | – | | | | – | |
Figures quoted represent past performance, which is no guarantee of future results, and do not reflect taxes that a shareholder may pay on fund distributions or the redemption of fund shares. Investment return and principal value of an investment will fluctuate so that an investor’s shares, when redeemed, may be worth more or less than their original cost. Performance shown without sales charges would be lower if sales charges were reflected. Current performance may be lower or higher than the performance data quoted, which assumes the reinvestment of dividends and capital gains. Current month-end performance is available on the Fund’s website, wellsfargoadvantagefunds.com.
Index returns do not include transaction costs associated with buying and selling securities, any mutual fund fees or expenses, or any taxes. It is not possible to invest directly in an index.
For Class A shares, the maximum front-end sales charge is 5.75%. For Class C shares, the maximum contingent deferred sales charge is 1.00%. Performance including a contingent deferred sales charge assumes the sales charge for the corresponding time period. Administrator Class, Institutional Class, and Investor Class shares are sold without a front-end sales charge or contingent deferred sales charge.
Stock values fluctuate in response to the activities of individual companies and general market and economic conditions. Certain investment strategies tend to increase the total risk of an investment (relative to the broader market). The Fund is exposed to foreign investment risk. Consult the Fund’s prospectus for additional information on these and other risks.
Please see footnotes on page 5.
| | | | | | |
| Performance highlights (unaudited) | | Wells Fargo Advantage Large Company Value Fund | | | 5 | |
| | | | |
| Ten largest equity holdings5 (%) as of January 31, 2015 | |
CVS Health Corporation | | | 2.76 | |
Equity Residential | | | 2.60 | |
Alexandria Real Estate Equities Incorporated | | | 2.37 | |
American International Group Incorporated | | | 2.37 | |
Merck & Company Incorporated | | | 2.27 | |
JPMorgan Chase & Company | | | 2.26 | |
Cigna Corporation | | | 2.02 | |
The Hartford Financial Services Group Incorporated | | | 1.98 | |
Marathon Oil Corporation | | | 1.97 | |
KeyCorp | | | 1.84 | |
|
| Sector distribution6 as of January 31, 2015 |
|
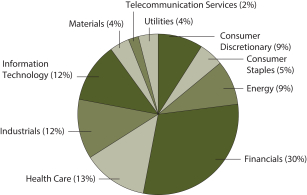 |
| 1 | Historical performance shown for Class A shares prior to their inception reflects the performance of Investor Class shares, and includes the higher expenses applicable to Investor Class shares (except during those periods in which the expenses of Class A shares would have been higher than those of Investor Class shares). If these expenses had not been included, returns would be higher. Historical performance shown for Class C shares prior to their inception reflects the performance of Investor Class shares, adjusted to reflect the higher expenses applicable to Class C shares. Historical performance shown for Institutional Class shares prior to their inception reflects the performance of Investor Class shares and includes the higher expenses applicable to Investor Class shares. If these expenses had not been included, returns would be higher. |
| 2 | Reflects the expense ratios as stated in the most recent prospectuses. The expense ratios shown are subject to change and may differ from the annualized expense ratios shown in the financial highlights of this report. |
| 3 | The Adviser has committed through November 30, 2015, to waive fees and/or reimburse expenses to the extent necessary to cap the Fund’s Total Annual Fund Operating Expenses After Fee Waiver, excluding certain expenses, at the amounts shown. After this time, the cap may be increased or the commitment to maintain the cap may be terminated only with the approval of the Board of Trustees. Brokerage commissions, stamp duty fees, interest, taxes, acquired fund fees and expenses, and extraordinary expenses are excluded from the cap. Without this cap, the Fund’s returns would have been lower. |
| 4 | The Russell 1000® Value Index measures the performance of those Russell 1000 Index companies with lower price-to-book ratios and lower forecasted growth values. You cannot invest directly in an index. |
| 5 | The ten largest equity holdings are calculated based on the value of the securities divided by total net assets of the Fund. Holdings are subject to change and may have changed since the date specified. |
| 6 | Amounts are calculated based on the total long-term investments of the Fund. These percentages are subject to change and may have changed since the date specified. |
| | | | |
| 6 | | Wells Fargo Advantage Large Company Value Fund | | Fund expenses (unaudited) |
As a shareholder of the Fund, you incur two types of costs: (1) transaction costs, including sales charges (loads) on purchase payments and contingent deferred sales charges (if any) on redemptions and (2) ongoing costs, including management fees, distribution (12b-1) and/or shareholder service fees, and other Fund expenses. This example is intended to help you understand your ongoing costs (in dollars) of investing in the Fund and to compare these costs with the ongoing costs of investing in other mutual funds.
The example is based on an investment of $1,000 invested at the beginning of the six-month period and held for the entire period from August 1, 2014 to January 31, 2015.
Actual expenses
The “Actual” line of the table below provides information about actual account values and actual expenses. You may use the information in this line, together with the amount you invested, to estimate the expenses that you paid over the period. Simply divide your account value by $1,000 (for example, an $8,600 account value divided by $1,000 = 8.6), then multiply the result by the number in the “Actual” line under the heading entitled “Expenses paid during period” for your applicable class of shares to estimate the expenses you paid on your account during this period.
Hypothetical example for comparison purposes
The “Hypothetical” line of the table below provides information about hypothetical account values and hypothetical expenses based on the Fund’s actual expense ratio and an assumed rate of return of 5% per year before expenses, which is not the Fund’s actual return. The hypothetical account values and expenses may not be used to estimate the actual ending account balance or expenses you paid for the period. You may use this information to compare the ongoing costs of investing in the Fund and other funds. To do so, compare this 5% hypothetical example with the 5% hypothetical examples that appear in the shareholder reports of the other funds.
Please note that the expenses shown in the table are meant to highlight your ongoing costs only and do not reflect any transactional costs, such as sales charges (loads) and contingent deferred sales charges. Therefore, the “Hypothetical” line of the table is useful in comparing ongoing costs only and will not help you determine the relative total costs of owning different funds. In addition, if these transactional costs were included, your costs would have been higher.
| | | | | | | | | | | | | | | | |
| | | Beginning
account value
8-1-2014 | | | Ending
account value
1-31-2015 | | | Expenses
paid during
the period¹ | | | Net annualized
expense ratio | |
Class A | | | | | | | | | | | | | | | | |
Actual | | $ | 1,000.00 | | | $ | 1,000.42 | | | $ | 5.55 | | | | 1.10 | % |
Hypothetical (5% return before expenses) | | $ | 1,000.00 | | | $ | 1,019.66 | | | $ | 5.60 | | | | 1.10 | % |
Class C | | | | | | | | | | | | | | | | |
Actual | | $ | 1,000.00 | | | $ | 997.43 | | | $ | 9.31 | | | | 1.85 | % |
Hypothetical (5% return before expenses) | | $ | 1,000.00 | | | $ | 1,015.88 | | | $ | 9.40 | | | | 1.85 | % |
Administrator Class | | | | | | | | | | | | | | | | |
Actual | | $ | 1,000.00 | | | $ | 1,001.87 | | | $ | 4.29 | | | | 0.85 | % |
Hypothetical (5% return before expenses) | | $ | 1,000.00 | | | $ | 1,020.92 | | | $ | 4.33 | | | | 0.85 | % |
Institutional Class | | | | | | | | | | | | | | | | |
Actual | | $ | 1,000.00 | | | $ | 1,002.63 | | | $ | 3.28 | | | | 0.65 | % |
Hypothetical (5% return before expenses) | | $ | 1,000.00 | | | $ | 1,021.93 | | | $ | 3.31 | | | | 0.65 | % |
Investor Class | | | | | | | | | | | | | | | | |
Actual | | $ | 1,000.00 | | | $ | 1,000.58 | | | $ | 5.85 | | | | 1.16 | % |
Hypothetical (5% return before expenses) | | $ | 1,000.00 | | | $ | 1,019.36 | | | $ | 5.90 | | | | 1.16 | % |
| 1 | Expenses paid is equal to the annualized expense ratio of each class multiplied by the average account value over the period, multiplied by the number of days in the most recent fiscal half-year divided by the number of days in the fiscal year (to reflect the one-half-year period). |
| | | | | | |
| Portfolio of investments—January 31, 2015 (unaudited) | | Wells Fargo Advantage Large Company Value Fund | | | 7 | |
| | | | | | | | | | | | |
| Security name | | | | | | Shares | | | Value | |
| | | | |
Common Stocks: 98.38% | | | | | | | | | | | | |
| | | | |
Consumer Discretionary: 8.40% | | | | | | | | | | | | |
| | | | |
| Automobiles: 0.98% | | | | | | | | | | | | |
Ford Motor Company | | | | | | | 189,026 | | | $ | 2,780,574 | |
| | | | | | | | | | | | |
| | | | |
| Hotels, Restaurants & Leisure: 2.23% | | | | | | | | | | | | |
Las Vegas Sands Corporation | | | | | | | 34,000 | | | | 1,848,580 | |
Norwegian Cruise Line Holdings Limited † | | | | | | | 102,969 | | | | 4,505,923 | |
| | | | |
| | | | | | | | | | | 6,354,503 | |
| | | | | | | | | | | | |
| | | | |
| Household Durables: 1.94% | | | | | | | | | | | | |
Newell Rubbermaid Incorporated | | | | | | | 94,390 | | | | 3,480,159 | |
Toll Brothers Incorporated † | | | | | | | 59,201 | | | | 2,049,539 | |
| | | | |
| | | | | | | | | | | 5,529,698 | |
| | | | | | | | | | | | |
| | | | |
| Media: 2.33% | | | | | | | | | | | | |
Gannett Company Incorporated | | | | | | | 41,967 | | | | 1,301,397 | |
The Walt Disney Company | | | | | | | 16,397 | | | | 1,491,471 | |
Viacom Incorporated Class B | | | | | | | 59,863 | | | | 3,856,374 | |
| | | | |
| | | | | | | | | | | 6,649,242 | |
| | | | | | | | | | | | |
| | | | |
| Textiles, Apparel & Luxury Goods: 0.92% | | | | | | | | | | | | |
PVH Corporation | | | | | | | 23,917 | | | | 2,637,088 | |
| | | | | | | | | | | | |
| | | | |
Consumer Staples: 4.96% | | | | | | | | | | | | |
| | | | |
| Food & Staples Retailing: 3.29% | | | | | | | | | | | | |
CVS Health Corporation | | | | | | | 80,300 | | | | 7,882,248 | |
Rite Aid Corporation † | | | | | | | 214,882 | | | | 1,499,876 | |
| | | | |
| | | | | | | | | | | 9,382,124 | |
| | | | | | | | | | | | |
| | | | |
| Household Products: 1.34% | | | | | | | | | | | | |
The Procter & Gamble Company | | | | | | | 45,253 | | | | 3,814,375 | |
| | | | | | | | | | | | |
| | | | |
| Personal Products: 0.33% | | | | | | | | | | | | |
Herbalife Limited « | | | | | | | 30,852 | | | | 940,369 | |
| | | | | | | | | | | | |
| | | | |
Energy: 9.22% | | | | | | | | | | | | |
| | | | |
| Energy Equipment & Services: 1.06% | | | | | | | | | | | | |
Baker Hughes Incorporated | | | | | | | 52,017 | | | | 3,016,466 | |
| | | | | | | | | | | | |
| | | | |
| Oil, Gas & Consumable Fuels: 8.16% | | | | | | | | | | | | |
Chevron Corporation | | | | | | | 32,646 | | | | 3,347,194 | |
ConocoPhillips Company | | | | | | | 48,596 | | | | 3,060,576 | |
Exxon Mobil Corporation | | | | | | | 44,339 | | | | 3,876,115 | |
Marathon Oil Corporation | | | | | | | 211,538 | | | | 5,626,911 | |
Noble Energy Incorporated | | | | | | | 51,866 | | | | 2,476,083 | |
Valero Energy Corporation | | | | | | | 92,529 | | | | 4,892,934 | |
| | | | |
| | | | | | | | | | | 23,279,813 | |
| | | | | | | | | | | | |
The accompanying notes are an integral part of these financial statements.
| | | | |
| 8 | | Wells Fargo Advantage Large Company Value Fund | | Portfolio of investments—January 31, 2015 (unaudited) |
| | | | | | | | | | | | |
| Security name | | | | | | Shares | | | Value | |
| | | | |
Financials: 29.45% | | | | | | | | | | | | |
| | | | |
| Banks: 10.61% | | | | | | | | | | | | |
Bank of America Corporation | | | | | | | 233,912 | | | $ | 3,543,767 | |
BOK Financial Corporation | | | | | | | 66,458 | | | | 3,596,042 | |
Citigroup Incorporated | | | | | | | 75,766 | | | | 3,557,214 | |
First Republic Bank | | | | | | | 97,320 | | | | 4,955,534 | |
JPMorgan Chase & Company | | | | | | | 118,579 | | | | 6,448,326 | |
KeyCorp | | | | | | | 403,521 | | | | 5,241,738 | |
SunTrust Banks Incorporated | | | | | | | 75,330 | | | | 2,894,179 | |
| | | | |
| | | | | | | | | | | 30,236,800 | |
| | | | | | | | | | | | |
| | | | |
| Capital Markets: 2.20% | | | | | | | | | | | | |
Ameriprise Financial Incorporated | | | | | | | 26,386 | | | | 3,296,667 | |
Goldman Sachs Group Incorporated | | | | | | | 17,224 | | | | 2,969,590 | |
| | | | |
| | | | | | | | | | | 6,266,257 | |
| | | | | | | | | | | | |
| | | | |
| Consumer Finance: 1.64% | | | | | | | | | | | | |
American Express Company | | | | | | | 58,082 | | | | 4,686,637 | |
| | | | | | | | | | | | |
| | | | |
| Insurance: 8.34% | | | | | | | | | | | | |
ACE Limited | | | | | | | 26,208 | | | | 2,829,416 | |
American International Group Incorporated | | | | | | | 138,215 | | | | 6,754,567 | |
Endurance Specialty Holdings Limited | | | | | | | 64,567 | | | | 3,946,335 | |
MetLife Incorporated | | | | | | | 99,138 | | | | 4,609,917 | |
The Hartford Financial Services Group Incorporated | | | | | | | 145,070 | | | | 5,643,223 | |
| | | | |
| | | | | | | | | | | 23,783,458 | |
| | | | | | | | | | | | |
| | | | |
| REITs: 6.66% | | | | | | | | | | | | |
Alexandria Real Estate Equities Incorporated | | | | | | | 69,415 | | | | 6,769,351 | |
American Realty Capital Properties Incorporated | | | | | | | 168,352 | | | | 1,559,781 | |
Equity Residential | | | | | | | 95,382 | | | | 7,402,597 | |
LaSalle Hotel Properties | | | | | | | 80,571 | | | | 3,259,903 | |
| | | | |
| | | | | | | | | | | 18,991,632 | |
| | | | | | | | | | | | |
| | | | |
Health Care: 12.60% | | | | | | | | | | | | |
| | | | |
| Biotechnology: 0.95% | | | | | | | | | | | | |
Gilead Sciences Incorporated † | | | | | | | 25,758 | | | | 2,700,211 | |
| | | | | | | | | | | | |
| | | | |
| Health Care Equipment & Supplies: 1.23% | | | | | | | | | | | | |
Medtronic plc | | | | | | | 49,178 | | | | 3,511,309 | |
| | | | | | | | | | | | |
| | | | |
| Health Care Providers & Services: 3.12% | | | | | | | | | | | | |
Cigna Corporation | | | | | | | 54,003 | | | | 5,769,140 | |
HCA Holdings Incorporated † | | | | | | | 44,279 | | | | 3,134,953 | |
| | | | |
| | | | | | | | | | | 8,904,093 | |
| | | | | | | | | | | | |
| | | | |
| Life Sciences Tools & Services: 1.09% | | | | | | | | | | | | |
PerkinElmer Incorporated | | | | | | | 67,893 | | | | 3,103,389 | |
| | | | | | | | | | | | |
The accompanying notes are an integral part of these financial statements.
| | | | | | |
| Portfolio of investments—January 31, 2015 (unaudited) | | Wells Fargo Advantage Large Company Value Fund | | | 9 | |
| | | | | | | | | | | | |
| Security name | | | | | | Shares | | | Value | |
| | | | |
| Pharmaceuticals: 6.21% | | | | | | | | | | | | |
Johnson & Johnson | | | | | | | 28,241 | | | $ | 2,828,054 | |
Merck & Company Incorporated | | | | | | | 107,505 | | | | 6,480,401 | |
Novartis AG ADR | | | | | | | 36,192 | | | | 3,525,101 | |
Pfizer Incorporated | | | | | | | 155,799 | | | | 4,868,719 | |
| | | | |
| | | | | | | | | | | 17,702,275 | |
| | | | | | | | | | | | |
| | | | |
Industrials: 11.34% | | | | | | | | | | | | |
| | | | |
| Aerospace & Defense: 1.53% | | | | | | | | | | | | |
Raytheon Company | | | | | | | 20,436 | | | | 2,044,622 | |
Triumph Group Incorporated | | | | | | | 40,626 | | | | 2,318,120 | |
| | | | |
| | | | | | | | | | | 4,362,742 | |
| | | | | | | | | | | | |
| | | | |
| Airlines: 1.53% | | | | | | | | | | | | |
United Continental Holdings Incorporated † | | | | | | | 62,917 | | | | 4,364,552 | |
| | | | | | | | | | | | |
| | | | |
| Commercial Services & Supplies: 1.13% | | | | | | | | | | | | |
West Corporation | | | | | | | 98,631 | | | | 3,225,234 | |
| | | | | | | | | | | | |
| | | | |
| Electrical Equipment: 0.68% | | | | | | | | | | | | |
Eaton Corporation plc | | | | | | | 30,956 | | | | 1,953,014 | |
| | | | | | | | | | | | |
| | | | |
| Industrial Conglomerates: 1.34% | | | | | | | | | | | | |
General Electric Company | | | | | | | 159,693 | | | | 3,815,066 | |
| | | | | | | | | | | | |
| | | | |
| Machinery: 4.00% | | | | | | | | | | | | |
Crane Company | | | | | | | 33,856 | | | | 2,063,523 | |
Oshkosh Corporation | | | | | | | 66,548 | | | | 2,851,582 | |
Stanley Black & Decker Incorporated | | | | | | | 50,488 | | | | 4,728,201 | |
The Timken Company | | | | | | | 46,019 | | | | 1,749,182 | |
| | | | |
| | | | | | | | | | | 11,392,488 | |
| | | | | | | | | | | | |
| | | | |
| Road & Rail: 0.54% | | | | | | | | | | | | |
AMERCO | | | | | | | 5,336 | | | | 1,526,683 | |
| | | | | | | | | | | | |
| | | | |
| Trading Companies & Distributors: 0.59% | | | | | | | | | | | | |
WESCO International Incorporated † | | | | | | | 25,412 | | | | 1,696,505 | |
| | | | | | | | | | | | |
| | | | |
Information Technology: 12.07% | | | | | | | | | | | | |
| | | | |
| Electronic Equipment, Instruments & Components: 1.93% | | | | | | | | | | | | |
Synnex Corporation | | | | | | | 51,718 | | | | 3,836,958 | |
TE Connectivity Limited | | | | | | | 25,331 | | | | 1,681,725 | |
| | | | |
| | | | | | | | | | | 5,518,683 | |
| | | | | | | | | | | | |
| | | | |
| Internet Software & Services: 2.59% | | | | | | | | | | | | |
AOL Incorporated † | | | | | | | 56,140 | | | | 2,428,055 | |
Google Incorporated Class C † | | | | | | | 5,547 | | | | 2,964,982 | |
Yahoo! Incorporated † | | | | | | | 45,063 | | | | 1,982,321 | |
| | | | |
| | | | | | | | | | | 7,375,358 | |
| | | | | | | | | | | | |
The accompanying notes are an integral part of these financial statements.
| | | | |
| 10 | | Wells Fargo Advantage Large Company Value Fund | | Portfolio of investments—January 31, 2015 (unaudited) |
| | | | | | | | | | | | |
| Security name | | | | | | Shares | | | Value | |
| | | | |
| IT Services: 0.53% | | | | | | | | | | | | |
Teradata Corporation † | | | | | | | 34,027 | | | $ | 1,516,243 | |
| | | | | | | | | | | | |
| | | | |
| Semiconductors & Semiconductor Equipment: 2.00% | | | | | | | | | | | | |
NXP Semiconductors NV † | | | | | | | 27,284 | | | | 2,164,713 | |
Skyworks Solutions Incorporated | | | | | | | 42,521 | | | | 3,531,369 | |
| | | | |
| | | | | | | | | | | 5,696,082 | |
| | | | | | | | | | | | |
| | | | |
| Technology Hardware, Storage & Peripherals: 5.02% | | | | | | | | | | | | |
Apple Incorporated | | | | | | | 26,071 | | | | 3,054,478 | |
EMC Corporation | | | | | | | 158,446 | | | | 4,108,505 | |
Hewlett-Packard Company | | | | | | | 77,342 | | | | 2,794,366 | |
NCR Corporation † | | | | | | | 116,486 | | | | 2,958,744 | |
Seagate Technology plc | | | | | | | 24,683 | | | | 1,393,109 | |
| | | | |
| | | | | | | | | | | 14,309,202 | |
| | | | | | | | | | | | |
| | | | |
Materials: 4.33% | | | | | | | | | | | | |
| | | | |
| Chemicals: 1.76% | | | | | | | | | | | | |
Cabot Corporation | | | | | | | 44,117 | | | | 1,871,002 | |
Huntsman Corporation | | | | | | | 142,859 | | | | 3,137,184 | |
| | | | |
| | | | | | | | | | | 5,008,186 | |
| | | | | | | | | | | | |
| | | | |
| Containers & Packaging: 0.98% | | | | | | | | | | | | |
Crown Holdings Incorporated † | | | | | | | 63,297 | | | | 2,804,690 | |
| | | | | | | | | | | | |
| | | | |
| Metals & Mining: 0.94% | | | | | | | | | | | | |
United States Steel Corporation | | | | | | | 109,925 | | | | 2,686,567 | |
| | | | | | | | | | | | |
| | | | |
| Paper & Forest Products: 0.65% | | | | | | | | | | | | |
International Paper Company | | | | | | | 35,230 | | | | 1,855,212 | |
| | | | | | | | | | | | |
| | | | |
Telecommunication Services: 1.81% | | | | | | | | | | | | |
| | | | |
| Diversified Telecommunication Services: 1.81% | | | | | | | | | | | | |
CenturyLink Incorporated | | | | | | | 58,542 | | | | 2,176,006 | |
Verizon Communications Incorporated | | | | | | | 65,339 | | | | 2,986,646 | |
| | | | |
| | | | | | | | | | | 5,162,652 | |
| | | | | | | | | | | | |
| | | | |
Utilities: 4.20% | | | | | | | | | | | | |
| | | | |
| Electric Utilities: 3.38% | | | | | | | | | | | | |
Duke Energy Corporation | | | | | | | 55,637 | | | | 4,848,208 | |
The Southern Company | | | | | | | 94,742 | | | | 4,805,314 | |
| | | | |
| | | | | | | | | | | 9,653,522 | |
| | | | | | | | | | | | |
| | | | |
| Independent Power & Renewable Electricity Producers: 0.82% | | | | | | | | | | | | |
AES Corporation | | | | | | | 190,636 | | | | 2,329,572 | |
| | | | | | | | | | | | |
| | | | |
Total Common Stocks (Cost $230,422,954) | | | | | | | | | | | 280,522,566 | |
| | | | | �� | | | | | | | |
The accompanying notes are an integral part of these financial statements.
| | | | | | |
| Portfolio of investments—January 31, 2015 (unaudited) | | Wells Fargo Advantage Large Company Value Fund | | | 11 | |
| | | | | | | | | | | | | | |
| Security name | | Yield | | | | | Shares | | | Value | |
| | | | |
Short-Term Investments: 2.97% | | | | | | | | | | | | | | |
| | | | |
| Investment Companies: 2.97% | | | | | | | | | | | | | | |
Securities Lending Cash Investments, LLC (l)(u)(r) | | | 0.13 | % | | | | | 966,400 | | | $ | 966,400 | |
Wells Fargo Advantage Cash Investment Money Market Fund, Select Class (l)(u) | | | 0.10 | | | | | | 7,510,112 | | | | 7,510,112 | |
| | | | |
Total Short-Term Investments (Cost $8,476,512) | | | | | | | | | | | | | 8,476,512 | |
| | | | | | | | | | | | | | |
| | | | | | | | |
| Total investments in securities (Cost $238,899,466) * | | | 101.35 | % | | | 288,999,078 | |
Other assets and liabilities, net | | | (1.35 | ) | | | (3,854,570 | ) |
| | | | | | | | |
| Total net assets | | | 100.00 | % | | $ | 285,144,508 | |
| | | | | | | | |
| † | Non-income-earning security |
| « | All or a portion of this security is on loan. |
| (l) | The security represents an affiliate of the Fund/Portfolio as defined in the Investment Company Act of 1940. |
| (u) | The rate represents the 7-day annualized yield at period end. |
| (r) | The investment is a non-registered investment vehicle purchased with cash collateral received from securities on loan. |
| * | Cost for federal income tax purposes is $241,832,709 and unrealized gains (losses) consists of: |
| | | | |
Gross unrealized gains | | $ | 58,834,906 | |
Gross unrealized losses | | | (11,668,537 | ) |
| | | | |
Net unrealized gains | | $ | 47,166,369 | |
The accompanying notes are an integral part of these financial statements.
| | | | |
| 12 | | Wells Fargo Advantage Large Company Value Fund | | Statement of assets and liabilities—January 31, 2015 (unaudited) |
| | | | |
| | | | |
| |
Assets | | | | |
Investments | | | | |
In unaffiliated securities (including $943,448 of securities loaned), at value (cost $230,422,954) | | $ | 280,522,566 | |
In affiliated securities, at value (cost $8,476,512) | | | 8,476,512 | |
| | | | |
Total investments, at value (cost $238,899,466) | | | 288,999,078 | |
Receivable for Fund shares sold | | | 16,147 | |
Receivable for dividends | | | 268,587 | |
Receivable for securities lending income | | | 2,291 | |
Prepaid expenses and other assets | | | 32,192 | |
| | | | |
Total assets | | | 289,318,295 | |
| | | | |
| |
Liabilities | | | | |
Payable for investments purchased | | | 2,569,651 | |
Payable for Fund shares redeemed | | | 313,509 | |
Payable upon receipt of securities loaned | | | 966,400 | |
Advisory fee payable | | | 119,197 | |
Distribution fee payable | | | 3,148 | |
Administration fees payable | | | 82,269 | |
Accrued expenses and other liabilities | | | 119,613 | |
| | | | |
Total liabilities | | | 4,173,787 | |
| | | | |
Total net assets | | $ | 285,144,508 | |
| | | | |
| |
NET ASSETS CONSIST OF | | | | |
Paid-in capital | | $ | 234,205,097 | |
Undistributed net investment income | | | 28,512 | |
Accumulated net realized gains on investments | | | 811,287 | |
Net unrealized gains on investments | | | 50,099,612 | |
| | | | |
Total net assets | | $ | 285,144,508 | |
| | | | |
| |
COMPUTATION OF NET ASSET VALUE AND OFFERING PRICE PER SHARE | | | | |
Net assets – Class A | | $ | 106,200,787 | |
Shares outstanding – Class A1 | | | 6,938,987 | |
Net asset value per share – Class A | | | $15.30 | |
Maximum offering price per share – Class A2 | | | $16.23 | |
Net assets – Class C | | $ | 4,538,097 | |
Shares outstanding – Class C1 | | | 290,806 | |
Net asset value per share – Class C | | | $15.61 | |
Net assets – Administrator Class | | $ | 32,741,903 | |
Shares outstanding – Administrator Class1 | | | 2,126,136 | |
Net asset value per share – Administrator Class | | | $15.40 | |
Net assets – Institutional Class | | $ | 1,767,268 | |
Shares outstanding – Institutional Class1 | | | 114,949 | |
Net asset value per share – Institutional Class | | | $15.37 | |
Net assets – Investor Class | | $ | 139,896,453 | |
Shares outstanding – Investor Class1 | | | 8,883,412 | |
Net asset value per share – Investor Class | | | $15.75 | |
| 1 | The Fund has an unlimited number of authorized shares. |
| 2 | Maximum offering price is computed as 100/94.25 of net asset value. On investments of $50,000 or more, the offering price is reduced. |
The accompanying notes are an integral part of these financial statements.
| | | | | | |
| Statement of operations—six months ended January 31, 2015 (unaudited) | | Wells Fargo Advantage Large Company Value Fund | | | 13 | |
| | | | |
| | | | |
| |
Investment income | | | | |
Dividends | | $ | 2,519,958 | |
Securities lending income, net | | | 15,932 | |
Income from affiliated securities | | | 2,285 | |
| | | | |
Total investment income | | | 2,538,175 | |
| | | | |
| |
Expenses | | | | |
Advisory fee | | | 993,227 | |
Administration fees | | | | |
Fund level | | | 76,402 | |
Class A | | | 148,918 | |
Class C | | | 6,102 | |
Administrator Class | | | 18,086 | |
Institutional Class | | | 528 | |
Investor Class | | | 238,191 | |
Shareholder servicing fees | | | | |
Class A | | | 143,190 | |
Class C | | | 5,867 | |
Administrator Class | | | 45,216 | |
Investor Class | | | 185,663 | |
Distribution fee | | | | |
Class C | | | 17,603 | |
Custody and accounting fees | | | 11,067 | |
Professional fees | | | 22,923 | |
Registration fees | | | 29,365 | |
Shareholder report expenses | | | 26,977 | |
Trustees’ fees and expenses | | | 5,914 | |
Other fees and expenses | | | 5,224 | |
| | | | |
Total expenses | | | 1,980,463 | |
Less: Fee waivers and/or expense reimbursements | | | (285,541 | ) |
| | | | |
Net expenses | | | 1,694,922 | |
| | | | |
Net investment income | | | 843,253 | |
| | | | |
| |
REALIZED AND UNREALIZED GAINS (LOSSES) ON INVESTMENTS | | | | |
Net realized gains on investments | | | 20,656,397 | |
Net change in unrealized gains (losses) on investments | | | (20,768,784 | ) |
| | | | |
Net realized and unrealized gains (losses) on investments | | | (112,387 | ) |
| | | | |
Net increase in net assets resulting from operations | | $ | 730,866 | |
| | | | |
The accompanying notes are an integral part of these financial statements.
| | | | |
| 14 | | Wells Fargo Advantage Large Company Value Fund | | Statement of changes in net assets |
| | | | | | | | | | | | | | | | |
| | | Six months ended
January 31, 2015
(unaudited) | | | Year ended
July 31, 2014 | |
| | | | |
Operations | | | | | | | | | | | | | | | | |
Net investment income | | | | | | $ | 843,253 | | | | | | | $ | 1,848,473 | |
Net realized gains on investments | | | | | | | 20,656,397 | | | | | | | | 39,715,628 | |
Net change in unrealized gains (losses) on investments | | | | | | | (20,768,784 | ) | | | | | | | (2,444,555 | ) |
| | | | |
Net increase in net assets resulting from operations | | | | | | | 730,866 | | | | | | | | 39,119,546 | |
| | | | |
| | | | |
Distributions to shareholders from | | | | | | | | | | | | | | | | |
Net investment income | | | | | | | | | | | | | | | | |
Class A | | | | | | | (419,357 | ) | | | | | | | (625,503 | ) |
Class C | | | | | | | 0 | | | | | | | | (2,997 | ) |
Administrator Class | | | | | | | (205,797 | ) | | | | | | | (269,425 | ) |
Institutional Class | | | | | | | (10,621 | ) | | | | | | | (12,375 | ) |
Investor Class | | | | | | | (468,512 | ) | | | | | | | (668,519 | ) |
Net realized gains | | | | | | | | | | | | | | | | |
Class A | | | | | | | (9,704,404 | ) | | | | | | | (11,065,973 | ) |
Class C | | | | | | | (389,854 | ) | | | | | | | (448,468 | ) |
Administrator Class | | | | | | | (3,048,826 | ) | | | | | | | (3,552,432 | ) |
Institutional Class | | | | | | | (160,301 | ) | | | | | | | (122,590 | ) |
Investor Class | | | | | | | (12,477,097 | ) | | | | | | | (13,095,944 | ) |
| | | | |
Total distributions to shareholders | | | | | | | (26,884,769 | ) | | | | | | | (29,864,226 | ) |
| | | | |
| | | | |
Capital share transactions | | | Shares | | | | | | | | Shares | | | | | |
Proceeds from shares sold | | | | | | | | | | | | | | | | |
Class A | | | 78,147 | | | | 1,284,015 | | | | 206,529 | | | | 3,419,892 | |
Class C | | | 29,797 | | | | 493,020 | | | | 34,216 | | | | 581,634 | |
Administrator Class | | | 86,844 | | | | 1,461,493 | | | | 224,328 | | | | 3,712,144 | |
Institutional Class | | | 64,018 | | | | 1,110,032 | | | | 8,867 | | | | 147,541 | |
Investor Class | | | 171,020 | | | | 2,937,553 | | | | 416,128 | | | | 7,103,375 | |
| | | | |
| | | | | | | 7,286,113 | | | | | | | | 14,964,586 | |
| | | | |
Reinvestment of distributions | | | | | | | | | | | | | | | | |
Class A | | | 623,860 | | | | 9,812,875 | | | | 712,472 | | | | 11,432,349 | |
Class C | | | 21,192 | | | | 339,283 | | | | 24,127 | | | | 394,545 | |
Administrator Class | | | 188,165 | | | | 2,981,872 | | | | 209,544 | | | | 3,383,843 | |
Institutional Class | | | 5,713 | | | | 90,443 | | | | 7,706 | | | | 124,367 | |
Investor Class | | | 768,731 | | | | 12,436,168 | | | | 797,069 | | | | 13,123,493 | |
| | | | |
| | | | | | | 25,660,641 | | | | | | | | 28,458,597 | |
| | | | |
Payment for shares redeemed | | | | | | | | | | | | | | | | |
Class A | | | (682,529 | ) | | | (11,521,741 | ) | | | (1,072,642 | ) | | | (17,848,323 | ) |
Class C | | | (32,219 | ) | | | (547,609 | ) | | | (58,373 | ) | | | (969,833 | ) |
Administrator Class | | | (275,545 | ) | | | (4,628,226 | ) | | | (662,954 | ) | | | (11,056,702 | ) |
Institutional Class | | | (5,838 | ) | | | (100,017 | ) | | | (166,124 | ) | | | (2,726,544 | ) |
Investor Class | | | (555,989 | ) | | | (9,496,407 | ) | | | (974,086 | ) | | | (16,531,264 | ) |
| | | | |
| | | | | | | (26,294,000 | ) | | | | | | | (49,132,666 | ) |
| | | | |
Net increase (decrease) in net assets resulting from capital share transactions | | | | | | | 6,652,754 | | | | | | | | (5,709,483 | ) |
| | | | |
Total increase (decrease) in net assets | | | | | | | (19,501,149 | ) | | | | | | | 3,545,837 | |
| | | | |
| | | | |
Net assets | | | | | | | | | | | | | | | | |
Beginning of period | | | | | | | 304,645,657 | | | | | | | | 301,099,820 | |
| | | | |
End of period | | | | | | $ | 285,144,508 | | | | | | | $ | 304,645,657 | |
| | | | |
Undistributed net investment income | | | | | | $ | 28,512 | | | | | | | $ | 289,546 | |
| | | | |
The accompanying notes are an integral part of these financial statements.
| | | | | | |
| Financial highlights | | Wells Fargo Advantage Large Company Value Fund | | | 15 | |
(For a share outstanding throughout each period)
| | | | | | | | | | | | | | | | | | | | | | | | |
| | | Six months ended
January 31, 2015 (unaudited) | | | Year ended July 31 | |
| CLASS A | | | 2014 | | | 2013 | | | 2012 | | | 2011 | | | 2010 | |
Net asset value, beginning of period | | | $16.82 | | | | $16.39 | | | | $12.96 | | | | $12.61 | | | | $11.04 | | | | $9.84 | |
Net investment income | | | 0.05 | | | | 0.10 | | | | 0.14 | | | | 0.17 | | | | 0.12 | | | | 0.09 | |
Net realized and unrealized gains (losses) on investments | | | (0.01 | ) | | | 2.04 | | | | 3.48 | | | | 0.35 | | | | 1.51 | | | | 1.21 | |
| | | | | | | | | | | | | | | | | | | | | | | | |
Total from investment operations | | | 0.04 | | | | 2.14 | | | | 3.62 | | | | 0.52 | | | | 1.63 | | | | 1.30 | |
Distributions to shareholders from | | | | | | | | | | | | | | | | | | | | | | | | |
Net investment income | | | (0.06 | ) | | | (0.09 | ) | | | (0.19 | ) | | | (0.17 | ) | | | (0.06 | ) | | | (0.10 | ) |
Net realized gains | | | (1.50 | ) | | | (1.62 | ) | | | 0.00 | | | | 0.00 | | | | 0.00 | | | | 0.00 | |
| | | | | | | | | | | | | | | | | | | | | | | | |
Total distributions to shareholders | | | (1.56 | ) | | | (1.71 | ) | | | (0.19 | ) | | | (0.17 | ) | | | (0.06 | ) | | | (0.10 | ) |
Net asset value, end of period | | | $15.30 | | | | $16.82 | | | | $16.39 | | | | $12.96 | | | | $12.61 | | | | $11.04 | |
Total return1 | | | 0.04 | % | | | 13.68 | % | | | 28.16 | % | | | 4.21 | % | | | 14.77 | % | | | 13.22 | % |
Ratios to average net assets (annualized) | | | | | | | | | | | | | | | | | | | | | | | | |
Gross expenses | | | 1.28 | % | | | 1.28 | % | | | 1.28 | % | | | 1.27 | % | | | 1.32 | % | | | 1.42 | % |
Net expenses | | | 1.10 | % | | | 1.10 | % | | | 1.10 | % | | | 1.10 | % | | | 1.25 | % | | | 1.25 | % |
Net investment income | | | 0.56 | % | | | 0.61 | % | | | 1.00 | % | | | 1.29 | % | | | 0.74 | % | | | 0.74 | % |
Supplemental data | | | | | | | | | | | | | | | | | | | | | | | | |
Portfolio turnover rate | | | 43 | % | | | 59 | % | | | 78 | % | | | 37 | % | | | 35 | % | | | 42 | % |
Net assets, end of period (000s omitted) | | | $106,201 | | | | $116,398 | | | | $115,895 | | | | $103,195 | | | | $642 | | | | $362 | |
| 1 | Total return calculations do not include any sales charges. Returns for periods of less than one year are not annualized. |
The accompanying notes are an integral part of these financial statements.
| | | | |
| 16 | | Wells Fargo Advantage Large Company Value Fund | | Financial highlights |
(For a share outstanding throughout each period)
| | | | | | | | | | | | | | | | | | | | | | | | |
| | | Six months ended
January 31, 2015 (unaudited) | | | Year ended July 31 | |
| CLASS C | | | 2014 | | | 2013 | | | 2012 | | | 2011 | | | 2010 | |
Net asset value, beginning of period | | | $17.12 | | | | $16.70 | | | | $13.21 | | | | $12.81 | | | | $11.26 | | | | $10.03 | |
Net investment income (loss) | | | (0.01 | ) | | | (0.02 | ) | | | 0.04 | | | | 0.09 | | | | 0.01 | | | | 0.03 | |
Net realized and unrealized gains (losses) on investments | | | 0.00 | 1 | | | 2.07 | | | | 3.54 | | | | 0.36 | | | | 1.55 | | | | 1.22 | |
| | | | | | | | | | | | | | | | | | | | | | | | |
Total from investment operations | | | (0.01 | ) | | | 2.05 | | | | 3.58 | | | | 0.45 | | | | 1.56 | | | | 1.25 | |
Distributions to shareholders from | | | | | | | | | | | | | | | | | | | | | | | | |
Net investment income | | | 0.00 | | | | (0.01 | ) | | | (0.09 | ) | | | (0.05 | ) | | | (0.01 | ) | | | (0.02 | ) |
Net realized gains | | | (1.50 | ) | | | (1.62 | ) | | | 0.00 | | | | 0.00 | | | | 0.00 | | | | 0.00 | |
| | | | | | | | | | | | | | | | | | | | | | | | |
Total distributions to shareholders | | | (1.50 | ) | | | (1.63 | ) | | | (0.09 | ) | | | (0.05 | ) | | | (0.01 | ) | | | (0.02 | ) |
Net asset value, end of period | | | $15.61 | | | | $17.12 | | | | $16.70 | | | | $13.21 | | | | $12.81 | | | | $11.26 | |
Total return2 | | | (0.26 | )% | | | 12.83 | % | | | 27.17 | % | | | 3.49 | % | | | 13.85 | % | | | 12.47 | % |
Ratios to average net assets (annualized) | | | | | | | | | | | | | | | | | | | | | | | | |
Gross expenses | | | 2.03 | % | | | 2.03 | % | | | 2.03 | % | | | 2.02 | % | | | 2.08 | % | | | 2.17 | % |
Net expenses | | | 1.85 | % | | | 1.85 | % | | | 1.85 | % | | | 1.85 | % | | | 2.00 | % | | | 2.00 | % |
Net investment income (loss) | | | (0.19 | )% | | | (0.14 | )% | | | 0.25 | % | | | 0.54 | % | | | 0.04 | % | | | 0.02 | % |
Supplemental data | | | | | | | | | | | | | | | | | | | | | | | | |
Portfolio turnover rate | | | 43 | % | | | 59 | % | | | 78 | % | | | 37 | % | | | 35 | % | | | 42 | % |
Net assets, end of period (000s omitted) | | | $4,538 | | | | $4,659 | | | | $4,543 | | | | $4,022 | | | | $513 | | | | $438 | |
| 1 | Amount is less than $0.005. |
| 2 | Total return calculations do not include any sales charges. Returns for periods of less than one year are not annualized. |
The accompanying notes are an integral part of these financial statements.
| | | | | | |
| Financial highlights | | Wells Fargo Advantage Large Company Value Fund | | | 17 | |
(For a share outstanding throughout each period)
| | | | | | | | | | | | | | | | | | | | | | | | |
| | | Six months ended
January 31, 2015 (unaudited) | | | Year ended July 31 | |
| ADMINISTRATOR CLASS | | | 2014 | | | 2013 | | | 2012 | | | 2011 | | | 2010 | |
Net asset value, beginning of period | | | $16.93 | | | | $16.47 | | | | $13.02 | | | | $12.68 | | | | $11.08 | | | | $9.87 | |
Net investment income | | | 0.07 | | | | 0.15 | | | | 0.21 | | | | 0.19 | 1 | | | 0.11 | | | | 0.12 | 1 |
Net realized and unrealized gains (losses) on investments | | | (0.01 | ) | | | 2.05 | | | | 3.46 | | | | 0.36 | | | | 1.56 | | | | 1.22 | |
| | | | | | | | | | | | | | | | | | | | | | | | |
Total from investment operations | | | 0.06 | | | | 2.20 | | | | 3.67 | | | | 0.55 | | | | 1.67 | | | | 1.34 | |
Distributions to shareholders from | | | | | | | | | | | | | | | | | | | | | | | | |
Net investment income | | | (0.09 | ) | | | (0.12 | ) | | | (0.22 | ) | | | (0.21 | ) | | | (0.07 | ) | | | (0.13 | ) |
Net realized gains | | | (1.50 | ) | | | (1.62 | ) | | | 0.00 | | | | 0.00 | | | | 0.00 | | | | 0.00 | |
| | | | | | | | | | | | | | | | | | | | | | | | |
Total distributions to shareholders | | | (1.59 | ) | | | (1.74 | ) | | | (0.22 | ) | | | (0.21 | ) | | | (0.07 | ) | | | (0.13 | ) |
Net asset value, end of period | | | $15.40 | | | | $16.93 | | | | $16.47 | | | | $13.02 | | | | $12.68 | | | | $11.08 | |
Total return2 | | | 0.19 | % | | | 13.94 | % | | | 28.52 | % | | | 4.47 | % | | | 15.12 | % | | | 13.53 | % |
Ratios to average net assets (annualized) | | | | | | | | | | | | | | | | | | | | | | | | |
Gross expenses | | | 1.12 | % | | | 1.12 | % | | | 1.10 | % | | | 1.11 | % | | | 1.17 | % | | | 1.24 | % |
Net expenses | | | 0.85 | % | | | 0.85 | % | | | 0.85 | % | | | 0.85 | % | | | 0.96 | % | | | 0.96 | % |
Net investment income | | | 0.82 | % | | | 0.86 | % | | | 1.28 | % | | | 1.54 | % | | | 1.93 | % | | | 1.12 | % |
Supplemental data | | | | | | | | | | | | | | | | | | | | | | | | |
Portfolio turnover rate | | | 43 | % | | | 59 | % | | | 78 | % | | | 37 | % | | | 35 | % | | | 42 | % |
Net assets, end of period (000s omitted) | | | $32,742 | | | | $36,002 | | | | $38,798 | | | | $176,623 | | | | $667 | | | | $289 | |
| 1 | Calculated based upon average shares outstanding |
| 2 | Returns for periods of less than one year are not annualized. |
The accompanying notes are an integral part of these financial statements.
| | | | |
| 18 | | Wells Fargo Advantage Large Company Value Fund | | Financial highlights |
(For a share outstanding throughout each period)
| | | | | | | | | | | | | | | | | | | | | | | | |
| | | Six months ended
January 31, 2015 (unaudited) | | | Year ended July 31 | |
| INSTITUTIONAL CLASS | | | 2014 | | | 2013 | | | 2012 | | | 2011 | | | 2010 | |
Net asset value, beginning of period | | | $16.91 | | | | $16.44 | | | | $13.00 | | | | $12.68 | | | | $11.08 | | | | $9.86 | |
Net investment income | | | 0.08 | 1 | | | 0.18 | 1 | | | 0.26 | 1 | | | 0.22 | | | | 0.14 | | | | 0.14 | |
Net realized and unrealized gains (losses) on investments | | | 0.00 | 2 | | | 2.05 | | | | 3.45 | | | | 0.35 | | | | 1.54 | | | | 1.23 | |
| | | | | | | | | | | | | | | | | | | | | | | | |
Total from investment operations | | | 0.08 | | | | 2.23 | | | | 3.71 | | | | 0.57 | | | | 1.68 | | | | 1.37 | |
Distributions to shareholders from | | | | | | | | | | | | | | | | | | | | | | | | |
Net investment income | | | (0.12 | ) | | | (0.14 | ) | | | (0.27 | ) | | | (0.25 | ) | | | (0.08 | ) | | | (0.15 | ) |
Net realized gains | | | (1.50 | ) | | | (1.62 | ) | | | 0.00 | | | | 0.00 | | | | 0.00 | | | | 0.00 | |
| | | | | | | | | | | | | | | | | | | | | | | | |
Total distributions to shareholders | | | (1.62 | ) | | | (1.76 | ) | | | (0.27 | ) | | | (0.25 | ) | | | (0.08 | ) | | | (0.15 | ) |
Net asset value, end of period | | | $15.37 | | | | $16.91 | | | | $16.44 | | | | $13.00 | | | | $12.68 | | | | $11.08 | |
Total return3 | | | 0.26 | % | | | 14.16 | % | | | 28.93 | % | | | 4.67 | % | | | 15.36 | % | | | 13.76 | % |
Ratios to average net assets (annualized) | | | | | | | | | | | | | | | | | | | | | | | | |
Gross expenses | | | 0.85 | % | | | 0.85 | % | | | 0.84 | % | | | 0.85 | % | | | 0.89 | % | | | 0.96 | % |
Net expenses | | | 0.65 | % | | | 0.65 | % | | | 0.65 | % | | | 0.66 | % | | | 0.75 | % | | | 0.75 | % |
Net investment income | | | 0.98 | % | | | 1.10 | % | | | 1.83 | % | | | 1.80 | % | | | 1.12 | % | | | 1.28 | % |
Supplemental data | | | | | | | | | | | | | | | | | | | | | | | | |
Portfolio turnover rate | | | 43 | % | | | 59 | % | | | 78 | % | | | 37 | % | | | 35 | % | | | 42 | % |
Net assets, end of period (000s omitted) | | | $1,767 | | | | $863 | | | | $3,299 | | | | $15,924 | | | | $14,401 | | | | $9 | |
| 1 | Calculated based upon average shares outstanding |
| 2 | Amount is less than $0.005. |
| 3 | Returns for periods of less than one year are not annualized. |
The accompanying notes are an integral part of these financial statements.
| | | | | | |
| Financial highlights | | Wells Fargo Advantage Large Company Value Fund | | | 19 | |
(For a share outstanding throughout each period)
| | | | | | | | | | | | | | | | | | | | | | | | |
| | | Six months ended
January 31, 2015 (unaudited) | | | Year ended July 31 | |
| INVESTOR CLASS | | | 2014 | | | 2013 | | | 2012 | | | 2011 | | | 2010 | |
Net asset value, beginning of period | | | $17.26 | | | | $16.77 | | | | $13.26 | | | | $12.89 | | | | $11.28 | | | | $10.05 | |
Net investment income | | | 0.04 | | | | 0.09 | | | | 0.14 | | | | 0.16 | | | | 0.09 | | | | 0.08 | |
Net realized and unrealized gains (losses) on investments | | | 0.00 | 1 | | | 2.10 | | | | 3.55 | | | | 0.36 | | | | 1.57 | | | | 1.23 | |
| | | | | | | | | | | | | | | | | | | | | | | | |
Total from investment operations | | | 0.04 | | | | 2.19 | | | | 3.69 | | | | 0.52 | | | | 1.66 | | | | 1.31 | |
Distributions to shareholders from | | | | | | | | | | | | | | | | | | | | | | | | |
Net investment income | | | (0.05 | ) | | | (0.08 | ) | | | (0.18 | ) | | | (0.15 | ) | | | (0.05 | ) | | | (0.08 | ) |
Net realized gains | | | (1.50 | ) | | | (1.62 | ) | | | 0.00 | | | | 0.00 | | | | 0.00 | | | | 0.00 | |
| | | | | | | | | | | | | | | | | | | | | | | | |
Total distributions to shareholders | | | (1.55 | ) | | | (1.70 | ) | | | (0.18 | ) | | | (0.15 | ) | | | (0.05 | ) | | | (0.08 | ) |
Net asset value, end of period | | | $15.75 | | | | $17.26 | | | | $16.77 | | | | $13.26 | | | | $12.89 | | | | $11.28 | |
Total return2 | | | 0.06 | % | | | 13.60 | % | | | 28.12 | % | | | 4.09 | % | | | 14.75 | % | | | 13.06 | % |
Ratios to average net assets (annualized) | | | | | | | | | | | | | | | | | | | | | | | | |
Gross expenses | | | 1.34 | % | | | 1.34 | % | | | 1.34 | % | | | 1.34 | % | | | 1.40 | % | | | 1.52 | % |
Net expenses | | | 1.16 | % | | | 1.16 | % | | | 1.16 | % | | | 1.18 | % | | | 1.32 | % | | | 1.35 | % |
Net investment income | | | 0.50 | % | | | 0.55 | % | | | 0.94 | % | | | 1.27 | % | | | 0.74 | % | | | 0.70 | % |
Supplemental data | | | | | | | | | | | | | | | | | | | | | | | | |
Portfolio turnover rate | | | 43 | % | | | 59 | % | | | 78 | % | | | 37 | % | | | 35 | % | | | 42 | % |
Net assets, end of period (000s omitted) | | | $139,896 | | | | $146,723 | | | | $138,565 | | | | $123,774 | | | | $110,554 | | | | $108,703 | |
| 1 | Amount is less than $0.005. |
| 2 | Returns for periods of less than one year are not annualized. |
The accompanying notes are an integral part of these financial statements.
| | | | |
| 20 | | Wells Fargo Advantage Large Company Value Fund | | Notes to financial statements (unaudited) |
1. ORGANIZATION
Wells Fargo Funds Trust (the “Trust”), a Delaware statutory trust organized on March 10, 1999, is an open-end management investment company registered under the Investment Company Act of 1940, as amended (the “1940 Act”). As an investment company, the Trust follows the accounting and reporting guidance in Financial Accounting Standards Board (“FASB”) Accounting Standards Codification Topic 946, Financial Services – Investment Companies. These financial statements report on the Wells Fargo Advantage Large Company Value Fund (the “Fund”) which is a diversified series of the Trust.
2. SIGNIFICANT ACCOUNTING POLICIES
The following significant accounting policies, which are consistently followed in the preparation of the financial statements of the Fund, are in conformity with U.S. generally accepted accounting principles which require management to make estimates and assumptions that affect the reported amounts of assets and liabilities, disclosure of contingent assets and liabilities at the date of the financial statements, and the reported amounts of revenues and expenses during the reporting period. Actual results could differ from those estimates.
Securities valuation
All investments are valued each business day as of the close of regular trading on the New York Stock Exchange (generally 4 p.m. Eastern Time).
Equity securities that are listed on a foreign or domestic exchange or market are valued at the official closing price or, if none, the last sales price. If no sale occurs on the primary exchange or market for the security that day, the prior day’s price will be deemed “stale” and fair values will be determined in accordance with the Fund’s Valuation Procedures.
Investments in registered open-end investment companies are valued at net asset value. Non-registered investment vehicles are fair valued at net asset value.
Investments which are not valued using any of the methods discussed above are valued at their fair value, as determined in good faith by the Board of Trustees of the Fund. The Board of Trustees has established a Valuation Committee comprised of the Trustees and has delegated to it the authority to take any actions regarding the valuation of portfolio securities that the Valuation Committee deems necessary or appropriate, including determining the fair value of portfolio securities, unless the determination has been delegated to the Management Valuation Team of Wells Fargo Funds Management, LLC (“Funds Management”). The Board of Trustees retains the authority to make or ratify any valuation decisions or approve any changes to the Valuation Procedures as it deems appropriate. On a quarterly basis, the Board of Trustees receives reports on any valuation actions taken by the Valuation Committee or the Management Valuation Team which may include items for ratification.
Valuations of fair valued securities are compared to the next actual sales price when available, or other appropriate market values, to assess the continued appropriateness of the fair valuation methodologies used. These securities are fair valued on a day-to-day basis, taking into consideration changes to appropriate market information and any significant changes to the inputs considered in the valuation process until there is a readily available price provided on an exchange or by an independent pricing service. Valuations received from an independent pricing service or independent broker-dealer quotes are periodically validated by comparisons to most recent trades and valuations provided by other independent pricing services in addition to the review of prices by the adviser and/or subadviser. Unobservable inputs used in determining fair valuations are identified based on the type of security, taking into consideration factors utilized by market participants in valuing the investment, knowledge about the issuer and the current market environment.
Security loans
The Fund may lend its securities from time to time in order to earn additional income in the form of fees or interest on securities received as collateral or the investment of any cash received as collateral. The Fund continues to receive interest or dividends on the securities loaned. The Fund receives collateral in the form of cash or securities with a value at least equal to the value of the securities on loan. The value of the loaned securities is determined at the close of each business day and any additional required collateral is delivered to the Fund on the next business day. In a securities lending transaction, the net asset value of the Fund will be affected by an increase or decrease in the value of the securities loaned and by an increase or decrease in the value of the instrument in which collateral is invested. The amount of securities lending activity undertaken by the Fund fluctuates from time to time. In the event of default or bankruptcy by the borrower, the Fund may be prevented from recovering the loaned securities or gaining access to the collateral or may experience delays or costs in doing so. In addition, the investment of any cash collateral received may lose all or part of its value. The Fund has the right under the lending agreement to recover the securities from the borrower on demand.
| | | | | | |
| Notes to financial statements (unaudited) | | Wells Fargo Advantage Large Company Value Fund | | | 21 | |
The Fund lends its securities through an unaffiliated securities lending agent. Cash collateral received in connection with its securities lending transactions is invested in Securities Lending Cash Investments, LLC (the “Securities Lending Fund”). The Securities Lending Fund is exempt from registration under Section 3(c)(7) of the 1940 Act and is managed by Funds Management and is subadvised by Wells Capital Management Incorporated (“WellsCap”). Funds Management receives an advisory fee starting at 0.05% and declining to 0.01% as the average daily net assets of the Securities Lending Fund increase. All of the fees received by Funds Management are paid to WellsCap for its services as subadviser. The Securities Lending Fund seeks to provide a positive return compared to the daily Fed Funds Open rate by investing in high-quality, U.S. dollar-denominated short-term money market instruments. Securities Lending Fund investments are fair valued based upon the amortized cost valuation technique. Income earned from investment in the Securities Lending Fund is included in securities lending income on the Statement of Operations.
Security transactions and income recognition
Securities transactions are recorded on a trade date basis. Realized gains or losses are recorded on the basis of identified cost.
Dividend income is recognized on the ex-dividend date.
Distributions to shareholders
Distributions to shareholders from net investment income and net realized gains, if any, are recorded on the ex-dividend date. Such distributions are determined in conformity with federal income tax regulations, which may differ in amount or character from net investment income and realized gains recognized for purposes of U.S. generally accepted accounting principles.
Federal and other taxes
The Fund intends to continue to qualify as a regulated investment company by distributing substantially all of its investment company taxable income and any net realized capital gains (after reduction for capital loss carryforwards) sufficient to relieve it from all, or substantially all, federal income taxes. Accordingly, no provision for federal income taxes was required.
The Fund’s income and federal excise tax returns and all financial records supporting those returns for the prior three fiscal years are subject to examination by the federal and Delaware revenue authorities. Management has analyzed the Fund’s tax positions taken on federal, state, and foreign tax returns for all open tax years and does not believe that there are any uncertain tax positions that require recognition of a tax liability.
As of July 31, 2014, the Fund had capital loss carryforwards available to offset future net realized capital gains in the amount of $14,314,500 with $11,985,163 expiring in 2016; and $2,329,337 expiring in 2018.
Class allocations
The separate classes of shares offered by the Fund differ principally in applicable sales charges, distribution, shareholder servicing, and administration fees. Class specific expenses are charged directly to that share class. Investment income, common expenses, and realized and unrealized gains (losses) on investments are allocated daily to each class of shares based on the relative proportion of net assets of each class.
3. FAIR VALUATION MEASUREMENTS
Fair value measurements of investments are determined within a framework that has established a fair value hierarchy based upon the various data inputs utilized in determining the value of the Fund’s investments. The three-level hierarchy gives the highest priority to unadjusted quoted prices in active markets for identical assets or liabilities (Level 1) and the lowest priority to significant unobservable inputs (Level 3). The Fund’s investments are classified within the fair value hierarchy based on the lowest level of input that is significant to the fair value measurement. The inputs are summarized into three broad levels as follows:
| n | | Level 1 – quoted prices in active markets for identical securities |
| n | | Level 2 – other significant observable inputs (including quoted prices for similar securities, interest rates, prepayment speeds, credit risk, use of amortized cost, etc.) |
| n | | Level 3 – significant unobservable inputs (including the Fund’s own assumptions in determining the fair value of investments) |
The inputs or methodologies used for valuing investments in securities are not necessarily an indication of the risk associated with investing in those securities.
| | | | |
| 22 | | Wells Fargo Advantage Large Company Value Fund | | Notes to financial statements (unaudited) |
The following is a summary of the inputs used in valuing the Fund’s assets and liabilities as of January 31, 2015:
| | | | | | | | | | | | | | | | |
| | | Quoted prices
(Level 1) | | | Other significant
observable inputs
(Level 2) | | | Significant
unobservable inputs
(Level 3) | | | Total | |
Assets | | | | | | | | | | | | | | | | |
Investments in : | | | | | | | | | | | | | | | | |
| | | | |
Common stocks | | | | | | | | | | | | | | | | |
Consumer discretionary | | $ | 23,951,105 | | | $ | 0 | | | $ | 0 | | | $ | 23,951,105 | |
Consumer staples | | | 14,136,868 | | | | 0 | | | | 0 | | | | 14,136,868 | |
Energy | | | 26,296,279 | | | | 0 | | | | 0 | | | | 26,296,279 | |
Financials | | | 83,964,784 | | | | 0 | | | | 0 | | | | 83,964,784 | |
Health care | | | 35,921,277 | | | | 0 | | | | 0 | | | | 35,921,277 | |
Industrials | | | 32,336,284 | | | | 0 | | | | 0 | | | | 32,336,284 | |
Information technology | | | 34,415,568 | | | | 0 | | | | 0 | | | | 34,415,568 | |
Materials | | | 12,354,655 | | | | 0 | | | | 0 | | | | 12,354,655 | |
Telecommunication services | | | 5,162,652 | | | | 0 | | | | 0 | | | | 5,162,652 | |
Utilities | | | 11,983,094 | | | | 0 | | | | 0 | | | | 11,983,094 | |
| | | | |
Short-term investments | | | | | | | | | | | | | | | | |
Investment companies | | | 7,510,112 | | | | 966,400 | | | | 0 | | | | 8,476,512 | |
Total assets | | $ | 288,032,678 | | | $ | 966,400 | | | $ | 0 | | | $ | 288,999,078 | |
The Fund recognizes transfers between levels within the fair value hierarchy at the end of the reporting period. At January 31, 2015, the Fund did not have any transfers into/out of Level 1, Level 2, or Level 3.
4. TRANSACTIONS WITH AFFILIATES AND OTHER EXPENSES
Advisory fee
The Trust has entered into an advisory contract with Funds Management, an indirect wholly owned subsidiary of Wells Fargo & Company (“Wells Fargo”). The adviser is responsible for implementing investment policies and guidelines and for supervising the subadviser, who is responsible for day-to-day portfolio management of the Fund.
Pursuant to the contract, Funds Management is entitled to receive an annual advisory fee starting at 0.65% and declining to 0.475% as the average daily net assets of the Fund increase. Prior to December 1, 2014, Funds Management was entitled to receive an annual advisory fee which started at 0.65% and declined to 0.55% as the average daily net assets of the Fund increased. For the six months ended January 31, 2015, the advisory fee was equivalent to an annual rate of 0.65% of the Fund’s average daily net assets.
Funds Management has retained the services of a subadviser to provide daily portfolio management to the Fund. The fee for subadvisory services is borne by Funds Management. Phocas Financial Corporation is the subadviser to the Fund and is entitled to receive a fee from Funds Management at an annual rate starting at 0.29% and declining to 0.20% as the average daily net assets of the Fund increase.
Administration fees
The Trust has entered into an administration agreement with Funds Management. Under this agreement, for providing administrative services, which includes paying fees and expenses for services provided by the transfer agent, sub-transfer agents, omnibus account servicers and record-keepers, Funds Management is entitled to receive from the Fund an annual fund level administration fee starting at 0.05% and declining to 0.03% as the average daily net assets of the Fund increase and a class level administration fee which is calculated based on the average daily net assets of each class as follows:
| | | | |
| | | Class level
administration fee | |
Class A, Class C | | | 0.26 | % |
Administrator Class | | | 0.10 | |
Institutional Class | | | 0.08 | |
Investor Class | | | 0.32 | |
| | | | | | |
| Notes to financial statements (unaudited) | | Wells Fargo Advantage Large Company Value Fund | | | 23 | |
Funds Management has contractually waived and/or reimbursed advisory and administration fees to the extent necessary to maintain certain net operating expense ratios for the Fund. Waiver of fees and/or reimbursement of expenses by Funds Management were made first from fund level expenses on a proportionate basis and then from class specific expenses. Funds Management has committed through November 30, 2015 to waive fees and/or reimburse expenses to the extent necessary to cap the Fund’s expenses at 1.10% for Class A shares, 1.85% for Class C shares, 0.85% for Administrator Class shares, 0.65% for Institutional Class shares and 1.16% for Investor Class shares. After this time, the cap may be increased or the commitment to maintain the cap may be terminated only with the approval of the Board of Trustees.
Distribution fee
The Trust has adopted a Distribution Plan for Class C shares of the Fund pursuant to Rule 12b-1 under the 1940 Act. A distribution fee is charged to Class C shares and paid to Wells Fargo Funds Distributor, LLC (“Funds Distributor”), the principal underwriter, at an annual rate of 0.75% of the average daily net assets of Class C shares.
In addition, Funds Distributor is entitled to receive the front-end sales charge from the purchase of Class A shares and a contingent deferred sales charge on the redemption of certain shares. Funds Distributor is also entitled to receive the contingent deferred sales charges from redemptions of Class C shares. For the six months ended January 31, 2015, Funds Distributor received $2,280 from the sale of Class A shares.
Shareholder servicing fees
The Trust has entered into contracts with one or more shareholder servicing agents, whereby Class A, Class C, Administrator Class, and Investor Class of the Fund is charged a fee at an annual rate of 0.25% of the average daily net assets of each respective class.
A portion of these total shareholder servicing fees were paid to affiliates of Wells Fargo.
5. INVESTMENT PORTFOLIO TRANSACTIONS
Purchases and sales of investments, excluding U.S. government obligations (if any) and short-term securities, for the six months ended January 31, 2015 were $220,413,421 and $276,325,300, respectively.
6. BANK BORROWINGS
The Trust (excluding the money market funds and certain other funds in the Trust) and Wells Fargo Variable Trust are parties to a $150,000,000 revolving credit agreement, whereby the Fund is permitted to use bank borrowings for temporary or emergency purposes, such as to fund shareholder redemption requests. Interest under the credit agreement is charged to the Fund based on a borrowing rate equal to the higher of the Federal Funds rate in effect on that day plus 1.25% or the overnight LIBOR rate in effect on that day plus 1.25%. In addition, an annual commitment fee equal to 0.10% of the unused balance is allocated to each participating fund. For the six months ended January 31, 2015, the Fund paid $226 in commitment fees.
For the six months ended January 31, 2015, there were no borrowings by the Fund under the agreement.
7. CONCENTRATION RISK
Concentration risks result from exposure to a limited number of sectors. A fund that invests a substantial portion of its assets in any sector may be more affected by changes in that sector than would be a fund whose investments are not heavily weighted in any sector.
8. INDEMNIFICATION
Under the Trust’s organizational documents, the officers and Trustees are indemnified against certain liabilities that may arise out of performance of their duties to the Trust. Additionally, in the normal course of business, the Trust may enter into contracts with service providers that contain a variety of indemnification clauses. The Trust’s maximum exposure under these arrangements is dependent on future claims that may be made against the Fund and, therefore, cannot be estimated.
| | | | |
| 24 | | Wells Fargo Advantage Large Company Value Fund | | Notes to financial statements (unaudited) |
9. SUBSEQUENT DISTRIBUTIONS
On March 25, 2015, the Fund declared distributions from net investment income to shareholders of record on March 24, 2015. The per share amounts payable on March 26, 2015 were as follows:
| | | | |
| | | Net investment income | |
Class A | | $ | 0.03510 | |
Class C | | $ | 0.00844 | |
Administrator Class | | $ | 0.04328 | |
Institutional Class | | $ | 0.04995 | |
Investor Class | | $ | 0.03273 | |
These distributions are not reflected in the accompanying financial statements. The final determination of the source of all distributions is subject to change and made after the Fund’s tax year-end.
| | | | | | |
| Other information (unaudited) | | Wells Fargo Advantage Large Company Value Fund | | | 25 | |
PROXY VOTING INFORMATION
A description of the policies and procedures that the Fund uses to determine how to vote proxies relating to portfolio securities, in addition to information regarding how the Fund voted proxies relating to portfolio securities during the most recent 12-month period ended June 30, is available on the Fund’s website at wellsfargoadvantagefunds.com or by visiting the SEC website at sec.gov.
PORTFOLIO HOLDINGS INFORMATION
The complete portfolio holdings for the Fund are publicly available monthly on the Fund’s website (wellsfargoadvantagefunds.com), on a one-month delayed basis. In addition, top ten holdings information (excluding derivative positions) for the Fund is publicly available on the Fund’s website on a monthly, seven-day or more delayed basis. The Fund files its complete schedule of portfolio holdings with the SEC for the first and third quarters of each fiscal year on Form N-Q, which is available by visiting the SEC website at sec.gov. In addition, the Fund’s Form N-Q may be reviewed and copied at the SEC’s Public Reference Room in Washington, DC, and at regional offices in New York City, at 233 Broadway, and in Chicago, at 175 West Jackson Boulevard, Suite 900. Information about the Public Reference Room may be obtained by calling 1-800-SEC-0330.
| | | | |
| 26 | | Wells Fargo Advantage Large Company Value Fund | | Other information (unaudited) |
BOARD OF TRUSTEES AND OFFICERS
Each of the Trustees and Officers1 listed in the table below acts in identical capacities for each fund in the Wells Fargo Advantage family of funds, which consists of 134 mutual funds comprising the Wells Fargo Funds Trust, Wells Fargo Variable Trust, Wells Fargo Master Trust and four closed-end funds (collectively the “Fund Complex”). This table should be read in conjunction with the Prospectus and the Statement of Additional Information2. The mailing address of each Trustee and Officer is 525 Market Street, 12th Floor, San Francisco, CA 94105. Each Trustee and Officer serves an indefinite term, however, each Trustee serves such term until reaching the mandatory retirement age established by the Trustees.
Independent Trustees
| | | | | | |
Name and
year of birth | | Position held and
length of service* | | Principal occupations during past five years or longer | | Other
directorships during
past five years |
| William R. Ebsworth (Born 1957) | | Trustee, since 2015** | | Retired. From 1984 to 2013, equities analyst, portfolio manager, research director at Fidelity Management and Research Company and retired in 2013 as Chief Investment Officer of Fidelity Strategic Advisers, Inc. in Boston, Tokyo, and Hong Kong where he led a team of investment professionals managing client assets. Prior thereto, Board member of Hong Kong Securities Clearing Co., Hong Kong Options Clearing Corp., the Thailand International Fund, Ltd., Fidelity Investments Life Insurance Company, and Empire Fidelity Investments Life Insurance Company. Mr. Ebsworth is an Adjunct Lecturer, Finance, at Babson College and a Chartered Financial Analyst. | | Asset Allocation Trust |
| Jane A. Freeman (Born 1953) | | Trustee, since 2015** | | Retired. From 2012 to 2014 and 1999 to 2008, Chief Financial Officer of Scientific Learning Corporation. From 2008 to 2012, Ms. Freeman provided consulting services related to strategic business projects. Prior thereto, Portfolio Manager at Rockefeller & Co. and Scudder, Stevens & Clark. Board member of the Harding Loevner Funds from 1996 to 2014, serving as both Lead Independent Director and chair of the Audit Committee. Board member of the Russell Exchange Traded Funds Trust from 2011 to 2012 and the chair of the Audit Committee. Ms. Freeman is a Chartered Financial Analyst (inactive), Chair of Taproot Foundation (non-profit organization) and a Board Member of Ruth Bancroft Garden (non-profit organization). | | Asset Allocation Trust |
| Peter G. Gordon (Born 1942) | | Trustee, since 1998; Chairman, since 2005 | | Co-Founder, Retired Chairman, President and CEO of Crystal Geyser Water Company. Trustee Emeritus, Colby College. | | Asset Allocation Trust |
| Isaiah Harris, Jr. (Born 1952) | | Trustee, since 2009 | | Retired. Chairman of the Board of CIGNA Corporation since 2009, and Director since 2005. From 2003 to 2011, Director of Delux Corporation. Prior thereto, President and CEO of BellSouth Advertising and Publishing Corp. from 2005 to 2007, President and CEO of BellSouth Enterprises from 2004 to 2005 and President of BellSouth Consumer Services from 2000 to 2003. Emeritus member of the Iowa State University Foundation Board of Governors. Emeritus Member of the Advisory Board of Iowa State University School of Business. Advisory Board Member, Palm Harbor Academy. Mr. Harris is a certified public accountant. | | CIGNA Corporation; Asset Allocation Trust |
| Judith M. Johnson (Born 1949) | | Trustee, since 2008; Audit Committee Chairman, since 2008 | | Retired. Prior thereto, Chief Executive Officer and Chief Investment Officer of Minneapolis Employees Retirement Fund from 1996 to 2008. Ms. Johnson is an attorney, certified public accountant and a certified managerial accountant. | | Asset Allocation Trust |
| David F. Larcker (Born 1950) | | Trustee, since 2009 | | James Irvin Miller Professor of Accounting at the Graduate School of Business, Stanford University, Morgan Stanley Director of the Center for Leadership Development and Research and Senior Faculty of The Rock Center for Corporate Governance since 2006. From 2005 to 2008, Professor of Accounting at the Graduate School of Business, Stanford University. Prior thereto, Ernst & Young Professor of Accounting at The Wharton School, University of Pennsylvania from 1985 to 2005. | | Asset Allocation Trust |
| | | | | | |
| Other information (unaudited) | | Wells Fargo Advantage Large Company Value Fund | | | 27 | |
| | | | | | |
Name and
year of birth | | Position held and
length of service* | | Principal occupations during past five years or longer | | Other
directorships during
past five years |
| Olivia S. Mitchell (Born 1953) | | Trustee, since 2006 | | International Foundation of Employee Benefit Plans Professor, Wharton School of the University of Pennsylvania since 1993. Director of Wharton’s Pension Research Council and Boettner Center on Pensions & Retirement Research, and Research Associate at the National Bureau of Economic Research. Previously, Cornell University Professor from 1978 to 1993. | | Asset Allocation Trust |
| Timothy J. Penny (Born 1951) | | Trustee, since 1996 | | President and Chief Executive Officer of Southern Minnesota Initiative Foundation, a non-profit organization, since 2007 and Senior Fellow at the Humphrey Institute Policy Forum at the University of Minnesota since 1995. Member of the Board of Trustees of NorthStar Education Finance, Inc., a non-profit organization, since 2007. | | Asset Allocation Trust |
| Michael S. Scofield (Born 1943) | | Trustee, since 2010 | | Served on the Investment Company Institute’s Board of Governors and Executive Committee from 2008-2011 as well the Governing Council of the Independent Directors Council from 2006-2011 and the Independent Directors Council Executive Committee from 2008-2011. Chairman of the IDC from 2008-2010. Institutional Investor (Fund Directions) Trustee of Year in 2007. Trustee of the Evergreen Funds complex (and its predecessors) from 1984 to 2010. Chairman of the Evergreen Funds from 2000-2010. Former Trustee of the Mentor Funds. Retired Attorney, Law Offices of Michael S. Scofield. | | Asset Allocation Trust |
| Donald C. Willeke (Born 1940) | | Trustee, since 1996 | | Principal of the law firm of Willeke & Daniels. General Counsel of the Minneapolis Employees Retirement Fund from 1984 until its consolidation into the Minnesota Public Employees Retirement Association on June 30, 2010. Director and Vice Chair of The Tree Trust (non-profit corporation). Director of the American Chestnut Foundation (non-profit corporation). | | Asset Allocation Trust |
| * | Length of service dates reflect the Trustee’s commencement of service with the Trust’s predecessor entities, where applicable. |
| ** | William R. Ebsworth and Jane A. Freeman each became a Trustee effective January 1, 2015. |
Officers
| | | | | | |
Name and
year of birth | | Position held and
length of service | | Principal occupations during past five years or longer | | |
| Karla M. Rabusch (Born 1959) | | President, since 2003 | | Executive Vice President of Wells Fargo Bank, N.A. and President of Wells Fargo Funds Management, LLC since 2003. | | |
Jeremy DePalma1 (Born 1974) | | Treasurer, since 2012 | | Senior Vice President of Wells Fargo Funds Management, LLC since 2009. Senior Vice President of Evergreen Investment Management Company, LLC from 2008 to 2010. Vice President, Evergreen Investment Services, Inc. from 2004 to 2007. Head of the Fund Reporting and Control Team within Fund Administration from 2005 to 2010. | | |
C. David Messman (Born 1960) | | Secretary, since 2000; Chief Legal Officer, since 2003 | | Assistant General Counsel of Wells Fargo Bank, N.A. since 2013 and Vice President and Managing Counsel of Wells Fargo Bank N.A. from 1996 to 2013. Senior Vice President and Secretary of Wells Fargo Funds Management, LLC since 2001. | | |
| Debra Ann Early (Born 1964) | | Chief Compliance Officer, since 2007 | | Senior Vice President of Wells Fargo Funds Management, LLC since 2007 and Chief Compliance Officer from 2007 to 2014. Chief Compliance Officer of Parnassus Investments from 2005 to 2007. Chief Financial Officer of Parnassus Investments from 2004 to 2007 and Senior Audit Manager of PricewaterhouseCoopers LLP from 1998 to 2004. | | |
| David Berardi (Born 1975) | | Assistant Treasurer, since 2009 | | Vice President of Wells Fargo Funds Management, LLC since 2009. Vice President of Evergreen Investment Management Company, LLC from 2008 to 2010. Assistant Vice President of Evergreen Investment Services, Inc. from 2004 to 2008. Manager of Fund Reporting and Control for Evergreen Investment Management Company, LLC from 2004 to 2010. | | |
| 1 | Jeremy DePalma acts as Treasurer of 61 funds and Assistant Treasurer of 73 funds in the Fund Complex. |
| 2 | The Statement of Additional Information includes additional information about the Trustees and is available, without charge, upon request, by calling 1-800-222-8222 or by visiting the website at wellsfargoadvantagefunds.com. |
| | | | |
| 28 | | Wells Fargo Advantage Large Company Value Fund | | List of abbreviations |
The following is a list of common abbreviations for terms and entities that may have appeared in this report.
| ACA | — ACA Financial Guaranty Corporation |
| ADR | — American depositary receipt |
| ADS | — American depositary shares |
| AGC | — Assured Guaranty Corporation |
| AGM | — Assured Guaranty Municipal |
| Ambac | — Ambac Financial Group Incorporated |
| AMT | — Alternative minimum tax |
| BAN | — Bond anticipation notes |
| BHAC | — Berkshire Hathaway Assurance Corporation |
| CAB | — Capital appreciation bond |
| CCAB | — Convertible capital appreciation bond |
| CDA | — Community Development Authority |
| CDO | — Collateralized debt obligation |
| DRIVER | — Derivative inverse tax-exempt receipts |
| DW&P | — Department of Water & Power |
| DWR | — Department of Water Resources |
| ECFA | — Educational & Cultural Facilities Authority |
| EDA | — Economic Development Authority |
| EDFA | — Economic Development Finance Authority |
| ETF | — Exchange-traded fund |
| FDIC | — Federal Deposit Insurance Corporation |
| FFCB | — Federal Farm Credit Banks |
| FGIC | — Financial Guaranty Insurance Corporation |
| FHA | — Federal Housing Administration |
| FHLB | — Federal Home Loan Bank |
| FHLMC | — Federal Home Loan Mortgage Corporation |
| FICO | — The Financing Corporation |
| FNMA | — Federal National Mortgage Association |
| GDR | — Global depositary receipt |
| GNMA | — Government National Mortgage Association |
| HCFR | — Healthcare facilities revenue |
| HEFA | — Health & Educational Facilities Authority |
| HEFAR | — Higher education facilities authority revenue |
| HFA | — Housing Finance Authority |
| HFFA | — Health Facilities Financing Authority |
| HUD | — Department of Housing and Urban Development |
| IDA | — Industrial Development Authority |
| IDAG | — Industrial Development Agency |
| KRW | — Republic of Korea won |
| LIBOR | — London Interbank Offered Rate |
| LIFER | — Long Inverse Floating Exempt Receipts |
| LLC | — Limited liability company |
| LLLP | — Limited liability limited partnership |
| LLP | — Limited liability partnership |
| MBIA | — Municipal Bond Insurance Association |
| MFHR | — Multifamily housing revenue |
| MSTR | — Municipal securities trust receipts |
| MUD | — Municipal Utility District |
| National | — National Public Finance Guarantee Corporation |
| PCFA | — Pollution Control Financing Authority |
| PCL | — Public Company Limited |
| PCR | — Pollution control revenue |
| PFA | — Public Finance Authority |
| PFFA | — Public Facilities Financing Authority |
| PFOTER | — Puttable floating option tax-exempt receipts |
| plc | — Public limited company |
| PUTTER | — Puttable tax-exempt receipts |
| R&D | — Research & development |
| Radian | — Radian Asset Assurance |
| RAN | — Revenue anticipation notes |
| RDA | — Redevelopment Authority |
| RDFA | — Redevelopment Finance Authority |
| REIT | — Real estate investment trust |
| ROC | — Reset option certificates |
| SAVRS | — Select auction variable rate securities |
| SBA | — Small Business Authority |
| SFHR | — Single-family housing revenue |
| SFMR | — Single-family mortgage revenue |
| SPA | — Standby purchase agreement |
| SPDR | — Standard & Poor’s Depositary Receipts |
| SPEAR | — Short Puttable Exempt Adjustable Receipts |
| STRIPS | — Separate trading of registered interest and |
| TAN | — Tax anticipation notes |
| TIPS | — Treasury inflation-protected securities |
| TRAN | — Tax revenue anticipation notes |
| TTFA | — Transportation Trust Fund Authority |
| TVA | — Tennessee Valley Authority |


For more information
More information about Wells Fargo Advantage Funds is available free upon request. To obtain literature, please write, email, visit the Fund’s website, or call:
Wells Fargo Advantage Funds
P.O. Box 8266
Boston, MA 02266-8266
Email: wfaf@wellsfargo.com
Website: wellsfargoadvantagefunds.com
Individual investors: 1-800-222-8222
Retail investment professionals: 1-888-877-9275
Institutional investment professionals: 1-866-765-0778
This report and the financial statements contained herein are submitted for the general information of the shareholders of Wells Fargo Advantage Funds. If this report is used for promotional purposes, distribution of the report must be accompanied or preceded by a current prospectus. Before investing, please consider the investment objectives, risks, charges, and expenses of the investment. For a current prospectus and, if available, a summary prospectus, containing this information, call 1-800-222-8222 or visit the Fund’s website at wellsfargoadvantagefunds.com. Read the prospectus carefully before you invest or send money.
Wells Fargo Funds Management, LLC, a wholly owned subsidiary of Wells Fargo & Company, provides investment advisory and administrative services for Wells Fargo Advantage Funds. Other affiliates of Wells Fargo & Company provide subadvisory and other services for the Funds. The Funds are distributed by Wells Fargo Funds Distributor, LLC, Member FINRA/SIPC, an affiliate of Wells Fargo & Company.
NOT FDIC INSURED ¡ NO BANK GUARANTEE ¡ MAY LOSE VALUE
© 2015 Wells Fargo Funds Management, LLC. All rights reserved.
| | |
 | | 231603 03-15 SA210/SAR210 01-15 |

Wells Fargo Advantage Omega Growth Fund

Semi-Annual Report
January 31, 2015

Reduce clutter. Save trees.
Sign up for electronic delivery of prospectuses and shareholder reports at wellsfargo.com/advantagedelivery
Contents
The views expressed and any forward-looking statements are as of January 31, 2015, unless otherwise noted, and are those of the Fund managers and/or Wells Fargo Funds Management, LLC. Discussions of individual securities, or the markets generally, or any Wells Fargo Advantage Fund are not intended as individual recommendations. Future events or results may vary significantly from those expressed in any forward-looking statements; the views expressed are subject to change at any time in response to changing circumstances in the market. Wells Fargo Funds Management, LLC and the Fund disclaim any obligation to publicly update or revise any views expressed or forward-looking statements.
NOT FDIC INSURED ¡ NO BANK GUARANTEE ¡ MAY LOSE VALUE
| | | | |
| 2 | | Wells Fargo Advantage Omega Growth Fund | | Letter to shareholders (unaudited) |

Karla M. Rabusch
President
Wells Fargo Advantage Funds
As the U.S. churned forward, major economies elsewhere in the world faced significant ongoing challenges.
Dear Valued Shareholder:
We are pleased to offer you this semi-annual report for the Wells Fargo Advantage Omega Growth Fund for the six-month period that ended January 31, 2015. Generally improving U.S. economic data helped drive a positive return for U.S. stocks for the reporting period (as measured by the S&P 500 Index1); in contrast, many economies and markets elsewhere in the world faced ongoing challenges.
Positive U.S. economic data, but increased tensions abroad, led to heightened volatility during the third quarter of 2014.
When the reporting period began on August 1, 2014, the U.S. stock market was experiencing a series of surges interrupted by bouts of volatility as interest-rate concerns in the U.S. and increased tensions abroad triggered heightened investor uncertainty. An escalating Russia/Ukraine situation and a growing perception that the U.S. Federal Reserve (Fed) would raise short-term interest rates sooner than expected caused investors to pull back near the end of July. As a result, the S&P 500 Index dropped into negative territory for July’s monthly return. However, August brought a bounce-back; the S&P 500 Index delivered its largest monthly gain since February 2014 on a string of positive economic news, led by an upwardly revised 4.2% estimate of second-quarter 2014 gross domestic product (GDP) growth. Then, in September, stock market volatility increased as positive economic data became overshadowed at times by growing discomfort over escalating tensions in Ukraine and the Middle East. Slowing growth in Europe and China also concerned investors. Ultimately, U.S. stocks ended the third quarter up slightly overall, buoyed largely by another upward revision of second-quarter GDP growth to 4.6%. Strong corporate earnings also contributed to market gains.
The fourth quarter of 2014 brought continued improvement in the U.S.; international economies remained challenged.
Strong fourth-quarter results by the U.S. stock market helped the S&P 500 Index deliver more than 50 record closes in 2014. The last several, in December, were spurred by investor optimism following Fed Chair Janet Yellen’s comment that the Fed would be patient in its timing of an interest-rate increase. U.S. stocks also were boosted by positive economic data. November’s 5.8% unemployment rate was down from 7.0% a year earlier, and the number of jobs being added continued to expand, keeping U.S. employers on pace to hire nearly three million workers during 2014. In addition, the U.S. economy’s third-quarter growth rate was revised upward during the quarter, to 5.0%—its fastest pace in 11 years. Meanwhile, U.S. companies continued to report strong earnings. The steadily brightening U.S. economy energized consumers, who were further buoyed by much lower prices at the gasoline pump. During the fourth quarter, gasoline prices fell to their lowest levels in five years, according to the American Automobile Association.
As the U.S. churned forward, major economies elsewhere in the world faced significant ongoing challenges. In China, where growth had been slowing for some time, government regulators in December announced changes being made in an effort to stimulate growth. In Japan, which slid back into recession in the third quarter of 2014, Prime Minister Abe gained approval in late December for roughly $29 billion in fresh stimulus to help the economy. In the eurozone, growth remained sluggish, and member countries continued to face an environment of low demand, high unemployment, and weak business investment. This situation
| 1 | The S&P 500 Index consists of 500 stocks chosen for market size, liquidity, and industry group representation. It is a market-value-weighted index with each stock’s weight in the index proportionate to its market value. You cannot invest directly in an index. |
| | | | | | |
| Letter to shareholders (unaudited) | | Wells Fargo Advantage Omega Growth Fund | | | 3 | |
was exacerbated in December by renewed concerns about Greece after its parliament failed to avert a general election that could jeopardize the terms of the country’s financial agreement with its international creditors. In Russia, the economy contracted for the first time since October 2009 as the country struggled under the weight of slumping oil prices, international sanctions, and massive outflows of capital.
Market volatility increased in January 2015.
Markets fluctuated in January as investors reacted to geopolitical developments and new economic data. Mid-month, the World Bank lowered its outlook for global growth based on deepening problems in the eurozone and emerging markets, stating that a strengthening U.S. economy could not, by itself, support the global economy. Later in January, Greek voters gave control of their government to opposition party Syriza, which promised to end austerity and insisted that Greece’s massive debt be renegotiated. In the U.S., various data released in January, such as consumer confidence and December’s jobless rate, showed improvement. On the last trading day of the month, however, investors learned that fourth-quarter 2014 U.S. economic growth was estimated at 2.6%, which was below consensus and lower than the 4.6% and 5.0% growth rates, respectively, for the second and third quarters of 2014.
Don’t let short-term uncertainty derail long-term investment goals.
Periods of uncertainty can present challenges, but experience has taught us that maintaining long-term investment goals can be an effective way to plan for the future. To help you create a sound strategy based on your personal goals and risk tolerance, Wells Fargo Advantage Funds offers more than 100 mutual funds spanning a wide range of asset classes and investment styles. Although diversification cannot guarantee an investment profit or prevent losses, we believe it can be an effective way to manage investment risk and potentially smooth out overall portfolio performance. We encourage investors to know their investments and to understand that appropriate levels of risk-taking may unlock opportunities.
Thank you for choosing to invest with Wells Fargo Advantage Funds. We appreciate your confidence in us and remain committed to helping you meet your financial needs. For current information about your fund investments, contact your investment professional, visit our website at wellsfargoadvantagefunds.com, or call us directly at 1-800-222-8222. We are available 24 hours a day, 7 days a week.
Sincerely,

Karla M. Rabusch
President
Wells Fargo Advantage Funds
We encourage investors to know their investments and to understand that appropriate levels of risk-taking may unlock opportunities.
| | | | |
| 4 | | Wells Fargo Advantage Omega Growth Fund | | Performance highlights (unaudited) |
Investment objective
The Fund seeks long-term capital appreciation.
Adviser
Wells Fargo Funds Management, LLC
Subadviser
Wells Capital Management Incorporated
Portfolio managers
Thomas J. Pence, CFA
Michael T. Smith, CFA
Average annual total returns1 (%) as of January 31, 2015
| | | | | | | | | | | | | | | | | | | | | | | | | | | | | | | | | | |
| | | | | Including sales charge | | | Excluding sales charge | | | Expense ratios2 (%) | |
| | | Inception date | | 1 year | | | 5 year | | | 10 year | | | 1 year | | | 5 year | | | 10 year | | | Gross | | | Net3 | |
| Class A (EKOAX) | | 4-29-1968 | | | (2.08 | ) | | | 13.61 | | | | 8.83 | | | | 3.90 | | | | 14.96 | | | | 9.48 | | | | 1.32 | | | | 1.30 | |
| Class B (EKOBX)* | | 8-2-1993 | | | (1.22 | ) | | | 13.86 | | | | 8.91 | | | | 3.12 | | | | 14.10 | | | | 8.91 | | | | 2.07 | | | | 2.05 | |
| Class C (EKOCX) | | 8-2-1993 | | | 2.14 | | | | 14.10 | | | | 8.67 | | | | 3.14 | | | | 14.10 | | | | 8.67 | | | | 2.07 | | | | 2.05 | |
| Class R (EKORX) | | 10-10-2003 | | | – | | | | – | | | | – | | | | 3.64 | | | | 14.67 | | | | 9.21 | | | | 1.57 | | | | 1.55 | |
| Administrator Class (EOMYX) | | 1-13-1997 | | | – | | | | – | | | | – | | | | 4.15 | | | | 15.25 | | | | 9.76 | | | | 1.16 | | | | 1.05 | |
| Institutional Class (EKONX) | | 7-30-2010 | | | – | | | | – | | | | – | | | | 4.42 | | | | 15.51 | | | | 9.89 | | | | 0.89 | | | | 0.80 | |
| Russell 3000® Growth Index4 | | – | | | – | | | | – | | | | – | | | | 13.80 | | | | 16.55 | | | | 8.70 | | | | – | | | | – | |
| * | | Class B shares are closed to investment, except in connection with the reinvestment of any distributions and permitted exchanges. |
Figures quoted represent past performance, which is no guarantee of future results, and do not reflect taxes that a shareholder may pay on fund distributions or the redemption of fund shares. Investment return and principal value of an investment will fluctuate so that an investor’s shares, when redeemed, may be worth more or less than their original cost. Performance shown without sales charges would be lower if sales charges were reflected. Current performance may be lower or higher than the performance data quoted, which assumes the reinvestment of dividends and capital gains. Current month-end performance is available on the Fund’s website, wellsfargoadvantagefunds.com.
Index returns do not include transaction costs associated with buying and selling securities, any mutual fund fees or expenses, or any taxes. It is not possible to invest directly in an index.
For Class A shares, the maximum front-end sales charge is 5.75%. For Class B shares, the maximum contingent deferred sales charge is 5.00%. For Class C shares, the maximum contingent deferred sales charge is 1.00%. Performance including a contingent deferred sales charge assumes the sales charge for the corresponding time period. Class R, Administrator Class, and Institutional Class shares are sold without a front-end sales charge or contingent deferred sales charge.
Stock values fluctuate in response to the activities of individual companies and general market and economic conditions. Certain investment strategies tend to increase the total risk of an investment (relative to the broader market). The Fund is exposed to foreign investment risk and smaller-company securities risk. Consult the Fund’s prospectus for additional information on these and other risks.
Please see footnotes on page 5.
| | | | | | |
| Performance highlights (unaudited) | | Wells Fargo Advantage Omega Growth Fund | | | 5 | |
| | | | |
| Ten largest equity holdings5 (%) as of January 31, 2015 | |
Apple Incorporated | | | 5.22 | |
Facebook Incorporated Class A | | | 3.63 | |
SBA Communications Corporation Class A | | | 2.60 | |
Gilead Sciences Incorporated | | | 2.53 | |
Comcast Corporation Class A | | | 2.32 | |
Biogen Idec Incorporated | | | 2.25 | |
Micron Technology Incorporated | | | 2.18 | |
Celgene Corporation | | | 2.12 | |
Visa Incorporated Class A | | | 2.11 | |
Under Armour Incorporated Class A | | | 2.03 | |
|
| Sector distribution6 as of January 31, 2015 |
|
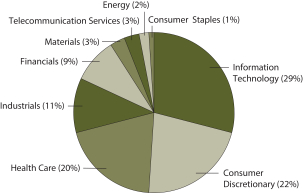 |
| 1 | Historical performance shown for Institutional Class shares prior to their inception reflects the performance of Administrator Class shares, and includes the higher expenses applicable to Administrator Class shares. If these expenses had not been included, returns would be higher. Historical performance shown for all classes of the Fund prior to July 19, 2010, is based on the performance of the Fund’s predecessor, Evergreen Omega Fund. |
| 2 | Reflects the expense ratios as stated in the most recent prospectuses. The expense ratios shown are subject to change and may differ from the annualized expense ratios shown in the financial highlights of this report. |
| 3 | The Adviser has committed through November 30, 2015, to waive fees and/or reimburse expenses to the extent necessary to cap the Fund’s Total Annual Fund Operating Expenses After Fee Waiver, excluding certain expenses, at the amounts shown. After this time, the cap may be increased or the commitment to maintain the cap may be terminated only with the approval of the Board of Trustees. Brokerage commissions, stamp duty fees, interest, taxes, acquired fund fees and expenses, and extraordinary expenses are excluded from the cap. Without this cap, the Fund’s returns would have been lower. |
| 4 | The Russell 3000® Growth Index measures the performance of those Russell 3000 Index companies with higher price-to-book ratios and higher forecasted growth values. You cannot invest directly in an index. |
| 5 | The ten largest equity holdings are calculated based on the value of the securities divided by total net assets of the Fund. Holdings are subject to change and may have changed since the date specified. |
| 6 | Amounts are calculated based on the total long-term investments of the Fund. These percentages are subject to change and may have changed since the date specified. |
| | | | |
| 6 | | Wells Fargo Advantage Omega Growth Fund | | Fund expenses (unaudited) |
As a shareholder of the Fund, you incur two types of costs: (1) transaction costs, including sales charges (loads) on purchase payments and contingent deferred sales charges (if any) on redemptions and (2) ongoing costs, including management fees, distribution (12b-1) and/or shareholder service fees, and other Fund expenses. This example is intended to help you understand your ongoing costs (in dollars) of investing in the Fund and to compare these costs with the ongoing costs of investing in other mutual funds.
The example is based on an investment of $1,000 invested at the beginning of the six-month period and held for the entire period from August 1, 2014 to January 31, 2015.
Actual expenses
The “Actual” line of the table below provides information about actual account values and actual expenses. You may use the information in this line, together with the amount you invested, to estimate the expenses that you paid over the period. Simply divide your account value by $1,000 (for example, an $8,600 account value divided by $1,000 = 8.6), then multiply the result by the number in the “Actual” line under the heading entitled “Expenses paid during period” for your applicable class of shares to estimate the expenses you paid on your account during this period.
Hypothetical example for comparison purposes
The “Hypothetical” line of the table below provides information about hypothetical account values and hypothetical expenses based on the Fund’s actual expense ratio and an assumed rate of return of 5% per year before expenses, which is not the Fund’s actual return. The hypothetical account values and expenses may not be used to estimate the actual ending account balance or expenses you paid for the period. You may use this information to compare the ongoing costs of investing in the Fund and other funds. To do so, compare this 5% hypothetical example with the 5% hypothetical examples that appear in the shareholder reports of the other funds.
Please note that the expenses shown in the table are meant to highlight your ongoing costs only and do not reflect any transactional costs, such as sales charges (loads) and contingent deferred sales charges. Therefore, the “Hypothetical” line of the table is useful in comparing ongoing costs only and will not help you determine the relative total costs of owning different funds. In addition, if these transactional costs were included, your costs would have been higher.
| | | | | | | | | | | | | | | | |
| | | Beginning
account value
8-1-2014 | | | Ending
account value
1-31-2015 | | | Expenses
paid during
the period¹ | | | Net annualized
expense ratio | |
Class A | | | | | | | | | | | | | | | | |
Actual | | $ | 1,000.00 | | | $ | 1,016.74 | | | $ | 6.61 | | | | 1.30 | % |
Hypothetical (5% return before expenses) | | $ | 1,000.00 | | | $ | 1,018.65 | | | $ | 6.61 | | | | 1.30 | % |
Class B | | | | | | | | | | | | | | | | |
Actual | | $ | 1,000.00 | | | $ | 1,012.86 | | | $ | 10.40 | | | | 2.05 | % |
Hypothetical (5% return before expenses) | | $ | 1,000.00 | | | $ | 1,014.87 | | | $ | 10.41 | | | | 2.05 | % |
Class C | | | | | | | | | | | | | | | | |
Actual | | $ | 1,000.00 | | | $ | 1,012.83 | | | $ | 10.40 | | | | 2.05 | % |
Hypothetical (5% return before expenses) | | $ | 1,000.00 | | | $ | 1,014.87 | | | $ | 10.41 | | | | 2.05 | % |
Class R | | | | | | | | | | | | | | | | |
Actual | | $ | 1,000.00 | | | $ | 1,015.29 | | | $ | 7.87 | | | | 1.55 | % |
Hypothetical (5% return before expenses) | | $ | 1,000.00 | | | $ | 1,017.39 | | | $ | 7.88 | | | | 1.55 | % |
Administrator Class | | | | | | | | | | | | | | | | |
Actual | | $ | 1,000.00 | | | $ | 1,017.87 | | | $ | 5.34 | | | | 1.05 | % |
Hypothetical (5% return before expenses) | | $ | 1,000.00 | | | $ | 1,019.91 | | | $ | 5.35 | | | | 1.05 | % |
Institutional Class | | | | | | | | | | | | | | | | |
Actual | | $ | 1,000.00 | | | $ | 1,019.22 | | | $ | 4.07 | | | | 0.80 | % |
Hypothetical (5% return before expenses) | | $ | 1,000.00 | | | $ | 1,021.17 | | | $ | 4.08 | | | | 0.80 | % |
| 1 | Expenses paid is equal to the annualized expense ratio of each class multiplied by the average account value over the period, multiplied by the number of days in the most recent fiscal half-year divided by the number of days in the fiscal year (to reflect the one-half-year period). |
| | | | | | |
| Portfolio of investments—January 31, 2015 (unaudited) | | Wells Fargo Advantage Omega Growth Fund | | | 7 | |
| | | | | | | | | | | | |
| Security name | | | | | | Shares | | | Value | |
| | | | |
Common Stocks: 98.10% | | | | | | | | | | | | |
| | | | |
Consumer Discretionary: 21.38% | | | | | | | | | | | | |
| | | | |
| Auto Components: 1.01% | | | | | | | | | | | | |
Delphi Automotive plc | | | | | | | 139,900 | | | $ | 9,615,327 | |
| | | | | | | | | | | | |
| | | | |
| Distributors: 1.59% | | | | | | | | | | | | |
LKQ Corporation † | | | | | | | 582,707 | | | | 15,039,668 | |
| | | | | | | | | | | | |
| | | | |
| Hotels, Restaurants & Leisure: 2.62% | | | | | | | | | | | | |
Chipotle Mexican Grill Incorporated † | | | | | | | 24,600 | | | | 17,462,064 | |
MGM Resorts International † | | | | | | | 377,400 | | | | 7,351,752 | |
| | | | |
| | | | | | | | | | | 24,813,816 | |
| | | | | | | | | | | | |
| | | | |
| Internet & Catalog Retail: 1.76% | | | | | | | | | | | | |
Amazon.com Incorporated † | | | | | | | 47,000 | | | | 16,662,910 | |
| | | | | | | | | | | | |
| | | | |
| Leisure Products: 1.59% | | | | | | | | | | | | |
Polaris Industries Incorporated | | | | | | | 104,100 | | | | 15,051,819 | |
| | | | | | | | | | | | |
| | | | |
| Media: 7.11% | | | | | | | | | | | | |
Comcast Corporation Class A | | | | | | | 412,900 | | | | 21,943,571 | |
Liberty Global plc Class C † | | | | | | | 420,125 | | | | 19,153,499 | |
Time Warner Incorporated | | | | | | | 172,400 | | | | 13,435,132 | |
Twenty-First Century Fox Incorporated | | | | | | | 386,100 | | | | 12,803,076 | |
| | | | |
| | | | | | | | | | | 67,335,278 | |
| | | | | | | | | | | | |
| | | | |
| Specialty Retail: 2.16% | | | | | | | | | | | | |
Advance Auto Parts Incorporated | | | | | | | 95,084 | | | | 15,118,356 | |
Williams-Sonoma Incorporated | | | | | | | 68,800 | | | | 5,383,600 | |
| | | | |
| | | | | | | | | | | 20,501,956 | |
| | | | | | | | | | | | |
| | | | |
| Textiles, Apparel & Luxury Goods: 3.54% | | | | | | | | | | | | |
Carter’s Incorporated | | | | | | | 175,700 | | | | 14,317,793 | |
Under Armour Incorporated Class A † | | | | | | | 267,400 | | | | 19,274,192 | |
| | | | |
| | | | | | | | | | | 33,591,985 | |
| | | | | | | | | | | | |
| | | | |
Consumer Staples: 1.61% | | | | | | | | | | | | |
| | | | |
| Beverages: 1.61% | | | | | | | | | | | | |
Constellation Brands Incorporated Class A † | | | | | | | 138,200 | | | | 15,264,190 | |
| | | | | | | | | | | | |
| | | | |
Energy: 1.99% | | | | | | | | | | | | |
| | | | |
| Oil, Gas & Consumable Fuels: 1.99% | | | | | | | | | | | | |
Pioneer Natural Resources Company | | | | | | | 107,186 | | | | 16,134,709 | |
Sanchez Energy Corporation †« | | | | | | | 241,001 | | | | 2,684,751 | |
| | | | |
| | | | | | | | | | | 18,819,460 | |
| | | | | | | | | | | | |
| | | | |
Financials: 8.88% | | | | | | | | | | | | |
| | | | |
| Banks: 0.41% | | | | | | | | | | | | |
Texas Capital Bancshares Incorporated † | | | | | | | 95,249 | | | | 3,890,922 | |
| | | | | | | | | | | | |
The accompanying notes are an integral part of these financial statements.
| | | | |
| 8 | | Wells Fargo Advantage Omega Growth Fund | | Portfolio of investments—January 31, 2015 (unaudited) |
| | | | | | | | | | | | |
| Security name | | | | | | Shares | | | Value | |
| | | | |
| Capital Markets: 4.66% | | | | | | | | | | | | |
Affiliated Managers Group Incorporated † | | | | | | | 73,972 | | | $ | 15,202,725 | |
Raymond James Financial Incorporated | | | | | | | 258,495 | | | | 13,602,007 | |
SEI Investments Company | | | | | | | 383,300 | | | | 15,397,161 | |
| | | | |
| | | | | | | | | | | 44,201,893 | |
| | | | | | | | | | | | |
| | | | |
| Diversified Financial Services: 3.81% | | | | | | | | | | | | |
IntercontinentalExchange Group Incorporated | | | | | | | 93,400 | | | | 19,215,182 | |
McGraw Hill Financial Incorporated | | | | | | | 188,500 | | | | 16,859,440 | |
| | | | |
| | | | | | | | | | | 36,074,622 | |
| | | | | | | | | | | | |
| | | | |
Health Care: 19.82% | | | | | | | | | | | | |
| | | | |
| Biotechnology: 8.92% | | | | | | | | | | | | |
Biogen Idec Incorporated † | | | | | | | 54,800 | | | | 21,325,968 | |
Celgene Corporation † | | | | | | | 169,000 | | | | 20,138,040 | |
Gilead Sciences Incorporated † | | | | | | | 228,627 | | | | 23,966,968 | |
Puma Biotechnology Incorporated † | | | | | | | 25,200 | | | | 5,319,216 | |
Regeneron Pharmaceuticals Incorporated † | | | | | | | 12,800 | | | | 5,333,248 | |
Vertex Pharmaceuticals Incorporated † | | | | | | | 76,600 | | | | 8,436,724 | |
| | | | |
| | | | | | | | | | | 84,520,164 | |
| | | | | | | | | | | | |
| | | | |
| Health Care Providers & Services: 6.11% | | | | | | | | | | | | |
Community Health Systems Incorporated † | | | | | | | 292,100 | | | | 13,749,147 | |
DaVita HealthCare Partners Incorporated † | | | | | | | 165,700 | | | | 12,437,442 | |
Envision Healthcare Holdings Incorporated † | | | | | | | 428,322 | | | | 14,725,710 | |
McKesson Corporation | | | | | | | 80,000 | | | | 17,012,000 | |
| | | | |
| | | | | | | | | | | 57,924,299 | |
| | | | | | | | | | | | |
| | | | |
| Pharmaceuticals: 4.79% | | | | | | | | | | | | |
AbbVie Incorporated | | | | | | | 227,441 | | | | 13,726,064 | |
Bristol-Myers Squibb Company | | | | | | | 147,800 | | | | 8,907,906 | |
Eli Lilly & Company | | | | | | | 90,000 | | | | 6,480,000 | |
Perrigo Company plc | | | | | | | 106,900 | | | | 16,221,006 | |
| | | | |
| | | | | | | | | | | 45,334,976 | |
| | | | | | | | | | | | |
| | | | |
Industrials: 10.46% | | | | | | | | | | | | |
| | | | |
| Airlines: 1.48% | | | | | | | | | | | | |
Delta Air Lines Incorporated | | | | | | | 296,500 | | | | 14,027,415 | |
| | | | | | | | | | | | |
| | | | |
| Industrial Conglomerates: 1.52% | | | | | | | | | | | | |
Carlisle Companies Incorporated | | | | | | | 160,600 | | | | 14,402,608 | |
| | | | | | | | | | | | |
| | | | |
| Machinery: 3.10% | | | | | | | | | | | | |
Allison Transmission Holdings Incorporated | | | | | | | 306,600 | | | | 9,602,712 | |
Proto Labs Incorporated †« | | | | | | | 152,382 | | | | 9,811,877 | |
Wabtec Corporation | | | | | | | 119,800 | | | | 9,997,310 | |
| | | | |
| | | | | | | | | | | 29,411,899 | |
| | | | | | | | | | | | |
| | | | |
| Road & Rail: 4.36% | | | | | | | | | | | | |
Canadian Pacific Railway Limited | | | | | | | 26,300 | | | | 4,593,821 | |
Old Dominion Freight Line Incorporated † | | | | | | | 201,970 | | | | 14,162,136 | |
The accompanying notes are an integral part of these financial statements.
| | | | | | |
| Portfolio of investments—January 31, 2015 (unaudited) | | Wells Fargo Advantage Omega Growth Fund | | | 9 | |
| | | | | | | | | | | | |
| Security name | | | | | | Shares | | | Value | |
| | | | |
| Road & Rail (continued) | | | | | | | | | | | | |
Swift Transportation Company † | | | | | | | 176,800 | | | $ | 4,345,744 | |
Union Pacific Corporation | | | | | | | 155,500 | | | | 18,226,155 | |
| | | | |
| | | | | | | | | | | 41,327,856 | |
| | | | | | | | | | | | |
| | | | |
Information Technology: 28.50% | | | | | | | | | | | | |
| | | | |
| Communications Equipment: 1.61% | | | | | | | | | | | | |
Palo Alto Networks Incorporated † | | | | | | | 120,606 | | | | 15,243,392 | |
| | | | | | | | | | | | |
| | | | |
| Electronic Equipment, Instruments & Components: 2.42% | | | | | | | | | | | | |
Cognex Corporation † | | | | | | | 283,200 | | | | 10,407,600 | |
TE Connectivity Limited | | | | | | | 189,200 | | | | 12,560,988 | |
| | | | |
| | | | | | | | | | | 22,968,588 | |
| | | | | | | | | | | | |
| | | | |
| Internet Software & Services: 8.50% | | | | | | | | | | | | |
Alibaba Group Holding Limited ADR † | | | | | | | 92,924 | | | | 8,277,670 | |
Facebook Incorporated Class A † | | | | | | | 453,200 | | | | 34,402,412 | |
Google Incorporated Class A † | | | | | | | 15,600 | | | | 8,385,780 | |
Google Incorporated Class C † | | | | | | | 32,400 | | | | 17,318,448 | |
LinkedIn Corporation Class A † | | | | | | | 32,400 | | | | 7,281,576 | |
Yelp Incorporated † | | | | | | | 92,721 | | | | 4,865,071 | |
| | | | |
| | | | | | | | | | | 80,530,957 | |
| | | | | | | | | | | | |
| | | | |
| IT Services: 4.89% | | | | | | | | | | | | |
Alliance Data Systems Corporation † | | | | | | | 47,500 | | | | 13,719,425 | |
Vantiv Incorporated Class A † | | | | | | | 366,574 | | | | 12,606,480 | |
Visa Incorporated Class A | | | | | | | 78,601 | | | | 20,036,181 | |
| | | | |
| | | | | | | | | | | 46,362,086 | |
| | | | | | | | | | | | |
| | | | |
| Semiconductors & Semiconductor Equipment: 2.18% | | | | | | | | | | | | |
Micron Technology Incorporated † | | | | | | | 706,700 | | | | 20,681,576 | |
| | | | | | | | | | | | |
| | | | |
| Software: 2.35% | | | | | | | | | | | | |
ServiceNow Incorporated † | | | | | | | 168,500 | | | | 12,283,650 | |
Workday Incorporated Class A † | | | | | | | 125,900 | | | | 10,004,014 | |
| | | | |
| | | | | | | | | | | 22,287,664 | |
| | | | | | | | | | | | |
| | | | |
| Technology Hardware, Storage & Peripherals: 6.55% | | | | | | | | | | | | |
Apple Incorporated | | | | | | | 422,500 | | | | 49,500,100 | |
Western Digital Corporation | | | | | | | 128,700 | | | | 12,513,501 | |
| | | | |
| | | | | | | | | | | 62,013,601 | |
| | | | | | | | | | | | |
| | | | |
Materials: 2.86% | | | | | | | | | | | | |
| | | | |
| Chemicals: 2.86% | | | | | | | | | | | | |
Axalta Coating Systems Limited † | | | | | | | 392,800 | | | | 10,083,176 | |
Monsanto Company | | | | | | | 144,400 | | | | 17,036,312 | |
| | | | |
| | | | | | | | | | | 27,119,488 | |
| | | | | | | | | | | | |
The accompanying notes are an integral part of these financial statements.
| | | | |
| 10 | | Wells Fargo Advantage Omega Growth Fund | | Portfolio of investments—January 31, 2015 (unaudited) |
| | | | | | | | | | | | | | |
| Security name | | | | | | | Shares | | | Value | |
| | | | |
Telecommunication Services: 2.60% | | | | | | | | | | | | | | |
| | | | |
| Wireless Telecommunication Services: 2.60% | | | | | | | | | | | | | | |
SBA Communications Corporation Class A † | | | | | | | | | 210,802 | | | $ | 24,600,593 | |
| | | | | | | | | | | | | | |
| | | | |
Total Common Stocks (Cost $750,428,455) | | | | | | | | | | | | | 929,621,008 | |
| | | | | | | | | | | | | | |
| | | | |
| | | Yield | | | | | | | | | |
| | | | |
Short-Term Investments: 0.97% | | | | | | | | | | | | | | |
| | | | |
| Investment Companies: 0.97% | | | | | | | | | | | | | | |
Securities Lending Cash Investments, LLC (l)(r)(u) | | | 0.13 | % | | | | | 7,960,316 | | | | 7,960,316 | |
Wells Fargo Advantage Cash Investment Money Market Fund, Select Class (l)(u) | | | 0.10 | | | | | | 1,277,167 | | | | 1,277,167 | |
| | | | |
Total Short-Term Investments (Cost $9,237,483) | | | | | | | | | | | | | 9,237,483 | |
| | | | | | | | | | | | | | |
| | | | | | | | |
| Total investments in securities (Cost $759,665,938) * | | | 99.07 | % | | | 938,858,491 | |
Other assets and liabilities, net | | | 0.93 | | | | 8,816,649 | |
| | | | | | | | |
| Total net assets | | | 100.00 | % | | $ | 947,675,140 | |
| | | | | | | | |
| † | Non-income-earning security |
| « | All or a portion of this security is on loan. |
| (l) | The security represents an affiliate of the Fund as defined in the Investment Company Act of 1940. |
| (r) | The investment is a non-registered investment vehicle purchased with cash collateral received from securities on loan. |
| (u) | The rate represents the 7-day annualized yield at period end. |
| * | Cost for federal income tax purposes is $760,931,656 and unrealized gains (losses) consists of: |
| | | | |
Gross unrealized gains | | $ | 199,994,385 | |
Gross unrealized losses | | | (22,067,550 | ) |
| | | | |
Net unrealized gains | | $ | 177,926,835 | |
The accompanying notes are an integral part of these financial statements.
| | | | | | |
| Statement of assets and liabilities—January 31, 2015 (unaudited) | | Wells Fargo Advantage Omega Growth Fund | | | 11 | |
| | | | |
| | | | |
| |
Assets | | | | |
Investments | | | | |
In unaffiliated securities (including $7,762,112 of securities loaned), at value (cost $750,428,455) | | $ | 929,621,008 | |
In affiliated securities, at value (cost $9,237,483) | | | 9,237,483 | |
| | | | |
Total investments, at value (cost $759,665,938) | | | 938,858,491 | |
Receivable for investments sold | | | 33,275,414 | |
Receivable for Fund shares sold | | | 1,851,545 | |
Receivable for dividends | | | 210,275 | |
Receivable for securities lending income | | | 6,138 | |
Prepaid expenses and other assets | | | 54,386 | |
| | | | |
Total assets | | | 974,256,249 | |
| | | | |
| |
Liabilities | | | | |
Payable for investments purchased | | | 7,307,713 | |
Payable for Fund shares redeemed | | | 3,534,077 | |
Payable upon receipt of securities loaned | | | 7,960,316 | |
Due to custodian bank | | | 6,546,353 | |
Advisory fee payable | | | 583,059 | |
Distribution fees payable | | | 78,408 | |
Administration fees payable | | | 239,048 | |
Accrued expenses and other liabilities | | | 332,135 | |
| | | | |
Total liabilities | | | 26,581,109 | |
| | | | |
Total net assets | | $ | 947,675,140 | |
| | | | |
| |
NET ASSETS CONSIST OF | | | | |
Paid-in capital | | $ | 750,447,454 | |
Accumulated net investment loss | | | (2,523,489 | ) |
Accumulated net realized gains on investments | | | 20,558,622 | |
Net unrealized gains on investments | | | 179,192,553 | |
| | | | |
Total net assets | | $ | 947,675,140 | |
| | | | |
| |
COMPUTATION OF NET ASSET VALUE AND OFFERING PRICE PER SHARE | | | | |
Net assets – Class A | | $ | 665,143,330 | |
Shares outstanding – Class A1 | | | 14,987,064 | |
Net asset value per share – Class A | | | $44.38 | |
Maximum offering price per share – Class A2 | | | $47.09 | |
Net assets – Class B | | $ | 9,821,614 | |
Shares outstanding – Class B1 | | | 284,412 | |
Net asset value per share – Class B | | | $34.53 | |
Net assets – Class C | | $ | 101,671,709 | |
Shares outstanding – Class C1 | | | 2,935,078 | |
Net asset value per share – Class C | | | $34.64 | |
Net assets – Class R | | $ | 16,929,582 | |
Shares outstanding – Class R1 | | | 394,370 | |
Net asset value per share – Class R | | | $42.93 | |
Net assets – Administrator Class | | $ | 86,551,358 | |
Shares outstanding – Administrator Class1 | | | 1,841,643 | |
Net asset value per share – Administrator Class | | | $47.00 | |
Net assets – Institutional Class | | $ | 67,557,547 | |
Shares outstanding – Institutional Class1 | | | 1,416,952 | |
Net asset value per share – Institutional Class | | | $47.68 | |
| 1 | The Fund has an unlimited number of authorized shares. |
| 2 | Maximum offering price is computed as 100/94.25 of net asset value. On investments of $50,000 or more, the offering price is reduced. |
The accompanying notes are an integral part of these financial statements.
| | | | |
| 12 | | Wells Fargo Advantage Omega Growth Fund | | Statement of operations—six months ended January 31, 2015 (unaudited) |
| | | | |
| | | | |
| |
Investment income | | | | |
Dividends (net of foreign withholding taxes of $7,172) | | $ | 4,325,604 | |
Securities lending income, net | | | 19,839 | |
Income from affiliated securities | | | 2,393 | |
| | | | |
Total investment income | | | 4,347,836 | |
| | | | |
| |
Expenses | | | | |
Advisory fee | | | 3,705,802 | |
Administration fees | | | | |
Fund level | | | 256,014 | |
Class A | | | 929,213 | |
Class B | | | 14,789 | |
Class C | | | 141,556 | |
Class R | | | 24,798 | |
Administrator Class | | | 53,883 | |
Institutional Class | | | 24,868 | |
Shareholder servicing fees | | | | |
Class A | | | 893,473 | |
Class B | | | 14,015 | |
Class C | | | 136,111 | |
Class R | | | 23,845 | |
Administrator Class | | | 130,088 | |
Distribution fees | | | | |
Class B | | | 42,661 | |
Class C | | | 408,335 | |
Class R | | | 23,845 | |
Custody and accounting fees | | | 32,181 | |
Professional fees | | | 25,365 | |
Registration fees | | | 50,020 | |
Shareholder report expenses | | | 71,375 | |
Trustees’ fees and expenses | | | 5,766 | |
Other fees and expenses | | | 10,257 | |
| | | | |
Total expenses | | | 7,018,260 | |
Less: Fee waivers and/or expense reimbursements | | | (177,247 | ) |
| | | | |
Net expenses | | | 6,841,013 | |
| | | | |
Net investment loss | | | (2,493,177 | ) |
| | | | |
| |
REALIZED AND UNREALIZED GAINS (LOSSES) ON INVESTMENTS | | | | |
Net realized gains on investments | | | 34,055,912 | |
Net change in unrealized gains (losses) on investments | | | (14,102,763 | ) |
| | | | |
Net realized and unrealized gains (losses) on investments | | | 19,953,149 | |
| | | | |
Net increase in net assets resulting from operations | | $ | 17,459,972 | |
| | | | |
The accompanying notes are an integral part of these financial statements.
| | | | | | |
| Statement of changes in net assets | | Wells Fargo Advantage Omega Growth Fund | | | 13 | |
| | | | | | | | | | | | | | | | |
| | | Six months ended
January 31, 2015
(unaudited) | | | Year ended
July 31, 2014 | |
| | | |
Operations | | | | | | | | | | | | |
Net investment loss | | | | | | $ | (2,493,177 | ) | | | | | | $ | (9,015,814 | ) |
Net realized gains on investments | | | | | | | 34,055,912 | | | | | | | | 160,298,938 | |
Net change in unrealized gains (losses) on investments | | | | | | | (14,102,763 | ) | | | | | | | (6,586,133 | ) |
| | | | |
Net increase in net assets resulting from operations | | | | | | | 17,459,972 | | | | | | | | 144,696,991 | |
| | | | |
| | | |
Distributions to shareholders from | | | | | | | | | | | | |
Net realized gains | | | | | | | | | | | | | | | | |
Class A | | | | | | | (88,485,249 | ) | | | | | | | (79,931,222 | ) |
Class B | | | | | | | (1,659,485 | ) | | | | | | | (2,146,719 | ) |
Class C | | | | | | | (16,860,203 | ) | | | | | | | (13,032,342 | ) |
Class R | | | | | | | (2,357,246 | ) | | | | | | | (3,057,782 | ) |
Administrator Class | | | | | | | (11,565,611 | ) | | | | | | | (9,323,528 | ) |
Institutional Class | | | | | | | (8,555,196 | ) | | | | | | | (1,312,052 | ) |
| | | | |
Total distributions to shareholders | | | | | | | (129,482,990 | ) | | | | | | | (108,803,645 | ) |
| | | | |
| | | | |
Capital share transactions | | | Shares | | | | | | | | Shares | | | | | |
Proceeds from shares sold | | | | | | | | | | | | | | | | |
Class A | | | 586,541 | | | | 28,637,177 | | | | 2,629,379 | | | | 131,733,853 | |
Class B | | | 1,839 | | | | 75,313 | | | | 14,628 | | | | 611,739 | |
Class C | | | 205,208 | | | | 7,782,572 | | | | 725,463 | | | | 29,939,937 | |
Class R | | | 63,352 | | | | 2,888,620 | | | | 261,245 | | | | 12,668,404 | |
Administrator Class | | | 275,659 | | | | 14,135,782 | | | | 1,297,321 | | | | 68,639,919 | |
Institutional Class | | | 525,262 | | | | 28,520,399 | | | | 914,142 | | | | 49,118,738 | |
| | | | |
| | | | | | | 82,039,863 | | | | | | | | 292,712,590 | |
| | | | |
Reinvestment of distributions | | | | | | | | | | | | | | | | |
Class A | | | 1,824,272 | | | | 82,165,203 | | | | 1,527,223 | | | | 74,253,607 | |
Class B | | | 46,774 | | | | 1,640,836 | | | | 53,475 | | | | 2,114,420 | |
Class C | | | 404,364 | | | | 14,229,572 | | | | 265,973 | | | | 10,543,167 | |
Class R | | | 21,691 | | | | 945,291 | | | | 19,145 | | | | 906,888 | |
Administrator Class | | | 205,792 | | | | 9,812,172 | | | | 147,977 | | | | 7,543,849 | |
Institutional Class | | | 136,046 | | | | 6,577,836 | | | | 25,487 | | | | 1,312,052 | |
| | | | |
| | | | | | | 115,370,910 | | | | | | | | 96,673,983 | |
| | | | |
Payment for shares redeemed | | | | | | | | | | | | | | | | |
Class A | | | (1,908,059 | ) | | | (93,571,657 | ) | | | (3,618,139 | ) | | | (181,905,297 | ) |
Class B | | | (73,861 | ) | | | (2,945,334 | ) | | | (194,619 | ) | | | (8,015,592 | ) |
Class C | | | (339,209 | ) | | | (13,063,844 | ) | | | (398,923 | ) | | | (16,344,006 | ) |
Class R | | | (103,969 | ) | | | (4,969,022 | ) | | | (373,336 | ) | | | (18,294,389 | ) |
Administrator Class | | | (835,689 | ) | | | (43,557,467 | ) | | | (634,586 | ) | | | (33,345,492 | ) |
Institutional Class | | | (185,158 | ) | | | (9,611,461 | ) | | | (68,416 | ) | | | (3,559,135 | ) |
| | | | |
| | | | | | | (167,718,785 | ) | | | | | | | (261,463,911 | ) |
| | | | |
Net increase in net assets resulting from capital share transactions | | | | | | | 29,691,988 | | | | | | | | 127,922,662 | |
| | | | |
Total increase (decrease) in net assets | | | | | | | (82,331,030 | ) | | | | | | | 163,816,008 | |
| | | | |
| | |
Net assets | | | | | | | | |
Beginning of period | | | | | | | 1,030,006,170 | | | | | | | | 866,190,162 | |
| | | | |
End of period | | | | | | $ | 947,675,140 | | | | | | | $ | 1,030,006,170 | |
| | | | |
Accumulated net investment loss | | | | | | $ | (2,523,489 | ) | | | | | | $ | (30,312 | ) |
| | | | |
The accompanying notes are an integral part of these financial statements.
| | | | |
| 14 | | Wells Fargo Advantage Omega Growth Fund | | Financial highlights |
(For a share outstanding throughout each period)
| | | | | | | | | | | | | | | | | | | | | | | | | | | | |
| | | Six months ended
January 31, 2015
(unaudited) | | | Year ended July 31 | | | Year ended
September 30, 20091 | |
| CLASS A | | | 2014 | | | 2013 | | | 2012 | | | 2011 | | | 20101,2 | | |
Net asset value, beginning of period | | | $49.99 | | | | $47.97 | | | | $39.09 | | | | $38.29 | | | | $30.11 | | | | $28.44 | | | | $27.26 | |
Net investment income (loss) | | | (0.16 | ) | | | (0.49 | ) | | | (0.02 | ) | | | (0.28 | )3 | | | (0.29 | ) | | | (0.10 | )3 | | | 0.18 | 3 |
Net realized and unrealized gains (losses) on investments | | | 1.09 | | | | 8.28 | | | | 10.31 | | | | 1.08 | | | | 8.47 | | | | 1.96 | | | | 1.00 | |
| | | | | | | | | | | | | | | | | | | | | | | | | | | | |
Total from investment operations | | | 0.93 | | | | 7.79 | | | | 10.29 | | | | 0.80 | | | | 8.18 | | | | 1.86 | | | | 1.18 | |
Distributions to shareholders from | | | | | | | | | | | | | | | | | | | | | | | | | | | | |
Net investment income | | | 0.00 | | | | 0.00 | | | | 0.00 | | | | 0.00 | | | | 0.00 | | | | (0.19 | ) | | | 0.00 | |
Net realized gains | | | (6.54 | ) | | | (5.77 | ) | | | (1.41 | ) | | | 0.00 | | | | 0.00 | | | | 0.00 | | | | 0.00 | |
| | | | | | | | | | | | | | | | | | | | | | | | | | | | |
Total distributions to shareholders | | | (6.54 | ) | | | (5.77 | ) | | | (1.41 | ) | | | 0.00 | | | | 0.00 | | | | (0.19 | ) | | | 0.00 | |
Net asset value, end of period | | | $44.38 | | | | $49.99 | | | | $47.97 | | | | $39.09 | | | | $38.29 | | | | $30.11 | | | | $28.44 | |
Total return4 | | | 1.67 | % | | | 16.58 | % | | | 27.07 | % | | | 2.09 | % | | | 27.17 | % | | | 6.53 | % | | | 4.33 | % |
Ratios to average net assets (annualized) | | | | | | | | | | | | | | | | | | | | | | | | | | | | |
Gross expenses | | | 1.32 | % | | | 1.32 | % | | | 1.34 | % | | | 1.35 | % | | | 1.36 | % | | | 1.35 | % | | | 1.48 | % |
Net expenses | | | 1.30 | % | | | 1.30 | % | | | 1.30 | % | | | 1.30 | % | | | 1.30 | % | | | 1.34 | % | | | 1.39 | % |
Net investment income (loss) | | | (0.45 | )% | | | (0.84 | )% | | | (0.08 | )% | | | (0.75 | )% | | | (0.80 | )% | | | (0.40 | )% | | | 0.79 | % |
Supplemental data | | | | | | | | | | | | | | | | | | | | | | | | | | | | |
Portfolio turnover rate | | | 42 | % | | | 101 | % | | | 88 | % | | | 101 | % | | | 123 | % | | | 116 | % | | | 26 | % |
Net assets, end of period (000s omitted) | | $ | 665,143 | | | $ | 724,071 | | | $ | 668,992 | | | $ | 550,758 | | | $ | 584,871 | | | $ | 460,187 | | | $ | 460,082 | |
| 1 | After the close of business on July 16, 2010, the Fund acquired the net assets of Evergreen Omega Fund which became the accounting and performance survivor in the transaction. The information for the periods prior to July 19, 2010 is that of Class A of Evergreen Omega Fund. |
| 2 | For the ten months ended July 31, 2010. The Fund changed its fiscal year end from September 30 to July 31, effective July 31, 2010. |
| 3 | Calculated based upon average shares outstanding |
| 4 | Total return calculations do not include any sales charges. Returns for periods of less than one year are not annualized. |
The accompanying notes are an integral part of these financial statements.
| | | | | | |
| Financial highlights | | Wells Fargo Advantage Omega Growth Fund | | | 15 | |
(For a share outstanding throughout each period)
| | | | | | | | | | | | | | | | | | | | | | | | | | | | |
| | | Six months ended
January 31, 2015
(unaudited) | | | Year ended July 31 | | | Year ended
September 30, 20091 | |
| CLASS B | | | 2014 | | | 2013 | | | 2012 | | | 2011 | | | 20101,2 | | |
Net asset value, beginning of period | | | $40.45 | | | | $40.07 | | | | $33.12 | | | | $32.68 | | | | $25.89 | | | | $24.46 | | | | $23.62 | |
Net investment income (loss) | | | (0.24 | )3 | | | (0.65 | )3 | | | (0.28 | )3 | | | (0.47 | )3 | | | (0.48 | )3 | | | (0.25 | )3 | | | 0.02 | 3 |
Net realized and unrealized gains (losses) on investments | | | 0.86 | | | | 6.80 | | | | 8.64 | | | | 0.91 | | | | 7.27 | | | | 1.68 | | | | 0.82 | |
| | | | | | | | | | | | | | | | | | | | | | | | | | | | |
Total from investment operations | | | 0.62 | | | | 6.15 | | | | 8.36 | | | | 0.44 | | | | 6.79 | | | | 1.43 | | | | 0.84 | |
Distributions to shareholders from | | | | | | | | | | | | | | | | | | | | | | | | | | | | |
Net realized gains | | | (6.54 | ) | | | (5.77 | ) | | | (1.41 | ) | | | 0.00 | | | | 0.00 | | | | 0.00 | | | | 0.00 | |
Net asset value, end of period | | | $34.53 | | | | $40.45 | | | | $40.07 | | | | $33.12 | | | | $32.68 | | | | $25.89 | | | | $24.46 | |
Total return4 | | | 1.29 | % | | | 15.71 | % | | | 26.11 | % | | | 1.32 | % | | | 26.23 | % | | | 5.85 | % | | | 3.56 | % |
Ratios to average net assets (annualized) | | | | | | | | | | | | | | | | | | | | | | | | | | | | |
Gross expenses | | | 2.07 | % | | | 2.07 | % | | | 2.09 | % | | | 2.10 | % | | | 2.12 | % | | | 2.10 | % | | | 2.22 | % |
Net expenses | | | 2.05 | % | | | 2.05 | % | | | 2.05 | % | | | 2.05 | % | | | 2.05 | % | | | 2.09 | % | | | 2.13 | % |
Net investment income (loss) | | | (1.21 | )% | | | (1.58 | )% | | | (0.78 | )% | | | (1.51 | )% | | | (1.55 | )% | | | (1.14 | )% | | | 0.10 | % |
Supplemental data | | | | | | | | | | | | | | | | | | | | | | | | | | | | |
Portfolio turnover rate | | | 42 | % | | | 101 | % | | | 88 | % | | | 101 | % | | | 123 | % | | | 116 | % | | | 26 | % |
Net assets, end of period (000s omitted) | | $ | 9,822 | | | $ | 12,526 | | | $ | 17,476 | | | $ | 22,271 | | | $ | 40,023 | | | $ | 46,434 | | | $ | 51,984 | |
| 1 | After the close of business on July 16, 2010, the Fund acquired the net assets of Evergreen Omega Fund which became the accounting and performance survivor in the transaction. The information for the periods prior to July 19, 2010 is that of Class B of Evergreen Omega Fund. |
| 2 | For the ten months ended July 31, 2010. The Fund changed its fiscal year end from September 30 to July 31, effective July 31, 2010. |
| 3 | Calculated based upon average shares outstanding |
| 4 | Total return calculations do not include any sales charges. Returns for periods of less than one year are not annualized. |
The accompanying notes are an integral part of these financial statements.
| | | | |
| 16 | | Wells Fargo Advantage Omega Growth Fund | | Financial highlights |
(For a share outstanding throughout each period)
| | | | | | | | | | | | | | | | | | | | | | | | | | | | |
| | | Six months ended
January 31, 2015
(unaudited) | | | Year ended July 31 | | | Year ended
September 30, 20091 | |
| CLASS C | | | 2014 | | | 2013 | | | 2012 | | | 2011 | | | 20101,2 | | |
Net asset value, beginning of period | | | $40.56 | | | | $40.15 | | | | $33.18 | | | | $32.75 | | | | $25.94 | | | | $24.53 | | | | $23.69 | |
Net investment income (loss) | | | (0.24 | )3 | | | (0.65 | )3 | | | (0.31 | )3 | | | (0.47 | )3 | | | (0.49 | )3 | | | (0.25 | )3 | | | 0.00 | 3,4 |
Net realized and unrealized gains (losses) on investments | | | 0.86 | | | | 6.83 | | | | 8.69 | | | | 0.90 | | | | 7.30 | | | | 1.68 | | | | 0.84 | |
| | | | | | | | | | | | | | | | | | | | | | | | | | | | |
Total from investment operations | | | 0.62 | | | | 6.18 | | | | 8.38 | | | | 0.43 | | | | 6.81 | | | | 1.43 | | | | 0.84 | |
Distributions to shareholders from | | | | | | | | | | | | | | | | | | | | | | | | | | | | |
Net investment income | | | 0.00 | | | | 0.00 | | | | 0.00 | | | | 0.00 | | | | 0.00 | | | | (0.02 | ) | | | 0.00 | |
Net realized gains | | | (6.54 | ) | | | (5.77 | ) | | | (1.41 | ) | | | 0.00 | | | | 0.00 | | | | 0.00 | | | | 0.00 | |
| | | | | | | | | | | | | | | | | | | | | | | | | | | | |
Total distributions to shareholders | | | (6.54 | ) | | | (5.77 | ) | | | (1.41 | ) | | | 0.00 | | | | 0.00 | | | | (0.02 | ) | | | 0.00 | |
Net asset value, end of period | | | $34.64 | | | | $40.56 | | | | $40.15 | | | | $33.18 | | | | $32.75 | | | | $25.94 | | | | $24.53 | |
Total return5 | | | 1.28 | % | | | 15.73 | % | | | 26.11 | % | | | 1.31 | % | | | 26.25 | % | | | 5.83 | % | | | 3.55 | % |
Ratios to average net assets (annualized) | | | | | | | | | | | | | | | | | | | | | | | | | | | | |
Gross expenses | | | 2.07 | % | | | 2.07 | % | | | 2.09 | % | | | 2.10 | % | | | 2.11 | % | | | 2.10 | % | | | 2.23 | % |
Net expenses | | | 2.05 | % | | | 2.05 | % | | | 2.05 | % | | | 2.05 | % | | | 2.05 | % | | | 2.09 | % | | | 2.14 | % |
Net investment income (loss) | | | (1.20 | )% | | | (1.59 | )% | | | (0.85 | )% | | | (1.49 | )% | | | (1.55 | )% | | | (1.15 | )% | | | 0.02 | % |
Supplemental data | | | | | | | | | | | | | | | | | | | | | | | | | | | | |
Portfolio turnover rate | | | 42 | % | | | 101 | % | | | 88 | % | | | 101 | % | | | 123 | % | | | 116 | % | | | 26 | % |
Net assets, end of period (000s omitted) | | $ | 101,672 | | | $ | 108,073 | | | $ | 83,206 | | | $ | 59,481 | | | $ | 58,329 | | | $ | 44,892 | | | $ | 43,806 | |
| 1 | After the close of business on July 16, 2010, the Fund acquired the net assets of Evergreen Omega Fund which became the accounting and performance survivor in the transaction. The information for the periods prior to July 19, 2010 is that of Class C of Evergreen Omega Fund. |
| 2 | For the ten months ended July 31, 2010. The Fund changed its fiscal year end from September 30 to July 31, effective July 31, 2010. |
| 3 | Calculated based upon average shares outstanding |
| 4 | Amount is less than $0.005. |
| 5 | Total return calculations do not include any sales charges. Returns for periods of less than one year are not annualized. |
The accompanying notes are an integral part of these financial statements.
| | | | | | |
| Financial highlights | | Wells Fargo Advantage Omega Growth Fund | | | 17 | |
(For a share outstanding throughout each period)
| | | | | | | | | | | | | | | | | | | | | | | | | | | | |
| | | Six months ended
January 31, 2015
(unaudited) | | | Year ended July 31 | | | Year ended
September 30, 20091 | |
| CLASS R | | | 2014 | | | 2013 | | | 2012 | | | 2011 | | | 20101,2 | | |
Net asset value, beginning of period | | | $48.62 | | | | $46.90 | | | | $38.35 | | | | $37.66 | | | | $29.69 | | | | $28.09 | | | | $26.99 | |
Net investment income (loss) | | | (0.19 | ) | | | (0.53 | )3 | | | (0.09 | ) | | | (0.36 | )3 | | | (0.13 | ) | | | (0.16 | )3 | | | 0.08 | 3 |
Net realized and unrealized gains (losses) on investments | | | 1.04 | | | | 8.02 | | | | 10.05 | | | | 1.05 | | | | 8.10 | | | | 1.94 | | | | 1.02 | |
| | | | | | | | | | | | | | | | | | | | | | | | | | | | |
Total from investment operations | | | 0.85 | | | | 7.49 | | | | 9.96 | | | | 0.69 | | | | 7.97 | | | | 1.78 | | | | 1.10 | |
Distributions to shareholders from | | | | | | | | | | | | | | | | | | | | | | | | | | | | |
Net investment income | | | 0.00 | | | | 0.00 | | | | 0.00 | | | | 0.00 | | | | 0.00 | | | | (0.18 | ) | | | 0.00 | |
Net realized gains | | | (6.54 | ) | | | (5.77 | ) | | | (1.41 | ) | | | 0.00 | | | | 0.00 | | | | 0.00 | | | | 0.00 | |
| | | | | | | | | | | | | | | | | | | | | | | | | | | | |
Total distributions to shareholders | | | (6.54 | ) | | | (5.77 | ) | | | (1.41 | ) | | | 0.00 | | | | 0.00 | | | | (0.18 | ) | | | 0.00 | |
Net asset value, end of period | | | $42.93 | | | | $48.62 | | | | $46.90 | | | | $38.35 | | | | $37.66 | | | | $29.69 | | | | $28.09 | |
Total return4 | | | 1.53 | % | | | 16.30 | % | | | 26.73 | % | | | 1.83 | % | | | 26.89 | % | | | 6.29 | % | | | 4.08 | % |
Ratios to average net assets (annualized) | | | | | | | | | | | | | | | | | | | | | | | | | | | | |
Gross expenses | | | 1.57 | % | | | 1.57 | % | | | 1.59 | % | | | 1.60 | % | | | 1.59 | % | | | 1.60 | % | | | 1.76 | % |
Net expenses | | | 1.55 | % | | | 1.55 | % | | | 1.55 | % | | | 1.55 | % | | | 1.55 | % | | | 1.59 | % | | | 1.67 | % |
Net investment income (loss) | | | (0.71 | )% | | | (1.09 | )% | | | (0.38 | )% | | | (0.99 | )% | | | (1.08 | )% | | | (0.65 | )% | | | 0.35 | % |
Supplemental data | | | | | | | | | | | | | | | | | | | | | | | | | | | | |
Portfolio turnover rate | | | 42 | % | | | 101 | % | | | 88 | % | | | 101 | % | | | 123 | % | | | 116 | % | | | 26 | % |
Net assets, end of period (000s omitted) | | | $16,930 | | | | $20,095 | | | | $23,745 | | | | $15,408 | | | | $6,515 | | | | $1,523 | | | | $838 | |
| 1 | After the close of business on July 16, 2010, the Fund acquired the net assets of Evergreen Omega Fund which became the accounting and performance survivor in the transaction. The information for the periods prior to July 19, 2010 is that of Class R of Evergreen Omega Fund. |
| 2 | For the ten months ended July 31, 2010. The Fund changed its fiscal year end from September 30 to July 31, effective July 31, 2010. |
| 3 | Calculated based upon average shares outstanding |
| 4 | Returns for periods of less than one year are not annualized. |
The accompanying notes are an integral part of these financial statements.
| | | | |
| 18 | | Wells Fargo Advantage Omega Growth Fund | | Financial highlights |
(For a share outstanding throughout each period)
| | | | | | | | | | | | | | | | | | | | | | | | | | | | |
| | | Six months ended
January 31, 2015
(unaudited) | | | Year ended July 31 | | | Year ended
September 30, 20091 | |
| ADMINISTRATOR CLASS | | | 2014 | | | 2013 | | | 2012 | | | 2011 | | | 20101,2 | | |
Net asset value, beginning of period | | | $52.50 | | | | $50.00 | | | | $40.60 | | | | $39.67 | | | | $31.12 | | | | $29.39 | | | | $28.10 | |
Net investment income (loss) | | | (0.06 | )3 | | | (0.31 | )3 | | | 0.07 | 3 | | | (0.19 | )3 | | | (0.21 | )3 | | | (0.04 | )3 | | | 0.24 | 3 |
Net realized and unrealized gains (losses) on investments | | | 1.10 | | | | 8.58 | | | | 10.74 | | | | 1.12 | | | | 8.76 | | | | 2.02 | | | | 1.05 | |
| | | | | | | | | | | | | | | | | | | | | | | | | | | | |
Total from investment operations | | | 1.04 | | | | 8.27 | | | | 10.81 | | | | 0.93 | | | | 8.55 | | | | 1.98 | | | | 1.29 | |
Distributions to shareholders from | | | | | | | | | | | | | | | | | | | | | | | | | | | | |
Net investment income | | | 0.00 | | | | 0.00 | | | | 0.00 | | | | 0.00 | | | | 0.00 | | | | (0.25 | ) | | | 0.00 | |
Net realized gains | | | (6.54 | ) | | | (5.77 | ) | | | (1.41 | ) | | | 0.00 | | | | 0.00 | | | | 0.00 | | | | 0.00 | |
| | | | | | | | | | | | | | | | | | | | | | | | | | | | |
Total distributions to shareholders | | | (6.54 | ) | | | (5.77 | ) | | | (1.41 | ) | | | 0.00 | | | | 0.00 | | | | (0.25 | ) | | | 0.00 | |
Net asset value, end of period | | | $47.00 | | | | $52.50 | | | | $50.00 | | | | $40.60 | | | | $39.67 | | | | $31.12 | | | | $29.39 | |
Total return4 | | | 1.79 | % | | | 16.89 | % | | | 27.35 | % | | | 2.34 | % | | | 27.47 | % | | | 6.75 | % | | | 4.59 | % |
Ratios to average net assets (annualized) | | | | | | | | | | | | | | | | | | | | | | | | | | | | |
Gross expenses | | | 1.15 | % | | | 1.15 | % | | | 1.17 | % | | | 1.17 | % | | | 1.18 | % | | | 1.11 | % | | | 1.23 | % |
Net expenses | | | 1.05 | % | | | 1.05 | % | | | 1.05 | % | | | 1.05 | % | | | 1.05 | % | | | 1.09 | % | | | 1.14 | % |
Net investment income (loss) | | | (0.22 | )% | | | (0.59 | )% | | | 0.16 | % | | | (0.49 | )% | | | (0.56 | )% | | | (0.16 | )% | | | 1.00 | % |
Supplemental data | | | | | | | | | | | | | | | | | | | | | | | | | | | | |
Portfolio turnover rate | | | 42 | % | | | 101 | % | | | 88 | % | | | 101 | % | | | 123 | % | | | 116 | % | | | 26 | % |
Net assets, end of period (000s omitted) | | $ | 86,551 | | | $ | 115,281 | | | $ | 69,264 | | | $ | 51,560 | | | $ | 41,242 | | | $ | 29,724 | | | $ | 32,437 | |
| 1 | After the close of business on July 16, 2010, the Fund acquired the net assets of Evergreen Omega Fund which became the accounting and performance survivor in the transaction. The information for the periods prior to July 19, 2010 is that of Class I of Evergreen Omega Fund. |
| 2 | For the ten months ended July 31, 2010. The Fund changed its fiscal year end from September 30 to July 31, effective July 31, 2010. |
| 3 | Calculated based upon average shares outstanding |
| 4 | Returns for periods of less than one year are not annualized. |
The accompanying notes are an integral part of these financial statements.
| | | | | | |
| Financial highlights | | Wells Fargo Advantage Omega Growth Fund | | | 19 | |
(For a share outstanding throughout each period)
| | | | | | | | | | | | | | | | | | | | | | | | |
| | | Six months ended
January 31, 2015
(unaudited) | | | Year ended July 31 | |
| INSTITUTIONAL CLASS | | | 2014 | | | 2013 | | | 2012 | | | 2011 | | | 20101 | |
Net asset value, beginning of period | | | $53.10 | | | | $50.40 | | | | $40.81 | | | | $39.77 | | | | $31.12 | | | | $31.12 | |
Net investment income (loss) | | | 0.02 | 2 | | | (0.24 | ) | | | 0.11 | 2 | | | (0.10 | ) | | | (0.03 | ) | | | 0.00 | |
Net realized and unrealized gains (losses) on investments | | | 1.10 | | | | 8.71 | | | | 10.89 | | | | 1.14 | | | | 8.68 | | | | 0.00 | |
| | | | | | | | | | | | | | | | | | | | | | | | |
Total from investment operations | | | 1.12 | | | | 8.47 | | | | 11.00 | | | | 1.04 | | | | 8.65 | | | | 0.00 | |
Distributions to shareholders from | | | | | | | | | | | | | | | | | | | | | | | | |
Net realized gains | | | (6.54 | ) | | | (5.77 | ) | | | (1.41 | ) | | | 0.00 | | | | 0.00 | | | | 0.00 | |
Net asset value, end of period | | | $47.68 | | | | $53.10 | | | | $50.40 | | | | $40.81 | | | | $39.77 | | | | $31.12 | |
Total return3 | | | 1.92 | % | | | 17.17 | % | | | 27.68 | % | | | 2.62 | % | | | 27.80 | % | | | 0.00 | % |
Ratios to average net assets (annualized) | | | | | | | | | | | | | | | | | | | | | | | | |
Gross expenses | | | 0.89 | % | | | 0.89 | % | | | 0.91 | % | | | 0.92 | % | | | 0.88 | % | | | 0.00 | % |
Net expenses | | | 0.80 | % | | | 0.80 | % | | | 0.80 | % | | | 0.80 | % | | | 0.80 | % | | | 0.00 | % |
Net investment income (loss) | | | 0.09 | % | | | (0.36 | )% | | | 0.24 | % | | | (0.24 | )% | | | (0.34 | )% | | | 0.00 | % |
Supplemental data | | | | | | | | | | | | | | | | | | | | | | | | |
Portfolio turnover rate | | | 42 | % | | | 101 | % | | | 88 | % | | | 101 | % | | | 123 | % | | | 116 | % |
Net assets, end of period (000s omitted) | | $ | 67,558 | | | $ | 49,960 | | | $ | 3,507 | | | $ | 779 | | | $ | 656 | | | $ | 10 | |
| 1 | For the period from July 30, 2010 (commencement of class operations) to July 31, 2010 |
| 2 | Calculated based upon average shares outstanding |
| 3 | Returns for periods of less than one year are not annualized. |
The accompanying notes are an integral part of these financial statements.
| | | | |
| 20 | | Wells Fargo Advantage Omega Growth Fund | | Notes to financial statements (unaudited) |
1. ORGANIZATION
Wells Fargo Funds Trust (the “Trust”), a Delaware statutory trust organized on March 10, 1999, is an open-end management investment company registered under the Investment Company Act of 1940, as amended (the “1940 Act”). As an investment company, the Trust follows the accounting and reporting guidance in Financial Accounting Standards Board (“FASB”) Accounting Standards Codification Topic 946, Financial Services – Investment Companies. These financial statements report on the Wells Fargo Advantage Omega Growth Fund (the “Fund”) which is a diversified series of the Trust.
2. SIGNIFICANT ACCOUNTING POLICIES
The following significant accounting policies, which are consistently followed in the preparation of the financial statements of the Fund, are in conformity with U.S. generally accepted accounting principles which require management to make estimates and assumptions that affect the reported amounts of assets and liabilities, disclosure of contingent assets and liabilities at the date of the financial statements, and the reported amounts of revenues and expenses during the reporting period. Actual results could differ from those estimates.
Securities valuation
All investments are valued each business day as of the close of regular trading on the New York Stock Exchange (generally 4 p.m. Eastern Time).
Equity securities that are listed on a foreign or domestic exchange or market are valued at the official closing price or, if none, the last sales price. If no sale occurs on the primary exchange or market for the security that day, the prior day’s price will be deemed “stale” and fair values will be determined in accordance with the Fund’s Valuation Procedures.
Investments in registered open-end investment companies are valued at net asset value. Non-registered investment vehicles are fair valued at net asset value.
Investments which are not valued using any of the methods discussed above are valued at their fair value, as determined in good faith by the Board of Trustees of the Fund. The Board of Trustees has established a Valuation Committee comprised of the Trustees and has delegated to it the authority to take any actions regarding the valuation of portfolio securities that the Valuation Committee deems necessary or appropriate, including determining the fair value of portfolio securities, unless the determination has been delegated to the Management Valuation Team of Wells Fargo Funds Management, LLC (“Funds Management”). The Board of Trustees retains the authority to make or ratify any valuation decisions or approve any changes to the Valuation Procedures as it deems appropriate. On a quarterly basis, the Board of Trustees receives reports on any valuation actions taken by the Valuation Committee or the Management Valuation Team which may include items for ratification.
Valuations of fair valued securities are compared to the next actual sales price when available, or other appropriate market values, to assess the continued appropriateness of the fair valuation methodologies used. These securities are fair valued on a day-to-day basis, taking into consideration changes to appropriate market information and any significant changes to the inputs considered in the valuation process until there is a readily available price provided on an exchange or by an independent pricing service. Valuations received from an independent pricing service or independent broker-dealer quotes are periodically validated by comparisons to most recent trades and valuations provided by other independent pricing services in addition to the review of prices by the adviser and/or subadviser. Unobservable inputs used in determining fair valuations are identified based on the type of security, taking into consideration factors utilized by market participants in valuing the investment, knowledge about the issuer and the current market environment.
Security loans
The Fund may lend its securities from time to time in order to earn additional income in the form of fees or interest on securities received as collateral or the investment of any cash received as collateral. The Fund continues to receive interest or dividends on the securities loaned. The Fund receives collateral in the form of cash or securities with a value at least equal to the value of the securities on loan. The value of the loaned securities is determined at the close of each business day and any additional required collateral is delivered to the Fund on the next business day. In a securities lending transaction, the net asset value of the Fund will be affected by an increase or decrease in the value of the securities loaned and by an increase or decrease in the value of the instrument in which collateral is invested. The amount of securities lending activity undertaken by the Fund fluctuates from time to time. In the event of default or bankruptcy by the borrower, the Fund may be prevented from recovering the loaned securities or gaining access to the collateral or may experience delays or costs in doing so. In addition, the investment of any cash collateral received may lose all or part of its value. The Fund has the right under the lending agreement to recover the securities from the borrower on demand.
| | | | | | |
| Notes to financial statements (unaudited) | | Wells Fargo Advantage Omega Growth Fund | | | 21 | |
The Fund lends its securities through an unaffiliated securities lending agent. Cash collateral received in connection with its securities lending transactions is invested in Securities Lending Cash Investments, LLC (the “Securities Lending Fund”). The Securities Lending Fund is exempt from registration under Section 3(c)(7) of the 1940 Act and is managed by Funds Management and is subadvised by Wells Capital Management Incorporated (“WellsCap”). Funds Management receives an advisory fee starting at 0.05% and declining to 0.01% as the average daily net assets of the Securities Lending Fund increase. All of the fees received by Funds Management are paid to WellsCap for its services as subadviser. The Securities Lending Fund seeks to provide a positive return compared to the daily Fed Funds Open rate by investing in high-quality, U.S. dollar-denominated short-term money market instruments. Securities Lending Fund investments are fair valued based upon the amortized cost valuation technique. Income earned from investment in the Securities Lending Fund is included in securities lending income on the Statement of Operations.
Security transactions and income recognition
Securities transactions are recorded on a trade date basis. Realized gains or losses are recorded on the basis of identified cost.
Dividend income is recognized on the ex-dividend date. Dividend income is recorded net of foreign taxes withheld where recovery of such taxes is not assured.
Distributions to shareholders
Distributions to shareholders from net investment income and net realized gains, if any, are recorded on the ex-dividend date. Such distributions are determined in conformity with federal income tax regulations, which may differ in amount or character from net investment income and realized gains recognized for purposes of U.S. generally accepted accounting principles.
Federal and other taxes
The Fund intends to continue to qualify as a regulated investment company by distributing substantially all of its investment company taxable income and any net realized capital gains (after reduction for capital loss carryforwards) sufficient to relieve it from all, or substantially all, federal income taxes. Accordingly, no provision for federal income taxes was required.
The Fund’s income and federal excise tax returns and all financial records supporting those returns for the prior three fiscal years are subject to examination by the federal and Delaware revenue authorities. Management has analyzed the Fund’s tax positions taken on federal, state, and foreign tax returns for all open tax years and does not believe that there are any uncertain tax positions that require recognition of a tax liability.
Class allocations
The separate classes of shares offered by the Fund differ principally in applicable sales charges, distribution, shareholder servicing, and administration fees. Class specific expenses are charged directly to that share class. Investment income, common expenses, and realized and unrealized gains (losses) on investments are allocated daily to each class of shares based on the relative proportion of net assets of each class.
3. FAIR VALUATION MEASUREMENTS
Fair value measurements of investments are determined within a framework that has established a fair value hierarchy based upon the various data inputs utilized in determining the value of the Fund’s investments. The three-level hierarchy gives the highest priority to unadjusted quoted prices in active markets for identical assets or liabilities (Level 1) and the lowest priority to significant unobservable inputs (Level 3). The Fund’s investments are classified within the fair value hierarchy based on the lowest level of input that is significant to the fair value measurement. The inputs are summarized into three broad levels as follows:
| n | | Level 1 – quoted prices in active markets for identical securities |
| n | | Level 2 – other significant observable inputs (including quoted prices for similar securities, interest rates, prepayment speeds, credit risk, use of amortized cost, etc.) |
| n | | Level 3 – significant unobservable inputs (including the Fund’s own assumptions in determining the fair value of investments) |
The inputs or methodologies used for valuing investments in securities are not necessarily an indication of the risk associated with investing in those securities.
| | | | |
| 22 | | Wells Fargo Advantage Omega Growth Fund | | Notes to financial statements (unaudited) |
The following is a summary of the inputs used in valuing the Fund’s assets and liabilities as of January 31, 2015:
| | | | | | | | | | | | | | | | |
| | | Quoted prices
(Level 1) | | | Other significant
observable inputs
(Level 2) | | | Significant
unobservable inputs
(Level 3) | | | Total | |
Assets | | | | | | | | | | | | | | | | |
Investments in: | | | | | | | | | | | | | | | | |
| | | | |
Common stocks | | | | | | | | | | | | | | | | |
Consumer discretionary | | $ | 202,612,759 | | | $ | 0 | | | $ | 0 | | | $ | 202,612,759 | |
Consumer staples | | | 15,264,190 | | | | 0 | | | | 0 | | | | 15,264,190 | |
Energy | | | 18,819,460 | | | | 0 | | | | 0 | | | | 18,819,460 | |
Financials | | | 84,167,437 | | | | 0 | | | | 0 | | | | 84,167,437 | |
Health care | | | 187,779,439 | | | | 0 | | | | 0 | | | | 187,779,439 | |
Industrials | | | 99,169,778 | | | | 0 | | | | 0 | | | | 99,169,778 | |
Information technology | | | 270,087,864 | | | | 0 | | | | 0 | | | | 270,087,864 | |
Materials | | | 27,119,488 | | | | 0 | | | | 0 | | | | 27,119,488 | |
Telecommunication services | | | 24,600,593 | | | | 0 | | | | 0 | | | | 24,600,593 | |
| | | | |
Short-term investments | | | | | | | | | | | | | | | | |
Investment companies | | | 1,277,167 | | | | 7,960,316 | | | | 0 | | | | 9,237,483 | |
Total assets | | $ | 930,898,175 | | | $ | 7,960,316 | | | $ | 0 | | | $ | 938,858,491 | |
The Fund recognizes transfers between levels within the fair value hierarchy at the end of the reporting period. At January 31, 2015, the Fund did not have any transfers into/out of Level 1, Level 2, or Level 3.
4. TRANSACTIONS WITH AFFILIATES
Advisory fee
The Trust has entered into an advisory contract with Funds Management, an indirect wholly owned subsidiary of Wells Fargo & Company (“Wells Fargo”). The adviser is responsible for implementing investment policies and guidelines and for supervising the subadviser, who is responsible for day-to-day portfolio management of the Fund.
Pursuant to the contract, Funds Management is entitled to receive an annual advisory fee starting at 0.75% and declining to 0.525% as the average daily net assets of the Fund increase. Prior to December 1, 2014, Funds Management was entitled to receive an annual advisory fee which started at 0.75% and declined to 0.55% as the average daily net assets of the Fund increased. For the six months ended January 31, 2015, the advisory fee was equivalent to an annual rate of 0.72% of the Fund’s average daily net assets.
Funds Management has retained the services of a subadviser to provide daily portfolio management to the Fund. The fee for subadvisory services is borne by Funds Management. WellsCap, an affiliate of Funds Management and an indirect wholly owned subsidiary of Wells Fargo, is the subadviser to the Fund and is entitled to receive a fee from Funds Management at an annual rate starting at 0.45% and declining to 0.30% as the average daily net assets of the Fund increase.
Administration fees
The Trust has entered into an administration agreement with Funds Management. Under this agreement, for providing administrative services, which includes paying fees and expenses for services provided by the transfer agent, sub-transfer agents, omnibus account servicers and record-keepers, Funds Management is entitled to receive from the Fund an annual fund level administration fee starting at 0.05% and declining to 0.03% as the average daily net assets of the Fund increase and a class level administration fee which is calculated based on the average daily net assets of each class as follows:
| | | | |
| | | Class level
administration fee | |
Class A, Class B, Class C, Class R | | | 0.26 | % |
Administrator Class | | | 0.10 | |
Institutional Class | | | 0.08 | |
| | | | | | |
| Notes to financial statements (unaudited) | | Wells Fargo Advantage Omega Growth Fund | | | 23 | |
Funds Management has contractually waived and/or reimbursed advisory and administration fees to the extent necessary to maintain certain net operating expense ratios for the Fund. Waiver of fees and/or reimbursement of expenses by Funds Management were made first from fund level expenses on a proportionate basis and then from class specific expenses. Funds Management has committed through November 30, 2015 to waive fees and/or reimburse expenses to the extent necessary to cap the Fund’s expenses at 1.30% for Class A shares, 2.05% for Class B shares, 2.05% for Class C shares, 1.55% for Class R, 1.05% for Administrator Class shares, and 0.80% for Institutional Class shares. After this time, the cap may be increased or the commitment to maintain the cap may be terminated only with the approval of the Board of Trustees.
Distribution fees
The Trust has adopted a Distribution Plan for Class B, Class C, and Class R shares of the Fund pursuant to Rule 12b-1 under the 1940 Act. Distribution fees are charged to Class B, Class C, and Class R shares and paid to Wells Fargo Funds Distributor, LLC (“Funds Distributor”), the principal underwriter, at an annual rate of 0.75% of the average daily net assets of Class B and Class C shares and 0.25% of the average daily net assets for Class R shares.
In addition, Funds Distributor is entitled to receive the front-end sales charge from the purchase of Class A shares and a contingent deferred sales charge on the redemption of certain shares. Funds Distributor is also entitled to receive the contingent deferred sales charges from redemptions of Class B and Class C shares. For the six months ended January 31, 2015, Funds Distributor received $13,509 from the sale of Class A shares and $236 and $271 in contingent deferred sales charges from redemptions of Class B and Class C shares, respectively.
Shareholder servicing fees
The Trust has entered into contracts with one or more shareholder servicing agents, whereby Class A, Class B, Class C, Class R, and Administrator Class of the Fund is charged a fee at an annual rate of 0.25% of the average daily net assets of each respective class.
A portion of these total shareholder servicing fees were paid to affiliates of Wells Fargo.
5. INVESTMENT PORTFOLIO TRANSACTIONS
Purchases and sales of investments, excluding U.S. government obligations (if any) and short-term securities, for the six months ended January 31, 2015 were $419,215,729 and $529,941,244, respectively.
6. BANK BORROWINGS
The Trust (excluding the money market funds and certain other funds in the Trust) and Wells Fargo Variable Trust are parties to a $150,000,000 revolving credit agreement, whereby the Fund is permitted to use bank borrowings for temporary or emergency purposes, such as to fund shareholder redemption requests. Interest under the credit agreement is charged to the Fund based on a borrowing rate equal to the higher of the Federal Funds rate in effect on that day plus 1.25% or the overnight LIBOR rate in effect on that day plus 1.25%. In addition, an annual commitment fee equal to 0.10% of the unused balance is allocated to each participating fund. For the six months ended January 31, 2015, the Fund paid $759 in commitment fees.
For the six months ended January 31, 2015, there were no borrowings by the Fund under the agreement.
7. CONCENTRATION RISK
Concentration risks result from exposure to a limited number of sectors. A fund that invests a substantial portion of its assets in any sector may be more affected by changes in that sector than would be a fund whose investments are not heavily weighted in any sector.
8. INDEMNIFICATION
Under the Trust’s organizational documents, the officers and Trustees are indemnified against certain liabilities that may arise out of performance of their duties to the Trust. Additionally, in the normal course of business, the Trust may enter into contracts with service providers that contain a variety of indemnification clauses. The Trust’s maximum exposure under these arrangements is dependent on future claims that may be made against the Fund and, therefore, cannot be estimated.
| | | | |
| 24 | | Wells Fargo Advantage Omega Growth Fund | | Other information (unaudited) |
PROXY VOTING INFORMATION
A description of the policies and procedures that the Fund uses to determine how to vote proxies relating to portfolio securities, in addition to information regarding how the Fund voted proxies relating to portfolio securities during the most recent 12-month period ended June 30, is available on the Fund’s website at wellsfargoadvantagefunds.com or by visiting the SEC website at sec.gov.
PORTFOLIO HOLDINGS INFORMATION
The complete portfolio holdings for the Fund are publicly available monthly on the Fund’s website (wellsfargoadvantagefunds.com), on a one-month delayed basis. In addition, top ten holdings information (excluding derivative positions) for the Fund is publicly available on the Fund’s website on a monthly, seven-day or more delayed basis. The Fund files its complete schedule of portfolio holdings with the SEC for the first and third quarters of each fiscal year on Form N-Q, which is available by visiting the SEC website at sec.gov. In addition, the Fund’s Form N-Q may be reviewed and copied at the SEC’s Public Reference Room in Washington, DC, and at regional offices in New York City, at 233 Broadway, and in Chicago, at 175 West Jackson Boulevard, Suite 900. Information about the Public Reference Room may be obtained by calling 1-800-SEC-0330.
| | | | | | |
| Other information (unaudited) | | Wells Fargo Advantage Omega Growth Fund | | | 25 | |
BOARD OF TRUSTEES AND OFFICERS
Each of the Trustees and Officers1 listed in the table below acts in identical capacities for each fund in the Wells Fargo Advantage family of funds, which consists of 134 mutual funds comprising the Wells Fargo Funds Trust, Wells Fargo Variable Trust, Wells Fargo Master Trust and four closed-end funds (collectively the “Fund Complex”). This table should be read in conjunction with the Prospectus and the Statement of Additional Information2. The mailing address of each Trustee and Officer is 525 Market Street, 12th Floor, San Francisco, CA 94105. Each Trustee and Officer serves an indefinite term, however, each Trustee serves such term until reaching the mandatory retirement age established by the Trustees.
Independent Trustees
| | | | | | |
Name and
year of birth | | Position held and
length of service* | | Principal occupations during past five years or longer | | Other
directorships during
past five years |
| William R. Ebsworth (Born 1957) | | Trustee, since 2015** | | Retired. From 1984 to 2013, equities analyst, portfolio manager, research director at Fidelity Management and Research Company and retired in 2013 as Chief Investment Officer of Fidelity Strategic Advisers, Inc. in Boston, Tokyo, and Hong Kong where he led a team of investment professionals managing client assets. Prior thereto, Board member of Hong Kong Securities Clearing Co., Hong Kong Options Clearing Corp., the Thailand International Fund, Ltd., Fidelity Investments Life Insurance Company, and Empire Fidelity Investments Life Insurance Company. Mr. Ebsworth is an Adjunct Lecturer, Finance, at Babson College and a Chartered Financial Analyst. | | Asset Allocation Trust |
| Jane A. Freeman (Born 1953) | | Trustee, since 2015** | | Retired. From 2012 to 2014 and 1999 to 2008, Chief Financial Officer of Scientific Learning Corporation. From 2008 to 2012, Ms. Freeman provided consulting services related to strategic business projects. Prior thereto, Portfolio Manager at Rockefeller & Co. and Scudder, Stevens & Clark. Board member of the Harding Loevner Funds from 1996 to 2014, serving as both Lead Independent Director and chair of the Audit Committee. Board member of the Russell Exchange Traded Funds Trust from 2011 to 2012 and the chair of the Audit Committee. Ms. Freeman is a Chartered Financial Analyst (inactive), Chair of Taproot Foundation (non-profit organization) and a Board Member of Ruth Bancroft Garden (non-profit organization). | | Asset Allocation Trust |
| Peter G. Gordon (Born 1942) | | Trustee, since 1998; Chairman, since 2005 | | Co-Founder, Retired Chairman, President and CEO of Crystal Geyser Water Company. Trustee Emeritus, Colby College. | | Asset Allocation Trust |
| Isaiah Harris, Jr. (Born 1952) | | Trustee, since 2009 | | Retired. Chairman of the Board of CIGNA Corporation since 2009, and Director since 2005. From 2003 to 2011, Director of Delux Corporation. Prior thereto, President and CEO of BellSouth Advertising and Publishing Corp. from 2005 to 2007, President and CEO of BellSouth Enterprises from 2004 to 2005 and President of BellSouth Consumer Services from 2000 to 2003. Emeritus member of the Iowa State University Foundation Board of Governors. Emeritus Member of the Advisory Board of Iowa State University School of Business. Advisory Board Member, Palm Harbor Academy. Mr. Harris is a certified public accountant. | | CIGNA Corporation; Asset Allocation Trust |
| Judith M. Johnson (Born 1949) | | Trustee, since 2008; Audit Committee Chairman, since 2008 | | Retired. Prior thereto, Chief Executive Officer and Chief Investment Officer of Minneapolis Employees Retirement Fund from 1996 to 2008. Ms. Johnson is an attorney, certified public accountant and a certified managerial accountant. | | Asset Allocation Trust |
| David F. Larcker (Born 1950) | | Trustee, since 2009 | | James Irvin Miller Professor of Accounting at the Graduate School of Business, Stanford University, Morgan Stanley Director of the Center for Leadership Development and Research and Senior Faculty of The Rock Center for Corporate Governance since 2006. From 2005 to 2008, Professor of Accounting at the Graduate School of Business, Stanford University. Prior thereto, Ernst & Young Professor of Accounting at The Wharton School, University of Pennsylvania from 1985 to 2005. | | Asset Allocation Trust |
| | | | |
| 26 | | Wells Fargo Advantage Omega Growth Fund | | Other information (unaudited) |
| | | | | | |
Name and
year of birth | | Position held and
length of service* | | Principal occupations during past five years or longer | | Other
directorships during
past five years |
| Olivia S. Mitchell (Born 1953) | | Trustee, since 2006 | | International Foundation of Employee Benefit Plans Professor, Wharton School of the University of Pennsylvania since 1993. Director of Wharton’s Pension Research Council and Boettner Center on Pensions & Retirement Research, and Research Associate at the National Bureau of Economic Research. Previously, Cornell University Professor from 1978 to 1993. | | Asset Allocation Trust |
| Timothy J. Penny (Born 1951) | | Trustee, since 1996 | | President and Chief Executive Officer of Southern Minnesota Initiative Foundation, a non-profit organization, since 2007 and Senior Fellow at the Humphrey Institute Policy Forum at the University of Minnesota since 1995. Member of the Board of Trustees of NorthStar Education Finance, Inc., a non-profit organization, since 2007. | | Asset Allocation Trust |
| Michael S. Scofield (Born 1943) | | Trustee, since 2010 | | Served on the Investment Company Institute’s Board of Governors and Executive Committee from 2008-2011 as well the Governing Council of the Independent Directors Council from 2006-2011 and the Independent Directors Council Executive Committee from 2008-2011. Chairman of the IDC from 2008-2010. Institutional Investor (Fund Directions) Trustee of Year in 2007. Trustee of the Evergreen Funds complex (and its predecessors) from 1984 to 2010. Chairman of the Evergreen Funds from 2000-2010. Former Trustee of the Mentor Funds. Retired Attorney, Law Offices of Michael S. Scofield. | | Asset Allocation Trust |
| Donald C. Willeke (Born 1940) | | Trustee, since 1996 | | Principal of the law firm of Willeke & Daniels. General Counsel of the Minneapolis Employees Retirement Fund from 1984 until its consolidation into the Minnesota Public Employees Retirement Association on June 30, 2010. Director and Vice Chair of The Tree Trust (non-profit corporation). Director of the American Chestnut Foundation (non-profit corporation). | | Asset Allocation Trust |
| * | Length of service dates reflect the Trustee’s commencement of service with the Trust’s predecessor entities, where applicable. |
| ** | William R. Ebsworth and Jane A. Freeman each became a Trustee effective January 1, 2015. |
Officers
| | | | | | |
Name and
year of birth | | Position held and
length of service | | Principal occupations during past five years or longer | | |
| Karla M. Rabusch (Born 1959) | | President, since 2003 | | Executive Vice President of Wells Fargo Bank, N.A. and President of Wells Fargo Funds Management, LLC since 2003. | | |
| Jeremy DePalma1 (Born 1974) | | Treasurer, since 2012 | | Senior Vice President of Wells Fargo Funds Management, LLC since 2009. Senior Vice President of Evergreen Investment Management Company, LLC from 2008 to 2010. Vice President, Evergreen Investment Services, Inc. from 2004 to 2007. Head of the Fund Reporting and Control Team within Fund Administration from 2005 to 2010. | | |
| C. David Messman (Born 1960) | | Secretary, since 2000; Chief Legal Officer, since 2003 | | Assistant General Counsel of Wells Fargo Bank, N.A. since 2013 and Vice President and Managing Counsel of Wells Fargo Bank N.A. from 1996 to 2013. Senior Vice President and Secretary of Wells Fargo Funds Management, LLC since 2001. | | |
| Debra Ann Early (Born 1964) | | Chief Compliance Officer, since 2007 | | Senior Vice President of Wells Fargo Funds Management, LLC since 2007 and Chief Compliance Officer from 2007 to 2014. Chief Compliance Officer of Parnassus Investments from 2005 to 2007. Chief Financial Officer of Parnassus Investments from 2004 to 2007 and Senior Audit Manager of PricewaterhouseCoopers LLP from 1998 to 2004. | | |
| David Berardi (Born 1975) | | Assistant Treasurer, since 2009 | | Vice President of Wells Fargo Funds Management, LLC since 2009. Vice President of Evergreen Investment Management Company, LLC from 2008 to 2010. Assistant Vice President of Evergreen Investment Services, Inc. from 2004 to 2008. Manager of Fund Reporting and Control for Evergreen Investment Management Company, LLC from 2004 to 2010. | | |
| 1 | Jeremy DePalma acts as Treasurer of 61 funds and Assistant Treasurer of 73 funds in the Fund Complex. |
| 2 | The Statement of Additional Information includes additional information about the Trustees and is available, without charge, upon request, by calling 1-800-222-8222 or by visiting the website at wellsfargoadvantagefunds.com. |
| | | | | | |
| List of abbreviations | | Wells Fargo Advantage Omega Growth Fund | | | 27 | |
The following is a list of common abbreviations for terms and entities that may have appeared in this report.
| ACA | — ACA Financial Guaranty Corporation |
| ADR | — American depositary receipt |
| ADS | — American depositary shares |
| AGC | — Assured Guaranty Corporation |
| AGM | — Assured Guaranty Municipal |
| Ambac | — Ambac Financial Group Incorporated |
| AMT | — Alternative minimum tax |
| BAN | — Bond anticipation notes |
| BHAC | — Berkshire Hathaway Assurance Corporation |
| CAB | — Capital appreciation bond |
| CCAB | — Convertible capital appreciation bond |
| CDA | — Community Development Authority |
| CDO | — Collateralized debt obligation |
| DRIVER | — Derivative inverse tax-exempt receipts |
| DW&P | — Department of Water & Power |
| DWR | — Department of Water Resources |
| ECFA | — Educational & Cultural Facilities Authority |
| EDA | — Economic Development Authority |
| EDFA | — Economic Development Finance Authority |
| ETF | — Exchange-traded fund |
| FDIC | — Federal Deposit Insurance Corporation |
| FFCB | — Federal Farm Credit Banks |
| FGIC | — Financial Guaranty Insurance Corporation |
| FHA | — Federal Housing Administration |
| FHLB | — Federal Home Loan Bank |
| FHLMC | — Federal Home Loan Mortgage Corporation |
| FICO | — The Financing Corporation |
| FNMA | — Federal National Mortgage Association |
| GDR | — Global depositary receipt |
| GNMA | — Government National Mortgage Association |
| HCFR | — Healthcare facilities revenue |
| HEFA | — Health & Educational Facilities Authority |
| HEFAR | — Higher education facilities authority revenue |
| HFA | — Housing Finance Authority |
| HFFA | — Health Facilities Financing Authority |
| HUD | — Department of Housing and Urban Development |
| IDA | — Industrial Development Authority |
| IDAG | — Industrial Development Agency |
| KRW | — Republic of Korea won |
| LIBOR | — London Interbank Offered Rate |
| LIFER | — Long Inverse Floating Exempt Receipts |
| LLC | — Limited liability company |
| LLLP | — Limited liability limited partnership |
| LLP | — Limited liability partnership |
| MBIA | — Municipal Bond Insurance Association |
| MFHR | — Multifamily housing revenue |
| MSTR | — Municipal securities trust receipts |
| MUD | — Municipal Utility District |
| National | — National Public Finance Guarantee Corporation |
| PCFA | — Pollution Control Financing Authority |
| PCL | — Public Company Limited |
| PCR | — Pollution control revenue |
| PFA | — Public Finance Authority |
| PFFA | — Public Facilities Financing Authority |
| PFOTER | — Puttable floating option tax-exempt receipts |
| plc | — Public limited company |
| PUTTER | — Puttable tax-exempt receipts |
| R&D | — Research & development |
| Radian | — Radian Asset Assurance |
| RAN | — Revenue anticipation notes |
| RDA | — Redevelopment Authority |
| RDFA | — Redevelopment Finance Authority |
| REIT | — Real estate investment trust |
| ROC | — Reset option certificates |
| SAVRS | — Select auction variable rate securities |
| SBA | — Small Business Authority |
| SFHR | — Single-family housing revenue |
| SFMR | — Single-family mortgage revenue |
| SPA | — Standby purchase agreement |
| SPDR | — Standard & Poor’s Depositary Receipts |
| SPEAR | — Short Puttable Exempt Adjustable Receipts |
| STRIPS | — Separate trading of registered interest and |
| TAN | — Tax anticipation notes |
| TIPS | — Treasury inflation-protected securities |
| TRAN | — Tax revenue anticipation notes |
| TTFA | — Transportation Trust Fund Authority |
| TVA | — Tennessee Valley Authority |
This page is intentionally left blank.


For more information
More information about Wells Fargo Advantage Funds is available free upon request. To obtain literature, please write, email, visit the Fund’s website, or call:
Wells Fargo Advantage Funds
P.O. Box 8266
Boston, MA 02266-8266
Email: wfaf@wellsfargo.com
Website: wellsfargoadvantagefunds.com
Individual investors: 1-800-222-8222
Retail investment professionals: 1-888-877-9275
Institutional investment professionals: 1-866-765-0778
This report and the financial statements contained herein are submitted for the general information of the shareholders of Wells Fargo Advantage Funds. If this report is used for promotional purposes, distribution of the report must be accompanied or preceded by a current prospectus. Before investing, please consider the investment objectives, risks, charges, and expenses of the investment. For a current prospectus and, if available, a summary prospectus, containing this information, call 1-800-222-8222 or visit the Fund’s website at wellsfargoadvantagefunds.com. Read the prospectus carefully before you invest or send money.
Wells Fargo Funds Management, LLC, a wholly owned subsidiary of Wells Fargo & Company, provides investment advisory and administrative services for Wells Fargo Advantage Funds. Other affiliates of Wells Fargo & Company provide subadvisory and other services for the Funds. The Funds are distributed by Wells Fargo Funds Distributor, LLC, Member FINRA/SIPC, an affiliate of Wells Fargo & Company.
NOT FDIC INSURED ¡ NO BANK GUARANTEE ¡ MAY LOSE VALUE
© 2015 Wells Fargo Funds Management, LLC. All rights reserved.
| | |
 | | 231604 03-15 SA211/SAR211 01-15 |

Wells Fargo Advantage
Premier Large Company Growth Fund

Semi-Annual Report
January 31, 2015

Reduce clutter. Save trees.
Sign up for electronic delivery of prospectuses and shareholder reports at wellsfargo.com/advantagedelivery
Contents
The views expressed and any forward-looking statements are as of January 31, 2015, unless otherwise noted, and are those of the Fund managers and/or Wells Fargo Funds Management, LLC. Discussions of individual securities, or the markets generally, or any Wells Fargo Advantage Fund are not intended as individual recommendations. Future events or results may vary significantly from those expressed in any forward-looking statements; the views expressed are subject to change at any time in response to changing circumstances in the market. Wells Fargo Funds Management, LLC and the Fund disclaim any obligation to publicly update or revise any views expressed or forward-looking statements.
NOT FDIC INSURED ¡ NO BANK GUARANTEE ¡ MAY LOSE VALUE
| | | | |
| 2 | | Wells Fargo Advantage Premier Large Company Growth Fund | | Letter to shareholders (unaudited) |

Karla M. Rabusch
President
Wells Fargo Advantage Funds
As the U.S. churned forward, major economies elsewhere in the world faced significant ongoing challenges.
Dear Valued Shareholder:
We are pleased to offer you this semi-annual report for the Wells Fargo Advantage Premier Large Company Growth Fund for the six-month period that ended January 31, 2015. Generally improving U.S. economic data helped drive a positive return for U.S. stocks for the reporting period (as measured by the S&P 500 Index1); in contrast, many economies and markets elsewhere in the world faced ongoing challenges.
Positive U.S. economic data, but increased tensions abroad, led to heightened volatility during the third quarter of 2014.
When the reporting period began on August 1, 2014, the U.S. stock market was experiencing a series of surges interrupted by bouts of volatility as interest-rate concerns in the U.S. and increased tensions abroad triggered heightened investor uncertainty. An escalating Russia/Ukraine situation and a growing perception that the U.S. Federal Reserve (Fed) would raise short-term interest rates sooner than expected caused investors to pull back near the end of July. As a result, the S&P 500 Index dropped into negative territory for July’s monthly return. However, August brought a bounce-back; the S&P 500 Index delivered its largest monthly gain since February 2014 on a string of positive economic news, led by an upwardly revised 4.2% estimate of second-quarter 2014 gross domestic product (GDP) growth. Then, in September, stock market volatility increased as positive economic data became overshadowed at times by growing discomfort over escalating tensions in Ukraine and the Middle East. Slowing growth in Europe and China also concerned investors. Ultimately, U.S. stocks ended the third quarter up slightly overall, buoyed largely by another upward revision of second-quarter GDP growth to 4.6%. Strong corporate earnings also contributed to market gains.
The fourth quarter of 2014 brought continued improvement in the U.S.; international economies remained challenged.
Strong fourth-quarter results by the U.S. stock market helped the S&P 500 Index deliver more than 50 record closes in 2014. The last several, in December, were spurred by investor optimism following Fed Chair Janet Yellen’s comment that the Fed would be patient in its timing of an interest-rate increase. U.S. stocks also were boosted by positive economic data. November’s 5.8% unemployment rate was down from 7.0% a year earlier, and the number of jobs being added continued to expand, keeping U.S. employers on pace to hire nearly three million workers during 2014. In addition, the U.S. economy’s third-quarter growth rate was revised upward during the quarter, to 5.0%—its fastest pace in 11 years. Meanwhile, U.S. companies continued to report strong earnings. The steadily brightening U.S. economy energized consumers, who were further buoyed by much lower prices at the gasoline pump. During the fourth quarter, gasoline prices fell to their lowest levels in five years, according to the American Automobile Association.
As the U.S. churned forward, major economies elsewhere in the world faced significant ongoing challenges. In China, where growth had been slowing for some time, government regulators in December announced changes being made in an effort to stimulate growth. In Japan, which slid back into recession in the third quarter of 2014, Prime Minister Abe gained approval in late December for roughly $29 billion in fresh stimulus to help the economy. In the eurozone, growth remained sluggish, and member countries continued to face an environment of
| 1 | The S&P 500 Index consists of 500 stocks chosen for market size, liquidity, and industry group representation. It is a market-value-weighted index with each stock’s weight in the index proportionate to its market value. You cannot invest directly in an index. |
| | | | | | |
| Letter to shareholders (unaudited) | | Wells Fargo Advantage Premier Large Company Growth Fund | | | 3 | |
low demand, high unemployment, and weak business investment. This situation was exacerbated in December by renewed concerns about Greece after its parliament failed to avert a general election that could jeopardize the terms of the country’s financial agreement with its international creditors. In Russia, the economy contracted for the first time since October 2009 as the country struggled under the weight of slumping oil prices, international sanctions, and massive outflows of capital.
Market volatility increased in January 2015.
Markets fluctuated in January as investors reacted to geopolitical developments and new economic data. Mid-month, the World Bank lowered its outlook for global growth based on deepening problems in the eurozone and emerging markets, stating that a strengthening U.S. economy could not, by itself, support the global economy. Later in January, Greek voters gave control of their government to opposition party Syriza, which promised to end austerity and insisted that Greece’s massive debt be renegotiated. In the U.S., various data released in January, such as consumer confidence and December’s jobless rate, showed improvement. On the last trading day of the month, however, investors learned that fourth-quarter 2014 U.S. economic growth was estimated at 2.6%, which was below consensus and lower than the 4.6% and 5.0% growth rates, respectively, for the second and third quarters of 2014.
Don’t let short-term uncertainty derail long-term investment goals.
Periods of uncertainty can present challenges, but experience has taught us that maintaining long-term investment goals can be an effective way to plan for the future. To help you create a sound strategy based on your personal goals and risk tolerance, Wells Fargo Advantage Funds offers more than 100 mutual funds spanning a wide range of asset classes and investment styles. Although diversification cannot guarantee an investment profit or prevent losses, we believe it can be an effective way to manage investment risk and potentially smooth out overall portfolio performance. We encourage investors to know their investments and to understand that appropriate levels of risk-taking may unlock opportunities.
Thank you for choosing to invest with Wells Fargo Advantage Funds. We appreciate your confidence in us and remain committed to helping you meet your financial needs. For current information about your fund investments, contact your investment professional, visit our website at wellsfargoadvantagefunds.com, or call us directly at 1-800-222-8222. We are available 24 hours a day, 7 days a week.
Sincerely,

Karla M. Rabusch
President
Wells Fargo Advantage Funds
We encourage investors to know their investments and to understand that appropriate levels of risk-taking may unlock opportunities.
| | | | |
| 4 | | Wells Fargo Advantage Premier Large Company Growth Fund | | Performance highlights (unaudited) |
Investment objective
The Fund seeks long-term capital appreciation.
Adviser
Wells Fargo Funds Management, LLC
Subadviser
Wells Capital Management Incorporated
Portfolio managers
Thomas C. Ognar, CFA
Bruce C. Olson, CFA
Joseph M. Eberhardy, CFA, CPA
Average annual total returns1 (%) as of January 31, 2015
| | | | | | | | | | | | | | | | | | | | | | | | | | | | | | | | | | |
| | | | | Including sales charge | | | Excluding sales charge | | | Expense ratios2 (%) | |
| | | Inception date | | 1 year | | | 5 year | | | 10 year | | | 1 year | | | 5 year | | | 10 year | | | Gross | | | Net3 | |
| Class A (EKJAX) | | 1-20-1998 | | | 2.91 | | | | 14.14 | | | | 9.24 | | | | 9.15 | | | | 15.52 | | | | 9.89 | | | | 1.17 | | | | 1.12 | |
| Class B (EKJBX)* | | 9-11-1935 | | | 3.35 | | | | 14.42 | | | | 9.33 | | | | 8.35 | | | | 14.65 | | | | 9.33 | | | | 1.92 | | | | 1.87 | |
| Class C (EKJCX) | | 1-22-1998 | | | 7.37 | | | | 14.67 | | | | 9.08 | | | | 8.37 | | | | 14.67 | | | | 9.08 | | | | 1.92 | | | | 1.87 | |
| Class R4 (EKJRX) | | 11-30-2012 | | | – | | | | – | | | | – | | | | 9.53 | | | | 15.89 | | | | 10.22 | | | | 0.84 | | | | 0.80 | |
| Class R6 (EKJFX) | | 11-30-2012 | | | – | | | | – | | | | – | | | | 9.74 | | | | 15.97 | | | | 10.26 | | | | 0.69 | | | | 0.65 | |
| Administrator Class (WFPDX) | | 7-16-2010 | | | – | | | | – | | | | – | | | | 9.32 | | | | 15.67 | | | | 10.01 | | | | 1.01 | | | | 0.95 | |
| Institutional Class (EKJYX) | | 6-30-1999 | | | – | | | | – | | | | – | | | | 9.67 | | | | 15.95 | | | | 10.25 | | | | 0.74 | | | | 0.70 | |
| Investor Class (WFPNX) | | 7-16-2010 | | | – | | | | – | | | | – | | | | 9.18 | | | | 15.44 | | | | 9.82 | | | | 1.23 | | | | 1.18 | |
| Russell 1000® Growth Index4 | | – | | | – | | | | – | | | | – | | | | 14.59 | | | | 16.49 | | | | 8.69 | | | | – | | | | – | |
| * | | Class B shares are closed to investment, except in connection with the reinvestment of any distributions and permitted exchanges. |
Figures quoted represent past performance, which is no guarantee of future results, and do not reflect taxes that a shareholder may pay on fund distributions or the redemption of fund shares. Investment return and principal value of an investment will fluctuate so that an investor’s shares, when redeemed, may be worth more or less than their original cost. Performance shown without sales charges would be lower if sales charges were reflected. Current performance may be lower or higher than the performance data quoted, which assumes the reinvestment of dividends and capital gains. Current month-end performance is available on the Fund’s website, wellsfargoadvantagefunds.com.
Index returns do not include transaction costs associated with buying and selling securities, any mutual fund fees or expenses, or any taxes. It is not possible to invest directly in an index.
For Class A shares, the maximum front-end sales charge is 5.75%. For Class B shares, the maximum contingent deferred sales charge is 5.00%. For Class C shares, the maximum contingent deferred sales charge is 1.00%. Performance including a contingent deferred sales charge assumes the sales charge for the corresponding time period. Class R4, Class R6, Administrator Class, Institutional Class, and Investor Class shares are sold without a front-end sales charge or contingent deferred sales charge.
Stock values fluctuate in response to the activities of individual companies and general market and economic conditions. Certain investment strategies tend to increase the total risk of an investment (relative to the broader market). The Fund is exposed to foreign investment risk and smaller-company risk. Consult the Fund’s prospectus for additional information on these and other risks.
Please see footnotes on page 5.
| | | | | | |
| Performance highlights (unaudited) | | Wells Fargo Advantage Premier Large Company Growth Fund | | | 5 | |
| | | | |
| Ten largest equity holdings5 (%) as of January 31, 2015 | |
Apple Incorporated | | | 3.10 | |
Alexion Pharmaceuticals Incorporated | | | 2.92 | |
Union Pacific Corporation | | | 2.87 | |
Google Incorporated Class A | | | 2.39 | |
Dollar Tree Incorporated | | | 2.35 | |
Biogen Idec Incorporated | | | 2.17 | |
Facebook Incorporated Class A | | | 2.11 | |
Microchip Technology Incorporated | | | 2.09 | |
Starbucks Corporation | | | 2.08 | |
Google Incorporated Class C | | | 1.98 | |
|
| Sector distribution6 as of January 31, 2015 |
|
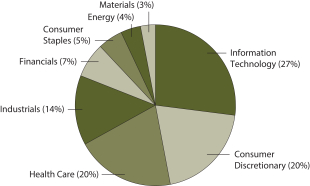 |
| 1 | Historical performance shown for Class R4 shares prior to their inception reflects the performance of Institutional Class shares, adjusted to reflect the higher expenses applicable to Class R4 shares. Historical performance shown for Class R6 shares prior to their inception reflects the performance of Institutional Class shares, and includes the higher expenses applicable to Institutional Class shares. If these expenses had not been included, returns would be higher. Historical performance shown for Administrator Class shares prior to their inception reflects the performance of Institutional Class shares, adjusted to reflect the higher expenses applicable to Administrator Class shares. Historical performance shown for Investor Class shares prior to their inception reflects the performance of Class A shares, adjusted to reflect the higher expenses applicable to Investor Class shares. Historical performance shown for all classes of the Fund prior to July 19, 2010, is based on the performance of the Fund’s predecessor, Evergreen Large Company Growth Fund. |
| 2 | Reflects the expense ratios as stated in the most recent prospectuses. The expense ratios shown are subject to change and may differ from the annualized expense ratios shown in the financial highlights of this report. |
| 3 | The Adviser has committed through November 30, 2015, to waive fees and/or reimburse expenses to the extent necessary to cap the Fund’s Total Annual Fund Operating Expenses After Fee Waiver, excluding certain expenses, at the amounts shown. After this time, the cap may be increased or the commitment to maintain the cap may be terminated only with the approval of the Board of Trustees. Brokerage commissions, stamp duty fees, interest, taxes, acquired fund fees and expenses, and extraordinary expenses are excluded from the cap. Without this cap, the Fund’s returns would have been lower. |
| 4 | The Russell 1000® Growth Index measures the performance of those Russell 1000 Index companies with higher price-to-book ratios and higher forecasted growth values. You cannot invest directly in an index. |
| 5 | The ten largest equity holdings are calculated based on the value of the securities divided by total net assets of the Fund. Holdings are subject to change and may have changed since the date specified. |
| 6 | Amounts are calculated based on the total long-term investments of the Fund. These percentages are subject to change and may have changed since the date specified. |
| | | | |
| 6 | | Wells Fargo Advantage Premier Large Company Growth Fund | | Fund expenses (unaudited) |
As a shareholder of the Fund, you incur two types of costs: (1) transaction costs, including sales charges (loads) on purchase payments and contingent deferred sales charges (if any) on redemptions and (2) ongoing costs, including management fees, distribution (12b-1) and/or shareholder service fees, and other Fund expenses. This example is intended to help you understand your ongoing costs (in dollars) of investing in the Fund and to compare these costs with the ongoing costs of investing in other mutual funds.
The example is based on an investment of $1,000 invested at the beginning of the six-month period and held for the entire period from August 1, 2014 to January 31, 2015.
Actual expenses
The “Actual” line of the table below provides information about actual account values and actual expenses. You may use the information in this line, together with the amount you invested, to estimate the expenses that you paid over the period. Simply divide your account value by $1,000 (for example, an $8,600 account value divided by $1,000 = 8.6), then multiply the result by the number in the “Actual” line under the heading entitled “Expenses paid during period” for your applicable class of shares to estimate the expenses you paid on your account during this period.
Hypothetical example for comparison purposes
The “Hypothetical” line of the table below provides information about hypothetical account values and hypothetical expenses based on the Fund’s actual expense ratio and an assumed rate of return of 5% per year before expenses, which is not the Fund’s actual return. The hypothetical account values and expenses may not be used to estimate the actual ending account balance or expenses you paid for the period. You may use this information to compare the ongoing costs of investing in the Fund and other funds. To do so, compare this 5% hypothetical example with the 5% hypothetical examples that appear in the shareholder reports of the other funds.
Please note that the expenses shown in the table are meant to highlight your ongoing costs only and do not reflect any transactional costs, such as sales charges (loads) and contingent deferred sales charges. Therefore, the “Hypothetical” line of the table is useful in comparing ongoing costs only and will not help you determine the relative total costs of owning different funds. In addition, if these transactional costs were included, your costs would have been higher.
| | | | | | | | | | | | | | | | |
| | | Beginning account value 8-1-2014 | | | Ending account value 1-31-2015 | | | Expenses paid during the period¹ | | | Net annualized expense ratio | |
Class A | | | | | | | | | | | | | | | | |
Actual | | $ | 1,000.00 | | | $ | 1,050.98 | | | $ | 5.79 | | | | 1.12 | % |
Hypothetical (5% return before expenses) | | $ | 1,000.00 | | | $ | 1,019.56 | | | $ | 5.70 | | | | 1.12 | % |
Class B | | | | | | | | | | | | | | | | |
Actual | | $ | 1,000.00 | | | $ | 1,047.40 | | | $ | 9.65 | | | | 1.87 | % |
Hypothetical (5% return before expenses) | | $ | 1,000.00 | | | $ | 1,015.78 | | | $ | 9.50 | | | | 1.87 | % |
Class C | | | | | | | | | | | | | | | | |
Actual | | $ | 1,000.00 | | | $ | 1,047.52 | | | $ | 9.65 | | | | 1.87 | % |
Hypothetical (5% return before expenses) | | $ | 1,000.00 | | | $ | 1,015.78 | | | $ | 9.50 | | | | 1.87 | % |
Class R4 | | | | | | | | | | | | | | | | |
Actual | | $ | 1,000.00 | | | $ | 1,053.01 | | | $ | 4.14 | | | | 0.80 | % |
Hypothetical (5% return before expenses) | | $ | 1,000.00 | | | $ | 1,021.17 | | | $ | 4.08 | | | | 0.80 | % |
Class R6 | | | | | | | | | | | | | | | | |
Actual | | $ | 1,000.00 | | | $ | 1,053.57 | | | $ | 3.36 | | | | 0.65 | % |
Hypothetical (5% return before expenses) | | $ | 1,000.00 | | | $ | 1,021.93 | | | $ | 3.31 | | | | 0.65 | % |
Administrator Class | | | | | | | | | | | | | | | | |
Actual | | $ | 1,000.00 | | | $ | 1,052.06 | | | $ | 4.91 | | | | 0.95 | % |
Hypothetical (5% return before expenses) | | $ | 1,000.00 | | | $ | 1,020.42 | | | $ | 4.84 | | | | 0.95 | % |
Institutional Class | | | | | | | | | | | | | | | | |
Actual | | $ | 1,000.00 | | | $ | 1,053.61 | | | $ | 3.62 | | | | 0.70 | % |
Hypothetical (5% return before expenses) | | $ | 1,000.00 | | | $ | 1,021.68 | | | $ | 3.57 | | | | 0.70 | % |
Investor Class | | | | | | | | | | | | | | | | |
Actual | | $ | 1,000.00 | | | $ | 1,051.15 | | | $ | 6.10 | | | | 1.18 | % |
Hypothetical (5% return before expenses) | | $ | 1,000.00 | | | $ | 1,019.26 | | | $ | 6.01 | | | | 1.18 | % |
| 1 | Expenses paid is equal to the annualized expense ratio of each class multiplied by the average account value over the period, multiplied by the number of days in the most recent fiscal half-year divided by the number of days in the fiscal year (to reflect the one-half-year period). |
| | | | | | |
| Portfolio of investments—January 31, 2015 (unaudited) | | Wells Fargo Advantage Premier Large Company Growth Fund | | | 7 | |
| | | | | | | | | | | | |
| Security name | | | | | | Shares | | | Value | |
| | | | |
Common Stocks: 99.23% | | | | | | | | | | | | |
| | | | |
Consumer Discretionary: 19.94% | | | | | | | | | | | | |
| | | | |
| Auto Components: 1.00% | | | | | | | | | | | | |
BorgWarner Incorporated | | | | | | | 343,260 | | | $ | 18,539,473 | |
Delphi Automotive plc | | | | | | | 507,490 | | | | 34,879,788 | |
| | | | |
| | | | | | | | | | | 53,419,261 | |
| | | | | | | | | | | | |
| | | | |
| Automobiles: 0.15% | | | | | | | | | | | | |
Harley-Davidson Incorporated | | | | | | | 125,500 | | | | 7,743,350 | |
| | | | | | | | | | | | |
| | | | |
| Distributors: 1.41% | | | | | | | | | | | | |
LKQ Corporation † | | | | | | | 2,908,520 | | | | 75,068,901 | |
| | | | | | | | | | | | |
| | | | |
| Hotels, Restaurants & Leisure: 3.95% | | | | | | | | | | | | |
Chipotle Mexican Grill Incorporated † | | | | | | | 111,910 | | | | 79,438,194 | |
Las Vegas Sands Corporation | | | | | | | 153,500 | | | | 8,345,795 | |
Starbucks Corporation | | | | | | | 1,265,440 | | | | 110,763,963 | |
Wynn Resorts Limited | | | | | | | 83,000 | | | | 12,279,850 | |
| | | | |
| | | | | | | | | | | 210,827,802 | |
| | | | | | | | | | | | |
| | | | |
| Internet & Catalog Retail: 1.92% | | | | | | | | | | | | |
Amazon.com Incorporated † | | | | | | | 194,050 | | | | 68,796,547 | |
The Priceline Group Incorporated † | | | | | | | 33,438 | | | | 33,754,992 | |
| | | | |
| | | | | | | | | | | 102,551,539 | |
| | | | | | | | | | | | |
| | | | |
| Media: 2.61% | | | | | | | | | | | | |
Charter Communication Incorporated † | | | | | | | 84,000 | | | | 12,693,660 | |
Comcast Corporation Class A | | | | | | | 763,000 | | | | 40,549,635 | |
The Walt Disney Company | | | | | | | 945,500 | | | | 86,002,680 | |
| | | | |
| | | | | | | | | | | 139,245,975 | |
| | | | | | | | | | | | |
| | | | |
| Multiline Retail: 2.35% | | | | | | | | | | | | |
Dollar Tree Incorporated † | | | | | | | 1,761,610 | | | | 125,250,471 | |
| | | | | | | | | | | | |
| | | | |
| Specialty Retail: 4.67% | | | | | | | | | | | | |
Cabela’s Incorporated † | | | | | | | 294,200 | | | | 16,166,290 | |
CarMax Incorporated † | | | | | | | 1,480,690 | | | | 91,950,849 | |
TJX Companies Incorporated | | | | | | | 695,500 | | | | 45,861,270 | |
Tractor Supply Company | | | | | | | 1,167,380 | | | | 94,756,235 | |
| | | | |
| | | | | | | | | | | 248,734,644 | |
| | | | | | | | | | | | |
| | | | |
| Textiles, Apparel & Luxury Goods: 1.88% | | | | | | | | | | | | |
Nike Incorporated Class B | | | | | | | 456,390 | | | | 42,101,978 | |
Under Armour Incorporated Class A † | | | | | | | 631,220 | | | | 45,498,338 | |
VF Corporation | | | | | | | 185,500 | | | | 12,868,135 | |
| | | | |
| | | | | | | | | | | 100,468,451 | |
| | | | | | | | | | | | |
| | | | |
Consumer Staples: 5.08% | | | | | | | | | | | | |
| | | | |
| Beverages: 0.66% | | | | | | | | | | | | |
The Coca-Cola Company | | | | | | | 855,000 | | | | 35,200,350 | |
| | | | | | | | | | | | |
The accompanying notes are an integral part of these financial statements.
| | | | |
| 8 | | Wells Fargo Advantage Premier Large Company Growth Fund | | Portfolio of investments—January 31, 2015 (unaudited) |
| | | | | | | | | | | | |
| Security name | | | | | | Shares | | | Value | |
| | | | |
| Food & Staples Retailing: 3.24% | | | | | | | | | | | | |
Costco Wholesale Corporation | | | | | | | 449,790 | | | $ | 64,315,472 | |
CVS Health Corporation | | | | | | | 501,500 | | | | 49,227,240 | |
Sprouts Farmers Market Incorporated † | | | | | | | 1,631,832 | | | | 59,415,003 | |
| | | | |
| | | | | | | | | | | 172,957,715 | |
| | | | | | | | | | | | |
| | | | |
| Household Products: 0.51% | | | | | | | | | | | | |
Colgate-Palmolive Company | | | | | | | 398,000 | | | | 26,872,960 | |
| | | | | | | | | | | | |
| | | | |
| Personal Products: 0.67% | | | | | | | | | | | | |
Estee Lauder Companies Incorporated Class A | | | | | | | 507,190 | | | | 35,802,542 | |
| | | | | | | | | | | | |
| | | | |
Energy: 4.25% | | | | | | | | | | | | |
| | | | |
| Energy Equipment & Services: 0.61% | | | | | | | | | | | | |
Schlumberger Limited | | | | | | | 398,970 | | | | 32,871,138 | |
| | | | | | | | | | | | |
| | | | |
| Oil, Gas & Consumable Fuels: 3.64% | | | | | | | | | | | | |
Concho Resources Incorporated † | | | | | | | 861,710 | | | | 95,520,554 | |
EOG Resources Incorporated | | | | | | | 420,000 | | | | 37,392,600 | |
Pioneer Natural Resources Company | | | | | | | 405,570 | | | | 61,050,452 | |
| | | | |
| | | | | | | | | | | 193,963,606 | |
| | | | | | | | | | | | |
| | | | |
Financials: 6.49% | | | | | | | | | | | | |
| | | | |
| Capital Markets: 2.84% | | | | | | | | | | | | |
Ameriprise Financial Incorporated | | | | | | | 464,720 | | | | 58,062,117 | |
TD Ameritrade Holding Corporation | | | | | | | 2,890,000 | | | | 93,607,100 | |
| | | | |
| | | | | | | | | | | 151,669,217 | |
| | | | | | | | | | | | |
| | | | |
| Consumer Finance: 2.79% | | | | | | | | | | | | |
American Express Company | | | | | | | 1,045,700 | | | | 84,377,533 | |
Discover Financial Services | | | | | | | 1,189,390 | | | | 64,679,028 | |
| | | | |
| | | | | | | | | | | 149,056,561 | |
| | | | | | | | | | | | |
| | | | |
| REITs: 0.86% | | | | | | | | | | | | |
American Tower Corporation | | | | | | | 470,500 | | | | 45,614,975 | |
| | | | | | | | | | | | |
| | | | |
Health Care: 19.30% | | | | | | | | | | | | |
| | | | |
| Biotechnology: 10.92% | | | | | | | | | | | | |
Alexion Pharmaceuticals Incorporated † | | | | | | | 850,990 | | | | 155,935,408 | |
Biogen Idec Incorporated † | | | | | | | 298,040 | | | | 115,985,246 | |
BioMarin Pharmaceutical Incorporated † | | | | | | | 266,550 | | | | 25,897,998 | |
Celgene Corporation † | | | | | | | 704,718 | | | | 83,974,197 | |
Gilead Sciences Incorporated † | | | | | | | 710,130 | | | | 74,442,928 | |
Medivation Incorporated † | | | | | | | 326,500 | | | | 35,529,730 | |
Regeneron Pharmaceuticals Incorporated † | | | | | | | 217,630 | | | | 90,677,716 | |
| | | | |
| | | | | | | | | | | 582,443,223 | |
| | | | | | | | | | | | |
| | | | |
| Health Care Equipment & Supplies: 0.96% | | | | | | | | | | | | |
Medtronic plc | | | | | | | 718,902 | | | | 51,329,634 | |
| | | | | | | | | | | | |
The accompanying notes are an integral part of these financial statements.
| | | | | | |
| Portfolio of investments—January 31, 2015 (unaudited) | | Wells Fargo Advantage Premier Large Company Growth Fund | | | 9 | |
| | | | | | | | | | | | |
| Security name | | | | | | Shares | | | Value | |
| | | | |
| Health Care Providers & Services: 2.11% | | | | | | | | | | | | |
AmerisourceBergen Corporation | | | | | | | 682,400 | | | $ | 64,862,120 | |
Envision Healthcare Holdings Incorporated † | | | | | | | 938,204 | | | | 32,255,454 | |
McKesson Corporation | | | | | | | 71,500 | | | | 15,204,475 | |
| | | | |
| | | | | | | | | | | 112,322,049 | |
| | | | | | | | | | | | |
| | | | |
| Health Care Technology: 1.71% | | | | | | | | | | | | |
Cerner Corporation † | | | | | | | 1,375,140 | | | | 91,240,539 | |
| | | | | | | | | | | | |
| | | | |
| Life Sciences Tools & Services: 1.51% | | | | | | | | | | | | |
Mettler-Toledo International Incorporated † | | | | | | | 167,720 | | | | 50,978,494 | |
Quintiles Transnational Holdings Incorporated † | | | | | | | 484,797 | | | | 29,330,219 | |
| | | | |
| | | | | | | | | | | 80,308,713 | |
| | | | | | | | | | | | |
| | | | |
| Pharmaceuticals: 2.09% | | | | | | | | | | | | |
Actavis plc † | | | | | | | 69,000 | | | | 18,391,260 | |
Merck & Company Incorporated | | | | | | | 541,000 | | | | 32,611,480 | |
Perrigo Company plc | | | | | | | 398,380 | | | | 60,450,181 | |
| | | | |
| | | | | | | | | | | 111,452,921 | |
| | | | | | | | | | | | |
| | | | |
Industrials: 13.98% | | | | | | | | | | | | |
| | | | |
| Aerospace & Defense: 1.18% | | | | | | | | | | | | |
The Boeing Company | | | | | | | 203,660 | | | | 29,606,054 | |
United Technologies Corporation | | | | | | | 289,600 | | | | 33,240,288 | |
| | | | |
| | | | | | | | | | | 62,846,342 | |
| | | | | | | | | | | | |
| | | | |
| Air Freight & Logistics: 1.34% | | | | | | | | | | | | |
United Parcel Service Incorporated Class B | | | | | | | 722,640 | | | | 71,425,738 | |
| | | | | | | | | | | | |
| | | | |
| Airlines: 0.81% | | | | | | | | | | | | |
Southwest Airlines Company | | | | | | | 957,160 | | | | 43,244,489 | |
| | | | | | | | | | | | |
| | | | |
| Commercial Services & Supplies: 0.39% | | | | | | | | | | | | |
Tyco International plc | | | | | | | 511,000 | | | | 20,853,910 | |
| | | | | | | | | | | | |
| | | | |
| Electrical Equipment: 0.80% | | | | | | | | | | | | |
Rockwell Automation Incorporated | | | | | | | 391,000 | | | | 42,587,720 | |
| | | | | | | | | | | | |
| | | | |
| Industrial Conglomerates: 0.69% | | | | | | | | | | | | |
Danaher Corporation | | | | | | | 449,230 | | | | 37,007,567 | |
| | | | | | | | | | | | |
| | | | |
| Machinery: 0.35% | | | | | | | | | | | | |
Pentair plc | | | | | | | 300,500 | | | | 18,573,905 | |
| | | | | | | | | | | | |
| | | | |
| Road & Rail: 7.86% | | | | | | | | | | | | |
CSX Corporation | | | | | | | 2,099,500 | �� | | | 69,913,350 | |
Genesee & Wyoming Incorporated Class A † | | | | | | | 317,500 | | | | 26,177,875 | |
Kansas City Southern | | | | | | | 821,900 | | | | 90,482,971 | |
Norfolk Southern Corporation | | | | | | | 778,840 | | | | 79,418,315 | |
Union Pacific Corporation | | | | | | | 1,306,140 | | | | 153,092,669 | |
| | | | |
| | | | | | | | | | | 419,085,180 | |
| | | | | | | | | | | | |
The accompanying notes are an integral part of these financial statements.
| | | | |
| 10 | | Wells Fargo Advantage Premier Large Company Growth Fund | | Portfolio of investments—January 31, 2015 (unaudited) |
| | | | | | | | | | | | |
| Security name | | | | | | Shares | | | Value | |
| | | | |
| Trading Companies & Distributors: 0.56% | | | | | | | | | | | | |
W.W. Grainger Incorporated | | | | | | | 127,500 | | | $ | 30,069,600 | |
| | | | | | | | | | | | |
| | | | |
Information Technology: 26.88% | | | | | | | | | | | | |
| | | | |
| Communications Equipment: 2.15% | | | | | | | | | | | | |
Cisco Systems Incorporated | | | | | | | 1,314,500 | | | | 34,656,793 | |
F5 Networks Incorporated † | | | | | | | 239,000 | | | | 26,677,180 | |
QUALCOMM Incorporated | | | | | | | 853,980 | | | | 53,339,591 | |
| | | | |
| | | | | | | | | | | 114,673,564 | |
| | | | | | | | | | | | |
| | | | |
| Internet Software & Services: 8.28% | | | | | | | | | | | | |
Akamai Technologies Incorporated † | | | | | | | 1,487,210 | | | | 86,488,698 | |
Facebook Incorporated Class A † | | | | | | | 1,479,490 | | | | 112,308,086 | |
Google Incorporated Class A † | | | | | | | 236,720 | | | | 127,248,836 | |
Google Incorporated Class C † | | | | | | | 197,220 | | | | 105,418,034 | |
Pandora Media Incorporated † | | | | | | | 608,500 | | | | 10,101,100 | |
| | | | |
| | | | | | | | | | | 441,564,754 | |
| | | | | | | | | | | | |
| | | | |
| IT Services: 5.96% | | | | | | | | | | | | |
Accenture plc | | | | | | | 659,000 | | | | 55,375,770 | |
Alliance Data Systems Corporation † | | | | | | | 299,780 | | | | 86,585,457 | |
MasterCard Incorporated Class A | | | | | | | 1,155,800 | | | | 94,810,274 | |
Visa Incorporated Class A | | | | | | | 318,740 | | | | 81,250,013 | |
| | | | |
| | | | | | | | | | | 318,021,514 | |
| | | | | | | | | | | | |
| | | | |
| Semiconductors & Semiconductor Equipment: 3.47% | | | | | | | | | | | | |
ARM Holdings plc ADR | | | | | | | 951,000 | | | | 44,544,840 | |
Microchip Technology Incorporated | | | | | | | 2,468,670 | | | | 111,337,017 | |
Texas Instruments Incorporated | | | | | | | 544,000 | | | | 29,076,800 | |
| | | | |
| | | | | | | | | | | 184,958,657 | |
| | | | | | | | | | | | |
| | | | |
| Software: 3.92% | | | | | | | | | | | | |
Adobe Systems Incorporated † | | | | | | | 487,000 | | | | 34,153,310 | |
Microsoft Corporation | | | | | | | 1,070,500 | | | | 43,248,200 | |
Salesforce.com Incorporated † | | | | | | | 815,950 | | | | 46,060,378 | |
ServiceNow Incorporated † | | | | | | | 482,000 | | | | 35,137,800 | |
Splunk Incorporated † | | | | | | | 388,500 | | | | 20,066,025 | |
Tableau Software Incorporated Class A † | | | | | | | 233,000 | | | | 18,817,080 | |
VMware Incorporated † | | | | | | | 145,500 | | | | 11,218,050 | |
| | | | |
| | | | | | | | | | | 208,700,843 | |
| | | | | | | | | | | | |
| | | | |
| Technology Hardware, Storage & Peripherals: 3.10% | | | | | | | | | | | | |
Apple Incorporated | | | | | | | 1,412,160 | | | | 165,448,666 | |
| | | | | | | | | | | | |
| | | | |
Materials: 3.31% | | | | | | | | | | | | |
| | | | |
| Chemicals: 3.31% | | | | | | | | | | | | |
Airgas Incorporated | | | | | | | 168,800 | | | | 19,013,632 | |
Ecolab Incorporated | | | | | | | 321,500 | | | | 33,362,055 | |
Monsanto Company | | | | | | | 260,340 | | | | 30,714,913 | |
The accompanying notes are an integral part of these financial statements.
| | | | | | |
| Portfolio of investments—January 31, 2015 (unaudited) | | Wells Fargo Advantage Premier Large Company Growth Fund | | | 11 | |
| | | | | | | | | | | | | | |
| Security name | | | | | | | Shares | | | Value | |
| | | | |
| Chemicals (continued) | | | | | | | | | | | | | | |
Praxair Incorporated | | | | | | | | | 777,100 | | | $ | 93,710,487 | |
| | | | |
| | | | | | | | | | | | | 176,801,087 | |
| | | | | | | | | | | | | | |
| | | | |
Total Common Stocks (Cost $3,771,862,568) | | | | | | | | | | | | | 5,292,280,073 | |
| | | | | | | | | | | | | | |
| | | | |
| | | Yield | | | | | | | | | |
| | | | |
Short-Term Investments: 1.32% | | | | | | | | | | | | | | |
| | | | |
| Investment Companies: 1.32% | | | | | | | | | | | | | | |
Wells Fargo Advantage Cash Investment Money Market Fund, Select Class (l)(u) | | | 0.10 | % | | | | | 70,168,079 | | | | 70,168,079 | |
| | | | | | | | | | | | | | |
| | | | |
Total Short-Term Investments (Cost $70,168,079) | | | | | | | | | | | | | 70,168,079 | |
| | | | | | | | | | | | | | |
| | | | | | | | |
| Total investments in securities (Cost $3,842,030,647) * | | | 100.55 | % | | | 5,362,448,152 | |
Other assets and liabilities, net | | | (0.55 | ) | | | (29,124,605 | ) |
| | | | | | | | |
| Total net assets | | | 100.00 | % | | $ | 5,333,323,547 | |
| | | | | | | | |
| † | Non-income-earning security |
| (l) | The security represents an affiliate of the Fund as defined in the Investment Company Act of 1940. |
| (u) | The rate represents the 7-day annualized yield at period end. |
| * | Cost for federal income tax purposes is $3,850,130,635 and unrealized gains (losses) consists of: |
| | | | |
Gross unrealized gains | | $ | 1,563,430,162 | |
Gross unrealized losses | | | (51,112,645 | ) |
| | | | |
Net unrealized gains | | $ | 1,512,317,517 | |
The accompanying notes are an integral part of these financial statements.
| | | | |
| 12 | | Wells Fargo Advantage Premier Large Company Growth Fund | | Statement of assets and liabilities—January 31, 2015 (unaudited) |
| | | | |
| | | | |
| |
Assets | | | | |
Investments | | | | |
In unaffiliated securities, at value (cost $3,771,862,568) | | $ | 5,292,280,073 | |
In affiliated securities, at value (cost $70,168,079) | | | 70,168,079 | |
| | | | |
Total investments, at value (cost $3,842,030,647) | | | 5,362,448,152 | |
Receivable for investments sold | | | 14,418,257 | |
Receivable for Fund shares sold | | | 8,060,852 | |
Receivable for dividends | | | 1,141,982 | |
Receivable for securities lending income | | | 885 | |
Prepaid expenses and other assets | | | 209,080 | |
| | | | |
Total assets | | | 5,386,279,208 | |
| | | | |
| |
Liabilities | | | | |
Payable for investments purchased | | | 38,859,686 | |
Payable for Fund shares redeemed | | | 9,221,729 | |
Advisory fee payable | | | 2,560,344 | |
Distribution fees payable | | | 256,118 | |
Administration fees payable | | | 1,076,571 | |
Accrued expenses and other liabilities | | | 981,213 | |
| | | | |
Total liabilities | | | 52,955,661 | |
| | | | |
Total net assets | | $ | 5,333,323,547 | |
| | | | |
| |
NET ASSETS CONSIST OF | | | | |
Paid-in capital | | $ | 3,773,898,660 | |
Accumulated net investment loss | | | (14,635,574 | ) |
Accumulated net realized gains on investments | | | 53,642,956 | |
Net unrealized gains on investments | | | 1,520,417,505 | |
| | | | |
Total net assets | | $ | 5,333,323,547 | |
| | | | |
| |
COMPUTATION OF NET ASSET VALUE AND OFFERING PRICE PER SHARE | | | | |
Net assets – Class A | | $ | 2,190,121,708 | |
Shares outstanding – Class A1 | | | 145,225,988 | |
Net asset value per share – Class A | | | $15.08 | |
Maximum offering price per share – Class A2 | | | $16.00 | |
Net assets – Class B | | $ | 3,052,830 | |
Shares outstanding – Class B1 | | | 229,532 | |
Net asset value per share – Class B | | | $13.30 | |
Net assets – Class C | | $ | 384,091,129 | |
Shares outstanding – Class C1 | | | 28,948,438 | |
Net asset value per share – Class C | | | $13.27 | |
Net assets – Class R4 | | $ | 1,941,985 | |
Share outstanding – Class R41 | | | 126,802 | |
Net asset value per share – Class R4 | | | $15.32 | |
Net assets – Class R6 | | $ | 167,740,988 | |
Shares outstanding – Class R61 | | | 10,923,056 | |
Net asset value per share – Class R6 | | | $15.36 | |
Net assets – Administrator Class | | $ | 1,247,214,841 | |
Shares outstanding – Administrator Class1 | | | 82,144,618 | |
Net asset value per share – Administrator Class | | | $15.18 | |
Net assets – Institutional Class | | $ | 1,142,892,655 | |
Shares outstanding – Institutional Class1 | | | 74,446,272 | |
Net asset value per share – Institutional Class | | | $15.35 | |
Net assets – Investor Class | | $ | 196,267,411 | |
Shares outstanding – Investor Class1 | | | 13,061,208 | |
Net asset value per share – Investor Class | | | $15.03 | |
| 1 | The Fund has an unlimited number of authorized shares. |
| 2 | Maximum offering price is computed as 100/94.25 of net asset value. On investments of $50,000 or more, the offering price is reduced. |
The accompanying notes are an integral part of these financial statements.
| | | | | | |
| Statement of operations—six months ended January 31, 2015 (unaudited) | | Wells Fargo Advantage Premier Large Company Growth Fund | | | 13 | |
| | | | |
| | | | |
| |
Investment income | | | | |
Dividends | | $ | 21,521,703 | |
Securities lending income, net | | | 79,894 | |
Income from affiliated securities | | | 32,883 | |
| | | | |
Total investment income | | | 21,634,480 | |
| | | | |
| |
Expenses | | | | |
Advisory fee | | | 15,292,271 | |
Administration fees | | | | |
Fund level | | | 1,295,463 | |
Class A | | | 2,544,334 | |
Class B | | | 4,722 | |
Class C | | | 506,333 | |
Class R4 | | | 758 | |
Class R6 | | | 25,425 | |
Administrator Class | | | 667,563 | |
Institutional Class | | | 462,955 | |
Investor Class | | | 321,664 | |
Shareholder servicing fees | | | | |
Class A | | | 2,446,475 | |
Class B | | | 4,540 | |
Class C | | | 486,859 | |
Class R4 | | | 948 | |
Administrator Class | | | 1,668,672 | |
Investor Class | | | 249,685 | |
Distribution fees | | | | |
Class B | | | 13,621 | |
Class C | | | 1,460,575 | |
Custody and accounting fees | | | 134,492 | |
Professional fees | | | 28,684 | |
Registration fees | | | 138,565 | |
Shareholder report expenses | | | 146,276 | |
Trustees’ fees and expenses | | | 6,680 | |
Other fees and expenses | | | 39,581 | |
| | | | |
Total expenses | | | 27,947,141 | |
Less: Fee waivers and/or expense reimbursements | | | (1,173,977 | ) |
| | | | |
Net expenses | | | 26,773,164 | |
| | | | |
Net investment loss | | | (5,138,684 | ) |
| | | | |
| |
REALIZED AND UNREALIZED GAINS (LOSSES) ON INVESTMENTS | | | | |
Net realized gains on investments | | | 104,835,225 | |
Net change in unrealized gains (losses) on investments | | | 148,301,187 | |
| | | | |
Net realized and unrealized gains (losses) on investments | | | 253,136,412 | |
| | | | |
Net increase in net assets resulting from operations | | $ | 247,997,728 | |
| | | | |
The accompanying notes are an integral part of these financial statements.
| | | | |
| 14 | | Wells Fargo Advantage Premier Large Company Growth Fund | | Statement of changes in net assets |
| | | | | | | | | | | | | | | | |
| | | Six months ended
January 31, 2015
(unaudited) | | | Year ended
July 31, 2014 | |
| | | | |
Operations | | | | | | | | | | | | | | | | |
Net investment loss | | | | | | $ | (5,138,684 | ) | | | | | | $ | (12,002,037 | ) |
Net realized gains on investments | | | | | | | 104,835,225 | | | | | | | | 131,365,067 | |
Net change in unrealized gains (losses) on investments | | | | | | | 148,301,187 | | | | | | | | 546,350,666 | |
| | | | |
Net increase in net assets resulting from operations | | | | | | | 247,997,728 | | | | | | | | 665,713,696 | |
| | | | |
| | | | |
Distributions to shareholders from | | | | | | | | | | | | | | | | |
Net realized gains | | | | | | | | | | | | | | | | |
Class A | | | | | | | (25,289,106 | ) | | | | | | | 0 | |
Class B | | | | | | | (52,310 | ) | | | | | | | 0 | |
Class C | | | | | | | (6,075,432 | ) | | | | | | | 0 | |
Class R4 | | | | | | | (26,355 | ) | | | | | | | 0 | |
Class R6 | | | | | | | (2,294,051 | ) | | | | | | | 0 | |
Administrator Class | | | | | | | (17,637,288 | ) | | | | | | | 0 | |
Institutional Class | | | | | | | (16,043,030 | ) | | | | | | | 0 | |
Investor Class | | | | | | | (2,767,968 | ) | | | | | | | 0 | |
| | | | |
Total distributions to shareholders | | | | | | | (70,185,540 | ) | | | | | | | 0 | |
| | | | |
| | | | |
Capital share transactions | | | Shares | | | | | | | | Shares | | | | | |
Proceeds from shares sold | | | | | | | | | | | | | | | | |
Class A | | | 35,775,212 | | | | 547,451,380 | | | | 42,606,662 | | | | 593,794,550 | |
Class B | | | 2,687 | | | | 36,087 | | | | 27,890 | | | | 341,694 | |
Class C | | | 2,623,691 | | | | 34,607,200 | | | | 8,601,633 | | | | 106,017,995 | |
Class R4 | | | 80,669 | | | | 1,190,605 | | | | 41,808 | | | | 609,423 | |
Class R6 | | | 693,194 | | | | 10,632,813 | | | | 12,608,190 | | | | 170,307,516 | |
Administrator Class | | | 7,240,800 | | | | 108,938,135 | | | | 73,161,085 | | | | 1,038,797,296 | |
Institutional Class | | | 13,243,603 | | | | 202,094,097 | | | | 34,278,958 | | | | 482,686,241 | |
Investor Class | | | 761,110 | | | | 11,400,247 | | | | 3,565,063 | | | | 49,308,160 | |
| | | | |
| | | | | | | 916,350,564 | | | | | | | | 2,441,862,875 | |
| | | | |
Reinvestment of distributions | | | | | | | | | | | | | | | | |
Class A | | | 1,553,406 | | | | 23,409,833 | | | | 0 | | | | 0 | |
Class B | | | 3,219 | | | | 42,848 | | | | 0 | | | | 0 | |
Class C | | | 333,914 | | | | 4,431,032 | | | | 0 | | | | 0 | |
Class R4 | | | 1,723 | | | | 26,355 | | | | 0 | | | | 0 | |
Class R6 | | | 141,898 | | | | 2,176,712 | | | | 0 | | | | 0 | |
Administrator Class | | | 1,033,233 | | | | 15,674,143 | | | | 0 | | | | 0 | |
Institutional Class | | | 854,381 | | | | 13,097,664 | | | | 0 | | | | 0 | |
Investor Class | | | 181,619 | | | | 2,727,921 | | | | 0 | | | | 0 | |
| | | | |
| | | | | | | 61,586,508 | | | | | | | | 0 | |
| | | | |
Payment for shares redeemed | | | | | | | | | | | | | | | | |
Class A | | | (23,290,400 | ) | | | (349,846,800 | ) | | | (32,025,660 | ) | | | (452,294,693 | ) |
Class B | | | (86,438 | ) | | | (1,146,179 | ) | | | (219,715 | ) | | | (2,727,974 | ) |
Class C | | | (3,075,145 | ) | | | (40,621,579 | ) | | | (4,454,199 | ) | | | (55,420,848 | ) |
Class R4 | | | (7,456 | ) | | | (114,286 | ) | | | (265 | ) | | | (3,714 | ) |
Class R6 | | | (1,003,245 | ) | | | (15,362,384 | ) | | | (1,881,186 | ) | | | (26,918,328 | ) |
Administrator Class | | | (16,739,721 | ) | | | (254,451,681 | ) | | | (33,287,121 | ) | | | (466,226,494 | ) |
Institutional Class | | | (9,499,986 | ) | | | (145,007,130 | ) | | | (69,016,664 | ) | | | (995,396,571 | ) |
Investor Class | | | (1,526,463 | ) | | | (22,807,794 | ) | | | (2,225,843 | ) | | | (30,843,706 | ) |
| | | | |
| | | | | | | (829,357,833 | ) | | | | | | | (2,029,832,328 | ) |
| | | | |
Net increase in net assets resulting from capital share transactions | | | | | | | 148,579,239 | | | | | | | | 412,030,547 | |
| | | | |
Total increase in net assets | | | | | | | 326,391,427 | | | | | | | | 1,077,744,243 | |
| | | | |
| | | | |
Net assets | | | | | | | | | | | | | | | | |
Beginning of period | | | | | | | 5,006,932,120 | | | | | | | | 3,929,187,877 | |
| | | | |
End of period | | | | | | $ | 5,333,323,547 | | | | | | | $ | 5,006,932,120 | |
| | | | |
Accumulated net investment loss | | | | | | $ | (14,635,574 | ) | | | | | | $ | (9,496,890 | ) |
| | | | |
The accompanying notes are an integral part of these financial statements.
| | | | | | |
| Financial highlights | | Wells Fargo Advantage Premier Large Company Growth Fund | | | 15 | |
(For a share outstanding throughout each period)
| | | | | | | | | | | | | | | | | | | | | | | | | | | | |
| | | Six months ended
January 31, 2015 (unaudited) | | | Year ended July 31 | | | Year ended September 30, 20091 | |
| CLASS A | | | 2014 | | | 2013 | | | 2012 | | | 2011 | | | 20101,2 | | |
Net asset value, beginning of period | | | $14.55 | | | | $12.57 | | | | $10.21 | | | | $9.89 | | | | $7.75 | | | | $7.23 | | | | $7.20 | |
Net investment income (loss) | | | (0.02 | ) | | | (0.05 | ) | | | (0.02 | ) | | | (0.03 | )3 | | | (0.01 | ) | | | 0.00 | 3,4 | | | 0.05 | 3 |
Net realized and unrealized gains (losses) on investments | | | 0.76 | | | | 2.03 | | | | 2.38 | | | | 0.60 | | | | 2.15 | | | | 0.57 | | | | 0.02 | |
| | | | | | | | | | | | | | | | | | | | | | | | | | | | |
Total from investment operations | | | 0.74 | | | | 1.98 | | | | 2.36 | | | | 0.57 | | | | 2.14 | | | | 0.57 | | | | 0.07 | |
Distributions to shareholders from | | | | | | | | | | | | | | | | | | | | | | | | | | | | |
Net investment income | | | 0.00 | | | | 0.00 | | | | 0.00 | | | | 0.00 | | | | (0.00 | )4 | | | (0.05 | ) | | | (0.04 | ) |
Net realized gains | | | (0.21 | ) | | | 0.00 | | | | 0.00 | | | | (0.25 | ) | | | 0.00 | | | | 0.00 | | | | 0.00 | |
| | | | | | | | | | | | | | | | | | | | | | | | | | | | |
Total distributions to shareholders | | | (0.21 | ) | | | 0.00 | | | | 0.00 | | | | (0.25 | ) | | | (0.00 | )4 | | | (0.05 | ) | | | (0.04 | ) |
Net asset value, end of period | | | $15.08 | | | | $14.55 | | | | $12.57 | | | | $10.21 | | | | $9.89 | | | | $7.75 | | | | $7.23 | |
Total return5 | | | 5.10 | % | | | 15.75 | % | | | 23.11 | % | | | 6.08 | % | | | 27.55 | % | | | 7.93 | % | | | 1.04 | % |
Ratios to average net assets (annualized) | | | | | | | | | | | | | | | | | | | | | | | | | |
Gross expenses | | | 1.17 | % | | | 1.17 | % | | | 1.19 | % | | | 1.23 | % | | | 1.24 | % | | | 1.09 | % | | | 1.12 | % |
Net expenses | | | 1.12 | % | | | 1.12 | % | | | 1.12 | % | | | 1.12 | % | | | 1.12 | % | | | 1.08 | % | | | 1.12 | % |
Net investment income (loss) | | | (0.30 | )% | | | (0.36 | )% | | | (0.15 | )% | | | (0.30 | )% | | | (0.13 | )% | | | 0.06 | % | | | 0.86 | % |
Supplemental data | | | | | | | | | | | | | | | | | | | | | | | | | | | | |
Portfolio turnover rate | | | 25 | % | | | 37 | % | | | 32 | % | | | 51 | % | | | 65 | % | | | 89 | % | | | 24 | % |
Net assets, end of period (000s omitted) | | | $2,190,122 | | | | $1,908,455 | | | | $1,515,862 | | | | $932,106 | | | | $620,262 | | | | $491,290 | | | | $268,422 | |
| 1 | After the close of business on July 16, 2010, the Fund acquired the net assets of Evergreen Large Company Growth Fund and Wells Fargo Advantage Large Company Growth Fund. Evergreen Large Company Growth Fund became the accounting and performance survivor in the transaction. The information for the periods prior to July 19, 2010 is that of Class A of Evergreen Large Company Growth Fund. |
| 2 | For the ten months ended July 31, 2010. The Fund changed its fiscal year end from September 30 to July 31, effective July 31, 2010. |
| 3 | Calculated based upon average shares outstanding |
| 4 | Amount is less than $0.005. |
| 5 | Total return calculations do not include any sales charges. Returns for periods of less than one year are not annualized. |
The accompanying notes are an integral part of these financial statements.
| | | | |
| 16 | | Wells Fargo Advantage Premier Large Company Growth Fund | | Financial highlights |
(For a share outstanding throughout each period)
| | | | | | | | | | | | | | | | | | | | | | | | | | | | |
| | | Six months ended
January 31, 2015 (unaudited) | | | Year ended July 31 | | | Year ended September 30, 20091 | |
| CLASS B | | | 2014 | | | 2013 | | | 2012 | | | 2011 | | | 20101,2 | | |
Net asset value, beginning of period | | | $12.90 | | | | $11.23 | | | | $9.19 | | | | $8.99 | | | | $7.10 | | | | $6.62 | | | | $6.60 | |
Net investment income (loss) | | | (0.07 | )3 | | | (0.13 | )3 | | | (0.09 | )3 | | | (0.09 | )3 | | | (0.07 | )3 | | | (0.04 | )3 | | | 0.01 | 3 |
Net realized and unrealized gains (losses)
on investments | | | 0.68 | | | | 1.80 | | | | 2.13 | | | | 0.54 | | | | 1.96 | | | | 0.52 | | | | 0.01 | |
| | | | | | | | | | | | | | | | | | | | | | | | | | | | |
Total from investment operations | | | 0.61 | | | | 1.67 | | | | 2.04 | | | | 0.45 | | | | 1.89 | | | | 0.48 | | | | 0.02 | |
Distributions to shareholders from | | | | | | | | | | | | | | | | | | | | | | | | | | | | |
Net realized gains | | | (0.21 | ) | | | 0.00 | | | | 0.00 | | | | (0.25 | ) | | | 0.00 | | | | 0.00 | | | | 0.00 | |
Net asset value, end of period | | | $13.30 | | | | $12.90 | | | | $11.23 | | | | $9.19 | | | | $8.99 | | | | $7.10 | | | | $6.62 | |
Total return4 | | | 4.74 | % | | | 14.87 | % | | | 22.20 | % | | | 5.22 | % | | | 26.62 | % | | | 7.25 | % | | | 0.30 | % |
Ratios to average net assets (annualized) | | | | | | | | | | | | | | | | | | | | | | | | | |
Gross expenses | | | 1.91 | % | | | 1.91 | % | | | 1.94 | % | | | 1.97 | % | | | 2.00 | % | | | 1.84 | % | | | 1.87 | % |
Net expenses | | | 1.87 | % | | | 1.87 | % | | | 1.87 | % | | | 1.87 | % | | | 1.87 | % | | | 1.83 | % | | | 1.87 | % |
Net investment income (loss) | | | (1.02 | )% | | | (1.09 | )% | | | (0.87 | )% | | | (1.04 | )% | | | (0.85 | )% | | | (0.69 | )% | | | 0.11 | % |
Supplemental data | | | | | | | | | | | | | | | | | | | | | | | | | | | | |
Portfolio turnover rate | | | 25 | % | | | 37 | % | | | 32 | % | | | 51 | % | | | 65 | % | | | 89 | % | | | 24 | % |
Net assets, end of period (000s omitted) | | | $3,053 | | | | $4,001 | | | | $5,637 | | | | $6,962 | | | | $10,244 | | | | $13,957 | | | | $7,951 | |
| 1 | After the close of business on July 16, 2010, the Fund acquired the net assets of Evergreen Large Company Growth Fund and Wells Fargo Advantage Large Company Growth Fund. Evergreen Large Company Growth Fund became the accounting and performance survivor in the transaction. The information for the periods prior to July 19, 2010 is that of Class B of Evergreen Large Company Growth Fund. |
| 2 | For the ten months ended July 31, 2010. The Fund changed its fiscal year end from September 30 to July 31, effective July 31, 2010. |
| 3 | Calculated based upon average shares outstanding |
| 4 | Total return calculations do not include any sales charges. Returns for periods of less than one year are not annualized. |
The accompanying notes are an integral part of these financial statements.
| | | | | | |
| Financial highlights | | Wells Fargo Advantage Premier Large Company Growth Fund | | | 17 | |
(For a share outstanding throughout each period)
| | | | | | | | | | | | | | | | | | | | | | | | | | | | |
| | | Six months ended
January 31, 2015 (unaudited) | | | Year ended July 31 | | | Year ended September 30, 20091 | |
| CLASS C | | | 2014 | | | 2013 | | | 2012 | | | 2011 | | | 20101,2 | | |
Net asset value, beginning of period | | | $12.87 | | | | $11.20 | | | | $9.17 | | | | $8.97 | | | | $7.08 | | | | $6.62 | | | | $6.59 | |
Net investment income (loss) | | | (0.07 | ) | | | (0.14 | )3 | | | (0.09 | )3 | | | (0.10 | )3 | | | (0.08 | )3 | | | (0.04 | )3 | | | 0.00 | 3,4 |
Net realized and unrealized gains (losses) on investments | | | 0.68 | | | | 1.81 | | | | 2.12 | | | | 0.55 | | | | 1.97 | | | | 0.52 | | | | 0.03 | |
| | | | | | | | | | | | | | | | | | | | | | | | | | | | |
Total from investment operations | | | 0.61 | | | | 1.67 | | | | 2.03 | | | | 0.45 | | | | 1.89 | | | | 0.48 | | | | 0.03 | |
Distributions to shareholders from | | | | | | | | | | | | | | | | | | | | | | | | | | | | |
Net investment income | | | 0.00 | | | | 0.00 | | | | 0.00 | | | | 0.00 | | | | 0.00 | | | | (0.02 | ) | | | 0.00 | |
Net realized gains | | | (0.21 | ) | | | 0.00 | | | | 0.00 | | | | (0.25 | ) | | | 0.00 | | | | 0.00 | | | | 0.00 | |
| | | | | | | | | | | | | | | | | | | | | | | | | | | | |
Total distributions to shareholders | | | (0.21 | ) | | | 0.00 | | | | 0.00 | | | | (0.25 | ) | | | 0.00 | | | | (0.02 | ) | | | 0.00 | |
Net asset value, end of period | | | $13.27 | | | | $12.87 | | | | $11.20 | | | | $9.17 | | | | $8.97 | | | | $7.08 | | | | $6.62 | |
Total return5 | | | 4.75 | % | | | 14.91 | % | | | 22.14 | % | | | 5.24 | % | | | 26.69 | % | | | 7.18 | % | | | 0.46 | % |
Ratios to average net assets (annualized) | | | | | | | | | | | | | | | | | | | | | | | | | |
Gross expenses | | | 1.92 | % | | | 1.92 | % | | | 1.94 | % | | | 1.98 | % | | | 1.99 | % | | | 1.84 | % | | | 1.87 | % |
Net expenses | | | 1.87 | % | | | 1.87 | % | | | 1.87 | % | | | 1.87 | % | | | 1.87 | % | | | 1.83 | % | | | 1.87 | % |
Net investment income (loss) | | | (1.04 | )% | | | (1.11 | )% | | | (0.91 | )% | | | (1.07 | )% | | | (0.90 | )% | | | (0.68 | )% | | | 0.08 | % |
Supplemental data | | | | | | | | | | | | | | | | | �� | | | | | | | | | | | |
Portfolio turnover rate | | | 25 | % | | | 37 | % | | | 32 | % | | | 51 | % | | | 65 | % | | | 89 | % | | | 24 | % |
Net assets, end of period (000s omitted) | | | $384,091 | | | | $374,136 | | | | $279,203 | | | | $129,980 | | | | $35,783 | | | | $22,246 | | | | $13,717 | |
| 1 | After the close of business on July 16, 2010, the Fund acquired the net assets of Evergreen Large Company Growth Fund and Wells Fargo Advantage Large Company Growth Fund. Evergreen Large Company Growth Fund became the accounting and performance survivor in the transaction. The information for the periods prior to July 19, 2010 is that of Class C of Evergreen Large Company Growth Fund. |
| 2 | For the ten months ended July 31, 2010. The Fund changed its fiscal year end from September 30 to July 31, effective July 31, 2010. |
| 3 | Calculated based upon average shares outstanding |
| 4 | Amount is less than $0.005. |
| 5 | Total return calculations do not include any sales charges. Returns for periods of less than one year are not annualized. |
The accompanying notes are an integral part of these financial statements.
| | | | |
| 18 | | Wells Fargo Advantage Premier Large Company Growth Fund | | Financial highlights |
(For a share outstanding throughout each period)
| | | | | | | | | | | | |
| | | Six months ended
January 31, 2015 (unaudited) | | | Year ended July 31 | |
| CLASS R4 | | | 2014 | | | 20131 | |
Net asset value, beginning of period | | | $14.75 | | | | $12.70 | | | | $10.81 | |
Net investment income (loss) | | | 0.00 | 2 | | | (0.01 | ) | | | 0.00 | 2 |
Net realized and unrealized gains (losses) on investments | | | 0.78 | | | | 2.06 | | | | 1.89 | |
| | | | | | | | | | | | |
Total from investment operations | | | 0.78 | | | | 2.05 | | | | 1.89 | |
Distributions to shareholders from | | | | | | | | | | | | |
Net realized gains | | | (0.21 | ) | | | 0.00 | | | | 0.00 | |
Net asset value, end of period | | | $15.32 | | | | $14.75 | | | | $12.70 | |
Total return3 | | | 5.30 | % | | | 16.14 | % | | | 17.48 | % |
Ratios to average net assets (annualized) | | | | | | | | | | | | |
Gross expenses | | | 0.84 | % | | | 0.84 | % | | | 0.85 | % |
Net expenses | | | 0.80 | % | | | 0.80 | % | | | 0.80 | % |
Net investment income (loss) | | | 0.02 | % | | | (0.11 | )% | | | 0.06 | % |
Supplemental data | | | | | | | | | | | | |
Portfolio turnover rate | | | 25 | % | | | 37 | % | | | 32 | % |
Net assets, end of period (000s omitted) | | | $1,942 | | | | $765 | | | | $131 | |
| 1 | For the period from November 30, 2012 (commencement of class operations) to July 31, 2013 |
| 2 | Amount is less than $0.005. |
| 3 | Returns for periods of less than one year are not annualized. |
The accompanying notes are an integral part of these financial statements.
| | | | | | |
| Financial highlights | | Wells Fargo Advantage Premier Large Company Growth Fund | | | 19 | |
(For a share outstanding throughout each period)
| | | | | | | | | | | | |
| | | Six months ended
January 31, 2015 (unaudited) | | | Year ended July 31 | |
| CLASS R6 | | | 2014 | | | 20131 | |
Net asset value, beginning of period | | | $14.77 | | | | $12.71 | | | | $10.81 | |
Net investment income | | | 0.01 | | | | 0.01 | | | | 0.00 | 2 |
Net realized and unrealized gains (losses) on investments | | | 0.79 | | | | 2.05 | | | | 1.90 | |
| | | | | | | | | | | | |
Total from investment operations | | | 0.80 | | | | 2.06 | | | | 1.90 | |
Distributions to shareholders from | | | | | | | | | | | | |
Net realized gains | | | (0.21 | ) | | | 0.00 | | | | 0.00 | |
Net asset value, end of period | | | $15.36 | | | | $14.77 | | | | $12.71 | |
Total return3 | | | 5.36 | % | | | 16.29 | % | | | 17.58 | % |
Ratios to average net assets (annualized) | | | | | | | | | | | | |
Gross expenses | | | 0.69 | % | | | 0.69 | % | | | 0.71 | % |
Net expenses | | | 0.65 | % | | | 0.65 | % | | | 0.65 | % |
Net investment income | | | 0.19 | % | | | 0.09 | % | | | 0.05 | % |
Supplemental data | | | | | | | | | | | | |
Portfolio turnover rate | | | 25 | % | | | 37 | % | | | 32 | % |
Net assets, end of period (000s omitted) | | | $167,741 | | | | $163,871 | | | | $4,629 | |
| 1 | For the period from November 30, 2012 (commencement of class operations) to July 31, 2013 |
| 2 | Amount is less than $0.005. |
| 3 | Returns for periods of less than one year are not annualized. |
The accompanying notes are an integral part of these financial statements.
| | | | |
| 20 | | Wells Fargo Advantage Premier Large Company Growth Fund | | Financial highlights |
(For a share outstanding throughout each period)
| | | | | | | | | | | | | | | | | | | | | | | | |
| | | Six months ended
January 31, 2015 (unaudited) | | | Year ended July 31 | |
| ADMINISTRATOR CLASS | | | 2014 | | | 2013 | | | 2012 | | | 2011 | | | 20101 | |
Net asset value, beginning of period | | | $14.63 | | | | $12.62 | | | | $10.24 | | | | $9.90 | | | | $7.75 | | | | $7.53 | |
Net investment income (loss) | | | (0.01 | ) | | | (0.02 | ) | | | (0.00 | )2 | | | (0.02 | ) | | | 0.00 | 2 | | | (0.00 | )2 |
Net realized and unrealized gains (losses) on investments | | | 0.77 | | | | 2.03 | | | | 2.38 | | | | 0.61 | | | | 2.16 | | | | 0.22 | |
| | | | | | | | | | | | | | | | | | | | | | | | |
Total from investment operations | | | 0.76 | | | | 2.01 | | | | 2.38 | | | | 0.59 | | | | 2.16 | | | | 0.22 | |
Distributions to shareholders from | | | | | | | | | | | | | | | | | | | | | | | | |
Net investment income | | | 0.00 | | | | 0.00 | | | | 0.00 | | | | 0.00 | | | | (0.01 | ) | | | 0.00 | |
Net realized gains | | | (0.21 | ) | | | 0.00 | | | | 0.00 | | | | (0.25 | ) | | | 0.00 | | | | 0.00 | |
| | | | | | | | | | | | | | | | | | | | | | | | |
Total distributions to shareholders | | | (0.21 | ) | | | 0.00 | | | | 0.00 | | | | (0.25 | ) | | | (0.01 | ) | | | 0.00 | |
Net asset value, end of period | | | $15.18 | | | | $14.63 | | | | $12.62 | | | | $10.24 | | | | $9.90 | | | | $7.75 | |
Total return3 | | | 5.21 | % | | | 15.93 | % | | | 23.24 | % | | | 6.28 | % | | | 27.75 | % | | | 2.92 | % |
Ratios to average net assets (annualized) | | | | | | | | | | | | | | | | | | | | | | | | |
Gross expenses | | | 1.00 | % | | | 1.00 | % | | | 1.04 | % | | | 1.07 | % | | | 1.08 | % | | | 1.13 | % |
Net expenses | | | 0.95 | % | | | 0.95 | % | | | 0.95 | % | | | 0.95 | % | | | 0.95 | % | | | 0.95 | % |
Net investment income (loss) | | | (0.11 | )% | | | (0.19 | )% | | | (0.01 | )% | | | (0.16 | )% | | | 0.01 | % | | | (0.34 | )% |
Supplemental data | | | | | | | | | | | | | | | | | | | | | | | | |
Portfolio turnover rate | | | 25 | % | | | 37 | % | | | 32 | % | | | 51 | % | | | 65 | % | | | 89 | % |
Net assets, end of period (000s omitted) | | | $1,247,215 | | | | $1,325,864 | | | | $640,494 | | | | $251,759 | | | | $54,335 | | | | $36,508 | |
| 1 | For the period from July 16, 2010 (commencement of class operations) to July 31, 2010 |
| 2 | Amount is less than $0.005. |
| 3 | Returns for periods of less than one year are not annualized. |
The accompanying notes are an integral part of these financial statements.
| | | | | | |
| Financial highlights | | Wells Fargo Advantage Premier Large Company Growth Fund | | | 21 | |
(For a share outstanding throughout each period)
| | | | | | | | | | | | | | | | | | | | | | | | | | | | |
| | | Six months ended
January 31, 2015 (unaudited) | | | Year ended July 31 | | | Year ended September 30, 20091 | |
| INSTITUTIONAL CLASS | | | 2014 | | | 2013 | | | 2012 | | | 2011 | | | 20101,2 | | |
Net asset value, beginning of period | | | $14.77 | | | | $12.71 | | | | $10.28 | | | | $9.91 | | | | $7.75 | | | | $7.24 | | | | $7.22 | |
Net investment income | | | 0.01 | | | | 0.01 | 4 | | | (0.00 | )3 | | | 0.00 | 3,4 | | | 0.02 | 4 | | | 0.02 | | | | 0.06 | 4 |
Net realized and unrealized gains (losses) on investments | | | 0.78 | | | | 2.05 | | | | 2.43 | | | | 0.62 | | | | 2.15 | | | | 0.57 | | | | 0.02 | |
| | | | | | | | | | | | | | | | | | | | | | | | | | | | |
Total from investment operations | | | 0.79 | | | | 2.06 | | | | 2.43 | | | | 0.62 | | | | 2.17 | | | | 0.59 | | | | 0.08 | |
Distributions to shareholders from | | | | | | | | | | | | | | | | | | | | | | | | | | | | |
Net investment income | | | 0.00 | | | | 0.00 | | | | 0.00 | | | | 0.00 | | | | (0.01 | ) | | | (0.08 | ) | | | (0.06 | ) |
Net realized gains | | | (0.21 | ) | | | 0.00 | | | | 0.00 | | | | (0.25 | ) | | | 0.00 | | | | 0.00 | | | | 0.00 | |
| | | | | | | | | | | | | | | | | | | | | | | | | | | | |
Total distributions to shareholders | | | (0.21 | ) | | | 0.00 | | | | 0.00 | | | | (0.25 | ) | | | (0.01 | ) | | | (0.08 | ) | | | (0.06 | ) |
Net asset value, end of period | | | $15.35 | | | | $14.77 | | | | $12.71 | | | | $10.28 | | | | $9.91 | | | | $7.75 | | | | $7.24 | |
Total return5 | | | 5.36 | % | | | 16.21 | % | | | 23.64 | % | | | 6.48 | % | | | 28.03 | % | | | 8.20 | % | | | 1.28 | % |
Ratios to average net assets (annualized) | | | | | | | | | | | | | | | | | | | | | | | | | |
Gross expenses | | | 0.74 | % | | | 0.74 | % | | | 0.76 | % | | | 0.79 | % | | | 0.81 | % | | | 0.83 | % | | | 0.87 | % |
Net expenses | | | 0.70 | % | | | 0.70 | % | | | 0.71 | % | | | 0.75 | % | | | 0.75 | % | | | 0.82 | % | | | 0.87 | % |
Net investment income | | | 0.13 | % | | | 0.07 | % | | | 0.16 | % | | | 0.04 | % | | | 0.22 | % | | | 0.34 | % | | | 1.04 | % |
Supplemental data | | | | | | | | | | | | | | | | | | | | | | | | | | | | |
Portfolio turnover rate | | | 25 | % | | | 37 | % | | | 32 | % | | | 51 | % | | | 65 | % | | | 89 | % | | | 24 | % |
Net assets, end of period (000s omitted) | | | $1,142,893 | | | | $1,031,979 | | | | $1,328,994 | | | | $223,616 | | | | $30,493 | | | | $18,841 | | | | $11,335 | |
| 1 | After the close of business on July 16, 2010, the Fund acquired the net assets of Evergreen Large Company Growth Fund and Wells Fargo Advantage Large Company Growth Fund. Evergreen Large Company Growth Fund became the accounting and performance survivor in the transaction. The information for the periods prior to July 19, 2010 is that of Class I of Evergreen Large Company Growth Fund. |
| 2 | For the ten months ended July 31, 2010. The Fund changed its fiscal year end from September 30 to July 31, effective July 31, 2010. |
| 3 | Amount is less than $0.005. |
| 4 | Calculated based upon average shares outstanding |
| 5 | Returns for periods of less than one year are not annualized. |
The accompanying notes are an integral part of these financial statements.
| | | | |
| 22 | | Wells Fargo Advantage Premier Large Company Growth Fund | | Financial highlights |
(For a share outstanding throughout each period)
| | | | | | | | | | | | | | | | | | | | | | | | |
| | | Six months ended
January 31, 2015 (unaudited) | | | Year ended July 31 | |
| INVESTOR CLASS | | | 2014 | | | 2013 | | | 2012 | | | 2011 | | | 20101 | |
Net asset value, beginning of period | | | $14.50 | | | | $12.53 | | | | $10.19 | | | | $9.87 | | | | $7.75 | | | | $7.54 | |
Net investment loss | | | (0.03 | ) | | | (0.05 | ) | | | (0.02 | ) | | | (0.03 | ) | | | (0.02 | ) | | | (0.00 | )2 |
Net realized and unrealized gains (losses) on investments | | | 0.77 | | | | 2.02 | | | | 2.36 | | | | 0.60 | | | | 2.15 | | | | 0.21 | |
| | | | | | | | | | | | | | | | | | | | | | | | |
Total from investment operations | | | 0.74 | | | | 1.97 | | | | 2.34 | | | | 0.57 | | | | 2.13 | | | | 0.21 | |
Distributions to shareholders from | | | | | | | | | | | | | | | | | | | | | | | | |
Net investment income | | | 0.00 | | | | 0.00 | | | | 0.00 | | | | 0.00 | | | | (0.01 | ) | | | 0.00 | |
Net realized gains | | | (0.21 | ) | | | 0.00 | | | | 0.00 | | | | (0.25 | ) | | | 0.00 | | | | 0.00 | |
| | | | | | | | | | | | | | | | | | | | | | | | |
Total distributions to shareholders | | | (0.21 | ) | | | 0.00 | | | | 0.00 | | | | (0.25 | ) | | | (0.01 | ) | | | 0.00 | |
Net asset value, end of period | | | $15.03 | | | | $14.50 | | | | $12.53 | | | | $10.19 | | | | $9.87 | | | | $7.75 | |
Total return3 | | | 5.12 | % | | | 15.72 | % | | | 22.96 | % | | | 5.99 | % | | | 27.48 | % | | | 2.79 | % |
Ratios to average net assets (annualized) | | | | | | | | | | | | | | | | | | | | | | | | |
Gross expenses | | | 1.22 | % | | | 1.23 | % | | | 1.25 | % | | | 1.29 | % | | | 1.31 | % | | | 1.36 | % |
Net expenses | | | 1.18 | % | | | 1.18 | % | | | 1.18 | % | | | 1.19 | % | | | 1.19 | % | | | 1.19 | % |
Net investment loss | | | (0.34 | )% | | | (0.42 | )% | | | (0.21 | )% | | | (0.37 | )% | | | (0.20 | )% | | | (0.59 | )% |
Supplemental data | | | | | | | | | | | | | | | | | | | | | | | | |
Portfolio turnover rate | | | 25 | % | | | 37 | % | | | 32 | % | | | 51 | % | | | 65 | % | | | 89 | % |
Net assets, end of period (000s omitted) | | | $196,267 | | | | $197,861 | | | | $154,238 | | | | $99,675 | | | | $79,464 | | | | $64,781 | |
| 1 | For the period from July 16, 2010 (commencement of class operations) to July 31, 2010 |
| 2 | Amount is less than $0.005. |
| 3 | Returns for periods of less than one year are not annualized. |
The accompanying notes are an integral part of these financial statements.
| | | | | | |
| Notes to financial statements (unaudited) | | Wells Fargo Advantage Premier Large Company Growth Fund | | | 23 | |
1. ORGANIZATION
Wells Fargo Funds Trust (the “Trust”), a Delaware statutory trust organized on March 10, 1999, is an open-end management investment company registered under the Investment Company Act of 1940, as amended (the “1940 Act”). As an investment company, the Trust follows the accounting and reporting guidance in Financial Accounting Standards Board (“FASB”) Accounting Standards Codification Topic 946, Financial Services – Investment Companies. These financial statements report on the Wells Fargo Advantage Premier Large Company Growth Fund (the “Fund”) which is a diversified series of the Trust.
2. SIGNIFICANT ACCOUNTING POLICIES
The following significant accounting policies, which are consistently followed in the preparation of the financial statements of the Fund, are in conformity with U.S. generally accepted accounting principles which require management to make estimates and assumptions that affect the reported amounts of assets and liabilities, disclosure of contingent assets and liabilities at the date of the financial statements, and the reported amounts of revenues and expenses during the reporting period. Actual results could differ from those estimates.
Securities valuation
All investments are valued each business day as of the close of regular trading on the New York Stock Exchange (generally 4 p.m. Eastern Time).
Equity securities that are listed on a foreign or domestic exchange or market are valued at the official closing price or, if none, the last sales price. If no sale occurs on the primary exchange or market for the security that day, the prior day’s price will be deemed “stale” and fair values will be determined in accordance with the Fund’s Valuation Procedures.
Investments in registered open-end investment companies are valued at net asset value. Non-registered investment vehicles are fair valued at net asset value.
Investments which are not valued using any of the methods discussed above are valued at their fair value, as determined in good faith by the Board of Trustees of the Fund. The Board of Trustees has established a Valuation Committee comprised of the Trustees and has delegated to it the authority to take any actions regarding the valuation of portfolio securities that the Valuation Committee deems necessary or appropriate, including determining the fair value of portfolio securities, unless the determination has been delegated to the Management Valuation Team of Wells Fargo Funds Management, LLC (“Funds Management”). The Board of Trustees retains the authority to make or ratify any valuation decisions or approve any changes to the Valuation Procedures as it deems appropriate. On a quarterly basis, the Board of Trustees receives reports on any valuation actions taken by the Valuation Committee or the Management Valuation Team which may include items for ratification.
Valuations of fair valued securities are compared to the next actual sales price when available, or other appropriate market values, to assess the continued appropriateness of the fair valuation methodologies used. These securities are fair valued on a day-to-day basis, taking into consideration changes to appropriate market information and any significant changes to the inputs considered in the valuation process until there is a readily available price provided on an exchange or by an independent pricing service. Valuations received from an independent pricing service or independent broker-dealer quotes are periodically validated by comparisons to most recent trades and valuations provided by other independent pricing services in addition to the review of prices by the adviser and/or subadviser. Unobservable inputs used in determining fair valuations are identified based on the type of security, taking into consideration factors utilized by market participants in valuing the investment, knowledge about the issuer and the current market environment.
Security loans
The Fund may lend its securities from time to time in order to earn additional income in the form of fees or interest on securities received as collateral or the investment of any cash received as collateral. The Fund continues to receive interest or dividends on the securities loaned. The Fund receives collateral in the form of cash or securities with a value at least equal to the value of the securities on loan. The value of the loaned securities is determined at the close of each business day and any additional required collateral is delivered to the Fund on the next business day. In a securities lending transaction, the net asset value of the Fund will be affected by an increase or decrease in the value of the securities loaned and by an increase or decrease in the value of the instrument in which collateral is invested. The amount of securities lending activity undertaken by the Fund fluctuates from time to time. In the event of default or bankruptcy by the borrower, the Fund may be prevented from recovering the loaned securities or gaining access to the collateral or may experience delays or costs in doing so. In addition, the investment of any cash collateral received may lose all or part of its value. The Fund has the right under the lending agreement to recover the securities from the borrower on demand.
The Fund lends its securities through an unaffiliated securities lending agent. Cash collateral received in connection with its securities lending transactions is invested in Securities Lending Cash Investments, LLC (the “Securities Lending Fund”).
| | | | |
| 24 | | Wells Fargo Advantage Premier Large Company Growth Fund | | Notes to financial statements (unaudited) |
The Securities Lending Fund is exempt from registration under Section 3(c)(7) of the 1940 Act and is managed by Funds Management and is subadvised by Wells Capital Management Incorporated (“WellsCap”). Funds Management receives an advisory fee starting at 0.05% and declining to 0.01% as the average daily net assets of the Securities Lending Fund increase. All of the fees received by Funds Management are paid to WellsCap for its services as subadviser. The Securities Lending Fund seeks to provide a positive return compared to the daily Fed Funds Open rate by investing in high-quality, U.S. dollar-denominated short-term money market instruments. Securities Lending Fund investments are fair valued based upon the amortized cost valuation technique. Income earned from investment in the Securities Lending Fund is included in securities lending income on the Statement of Operations.
Security transactions and income recognition
Securities transactions are recorded on a trade date basis. Realized gains or losses are recorded on the basis of identified cost.
Dividend income is recognized on the ex-dividend date.
Distributions to shareholders
Distributions to shareholders from net investment income and net realized gains, if any, are recorded on the ex-dividend date. Such distributions are determined in conformity with federal income tax regulations, which may differ in amount or character from net investment income and realized gains recognized for purposes of U.S. generally accepted accounting principles.
Federal and other taxes
The Fund intends to continue to qualify as a regulated investment company by distributing substantially all of its investment company taxable income and any net realized capital gains (after reduction for capital loss carryforwards) sufficient to relieve it from all, or substantially all, federal income taxes. Accordingly, no provision for federal income taxes was required.
The Fund’s income and federal excise tax returns and all financial records supporting those returns for the prior three fiscal years are subject to examination by the federal and Delaware revenue authorities. Management has analyzed the Fund’s tax positions taken on federal, state, and foreign tax returns for all open tax years and does not believe that there are any uncertain tax positions that require recognition of a tax liability.
As of July 31 2014, the Fund had capital loss carryforwards available to offset future net realized capital gains in the amount of $36,911,214 with $18,691,738 expiring in 2016 and $18,219,476 expiring in 2017.
As of July 31, 2014, the Fund had a qualified late-year ordinary loss of $9,473,523 which was recognized on the first day of the current fiscal year.
Class allocations
The separate classes of shares offered by the Fund differ principally in applicable sales charges, distribution, shareholder servicing, and administration fees. Class specific expenses are charged directly to that share class. Investment income, common expenses, and realized and unrealized gains (losses) on investments are allocated daily to each class of shares based on the relative proportion of net assets of each class.
3. FAIR VALUATION MEASUREMENTS
Fair value measurements of investments are determined within a framework that has established a fair value hierarchy based upon the various data inputs utilized in determining the value of the Fund’s investments. The three-level hierarchy gives the highest priority to unadjusted quoted prices in active markets for identical assets or liabilities (Level 1) and the lowest priority to significant unobservable inputs (Level 3). The Fund’s investments are classified within the fair value hierarchy based on the lowest level of input that is significant to the fair value measurement. The inputs are summarized into three broad levels as follows:
| n | | Level 1 – quoted prices in active markets for identical securities |
| n | | Level 2 – other significant observable inputs (including quoted prices for similar securities, interest rates, prepayment speeds, credit risk, use of amortized cost, etc.) |
| n | | Level 3 – significant unobservable inputs (including the Fund’s own assumptions in determining the fair value of investments) |
The inputs or methodologies used for valuing investments in securities are not necessarily an indication of the risk associated with investing in those securities.
| | | | | | |
| Notes to financial statements (unaudited) | | Wells Fargo Advantage Premier Large Company Growth Fund | | | 25 | |
The following is a summary of the inputs used in valuing the Fund’s assets and liabilities as of January 31, 2015:
| | | | | | | | | | | | | | | | |
| | | Quoted prices
(Level 1) | | | Other significant
observable inputs
(Level 2) | | | Significant
unobservable inputs
(Level 3) | | | Total | |
Assets | | | | | | | | | | | | | | | | |
Investments in: | | | | | | | | | | | | | | | | |
| | | | |
Common stocks | | | | | | | | | | | | | | | | |
Consumer discretionary | | $ | 1,063,310,394 | | | $ | 0 | | | $ | 0 | | | $ | 1,063,310,394 | |
Consumer staples | | | 270,833,567 | | | | 0 | | | | 0 | | | | 270,833,567 | |
Energy | | | 226,834,744 | | | | 0 | | | | 0 | | | | 226,834,744 | |
Financials | | | 346,340,753 | | | | 0 | | | | 0 | | | | 346,340,753 | |
Health care | | | 1,029,097,079 | | | | 0 | | | | 0 | | | | 1,029,097,079 | |
Industrials | | | 745,694,451 | | | | 0 | | | | 0 | | | | 745,694,451 | |
Information technology | | | 1,433,367,998 | | | | 0 | | | | 0 | | | | 1,433,367,998 | |
Materials | | | 176,801,087 | | | | 0 | | | | 0 | | | | 176,801,087 | |
| | | | |
Short-term investments | | | | | | | | | | | | | | | | |
Investment companies | | | 70,168,079 | | | | 0 | | | | 0 | | | | 70,168,079 | |
Total assets | | $ | 5,362,448,152 | | | $ | 0 | | | $ | 0 | | | $ | 5,362,448,152 | |
The Fund recognizes transfers between levels within the fair value hierarchy at the end of the reporting period. At January 31, 2015, the Fund did not have any transfers into/out of Level 1, Level 2, or Level 3.
4. TRANSACTIONS WITH AFFILIATES
Advisory fee
The Trust has entered into an advisory contract with Funds Management, an indirect wholly owned subsidiary of Wells Fargo & Company (“Wells Fargo”). The adviser is responsible for implementing investment policies and guidelines and for supervising the subadviser, who is responsible for day-to-day portfolio management of the Fund.
Pursuant to the contract, Funds Management is entitled to receive an annual advisory fee starting at 0.65% and declining to 0.475% as the average daily net assets of the Fund increase. Prior to December 1, 2014, Funds Management was entitled to receive an annual advisory fee which started at 0.65% and declined to 0.55% as the average daily net assets of the Fund increased. For the six months ended January 31, 2015, the advisory fee was equivalent to an annual rate of 0.59% of the Fund’s average daily net assets.
Funds Management has retained the services of a subadviser to provide daily portfolio management to the Fund. The fee for subadvisory services is borne by Funds Management. WellsCap, an affiliate of Funds Management and an indirect wholly owned subsidiary of Wells Fargo, is the subadviser to the Fund and is entitled to receive a fee from Funds Management at an annual rate starting at 0.35% and declining to 0.275% as the average daily net assets of the Fund increase.
Administration fees
The Trust has entered into an administration agreement with Funds Management. Under this agreement, for providing administrative services, which includes paying fees and expenses for services provided by the transfer agent, sub-transfer agents, omnibus account servicers and record-keepers, Funds Management is entitled to receive from the Fund an annual fund level administration fee starting at 0.05% and declining to 0.03% as the average daily net assets of the Fund increase and a class level administration fee which is calculated based on the average daily net assets of each class as follows:
| | |
| | | Class level
administration fee |
| Class A, Class B, Class C | | 0.26% |
| Class R4, Institutional Class | | 0.08 |
| Class R6 | | 0.03 |
| Administrator Class | | 0.10 |
| Investor Class | | 0.32 |
| | | | |
| 26 | | Wells Fargo Advantage Premier Large Company Growth Fund | | Notes to financial statements (unaudited) |
Funds Management has contractually waived and/or reimbursed advisory and administration fees to the extent necessary to maintain certain net operating expense ratios for the Fund. Waiver of fees and/or reimbursement of expenses by Funds Management were made first from fund level expenses on a proportionate basis and then from class specific expenses. Funds Management has committed through November 30, 2015 to waive fees and/or reimburse expenses to the extent necessary to cap the Fund’s expenses at 1.12% for Class A shares, 1.87% for Class B shares, 1.87% for Class C shares, 0.80% for Class R4 shares, 0.65% for Class R6 shares, 0.95% for Administrator Class shares, 0.70% for Institutional Class shares, and 1.18% for Investor Class shares. After this time, the cap may be increased or the commitment to maintain the cap may be terminated only with the approval of the Board of Trustees.
Distribution fees
The Trust has adopted a Distribution Plan for Class B and Class C shares of the Fund pursuant to Rule 12b-1 under the 1940 Act. Distribution fees are charged to Class B and Class C shares and paid to Wells Fargo Funds Distributor, LLC (“Funds Distributor”), the principal underwriter, at an annual rate of 0.75% of the average daily net assets of Class B and Class C shares.
In addition, Funds Distributor is entitled to receive the front-end sales charge from the purchase of Class A shares and a contingent deferred sales charge on the redemption of certain shares. Funds Distributor is also entitled to receive the contingent deferred sales charges from redemptions of Class B and Class C shares. For the six months ended January 31, 2015, Funds Distributor received $52,331 from the sale of Class A shares and $31 and $1,327 in contingent deferred sales charges from redemptions of Class B and Class C shares, respectively.
Shareholder servicing fees
The Trust has entered into contracts with one or more shareholder servicing agents, whereby Class A, Class B, Class C, Administrator Class, and Investor Class of the Fund is charged a fee at an annual rate of 0.25% of the average daily net assets of each respective class. Class R4 shares are charged a fee at an annual rate of 0.10% of its average daily net assets.
A portion of these total shareholder servicing fees were paid to affiliates of Wells Fargo.
5. INVESTMENT PORTFOLIO TRANSACTIONS
Purchases and sales of investments, excluding U.S. government obligations (if any) and short-term securities, for the six months ended January 31, 2015 were $1,358,450,641 and $1,251,828,793, respectively.
6. BANK BORROWINGS
The Trust (excluding the money market funds and certain other funds in the Trust) and Wells Fargo Variable Trust are parties to a $150,000,000 revolving credit agreement, whereby the Fund is permitted to use bank borrowings for temporary or emergency purposes, such as to fund shareholder redemption requests. Interest under the credit agreement is charged to the Fund based on a borrowing rate equal to the higher of the Federal Funds rate in effect on that day plus 1.25% or the overnight LIBOR rate in effect on that day plus 1.25%. In addition, an annual commitment fee equal to 0.10% of the unused balance is allocated to each participating fund. For the six months ended January 31, 2015, the Fund paid $3,745 in commitment fees.
For the six months ended January 31, 2015, there were no borrowings by the Fund under the agreement.
7. CONCENTRATION RISK
Concentration risks result from exposure to a limited number of sectors. A fund that invests a substantial portion of its assets in any sector may be more affected by changes in that sector than would be a fund whose investments are not heavily weighted in any sector.
8. INDEMNIFICATION
Under the Trust’s organizational documents, the officers and Trustees are indemnified against certain liabilities that may arise out of performance of their duties to the Trust. Additionally, in the normal course of business, the Trust may enter into contracts with service providers that contain a variety of indemnification clauses. The Trust’s maximum exposure under these arrangements is dependent on future claims that may be made against the Fund and, therefore, cannot be estimated.
| | | | | | |
| Other information (unaudited) | | Wells Fargo Advantage Premier Large Company Growth Fund | | | 27 | |
PROXY VOTING INFORMATION
A description of the policies and procedures that the Fund uses to determine how to vote proxies relating to portfolio securities, in addition to information regarding how the Fund voted proxies relating to portfolio securities during the most recent 12-month period ended June 30, is available on the Fund’s website at wellsfargoadvantagefunds.com or by visiting the SEC website at sec.gov.
PORTFOLIO HOLDINGS INFORMATION
The complete portfolio holdings for the Fund are publicly available monthly on the Fund’s website (wellsfargoadvantagefunds.com), on a one-month delayed basis. In addition, top ten holdings information (excluding derivative positions) for the Fund is publicly available on the Fund’s website on a monthly, seven-day or more delayed basis. The Fund files its complete schedule of portfolio holdings with the SEC for the first and third quarters of each fiscal year on Form N-Q, which is available by visiting the SEC website at sec.gov. In addition, the Fund’s Form N-Q may be reviewed and copied at the SEC’s Public Reference Room in Washington, DC, and at regional offices in New York City, at 233 Broadway, and in Chicago, at 175 West Jackson Boulevard, Suite 900. Information about the Public Reference Room may be obtained by calling 1-800-SEC-0330.
| | | | |
| 28 | | Wells Fargo Advantage Premier Large Company Growth Fund | | Other information (unaudited) |
BOARD OF TRUSTEES AND OFFICERS
Each of the Trustees and Officers1 listed in the table below acts in identical capacities for each fund in the Wells Fargo Advantage family of funds, which consists of 134 mutual funds comprising the Wells Fargo Funds Trust, Wells Fargo Variable Trust, Wells Fargo Master Trust and four closed-end funds (collectively the “Fund Complex”). This table should be read in conjunction with the Prospectus and the Statement of Additional Information2. The mailing address of each Trustee and Officer is 525 Market Street, 12th Floor, San Francisco, CA 94105. Each Trustee and Officer serves an indefinite term, however, each Trustee serves such term until reaching the mandatory retirement age established by the Trustees.
Independent Trustees
| | | | | | |
Name and
year of birth | | Position held and
length of service* | | Principal occupations during past five years or longer | | Other
directorships during
past five years |
William R. Ebsworth (Born 1957) | | Trustee, since 2015** | | Retired. From 1984 to 2013, equities analyst, portfolio manager, research director at Fidelity Management and Research Company and retired in 2013 as Chief Investment Officer of Fidelity Strategic Advisers, Inc. in Boston, Tokyo, and Hong Kong where he led a team of investment professionals managing client assets. Prior thereto, Board member of Hong Kong Securities Clearing Co., Hong Kong Options Clearing Corp., the Thailand International Fund, Ltd., Fidelity Investments Life Insurance Company, and Empire Fidelity Investments Life Insurance Company. Mr. Ebsworth is an Adjunct Lecturer, Finance, at Babson College and a Chartered Financial Analyst. | | Asset Allocation Trust |
| Jane A. Freeman (Born 1953) | | Trustee, since 2015** | | Retired. From 2012 to 2014 and 1999 to 2008, Chief Financial Officer of Scientific Learning Corporation. From 2008 to 2012, Ms. Freeman provided consulting services related to strategic business projects. Prior thereto, Portfolio Manager at Rockefeller & Co. and Scudder, Stevens & Clark. Board member of the Harding Loevner Funds from 1996 to 2014, serving as both Lead Independent Director and chair of the Audit Committee. Board member of the Russell Exchange Traded Funds Trust from 2011 to 2012 and the chair of the Audit Committee. Ms. Freeman is a Chartered Financial Analyst (inactive), Chair of Taproot Foundation (non-profit organization) and a Board Member of Ruth Bancroft Garden (non-profit organization). | | Asset Allocation Trust |
| Peter G. Gordon (Born 1942) | | Trustee, since 1998; Chairman, since 2005 | | Co-Founder, Retired Chairman, President and CEO of Crystal Geyser Water Company. Trustee Emeritus, Colby College. | | Asset Allocation Trust |
| Isaiah Harris, Jr. (Born 1952) | | Trustee, since 2009 | | Retired. Chairman of the Board of CIGNA Corporation since 2009, and Director since 2005. From 2003 to 2011, Director of Delux Corporation. Prior thereto, President and CEO of BellSouth Advertising and Publishing Corp. from 2005 to 2007, President and CEO of BellSouth Enterprises from 2004 to 2005 and President of BellSouth Consumer Services from 2000 to 2003. Emeritus member of the Iowa State University Foundation Board of Governors. Emeritus Member of the Advisory Board of Iowa State University School of Business. Advisory Board Member, Palm Harbor Academy. Mr. Harris is a certified public accountant. | | CIGNA Corporation; Asset Allocation Trust |
| Judith M. Johnson (Born 1949) | | Trustee, since 2008; Audit Committee Chairman, since 2008 | | Retired. Prior thereto, Chief Executive Officer and Chief Investment Officer of Minneapolis Employees Retirement Fund from 1996 to 2008. Ms. Johnson is an attorney, certified public accountant and a certified managerial accountant. | | Asset Allocation Trust |
| David F. Larcker (Born 1950) | | Trustee, since 2009 | | James Irvin Miller Professor of Accounting at the Graduate School of Business, Stanford University, Morgan Stanley Director of the Center for Leadership Development and Research and Senior Faculty of The Rock Center for Corporate Governance since 2006. From 2005 to 2008, Professor of Accounting at the Graduate School of Business, Stanford University. Prior thereto, Ernst & Young Professor of Accounting at The Wharton School, University of Pennsylvania from 1985 to 2005. | | Asset Allocation Trust |
| | | | | | |
| Other information (unaudited) | | Wells Fargo Advantage Premier Large Company Growth Fund | | | 29 | |
| | | | | | |
Name and
year of birth | | Position held and
length of service* | | Principal occupations during past five years or longer | | Other
directorships during
past five years |
| Olivia S. Mitchell (Born 1953) | | Trustee, since 2006 | | International Foundation of Employee Benefit Plans Professor, Wharton School of the University of Pennsylvania since 1993. Director of Wharton’s Pension Research Council and Boettner Center on Pensions & Retirement Research, and Research Associate at the National Bureau of Economic Research. Previously, Cornell University Professor from 1978 to 1993. | | Asset Allocation Trust |
| Timothy J. Penny (Born 1951) | | Trustee, since 1996 | | President and Chief Executive Officer of Southern Minnesota Initiative Foundation, a non-profit organization, since 2007 and Senior Fellow at the Humphrey Institute Policy Forum at the University of Minnesota since 1995. Member of the Board of Trustees of NorthStar Education Finance, Inc., a non-profit organization, since 2007. | | Asset Allocation Trust |
| Michael S. Scofield (Born 1943) | | Trustee, since 2010 | | Served on the Investment Company Institute’s Board of Governors and Executive Committee from 2008-2011 as well the Governing Council of the Independent Directors Council from 2006-2011 and the Independent Directors Council Executive Committee from 2008-2011. Chairman of the IDC from 2008-2010. Institutional Investor (Fund Directions) Trustee of Year in 2007. Trustee of the Evergreen Funds complex (and its predecessors) from 1984 to 2010. Chairman of the Evergreen Funds from 2000-2010. Former Trustee of the Mentor Funds. Retired Attorney, Law Offices of Michael S. Scofield. | | Asset Allocation Trust |
| Donald C. Willeke (Born 1940) | | Trustee, since 1996 | | Principal of the law firm of Willeke & Daniels. General Counsel of the Minneapolis Employees Retirement Fund from 1984 until its consolidation into the Minnesota Public Employees Retirement Association on June 30, 2010. Director and Vice Chair of The Tree Trust (non-profit corporation). Director of the American Chestnut Foundation (non-profit corporation). | | Asset Allocation Trust |
| * | Length of service dates reflect the Trustee’s commencement of service with the Trust’s predecessor entities, where applicable. |
| ** | William R. Ebsworth and Jane A. Freeman each became a Trustee effective January 1, 2015. |
Officers
| | | | | | |
Name and
year of birth | | Position held and
length of service | | Principal occupations during past five years or longer | | |
Karla M. Rabusch (Born 1959) | | President, since 2003 | | Executive Vice President of Wells Fargo Bank, N.A. and President of Wells Fargo Funds Management, LLC since 2003. | | |
Jeremy DePalma1 (Born 1974) | | Treasurer, since 2012 | | Senior Vice President of Wells Fargo Funds Management, LLC since 2009. Senior Vice President of Evergreen Investment Management Company, LLC from 2008 to 2010. Vice President, Evergreen Investment Services, Inc. from 2004 to 2007. Head of the Fund Reporting and Control Team within Fund Administration from 2005 to 2010. | | |
C. David Messman (Born 1960) | | Secretary, since 2000; Chief Legal Officer, since 2003 | | Assistant General Counsel of Wells Fargo Bank, N.A. since 2013 and Vice President and Managing Counsel of Wells Fargo Bank N.A. from 1996 to 2013. Senior Vice President and Secretary of Wells Fargo Funds Management, LLC since 2001. | | |
Debra Ann Early (Born 1964) | | Chief Compliance Officer, since 2007 | | Senior Vice President of Wells Fargo Funds Management, LLC since 2007 and Chief Compliance Officer from 2007 to 2014. Chief Compliance Officer of Parnassus Investments from 2005 to 2007. Chief Financial Officer of Parnassus Investments from 2004 to 2007 and Senior Audit Manager of PricewaterhouseCoopers LLP from 1998 to 2004. | | |
David Berardi (Born 1975) | | Assistant Treasurer, since 2009 | | Vice President of Wells Fargo Funds Management, LLC since 2009. Vice President of Evergreen Investment Management Company, LLC from 2008 to 2010. Assistant Vice President of Evergreen Investment Services, Inc. from 2004 to 2008. Manager of Fund Reporting and Control for Evergreen Investment Management Company, LLC from 2004 to 2010. | | |
| 1 | Jeremy DePalma acts as Treasurer of 61 funds and Assistant Treasurer of 73 funds in the Fund Complex. |
| 2 | The Statement of Additional Information includes additional information about the Trustees and is available, without charge, upon request, by calling 1-800-222-8222 or by visiting the website at wellsfargoadvantagefunds.com. |
| | | | |
| 30 | | Wells Fargo Advantage Premier Large Company Growth Fund | | List of abbreviations |
The following is a list of common abbreviations for terms and entities that may have appeared in this report.
| ACA | — ACA Financial Guaranty Corporation |
| ADR | — American depositary receipt |
| ADS | — American depositary shares |
| AGC | — Assured Guaranty Corporation |
| AGM | — Assured Guaranty Municipal |
| Ambac | — Ambac Financial Group Incorporated |
| AMT | — Alternative minimum tax |
| BAN | — Bond anticipation notes |
| BHAC | — Berkshire Hathaway Assurance Corporation |
| CAB | — Capital appreciation bond |
| CCAB | — Convertible capital appreciation bond |
| CDA | — Community Development Authority |
| CDO | — Collateralized debt obligation |
| DRIVER | — Derivative inverse tax-exempt receipts |
| DW&P | — Department of Water & Power |
| DWR | — Department of Water Resources |
| ECFA | — Educational & Cultural Facilities Authority |
| EDA | — Economic Development Authority |
| EDFA | — Economic Development Finance Authority |
| ETF | — Exchange-traded fund |
| FDIC | — Federal Deposit Insurance Corporation |
| FFCB | — Federal Farm Credit Banks |
| FGIC | — Financial Guaranty Insurance Corporation |
| FHA | — Federal Housing Administration |
| FHLB | — Federal Home Loan Bank |
| FHLMC | — Federal Home Loan Mortgage Corporation |
| FICO | — The Financing Corporation |
| FNMA | — Federal National Mortgage Association |
| GDR | — Global depositary receipt |
| GNMA | — Government National Mortgage Association |
| HCFR | — Healthcare facilities revenue |
| HEFA | — Health & Educational Facilities Authority |
| HEFAR | — Higher education facilities authority revenue |
| HFA | — Housing Finance Authority |
| HFFA | — Health Facilities Financing Authority |
| HUD | — Department of Housing and Urban Development |
| IDA | — Industrial Development Authority |
| IDAG | — Industrial Development Agency |
| KRW | — Republic of Korea won |
| LIBOR | — London Interbank Offered Rate |
| LIFER | — Long Inverse Floating Exempt Receipts |
| LLC | — Limited liability company |
| LLLP | — Limited liability limited partnership |
| LLP | — Limited liability partnership |
| MBIA | — Municipal Bond Insurance Association |
| MFHR | — Multifamily housing revenue |
| MSTR | — Municipal securities trust receipts |
| MUD | — Municipal Utility District |
| National | — National Public Finance Guarantee Corporation |
| PCFA | — Pollution Control Financing Authority |
| PCL | — Public Company Limited |
| PCR | — Pollution control revenue |
| PFA | — Public Finance Authority |
| PFFA | — Public Facilities Financing Authority |
| PFOTER | — Puttable floating option tax-exempt receipts |
| plc | — Public limited company |
| PUTTER | — Puttable tax-exempt receipts |
| R&D | — Research & development |
| Radian | — Radian Asset Assurance |
| RAN | — Revenue anticipation notes |
| RDA | — Redevelopment Authority |
| RDFA | — Redevelopment Finance Authority |
| REIT | — Real estate investment trust |
| ROC | — Reset option certificates |
| SAVRS | — Select auction variable rate securities |
| SBA | — Small Business Authority |
| SFHR | — Single-family housing revenue |
| SFMR | — Single-family mortgage revenue |
| SPA | — Standby purchase agreement |
| SPDR | — Standard & Poor’s Depositary Receipts |
| SPEAR | — Short Puttable Exempt Adjustable Receipts |
| STRIPS | — Separate trading of registered interest and |
| TAN | — Tax anticipation notes |
| TIPS | — Treasury inflation-protected securities |
| TRAN | — Tax revenue anticipation notes |
| TTFA | — Transportation Trust Fund Authority |
| TVA | — Tennessee Valley Authority |
This page is intentionally left blank.
This page is intentionally left blank.


For more information
More information about Wells Fargo Advantage Funds is available free upon request. To obtain literature, please write, email, visit the Fund’s website, or call:
Wells Fargo Advantage Funds
P.O. Box 8266
Boston, MA 02266-8266
Email: wfaf@wellsfargo.com
Website: wellsfargoadvantagefunds.com
Individual investors: 1-800-222-8222
Retail investment professionals: 1-888-877-9275
Institutional investment professionals: 1-866-765-0778
This report and the financial statements contained herein are submitted for the general information of the shareholders of Wells Fargo Advantage Funds. If this report is used for promotional purposes, distribution of the report must be accompanied or preceded by a current prospectus. Before investing, please consider the investment objectives, risks, charges, and expenses of the investment. For a current prospectus and, if available, a summary prospectus, containing this information, call 1-800-222-8222 or visit the Fund’s website at wellsfargoadvantagefunds.com. Read the prospectus carefully before you invest or send money.
Wells Fargo Funds Management, LLC, a wholly owned subsidiary of Wells Fargo & Company, provides investment advisory and administrative services for Wells Fargo Advantage Funds. Other affiliates of Wells Fargo & Company provide subadvisory and other services for the Funds. The Funds are distributed by Wells Fargo Funds Distributor, LLC, Member FINRA/SIPC, an affiliate of Wells Fargo & Company.
NOT FDIC INSURED ¡ NO BANK GUARANTEE ¡ MAY LOSE VALUE
© 2015 Wells Fargo Funds Management, LLC. All rights reserved.
| | |
 | | 231605 03-15 SA212/SAR212 01-15 |
ITEM 2. CODE OF ETHICS
Not applicable.
ITEM 3. AUDIT COMMITTEE FINANCIAL EXPERT
Not applicable.
ITEM 4. PRINCIPAL ACCOUNTANT FEES AND SERVICES
Not applicable.
ITEM 5. AUDIT COMMITTEE OF LISTED REGISTRANTS
Not applicable.
ITEM 6. INVESTMENTS
A Portfolio of Investments for each series of Wells Fargo Funds Trust is included as part of the report to shareholders filed under Item 1 of this Form.
ITEM 7. DISCLOSURE OF PROXY VOTING POLICIES AND PROCEDURES FOR CLOSED-END MANAGEMENT INVESTMENT COMPANIES
Not applicable.
ITEM 8. PORTFOLIO MANAGERS OF CLOSED-END MANAGEMENT INVESTMENT COMPANIES
Not applicable.
ITEM 9. PURCHASES OF EQUITY SECURITIES BY CLOSED-END MANAGEMEENT INVESTMENT COMPANY AND AFFILIATED PURCHASERS
Not applicable.
ITEM 10. SUBMISSION OF MATTERS TO A VOTE OF SECURITY HOLDERS
There have been no material changes to the procedures by which shareholders may recommend nominees to the registrant’s Board of Trustees that have been implemented since the registrant’s last provided disclosure in response to the requirements of this Item.
ITEM 11. CONTROLS AND PROCEDURES
(a) The President and Treasurer have concluded that the Wells Fargo Funds Trust (the “Trust”) disclosure controls and procedures (as defined in Rule 30a-3(c) under the Investment Company Act of 1940) provide reasonable assurances that material information relating to the Trust is made known to them by the appropriate persons, based on their evaluation of these controls and procedures as of a date within 90 days of the filing of this report.
(b) There were no significant changes in the Trust’s internal controls over financial reporting (as defined in Rule 30a-3(d) under the Investment Company Act of 1940) that occurred during the second fiscal quarter of the period covered by this report that materially affected, or is reasonably likely to materially affect, the registrant’s internal control over financial reporting.
ITEM 12. EXHIBITS
(a)(1) Not applicable.
(a)(2) Certification pursuant to Rule 30a-2(a) under the Investment Company Act of 1940 (17 CFR 270.30a-2(a)) is filed and attached hereto as Exhibit 99.CERT.
(a)(3) Not applicable.
(b) Certification pursuant to Rule 30a-2(b) under the Investment Company Act of 1940 (17 CFR 270.30a-2(b)) is filed and attached hereto as Exhibit 99.906CERT.
SIGNATURES
Pursuant to the requirements of the Securities Exchange Act of 1934 and the Investment Company Act of 1940, the registrant has duly caused this report to be signed on its behalf by the undersigned, thereunto duly authorized.
| | |
| Wells Fargo Funds Trust |
| |
| By: | | |
| |
| | /s/ Karla M. Rabusch |
| |
| | Karla M. Rabusch |
| | President |
| |
| Date: | | March 25, 2015 |
Pursuant to the requirements of the Securities Exchange Act of 1934 and the Investment Company Act of 1940, this report has been signed below by the following persons on behalf of the registrant and in the capacities and on the date indicated.
| | |
| Wells Fargo Funds Trust |
| |
| By: | | |
| |
| | /s/ Karla M. Rabusch |
| |
| | Karla M. Rabusch |
| | President |
|
| Date: March 25, 2015 |
| |
| By: | | |
| |
| | /s/ Jeremy DePalma |
| |
| | Jeremy DePalma |
| | Treasurer |
| |
| Date: | | March 25, 2015 |