
UNITED STATES
SECURITIES AND EXCHANGE COMMISSION
Washington, D.C. 20549
FORM N-CSRS
CERTIFIED SHAREHOLDER REPORT OF REGISTERED
MANAGEMENT INVESTMENT COMPANIES
Investment Company Act file number: 811-09253
Wells Fargo Funds Trust
(Exact name of registrant as specified in charter)
525 Market St., San Francisco, CA 94105
(Address of principal executive offices) (Zip code)
C. David Messman
Wells Fargo Funds Management, LLC
525 Market St., San Francisco, CA 94105
(Name and address of agent for service)
Registrant’s telephone number, including area code: 800-222-8222
Date of fiscal year end: August 31
Registrant is making a filing for 10 of its series:
Wells Fargo Advantage Adjustable Rate Government Fund, Wells Fargo Advantage Conservative Income Fund, Wells Fargo Advantage Government Securities Fund, Wells Fargo Advantage High Income Fund, Wells Fargo Advantage High Yield Bond Fund, Wells Fargo Advantage Income Plus Fund, Wells Fargo Advantage Short Duration Government Bond Fund, Wells Fargo Advantage Short-Term Bond Fund, Wells Fargo Advantage Short-Term High Yield Bond Fund, and Wells Fargo Advantage Ultra Short-Term Income Fund.
Date of reporting period: February 28, 2015
| ITEM 1. | REPORT TO STOCKHOLDERS |

Wells Fargo Advantage
Adjustable Rate Government Fund

Semi-Annual Report
February 28, 2015

Reduce clutter. Save trees.
Sign up for electronic delivery of prospectuses and shareholder reports at wellsfargo.com/advantagedelivery
Contents
| * | A complete schedule of portfolio holdings as of the report date may be obtained, free of charge, by accessing the following website: http://a584.g.akamai.net/f/584/1326/1d/www.wellsfargoadvantagefunds.com/pdf/semi/holdings/adjustablerategovt.pdf or by calling Wells Fargo Advantage Funds at 1-800-222-8222. This complete schedule, filed on Form N-CSRS, is also available on the SEC’s website at sec.gov. |
The views expressed and any forward-looking statements are as of February 28, 2015, unless otherwise noted, and are those of the Fund managers and/or Wells Fargo Funds Management, LLC. Discussions of individual securities, or the markets generally, or any Wells Fargo Advantage Fund are not intended as individual recommendations. Future events or results may vary significantly from those expressed in any forward-looking statements; the views expressed are subject to change at any time in response to changing circumstances in the market. Wells Fargo Funds Management, LLC and the Fund disclaim any obligation to publicly update or revise any views expressed or forward-looking statements.
NOT FDIC INSURED ¡ NO BANK GUARANTEE ¡ MAY LOSE VALUE
| | | | |
| 2 | | Wells Fargo Advantage Adjustable Rate Government Fund | | Letter to shareholders (unaudited) |

Karla M. Rabusch
President
Wells Fargo Advantage Funds
Major central banks continued to inject liquidity into global banks and markets through various accommodative monetary policies, including quantitative easing.
Dear Valued Shareholder:
We are pleased to offer you this semi-annual report for the Wells Fargo Advantage Adjustable Rate Government Fund for the six-month period that ended February 28, 2015. The period was marked by low interest rates, a large decline in oil prices, and moderate U.S. economic growth. Investment-grade bonds, as measured by the Barclays U.S. Aggregate Bond Index1, returned 2.25% during the period.
Major central banks continued to provide stimulus.
Major central banks continued to inject liquidity into global banks and markets through various accommodative monetary policies, including quantitative easing. In the U.S., the Federal Reserve (Fed) kept its key interest rate near zero in order to support the economy and the financial system. It ended its quantitative easing program in October 2014 and also set expectations for it to begin normalizing monetary policy with higher target ranges for the federal funds rate in 2015.
Meanwhile, European markets continued to benefit from the European Central Bank’s (ECB’s) willingness to maintain low interest rates. In September 2014, the ECB cut its key rate to a historic low of 0.05%. In addition to its targeted longer-term refinancing operations that are designed to increase bank lending, the ECB said it intends to increase the size of its balance sheet, a result of quantitative easing, by buying eurozone government bonds. In Japan, the Bank of Japan maintained an aggressive monetary program aimed at combating deflation.
U.S. economic growth was moderate, and oil prices plummeted.
Economic growth advanced during the reporting period, the unemployment rate ticked lower to 5.5% as of February 2015, and inflation remained below the Fed’s longer-run objective of a 2% pace. The period was also marked by dramatically lower oil prices, which fell from more than $90 per barrel at the end of August 2014 to below $50 per barrel at the end of February 2015. While lower oil prices benefited consumers of oil products, the lower prices pressured companies within the energy sector.
Longer-dated securities and higher-rated credits were top performers.
Ten-year U.S. Treasury rates declined during the period, from 2.35% at end of August 2014 to 2.03% by the end of February 2015, benefiting both from safe-haven status as well as relative attractiveness to global investors. With the U.S. economy the furthest along its business cycle, the level of interest rates in the U.S. and Europe diverged. The 10-year U.S. Treasury yield was 2.03% at the end of February 2015 compared with 0.30% for 10-year German government yields, 173 basis points (bps; 100 bps equals 1.00%) higher. This was largely attributed to the Fed being closer to eventually increasing interest rates while the ECB potentially needs to further increase, rather than scale back, its amount of accommodation. Further, U.S. economic activity was healthier than Europe’s.
Treasury bonds with maturities greater than 20 years returned more than 10% during the six-month period that ended February 28, 2015, according to the Barclays U.S. Aggregate Bond Index. This was due, in part, to strong demand from overseas investors because yields in Europe and Japan were substantially lower than U.S. yields. In addition, because the dollar strengthened, the returns from Treasuries were even higher for foreign-domiciled investors. Longer-maturity debt across all sectors outperformed shorter-dated securities.
| 1 | The Barclays U.S. Aggregate Bond Index is a broad-based benchmark that measures the investment-grade, U.S. dollar–denominated, fixed-rate taxable bond market, including Treasuries, government-related and corporate securities, mortgage-backed securities (agency fixed-rate and hybrid adjustable-rate mortgage pass-throughs), asset-backed securities, and commercial mortgage-backed securities. You cannot invest directly in an index. |
| | | | | | |
| Letter to shareholders (unaudited) | | Wells Fargo Advantage Adjustable Rate Government Fund | | | 3 | |
Investment-grade corporate bonds returned 2.29% during the six-month reporting period, according to the Barclays U.S. Aggregate Bond Index, and AAA-rated2 bonds had higher returns than BBB-rated bonds. Lower-rated credits, including high yield, underperformed as oil prices fell dramatically. Not only were many energy and mining companies negatively affected, but investor trepidation about weak global growth caused investment-grade spreads to modestly widen while high-yield spreads widened substantially.
Don’t let short-term uncertainty derail long-term investment goals.
Periods of uncertainty can present challenges, but experience has taught us that maintaining long-term investment goals can be an effective way to plan for the future. To help you create a sound strategy based on your personal goals and risk tolerance, Wells Fargo Advantage Funds offers more than 100 mutual funds and other investments spanning a wide range of asset classes and investment styles. Although diversification cannot guarantee an investment profit or prevent losses, we believe it can be an effective way to manage investment risk and potentially smooth out overall portfolio performance. We encourage investors to know their investments and to understand that appropriate levels of risk-taking may unlock opportunities.
Thank you for choosing to invest with Wells Fargo Advantage Funds. We appreciate your confidence in us and remain committed to helping you meet your financial needs. For current information about your fund investments, contact your investment professional, visit our website at wellsfargoadvantagefunds.com, or call us directly at 1-800-222-8222. We are available 24 hours a day, 7 days a week.
Sincerely,

Karla M. Rabusch
President
Wells Fargo Advantage Funds
Periods of uncertainty can present challenges, but experience has taught us that maintaining long-term investment goals can be an effective way to plan for the future.
| 2 | The ratings indicated are from Standard & Poor’s, Moody’s Investors Service, and/or Fitch Ratings Ltd. Standard & Poor’s rates the creditworthiness of bonds from AAA (highest) to D (lowest). Ratings from A to CCC may be modified by the addition of a plus (+) or minus (-) sign to show relative standing within the rating categories. Moody’s rates the creditworthiness of bonds from Aaa (highest) to C (lowest). Ratings Aa to B may be modified by the addition of a number 1 (highest) to 3 (lowest) to show relative standing within the ratings categories. Fitch rates the creditworthiness of bonds from AAA (highest) to D (lowest). |
| | | | |
| 4 | | Wells Fargo Advantage Adjustable Rate Government Fund | | Performance highlights (unaudited) |
Investment objective
The Fund seeks current income consistent with capital preservation.
Adviser
Wells Fargo Funds Management, LLC
Subadviser
Wells Capital Management Incorporated
Portfolio managers
Michael J. Bray, CFA
Christopher Y. Kauffman, CFA
Average annual total returns1 (%) as of February 28, 2015
| | | | | | | | | | | | | | | | | | | | | | | | | | | | | | | | | | |
| | | | | Including sales charge | | | Excluding sales charge | | | Expense ratios2 (%) | |
| | | Inception date | | 1 year | | | 5 year | | | 10 year | | | 1 year | | | 5 year | | | 10 year | | | Gross | | | Net3 | |
| Class A (ESAAX) | | 6-30-2000 | | | (1.58 | ) | | | 1.00 | | | | 2.11 | | | | 0.47 | | | | 1.40 | | | | 2.32 | | | | 0.79 | | | | 0.74 | |
| Class B (ESABX)* | | 6-30-2000 | | | (1.88 | ) | | | 0.82 | | | | 2.02 | | | | (0.39 | ) | | | 0.82 | | | | 2.02 | | | | 1.54 | | | | 1.49 | |
| Class C (ESACX) | | 6-30-2000 | | | (1.28 | ) | | | 0.64 | | | | 1.56 | | | | (0.28 | ) | | | 0.64 | | | | 1.56 | | | | 1.54 | | | | 1.49 | |
| Administrator Class (ESADX) | | 7-30-2010 | | | – | | | | – | | | | – | | | | 0.61 | | | | 1.54 | | | | 2.47 | | | | 0.73 | | | | 0.60 | |
| Institutional Class (EKIZX) | | 10-1-1991 | | | – | | | | – | | | | – | | | | 0.75 | | | | 1.67 | | | | 2.59 | | | | 0.46 | | | | 0.46 | |
| Barclays 6-Month Treasury Bill Index4 | | – | | | – | | | | – | | | | – | | | | 0.13 | | | | 0.22 | | | | 1.84 | | | | – | | | | – | |
| * | | Class B shares are closed to investment, except in connection with the reinvestment of any distributions and permitted exchanges. |
Figures quoted represent past performance, which is no guarantee of future results, and do not reflect taxes that a shareholder may pay on fund distributions or the redemption of fund shares. Investment return and principal value of an investment will fluctuate so that an investor’s shares, when redeemed, may be worth more or less than their original cost. Performance shown without sales charges would be lower if sales charges were reflected. Current performance may be lower or higher than the performance data quoted, which assumes the reinvestment of dividends and capital gains. Current month-end performance is available on the Fund’s website, wellsfargoadvantagefunds.com.
Index returns do not include transaction costs associated with buying and selling securities, any mutual fund fees or expenses, or any taxes. It is not possible to invest directly in an index.
For Class A shares, the maximum front-end sales charge is 2.00%. For Class B shares, the maximum contingent deferred sales charge is 1.50%. For Class C shares, the maximum contingent deferred sales charge is 1.00%. Performance including a contigent deferred sales charge assumes the sales charge for the corresponding time period. Administrator Class and Institutional Class shares are sold without a front-end sales charge or contingent deferred sales charge.
Bond values fluctuate in response to the financial condition of individual issuers, general market and economic conditions, and changes in interest rates. Changes in market conditions and government policies may lead to periods of heightened volatility in the bond market and reduced liquidity for certain bonds held by the Fund. In general, when interest rates rise, bond values fall and investors may lose principal value. Interest-rate changes and their impact on the Fund and its share price can be sudden and unpredictable. The use of derivatives may reduce returns and/or increase volatility. Securities issued by U.S. government agencies or government sponsored entities may not be guaranteed by the U.S. Treasury. Certain investment strategies tend to increase the total risk of an investment (relative to the broader market). The Fund is exposed to mortgage-and asset-backed securities risk. Consult the Fund’s prospectus for additional information on these and other risks. The U.S. government guarantee applies to certain underlying securities and not to shares of the Fund.
Please see footnotes on page 5.
| | | | | | |
| Performance highlights (unaudited) | | Wells Fargo Advantage Adjustable Rate Government Fund | | | 5 | |
| | | | |
| Ten largest long-term holdings5 (%) as of February 28, 2015 | |
FNMA Series 2003-W18 Class 2A, 3.43%, 6-25-2043 | | | 1.20 | |
FNMA, 2.80%, 11-1-2035 | | | 1.03 | |
FHLMC Series T-67 Class 1A1C, 2.92%, 3-25-2036 | | | 0.99 | |
FNMA, 2.40%, 2-1-2036 | | | 0.99 | |
FHLMC, 1.86%, 7-1-2034 | | | 0.98 | |
FHLMC, 2.48%, 9-1-2030 | | | 0.89 | |
FNMA Series 2002-66 Class A3, 3.12%, 4-25-2042 | | | 0.86 | |
FNMA Series 2006-W1 Class 3A, 2.15%, 10-25-2045 | | | 0.83 | |
FNMA, 2.33%, 12-1-2040 | | | 0.80 | |
FNMA Series 2004-W15 Class 3A, 2.63%, 6-25-2044 | | | 0.78 | |
|
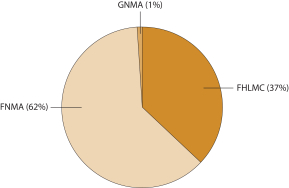
| Portfolio allocation6 as of February 28, 2015 |
|
 |
| 1 | Historical performance shown for Administrator Class shares prior to their inception reflects the performance of Institutional Class shares, adjusted to reflect the higher expenses applicable to Administrator Class shares. Historical performance shown for all classes of the Fund prior to July 12, 2010, is based on the performance of the Fund’s predecessor, Evergreen Adjustable Rate Fund. |
| 2 | Reflects the expense ratios as stated in the most recent prospectuses. The expense ratios shown are subject to change and may differ from the annualized expense ratios shown in the financial highlights of this report. |
| 3 | The Adviser has committed through December 31, 2015, to waive fees and/or reimburse expenses to the extent necessary to cap the Fund’s Total Annual Fund Operating Expenses After Fee Waiver, excluding certain expenses, at the amounts shown. After this time, the cap may be increased or the commitment to maintain the cap may be terminated only with the approval of the Board of Trustees. Brokerage commissions, stamp duty fees, interest, taxes, acquired fund fees and expenses, and extraordinary expenses are excluded from the cap. Without this cap, the Fund’s returns would have been lower. |
| 4 | The Barclays 6-Month Treasury Bill Index tracks the performance and attributes of recently issued 6-month U.S. Treasury Bills. The index follows Barclays’ monthly rebalancing conventions. You cannot invest directly in an index. |
| 5 | The ten largest long-term holdings are calculated based on the value of the securities divided by total net assets of the Fund. Holdings are subject to change and may have changed since the date specified. |
| 6 | Amounts are calculated based on the total long-term investments of the Fund. These percentages are subject to change and may have changed since the date specified. |
| | | | |
| 6 | | Wells Fargo Advantage Adjustable Rate Government Fund | | Fund expenses (unaudited) |
As a shareholder of the Fund, you incur two types of costs: (1) transaction costs, including sales charges (loads) on purchase payments and contingent deferred sales charges (if any) on redemptions and (2) ongoing costs, including management fees, distribution (12b-1) and/or shareholder service fees, and other Fund expenses. This example is intended to help you understand your ongoing costs (in dollars) of investing in the Fund and to compare these costs with the ongoing costs of investing in other mutual funds.
The example is based on an investment of $1,000 invested at the beginning of the six-month period and held for the entire period from September 1, 2014 to February 28, 2015.
Actual expenses
The “Actual” line of the table below provides information about actual account values and actual expenses. You may use the information in this line, together with the amount you invested, to estimate the expenses that you paid over the period. Simply divide your account value by $1,000 (for example, an $8,600 account value divided by $1,000 = 8.6), then multiply the result by the number in the “Actual” line under the heading entitled “Expenses paid during period” for your applicable class of shares to estimate the expenses you paid on your account during this period.
Hypothetical example for comparison purposes
The “Hypothetical” line of the table below provides information about hypothetical account values and hypothetical expenses based on the Fund’s actual expense ratio and an assumed rate of return of 5% per year before expenses, which is not the Fund’s actual return. The hypothetical account values and expenses may not be used to estimate the actual ending account balance or expenses you paid for the period. You may use this information to compare the ongoing costs of investing in the Fund and other funds. To do so, compare this 5% hypothetical example with the 5% hypothetical examples that appear in the shareholder reports of the other funds.
Please note that the expenses shown in the table are meant to highlight your ongoing costs only and do not reflect any transactional costs, such as sales charges (loads) and contingent deferred sales charges. Therefore, the “Hypothetical” line of the table is useful in comparing ongoing costs only and will not help you determine the relative total costs of owning different funds. In addition, if these transactional costs were included, your costs would have been higher.
| | | | | | | | | | | | | | | | |
| | | Beginning
account value
9-1-2014 | | | Ending
account value
2-28-2015 | | | Expenses
paid during
the period1 | | | Net annualized
expense ratio | |
Class A | | | | | | | | | | | | | | | | |
Actual | | $ | 1,000.00 | | | $ | 1,000.58 | | | $ | 3.67 | | | | 0.74 | % |
Hypothetical (5% return before expenses) | | $ | 1,000.00 | | | $ | 1,021.12 | | | $ | 3.71 | | | | 0.74 | % |
Class B | | | | | | | | | | | | | | | | |
Actual | | $ | 1,000.00 | | | $ | 996.94 | | | $ | 7.28 | | | | 1.47 | % |
Hypothetical (5% return before expenses) | | $ | 1,000.00 | | | $ | 1,017.50 | | | $ | 7.35 | | | | 1.47 | % |
Class C | | | | | | | | | | | | | | | | |
Actual | | $ | 1,000.00 | | | $ | 996.86 | | | $ | 7.38 | | | | 1.49 | % |
Hypothetical (5% return before expenses) | | $ | 1,000.00 | | | $ | 1,017.41 | | | $ | 7.45 | | | | 1.49 | % |
Administrator Class | | | | | | | | | | | | | | | | |
Actual | | $ | 1,000.00 | | | $ | 1,001.27 | | | $ | 2.98 | | | | 0.60 | % |
Hypothetical (5% return before expenses) | | $ | 1,000.00 | | | $ | 1,021.82 | | | $ | 3.01 | | | | 0.60 | % |
Institutional Class | | | | | | | | | | | | | | | | |
Actual | | $ | 1,000.00 | | | $ | 1,001.99 | | | $ | 2.23 | | | | 0.45 | % |
Hypothetical (5% return before expenses) | | $ | 1,000.00 | | | $ | 1,022.56 | | | $ | 2.26 | | | | 0.45 | % |
| 1 | Expenses paid is equal to the annualized expense ratio of each class multiplied by the average account value over the period, multiplied by the number of days in the most recent fiscal half-year divided by the number of days in the fiscal year (to reflect the one-half-year period). |
| | | | | | |
| Summary portfolio of investments—February 28, 2015 (unaudited) | | Wells Fargo Advantage Adjustable Rate Government Fund | | | 7 | |
The Summary portfolio of investments shows the 50 largest portfolio holdings in unaffiliated issuers and any holdings exceeding 1% of the total net assets as of the report date. The remaining securities held are grouped as “Other securities” in each category.
| | | | | | | | | | | | | | | | | | | | |
| Security name | | Interest rate | | | Maturity date | | | Principal | | | Value | | | Percent of
net assets | |
| | | | | |
Agency Securities: 94.59% | | | | | | | | | | | | | | | | | | | | |
FHLMC | | | 0.21-8.50 | % | | | 1-1-2016 to 2-25-2045 | | | $ | 325,720,521 | | | $ | 345,991,341 | | | | 25.58 | % |
FHLMC ± | | | 1.86 | | | | 7-1-2034 | | | | 12,442,231 | | | | 13,222,592 | | | | 0.98 | |
FHLMC ± | | | 2.33 | | | | 6-1-2037 | | | | 8,291,923 | | | | 8,865,330 | | | | 0.66 | |
FHLMC ± | | | 2.35 | | | | 6-1-2037 | | | | 8,480,726 | | | | 9,064,337 | | | | 0.67 | |
FHLMC ± | | | 2.36 | | | | 9-1-2035 | | | | 7,790,802 | | | | 8,307,609 | | | | 0.61 | |
FHLMC ± | | | 2.38 | | | | 4-1-2038 | | | | 7,946,931 | | | | 8,493,979 | | | | 0.63 | |
FHLMC ± | | | 2.38 | | | | 1-1-2038 | | | | 8,041,265 | | | | 8,611,436 | | | | 0.64 | |
FHLMC ± | | | 2.39 | | | | 2-1-2035 | | | | 6,201,918 | | | | 6,615,274 | | | | 0.49 | |
FHLMC ± | | | 2.42 | | | | 4-1-2034 | | | | 5,886,618 | | | | 6,292,077 | | | | 0.47 | |
FHLMC ± | | | 2.48 | | | | 9-1-2030 | | | | 11,352,162 | | | | 12,075,320 | | | | 0.89 | |
FHLMC ± | | | 2.69 | | | | 8-1-2030 | | | | 6,180,102 | | | | 6,622,598 | | | | 0.49 | |
FHLMC ± | | | 2.71 | | | | 2-1-2036 | | | | 5,454,852 | | | | 5,864,519 | | | | 0.43 | |
FHLMC Series T-62 Class 1A1 ± | | | 1.31 | | | | 10-25-2044 | | | | 5,878,424 | | | | 5,990,843 | | | | 0.44 | |
FHLMC Series T-67 Class 1A1C ± | | | 2.92 | | | | 3-25-2036 | | | | 12,698,698 | | | | 13,420,911 | | | | 0.99 | |
FHLMC Series T-67 Class 2A1C ± | | | 2.95 | | | | 3-25-2036 | | | | 8,045,876 | | | | 8,365,603 | | | | 0.62 | |
FNMA | | | 0.42-11.00 | | | | 2-1-2016 to 12-1-2046 | | | | 476,080,959 | | | | 507,046,819 | | | | 37.47 | |
FNMA ± | | | 2.03 | | | | 10-1-2035 | | | | 8,399,073 | | | | 8,825,632 | | | | 0.65 | |
FNMA ± | | | 2.07 | | | | 12-1-2035 | | | | 7,358,890 | | | | 7,738,672 | | | | 0.57 | |
FNMA ± | | | 2.13 | | | | 5-1-2033 | | | | 6,005,987 | | | | 6,382,680 | | | | 0.47 | |
FNMA ± | | | 2.22 | | | | 9-1-2032 | | | | 7,443,486 | | | | 7,921,280 | | | | 0.59 | |
FNMA ± | | | 2.24 | | | | 2-1-2036 | | | | 6,144,601 | | | | 6,555,071 | | | | 0.49 | |
FNMA ± | | | 2.27 | | | | 8-1-2039 | | | | 5,770,401 | | | | 6,147,987 | | | | 0.45 | |
FNMA ± | | | 2.28 | | | | 5-1-2038 | | | | 5,462,409 | | | | 5,822,288 | | | | 0.43 | |
FNMA �� | | | 2.30 | | | | 1-1-2037 | | | | 9,773,253 | | | | 10,459,496 | | | | 0.77 | |
FNMA ± | | | 2.30 | | | | 7-1-2038 | | | | 7,192,290 | | | | 7,798,216 | | | | 0.58 | |
FNMA ± | | | 2.31 | | | | 7-1-2039 | | | | 5,552,287 | | | | 5,942,209 | | | | 0.44 | |
FNMA ± | | | 2.33 | | | | 12-1-2040 | | | | 10,126,546 | | | | 10,785,747 | | | | 0.80 | |
FNMA ± | | | 2.33 | | | | 12-1-2040 | | | | 6,041,538 | | | | 6,438,480 | | | | 0.48 | |
FNMA ± | | | 2.34 | | | | 9-1-2034 | | | | 5,603,263 | | | | 5,978,156 | | | | 0.44 | |
FNMA ± | | | 2.34 | | | | 1-1-2035 | | | | 6,842,460 | | | | 7,294,166 | | | | 0.54 | |
FNMA ± | | | 2.34 | | | | 1-1-2038 | | | | 7,550,021 | | | | 8,086,413 | | | | 0.60 | |
FNMA ± | | | 2.34 | | | | 7-1-2036 | | | | 5,447,050 | | | | 5,807,518 | | | | 0.43 | |
FNMA ± | | | 2.35 | | | | 12-1-2044 | | | | 6,924,786 | | | | 7,386,930 | | | | 0.55 | |
FNMA ± | | | 2.36 | | | | 8-1-2037 | | | | 5,643,299 | | | | 6,034,646 | | | | 0.45 | |
FNMA ± | | | 2.36 | | | | 5-1-2036 | | | | 5,545,680 | | | | 5,965,448 | | | | 0.44 | |
FNMA ± | | | 2.36 | | | | 12-1-2040 | | | | 6,814,358 | | | | 7,271,316 | | | | 0.54 | |
FNMA ± | | | 2.36 | | | | 9-1-2039 | | | | 8,383,927 | | | | 8,931,630 | | | | 0.66 | |
FNMA ± | | | 2.37 | | | | 12-1-2035 | | | | 5,863,484 | | | | 6,253,389 | | | | 0.46 | |
FNMA ± | | | 2.39 | | | | 12-1-2040 | | | | 5,438,548 | | | | 5,807,615 | | | | 0.43 | |
FNMA ± | | | 2.40 | | | | 2-1-2036 | | | | 12,401,812 | | | | 13,401,749 | | | | 0.99 | |
FNMA ± | | | 2.40 | | | | 2-1-2038 | | | | 7,200,442 | | | | 7,734,077 | | | | 0.57 | |
FNMA ± | | | 2.43 | | | | 4-1-2036 | | | | 5,614,153 | | | | 6,010,893 | | | | 0.44 | |
FNMA ± | | | 2.47 | | | | 3-1-2037 | | | | 5,502,141 | | | | 5,917,370 | | | | 0.44 | |
FNMA ± | | | 2.49 | | | | 11-1-2034 | | | | 6,877,917 | | | | 7,353,716 | | | | 0.54 | |
The accompanying notes are an integral part of these financial statements.
| | | | |
| 8 | | Wells Fargo Advantage Adjustable Rate Government Fund | | Summary portfolio of investments—February 28, 2015 (unaudited) |
| | | | | | | | | | | | | | | | | | | | |
| Security name | | Interest rate | | | Maturity date | | | Principal | | | Value | | | Percent of
net assets | |
| | | | | |
Agency Securities (continued) | | | | | | | | | | | | | | | | | | | | |
FNMA ± | | | 2.80 | % | | | 11-1-2035 | | | $ | 12,914,315 | | | $ | 13,884,685 | | | | 1.03 | % |
FNMA Series 2001-T12 Class A4 ± | | | 3.36 | | | | 8-25-2041 | | | | 7,625,454 | | | | 7,870,033 | | | | 0.58 | |
FNMA Series 2002-66 Class A3 ± | | | 3.12 | | | | 4-25-2042 | | | | 11,235,040 | | | | 11,581,056 | | | | 0.86 | |
FNMA Series 2003-W18 Class 2A ± | | | 3.43 | | | | 6-25-2043 | | | | 14,978,638 | | | | 16,225,100 | | | | 1.20 | |
FNMA Series 2004-W12 Class 2A ± | | | 3.34 | | | | 6-25-2044 | | | | 7,565,789 | | | | 8,033,491 | | | | 0.59 | |
FNMA Series 2004-W15 Class 3A ± | | | 2.63 | | | | 6-25-2044 | | | | 9,789,228 | | | | 10,561,510 | | | | 0.78 | |
FNMA Series 2006-W1 Class 3A ± | | | 2.15 | | | | 10-25-2045 | | | | 10,619,366 | | | | 11,237,923 | | | | 0.83 | |
GNMA ± | | | 2.04 | | | | 8-20-2062 | | | | 7,863,759 | | | | 8,322,664 | | | | 0.62 | |
GNMA | | | 0.57-9.00 | | | | 5-15-2016 to 9-20-2062 | | | | 8,982,495 | | | | 9,302,785 | | | | 0.68 | |
Other securities | | | | | | | | | | | | | | | 1,572,788 | | | | 0.12 | |
| | | | | |
Total Agency Securities (Cost $1,256,177,401) | | | | | | | | | | | | | | | 1,279,495,413 | | | | 94.59 | |
| | | | | | | | | | | | | | | | | | | | |
| | | | | |
| | | Yield | | | | | | Shares | | | | | | | |
| Short-Term Investments: 5.69% | | | | | | | | | | | | | | | | | | | | |
| | | | | |
| Investment Companies: 5.62% | | | | | | | | | | | | | | | | | | | | |
Wells Fargo Advantage Government Money Market Fund, Institutional Class (l)(u) | | | 0.01 | | | | | | | | 76,055,353 | | | | 76,055,353 | | | | 5.62 | |
| | | | | | | | | | | | | | | | | | | | |
| | | | | |
| | | | | | | | | Principal | | | | | | | |
| U.S. Treasury Securities: 0.07% | | | | | | | | | | | | | | | | | | | | |
U.S. Treasury Bill #(z) | | | 0.01 | | | | 3-19-2015 | | | $ | 900,000 | | | | 899,994 | | | | 0.07 | |
| | | | | | | | | | | | | | | | | | | | |
| | | | |
Total Short-Term Investments (Cost $76,955,342) | | | | | | | | | | | | 76,955,347 | | | | 5.69 | |
| | | | | | | | | | | | | | | | | | | | |
| | | | |
| Total investments in securities (Cost $1,333,132,743) * | | | | | | | | | | | | 1,356,450,760 | | | | 100.28 | % |
Other assets and liabilities, net | | | | | | | | | | | | | | | (3,765,149 | ) | | | (0.28 | ) |
| | | | | | | | | | | | | | | | | | | | |
| Total net assets | | | | | | | | | | | | | | $ | 1,352,685,611 | | | | 100.00 | % |
| | | | | | | | | | | | | | | | | | | | |
| ± | Variable rate investment. The rate shown is the rate in effect at period end. |
| (l) | The security represents an affiliate of the Fund as defined in the Investment Company Act of 1940. |
| (u) | The rate represents the 7-day annualized yield at period end. |
| # | All or a portion of this security is segregated as collateral for investments in derivative instruments. |
| (z) | Zero coupon security. The rate represents the current yield to maturity. |
| * | Cost for federal income tax purposes is $1,333,962,748 and unrealized gains (losses) consists of: |
| | | | |
Gross unrealized gains | | $ | 24,236,582 | |
Gross unrealized losses | | | (1,748,570 | ) |
| | | | |
Net unrealized gains | | $ | 22,488,012 | |
The accompanying notes are an integral part of these financial statements.
| | | | | | |
| Statement of assets and liabilities—February 28, 2015 (unaudited) | | Wells Fargo Advantage Adjustable Rate Government Fund | | | 9 | |
| | | | |
| | | | |
| |
Assets | | | | |
Investments | | | | |
In unaffiliated securities, at value (cost $1,257,077,390) | | $ | 1,280,395,407 | |
In affiliated securities, at value (cost $76,055,353) | | | 76,055,353 | |
| | | | |
Total investments, at value (cost $1,333,132,743) | | | 1,356,450,760 | |
Cash | | | 8,466,149 | |
Principal paydown receivable | | | 3,603,682 | |
Receivable for Fund shares sold | | | 1,045,295 | |
Receivable for interest | | | 3,307,267 | |
Prepaid expenses and other assets | | | 40,391 | |
| | | | |
Total assets | | | 1,372,913,544 | |
| | | | |
| |
Liabilities | | | | |
Dividends payable | | | 227,155 | |
Payable for investments purchased | | | 13,886,265 | |
Payable for Fund shares redeemed | | | 5,196,958 | |
Payable for daily variation margin on open futures contracts | | | 100,469 | |
Advisory fee payable | | | 290,347 | |
Distribution fees payable | | | 81,492 | |
Administration fees payable | | | 162,885 | |
Accrued expenses and other liabilities | | | 282,362 | |
| | | | |
Total liabilities | | | 20,227,933 | |
| | | | |
Total net assets | | $ | 1,352,685,611 | |
| | | | |
| |
NET ASSETS CONSIST OF | | | | |
Paid-in capital | | $ | 1,388,011,236 | |
Overdistributed net investment income | | | (1,419,000 | ) |
Accumulated net realized losses on investments | | | (56,977,414 | ) |
Net unrealized gains on investments | | | 23,070,789 | |
| | | | |
Total net assets | | $ | 1,352,685,611 | |
| | | | |
| |
COMPUTATION OF NET ASSET VALUE AND OFFERING PRICE PER SHARE | | | | |
Net assets – Class A | | $ | 229,883,636 | |
Shares outstanding – Class A1 | | | 25,210,345 | |
Net asset value per share – Class A | | | $9.12 | |
Maximum offering price per share – Class A2 | | | $9.31 | |
Net assets – Class B | | $ | 763,520 | |
Shares outstanding – Class B1 | | | 83,708 | |
Net asset value per share – Class B | | | $9.12 | |
Net assets – Class C | | $ | 134,871,598 | |
Shares outstanding – Class C1 | | | 14,790,382 | |
Net asset value per share – Class C | | | $9.12 | |
Net assets – Administrator Class | | $ | 85,800,646 | |
Shares outstanding – Administrator Class1 | | | 9,409,567 | |
Net asset value per share – Administrator Class | | | $9.12 | |
Net assets – Institutional Class | | $ | 901,366,211 | |
Shares outstanding – Institutional Class1 | | | 98,828,498 | |
Net asset value per share – Institutional Class | | | $9.12 | |
| 1 | The Fund has an unlimited number of authorized shares. |
| 2 | Maximum offering price is computed as 100/98 of net asset value. On investments of $50,000 or more, the offering price is reduced. |
The accompanying notes are an integral part of these financial statements.
| | | | |
| 10 | | Wells Fargo Advantage Adjustable Rate Government Fund | | Statement of operations—six months ended February 28, 2015 (unaudited) |
| | | | |
| | | | |
| |
Investment income | | | | |
Interest | | $ | 9,241,697 | |
Income from affiliated securities | | | 2,231 | |
| | | | |
Total investment income | | | 9,243,928 | |
| | | | |
| |
Expenses | | | | |
Advisory fee | | | 1,983,450 | |
Administration fees | | | | |
Fund level | | | 338,087 | |
Class A | | | 190,646 | |
Class B | | | 770 | |
Class C | | | 112,251 | |
Administrator Class | | | 50,688 | |
Institutional Class | | | 348,555 | |
Shareholder servicing fees | | | | |
Class A | | | 297,883 | |
Class B | | | 1,115 | |
Class C | | | 175,392 | |
Administrator Class | | | 126,002 | |
Distribution fees | | | | |
Class B | | | 3,611 | |
Class C | | | 526,176 | |
Custody and accounting fees | | | 51,572 | |
Professional fees | | | 32,857 | |
Registration fees | | | 48,740 | |
Shareholder report expenses | | | 40,450 | |
Trustees’ fees and expenses | | | 5,763 | |
Other fees and expenses | | | 30,811 | |
| | | | |
Total expenses | | | 4,364,819 | |
Less: Fee waivers and/or expense reimbursements | | | (146,630 | ) |
| | | | |
Net expenses | | | 4,218,189 | |
| | | | |
Net investment income | | | 5,025,739 | |
| | | | |
| |
REALIZED AND UNREALIZED GAINS (LOSSES) ON INVESTMENTS | | | | |
| |
Net realized gains (losses) on: | | | | |
Unaffiliated securities | | | 829,297 | |
Futures transactions | | | (1,845,554 | ) |
| | | | |
Net realized losses on investments | | | (1,016,257 | ) |
| | | | |
| |
Net change in unrealized gains (losses) on: | | | | |
Unaffiliated securities | | | (2,706,365 | ) |
Futures transactions | | | 35,048 | |
| | | | |
Net change in unrealized gains (losses) on investments | | | (2,671,317 | ) |
| | | | |
Net realized and unrealized gains (losses) on investments | | | (3,687,574 | ) |
| | | | |
Net increase in net assets resulting from operations | | $ | 1,338,165 | |
| | | | |
The accompanying notes are an integral part of these financial statements.
| | | | | | |
| Statement of changes in net assets | | Wells Fargo Advantage Adjustable Rate Government Fund | | | 11 | |
| | | | | | | | | | | | | | | | |
| | | Six months ended February 28, 2015 (unaudited) | | | Year ended August 31, 2014 | |
| | | | |
Operations | | | | | | | | | | | | | | | | |
Net investment income | | | | | | $ | 5,025,739 | | | | | | | $ | 10,805,581 | |
Net realized gains (losses) on investments | | | | | | | (1,016,257 | ) | | | | | | | 593,005 | |
Net change in unrealized gains (losses) on investments | | | | | | | (2,671,317 | ) | | | | | | | 3,546,510 | |
| | | | |
Net increase in net assets resulting from operations | | | | | | | 1,338,165 | | | | | | | | 14,945,096 | |
| | | | |
| | | | |
Distributions to shareholders from | | | | | | | | | | | | | | | | |
Net investment income | | | | | | | | | | | | | | | | |
Class A | | | | | | | (928,731 | ) | | | | | | | (1,733,771 | ) |
Class B | | | | | | | (214 | ) | | | | | | | (575 | ) |
Class C | | | | | | | (20,498 | ) | | | | | | | (56,786 | ) |
Administrator Class | | | | | | | (466,296 | ) | | | | | | | (875,098 | ) |
Institutional Class | | | | | | | (4,638,787 | ) | | | | | | | (8,075,183 | ) |
Tax basis return of capital | | | | | | | | | | | | | | | | |
Class A | | | | | | | 0 | | | | | | | | (366,434 | ) |
Class B | | | | | | | 0 | | | | | | | | (121 | ) |
Class C | | | | | | | 0 | | | | | | | | (12,002 | ) |
Administrator Class | | | | | | | 0 | | | | | | | | (184,953 | ) |
Institutional Class | | | | | | | 0 | | | | | | | | (1,706,699 | ) |
| | | | |
Total distributions to shareholders | | | | | | | (6,054,526 | ) | | | | | | | (13,011,622 | ) |
| | | | |
| | | | |
Capital share transactions | | | Shares | | | | | | | | Shares | | | | | |
Proceeds from shares sold | | | | | | | | | | | | | | | | |
Class A | | | 2,231,975 | | | | 20,407,379 | | | | 7,244,221 | | | | 66,263,594 | |
Class B | | | 2,582 | | | | 23,624 | | | | 3,858 | | | | 35,285 | |
Class C | | | 178,564 | | | | 1,633,706 | | | | 452,217 | | | | 4,137,215 | |
Administrator Class | | | 2,621,516 | | | | 23,974,254 | | | | 6,986,964 | | | | 63,914,051 | |
Institutional Class | | | 39,875,545 | | | | 364,746,468 | | | | 62,792,794 | | | | 574,754,504 | |
| | | | |
| | | | | | | 410,785,431 | | | | | | | | 709,104,649 | |
| | | | |
Reinvestment of distributions | | | | | | | | | | | | | | | | |
Class A | | | 86,322 | | | | 789,041 | | | | 193,274 | | | | 1,767,656 | |
Class B | | | 20 | | | | 186 | | | | 70 | | | | 646 | |
Class C | | | 1,670 | | | | 15,273 | | | | 5,609 | | | | 51,307 | |
Administrator Class | | | 41,831 | | | | 382,348 | | | | 77,012 | | | | 704,495 | |
Institutional Class | | | 371,452 | | | | 3,395,114 | | | | 729,403 | | | | 6,672,314 | |
| | | | |
| | | | | | | 4,581,962 | | | | | | | | 9,196,418 | |
| | | | |
Payment for shares redeemed | | | | | | | | | | | | | | | | |
Class A | | | (4,614,886 | ) | | | (42,200,318 | ) | | | (10,685,135 | ) | | | (97,752,051 | ) |
Class B | | | (49,123 | ) | | | (449,539 | ) | | | (189,405 | ) | | | (1,734,110 | ) |
Class C | | | (1,621,557 | ) | | | (14,832,006 | ) | | | (5,030,472 | ) | | | (46,016,981 | ) |
Administrator Class | | | (6,842,357 | ) | | | (62,597,601 | ) | | | (4,667,752 | ) | | | (42,695,260 | ) |
Institutional Class | | | (33,665,392 | ) | | | (307,852,767 | ) | | | (70,479,287 | ) | | | (645,076,343 | ) |
| | | | |
| | | | | | | (427,932,231 | ) | | | | | | | (833,274,745 | ) |
| | | | |
Net decrease in net assets resulting from capital share transactions | | | | | | | (12,564,838 | ) | | | | | | | (114,973,678 | ) |
| | | | |
Total decrease in net assets | | | | | | | (17,281,199 | ) | | | | | | | (113,040,204 | ) |
| | | | |
| | | | |
Net assets | | | | | | | | | | | | | | | | |
Beginning of period | | | | | | | 1,369,966,810 | | | | | | | | 1,483,007,014 | |
| | | | |
End of period | | | | | | $ | 1,352,685,611 | | | | | | | $ | 1,369,966,810 | |
| | | | |
Overdistributed net investment income | | | | | | $ | (1,419,000 | ) | | | | | | $ | (390,213 | ) |
| | | | |
The accompanying notes are an integral part of these financial statements.
| | | | |
| 12 | | Wells Fargo Advantage Adjustable Rate Government Fund | | Financial highlights |
(For a share outstanding throughout each period)
| | | | | | | | | | | | | | | | | | | | | | | | | | | | |
| | | Six months ended
February 28, 2015 (unaudited) | | | Year ended August 31 | | | Year ended June 30, 20101 | |
| CLASS A | | | 2014 | | | 2013 | | | 2012 | | | 2011 | | | 20101,2 | | |
Net asset value, beginning of period | | | $9.15 | | | | $9.14 | | | | $9.19 | | | | $9.12 | | | | $9.12 | | | | $9.11 | | | | $9.00 | |
Net investment income | | | 0.03 | | | | 0.06 | | | | 0.06 | | | | 0.09 | | | | 0.14 | | | | 0.02 | | | | 0.20 | |
Net realized and unrealized gains (losses) on investments | | | (0.02 | ) | | | 0.02 | | | | (0.04 | ) | | | 0.08 | | | | 0.04 | | | | 0.02 | | | | 0.11 | |
| | | | | | | | | | | | | | | | | | | | | | | | | | | | |
Total from investment operations | | | 0.01 | | | | 0.08 | | | | 0.02 | | | | 0.17 | | | | 0.18 | | | | 0.04 | | | | 0.31 | |
Distributions to shareholders from | | | | | | | | | | | | | | | | | | | | | | | | | | | | |
Net investment income | | | (0.04 | ) | | | (0.06 | ) | | | (0.07 | ) | | | (0.09 | ) | | | (0.13 | )3 | | | (0.01 | )3 | | | (0.20 | ) |
Tax basis return of capital | | | 0.00 | | | | (0.01 | ) | | | (0.00 | )4 | | | (0.01 | ) | | | (0.05 | )3 | | | (0.02 | )3 | | | 0.00 | |
| | | | | | | | | | | | | | | | | | | | | | | | | | | | |
Total distributions to shareholders | | | (0.04 | ) | | | (0.07 | ) | | | (0.07 | ) | | | (0.10 | ) | | | (0.18 | ) | | | (0.03 | ) | | | (0.20 | ) |
Net asset value, end of period | | | $9.12 | | | | $9.15 | | | | $9.14 | | | | $9.19 | | | | $9.12 | | | | $9.12 | | | | $9.11 | |
Total return5 | | | 0.06 | % | | | 0.90 | % | | | 0.23 | % | | | 1.84 | % | | | 2.04 | % | | | 0.49 | % | | | 3.51 | % |
Ratios to average net assets (annualized) | | | | | | | | | | | | | | | | | | | | | | | | | | | | |
Gross expenses | | | 0.78 | % | | | 0.80 | % | | | 0.84 | % | | | 0.86 | % | | | 0.88 | % | | | 0.88 | % | | | 0.73 | % |
Net expenses | | | 0.74 | % | | | 0.74 | % | | | 0.74 | % | | | 0.74 | % | | | 0.74 | % | | | 0.74 | % | | | 0.73 | % |
Net investment income | | | 0.63 | % | | | 0.64 | % | | | 0.71 | % | | | 1.01 | % | | | 1.50 | % | | | 1.18 | % | | | 2.27 | % |
Supplemental data | | | | | | | | | | | | | | | | | | | | | | | | | | | | |
Portfolio turnover rate | | | 8 | % | | | 18 | % | | | 10 | % | | | 9 | % | | | 18 | % | | | 0 | % | | | 14 | % |
Net assets, end of period (000s omitted) | | | $229,884 | | | | $251,686 | | | | $281,028 | | | | $309,827 | | | | $328,427 | | | | $353,453 | | | | $271,853 | |
| 1 | After the close of business on July 9, 2010, the Fund acquired the net assets of Evergreen Adjustable Rate Fund which became the accounting and performance survivor in the transaction. The information for the periods prior to July 12, 2010 is that of Class A of Evergreen Adjustable Rate Fund. |
| 2 | For the two months ended August 31, 2010. The Fund changed its fiscal year end from June 30 to August 31, effective August 31, 2010. |
| 3 | Calculated based upon average shares outstanding |
| 4 | Amount is less than $0.005. |
| 5 | Total return calculations do not include any sales charges. Returns for periods of less than one year are not annualized. |
The accompanying notes are an integral part of these financial statements.
| | | | | | |
| Financial highlights | | Wells Fargo Advantage Adjustable Rate Government Fund | | | 13 | |
(For a share outstanding throughout each period)
| | | | | | | | | | | | | | | | | | | | | | | | | | | | |
| | | Six months ended
February 28, 2015 (unaudited) | | | Year ended August 31 | | | Year ended June 30, 20101 | |
| CLASS B | | | 2014 | | | 2013 | | | 2012 | | | 2011 | | | 20101,2 | | |
Net asset value, beginning of period | | | $9.15 | | | | $9.14 | | | | $9.19 | | | | $9.12 | | | | $9.12 | | | | $9.11 | | | | $9.00 | |
Net investment income (loss) | | | (0.01 | )3 | | | (0.01 | )3 | | | (0.00 | )3,4 | | | 0.03 | 3 | | | 0.07 | 3 | | | 0.00 | 4 | | | 0.13 | 3 |
Net realized and unrealized gains (losses) on investments | | | (0.02 | ) | | | 0.02 | | | | (0.05 | ) | | | 0.07 | | | | 0.05 | | | | 0.03 | | | | 0.11 | |
| | | | | | | | | | | | | | | | | | | | | | | | | | | | |
Total from investment operations | | | (0.03 | ) | | | 0.01 | | | | (0.05 | ) | | | 0.10 | | | | 0.12 | | | | 0.03 | | | | 0.24 | |
Distributions to shareholders from | | | | | | | | | | | | | | | | | | | | | | | | | | | | |
Net investment income | | | (0.00 | )4 | | | (0.00 | )4 | | | (0.00 | )4 | | | (0.03 | ) | | | (0.07 | )3 | | | (0.00 | )3,4 | | | (0.13 | ) |
Tax basis return of capital | | | 0.00 | | | | (0.00 | )4 | | | (0.00 | )4 | | | (0.00 | )4 | | | (0.05 | )3 | | | (0.02 | )3 | | | 0.00 | |
| | | | | | | | | | | | | | | | | | | | | | | | | | | | |
Total distributions to shareholders | | | (0.00 | )4 | | | (0.00 | )4 | | | (0.00 | )4 | | | (0.03 | ) | | | (0.12 | ) | | | (0.02 | ) | | | (0.13 | ) |
Net asset value, end of period | | | $9.12 | | | | $9.15 | | | | $9.14 | | | | $9.19 | | | | $9.12 | | | | $9.12 | | | | $9.11 | |
Total return5 | | | (0.31 | )% | | | 0.15 | % | | | (0.52 | )% | | | 1.08 | % | | | 1.28 | % | | | 0.36 | % | | | 2.73 | % |
Ratios to average net assets (annualized) | | | | | | | | | | | | | | | | | | | | | | | | | | | | |
Gross expenses | | | 1.52 | % | | | 1.55 | % | | | 1.60 | % | | | 1.61 | % | | | 1.63 | % | | | 1.62 | % | | | 1.48 | % |
Net expenses | | | 1.47 | % | | | 1.49 | % | | | 1.49 | % | | | 1.49 | % | | | 1.49 | % | | | 1.49 | % | | | 1.48 | % |
Net investment income (loss) | | | (0.12 | )% | | | (0.11 | )% | | | (0.03 | )% | | | 0.27 | % | | | 0.81 | % | | | 0.24 | % | | | 1.55 | % |
Supplemental data | | | | | | | | | | | | | | | | | | | | | | | | | | | | |
Portfolio turnover rate | | | 8 | % | | | 18 | % | | | 10 | % | | | 9 | % | | | 18 | % | | | 0 | % | | | 14 | % |
Net assets, end of period (000s omitted) | | | $764 | | | | $1,192 | | | | $2,886 | | | | $6,660 | | | | $14,911 | | | | $50,229 | | | | $52,414 | |
| 1 | After the close of business on July 9, 2010, the Fund acquired the net assets of Evergreen Adjustable Rate Fund which became the accounting and performance survivor in the transaction. The information for the periods prior to July 12, 2010 is that of Class B of Evergreen Adjustable Rate Fund. |
| 2 | For the two months ended August 31, 2010. The Fund changed its fiscal year end from June 30 to August 31, effective August 31, 2010. |
| 3 | Calculated based upon average shares outstanding |
| 4 | Amount is less than $0.005. |
| 5 | Total return calculations do not include any sales charges. Returns for periods of less than one year are not annualized. |
The accompanying notes are an integral part of these financial statements.
| | | | |
| 14 | | Wells Fargo Advantage Adjustable Rate Government Fund | | Financial highlights |
(For a share outstanding throughout each period)
| | | | | | | | | | | | | | | | | | | | | | | | | | | | |
| | | Six months ended
February 28, 2015 (unaudited) | | | Year ended August 31 | | | Year ended June 30, 20101 | |
| CLASS C | | | 2014 | | | 2013 | | | 2012 | | | 2011 | | | 20101,2 | | |
Net asset value, beginning of period | | | $9.15 | | | | $9.14 | | | | $9.19 | | | | $9.12 | | | | $9.12 | | | | $9.11 | | | | $9.00 | |
Net investment income (loss) | | | (0.01 | )4 | | | (0.01 | )4 | | | (0.00 | )3,4 | | | 0.02 | 4 | | | 0.06 | | | | 0.00 | 3 | | | 0.14 | |
Net realized and unrealized gains (losses) on investments | | | (0.02 | ) | | | 0.02 | | | | (0.05 | ) | | | 0.08 | | | | 0.06 | | | | 0.03 | | | | 0.10 | |
| | | | | | | | | | | | | | | | | | | | | | | | | | | | |
Total from investment operations | | | (0.03 | ) | | | 0.01 | | | | (0.05 | ) | | | 0.10 | | | | 0.12 | | | | 0.03 | | | | 0.24 | |
Distributions to shareholders from | | | | | | | | | | | | | | | | | | | | | | | | | | | | |
Net investment income | | | (0.00 | )3 | | | (0.00 | )3 | | | (0.00 | )3 | | | (0.03 | ) | | | (0.07 | )4 | | | (0.00 | )3,4 | | | (0.13 | ) |
Tax basis return of capital | | | 0.00 | | | | (0.00 | )3 | | | (0.00 | )3 | | | (0.00 | )3 | | | (0.05 | )4 | | | (0.02 | )4 | | | 0.00 | |
| | | | | | | | | | | | | | | | | | | | | | | | | | | | |
Total distributions to shareholders | | | (0.00 | )3 | | | (0.00 | )3 | | | (0.00 | )3 | | | (0.03 | ) | | | (0.12 | ) | | | (0.02 | ) | | | (0.13 | ) |
Net asset value, end of period | | | $9.12 | | | | $9.15 | | | | $9.14 | | | | $9.19 | | | | $9.12 | | | | $9.12 | | | | $9.11 | |
Total return5 | | | (0.31 | )% | | | 0.15 | % | | | (0.52 | )% | | | 1.08 | % | | | 1.28 | % | | | 0.36 | % | | | 2.73 | % |
Ratios to average net assets (annualized) | | | | | | | | | | | | | | | | | | | | | | | | | | | | |
Gross expenses | | | 1.53 | % | | | 1.55 | % | | | 1.59 | % | | | 1.61 | % | | | 1.63 | % | | | 1.62 | % | | | 1.48 | % |
Net expenses | | | 1.49 | % | | | 1.49 | % | | | 1.49 | % | | | 1.49 | % | | | 1.49 | % | | | 1.51 | % | | | 1.48 | % |
Net investment income (loss) | | | (0.13 | )% | | | (0.11 | )% | | | (0.04 | )% | | | 0.26 | % | | | 0.74 | % | | | 0.23 | % | | | 1.52 | % |
Supplemental data | | | | | | | | | | | | | | | | | | | | | | | | | | | | |
Portfolio turnover rate | | | 8 | % | | | 18 | % | | | 10 | % | | | 9 | % | | | 18 | % | | | 0 | % | | | 14 | % |
Net assets, end of period (000s omitted) | | | $134,872 | | | | $148,523 | | | | $190,110 | | | | $248,392 | | | | $296,645 | | | | $340,278 | | | | $349,562 | |
| 1 | After the close of business on July 9, 2010, the Fund acquired the net assets of Evergreen Adjustable Rate Fund which became the accounting and performance survivor in the transaction. The information for the periods prior to July 12, 2010 is that of Class C of Evergreen Adjustable Rate Fund. |
| 2 | For the two months ended August 31, 2010. The Fund changed its fiscal year end from June 30 to August 31, effective August 31, 2010. |
| 3 | Amount is less than $0.005. |
| 4 | Calculated based upon average shares outstanding |
| 5 | Total return calculations do not include any sales charges. Returns for periods of less than one year are not annualized. |
The accompanying notes are an integral part of these financial statements.
| | | | | | |
| Financial highlights | | Wells Fargo Advantage Adjustable Rate Government Fund | | | 15 | |
(For a share outstanding throughout each period)
| | | | | | | | | | | | | | | | | | | | | | | | |
| | | Six months ended
February 28, 2015 (unaudited) | | | Year ended August 31 | |
| ADMINISTRATOR CLASS | | | 2014 | | | 2013 | | | 2012 | | | 2011 | | | 20101 | |
Net asset value, beginning of period | | | $9.15 | | | | $9.14 | | | | $9.19 | | | | $9.12 | | | | $9.12 | | | | $9.11 | |
Net investment income | | | 0.03 | | | | 0.07 | | | | 0.08 | | | | 0.11 | | | | 0.14 | 2 | | | 0.02 | |
Net realized and unrealized gains (losses) on investments | | | (0.02 | ) | | | 0.03 | | | | (0.05 | ) | | | 0.07 | | | | 0.06 | | | | 0.01 | |
| | | | | | | | | | | | | | | | | | | | | | | | |
Total from investment operations | | | 0.01 | | | | 0.10 | | | | 0.03 | | | | 0.18 | | | | 0.20 | | | | 0.03 | |
Distributions to shareholders from | | | | | | | | | | | | | | | | | | | | | | | | |
Net investment income | | | (0.04 | ) | | | (0.07 | ) | | | (0.08 | ) | | | (0.10 | ) | | | (0.15 | )2 | | | (0.00 | )2,3 |
Tax basis return of capital | | | 0.00 | | | | (0.02 | ) | | | (0.00 | )3 | | | (0.01 | ) | | | (0.05 | )2 | | | (0.02 | )2 |
| | | | | | | | | | | | | | | | | | | | | | | | |
Total distributions to shareholders | | | (0.04 | ) | | | (0.09 | ) | | | (0.08 | ) | | | (0.11 | ) | | | (0.20 | ) | | | (0.02 | ) |
Net asset value, end of period | | | $9.12 | | | | $9.15 | | | | $9.14 | | | | $9.19 | | | | $9.12 | | | | $9.12 | |
Total return4 | | | 0.13 | % | | | 1.05 | % | | | 0.37 | % | | | 1.98 | % | | | 2.18 | % | | | 0.31 | % |
Ratios to average net assets (annualized) | | | | | | | | | | | | | | | | | | | | | | | | |
Gross expenses | | | 0.72 | % | | | 0.73 | % | | | 0.77 | % | | | 0.79 | % | | | 0.78 | % | | | 0.90 | % |
Net expenses | | | 0.60 | % | | | 0.60 | % | | | 0.60 | % | | | 0.60 | % | | | 0.60 | % | | | 0.62 | % |
Net investment income | | | 0.75 | % | | | 0.78 | % | | | 0.85 | % | | | 1.14 | % | | | 1.49 | % | | | 2.01 | % |
Supplemental data | | | | | | | | | | | | | | | | | | | | | | | | |
Portfolio turnover rate | | | 8 | % | | | 18 | % | | | 10 | % | | | 9 | % | | | 18 | % | | | 0 | % |
Net assets, end of period (000s omitted) | | | $85,801 | | | | $124,345 | | | | $102,284 | | | | $112,319 | | | | $34,946 | | | | $10 | |
| 1 | For the period from July 30, 2010 (commencement of class operations) to August 31, 2010 |
| 2 | Calculated based upon average shares outstanding |
| 3 | Amount is less than $0.005. |
| 4 | Returns for periods of less than one year are not annualized. |
The accompanying notes are an integral part of these financial statements.
| | | | |
| 16 | | Wells Fargo Advantage Adjustable Rate Government Fund | | Financial highlights |
(For a share outstanding throughout each period)
| | | | | | | | | | | | | | | | | | | | | | | | | | | | |
| | | Six months ended
February 28, 2015 (unaudited) | | | Year ended August 31 | | | Year ended June 30, 20101 | |
| INSTITUTIONAL CLASS | | | 2014 | | | 2013 | | | 2012 | | | 2011 | | | 20101,2 | | |
Net asset value, beginning of period | | | $9.15 | | | | $9.14 | | | | $9.19 | | | | $9.12 | | | | $9.12 | | | | $9.11 | | | | $9.00 | |
Net investment income | | | 0.04 | | | | 0.08 | | | | 0.09 | 3 | | | 0.12 | 3 | | | 0.15 | | | | 0.02 | | | | 0.23 | |
Net realized and unrealized gains (losses) on investments | | | (0.02 | ) | | | 0.03 | | | | (0.04 | ) | | | 0.07 | | | | 0.06 | | | | 0.03 | | | | 0.10 | |
| | | | | | | | | | | | | | | | | | | | | | | | | | | | |
Total from investment operations | | | 0.02 | | | | 0.11 | | | | 0.05 | | | | 0.19 | | | | 0.21 | | | | 0.05 | | | | 0.33 | |
Distributions to shareholders from | | | | | | | | | | | | | | | | | | | | | | | | | | | | |
Net investment income | | | (0.05 | ) | | | (0.08 | ) | | | (0.10 | ) | | | (0.11 | ) | | | (0.16 | )3 | | | (0.02 | )3 | | | (0.22 | ) |
Tax basis return of capital | | | 0.00 | | | | (0.02 | ) | | | (0.00 | )4 | | | (0.01 | ) | | | (0.05 | )3 | | | (0.02 | )3 | | | 0.00 | |
| | | | | | | | | | | | | | | | | | | | | | | | | | | | |
Total distributions to shareholders | | | (0.05 | ) | | | (0.10 | ) | | | (0.10 | ) | | | (0.12 | ) | | | (0.21 | ) | | | (0.04 | ) | | | (0.22 | ) |
Net asset value, end of period | | | $9.12 | | | | $9.15 | | | | $9.14 | | | | $9.19 | | | | $9.12 | | | | $9.12 | | | | $9.11 | |
Total return5 | | | 0.20 | % | | | 1.19 | % | | | 0.50 | % | | | 2.09 | % | | | 2.30 | % | | | 0.53 | % | | | 3.76 | % |
Ratios to average net assets (annualized) | | | | | | | | | | | | | | | | | | | | | | | | | | | | |
Gross expenses | | | 0.45 | % | | | 0.47 | % | | | 0.51 | % | | | 0.53 | % | | | 0.55 | % | | | 0.55 | % | | | 0.48 | % |
Net expenses | | | 0.45 | % | | | 0.46 | % | | | 0.47 | % | | | 0.49 | % | | | 0.49 | % | | | 0.49 | % | | | 0.48 | % |
Net investment income | | | 0.92 | % | | | 0.93 | % | | | 0.98 | % | | | 1.25 | % | | | 1.72 | % | | | 1.21 | % | | | 2.52 | % |
Supplemental data | | | | | | | | | | | | | | | | | | | | | | | | | | | | |
Portfolio turnover rate | | | 8 | % | | | 18 | % | | | 10 | % | | | 9 | % | | | 18 | % | | | 0 | % | | | 14 | % |
Net assets, end of period (000s omitted) | | | $901,366 | | | | $844,221 | | | | $906,698 | | | | $686,587 | | | | $597,521 | | | | $368,066 | | | | $389,075 | |
| 1 | After the close of business on July 9, 2010, the Fund acquired the net assets of Evergreen Adjustable Rate Fund which became the accounting and performance survivor in the transaction. The information for the periods prior to July 12, 2010 is that of Class I of Evergreen Adjustable Rate Fund. |
| 2 | For the two months ended August 31, 2010. The Fund changed its fiscal year end from June 30 to August 31, effective August 31, 2010. |
| 3 | Calculated based upon average shares outstanding |
| 4 | Amount is less than $0.005. |
| 5 | Returns for periods of less than one year are not annualized. |
The accompanying notes are an integral part of these financial statements.
| | | | | | |
| Notes to financial statements (unaudited) | | Wells Fargo Advantage Adjustable Rate Government Fund | | | 17 | |
1. ORGANIZATION
Wells Fargo Funds Trust (the “Trust”), a Delaware statutory trust organized on March 10, 1999, is an open-end management investment company registered under the Investment Company Act of 1940, as amended (the “1940 Act”). As an investment company, the Trust follows the accounting and reporting guidance in Financial Accounting Standards Board (“FASB”) Accounting Standards Codification Topic 946, Financial Services—Investment Companies. These financial statements report on the Wells Fargo Advantage Adjustable Rate Government Fund (the “Fund”) which is a diversified series of the Trust.
2. SIGNIFICANT ACCOUNTING POLICIES
The following significant accounting policies, which are consistently followed in the preparation of the financial statements of the Fund, are in conformity with U.S. generally accepted accounting principles which require management to make estimates and assumptions that affect the reported amounts of assets and liabilities, disclosure of contingent assets and liabilities at the date of the financial statements, and the reported amounts of revenues and expenses during the reporting period. Actual results could differ from those estimates.
Securities valuation
All investments are valued each business day as of the close of regular trading on the New York Stock Exchange (generally 4 p.m. Eastern Time).
Debt securities are valued at the evaluated bid price provided by an independent pricing service or, if a reliable price is not available, the quoted bid price from an independent broker-dealer.
Futures that are listed on a foreign or domestic exchange or market are valued at the official closing price or, if none, the last sales price.
Investments in registered open-end investment companies are valued at net asset value.
Investments which are not valued using any of the methods discussed above are valued at their fair value, as determined in good faith by the Board of Trustees of the Fund. The Board of Trustees has established a Valuation Committee comprised of the Trustees and has delegated to it the authority to take any actions regarding the valuation of portfolio securities that the Valuation Committee deems necessary or appropriate, including determining the fair value of portfolio securities, unless the determination has been delegated to the Management Valuation Team of Wells Fargo Funds Management, LLC (“Funds Management”). The Board of Trustees retains the authority to make or ratify any valuation decisions or approve any changes to the Valuation Procedures as it deems appropriate. On a quarterly basis, the Board of Trustees receives reports on any valuation actions taken by the Valuation Committee or the Management Valuation Team which may include items for ratification.
Valuations of fair valued securities are compared to the next actual sales price when available, or other appropriate market values, to assess the continued appropriateness of the fair valuation methodologies used. These securities are fair valued on a day-to-day basis, taking into consideration changes to appropriate market information and any significant changes to the inputs considered in the valuation process until there is a readily available price provided on an exchange or by an independent pricing service. Valuations received from an independent pricing service or independent broker-dealer quotes are periodically validated by comparisons to most recent trades and valuations provided by other independent pricing services in addition to the review of prices by the adviser and/or subadviser. Unobservable inputs used in determining fair valuations are identified based on the type of security, taking into consideration factors utilized by market participants in valuing the investment, knowledge about the issuer and the current market environment.
Futures contracts
The Fund is subject to interest rate risk in the normal course of pursuing its investment objectives. The Fund may buy and sell futures contracts in order to gain exposure to, or protect against, changes in security values and interest rates. The primary risks associated with the use of futures contracts are the imperfect correlation between changes in market values of securities held by the Fund and the prices of futures contracts, and the possibility of an illiquid market.
The aggregate principal amounts of the contracts are not recorded in the financial statements. Fluctuations in the value of the contracts are recorded in the Statement of Assets and Liabilities as an asset or liability and in the Statement of Operations as unrealized gains or losses until the contracts are closed, at which point they are recorded as net realized gains or losses on futures contracts. With futures contracts, there is minimal counterparty risk to the Fund since futures are exchange traded and the exchange’s clearinghouse, as counterparty to all exchange traded futures, guarantees the futures against default.
| | | | |
| 18 | | Wells Fargo Advantage Adjustable Rate Government Fund | | Notes to financial statements (unaudited) |
Security transactions and income recognition
Securities transactions are recorded on a trade date basis. Realized gains or losses are recorded on the basis of identified cost.
Interest income is accrued daily and bond discounts are accreted and premiums are amortized daily based on the effective interest method. To the extent debt obligations are placed on non-accrual status, any related interest income may be reduced by writing off interest receivables when the collection of all or a portion of interest has become doubtful based on consistently applied procedures. If the issuer subsequently resumes interest payments or when the collectability of interest is reasonably assured, the debt obligation is removed from non-accrual status.
Distributions to shareholders
Distributions to shareholders from net investment income are accrued daily and paid monthly. Distributions from net realized gains, if any, are recorded on the ex-dividend date. Such distributions are determined in conformity with federal income tax regulations, which may differ in amount or character from net investment income and realized gains recognized for purposes of U.S. generally accepted accounting principles.
Federal and other taxes
The Fund intends to continue to qualify as a regulated investment company by distributing substantially all of its investment company taxable income and any net realized capital gains (after reduction for capital loss carryforwards) sufficient to relieve it from all, or substantially all, federal income taxes. Accordingly, no provision for federal income taxes was required.
The Fund’s income and federal excise tax returns and all financial records supporting those returns for the prior three fiscal years are subject to examination by the federal and Delaware revenue authorities. Management has analyzed the Fund’s tax positions taken on federal, state, and foreign tax returns for all open tax years and does not believe that there are any uncertain tax positions that require recognition of a tax liability.
As of August 31 2014, capital loss carryforwards available to offset future net realized capital gains were as follows through the indicated expiration dates:
| | | | | | | | |
| 2015 | | 2016 | | 2017 | | 2018 | | 2019 |
| $18,541,278 | | $10,766,785 | | $24,262,054 | | $1,705,150 | | $66,443 |
Class allocations
The separate classes of shares offered by the Fund differ principally in applicable sales charges, distribution, shareholder servicing, and administration fees. Class specific expenses are charged directly to that share class. Investment income, common expenses, and realized and unrealized gains (losses) on investments are allocated daily to each class of shares based on the relative proportion of net assets of each class.
3. FAIR VALUATION MEASUREMENTS
Fair value measurements of investments are determined within a framework that has established a fair value hierarchy based upon the various data inputs utilized in determining the value of the Fund’s investments. The three-level hierarchy gives the highest priority to unadjusted quoted prices in active markets for identical assets or liabilities (Level 1) and the lowest priority to significant unobservable inputs (Level 3). The Fund’s investments are classified within the fair value hierarchy based on the lowest level of input that is significant to the fair value measurement. The inputs are summarized into three broad levels as follows:
| n | | Level 1 – quoted prices in active markets for identical securities |
| n | | Level 2 – other significant observable inputs (including quoted prices for similar securities, interest rates, prepayment speeds, credit risk, use of amortized cost, etc.) |
| n | | Level 3 – significant unobservable inputs (including the Fund’s own assumptions in determining the fair value of investments) |
The inputs or methodologies used for valuing investments in securities are not necessarily an indication of the risk associated with investing in those securities.
| | | | | | |
| Notes to financial statements (unaudited) | | Wells Fargo Advantage Adjustable Rate Government Fund | | | 19 | |
The following is a summary of the inputs used in valuing the Fund’s assets and liabilities as of February 28, 2015:
| | | | | | | | | | | | | | | | |
| | | Quoted prices
(Level 1) | | | Other significant
observable inputs
(Level 2) | | | Significant
unobservable inputs
(Level 3) | | | Total | |
Assets | | | | | | | | | | | | | | | | |
Investments in: | | | | | | | | | | | | | | | | |
| | | | |
Agency securities | | $ | 0 | | | $ | 1,279,495,413 | | | $ | 0 | | | $ | 1,279,495,413 | |
| | | | |
Short-term investments | | | | | | | | | | | | | | | | |
Investment companies | | | 76,055,353 | | | | 0 | | | | 0 | | | | 76,055,353 | |
U.S. Treasury securities | | | 899,994 | | | | 0 | | | | 0 | | | | 899,994 | |
Total assets | | $ | 76,955,347 | | | $ | 1,279,495,413 | | | $ | 0 | | | $ | 1,356,450,760 | |
Liabilities | | | | | | | | | | | | | | | | |
| | | | |
Futures contracts | | $ | 100,469 | | | $ | 0 | | | $ | 0 | | | $ | 100,469 | |
Total liabilities | | $ | 100,469 | | | $ | 0 | | | $ | 0 | | | $ | 100,469 | |
Futures contracts are reported at their variation margin at measurement date, which represents the amount due from the Fund at that date. All other assets and liabilities are reported at their market value at measurement date.
The Fund recognizes transfers between levels within the fair value hierarchy at the end of the reporting period. At February 28, 2015, the Fund did not have any transfers into/out of Level 1, Level 2, or Level 3.
4. TRANSACTIONS WITH AFFILIATES
Advisory fee
The Trust has entered into an advisory contract with Funds Management, an indirect wholly owned subsidiary of Wells Fargo & Company (“Wells Fargo”). The adviser is responsible for implementing investment policies and guidelines and for supervising the subadviser, who is responsible for day-to-day portfolio management of the Fund.
Pursuant to the contract, Funds Management is entitled to receive an annual advisory fee starting at 0.30% and declining to 0.225% as the average daily net assets of the Fund increase. For the six months ended February 28, 2015, the advisory fee was equivalent to an annual rate of 0.29% of the Fund’s average daily net assets.
Funds Management has retained the services of a subadviser to provide daily portfolio management to the Fund. The fee for subadvisory services is borne by Funds Management. Wells Capital Management Incorporated, an affiliate of Funds Management and an indirect wholly owned subsidiary of Wells Fargo, is the subadviser to the Fund and is entitled to receive a fee from Funds Management at an annual rate starting at 0.20% and declining to 0.10% as the average daily net assets of the Fund increase.
Administration fees
The Trust has entered into an administration agreement with Funds Management. Under this agreement, for providing administrative services, which includes paying fees and expenses for services provided by the transfer agent, sub-transfer agents, omnibus account servicers and record-keepers, Funds Management is entitled to receive from the Fund an annual fund level administration fee starting at 0.05% and declining to 0.03% as the average daily net assets of the Fund increase and a class level administration fee which is calculated based on the average daily net assets of each class as follows:
| | | | |
| | | Class level
administration fee | |
Class A, Class B, Class C | | | 0.16 | % |
Administrator Class | | | 0.10 | |
Institutional Class | | | 0.08 | |
Funds Management has contractually waived and/or reimbursed advisory and administration fees to the extent necessary to maintain certain net operating expense ratios for the Fund. Waiver of fees and/or reimbursement of expenses by Funds Management were made first from fund level expenses on a proportionate basis and then from class
| | | | |
| 20 | | Wells Fargo Advantage Adjustable Rate Government Fund | | Notes to financial statements (unaudited) |
specific expenses. Funds Management has committed through December 31, 2015 to waive fees and/or reimburse expenses to the extent necessary to cap the Fund’s expenses at 0.74% for Class A shares, 1.49% for Class B shares, 1.49% for Class C shares, 0.60% for Administrator Class shares, and 0.46 for Institutional Class shares. After this time, the cap may be increased or the commitment to maintain the cap may be terminated only with the approval of the Board of Trustees.
Distribution fees
The Trust has adopted a Distribution Plan for Class B and Class C shares of the Fund pursuant to Rule 12b-1 under the 1940 Act. Distribution fees are charged to Class B and Class C shares and paid to Wells Fargo Funds Distributor, LLC (“Funds Distributor”), the principal underwriter, at an annual rate of 0.75% of the average daily net assets of Class B and Class C shares.
In addition, Funds Distributor is entitled to receive the front-end sales charges from the purchase of Class A shares and a contingent deferred sales charge on the redemption of certain shares. Funds Distributor is also entitled to receive the contingent deferred sales charges from redemptions of Class A, Class B, and Class C shares. For the six months ended February 28, 2015, Funds Distributor received $733 from the sale of Class A shares and $792 and $954 in contingent deferred sales charges from redemptions of Class A and Class C shares, respectively.
Shareholder servicing fees
The Trust has entered into contracts with one or more shareholder servicing agents, whereby Class A, Class B, Class C, and Administrator Class of the Fund is charged a fee at an annual rate of 0.25% of the average daily net assets of each respective class.
A portion of these total shareholder servicing fees were paid to affiliates of Wells Fargo.
5. INVESTMENT PORTFOLIO TRANSACTIONS
Purchases and sales of U.S. government obligations, excluding short-term securities, for the six months ended February 28, 2015 were $170,180,695 and $102,262,459, respectively.
6. DERIVATIVE TRANSACTIONS
During the six months ended February 28, 2015, the Fund entered into futures contracts to speculate on interest rates and to help manage the duration of the portfolio.
At February 28, 2015, the Fund had short futures contracts outstanding as follows:
| | | | | | | | | | | | | | | | | | |
| Expiration date | | Counterparty | | Contracts | | | Type | | | Contract value at February 28, 2015 | | | Unrealized
losses | |
| 6-19-2015 | | JPMorgan | | | 267 Short | | | | 10-Year U.S. Treasury Notes | | | $ | 34,121,766 | | | $ | (121,491 | ) |
| 6-30-2015 | | JPMorgan | | | 470 Short | | | | 5-Year U.S. Treasury Notes | | | | 56,062,188 | | | | (125,737 | ) |
The Fund had an average notional amount of $89,833,596 in short futures contracts during the six months ended February 28, 2015.
On February 28, 2015, the cumulative unrealized losses on futures contracts in the amount of $247,228 are reflected in net unrealized gains on investments on the Statement of Assets and Liabilities. The payable for daily variation margin on open futures contracts reflected in the Statement of Assets and Liabilities only represents the current day’s variation margin. The realized losses and change in unrealized gains (losses) on futures contracts are reflected in the Statement of Operations.
For certain types of derivative transactions, the Fund has entered into International Swaps and Derivatives Association, Inc. master agreements (“ISDA Master Agreements”) or similar agreements with approved counterparties. The ISDA Master Agreements or similar agreements may have requirements to deliver/deposit securities or cash to/with an exchange or broker-dealer as collateral and allows the Fund to offset, with each counterparty, certain derivative financial instrument’s assets and/or liabilities with collateral held or pledged. Collateral requirements differ by type of derivative. Collateral or margin requirements are set by the broker or exchange clearing house for exchange traded derivatives while collateral terms are contract specific for over-the-counter traded derivatives. Cash collateral that has been pledged to cover obligations of the Fund under ISDA Master Agreements or similar agreements, if any, will be reported separately in the Statement of Assets and Liabilities. Securities pledged as collateral, if any, for the same purpose are noted in the Summary Portfolio of Investments. With respect to balance sheet offsetting, absent an event of default by the
| | | | | | |
| Notes to financial statements (unaudited) | | Wells Fargo Advantage Adjustable Rate Government Fund | | | 21 | |
counterparty or a termination of the agreement, the reported amounts of financial assets and financial liabilities in the Statement of Assets and Liabilities are not offset across transactions between the Fund and the applicable counterparty. A reconciliation of the gross amounts on the Statement of Assets and Liabilities to the net amounts by derivative type, including any collateral exposure, is as follows:
| | | | | | | | | | | | | | | | |
| Derivative type | | Counterparty | | Gross amounts
of liabilities in the
Statement of
Assets and
Liabilities | | Amounts
subject to
netting
agreements | | | Collateral
pledged1 | | | Net amount
of liabilities | |
Futures – variation margin | | JPMorgan | | $100,469 | | $ | 0 | | | $ | (100,469 | ) | | $ | 0 | |
| | 1 | Collateral pledged within this table is limited to the collateral for the net transaction with the counterparty. | |
7. BANK BORROWINGS
The Trust (excluding the money market funds and certain other funds in the Trust) and Wells Fargo Variable Trust are parties to a $150,000,000 revolving credit agreement, whereby the Fund is permitted to use bank borrowings for temporary or emergency purposes, such as to fund shareholder redemption requests. Interest under the credit agreement is charged to the Fund based on a borrowing rate equal to the higher of the Federal Funds rate in effect on that day plus 1.25% or the overnight LIBOR rate in effect on that day plus 1.25%. In addition, an annual commitment fee equal to 0.10% of the unused balance is allocated to each participating fund. For the six months ended February 28, 2015, the Fund paid $250 in commitment fees.
For the six months ended February 28, 2015, there were no borrowings by the Fund under the agreement.
8. INDEMNIFICATION
Under the Trust’s organizational documents, the officers and Trustees are indemnified against certain liabilities that may arise out of performance of their duties to the Trust. Additionally, in the normal course of business, the Trust may enter into contracts with service providers that contain a variety of indemnification clauses. The Trust’s maximum exposure under these arrangements is dependent on future claims that may be made against the Fund and, therefore, cannot be estimated.
| | | | |
| 22 | | Wells Fargo Advantage Adjustable Rate Government Fund | | Other information (unaudited) |
PROXY VOTING INFORMATION
A description of the policies and procedures that the Fund uses to determine how to vote proxies relating to portfolio securities is available, upon request, by calling 1-800-222-8222, visiting our website at wellsfargoadvantagefunds.com, or visiting the SEC website at sec.gov. Information regarding how the Fund voted proxies relating to portfolio securities during the most recent 12-month period ended June 30 is available on the Fund’s website at wellsfargoadvantagefunds.com or by visiting the SEC website at sec.gov.
PORTFOLIO HOLDINGS INFORMATION
The complete portfolio holdings for the Fund are publicly available monthly on the Fund’s website (wellsfargoadvantagefunds.com), on a one-month delayed basis. In addition, top ten holdings information (excluding derivative positions) for the Fund is publicly available on the Fund’s website on a monthly, seven-day or more delayed basis. The Fund files its complete schedule of portfolio holdings with the SEC for the first and third quarters of each fiscal year on Form N-Q, which is available by visiting the SEC website at sec.gov. In addition, the Fund’s Form N-Q may be reviewed and copied at the SEC’s Public Reference Room in Washington, DC, and at regional offices in New York City, at 233 Broadway, and in Chicago, at 175 West Jackson Boulevard, Suite 900. Information about the Public Reference Room may be obtained by calling 1-800-SEC-0330.
| | | | | | |
| Other information (unaudited) | | Wells Fargo Advantage Adjustable Rate Government Fund | | | 23 | |
BOARD OF TRUSTEES AND OFFICERS
Each of the Trustees and Officers1 listed in the table below acts in identical capacities for each fund in the Wells Fargo Advantage family of funds, which consists of 134 mutual funds comprising the Wells Fargo Funds Trust, Wells Fargo Variable Trust, Wells Fargo Master Trust and four closed-end funds (collectively the “Fund Complex”). This table should be read in conjunction with the Prospectus and the Statement of Additional Information2. The mailing address of each Trustee and Officer is 525 Market Street, 12th Floor, San Francisco, CA 94105. Each Trustee and Officer serves an indefinite term, however, each Trustee serves such term until reaching the mandatory retirement age established by the Trustees.
Independent Trustees
| | | | | | |
Name and
year of birth | | Position held and
length of service* | | Principal occupations during past five years or longer | | Other
directorships during
past five years |
| William R. Ebsworth (Born 1957) | | Trustee, since 2015** | | Retired. From 1984 to 2013, equities analyst, portfolio manager, research director at Fidelity Management and Research Company and retired in 2013 as Chief Investment Officer of Fidelity Strategic Advisers, Inc. in Boston, Tokyo, and Hong Kong where he led a team of investment professionals managing client assets. Prior thereto, Board member of Hong Kong Securities Clearing Co., Hong Kong Options Clearing Corp., the Thailand International Fund, Ltd., Fidelity Investments Life Insurance Company, and Empire Fidelity Investments Life Insurance Company. Mr. Ebsworth is an Adjunct Lecturer, Finance, at Babson College and a Chartered Financial Analyst. | | Asset Allocation Trust |
Jane A. Freeman
(Born 1953) | | Trustee, since 2015** | | Retired. From 2012 to 2014 and 1999 to 2008, Chief Financial Officer of Scientific Learning Corporation. From 2008 to 2012, Ms. Freeman provided consulting services related to strategic business projects. Prior thereto, Portfolio Manager at Rockefeller & Co. and Scudder, Stevens & Clark. Board member of the Harding Loevner Funds from 1996 to 2014, serving as both Lead Independent Director and chair of the Audit Committee. Board member of the Russell Exchange Traded Funds Trust from 2011 to 2012 and the chair of the Audit Committee. Ms. Freeman is a Chartered Financial Analyst (inactive), Chair of Taproot Foundation (non-profit organization) and a Board Member of Ruth Bancroft Garden (non-profit organization). | | Asset Allocation Trust |
Peter G. Gordon
(Born 1942) | | Trustee, since 1998; Chairman, since 2005 | | Co-Founder, Retired Chairman, President and CEO of Crystal Geyser Water Company. Trustee Emeritus, Colby College. | | Asset Allocation Trust |
Isaiah Harris, Jr.
(Born 1952) | | Trustee, since 2009 | | Retired. Chairman of the Board of CIGNA Corporation since 2009, and Director since 2005. From 2003 to 2011, Director of Delux Corporation. Prior thereto, President and CEO of BellSouth Advertising and Publishing Corp. from 2005 to 2007, President and CEO of BellSouth Enterprises from 2004 to 2005 and President of BellSouth Consumer Services from 2000 to 2003. Emeritus member of the Iowa State University Foundation Board of Governors. Emeritus Member of the Advisory Board of Iowa State University School of Business. Advisory Board Member, Palm Harbor Academy. Mr. Harris is a certified public accountant. | | CIGNA Corporation; Asset Allocation Trust |
Judith M. Johnson
(Born 1949) | | Trustee, since 2008;
Audit Committee
Chairman, since 2008 | | Retired. Prior thereto, Chief Executive Officer and Chief Investment Officer of Minneapolis Employees Retirement Fund from 1996 to 2008. Ms. Johnson is an attorney, certified public accountant and a certified managerial accountant. | | Asset Allocation Trust |
David F. Larcker
(Born 1950) | | Trustee, since 2009 | | James Irvin Miller Professor of Accounting at the Graduate School of Business, Stanford University, Morgan Stanley Director of the Center for Leadership Development and Research and Senior Faculty of The Rock Center for Corporate Governance since 2006. From 2005 to 2008, Professor of Accounting at the Graduate School of Business, Stanford University. Prior thereto, Ernst & Young Professor of Accounting at The Wharton School, University of Pennsylvania from 1985 to 2005. | | Asset Allocation Trust |
Olivia S. Mitchell
(Born 1953) | | Trustee, since 2006 | | International Foundation of Employee Benefit Plans Professor, Wharton School of the University of Pennsylvania since 1993. Director of Wharton’s Pension Research Council and Boettner Center on Pensions & Retirement Research, and Research Associate at the National Bureau of Economic Research. Previously, Cornell University Professor from 1978 to 1993. | | Asset Allocation Trust |
| | | | |
| 24 | | Wells Fargo Advantage Adjustable Rate Government Fund | | Other information (unaudited) |
| | | | | | |
Name and
year of birth | | Position held and
length of service* | | Principal occupations during past five years or longer | | Other
directorships during
past five years |
Timothy J. Penny
(Born 1951) | | Trustee, since 1996 | | President and Chief Executive Officer of Southern Minnesota Initiative Foundation, a non-profit organization, since 2007 and Senior Fellow at the Humphrey Institute Policy Forum at the University of Minnesota since 1995. Member of the Board of Trustees of NorthStar Education Finance, Inc., a non-profit organization, since 2007. | | Asset Allocation Trust |
Michael S. Scofield
(Born 1943) | | Trustee, since 2010 | | Served on the Investment Company Institute’s Board of Governors and Executive Committee from 2008-2011 as well the Governing Council of the Independent Directors Council from 2006-2011 and the Independent Directors Council Executive Committee from 2008-2011. Chairman of the IDC from 2008-2010. Institutional Investor (Fund Directions) Trustee of Year in 2007. Trustee of the Evergreen Funds complex (and its predecessors) from 1984 to 2010. Chairman of the Evergreen Funds from 2000-2010. Former Trustee of the Mentor Funds. Retired Attorney, Law Offices of Michael S. Scofield. | | Asset Allocation Trust |
Donald C. Willeke
(Born 1940) | | Trustee, since 1996 | | Principal of the law firm of Willeke & Daniels. General Counsel of the Minneapolis Employees Retirement Fund from 1984 until its consolidation into the Minnesota Public Employees Retirement Association on June 30, 2010. Director and Vice Chair of The Tree Trust (non-profit corporation). Director of the American Chestnut Foundation (non-profit corporation). | | Asset Allocation Trust |
| * | Length of service dates reflect the Trustee’s commencement of service with the Trust’s predecessor entities, where applicable. |
| ** | William R. Ebsworth and Jane A. Freeman each became a Trustee effective January 1, 2015. |
Officers
| | | | | | |
Name and year of birth | | Position held and
length of service | | Principal occupations during past five years or longer | | |
| Karla M. Rabusch (Born 1959) | | President, since 2003 | | Executive Vice President of Wells Fargo Bank, N.A. and President of Wells Fargo Funds Management, LLC since 2003. | | |
Nancy Wiser1
(Born 1967) | | Treasurer, since 2012 | | Executive Vice President of Wells Fargo Funds Management, LLC since 2011. Chief Operating Officer and Chief Compliance Officer at LightBox Capital Management LLC, from 2008 to 2011. Owned and operated a consulting business providing services to various hedge funds including acting as Chief Operating Officer and Chief Compliance Officer for a hedge fund from 2007 to 2008. Chief Operating Officer and Chief Compliance Officer of GMN Capital LLC from 2006 to 2007. | | |
C. David Messman
(Born 1960) | | Secretary, since 2000; Chief Legal Officer, since 2003 | | Senior Vice President and Secretary of Wells Fargo Funds Management, LLC since 2001. Assistant General Counsel of Wells Fargo Bank, N.A. since 2013 and Vice President and Managing Counsel of Wells Fargo Bank N.A. from 1996 to 2013. | | |
Debra Ann Early
(Born 1964) | | Chief Compliance Officer, since 2007 | | Senior Vice President of Wells Fargo Funds Management, LLC since 2007 and Chief Compliance Officer from 2007 to 2014. Chief Compliance Officer of Parnassus Investments from 2005 to 2007. Chief Financial Officer of Parnassus Investments from 2004 to 2007 and Senior Audit Manager of PricewaterhouseCoopers LLP from 1998 to 2004. | | |
David Berardi
(Born 1975) | | Assistant Treasurer, since 2009 | | Vice President of Wells Fargo Funds Management, LLC since 2009. Vice President of Evergreen Investment Management Company, LLC from 2008 to 2010. Assistant Vice President of Evergreen Investment Services, Inc. from 2004 to 2008. Manager of Fund Reporting and Control for Evergreen Investment Management Company, LLC from 2004 to 2010. | | |
Jeremy DePalma1
(Born 1974) | | Assistant Treasurer, since 2009 | | Senior Vice President of Wells Fargo Funds Management, LLC since 2009. Senior Vice President of Evergreen Investment Management Company, LLC from 2008 to 2010. Vice President, Evergreen Investment Services, Inc. from 2004 to 2007. Head of the Fund Reporting and Control Team within Fund Administration from 2005 to 2010. | | |
| 1 | Nancy Wiser acts as Treasurer of 73 funds in the Fund Complex. Jeremy DePalma acts as Treasurer of 61 funds and Assistant Treasurer of 73 funds in the Fund Complex. |
| 2 | The Statement of Additional Information includes additional information about the Trustees and is available, without charge, upon request, by calling 1-800-222-8222 or by visiting the website at wellsfargoadvantagefunds.com. |
| | | | | | |
| List of abbreviations | | Wells Fargo Advantage Adjustable Rate Government Fund | | | 25 | |
The following is a list of common abbreviations for terms and entities that may have appeared in this report.
| ACA | — ACA Financial Guaranty Corporation |
| ADR | — American depositary receipt |
| ADS | — American depositary shares |
| AGC | — Assured Guaranty Corporation |
| AGM | — Assured Guaranty Municipal |
| Ambac | — Ambac Financial Group Incorporated |
| AMT | — Alternative minimum tax |
| BAN | — Bond anticipation notes |
| BHAC | — Berkshire Hathaway Assurance Corporation |
| CAB | — Capital appreciation bond |
| CCAB | — Convertible capital appreciation bond |
| CDA | — Community Development Authority |
| CDO | — Collateralized debt obligation |
| DRIVER | — Derivative inverse tax-exempt receipts |
| DW&P | — Department of Water & Power |
| DWR | — Department of Water Resources |
| ECFA | — Educational & Cultural Facilities Authority |
| EDA | — Economic Development Authority |
| EDFA | — Economic Development Finance Authority |
| ETF | — Exchange-traded fund |
| FDIC | — Federal Deposit Insurance Corporation |
| FFCB | — Federal Farm Credit Banks |
| FGIC | — Financial Guaranty Insurance Corporation |
| FHA | — Federal Housing Administration |
| FHLB | — Federal Home Loan Bank |
| FHLMC | — Federal Home Loan Mortgage Corporation |
| FICO | — The Financing Corporation |
| FNMA | — Federal National Mortgage Association |
| GDR | — Global depositary receipt |
| GNMA | — Government National Mortgage Association |
| HCFR | — Healthcare facilities revenue |
| HEFA | — Health & Educational Facilities Authority |
| HEFAR | — Higher education facilities authority revenue |
| HFA | — Housing Finance Authority |
| HFFA | — Health Facilities Financing Authority |
| HUD | — Department of Housing and Urban Development |
| IDA | — Industrial Development Authority |
| IDAG | — Industrial Development Agency |
| KRW | — Republic of Korea won |
| LIBOR | — London Interbank Offered Rate |
| LIFER | — Long Inverse Floating Exempt Receipts |
| LLC | — Limited liability company |
| LLLP | — Limited liability limited partnership |
| LLP | — Limited liability partnership |
| MBIA | — Municipal Bond Insurance Association |
| MFHR | — Multifamily housing revenue |
| MSTR | — Municipal securities trust receipts |
| MUD | — Municipal Utility District |
| National | — National Public Finance Guarantee Corporation |
| PCFA | — Pollution Control Financing Authority |
| PCL | — Public Company Limited |
| PCR | — Pollution control revenue |
| PFA | — Public Finance Authority |
| PFFA | — Public Facilities Financing Authority |
| PFOTER | — Puttable floating option tax-exempt receipts |
| plc | — Public limited company |
| PUTTER | — Puttable tax-exempt receipts |
| R&D | — Research & development |
| Radian | — Radian Asset Assurance |
| RAN | — Revenue anticipation notes |
| RDA | — Redevelopment Authority |
| RDFA | — Redevelopment Finance Authority |
| REIT | — Real estate investment trust |
| ROC | — Reset option certificates |
| SAVRS | — Select auction variable rate securities |
| SBA | — Small Business Authority |
| SFHR | — Single-family housing revenue |
| SFMR | — Single-family mortgage revenue |
| SPA | — Standby purchase agreement |
| SPDR | — Standard & Poor’s Depositary Receipts |
| SPEAR | — Short Puttable Exempt Adjustable Receipts |
| STRIPS | — Separate trading of registered interest and |
| TAN | — Tax anticipation notes |
| TIPS | — Treasury inflation-protected securities |
| TRAN | — Tax revenue anticipation notes |
| TTFA | — Transportation Trust Fund Authority |
| TVA | — Tennessee Valley Authority |
This page is intentionally left blank.
This page is intentionally left blank.
This page is intentionally left blank.


For more information
More information about Wells Fargo Advantage Funds is available free upon request. To obtain literature, please write, email, visit the Fund’s website, or call:
Wells Fargo Advantage Funds
P.O. Box 8266
Boston, MA 02266-8266
Email: wfaf@wellsfargo.com
Website: wellsfargoadvantagefunds.com
Individual investors: 1-800-222-8222
Retail investment professionals: 1-888-877-9275
Institutional investment professionals: 1-866-765-0778
This report and the financial statements contained herein are submitted for the general information of the shareholders of Wells Fargo Advantage Funds. If this report is used for promotional purposes, distribution of the report must be accompanied or preceded by a current prospectus. Before investing, please consider the investment objectives, risks, charges, and expenses of the investment. For a current prospectus and, if available, a summary prospectus, containing this information, call 1-800-222-8222 or visit the Fund’s website at wellsfargoadvantagefunds.com. Read the prospectus carefully before you invest or send money.
Wells Fargo Funds Management, LLC, a wholly owned subsidiary of Wells Fargo & Company, provides investment advisory and administrative services for Wells Fargo Advantage Funds. Other affiliates of Wells Fargo & Company provide subadvisory and other services for the Funds. The Funds are distributed by Wells Fargo Funds Distributor, LLC, Member FINRA/SIPC, an affiliate of Wells Fargo & Company.
NOT FDIC INSURED ¡ NO BANK GUARANTEE ¡ MAY LOSE VALUE
© 2015 Wells Fargo Funds Management, LLC. All rights reserved.
| | |
 | | 232051 04-15 SA215/SAR215 02-15 |

Wells Fargo Advantage Conservative Income Fund

Semi-Annual Report
February 28, 2015

Reduce clutter. Save trees.
Sign up for electronic delivery of prospectuses and shareholder reports at wellsfargo.com/advantagedelivery
Contents
The views expressed and any forward-looking statements are as of February 28, 2015, unless otherwise noted, and are those of the Fund managers and/or Wells Fargo Funds Management, LLC. Discussions of individual securities, or the markets generally, or any Wells Fargo Advantage Fund are not intended as individual recommendations. Future events or results may vary significantly from those expressed in any forward-looking statements; the views expressed are subject to change at any time in response to changing circumstances in the market. Wells Fargo Funds Management, LLC and the Fund disclaim any obligation to publicly update or revise any views expressed or forward-looking statements.
NOT FDIC INSURED ¡ NO BANK GUARANTEE ¡ MAY LOSE VALUE
| | | | |
| 2 | | Wells Fargo Advantage Conservative Income Fund | | Letter to shareholders (unaudited) |

Karla M. Rabusch
President
Wells Fargo Advantage Funds
Major central banks continued to inject liquidity into global banks and markets through various accommodative monetary policies, including quantitative easing.
Dear Valued Shareholder:
We are pleased to offer you this semi-annual report for the Wells Fargo Advantage Conservative Income Fund for the six-month period that ended February 28, 2015. The period was marked by low interest rates, a large decline in oil prices, and moderate U.S. economic growth. Investment-grade bonds, as measured by the Barclays U.S. Aggregate Bond Index1, returned 2.25% during the period.
Major central banks continued to provide stimulus.
Major central banks continued to inject liquidity into global banks and markets through various accommodative monetary policies, including quantitative easing. In the U.S., the Federal Reserve (Fed) kept its key interest rate near zero in order to support the economy and the financial system. It ended its quantitative easing program in October 2014 and also set expectations for it to begin normalizing monetary policy with higher target ranges for the federal funds rate in 2015.
Meanwhile, European markets continued to benefit from the European Central Bank’s (ECB’s) willingness to maintain low interest rates. In September 2014, the ECB cut its key rate to a historic low of 0.05%. In addition to its targeted longer-term refinancing operations that are designed to increase bank lending, the ECB said it intends to increase the size of its balance sheet, a result of quantitative easing, by buying eurozone government bonds. In Japan, the Bank of Japan maintained an aggressive monetary program aimed at combating deflation.
U.S. economic growth was moderate, and oil prices plummeted.
Economic growth advanced during the reporting period, the unemployment rate ticked lower to 5.5% as of February 2015, and inflation remained below the Fed’s longer-run objective of a 2% pace. The period was also marked by dramatically lower oil prices, which fell from more than $90 per barrel at the end of August 2014 to below $50 per barrel at the end of February 2015. While lower oil prices benefited consumers of oil products, the lower prices pressured companies within the energy sector.
Longer-dated securities and higher-rated credits were top performers.
Ten-year U.S. Treasury rates declined during the period, from 2.35% at end of August 2014 to 2.03% by the end of February 2015, benefiting both from safe-haven status as well as relative attractiveness to global investors. With the U.S. economy the furthest along its business cycle, the level of interest rates in the U.S. and Europe diverged. The 10-year U.S. Treasury yield was 2.03% at the end of February 2015 compared with 0.30% for 10-year German government yields, 173 basis points (bps; 100 bps equals 1.00%) higher. This was largely attributed to the Fed being closer to eventually increasing interest rates while the ECB potentially needs to further increase, rather than scale back, its amount of accommodation. Further, U.S. economic activity was healthier than Europe’s.
Treasury bonds with maturities greater than 20 years returned more than 10% during the six-month period that ended February 28, 2015, according to the Barclays U.S. Aggregate Bond Index. This was due, in part, to strong demand from overseas investors because yields in Europe and Japan were substantially lower than U.S. yields. In addition, because the dollar strengthened, the returns from Treasuries were even higher for foreign-domiciled investors. Longer-maturity debt across all sectors outperformed shorter-dated securities.
| 1 | The Barclays U.S. Aggregate Bond Index is a broad-based benchmark that measures the investment-grade, U.S. dollar-denominated, fixed-rate taxable bond market, including Treasuries, government-related and corporate securities, MBS (agency fixed-rate and hybrid ARM passthroughs), ABS, and CMBS. You cannot invest directly in an index. |
| | | | | | |
| Letter to shareholders (unaudited) | | Wells Fargo Advantage Conservative Income Fund | | | 3 | |
Investment-grade corporate bonds returned 2.29% during the six-month reporting period, according to the Barclays U.S. Aggregate Bond Index, and AAA-rated2 bonds had higher returns than BBB-rated bonds. Lower-rated credits, including high yield, underperformed as oil prices fell dramatically. Not only were many energy and mining companies negatively affected, but investor trepidation about weak global growth caused investment-grade spreads to modestly widen while high-yield spreads widened substantially.
Don’t let short-term uncertainty derail long-term investment goals.
Periods of uncertainty can present challenges, but experience has taught us that maintaining long-term investment goals can be an effective way to plan for the future. To help you create a sound strategy based on your personal goals and risk tolerance, Wells Fargo Advantage Funds offers more than 100 mutual funds and other investments spanning a wide range of asset classes and investment styles. Although diversification cannot guarantee an investment profit or prevent losses, we believe it can be an effective way to manage investment risk and potentially smooth out overall portfolio performance. We encourage investors to know their investments and to understand that appropriate levels of risk-taking may unlock opportunities.
Thank you for choosing to invest with Wells Fargo Advantage Funds. We appreciate your confidence in us and remain committed to helping you meet your financial needs. For current information about your fund investments, contact your investment professional, visit our website at wellsfargoadvantagefunds.com, or call us directly at 1-800-222-8222. We are available 24 hours a day, 7 days a week.
Sincerely,

Karla M. Rabusch
President
Wells Fargo Advantage Funds
Periods of uncertainty can present challenges, but experience has taught us that maintaining long-term investment goals can be an effective way to plan for the future.
| 2 | The ratings indicated are from Standard & Poor’s, Moody’s Investors Service, and/or Fitch Ratings Ltd. Standard & Poor’s rates the creditworthiness of bonds from AAA (highest) to D (lowest). Ratings from A to CCC may be modified by the addition of a plus (+) or minus (-) sign to show relative standing within the rating categories. Moody’s rates the creditworthiness of bonds from Aaa (highest) to C (lowest). Ratings Aa to B may be modified by the addition of a number 1 (highest) to 3 (lowest) to show relative standing within the ratings categories. Fitch rates the creditworthiness of bonds from AAA (highest) to D (lowest). |
| | | | |
| 4 | | Wells Fargo Advantage Conservative Income Fund | | Performance highlights (unaudited) |
Investment objective
The Fund seeks current income consistent with capital preservation.
Adviser
Wells Fargo Funds Management, LLC
Subadviser
Wells Capital Management Incorporated
Portfolio managers
Andrew M. Greenberg, CFA
Anthony J. Melville, CFA
Jeffrey L. Weaver, CFA
Average annual total returns (%) as of February 28, 2015
| | | | | | | | | | | | | | | | | | |
| | | | | | | | Expense ratios1 (%) | |
| | | Inception date | | 1 year | | | Since inception | | | Gross | | | Net2 | |
| Institutional Class (WCIIX) | | 5-31-2013 | | | 0.28 | | | | 0.46 | | | | 0.43 | | | | 0.27 | |
| Barclays 6-9 Month Treasury Bill Index3 | | – | | | 0.13 | | | | 0.11 | * | | | – | | | | – | |
| * | | Based on inception date of Institutional Class. |
Figures quoted represent past performance, which is no guarantee of future results, and do not reflect taxes that a shareholder may pay on fund distributions or the redemption of fund shares. Investment return and principal value of an investment will fluctuate so that an investor’s shares, when redeemed, may be worth more or less than their original cost. Current performance may be lower or higher than the performance data quoted, which assumes the reinvestment of dividends and capital gains. Current month-end performance is available on the Fund’s website, wellsfargoadvantagefunds.com.
Index returns do not include transaction costs associated with buying and selling securities, any mutual fund fees or expenses, or any taxes. It is not possible to invest directly in an index.
Institutional Class shares are sold without a front-end sales charge or contingent deferred sales charge.
Bond values fluctuate in response to the financial condition of individual issuers, general market and economic conditions, and changes in interest rates. Changes in market conditions and government policies may lead to periods of heightened volatility in the bond market and reduced liquidity for certain bonds held by the Fund. In general, when interest rates rise, bond values fall and investors may lose principal value. Interest-rate changes and their impact on the fund and its share price can be sudden and unpredictable. The use of derivatives may reduce returns and/or increase volatility. Certain investment strategies tend to increase the total risk of an investment (relative to the broader market). The use of derivatives may reduce returns and/or increase volatility. The Fund is exposed to foreign investment risk, mortgage- and asset-backed securities risk, and municipal securities risk. Consult the Fund’s prospectus for additional information on these and other risks.
Please see footnotes on page 5.
| | | | | | |
| Performance highlights (unaudited) | | Wells Fargo Advantage Conservative Income Fund | | | 5 | |
| | | | |
| Ten largest long-term holdings4 (%) as of February 28, 2015 | |
Citibank Credit Card Issuance Trust Series 2013-A3 Class A3, 1.11%, 7-23-2018 | | | 1.60 | |
Penarth Master Issuer Series 2013-1A Class A1, 0.56%, 11-18-2017 | | | 1.51 | |
Nissan Auto Lease Trust Series 2014-A Class A2A, 0.48%, 9-15-2016 | | | 1.43 | |
La Caisse Centrale Desjardins du Quebec, 0.92%, 1-29-2018 | | | 1.42 | |
Principal Life Global Funding II, 1.00%, 12-11-2015 | | | 1.33 | |
Harley-Davidson Financial Services Incorporated, 3.88%, 3-15-2016 | | | 1.33 | |
JPMorgan Chase & Company, 0.78%, 2-15-2017 | | | 1.33 | |
American Express Credit Account Master Trust Series 2012-2 Class A, 0.68%, 3-15-2018 | | | 1.29 | |
Bank of the West Auto Trust Series 2014-1 Class A2, 0.69%, 7-17-2017 | | | 1.21 | |
CarMax Auto Owner Trust Series 2014-4 Class A2A, 0.67%, 2-15-2018 | | | 1.21 | |
|
| Portfolio allocation5 as of February 28, 2015 |
|
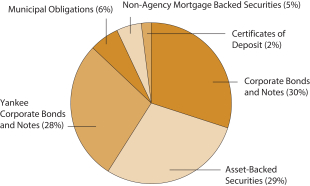 |
| 1 | Reflects the expense ratios as stated in the most recent prospectus. The expense ratios shown are subject to change and may differ from the annualized expense ratio shown in the financial highlights of this report. |
| 2 | The Adviser has committed through December 31, 2015, to waive fees and/or reimburse expenses to the extent necessary to cap the Fund’s Total Annual Fund Operating Expenses After Fee Waiver, excluding certain expenses, at the amount shown. After this time, the cap may be increased or the commitment to maintain the cap may be terminated only with the approval of the Board of Trustees. Brokerage commissions, stamp duty fees, interest, taxes, acquired fund fees and expenses, and extraordinary expenses are excluded from the cap. Without this cap, the Fund’s returns would have been lower. |
| 3 | The Barclays 6–9 Month Treasury Bill Index includes all publicly issued zero-coupon U.S. Treasury bills that have a remaining maturity of less than nine months and more than six, are rated investment-grade, and have $250 million or more of outstanding face value. You cannot invest directly in an index. |
| 4 | The ten largest long-term holdings are calculated based on the value of the securities divided by total net assets of the Fund. Holdings are subject to change and may have changed since the date specified. |
| 5 | Amounts are calculated based on the total long-term investments of the Fund. These percentages are subject to change and may have changed since the date specified. |
| | | | |
| 6 | | Wells Fargo Advantage Conservative Income Fund | | Fund expenses (unaudited) |
As a shareholder of the Fund, you incur ongoing costs and other Fund expenses. This example is intended to help you understand your ongoing costs (in dollars) of investing in the Fund and to compare these costs with the ongoing costs of investing in other mutual funds.
The example is based on an investment of $1,000 invested at the beginning of the six-month period and held for the entire period from September 1, 2014 to February 28, 2015.
Actual expenses
The “Actual” line of the table below provides information about actual account values and actual expenses. You may use the information in this line, together with the amount you invested, to estimate the expenses that you paid over the period. Simply divide your account value by $1,000 (for example, an $8,600 account value divided by $1,000 = 8.6), then multiply the result by the number in the “Actual” line under the heading entitled “Expenses paid during period” for your applicable class of shares to estimate the expenses you paid on your account during this period.
Hypothetical example for comparison purposes
The “Hypothetical” line of the table below provides information about hypothetical account values and hypothetical expenses based on the Fund’s actual expense ratio and an assumed rate of return of 5% per year before expenses, which is not the Fund’s actual return. The hypothetical account values and expenses may not be used to estimate the actual ending account balance or expenses you paid for the period. You may use this information to compare the ongoing costs of investing in the Fund and other funds. To do so, compare this 5% hypothetical example with the 5% hypothetical examples that appear in the shareholder reports of the other funds.
Please note that the expenses shown in the table are meant to highlight your ongoing costs. Therefore, the “Hypothetical” line of the table is useful in comparing ongoing costs only and will not help you determine the relative total costs of owning different funds.
| | | | | | | | | | | | | | | | |
| | | Beginning account value 9-1-2014 | | | Ending account value 2-28-2015 | | | Expenses paid during the period1 | | | Net annualized expense ratio | |
Institutional Class | | | | | | | | | | | | | | | | |
Actual | | $ | 1,000.00 | | | $ | 1,000.49 | | | $ | 1.34 | | | | 0.27 | % |
Hypothetical (5% return before expenses) | | $ | 1,000.00 | | | $ | 1,023.46 | | | $ | 1.35 | | | | 0.27 | % |
| 1 | Expenses paid is equal to the annualized expense ratio multiplied by the average account value over the period, multiplied by the number of days in the most recent fiscal half-year divided by the number of days in the fiscal year (to reflect the one-half-year period). |
| | | | | | |
| Portfolio of investments—February 28, 2015 (unaudited) | | Wells Fargo Advantage Conservative Income Fund | | | 7 | |
| | | | | | | | | | | | | | | | |
| Security name | | Interest rate | | | Maturity date | | | Principal | | | Value | |
| | | | |
Asset-Backed Securities: 22.37% | | | | | | | | | | | | | | | | |
Ally Auto Receivables Trust Series 2014-3 Class A2 | | | 0.81 | % | | | 9-15-2017 | | | $ | 1,000,000 | | | $ | 1,000,173 | |
American Express Credit Account Master Trust Series 2012-2 Class A | | | 0.68 | | | | 3-15-2018 | | | | 3,400,000 | | | | 3,403,468 | |
Bank of the West Auto Trust Series 2014-1 Class A2 144A | | | 0.69 | | | | 7-17-2017 | | | | 3,200,000 | | | | 3,198,957 | |
Barclays Dryrock Issuance Trust Series 2014-4 Class A ± | | | 0.56 | | | | 9-15-2020 | | | | 1,400,000 | | | | 1,400,574 | |
BMW Vehicle Lease Trust Series 2014-1 Class A2 | | | 0.45 | | | | 3-21-2016 | | | | 1,097,341 | | | | 1,096,897 | |
California Republic Auto Receivables Trust Series 2014-1 Class A2 | | | 0.62 | | | | 1-17-2017 | | | | 472,116 | | | | 472,124 | |
California Republic Auto Receivables Trust Series 2014-3 Class A3 | | | 1.09 | | | | 11-15-2018 | | | | 1,500,000 | | | | 1,500,081 | |
CarMax Auto Owner Trust Series 2013-3 Class A2 | | | 0.59 | | | | 8-15-2016 | | | | 297,180 | | | | 297,199 | |
CarMax Auto Owner Trust Series 2014-4 Class A2A | | | 0.67 | | | | 2-15-2018 | | | | 3,200,000 | | | | 3,197,651 | |
Citibank Credit Card Issuance Trust Series 2013-A3 Class A3 | | | 1.11 | | | | 7-23-2018 | | | | 4,220,000 | | | | 4,234,238 | |
Fifth Third Auto Trust Series 2014-1 Class A2 | | | 0.46 | | | | 8-15-2016 | | | | 1,246,589 | | | | 1,246,554 | |
Fifth Third Auto Trust Series 2014-1 Class A3 | | | 0.68 | | | | 4-16-2018 | | | | 2,000,000 | | | | 1,997,932 | |
Ford Credit Auto Lease Trust Series 2013-B Class A2A | | | 0.59 | | | | 1-15-2016 | | | | 316,757 | | | | 316,836 | |
Ford Credit Auto Lease Trust Series 2013-B Class A3 | | | 0.76 | | | | 9-15-2016 | | | | 1,000,000 | | | | 1,000,654 | |
Ford Credit Auto Lease Trust Series 2014-A Class A3 | | | 0.68 | | | | 4-15-2017 | | | | 900,000 | | | | 899,684 | |
GE Equipment Transportation LLC Series 2015-1 Class A2 %% | | | 0.89 | | | | 11-24-2017 | | | | 1,825,000 | | | | 1,824,804 | |
GM Financial Automobile Leasing Trust Series 2014-1A Class A2 144A | | | 0.61 | | | | 7-20-2016 | | | | 1,524,353 | | | | 1,523,385 | |
GM Financial Automobile Leasing Trust Series 2014-2A Class A3 144A | | | 1.22 | | | | 1-22-2018 | | | | 2,500,000 | | | | 2,499,913 | |
Golden Credit Card Trust Series 2012-5A Class A 144A | | | 0.79 | | | | 9-15-2017 | | | | 3,000,000 | | | | 3,002,739 | |
Hyundai Auto Lease Securitization Trust Series 2013-A Class A3 144A | | | 0.66 | | | | 6-15-2016 | | | | 639,573 | | | | 639,495 | |
Hyundai Auto Lease Securitization Trust Series 2013-B Class A3 144A | | | 0.98 | | | | 10-17-2016 | | | | 1,755,000 | | | | 1,758,808 | |
Hyundai Auto Receivables Trust Series 2012-C Class A3 | | | 0.53 | | | | 4-17-2017 | | | | 434,109 | | | | 434,042 | |
M&T Bank Auto Receivables Trust Series 2013-1A Class A3 144A | | | 1.06 | | | | 11-15-2017 | | | | 1,146,468 | | | | 1,149,454 | |
Mercedes-Benz Auto Lease Trust Series 2013-B Class A2 | | | 0.53 | | | | 9-15-2015 | | | | 2,076 | | | | 2,076 | |
Mercedes-Benz Auto Lease Trust Series 2013-B Class A3 | | | 0.62 | | | | 7-15-2016 | | | | 1,000,000 | | | | 1,000,041 | |
Nissan Auto Lease Trust Series 2013-B Class A3 | | | 0.75 | | | | 6-15-2016 | | | | 1,000,000 | | | | 1,000,806 | |
Nissan Auto Lease Trust Series 2014-A Class A2A | | | 0.48 | | | | 9-15-2016 | | | | 3,778,530 | | | | 3,775,125 | |
Oscar US Funding Trust Series 2014-1A Class A2 144A | | | 1.00 | | | | 8-15-2017 | | | | 2,500,000 | | | | 2,496,865 | |
Penarth Master Issuer Series 2013-1A Class A1 144A± | | | 0.56 | | | | 11-18-2017 | | | | 4,000,000 | | | | 4,000,576 | |
Porsche Innovative Lease Owner Pilot Trust Series 2013-1 Class A2 144A | | | 0.54 | | | | 1-22-2016 | | | | 198,554 | | | | 198,573 | |
Smart Trust Series 2014-1US Class A2A | | | 0.58 | | | | 7-14-2016 | | | | 953,567 | | | | 953,238 | |
Volkswagen Auto Lease Trust Series 2014-A Class A3 | | | 0.80 | | | | 4-20-2017 | | | | 1,765,000 | | | | 1,763,839 | |
Volkswagen Auto Lease Trust Series 2013-A Class A2A | | | 0.63 | | | | 12-21-2015 | | | | 41,342 | | | | 41,345 | |
Volkswagen Auto Lease Trust Series 2014-A Class A2A | | | 0.52 | | | | 10-20-2016 | | | | 955,535 | | | | 955,252 | |
Volkswagen Auto Lease Trust Series 2015-A Class A2A %% | | | 0.98 | | | | 6-20-2017 | | | | 1,000,000 | | | | 999,995 | |
Volvo Financial Equipment LLC Series 2014-1A Class A2 144A | | | 0.54 | | | | 11-15-2016 | | | | 2,531,024 | | | | 2,530,022 | |
World Omni Automobile Receivables Trust Series 2013-B Class A2 | | | 0.48 | | | | 11-15-2016 | | | | 316,219 | | | | 316,217 | |
World Omni Automobile Receivables Trust Series 2015-A Class A2A %% | | | 0.90 | | | | 7-16-2018 | | | | 1,000,000 | | | | 999,916 | |
| | | | |
Total Asset-Backed Securities (Cost $59,134,055) | | | | | | | | | | | | | | | 59,129,548 | |
| | | | | | | | | | | | | | | | |
| | | | |
Certificates of Deposit: 1.51% | | | | | | | | | | | | | | | | |
Bank of Tokyo-Mitsubishi LLC ± | | | 0.63 | | | | 7-15-2016 | | | | 2,000,000 | | | | 2,000,000 | |
Credit Suisse NY ± | | | 0.58 | | | | 8-24-2015 | | | | 2,000,000 | | | | 2,000,000 | |
| | | | |
Total Certificates of Deposit (Cost $4,000,000) | | | | | | | | | | | | | | | 4,000,000 | |
| | | | | | | | | | | | | | | | |
| | | | |
Corporate Bonds and Notes: 23.38% | | | | | | | | | | | | | | | | |
| | | | |
Consumer Discretionary: 2.86% | | | | | | | | | | | | | | | | |
| | | | |
| Automobiles: 1.33% | | | | | | | | | | | | | | | | |
Harley-Davidson Financial Services Incorporated 144A | | | 3.88 | | | | 3-15-2016 | | | | 3,400,000 | | | | 3,507,824 | |
| | | | | | | | | | | | | | | | |
The accompanying notes are an integral part of these financial statements.
| | | | |
| 8 | | Wells Fargo Advantage Conservative Income Fund | | Portfolio of investments—February 28, 2015 (unaudited) |
| | | | | | | | | | | | | | | | |
| Security name | | Interest rate | | | Maturity date | | | Principal | | | Value | |
| | | | |
| Media: 0.57% | | | | | | | | | | | | | | | | |
NBCUniversal Media LLC | | | 3.65 | % | | | 4-30-2015 | | | $ | 1,500,000 | | | $ | 1,507,632 | |
| | | | | | | | | | | | | | | | |
| | | | |
| Specialty Retail: 0.96% | | | | | | | | | | | | | | | | |
Lowe’s Companies Incorporated | | | 2.13 | | | | 4-15-2016 | | | | 2,500,000 | | | | 2,539,543 | |
| | | | | | | | | | | | | | | | |
| | | | |
Financials: 18.79% | | | | | | | | | | | | | | | | |
| | | | |
| Banks: 7.19% | | | | | | | | | | | | | | | | |
Bank of America Corporation ± | | | 0.73 | | | | 2-14-2017 | | | | 1,890,000 | | | | 1,888,828 | |
Bank of America Corporation | | | 4.50 | | | | 4-1-2015 | | | | 500,000 | | | | 501,508 | |
Branch Banking & Trust Company ± | | | 0.56 | | | | 9-13-2016 | | | | 1,050,000 | | | | 1,045,087 | |
Branch Banking & Trust Corporation | | | 5.63 | | | | 9-15-2016 | | | | 250,000 | | | | 266,653 | |
Capital One NA ± | | | 0.76 | | | | 2-13-2017 | | | | 1,500,000 | | | | 1,499,940 | |
Capital One NA ± | | | 0.94 | | | | 2-5-2018 | | | | 1,500,000 | | | | 1,502,996 | |
Citigroup Incorporated ± | | | 0.78 | | | | 3-10-2017 | | | | 350,000 | | | | 349,510 | |
Citigroup Incorporated ± | | | 0.94 | | | | 11-15-2016 | | | | 500,000 | | | | 502,309 | |
Citigroup Incorporated ± | | | 1.22 | | | | 7-25-2016 | | | | 500,000 | | | | 503,111 | |
Citigroup Incorporated | | | 1.70 | | | | 7-25-2016 | | | | 650,000 | | | | 654,230 | |
Credit Suisse New York ± | | | 0.94 | | | | 1-29-2018 | | | | 1,750,000 | | | | 1,753,978 | |
JPMorgan Chase & Company ± | | | 0.78 | | | | 2-15-2017 | | | | 3,500,000 | | | | 3,506,612 | |
PNC Bank NA ± | | | 0.55 | | | | 8-1-2017 | | | | 1,650,000 | | | | 1,646,558 | |
PNC Bank NA | | | 0.80 | | | | 1-28-2016 | | | | 750,000 | | | | 751,627 | |
PNC Bank NA | | | 1.30 | | | | 10-3-2016 | | | | 1,000,000 | | | | 1,005,538 | |
MUFG Union Bank NA ± | | | 1.00 | | | | 9-26-2016 | | | | 1,625,000 | | | | 1,633,309 | |
| | | | |
| | | | | | | | | | | | | | | 19,011,794 | |
| | | | | | | | | | | | | | | | |
| | | | |
| Capital Markets: 1.99% | | | | | | | | | | | | | | | | |
Goldman Sachs Group Incorporated | | | 3.30 | | | | 5-3-2015 | | | | 1,250,000 | | | | 1,255,653 | |
Goldman Sachs Group Incorporated | | | 3.70 | | | | 8-1-2015 | | | | 721,000 | | | | 729,578 | |
Merrill Lynch & Company Incorporated | | | 5.30 | | | | 9-30-2015 | | | | 595,000 | | | | 610,107 | |
Morgan Stanley ± | | | 0.97 | | | | 1-5-2018 | | | | 750,000 | | | | 751,047 | |
Morgan Stanley | | | 6.00 | | | | 4-28-2015 | | | | 1,900,000 | | | | 1,915,367 | |
| | | | |
| | | | | | | | | | | | | | | 5,261,752 | |
| | | | | | | | | | | | | | | | |
| | | | |
| Consumer Finance: 5.26% | | | | | | | | | | | | | | | | |
American Express Centurion Bank | | | 0.88 | | | | 11-13-2015 | | | | 1,150,000 | | | | 1,154,063 | |
American Express Credit Corporation | | | 1.30 | | | | 7-29-2016 | | | | 1,750,000 | | | | 1,759,079 | |
American Express Credit Corporation | | | 2.75 | | | | 9-15-2015 | | | | 1,021,000 | | | | 1,033,201 | |
American Honda Finance Corporation ± | | | 0.36 | | | | 9-2-2016 | | | | 1,150,000 | | | | 1,148,712 | |
Daimler Finance North America LLC 144A | | | 1.45 | | | | 8-1-2016 | | | | 3,000,000 | | | | 3,020,436 | |
Daimler Finance North America LLC 144A | | | 1.65 | | | | 4-10-2015 | | | | 375,000 | | | | 375,470 | |
General Electric Capital Corporation Series A | | | 5.38 | | | | 10-20-2016 | | | | 1,500,000 | | | | 1,608,800 | |
HSBC Finance Corporation ± | | | 0.66 | | | | 6-1-2016 | | | | 350,000 | | | | 349,568 | |
HSBC Finance Corporation | | | 5.00 | | | | 6-30-2015 | | | | 1,560,000 | | | | 1,582,402 | |
John Deere Capital Corporation ± | | | 0.54 | | | | 1-16-2018 | | | | 1,860,000 | | | | 1,864,741 | |
| | | | |
| | | | | | | | | | | | | | | 13,896,472 | |
| | | | | | | | | | | | | | | | |
The accompanying notes are an integral part of these financial statements.
| | | | | | |
| Portfolio of investments—February 28, 2015 (unaudited) | | Wells Fargo Advantage Conservative Income Fund | | | 9 | |
| | | | | | | | | | | | | | | | |
| Security name | | Interest rate | | | Maturity date | | | Principal | | | Value | |
| | | | |
| Diversified Financial Services: 1.00% | | | | | | | | | | | | | | | | |
General Electric Capital Corporation | | | 3.50 | % | | | 6-29-2015 | | | $ | 925,000 | | | $ | 934,427 | |
General Electric Capital Corporation | | | 5.00 | | | | 1-8-2016 | | | | 1,650,000 | | | | 1,713,378 | |
| | | | |
| | | | | | | | | | | | | | | 2,647,805 | |
| | | | | | | | | | | | | | | | |
| | | | |
| Insurance: 3.35% | | | | | | | | | | | | | | | | |
ACE INA Holdings Incorporated | | | 2.60 | | | | 11-23-2015 | | | | 1,310,000 | | | | 1,328,776 | |
Berkshire Hathaway Finance Corporation ± | | | 0.55 | | | | 1-12-2018 | | | | 2,000,000 | | | | 2,002,240 | |
Jackson National Life Global Funding Company 144A± | | | 0.50 | | | | 7-29-2016 | | | | 2,000,000 | | | | 2,000,804 | |
Principal Life Global Funding II 144A | | | 1.00 | | | | 12-11-2015 | | | | 3,500,000 | | | | 3,515,754 | |
| | | | |
| | | | | | | | | | | | | | | 8,847,574 | |
| | | | | | | | | | | | | | | | |
| | | | |
Health Care: 0.83% | | | | | | | | | | | | | | | | |
| | | | |
| Health Care Providers & Services: 0.38% | | | | | | | | | | | | | | | | |
Providence Health & Services Obligated Group ± | | | 0.91 | | | | 10-1-2015 | | | | 1,000,000 | | | | 1,001,486 | |
| | | | | | | | | | | | | | | | |
| | | | |
| Pharmaceuticals: 0.45% | | | | | | | | | | | | | | | | |
Bayer US Finance LLC 144A± | | | 0.50 | | | | 10-7-2016 | | | | 1,200,000 | | | | 1,200,344 | |
| | | | | | | | | | | | | | | | |
| | | | |
Utilities: 0.90% | | | | | | | | | | | | | | | | |
| | | | |
| Electric Utilities: 0.90% | | | | | | | | | | | | | | | | |
Commonwealth Edison Company | | | 4.70 | | | | 4-15-2015 | | | | 524,000 | | | | 526,578 | |
Southern Company | | | 2.38 | | | | 9-15-2015 | | | | 1,825,000 | | | | 1,842,598 | |
| | | | |
| | | | | | | | | | | | | | | 2,369,176 | |
| | | | | | | | | | | | | | | | |
| | | | |
Total Corporate Bonds and Notes (Cost $61,754,636) | | | | | | | | | | | | | | | 61,791,402 | |
| | | | | | | | | | | | | | | | |
| | | | |
Municipal Obligations: 4.69% | | | | | | | | | | | | | | | | |
| | | | |
| California: 2.19% | | | | | | | | | | | | | | | | |
California Earthquake Authority (Miscellaneous Revenue) | | | 1.19 | | | | 7-1-2016 | | | | 1,750,000 | | | | 1,746,833 | |
Northern California Transmission Refunding Oregon Project Series B (Utilities Revenue) ## | | | 5.37 | | | | 5-1-2015 | | | | 1,000,000 | | | | 1,008,590 | |
Riverside County CA Public Financing Authority Indian Wells Project Series A Class T (Tax Revenue) | | | 0.83 | | | | 9-1-2015 | | | | 1,045,000 | | | | 1,044,592 | |
University of California Series Y-1 (Education Revenue) ± | | | 0.67 | | | | 7-1-2041 | | | | 2,000,000 | | | | 2,000,180 | |
| | | | |
| | | | | | | | | | | | | | | 5,800,195 | |
| | | | | | | | | | | | | | | | |
| | | | |
| Florida: 1.01% | | | | | | | | | | | | | | | | |
Village Center Florida Community Development District (Water & Sewer Revenue) 144A## | | | 1.30 | | | | 11-1-2015 | | | | 2,665,000 | | | | 2,663,721 | |
| | | | | | | | | | | | | | | | |
| | | | |
| Illinois: 0.77% | | | | | | | | | | | | | | | | |
Chicago IL Midway Airport Series C (Airport Revenue) | | | 1.32 | | | | 1-1-2016 | | | | 600,000 | | | | 604,344 | |
Illinois (GO) | | | 4.96 | | | | 3-1-2016 | | | | 1,365,000 | | | | 1,416,734 | |
| | | | |
| | | | | | | | | | | | | | | 2,021,078 | |
| | | | | | | | | | | | | | | | |
| | | | |
| New Jersey: 0.72% | | | | | | | | | | | | | | | | |
New Jersey Building Authority Series B (Miscellaneous Revenue) | | | 0.75 | | | | 6-15-2015 | | | | 1,000,000 | | | | 1,001,240 | |
New Jersey EDA School Facilities Construction Series QQ (Miscellaneous Revenue) | | | 1.10 | | | | 6-15-2016 | | | | 900,000 | | | | 900,288 | |
| | | | |
| | | | | | | | | | | | | | | 1,901,528 | |
| | | | | | | | | | | | | | | | |
| | | | |
Total Municipal Obligations (Cost $12,375,949) | | | | | | | | | | | | | | | 12,386,522 | |
| | | | | | | | | | | | | | | | |
The accompanying notes are an integral part of these financial statements.
| | | | |
| 10 | | Wells Fargo Advantage Conservative Income Fund | | Portfolio of investments—February 28, 2015 (unaudited) |
| | | | | | | | | | | | | | | | |
| Security name | | Interest rate | | | Maturity date | | | Principal | | | Value | |
| | | | |
Non-Agency Mortgage-Backed Securities: 3.98% | | | | | | | | | | | | | | | | |
Bear Stearns Commercial Mortgage Securities Incorporated Series 2005-T20 Class A4A ± | | | 5.14 | % | | | 10-12-2042 | | | $ | 869,174 | | | $ | 878,944 | |
CCG Receivables Trust Class 2014-1 Class A2 144A | | | 1.06 | | | | 11-15-2021 | | | | 1,925,032 | | | | 1,925,533 | |
Citigroup Commercial Mortgage Trust Series 2005-CD1 Class A4 ± | | | 5.23 | | | | 7-15-2044 | | | | 1,945,245 | | | | 1,963,802 | |
Commercial Mortgage Trust Pass-Through Certificate Series 2005-C6 Class A5A ± | | | 5.12 | | | | 6-10-2044 | | | | 475,152 | | | | 478,360 | |
JPMorgan Chase Commercial Mortgage Securities Trust Series 2005-LDP5 Class A4 ± | | | 5.23 | | | | 12-15-2044 | | | | 1,546,650 | | | | 1,570,138 | |
JPMorgan Chase Commercial Mortgage Securities Trust Series 2006-LDP6 Class A4 ± | | | 5.48 | | | | 4-15-2043 | | | | 1,770,624 | | | | 1,818,292 | |
JPMorgan Chase Commercial Mortgage Securities Trust Series 2005-LDP3 Class A4A ± | | | 4.94 | | | | 8-15-2042 | | | | 396,810 | | | | 398,694 | |
Merrill Lynch Mortgage Trust Series 2005-CKI1 Class A6 ± | | | 5.27 | | | | 11-12-2037 | | | | 1,457,356 | | | | 1,474,531 | |
| | | | |
Total Non-Agency Mortgage-Backed Securities (Cost $10,590,805) | | | | | | | | | | | | | | | 10,508,294 | |
| | | | | | | | | | | | | | | | |
| | | | |
Yankee Corporate Bonds and Notes: 21.20% | | | | | | | | | | | | | | | | |
| | | | |
Consumer Discretionary: 0.29% | | | | | | | | | | | | | | | | |
| | | | |
| Automobiles: 0.29% | | | | | | | | | | | | | | | | |
Volkswagen Group America 144A | | | 1.63 | | | | 3-22-2015 | | | | 775,000 | | | | 775,482 | |
| | | | | | | | | | | | | | | | |
| | | | |
Consumer Staples: 2.03% | | | | | | | | | | | | | | | | |
| | | | |
| Food & Staples Retailing: 1.39% | | | | | | | | | | | | | | | | |
Wesfarmers Limited 144A | | | 2.98 | | | | 5-18-2016 | | | | 1,810,000 | | | | 1,855,608 | |
Woolworths Limited 144A | | | 2.55 | | | | 9-22-2015 | | | | 1,813,000 | | | | 1,831,964 | |
| | | | |
| | | | | | | | | | | | | | | 3,687,572 | |
| | | | | | | | | | | | | | | | |
| | | | |
| Tobacco: 0.64% | | | | | | | | | | | | | | | | |
BAT International Finance plc 144A | | | 1.40 | | | | 6-5-2015 | | | | 1,680,000 | | | | 1,683,190 | |
| | | | | | | | | | | | | | | | |
| | | | |
Energy: 1.90% | | | | | | | | | | | | | | | | |
| | | | |
| Oil, Gas & Consumable Fuels: 1.90% | | | | | | | | | | | | | | | | |
BP Capital Markets plc ± | | | 0.61 | | | | 2-10-2017 | | | | 1,250,000 | | | | 1,251,175 | |
BP Capital Markets plc | | | 3.13 | | | | 10-1-2015 | | | | 1,000,000 | | | | 1,014,183 | |
BP Capital Markets plc | | | 3.20 | | | | 3-11-2016 | | | | 1,701,000 | | | | 1,744,763 | |
CNPC General Capital Limited 144A± | | | 1.16 | | | | 5-14-2017 | | | | 1,000,000 | | | | 1,001,436 | |
| | | | |
| | | | | | | | | | | | | | | 5,011,557 | |
| | | | | | | | | | | | | | | | |
| | | | |
Financials: 15.16% | | | | | | | | | | | | | | | | |
| | | | |
| Banks: 11.98% | | | | | | | | | | | | | | | | |
ABN Amro Bank NV 144A± | | | 1.06 | | | | 10-28-2016 | | | | 2,000,000 | | | | 2,013,460 | |
ANZ Banking Group 144A± | | | 0.69 | | | | 1-16-2018 | | | | 1,500,000 | | | | 1,499,555 | |
ANZ New Zealand International Limited of London 144A | | | 1.85 | | | | 10-15-2015 | | | | 1,050,000 | | | | 1,059,333 | |
Banco Santander Chile 144A± | | | 1.15 | | | | 4-11-2017 | | | | 1,250,000 | | | | 1,244,781 | |
Bank of Montreal | | | 1.30 | | | | 7-15-2016 | | | | 3,000,000 | | | | 3,022,719 | |
Bank of Nova Scotia | | | 0.95 | | | | 3-15-2016 | | | | 1,553,000 | | | | 1,559,094 | |
Banque Federative du Credit Mutuel SA 144A± | | | 1.11 | | | | 1-20-2017 | | | | 1,000,000 | | | | 1,006,491 | |
BPCE SA | | | 1.70 | | | | 4-25-2016 | | | | 2,695,000 | | | | 2,714,576 | |
Export-Import Bank of Korea ± | | | 0.98 | | | | 1-14-2017 | | | | 1,400,000 | | | | 1,406,947 | |
Export-Import Bank of Korea 144A | | | 5.38 | | | | 10-4-2016 | | | | 1,000,000 | | | | 1,064,915 | |
Industrial & Commercial Bank of China Limited ± | | | 1.45 | | | | 11-13-2017 | | | | 1,500,000 | | | | 1,508,235 | |
ING Bank NV 144A | | | 2.00 | | | | 9-25-2015 | | | | 2,990,000 | | | | 3,013,175 | |
Kookmin Bank 144A± | | | 1.13 | | | | 1-27-2017 | | | | 2,000,000 | | | | 2,012,176 | |
The accompanying notes are an integral part of these financial statements.
| | | | | | |
| Portfolio of investments—February 28, 2015 (unaudited) | | Wells Fargo Advantage Conservative Income Fund | | | 11 | |
| | | | | | | | | | | | | | | | |
| Security name | | Interest rate | | | Maturity date | | | Principal | | | Value | |
| | | | |
| Banks (continued) | | | | | | | | | | | | | | | | |
Kookmin Bank 144A± | | | 1.50 | % | | | 10-11-2016 | | | $ | 500,000 | | | $ | 505,157 | |
Macquarie Bank Limited 144A | | | 0.30 | | | | 6-24-2015 | | | | 1,000,000 | | | | 999,050 | |
Macquarie Bank Limited 144A± | | | 1.05 | | | | 3-24-2017 | | | | 1,000,000 | | | | 1,004,053 | |
Macquarie Bank Limited 144A | | | 3.45 | | | | 7-27-2015 | | | | 1,000,000 | | | | 1,011,446 | |
National Australia Bank Limited | | | 1.30 | | | | 7-25-2016 | | | | 1,000,000 | | | | 1,006,668 | |
Rabobank Nederland 144A | | | 3.20 | | | | 3-11-2015 | | | | 900,000 | | | | 900,471 | |
Royal Bank of Scotland plc | | | 4.88 | | | | 3-16-2015 | | | | 850,000 | | | | 851,193 | |
Sumitomo Mitsui Banking Corporation ± | | | 0.83 | | | | 1-16-2018 | | | | 1,500,000 | | | | 1,504,103 | |
Sumitomo Mitsui Trust Bank Limited 144A± | | | 1.02 | | | | 9-16-2016 | | | | 750,000 | | | | 753,998 | |
| | | | |
| | | | | | | | | | | | | | | 31,661,596 | |
| | | | | | | | | | | | | | | | |
| | | | |
| Consumer Finance: 1.06% | | | | | | | | | | | | | | | | |
Volkswagen International Finance NV 144A± | | | 0.70 | | | | 11-20-2017 | | | | 725,000 | | | | 725,147 | |
Volkswagen International Finance NV 144A | | | 2.88 | | | | 4-1-2016 | | | | 2,032,000 | | | | 2,076,613 | |
| | | | |
| | | | | | | | | | | | | | | 2,801,760 | |
| | | | | | | | | | | | | | | | |
| | | | |
| Diversified Financial Services: 2.12% | | | | | | | | | | | | | | | | |
Abbey National Treasury Services plc ± | | | 0.75 | | | | 3-13-2017 | | | | 500,000 | | | | 500,197 | |
Abbey National Treasury Services plc | | | 4.00 | | | | 4-27-2016 | | | | 1,300,000 | | | | 1,343,806 | |
La Caisse Centrale Desjardins du Quebec 144A± | | | 0.92 | | | | 1-29-2018 | | | | 3,760,000 | | | | 3,759,425 | |
| | | | |
| | | | | | | | | | | | | | | 5,603,428 | |
| | | | | | | | | | | | | | | | |
| | | | |
Information Technology: 0.87% | | | | | | | | | | | | | | | | |
| | | | |
| Internet Software & Services: 0.87% | | | | | | | | | | | | | | | | |
Alibaba Group Holding Limited 144A± | | | 0.76 | | | | 11-28-2017 | | | | 2,300,000 | | | | 2,292,547 | |
| | | | | | | | | | | | | | | | |
| | | | |
Telecommunication Services: 0.95% | | | | | | | | | | | | | | | | |
| | | | |
| Wireless Telecommunication Services: 0.95% | | | | | | | | | | | | | | | | |
America Movil SAB de CV ± | | | 1.24 | | | | 9-12-2016 | | | | 2,500,000 | | | | 2,518,885 | |
| | | | | | | | | | | | | | | | |
| | | | |
Total Yankee Corporate Bonds and Notes (Cost $55,994,492) | | | | | | | | | | | | | | | 56,036,017 | |
| | | | | | | | | | | | | | | | |
| | | | |
Short-Term Investments: 23.83% | | | | | | | | | | | | | | | | |
| | | | |
| Commercial Paper: 23.56% | | | | | | | | | | | | | | | | |
Alpine Securitization Corporation 144A(p)(z) | | | 0.25 | | | | 5-11-2015 | | | | 2,000,000 | | | | 1,998,989 | |
Alpine Securitization Corpotation 144A(p)(z) | | | 0.25 | | | | 5-4-2015 | | | | 1,000,000 | | | | 999,545 | |
Anglesea Funding LLC 144A(p)(z) | | | 0.00 | | | | 3-2-2015 | | | | 1,600,000 | | | | 1,600,000 | |
Anglesea Funding LLC 144A(p)(z) | | | 0.28 | | | | 4-1-2015 | | | | 2,100,000 | | | | 2,099,475 | |
Antalis US Funding Corporation 144A(p)(z) | | | 0.00 | | | | 3-2-2015 | | | | 3,250,000 | | | | 3,250,000 | |
Banco de Chile 144A(z) | | | 0.45 | | | | 8-28-2015 | | | | 3,650,000 | | | | 3,641,833 | |
Banco de Credito e Inversiones 144A(z) | | | 0.39 | | | | 5-20-2015 | | | | 1,900,000 | | | | 1,898,332 | |
Banco de Credito e Inversiones 144A(z) | | | 0.42 | | | | 4-27-2015 | | | | 1,000,000 | | | | 999,316 | |
CNPC Finance Hong Kong Limited 144A(z) | | | 0.30 | | | | 3-10-2015 | | | | 1,750,000 | | | | 1,749,852 | |
CNPC Finance Hong Kong Limited 144A(z) | | | 0.35 | | | | 3-26-2015 | | | | 4,000,000 | | | | 3,998,987 | |
Coca-Cola Company 144A(z) | | | 0.24 | | | | 6-22-2015 | | | | 750,000 | | | | 749,440 | |
Coca-Cola Company 144A(z) | | | 0.30 | | | | 9-8-2015 | | | | 1,500,000 | | | | 1,497,625 | |
Collateralized Commercial Paper Company LLC 144A(z) | | | 0.30 | | | | 7-6-2015 | | | | 1,500,000 | | | | 1,498,425 | |
Collateralized Commercial Paper Company LLC 144A(z) | | | 0.33 | | | | 5-7-2015 | | | | 1,000,000 | | | | 999,377 | |
Crown Point Capital Company LLC 144A(p)(z) | | | 0.23 | | | | 4-7-2015 | | | | 1,000,000 | | | | 999,760 | |
Crown Point Capital Company LLC 144A(p)(z) | | | 0.24 | | | | 4-17-2015 | | | | 2,200,000 | | | | 2,199,297 | |
The accompanying notes are an integral part of these financial statements.
| | | | |
| 12 | | Wells Fargo Advantage Conservative Income Fund | | Portfolio of investments—February 28, 2015 (unaudited) |
| | | | | | | | | | | | | | | | |
| Security name | | Interest rate | | | Maturity date | | | Principal | | | Value | |
| | | | |
| Commercial Paper (continued) | | | | | | | | | | | | | | | | |
Institutional Secured Funding LLC 144A(p)(z) | | | 0.24 | % | | | 3-17-2015 | | | $ | 1,000,000 | | | $ | 999,888 | |
Institutional Secured Funding LLC 144A(p)(z) | | | 0.35 | | | | 4-2-2015 | | | | 5,200,000 | | | | 5,198,343 | |
Midea International Corporation (z) | | | 0.25 | | | | 3-6-2015 | | | | 3,500,000 | | | | 3,499,852 | |
Reckitt Benckiser Treasury Services plc 144A(z) | | | 0.30 | | | | 8-25-2015 | | | | 500,000 | | | | 499,267 | |
Reckitt Benckiser Treasury Services plc 144A(z) | | | 0.37 | | | | 8-25-2015 | | | | 2,300,000 | | | | 2,295,840 | |
Ridgefield Funding Company LLC 144A(p)(z) | | | 0.24 | | | | 5-5-2015 | | | | 4,000,000 | | | | 3,998,222 | |
Salisbury Receivables Company LLC 144A(p)(z) | | | 0.22 | | | | 4-14-2015 | | | | 2,000,000 | | | | 1,999,451 | |
Salisbury Receivables Company LLC 144A(p)(z) | | | 0.27 | | | | 4-1-2015 | | | | 2,500,000 | | | | 2,499,396 | |
Sinopec Century Bright Capital Investment Limited 144A(z) | | | 0.31 | | | | 3-23-2015 | | | | 1,500,000 | | | | 1,499,703 | |
Suncorp Group Limited 144A(z) | | | 0.52 | | | | 7-6-2015 | | | | 1,100,000 | | | | 1,097,960 | |
Suncorp Group Limited 144A(z) | | | 0.61 | | | | 1-5-2016 | | | | 2,000,000 | | | | 1,989,528 | |
White Point Funding Incorporated 144A(p)(z) | | | 0.01 | | | | 3-6-2015 | | | | 6,500,000 | | | | 6,499,783 | |
| | | | |
| | | | | | | | | | | | | | | 62,257,486 | |
| | | | | | | | | | | | | | | | |
| | | | |
| | | Yield | | | | | | Shares | | | | |
| Investment Companies: 0.26% | | | | | | | | | | | | | | | | |
Wells Fargo Advantage Cash Investment Money Market Fund, Select Class ##(l)(u) | | | 0.10 | | | | | | | | 685,927 | | | | 685,927 | |
| | | | | | | | | | | | | | | | |
| | | | |
| | | | | | | | | Principal | | | | |
| U.S. Treasury Securities: 0.01% | | | | | | | | | | | | | | | | |
U.S. Treasury Bill (z)# | | | 0.01 | | | | 3-19-2015 | | | $ | 30,000 | | | | 30,000 | |
| | | | | | | | | | | | | | | | |
| | | | |
Total Short-Term Investments (Cost $62,973,413) | | | | | | | | | | | | | | | 62,973,413 | |
| | | | | | | | | | | | | | | | |
| | | | | | | | |
| Total investments in securities (Cost $266,823,350) * | | | 100.96 | % | | | 266,825,196 | |
Other assets and liabilities, net | | | (0.96 | ) | | | (2,549,143 | ) |
| | | | | | | | |
| Total net assets | | | 100.00 | % | | $ | 264,276,053 | |
| | | | | | | | |
| 144A | The security may be resold in transactions exempt from registration, normally to qualified institutional buyers, pursuant to Rule 144A under the Securities Act of 1933. |
| ± | Variable rate investment. The rate shown is the rate in effect at period end. |
| %% | The security is issued on a when-issued basis. |
| ## | All or a portion of this security is segregated for when-issued securities. |
| (p) | Asset-backed commercial paper |
| (z) | Zero coupon security. The rate represents the current yield to maturity. |
| (l) | The security represents an affiliate of the Fund as defined in the Investment Company Act of 1940. |
| (u) | The rate represents the 7-day annualized yield at period end. |
| # | All or a portion of this security is segregated as collateral for investments in derivative instruments. |
| * | Cost for federal income tax purposes is $266,824,965 and unrealized gains (losses) consists of: |
| | | | |
Gross unrealized gains | | $ | 143,841 | |
Gross unrealized losses | | | (143,610 | ) |
| | | | |
Net unrealized gains | | $ | 231 | |
The accompanying notes are an integral part of these financial statements.
| | | | | | |
| Statement of assets and liabilities—February 28, 2015 (unaudited) | | Wells Fargo Advantage Conservative Income Fund | | | 13 | |
| | | | |
| | | | |
| |
Assets | | | | |
Investments | | | | |
In unaffiliated securities, at value (cost $266,137,423) | | $ | 266,139,269 | |
In affiliated securities, at value (cost $685,927) | | | 685,927 | |
| | | | |
Total investments, at value (cost $266,823,350) | | | 266,825,196 | |
Receivable for Fund shares sold | | | 563,100 | |
Receivable for interest | | | 804,246 | |
Prepaid expenses and other assets | | | 21,570 | |
| | | | |
Total assets | | | 268,214,112 | |
| | | | |
| |
Liabilities | | | | |
Dividends payable | | | 44,488 | |
Payable for investments purchased | | | 3,824,715 | |
Payable for daily variation margin on open futures contracts | | | 1,641 | |
Advisory fee payable | | | 17,790 | |
Administration fee payable | | | 25,823 | |
Accrued expenses and other liabilities | | | 23,602 | |
| | | | |
Total liabilities | | | 3,938,059 | |
| | | | |
Total net assets | | $ | 264,276,053 | |
| | | | |
| |
NET ASSETS CONSIST OF | | | | |
Paid-in capital | | $ | 264,298,892 | |
Overdistributed net investment income | | | (1,354 | ) |
Accumulated net realized losses on investments | | | (20,724 | ) |
Net unrealized losses on investments | | | (761 | ) |
| | | | |
Total net assets | | $ | 264,276,053 | |
| | | | |
| |
COMPUTATION OF NET ASSET VALUE PER SHARE | | | | |
Net assets – Institutional Class | | $ | 264,276,053 | |
Shares outstanding – Institutional Class1 | | | 26,416,073 | |
Net asset value per share – Institutional Class | | | $10.00 | |
| 1 | The Fund has an unlimited number of authorized shares. |
The accompanying notes are an integral part of these financial statements.
| | | | |
| 14 | | Wells Fargo Advantage Conservative Income Fund | | Statement of operations—six months ended February 28, 2015 (unaudited) |
| | | | |
| | | | |
| |
Investment income | | | | |
Interest (net of foreign interest withholding taxes of $1,865) | | $ | 679,760 | |
Income from affiliated securities | | | 659 | |
| | | | |
Total investment income | | | 680,419 | |
| | | | |
| |
Expenses | | | | |
Advisory fee | | | 178,340 | |
Administration fee | | | 115,921 | |
Custody and accounting fees | | | 7,778 | |
Professional fees | | | 20,554 | |
Registration fees | | | 9,703 | |
Shareholder report expenses | | | 8,411 | |
Trustees’ fees and expenses | | | 5,825 | |
Other fees and expenses | | | 1,095 | |
| | | | |
Total expenses | | | 347,627 | |
Less: Fee waivers and/or expense reimbursements | | | (106,868 | ) |
| | | | |
Net expenses | | | 240,759 | |
| | | | |
Net investment income | | | 439,660 | |
| | | | |
| |
REALIZED AND UNREALIZED GAINS (LOSSES) ON INVESTMENTS | | | | |
| |
Net realized losses on: | | | | |
Unaffiliated securities | | | (5,349 | ) |
Futures transactions | | | (18,161 | ) |
| | | | |
Net realized losses on investments | | | (23,510 | ) |
| | | | |
| |
Net change in unrealized gains (losses) on: | | | | |
Unaffiliated securities | | | (171,813 | ) |
Futures transactions | | | 703 | |
| | | | |
Net change in unrealized gains (losses) on investments | | | (171,110 | ) |
| | | | |
Net realized and unrealized gains (losses) on investments | | | (194,620 | ) |
| | | | |
Net increase in net assets resulting from operations | | $ | 245,040 | |
| | | | |
The accompanying notes are an integral part of these financial statements.
| | | | | | |
| Statement of changes in net assets | | Wells Fargo Advantage Conservative Income Fund | | | 15 | |
| | | | | | | | | | | | | | | | |
| | | Six months ended
February 28, 2015
(unaudited) | | | Year ended
August 31, 2014 | |
| | | | |
Operations | | | | | | | | | | | | | | | | |
Net investment income | | | | | | $ | 439,660 | | | | | | | $ | 521,040 | |
Net realized gains (losses) on investments | | | | | | | (23,510 | ) | | | | | | | 36,110 | |
Net change in unrealized gains (losses) on investments | | | | | | | (171,110 | ) | | | | | | | 228,803 | |
| | | | |
Net increase in net assets resulting from operations | | | | | | | 245,040 | | | | | | | | 785,953 | |
| | | | |
| | | | |
Distributions to shareholders from | | | | | | | | | | | | | | | | |
Net investment income – Institutional Class | | | | | | | (439,689 | ) | | | | | | | (522,365 | ) |
Net realized gains – Institutional Class | | | | | | | (9,602 | ) | | | | | | | (10,290 | ) |
| | | | |
Total distributions to shareholders | | | | | | | (449,291 | ) | | | | | | | (532,655 | ) |
| | | | |
| | | | |
Capital share transactions | | | Shares | | | | | | | | Shares | | | | | |
Proceeds from shares sold – Institutional Class | | | 16,673,464 | | | | 166,852,937 | | | | 17,611,286 | | | | 176,332,163 | |
Reinvestment of distributions – Institutional Class | | | 32,963 | | | | 329,834 | | | | 44,616 | | | | 446,908 | |
Payment for shares redeemed – Institutional Class | | | (4,607,519 | ) | | | (46,120,953 | ) | | | (8,344,325 | ) | | | (83,597,346 | ) |
| | | | |
Net increase in net assets resulting from capital share transactions | | | | | | | 121,061,818 | | | | | | | | 93,181,725 | |
| | | | |
Total increase in net assets | | | | | | | 120,857,567 | | | | | | | | 93,435,023 | |
| | | | |
| | | | |
Net assets | | | | | | | | | | | | | | | | |
Beginning of period | | | | | | | 143,418,486 | | | | | | | | 49,983,463 | |
| | | | |
End of period | | | | | | $ | 264,276,053 | | | | | | | $ | 143,418,486 | |
| | | | |
Overdistributed net investment income | | | | | | $ | (1,354 | ) | | | | | | $ | (1,325 | ) |
| | | | |
The accompanying notes are an integral part of these financial statements.
| | | | |
| 16 | | Wells Fargo Advantage Conservative Income Fund | | Financial highlights |
(For a share outstanding throughout each period)
| | | | | | | | | | | | |
| | | Six months ended
February 28, 2015 (unaudited) | | | Year ended August 31 | |
| INSTITUTIONAL CLASS | | | 2014 | | | 20131 | |
Net asset value, beginning of period | | | $10.02 | | | | $9.99 | | | | $10.00 | |
Net investment income | | | 0.02 | | | | 0.04 | | | | 0.01 | |
Net realized and unrealized gains (losses) on investments | | | (0.02 | ) | | | 0.03 | | | | (0.01 | ) |
| | | | | | | | | | | | |
Total from investment operations | | | 0.00 | | | | 0.07 | | | | 0.00 | |
Distributions to shareholders from | | | | | | | | | | | | |
Net investment income | | | (0.02 | ) | | | (0.04 | ) | | | (0.01 | ) |
Net realized gains | | | (0.00 | )2 | | | (0.00 | )2 | | | 0.00 | |
| | | | | | | | | | | | |
Total distributions to shareholders | | | (0.02 | ) | | | (0.04 | ) | | | (0.01 | ) |
Net asset value, end of period | | | $10.00 | | | | $10.02 | | | | $9.99 | |
Total return3 | | | 0.05 | % | | | 0.74 | % | | | 0.01 | % |
Ratios to average net assets (annualized) | | | | | | | | | | | | |
Gross expenses | | | 0.39 | % | | | 0.43 | % | | | 0.74 | % |
Net expenses | | | 0.27 | % | | | 0.27 | % | | | 0.27 | % |
Net investment income | | | 0.49 | % | | | 0.44 | % | | | 0.44 | % |
Supplemental data | | | | | | | | | | | | |
Portfolio turnover rate | | | 19 | % | | | 55 | % | | | 10 | % |
Net assets, end of period (000s omitted) | | | $264,276 | | | | $143,418 | | | | $49,983 | |
| 1 | For the period from May 31, 2013 (commencement of class operations) to August 31, 2013 |
| 2 | Amount is less than $0.005. |
| 3 | Returns for periods of less than one year are not annualized. |
The accompanying notes are an integral part of these financial statements.
| | | | | | |
| Notes to financial statements (unaudited) | | Wells Fargo Advantage Conservative Income Fund | | | 17 | |
1. ORGANIZATION
Wells Fargo Funds Trust (the “Trust”), a Delaware statutory trust organized on March 10, 1999, is an open-end management investment company registered under the Investment Company Act of 1940, as amended (the “1940 Act”). As an investment company, the Trust follows the accounting and reporting guidance in Financial Accounting Standards Board (“FASB”) Accounting Standards Codification Topic 946, Financial Services—Investment Companies. These financial statements report on the Wells Fargo Advantage Conservative Income Fund (the “Fund”) which is a diversified series of the Trust.
2. SIGNIFICANT ACCOUNTING POLICIES
The following significant accounting policies, which are consistently followed in the preparation of the financial statements of the Fund, are in conformity with U.S. generally accepted accounting principles which require management to make estimates and assumptions that affect the reported amounts of assets and liabilities, disclosure of contingent assets and liabilities at the date of the financial statements, and the reported amounts of revenues and expenses during the reporting period. Actual results could differ from those estimates.
Securities valuation
All investments are valued each business day as of the close of regular trading on the New York Stock Exchange (generally 4 p.m. Eastern Time).
Debt securities are valued at the evaluated bid price provided by an independent pricing service or, if a reliable price is not available, the quoted bid price from an independent broker-dealer.
Futures that are listed on a foreign or domestic exchange or market are valued at the official closing price or, if none, the last sales price.
Investments in registered open-end investment companies are valued at net asset value.
Investments which are not valued using any of the methods discussed above are valued at their fair value, as determined in good faith by the Board of Trustees of the Fund. The Board of Trustees has established a Valuation Committee comprised of the Trustees and has delegated to it the authority to take any actions regarding the valuation of portfolio securities that the Valuation Committee deems necessary or appropriate, including determining the fair value of portfolio securities, unless the determination has been delegated to the Management Valuation Team of Wells Fargo Funds Management, LLC (“Funds Management”). The Board of Trustees retains the authority to make or ratify any valuation decisions or approve any changes to the Valuation Procedures as it deems appropriate. On a quarterly basis, the Board of Trustees receives reports on any valuation actions taken by the Valuation Committee or the Management Valuation Team which may include items for ratification.
Valuations of fair valued securities are compared to the next actual sales price when available, or other appropriate market values, to assess the continued appropriateness of the fair valuation methodologies used. These securities are fair valued on a day-to-day basis, taking into consideration changes to appropriate market information and any significant changes to the inputs considered in the valuation process until there is a readily available price provided on an exchange or by an independent pricing service. Valuations received from an independent pricing service or independent broker-dealer quotes are periodically validated by comparisons to most recent trades and valuations provided by other independent pricing services in addition to the review of prices by the adviser and/or subadviser. Unobservable inputs used in determining fair valuations are identified based on the type of security, taking into consideration factors utilized by market participants in valuing the investment, knowledge about the issuer and the current market environment.
When-issued transactions
The Fund may purchase securities on a forward commitment or when-issued basis. The Fund records a when-issued transaction on the trade date and will segregate assets in an amount at least equal in value to the Fund’s commitment to purchase when-issued securities. Securities purchased on a when-issued basis are marked-to-market daily and the Fund begins earning interest on the settlement date. Losses may arise due to changes in the market value of the underlying securities or if the counterparty does not perform under the contract.
Futures contracts
The Fund is subject to interest rate risk in the normal course of pursuing its investment objectives. The Fund may buy and sell futures contracts in order to gain exposure to, or protect against, changes in security values and interest rates. The primary risks associated with the use of futures contracts are the imperfect correlation between changes in market values of securities held by the Fund and the prices of futures contracts, and the possibility of an illiquid market.
| | | | |
| 18 | | Wells Fargo Advantage Conservative Income Fund | | Notes to financial statements (unaudited) |
The aggregate principal amounts of the contracts are not recorded in the financial statements. Fluctuations in the value of the contracts are recorded in the Statement of Assets and Liabilities as an asset or liability and in the Statement of Operations as unrealized gains or losses until the contracts are closed, at which point they are recorded as net realized gains or losses on futures contracts. With futures contracts, there is minimal counterparty risk to the Fund since futures are exchange traded and the exchange’s clearinghouse, as counterparty to all exchange traded futures, guarantees the futures against default.
Security transactions and income recognition
Securities transactions are recorded on a trade date basis. Realized gains or losses are recorded on the basis of identified cost.
Interest income is accrued daily and bond discounts are accreted and premiums are amortized daily based on the effective interest method. To the extent debt obligations are placed on non-accrual status, any related interest income may be reduced by writing off interest receivables when the collection of all or a portion of interest has become doubtful based on consistently applied procedures. If the issuer subsequently resumes interest payments or when the collectability of interest is reasonably assured, the debt obligation is removed from non-accrual status.
Income from foreign securities is recorded net of foreign taxes withheld where recovery of such taxes is not assured.
Distributions to shareholders
Distributions to shareholders from net investment income are accrued daily and paid monthly. Distributions from net realized gains, if any, are recorded on the ex-dividend date. Such distributions are determined in conformity with federal income tax regulations, which may differ in amount or character from net investment income and realized gains recognized for purposes of U.S. generally accepted accounting principles.
Federal and other taxes
The Fund intends to continue to qualify as a regulated investment company by distributing substantially all of its investment company taxable income and any net realized capital gains (after reduction for capital loss carryforwards) sufficient to relieve it from all, or substantially all, federal income taxes. Accordingly, no provision for federal income taxes was required.
The Fund’s income and federal excise tax returns and all financial records supporting those returns for the three fiscal years since commencement of operations will be subject to examination by the federal and Delaware revenue authorities. Management has analyzed the Fund’s tax positions taken on federal, state, and foreign tax returns for all open tax years and does not believe that there are any uncertain tax positions that require recognition of a tax liability.
3. FAIR VALUATION MEASUREMENTS
Fair value measurements of investments are determined within a framework that has established a fair value hierarchy based upon the various data inputs utilized in determining the value of the Fund’s investments. The three-level hierarchy gives the highest priority to unadjusted quoted prices in active markets for identical assets or liabilities (Level 1) and the lowest priority to significant unobservable inputs (Level 3). The Fund’s investments are classified within the fair value hierarchy based on the lowest level of input that is significant to the fair value measurement. The inputs are summarized into three broad levels as follows:
| n | | Level 1 – quoted prices in active markets for identical securities |
| n | | Level 2 – other significant observable inputs (including quoted prices for similar securities, interest rates, prepayment speeds, credit risk, use of amortized cost, etc.) |
| n | | Level 3 – significant unobservable inputs (including the Fund’s own assumptions in determining the fair value of investments) |
The inputs or methodologies used for valuing investments in securities are not necessarily an indication of the risk associated with investing in those securities.
| | | | | | |
| Notes to financial statements (unaudited) | | Wells Fargo Advantage Conservative Income Fund | | | 19 | |
The following is a summary of the inputs used in valuing the Fund’s assets and liabilities as of February 28, 2015:
| | | | | | | | | | | | | | | | |
| | | Quoted prices (Level 1) | | | Other significant observable inputs (Level 2) | | | Significant unobservable inputs (Level 3) | | | Total | |
Assets | | | | | | | | | | | | | | | | |
Investments in : | | | | | | | | | | | | | | | | |
| | | | |
Asset-backed securities | | $ | 0 | | | $ | 59,129,548 | | | $ | 0 | | | $ | 59,129,548 | |
Certificates of deposit | | | 0 | | | | 4,000,000 | | | | 0 | | | | 4,000,000 | |
Corporate bonds and notes | | | 0 | | | | 61,791,402 | | | | 0 | | | | 61,791,402 | |
Municipal obligations | | | 0 | | | | 12,386,522 | | | | 0 | | | | 12,386,522 | |
Non-agency mortgage-backed securities | | | 0 | | | | 10,508,294 | | | | 0 | | | | 10,508,294 | |
Yankee corporate bonds and notes | | | 0 | | | | 56,036,017 | | | | 0 | | | | 56,036,017 | |
| | | | |
Short-term investments | | | | | | | | | | | | | | | | |
Commercial paper | | | 0 | | | | 62,257,486 | | | | 0 | | | | 62,257,486 | |
Investment companies | | | 685,927 | | | | 0 | | | | 0 | | | | 685,927 | |
U.S. Treasury securities | | | 30,000 | | | | 0 | | | | 0 | | | | 30,000 | |
Total assets | | $ | 715,927 | | | $ | 266,109,269 | | | $ | 0 | | | $ | 266,825,196 | |
Liabilities | | | | | | | | | | | | | | | | |
| | | | |
Futures contracts | | $ | 1,641 | | | $ | 0 | | | $ | 0 | | | $ | 1,641 | |
Total liabilities | | $ | 1,641 | | | $ | 0 | | | $ | 0 | | | $ | 1,641 | |
Futures contracts are reported at their variation margin at measurement date, which represents the amount due from the Fund at that date. All other assets and liabilities are reported at their market value at measurement date.
The Fund recognizes transfers between levels within the fair value hierarchy at the end of the reporting period. At February 28, 2015, the Fund did not have any transfers into/out of Level 1, Level 2, or Level 3.
4. TRANSACTIONS WITH AFFILIATES
Advisory fee
The Trust has entered into an advisory contract with Funds Management, an indirect wholly owned subsidiary of Wells Fargo & Company (“Wells Fargo”). The adviser is responsible for implementing investment policies and guidelines and for supervising the subadviser, who is responsible for day-to-day portfolio management of the Fund.
Pursuant to the contract, Funds Management is entitled to receive an annual advisory fee starting at 0.20% and declining to 0.15% as the average daily net assets of the Fund increase. For the six months ended February 28, 2015, the advisory fee was equivalent to an annual rate of 0.20% of the Fund’s average daily net assets.
Funds Management has retained the services of a subadviser to provide daily portfolio management to the Fund. The fee for subadvisory services is borne by Funds Management. Wells Capital Management Incorporated, an affiliate of Funds Management and an indirect wholly owned subsidiary of Wells Fargo, is the subadviser to the Fund and is entitled to receive a fee from Funds Management at an annual rate starting at 0.10% and declining to 0.05% as the average daily net assets of the Fund increase.
Administration fee
The Trust has entered into an administration agreement with Funds Management. Under this agreement, for providing administrative services, which includes paying fees and expenses for services provided by the transfer agent, sub-transfer agents, omnibus account servicers and record-keepers, Funds Management is entitled to receive from the Fund an annual fund level administration fee starting at 0.13% and declining to 0.11% as the average daily net assets of the Fund increase.
Funds Management has contractually waived and/or reimbursed advisory and administration fees to the extent necessary to maintain certain net operating expense ratios for the Fund. Waiver of fees and/or reimbursement of expenses by Funds Management were made first from fund level expenses on a proportionate basis and then from class specific expenses. Funds Management has committed through December 31, 2015 to waive fees and/or reimburse
| | | | |
| 20 | | Wells Fargo Advantage Conservative Income Fund | | Notes to financial statements (unaudited) |
expenses to the extent necessary to cap the Fund’s expenses at 0.27% for Institutional Class shares. After this time, the cap may be increased or the commitment to maintain the cap may be terminated only with the approval of the Board of Trustees.
5. INVESTMENT PORTFOLIO TRANSACTIONS
Purchases and sales of investments, excluding U.S. government obligations (if any) and short-term securities, for the six months ended February 28, 2015 were $126,105,411 and $26,887,520, respectively.
6. DERIVATIVE TRANSACTIONS
During the six months ended February 28, 2015, the Fund entered into futures contracts to speculate on interest rates and to help manage the duration of the portfolio
At February 28, 2015, the Fund had short futures contracts outstanding as follows:
| | | | | | | | | | | | | | | | |
| Expiration date | | Counterparty | | Contracts | | Type | | | Contract value at February 28, 2015 | | | Unrealized losses | |
6-30-2015 | | JPMorgan | | 15 Short | | | 2-Year U.S. Treasury Notes | | | $ | 3,278,672 | | | $ | (2,607 | ) |
The Fund had an average notional amount of $3,300,830 in short futures contracts during the six months ended February 28, 2015.
On February 28, 2015, the cumulative unrealized losses on futures contracts in the amount of $2,607 are reflected in net unrealized losses on investments on the Statement of Assets and Liabilities. The payable for daily variation margin on open futures contracts reflected in the Statement of Assets and Liabilities only represents the current day’s variation margin. The realized losses and change in unrealized gains (losses) on futures contracts are reflected in the Statement of Operations.
For certain types of derivative transactions, the Fund has entered into International Swaps and Derivatives Association, Inc. master agreements (“ISDA Master Agreements”) or similar agreements with approved counterparties. The ISDA Master Agreements or similar agreements may have requirements to deliver/deposit securities or cash to/with an exchange or broker-dealer as collateral and allows the Fund to offset, with each counterparty, certain derivative financial instrument’s assets and/or liabilities with collateral held or pledged. Collateral requirements differ by type of derivative. Collateral or margin requirements are set by the broker or exchange clearing house for exchange traded derivatives while collateral terms are contract specific for over-the-counter traded derivatives. Cash collateral that has been pledged to cover obligations of the Fund under ISDA Master Agreements or similar agreements, if any, will be reported separately in the Statement of Assets and Liabilities. Securities pledged as collateral, if any, for the same purpose are noted in the Portfolio of Investments. With respect to balance sheet offsetting, absent an event of default by the counterparty or a termination of the agreement, the reported amounts of financial assets and financial liabilities in the Statement of Assets and Liabilities are not offset across transactions between the Fund and the applicable counterparty. A reconciliation of the gross amounts on the Statement of Assets and Liabilities to the net amounts by derivative type, including any collateral exposure, is as follows:
| | | | | | | | | | | | | | | | |
| Derivative type | | Counterparty | | Gross amounts of liabilities in the Statement of Assets and Liabilities | | Amounts subject to netting agreements | | | Collateral pledged1 | | | Net amount of liabilities | |
Futures – variation margin | | JPMorgan | | $1,641 | | $ | 0 | | | $ | (1,641 | ) | | $ | 0 | |
| | 1 | Collateral pledged within this table is limited to the collateral for the net transaction with the counterparty. | |
7. BANK BORROWINGS
The Trust (excluding the money market funds and certain other funds in the Trust) and Wells Fargo Variable Trust are parties to a $150,000,000 revolving credit agreement, whereby the Fund is permitted to use bank borrowings for temporary or emergency purposes, such as to fund shareholder redemption requests. Interest under the credit agreement is charged to the Fund based on a borrowing rate equal to the higher of the Federal Funds rate in effect on that day plus 1.25% or the overnight LIBOR rate in effect on that day plus 1.25%. In addition, an annual commitment fee equal to 0.10% of the unused balance is allocated to each participating fund. For the six months ended February 28, 2015, the Fund paid $84 in commitment fees.
| | | | | | |
| Notes to financial statements (unaudited) | | Wells Fargo Advantage Conservative Income Fund | | | 21 | |
For the six months ended February 28, 2015, there were no borrowings by the Fund under the agreement.
8. INDEMNIFICATION
Under the Trust’s organizational documents, the officers and Trustees are indemnified against certain liabilities that may arise out of performance of their duties to the Trust. Additionally, in the normal course of business, the Trust may enter into contracts with service providers that contain a variety of indemnification clauses. The Trust’s maximum exposure under these arrangements is dependent on future claims that may be made against the Fund and, therefore, cannot be estimated.
| | | | |
| 22 | | Wells Fargo Advantage Conservative Income Fund | | Other information (unaudited) |
PROXY VOTING INFORMATION
A description of the policies and procedures that the Fund uses to determine how to vote proxies relating to portfolio securities is available, upon request, by calling 1-800-222-8222, visiting our website at wellsfargoadvantagefunds.com, or visiting the SEC website at sec.gov. Information regarding how the Fund voted proxies relating to portfolio securities during the most recent 12-month period ended June 30 is available on the Fund’s website at wellsfargoadvantagefunds.com or by visiting the SEC website at sec.gov.
PORTFOLIO HOLDINGS INFORMATION
The complete portfolio holdings for the Fund are publicly available monthly on the Fund’s website (wellsfargoadvantagefunds.com), on a one-month delayed basis. In addition, top ten holdings information (excluding derivative positions) for the Fund is publicly available on the Fund’s website on a monthly, seven-day or more delayed basis. The Fund files its complete schedule of portfolio holdings with the SEC for the first and third quarters of each fiscal year on Form N-Q, which is available by visiting the SEC website at sec.gov. In addition, the Fund’s Form N-Q may be reviewed and copied at the SEC’s Public Reference Room in Washington, DC, and at regional offices in New York City, at 233 Broadway, and in Chicago, at 175 West Jackson Boulevard, Suite 900. Information about the Public Reference Room may be obtained by calling 1-800-SEC-0330.
| | | | | | |
| Other information (unaudited) | | Wells Fargo Advantage Conservative Income Fund | | | 23 | |
BOARD OF TRUSTEES AND OFFICERS
Each of the Trustees and Officers1 listed in the table below acts in identical capacities for each fund in the Wells Fargo Advantage family of funds, which consists of 134 mutual funds comprising the Wells Fargo Funds Trust, Wells Fargo Variable Trust, Wells Fargo Master Trust and four closed-end funds (collectively the “Fund Complex”). This table should be read in conjunction with the Prospectus and the Statement of Additional Information2. The mailing address of each Trustee and Officer is 525 Market Street, 12th Floor, San Francisco, CA 94105. Each Trustee and Officer serves an indefinite term, however, each Trustee serves such term until reaching the mandatory retirement age established by the Trustees.
Independent Trustees
| | | | | | |
Name and
year of birth | | Position held and
length of service* | | Principal occupations during past five years or longer | | Other
directorships during
past five years |
William R. Ebsworth
(Born 1957) | | Trustee, since 2015** | | Retired. From 1984 to 2013, equities analyst, portfolio manager, research director at Fidelity Management and Research Company and retired in 2013 as Chief Investment Officer of Fidelity Strategic Advisers, Inc. in Boston, Tokyo, and Hong Kong where he led a team of investment professionals managing client assets. Prior thereto, Board member of Hong Kong Securities Clearing Co., Hong Kong Options Clearing Corp., the Thailand International Fund, Ltd., Fidelity Investments Life Insurance Company, and Empire Fidelity Investments Life Insurance Company. Mr. Ebsworth is an Adjunct Lecturer, Finance, at Babson College and a Chartered Financial Analyst. | | Asset Allocation Trust |
| Jane A. Freeman (Born 1953) | | Trustee, since 2015** | | Retired. From 2012 to 2014 and 1999 to 2008, Chief Financial Officer of Scientific Learning Corporation. From 2008 to 2012, Ms. Freeman provided consulting services related to strategic business projects. Prior thereto, Portfolio Manager at Rockefeller & Co. and Scudder, Stevens & Clark. Board member of the Harding Loevner Funds from 1996 to 2014, serving as both Lead Independent Director and chair of the Audit Committee. Board member of the Russell Exchange Traded Funds Trust from 2011 to 2012 and the chair of the Audit Committee. Ms. Freeman is a Chartered Financial Analyst (inactive), Chair of Taproot Foundation (non-profit organization) and a Board Member of Ruth Bancroft Garden (non-profit organization). | | Asset Allocation Trust |
| Peter G. Gordon (Born 1942) | | Trustee, since 1998; Chairman, since 2005 | | Co-Founder, Retired Chairman, President and CEO of Crystal Geyser Water Company. Trustee Emeritus, Colby College. | | Asset Allocation Trust |
| Isaiah Harris, Jr. (Born 1952) | | Trustee, since 2009 | | Retired. Chairman of the Board of CIGNA Corporation since 2009, and Director since 2005. From 2003 to 2011, Director of Delux Corporation. Prior thereto, President and CEO of BellSouth Advertising and Publishing Corp. from 2005 to 2007, President and CEO of BellSouth Enterprises from 2004 to 2005 and President of BellSouth Consumer Services from 2000 to 2003. Emeritus member of the Iowa State University Foundation Board of Governors. Emeritus Member of the Advisory Board of Iowa State University School of Business. Advisory Board Member, Palm Harbor Academy. Mr. Harris is a certified public accountant. | | CIGNA Corporation; Asset Allocation Trust |
| Judith M. Johnson (Born 1949) | | Trustee, since 2008; Audit Committee Chairman, since 2008 | | Retired. Prior thereto, Chief Executive Officer and Chief Investment Officer of Minneapolis Employees Retirement Fund from 1996 to 2008. Ms. Johnson is an attorney, certified public accountant and a certified managerial accountant. | | Asset Allocation Trust |
| David F. Larcker (Born 1950) | | Trustee, since 2009 | | James Irvin Miller Professor of Accounting at the Graduate School of Business, Stanford University, Morgan Stanley Director of the Center for Leadership Development and Research and Senior Faculty of The Rock Center for Corporate Governance since 2006. From 2005 to 2008, Professor of Accounting at the Graduate School of Business, Stanford University. Prior thereto, Ernst & Young Professor of Accounting at The Wharton School, University of Pennsylvania from 1985 to 2005. | | Asset Allocation Trust |
| Olivia S. Mitchell (Born 1953) | | Trustee, since 2006 | | International Foundation of Employee Benefit Plans Professor, Wharton School of the University of Pennsylvania since 1993. Director of Wharton’s Pension Research Council and Boettner Center on Pensions & Retirement Research, and Research Associate at the National Bureau of Economic Research. Previously, Cornell University Professor from 1978 to 1993. | | Asset Allocation Trust |
| | | | |
| 24 | | Wells Fargo Advantage Conservative Income Fund | | Other information (unaudited) |
| | | | | | |
Name and
year of birth | | Position held and
length of service* | | Principal occupations during past five years or longer | | Other
directorships during
past five years |
Timothy J. Penny
(Born 1951) | | Trustee, since 1996 | | President and Chief Executive Officer of Southern Minnesota Initiative Foundation, a non-profit organization, since 2007 and Senior Fellow at the Humphrey Institute Policy Forum at the University of Minnesota since 1995. Member of the Board of Trustees of NorthStar Education Finance, Inc., a non-profit organization, since 2007. | | Asset Allocation Trust |
Michael S. Scofield
(Born 1943) | | Trustee, since 2010 | | Served on the Investment Company Institute’s Board of Governors and Executive Committee from 2008-2011 as well the Governing Council of the Independent Directors Council from 2006-2011 and the Independent Directors Council Executive Committee from 2008-2011. Chairman of the IDC from 2008-2010. Institutional Investor (Fund Directions) Trustee of Year in 2007. Trustee of the Evergreen Funds complex (and its predecessors) from 1984 to 2010. Chairman of the Evergreen Funds from 2000-2010. Former Trustee of the Mentor Funds. Retired Attorney, Law Offices of Michael S. Scofield. | | Asset Allocation Trust |
Donald C. Willeke
(Born 1940) | | Trustee, since 1996 | | Principal of the law firm of Willeke & Daniels. General Counsel of the Minneapolis Employees Retirement Fund from 1984 until its consolidation into the Minnesota Public Employees Retirement Association on June 30, 2010. Director and Vice Chair of The Tree Trust (non-profit corporation). Director of the American Chestnut Foundation (non-profit corporation). | | Asset Allocation Trust |
| * | Length of service dates reflect the Trustee’s commencement of service with the Trust’s predecessor entities, where applicable. |
| ** | William R. Ebsworth and Jane A. Freeman each became a Trustee effective January 1, 2015. |
Officers
| | | | | | |
Name and
year of birth | | Position held and
length of service | | Principal occupations during past five years or longer | | |
Karla M. Rabusch
(Born 1959) | | President, since 2003 | | Executive Vice President of Wells Fargo Bank, N.A. and President of Wells Fargo Funds Management, LLC since 2003. | | |
Nancy Wiser1
(Born 1967) | | Treasurer, since 2012 | | Executive Vice President of Wells Fargo Funds Management, LLC since 2011. Chief Operating Officer and Chief Compliance Officer at LightBox Capital Management LLC, from 2008 to 2011. Owned and operated a consulting business providing services to various hedge funds including acting as Chief Operating Officer and Chief Compliance Officer for a hedge fund from 2007 to 2008. Chief Operating Officer and Chief Compliance Officer of GMN Capital LLC from 2006 to 2007. | | |
C. David Messman
(Born 1960) | | Secretary, since 2000; Chief Legal Officer, since 2003 | | Senior Vice President and Secretary of Wells Fargo Funds Management, LLC since 2001. Assistant General Counsel of Wells Fargo Bank, N.A. since 2013 and Vice President and Managing Counsel of Wells Fargo Bank N.A. from 1996 to 2013. | | |
Debra Ann Early
(Born 1964) | | Chief Compliance Officer, since 2007 | | Senior Vice President of Wells Fargo Funds Management, LLC since 2007 and Chief Compliance Officer from 2007 to 2014. Chief Compliance Officer of Parnassus Investments from 2005 to 2007. Chief Financial Officer of Parnassus Investments from 2004 to 2007 and Senior Audit Manager of PricewaterhouseCoopers LLP from 1998 to 2004. | | |
David Berardi
(Born 1975) | | Assistant Treasurer, since 2009 | | Vice President of Wells Fargo Funds Management, LLC since 2009. Vice President of Evergreen Investment Management Company, LLC from 2008 to 2010. Assistant Vice President of Evergreen Investment Services, Inc. from 2004 to 2008. Manager of Fund Reporting and Control for Evergreen Investment Management Company, LLC from 2004 to 2010. | | |
Jeremy DePalma1
(Born 1974) | | Assistant Treasurer, since 2009 | | Senior Vice President of Wells Fargo Funds Management, LLC since 2009. Senior Vice President of Evergreen Investment Management Company, LLC from 2008 to 2010. Vice President, Evergreen Investment Services, Inc. from 2004 to 2007. Head of the Fund Reporting and Control Team within Fund Administration from 2005 to 2010. | | |
| 1 | Nancy Wiser acts as Treasurer of 73 funds in the Fund Complex. Jeremy DePalma acts as Treasurer of 61 funds and Assistant Treasurer of 73 funds in the Fund Complex. |
| 2 | The Statement of Additional Information includes additional information about the Trustees and is available, without charge, upon request, by calling 1-800-222-8222 or by visiting the website at wellsfargoadvantagefunds.com. |
| | | | | | |
| List of abbreviations | | Wells Fargo Advantage Conservative Income Fund | | | 25 | |
The following is a list of common abbreviations for terms and entities that may have appeared in this report.
| ACA | — ACA Financial Guaranty Corporation |
| ADR | — American depositary receipt |
| ADS | — American depositary shares |
| AGC | — Assured Guaranty Corporation |
| AGM | — Assured Guaranty Municipal |
| Ambac | — Ambac Financial Group Incorporated |
| AMT | — Alternative minimum tax |
| BAN | — Bond anticipation notes |
| BHAC | — Berkshire Hathaway Assurance Corporation |
| CAB | — Capital appreciation bond |
| CCAB | — Convertible capital appreciation bond |
| CDA | — Community Development Authority |
| CDO | — Collateralized debt obligation |
| DRIVER | — Derivative inverse tax-exempt receipts |
| DW&P | — Department of Water & Power |
| DWR | — Department of Water Resources |
| ECFA | — Educational & Cultural Facilities Authority |
| EDA | — Economic Development Authority |
| EDFA | — Economic Development Finance Authority |
| ETF | — Exchange-traded fund |
| FDIC | — Federal Deposit Insurance Corporation |
| FFCB | — Federal Farm Credit Banks |
| FGIC | — Financial Guaranty Insurance Corporation |
| FHA | — Federal Housing Administration |
| FHLB | — Federal Home Loan Bank |
| FHLMC | — Federal Home Loan Mortgage Corporation |
| FICO | — The Financing Corporation |
| FNMA | — Federal National Mortgage Association |
| GDR | — Global depositary receipt |
| GNMA | — Government National Mortgage Association |
| HCFR | — Healthcare facilities revenue |
| HEFA | — Health & Educational Facilities Authority |
| HEFAR | — Higher education facilities authority revenue |
| HFA | — Housing Finance Authority |
| HFFA | — Health Facilities Financing Authority |
| HUD | — Department of Housing and Urban Development |
| IDA | — Industrial Development Authority |
| IDAG | — Industrial Development Agency |
| KRW | — Republic of Korea won |
| LIBOR | — London Interbank Offered Rate |
| LIFER | — Long Inverse Floating Exempt Receipts |
| LLC | — Limited liability company |
| LLLP | — Limited liability limited partnership |
| LLP | — Limited liability partnership |
| MBIA | — Municipal Bond Insurance Association |
| MFHR | — Multifamily housing revenue |
| MSTR | — Municipal securities trust receipts |
| MUD | — Municipal Utility District |
| National | — National Public Finance Guarantee Corporation |
| PCFA | — Pollution Control Financing Authority |
| PCL | — Public Company Limited |
| PCR | — Pollution control revenue |
| PFA | — Public Finance Authority |
| PFFA | — Public Facilities Financing Authority |
| PFOTER | — Puttable floating option tax-exempt receipts |
| plc | — Public limited company |
| PUTTER | — Puttable tax-exempt receipts |
| R&D | — Research & development |
| Radian | — Radian Asset Assurance |
| RAN | — Revenue anticipation notes |
| RDA | — Redevelopment Authority |
| RDFA | — Redevelopment Finance Authority |
| REIT | — Real estate investment trust |
| ROC | — Reset option certificates |
| SAVRS | — Select auction variable rate securities |
| SBA | — Small Business Authority |
| SFHR | — Single-family housing revenue |
| SFMR | — Single-family mortgage revenue |
| SPA | — Standby purchase agreement |
| SPDR | — Standard & Poor’s Depositary Receipts |
| SPEAR | — Short Puttable Exempt Adjustable Receipts |
| STRIPS | — Separate trading of registered interest and |
| TAN | — Tax anticipation notes |
| TIPS | — Treasury inflation-protected securities |
| TRAN | — Tax revenue anticipation notes |
| TTFA | — Transportation Trust Fund Authority |
| TVA | — Tennessee Valley Authority |
This page is intentionally left blank.
This page is intentionally left blank.
This page is intentionally left blank.


For more information
More information about Wells Fargo Advantage Funds is available free upon request. To obtain literature, please write, email, visit the Fund’s website, or call:
Wells Fargo Advantage Funds
P.O. Box 8266
Boston, MA 02266-8266
Email: wfaf@wellsfargo.com
Website: wellsfargoadvantagefunds.com
Individual investors: 1-800-222-8222
Retail investment professionals: 1-888-877-9275
Institutional investment professionals: 1-866-765-0778
This report and the financial statements contained herein are submitted for the general information of the shareholders of Wells Fargo Advantage Funds. If this report is used for promotional purposes, distribution of the report must be accompanied or preceded by a current prospectus. Before investing, please consider the investment objectives, risks, charges, and expenses of the investment. For a current prospectus and, if available, a summary prospectus, containing this information, call 1-800-222-8222 or visit the Fund’s website at wellsfargoadvantagefunds.com. Read the prospectus carefully before you invest or send money.
Wells Fargo Funds Management, LLC, a wholly owned subsidiary of Wells Fargo & Company, provides investment advisory and administrative services for Wells Fargo Advantage Funds. Other affiliates of Wells Fargo & Company provide subadvisory and other services for the Funds. The Funds are distributed by Wells Fargo Funds Distributor, LLC, Member FINRA/SIPC, an affiliate of Wells Fargo & Company.
NOT FDIC INSURED ¡ NO BANK GUARANTEE ¡ MAY LOSE VALUE
© 2015 Wells Fargo Funds Management, LLC. All rights reserved.
| | |
 | | 232052 04-15 SA265/SAR265 02-15 |

Wells Fargo Advantage
Government Securities Fund

Semi-Annual Report
February 28, 2015

Reduce clutter. Save trees.
Sign up for electronic delivery of prospectuses and shareholder reports at wellsfargo.com/advantagedelivery
Contents
| * | A complete schedule of portfolio holdings as of the report date may be obtained, free of charge, by accessing the following website: http://a584.g.akamai.net/f/584/1326/1d/www.wellsfargoadvantagefunds.com/pdf/semi/holdings/govtsecurities.pdf or by calling Wells Fargo Advantage Funds at 1-800-222-8222. This complete schedule, filed on Form N-CSRS, is also available on the SEC’s website at sec.gov. |
| | The views expressed and any forward-looking statements are as of February 28, 2015, unless otherwise noted, and are those of the Fund managers and/or Wells Fargo Funds Management, LLC. Discussions of individual securities, or the markets generally, or any Wells Fargo Advantage Fund are not intended as individual recommendations. Future events or results may vary significantly from those expressed in any forward-looking statements; the views expressed are subject to change at any time in response to changing circumstances in the market. Wells Fargo Funds Management, LLC and the Fund disclaim any obligation to publicly update or revise any views expressed or forward-looking statements. |
NOT FDIC INSURED ¡ NO BANK GUARANTEE ¡ MAY LOSE VALUE
| | | | |
| 2 | | Wells Fargo Advantage Government Securities Fund | | Letter to shareholders (unaudited) |

Karla M. Rabusch
President
Wells Fargo Advantage Funds
Major central banks continued to inject liquidity into global banks and markets through various accommodative monetary policies, including quantitative easing.
Dear Valued Shareholder:
We are pleased to offer you this semi-annual report for the Wells Fargo Advantage Government Securities Fund for the six-month period that ended February 28, 2015. The period was marked by low interest rates, a large decline in oil prices, and moderate U.S. economic growth. Investment-grade bonds, as measured by the Barclays U.S. Aggregate Bond Index1, returned 2.25% during the period.
Major central banks continued to provide stimulus.
Major central banks continued to inject liquidity into global banks and markets through various accommodative monetary policies, including quantitative easing. In the U.S., the Federal Reserve (Fed) kept its key interest rate near zero in order to support the economy and the financial system. It ended its quantitative easing program in October 2014 and also set expectations for it to begin normalizing monetary policy with higher target ranges for the federal funds rate in 2015.
Meanwhile, European markets continued to benefit from the European Central Bank’s (ECB’s) willingness to maintain low interest rates. In September 2014, the ECB cut its key rate to a historic low of 0.05%. In addition to its targeted longer-term refinancing operations that are designed to increase bank lending, the ECB said it intends to increase the size of its balance sheet, a result of quantitative easing, by buying eurozone government bonds. In Japan, the Bank of Japan maintained an aggressive monetary program aimed at combating deflation.
U.S. economic growth was moderate, and oil prices plummeted.
Economic growth advanced during the reporting period, the unemployment rate ticked lower to 5.5% as of February 2015, and inflation remained below the Fed’s longer-run objective of a 2% pace. The period was also marked by dramatically lower oil prices, which fell from more than $90 per barrel at the end of August 2014 to below $50 per barrel at the end of February 2015. While lower oil prices benefited consumers of oil products, the lower prices pressured companies within the energy sector.
Longer-dated securities and higher-rated credits were top performers.
Ten-year U.S. Treasury rates declined during the period, from 2.35% at end of August 2014 to 2.03% by the end of February 2015, benefiting both from safe-haven status as well as relative attractiveness to global investors. With the U.S. economy the furthest along its business cycle, the level of interest rates in the U.S. and Europe diverged. The 10-year U.S. Treasury yield was 2.03% at the end of February 2015 compared with 0.30% for 10-year German government yields, 173 basis points (bps; 100 bps equals 1.00%) higher. This was largely attributed to the Fed being closer to eventually increasing interest rates while the ECB potentially needs to further increase, rather than scale back, its amount of accommodation. Further, U.S. economic activity was healthier than Europe’s.
Treasury bonds with maturities greater than 20 years returned more than 10% during the six-month period that ended February 28, 2015, according to the Barclays U.S. Aggregate Bond Index. This was due, in part, to strong demand from overseas investors because yields in Europe and Japan were substantially lower
| 1 | The Barclays U.S. Aggregate Bond Index is a broad-based benchmark that measures the investment-grade, U.S. dollar–denominated, fixed-rate taxable bond market, including Treasuries, government-related and corporate securities, mortgage-backed securities (agency fixed-rate and hybrid adjustable-rate mortgage pass-throughs), asset-backed securities, and commercial mortgage-backed securities. You cannot invest directly in an index. |
| | | | | | |
| Letter to shareholders (unaudited) | | Wells Fargo Advantage Government Securities Fund | | | 3 | |
than U.S. yields. In addition, because the dollar strengthened, the returns from Treasuries were even higher for foreign-domiciled investors. Longer-maturity debt across all sectors outperformed shorter-dated securities.
Investment-grade corporate bonds returned 2.29% during the six-month reporting period, according to the Barclays U.S. Aggregate Bond Index, and AAA-rated2 bonds had higher returns than BBB-rated bonds. Lower-rated credits, including high yield, underperformed as oil prices fell dramatically. Not only were many energy and mining companies negatively affected, but investor trepidation about weak global growth caused investment-grade spreads to modestly widen while high-yield spreads widened substantially.
Don’t let short-term uncertainty derail long-term investment goals.
Periods of uncertainty can present challenges, but experience has taught us that maintaining long-term investment goals can be an effective way to plan for the future. To help you create a sound strategy based on your personal goals and risk tolerance, Wells Fargo Advantage Funds offers more than 100 mutual funds and other investments spanning a wide range of asset classes and investment styles. Although diversification cannot guarantee an investment profit or prevent losses, we believe it can be an effective way to manage investment risk and potentially smooth out overall portfolio performance. We encourage investors to know their investments and to understand that appropriate levels of risk-taking may unlock opportunities.
Thank you for choosing to invest with Wells Fargo Advantage Funds. We appreciate your confidence in us and remain committed to helping you meet your financial needs. For current information about your fund investments, contact your investment professional, visit our website at wellsfargoadvantagefunds.com, or call us directly at 1-800-222-8222. We are available 24 hours a day, 7 days a week.
Sincerely,

Karla M. Rabusch
President
Wells Fargo Advantage Funds
Periods of uncertainty can present challenges, but experience has taught us that maintaining long-term investment goals can be an effective way to plan for the future.
| 2 | The ratings indicated are from Standard & Poor’s, Moody’s Investors Service, and/or Fitch Ratings Ltd. Standard & Poor’s rates the creditworthiness of bonds from AAA (highest) to D (lowest). Ratings from A to CCC may be modified by the addition of a plus (+) or minus (-) sign to show relative standing within the rating categories. Moody’s rates the creditworthiness of bonds from Aaa (highest) to C (lowest). Ratings Aa to B may be modified by the addition of a number 1 (highest) to 3 (lowest) to show relative standing within the ratings categories. Fitch rates the creditworthiness of bonds from AAA (highest) to D (lowest) |
| | | | |
| 4 | | Wells Fargo Advantage Government Securities Fund | | Performance highlights (unaudited) |
Investment objective
The Fund seeks current income.
Adviser
Wells Fargo Funds Management, LLC
Subadviser
Wells Capital Management Incorporated
Portfolio managers
Michael J. Bray, CFA
Christopher Y. Kauffman, CFA
Average annual total returns1 (%) as of February 28, 2015
| | | | | | | | | | | | | | | | | | | | | | | | | | | | | | | | | | |
| | | | | Including sales charge | | | Excluding sales charge | | | Expense ratios2 (%) | |
| | | Inception date | | 1 year | | | 5 year | | | 10 year | | | 1 year | | | 5 year | | | 10 year | | | Gross | | | Net3 | |
| Class A (SGVDX) | | 8-31-1999 | | | (0.62 | ) | | | 2.29 | | | | 3.71 | | | | 4.07 | | | | 3.23 | | | | 4.19 | | | | 0.89 | | | | 0.86 | |
| Class B (WGSBX)* | | 7-18-2008 | | | (1.62 | ) | | | 2.10 | | | | 3.65 | | | | 3.38 | | | | 2.47 | | | | 3.65 | | | | 1.64 | | | | 1.61 | |
| Class C (WGSCX) | | 12-26-2002 | | | 2.38 | | | | 2.46 | | | | 3.39 | | | | 3.38 | | | | 2.46 | | | | 3.39 | | | | 1.64 | | | | 1.61 | |
| Administrator Class (WGSDX) | | 4-8-2005 | | | – | | | | – | | | | – | | | | 4.38 | | | | 3.45 | | | | 4.41 | | | | 0.83 | | | | 0.65 | |
| Institutional Class (SGVIX) | | 8-31-1999 | | | – | | | | – | | | | – | | | | 4.45 | | | | 3.62 | | | | 4.60 | | | | 0.56 | | | | 0.49 | |
| Investor Class (STVSX) | | 10-29-1986 | | | | | | | | | | | | | | | 4.13 | | | | 3.20 | | | | 4.15 | | | | 0.92 | | | | 0.89 | |
| Barclays Intermediate Government Index4 | | – | | | – | | | | – | | | | – | | | | 2.21 | | | | 2.57 | | | | 3.88 | | | | – | | | | – | |
| Barclays U.S. Aggregate ex Credit Index5 | | – | | | – | | | | – | | | | – | | | | 4.46 | | | | 3.62 | | | | 4.54 | | | | – | | | | – | |
| * | | Class B shares are closed to investment, except in connection with the reinvestment of any distributions and permitted exchanges. |
Figures quoted represent past performance, which is no guarantee of future results, and do not reflect taxes that a shareholder may pay on fund distributions or the redemption of fund shares. Investment return and principal value of an investment will fluctuate so that an investor’s shares, when redeemed, may be worth more or less than their original cost. Performance shown without sales charges would be lower if sales charges were reflected. Current performance may be lower or higher than the performance data quoted, which assumes the reinvestment of dividends and capital gains. Current month-end performance is available on the Fund’s website, wellsfargoadvantagefunds.com.
Index returns do not include transaction costs associated with buying and selling securities, any mutual fund fees or expenses, or any taxes. It is not possible to invest directly in an index.
For Class A shares, the maximum front-end sales charge is 4.50%. For Class B shares, the maximum contingent deferred sales charge is 5.00%. For Class C shares, the maximum contingent deferred sales charge is 1.00%. Performance including a contingent deferred sales charge assumes the sales charge for the corresponding time period. Administrator Class, Institutional Class, and Investor Class shares are sold without a front-end sales charge or contingent deferred sales charge.
Bond values fluctuate in response to the financial condition of individual issuers, generalmarket and economic conditions, and changes in interest rates. Changes in market conditions and government policies may lead to periods of heightened volatility in the bond market and reduced liquidity for certain bonds held by the Fund. In general, when interest rates rise, bond values fall and investors may lose principal value. Interest-rate changes and their impact on the Fund and its share price can be sudden and unpredictable. The use of derivatives may reduce returns and/or increase volatility. Securities issued by U.S. government agencies or government sponsored entities may not be guaranteed by the U.S. Treasury. Certain investment strategies tend to increase the total risk of an investment (relative to the broader market). The Fund is exposed to mortgage- and asset-backed securities risk. Consult the Fund’s prospectus for additional information on these and other risks. The U.S. government guarantee applies to certain underlying securities and not to shares of the Fund.
Please see footnotes on page 5.
| | | | | | |
| Performance highlights (unaudited) | | Wells Fargo Advantage Government Securities Fund | | | 5 | |
| | | | |
| Ten largest long-term holdings6 (%) as of February 28, 2015 | |
U.S. Treasury Note, 0.07%, 1-31-2016 | | | 10.32 | |
U.S. Treasury Note, 0.25%, 9-30-2015 | | | 8.99 | |
FHLB, 0.00%, 5-27-2015 | | | 8.93 | |
U.S. Treasury Note, 0.38%, 3-15-2015 | | | 7.09 | |
FNMA, 3.00%, 3-12-2045 | | | 6.88 | |
U.S. Treasury Note, 0.38%, 11-15-2015 | | | 6.43 | |
FNMA, 4.50%, 3-12-2045 | | | 5.07 | |
FHLMC, 3.50%, 3-1-2045 | | | 4.50 | |
U.S. Treasury Note, 0.25%, 12-31-2015 | | | 4.41 | |
FNMA, 4.00%, 3-12-2045 | | | 4.39 | |
| | |
| Portfolio allocation7 as of February 28, 2015 |
|
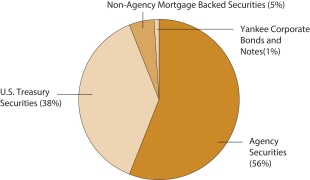 |
| 1 | Effective June 20, 2008, the Advisor Class was renamed Class A and modified to assume the features and attributes of Class A. Historical performance shown for Class A shares through June 19, 2008, includes Advisor Class expenses. Historical performance shown for Class B shares prior to their inception reflects the performance of Investor Class shares, adjusted to reflect the higher expenses applicable to Class B. Historical performance shown for Administrator Class shares prior to their inception reflects the performance of Institutional Class shares, adjusted to reflect the higher expenses applicable to Administrator Class shares. |
| 2 | Reflects the expense ratios as stated in the most recent prospectuses, which include the impact of 0.01% in acquired fund fees and expenses. The expense ratios shown are subject to change and may differ from the annualized expense ratios shown in the financial highlights of this report, which do not include acquired fund fees and expenses. |
| 3 | The Adviser has committed through December 31 2015, to waive fees and/or reimburse expenses to the extent necessary to cap the Fund’s Total Annual Fund Operating Expenses After Fee Waiver, excluding certain expenses, at 0.85% for Class A, 1.60% for Class B, 1.60% for Class C, 0.64% for Administrator Class, 0.48% for Institutional Class, and 0.88% for Investor Class. After this time, the cap may be increased or the commitment to maintain the cap may be terminated only with the approval of the Board of Trustees. Brokerage commissions, stamp duty fees, interest, taxes, acquired fund fees and expenses, and extraordinary expenses are excluded from the cap. Without this cap, the Fund’s returns would have been lower. |
| 4 | The Barclays Intermediate Government Index is an unmanaged index composed of U.S. government securities with maturities in the one to 10-year range, including securities issued by the U.S. Treasury and U.S. government agencies. You cannot invest directly in an index. |
| 5 | The Barclays U.S. Aggregate ex Credit Index is composed of the Barclays U.S. Government Index and the Barclays U.S. Mortgage-Backed Securities Index and it includes Treasury issues, agency issues, and mortgage-backed securities. You cannot invest directly in an index. |
| 6 | The ten largest long-term holdings are calculated based on the value of the securities divided by total net assets of the Fund. Holdings are subject to change and may have changed since the date specified. |
| 7 | Amounts are calculated based on the total long-term investments of the Fund. These percentages are subject to change and may have changed since the date specified. |
| | | | |
| 6 | | Wells Fargo Advantage Government Securities Fund | | Fund expenses (unaudited) |
As a shareholder of the Fund, you incur two types of costs: (1) transaction costs, including sales charges (loads) on purchase payments and contingent deferred sales charges (if any) on redemptions and (2) ongoing costs, including management fees, distribution (12b-1) and/or shareholder service fees, and other Fund expenses. This example is intended to help you understand your ongoing costs (in dollars) of investing in the Fund and to compare these costs with the ongoing costs of investing in other mutual funds.
The example is based on an investment of $1,000 invested at the beginning of the six-month period and held for the entire period from September 1, 2014 to February 28, 2015.
Actual expenses
The “Actual” line of the table below provides information about actual account values and actual expenses. You may use the information in this line, together with the amount you invested, to estimate the expenses that you paid over the period. Simply divide your account value by $1,000 (for example, an $8,600 account value divided by $1,000 = 8.6), then multiply the result by the number in the “Actual” line under the heading entitled “Expenses paid during period” for your applicable class of shares to estimate the expenses you paid on your account during this period.
Hypothetical example for comparison purposes
The “Hypothetical” line of the table below provides information about hypothetical account values and hypothetical expenses based on the Fund’s actual expense ratio and an assumed rate of return of 5% per year before expenses, which is not the Fund’s actual return. The hypothetical account values and expenses may not be used to estimate the actual ending account balance or expenses you paid for the period. You may use this information to compare the ongoing costs of investing in the Fund and other funds. To do so, compare this 5% hypothetical example with the 5% hypothetical examples that appear in the shareholder reports of the other funds.
Please note that the expenses shown in the table are meant to highlight your ongoing costs only and do not reflect any transactional costs, such as sales charges (loads) and contingent deferred sales charges. Therefore, the “Hypothetical” line of the table is useful in comparing ongoing costs only and will not help you determine the relative total costs of owning different funds. In addition, if these transactional costs were included, your costs would have been higher.
| | | | | | | | | | | | | | | | |
| | | Beginning
account value
9-1-2014 | | | Ending
account value
2-28-2015 | | | Expenses
paid during
the period1 | | | Net annualized
expense ratio | |
Class A | | | | | | | | | | | | | | | | |
Actual | | $ | 1,000.00 | | | $ | 1,021.63 | | | $ | 4.26 | | | | 0.85 | % |
Hypothetical (5% return before expenses) | | $ | 1,000.00 | | | $ | 1,020.58 | | | $ | 4.26 | | | | 0.85 | % |
Class B | | | | | | | | | | | | | | | | |
Actual | | $ | 1,000.00 | | | $ | 1,017.85 | | | $ | 8.01 | | | | 1.60 | % |
Hypothetical (5% return before expenses) | | $ | 1,000.00 | | | $ | 1,016.86 | | | $ | 8.00 | | | | 1.60 | % |
Class C | | | | | | | | | | | | | | | | |
Actual | | $ | 1,000.00 | | | $ | 1,017.85 | | | $ | 8.01 | | | | 1.60 | % |
Hypothetical (5% return before expenses) | | $ | 1,000.00 | | | $ | 1,016.86 | | | $ | 8.00 | | | | 1.60 | % |
Administrator Class | | | | | | | | | | | | | | | | |
Actual | | $ | 1,000.00 | | | $ | 1,022.69 | | | $ | 3.21 | | | | 0.64 | % |
Hypothetical (5% return before expenses) | | $ | 1,000.00 | | | $ | 1,021.62 | | | $ | 3.21 | | | | 0.64 | % |
Institutional Class | | | | | | | | | | | | | | | | |
Actual | | $ | 1,000.00 | | | $ | 1,023.51 | | | $ | 2.41 | | | | 0.48 | % |
Hypothetical (5% return before expenses) | | $ | 1,000.00 | | | $ | 1,022.41 | | | $ | 2.41 | | | | 0.48 | % |
Investor Class | | | | | | | | | | | | | | | | |
Actual | | $ | 1,000.00 | | | $ | 1,021.46 | | | $ | 4.41 | | | | 0.88 | % |
Hypothetical (5% return before expenses) | | $ | 1,000.00 | | | $ | 1,020.43 | | | $ | 4.41 | | | | 0.88 | % |
| 1 | Expenses paid is equal to the annualized expense ratio of each class multiplied by the average account value over the period, multiplied by the number of days in the most recent fiscal half-year divided by the number of days in the fiscal year (to reflect the one-half-year period). |
| | | | | | |
| Summary portfolio of investments—February 28, 2015 (unaudited) | | Wells Fargo Advantage Government Securities Fund | | | 7 | |
The Summary portfolio of investments shows the 50 largest portfolio holdings in unaffiliated issuers and any holdings exceeding 1% of the total net assets as of the report date. The remaining securities held are grouped as “Other securities” in each category.
| | | | | | | | | | | | | | | | | | | | |
| Security name | | Interest rate | | | Maturity date | | | Principal | | | Value | | | Percent of
net assets | |
| | | | | |
Agency Securities: 72.84% | | | | | | | | | | | | | | | | | | | | |
FDIC Series 2010-S1 Class 1A ±144A | | | 0.72 | % | | | 2-25-2048 | | | $ | 6,508,796 | | | $ | 6,511,152 | | | | 0.51 | % |
FDIC Series 2013-R1 Class A 144A | | | 1.15 | | | | 3-25-2033 | | | | 5,366,022 | | | | 5,329,192 | | | | 0.42 | |
FHLB ¤ | | | 0.00 | | | | 5-27-2015 | | | | 113,270,000 | | | | 113,259,126 | | | | 8.93 | |
FHLB | | | 5.63 | | | | 3-14-2036 | | | | 6,150,000 | | | | 8,683,837 | | | | 0.68 | |
FHLMC | | | 2.38 | | | | 1-13-2022 | | | | 10,415,000 | | | | 10,733,949 | | | | 0.85 | |
FHLMC %% | | | 3.50 | | | | 3-1-2045 | | | | 54,565,000 | | | | 57,090,765 | | | | 4.50 | |
FHLMC %% | | | 4.00 | | | | 3-1-2045 | | | | 11,875,000 | | | | 12,696,973 | | | | 1.00 | |
FHLMC | | | 5.50 | | | | 7-1-2035 | | | | 8,105,433 | | | | 9,105,910 | | | | 0.72 | |
FHLMC | | | 6.00 | | | | 5-25-2043 | | | | 6,668,020 | | | | 7,703,977 | | | | 0.61 | |
FHLMC | | | 0.21-10.50 | | | | 6-1-2016 to 7-25-2043 | | | | 105,614,221 | | | | 64,948,677 | | | | 5.13 | |
FNMA | | | 2.63 | | | | 9-6-2024 | | | | 16,000,000 | | | | 16,457,008 | | | | 1.30 | |
FNMA %% | | | 3.00 | | | | 3-18-2030 | | | | 18,235,000 | | | | 19,090,479 | | | | 1.50 | |
FNMA %% | | | 3.00 | | | | 3-12-2045 | | | | 85,745,000 | | | | 87,342,669 | | | | 6.88 | |
FNMA %% | | | 3.50 | | | | 3-18-2030 | | | | 15,180,000 | | | | 16,095,946 | | | | 1.27 | |
FNMA %% | | | 3.50 | | | | 3-12-2045 | | | | 50,820,000 | | | | 53,257,774 | | | | 4.20 | |
FNMA %% | | | 4.00 | | | | 3-18-2030 | | | | 12,615,000 | | | | 13,342,136 | | | | 1.05 | |
FNMA %% | | | 4.00 | | | | 3-12-2045 | | | | 52,050,000 | | | | 55,652,839 | | | | 4.39 | |
FNMA | | | 4.50 | | | | 1-1-2026 | | | | 11,305,000 | | | | 11,878,641 | | | | 0.94 | |
FNMA %% | | | 4.50 | | | | 3-12-2045 | | | | 59,157,000 | | | | 64,287,024 | | | | 5.07 | |
FNMA | | | 5.00 | | | | 8-1-2040 | | | | 23,633,250 | | | | 26,385,000 | | | | 2.08 | |
FNMA | | | 5.30 | | | | 4-1-2017 | | | | 6,265,835 | | | | 6,607,275 | | | | 0.52 | |
FNMA | | | 5.50 | | | | 8-1-2033 | | | | 7,899,647 | | | | 8,931,296 | | | | 0.70 | |
FNMA | | | 5.67 | | | | 3-1-2016 | | | | 6,034,833 | | | | 6,260,489 | | | | 0.49 | |
FNMA %% | | | 6.00 | | | | 3-12-2045 | | | | 15,585,000 | | | | 17,723,980 | | | | 1.40 | |
FNMA Series 2002-T19 Class A1 | | | 6.50 | | | | 7-25-2042 | | | | 6,195,378 | | | | 7,068,338 | | | | 0.56 | |
FNMA Series 2006-M2 Class A2F ± | | | 5.26 | | | | 5-25-2020 | | | | 6,790,390 | | | | 7,488,965 | | | | 0.59 | |
FNMA | | | 0.37-11.25 | | | | 3-1-2015 to 8-25-2047 | | | | 131,411,056 | | | | 140,912,761 | | | | 11.09 | |
GNMA | | | 4.00 | | | | 1-20-2045 | | | | 17,374,613 | | | | 18,549,547 | | | | 1.46 | |
GNMA | | | 5.00 | | | | 7-20-2040 | | | | 7,843,352 | | | | 8,775,574 | | | | 0.69 | |
GNMA Series 2006-32 Class C ± | | | 5.26 | | | | 11-16-2038 | | | | 11,398,849 | | | | 12,003,638 | | | | 0.95 | |
GNMA Series 2006-68 Class D ± | | | 5.31 | | | | 12-16-2037 | | | | 12,520,000 | | | | 13,695,102 | | | | 1.08 | |
GNMA | | | 0.00-12.50 | | | | 7-15-2016 to 10-16-2052 | | | | 91,245,956 | | | | 11,447,205 | | | | 0.89 | |
Other securities | | | | | | | | | | | | | | | 4,918,542 | | | | 0.39 | |
| | | | | |
Total Agency Securities (Cost $905,221,395) | | | | | | | | | | | | | | | 924,235,786 | | | | 72.84 | |
| | | | | | | | | | | | | | | | | | | | |
| | | | | |
Municipal Obligations: 0.61% | | | | | | | | | | | | | | | | | | | | |
| | | | | |
| Texas: 0.61% | | | | | | | | | | | | | | | | | | | | |
San Antonio TX Retama Development Corporation (Miscellaneous Revenue) | | | 10.00 | | | | 12-15-2020 | | | | 5,405,000 | | | | 7,800,280 | | | | 0.61 | |
| | | | | | | | | | | | | | | | | | | | |
| | | | | |
Total Municipal Obligations (Cost $6,665,706) | | | | | | | | | | | | | | | 7,800,280 | | | | 0.61 | |
| | | | | | | | | | | | | | | | | | | | |
The accompanying notes are an integral part of these financial statements.
| | | | |
| 8 | | Wells Fargo Advantage Government Securities Fund | | Summary portfolio of investments—February 28, 2015 (unaudited) |
| | | | | | | | | | | | | | | | | | | | |
| Security name | | Interest rate | | | Maturity date | | | Principal | | | Value | | | Percent of
net assets | |
| | | | |
Non-Agency Mortgage-Backed Securities: 5.85% | | | | | | | | | | | | | | | | | |
Citigroup Commercial Mortgage Trust Series 2006-C4 Class A3 ± | | | 5.77 | % | | | 3-15-2049 | | | $ | 8,876,687 | | | $ | 9,204,148 | | | | 0.72 | % |
Citigroup Commercial Mortgage Trust Series 2006-C5 Class A4 | | | 5.43 | | | | 10-15-2049 | | | | 11,280,000 | | | | 11,876,069 | | | | 0.94 | |
Citigroup Commercial Mortgage Trust Series 2015-GC27 Class A5 | | | 3.14 | | | | 2-10-2048 | | | | 6,130,000 | | | | 6,211,180 | | | | 0.49 | |
GE Capital Commercial Mortgage Corporation Series 2005-C3 Class A7A ± | | | 4.97 | | | | 7-10-2045 | | | | 9,360,000 | | | | 9,384,898 | | | | 0.74 | |
Lehman Brothers UBS Commercial Mortgage Trust Series 2006-C1 Class A4 | | | 5.16 | | | | 2-15-2031 | | | | 12,811,647 | | | | 13,068,124 | | | | 1.03 | |
NCUA Guaranteed Notes Program Series 2010-C1 Class APT | | | 2.65 | | | | 10-29-2020 | | | | 7,879,471 | | | | 7,974,135 | | | | 0.63 | |
Other securities | | | | | | | | | | | | | | | 16,524,736 | | | | 1.30 | |
| | | | | |
Total Non-Agency Mortgage-Backed Securities (Cost $75,867,231) | | | | | | | | | | | | | | | 74,243,290 | | | | 5.85 | |
| | | | | | | | | | | | | | | | | | | | |
| | | | | |
U.S. Treasury Securities: 50.01% | | | | | | | | | | | | | | | | | | | | |
U.S. Treasury Bond | | | 2.75 | | | | 8-15-2042 | | | | 16,720,000 | | | | 17,221,600 | | | | 1.36 | |
U.S. Treasury Bond | | | 3.00 | | | | 11-15-2044 | | | | 5,965,000 | | | | 6,469,693 | | | | 0.51 | |
U.S. Treasury Bond | | | 3.75 | | | | 8-15-2041 | | | | 17,565,000 | | | | 21,641,995 | | | | 1.71 | |
U.S. Treasury Bond | | | 4.50 | | | | 2-15-2036 | | | | 7,475,000 | | | | 10,083,655 | | | | 0.80 | |
U.S. Treasury Bond | | | 4.63 | | | | 2-15-2040 | | | | 20,150,000 | | | | 27,912,465 | | | | 2.20 | |
U.S. Treasury Bond | | | 6.25 | | | | 8-15-2023 | | | | 16,335,000 | | | | 21,913,141 | | | | 1.73 | |
U.S. Treasury Bond | | | 7.25 | | | | 8-15-2022 | | | | 4,685,000 | | | | 6,478,844 | | | | 0.51 | |
U.S. Treasury Note ±## | | | 0.07 | | | | 1-31-2016 | | | | 130,990,000 | | | | 130,986,987 | | | | 10.32 | |
U.S. Treasury Note ## | | | 0.25 | | | | 9-30-2015 | | | | 114,015,000 | | | | 114,077,366 | | | | 8.99 | |
U.S. Treasury Note | | | 0.25 | | | | 12-31-2015 | | | | 56,000,000 | | | | 56,008,736 | | | | 4.41 | |
U.S. Treasury Note ## | | | 0.38 | | | | 3-15-2015 | | | | 89,940,000 | | | | 89,947,015 | | | | 7.09 | |
U.S. Treasury Note ## | | | 0.38 | | | | 11-15-2015 | | | | 81,495,000 | | | | 81,615,939 | | | | 6.43 | |
U.S. Treasury Note | | | 1.00 | | | | 8-31-2016 | | | | 12,240,000 | | | | 12,340,405 | | | | 0.97 | |
U.S. Treasury Note | | | 1.38 | | | | 2-28-2019 | | | | 37,735,000 | | | | 37,790,996 | | | | 2.98 | |
| | | | | |
Total U.S. Treasury Securities (Cost $621,132,986) | | | | | | | | | | | | | | | 634,488,837 | | | | 50.01 | |
| | | | | | | | | | | | | | | | | | | | |
| | | | | |
Yankee Corporate Bonds and Notes: 1.56% | | | | | | | | | | | | | | | | | | | | |
| | | | | |
Financials: 1.56% | | | | | | | | | | | | | | | | | | | | |
| | | | | |
| Banks: 1.56% | | | | | | | | | | | | | | | | | | | | |
Bank of Nova Scotia 144A | | | 1.65 | | | | 10-29-2015 | | | | 13,235,000 | | | | 13,343,249 | | | | 1.05 | |
Royal Bank of Canada Incorporated | | | 2.00 | | | | 10-1-2018 | | | | 6,370,000 | | | | 6,452,765 | | | | 0.51 | |
| | | | | |
Total Yankee Corporate Bonds and Notes (Cost $19,598,373) | | | | | | | | | | | | | | | 19,796,014 | | | | 1.56 | |
| | | | | | | | | | | | | | | | | | | | |
| | | | | |
| | | Yield | | | | | | Shares | | | | | | | |
| Short-Term Investments: 0.33% | | | | | | | | | | | | | | | | | | | | |
| | | | | |
| Investment Companies: 0.20% | | | | | | | | | | | | | | | | | | | | |
Wells Fargo Advantage Government Money Market Fund, Institutional Class (l)(u)## | | | 0.01 | | | | | | | | 2,598,477 | | | | 2,598,477 | | | | 0.20 | |
| | | | | | | | | | | | | | | | | | | | |
The accompanying notes are an integral part of these financial statements.
| | | | | | |
| Summary portfolio of investments—February 28, 2015 (unaudited) | | Wells Fargo Advantage Government Securities Fund | | | 9 | |
| | | | | | | | | | | | | | | | | | | | |
| Security name | | Yield | | | Maturity date | | | Principal | | | Value | | | Percent of
net assets | |
| | | | | |
| U.S. Treasury Securities: 0.13% | | | | | | | | | | | | | | | | | | | | |
U.S. Treasury Bill (z) # | | | 0.01 | % | | | 3-19-2015 | | | $ | 1,600,000 | | | $ | 1,599,989 | | | | 0.13 | % |
| | | | | | | | | | | | | | | | | | | | |
| | | | | |
Total Short-Term Investments (Cost $4,198,457) | | | | | | | | | | | | | | | 4,198,466 | | | | 0.33 | |
| | | | | | | | | | | | | | | | | | | | |
| | | | |
| Total investments in securities (Cost $1,632,684,148) * | | | | | | | | | | | | 1,664,762,673 | | | | 131.20 | |
Other assets and liabilities, net | | | | | | | | | | | | | | | (395,905,819 | ) | | | (31.20 | ) |
| | | | | | | | | | | | | | | | | | | | |
| Total net assets | | | | | | | | | | | | | | $ | 1,268,856,854 | | | | 100.00 | % |
| | | | | | | | | | | | | | | | | | | | |
| 144A | The security may be resold in transactions exempt from registration, normally to qualified institutional buyers, pursuant to Rule 144A under the Securities Act of 1933. |
| ± | Variable rate investment. The rate shown is the rate in effect at period end. |
| ¤ | The security is issued in zero coupon form with no periodic interest payments. |
| %% | Security issued on a when-issued basis |
| (l) | The security represents an affiliate of the Fund as defined in the Investment Company Act of 1940. |
| (u) | The rate represents the 7-day annualized yield at period end. |
| ## | All or a portion of this security is segregated for when-issued securities. |
| (z) | Zero coupon security. The rate represents the current yield to maturity. |
| # | All or a portion of this security is segregated as collateral for investments in derivative instruments. |
| * | Cost for federal income tax purposes is $1,633,676,021 and unrealized gains (losses) consists of: |
| | | | |
Gross unrealized gains | | $ | 39,360,419 | |
Gross unrealized losses | | | (8,273,767 | ) |
| | | | |
Net unrealized gains | | $ | 31,086,652 | |
The accompanying notes are an integral part of these financial statements.
| | | | |
| 10 | | Wells Fargo Advantage Government Securities Fund | | Statement of assets and liabilities—February 28, 2015 (unaudited) |
| | | | |
| | | | |
| |
Assets | | | | |
Investments | | | | |
In unaffiliated securities, at value (cost $1,630,085,671) | | $ | 1,662,164,196 | |
In affiliated securities, at value (cost $2,598,477) | | | 2,598,477 | |
| | | | |
Total investments, at value (cost $1,632,684,148) | | | 1,664,762,673 | |
Cash | | | 979 | |
Principal paydown receivable | | | 30,728 | |
Receivable for Fund shares sold | | | 541,250 | |
Receivable for interest | | | 3,822,504 | |
Receivable for daily variation margin on open futures contracts | | | 202,183 | |
Prepaid expenses and other assets | | | 32,044 | |
| | | | |
Total assets | | | 1,669,392,361 | |
| | | | |
| |
Liabilities | | | | |
Dividends payable | | | 51,786 | |
Payable for investments purchased | | | 397,265,760 | |
Payable for Fund shares redeemed | | | 2,406,804 | |
Advisory fee payable | | | 329,384 | |
Distribution fees payable | | | 18,503 | |
Administration fees payable | | | 177,996 | |
Accrued expenses and other liabilities | | | 285,274 | |
| | | | |
Total liabilities | | | 400,535,507 | |
| | | | |
Total net assets | | $ | 1,268,856,854 | |
| | | | |
| |
NET ASSETS CONSIST OF | | | | |
Paid-in capital | | $ | 1,248,268,413 | |
Overdistributed net investment income | | | (11,348,041 | ) |
Accumulated net realized losses on investments | | | (149,512 | ) |
Net unrealized gains on investments | | | 32,085,994 | |
| | | | |
Total net assets | | $ | 1,268,856,854 | |
| | | | |
| |
COMPUTATION OF NET ASSET VALUE AND OFFERING PRICE PER SHARE | | | | |
Net assets – Class A | | $ | 235,810,127 | |
Shares outstanding – Class A1 | | | 20,860,252 | |
Net asset value per share – Class A | | | $11.30 | |
Maximum offering price per share – Class A2 | | | $11.83 | |
Net assets – Class B | | $ | 785,127 | |
Shares outstanding – Class B1 | | | 69,469 | |
Net asset value per share – Class B | | | $11.30 | |
Net assets – Class C | | $ | 30,166,737 | |
Shares outstanding – Class C1 | | | 2,668,984 | |
Net asset value per share – Class C | | | $11.30 | |
Net assets – Administrator Class | | $ | 177,414,833 | |
Shares outstanding – Administrator Class1 | | | 15,700,544 | |
Net asset value per share – Administrator Class | | | $11.30 | |
Net assets – Institutional Class | | $ | 499,803,678 | |
Shares outstanding – Institutional Class1 | | | 44,252,587 | |
Net asset value per share – Institutional Class | | | $11.29 | |
Net assets – Investor Class | | $ | 324,876,352 | |
Shares outstanding – Investor Class1 | | | 28,721,971 | |
Net asset value per share – Investor Class | | | $11.31 | |
| 1 | The Fund has an unlimited number of authorized shares. |
| 2 | Maximum offering price is computed as 100/95.50 of net asset value. On investments of $50,000 or more, the offering price is reduced. |
The accompanying notes are an integral part of these financial statements.
| | | | | | |
| Statement of operations—six months ended February 28, 2015 (unaudited) | | Wells Fargo Advantage Government Securities Fund | | | 11 | |
| | | | |
| | | | |
| |
Investment income | | | | |
Interest | | $ | 10,497,667 | |
Income from affiliated securities | | | 662 | |
| | | | |
Total investment income | | | 10,498,329 | |
| | | | |
| |
Expenses | | | | |
Advisory fee | | | 2,408,598 | |
Administration fees | | | | |
Fund level | | | 317,520 | |
Class A | | | 141,161 | |
Class B | | | 758 | |
Class C | | | 24,522 | |
Administrator Class | | | 97,653 | |
Institutional Class | | | 213,664 | |
Investor Class | | | 315,934 | |
Shareholder servicing fees | | | | |
Class A | | | 220,564 | |
Class B | | | 1,184 | |
Class C | | | 38,315 | |
Administrator Class | | | 235,458 | |
Investor Class | | | 414,370 | |
Distribution fees | | | | |
Class B | | | 3,552 | |
Class C | | | 114,945 | |
Custody and accounting fees | | | 41,814 | |
Professional fees | | | 38,272 | |
Registration fees | | | 27,820 | |
Shareholder report expenses | | | 44,875 | |
Trustees’ fees and expenses | | | 3,919 | |
Other fees and expenses | | | 20,348 | |
| | | | |
Total expenses | | | 4,725,246 | |
Less: Fee waivers and/or expense reimbursements | | | (352,379 | ) |
| | | | |
Net expenses | | | 4,372,867 | |
| | | | |
Net investment income | | | 6,125,462 | |
| | | | |
| |
REALIZED AND UNREALIZED GAINS (LOSSES) ON INVESTMENTS | | | | |
| |
Net realized gains on: | | | | |
Unaffiliated securities | | | 14,641,143 | |
Futures transactions | | | 4,906,143 | |
| | | | |
Net realized gains on investments | | | 19,547,286 | |
| | | | |
| |
Net change in unrealized gains (losses) on: | | | | |
Unaffiliated securities | | | 3,441,458 | |
Futures transactions | | | (461,693 | ) |
| | | | |
Net change in unrealized gains (losses) on investments | | | 2,979,765 | |
| | | | |
Net realized and unrealized gains (losses) on investments | | | 22,527,051 | |
| | | | |
Net increase in net assets resulting from operations | | $ | 28,652,513 | |
| | | | |
The accompanying notes are an integral part of these financial statements.
| | | | |
| 12 | | Wells Fargo Advantage Government Securities Fund | | Statement of changes in net assets |
| | | | | | | | | | | | | | | | |
| | | Six months ended February 28, 2015 (unaudited) | | | Year ended August 31, 2014 | |
| | | | |
Operations | | | | | | | | | | | | | | | | |
Net investment income | | | | | | $ | 6,125,462 | | | | | | | $ | 9,641,392 | |
Net realized gains on investments | | | | | | | 19,547,286 | | | | | | | | 26,150,713 | |
Net change in unrealized gains (losses) on investments | | | | | | | 2,979,765 | | | | | | | | 23,009,547 | |
| | | | |
Net increase in net assets resulting from operations | | | | | | | 28,652,513 | | | | | | | | 58,801,652 | |
| | | | |
| | | | |
Distributions to shareholders from | | | | | | | | | | | | | | | | |
Net investment income | | | | | | | | | | | | | | | | |
Class A | | | | | | | (788,485 | ) | | | | | | | (1,872,053 | ) |
Class B | | | | | | | (710 | ) | | | | | | | (4,542 | ) |
Class C | | | | | | | (22,748 | ) | | | | | | | (97,114 | ) |
Administrator Class | | | | | | | (1,078,452 | ) | | | | | | | (2,550,531 | ) |
Institutional Class | | | | | | | (3,387,487 | ) | | | | | | | (7,287,898 | ) |
Investor Class | | | | | | | (1,445,451 | ) | | | | | | | (3,734,536 | ) |
| | | | |
Total distributions to shareholders | | | | | | | (6,723,333 | ) | | | | | | | (15,546,674 | ) |
| | | | |
| | | | |
Capital share transactions | | | Shares | | | | | | | | Shares | | | | | |
Proceeds from shares sold | | | | | | | | | | | | | | | | |
Class A | | | 7,060,546 | | | | 79,760,069 | | | | 1,334,647 | | | | 14,597,639 | |
Class B | | | 1,363 | | | | 15,319 | | | | 3,268 | | | | 35,619 | |
Class C | | | 126,377 | | | | 1,418,715 | | | | 104,199 | | | | 1,140,397 | |
Administrator Class | | | 1,402,379 | | | | 15,709,725 | | | | 5,338,839 | | | | 58,457,305 | |
Institutional Class | | | 5,739,457 | | | | 64,239,429 | | | | 11,859,778 | | | | 129,354,060 | |
Investor Class | | | 2,598,425 | | | | 29,114,163 | | | | 3,439,701 | | | | 37,627,752 | |
| | | | |
| | | | | | | 190,257,420 | | | | | | | | 241,212,772 | |
| | | | |
Reinvestment of distributions | | | | | | | | | | | | | | | | |
Class A | | | 60,446 | | | | 678,667 | | | | 150,226 | | | | 1,639,169 | |
Class B | | | 48 | | | | 532 | | | | 350 | | | | 3,778 | |
Class C | | | 785 | | | | 8,801 | | | | 3,431 | | | | 37,019 | |
Administrator Class | | | 90,768 | | | | 1,018,654 | | | | 199,621 | | | | 2,179,413 | |
Institutional Class | | | 289,604 | | | | 3,247,681 | | | | 652,963 | | | | 7,128,143 | |
Investor Class | | | 125,654 | | | | 1,411,295 | | | | 333,416 | | | | 3,639,504 | |
| | | | |
| | | | | | | 6,365,630 | | | | | | | | 14,627,026 | |
| | | | |
Payment for shares redeemed | | | | | | | | | | | | | | | | |
Class A | | | (1,899,712 | ) | | | (21,337,050 | ) | | | (4,693,790 | ) | | | (51,288,609 | ) |
Class B | | | (36,074 | ) | | | (404,089 | ) | | | (109,977 | ) | | | (1,201,292 | ) |
Class C | | | (330,181 | ) | | | (3,696,298 | ) | | | (1,382,379 | ) | | | (15,072,513 | ) |
Administrator Class | | | (4,842,781 | ) | | | (54,214,110 | ) | | | (18,024,531 | ) | | | (196,102,002 | ) |
Institutional Class | | | (10,479,816 | ) | | | (117,668,357 | ) | | | (16,381,291 | ) | | | (177,928,722 | ) |
Investor Class | | | (4,547,961 | ) | | | (51,103,281 | ) | | | (13,804,746 | ) | | | (150,877,755 | ) |
| | | | |
| | | | | | | (248,423,185 | ) | | | | | | | (592,470,893 | ) |
| | | | |
Net decrease in net assets resulting from capital share transactions | | | | | | | (51,800,135 | ) | | | | | | | (336,631,095 | ) |
| | | | |
Total decrease in net assets | | | | | | | (29,870,955 | ) | | | | | | | (293,376,117 | ) |
| | | | |
| | | | |
Net assets | | | | | | | | | | | | | | | | |
Beginning of period | | | | | | | 1,298,727,809 | | | | | | | | 1,592,103,926 | |
| | | | |
End of period | | | | | | $ | 1,268,856,854 | | | | | | | $ | 1,298,727,809 | |
| | | | |
Overdistributed net investment income | | | | | | $ | (11,348,041 | ) | | | | | | $ | (10,750,170 | ) |
| | | | |
The accompanying notes are an integral part of these financial statements.
| | | | | | |
| Financial highlights | | Wells Fargo Advantage Government Securities Fund | | | 13 | |
(For a share outstanding throughout each period)
| | | | | | | | | | | | | | | | | | | | | | | | | | | | |
| | | Six months ended
February 28, 2015
(unaudited) | | | Year ended August 31 | | | Year ended
May 31, 2010 | |
| CLASS A | | | 2014 | | | 2013 | | | 2012 | | | 2011 | | | 20101 | | |
Net asset value, beginning of period | | | $11.11 | | | | $10.77 | | | | $11.48 | | | | $11.23 | | | | $11.16 | | | | $10.89 | | | | $10.71 | |
Net investment income | | | 0.04 | 2 | | | 0.05 | | | | 0.07 | | | | 0.15 | | | | 0.25 | | | | 0.06 | 2 | | | 0.29 | |
Net realized and unrealized gains (losses) on investments | | | 0.20 | | | | 0.40 | | | | (0.42 | ) | | | 0.33 | | | | 0.16 | | | | 0.30 | | | | 0.39 | |
| | | | | | | | | | | | | | | | | | | | | | | | | | | | |
Total from investment operations | | | 0.24 | | | | 0.45 | | | | (0.35 | ) | | | 0.48 | | | | 0.41 | | | | 0.36 | | | | 0.68 | |
Distributions to shareholders from | | | | | | | | | | | | | | | | | | | | | | | | | | | | |
Net investment income | | | (0.05 | ) | | | (0.11 | ) | | | (0.09 | ) | | | (0.17 | ) | | | (0.34 | ) | | | (0.09 | ) | | | (0.41 | ) |
Net realized gains | | | 0.00 | | | | 0.00 | | | | (0.27 | ) | | | (0.06 | ) | | | 0.00 | | | | 0.00 | | | | (0.09 | ) |
| | | | | | | | | | | | | | | | | | | | | | | | | | | | |
Total distributions to shareholders | | | (0.05 | ) | | | (0.11 | ) | | | (0.36 | ) | | | (0.23 | ) | | | (0.34 | ) | | | (0.09 | ) | | | (0.50 | ) |
Net asset value, end of period | | | $11.30 | | | | $11.11 | | | | $10.77 | | | | $11.48 | | | | $11.23 | | | | $11.16 | | | | $10.89 | |
Total return3 | | | 2.16 | % | | | 4.19 | % | | | (3.22 | )% | | | 4.35 | % | | | 3.75 | % | | | 3.29 | % | | | 6.48 | % |
Ratios to average net assets (annualized) | | | | | | | | | | | | | | | | | | | | | | | | | | | | |
Gross expenses | | | 0.87 | % | | | 0.88 | % | | | 0.85 | % | | | 0.86 | % | | | 0.85 | % | | | 0.86 | % | | | 0.89 | % |
Net expenses | | | 0.85 | % | | | 0.86 | % | | | 0.85 | % | | | 0.86 | % | | | 0.85 | % | | | 0.86 | % | | | 0.89 | % |
Net investment income | | | 0.81 | % | | | 0.56 | % | | | 0.67 | % | | | 1.35 | % | | | 2.31 | % | | | 2.10 | % | | | 2.71 | % |
Supplemental data | | | | | | | | | | | | | | | | | | | | | | | | | | | | |
Portfolio turnover rate | | | 177 | % | | | 349 | % | | | 341 | % | | | 327 | % | | | 268 | % | | | 89 | % | | | 194 | % |
Net assets, end of period (000s omitted) | | | $235,810 | | | | $173,772 | | | | $202,955 | | | | $258,329 | | | | $270,253 | | | | $326,800 | | | | $174,781 | |
| 1 | For the three months ended August 31, 2010. The Fund changed its fiscal year end from May 31 to August 31, effective August 31, 2010. |
| 2 | Calculated based upon average shares outstanding |
| 3 | Total return calculations do not include any sales charges. Returns for periods of less than one year are not annualized. |
The accompanying notes are an integral part of these financial statements.
| | | | |
| 14 | | Wells Fargo Advantage Government Securities Fund | | Financial highlights |
(For a share outstanding throughout each period)
| | | | | | | | | | | | | | | | | | | | | | | | | | | | |
| | | Six months ended
February 28, 2015
(unaudited) | | | Year ended August 31 | | | Year ended
May 31, 2010 | |
| CLASS B | | | 2014 | | | 2013 | | | 2012 | | | 2011 | | | 20101 | | |
Net asset value, beginning of period | | | $11.11 | | | | $10.77 | | | | $11.48 | | | | $11.23 | | | | $11.16 | | | | $10.89 | | | | $10.70 | |
Net investment income (loss) | | | 0.00 | 2,3 | | | (0.02 | )2 | | | (0.03 | ) | | | 0.08 | 2 | | | 0.15 | | | | 0.04 | 2 | | | 0.24 | 2 |
Net realized and unrealized gains (losses) on investments | | | 0.20 | | | | 0.39 | | | | (0.41 | ) | | | 0.31 | | | | 0.17 | | | | 0.30 | | | | 0.37 | |
| | | | | | | | | | | | | | | | | | | | | | | | | | | | |
Total from investment operations | | | 0.20 | | | | 0.37 | | | | (0.44 | ) | | | 0.39 | | | | 0.32 | | | | 0.34 | | | | 0.61 | |
Distributions to shareholders from | | | | | | | | | | | | | | | | | | | | | | | | | | | | |
Net investment income | | | (0.01 | ) | | | (0.03 | ) | | | (0.00 | )3 | | | (0.08 | ) | | | (0.25 | ) | | | (0.07 | ) | | | (0.33 | ) |
Net realized gains | | | 0.00 | | | | 0.00 | | | | (0.27 | ) | | | (0.06 | ) | | | 0.00 | | | | 0.00 | | | | (0.09 | ) |
| | | | | | | | | | | | | | | | | | | | | | | | | | | | |
Total distributions to shareholders | | | (0.01 | ) | | | (0.03 | ) | | | (0.27 | ) | | | (0.14 | ) | | | (0.25 | ) | | | (0.07 | ) | | | (0.42 | ) |
Net asset value, end of period | | | $11.30 | | | | $11.11 | | | | $10.77 | | | | $11.48 | | | | $11.23 | | | | $11.16 | | | | $10.89 | |
Total return4 | | | 1.78 | % | | | 3.42 | % | | | (3.94 | )% | | | 3.57 | % | | | 2.98 | % | | | 3.10 | % | | | 5.80 | % |
Ratios to average net assets (annualized) | | | | | | | | | | | | | | | | | | | | | | | | | | | | |
Gross expenses | | | 1.62 | % | | | 1.61 | % | | | 1.60 | % | | | 1.61 | % | | | 1.60 | % | | | 1.60 | % | | | 1.63 | % |
Net expenses | | | 1.60 | % | | | 1.60 | % | | | 1.60 | % | | | 1.61 | % | | | 1.60 | % | | | 1.60 | % | | | 1.63 | % |
Net investment income (loss) | | | 0.05 | % | | | (0.18 | )% | | | (0.08 | )% | | | 0.68 | % | | | 1.55 | % | | | 1.29 | % | | | 2.09 | % |
Supplemental data | | | | | | | | | | | | | | | | | | | | | | | | | | | | |
Portfolio turnover rate | | | 177 | % | | | 349 | % | | | 341 | % | | | 327 | % | | | 268 | % | | | 89 | % | | | 194 | % |
Net assets, end of period (000s omitted) | | | $785 | | | | $1,157 | | | | $2,266 | | | | $4,727 | | | | $7,083 | | | | $11,495 | | | | $2,159 | |
| 1 | For the three months ended August 31, 2010. The Fund changed its fiscal year end from May 31 to August 31, effective August 31, 2010. |
| 2 | Calculated based upon average shares outstanding |
| 3 | Amount is less than $0.005. |
| 4 | Total return calculations do not include any sales charges. Returns for periods of less than one year are not annualized. |
The accompanying notes are an integral part of these financial statements.
| | | | | | |
| Financial highlights | | Wells Fargo Advantage Government Securities Fund | | | 15 | |
(For a share outstanding throughout each period)
| | | | | | | | | | | | | | | | | | | | | | | | | | | | |
| | | Six months ended
February 28, 2015
(unaudited) | | | Year ended August 31 | | | Year ended
May 31, 2010 | |
| CLASS C | | | 2014 | | | 2013 | | | 2012 | | | 2011 | | | 20101 | | |
Net asset value, beginning of period | | | $11.11 | | | | $10.77 | | | | $11.48 | | | | $11.23 | | | | $11.16 | | | | $10.89 | | | | $10.70 | |
Net investment income (loss) | | | 0.00 | 2,3 | | | (0.02 | )2 | | | (0.02 | ) | | | 0.07 | | | | 0.17 | | | | 0.04 | 2 | | | 0.23 | |
Net realized and unrealized gains (losses) on investments | | | 0.20 | | | | 0.39 | | | | (0.42 | ) | | | 0.32 | | | | 0.15 | | | | 0.30 | | | | 0.38 | |
| | | | | | | | | | | | | | | | | | | | | | | | | | | | |
Total from investment operations | | | 0.20 | | | | 0.37 | | | | (0.44 | ) | | | 0.39 | | | | 0.32 | | | | 0.34 | | | | 0.61 | |
Distributions to shareholders from | | | | | | | | | | | | | | | | | | | | | | | | | | | | |
Net investment income | | | (0.01 | ) | | | (0.03 | ) | | | (0.00 | )3 | | | (0.08 | ) | | | (0.25 | ) | | | (0.07 | ) | | | (0.33 | ) |
Net realized gains | | | 0.00 | | | | 0.00 | | | | (0.27 | ) | | | (0.06 | ) | | | 0.00 | | | | 0.00 | | | | (0.09 | ) |
| | | | | | | | | | | | | | | | | | | | | | | | | | | | |
Total distributions to shareholders | | | (0.01 | ) | | | (0.03 | ) | | | (0.27 | ) | | | (0.14 | ) | | | (0.25 | ) | | | (0.07 | ) | | | (0.42 | ) |
Net asset value, end of period | | | $11.30 | | | | $11.11 | | | | $10.77 | | | | $11.48 | | | | $11.23 | | | | $11.16 | | | | $10.89 | |
Total return4 | | | 1.78 | % | | | 3.42 | % | | | (3.94 | )% | | | 3.57 | % | | | 2.98 | % | | | 3.09 | % | | | 5.78 | % |
Ratios to average net assets (annualized) | | | | | | | | | | | | | | | | | | | | | | | | | | | | |
Gross expenses | | | 1.62 | % | | | 1.63 | % | | | 1.60 | % | | | 1.61 | % | | | 1.60 | % | | | 1.61 | % | | | 1.64 | % |
Net expenses | | | 1.60 | % | | | 1.61 | % | | | 1.60 | % | | | 1.61 | % | | | 1.60 | % | | | 1.61 | % | | | 1.64 | % |
Net investment income (loss) | | | 0.05 | % | | | (0.20 | )% | | | (0.08 | )% | | | 0.55 | % | | | 1.56 | % | | | 1.35 | % | | | 1.89 | % |
Supplemental data | | | | | | | | | | | | | | | | | | | | | | | | | | | | |
Portfolio turnover rate | | | 177 | % | | | 349 | % | | | 341 | % | | | 327 | % | | | 268 | % | | | 89 | % | | | 194 | % |
Net assets, end of period (000s omitted) | | | $30,167 | | | | $31,908 | | | | $44,647 | | | | $75,244 | | | | $58,576 | | | | $59,580 | | | | $34,927 | |
| 1 | For the three months ended August 31, 2010. The Fund changed its fiscal year end from May 31 to August 31, effective August 31, 2010. |
| 2 | Calculated based upon average shares outstanding |
| 3 | Amount is less than $0.005. |
| 4 | Total return calculations do not include any sales charges. Returns for periods of less than one year are not annualized. |
The accompanying notes are an integral part of these financial statements.
| | | | |
| 16 | | Wells Fargo Advantage Government Securities Fund | | Financial highlights |
(For a share outstanding throughout each period)
| | | | | | | | | | | | | | | | | | | | | | | | | | | | |
| | | Six months ended
February 28, 2015
(unaudited) | | | Year ended August 31 | | | Year ended
May 31, 2010 | |
| ADMINISTRATOR CLASS | | | 2014 | | | 2013 | | | 2012 | | | 2011 | | | 20101 | | |
Net asset value, beginning of period | | | $11.11 | | | | $10.76 | | | | $11.48 | | | | $11.23 | | | | $11.16 | | | | $10.89 | | | | $10.70 | |
Net investment income | | | 0.06 | 2 | | | 0.06 | | | | 0.09 | | | | 0.17 | 2 | | | 0.27 | 2 | | | 0.06 | 2 | | | 0.32 | |
Net realized and unrealized gains (losses) on investments | | | 0.19 | | | | 0.42 | | | | (0.43 | ) | | | 0.33 | | | | 0.16 | | | | 0.30 | | | | 0.39 | |
| | | | | | | | | | | | | | | | | | | | | | | | | | | | |
Total from investment operations | | | 0.25 | | | | 0.48 | | | | (0.34 | ) | | | 0.50 | | | | 0.43 | | | | 0.36 | | | | 0.71 | |
Distributions to shareholders from | | | | | | | | | | | | | | | | | | | | | | | | | | | | |
Net investment income | | | (0.06 | ) | | | (0.13 | ) | | | (0.11 | ) | | | (0.19 | ) | | | (0.36 | ) | | | (0.09 | ) | | | (0.43 | ) |
Net realized gains | | | 0.00 | | | | 0.00 | | | | (0.27 | ) | | | (0.06 | ) | | | 0.00 | | | | 0.00 | | | | (0.09 | ) |
| | | | | | | | | | | | | | | | | | | | | | | | | | | | |
Total distributions to shareholders | | | (0.06 | ) | | | (0.13 | ) | | | (0.38 | ) | | | (0.25 | ) | | | (0.36 | ) | | | (0.09 | ) | | | (0.52 | ) |
Net asset value, end of period | | | $11.30 | | | | $11.11 | | | | $10.76 | | | | $11.48 | | | | $11.23 | | | | $11.16 | | | | $10.89 | |
Total return3 | | | 2.27 | % | | | 4.51 | % | | | (3.10 | )% | | | 4.57 | % | | | 3.97 | % | | | 3.34 | % | | | 6.78 | % |
Ratios to average net assets (annualized) | | | | | | | | | | | | | | | | | | | | | | | | | | | | |
Gross expenses | | | 0.80 | % | | | 0.81 | % | | | 0.79 | % | | | 0.79 | % | | | 0.74 | % | | | 0.79 | % | | | 0.81 | % |
Net expenses | | | 0.64 | % | | | 0.64 | % | | | 0.64 | % | | | 0.64 | % | | | 0.64 | % | | | 0.67 | % | | | 0.70 | % |
Net investment income | | | 1.01 | % | | | 0.79 | % | | | 0.88 | % | | | 1.49 | % | | | 2.50 | % | | | 2.30 | % | | | 2.90 | % |
Supplemental data | | | | | | | | | | | | | | | | | | | | | | | | | | | | |
Portfolio turnover rate | | | 177 | % | | | 349 | % | | | 341 | % | | | 327 | % | | | 268 | % | | | 89 | % | | | 194 | % |
Net assets, end of period (000s omitted) | | | $177,415 | | | | $211,589 | | | | $339,446 | | | | $436,578 | | | | $276,334 | | | | $366,430 | | | | $243,760 | |
| 1 | For the three months ended August 31, 2010. The Fund changed its fiscal year end from May 31 to August 31, effective August 31, 2010. |
| 2 | Calculated based upon average shares outstanding |
| 3 | Returns for periods of less than one year are not annualized. |
The accompanying notes are an integral part of these financial statements.
| | | | | | |
| Financial highlights | | Wells Fargo Advantage Government Securities Fund | | | 17 | |
(For a share outstanding throughout each period)
| | | | | | | | | | | | | | | | | | | | | | | | | | | | |
| | | Six months ended
February 28, 2015
(unaudited) | | | Year ended August 31 | | | Year ended
May 31, 2010 | |
| INSTITUTIONAL CLASS | | | 2014 | | | 2013 | | | 2012 | | | 2011 | | | 20101 | | |
Net asset value, beginning of period | | | $11.10 | | | | $10.76 | | | | $11.47 | | | | $11.22 | | | | $11.15 | | | | $10.88 | | | | $10.70 | |
Net investment income | | | 0.07 | 2 | | | 0.10 | | | | 0.11 | | | | 0.19 | 2 | | | 0.30 | | | | 0.07 | 2 | | | 0.32 | 2 |
Net realized and unrealized gains (losses) on investments | | | 0.19 | | | | 0.39 | | | | (0.42 | ) | | | 0.33 | | | | 0.15 | | | | 0.30 | | | | 0.41 | |
| | | | | | | | | | | | | | | | | | | | | | | | | | | | |
Total from investment operations | | | 0.26 | | | | 0.49 | | | | (0.31 | ) | | | 0.52 | | | | 0.45 | | | | 0.37 | | | | 0.73 | |
Distributions to shareholders from | | | | | | | | | | | | | | | | | | | | | | | | | | | | |
Net investment income | | | (0.07 | ) | | | (0.15 | ) | | | (0.13 | ) | | | (0.21 | ) | | | (0.38 | ) | | | (0.10 | ) | | | (0.46 | ) |
Net realized gains | | | 0.00 | | | | 0.00 | | | | (0.27 | ) | | | (0.06 | ) | | | 0.00 | | | | 0.00 | | | | (0.09 | ) |
| | | | | | | | | | | | | | | | | | | | | | | | | | | | |
Total distributions to shareholders | | | (0.07 | ) | | | (0.15 | ) | | | (0.40 | ) | | | (0.27 | ) | | | (0.38 | ) | | | (0.10 | ) | | | (0.55 | ) |
Net asset value, end of period | | | $11.29 | | | | $11.10 | | | | $10.76 | | | | $11.47 | | | | $11.22 | | | | $11.15 | | | | $10.88 | |
Total return3 | | | 2.35 | % | | | 4.59 | % | | | (2.86 | )% | | | 4.74 | % | | | 4.14 | % | | | 3.39 | % | | | 6.92 | % |
Ratios to average net assets (annualized) | | | | | | | | | | | | | | | | | | | | | | | | | | | | |
Gross expenses | | | 0.54 | % | | | 0.55 | % | | | 0.52 | % | | | 0.53 | % | | | 0.52 | % | | | 0.52 | % | | | 0.54 | % |
Net expenses | | | 0.48 | % | | | 0.48 | % | | | 0.48 | % | | | 0.48 | % | | | 0.48 | % | | | 0.48 | % | | | 0.48 | % |
Net investment income | | | 1.17 | % | | | 0.94 | % | | | 1.05 | % | | | 1.71 | % | | | 2.71 | % | | | 2.52 | % | | | 3.06 | % |
Supplemental data | | | | | | | | | | | | | | | | | | | | | | | | | | | | |
Portfolio turnover rate | | | 177 | % | | | 349 | % | | | 341 | % | | | 327 | % | | | 268 | % | | | 89 | % | | | 194 | % |
Net assets, end of period (000s omitted) | | | $499,804 | | | | $540,684 | | | | $565,573 | | | | $778,919 | | | | $718,411 | | | | $531,890 | | | | $463,726 | |
| 1 | For the three months ended August 31, 2010. The Fund changed its fiscal year end from May 31 to August 31, effective August 31, 2010. |
| 2 | Calculated based upon average shares outstanding |
| 3 | Returns for periods of less than one year are not annualized. |
The accompanying notes are an integral part of these financial statements.
| | | | |
| 18 | | Wells Fargo Advantage Government Securities Fund | | Financial highlights |
(For a share outstanding throughout each period)
| | | | | | | | | | | | | | | | | | | | | | | | | | | | |
| | | Six months ended
February 28, 2015
(unaudited) | | | Year ended August 31 | | | Year ended
May 31, 2010 | |
| INVESTOR CLASS | | | 2014 | | | 2013 | | | 2012 | | | 2011 | | | 20101 | | |
Net asset value, beginning of period | | | $11.12 | | | | $10.77 | | | | $11.49 | | | | $11.24 | | | | $11.17 | | | | $10.90 | | | | $10.71 | |
Net investment income | | | 0.04 | | | | 0.04 | | | | 0.07 | | | | 0.15 | 2 | | | 0.25 | 2 | | | 0.06 | 2 | | | 0.29 | |
Net realized and unrealized gains (losses) on investments | | | 0.20 | | | | 0.42 | | | | (0.44 | ) | | | 0.33 | | | | 0.15 | | | | 0.30 | | | | 0.40 | |
| | | | | | | | | | | | | | | | | | | | | | | | | | | | |
Total from investment operations | | | 0.24 | | | | 0.46 | | | | (0.37 | ) | | | 0.48 | | | | 0.40 | | | | 0.36 | | | | 0.69 | |
Distributions to shareholders from | | | | | | | | | | | | | | | | | | | | | | | | | | | | |
Net investment income | | | (0.05 | ) | | | (0.11 | ) | | | (0.08 | ) | | | (0.17 | ) | | | (0.33 | ) | | | (0.09 | ) | | | (0.41 | ) |
Net realized gains | | | 0.00 | | | | 0.00 | | | | (0.27 | ) | | | (0.06 | ) | | | 0.00 | | | | 0.00 | | | | (0.09 | ) |
| | | | | | | | | | | | | | | | | | | | | | | | | | | | |
Total distributions to shareholders | | | (0.05 | ) | | | (0.11 | ) | | | (0.35 | ) | | | (0.23 | ) | | | (0.33 | ) | | | (0.09 | ) | | | (0.50 | ) |
Net asset value, end of period | | | $11.31 | | | | $11.12 | | | | $10.77 | | | | $11.49 | | | | $11.24 | | | | $11.17 | | | | $10.90 | |
Total return3 | | | 2.15 | % | | | 4.25 | % | | | (3.33 | )% | | | 4.31 | % | | | 3.72 | % | | | 3.28 | % | | | 6.53 | % |
Ratios to average net assets (annualized) | | | | | | | | | | | | | | | | | | | | | | | | | | | | |
Gross expenses | | | 0.90 | % | | | 0.90 | % | | | 0.87 | % | | | 0.89 | % | | | 0.88 | % | | | 0.90 | % | | | 0.94 | % |
Net expenses | | | 0.88 | % | | | 0.89 | % | | | 0.87 | % | | | 0.89 | % | | | 0.88 | % | | | 0.90 | % | | | 0.94 | % |
Net investment income | | | 0.77 | % | | | 0.53 | % | | | 0.65 | % | | | 1.33 | % | | | 2.25 | % | | | 2.10 | % | | | 2.66 | % |
Supplemental data | | | | | | | | | | | | | | | | | | | | | | | | | | | | |
Portfolio turnover rate | | | 177 | % | | | 349 | % | | | 341 | % | | | 327 | % | | | 268 | % | | | 89 | % | | | 194 | % |
Net assets, end of period (000s omitted) | | | $324,876 | | | | $339,618 | | | | $437,217 | | | | $640,561 | | | | $678,022 | | | | $1,146,356 | | | | $1,024,088 | |
| 1 | For the three months ended August 31, 2010. The Fund changed its fiscal year end from May 31 to August 31, effective August 31, 2010. |
| 2 | Calculated based upon average shares outstanding |
| 3 | Returns for periods of less than one year are not annualized. |
The accompanying notes are an integral part of these financial statements.
| | | | | | |
| Notes to financial statements (unaudited) | | Wells Fargo Advantage Government Securities Fund | | | 19 | |
1. ORGANIZATION
Wells Fargo Funds Trust (the “Trust”), a Delaware statutory trust organized on March 10, 1999, is an open-end management investment company registered under the Investment Company Act of 1940, as amended (the “1940 Act”). As an investment company, the Trust follows the accounting and reporting guidance in Financial Accounting Standards Board (“FASB”) Accounting Standards Codification Topic 946, Financial Services—Investment Companies. These financial statements report on the Wells Fargo Advantage Government Securities Fund (the “Fund”) which is a diversified series of the Trust.
2. SIGNIFICANT ACCOUNTING POLICIES
The following significant accounting policies, which are consistently followed in the preparation of the financial statements of the Fund, are in conformity with U.S. generally accepted accounting principles which require management to make estimates and assumptions that affect the reported amounts of assets and liabilities, disclosure of contingent assets and liabilities at the date of the financial statements, and the reported amounts of revenues and expenses during the reporting period. Actual results could differ from those estimates.
Securities valuation
All investments are valued each business day as of the close of regular trading on the New York Stock Exchange (generally 4 p.m. Eastern Time).
Debt securities are valued at the evaluated bid price provided by an independent pricing service or, if a reliable price is not available, the quoted bid price from an independent broker-dealer.
Futures that are listed on a foreign or domestic exchange or market are valued at the official closing price or, if none, the last sales price.
Investments in registered open-end investment companies are valued at net asset value.
Investments which are not valued using any of the methods discussed above are valued at their fair value, as determined in good faith by the Board of Trustees of the Fund. The Board of Trustees has established a Valuation Committee comprised of the Trustees and has delegated to it the authority to take any actions regarding the valuation of portfolio securities that the Valuation Committee deems necessary or appropriate, including determining the fair value of portfolio securities, unless the determination has been delegated to the Management Valuation Team of Wells Fargo Funds Management, LLC (“Funds Management”). The Board of Trustees retains the authority to make or ratify any valuation decisions or approve any changes to the Valuation Procedures as it deems appropriate. On a quarterly basis, the Board of Trustees receives reports on any valuation actions taken by the Valuation Committee or the Management Valuation Team which may include items for ratification.
Valuations of fair valued securities are compared to the next actual sales price when available, or other appropriate market values, to assess the continued appropriateness of the fair valuation methodologies used. These securities are fair valued on a day-to-day basis, taking into consideration changes to appropriate market information and any significant changes to the inputs considered in the valuation process until there is a readily available price provided on an exchange or by an independent pricing service. Valuations received from an independent pricing service or independent broker-dealer quotes are periodically validated by comparisons to most recent trades and valuations provided by other independent pricing services in addition to the review of prices by the adviser and/or subadviser. Unobservable inputs used in determining fair valuations are identified based on the type of security, taking into consideration factors utilized by market participants in valuing the investment, knowledge about the issuer and the current market environment.
When-issued transactions
The Fund may purchase securities on a forward commitment or when-issued basis. The Fund records a when-issued transaction on the trade date and will segregate assets in an amount at least equal in value to the Fund’s commitment to purchase when-issued securities. Securities purchased on a when-issued basis are marked-to-market daily and the Fund begins earning interest on the settlement date. Losses may arise due to changes in the market value of the underlying securities or if the counterparty does not perform under the contract.
Futures contracts
The Fund is subject to interest rate risk in the normal course of pursuing its investment objectives. The Fund may buy and sell futures contracts in order to gain exposure to, or protect against, changes in security values and interest rates. The primary risks associated with the use of futures contracts are the imperfect correlation between changes in market values of securities held by the Fund and the prices of futures contracts, and the possibility of an illiquid market.
| | | | |
| 20 | | Wells Fargo Advantage Government Securities Fund | | Notes to financial statements (unaudited) |
The aggregate principal amounts of the contracts are not recorded in the financial statements. Fluctuations in the value of the contracts are recorded in the Statement of Assets and Liabilities as an asset or liability and in the Statement of Operations as unrealized gains or losses until the contracts are closed, at which point they are recorded as net realized gains or losses on futures contracts. With futures contracts, there is minimal counterparty risk to the Fund since futures are exchange traded and the exchange’s clearinghouse, as counterparty to all exchange traded futures, guarantees the futures against default.
Security transactions and income recognition
Securities transactions are recorded on a trade date basis. Realized gains or losses are recorded on the basis of identified cost.
Interest income is accrued daily and bond discounts are accreted and premiums are amortized daily based on the effective interest method. To the extent debt obligations are placed on non-accrual status, any related interest income may be reduced by writing off interest receivables when the collection of all or a portion of interest has become doubtful based on consistently applied procedures. If the issuer subsequently resumes interest payments or when the collectability of interest is reasonably assured, the debt obligation is removed from non-accrual status.
Distributions to shareholders
Distributions to shareholders from net investment income are accrued daily and paid monthly. Distributions from net realized gains, if any, are recorded on the ex-dividend date. Such distributions are determined in conformity with federal income tax regulations, which may differ in amount or character from net investment income and realized gains recognized for purposes of U.S. generally accepted accounting principles.
Federal and other taxes
The Fund intends to continue to qualify as a regulated investment company by distributing substantially all of its investment company taxable income and any net realized capital gains (after reduction for capital loss carryforwards) sufficient to relieve it from all, or substantially all, federal income taxes. Accordingly, no provision for federal income taxes was required.
The Fund’s income and federal excise tax returns and all financial records supporting those returns for the prior three fiscal years are subject to examination by the federal and Delaware revenue authorities. Management has analyzed the Fund’s tax positions taken on federal, state, and foreign tax returns for all open tax years and does not believe that there are any uncertain tax positions that require recognition of a tax liability.
As of August 31, 2014, the Fund had capital loss carryforwards available to offset future net realized capital gains in the amount of $17,843,796 expiring in 2017.
Class allocations
The separate classes of shares offered by the Fund differ principally in applicable sales charges, distribution, shareholder servicing, and administration fees. Class specific expenses are charged directly to that share class. Investment income, common expenses, and realized and unrealized gains (losses) on investments are allocated daily to each class of shares based on the relative proportion of net assets of each class.
3. FAIR VALUATION MEASUREMENTS
Fair value measurements of investments are determined within a framework that has established a fair value hierarchy based upon the various data inputs utilized in determining the value of the Fund’s investments. The three-level hierarchy gives the highest priority to unadjusted quoted prices in active markets for identical assets or liabilities (Level 1) and the lowest priority to significant unobservable inputs (Level 3). The Fund’s investments are classified within the fair value hierarchy based on the lowest level of input that is significant to the fair value measurement. The inputs are summarized into three broad levels as follows:
| n | | Level 1 – quoted prices in active markets for identical securities |
| n | | Level 2 – other significant observable inputs (including quoted prices for similar securities, interest rates, prepayment speeds, credit risk, use of amortized cost, etc.) |
| n | | Level 3 – significant unobservable inputs (including the Fund’s own assumptions in determining the fair value of investments) |
The inputs or methodologies used for valuing investments in securities are not necessarily an indication of the risk associated with investing in those securities.
| | | | | | |
| Notes to financial statements (unaudited) | | Wells Fargo Advantage Government Securities Fund | | | 21 | |
The following is a summary of the inputs used in valuing the Fund’s assets and liabilities as of February 28, 2015:
| | | | | | | | | | | | | | | | |
| | | Quoted prices
(Level 1) | | | Other significant
observable inputs
(Level 2) | | | Significant
unobservable inputs
(Level 3) | | | Total | |
Assets | | | | | | | | | | | | | | | | |
Investments in: | | | | | | | | | | | | | | | | |
| | | | |
Agency securities | | $ | 0 | | | $ | 924,225,597 | | | $ | 10,189 | | | $ | 924,235,786 | |
| | | | |
Municipal obligations | | | 0 | | | | 7,800,280 | | | | 0 | | | | 7,800,280 | |
| | | | |
Non-agency mortgage-backed securities | | | 0 | | | | 74,243,290 | | | | 0 | | | | 74,243,290 | |
| | | | |
U.S. Treasury securities | | | 634,488,837 | | | | 0 | | | | 0 | | | | 634,488,837 | |
| | | | |
Yankee corporate bonds and notes | | | 0 | | | | 19,796,014 | | | | 0 | | | | 19,796,014 | |
| | | | |
Short-term investments | | | | | �� | | | | | | | | | | | |
Investment companies | | | 2,598,477 | | | | 0 | | | | 0 | | | | 2,598,477 | |
U.S. Treasury securities | | | 1,599,989 | | | | 0 | | | | 0 | | | | 1,599,989 | |
| | | | 638,687,303 | | | | 1,026,065,181 | | | | 10,189 | | | | 1,664,762,673 | |
| | | | |
Futures contracts | | | 202,183 | | | | 0 | | | | 0 | | | | 202,183 | |
Total assets | | $ | 638,889,486 | | | $ | 1,026,065,181 | | | $ | 10,189 | | | $ | 1,664,964,856 | |
Futures contracts are reported at their variation margin at measurement date, which represents the amount due to the Fund at that date. All other assets and liabilities are reported at their market value at measurement date.
The Fund recognizes transfers between levels within the fair value hierarchy at the end of the reporting period. At February 28, 2015, the Fund did not have any transfers into/out of Level 1, Level 2, or Level 3.
4. TRANSACTIONS WITH AFFILIATES
Advisory fee
The Trust has entered into an advisory contract with Funds Management, an indirect wholly owned subsidiary of Wells Fargo & Company (“Wells Fargo”). The adviser is responsible for implementing investment policies and guidelines and for supervising the subadviser, who is responsible for day-to-day portfolio management of the Fund.
Pursuant to the contract, Funds Management is entitled to receive an annual advisory fee starting at 0.40% and declining to 0.30% as the average daily net assets of the Fund increase. For the six months ended February 28, 2015, the advisory fee was equivalent to an annual rate of 0.38% of the Fund’s average daily net assets.
Funds Management has retained the services of a subadviser to provide daily portfolio management to the Fund. The fee for subadvisory services is borne by Funds Management. Wells Capital Management Incorporated, an affiliate of Funds Management and an indirect wholly owned subsidiary of Wells Fargo, is the subadviser to the Fund and is entitled to receive a fee from Funds Management at an annual rate starting at 0.20% and declining to 0.10% as the average daily net assets of the Fund increase.
Administration fees
The Trust has entered into an administration agreement with Funds Management. Under this agreement, for providing administrative services, which includes paying fees and expenses for services provided by the transfer agent, sub-transfer agents, omnibus account servicers and record-keepers, Funds Management is entitled to receive from the Fund an annual fund level administration fee starting at 0.05% and declining to 0.03% as the average daily net assets of the Fund increase and a class level administration fee which is calculated based on the average daily net assets of each class as follows:
| | | | |
| | | Class level
administration fee | |
Class A, Class B, Class C | | | 0.16 | % |
Administrator Class | | | 0.10 | |
Institutional Class | | | 0.08 | |
Investor Class | | | 0.19 | |
| | | | |
| 22 | | Wells Fargo Advantage Government Securities Fund | | Notes to financial statements (unaudited) |
Funds Management has contractually waived and/or reimbursed advisory and administration fees to the extent necessary to maintain certain net operating expense ratios for the Fund. Waiver of fees and/or reimbursement of expenses by Funds Management were made first from fund level expenses on a proportionate basis and then from class specific expenses. Funds Management has committed through December 31, 2015 to waive fees and/or reimburse expenses to the extent necessary to cap the Fund’s expenses at 0.85% for Class A shares, 1.60% for Class B shares, 1.60% for Class C shares, 0.64% for Administrator Class shares, 0.48% for Institutional Class shares, and 0.88% for Investor Class shares. After this time, the cap may be increased or the commitment to maintain the cap may be terminated only with the approval of the Board of Trustees.
Distribution fees
The Trust has adopted a Distribution Plan for Class B and Class C shares of the Fund pursuant to Rule 12b-1 under the 1940 Act. Distribution fees are charged to Class B and Class C shares and paid to Wells Fargo Funds Distributor, LLC (“Funds Distributor”), the principal underwriter, at an annual rate of 0.75% of the average daily net assets of Class B and Class C shares.
In addition, Funds Distributor is entitled to receive the front-end sales charge from the purchase of Class A shares and a contingent deferred sales charge on the redemption of certain shares. Funds Distributor is also entitled to receive the contingent deferred sales charges from redemptions of Class B and Class C shares. For the six months ended February 28, 2015, Funds Distributor received $2,195 from the sale of Class A shares.
Shareholder servicing fees
The Trust has entered into contracts with one or more shareholder servicing agents, whereby Class A, Class B, Class C, Administrator Class, and Investor Class of the Fund is charged a fee at an annual rate of 0.25% of the average daily net assets of each respective class.
A portion of these total shareholder servicing fees were paid to affiliates of Wells Fargo.
5. INVESTMENT PORTFOLIO TRANSACTIONS
Purchases and sales of investments, excluding short-term securities, for the six months ended February 28, 2015 were as follows:
| | | | | | |
Purchases at cost | | Sales proceeds |
U.S. government | | Non-U.S. government | | U.S. government | | Non-U.S. government |
| $2,941,062,823 | | $19,554,835 | | $2,946,079,377 | | $8,768,534 |
6. DERIVATIVE TRANSACTIONS
During the six months ended February 28, 2015, the Fund entered into futures contracts to speculate on interest rates and to help manage the duration of the portfolio.
At February 28, 2015, the Fund had long and short futures contracts outstanding as follows:
| | | | | | | | | | | | | | |
| Expiration date | | Counterparty | | Contracts | | Type | | Contract
value at
February 28, 2015 | | | Unrealized
gains
(losses) | |
6-19-2015 | | JPMorgan | | 509 Long | | 10-Year U.S. Treasury Notes | | $ | 65,048,609 | | | $ | 136,251 | |
6-19-2015 | | JPMorgan | | 20 Short | | U.S. Treasury Bonds | | | 3,365,625 | | | | (31,444 | ) |
6-30-2015 | | JPMorgan | | 496 Long | | 2-Year U.S. Treasury Notes | | | 108,414,751 | | | | 309 | |
6-30-2015 | | JPMorgan | | 546 Long | | 5-Year U.S. Treasury Notes | | | 65,127,563 | | | | (97,647 | ) |
The Fund had an average notional amount of $191,383,971 and $13,617,204 in long futures contracts and short futures contracts, respectively, during the six months ended February 28, 2015.
On February 28, 2015, the cumulative unrealized gains on futures contracts in the amount of $7,469 are reflected in net unrealized gains on investments on the Statement of Assets and Liabilities. The receivable for daily variation margin on open futures contracts reflected in the Statement of Assets and Liabilities only represents the current day’s variation margin. The realized gains and change in unrealized gains (losses) on futures contracts are reflected in the Statement of Operations.
| | | | | | |
| Notes to financial statements (unaudited) | | Wells Fargo Advantage Government Securities Fund | | | 23 | |
For certain types of derivative transactions, the Fund has entered into International Swaps and Derivatives Association, Inc. master agreements (“ISDA Master Agreements”) or similar agreements with approved counterparties. The ISDA Master Agreements or similar agreements may have requirements to deliver/deposit securities or cash to/with an exchange or broker-dealer as collateral and allows the Fund to offset, with each counterparty, certain derivative financial instrument’s assets and/or liabilities with collateral held or pledged. Collateral requirements differ by type of derivative. Collateral or margin requirements are set by the broker or exchange clearing house for exchange traded derivatives while collateral terms are contract specific for over-the-counter traded derivatives. Cash collateral that has been pledged to cover obligations of the Fund under ISDA Master Agreements or similar agreements, if any, will be reported separately in the Statement of Assets and Liabilities. Securities pledged as collateral, if any, for the same purpose are noted in the Summary Portfolio of Investments. With respect to balance sheet offsetting, absent an event of default by the counterparty or a termination of the agreement, the reported amounts of financial assets and financial liabilities in the Statement of Assets and Liabilities are not offset across transactions between the Fund and the applicable counterparty. A reconciliation of the gross amounts on the Statement of Assets and Liabilities to the net amounts by derivative type, including any collateral exposure, is as follows:
| | | | | | | | | | | | | | | | |
| Derivative type | | Counterparty | | Gross amounts
of assets in the
Statement of
Assets and
Liabilities | | Amounts
subject to
netting
agreements | | | Collateral
received | | | Net amount
of assets | |
Futures – variation margin | | JPMorgan | | $202,183 | | $ | 0 | | | $ | 0 | | | $ | 202,183 | |
7. BANK BORROWINGS
The Trust (excluding the money market funds and certain other funds in the Trust) and Wells Fargo Variable Trust are parties to a $150,000,000 revolving credit agreement whereby the Fund is permitted to use bank borrowings for temporary or emergency purposes, such as to fund shareholder redemption requests. Interest under the credit agreement is charged to the Fund based on a borrowing rate equal to the higher of the Federal Funds rate in effect on that day plus 1.25% or the overnight LIBOR rate in effect on that day plus 1.25%. In addition, an annual commitment fee equal to 0.10% of the unused balance is allocated to each participating fund. For the six months ended February 28, 2015, the Fund paid $238 in commitment fees.
For the six months ended February 28, 2015, there were no borrowings by the Fund under the agreement.
8. INDEMNIFICATION
Under the Trust’s organizational documents, the officers and Trustees are indemnified against certain liabilities that may arise out of performance of their duties to the Trust. Additionally, in the normal course of business, the Trust may enter into contracts with service providers that contain a variety of indemnification clauses. The Trust’s maximum exposure under these arrangements is dependent on future claims that may be made against the Fund and, therefore, cannot be estimated.
| | | | |
| 24 | | Wells Fargo Advantage Government Securities Fund | | Other information (unaudited) |
PROXY VOTING INFORMATION
A description of the policies and procedures that the Fund uses to determine how to vote proxies relating to portfolio securities is available, upon request, by calling 1-800-222-8222, visiting our website at wellsfargoadvantagefunds.com, or visiting the SEC website at sec.gov. Information regarding how the Fund voted proxies relating to portfolio securities during the most recent 12-month period ended June 30 is available on the Fund’s website at wellsfargoadvantagefunds.com or by visiting the SEC website at sec.gov.
PORTFOLIO HOLDINGS INFORMATION
The complete portfolio holdings for the Fund are publicly available monthly on the Fund’s website (wellsfargoadvantagefunds.com), on a one-month delayed basis. In addition, top ten holdings information (excluding derivative positions) for the Fund is publicly available on the Fund’s website on a monthly, seven-day or more delayed basis. The Fund files its complete schedule of portfolio holdings with the SEC for the first and third quarters of each fiscal year on Form N-Q, which is available by visiting the SEC website at sec.gov. In addition, the Fund’s Form N-Q may be reviewed and copied at the SEC’s Public Reference Room in Washington, DC, and at regional offices in New York City, at 233 Broadway, and in Chicago, at 175 West Jackson Boulevard, Suite 900. Information about the Public Reference Room may be obtained by calling 1-800-SEC-0330.
| | | | | | |
| Other information (unaudited) | | Wells Fargo Advantage Government Securities Fund | | | 25 | |
BOARD OF TRUSTEES AND OFFICERS
Each of the Trustees and Officers1 listed in the table below acts in identical capacities for each fund in the Wells Fargo Advantage family of funds, which consists of 134 mutual funds comprising the Wells Fargo Funds Trust, Wells Fargo Variable Trust, Wells Fargo Master Trust and four closed-end funds (collectively the “Fund Complex”). This table should be read in conjunction with the Prospectus and the Statement of Additional Information2. The mailing address of each Trustee and Officer is 525 Market Street, 12th Floor, San Francisco, CA 94105. Each Trustee and Officer serves an indefinite term, however, each Trustee serves such term until reaching the mandatory retirement age established by the Trustees.
Independent Trustees
| | | | | | |
Name and year of birth | | Position held and length of service* | | Principal occupations during past five years or longer | | Other directorships during past five years |
William R. Ebsworth (Born 1957) | | Trustee, since 2015** | | Retired. From 1984 to 2013, equities analyst, portfolio manager, research director at Fidelity Management and Research Company and retired in 2013 as Chief Investment Officer of Fidelity Strategic Advisers, Inc. in Boston, Tokyo, and Hong Kong where he led a team of investment professionals managing client assets. Prior thereto, Board member of Hong Kong Securities Clearing Co., Hong Kong Options Clearing Corp., the Thailand International Fund, Ltd., Fidelity Investments Life Insurance Company, and Empire Fidelity Investments Life Insurance Company. Mr. Ebsworth is an Adjunct Lecturer, Finance, at Babson College and a Chartered Financial Analyst. | | Asset Allocation Trust |
| Jane A. Freeman (Born 1953) | | Trustee, since 2015** | | Retired. From 2012 to 2014 and 1999 to 2008, Chief Financial Officer of Scientific Learning Corporation. From 2008 to 2012, Ms. Freeman provided consulting services related to strategic business projects. Prior thereto, Portfolio Manager at Rockefeller & Co. and Scudder, Stevens & Clark. Board member of the Harding Loevner Funds from 1996 to 2014, serving as both Lead Independent Director and chair of the Audit Committee. Board member of the Russell Exchange Traded Funds Trust from 2011 to 2012 and the chair of the Audit Committee. Ms. Freeman is a Chartered Financial Analyst (inactive), Chair of Taproot Foundation (non-profit organization) and a Board Member of Ruth Bancroft Garden (non-profit organization). | | Asset Allocation Trust |
| Peter G. Gordon (Born 1942) | | Trustee, since 1998; Chairman, since 2005 | | Co-Founder, Retired Chairman, President and CEO of Crystal Geyser Water Company. Trustee Emeritus, Colby College. | | Asset Allocation Trust |
Isaiah Harris, Jr. (Born 1952) | | Trustee, since 2009 | | Retired. Chairman of the Board of CIGNA Corporation since 2009, and Director since 2005. From 2003 to 2011, Director of Delux Corporation. Prior thereto, President and CEO of BellSouth Advertising and Publishing Corp. from 2005 to 2007, President and CEO of BellSouth Enterprises from 2004 to 2005 and President of BellSouth Consumer Services from 2000 to 2003. Emeritus member of the Iowa State University Foundation Board of Governors. Emeritus Member of the Advisory Board of Iowa State University School of Business. Advisory Board Member, Palm Harbor Academy. Mr. Harris is a certified public accountant. | | CIGNA Corporation; Asset Allocation Trust |
| Judith M. Johnson (Born 1949) | | Trustee, since 2008; Audit Committee Chairman, since 2008 | | Retired. Prior thereto, Chief Executive Officer and Chief Investment Officer of Minneapolis Employees Retirement Fund from 1996 to 2008. Ms. Johnson is an attorney, certified public accountant and a certified managerial accountant. | | Asset Allocation Trust |
| David F. Larcker (Born 1950) | | Trustee, since 2009 | | James Irvin Miller Professor of Accounting at the Graduate School of Business, Stanford University, Morgan Stanley Director of the Center for Leadership Development and Research and Senior Faculty of The Rock Center for Corporate Governance since 2006. From 2005 to 2008, Professor of Accounting at the Graduate School of Business, Stanford University. Prior thereto, Ernst & Young Professor of Accounting at The Wharton School, University of Pennsylvania from 1985 to 2005. | | Asset Allocation Trust |
| Olivia S. Mitchell (Born 1953) | | Trustee, since 2006 | | International Foundation of Employee Benefit Plans Professor, Wharton School of the University of Pennsylvania since 1993. Director of Wharton’s Pension Research Council and Boettner Center on Pensions & Retirement Research, and Research Associate at the National Bureau of Economic Research. Previously, Cornell University Professor from 1978 to 1993. | | Asset Allocation Trust |
| | | | |
| 26 | | Wells Fargo Advantage Government Securities Fund | | Other information (unaudited) |
| | | | | | |
Name and year of birth | | Position held and length of service* | | Principal occupations during past five years or longer | | Other directorships during past five years |
| Timothy J. Penny (Born 1951) | | Trustee, since 1996 | | President and Chief Executive Officer of Southern Minnesota Initiative Foundation, a non-profit organization, since 2007 and Senior Fellow at the Humphrey Institute Policy Forum at the University of Minnesota since 1995. Member of the Board of Trustees of NorthStar Education Finance, Inc., a non-profit organization, since 2007. | | Asset Allocation Trust |
| Michael S. Scofield (Born 1943) | | Trustee, since 2010 | | Served on the Investment Company Institute’s Board of Governors and Executive Committee from 2008-2011 as well the Governing Council of the Independent Directors Council from 2006-2011 and the Independent Directors Council Executive Committee from 2008-2011. Chairman of the IDC from 2008-2010. Institutional Investor (Fund Directions) Trustee of Year in 2007. Trustee of the Evergreen Funds complex (and its predecessors) from 1984 to 2010. Chairman of the Evergreen Funds from 2000-2010. Former Trustee of the Mentor Funds. Retired Attorney, Law Offices of Michael S. Scofield. | | Asset Allocation Trust |
| Donald C. Willeke (Born 1940) | | Trustee, since 1996 | | Principal of the law firm of Willeke & Daniels. General Counsel of the Minneapolis Employees Retirement Fund from 1984 until its consolidation into the Minnesota Public Employees Retirement Association on June 30, 2010. Director and Vice Chair of The Tree Trust (non-profit corporation). Director of the American Chestnut Foundation (non-profit corporation). | | Asset Allocation Trust |
| * | Length of service dates reflect the Trustee’s commencement of service with the Trust’s predecessor entities, where applicable. |
| ** | William R. Ebsworth and Jane A. Freeman each became a Trustee effective January 1, 2015. |
Officers
| | | | | | |
Name and year of birth | | Position held and length of service | | Principal occupations during past five years or longer | | |
| Karla M. Rabusch (Born 1959) | | President, since 2003 | | Executive Vice President of Wells Fargo Bank, N.A. and President of Wells Fargo Funds Management, LLC since 2003. | | |
Nancy Wiser1 (Born 1967) | | Treasurer, since 2012 | | Executive Vice President of Wells Fargo Funds Management, LLC since 2011. Chief Operating Officer and Chief Compliance Officer at LightBox Capital Management LLC, from 2008 to 2011. Owned and operated a consulting business providing services to various hedge funds including acting as Chief Operating Officer and Chief Compliance Officer for a hedge fund from 2007 to 2008. Chief Operating Officer and Chief Compliance Officer of GMN Capital LLC from 2006 to 2007. | | |
| C. David Messman (Born 1960) | | Secretary, since 2000; Chief Legal Officer, since 2003 | | Senior Vice President and Secretary of Wells Fargo Funds Management, LLC since 2001. Assistant General Counsel of Wells Fargo Bank, N.A. since 2013 and Vice President and Managing Counsel of Wells Fargo Bank N.A. from 1996 to 2013. | | |
Debra Ann Early (Born 1964) | | Chief Compliance Officer, since 2007 | | Senior Vice President of Wells Fargo Funds Management, LLC since 2007 and Chief Compliance Officer from 2007 to 2014. Chief Compliance Officer of Parnassus Investments from 2005 to 2007. Chief Financial Officer of Parnassus Investments from 2004 to 2007 and Senior Audit Manager of PricewaterhouseCoopers LLP from 1998 to 2004. | | |
David Berardi (Born 1975) | | Assistant Treasurer, since 2009 | | Vice President of Wells Fargo Funds Management, LLC since 2009. Vice President of Evergreen Investment Management Company, LLC from 2008 to 2010. Assistant Vice President of Evergreen Investment Services, Inc. from 2004 to 2008. Manager of Fund Reporting and Control for Evergreen Investment Management Company, LLC from 2004 to 2010. | | |
Jeremy DePalma1 (Born 1974) | | Assistant Treasurer, since 2009 | | Senior Vice President of Wells Fargo Funds Management, LLC since 2009. Senior Vice President of Evergreen Investment Management Company, LLC from 2008 to 2010. Vice President, Evergreen Investment Services, Inc. from 2004 to 2007. Head of the Fund Reporting and Control Team within Fund Administration from 2005 to 2010. | | |
| 1 | Nancy Wiser acts as Treasurer of 73 funds in the Fund Complex. Jeremy DePalma acts as Treasurer of 61 funds and Assistant Treasurer of 73 funds in the Fund Complex. |
| 2 | The Statement of Additional Information includes additional information about the Trustees and is available, without charge, upon request, by calling 1-800-222-8222 or by visiting the website at wellsfargoadvantagefunds.com. |
| | | | | | |
| List of abbreviations | | Wells Fargo Advantage Government Securities Fund | | | 27 | |
The following is a list of common abbreviations for terms and entities that may have appeared in this report.
| ACA | — ACA Financial Guaranty Corporation |
| ADR | — American depositary receipt |
| ADS | — American depositary shares |
| AGC | — Assured Guaranty Corporation |
| AGM | — Assured Guaranty Municipal |
| Ambac | — Ambac Financial Group Incorporated |
| AMT | — Alternative minimum tax |
| BAN | — Bond anticipation notes |
| BHAC | — Berkshire Hathaway Assurance Corporation |
| CAB | — Capital appreciation bond |
| CCAB | — Convertible capital appreciation bond |
| CDA | — Community Development Authority |
| CDO | — Collateralized debt obligation |
| DRIVER | — Derivative inverse tax-exempt receipts |
| DW&P | — Department of Water & Power |
| DWR | — Department of Water Resources |
| ECFA | — Educational & Cultural Facilities Authority |
| EDA | — Economic Development Authority |
| EDFA | — Economic Development Finance Authority |
| ETF | — Exchange-traded fund |
| FDIC | — Federal Deposit Insurance Corporation |
| FFCB | — Federal Farm Credit Banks |
| FGIC | — Financial Guaranty Insurance Corporation |
| FHA | — Federal Housing Administration |
| FHLB | — Federal Home Loan Bank |
| FHLMC | — Federal Home Loan Mortgage Corporation |
| FICO | — The Financing Corporation |
| FNMA | — Federal National Mortgage Association |
| GDR | — Global depositary receipt |
| GNMA | — Government National Mortgage Association |
| HCFR | — Healthcare facilities revenue |
| HEFA | — Health & Educational Facilities Authority |
| HEFAR | — Higher education facilities authority revenue |
| HFA | — Housing Finance Authority |
| HFFA | — Health Facilities Financing Authority |
| HUD | — Department of Housing and Urban Development |
| IDA | — Industrial Development Authority |
| IDAG | — Industrial Development Agency |
| KRW | — Republic of Korea won |
| LIBOR | — London Interbank Offered Rate |
| LIFER | — Long Inverse Floating Exempt Receipts |
| LLC | — Limited liability company |
| LLLP | — Limited liability limited partnership |
| LLP | — Limited liability partnership |
| MBIA | — Municipal Bond Insurance Association |
| MFHR | — Multifamily housing revenue |
| MSTR | — Municipal securities trust receipts |
| MUD | — Municipal Utility District |
| National | — National Public Finance Guarantee Corporation |
| PCFA | — Pollution Control Financing Authority |
| PCL | — Public Company Limited |
| PCR | — Pollution control revenue |
| PFA | — Public Finance Authority |
| PFFA | — Public Facilities Financing Authority |
| PFOTER | — Puttable floating option tax-exempt receipts |
| plc | — Public limited company |
| PUTTER | — Puttable tax-exempt receipts |
| R&D | — Research & development |
| Radian | — Radian Asset Assurance |
| RAN | — Revenue anticipation notes |
| RDA | — Redevelopment Authority |
| RDFA | — Redevelopment Finance Authority |
| REIT | — Real estate investment trust |
| ROC | — Reset option certificates |
| SAVRS | — Select auction variable rate securities |
| SBA | — Small Business Authority |
| SFHR | — Single-family housing revenue |
| SFMR | — Single-family mortgage revenue |
| SPA | — Standby purchase agreement |
| SPDR | — Standard & Poor’s Depositary Receipts |
| SPEAR | — Short Puttable Exempt Adjustable Receipts |
| STRIPS | — Separate trading of registered interest and |
| TAN | — Tax anticipation notes |
| TIPS | — Treasury inflation-protected securities |
| TRAN | — Tax revenue anticipation notes |
| TTFA | — Transportation Trust Fund Authority |
| TVA | — Tennessee Valley Authority |
This page is intentionally left blank.


For more information
More information about Wells Fargo Advantage Funds is available free upon request. To obtain literature, please write, email, visit the Fund’s website, or call:
Wells Fargo Advantage Funds
P.O. Box 8266
Boston, MA 02266-8266
Email: wfaf@wellsfargo.com
Website: wellsfargoadvantagefunds.com
Individual investors: 1-800-222-8222
Retail investment professionals: 1-888-877-9275
Institutional investment professionals: 1-866-765-0778
This report and the financial statements contained herein are submitted for the general information of the shareholders of Wells Fargo Advantage Funds. If this report is used for promotional purposes, distribution of the report must be accompanied or preceded by a current prospectus. Before investing, please consider the investment objectives, risks, charges, and expenses of the investment. For a current prospectus and, if available, a summary prospectus, containing this information, call 1-800-222-8222 or visit the Fund’s website at wellsfargoadvantagefunds.com. Read the prospectus carefully before you invest or send money.
Wells Fargo Funds Management, LLC, a wholly owned subsidiary of Wells Fargo & Company, provides investment advisory and administrative services for Wells Fargo Advantage Funds. Other affiliates of Wells Fargo & Company provide subadvisory and other services for the Funds. The Funds are distributed by Wells Fargo Funds Distributor, LLC, Member FINRA/SIPC, an affiliate of Wells Fargo & Company.
NOT FDIC INSURED ¡ NO BANK GUARANTEE ¡ MAY LOSE VALUE
© 2015 Wells Fargo Funds Management, LLC. All rights reserved.
| | |
 | | 232053 04-15 SA216/SAR216 02-15 |

Wells Fargo Advantage High Income Fund

Semi-Annual Report
February 28, 2015

Reduce clutter. Save trees.
Sign up for electronic delivery of prospectuses and shareholder reports at wellsfargo.com/advantagedelivery
Contents
The views expressed and any forward-looking statements are as of February 28, 2015, unless otherwise noted, and are those of the Fund managers and/or Wells Fargo Funds Management, LLC. Discussions of individual securities, or the markets generally, or any Wells Fargo Advantage Fund are not intended as individual recommendations. Future events or results may vary significantly from those expressed in any forward-looking statements; the views expressed are subject to change at any time in response to changing circumstances in the market. Wells Fargo Funds Management, LLC and the Fund disclaim any obligation to publicly update or revise any views expressed or forward-looking statements.
NOT FDIC INSURED ¡ NO BANK GUARANTEE ¡ MAY LOSE VALUE
| | | | |
| 2 | | Wells Fargo Advantage High Income Fund | | Letter to shareholders (unaudited) |
Karla M. Rabusch
President
Wells Fargo Advantage Funds
Major central banks continued to inject liquidity into global banks and markets through various accommodative monetary policies, including quantitative easing.
Dear Valued Shareholder:
We are pleased to offer you this semi-annual report for the Wells Fargo Advantage High Income Fund for the six-month period that ended February 28, 2015. The period was marked by low interest rates, a large decline in oil prices, and moderate U.S. economic growth. Investment-grade bonds, as measured by the Barclays U.S. Aggregate Bond Index1, returned 2.25% during the period.
Major central banks continued to provide stimulus.
Major central banks continued to inject liquidity into global banks and markets through various accommodative monetary policies, including quantitative easing. In the U.S., the Federal Reserve (Fed) kept its key interest rate near zero in order to support the economy and the financial system. It ended its quantitative easing program in October 2014 and also set expectations for it to begin normalizing monetary policy with higher target ranges for the federal funds rate in 2015.
Meanwhile, European markets continued to benefit from the European Central Bank’s (ECB’s) willingness to maintain low interest rates. In September 2014, the ECB cut its key rate to a historic low of 0.05%. In addition to its targeted longer-term refinancing operations that are designed to increase bank lending, the ECB said it intends to increase the size of its balance sheet, a result of quantitative easing, by buying eurozone government bonds. In Japan, the Bank of Japan maintained an aggressive monetary program aimed at combating deflation.
U.S. economic growth was moderate, and oil prices plummeted.
Economic growth advanced during the reporting period, the unemployment rate ticked lower to 5.5% as of February 2015, and inflation remained below the Fed’s longer-run objective of a 2% pace. The period was also marked by dramatically lower oil prices, which fell from more than $90 per barrel at the end of August 2014 to below $50 per barrel at the end of February 2015. While lower oil prices benefited consumers of oil products, the lower prices pressured companies within the energy sector.
Longer-dated securities and higher-rated credits were top performers.
Ten-year U.S. Treasury rates declined during the period, from 2.35% at end of August 2014 to 2.03% by the end of February 2015, benefiting both from safe-haven status as well as relative attractiveness to global investors. With the U.S. economy the furthest along its business cycle, the level of interest rates in the U.S. and Europe diverged. The 10-year U.S. Treasury yield was 2.03% at the end of February 2015 compared with 0.30% for 10-year German government yields, 173 basis points (bps; 100 bps equals 1.00%) higher. This was largely attributed to the Fed being closer to eventually increasing interest rates while the ECB potentially needs to further increase, rather than scale back, its amount of accommodation. Further, U.S. economic activity was healthier than Europe’s.
Treasury bonds with maturities greater than 20 years returned more than 10% during the six-month period that ended February 28, 2015, according to the Barclays U.S. Aggregate Bond Index. This was due, in part, to strong demand from overseas investors because yields in Europe and Japan were substantially lower than U.S. yields. In addition, because the dollar strengthened, the returns from
| 1 | The Barclays U.S. Aggregate Bond Index is a broad-based benchmark that measures the investment-grade, U.S. dollar-denominated, fixed-rate taxable bond market, including Treasuries, government-related and corporate securities, MBS (agency fixed-rate and hybrid ARM passthroughs), ABS, and CMBS. You cannot invest directly in an index. |
| | | | | | |
| Letter to shareholders (unaudited) | | Wells Fargo Advantage High Income Fund | | | 3 | |
Treasuries were even higher for foreign-domiciled investors. Longer-maturity debt across all sectors outperformed shorter-dated securities.
Investment-grade corporate bonds returned 2.29% during the six-month reporting period, according to the Barclays U.S. Aggregate Bond Index, and AAA-rated2 bonds had higher returns than BBB-rated bonds. Lower-rated credits, including high yield, underperformed as oil prices fell dramatically. Not only were many energy and mining companies negatively affected, but investor trepidation about weak global growth caused investment-grade spreads to modestly widen while high-yield spreads widened substantially.
Don’t let short-term uncertainty derail long-term investment goals.
Periods of uncertainty can present challenges, but experience has taught us that maintaining long-term investment goals can be an effective way to plan for the future. To help you create a sound strategy based on your personal goals and risk tolerance, Wells Fargo Advantage Funds offers more than 100 mutual funds and other investments spanning a wide range of asset classes and investment styles. Although diversification cannot guarantee an investment profit or prevent losses, we believe it can be an effective way to manage investment risk and potentially smooth out overall portfolio performance. We encourage investors to know their investments and to understand that appropriate levels of risk-taking may unlock opportunities.
Thank you for choosing to invest with Wells Fargo Advantage Funds. We appreciate your confidence in us and remain committed to helping you meet your financial needs. For current information about your fund investments, contact your investment professional, visit our website at wellsfargoadvantagefunds.com, or call us directly at 1-800-222-8222. We are available 24 hours a day, 7 days a week.
Sincerely,
Karla M. Rabusch
President
Wells Fargo Advantage Funds
Periods of uncertainty can present challenges, but experience has taught us that maintaining long-term investment goals can be an effective way to plan for the future.
| 2 | The ratings indicated are from Standard & Poor’s, Moody’s Investors Service, and/or Fitch Ratings Ltd. Standard & Poor’s rates the creditworthiness of bonds from AAA (highest) to D (lowest). Ratings from A to CCC may be modified by the addition of a plus (+) or minus (-) sign to show relative standing within the rating categories. Moody’s rates the creditworthiness of bonds from Aaa (highest) to C (lowest). Ratings Aa to B may be modified by the addition of a number 1 (highest) to 3 (lowest) to show relative standing within the ratings categories. Fitch rates the creditworthiness of bonds from AAA (highest) to D (lowest). |
| | | | |
| 4 | | Wells Fargo Advantage High Income Fund | | Performance highlights (unaudited) |
Investment objective
The Fund seeks total return, consisting of a high level of current income and capital appreciation.
Adviser
Wells Fargo Funds Management, LLC
Subadviser
Wells Capital Management Incorporated
Portfolio managers
Kevin J. Maas, CFA
Thomas M. Price, CFA
Michael J. Schueller, CFA
Average annual total returns1 (%) as of February 28, 2015
| | | | | | | | | | | | | | | | | | | | | | | | | | | | | | | | | | |
| | | | | Including sales charge | | | Excluding sales charge | | | Expense ratios2 (%) | |
| | | Inception date | | 1 year | | | 5 year | | | 10 year | | | 1 year | | | 5 year | | | 10 year | | | Gross | | | Net3 | |
| Class A (SHBAX) | | 2-29-2000 | | | (4.82 | ) | | | 6.61 | | | | 5.69 | | | | (0.33 | ) | | | 7.60 | | | | 6.18 | | | | 1.01 | | | | 0.91 | |
| Class B (WFNBX)* | | 7-18-2008 | | | (6.07 | ) | | | 6.49 | | | | 5.62 | | | | (1.07 | ) | | | 6.80 | | | | 5.62 | | | | 1.76 | | | | 1.66 | |
| Class C (WFNCX) | | 7-18-2008 | | | (2.07 | ) | | | 6.80 | | | | 5.38 | | | | (1.07 | ) | | | 6.80 | | | | 5.38 | | | | 1.76 | | | | 1.66 | |
| Administrator Class (WFNDX) | | 7-30-2010 | | | – | | | | – | | | | – | | | | (0.31 | ) | | | 7.72 | | | | 6.31 | | | | 0.95 | | | | 0.81 | |
| Institutional Class (SHYYX) | | 7-31-2001 | | | – | | | | – | | | | – | | | | 0.12 | | | | 8.05 | | | | 6.63 | | | | 0.68 | | | | 0.51 | |
| Investor Class (STHYX) | | 12-28-1995 | | | – | | | | – | �� | | | – | | | | (0.34 | ) | | | 7.56 | | | | 6.16 | | | | 1.04 | | | | 0.94 | |
| Barclays U.S. Corporate High Yield Bond Index4 | | – | | | – | | | | – | | | | – | | | | 2.80 | | | | 9.38 | | | | 7.92 | | | | – | | | | – | |
| * | | Class B shares are closed to investment, except in connection with the reinvestment of any distributions and permitted exchanges. |
Figures quoted represent past performance, which is no guarantee of future results, and do not reflect taxes that a shareholder may pay on fund distributions or the redemption of fund shares. Investment return and principal value of an investment will fluctuate so that an investor’s shares, when redeemed, may be worth more or less than their original cost. Performance shown without sales charges would be lower if sales charges were reflected. Current performance may be lower or higher than the performance data quoted, which assumes the reinvestment of dividends and capital gains. Current month-end performance is available on the Fund’s website, wellsfargoadvantagefunds.com.
Index returns do not include transaction costs associated with buying and selling securities, any mutual fund fees or expenses, or any taxes. It is not possible to invest directly in an index.
For Class A shares, the maximum front-end sales charge is 4.50%. For Class B shares, the maximum contingent deferred sales charge is 5.00%. For Class C shares, the maximum contingent deferred sales charge is 1.00%. Performance including a contingent deferred sales charge assumes the sales charge for the corresponding time period. Administrator Class, Institutional Class, and Investor Class shares are sold without a front-end sales charge or contingent deferred sales charge.
Bond values fluctuate in response to the financial condition of individual issuers, general market and economic conditions, and changes in interest rates. Changes in market conditions and government policies may lead to periods of heightened volatility in the bond market and reduced liquidity for certain bonds held by the fund. In general, when interest rates rise, bond values fall and investors may lose principal value. Interest-rate changes and their impact on the Fund and its share price can be sudden and unpredictable. High-yield securities have a greater risk of default and tend to be more volatile than higher-rated debt securities. Loans are subject to risks similar to those associated with other below-investment-grade bond investments, such as credit risk (for example, risk of issuer default), below-investment-grade bond risk (for example, risk of greater volatility in value), and risk that the loan may become illiquid or difficult to price. The use of derivatives may reduce returns and/or increase volatility. Certain investment strategies tend to increase the total risk of an investment (relative to the broader market). The Fund is exposed to foreign investment risk. Consult the Fund’s prospectus for additional information on these and other risks.
Please see footnotes on page 5.
| | | | | | |
| Performance highlights (unaudited) | | Wells Fargo Advantage High Income Fund | | | 5 | |
| | | | |
| Ten largest long-term holdings5 (%) as of February 28, 2015 | |
Sprint Corporation, 7.88%, 9-15-2023 | | | 1.84 | |
Tenet Healthcare Corporation, 8.13%, 4-1-2022 | | | 1.24 | |
American Axle Manufacturing Incorporated, 6.63%, 10-15-2022 | | | 1.19 | |
Delos Finance SARL , 3.50%, 3-6-2021 | | | 1.19 | |
HCA Incorporated, 4.75%, 5-1-2023 | | | 1.16 | |
FTI Consulting Incorporated, 6.75%, 10-1-2020 | | | 1.14 | |
Neiman Marcus Group Limited, 8.00%, 10-15-2021 | | | 1.06 | |
ArcelorMittal, 7.00%, 2-25-2022 | | | 1.03 | |
Chrysler Group LLC, 8.25%, 6-15-2021 | | | 1.02 | |
Valeant Pharmaceuticals International Incorporated, 7.50%, 7-15-2021 | | | 0.99 | |
|
| Credit quality6 as of February 28, 2015 |
|
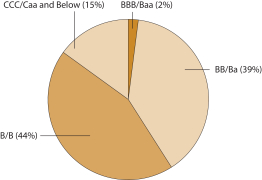 |
| 1 | Historical performance shown for Class A shares through June 19, 2008, includes Advisor Class expenses. Historical performance shown for Class B and Class C shares prior to their inception reflects the performance of Investor Class shares, adjusted to reflect the higher expenses applicable to Class B and Class C shares. Historical performance shown for Administrator Class shares prior to their inception reflects the performance of Institutional Class shares, adjusted to reflect the higher expenses applicable to Administrator Class shares. Effective June 20, 2008, Advisor Class was renamed Class A and modified to assume the features and attributes of Class A. |
| 2 | Reflects the expense ratios as stated in the most recent prospectuses, which include the impact of 0.01% in acquired fund fees and expenses. The expense ratios shown are subject to change and may differ from the annualized expense ratios shown in the financial highlights of this report, which do not include acquired fund fees and expenses. |
| 3 | The Adviser has committed through December 31, 2015, to waive fees and/or reimburse expenses to the extent necessary to cap the Fund’s Total Annual Fund Operating Expenses After Fee Waiver, excluding certain expenses, at 0.90% for Class A, 1.65% for Class B, 1.65% for Class C, 0.80% for Administrator Class, 0.50% for Institutional Class, and 0.93% for Investor Class. After this time, the cap may be increased or the commitment to maintain the cap may be terminated only with the approval of the Board of Trustees. Brokerage commissions, stamp duty fees, interest, taxes, acquired fund fees and expenses, and extraordinary expenses are excluded from the cap. Without this cap, the Fund’s returns would have been lower. |
| 4 | The Barclays U.S. Corporate High Yield Bond Index is an unmanaged, U.S. dollar-denominated, nonconvertible, non-investment-grade debt index. The index consists of domestic and corporate bonds rated Ba and below with a minimum outstanding amount of $150 million. You cannot invest directly in an index. |
| 5 | The ten largest long-term holdings are calculated based on the value of the securities divided by total net assets of the Fund. Holdings are subject to change and may have changed since the date specified. |
| 6 | The credit quality distribution of portfolio holdings reflected in the chart is based on ratings from Standard & Poor’s, Moody’s Investors Service, and/or Fitch Ratings Ltd. Credit quality ratings apply to the underlying holdings of the Fund and not to the Fund itself. The percentages of the Fund’s portfolio with the ratings depicted in the chart are calculated based on the total market value of fixed income securities held by the Fund. If a security was rated by all three rating agencies, the middle rating was utilized. If rated by two of three rating agencies, the lower rating was utilized, and if rated by one of the rating agencies, that rating was utilized. Standard & Poor’s rates the creditworthiness of bonds, ranging from AAA (highest) to D (lowest). Ratings from A to CCC may be modified by the addition of a plus (+) or minus (-) sign to show relative standing within the rating categories. Standard & Poor’s rates the creditworthiness of short-term notes from SP-1 (highest) to SP-3 (lowest). Moody’s rates the creditworthiness of bonds, ranging from Aaa (highest) to C (lowest). Ratings Aa to B may be modified by the addition of a number 1 (highest) to 3 (lowest) to show relative standing within the ratings categories. Moody’s rates the creditworthiness of short-term U.S. tax-exempt municipal securities from MIG 1/VMIG 1 (highest) to SG (lowest). Fitch rates the creditworthiness of bonds, ranging from AAA (highest) to D (lowest). Credit quality and credit quality ratings are subject to change and may have changed since the date specified. |
| | | | |
| 6 | | Wells Fargo Advantage High Income Fund | | Fund expenses (unaudited) |
As a shareholder of the Fund, you incur two types of costs: (1) transaction costs, including sales charges (loads) on purchase payments and contingent deferred sales charges (if any) on redemptions and (2) ongoing costs, including management fees, distribution (12b-1) and/or shareholder service fees, and other Fund expenses. This example is intended to help you understand your ongoing costs (in dollars) of investing in the Fund and to compare these costs with the ongoing costs of investing in other mutual funds.
The example is based on an investment of $1,000 invested at the beginning of the six-month period and held for the entire period from September 1, 2014 to February 28, 2015.
Actual expenses
The “Actual” line of the table below provides information about actual account values and actual expenses. You may use the information in this line, together with the amount you invested, to estimate the expenses that you paid over the period. Simply divide your account value by $1,000 (for example, an $8,600 account value divided by $1,000 = 8.6), then multiply the result by the number in the “Actual” line under the heading entitled “Expenses paid during period” for your applicable class of shares to estimate the expenses you paid on your account during this period.
Hypothetical example for comparison purposes
The “Hypothetical” line of the table below provides information about hypothetical account values and hypothetical expenses based on the Fund’s actual expense ratio and an assumed rate of return of 5% per year before expenses, which is not the Fund’s actual return. The hypothetical account values and expenses may not be used to estimate the actual ending account balance or expenses you paid for the period. You may use this information to compare the ongoing costs of investing in the Fund and other funds. To do so, compare this 5% hypothetical example with the 5% hypothetical examples that appear in the shareholder reports of the other funds.
Please note that the expenses shown in the table are meant to highlight your ongoing costs only and do not reflect any transactional costs, such as sales charges (loads) and contingent deferred sales charges. Therefore, the “Hypothetical” line of the table is useful in comparing ongoing costs only and will not help you determine the relative total costs of owning different funds. In addition, if these transactional costs were included, your costs would have been higher.
| | | | | | | | | | | | | | | | |
| | | Beginning
account value
9-1-2014 | | | Ending
account value
2-28-2015 | | | Expenses
paid during
the period1 | | | Net annualized
expense ratio | |
Class A | | | | | | | | | | | | | | | | |
Actual | | $ | 1,000.00 | | | $ | 979.79 | | | $ | 4.42 | | | | 0.90 | % |
Hypothetical (5% return before expenses) | | $ | 1,000.00 | | | $ | 1,020.33 | | | $ | 4.51 | | | | 0.90 | % |
Class B | | | | | | | | | | | | | | | | |
Actual | | $ | 1,000.00 | | | $ | 976.16 | | | $ | 8.08 | | | | 1.65 | % |
Hypothetical (5% return before expenses) | | $ | 1,000.00 | | | $ | 1,016.61 | | | $ | 8.25 | | | | 1.65 | % |
Class C | | | | | | | | | | | | | | | | |
Actual | | $ | 1,000.00 | | | $ | 976.17 | | | $ | 8.08 | | | | 1.65 | % |
Hypothetical (5% return before expenses) | | $ | 1,000.00 | | | $ | 1,016.61 | | | $ | 8.25 | | | | 1.65 | % |
Administrator Class | | | | | | | | | | | | | | | | |
Actual | | $ | 1,000.00 | | | $ | 980.70 | | | $ | 3.93 | | | | 0.80 | % |
Hypothetical (5% return before expenses) | | $ | 1,000.00 | | | $ | 1,020.83 | | | $ | 4.01 | | | | 0.80 | % |
Institutional Class | | | | | | | | | | | | | | | | |
Actual | | $ | 1,000.00 | | | $ | 982.16 | | | $ | 2.46 | | | | 0.50 | % |
Hypothetical (5% return before expenses) | | $ | 1,000.00 | | | $ | 1,022.32 | | | $ | 2.51 | | | | 0.50 | % |
Investor Class | | | | | | | | | | | | | | | | |
Actual | | $ | 1,000.00 | | | $ | 979.83 | | | $ | 4.57 | | | | 0.93 | % |
Hypothetical (5% return before expenses) | | $ | 1,000.00 | | | $ | 1,020.18 | | | $ | 4.66 | | | | 0.93 | % |
| 1 | Expenses paid is equal to the annualized expense ratio of each class multiplied by the average account value over the period, multiplied by the number of days in the most recent fiscal half-year divided by the number of days in the fiscal year (to reflect the one-half-year period). |
| | | | | | |
| Portfolio of investments—February 28, 2015 (unaudited) | | Wells Fargo Advantage High Income Fund | | | 7 | |
| | | | | | | | | | | | | | | | |
| Security name | | Interest rate | | | Maturity date | | | Principal | | | Value | |
| | | | |
Corporate Bonds and Notes: 73.40% | | | | | | | | | | | | | | | | |
| | | | |
Consumer Discretionary: 18.31% | | | | | | | | | | | | | | | | |
| | | | |
| Auto Components: 3.66% | | | | | | | | | | | | | | | | |
American Axle Manufacturing Incorporated | | | 6.63 | % | | | 10-15-2022 | | | $ | 6,000,000 | | | $ | 6,525,000 | |
Chrysler Group LLC | | | 8.25 | | | | 6-15-2021 | | | | 5,000,000 | | | | 5,581,250 | |
Goodyear Tire & Rubber Company | | | 6.50 | | | | 3-1-2021 | | | | 5,000,000 | | | | 5,375,000 | |
Lear Corporation | | | 5.25 | | | | 1-15-2025 | | | | 2,500,000 | | | | 2,543,750 | |
| | | | |
| | | | | | | | | | | | | | | 20,025,000 | |
| | | | | | | | | | | | | | | | |
| | | | |
| Automobiles: 1.57% | | | | | | | | | | | | | | | | |
General Motors Financial Company | | | 4.00 | | | | 1-15-2025 | | | | 3,000,000 | | | | 3,077,343 | |
General Motors Financial Company | | | 4.25 | | | | 5-15-2023 | | | | 3,215,000 | | | | 3,367,712 | |
General Motors Financial Company | | | 4.38 | | | | 9-25-2021 | | | | 2,000,000 | | | | 2,125,000 | |
| | | | |
| | | | | | | | | | | | | | | 8,570,055 | |
| | | | | | | | | | | | | | | | |
| | | | |
| Diversified Consumer Services: 0.22% | | | | | | | | | | | | | | | | |
Ashtead Capital Incorporated 144A | | | 5.63 | | | | 10-1-2024 | | | | 1,135,000 | | | | 1,191,750 | |
| | | | | | | | | | | | | | | | |
| | | | |
| Hotels, Restaurants & Leisure: 1.69% | | | | | | | | | | | | | | | | |
MGM Resorts International Company | | | 6.63 | | | | 12-15-2021 | | | | 4,000,000 | | | | 4,340,000 | |
MGM Resorts International Company | | | 8.63 | | | | 2-1-2019 | | | | 1,000,000 | | | | 1,150,000 | |
Tunica-Biloxi Gaming Authority 144A(i) | | | 9.00 | | | | 11-15-2015 | | | | 6,260,000 | | | | 3,756,000 | |
| | | | |
| | | | | | | | | | | | | | | 9,246,000 | |
| | | | | | | | | | | | | | | | |
| | | | |
| Household Durables: 1.95% | | | | | | | | | | | | | | | | |
Beazer Homes USA Company | | | 6.63 | | | | 4-15-2018 | | | | 1,000,000 | | | | 1,040,000 | |
Beazer Homes USA Company | | | 7.25 | | | | 2-1-2023 | | | | 4,000,000 | | | | 3,815,000 | |
Lennar Corporation | | | 4.13 | | | | 12-1-2018 | | | | 3,000,000 | | | | 3,037,500 | |
Standard Pacific Corporation | | | 8.38 | | | | 1-15-2021 | | | | 2,400,000 | | | | 2,772,000 | |
| | | | |
| | | | | | | | | | | | | | | 10,664,500 | |
| | | | | | | | | | | | | | | | |
| | | | |
| Media: 7.07% | | | | | | | | | | | | | | | | |
CCO Holdings LLC | | | 6.50 | | | | 4-30-2021 | | | | 4,000,000 | | | | 4,210,000 | |
CCO Holdings LLC | | | 6.63 | | | | 1-31-2022 | | | | 2,000,000 | | | | 2,145,000 | |
CCOH Safari LLC | | | 5.75 | | | | 12-1-2024 | | | | 1,000,000 | | | | 1,035,000 | |
Cequel Communications Holdings 144A | | | 6.38 | | | | 9-15-2020 | | | | 4,000,000 | | | | 4,240,000 | |
Clear Channel Communications Incorporated | | | 9.00 | | | | 3-1-2021 | | | | 2,000,000 | | | | 1,930,000 | |
Clear Channel Communications Incorporated « | | | 10.00 | | | | 1-15-2018 | | | | 3,000,000 | | | | 2,666,250 | |
Clear Channel Communications Incorporated (PIK at 14.00%) ¥ | | | 14.00 | | | | 2-1-2021 | | | | 2,060,602 | | | | 1,705,148 | |
Clear Channel Worldwide Holdings Incorporated | | | 6.50 | | | | 11-15-2022 | | | | 5,000,000 | | | | 5,237,500 | |
Cumulus Media Holdings Incorporated « | | | 7.75 | | | | 5-1-2019 | | | | 2,400,000 | | | | 2,496,000 | |
DISH DBS Corporation | | | 5.88 | | | | 7-15-2022 | | | | 4,250,000 | | | | 4,292,500 | |
Gannett Company Incorporated 144A | | | 5.50 | | | | 9-15-2024 | | | | 885,000 | | | | 920,400 | |
Nielsen Finance LLC 144A | | | 5.00 | | | | 4-15-2022 | | | | 500,000 | | | | 511,250 | |
Sinclair Television Group Incorporated 144A | | | 5.63 | | | | 8-1-2024 | | | | 3,000,000 | | | | 3,037,500 | |
Sirius XM Radio Incorporated 144A | | | 5.75 | | | | 8-1-2021 | | | | 2,000,000 | | | | 2,100,000 | |
Sirius XM Radio Incorporated 144A | | | 6.00 | | | | 7-15-2024 | | | | 2,000,000 | | | | 2,125,000 | |
| | | | |
| | | | | | | | | | | | | | | 38,651,548 | |
| | | | | | | | | | | | | | | | |
The accompanying notes are an integral part of these financial statements.
| | | | |
| 8 | | Wells Fargo Advantage High Income Fund | | Portfolio of investments—February 28, 2015 (unaudited) |
| | | | | | | | | | | | | | | | |
| Security name | | Interest rate | | | Maturity date | | | Principal | | | Value | |
| | | | |
| Specialty Retail: 2.15% | | | | | | | | | | | | | | | | |
L Brands Incorporated | | | 6.63 | % | | | 4-1-2021 | | | $ | 3,000,000 | | | $ | 3,442,500 | |
Neiman Marcus Group Limited 144A | | | 8.00 | | | | 10-15-2021 | | | | 5,500,000 | | | | 5,781,875 | |
Sally Beauty Holdings Incorporated | | | 5.75 | | | | 6-1-2022 | | | | 2,400,000 | | | | 2,544,000 | |
| | | | |
| | | | | | | | | | | | | | | 11,768,375 | |
| | | | | | | | | | | | | | | | |
| | | | |
Consumer Staples: 1.90% | | | | | | | | | | | | | | | | |
| | | | |
| Food Products: 1.90% | | | | | | | | | | | | | | | | |
Dean Foods Company 144A | | | 6.50 | | | | 3-15-2023 | | | | 1,000,000 | | | | 1,006,250 | |
JBS USA LLC/JBS USA Finance Incorporated 144A | | | 5.88 | | | | 7-15-2024 | | | | 3,500,000 | | | | 3,500,000 | |
Post Holdings Incorporated 144A | | | 6.75 | | | | 12-1-2021 | | | | 3,000,000 | | | | 3,067,500 | |
TreeHouse Foods Incorporated | | | 4.88 | | | | 3-15-2022 | | | | 2,730,000 | | | | 2,811,900 | |
| | | | |
| | | | | | | | | | | | | | | 10,385,650 | |
| | | | | | | | | | | | | | | | |
| | | | |
Energy: 10.26% | | | | | | | | | | | | | | | | |
| | | | |
| Energy Equipment & Services: 1.91% | | | | | | | | | | | | | | | | |
EP Energy LLC and Everest Acquisition Finance Incorporated | | | 9.38 | | | | 5-1-2020 | | | | 2,000,000 | | | | 2,135,000 | |
Gulfmark Offshore Incorporated | | | 6.38 | | | | 3-15-2022 | | | | 2,000,000 | | | | 1,645,000 | |
Key Energy Services Incorporated | | | 6.75 | | | | 3-1-2021 | | | | 4,000,000 | | | | 2,672,500 | |
SESI LLC | | | 7.13 | | | | 12-15-2021 | | | | 4,000,000 | | | | 4,010,000 | |
| | | | |
| | | | | | | | | | | | | | | 10,462,500 | |
| | | | | | | | | | | | | | | | |
| | | | |
| Oil, Gas & Consumable Fuels: 8.35% | | | | | | | | | | | | | | | | |
BreitBurn Energy Partners LP | | | 8.63 | | | | 10-15-2020 | | | | 4,000,000 | | | | 3,280,000 | |
Chesapeake Energy Corporation | | | 4.88 | | | | 4-15-2022 | | | | 4,000,000 | | | | 3,950,000 | |
Chesapeake Energy Corporation | | | 6.63 | | | | 11-15-2019 | | | | 3,100,000 | | | | 2,472,250 | |
Consol Energy Incorporated | | | 5.88 | | | | 4-15-2022 | | | | 3,000,000 | | | | 2,887,500 | |
Energy XXI Gulf Coast Incorporated | | | 7.50 | | | | 12-15-2021 | | | | 2,000,000 | | | | 1,070,000 | |
Halcon Resources Corporation « | | | 8.88 | | | | 5-15-2021 | | | | 2,000,000 | | | | 1,520,000 | |
Midstates Petroleum Incorporated LLC | | | 10.75 | | | | 10-1-2020 | | | | 1,000,000 | | | | 635,000 | |
Newfield Exploration Company | | | 6.88 | | | | 2-1-2020 | | | | 4,950,000 | | | | 5,086,125 | |
Oasis Petroleum Incorporated | | | 6.88 | | | | 1-15-2023 | | | | 4,000,000 | | | | 3,870,000 | |
Peabody Energy Corporation « | | | 6.25 | | | | 11-15-2021 | | | | 3,000,000 | | | | 2,475,000 | |
Penn Virginia Corporation | | | 8.50 | | | | 5-1-2020 | | | | 3,000,000 | | | | 2,940,000 | |
Sabine Pass Liquefaction LLC | | | 5.63 | | | | 2-1-2021 | | | | 4,500,000 | | | | 4,606,875 | |
Targa Resources Partners Incorporated | | | 6.88 | | | | 2-1-2021 | | | | 4,000,000 | | | | 4,240,000 | |
Tesoro Logistics LP Corporation | | | 6.13 | | | | 10-15-2021 | | | | 3,500,000 | | | | 3,710,000 | |
Ultra Petroleum Corporation 144A | | | 5.75 | | | | 12-15-2018 | | | | 3,000,000 | | | | 2,910,000 | |
| | | | |
| | | | | | | | | | | | | | | 45,652,750 | |
| | | | | | | | | | | | | | | | |
| | | | |
Financials: 5.59% | | | | | | | | | | | | | | | | |
| | | | |
| Banks: 0.96% | | | | | | | | | | | | | | | | |
CIT Group Incorporated | | | 5.25 | | | | 3-15-2018 | | | | 5,000,000 | | | | 5,280,000 | |
| | | | | | | | | | | | | | | | |
| | | | |
| Consumer Finance: 2.56% | | | | | | | | | | | | | | | | |
Ally Financial Incorporated | | | 4.13 | | | | 2-13-2022 | | | | 2,000,000 | | | | 1,990,000 | |
Ally Financial Incorporated | | | 5.50 | | | | 2-15-2017 | | | | 1,500,000 | | | | 1,572,315 | |
Ally Financial Incorporated | | | 6.25 | | | | 12-1-2017 | | | | 2,000,000 | | | | 2,160,000 | |
Ally Financial Incorporated | | | 8.00 | | | | 3-15-2020 | | | | 1,580,000 | | | | 1,892,050 | |
The accompanying notes are an integral part of these financial statements.
| | | | | | |
| Portfolio of investments—February 28, 2015 (unaudited) | | Wells Fargo Advantage High Income Fund | | | 9 | |
| | | | | | | | | | | | | | | | |
| Security name | | Interest rate | | | Maturity date | | | Principal | | | Value | |
| | | | |
| Consumer Finance (continued) | | | | | | | | | | | | | | | | |
Navient Corporation | | | 5.00 | % | | | 10-26-2020 | | | $ | 1,000,000 | | | $ | 1,015,000 | |
Navient Corporation | | | 5.88 | | | | 10-25-2024 | | | | 3,000,000 | | | | 2,913,750 | |
SLM Corporation | | | 5.50 | | | | 1-25-2023 | | | | 2,500,000 | | | | 2,456,250 | |
| | | | |
| | | | | | | | | | | | | | | 13,999,365 | |
| | | | | | | | | | | | | | | | |
| | | | |
| Diversified Financial Services: 1.01% | | | | | | | | | | | | | | | | |
Alphabet Holdings Company Incorporated | | | 7.75 | | | | 11-1-2017 | | | | 3,500,000 | | | | 3,438,750 | |
Argos Merger Incorporated 144A%% | | | 7.13 | | | | 3-15-2023 | | | | 2,000,000 | | | | 2,070,000 | |
| | | | |
| | | | | | | | | | | | | | | 5,508,750 | |
| | | | | | | | | | | | | | | | |
| | | | |
| Insurance: 0.48% | | | | | | | | | | | | | | | | |
Genworth Holdings Incorporated | | | 4.80 | | | | 2-15-2024 | | | | 3,000,000 | | | | 2,635,821 | |
| | | | | | | | | | | | | | | | |
| | | | |
| Real Estate Management & Development: 0.58% | | | | | | | | | | | | | | | | |
CBRE Services Incorporated | | | 5.00 | | | | 3-15-2023 | | | | 3,000,000 | | | | 3,150,000 | |
| | | | | | | | | | | | | | | | |
| | | | |
Health Care: 7.65% | | | | | | | | | | | | | | | | |
| | | | |
| Health Care Equipment & Supplies: 1.78% | | | | | | | | | | | | | | | | |
Biomet Incorporated | | | 6.50 | | | | 8-1-2020 | | | | 5,000,000 | | | | 5,331,250 | |
Kinetics Concepts Incorporated | | | 10.50 | | | | 11-1-2018 | | | | 4,000,000 | | | | 4,375,000 | |
| | | | |
| | | | | | | | | | | | | | | 9,706,250 | |
| | | | | | | | | | | | | | | | |
| | | | |
| Health Care Providers & Services: 5.87% | | | | | | | | | | | | | | | | |
Community Health Systems Incorporated | | | 6.88 | | | | 2-1-2022 | | | | 1,000,000 | | | | 1,065,000 | |
Community Health Systems Incorporated | | | 8.00 | | | | 11-15-2019 | | | | 4,000,000 | | | | 4,285,000 | |
Hanger Orthopedic Group | | | 7.13 | | | | 11-15-2018 | | | | 4,000,000 | | | | 4,080,000 | |
HCA Incorporated | | | 4.75 | | | | 5-1-2023 | | | | 6,000,000 | | | | 6,329,400 | |
Iasis Healthcare Corporation | | | 8.38 | | | | 5-15-2019 | | | | 5,000,000 | | | | 5,206,250 | |
Kindred Healthcare Incorporated 144A | | | 8.75 | | | | 1-15-2023 | | | | 4,000,000 | | | | 4,360,000 | |
Tenet Healthcare Corporation | | | 8.13 | | | | 4-1-2022 | | | | 6,000,000 | | | | 6,795,000 | |
| | | | |
| | | | | | | | | | | | | | | 32,120,650 | |
| | | | | | | | | | | | | | | | |
| | | | |
Industrials: 12.76% | | | | | | | | | | | | | | | | |
| | | | |
| Aerospace & Defense: 3.01% | | | | | | | | | | | | | | | | |
DigitalGlobe Incorporated 144A | | | 5.25 | | | | 2-1-2021 | | | | 5,000,000 | | | | 4,850,000 | |
Esterline Technologies Corporation | | | 7.00 | | | | 8-1-2020 | | | | 3,750,000 | | | | 3,937,500 | |
Huntington Ingalls Industries Incorporated 144A | | | 5.00 | | | | 12-15-2021 | | | | 3,400,000 | | | | 3,565,750 | |
TransDigm Group Incorporated | | | 6.50 | | | | 7-15-2024 | | | | 4,000,000 | | | | 4,090,000 | |
| | | | |
| | | | | | | | | | | | | | | 16,443,250 | |
| | | | | | | | | | | | | | | | |
| | | | |
| Airlines: 0.52% | | | | | | | | | | | | | | | | |
United Continental Holdings Incorporated | | | 6.00 | | | | 12-1-2020 | | | | 2,700,000 | | | | 2,862,000 | |
| | | | | | | | | | | | | | | | |
| | | | |
| Building Products: 1.38% | | | | | | | | | | | | | | | | |
Masco Corporation | | | 5.95 | | | | 3-15-2022 | | | | 2,030,000 | | | | 2,278,675 | |
Nortek Incorporated | | | 8.50 | | | | 4-15-2021 | | | | 2,000,000 | | | | 2,150,000 | |
USG Corporation 144A | | | 5.50 | | | | 3-1-2025 | | | | 1,000,000 | | | | 1,022,500 | |
USG Corporation 144A | | | 5.88 | | | | 11-1-2021 | | | | 2,000,000 | | | | 2,105,000 | |
| | | | |
| | | | | | | | | | | | | | | 7,556,175 | |
| | | | | | | | | | | | | | | | |
The accompanying notes are an integral part of these financial statements.
| | | | |
| 10 | | Wells Fargo Advantage High Income Fund | | Portfolio of investments—February 28, 2015 (unaudited) |
| | | | | | | | | | | | | | | | |
| Security name | | Interest rate | | | Maturity date | | | Principal | | | Value | |
| | | | |
| Commercial Services & Supplies: 2.04% | | | | | | | | | | | | | | | | |
ADT Corporation | | | 6.25 | % | | | 10-15-2021 | | | $ | 2,500,000 | | | $ | 2,706,250 | |
Casella Waste Systems Incorporated | | | 7.75 | | | | 2-15-2019 | | | | 4,250,000 | | | | 4,292,500 | |
Deluxe Corporation | | | 6.00 | | | | 11-15-2020 | | | | 1,000,000 | | | | 1,052,500 | |
Deluxe Corporation | | | 7.00 | | | | 3-15-2019 | | | | 3,000,000 | | | | 3,108,750 | |
| | | | |
| | | | | | | | | | | | | | | 11,160,000 | |
| | | | | �� | | | | | | | | | | | |
| | | | |
| Machinery: 1.95% | | | | | | | | | | | | | | | | |
Manitowoc Company Incorporated | | | 8.50 | | | | 11-1-2020 | | | | 4,000,000 | | | | 4,320,000 | |
Navistar International Corporation | | | 8.25 | | | | 11-1-2021 | | | | 3,000,000 | | | | 3,015,000 | |
Terex Corporation | | | 6.00 | | | | 5-15-2021 | | | | 3,250,000 | | | | 3,335,313 | |
| | | | |
| | | | | | | | | | | | | | | 10,670,313 | |
| | | | | | | | | | | | | | | | |
| | | | |
| Professional Services: 1.14% | | | | | | | | | | | | | | | | |
FTI Consulting Incorporated | | | 6.75 | | | | 10-1-2020 | | | | 5,900,000 | | | | 6,231,875 | |
| | | | | | | | | | | | | | | | |
| | | | |
| Road & Rail: 0.71% | | | | | | | | | | | | | | | | |
The Hertz Corporation | | | 5.88 | | | | 10-15-2020 | | | | 2,750,000 | | | | 2,839,375 | |
The Hertz Corporation | | | 6.25 | | | | 10-15-2022 | | | | 1,000,000 | | | | 1,040,000 | |
| | | | |
| | | | | | | | | | | | | | | 3,879,375 | |
| | | | | | | | | | | | | | | | |
| | | | |
| Trading Companies & Distributors: 2.01% | | | | | | | | | | | | | | | | |
Aircastle Limited | | | 5.50 | | | | 2-15-2022 | | | | 2,500,000 | | | | 2,681,250 | |
Ashtead Capital Incorporated 144A | | | 6.50 | | | | 7-15-2022 | | | | 3,740,000 | | | | 4,067,250 | |
United Rentals North America Incorporated | | | 5.75 | | | | 11-15-2024 | | | | 4,000,000 | | | | 4,237,960 | |
| | | | |
| | | | | | | | | | | | | | | 10,986,460 | |
| | | | | | | | | | | | | | | | |
| | | | |
Information Technology: 2.95% | | | | | | | | | | | | | | | | |
| | | | |
| Internet Software & Services: 0.23% | | | | | | | | | | | | | | | | |
Zayo Group LLC | | | 10.13 | | | | 7-1-2020 | | | | 1,107,000 | | | | 1,250,910 | |
| | | | | | | | | | | | | | | | |
| | | | |
| IT Services: 2.44% | | | | | | | | | | | | | | | | |
First Data Corporation | | | 10.63 | | | | 6-15-2021 | | | | 1,950,000 | | | | 2,242,500 | |
First Data Corporation (PIK at 10.00%) 144A¥ | | | 8.75 | | | | 1-15-2022 | | | | 3,000,000 | | | | 3,240,000 | |
iGATE Corporation | | | 4.75 | | | | 4-15-2019 | | | | 4,250,000 | | | | 4,313,750 | |
Neustar Incorporated « | | | 4.50 | | | | 1-15-2023 | | | | 4,000,000 | | | | 3,520,000 | |
| | | | |
| | | | | | | | | | | | | | | 13,316,250 | |
| | | | | | | | | | | | | | | | |
| | | | |
| Semiconductors & Semiconductor Equipment: 0.28% | | | | | | | | | | | | | | | | |
Magnachip Semiconductor Corporation | | | 6.63 | | | | 7-15-2021 | | | | 2,000,000 | | | | 1,555,000 | |
| | | | | | | | | | | | | | | | |
| | | | |
Materials: 5.20% | | | | | | | | | | | | | | | | |
| | | | |
| Chemicals: 1.54% | | | | | | | | | | | | | | | | |
Huntsman International LLC | | | 4.88 | | | | 11-15-2020 | | | | 4,000,000 | | | | 4,115,000 | |
W.R. Grace & Company 144A | | | 5.63 | | | | 10-1-2024 | | | | 4,000,000 | | | | 4,300,000 | |
| | | | |
| | | | | | | | | | | | | | | 8,415,000 | |
| | | | | | | | | | | | | | | | |
| | | | |
| Containers & Packaging: 1.56% | | | | | | | | | | | | | | | | |
Reynolds Group Holdings | | | 5.75 | | | | 10-15-2020 | | | | 3,000,000 | | | | 3,116,250 | |
Reynolds Group Holdings | | | 8.25 | | | | 2-15-2021 | | | | 3,000,000 | | | | 3,157,500 | |
Sealed Air Corporation 144A | | | 8.38 | | | | 9-15-2021 | | | | 2,000,000 | | | | 2,262,500 | |
| | | | |
| | | | | | | | | | | | | | | 8,536,250 | |
| | | | | | | | | | | | | | | | |
The accompanying notes are an integral part of these financial statements.
| | | | | | |
| Portfolio of investments—February 28, 2015 (unaudited) | | Wells Fargo Advantage High Income Fund | | | 11 | |
| | | | | | | | | | | | | | | | |
| Security name | | Interest rate | | | Maturity date | | | Principal | | | Value | |
| | | | |
| Metals & Mining: 2.10% | | | | | | | | | | | | | | | | |
AK Steel Corporation | | | 7.63 | % | | | 5-15-2020 | | | $ | 1,000,000 | | | $ | 907,500 | |
AK Steel Corporation | | | 8.38 | | | | 4-1-2022 | | | | 2,840,000 | | | | 2,527,600 | |
Steel Dynamics Incorporated 144A | | | 5.50 | | | | 10-1-2024 | | | | 4,250,000 | | | | 4,420,000 | |
United States Steel Corporation | | | 6.88 | | | | 4-1-2021 | | | | 3,500,000 | | | | 3,596,250 | |
| | | | |
| | | | | | | | | | | | | | | 11,451,350 | |
| | | | | | | | | | | | | | | | |
| | | | |
Telecommunication Services: 5.63% | | | | | | | | | | | | | | | | |
| | | | |
| Diversified Telecommunication Services: 2.64% | | | | | | | | | | | | | | | | |
CenturyLink Incorporated | | | 5.63 | | | | 4-1-2020 | | | | 3,000,000 | | | | 3,210,000 | |
Cincinnati Bell Incorporated | | | 8.38 | | | | 10-15-2020 | | | | 3,000,000 | | | | 3,195,000 | |
Frontier Communications Corporation | | | 6.25 | | | | 9-15-2021 | | | | 2,615,000 | | | | 2,680,375 | |
Level 3 Financing Incorporated | | | 7.00 | | | | 6-1-2020 | | | | 5,000,000 | | | | 5,376,050 | |
| | | | |
| | | | | | | | | | | | | | | 14,461,425 | |
| | | | | | | | | | | | | | | | |
| | | | |
| Wireless Telecommunication Services: 2.99% | | | | | | | | | | | | | | | | |
Sprint Capital Corporation | | | 6.90 | | | | 5-1-2019 | | | | 3,000,000 | | | | 3,105,000 | |
Sprint Capital Corporation | | | 7.88 | | | | 9-15-2023 | | | | 9,750,000 | | | | 10,066,875 | |
T-Mobile USA Incorporated | | | 6.25 | | | | 4-1-2021 | | | | 3,000,000 | | | | 3,150,000 | |
| | | | |
| | | | | | | | | | | | | | | 16,321,875 | |
| | | | | | | | | | | | | | | | |
| | | | |
Utilities: 3.15% | | | | | | | | | | | | | | | | |
| | | | |
| Independent Power & Renewable Electricity Producers: 3.15% | | | | | | | | | | | | | | | | |
Calpine Corporation | | | 5.38 | | | | 1-15-2023 | | | | 5,000,000 | | | | 5,075,000 | |
Dynergy Incorporated | | | 5.88 | | | | 6-1-2023 | | | | 3,000,000 | | | | 2,955,000 | |
NRG Energy Incorporated | | | 6.63 | | | | 3-15-2023 | | | | 3,500,000 | | | | 3,675,000 | |
TerraForm Power Operating LLC 144A | | | 5.88 | | | | 2-1-2023 | | | | 1,500,000 | | | | 1,559,700 | |
The AES Corporation | | | 5.50 | | | | 3-15-2024 | | | | 3,910,000 | | | | 3,968,650 | |
| | | | |
| | | | | | | | | | | | | | | 17,233,350 | |
| | | | | | | | | | | | | | | | |
| | | | |
Total Corporate Bonds and Notes (Cost $400,510,175) | | | | | | | | | | | | | | | 401,349,822 | |
| | | | | | | | | | | | | | | | |
| | | | |
Loans: 6.83% | | | | | | | | | | | | | | | | |
Aramark Corporation ± | | | 3.25 | | | | 9-7-2019 | | | | 3,880,000 | | | | 3,868,360 | |
Crown Castle Operating Company ± | | | 3.00 | | | | 1-31-2021 | | | | 4,950,000 | | | | 4,938,863 | |
Dell Incorporated ± | | | 4.50 | | | | 4-29-2020 | | | | 3,950,000 | | | | 3,964,813 | |
Delos Finance SARL ± | | | 3.50 | | | | 3-6-2021 | | | | 6,500,000 | | | | 6,497,270 | |
Freescale Semiconductor Incorporated ± | | | 4.25 | | | | 3-1-2020 | | | | 3,465,000 | | | | 3,456,338 | |
SBA Senior Finance II LLC ± | | | 3.25 | | | | 3-24-2021 | | | | 3,980,000 | | | | 3,950,707 | |
Select Medical Corporation ± | | | 3.75 | | | | 6-1-2018 | | | | 4,000,000 | | | | 3,987,520 | |
ServiceMaster Company ± | | | 4.25 | | | | 7-1-2021 | | | | 3,491,250 | | | | 3,489,993 | |
Zayo Group LLC ± | | | 4.00 | | | | 7-2-2019 | | | | 3,217,670 | | | | 3,213,647 | |
| | | | |
Total Loans (Cost $37,451,096) | | | | | | | | | | | | | | | 37,367,511 | |
| | | | | | | | | | | | | | | | |
| | | | |
Municipal Obligations: 1.10% | | | | | | | | | | | | | | | | |
| | | | |
| Alabama: 0.49% | | | | | | | | | | | | | | | | |
Jefferson County AL Taxable Warrants Series D (GO) | | | 4.90 | | | | 4-1-2017 | | | | 2,625,000 | | | | 2,681,989 | |
| | | | | | | | | | | | | | | | |
| | | | |
| Florida: 0.61% | | | | | | | | | | | | | | | | |
Florida Development Financial Corporation Renaissance Charter School Project Series B (Education Revenue) | | | 7.50 | | | | 6-15-2018 | | | | 1,170,000 | | | | 1,179,278 | |
The accompanying notes are an integral part of these financial statements.
| | | | |
| 12 | | Wells Fargo Advantage High Income Fund | | Portfolio of investments—February 28, 2015 (unaudited) |
| | | | | | | | | | | | | | | | |
| Security name | | Interest rate | | | Maturity date | | | Principal | | | Value | |
| | | | |
| Florida (continued) | | | | | | | | | | | | | | | | |
Florida Development Financial Corporation Renaissance Charter School Project Series B (Education Revenue) | | | 8.00 | % | | | 12-15-2018 | | | $ | 2,095,000 | | | $ | 2,162,103 | |
| | | | |
| | | | | | | | | | | | | | | 3,341,381 | |
| | | | | | | | | | | | | | | | |
| | | | |
Total Municipal Obligations (Cost $5,930,996) | | | | | | | | | | | | | | | 6,023,370 | |
| | | | | | | | | | | | | | | | |
| | | | |
Yankee Corporate Bonds and Notes: 9.94% | | | | | | | | | | | | | | | | |
| | | | |
Consumer Discretionary: 2.39% | | | | | | | | | | | | | | | | |
| | | | |
| Auto Components: 0.20% | | | | | | | | | | | | | | | | |
Schaeffler Holding Finance BV 144A | | | 6.75 | | | | 11-15-2022 | | | | 1,000,000 | | | | 1,095,000 | |
| | | | | | | | | | | | | | | | |
| | | | |
| Automobiles: 0.69% | | | | | | | | | | | | | | | | |
Jaguar Land Rover Automotive plc 144A | | | 5.63 | | | | 2-1-2023 | | | | 3,500,000 | | | | 3,762,500 | |
| | | | | | | | | | | | | | | | |
| | | | |
| Consumer Finance: 0.54% | | | | | | | | | | | | | | | | |
Cleopatra Finance Limited 144A | | | 6.50 | | | | 2-15-2025 | | | | 3,000,000 | | | | 2,981,250 | |
| | | | | | | | | | | | | | | | |
| | | | |
| Media: 0.96% | | | | | | | | | | | | | | | | |
Quebecor Media Incorporated | | | 5.75 | | | | 1-15-2023 | | | | 5,000,000 | | | | 5,225,000 | |
| | | | | | | | | | | | | | | | |
| | | | |
Financials: 0.77% | | | | | | | | | | | | | | | | |
| | | | |
| Banks: 0.77% | | | | | | | | | | | | | | | | |
Royal Bank of Scotland Group plc | | | 5.13 | | | | 5-28-2024 | | | | 4,000,000 | | | | 4,236,804 | |
| | | | | | | | | | | | | | | | |
| | | | |
Health Care: 0.99% | | | | | | | | | | | | | | | | |
| | | | |
| Pharmaceuticals: 0.99% | | | | | | | | | | | | | | | | |
Valeant Pharmaceuticals International Incorporated 144A | | | 7.50 | | | | 7-15-2021 | | | | 5,000,000 | | | | 5,425,000 | |
| | | | | | | | | | | | | | | | |
| | | | |
Industrials: 0.37% | | | | | | | | | | | | | | | | |
| | | | |
| Aerospace & Defense: 0.37% | | | | | | | | | | | | | | | | |
Bombardier Incorporated 144A%% | | | 7.50 | | | | 3-15-2025 | | | | 2,000,000 | | | | 2,005,000 | |
| | | | | | | | | | | | | | | | |
| | | | |
Information Technology: 0.49% | | | | | | | | | | | | | | | | |
| | | | |
| Semiconductors & Semiconductor Equipment: 0.49% | | | | | | | | | | | | | | | | |
NXP Funding LLC 144A | | | 5.75 | | | | 2-15-2021 | | | | 2,500,000 | | | | 2,662,500 | |
| | | | | | | | | | | | | | | | |
| | | | |
Materials: 3.10% | | | | | | | | | | | | | | | | |
| | | | |
| Chemicals: 0.39% | | | | | | | | | | | | | | | | |
Ineos Finance plc 144A | | | 7.50 | | | | 5-1-2020 | | | | 1,000,000 | | | | 1,061,250 | |
Ineos Group Holdings plc 144A | | | 8.38 | | | | 2-15-2019 | | | | 1,000,000 | | | | 1,066,500 | |
| | | | |
| | | | | | | | | | | | | | | 2,127,750 | |
| | | | | | | | | | | | | | | | |
| | | | |
| Containers & Packaging: 0.92% | | | | | | | | | | | | | | | | |
Ardagh Holdings USA Incorporated 144A | | | 6.75 | | | | 1-31-2021 | | | | 5,000,000 | | | | 5,050,000 | |
| | | | | | | | | | | | | | | | |
| | | | |
| Metals & Mining: 1.03% | | | | | | | | | | | | | | | | |
ArcelorMittal « | | | 7.00 | | | | 2-25-2022 | | | | 5,000,000 | | | | 5,638,500 | |
| | | | | | | | | | | | | | | | |
| | | | |
| Paper & Forest Products: 0.76% | | | | | | | | | | | | | | | | |
Sappi Papier Holding GmbH 144A | | | 6.63 | | | | 4-15-2021 | | | | 4,000,000 | | | | 4,140,000 | |
| | | | | | | | | | | | | | | | |
The accompanying notes are an integral part of these financial statements.
| | | | | | |
| Portfolio of investments—February 28, 2015 (unaudited) | | Wells Fargo Advantage High Income Fund | | | 13 | |
| | | | | | | | | | | | | | | | |
| Security name | | Interest rate | | | Maturity date | | | Principal | | | Value | |
| | | | |
Telecommunication Services: 1.83% | | | | | | | | | | | | | | | | |
| | | | |
| Diversified Telecommunication Services: 0.85% | | | | | | | | | | | | | | | | |
Intelsat Luxembourg SA | | | 7.75 | % | | | 6-1-2021 | | | $ | 5,000,000 | | | $ | 4,631,250 | |
| | | | | | | | | | | | | | | | |
| | | | |
| Wireless Telecommunication Services: 0.98% | | | | | | | | | | | | | | | | |
Virgin Media Finance plc 144A | | | 5.75 | | | | 1-15-2025 | | | | 2,500,000 | | | | 2,653,125 | |
Virgin Media Finance plc 144A | | | 6.00 | | | | 10-15-2024 | | | | 500,000 | | | | 537,500 | |
Virgin Media Finance plc 144A | | | 6.38 | | | | 4-15-2023 | | | | 2,000,000 | | | | 2,160,000 | |
| | | | |
| | | | | | | | | | | | | | | 5,350,625 | |
| | | | | | | | | | | | | | | | |
| | | | |
Total Yankee Corporate Bonds and Notes (Cost $53,047,583) | | | | | | | | | | | | | | | 54,331,179 | |
| | | | | | | | | | | | | | | | |
| | | | |
| | | Yield | | | | | | Shares | | | | |
| Short-Term Investments: 10.14% | | | | | | | | | | | | | | | | |
| | | | |
| Investment Companies: 9.99% | | | | | | | | | | | | | | | | |
Securities Lending Cash Investments, LLC (l)(r)(u) | | | 0.13 | | | | | | | | 15,556,625 | | | | 15,556,625 | |
Wells Fargo Advantage Cash Investment Money Market Fund, Select Class (l)(u)## | | | 0.10 | | | | | | | | 39,100,567 | | | | 39,100,567 | |
| | | | |
| | | | | | | | | | | | | | | 54,657,192 | |
| | | | | | | | | | | | | | | | |
| | | | |
| | | | | | | | | Principal | | | | |
| U.S. Treasury Securities: 0.15% | | | | | | | | | | | | | | | | |
U.S. Treasury Bill (z)# | | | 0.01 | | | | 3-19-2015 | | | $ | 800,000 | | | | 799,994 | |
| | | | | | | | | | | | | | | | |
| | | | |
Total Short-Term Investments (Cost $55,457,182) | | | | | | | | | | | | | | | 55,457,186 | |
| | | | | | | | | | | | | | | | |
| | | | | | | | |
| Total investments in securities (Cost $552,397,032) * | | | 101.41 | % | | | 554,529,068 | |
Other assets and liabilities, net | | | (1.41 | ) | | | (7,719,195 | ) |
| | | | | | | | |
| Total net assets | | | 100.00 | % | | $ | 546,809,873 | |
| | | | | | | | |
| 144A | The security may be resold in transactions exempt from registration, normally to qualified institutional buyers, pursuant to Rule 144A under the Securities Act of 1933. |
| « | All or a portion of this security is on loan. |
| ¥ | A payment-in-kind (PIK) security is a security in which the issuer may make interest or dividend payments in cash or additional securities. These additional securities generally have the same terms as the original holdings. |
| %% | The security is issued on a when-issued basis. |
| ± | Variable rate investment. The rate shown is the rate in effect at period end. |
| (l) | The security represents an affiliate of the Fund as defined in the Investment Company Act of 1940. |
| (r) | The investment is a non-registered investment vehicle purchased with cash collateral received from securities on loan. |
| (u) | The rate represents the 7-day annualized yield at period end. |
| ## | All or a portion of this security is segregated for when-issued securities. |
| (z) | Zero coupon security. The rate represents the current yield to maturity. |
| # | All or a portion of this security is segregated as collateral for investments in derivative instruments. |
| * | Cost for federal income tax purposes is $552,477,847 and unrealized gains (losses) consists of: |
| | | | |
Gross unrealized gains | | $ | 13,600,606 | |
Gross unrealized losses | | | (11,549,385 | ) |
| | | | |
Net unrealized gains | | $ | 2,051,221 | |
The accompanying notes are an integral part of these financial statements.
| | | | |
| 14 | | Wells Fargo Advantage High Income Fund | | Statement of assets and liabilities—February 28, 2015 (unaudited) |
| | | | |
| | | | |
| |
Assets | | | | |
Investments | | | | |
In unaffiliated securities (including $15,231,937 of securities loaned), at value (cost $497,739,840) | | $ | 499,871,876 | |
In affiliated securities, at value (cost $54,657,192) | | | 54,657,192 | |
| | | | |
Total investments, at value (cost $552,397,032) | | | 554,529,068 | |
Cash | | | 5,096,215 | |
Receivable for investments sold | | | 3,188,125 | |
Receivable for Fund shares sold | | | 716,394 | |
Receivable for interest | | | 8,404,746 | |
Receivable for securities lending income | | | 8,811 | |
Prepaid expenses and other assets | | | 42,856 | |
| | | | |
Total assets | | | 571,986,215 | |
| | | | |
| |
Liabilities | | | | |
Dividends payable | | | 483,888 | |
Payable for investments purchased | | | 5,021,250 | |
Payable for Fund shares redeemed | | | 3,687,772 | |
Payable upon receipt of securities loaned | | | 15,556,625 | |
Payable for daily variation margin on open futures contracts | | | 39,000 | |
Advisory fee payable | | | 156,924 | |
Distribution fees payable | | | 13,408 | |
Administration fees payable | | | 82,575 | |
Accrued expenses and other liabilities | | | 134,900 | |
| | | | |
Total liabilities | | | 25,176,342 | |
| | | | |
Total net assets | | $ | 546,809,873 | |
| | | | |
| |
NET ASSETS CONSIST OF | | | | |
Paid-in capital | | $ | 562,338,840 | |
Overdistributed net investment income | | | (46,842 | ) |
Accumulated net realized losses on investments | | | (17,530,693 | ) |
Net unrealized gains on investments | | | 2,048,568 | |
| | | | |
Total net assets | | $ | 546,809,873 | |
| | | | |
| |
COMPUTATION OF NET ASSET VALUE AND OFFERING PRICE PER SHARE | | | | |
Net assets – Class A | | $ | 65,894,165 | |
Shares outstanding – Class A1 | | | 9,422,033 | |
Net asset value per share – Class A | | | $6.99 | |
Maximum offering price per share – Class A2 | | | $7.32 | |
Net assets – Class B | | $ | 277,421 | |
Shares outstanding – Class B1 | | | 39,677 | |
Net asset value per share – Class B | | | $6.99 | |
Net assets – Class C | | $ | 22,293,008 | |
Shares outstanding – Class C1 | | | 3,188,082 | |
Net asset value per share – Class C | | | $6.99 | |
Net assets – Administrator Class | | $ | 84,124,182 | |
Shares outstanding – Administrator Class1 | | | 11,907,206 | |
Net asset value per share – Administrator Class | | | $7.06 | |
Net assets – Institutional Class | | $ | 147,500,647 | |
Shares outstanding – Institutional Class1 | | | 20,895,912 | |
Net asset value per share – Institutional Class | | | $7.06 | |
Net assets – Investor Class | | $ | 226,720,450 | |
Shares outstanding – Investor Class1 | | | 32,281,939 | |
Net asset value per share – Investor Class | | | $7.02 | |
| 1 | The Fund has an unlimited number of authorized shares. |
| 2 | Maximum offering price is computed as 100/95.50 of net asset value. On investments of $50,000 or more, the offering price is reduced. |
The accompanying notes are an integral part of these financial statements.
| | | | | | |
| Statement of operations—six months ended February 28, 2015 (unaudited) | | Wells Fargo Advantage High Income Fund | | | 15 | |
| | | | |
| | | | |
| |
Investment income | | | | |
Interest | | $ | 16,466,863 | |
Securities lending income, net | | | 81,801 | |
Income from affiliated securities | | | 13,149 | |
| | | | |
Total investment income | | | 16,561,813 | |
| | | | |
| |
Expenses | | | | |
Advisory fee | | | 1,378,906 | |
Administration fees | | | | |
Fund level | | | 138,624 | |
Class A | | | 56,916 | |
Class B | | | 295 | |
Class C | | | 19,347 | |
Administrator Class | | | 44,966 | |
Institutional Class | | | 49,428 | |
Investor Class | | | 233,030 | |
Shareholder servicing fees | | | | |
Class A | | | 88,931 | |
Class B | | | 461 | |
Class C | | | 30,229 | |
Administrator Class | | | 96,294 | |
Investor Class | | | 306,618 | |
Distribution fees | | | | |
Class B | | | 1,382 | |
Class C | | | 90,688 | |
Custody and accounting fees | | | 18,135 | |
Professional fees | | | 29,308 | |
Registration fees | | | 43,188 | |
Shareholder report expenses | | | 45,154 | |
Trustees’ fees and expenses | | | 4,795 | |
Other fees and expenses | | | 6,524 | |
| | | | |
Total expenses | | | 2,683,219 | |
Less: Fee waivers and/or expense reimbursements | | | (351,237 | ) |
| | | | |
Net expenses | | | 2,331,982 | |
| | | | |
Net investment income | | | 14,229,831 | |
| | | | |
| |
REALIZED AND UNREALIZED GAINS (LOSSES) ON INVESTMENTS | | | | |
| |
Net realized losses on: | | | | |
Unaffiliated securities | | | (17,014,427 | ) |
Futures transactions | | | (611,746 | ) |
| | | | |
Net realized losses on investments | | | (17,626,173 | ) |
| | | | |
| |
Net change in unrealized gains (losses) on: | | | | |
Unaffiliated securities | | | (8,468,598 | ) |
Futures transactions | | | 12,187 | |
| | | | |
Net change in unrealized gains (losses) on investments | | | (8,456,411 | ) |
| | | | |
Net realized and unrealized gains (losses) on investments | | | (26,082,584 | ) |
| | | | |
Net decrease in net assets resulting from operations | | $ | (11,852,753 | ) |
| | | | |
The accompanying notes are an integral part of these financial statements.
| | | | |
| 16 | | Wells Fargo Advantage High Income Fund | | Statement of changes in net assets |
| | | | | | | | | | | | | | | | |
| | | Six months ended
February 28, 2015
(unaudited) | | | Year ended
August 31, 2014 | |
| | | | |
Operations | | | | | | | | | | | | | | | | |
Net investment income | | | | | | $ | 14,229,831 | | | | | | | $ | 36,580,956 | |
Net realized gains (losses) on investments | | | | | | | (17,626,173 | ) | | | | | | | 8,047,490 | |
Net change in unrealized gains (losses) on investments | | | | | | | (8,456,411 | ) | | | | | | | 13,478,951 | |
| | | | |
Net increase (decrease) in net assets resulting from operations | | | | | | | (11,852,753 | ) | | | | | | | 58,107,397 | |
| | | | |
| | | | |
Distributions to shareholders from | | | | | | | | | | | | | | | | |
Net investment income | | | | | | | | | | | | | | | | |
Class A | | | | | | | (1,804,904 | ) | | | | | | | (4,988,884 | ) |
Class B | | | | | | | (7,956 | ) | | | | | | | (35,240 | ) |
Class C | | | | | | | (523,844 | ) | | | | | | | (1,345,745 | ) |
Administrator Class | | | | | | | (2,330,382 | ) | | | | | | | (3,773,802 | ) |
Institutional Class | | | | | | | (3,377,416 | ) | | | | | | | (9,751,084 | ) |
Investor Class | | | | | | | (6,185,329 | ) | | | | | | | (16,603,815 | ) |
Net realized gains | | | | | | | | | | | | | | | | |
Class A | | | | | | | (969,256 | ) | | | | | | | (3,842,804 | ) |
Class B | | | | | | | (4,641 | ) | | | | | | | (38,215 | ) |
Class C | | | | | | | (329,907 | ) | | | | | | | (1,274,798 | ) |
Administrator Class | | | | | | | (1,216,589 | ) | | | | | | | (2,836,913 | ) |
Institutional Class | | | | | | | (1,577,413 | ) | | | | | | | (8,563,107 | ) |
Investor Class | | | | | | | (3,110,108 | ) | | | | | | | (13,040,948 | ) |
| | | | |
Total distributions to shareholders | | | | | | | (21,437,745 | ) | | | | | | | (66,095,355 | ) |
| | | | |
| | | | |
Capital share transactions | | | Shares | | | | | | | | Shares | | | | | |
Proceeds from shares sold | | | | | | | | | | | | | | | | |
Class A | | | 456,329 | | | | 3,228,904 | | | | 3,794,924 | | | | 28,252,612 | |
Class B | | | 136 | | | | 946 | | | | 16,194 | | | | 121,959 | |
Class C | | | 79,656 | | | | 564,237 | | | | 485,547 | | | | 3,643,236 | |
Administrator Class | | | 1,465,429 | | | | 10,439,714 | | | | 8,278,192 | | | | 62,362,797 | |
Institutional Class | | | 8,853,950 | | | | 62,020,412 | | | | 2,525,658 | | | | 19,041,640 | |
Investor Class | | | 6,365,789 | | | | 45,037,375 | | | | 14,510,420 | | | | 108,878,323 | |
| | | | |
| | | | | | | 121,291,588 | | | | | | | | 222,300,567 | |
| | | | |
Reinvestment of distributions | | | | | | | | | | | | | | | | |
Class A | | | 385,020 | | | | 2,687,407 | | | | 1,143,459 | | | | 8,497,069 | |
Class B | | | 1,559 | | | | 10,887 | | | | 9,113 | | | | 67,675 | |
Class C | | | 116,907 | | | | 814,769 | | | | 337,949 | | | | 2,509,671 | |
Administrator Class | | | 497,879 | | | | 3,510,163 | | | | 829,521 | | | | 6,226,308 | |
Institutional Class | | | 294,858 | | | | 2,076,395 | | | | 683,853 | | | | 5,128,743 | |
Investor Class | | | 1,183,965 | | | | 8,306,725 | | | | 3,599,102 | | | | 26,847,596 | |
| | | | |
| | | | | | | 17,406,346 | | | | | | | | 49,277,062 | |
| | | | |
Payment for shares redeemed | | | | | | | | | | | | | | | | |
Class A | | | (2,270,681 | ) | | | (16,045,298 | ) | | | (7,335,423 | ) | | | (54,765,677 | ) |
Class B | | | (33,848 | ) | | | (242,566 | ) | | | (93,091 | ) | | | (696,788 | ) |
Class C | | | (756,276 | ) | | | (5,339,246 | ) | | | (1,278,499 | ) | | | (9,551,308 | ) |
Administrator Class | | | (3,426,798 | ) | | | (24,389,965 | ) | | | (4,267,272 | ) | | | (32,180,199 | ) |
Institutional Class | | | (4,723,718 | ) | | | (33,467,489 | ) | | | (15,484,067 | ) | | | (116,484,382 | ) |
Investor Class | | | (14,570,909 | ) | | | (104,037,961 | ) | | | (20,541,049 | ) | | | (153,671,049 | ) |
| | | | |
| | | | | | | (183,522,525 | ) | | | | | | | (367,349,403 | ) |
| | | | |
Net decrease in net assets resulting from capital share transactions | | | | | | | (44,824,591 | ) | | | | | | | (95,771,774 | ) |
| | | | |
Total decrease in net assets | | | | | | | (78,115,089 | ) | | | | | | | (103,759,732 | ) |
| | | | |
| | | | |
Net assets | | | | | | | | | | | | | | | | |
Beginning of period | | | | | | | 624,924,962 | | | | | | | | 728,684,694 | |
| | | | |
End of period | | | | | | $ | 546,809,873 | | | | | | | $ | 624,924,962 | |
| | | | |
Overdistributed net investment income | | | | | | $ | (46,842 | ) | | | | | | $ | (46,842 | ) |
| | | | |
The accompanying notes are an integral part of these financial statements.
| | | | | | |
| Financial highlights | | Wells Fargo Advantage High Income Fund | | | 17 | |
(For a share outstanding throughout each period)
| | | | | | | | | | | | | | | | | | | | | | | | | | | | |
| | | Six months ended
February 28, 2015
(unaudited) | | | Year ended August 31 | | | Year ended
May 31, 2010 | |
| CLASS A | | | 2014 | | | 2013 | | | 2012 | | | 2011 | | | 20101 | | |
Net asset value, beginning of period | | | $7.42 | | | | $7.50 | | | | $7.63 | | | | $7.17 | | | | $7.14 | | | | $6.90 | | | | $6.35 | |
Net investment income | | | 0.18 | | | | 0.39 | 2 | | | 0.43 | | | | 0.46 | | | | 0.50 | | | | 0.13 | | | | 0.53 | |
Net realized and unrealized gains (losses) on investments | | | (0.33 | ) | | | 0.23 | | | | (0.10 | ) | | | 0.47 | | | | 0.03 | | | | 0.24 | | | | 0.54 | |
| | | | | | | | | | | | | | | | | | | | | | | | | | | | |
Total from investment operations | | | (0.15 | ) | | | 0.62 | | | | 0.33 | | | | 0.93 | | | | 0.53 | | | | 0.37 | | | | 1.07 | |
Distributions to shareholders from | | | | | | | | | | | | | | | | | | | | |
Net investment income | | | (0.18 | ) | | | (0.39 | ) | | | (0.42 | ) | | | (0.47 | ) | | | (0.50 | ) | | | (0.13 | ) | | | (0.52 | ) |
Net realized gains | | | (0.10 | ) | | | (0.31 | ) | | | (0.04 | ) | | | 0.00 | | | | 0.00 | | | | 0.00 | | | | 0.00 | |
| | | | | | | | | | | | | | | | | | | | | | | | | | | | |
Total distributions to shareholders | | | (0.28 | ) | | | (0.70 | ) | | | (0.46 | ) | | | (0.47 | ) | | | (0.50 | ) | | | (0.13 | ) | | | (0.52 | ) |
Net asset value, end of period | | | $6.99 | | | | $7.42 | | | | $7.50 | | | | $7.63 | | | | $7.17 | | | | $7.14 | | | | $6.90 | |
Total return3 | | | (2.02 | )% | | | 8.60 | % | | | 4.42 | % | | | 13.30 | % | | | 7.41 | % | | | 5.44 | % | | | 17.20 | % |
Ratios to average net assets (annualized) | | | | | | | | | | | | | | | | | | | | |
Gross expenses | | | 1.01 | % | | | 1.01 | % | | | 0.99 | % | | | 1.00 | % | | | 1.01 | % | | | 1.00 | % | | | 1.03 | % |
Net expenses | | | 0.90 | % | | | 0.90 | % | | | 0.90 | % | | | 0.90 | % | | | 0.90 | % | | | 0.90 | % | | | 0.90 | % |
Net investment income | | | 5.07 | % | | | 5.22 | % | | | 5.52 | % | | | 6.30 | % | | | 6.77 | % | | | 7.52 | % | | | 7.86 | % |
Supplemental data | | | | | | | | | | | | | | | | | | | | |
Portfolio turnover rate | | | 25 | % | | | 46 | % | | | 60 | % | | | 22 | % | | | 78 | % | | | 11 | % | | | 77 | % |
Net assets, end of period (000s omitted) | | | $65,894 | | | | $80,478 | | | | $99,410 | | | | $123,727 | | | | $102,361 | | | | $124,730 | | | | $99,515 | |
| 1 | For the three months ended August 31, 2010. The Fund changed its fiscal year end from May 31 to August 31, effective August 31, 2010. |
| 2 | Calculated based upon average shares outstanding |
| 3 | Total return calculations do not include any sales charges. Returns for periods of less than one year are not annualized. |
The accompanying notes are an integral part of these financial statements.
| | | | |
| 18 | | Wells Fargo Advantage High Income Fund | | Financial highlights |
(For a share outstanding throughout each period)
| | | | | | | | | | | | | | | | | | | | | | | | | | | | |
| | | Six months ended
February 28, 2015
(unaudited) | | | Year ended August 31 | | | Year ended
May 31, 2010 | |
| CLASS B | | | 2014 | | | 2013 | | | 2012 | | | 2011 | | | 20101 | | |
Net asset value, beginning of period | | | $7.42 | | | | $7.50 | | | | $7.63 | | | | $7.17 | | | | $7.13 | | | | $6.90 | | | | $6.35 | |
Net investment income | | | 0.15 | 2 | | | 0.34 | 2 | | | 0.37 | 2 | | | 0.41 | 2 | | | 0.45 | | | | 0.12 | | | | 0.48 | |
Net realized and unrealized gains (losses) on investments | | | (0.33 | ) | | | 0.22 | | | | (0.09 | ) | | | 0.46 | | | | 0.04 | | | | 0.23 | | | | 0.54 | |
| | | | | | | | | | | | | | | | | | | | | | | | | | | | |
Total from investment operations | | | (0.18 | ) | | | 0.56 | | | | 0.28 | | | | 0.87 | | | | 0.49 | | | | 0.35 | | | | 1.02 | |
Distributions to shareholders from | | | | | | | | | | | | | | | | | | | | | | | | | | | | |
Net investment income | | | (0.15 | ) | | | (0.33 | ) | | | (0.37 | ) | | | (0.41 | ) | | | (0.45 | ) | | | (0.12 | ) | | | (0.47 | ) |
Net realized gains | | | (0.10 | ) | | | (0.31 | ) | | | (0.04 | ) | | | 0.00 | | | | 0.00 | | | | 0.00 | | | | 0.00 | |
| | | | | | | | | | | | | | | | | | | | | | | | | | | | |
Total distributions to shareholders | | | (0.25 | ) | | | (0.64 | ) | | | (0.41 | ) | | | (0.41 | ) | | | (0.45 | ) | | | (0.12 | ) | | | (0.47 | ) |
Net asset value, end of period | | | $6.99 | | | | $7.42 | | | | $7.50 | | | | $7.63 | | | | $7.17 | | | | $7.13 | | | | $6.90 | |
Total return3 | | | (2.38 | )% | | | 7.79 | % | | | 3.64 | % | | | 12.46 | % | | | 6.76 | % | | | 5.10 | % | | | 16.33 | % |
Ratios to average net assets (annualized) | | | | | | | | | | | | | | | | | | | | | | | | | | | | |
Gross expenses | | | 1.76 | % | | | 1.76 | % | | | 1.74 | % | | | 1.75 | % | | | 1.76 | % | | | 1.75 | % | | | 1.78 | % |
Net expenses | | | 1.65 | % | | | 1.65 | % | | | 1.65 | % | | | 1.65 | % | | | 1.65 | % | | | 1.65 | % | | | 1.65 | % |
Net investment income | | | 4.32 | % | | | 4.51 | % | | | 4.77 | % | | | 5.59 | % | | | 6.04 | % | | | 6.66 | % | | | 7.17 | % |
Supplemental data | | | | | | | | | | | | | | | | | | | | | | | | | | | | |
Portfolio turnover rate | | | 25 | % | | | 46 | % | | | 60 | % | | | 22 | % | | | 78 | % | | | 11 | % | | | 77 | % |
Net assets, end of period (000s omitted) | | | $277 | | | | $533 | | | | $1,047 | | | | $1,470 | | | | $2,452 | | | | $5,451 | | | | $4,564 | |
| 1 | For the three months ended August 31, 2010. The Fund changed its fiscal year end from May 31 to August 31, effective August 31, 2010. |
| 2 | Calculated based upon average shares outstanding |
| 3 | Total return calculations do not include any sales charges. Returns for periods of less than one year are not annualized. |
The accompanying notes are an integral part of these financial statements.
| | | | | | |
| Financial highlights | | Wells Fargo Advantage High Income Fund | | | 19 | |
(For a share outstanding throughout each period)
| | | | | | | | | | | | | | | | | | | | | | | | | | | | |
| | | Six months ended
February 28, 2015
(unaudited) | | | Year ended August 31 | | | Year ended
May 31, 2010 | |
| CLASS C | | | 2014 | | | 2013 | | | 2012 | | | 2011 | | | 20101 | | |
Net asset value, beginning of period | | | $7.42 | | | | $7.50 | | | | $7.63 | | | | $7.17 | | | | $7.14 | | | | $6.90 | | | | $6.35 | |
Net investment income | | | 0.15 | 2 | | | 0.32 | | | | 0.37 | | | | 0.41 | | | | 0.45 | | | | 0.12 | | | | 0.48 | |
Net realized and unrealized gains (losses) on investments | | | (0.33 | ) | | | 0.24 | | | | (0.09 | ) | | | 0.46 | | | | 0.03 | | | | 0.24 | | | | 0.54 | |
| | | | | | | | | | | | | | | | | | | | | | | | | | | | |
Total from investment operations | | | (0.18 | ) | | | 0.56 | | | | 0.28 | | | | 0.87 | | | | 0.48 | | | | 0.36 | | | | 1.02 | |
Distributions to shareholders from | | | | | | | | | | | | | | | | | | | | | | | | | | | | |
Net investment income | | | (0.15 | ) | | | (0.33 | ) | | | (0.37 | ) | | | (0.41 | ) | | | (0.45 | ) | | | (0.12 | ) | | | (0.47 | ) |
Net realized gains | | | (0.10 | ) | | | (0.31 | ) | | | (0.04 | ) | | | 0.00 | | | | 0.00 | | | | 0.00 | | | | 0.00 | |
| | | | | | | | | | | | | | | | | | | | | | | | | | | | |
Total distributions to shareholders | | | (0.25 | ) | | | (0.64 | ) | | | (0.41 | ) | | | (0.41 | ) | | | (0.45 | ) | | | (0.12 | ) | | | (0.47 | ) |
Net asset value, end of period | | | $6.99 | | | | $7.42 | | | | $7.50 | | | | $7.63 | | | | $7.17 | | | | $7.14 | | | | $6.90 | |
Total return3 | | | (2.38 | )% | | | 7.80 | % | | | 3.65 | % | | | 12.47 | % | | | 6.62 | % | | | 5.25 | % | | | 16.33 | % |
Ratios to average net assets (annualized) | | | | | | | | | | | | | | | | | | | | | | | | | | | | |
Gross expenses | | | 1.76 | % | | | 1.76 | % | | | 1.74 | % | | | 1.75 | % | | | 1.76 | % | | | 1.75 | % | | | 1.78 | % |
Net expenses | | | 1.65 | % | | | 1.65 | % | | | 1.65 | % | | | 1.65 | % | | | 1.65 | % | | | 1.65 | % | | | 1.65 | % |
Net investment income | | | 4.33 | % | | | 4.48 | % | | | 4.76 | % | | | 5.56 | % | | | 6.01 | % | | | 6.75 | % | | | 7.04 | % |
Supplemental data | | | | | | | | | | | | | | | | | | | | | | | | | | | | |
Portfolio turnover rate | | | 25 | % | | | 46 | % | | | 60 | % | | | 22 | % | | | 78 | % | | | 11 | % | | | 77 | % |
Net assets, end of period (000s omitted) | | | $22,293 | | | | $27,791 | | | | $31,534 | | | | $32,089 | | | | $30,645 | | | | $30,332 | | | | $18,573 | |
| 1 | For the three months ended August 31, 2010. The Fund changed its fiscal year end from May 31 to August 31, effective August 31, 2010. |
| 2 | Calculated based upon average shares outstanding |
| 3 | Total return calculations do not include any sales charges. Returns for periods of less than one year are not annualized. |
The accompanying notes are an integral part of these financial statements.
| | | | |
| 20 | | Wells Fargo Advantage High Income Fund | | Financial highlights |
(For a share outstanding throughout each period)
| | | | | | | | | | | | | | | | | | | | | | | | |
| | | Six months ended
February 28, 2015
(unaudited) | | | Year ended August 31 | |
| ADMINISTRATOR CLASS | | | 2014 | | | 2013 | | | 2012 | | | 2011 | | | 20101 | |
Net asset value, beginning of period | | | $7.49 | | | | $7.58 | | | | $7.70 | | | | $7.24 | | | | $7.20 | | | | $7.23 | |
Net investment income | | | 0.18 | | | | 0.40 | | | | 0.44 | | | | 0.48 | | | | 0.51 | | | | 0.04 | |
Net realized and unrealized gains (losses) on investments | | | (0.33 | ) | | | 0.22 | | | | (0.08 | ) | | | 0.46 | | | | 0.04 | | | | (0.02 | ) |
| | | | | | | | | | | | | | | | | | | | | | | | |
Total from investment operations | | | (0.15 | ) | | | 0.62 | | | | 0.36 | | | | 0.94 | | | | 0.55 | | | | 0.02 | |
Distributions to shareholders from | | | | | | | | | | | | | | | | | | | | | | | | |
Net investment income | | | (0.18 | ) | | | (0.40 | ) | | | (0.44 | ) | | | (0.48 | ) | | | (0.51 | ) | | | (0.05 | ) |
Net realized gains | | | (0.10 | ) | | | (0.31 | ) | | | (0.04 | ) | | | 0.00 | | | | 0.00 | | | | 0.00 | |
| | | | | | | | | | | | | | | | | | | | | | | | |
Total distributions to shareholders | | | (0.28 | ) | | | (0.71 | ) | | | (0.48 | ) | | | (0.48 | ) | | | (0.51 | ) | | | (0.05 | ) |
Net asset value, end of period | | | $7.06 | | | | $7.49 | | | | $7.58 | | | | $7.70 | | | | $7.24 | | | | $7.20 | |
Total return2 | | | (1.93 | )% | | | 8.53 | % | | | 4.68 | % | | | 13.36 | % | | | 7.66 | % | | | 0.22 | % |
Ratios to average net assets (annualized) | | | | | | | | | | | | | | | | | | | | | | | | |
Gross expenses | | | 0.92 | % | | | 0.94 | % | | | 0.91 | % | | | 0.90 | % | | | 0.92 | % | | | 0.99 | % |
Net expenses | | | 0.80 | % | | | 0.80 | % | | | 0.80 | % | | | 0.80 | % | | | 0.79 | % | | | 0.84 | % |
Net investment income | | | 5.18 | % | | | 5.31 | % | | | 5.57 | % | | | 6.37 | % | | | 6.73 | % | | | 7.78 | % |
Supplemental data | | | | | | | | | | | | | | | | | | | | | | | | |
Portfolio turnover rate | | | 25 | % | | | 46 | % | | | 60 | % | | | 22 | % | | | 78 | % | | | 11 | % |
Net assets, end of period (000s omitted) | | | $84,124 | | | | $100,159 | | | | $64,626 | | | | $33,395 | | | | $14,654 | | | | $10 | |
| 1 | For the period from July 30, 2010 (commencement of class operations) to August 31, 2010 |
| 2 | Returns for periods of less than one year are not annualized. |
The accompanying notes are an integral part of these financial statements.
| | | | | | |
| Financial highlights | | Wells Fargo Advantage High Income Fund | | | 21 | |
(For a share outstanding throughout each period)
| | | | | | | | | | | | | | | | | | | | | | | | | | | | |
| | | Six months ended
February 28, 2015
(unaudited) | | | Year ended August 31 | | | Year ended
May 31, 2010 | |
| INSTITUTIONAL CLASS | | | 2014 | | | 2013 | | | 2012 | | | 2011 | | | 20101 | | |
Net asset value, beginning of period | | | $7.49 | | | | $7.57 | | | | $7.70 | | | | $7.24 | | | | $7.20 | | | | $6.96 | | | | $6.40 | |
Net investment income | | | 0.19 | | | | 0.43 | | | | 0.46 | | | | 0.50 | | | | 0.54 | | | | 0.14 | | | | 0.57 | |
Net realized and unrealized gains (losses) on investments | | | (0.33 | ) | | | 0.22 | | | | (0.09 | ) | | | 0.46 | | | | 0.04 | | | | 0.24 | | | | 0.54 | |
| | | | | | | | | | | | | | | | | | | | | | | | | | | | |
Total from investment operations | | | (0.14 | ) | | | 0.65 | | | | 0.37 | | | | 0.96 | | | | 0.58 | | | | 0.38 | | | | 1.11 | |
Distributions to shareholders from | | | | | | | | | | | | | | | | | | | | | | | | | | | | |
Net investment income | | | (0.19 | ) | | | (0.42 | ) | | | (0.46 | ) | | | (0.50 | ) | | | (0.54 | ) | | | (0.14 | ) | | | (0.55 | ) |
Net realized gains | | | (0.10 | ) | | | (0.31 | ) | | | (0.04 | ) | | | 0.00 | | | | 0.00 | | | | 0.00 | | | | 0.00 | |
| | | | | | | | | | | | | | | | | | | | | | | | | | | | |
Total distributions to shareholders | | | (0.29 | ) | | | (0.73 | ) | | | (0.50 | ) | | | (0.50 | ) | | | (0.54 | ) | | | (0.14 | ) | | | (0.55 | ) |
Net asset value, end of period | | | $7.06 | | | | $7.49 | | | | $7.57 | | | | $7.70 | | | | $7.24 | | | | $7.20 | | | | $6.96 | |
Total return2 | | | (1.78 | )% | | | 9.01 | % | | | 4.85 | % | | | 13.69 | % | | | 7.98 | % | | | 5.52 | % | | | 17.76 | % |
Ratios to average net assets (annualized) | | | | | | | | | | | | | | | | | | | | | | | | | | | | |
Gross expenses | | | 0.68 | % | | | 0.68 | % | | | 0.66 | % | | | 0.67 | % | | | 0.68 | % | | | 0.67 | % | | | 0.68 | % |
Net expenses | | | 0.50 | % | | | 0.50 | % | | | 0.50 | % | | | 0.50 | % | | | 0.50 | % | | | 0.50 | % | | | 0.50 | % |
Net investment income | | | 5.47 | % | | | 5.65 | % | | | 5.92 | % | | | 6.69 | % | | | 7.15 | % | | | 7.94 | % | | | 8.18 | % |
Supplemental data | | | | | | | | | | | | | | | | | | | | | | | | | | | | |
Portfolio turnover rate | | | 25 | % | | | 46 | % | | | 60 | % | | | 22 | % | | | 78 | % | | | 11 | % | | | 77 | % |
Net assets, end of period (000s omitted) | | | $147,501 | | | | $123,288 | | | | $217,648 | | | | $302,894 | | | | $238,490 | | | | $197,158 | | | | $189,936 | |
| 1 | For the three months ended August 31, 2010. The Fund changed its fiscal year end from May 31 to August 31, effective August 31, 2010. |
| 2 | Returns for periods of less than one year are not annualized. |
The accompanying notes are an integral part of these financial statements.
| | | | |
| 22 | | Wells Fargo Advantage High Income Fund | | Financial highlights |
(For a share outstanding throughout each period)
| | | | | | | | | | | | | | | | | | | | | | | | | | | | |
| | | Six months ended
February 28, 2015
(unaudited) | | | Year ended August 31 | | | Year ended
May 31, 2010 | |
| INVESTOR CLASS | | | 2014 | | | 2013 | | | 2012 | | | 2011 | | | 20101 | | |
Net asset value, beginning of period | | | $7.45 | | | | $7.53 | | | | $7.66 | | | | $7.20 | | | | $7.16 | | | | $6.93 | | | | $6.37 | |
Net investment income | | | 0.18 | | | | 0.39 | | | | 0.42 | | | | 0.47 | | | | 0.50 | | | | 0.13 | | | | 0.53 | |
Net realized and unrealized gains (losses) on investments | | | (0.33 | ) | | | 0.23 | | | | (0.09 | ) | | | 0.46 | | | | 0.04 | | | | 0.23 | | | | 0.55 | |
| | | | | | | | | | | | | | | | | | | | | | | | | | | | |
Total from investment operations | | | (0.15 | ) | | | 0.62 | | | | 0.33 | | | | 0.93 | | | | 0.54 | | | | 0.36 | | | | 1.08 | |
Distributions to shareholders from | | | | | | | | | | | | | | | | | | | | | | | | | | | | |
Net investment income | | | (0.18 | ) | | | (0.39 | ) | | | (0.42 | ) | | | (0.47 | ) | | | (0.50 | ) | | | (0.13 | ) | | | (0.52 | ) |
Net realized gains | | | (0.10 | ) | | | (0.31 | ) | | | (0.04 | ) | | | 0.00 | | | | 0.00 | | | | 0.00 | | | | 0.00 | |
| | | | | | | | | | | | | | | | | | | | | | | | | | | | |
Total distributions to shareholders | | | (0.28 | ) | | | (0.70 | ) | | | (0.46 | ) | | | (0.47 | ) | | | (0.50 | ) | | | (0.13 | ) | | | (0.52 | ) |
Net asset value, end of period | | | $7.02 | | | | $7.45 | | | | $7.53 | | | | $7.66 | | | | $7.20 | | | | $7.16 | | | | $6.93 | |
Total return2 | | | (2.02 | )% | | | 8.56 | % | | | 4.40 | % | | | 13.24 | % | | | 7.53 | % | | | 5.27 | % | | | 17.28 | % |
Ratios to average net assets (annualized) | | | | | | | | | | | | | | | | | | | | | | | | | | | | |
Gross expenses | | | 1.04 | % | | | 1.03 | % | | | 1.01 | % | | | 1.03 | % | | | 1.04 | % | | | 1.04 | % | | | 1.07 | % |
Net expenses | | | 0.93 | % | | | 0.93 | % | | | 0.93 | % | | | 0.93 | % | | | 0.93 | % | | | 0.94 | % | | | 0.95 | % |
Net investment income | | | 5.04 | % | | | 5.19 | % | | | 5.48 | % | | | 6.27 | % | | | 6.73 | % | | | 7.49 | % | | | 7.76 | % |
Supplemental data | | | | | | | | | | | | | | | | | | | | | | | | | | | | |
Portfolio turnover rate | | | 25 | % | | | 46 | % | | | 60 | % | | | 22 | % | | | 78 | % | | | 11 | % | | | 77 | % |
Net assets, end of period (000s omitted) | | | $226,720 | | | | $292,677 | | | | $314,420 | | | | $343,752 | | | | $278,024 | | | | $322,015 | | | | $286,836 | |
| 1 | For the three months ended August 31, 2010. The Fund changed its fiscal year end from May 31 to August 31, effective August 31, 2010. |
| 2 | Returns for periods of less than one year are not annualized. |
The accompanying notes are an integral part of these financial statements.
| | | | | | |
| Notes to financial statements (unaudited) | | Wells Fargo Advantage High Income Fund | | | 23 | |
1. ORGANIZATION
Wells Fargo Funds Trust (the “Trust”), a Delaware statutory trust organized on March 10, 1999, is an open-end management investment company registered under the Investment Company Act of 1940, as amended (the “1940 Act”). As an investment company, the Trust follows the accounting and reporting guidance in Financial Accounting Standards Board (“FASB”) Accounting Standards Codification Topic 946, Financial Services—Investment Companies. These financial statements report on the Wells Fargo Advantage High Income Fund (the “Fund”) which is a diversified series of the Trust.
2. SIGNIFICANT ACCOUNTING POLICIES
The following significant accounting policies, which are consistently followed in the preparation of the financial statements of the Fund, are in conformity with U.S. generally accepted accounting principles which require management to make estimates and assumptions that affect the reported amounts of assets and liabilities, disclosure of contingent assets and liabilities at the date of the financial statements, and the reported amounts of revenues and expenses during the reporting period. Actual results could differ from those estimates.
Securities valuation
All investments are valued each business day as of the close of regular trading on the New York Stock Exchange (generally 4 p.m. Eastern Time).
Debt securities are valued at the evaluated bid price provided by an independent pricing service or, if a reliable price is not available, the quoted bid price from an independent broker-dealer.
Futures that are listed on a foreign or domestic exchange or market are valued at the official closing price or, if none, the last sales price.
Investments in registered open-end investment companies are valued at net asset value. Interests in non-registered investment vehicles that are redeemable at net asset value are fair valued at net asset value when available.
Investments which are not valued using any of the methods discussed above are valued at their fair value, as determined in good faith by the Board of Trustees of the Fund. The Board of Trustees has established a Valuation Committee comprised of the Trustees and has delegated to it the authority to take any actions regarding the valuation of portfolio securities that the Valuation Committee deems necessary or appropriate, including determining the fair value of portfolio securities, unless the determination has been delegated to the Management Valuation Team of Wells Fargo Funds Management, LLC (“Funds Management”). The Board of Trustees retains the authority to make or ratify any valuation decisions or approve any changes to the Valuation Procedures as it deems appropriate. On a quarterly basis, the Board of Trustees receives reports on any valuation actions taken by the Valuation Committee or the Management Valuation Team which may include items for ratification.
Valuations of fair valued securities are compared to the next actual sales price when available, or other appropriate market values, to assess the continued appropriateness of the fair valuation methodologies used. These securities are fair valued on a day-to-day basis, taking into consideration changes to appropriate market information and any significant changes to the inputs considered in the valuation process until there is a readily available price provided on an exchange or by an independent pricing service. Valuations received from an independent pricing service or independent broker-dealer quotes are periodically validated by comparisons to most recent trades and valuations provided by other independent pricing services in addition to the review of prices by the adviser and/or subadviser. Unobservable inputs used in determining fair valuations are identified based on the type of security, taking into consideration factors utilized by market participants in valuing the investment, knowledge about the issuer and the current market environment.
Security loans
The Fund may lend its securities from time to time in order to earn additional income in the form of fees or interest on securities received as collateral or the investment of any cash received as collateral. The Fund continues to receive interest or dividends on the securities loaned. The Fund receives collateral in the form of cash or securities with a value at least equal to the value of the securities on loan. The value of the loaned securities is determined at the close of each business day and any additional required collateral is delivered to the Fund on the next business day. In a securities lending transaction, the net asset value of the Fund will be affected by an increase or decrease in the value of the securities loaned and by an increase or decrease in the value of the instrument in which collateral is invested. The amount of securities lending activity undertaken by the Fund fluctuates from time to time. In the event of default or bankruptcy by the borrower, the Fund may be prevented from recovering the loaned securities or gaining access to the collateral or may experience delays or costs in doing so. In addition, the investment of any cash collateral received may lose all or part of its value. The Fund has the right under the lending agreement to recover the securities from the borrower on demand.
| | | | |
| 24 | | Wells Fargo Advantage High Income Fund | | Notes to financial statements (unaudited) |
The Fund lends its securities through an unaffiliated securities lending agent. Cash collateral received in connection with its securities lending transactions is invested in Securities Lending Cash Investments, LLC (the “Securities Lending Fund”). The Securities Lending Fund is exempt from registration under Section 3(c)(7) of the 1940 Act and is managed by Funds Management and is subadvised by Wells Capital Management Incorporated (“WellsCap”). Funds Management receives an advisory fee starting at 0.05% and declining to 0.01% as the average daily net assets of the Securities Lending Fund increase. All of the fees received by Funds Management are paid to WellsCap for its services as subadviser. The Securities Lending Fund seeks to provide a positive return compared to the daily Fed Funds Open rate by investing in high-quality, U.S. dollar-denominated short-term money market instruments. Securities Lending Fund investments are fair valued based upon the amortized cost valuation technique. Income earned from investment in the Securities Lending Fund is included in securities lending income on the Statement of Operations.
When-issued transactions
The Fund may purchase securities on a forward commitment or when-issued basis. The Fund records a when-issued transaction on the trade date and will segregate assets in an amount at least equal in value to the Fund’s commitment to purchase when-issued securities. Securities purchased on a when-issued basis are marked-to-market daily and the Fund begins earning interest on the settlement date. Losses may arise due to changes in the market value of the underlying securities or if the counterparty does not perform under the contract.
Loans
The Fund may invest in direct debt instruments which are interests in amounts owed to lenders by corporate or other borrowers. The loans pay interest at rates which are periodically reset by reference to a base lending rate plus a spread. Investments in loans may be in the form of participations in loans or assignments of all or a portion of loans from third parties. When the Fund purchases participations, it generally has no rights to enforce compliance with terms of the loan agreement with the borrower. As a result, the Fund assumes the credit risk of both the borrower and the lender that is selling the participation. When the Fund purchases assignments from lenders, it acquires direct rights against the borrower on the loan and may enforce compliance by the borrower with the terms of the loan agreement. Loans may include fully funded term loans or unfunded loan commitments, which are contractual obligations for future funding.
Futures contracts
The Fund is subject to interest rate risk in the normal course of pursuing its investment objectives. The Fund may buy and sell futures contracts in order to gain exposure to, or protect against, changes in security values and interest rates. The primary risks associated with the use of futures contracts are the imperfect correlation between changes in market values of securities held by the Fund and the prices of futures contracts, and the possibility of an illiquid market.
The aggregate principal amounts of the contracts are not recorded in the financial statements. Fluctuations in the value of the contracts are recorded in the Statement of Assets and Liabilities as an asset or liability and in the Statement of Operations as unrealized gains or losses until the contracts are closed, at which point they are recorded as net realized gains or losses on futures contracts. With futures contracts, there is minimal counterparty risk to the Fund since futures are exchange traded and the exchange’s clearinghouse, as counterparty to all exchange traded futures, guarantees the futures against default.
Security transactions and income recognition
Securities transactions are recorded on a trade date basis. Realized gains or losses are recorded on the basis of identified cost.
Interest income is accrued daily and bond discounts are accreted and premiums are amortized daily based on the effective interest method. To the extent debt obligations are placed on non-accrual status, any related interest income may be reduced by writing off interest receivables when the collection of all or a portion of interest has become doubtful based on consistently applied procedures. If the issuer subsequently resumes interest payments or when the collectability of interest is reasonably assured, the debt obligation is removed from non-accrual status.
Distributions to shareholders
Distributions to shareholders from net investment income are accrued daily and paid monthly. Distributions from net realized gains, if any, are recorded on the ex-dividend date. Such distributions are determined in conformity with federal income tax regulations, which may differ in amount or character from net investment income and realized gains recognized for purposes of U.S. generally accepted accounting principles.
Federal and other taxes
The Fund intends to continue to qualify as a regulated investment company by distributing substantially all of its investment company taxable income and any net realized capital gains (after reduction for capital loss carryforwards) sufficient to relieve it from all, or substantially all, federal income taxes. Accordingly, no provision for federal income taxes was required.
| | | | | | |
| Notes to financial statements (unaudited) | | Wells Fargo Advantage High Income Fund | | | 25 | |
The Fund’s income and federal excise tax returns and all financial records supporting those returns for the prior three fiscal years are subject to examination by the federal and Delaware revenue authorities. Management has analyzed the Fund’s tax positions taken on federal, state, and foreign tax returns for all open tax years and does not believe that there are any uncertain tax positions that require recognition of a tax liability.
Class allocations
The separate classes of shares offered by the Fund differ principally in applicable sales charges, distribution, shareholder servicing, and administration fees. Class specific expenses are charged directly to that share class. Investment income, common expenses, and realized and unrealized gains (losses) on investments are allocated daily to each class of shares based on the relative proportion of net assets of each class.
3. FAIR VALUATION MEASUREMENTS
Fair value measurements of investments are determined within a framework that has established a fair value hierarchy based upon the various data inputs utilized in determining the value of the Fund’s investments. The three-level hierarchy gives the highest priority to unadjusted quoted prices in active markets for identical assets or liabilities (Level 1) and the lowest priority to significant unobservable inputs (Level 3). The Fund’s investments are classified within the fair value hierarchy based on the lowest level of input that is significant to the fair value measurement. The inputs are summarized into three broad levels as follows:
| n | | Level 1 – quoted prices in active markets for identical securities |
| n | | Level 2 – other significant observable inputs (including quoted prices for similar securities, interest rates, prepayment speeds, credit risk, use of amortized cost, etc.) |
| n | | Level 3 – significant unobservable inputs (including the Fund’s own assumptions in determining the fair value of investments) |
The inputs or methodologies used for valuing investments in securities are not necessarily an indication of the risk associated with investing in those securities.
The following is a summary of the inputs used in valuing the Fund’s assets and liabilities as of February 28, 2015:
| | | | | | | | | | | | | | | | |
| | | Quoted prices
(Level 1) | | | Other significant
observable inputs
(Level 2) | | | Significant
unobservable inputs
(Level 3) | | | Total | |
Assets | | | | | | | | | | | | | | | | |
Investments in: | | | | | | | | | | | | | | | | |
| | | | |
Corporate bonds and notes | | $ | 0 | | | $ | 401,349,822 | | | $ | 0 | | | $ | 401,349,822 | |
| | | | |
Loans | | | 0 | | | | 37,367,511 | | | | 0 | | | | 37,367,511 | |
| | | | |
Municipal obligations | | | 0 | | | | 6,023,370 | | | | 0 | | | | 6,023,370 | |
| | | | |
Yankee corporate bonds and notes | | | 0 | | | | 54,331,179 | | | | 0 | | | | 54,331,179 | |
| | | | |
Short-term investments | | | | | | | | | | | | | | | | |
Investment companies | | | 39,100,567 | | | | 15,556,625 | | | | 0 | | | | 54,657,192 | |
U.S. Treasury securities | | | 799,994 | | | | 0 | | | | 0 | | | | 799,994 | |
Total assets | | $ | 39,900,561 | | | $ | 514,628,507 | | | $ | 0 | | | $ | 554,529,068 | |
Liabilities | | | | | | | | | | | | | | | | |
| | | | |
Futures contracts | | $ | 39,000 | | | $ | 0 | | | $ | 0 | | | $ | 39,000 | |
Total liabilities | | $ | 39,000 | | | $ | 0 | | | $ | 0 | | | $ | 39,000 | |
Futures contracts are reported at their variation margin at measurement date, which represents the amount due from the Fund at that date. All other assets and liabilities are reported at their market value at measurement date.
The Fund recognizes transfers between levels within the fair value hierarchy at the end of the reporting period. At February 28, 2015, the Fund did not have any transfers into/out of Level 1, Level 2, or Level 3.
| | | | |
| 26 | | Wells Fargo Advantage High Income Fund | | Notes to financial statements (unaudited) |
4. TRANSACTIONS WITH AFFILIATES
Advisory fee
The Trust has entered into an advisory contract with Funds Management, an indirect wholly owned subsidiary of Wells Fargo & Company (“Wells Fargo”). The adviser is responsible for implementing investment policies and guidelines and for supervising the subadviser, who is responsible for day-to-day portfolio management of the Fund.
Pursuant to the contract, Funds Management is entitled to receive an annual advisory fee starting at 0.50% and declining to 0.40% as the average daily net assets of the Fund increase. For the six months ended February 28, 2015, the advisory fee was equivalent to an annual rate of 0.50% of the Fund’s average daily net assets.
Funds Management has retained the services of a subadviser to provide daily portfolio management to the Fund. The fee for subadvisory services is borne by Funds Management. WellsCap, an affiliate of Funds Management and an indirect wholly owned subsidiary of Wells Fargo, is the subadviser to the Fund and is entitled to receive a fee from Funds Management at an annual rate starting at 0.35% and declining to 0.20% as the average daily net assets of the Fund increase.
Administration fees
The Trust has entered into an administration agreement with Funds Management. Under this agreement, for providing administrative services, which includes paying fees and expenses for services provided by the transfer agent, sub-transfer agents, omnibus account servicers and record-keepers, Funds Management is entitled to receive from the Fund an annual fund level administration fee starting at 0.05% and declining to 0.03% as the average daily net assets of the Fund increase and a class level administration fee which is calculated based on the average daily net assets of each class as follows:
| | | | |
| | | Class level
administration fee | |
Class A, Class B, Class C | | | 0.16 | % |
Administrator Class | | | 0.10 | |
Institutional Class | | | 0.08 | |
Investor Class | | | 0.19 | |
Funds Management has contractually waived and/or reimbursed advisory and administration fees to the extent necessary to maintain certain net operating expense ratios for the Fund. Waiver of fees and/or reimbursement of expenses by Funds Management were made first from fund level expenses on a proportionate basis and then from class specific expenses. Funds Management has committed through December 31, 2015 to waive fees and/or reimburse expenses to the extent necessary to cap the Fund’s expenses at 0.90% for Class A shares, 1.65% for Class B shares, 1.65% for Class C shares, 0.80% for Administrator Class shares, 0.50% for Institutional Class shares, and 0.93% for Investor Class shares. After this time, the cap may be increased or the commitment to maintain the cap may be terminated only with the approval of the Board of Trustees.
Distribution fees
The Trust has adopted a Distribution Plan for Class B and Class C shares of the Fund pursuant to Rule 12b-1 under the 1940 Act. Distribution fees are charged to Class B and Class C shares and paid to Wells Fargo Funds Distributor, LLC (“Funds Distributor”), the principal underwriter, at an annual rate of 0.75% of the average daily net assets of Class B and Class C shares.
In addition, Funds Distributor is entitled to receive the front-end sales charge from the purchase of Class A shares and a contingent deferred sales charge on the redemption of certain shares. Funds Distributor is also entitled to receive the contingent deferred sales charges from redemptions of Class B and Class C shares. For the six months ended February 28, 2015, Funds Distributor received $2,103 from the sale of Class A.
Shareholder servicing fees
The Trust has entered into contracts with one or more shareholder servicing agents, whereby Class A, Class B, Class C, Administrator Class, and Investor Class of the Fund is charged a fee at an annual rate of 0.25% of the average daily net assets of each respective class.
A portion of these total shareholder servicing fees were paid to affiliates of Wells Fargo.
| | | | | | |
| Notes to financial statements (unaudited) | | Wells Fargo Advantage High Income Fund | | | 27 | |
5. INVESTMENT PORTFOLIO TRANSACTIONS
Purchases and sales of investments, excluding U.S. government obligations (if any) and short-term securities, for the six months ended February 28, 2015 were $129,703,226 and $173,022,225, respectively.
6. DERIVATIVE TRANSACTIONS
During the six months ended February 28, 2015, the Fund entered into futures contracts to speculate on interest rates and to help manage the duration of the portfolio.
At February 28, 2015, the Fund had short futures contracts outstanding as follows:
| | | | | | | | | | | | | | | | |
| Expiration date | | Counterparty | | Contracts | | Type | | | Contract value at
February 28, 2015 | | | Unrealized
losses | |
6-30-2015 | | JPMorgan | | 312 Short | | | 5-Year U.S. Treasury Notes | | | $ | 37,215,750 | | | $ | (83,468 | ) |
The Fund had an average notional amount of $37,235,704 in short futures contracts during the six months ended February 28, 2015.
On February 28, 2015, the cumulative unrealized losses on futures contracts in the amount of $83,468 are reflected in net unrealized gains on investments on the Statement of Assets and Liabilities. The payable for daily variation margin on open futures contracts reflected in the Statement of Assets and Liabilities only represents the current day’s variation margin. The realized losses and change in unrealized gains (losses) on futures contracts are reflected in the Statement of Operations.
For certain types of derivative transactions, the Fund has entered into International Swaps and Derivatives Association, Inc. master agreements (“ISDA Master Agreements”) or similar agreements with approved counterparties. The ISDA Master Agreements or similar agreements may have requirements to deliver/deposit securities or cash to/with an exchange or broker-dealer as collateral and allows the Fund to offset, with each counterparty, certain derivative financial instrument’s assets and/or liabilities with collateral held or pledged. Collateral requirements differ by type of derivative. Collateral or margin requirements are set by the broker or exchange clearing house for exchange traded derivatives while collateral terms are contract specific for over-the-counter traded derivatives. Cash collateral that has been pledged to cover obligations of the Fund under ISDA Master Agreements or similar agreements, if any, will be reported separately in the Statement of Assets and Liabilities. Securities pledged as collateral, if any, for the same purpose are noted in the Portfolio of Investments. With respect to balance sheet offsetting, absent an event of default by the counterparty or a termination of the agreement, the reported amounts of financial assets and financial liabilities in the Statement of Assets and Liabilities are not offset across transactions between the Fund and the applicable counterparty. A reconciliation of the gross amounts on the Statement of Assets and Liabilities to the net amounts by derivative type, including any collateral exposure, is as follows:
| | | | | | | | | | | | | | | | |
| Derivative type | | Counterparty | | Gross amounts
of liabilities in the
Statement of
Assets and
Liabilities | | Amounts
subject to
netting
agreements | | | Collateral
pledged1 | | | Net amount
of liabilities | |
Futures – variation margin | | JPMorgan | | $39,000 | | $ | 0 | | | $ | (39,000 | ) | | $ | 0 | |
| | 1 | Collateral pledged within this table is limited to the collateral for the net transaction with the counterparty. | |
7. BANK BORROWINGS
The Trust (excluding the money market funds and certain other funds in the Trust) and Wells Fargo Variable Trust are parties to a $150,000,000 revolving credit agreement whereby the Fund is permitted to use bank borrowings for temporary or emergency purposes, such as to fund shareholder redemption requests. Interest under the credit agreement is charged to the Fund based on a borrowing rate equal to the higher of the Federal Funds rate in effect on that day plus 1.25% or the overnight LIBOR rate in effect on that day plus 1.25%. In addition, an annual commitment fee equal to 0.10% of the unused balance is allocated to each participating fund. For the six months ended February 28, 2015, the Fund paid $557 in commitment fees.
For the six months ended February 28, 2015, there were no borrowings by the Fund under the agreement.
| | | | |
| 28 | | Wells Fargo Advantage High Income Fund | | Notes to financial statements (unaudited) |
8. INDEMNIFICATION
Under the Trust’s organizational documents, the officers and Trustees are indemnified against certain liabilities that may arise out of performance of their duties to the Trust. Additionally, in the normal course of business, the Trust may enter into contracts with service providers that contain a variety of indemnification clauses. The Trust’s maximum exposure under these arrangements is dependent on future claims that may be made against the Fund and, therefore, cannot be estimated.
| | | | | | |
| Other information (unaudited) | | Wells Fargo Advantage High Income Fund | | | 29 | |
PROXY VOTING INFORMATION
A description of the policies and procedures that the Fund uses to determine how to vote proxies relating to portfolio securities is available, upon request, by calling 1-800-222-8222, visiting our website at wellsfargoadvantagefunds.com, or visiting the SEC website at sec.gov. Information regarding how the Fund voted proxies relating to portfolio securities during the most recent 12-month period ended June 30 is available on the Fund’s website at wellsfargoadvantagefunds.com or by visiting the SEC website at sec.gov.
PORTFOLIO HOLDINGS INFORMATION
The complete portfolio holdings for the Fund are publicly available monthly on the Fund’s website (wellsfargoadvantagefunds.com), on a one-month delayed basis. In addition, top ten holdings information (excluding derivative positions) for the Fund is publicly available on the Fund’s website on a monthly, seven-day or more delayed basis. The Fund files its complete schedule of portfolio holdings with the SEC for the first and third quarters of each fiscal year on Form N-Q, which is available by visiting the SEC website at sec.gov. In addition, the Fund’s Form N-Q may be reviewed and copied at the SEC’s Public Reference Room in Washington, DC, and at regional offices in New York City, at 233 Broadway, and in Chicago, at 175 West Jackson Boulevard, Suite 900. Information about the Public Reference Room may be obtained by calling 1-800-SEC-0330.
| | | | |
| 30 | | Wells Fargo Advantage High Income Fund | | Other information (unaudited) |
BOARD OF TRUSTEES AND OFFICERS
Each of the Trustees and Officers1 listed in the table below acts in identical capacities for each fund in the Wells Fargo Advantage family of funds, which consists of 134 mutual funds comprising the Wells Fargo Funds Trust, Wells Fargo Variable Trust, Wells Fargo Master Trust and four closed-end funds (collectively the “Fund Complex”). This table should be read in conjunction with the Prospectus and the Statement of Additional Information2. The mailing address of each Trustee and Officer is 525 Market Street, 12th Floor, San Francisco, CA 94105. Each Trustee and Officer serves an indefinite term, however, each Trustee serves such term until reaching the mandatory retirement age established by the Trustees.
Independent Trustees
| | | | | | |
Name and
year of birth | | Position held and
length of service* | | Principal occupations during past five years or longer | | Other
directorships during
past five years |
| William R. Ebsworth (Born 1957) | | Trustee, since 2015** | | Retired. From 1984 to 2013, equities analyst, portfolio manager, research director at Fidelity Management and Research Company and retired in 2013 as Chief Investment Officer of Fidelity Strategic Advisers, Inc. in Boston, Tokyo, and Hong Kong where he led a team of investment professionals managing client assets. Prior thereto, Board member of Hong Kong Securities Clearing Co., Hong Kong Options Clearing Corp., the Thailand International Fund, Ltd., Fidelity Investments Life Insurance Company, and Empire Fidelity Investments Life Insurance Company. Mr. Ebsworth is an Adjunct Lecturer, Finance, at Babson College and a Chartered Financial Analyst. | | Asset Allocation Trust |
| Jane A. Freeman (Born 1953) | | Trustee, since 2015** | | Retired. From 2012 to 2014 and 1999 to 2008, Chief Financial Officer of Scientific Learning Corporation. From 2008 to 2012, Ms. Freeman provided consulting services related to strategic business projects. Prior thereto, Portfolio Manager at Rockefeller & Co. and Scudder, Stevens & Clark. Board member of the Harding Loevner Funds from 1996 to 2014, serving as both Lead Independent Director and chair of the Audit Committee. Board member of the Russell Exchange Traded Funds Trust from 2011 to 2012 and the chair of the Audit Committee. Ms. Freeman is a Chartered Financial Analyst (inactive), Chair of Taproot Foundation (non-profit organization) and a Board Member of Ruth Bancroft Garden (non-profit organization). | | Asset Allocation Trust |
| Peter G. Gordon (Born 1942) | | Trustee, since 1998; Chairman, since 2005 | | Co-Founder, Retired Chairman, President and CEO of Crystal Geyser Water Company. Trustee Emeritus, Colby College. | | Asset Allocation Trust |
| Isaiah Harris, Jr. (Born 1952) | | Trustee, since 2009 | | Retired. Chairman of the Board of CIGNA Corporation since 2009, and Director since 2005. From 2003 to 2011, Director of Delux Corporation. Prior thereto, President and CEO of BellSouth Advertising and Publishing Corp. from 2005 to 2007, President and CEO of BellSouth Enterprises from 2004 to 2005 and President of BellSouth Consumer Services from 2000 to 2003. Emeritus member of the Iowa State University Foundation Board of Governors. Emeritus Member of the Advisory Board of Iowa State University School of Business. Advisory Board Member, Palm Harbor Academy. Mr. Harris is a certified public accountant. | | CIGNA Corporation; Asset Allocation Trust |
| Judith M. Johnson (Born 1949) | | Trustee, since 2008; Audit Committee Chairman, since 2008 | | Retired. Prior thereto, Chief Executive Officer and Chief Investment Officer of Minneapolis Employees Retirement Fund from 1996 to 2008. Ms. Johnson is an attorney, certified public accountant and a certified managerial accountant. | | Asset Allocation Trust |
| David F. Larcker (Born 1950) | | Trustee, since 2009 | | James Irvin Miller Professor of Accounting at the Graduate School of Business, Stanford University, Morgan Stanley Director of the Center for Leadership Development and Research and Senior Faculty of The Rock Center for Corporate Governance since 2006. From 2005 to 2008, Professor of Accounting at the Graduate School of Business, Stanford University. Prior thereto, Ernst & Young Professor of Accounting at The Wharton School, University of Pennsylvania from 1985 to 2005. | | Asset Allocation Trust |
| Olivia S. Mitchell (Born 1953) | | Trustee, since 2006 | | International Foundation of Employee Benefit Plans Professor, Wharton School of the University of Pennsylvania since 1993. Director of Wharton’s Pension Research Council and Boettner Center on Pensions & Retirement Research, and Research Associate at the National Bureau of Economic Research. Previously, Cornell University Professor from 1978 to 1993. | | Asset Allocation Trust |
| | | | | | |
| Other information (unaudited) | | Wells Fargo Advantage High Income Fund | | | 31 | |
| | | | | | |
Name and
year of birth | | Position held and
length of service* | | Principal occupations during past five years or longer | | Other
directorships during
past five years |
| Timothy J. Penny (Born 1951) | | Trustee, since 1996 | | President and Chief Executive Officer of Southern Minnesota Initiative Foundation, a non-profit organization, since 2007 and Senior Fellow at the Humphrey Institute Policy Forum at the University of Minnesota since 1995. Member of the Board of Trustees of NorthStar Education Finance, Inc., a non-profit organization, since 2007. | | Asset Allocation Trust |
| Michael S. Scofield (Born 1943) | | Trustee, since 2010 | | Served on the Investment Company Institute’s Board of Governors and Executive Committee from 2008-2011 as well the Governing Council of the Independent Directors Council from 2006-2011 and the Independent Directors Council Executive Committee from 2008-2011. Chairman of the IDC from 2008-2010. Institutional Investor (Fund Directions) Trustee of Year in 2007. Trustee of the Evergreen Funds complex (and its predecessors) from 1984 to 2010. Chairman of the Evergreen Funds from 2000-2010. Former Trustee of the Mentor Funds. Retired Attorney, Law Offices of Michael S. Scofield. | | Asset Allocation Trust |
| Donald C. Willeke (Born 1940) | | Trustee, since 1996 | | Principal of the law firm of Willeke & Daniels. General Counsel of the Minneapolis Employees Retirement Fund from 1984 until its consolidation into the Minnesota Public Employees Retirement Association on June 30, 2010. Director and Vice Chair of The Tree Trust (non-profit corporation). Director of the American Chestnut Foundation (non-profit corporation). | | Asset Allocation Trust |
| * | Length of service dates reflect the Trustee’s commencement of service with the Trust’s predecessor entities, where applicable. |
| ** | William R. Ebsworth and Jane A. Freeman each became a Trustee effective January 1, 2015. |
Officers
| | | | | | |
Name and
year of birth | | Position held and
length of service | | Principal occupations during past five years or longer | | |
| Karla M. Rabusch (Born 1959) | | President, since 2003 | | Executive Vice President of Wells Fargo Bank, N.A. and President of Wells Fargo Funds Management, LLC since 2003. | | |
| Nancy Wiser1 (Born 1967) | | Treasurer, since 2012 | | Executive Vice President of Wells Fargo Funds Management, LLC since 2011. Chief Operating Officer and Chief Compliance Officer at LightBox Capital Management LLC, from 2008 to 2011. Owned and operated a consulting business providing services to various hedge funds including acting as Chief Operating Officer and Chief Compliance Officer for a hedge fund from 2007 to 2008. Chief Operating Officer and Chief Compliance Officer of GMN Capital LLC from 2006 to 2007. | | |
| C. David Messman (Born 1960) | | Secretary, since 2000; Chief Legal Officer, since 2003 | | Senior Vice President and Secretary of Wells Fargo Funds Management, LLC since 2001. Assistant General Counsel of Wells Fargo Bank, N.A. since 2013 and Vice President and Managing Counsel of Wells Fargo Bank N.A. from 1996 to 2013. | | |
| Debra Ann Early (Born 1964) | | Chief Compliance Officer, since 2007 | | Senior Vice President of Wells Fargo Funds Management, LLC since 2007 and Chief Compliance Officer from 2007 to 2014. Chief Compliance Officer of Parnassus Investments from 2005 to 2007. Chief Financial Officer of Parnassus Investments from 2004 to 2007 and Senior Audit Manager of PricewaterhouseCoopers LLP from 1998 to 2004. | | |
| David Berardi (Born 1975) | | Assistant Treasurer, since 2009 | | Vice President of Wells Fargo Funds Management, LLC since 2009. Vice President of Evergreen Investment Management Company, LLC from 2008 to 2010. Assistant Vice President of Evergreen Investment Services, Inc. from 2004 to 2008. Manager of Fund Reporting and Control for Evergreen Investment Management Company, LLC from 2004 to 2010. | | |
| Jeremy DePalma1 (Born 1974) | | Assistant Treasurer, since 2009 | | Senior Vice President of Wells Fargo Funds Management, LLC since 2009. Senior Vice President of Evergreen Investment Management Company, LLC from 2008 to 2010. Vice President, Evergreen Investment Services, Inc. from 2004 to 2007. Head of the Fund Reporting and Control Team within Fund Administration from 2005 to 2010. | | |
| 1 | Nancy Wiser acts as Treasurer of 73 funds in the Fund Complex. Jeremy DePalma acts as Treasurer of 61 funds and Assistant Treasurer of 73 funds in the Fund Complex. |
| 2 | The Statement of Additional Information includes additional information about the Trustees and is available, without charge, upon request, by calling 1-800-222-8222 or by visiting the website at wellsfargoadvantagefunds.com. |
| | | | |
| 32 | | Wells Fargo Advantage High Income Fund | | List of abbreviations |
The following is a list of common abbreviations for terms and entities that may have appeared in this report.
| ACA | — ACA Financial Guaranty Corporation |
| ADR | — American depositary receipt |
| ADS | — American depositary shares |
| AGC | — Assured Guaranty Corporation |
| AGM | — Assured Guaranty Municipal |
| Ambac | — Ambac Financial Group Incorporated |
| AMT | — Alternative minimum tax |
| BAN | — Bond anticipation notes |
| BHAC | — Berkshire Hathaway Assurance Corporation |
| CAB | — Capital appreciation bond |
| CCAB | — Convertible capital appreciation bond |
| CDA | — Community Development Authority |
| CDO | — Collateralized debt obligation |
| DRIVER | — Derivative inverse tax-exempt receipts |
| DW&P | — Department of Water & Power |
| DWR | — Department of Water Resources |
| ECFA | — Educational & Cultural Facilities Authority |
| EDA | — Economic Development Authority |
| EDFA | — Economic Development Finance Authority |
| ETF | — Exchange-traded fund |
| FDIC | — Federal Deposit Insurance Corporation |
| FFCB | — Federal Farm Credit Banks |
| FGIC | — Financial Guaranty Insurance Corporation |
| FHA | — Federal Housing Administration |
| FHLB | — Federal Home Loan Bank |
| FHLMC | — Federal Home Loan Mortgage Corporation |
| FICO | — The Financing Corporation |
| FNMA | — Federal National Mortgage Association |
| GDR | — Global depositary receipt |
| GNMA | — Government National Mortgage Association |
| HCFR | — Healthcare facilities revenue |
| HEFA | — Health & Educational Facilities Authority |
| HEFAR | — Higher education facilities authority revenue |
| HFA | — Housing Finance Authority |
| HFFA | — Health Facilities Financing Authority |
| HUD | — Department of Housing and Urban Development |
| IDA | — Industrial Development Authority |
| IDAG | — Industrial Development Agency |
| KRW | — Republic of Korea won |
| LIBOR | — London Interbank Offered Rate |
| LIFER | — Long Inverse Floating Exempt Receipts |
| LLC | — Limited liability company |
| LLLP | — Limited liability limited partnership |
| LLP | — Limited liability partnership |
| MBIA | — Municipal Bond Insurance Association |
| MFHR | — Multifamily housing revenue |
| MSTR | — Municipal securities trust receipts |
| MUD | — Municipal Utility District |
| National | — National Public Finance Guarantee Corporation |
| PCFA | — Pollution Control Financing Authority |
| PCL | — Public Company Limited |
| PCR | — Pollution control revenue |
| PFA | — Public Finance Authority |
| PFFA | — Public Facilities Financing Authority |
| PFOTER | — Puttable floating option tax-exempt receipts |
| plc | — Public limited company |
| PUTTER | — Puttable tax-exempt receipts |
| R&D | — Research & development |
| Radian | — Radian Asset Assurance |
| RAN | — Revenue anticipation notes |
| RDA | — Redevelopment Authority |
| RDFA | — Redevelopment Finance Authority |
| REIT | — Real estate investment trust |
| ROC | — Reset option certificates |
| SAVRS | — Select auction variable rate securities |
| SBA | — Small Business Authority |
| SFHR | — Single-family housing revenue |
| SFMR | — Single-family mortgage revenue |
| SPA | — Standby purchase agreement |
| SPDR | — Standard & Poor’s Depositary Receipts |
| SPEAR | — Short Puttable Exempt Adjustable Receipts |
| STRIPS | — Separate trading of registered interest and |
| TAN | — Tax anticipation notes |
| TIPS | — Treasury inflation-protected securities |
| TRAN | — Tax revenue anticipation notes |
| TTFA | — Transportation Trust Fund Authority |
| TVA | — Tennessee Valley Authority |


For more information
More information about Wells Fargo Advantage Funds is available free upon request. To obtain literature, please write, email, visit the Fund’s website, or call:
Wells Fargo Advantage Funds
P.O. Box 8266
Boston, MA 02266-8266
Email: wfaf@wellsfargo.com
Website: wellsfargoadvantagefunds.com
Individual investors: 1-800-222-8222
Retail investment professionals: 1-888-877-9275
Institutional investment professionals: 1-866-765-0778
This report and the financial statements contained herein are submitted for the general information of the shareholders of Wells Fargo Advantage Funds. If this report is used for promotional purposes, distribution of the report must be accompanied or preceded by a current prospectus. Before investing, please consider the investment objectives, risks, charges, and expenses of the investment. For a current prospectus and, if available, a summary prospectus, containing this information, call 1-800-222-8222 or visit the Fund’s website at wellsfargoadvantagefunds.com. Read the prospectus carefully before you invest or send money.
Wells Fargo Funds Management, LLC, a wholly owned subsidiary of Wells Fargo & Company, provides investment advisory and administrative services for Wells Fargo Advantage Funds. Other affiliates of Wells Fargo & Company provide subadvisory and other services for the Funds. The Funds are distributed by Wells Fargo Funds Distributor, LLC, Member FINRA/SIPC, an affiliate of Wells Fargo & Company.
NOT FDIC INSURED ¡ NO BANK GUARANTEE ¡ MAY LOSE VALUE
© 2015 Wells Fargo Funds Management, LLC. All rights reserved.
| | |
 | | 232054 04-15 SA217/SAR217 02-15 |

Wells Fargo Advantage High Yield Bond Fund

Semi-Annual Report
February 28, 2015

Reduce clutter. Save trees.
Sign up for electronic delivery of prospectuses and shareholder reports at wellsfargo.com/advantagedelivery
Contents
The views expressed and any forward-looking statements are as of February 28, 2015, unless otherwise noted, and are those of the Fund managers and/or Wells Fargo Funds Management, LLC. Discussions of individual securities, or the markets generally, or any Wells Fargo Advantage Fund are not intended as individual recommendations. Future events or results may vary significantly from those expressed in any forward-looking statements; the views expressed are subject to change at any time in response to changing circumstances in the market. Wells Fargo Funds Management, LLC and the Fund disclaim any obligation to publicly update or revise any views expressed or forward-looking statements.
NOT FDIC INSURED ¡ NO BANK GUARANTEE ¡ MAY LOSE VALUE
| | | | |
| 2 | | Wells Fargo Advantage High Yield Bond Fund | | Letter to shareholders (unaudited) |

Karla M. Rabusch
President
Wells Fargo Advantage Funds
Major central banks continued to inject liquidity into global banks and markets through various accommodative monetary policies, including quantitative easing.
Dear Valued Shareholder:
We are pleased to offer you this semi-annual report for the Wells Fargo Advantage High Yield Bond Fund for the six-month period that ended February 28, 2015. The period was marked by low interest rates, a large decline in oil prices, and moderate U.S. economic growth. Investment-grade bonds, as measured by the Barclays U.S. Aggregate Bond Index1, returned 2.25% during the period.
Major central banks continued to provide stimulus.
Major central banks continued to inject liquidity into global banks and markets through various accommodative monetary policies, including quantitative easing. In the U.S., the Federal Reserve (Fed) kept its key interest rate near zero in order to support the economy and the financial system. It ended its quantitative easing program in October 2014 and also set expectations for it to begin normalizing monetary policy with higher target ranges for the federal funds rate in 2015.
Meanwhile, European markets continued to benefit from the European Central Bank’s (ECB’s) willingness to maintain low interest rates. In September 2014, the ECB cut its key rate to a historic low of 0.05%. In addition to its targeted longer-term refinancing operations that are designed to increase bank lending, the ECB said it intends to increase the size of its balance sheet, a result of quantitative easing, by buying eurozone government bonds. In Japan, the Bank of Japan maintained an aggressive monetary program aimed at combating deflation.
U.S. economic growth was moderate, and oil prices plummeted.
Economic growth advanced during the reporting period, the unemployment rate ticked lower to 5.5% as of February 2015, and inflation remained below the Fed’s longer-run objective of a 2% pace. The period was also marked by dramatically lower oil prices, which fell from more than $90 per barrel at the end of August 2014 to below $50 per barrel at the end of February 2015. While lower oil prices benefited consumers of oil products, the lower prices pressured companies within the energy sector.
Longer-dated securities and higher-rated credits were top performers.
Ten-year U.S. Treasury rates declined during the period, from 2.35% at end of August 2014 to 2.03% by the end of February 2015, benefiting both from safe-haven status as well as relative attractiveness to global investors. With the U.S. economy the furthest along its business cycle, the level of interest rates in the U.S. and Europe diverged. The 10-year U.S. Treasury yield was 2.03% at the end of February 2015 compared with 0.30% for 10-year German government yields, 173 basis points (bps; 100 bps equals 1.00%) higher. This was largely attributed to the Fed being closer to eventually increasing interest rates while the ECB potentially needs to further increase, rather than scale back, its amount of accommodation. Further, U.S. economic activity was healthier than Europe’s.
Treasury bonds with maturities greater than 20 years returned more than 10% during the six-month period that ended February 28, 2015, according to the Barclays U.S. Aggregate Bond Index. This was due, in part, to strong demand from overseas investors because yields in Europe and Japan were substantially lower than U.S. yields. In addition, because the dollar strengthened, the returns from Treasuries were even higher for foreign-domiciled investors. Longer-maturity debt across all sectors outperformed shorter-dated securities.
| 1 | The Barclays U.S. Aggregate Bond Index is a broad-based benchmark that measures the investment-grade, U.S. dollar-denominated, fixed-rate taxable bond market, including Treasuries, government-related and corporate securities, MBS (agency fixed-rate and hybrid ARM passthroughs), ABS, and CMBS. You cannot invest directly in an index. |
| | | | | | |
| Letter to shareholders (unaudited) | | Wells Fargo Advantage High Yield Bond Fund | | | 3 | |
Investment-grade corporate bonds returned 2.29% during the six-month reporting period, according to the Barclays U.S. Aggregate Bond Index, and AAA-rated2 bonds had higher returns than BBB-rated bonds. Lower-rated credits, including high yield, underperformed as oil prices fell dramatically. Not only were many energy and mining companies negatively affected, but investor trepidation about weak global growth caused investment-grade spreads to modestly widen while high-yield spreads widened substantially.
Don’t let short-term uncertainty derail long-term investment goals.
Periods of uncertainty can present challenges, but experience has taught us that maintaining long-term investment goals can be an effective way to plan for the future. To help you create a sound strategy based on your personal goals and risk tolerance, Wells Fargo Advantage Funds offers more than 100 mutual funds and other investments spanning a wide range of asset classes and investment styles. Although diversification cannot guarantee an investment profit or prevent losses, we believe it can be an effective way to manage investment risk and potentially smooth out overall portfolio performance. We encourage investors to know their investments and to understand that appropriate levels of risk-taking may unlock opportunities.
Thank you for choosing to invest with Wells Fargo Advantage Funds. We appreciate your confidence in us and remain committed to helping you meet your financial needs. For current information about your fund investments, contact your investment professional, visit our website at wellsfargoadvantagefunds.com, or call us directly at 1-800-222-8222. We are available 24 hours a day, 7 days a week.
Sincerely,

Karla M. Rabusch
President
Wells Fargo Advantage Funds
Periods of uncertainty can present challenges, but experience has taught us that maintaining long-term investment goals can be an effective way to plan for the future.
| 2 | The ratings indicated are from Standard & Poor’s, Moody’s Investors Service, and/or Fitch Ratings Ltd. Standard & Poor’s rates the creditworthiness of bonds from AAA (highest) to D (lowest). Ratings from A to CCC may be modified by the addition of a plus (+) or minus (-) sign to show relative standing within the rating categories. Moody’s rates the creditworthiness of bonds from Aaa (highest) to C (lowest). Ratings Aa to B may be modified by the addition of a number 1 (highest) to 3 (lowest) to show relative standing within the ratings categories. Fitch rates the creditworthiness of bonds from AAA (highest) to D (lowest). |
| | | | |
| 4 | | Wells Fargo Advantage High Yield Bond Fund | | Performance highlights (unaudited) |
Investment objective
The Fund seeks total return, consisting of a high level of current income and capital appreciation.
Adviser
Wells Fargo Funds Management, LLC
Subadviser
Wells Capital Management Incorporated
Portfolio manager
Margaret D. Patel
Average annual total returns1 (%) as of February 28, 2015
| | | | | | | | | | | | | | | | | | | | | | | | | | | | | | | | | | |
| | | | | Including sales charge | | | Excluding sales charge | | | Expense ratios2 (%) | |
| | | Inception date | | 1 year | | | 5 year | | | 10 year | | | 1 year | | | 5 year | | | 10 year | | | Gross | | | Net3 | |
| Class A (EKHAX) | | 1-20-1998 | | | (0.62 | ) | | | 7.02 | | | | 6.06 | | | | 4.18 | | | | 8.01 | | | | 6.53 | | | | 1.03 | | | | 1.03 | |
| Class B (EKHBX)* | | 9-11-1935 | | | (1.60 | ) | | | 6.91 | | | | 5.98 | | | | 3.40 | | | | 7.21 | | | | 5.98 | | | | 1.78 | | | | 1.78 | |
| Class C (EKHCX) | | 1-21-1998 | | | 2.40 | | | | 7.21 | | | | 5.75 | | | | 3.40 | | | | 7.21 | | | | 5.75 | | | | 1.78 | | | | 1.78 | |
| Administrator Class (EKHYX) | | 4-14-1998 | | | – | | | | – | | | | – | | | | 4.42 | | | | 8.26 | | | | 6.79 | | | | 0.97 | | | | 0.80 | |
| Institutional Class (EKHIX) | | 10-31-2014 | | | – | | | | – | | | | – | | | | 4.74 | | | | 8.32 | | | | 6.83 | | | | 0.70 | | | | 0.70 | |
| BofA Merrill Lynch U.S. High Yield Master II Constrained Index4 | | – | | | – | | | | – | | | | – | | | | 2.84 | | | | 9.15 | | | | 7.80 | | | | – | | | | – | |
| * | | Class B shares are closed to investment, except in connection with the reinvestment of any distributions and permitted exchanges. |
Figures quoted represent past performance, which is no guarantee of future results, and do not reflect taxes that a shareholder may pay on fund distributions or the redemption of fund shares. Investment return and principal value of an investment will fluctuate so that an investor’s shares, when redeemed, may be worth more or less than their original cost. Performance shown without sales charges would be lower if sales charges were reflected. Current performance may be lower or higher than the performance data quoted, which assumes the reinvestment of dividends and capital gains. Current month-end performance is available on the Fund’s website, wellsfargoadvantagefunds.com.
Index returns do not include transaction costs associated with buying and selling securities, any mutual fund fees or expenses, or any taxes. It is not possible to invest directly in an index.
For Class A shares, the maximum front-end sales charge is 4.50%. For Class B shares, the maximum contingent deferred sales charge is 5.00%. For Class C shares, the maximum contingent deferred sales charge is 1.00%. Performance including a contingent deferred sales charge assumes the sales charge for the corresponding time period. Administrator Class and Institutional Class shares are sold without a front-end sales charge or contingent deferred sales charge.
Bond values fluctuate in response to the financial condition of individual issuers, general market and economic conditions, and changes in interest rates. Changes in market conditions and government policies may lead to periods of heightened volatility in the bond market and reduced liquidity for certain bonds held by the Fund. In general, when interest rates rise, bond values fall and investors may lose principal value. Interest-rate changes and their impact on the Fund and its share price can be sudden and unpredictable. The use of derivatives may reduce returns and/or increase volatility. High-yield securities have a greater risk of default and tend to be more volatile than higher-rated debt securities. Loans are subject to risks similar to those associated with other below-investment-grade bond investments, such as credit risk (for example, risk of issuer default), below-investment-grade bond risk (for example, risk of greater volatility in value), and risk that the loan may become illiquid or difficult to price. Certain investment strategies tend to increase the total risk of an investment (relative to the broader market). The Fund is exposed to foreign investment risk. Consult the Fund’s prospectus for additional information on these and other risks.
Please see footnotes on page 5.
| | | | | | |
| Performance highlights (unaudited) | | Wells Fargo Advantage High Yield Bond Fund | | | 5 | |
| | | | |
| Ten largest long-term holdings5 (%) as of February 28, 2015 | |
Constellation Brands Incorporated, 4.75%, 11-15-2024 | | | 3.77 | |
Tronox Finance LLC, 6.38%, 8-15-2020 | | | 3.44 | |
CommScope Incorporated, 5.50%, 6-15-2024 | | | 3.43 | |
Endo Finance LLC, 6.00%, 2-1-2025 | | | 2.81 | |
Lear Corporation, 4.75%, 1-15-2023 | | | 2.69 | |
Olin Corporation, 5.50%, 8-15-2022 | | | 2.64 | |
The Hertz Corporation, 6.25%, 10-15-2022 | | | 2.59 | |
Penske Auto Group Incorporated, 5.75, 10-1-2022 | | | 2.50 | |
Rayonier Advanced Materials Products Incorporated, 5.50%, 6-1-2024 | | | 2.50 | |
Seagate HDD (Cayman), 4.75%, 6-1-2023 | | | 2.35 | |
|
| Credit quality6 as of February 28, 2015 |
|
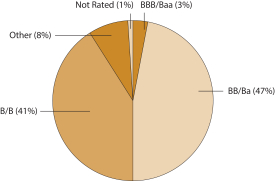 |
| 1 | Historical performance shown for all classes of the Fund prior to July 12, 2010 is based on the performance of the Fund’s predecessor, Evergreen High Income Fund. Historical performance shown for the Institutional Class shares prior to their inception reflects the performance of the Administration Class shares, and is not adjusted to reflect the Institutional Class expenses. If these expenses had been included, returns for the Institutional Class would be higher. |
| 2 | Reflects the expense ratios as stated in the most recent prospectuses. The expense ratios shown are subject to change and may differ from the annualized expense ratios shown in the financial highlights of this report. |
| 3 | The Adviser has committed through December 31, 2015, to waive fees and/or reimburse expenses to the extent necessary to cap the Fund’s Total Annual Fund Operating Expenses After Fee Waiver, excluding certain expenses, at the amounts shown. After this time, the cap may be increased or the commitment to maintain the cap may be terminated only with the approval of the Board of Trustees. Brokerage commissions, stamp duty fees, interest, taxes, acquired fund fees and expenses, and extraordinary expenses are excluded from the cap. Without this cap, the Fund’s returns would have been lower. |
| 4 | The BofA Merrill Lynch U.S. High Yield Master II Constrained Index is a market value-weighted index of all domestic and yankee high-yield bonds, including deferred interest bonds and payment-in kind securities. Issues included in the index have maturities of one year or more and have a credit rating lower than BBB–/Baa3, but are not in default. The BofA Merrill Lynch U.S. High Yield Master II Constrained Index limits any individual issuer to a maximum of 2% benchmark exposure. You cannot invest directly in an index. |
| 5 | The ten largest long-term holdings are calculated based on the value of the securities divided by total net assets of the Fund. Holdings are subject to change and may have changed since the date specified. |
| 6 | The credit quality distribution of portfolio holdings reflected in the chart is based on ratings from Standard & Poor’s, Moody’s Investors Service, and/or Fitch Ratings Ltd. Credit quality ratings apply to the underlying holdings of the Fund and not to the Fund itself. The percentages of the Fund’s portfolio with the ratings depicted in the chart are calculated based on the total market value of fixed income securities held by the Fund. If a security was rated by all three rating agencies, the middle rating was utilized. If rated by two of three rating agencies, the lower rating was utilized, and if rated by one of the rating agencies, that rating was utilized. Standard & Poor’s rates the creditworthiness of bonds, ranging from AAA (highest) to D (lowest). Ratings from A to CCC may be modified by the addition of a plus (+) or minus (-) sign to show relative standing within the rating categories. Standard & Poor’s rates the creditworthiness of short-term notes from SP-1 (highest) to SP-3 (lowest). Moody’s rates the creditworthiness of bonds, ranging from Aaa (highest) to C (lowest). Ratings Aa to B may be modified by the addition of a number 1 (highest) to 3 (lowest) to show relative standing within the ratings categories. Moody’s rates the creditworthiness of short-term U.S. tax-exempt municipal securities from MIG 1/VMIG 1 (highest) to SG (lowest). Fitch rates the creditworthiness of bonds, ranging from AAA (highest) to D (lowest). Credit quality and credit quality ratings are subject to change and may have changed since the date specified. |
| | | | |
| 6 | | Wells Fargo Advantage High Yield Bond Fund | | Fund expenses (unaudited) |
As a shareholder of the Fund, you incur two types of costs: (1) transaction costs, including sales charges (loads) on purchase payments and contingent deferred sales charges (if any) on redemptions and (2) ongoing costs, including management fees, distribution (12b-1) and/or shareholder service fees, and other Fund expenses. This example is intended to help you understand your ongoing costs (in dollars) of investing in the Fund and to compare these costs with the ongoing costs of investing in other mutual funds.
The example is based on an investment of $1,000 invested at the beginning of the six-month period and held for the entire period from September 1, 2014 to February 28, 2015.
Actual expenses
The “Actual” line of the table below provides information about actual account values and actual expenses. You may use the information in this line, together with the amount you invested, to estimate the expenses that you paid over the period. Simply divide your account value by $1,000 (for example, an $8,600 account value divided by $1,000 = 8.6), then multiply the result by the number in the “Actual” line under the heading entitled “Expenses paid during period” for your applicable class of shares to estimate the expenses you paid on your account during this period.
Hypothetical example for comparison purposes
The “Hypothetical” line of the table below provides information about hypothetical account values and hypothetical expenses based on the Fund’s actual expense ratio and an assumed rate of return of 5% per year before expenses, which is not the Fund’s actual return. The hypothetical account values and expenses may not be used to estimate the actual ending account balance or expenses you paid for the period. You may use this information to compare the ongoing costs of investing in the Fund and other funds. To do so, compare this 5% hypothetical example with the 5% hypothetical examples that appear in the shareholder reports of the other funds.
Please note that the expenses shown in the table are meant to highlight your ongoing costs only and do not reflect any transactional costs, such as sales charges (loads) and contingent deferred sales charges. Therefore, the “Hypothetical” line of the table is useful in comparing ongoing costs only and will not help you determine the relative total costs of owning different funds. In addition, if these transactional costs were included, your costs would have been higher.
| | | | | | | | | | | | | | | | |
| | | Beginning
account value
9-1-2014 | | | Ending
account value
2-28-2015 | | | Expenses
paid during
the period¹ | | | Net annualized
expense ratio | |
Class A | | | | | | | | | | | | | | | | |
Actual | | $ | 1,000.00 | | | $ | 1,008.41 | | | $ | 5.13 | | | | 1.03 | % |
Hypothetical (5% return before expenses) | | $ | 1,000.00 | | | $ | 1,019.69 | | | $ | 5.16 | | | | 1.03 | % |
Class B | | | | | | | | | | | | | | | | |
Actual | | $ | 1,000.00 | | | $ | 1,001.69 | | | $ | 8.83 | | | | 1.78 | % |
Hypothetical (5% return before expenses) | | $ | 1,000.00 | | | $ | 1,015.97 | | | $ | 8.90 | | | | 1.78 | % |
Class C | | | | | | | | | | | | | | | | |
Actual | | $ | 1,000.00 | | | $ | 1,004.68 | | | $ | 8.85 | | | | 1.78 | % |
Hypothetical (5% return before expenses) | | $ | 1,000.00 | | | $ | 1,015.97 | | | $ | 8.90 | | | | 1.78 | % |
Administrator Class | | | | | | | | | | | | | | | | |
Actual | | $ | 1,000.00 | | | $ | 1,006.55 | | | $ | 3.98 | | | | 0.80 | % |
Hypothetical (5% return before expenses) | | $ | 1,000.00 | | | $ | 1,020.83 | | | $ | 4.01 | | | | 0.80 | % |
Institutional Class | | | | | | | | | | | | | | | | |
Actual | | $ | 1,000.00 | | | $ | 1,009.63 | | | $ | 3.49 | | | | 0.70 | % |
Hypothetical (5% return before expenses) | | $ | 1,000.00 | | | $ | 1,021.32 | | | $ | 3.51 | | | | 0.70 | % |
| 1 | Expenses paid is equal to the annualized expense ratio of each class multiplied by the average account value over the period, multiplied by the number of days in the most recent fiscal half-year divided by the number of days in the fiscal year (to reflect the one-half-year period). |
| | | | | | |
| Portfolio of investments—February 28, 2015 (unaudited) | | Wells Fargo Advantage High Yield Bond Fund | | | 7 | |
| | | | | | | | | | | | |
| Security name | | | | | | Shares | | | Value | |
| | | | | | | | | | | | |
| | | | |
Common Stocks: 8.94% | | | | | | | | | | | | |
| | | | |
Consumer Discretionary: 1.44% | | | | | | | | | | | | |
| | | | |
| Auto Components: 0.33% | | | | | | | | | | | | |
Gentex Corporation | | | | | | | 30,000 | | | $ | 528,600 | |
Johnson Controls Incorporated | | | | | | | 3,000 | | | | 152,430 | |
Lear Corporation | | | | | | | 3,000 | | | | 326,760 | |
| | | | |
| | | | | | | | | | | 1,007,790 | |
| | | | | | | | | | | | |
| | | | |
| Distributors: 0.32% | | | | | | | | | | | | |
Genuine Parts Company | | | | | | | 10,000 | | | | 960,800 | |
| | | | | | | | | | | | |
| | | | |
| Hotels, Restaurants & Leisure: 0.14% | | | | | | | | | | | | |
Marriott International Incorporated Class A | | | | | | | 5,000 | | | | 415,500 | |
| | | | | | | | | | | | |
| | | | |
| Household Durables: 0.28% | | | | | | | | | | | | |
Harman International Industries Incorporated | | | | | | | 6,000 | | | | 827,940 | |
| | | | | | | | | | | | |
| | | | |
| Specialty Retail: 0.37% | | | | | | | | | | | | |
Group 1 Automotive Incorporated | | | | | | | 4,000 | | | | 325,360 | |
The Home Depot Incorporated | | | | | | | 7,000 | | | | 803,250 | |
| | | | |
| | | | | | | | | | | 1,128,610 | |
| | | | | | | | | | | | |
| | | | |
Consumer Staples: 0.68% | | | | | | | | | | | | |
| | | | |
| Food & Staples Retailing: 0.14% | | | | | | | | | | | | |
CVS Health Corporation | | | | | | | 4,000 | | | | 415,480 | |
| | | | | | | | | | | | |
| | | | |
| Food Products: 0.29% | | | | | | | | | | | | |
ConAgra Foods Incorporated | | | | | | | 25,000 | | | | 874,500 | |
| | | | | | | | | | | | |
| | | | |
| Household Products: 0.25% | | | | | | | | | | | | |
Church & Dwight Company Incorporated | | | | | | | 9,000 | | | | 766,260 | |
| | | | | | | | | | | | |
| | | | |
Energy: 0.88% | | | | | | | | | | | | |
| | | | |
| Energy Equipment & Services: 0.10% | | | | | | | | | | | | |
Bristow Group Incorporated | | | | | | | 5,000 | | | | 309,700 | |
| | | | | | | | | | | | |
| | | | |
| Oil, Gas & Consumable Fuels: 0.78% | | | | | | | | | | | | |
Kinder Morgan Incorporated | | | | | | | 5,000 | | | | 205,050 | |
ONEOK Incorporated | | | | | | | 3,000 | | | | 132,780 | |
Plains All American Pipeline LP | | | | | | | 40,000 | | | | 1,995,600 | |
| | | | |
| | | | | | | | | | | 2,333,430 | |
| | | | | | | | | | | | |
| | | | |
Financials: 0.30% | | | | | | | | | | | | |
| | | | |
| Banks: 0.30% | | | | | | | | | | | | |
PNC Financial Services Group Incorporated | | | | | | | 10,000 | | | | 919,600 | |
| | | | | | | | | | | | |
The accompanying notes are an integral part of these financial statements.
| | | | |
| 8 | | Wells Fargo Advantage High Yield Bond Fund | | Portfolio of investments—February 28, 2015 (unaudited) |
| | | | | | | | | | | | |
| Security name | | | | | | Shares | | | Value | |
| | | | | | | | | | | | |
| | | | |
Health Care: 1.24% | | | | | | | | | | | | |
| | | | |
| Biotechnology: 0.05% | | | | | | | | | | | | |
Amgen Incorporated | | | | | | | 1,000 | | | $ | 157,720 | |
| | | | | | | | | | | | |
| | | | |
| Health Care Equipment & Supplies: 0.50% | | | | | | | | | | | | |
Baxter International Incorporated | | | | | | | 4,000 | | | | 276,600 | |
C.R. Bard Incorporated | | | | | | | 4,000 | | | | 676,560 | |
Medtronic plc | | | | | | | 5,000 | | | | 387,950 | |
West Pharmaceutical Services Incorporated | | | | | | | 3,000 | | | | 164,160 | |
| | | | |
| | | | | | | | | | | 1,505,270 | |
| | | | | | | | | | | | |
| | | | |
| Health Care Providers & Services: 0.04% | | | | | | | | | | | | |
McKesson Corporation | | | | | | | 500 | | | | 114,350 | |
| | | | | | | | | | | | |
| | | | |
| Pharmaceuticals: 0.65% | | | | | | | | | | | | |
Actavis plc † | | | | | | | 3,000 | | | | 874,080 | |
Mylan Laboratories Incorporated † | | | | | | | 10,000 | | | | 573,250 | |
Novartis AG ADR | | | | | | | 5,000 | | | | 512,000 | |
| | | | |
| | | | | | | | | | | 1,959,330 | |
| | | | | | | | | | | | |
| | | | |
Industrials: 2.34% | | | | | | | | | | | | |
| | | | |
| Aerospace & Defense: 0.35% | | | | | | | | | | | | |
Curtiss-Wright Corporation | | | | | | | 5,000 | | | | 362,900 | |
General Dynamics Corporation | | | | | | | 5,000 | | | | 693,900 | |
| | | | |
| | | | | | | | | | | 1,056,800 | |
| | | | | | | | | | | | |
| | | | |
| Electrical Equipment: 1.20% | | | | | | | | | | | | |
AMETEK Incorporated | | | | | | | 10,000 | | | | 531,400 | |
Emerson Electric Company | | | | | | | 30,000 | | | | 1,737,600 | |
Regal-Beloit Corporation | | | | | | | 2,000 | | | | 155,880 | |
Rockwell Automation Incorporated | | | | | | | 10,000 | | | | 1,170,400 | |
| | | | |
| | | | | | | | | | | 3,595,280 | |
| | | | | | | | | | | | |
| | | | |
| Industrial Conglomerates: 0.22% | | | | | | | | | | | | |
Roper Industries Incorporated | | | | | | | 4,000 | | | | 670,280 | |
| | | | | | | | | | | | |
| | | | |
| Machinery: 0.57% | | | | | | | | | | | | |
Flowserve Corporation | | | | | | | 3,000 | | | | 186,390 | |
IDEX Corporation | | | | | | | 10,000 | | | | 772,600 | |
John Bean Technologies Corporation | | | | | | | 12,000 | | | | 414,720 | |
Lincoln Electric Holdings Incorporated | | | | | | | 5,000 | | | | 345,200 | |
| | | | |
| | | | | | | | | | | 1,718,910 | |
| | | | | | | | | | | | |
| | | | |
Information Technology: 0.90% | | | | | | | | | | | | |
| | | | |
| Electronic Equipment, Instruments & Components: 0.32% | | | | | | | | | | | | |
Amphenol Corporation Class A | | | | | | | 10,000 | | | | 564,600 | |
FEI Company | | | | | | | 5,000 | | | | 394,950 | |
| | | | |
| | | | | | | | | | | 959,550 | |
| | | | | | | | | | | | |
The accompanying notes are an integral part of these financial statements.
| | | | | | |
| Portfolio of investments—February 28, 2015 (unaudited) | | Wells Fargo Advantage High Yield Bond Fund | | | 9 | |
| | | | | | | | | | | | | | | | |
| Security name | | | | | | | | Shares | | | Value | |
| | | | | | | | | | | | | | | | |
| | | | |
| IT Services: 0.32% | | | | | | | | | | | | | | | | |
Automatic Data Processing Incorporated | | | | | | | | | | | 11,000 | | | $ | 977,240 | |
| | | | | | | | | | | | | | | | |
| | | | |
| Software: 0.06% | | | | | | | | | | | | | | | | |
CDK Global Incorporated | | | | | | | | | | | 3,666 | | | | 171,679 | |
| | | | | | | | | | | | | | | | |
| | | | |
| Technology Hardware, Storage & Peripherals: 0.20% | | | | | | | | | | | | | | | | |
Seagate Technology plc | | | | | | | | | | | 10,000 | | | | 611,200 | |
| | | | | | | | | | | | | | | | |
| | | | |
Materials: 0.23% | | | | | | | | | | | | | | | | |
| | | | |
| Chemicals: 0.20% | | | | | | | | | | | | | | | | |
FMC Corporation | | | | | | | | | | | 5,000 | | | | 317,050 | |
Westlake Chemical Corporation | | | | | | | | | | | 4,000 | | | | 267,040 | |
| | | | |
| | | | | | | | | | | | | | | 584,090 | |
| | | | | | | | | | | | | | | | |
| | | | |
| Containers & Packaging: 0.03% | | | | | | | | | | | | | | | | |
Sealed Air Corporation | | | | | | | | | | | 2,000 | | | | 94,260 | |
| | | | | | | | | | | | | | | | |
| | | | |
Utilities: 0.93% | | | | | | | | | | | | | | | | |
| | | | |
| Electric Utilities: 0.08% | | | | | | | | | | | | | | | | |
NRG Yield Incorporated Class A « | | | | | | | | | | | 5,000 | | | | 256,550 | |
| | | | | | | | | | | | | | | | |
| | | | |
| Multi-Utilities: 0.85% | | | | | | | | | | | | | | | | |
Dominion Resources Incorporated | | | | | | | | | | | 1,000 | | | | 72,090 | |
Sempra Energy | | | | | | | | | | | 23,000 | | | | 2,488,600 | |
| | | | |
| | | | | | | | | | | | | | | 2,560,690 | |
| | | | | | | | | | | | | | | | |
| | | | |
Total Common Stocks (Cost $25,349,169) | | | | | | | | | | | | | | | 26,952,809 | |
| | | | | | | | | | | | | | | | |
| | | | |
| | | Interest rate | | | Maturity date | | | Principal | | | | |
| | | | |
Corporate Bonds and Notes: 82.98% | | | | | | | | | | | | | | | | |
| | | | |
Consumer Discretionary: 12.35% | | | | | | | | | | | | | | | | |
| | | | |
| Auto Components: 4.71% | | | | | | | | | | | | | | | | |
American Axle Manufacturing Incorporated | | | 6.63 | % | | | 10-15-2022 | | | $ | 2,250,000 | | | | 2,446,875 | |
Cooper Tire & Rubber Company (i) | | | 7.63 | | | | 3-15-2027 | | | | 1,500,000 | | | | 1,590,000 | |
Dana Holding Corporation | | | 5.50 | | | | 12-15-2024 | | | | 2,000,000 | | | | 2,065,000 | |
Lear Corporation | | | 4.75 | | | | 1-15-2023 | | | | 8,000,000 | | | | 8,100,000 | |
| | | | |
| | | | | | | | | | | | | | | 14,201,875 | |
| | | | | | | | | | | | | | | | |
| | | | |
| Hotels, Restaurants & Leisure: 1.06% | | | | | | | | | | | | | | | | |
Speedway Motorsports Incorporated 144A | | | 5.13 | | | | 2-1-2023 | | | | 3,115,000 | | | | 3,200,663 | |
| | | | | | | | | | | | | | | | |
| | | | |
| Media: 1.76% | | | | | | | | | | | | | | | | |
DISH DBS Corporation | | | 5.00 | | | | 3-15-2023 | | | | 5,500,000 | | | | 5,290,318 | |
| | | | | | | | | | | | | | | | |
| | | | |
| Specialty Retail: 4.82% | | | | | | | | | | | | | | | | |
Group 1 Automotive Incorporated 144A | | | 5.00 | | | | 6-1-2022 | | | | 7,000,000 | | | | 7,000,000 | |
Penske Auto Group Incorporated | | | 5.75 | | | | 10-1-2022 | | | | 7,200,000 | | | | 7,542,000 | |
| | | | |
| | | | | | | | | | | | | | | 14,542,000 | |
| | | | | | | | | | | | | | | | |
The accompanying notes are an integral part of these financial statements.
| | | | |
| 10 | | Wells Fargo Advantage High Yield Bond Fund | | Portfolio of investments—February 28, 2015 (unaudited) |
| | | | | | | | | | | | | | | | |
| Security name | | Interest rate | | | Maturity date | | | Principal | | | Value | |
| | | | | | | | | | | | | | | | |
| | | | |
Consumer Staples: 3.77% | | | | | | | | | | | | | | | | |
| | | | |
| Beverages: 3.77% | | | | | | | | | | | | | | | | |
Constellation Brands Incorporated | | | 4.75 | % | | | 11-15-2024 | | | $ | 10,626,000 | | | $ | 11,369,820 | |
| | | | | | | | | | | | | | | | |
| | | | |
Energy: 3.77% | | | | | | | | | | | | | | | | |
| | | | |
| Energy Equipment & Services: 2.38% | | | | | | | | | | | | | | | | |
Bristow Group Incorporated | | | 6.25 | | | | 10-15-2022 | | | | 5,990,000 | | | | 5,870,200 | |
Dresser-Rand Group Incorporated | | | 6.50 | | | | 5-1-2021 | | | | 1,225,000 | | | | 1,304,625 | |
| | | | |
| | | | | | | | | | | | | | | 7,174,825 | |
| | | | | | | | | | | | | | | | |
| | | | |
| Oil, Gas & Consumable Fuels: 1.39% | | | | | | | | | | | | | | | | |
Energy Transfer Equity LP | | | 5.88 | | | | 1-15-2024 | | | | 1,500,000 | | | | 1,605,000 | |
Energy Transfer Equity LP | | | 7.50 | | | | 10-15-2020 | | | | 980,000 | | | | 1,122,100 | |
NGL Energy Partners LP | | | 5.13 | | | | 7-15-2019 | | | | 1,500,000 | | | | 1,462,500 | |
| | | | |
| | | | | | | | | | | | | | | 4,189,600 | |
| | | | | | | | | | | | | | | | |
| | | | |
Financials: 4.83% | | | | | | | | | | | | | | | | |
| | | | |
| REITs: 4.83% | | | | | | | | | | | | | | | | |
Crown Castle International Corporation | | | 4.88 | | | | 4-15-2022 | | | | 1,000,000 | | | | 1,047,500 | |
Crown Castle International Corporation | | | 5.25 | | | | 1-15-2023 | | | | 4,000,000 | | | | 4,220,000 | |
Iron Mountain Incorporated | | | 5.75 | | | | 8-15-2024 | | | | 5,000,000 | | | | 5,062,500 | |
Sabra Health Care Incorporated | | | 5.38 | | | | 6-1-2023 | | | | 4,000,000 | | | | 4,235,000 | |
| | | | |
| | | | | | | | | | | | | | | 14,565,000 | |
| | | | | | | | | | | | | | | | |
| | | | |
Health Care: 10.86% | | | | | | | | | | | | | | | | |
| | | | |
| Health Care Equipment & Supplies: 1.06% | | | | | | | | | | | | | | | | |
Halyard Health Incorporated 144A | | | 6.25 | | | | 10-15-2022 | | | | 1,000,000 | | | | 1,050,000 | |
Hologic Incorporated | | | 6.25 | | | | 8-1-2020 | | | | 2,062,000 | | | | 2,159,945 | |
| | | | |
| | | | | | | | | | | | | | | 3,209,945 | |
| | | | | | | | | | | | | | | | |
| | | | |
| Health Care Providers & Services: 6.26% | | | | | | | | | | | | | | | | |
Davita Healthcare Partners Incorpoarted | | | 5.13 | | | | 7-15-2024 | | | | 2,000,000 | | | | 2,075,000 | |
DaVita HealthCare Partners Incorporated | | | 5.75 | | | | 8-15-2022 | | | | 4,465,000 | | | | 4,816,619 | |
Fresenius Medical Care Holdings Incorporated 144A | | | 5.88 | | | | 1-31-2022 | | | | 4,529,000 | | | | 5,083,803 | |
HCA Incorporated | | | 5.38 | | | | 2-1-2025 | | | | 6,500,000 | | | | 6,890,000 | |
| | | | |
| | | | | | | | | | | | | | | 18,865,422 | |
| | | | | | | | | | | | | | | | |
| | | | |
| Pharmaceuticals: 3.54% | | | | | | | | | | | | | | | | |
Endo Finance LLC 144A | | | 6.00 | | | | 2-1-2025 | | | | 8,000,000 | | | | 8,470,000 | |
Forest Laboratories Incorporated 144A | | | 5.00 | | | | 12-15-2021 | | | | 2,000,000 | | | | 2,196,290 | |
| | | | |
| | | | | | | | | | | | | | | 10,666,290 | |
| | | | | | | | | | | | | | | | |
| | | | |
Industrials: 11.05% | | | | | | | | | | | | | | | | |
| | | | |
| Aerospace & Defense: 2.96% | | | | | | | | | | | | | | | | |
Alliant Techsystems Incorporated 144A | | | 5.25 | | | | 10-1-2021 | | | | 3,675,000 | | | | 3,748,500 | |
Moog Incorporated 144A | | | 5.25 | | | | 12-1-2022 | | | | 5,000,000 | | | | 5,162,500 | |
| | | | |
| | | | | | | | | | | | | | | 8,911,000 | |
| | | | | | | | | | | | | | | | |
The accompanying notes are an integral part of these financial statements.
| | | | | | |
| Portfolio of investments—February 28, 2015 (unaudited) | | Wells Fargo Advantage High Yield Bond Fund | | | 11 | |
| | | | | | | | | | | | | | | | |
| Security name | | Interest rate | | | Maturity date | | | Principal | | | Value | |
| | | | | | | | | | | | | | | | |
| | | | |
| Building Products: 1.39% | | | | | | | | | | | | | | | | |
Dycom Investments Incorporated | | | 7.13 | % | | | 1-15-2021 | | | $ | 4,000,000 | | | $ | 4,200,000 | |
| | | | | | | | | | | | | | | | |
| | | | |
| Commercial Services & Supplies: 1.81% | | | | | | | | | | | | | | | | |
Clean Harbors Incorporated | | | 5.13 | | | | 6-1-2021 | | | | 5,338,000 | | | | 5,458,105 | |
| | | | | | | | | | | | | | | | |
| | | | |
| Electrical Equipment: 1.87% | | | | | | | | | | | | | | | | |
Belden Incorporated 144A | | | 5.50 | | | | 9-1-2022 | | | | 5,500,000 | | | | 5,637,500 | |
| | | | | | | | | | | | | | | | |
| | | | |
| Machinery: 0.43% | | | | | | | | | | | | | | | | |
Oshkosh Corporation 144A%% | | | 5.38 | | | | 3-1-2025 | | | | 1,250,000 | | | | 1,281,250 | |
| | | | | | | | | | | | | | | | |
| | | | |
| Road & Rail: 2.59% | | | | | | | | | | | | | | | | |
The Hertz Corporation | | | 6.25 | | | | 10-15-2022 | | | | 7,500,000 | | | | 7,800,000 | |
| | | | | | | | | | | | | | | | |
| | | | |
Information Technology: 7.54% | | | | | | | | | | | | | | | | |
| | | | |
| Communications Equipment: 3.43% | | | | | | | | | | | | | | | | |
CommScope Incorporated 144A | | | 5.50 | | | | 6-15-2024 | | | | 10,200,000 | | | | 10,327,500 | |
| | | | | | | | | | | | | | | | |
| | | | |
| Electronic Equipment, Instruments & Components: 0.34% | | | | | | | | | | | | | | | | |
Anixter International Incorporated | | | 5.13 | | | | 10-1-2021 | | | | 1,000,000 | | | | 1,028,750 | |
| | | | | | | | | | | | | | | | |
| | | | |
| IT Services: 1.85% | | | | | | | | | | | | | | | | |
Neustar Incorporated « | | | 4.50 | | | | 1-15-2023 | | | | 6,350,000 | | | | 5,588,000 | |
| | | | | | | | | | | | | | | | |
| | | | |
| Semiconductors & Semiconductor Equipment: 1.92% | | | | | | | | | | | | | | | | |
Micron Technology Incorporated 144A | | | 5.25 | | | | 8-1-2023 | | | | 4,100,000 | | | | 4,202,500 | |
Micron Technology Incorporated 144A | | | 5.50 | | | | 2-1-2025 | | | | 1,550,000 | | | | 1,588,750 | |
| | | | |
| | | | | | | | | | | | | | | 5,791,250 | |
| | | | | | | | | | | | | | | | |
| | | | |
Materials: 19.66% | | | | | | | | | | | | | | | | |
| | | | |
| Chemicals: 11.89% | | | | | | | | | | | | | | | | |
Celanese U.S. Holdings LLC | | | 4.63 | | | | 11-15-2022 | | | | 6,729,000 | | | | 6,796,290 | |
Huntsman International LLC | | | 4.88 | | | | 11-15-2020 | | | | 1,000,000 | | | | 1,028,750 | |
Kraton Polymers LLC | | | 6.75 | | | | 3-1-2019 | | | | 2,105,000 | | | | 2,162,888 | |
Olin Corporation | | | 5.50 | | | | 8-15-2022 | | | | 7,750,000 | | | | 7,963,125 | |
Rayonier Advanced Materials Products Incorporated 144A | | | 5.50 | | | | 6-1-2024 | | | | 8,775,000 | | | | 7,524,563 | |
Tronox Finance LLC « | | | 6.38 | | | | 8-15-2020 | | | | 10,400,000 | | | | 10,361,000 | |
| | | | |
| | | | | | | | | | | | | | �� | 35,836,616 | |
| | | | | | | | | | | | | | | | |
| | | | |
| Containers & Packaging: 6.04% | | | | | | | | | | | | | | | | |
Ball Corporation | | | 4.00 | | | | 11-15-2023 | | | | 1,500,000 | | | | 1,473,750 | |
Ball Corporation | | | 5.00 | | | | 3-15-2022 | | | | 5,500,000 | | | | 5,747,500 | |
Sealed Air Corporation 144A | | | 5.25 | | | | 4-1-2023 | | | | 1,500,000 | | | | 1,580,625 | |
Sealed Air Corporation 144A | | | 6.50 | | | | 12-1-2020 | | | | 4,635,000 | | | | 5,250,065 | |
Silgan Holdings Incorporated | | | 5.00 | | | | 4-1-2020 | | | | 4,000,000 | | | | 4,150,000 | |
| | | | |
| | | | | | | | | | | | | | | 18,201,940 | |
| | | | | | | | | | | | | | | | |
| | | | |
| Metals & Mining: 0.15% | | | | | | | | | | | | | | | | |
Commercial Metals Company | | | 4.88 | | | | 5-15-2023 | | | | 150,000 | | | | 143,250 | |
Steel Dynamics Incorporated 144A | | | 5.50 | | | | 10-1-2024 | | | | 300,000 | | | | 312,000 | |
| | | | |
| | | | | | | | | | | | | | | 455,250 | |
| | | | | | | | | | | | | | | | |
The accompanying notes are an integral part of these financial statements.
| | | | |
| 12 | | Wells Fargo Advantage High Yield Bond Fund | | Portfolio of investments—February 28, 2015 (unaudited) |
| | | | | | | | | | | | | | | | |
| Security name | | Interest rate | | | Maturity date | | | Principal | | | Value | |
| | | | | | | | | | | | | | | | |
| | | | |
| Paper & Forest Products: 1.58% | | | | | | | | | | | | | | | | |
P.H. Glatfelter Company | | | 5.38 | % | | | 10-15-2020 | | | $ | 4,630,000 | | | $ | 4,745,750 | |
| | | | | | | | | | | | | | | | |
| | | | |
Telecommunication Services: 3.54% | | | | | | | | | | | | | | | | |
| | | | |
| Diversified Telecommunication Services: 0.78% | | | | | | | | | | | | | | | | |
GCI Incorporated | | | 8.63 | | | | 11-15-2019 | | | | 2,235,000 | | | | 2,338,369 | |
| | | | | | | | | | | | | | | | |
| | | | |
| Wireless Telecommunication Services: 2.76% | | | | | | | | | | | | | | | | |
MetroPCS Wireless Incorporated | | | 6.63 | | | | 11-15-2020 | | | | 1,575,000 | | | | 1,661,625 | |
SBA Communications Corporation | | | 5.63 | | | | 10-1-2019 | | | | 5,700,000 | | | | 5,999,250 | |
SBA Communications Corporation | | | 5.75 | | | | 7-15-2020 | | | | 625,000 | | | | 657,813 | |
| | | | |
| | | | | | | | | | | | | | | 8,318,688 | |
| | | | | | | | | | | | | | | | |
| | | | |
Utilities: 5.61% | | | | | | | | | | | | | | | | |
| | | | |
| Electric Utilities: 1.52% | | | | | | | | | | | | | | | | |
DPL Incorporated | | | 7.25 | | | | 10-15-2021 | | | | 4,375,000 | | | | 4,593,750 | |
| | | | | | | | | | | | | | | | |
| | | | |
| Gas Utilities: 0.57% | | | | | | | | | | | | | | | | |
AmeriGas Finance LLC | | | 6.75 | | | | 5-20-2020 | | | | 1,600,000 | | | | 1,708,000 | |
| | | | | | | | | | | | | | | | |
| | | | |
| Independent Power & Renewable Electricity Producers: 3.52% | | | | | | | | | | | | | | | | |
Calpine Corporation 144A | | | 5.88 | | | | 1-15-2024 | | | | 2,576,000 | | | | 2,794,960 | |
Calpine Corporation 144A | | | 6.00 | | | | 1-15-2022 | | | | 1,625,000 | | | | 1,772,063 | |
NRG Energy Incorporated | | | 6.63 | | | | 3-15-2023 | | | | 5,743,000 | | | | 6,030,150 | |
| | | | |
| | | | | | | | | | | | | | | 10,597,173 | |
| | | | | | | | | | | | | | | | |
| | | | |
Total Corporate Bonds and Notes (Cost $245,960,090) | | | | | | | | | | | | | | | 250,094,649 | |
| | | | | | | | | | | | | | | | |
| | | | |
Yankee Corporate Bonds and Notes: 5.19% | | | | | | | | | | | | | | | | |
| | | | |
Health Care: 0.73% | | | | | | | | | | | | | | | | |
| | | | |
| Pharmaceuticals: 0.73% | | | | | | | | | | | | | | | | |
Valeant Pharmaceuticals International Incorporated 144A | | | 5.50 | | | | 3-1-2023 | | | | 2,195,000 | | | | 2,208,715 | |
| | | | | | | | | | | | | | | | |
| | | | |
Industrials: 2.11% | | | | | | | | | | | | | | | | |
| | | | |
| Electrical Equipment: 2.11% | | | | | | | | | | | | | | | | |
Sensata Technologies BV 144A | | | 4.88 | | | | 10-15-2023 | | | | 3,000,000 | | | | 3,127,800 | |
Sensata Technologies BV 144A | | | 5.63 | | | | 11-1-2024 | | | | 3,000,000 | | | | 3,217,500 | |
| | | | |
| | | | | | | | | | | | | | | 6,345,300 | |
| | | | | | | | | | | | | | | | |
| | | | |
Information Technology: 2.35% | | | | | | | | | | | | | | | | |
| | | | |
| Technology Hardware, Storage & Peripherals: 2.35% | | | | | | | | | | | | | | | | |
Seagate HDD (Cayman) | | | 4.75 | | | | 6-1-2023 | | | | 6,640,000 | | | | 7,073,166 | |
| | | | | | | | | | | | | | | | |
| | | | |
Total Yankee Corporate Bonds and Notes (Cost $14,989,370) | | | | | | | | | | | | | | | 15,627,181 | |
| | | | | | | | | | | | | | | | |
The accompanying notes are an integral part of these financial statements.
| | | | | | |
| Portfolio of investments—February 28, 2015 (unaudited) | | Wells Fargo Advantage High Yield Bond Fund | | | 13 | |
| | | | | | | | | | | | | | |
| Security name | | Yield | | | | | Shares | | | Value | |
| | | | | | | | | | | | | | |
| Short-Term Investments: 4.33% | | | | | | | | | | | | | | |
| | | | |
| Investment Companies: 4.33% | | | | | | | | | | | | | | |
Securities Lending Cash Investments, LLC (r)(l)(u) | | | 0.13 | % | | | | | 8,334,835 | | | $ | 8,334,835 | |
Wells Fargo Advantage Cash Investment Money Market Fund, Select Class (l)(u)## | | | 0.10 | | | | | | 4,706,115 | | | | 4,706,115 | |
| | | | |
Total Short-Term Investments (Cost $13,040,950) | | | | | | | | | | | | | 13,040,950 | |
| | | | | | | | | | | | | | |
| | | | | | | | |
| Total investments in securities (Cost $299,339,579) * | | | 101.44 | % | | | 305,715,589 | |
Other assets and liabilities, net | | | (1.44 | ) | | | (4,342,335 | ) |
| | | | | | | | |
| Total net assets | | | 100.00 | % | | $ | 301,373,254 | |
| | | | | | | | |
| † | Non-income-earning security |
| « | All or a portion of this security is on loan. |
| 144A | The security may be resold in transactions exempt from registration, normally to qualified institutional buyers, pursuant to Rule 144A under the Securities Act of 1933. |
| %% | The security is issued on a when-issued basis. |
| (r) | The investment is a non-registered investment vehicle purchased with cash collateral received from securities on loan. |
| (l) | The security represents an affiliate of the Fund as defined in the Investment Company Act of 1940. |
| (u) | The rate represents the 7-day annualized yield at period end. |
| ## | All or a portion of this security is segregated for when-issued securities. |
| * | Cost for federal income tax purposes is $299,259,365 and unrealized gains (losses) consists of: |
| | | | |
Gross unrealized gains | | $ | 9,862,317 | |
Gross unrealized losses | | | (3,406,093 | ) |
| | | | |
Net unrealized gains | | $ | 6,456,224 | |
The accompanying notes are an integral part of these financial statements.
| | | | |
| 14 | | Wells Fargo Advantage High Yield Bond Fund | | Statement of assets and liabilities—February 28, 2015 (unaudited) |
| | | | |
| | | | |
| |
Assets | | | | |
Investments | | | | |
In unaffiliated securities (including $8,156,082 of securities loaned), at value (cost $286,298,629) | | $ | 292,674,639 | |
In affiliated securities, at value (cost $13,040,950) | | | 13,040,950 | |
| | | | |
Total investments, at value (cost $299,339,579) | | | 305,715,589 | |
Foreign currency, at value (cost $45) | | | 39 | |
Receivable for investments sold | | | 7,988,774 | |
Receivable for Fund shares sold | | | 248,594 | |
Receivable for dividends and interest | | | 3,761,533 | |
Receivable for securities lending income | | | 5,420 | |
Prepaid expenses and other assets | | | 136,546 | |
| | | | |
Total assets | | | 317,856,495 | |
| | | | |
| |
Liabilities | | | | |
Dividends payable | | | 101,649 | |
Payable for investments purchased | | | 7,063,969 | |
Payable for Fund shares redeemed | | | 624,115 | |
Payable upon receipt of securities loaned | | | 8,334,835 | |
Advisory fee payable | | | 115,714 | |
Distribution fees payable | | | 41,795 | |
Administration fees payable | | | 48,903 | |
Accrued expenses and other liabilities | | | 152,261 | |
| | | | |
Total liabilities | | | 16,483,241 | |
| | | | |
Total net assets | | $ | 301,373,254 | |
| | | | |
| |
NET ASSETS CONSIST OF | | | | |
Paid-in capital | | $ | 352,234,877 | |
Overdistributed net investment income | | | (163,588 | ) |
Accumulated net realized losses on investments | | | (57,074,039 | ) |
Net unrealized gains on investments | | | 6,376,004 | |
| | | | |
Total net assets | | $ | 301,373,254 | |
| | | | |
| |
COMPUTATION OF NET ASSET VALUE AND OFFERING PRICE PER SHARE | | | | |
Net assets – Class A | | $ | 209,717,603 | |
Shares outstanding – Class A1 | | | 63,386,422 | |
Net asset value per share – Class A | | | $3.31 | |
Maximum offering price per share – Class A2 | | | $3.47 | |
Net assets – Class B | | $ | 2,989,145 | |
Shares outstanding – Class B1 | | | 903,130 | |
Net asset value per share – Class B | | | $3.31 | |
Net assets – Class C | | $ | 67,500,712 | |
Shares outstanding – Class C1 | | | 20,398,320 | |
Net asset value per share – Class C | | | $3.31 | |
Net assets – Administrator Class | | $ | 20,317,905 | |
Shares outstanding – Administrator Class1 | | | 6,131,533 | |
Net asset value per share – Administrator Class | | | $3.31 | |
Net assets – Institutional Class | | $ | 847,889 | |
Shares outstanding – Institutional Class1 | | | 255,663 | |
Net asset value per share – Institutional Class | | | $3.32 | |
| 1 | The Fund has an unlimited number of authorized shares. |
| 2 | Maximum offering price is computed as 100/95.50 of net asset value. On investments of $50,000 or more, the offering price is reduced. |
The accompanying notes are an integral part of these financial statements.
| | | | | | |
| Statement of operations—six months ended February 28, 2015 (unaudited) | | Wells Fargo Advantage High Yield Bond Fund | | | 15 | |
| | | | |
| | | | |
| |
Investment income | | | | |
Interest | | $ | 7,213,320 | |
Dividends | | | 295,717 | |
Securities lending income, net | | | 39,356 | |
Income from affiliated securities | | | 1,183 | |
| | | | |
Total investment income | | | 7,549,576 | |
| | | | |
| |
Expenses | | | | |
Advisory fee | | | 731,709 | |
Administration fees | | | | |
Fund level | | | 73,171 | |
Class A | | | 160,893 | |
Class B | | | 2,687 | |
Class C | | | 54,568 | |
Administrator Class | | | 9,719 | |
Institutional Class | | | 224 | 1 |
Shareholder servicing fees | | | | |
Class A | | | 251,394 | |
Class B | | | 4,198 | |
Class C | | | 85,263 | |
Administrator Class | | | 24,299 | |
Distribution fees | | | | |
Class B | | | 12,594 | |
Class C | | | 255,789 | |
Custody and accounting fees | | | 11,888 | |
Professional fees | | | 34,028 | |
Registration fees | | | 21,081 | |
Shareholder report expenses | | | 27,572 | |
Trustees’ fees and expenses | | | 5,017 | |
Other fees and expenses | | | 6,908 | |
| | | | |
Total expenses | | | 1,773,002 | |
Less: Fee waivers and/or expense reimbursements | | | (20,673 | ) |
| | | | |
Net expenses | | | 1,752,329 | |
| | | | |
Net investment income | | | 5,797,247 | |
| | | | |
| |
REALIZED AND UNREALIZED GAINS (LOSSES) ON INVESTMENTS | | | | |
| |
Net realized losses on: | | | | |
Unaffiliated securities | | | (173,765 | ) |
Futures transactions | | | (288,529 | ) |
| | | | |
Net realized losses on investments | | | (462,294 | ) |
| | | | |
| |
Net change in unrealized gains (losses) on: | | | | |
Unaffiliated securities | | | (4,079,875 | ) |
Futures transactions | | | 214,228 | |
| | | | |
Net change in unrealized gains (losses) on investments | | | (3,865,647 | ) |
| | | | |
Net realized and unrealized gains (losses) on investments | | | (4,327,941 | ) |
| | | | |
Net increase in net assets resulting from operations | | $ | 1,469,306 | |
| | | | |
| 1 | For the period from October 31, 2014 (commencement of class operations) to February 28, 2015 |
The accompanying notes are an integral part of these financial statements.
| | | | |
| 16 | | Wells Fargo Advantage High Yield Bond Fund | | Statement of changes in net assets |
| | | | | | | | | | | | | | | | |
| | | Six months ended
February 28, 2015
(unaudited) | | | Year ended
August 31, 2014 | |
| | | |
Operations | | | | | | | | | | | | |
Net investment income | | | | | | $ | 5,797,247 | | | | | | | $ | 13,443,918 | |
Net realized gains (losses) on investments | | | | | | | (462,294 | ) | | | | | | | 5,377,718 | |
Net change in unrealized gains (losses) on investments | | | | | | | (3,865,647 | ) | | | | | | | 15,459,995 | |
| | | | |
Net increase in net assets resulting from operations | | | | | | | 1,469,306 | | | | | | | | 34,281,631 | |
| | | | |
| | | |
Distributions to shareholders from | | | | | | | | | | | | |
Net investment income | | | | | | | | | | | | | | | | |
Class A | | | | | | | (4,151,620 | ) | | | | | | | (9,459,253 | ) |
Class B | | | | | | | (56,608 | ) | | | | | | | (189,519 | ) |
Class C | | | | | | | (1,152,236 | ) | | | | | | | (2,766,449 | ) |
Administrator Class | | | | | | | (424,367 | ) | | | | | | | (967,151 | ) |
Institutional Class | | | | | | | (12,416 | )1 | | | | | | | N/A | |
| | | | |
Total distributions to shareholders | | | | | | | (5,797,247 | ) | | | | | | | (13,382,372 | ) |
| | | | |
| | | | |
Capital share transactions | | | Shares | | | | | | | | Shares | | | | | |
Proceeds from shares sold | | | | | | | | | | | | | | | | |
Class A | | | 7,334,237 | | | | 24,027,360 | | | | 4,174,488 | | | | 13,529,333 | |
Class B | | | 49,540 | | | | 163,376 | | | | 17,151 | | | | 56,831 | |
Class C | | | 389,186 | | | | 1,274,584 | | | | 821,870 | | | | 2,678,022 | |
Administrator Class | | | 1,351,571 | | | | 4,459,182 | | | | 2,812,042 | | | | 9,171,050 | |
Institutional Class | | | 347,367 | 1 | | | 1,148,494 | 1 | | | N/A | | | | N/A | |
| | | | |
| | | | | | | 31,072,996 | | | | | | | | 25,435,236 | |
| | | | |
Reinvestment of distributions | | | | | | | | | | | | | | | | |
Class A | | | 1,114,188 | | | | 3,658,800 | | | | 2,511,673 | | | | 8,240,513 | |
Class B | | | 15,053 | | | | 49,462 | | | | 51,262 | | | | 167,850 | |
Class C | | | 322,797 | | | | 1,060,525 | | | | 770,176 | | | | 2,526,354 | |
Administrator Class | | | 118,714 | | | | 390,312 | | | | 262,316 | | | | 862,288 | |
Institutional Class | | | 44 | 1 | | | 144 | 1 | | | N/A | | | | N/A | |
| | | | |
| | | | | | | 5,159,243 | | | | | | | | 11,797,005 | |
| | | | |
Payment for shares redeemed | | | | | | | | | | | | | | | | |
Class A | | | (7,667,337 | ) | | | (25,048,175 | ) | | | (15,822,235 | ) | | | (51,599,260 | ) |
Class B | | | (345,348 | ) | | | (1,133,867 | ) | | | (1,002,877 | ) | | | (3,278,584 | ) |
Class C | | | (1,991,630 | ) | | | (6,523,186 | ) | | | (6,460,879 | ) | | | (21,047,143 | ) |
Administrator Class | | | (1,344,287 | ) | | | (4,404,789 | ) | | | (3,853,847 | ) | | | (12,658,859 | ) |
Institutional Class | | | (91,748 | )1 | | | (302,984 | )1 | | | N/A | | | | N/A | |
| | | | |
| | | | | | | (37,413,001 | ) | | | | | | | (88,583,846 | ) |
| | | | |
Net decrease in net assets resulting from capital share transactions | | | | | | | (1,180,762 | ) | | | | | | | (51,351,605 | ) |
| | | | |
Total decrease in net assets | | | | | | | (5,508,703 | ) | | | | | | | (30,452,346 | ) |
| | | | |
| | |
Net assets | | | | | | | | |
Beginning of period | | | | | | | 306,881,957 | | | | | | | | 337,334,303 | |
| | | | |
End of period | | | | | | $ | 301,373,254 | | | | | | | $ | 306,881,957 | |
| | | | |
Overdistributed net investment income | | | | | | $ | (163,588 | ) | | | | | | $ | (163,588 | ) |
| | | | |
| 1 | For the period from October 31, 2014 (commencement of class operations) to February 28, 2015 |
The accompanying notes are an integral part of these financial statements.
| | | | | | |
| Financial highlights | | Wells Fargo Advantage High Yield Bond Fund | | | 17 | |
(For a share outstanding throughout each period)
| | | | | | | | | | | | | | | | | | | | | | | | | | | | |
| | | Six months ended
February 28, 2015
(unaudited) | | | Year ended August 31 | | | Year ended
April 30, 20101 | |
| CLASS A | | | 2014 | | | 2013 | | | 2012 | | | 2011 | | | 20101,2 | | |
Net asset value, beginning of period | | | $3.35 | | | | $3.15 | | | | $3.18 | | | | $3.03 | | | | $3.05 | | | | $3.10 | | | | $2.39 | |
Net investment income | | | 0.07 | | | | 0.14 | | | | 0.15 | | | | 0.20 | | | | 0.21 | | | | 0.08 | | | | 0.25 | |
Net realized and unrealized gains (losses) on investments | | | (0.04 | ) | | | 0.20 | | | | (0.03 | ) | | | 0.15 | | | | (0.02 | ) | | | (0.05 | ) | | | 0.72 | |
| | | | | | | | | | | | | | | | | | | | | | | | | | | | |
Total from investment operations | | | 0.03 | | | | 0.34 | | | | 0.12 | | | | 0.35 | | | | 0.19 | | | | 0.03 | | | | 0.97 | |
Distributions to shareholders from | | | | | | | | | | | | | | | | | | | | | | | | | | | | |
Net investment income | | | (0.07 | ) | | | (0.14 | ) | | | (0.15 | ) | | | (0.20 | ) | | | (0.21 | ) | | | (0.08 | ) | | | (0.26 | ) |
Net asset value, end of period | | | $3.31 | | | | $3.35 | | | | $3.15 | | | | $3.18 | | | | $3.03 | | | | $3.05 | | | | $3.10 | |
Total return3 | | | 0.84 | % | | | 11.02 | % | | | 3.78 | % | | | 12.00 | % | | | 6.07 | % | | | 0.99 | % | | | 42.27 | % |
Ratios to average net assets (annualized) | | | | | | | | | | | | | | | | | | | | | | | | | | | | |
Gross expenses | | | 1.03 | % | | | 1.03 | % | | | 1.04 | % | | | 1.02 | % | | | 1.02 | % | | | 1.06 | % | | | 1.14 | % |
Net expenses | | | 1.03 | % | | | 1.03 | % | | | 1.03 | % | | | 1.02 | % | | | 1.02 | % | | | 1.05 | % | | | 1.13 | % |
Net investment income | | | 4.13 | % | | | 4.35 | % | | | 4.65 | % | | | 6.52 | % | | | 6.60 | % | | | 7.70 | % | | | 8.96 | % |
Supplemental data | | | | | | | | | | | | | | | | | | | | | | | | | | | | |
Portfolio turnover rate | | | 35 | % | | | 40 | % | | | 95 | % | | | 37 | % | | | 70 | % | | | 46 | % | | | 129 | % |
Net assets, end of period (000s omitted) | | | $209,718 | | | | $210,005 | | | | $225,743 | | | | $261,938 | | | | $240,653 | | | | $281,044 | | | | $292,039 | |
| 1 | After the close of business on July 9, 2010, the Fund acquired the net assets of Evergreen High Income Fund which became the accounting and performance survivor in the transaction. The information for the periods prior to July 12, 2010 is that of Class A of Evergreen High Income Fund. |
| 2 | For the four months ended August 31, 2010. The Fund changed its fiscal year end from April 30 to August 31, effective August 31, 2010. |
| 3 | Total return calculations do not include any sales charges. Returns for periods of less than one year are not annualized. |
The accompanying notes are an integral part of these financial statements.
| | | | |
| 18 | | Wells Fargo Advantage High Yield Bond Fund | | Financial highlights |
(For a share outstanding throughout each period)
| | | | | | | | | | | | | | | | | | | | | | | | | | | | |
| | | Six months ended
February 28, 2015
(unaudited) | | | Year ended August 31 | | | Year ended
April 30, 20101 | |
| CLASS B | | | 2014 | | | 2013 | | | 2012 | | | 2011 | | | 20101,2 | | |
Net asset value, beginning of period | | | $3.36 | | | | $3.15 | | | | $3.18 | | | | $3.03 | | | | $3.05 | | | | $3.10 | | | | $2.39 | |
Net investment income | | | 0.05 | 3 | | | 0.12 | 3 | | | 0.13 | 3 | | | 0.18 | 3 | | | 0.18 | 3 | | | 0.07 | | | | 0.22 | |
Net realized and unrealized gains (losses) on investments | | | (0.05 | ) | | | 0.21 | | | | (0.03 | ) | | | 0.15 | | | | (0.02 | ) | | | (0.05 | ) | | | 0.73 | |
| | | | | | | | | | | | | | | | | | | | | | | | | | | | |
Total from investment operations | | | 0.00 | | | | 0.33 | | | | 0.10 | | | | 0.33 | | | | 0.16 | | | | 0.02 | | | | 0.95 | |
Distributions to shareholders from | | | | | | | | | | | | | | | | | | | | | | | | | | | | |
Net investment income | | | (0.05 | ) | | | (0.12 | ) | | | (0.13 | ) | | | (0.18 | ) | | | (0.18 | ) | | | (0.07 | ) | | | (0.24 | ) |
Net asset value, end of period | | | $3.31 | | | | $3.36 | | | | $3.15 | | | | $3.18 | | | | $3.03 | | | | $3.05 | | | | $3.10 | |
Total return4 | | | 0.17 | % | | | 10.53 | % | | | 3.01 | % | | | 11.17 | % | | | 5.28 | % | | | 0.74 | % | | | 41.23 | % |
Ratios to average net assets (annualized) | | | | | | | | | | | | | | | | | | | | | | | | | | | | |
Gross expenses | | | 1.78 | % | | | 1.78 | % | | | 1.78 | % | | | 1.77 | % | | | 1.78 | % | | | 1.81 | % | | | 1.89 | % |
Net expenses | | | 1.78 | % | | | 1.78 | % | | | 1.78 | % | | | 1.77 | % | | | 1.77 | % | | | 1.81 | % | | | 1.88 | % |
Net investment income | | | 3.37 | % | | | 3.63 | % | | | 3.93 | % | | | 5.80 | % | | | 5.85 | % | | | 6.98 | % | | | 8.29 | % |
Supplemental data | | | | | | | | | | | | | | | | | | | | | | | | | | | | |
Portfolio turnover rate | | | 35 | % | | | 40 | % | | | 95 | % | | | 37 | % | | | 70 | % | | | 46 | % | | | 129 | % |
Net assets, end of period (000s omitted) | | | $2,989 | | | | $3,972 | | | | $6,667 | | | | $13,247 | | | | $21,656 | | | | $50,671 | | | | $54,017 | |
| 1 | After the close of business on July 9, 2010, the Fund acquired the net assets of Evergreen High Income Fund which became the accounting and performance survivor in the transaction. The information for the periods prior to July 12, 2010 is that of Class B of Evergreen High Income Fund. |
| 2 | For the four months ended August 31, 2010. The Fund changed its fiscal year end from April 30 to August 31, effective August 31, 2010. |
| 3 | Calculated based upon average shares outstanding |
| 4 | Total return calculations do not include any sales charges. Returns for periods of less than one year are not annualized. |
The accompanying notes are an integral part of these financial statements.
| | | | | | |
| Financial highlights | | Wells Fargo Advantage High Yield Bond Fund | | | 19 | |
(For a share outstanding throughout each period)
| | | | | | | | | | | | | | | | | | | | | | | | | | | | |
| | | Six months ended
February 28, 2015
(unaudited) | | | Year ended August 31 | | | Year ended
April 30, 20101 | |
| CLASS C | | | 2014 | | | 2013 | | | 2012 | | | 2011 | | | 20101,2 | | |
Net asset value, beginning of period | | | $3.35 | | | | $3.15 | | | | $3.18 | | | | $3.03 | | | | $3.05 | | | | $3.10 | | | | $2.39 | |
Net investment income | | | 0.06 | | | | 0.12 | | | | 0.13 | | | | 0.18 | | | | 0.18 | | | | 0.07 | | | | 0.23 | |
Net realized and unrealized gains (losses) on investments | | | (0.05 | ) | | | 0.20 | | | | (0.03 | ) | | | 0.15 | | | | (0.02 | ) | | | (0.05 | ) | | | 0.72 | |
| | | | | | | | | | | | | | | | | | | | | | | | | | | | |
Total from investment operations | | | 0.01 | | | | 0.32 | | | | 0.10 | | | | 0.33 | | | | 0.16 | | | | 0.02 | | | | 0.95 | |
Distributions to shareholders from | | | | | | | | | | | | | | | | | | | | | | | | | | | | |
Net investment income | | | (0.05 | ) | | | (0.12 | ) | | | (0.13 | ) | | | (0.18 | ) | | | (0.18 | ) | | | (0.07 | ) | | | (0.24 | ) |
Net asset value, end of period | | | $3.31 | | | | $3.35 | | | | $3.15 | | | | $3.18 | | | | $3.03 | | | | $3.05 | | | | $3.10 | |
Total return3 | | | 0.47 | % | | | 10.20 | % | | | 3.01 | % | | | 11.17 | % | | | 5.28 | % | | | 0.74 | % | | | 41.23 | % |
Ratios to average net assets (annualized) | | | | | | | | | | | | | | | | | | | | | | | | | | | | |
Gross expenses | | | 1.78 | % | | | 1.78 | % | | | 1.79 | % | | | 1.77 | % | | | 1.77 | % | | | 1.81 | % | | | 1.89 | % |
Net expenses | | | 1.78 | % | | | 1.78 | % | | | 1.78 | % | | | 1.77 | % | | | 1.77 | % | | | 1.81 | % | | | 1.88 | % |
Net investment income | | | 3.38 | % | | | 3.60 | % | | | 3.90 | % | | | 5.78 | % | | | 5.85 | % | | | 6.97 | % | | | 8.21 | % |
Supplemental data | | | | | | | | | | | | | | | | | | | | | | | | | | | | |
Portfolio turnover rate | | | 35 | % | | | 40 | % | | | 95 | % | | | 37 | % | | | 70 | % | | | 46 | % | | | 129 | % |
Net assets, end of period (000s omitted) | | | $67,501 | | | | $72,728 | | | | $83,548 | | | | $99,633 | | | | $95,999 | | | | $104,954 | | | | $106,886 | |
| 1 | After the close of business on July 9, 2010, the Fund acquired the net assets of Evergreen High Income Fund which became the accounting and performance survivor in the transaction. The information for the periods prior to July 12, 2010 is that of Class C of Evergreen High Income Fund. |
| 2 | For the four months ended August 31, 2010. The Fund changed its fiscal year end from April 30 to August 31, effective August 31, 2010. |
| 3 | Total return calculations do not include any sales charges. Returns for periods of less than one year are not annualized. |
The accompanying notes are an integral part of these financial statements.
| | | | |
| 20 | | Wells Fargo Advantage High Yield Bond Fund | | Financial highlights |
(For a share outstanding throughout each period)
| | | | | | | | | | | | | | | | | | | | | | | | | | | | |
| | | Six months ended
February 28, 2015
(unaudited) | | | Year ended August 31 | | | Year ended
April 30, 20101 | |
| ADMINISTRATOR CLASS | | | 2014 | | | 2013 | | | 2012 | | | 2011 | | | 20101,2 | | |
Net asset value, beginning of period | | | $3.36 | | | | $3.15 | | | | $3.18 | | | | $3.03 | | | | $3.05 | | | | $3.10 | | | | $2.39 | |
Net investment income | | | 0.07 | | | | 0.15 | | | | 0.16 | | | | 0.21 | | | | 0.22 | | | | 0.08 | | | | 0.26 | |
Net realized and unrealized gains (losses) on investments | | | (0.05 | ) | | | 0.21 | | | | (0.03 | ) | | | 0.15 | | | | (0.03 | ) | | | (0.05 | ) | | | 0.72 | |
| | | | | | | | | | | | | | | | | | | | | | | | | | | | |
Total from investment operations | | | 0.02 | | | | 0.36 | | | | 0.13 | | | | 0.36 | | | | 0.19 | | | | 0.03 | | | | 0.98 | |
Distributions to shareholders from | | | | | | | | | | | | | | | | | | | | | | | | | | | | |
Net investment income | | | (0.07 | ) | | | (0.15 | ) | | | (0.16 | ) | | | (0.21 | ) | | | (0.21 | ) | | | (0.08 | ) | | | (0.27 | ) |
Net asset value, end of period | | | $3.31 | | | | $3.36 | | | | $3.15 | | | | $3.18 | | | | $3.03 | | | | $3.05 | | | | $3.10 | |
Total return3 | | | 0.66 | % | | | 11.61 | % | | | 4.02 | % | | | 12.25 | % | | | 6.30 | % | | | 1.07 | % | | | 42.62 | % |
Ratios to average net assets (annualized) | | | | | | | | | | | | | | | | | | | | | | | | | | | | |
Gross expenses | | | 0.97 | % | | | 0.96 | % | | | 0.96 | % | | | 0.95 | % | | | 0.95 | % | | | 0.87 | % | | | 0.89 | % |
Net expenses | | | 0.80 | % | | | 0.80 | % | | | 0.80 | % | | | 0.80 | % | | | 0.80 | % | | | 0.81 | % | | | 0.88 | % |
Net investment income | | | 4.37 | % | | | 4.57 | % | | | 4.91 | % | | | 6.73 | % | | | 6.79 | % | | | 7.95 | % | | | 9.17 | % |
Supplemental data | | | | | | | | | | | | | | | | | | | | | | | | | | | | |
Portfolio turnover rate | | | 35 | % | | | 40 | % | | | 95 | % | | | 37 | % | | | 70 | % | | | 46 | % | | | 129 | % |
Net assets, end of period (000s omitted) | | | $20,318 | | | | $20,177 | | | | $21,376 | | | | $37,469 | | | | $26,234 | | | | $48,709 | | | | $93,639 | |
| 1 | After the close of business on July 9, 2010, the Fund acquired the net assets of Evergreen High Income Fund which became the accounting and performance survivor in the transaction. The information for the periods prior to July 12, 2010 is that of Class I of Evergreen High Income Fund. |
| 2 | For the four months ended August 31, 2010. The Fund changed its fiscal year end from April 30 to August 31, effective August 31, 2010. |
| 3 | Returns for periods of less than one year are not annualized. |
The accompanying notes are an integral part of these financial statements.
| | | | | | |
| Financial highlights | | Wells Fargo Advantage High Yield Bond Fund | | | 21 | |
(For a share outstanding throughout the period)
| | | | |
| INSTITUTIONAL CLASS | | Six months ended
February 28, 20151
(unaudited) | |
Net asset value, beginning of period | | | $3.33 | |
Net investment income | | | 0.05 | 2 |
Net realized and unrealized gains (losses) on investments | | | (0.01 | ) |
| | | | |
Total from investment operations | | | 0.04 | |
Distributions to shareholders from | | | | |
Net investment income | | | (0.05 | ) |
Net asset value, end of period | | | $3.32 | |
Total return3 | | | 1.15 | % |
Ratios to average net assets (annualized) | | | | |
Gross expenses | | | 0.70 | % |
Net expenses | | | 0.70 | % |
Net investment income | | | 4.44 | % |
Supplemental data | | | | |
Portfolio turnover rate | | | 35 | % |
Net assets, end of period (000s omitted) | | | $848 | |
| 1 | For the period from October 31, 2014 (commencement of class operations) to February 28, 2015 |
| 2 | Calculated based upon average shares outstanding |
| 3 | Returns for periods of less than one year are not annualized. |
The accompanying notes are an integral part of these financial statements.
| | | | |
| 22 | | Wells Fargo Advantage High Yield Bond Fund | | Notes to financial statements (unaudited) |
1. ORGANIZATION
Wells Fargo Funds Trust (the “Trust”), a Delaware statutory trust organized on March 10, 1999, is an open-end management investment company registered under the Investment Company Act of 1940, as amended (the “1940 Act”). As an investment company, the Trust follows the accounting and reporting guidance in Financial Accounting Standards Board (“FASB”) Accounting Standards Codification Topic 946, Financial Services—Investment Companies. These financial statements report on the Wells Fargo Advantage High Yield Bond Fund (the “Fund”) which is a diversified series of the Trust.
2. SIGNIFICANT ACCOUNTING POLICIES
The following significant accounting policies, which are consistently followed in the preparation of the financial statements of the Fund, are in conformity with U.S. generally accepted accounting principles which require management to make estimates and assumptions that affect the reported amounts of assets and liabilities, disclosure of contingent assets and liabilities at the date of the financial statements, and the reported amounts of revenues and expenses during the reporting period. Actual results could differ from those estimates.
Securities valuation
All investments are valued each business day as of the close of regular trading on the New York Stock Exchange (generally 4 p.m. Eastern Time).
Debt securities are valued at the evaluated bid price provided by an independent pricing service or, if a reliable price is not available, the quoted bid price from an independent broker-dealer.
Equity securities and futures that are listed on a foreign or domestic exchange or market are valued at the official closing price or, if none, the last sales price. If no sale occurs on the primary exchange or market that day, the prior day’s price will be deemed “stale” and a fair value price will be determined in accordance with the Fund’s Valuation Procedures.
Equity securities that are not listed on a foreign or domestic exchange or market, but have a public trading market, are valued at the quoted bid price from an independent broker-dealer that the Management Valuation Team of Wells Fargo Funds Management, LLC (“Funds Management”) has determined is an acceptable source.
Investments in registered open-end investment companies are valued at net asset value. Interests in non-registered investment vehicles that are redeemable at net asset value are fair valued at net asset value when available.
Investments which are not valued using any of the methods discussed above are valued at their fair value, as determined in good faith by the Board of Trustees of the Fund. The Board of Trustees has established a Valuation Committee comprised of the Trustees and has delegated to it the authority to take any actions regarding the valuation of portfolio securities that the Valuation Committee deems necessary or appropriate, including determining the fair value of portfolio securities, unless the determination has been delegated to the Management Valuation Team. The Board of Trustees retains the authority to make or ratify any valuation decisions or approve any changes to the Valuation Procedures as it deems appropriate. On a quarterly basis, the Board of Trustees receives reports on any valuation actions taken by the Valuation Committee or the Management Valuation Team which may include items for ratification.
Valuations of fair valued securities are compared to the next actual sales price when available, or other appropriate market values, to assess the continued appropriateness of the fair valuation methodologies used. These securities are fair valued on a day-to-day basis, taking into consideration changes to appropriate market information and any significant changes to the inputs considered in the valuation process until there is a readily available price provided on an exchange or by an independent pricing service. Valuations received from an independent pricing service or independent broker-dealer quotes are periodically validated by comparisons to most recent trades and valuations provided by other independent pricing services in addition to the review of prices by the adviser and/or subadviser. Unobservable inputs used in determining fair valuations are identified based on the type of security, taking into consideration factors utilized by market participants in valuing the investment, knowledge about the issuer and the current market environment.
Foreign currency translation
The accounting records of the Fund are maintained in U.S. dollars. The values of other assets and liabilities denominated in foreign currencies are translated into U.S. dollars at rates provided by an independent foreign currency pricing source at a time each business day specified by the Management Valuation Team. Purchases and sales of securities, and income and expenses are converted at the rate of exchange on the respective dates of such transactions. Net realized foreign exchange gains or losses arise from sales of foreign currencies, currency gains or losses realized between the trade and settlement dates on securities transactions, and the difference between the amounts of dividends, interest and foreign withholding taxes recorded and the U.S. dollar equivalent of the amounts actually paid or received. Net unrealized
| | | | | | |
| Notes to financial statements (unaudited) | | Wells Fargo Advantage High Yield Bond Fund | | | 23 | |
foreign exchange gains and losses arise from changes in the fair value of assets and liabilities other than investments in securities resulting from changes in exchange rates. The changes in net assets arising from changes in exchange rates and the changes in net assets resulting from changes in market prices of securities are not separately presented. Such changes are included in net realized and unrealized gains or losses from investments.
Security loans
The Fund may lend its securities from time to time in order to earn additional income in the form of fees or interest on securities received as collateral or the investment of any cash received as collateral. The Fund continues to receive interest or dividends on the securities loaned. The Fund receives collateral in the form of cash or securities with a value at least equal to the value of the securities on loan. The value of the loaned securities is determined at the close of each business day and any additional required collateral is delivered to the Fund on the next business day. In a securities lending transaction, the net asset value of the Fund will be affected by an increase or decrease in the value of the securities loaned and by an increase or decrease in the value of the instrument in which collateral is invested. The amount of securities lending activity undertaken by the Fund fluctuates from time to time. In the event of default or bankruptcy by the borrower, the Fund may be prevented from recovering the loaned securities or gaining access to the collateral or may experience delays or costs in doing so. In addition, the investment of any cash collateral received may lose all or part of its value. The Fund has the right under the lending agreement to recover the securities from the borrower on demand.
The Fund lends its securities through an unaffiliated securities lending agent. Cash collateral received in connection with its securities lending transactions is invested in Securities Lending Cash Investments, LLC (the “Securities Lending Fund”). The Securities Lending Fund is exempt from registration under Section 3(c)(7) of the 1940 Act and is managed by Funds Management and is subadvised by Wells Capital Management Incorporated (“WellsCap”). Funds Management receives an advisory fee starting at 0.05% and declining to 0.01% as the average daily net assets of the Securities Lending Fund increase. All of the fees received by Funds Management are paid to WellsCap for its services as subadviser. The Securities Lending Fund seeks to provide a positive return compared to the daily Fed Funds Open rate by investing in high-quality, U.S. dollar-denominated short-term money market instruments. Securities Lending Fund investments are fair valued based upon the amortized cost valuation technique. Income earned from investment in the Securities Lending Fund is included in securities lending income on the Statement of Operations.
When-issued transactions
The Fund may purchase securities on a forward commitment or when-issued basis. The Fund records a when-issued transaction on the trade date and will segregate assets in an amount at least equal in value to the Fund’s commitment to purchase when-issued securities. Securities purchased on a when-issued basis are marked-to-market daily and the Fund begins earning interest on the settlement date. Losses may arise due to changes in the market value of the underlying securities or if the counterparty does not perform under the contract.
Futures contracts
The Fund is subject to interest rate risk and equity price risk in the normal course of pursuing its investment objectives. The Fund may buy and sell futures contracts in order to gain exposure to, or protect against, changes in security values and interest rates. The primary risks associated with the use of futures contracts are the imperfect correlation between changes in market values of securities held by the Fund and the prices of futures contracts, and the possibility of an illiquid market.
The aggregate principal amounts of the contracts are not recorded in the financial statements. Fluctuations in the value of the contracts are recorded in the Statement of Assets and Liabilities as an asset or liability and in the Statement of Operations as unrealized gains or losses until the contracts are closed, at which point they are recorded as net realized gains or losses on futures contracts. With futures contracts, there is minimal counterparty risk to the Fund since futures are exchange traded and the exchange’s clearinghouse, as counterparty to all exchange traded futures, guarantees the futures against default.
Security transactions and income recognition
Securities transactions are recorded on a trade date basis. Realized gains or losses are recorded on the basis of identified cost.
Interest income is accrued daily and bond discounts are accreted and premiums are amortized daily based on the effective interest method. To the extent debt obligations are placed on non-accrual status, any related interest income may be reduced by writing off interest receivables when the collection of all or a portion of interest has become doubtful based on consistently applied procedures. If the issuer subsequently resumes interest payments or when the collectability of interest is reasonably assured, the debt obligation is removed from non-accrual status.
Dividend income is recognized on the ex-dividend date.
| | | | |
| 24 | | Wells Fargo Advantage High Yield Bond Fund | | Notes to financial statements (unaudited) |
Distributions to shareholders
Distributions to shareholders from net investment income are accrued daily and paid monthly. Distributions from net realized gains, if any, are recorded on the ex-dividend date. Such distributions are determined in conformity with federal income tax regulations, which may differ in amount or character from net investment income and realized gains recognized for purposes of U.S. generally accepted accounting principles.
Federal and other taxes
The Fund intends to continue to qualify as a regulated investment company by distributing substantially all of its investment company taxable income and any net realized capital gains (after reduction for capital loss carryforwards) sufficient to relieve it from all, or substantially all, federal income taxes. Accordingly, no provision for federal income taxes was required.
The Fund’s income and federal excise tax returns and all financial records supporting those returns for the prior three fiscal years are subject to examination by the federal and Delaware revenue authorities. Management has analyzed the Fund’s tax positions taken on federal, state, and foreign tax returns for all open tax years and does not believe that there are any uncertain tax positions that require recognition of a tax liability.
As of August 31, 2014, the Fund had capital loss carryforwards available to offset future net realized capital gains in the amount of $56,906,187 with $19,655,495 expiring in 2016, and $37,250,692 expiring in 2017.
Class allocations
The separate classes of shares offered by the Fund differ principally in applicable sales charges, distribution, shareholder servicing, and administration fees. Class specific expenses are charged directly to that share class. Investment income, common expenses, and realized and unrealized gains (losses) on investments are allocated daily to each class of shares based on the relative proportion of net assets of each class.
3. FAIR VALUATION MEASUREMENTS
Fair value measurements of investments are determined within a framework that has established a fair value hierarchy based upon the various data inputs utilized in determining the value of the Fund’s investments. The three-level hierarchy gives the highest priority to unadjusted quoted prices in active markets for identical assets or liabilities (Level 1) and the lowest priority to significant unobservable inputs (Level 3). The Fund’s investments are classified within the fair value hierarchy based on the lowest level of input that is significant to the fair value measurement. The inputs are summarized into three broad levels as follows:
| n | | Level 1 – quoted prices in active markets for identical securities |
| n | | Level 2 – other significant observable inputs (including quoted prices for similar securities, interest rates, prepayment speeds, credit risk, use of amortized cost, etc.) |
| n | | Level 3 – significant unobservable inputs (including the Fund’s own assumptions in determining the fair value of investments) |
The inputs or methodologies used for valuing investments in securities are not necessarily an indication of the risk associated with investing in those securities.
| | | | | | |
| Notes to financial statements (unaudited) | | Wells Fargo Advantage High Yield Bond Fund | | | 25 | |
The following is a summary of the inputs used in valuing the Fund’s assets and liabilities as of February 28, 2015:
| | | | | | | | | | | | | | | | |
| | | Quoted prices
(Level 1) | | | Other significant
observable inputs
(Level 2) | | | Significant
unobservable inputs
(Level 3) | | | Total | |
Assets | | | | | | | | | | | | | | | | |
Investments in: | | | | | | | | | | | | | | | | |
| | | | |
Common stocks | | | | | | | | | | | | | | | | |
Consumer discretionary | | $ | 4,340,640 | | | $ | 0 | | | $ | 0 | | | $ | 4,340,640 | |
Consumer staples | | | 2,056,240 | | | | 0 | | | | 0 | | | | 2,056,240 | |
Energy | | | 2,643,130 | | | | 0 | | | | 0 | | | | 2,643,130 | |
Financials | | | 919,600 | | | | 0 | | | | 0 | | | | 919,600 | |
Health care | | | 3,736,670 | | | | 0 | | | | 0 | | | | 3,736,670 | |
Industrials | | | 7,041,270 | | | | 0 | | | | 0 | | | | 7,041,270 | |
Information technology | | | 2,719,669 | | | | 0 | | | | 0 | | | | 2,719,669 | |
Materials | | | 678,350 | | | | 0 | | | | 0 | | | | 678,350 | |
Utilities | | | 2,817,240 | | | | 0 | | | | 0 | | | | 2,817,240 | |
| | | | |
Corporate bonds and notes | | | 0 | | | | 250,094,649 | | | | 0 | | | | 250,094,649 | |
| | | | |
Yankee corporate bonds and notes | | | 0 | | | | 15,627,181 | | | | 0 | | | | 15,627,181 | |
| | | | |
Short-term investments | | | | | | | | | | | | | | | | |
Investment companies | | | 4,706,115 | | | | 8,334,835 | | | | 0 | | | | 13,040,950 | |
Total Assets | | | 31,658,924 | | | | 274,056,665 | | | | 0 | | | | 305,715,589 | |
The Fund recognizes transfers between levels within the fair value hierarchy at the end of the reporting period. At February 28, 2015, the Fund did not have any transfers into/out of Level 1, Level 2, or Level 3.
4. TRANSACTIONS WITH AFFILIATES
Advisory fee
The Trust has entered into an advisory contract with Funds Management, an indirect wholly owned subsidiary of Wells Fargo & Company (“Wells Fargo”). The adviser is responsible for implementing investment policies and guidelines and for supervising the subadviser, who is responsible for day-to-day portfolio management of the Fund.
Pursuant to the contract, Funds Management is entitled to receive an annual advisory fee starting at 0.50% and declining to 0.40% as the average daily net assets of the Fund increase. For the six months ended February 28, 2015, the advisory fee was equivalent to an annual rate of 0.50% of the Fund’s average daily net assets.
Funds Management has retained the services of a subadviser to provide daily portfolio management to the Fund. The fee for subadvisory services is borne by Funds Management. WellsCap, an affiliate of Funds Management and an indirect wholly owned subsidiary of Wells Fargo, is the subadviser to the Fund and is entitled to receive a fee from Funds Management at an annual rate starting at 0.35% and declining to 0.20% as the average daily net assets of the Fund increase.
Administration fees
The Trust has entered into an administration agreement with Funds Management. Under this agreement, for providing administrative services, which includes paying fees and expenses for services provided by the transfer agent, sub-transfer agents, omnibus account servicers and record-keepers, Funds Management is entitled to receive from the Fund an annual fund level administration fee starting at 0.05% and declining to 0.03% as the average daily net assets of the Fund increase and a class level administration fee which is calculated based on the average daily net assets of each class as follows:
| | | | |
| | | Class level
administration fee | |
Class A, Class B, Class C | | | 0.16 | % |
Administrator Class | | | 0.10 | |
Institutional Class | | | 0.08 | |
| | | | |
| 26 | | Wells Fargo Advantage High Yield Bond Fund | | Notes to financial statements (unaudited) |
Funds Management has contractually waived and/or reimbursed advisory and administration fees to the extent necessary to maintain certain net operating expense ratios for the Fund. Waiver of fees and/or reimbursement of expenses by Funds Management were made first from fund level expenses on a proportionate basis and then from class specific expenses. Funds Management has committed through December 31, 2015 to waive fees and/or reimburse expenses to the extent necessary to cap the Fund’s expenses at 1.03% for Class A shares, 1.78% for Class B shares, 1.78% for Class C shares, 0.80% for Administrator Class shares and 0.70% for Institutional Class shares. After this time, the cap may be increased or the commitment to maintain the cap may be terminated only with the approval of the Board of Trustees.
Distribution fees
The Trust has adopted a Distribution Plan for Class B and Class C shares of the Fund pursuant to Rule 12b-1 under the 1940 Act. Distribution fees are charged to Class B and Class C shares and paid to Wells Fargo Funds Distributor, LLC (“Funds Distributor”), the principal underwriter, at an annual rate of 0.75% of the average daily net assets of Class B and Class C shares.
In addition, Funds Distributor is entitled to receive the front-end sales charge from the purchase of Class A shares and a contingent deferred sales charge on the redemption of certain shares. Funds Distributor is also entitled to receive the contingent deferred sales charges from redemptions of Class B and Class C shares. For the six months ended February 28, 2015, Funds Distributor received $2,103 from the sale of Class A shares.
Shareholder servicing fees
The Trust has entered into contracts with one or more shareholder servicing agents, whereby Class A, Class B, Class C and Administrator Class of the Fund is charged a fee at an annual rate of 0.25% of the average daily net assets of each respective class.
A portion of these total shareholder servicing fees were paid to affiliates of Wells Fargo.
5. INVESTMENT PORTFOLIO TRANSACTIONS
Purchases and sales of investments, excluding U.S. government obligations (if any) and short-term securities, for the six months ended February 28, 2015 were $100,920,248 and $101,002,414, respectively.
6. DERIVATIVE TRANSACTIONS
During the six months ended February 28, 2015, the Fund entered into futures contracts to speculate on interest rates and to help manage the duration of the portfolio.
As of February 28, 2015, the Fund did not have any open futures contracts. The Fund had an average notional amount of $3,055,493 in short futures contracts during the six months ended February 28, 2015.
7. BANK BORROWINGS
The Trust (excluding the money market funds and certain other funds in the Trust) and Wells Fargo Variable Trust are parties to a $150,000,000 revolving credit agreement, whereby the Fund is permitted to use bank borrowings for temporary or emergency purposes, such as to fund shareholder redemption requests. Interest under the credit agreement is charged to the Fund based on a borrowing rate equal to the higher of the Federal Funds rate in effect on that day plus 1.25% or the overnight LIBOR rate in effect on that day plus 1.25%. In addition, an annual commitment fee equal to 0.10% of the unused balance is allocated to each participating fund. For the six months ended February 28, 2015, the Fund paid $279 in commitment fees.
For the six months ended February 28, 2015, there were no borrowings by the Fund under the agreement.
8. INDEMNIFICATION
Under the Trust’s organizational documents, the officers and Trustees are indemnified against certain liabilities that may arise out of performance of their duties to the Trust. Additionally, in the normal course of business, the Trust may enter into contracts with service providers that contain a variety of indemnification clauses. The Trust’s maximum exposure under these arrangements is dependent on future claims that may be made against the Fund and, therefore, cannot be estimated.
| | | | | | |
| Other information (unaudited) | | Wells Fargo Advantage High Yield Bond Fund | | | 27 | |
PROXY VOTING INFORMATION
A description of the policies and procedures that the Fund uses to determine how to vote proxies relating to portfolio securities is available, upon request, by calling 1-800-222-8222, visiting our website at wellsfargoadvantagefunds.com, or visiting the SEC website at sec.gov. Information regarding how the Fund voted proxies relating to portfolio securities during the most recent 12-month period ended June 30 is available on the Fund’s website at wellsfargoadvantagefunds.com or by visiting the SEC website at sec.gov.
PORTFOLIO HOLDINGS INFORMATION
The complete portfolio holdings for the Fund are publicly available monthly on the Fund’s website (wellsfargoadvantagefunds.com), on a one-month delayed basis. In addition, top ten holdings information (excluding derivative positions) for the Fund is publicly available on the Fund’s website on a monthly, seven-day or more delayed basis. The Fund files its complete schedule of portfolio holdings with the SEC for the first and third quarters of each fiscal year on Form N-Q, which is available by visiting the SEC website at sec.gov. In addition, the Fund’s Form N-Q may be reviewed and copied at the SEC’s Public Reference Room in Washington, DC, and at regional offices in New York City, at 233 Broadway, and in Chicago, at 175 West Jackson Boulevard, Suite 900. Information about the Public Reference Room may be obtained by calling 1-800-SEC-0330.
| | | | |
| 28 | | Wells Fargo Advantage High Yield Bond Fund | | Other information (unaudited) |
BOARD OF TRUSTEES AND OFFICERS
Each of the Trustees and Officers1 listed in the table below acts in identical capacities for each fund in the Wells Fargo Advantage family of funds, which consists of 134 mutual funds comprising the Wells Fargo Funds Trust, Wells Fargo Variable Trust, Wells Fargo Master Trust and four closed-end funds (collectively the “Fund Complex”). This table should be read in conjunction with the Prospectus and the Statement of Additional Information2. The mailing address of each Trustee and Officer is 525 Market Street, 12th Floor, San Francisco, CA 94105. Each Trustee and Officer serves an indefinite term, however, each Trustee serves such term until reaching the mandatory retirement age established by the Trustees.
Independent Trustees
| | | | | | |
Name and
year of birth | | Position held and
length of service* | | Principal occupations during past five years or longer | | Other
directorships during
past five years |
| William R. Ebsworth (Born 1957) | | Trustee, since 2015** | | Retired. From 1984 to 2013, equities analyst, portfolio manager, research director at Fidelity Management and Research Company and retired in 2013 as Chief Investment Officer of Fidelity Strategic Advisers, Inc. in Boston, Tokyo, and Hong Kong where he led a team of investment professionals managing client assets. Prior thereto, Board member of Hong Kong Securities Clearing Co., Hong Kong Options Clearing Corp., the Thailand International Fund, Ltd., Fidelity Investments Life Insurance Company, and Empire Fidelity Investments Life Insurance Company. Mr. Ebsworth is an Adjunct Lecturer, Finance, at Babson College and a Chartered Financial Analyst. | | Asset Allocation Trust |
Jane A. Freeman (Born 1953) | | Trustee, since 2015** | | Retired. From 2012 to 2014 and 1999 to 2008, Chief Financial Officer of Scientific Learning Corporation. From 2008 to 2012, Ms. Freeman provided consulting services related to strategic business projects. Prior thereto, Portfolio Manager at Rockefeller & Co. and Scudder, Stevens & Clark. Board member of the Harding Loevner Funds from 1996 to 2014, serving as both Lead Independent Director and chair of the Audit Committee. Board member of the Russell Exchange Traded Funds Trust from 2011 to 2012 and the chair of the Audit Committee. Ms. Freeman is a Chartered Financial Analyst (inactive), Chair of Taproot Foundation (non-profit organization) and a Board Member of Ruth Bancroft Garden (non-profit organization). | | Asset Allocation Trust |
Peter G. Gordon (Born 1942) | | Trustee, since 1998; Chairman, since 2005 | | Co-Founder, Retired Chairman, President and CEO of Crystal Geyser Water Company. Trustee Emeritus, Colby College. | | Asset Allocation Trust |
Isaiah Harris, Jr. (Born 1952) | | Trustee, since 2009 | | Retired. Chairman of the Board of CIGNA Corporation since 2009, and Director since 2005. From 2003 to 2011, Director of Delux Corporation. Prior thereto, President and CEO of BellSouth Advertising and Publishing Corp. from 2005 to 2007, President and CEO of BellSouth Enterprises from 2004 to 2005 and President of BellSouth Consumer Services from 2000 to 2003. Emeritus member of the Iowa State University Foundation Board of Governors. Emeritus Member of the Advisory Board of Iowa State University School of Business. Advisory Board Member, Palm Harbor Academy. Mr. Harris is a certified public accountant. | | CIGNA Corporation; Asset Allocation Trust |
Judith M. Johnson (Born 1949) | | Trustee, since 2008; Audit Committee Chairman, since 2008 | | Retired. Prior thereto, Chief Executive Officer and Chief Investment Officer of Minneapolis Employees Retirement Fund from 1996 to 2008. Ms. Johnson is an attorney, certified public accountant and a certified managerial accountant. | | Asset Allocation Trust |
David F. Larcker (Born 1950) | | Trustee, since 2009 | | James Irvin Miller Professor of Accounting at the Graduate School of Business, Stanford University, Morgan Stanley Director of the Center for Leadership Development and Research and Senior Faculty of The Rock Center for Corporate Governance since 2006. From 2005 to 2008, Professor of Accounting at the Graduate School of Business, Stanford University. Prior thereto, Ernst & Young Professor of Accounting at The Wharton School, University of Pennsylvania from 1985 to 2005. | | Asset Allocation Trust |
Olivia S. Mitchell (Born 1953) | | Trustee, since 2006 | | International Foundation of Employee Benefit Plans Professor, Wharton School of the University of Pennsylvania since 1993. Director of Wharton’s Pension Research Council and Boettner Center on Pensions & Retirement Research, and Research Associate at the National Bureau of Economic Research. Previously, Cornell University Professor from 1978 to 1993. | | Asset Allocation Trust |
| | | | | | |
| Other information (unaudited) | | Wells Fargo Advantage High Yield Bond Fund | | | 29 | |
| | | | | | |
Name and
year of birth | | Position held and
length of service* | | Principal occupations during past five years or longer | | Other
directorships during
past five years |
| Timothy J. Penny (Born 1951) | | Trustee, since 1996 | | President and Chief Executive Officer of Southern Minnesota Initiative Foundation, a non-profit organization, since 2007 and Senior Fellow at the Humphrey Institute Policy Forum at the University of Minnesota since 1995. Member of the Board of Trustees of NorthStar Education Finance, Inc., a non-profit organization, since 2007. | | Asset Allocation Trust |
| Michael S. Scofield (Born 1943) | | Trustee, since 2010 | | Served on the Investment Company Institute’s Board of Governors and Executive Committee from 2008-2011 as well the Governing Council of the Independent Directors Council from 2006-2011 and the Independent Directors Council Executive Committee from 2008-2011. Chairman of the IDC from 2008-2010. Institutional Investor (Fund Directions) Trustee of Year in 2007. Trustee of the Evergreen Funds complex (and its predecessors) from 1984 to 2010. Chairman of the Evergreen Funds from 2000-2010. Former Trustee of the Mentor Funds. Retired Attorney, Law Offices of Michael S. Scofield. | | Asset Allocation Trust |
| Donald C. Willeke (Born 1940) | | Trustee, since 1996 | | Principal of the law firm of Willeke & Daniels. General Counsel of the Minneapolis Employees Retirement Fund from 1984 until its consolidation into the Minnesota Public Employees Retirement Association on June 30, 2010. Director and Vice Chair of The Tree Trust (non-profit corporation). Director of the American Chestnut Foundation (non-profit corporation). | | Asset Allocation Trust |
| * | Length of service dates reflect the Trustee’s commencement of service with the Trust’s predecessor entities, where applicable. |
| ** | William R. Ebsworth and Jane A. Freeman each became a Trustee effective January 1, 2015. |
Officers
| | | | | | |
Name and
year of birth | | Position held and
length of service | | Principal occupations during past five years or longer | | |
Karla M. Rabusch
(Born 1959) | | President, since 2003 | | Executive Vice President of Wells Fargo Bank, N.A. and President of Wells Fargo Funds Management, LLC since 2003. | | |
Nancy Wiser1 (Born 1967) | | Treasurer, since 2012 | | Executive Vice President of Wells Fargo Funds Management, LLC since 2011. Chief Operating Officer and Chief Compliance Officer at LightBox Capital Management LLC, from 2008 to 2011. Owned and operated a consulting business providing services to various hedge funds including acting as Chief Operating Officer and Chief Compliance Officer for a hedge fund from 2007 to 2008. Chief Operating Officer and Chief Compliance Officer of GMN Capital LLC from 2006 to 2007. | | |
C. David Messman (Born 1960) | | Secretary, since 2000; Chief Legal Officer, since 2003 | | Senior Vice President and Secretary of Wells Fargo Funds Management, LLC since 2001. Assistant General Counsel of Wells Fargo Bank, N.A. since 2013 and Vice President and Managing Counsel of Wells Fargo Bank N.A. from 1996 to 2013. | | |
Debra Ann Early (Born 1964) | | Chief Compliance Officer, since 2007 | | Senior Vice President of Wells Fargo Funds Management, LLC since 2007 and Chief Compliance Officer from 2007 to 2014. Chief Compliance Officer of Parnassus Investments from 2005 to 2007. Chief Financial Officer of Parnassus Investments from 2004 to 2007 and Senior Audit Manager of PricewaterhouseCoopers LLP from 1998 to 2004. | | |
David Berardi (Born 1975) | | Assistant Treasurer, since 2009 | | Vice President of Wells Fargo Funds Management, LLC since 2009. Vice President of Evergreen Investment Management Company, LLC from 2008 to 2010. Assistant Vice President of Evergreen Investment Services, Inc. from 2004 to 2008. Manager of Fund Reporting and Control for Evergreen Investment Management Company, LLC from 2004 to 2010. | | |
Jeremy DePalma1 (Born 1974) | | Assistant Treasurer, since 2009 | | Senior Vice President of Wells Fargo Funds Management, LLC since 2009. Senior Vice President of Evergreen Investment Management Company, LLC from 2008 to 2010. Vice President, Evergreen Investment Services, Inc. from 2004 to 2007. Head of the Fund Reporting and Control Team within Fund Administration from 2005 to 2010. | | |
| 1 | Nancy Wiser acts as Treasurer of 73 funds in the Fund Complex. Jeremy DePalma acts as Treasurer of 61 funds and Assistant Treasurer of 73 funds in the Fund Complex. |
| 2 | The Statement of Additional Information includes additional information about the Trustees and is available, without charge, upon request, by calling 1-800-222-8222 or by visiting the website at wellsfargoadvantagefunds.com. |
| | | | |
| 30 | | Wells Fargo Advantage High Yield Bond Fund | | List of abbreviations |
The following is a list of common abbreviations for terms and entities that may have appeared in this report.
| ACA | — ACA Financial Guaranty Corporation |
| ADR | — American depositary receipt |
| ADS | — American depositary shares |
| AGC | — Assured Guaranty Corporation |
| AGM | — Assured Guaranty Municipal |
| Ambac | — Ambac Financial Group Incorporated |
| AMT | — Alternative minimum tax |
| BAN | — Bond anticipation notes |
| BHAC | — Berkshire Hathaway Assurance Corporation |
| CAB | — Capital appreciation bond |
| CCAB | — Convertible capital appreciation bond |
| CDA | — Community Development Authority |
| CDO | — Collateralized debt obligation |
| DRIVER | — Derivative inverse tax-exempt receipts |
| DW&P | — Department of Water & Power |
| DWR | — Department of Water Resources |
| ECFA | — Educational & Cultural Facilities Authority |
| EDA | — Economic Development Authority |
| EDFA | — Economic Development Finance Authority |
| ETF | — Exchange-traded fund |
| FDIC | — Federal Deposit Insurance Corporation |
| FFCB | — Federal Farm Credit Banks |
| FGIC | — Financial Guaranty Insurance Corporation |
| FHA | — Federal Housing Administration |
| FHLB | — Federal Home Loan Bank |
| FHLMC | — Federal Home Loan Mortgage Corporation |
| FICO | — The Financing Corporation |
| FNMA | — Federal National Mortgage Association |
| GDR | — Global depositary receipt |
| GNMA | — Government National Mortgage Association |
| HCFR | — Healthcare facilities revenue |
| HEFA | — Health & Educational Facilities Authority |
| HEFAR | — Higher education facilities authority revenue |
| HFA | — Housing Finance Authority |
| HFFA | — Health Facilities Financing Authority |
| HUD | — Department of Housing and Urban Development |
| IDA | — Industrial Development Authority |
| IDAG | — Industrial Development Agency |
| KRW | — Republic of Korea won |
| LIBOR | — London Interbank Offered Rate |
| LIFER | — Long Inverse Floating Exempt Receipts |
| LLC | — Limited liability company |
| LLLP | — Limited liability limited partnership |
| LLP | — Limited liability partnership |
| MBIA | — Municipal Bond Insurance Association |
| MFHR | — Multifamily housing revenue |
| MSTR | — Municipal securities trust receipts |
| MUD | — Municipal Utility District |
| National | — National Public Finance Guarantee Corporation |
| PCFA | — Pollution Control Financing Authority |
| PCL | — Public Company Limited |
| PCR | — Pollution control revenue |
| PFA | — Public Finance Authority |
| PFFA | — Public Facilities Financing Authority |
| PFOTER | — Puttable floating option tax-exempt receipts |
| plc | — Public limited company |
| PUTTER | — Puttable tax-exempt receipts |
| R&D | — Research & development |
| Radian | — Radian Asset Assurance |
| RAN | — Revenue anticipation notes |
| RDA | — Redevelopment Authority |
| RDFA | — Redevelopment Finance Authority |
| REIT | — Real estate investment trust |
| ROC | — Reset option certificates |
| SAVRS | — Select auction variable rate securities |
| SBA | — Small Business Authority |
| SFHR | — Single-family housing revenue |
| SFMR | — Single-family mortgage revenue |
| SPA | — Standby purchase agreement |
| SPDR | — Standard & Poor’s Depositary Receipts |
| SPEAR | — Short Puttable Exempt Adjustable Receipts |
| STRIPS | — Separate trading of registered interest and |
| TAN | — Tax anticipation notes |
| TIPS | — Treasury inflation-protected securities |
| TRAN | — Tax revenue anticipation notes |
| TTFA | — Transportation Trust Fund Authority |
| TVA | — Tennessee Valley Authority |
This page is intentionally left blank.
This page is intentionally left blank.


For more information
More information about Wells Fargo Advantage Funds is available free upon request. To obtain literature, please write, email, visit the Fund’s website, or call:
Wells Fargo Advantage Funds
P.O. Box 8266
Boston, MA 02266-8266
Email: wfaf@wellsfargo.com
Website: wellsfargoadvantagefunds.com
Individual investors: 1-800-222-8222
Retail investment professionals: 1-888-877-9275
Institutional investment professionals: 1-866-765-0778
This report and the financial statements contained herein are submitted for the general information of the shareholders of Wells Fargo Advantage Funds. If this report is used for promotional purposes, distribution of the report must be accompanied or preceded by a current prospectus. Before investing, please consider the investment objectives, risks, charges, and expenses of the investment. For a current prospectus and, if available, a summary prospectus, containing this information, call 1-800-222-8222 or visit the Fund’s website at wellsfargoadvantagefunds.com. Read the prospectus carefully before you invest or send money.
Wells Fargo Funds Management, LLC, a wholly owned subsidiary of Wells Fargo & Company, provides investment advisory and administrative services for Wells Fargo Advantage Funds. Other affiliates of Wells Fargo & Company provide subadvisory and other services for the Funds. The Funds are distributed by Wells Fargo Funds Distributor, LLC, Member FINRA/SIPC, an affiliate of Wells Fargo & Company.
NOT FDIC INSURED ¡ NO BANK GUARANTEE ¡ MAY LOSE VALUE
© 2015 Wells Fargo Funds Management, LLC. All rights reserved.
| | |
 | | 232055 04-15 SA218/SAR218 02-15 |

Wells Fargo Advantage Income Plus Fund

Semi-Annual Report
February 28, 2015

Reduce clutter. Save trees.
Sign up for electronic delivery of prospectuses and shareholder reports at wellsfargo.com/advantagedelivery
Contents
The views expressed and any forward-looking statements are as of February 28, 2015, unless otherwise noted, and are those of the Fund managers and/or Wells Fargo Funds Management, LLC. Discussions of individual securities, or the markets generally, or any Wells Fargo Advantage Fund are not intended as individual recommendations. Future events or results may vary significantly from those expressed in any forward-looking statements; the views expressed are subject to change at any time in response to changing circumstances in the market. Wells Fargo Funds Management, LLC and the Fund disclaim any obligation to publicly update or revise any views expressed or forward-looking statements.
NOT FDIC INSURED ¡ NO BANK GUARANTEE ¡ MAY LOSE VALUE
| | | | |
| 2 | | Wells Fargo Advantage Income Plus Fund | | Letter to shareholders (unaudited) |

Karla M. Rabusch
President
Wells Fargo Advantage Funds
Major central banks continued to inject liquidity into global banks and markets through various accommodative monetary policies, including quantitative easing.
Dear Valued Shareholder:
We are pleased to offer you this semi-annual report for the Wells Fargo Advantage Income Plus Fund for the six-month period that ended February 28, 2015. The period was marked by low interest rates, a large decline in oil prices, and moderate U.S. economic growth. Investment-grade bonds, as measured by the Barclays U.S. Aggregate Bond Index1, returned 2.25% during the period.
Major central banks continued to provide stimulus.
Major central banks continued to inject liquidity into global banks and markets through various accommodative monetary policies, including quantitative easing. In the U.S., the Federal Reserve (Fed) kept its key interest rate near zero in order to support the economy and the financial system. It ended its quantitative easing program in October 2014 and also set expectations for it to begin normalizing monetary policy with higher target ranges for the federal funds rate in 2015.
Meanwhile, European markets continued to benefit from the European Central Bank’s (ECB’s) willingness to maintain low interest rates. In September 2014, the ECB cut its key rate to a historic low of 0.05%. In addition to its targeted longer-term refinancing operations that are designed to increase bank lending, the ECB said it intends to increase the size of its balance sheet, a result of quantitative easing, by buying eurozone government bonds. In Japan, the Bank of Japan maintained an aggressive monetary program aimed at combating deflation.
U.S. economic growth was moderate, and oil prices plummeted.
Economic growth advanced during the reporting period, the unemployment rate ticked lower to 5.5% as of February 2015, and inflation remained below the Fed’s longer-run objective of a 2% pace. The period was also marked by dramatically lower oil prices, which fell from more than $90 per barrel at the end of August 2014 to below $50 per barrel at the end of February 2015. While lower oil prices benefited consumers of oil products, the lower prices pressured companies within the energy sector.
Longer-dated securities and higher-rated credits were top performers.
Ten-year U.S. Treasury rates declined during the period, from 2.35% at end of August 2014 to 2.03% by the end of February 2015, benefiting both from safe-haven status as well as relative attractiveness to global investors. With the U.S. economy the furthest along its business cycle, the level of interest rates in the U.S. and Europe diverged. The 10-year U.S. Treasury yield was 2.03% at the end of February 2015 compared with 0.30% for 10-year German government yields, 173 basis points (bps; 100 bps equals 1.00%) higher. This was largely attributed to the Fed being closer to eventually increasing interest rates while the ECB potentially needs to further increase, rather than scale back, its amount of accommodation. Further, U.S. economic activity was healthier than Europe’s.
Treasury bonds with maturities greater than 20 years returned more than 10% during the six-month period that ended February 28, 2015, according to the Barclays U.S. Aggregate Bond Index. This was due, in part, to strong demand from overseas investors because yields in Europe and Japan were substantially lower than U.S. yields. In addition, because the dollar strengthened, the returns from Treasuries were even higher for foreign-domiciled investors. Longer-maturity debt across all sectors outperformed shorter-dated securities.
| 1 | The Barclays U.S. Aggregate Bond Index is a broad-based benchmark that measures the investment-grade, U.S. dollar–denominated, fixed-rate taxable bond market, including Treasuries, government-related and corporate securities, mortgage-backed securities (agency fixed-rate and hybrid adjustable-rate mortgage pass-throughs), asset-backed securities, and commercial mortgage-backed securities. You cannot invest directly in an index. |
| | | | | | |
| Letter to shareholders (unaudited) | | Wells Fargo Advantage Income Plus Fund | | | 3 | |
Investment-grade corporate bonds returned 2.29% during the six-month reporting period, according to the Barclays U.S. Aggregate Bond Index, and AAA-rated bonds2 had higher returns than BBB-rated bonds. Lower-rated credits, including high yield, underperformed as oil prices fell dramatically. Not only were many energy and mining companies negatively affected, but investor trepidation about weak global growth caused investment-grade spreads to modestly widen while high-yield spreads widened substantially.
Don’t let short-term uncertainty derail long-term investment goals.
Periods of uncertainty can present challenges, but experience has taught us that maintaining long-term investment goals can be an effective way to plan for the future. To help you create a sound strategy based on your personal goals and risk tolerance, Wells Fargo Advantage Funds offers more than 100 mutual funds and other investments spanning a wide range of asset classes and investment styles. Although diversification cannot guarantee an investment profit or prevent losses, we believe it can be an effective way to manage investment risk and potentially smooth out overall portfolio performance. We encourage investors to know their investments and to understand that appropriate levels of risk-taking may unlock opportunities.
Thank you for choosing to invest with Wells Fargo Advantage Funds. We appreciate your confidence in us and remain committed to helping you meet your financial needs. For current information about your fund investments, contact your investment professional, visit our website at wellsfargoadvantagefunds.com, or call us directly at 1-800-222-8222. We are available 24 hours a day, 7 days a week.
Sincerely,

Karla M. Rabusch
President
Wells Fargo Advantage Funds
Periods of uncertainty can present challenges, but experience has taught us that maintaining long-term investment goals can be an effective way to plan for the future.
| 2 | The ratings indicated are from Standard & Poor’s, Moody’s Investors Service, and/or Fitch Ratings Ltd. Standard & Poor’s rates the creditworthiness of bonds from AAA (highest) to D (lowest). Ratings from A to CCC may be modified by the addition of a plus (+) or minus (-) sign to show relative standing within the rating categories. Moody’s rates the creditworthiness of bonds from Aaa (highest) to C (lowest). Ratings Aa to B may be modified by the addition of a number 1 (highest) to 3 (lowest) to show relative standing within the ratings categories. Fitch rates the creditworthiness of bonds from AAA (highest) to D (lowest). |
| | | | |
| 4 | | Wells Fargo Advantage Income Plus Fund | | Performance highlights (unaudited) |
Investment objective
The Fund seeks total return, consisting of current income and capital appreciation.
Adviser
Wells Fargo Funds Management, LLC
Subadviser
Wells Capital Management Incorporated
Portfolio managers
Michael J. Bray, CFA
Thomas M. Price, CFA
Noah Wise, CFA
Average annual total returns1 (%) as of February 28, 2015
| | | | | | | | | | | | | | | | | | | | | | | | | | | | | | | | | | |
| | | | | Including sales charge | | | Excluding sales charge | | | Expense ratios2 (%) | |
| | | Inception date | | 1 year | | | 5 year | | | 10 year | | | 1 year | | | 5 year | | | 10 year | | | Gross | | | Net3 | |
| Class A (STYAX) | | 7-13-1998 | | | 0.88 | | | | 4.12 | | | | 4.93 | | | | 5.59 | | | | 5.08 | | | | 5.41 | | | | 0.94 | | | | 0.85 | |
| Class B (STYBX)* | | 7-13-1998 | | | (0.25 | ) | | | 3.95 | | | | 4.86 | | | | 4.75 | | | | 4.30 | | | | 4.86 | | | | 1.69 | | | | 1.60 | |
| Class C (WFIPX) | | 7-13-1998 | | | 3.79 | | | | 4.32 | | | | 4.63 | | | | 4.79 | | | | 4.32 | | | | 4.63 | | | | 1.69 | | | | 1.60 | |
| Administrator Class (WIPDX) | | 7-30-2010 | | | – | | | | – | | | | – | | | | 5.72 | | | | 5.22 | | | | 5.45 | | | | 0.88 | | | | 0.73 | |
| Institutional Class (WIPIX) | | 7-18-2008 | | | – | | | | – | | | | – | | | | 5.86 | | | | 5.41 | | | | 5.63 | | | | 0.61 | | | | 0.59 | |
| Investor Class (WIPNX) | | 7-18-2008 | | | | | | | | | | | | | | | 5.58 | | | | 5.06 | | | | 5.39 | | | | 0.97 | | | | 0.86 | |
| Barclays U.S. Universal Bond Index4 | | – | | | – | | | | – | | | | – | | | | 4.80 | | | | 4.69 | | | | 5.03 | | | | – | | | | – | |
| * | | Class B shares are closed to investment, except in connection with the reinvestment of any distributions and permitted exchanges. |
Figures quoted represent past performance, which is no guarantee of future results, and do not reflect taxes that a shareholder may pay on fund distributions or the redemption of fund shares. Investment return and principal value of an investment will fluctuate so that an investor’s shares, when redeemed, may be worth more or less than their original cost. Performance shown without sales charges would be lower if sales charges were reflected. Current performance may be lower or higher than the performance data quoted, which assumes the reinvestment of dividends and capital gains. Current month-end performance is available on the Fund’s website, wellsfargoadvantagefunds.com.
Index returns do not include transaction costs associated with buying and selling securities, any mutual fund fees or expenses, or any taxes. It is not possible to invest directly in an index.
For Class A shares, the maximum front-end sales charge is 4.50%. For Class B shares, the maximum contingent deferred sales charge is 5.00%. For Class C shares, the maximum contingent deferred sales charge is 1.00%. Performance including a contingent deferred sales charge assumes the sales charge for the corresponding time period. Administrator Class, Institutional Class, and Investor Class shares are sold without a front-end sales charge or contingent deferred sales charge.
Bond values fluctuate in response to the financial condition of individual issuers, general market and economic conditions, and changes in interest rates. Changes in market conditions and government policies may lead to periods of heightened volatility in the bond market and reduced liquidity for certain bonds held by the Fund. In general, when interest rates rise, bond values fall and investors may lose principal value. Interest-rate changes and their impact on the Fund and its share price can be sudden and unpredictable. Loans are subject to risks similar to those associated with other below-investment-grade bond investments, such as credit risk (for example, risk of issuer default), below-investment-grade bond risk (for example, risk of greater volatility in value), and risk that the loan may become illiquid or difficult to price. The use of derivatives may reduce returns and/or increase volatility. Certain investment strategies tend to increase the total risk of an investment (relative to the broader market). The Fund is exposed to foreign investment risk, high-yield securities risk, and mortgage and asset-backed securities risk. Consult the Fund’s prospectus for additional information on these and other risks.
Please see footnotes on page 5.
| | | | | | |
| Performance highlights (unaudited) | | Wells Fargo Advantage Income Plus Fund | | | 5 | |
| | | | |
| Ten largest long-term holdings5 (%) as of February 28, 2015 | |
FNMA, 3.00%, 3-1-2045 | | | 4.77 | |
U.S. Treasury Note, 0.38%, 3-15-2015 | | | 4.47 | |
FNMA, 3.50%, 3-1-2045 | | | 3.64 | |
U.S. Treasury Note, 2.25%, 7-31-2018 | | | 3.34 | |
FNMA, 4.50%, 3-1-2045 | | | 3.15 | |
FHLMC, 3.50%, 3-1-2045 | | | 2.42 | |
U.S. Treasury Note, 1.00%, 8-31-2016 | | | 2.11 | |
U.S. Treasury Note, 0.25%, 12-15-2015 | | | 2.08 | |
FNMA, 4.00%, 3-1-2045 | | | 2.01 | |
U.S. Treasury Note, 1.00%, 5-31-2018 | | | 1.89 | |
|
| Portfolio allocation6 as of February 28, 2015 |
|
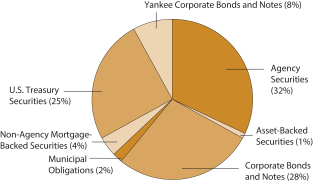 |
| 1 | Historical performance shown for Administrator Class shares prior to their inception reflects the performance of Institutional Class shares and has been adjusted to include the higher expenses applicable to Administrator Class shares. Historical performance shown for Institutional Class shares prior to their inception reflects the performance of Class A shares and includes the higher expenses applicable to Class A shares. Historical performance shown for Investor Class shares prior to their inception reflects the performance of Class A shares and has been adjusted to include the higher expenses applicable to Investor Class shares. If these expenses had not been included, returns would have been higher. |
| 2 | Reflects the expense ratios as stated in the most recent prospectuses, which include the impact of 0.01% in acquired fund fees and expenses. The expense ratios shown are subject to change and may differ from the annualized expense ratios shown in the financial highlights of this report, which do not include acquired fund fees and expenses. |
| 3 | The Adviser has committed through December 31, 2015, to waive fees and/or reimburse expenses to the extent necessary to cap the Fund’s Total Annual Fund Operating Expenses After Fee Waiver, excluding certain expenses, at 0.84% for Class A, 1.59% for Class B, 1.59% for Class C, 0.72% for Administrator Class, 0.58% for Institutional Class, and 0.85% for Investor Class. After this time, the cap may be increased or the commitment to maintain the cap may be terminated only with the approval of the Board of Trustees. Brokerage commissions, stamp duty fees, interest, taxes, acquired fund fees and expenses, and extraordinary expenses are excluded from the cap. Without this cap, the Fund’s returns would have been lower. |
| 4 | The Barclays U.S. Universal Bond Index is an unmanaged market value-weighted performance benchmark for the U.S. dollar-denominated bond market, which includes investment-grade, high yield, and emerging market debt securities with maturities of one year or more. You cannot invest directly in an index. |
| 5 | The ten largest long-term holdings are calculated based on the value of the securities divided by total net assets of the Fund. Holdings are subject to change and may have changed since the date specified. |
| 6 | Amounts are calculated based on the total long-term investments of the Fund. These percentages are subject to change and may have changed since the date specified. |
| | | | |
| 6 | | Wells Fargo Advantage Income Plus Fund | | Fund expenses (unaudited) |
As a shareholder of the Fund, you incur two types of costs: (1) transaction costs, including sales charges (loads) on purchase payments and contingent deferred sales charges (if any) on redemptions and (2) ongoing costs, including management fees, distribution (12b-1) and/or shareholder service fees, and other Fund expenses. This example is intended to help you understand your ongoing costs (in dollars) of investing in the Fund and to compare these costs with the ongoing costs of investing in other mutual funds.
The example is based on an investment of $1,000 invested at the beginning of the six-month period and held for the entire period from September 1, 2014 to February 28, 2015.
Actual expenses
The “Actual” line of the table below provides information about actual account values and actual expenses. You may use the information in this line, together with the amount you invested, to estimate the expenses that you paid over the period. Simply divide your account value by $1,000 (for example, an $8,600 account value divided by $1,000 = 8.6), then multiply the result by the number in the “Actual” line under the heading entitled “Expenses paid during period” for your applicable class of shares to estimate the expenses you paid on your account during this period.
Hypothetical example for comparison purposes
The “Hypothetical” line of the table below provides information about hypothetical account values and hypothetical expenses based on the Fund’s actual expense ratio and an assumed rate of return of 5% per year before expenses, which is not the Fund’s actual return. The hypothetical account values and expenses may not be used to estimate the actual ending account balance or expenses you paid for the period. You may use this information to compare the ongoing costs of investing in the Fund and other funds. To do so, compare this 5% hypothetical example with the 5% hypothetical examples that appear in the shareholder reports of the other funds.
Please note that the expenses shown in the table are meant to highlight your ongoing costs only and do not reflect any transactional costs, such as sales charges (loads) and contingent deferred sales charges. Therefore, the “Hypothetical” line of the table is useful in comparing ongoing costs only and will not help you determine the relative total costs of owning different funds. In addition, if these transactional costs were included, your costs would have been higher.
| | | | | | | | | | | | | | | | |
| | | Beginning
account value
9-1-2014 | | | Ending
account value
2-28-2015 | | | Expenses
paid during
the period¹ | | | Net annualized
expense ratio | |
Class A | | | | | | | | | | | | | | | | |
Actual | | $ | 1,000.00 | | | $ | 1,023.42 | | | $ | 4.21 | | | | 0.84 | % |
Hypothetical (5% return before expenses) | | $ | 1,000.00 | | | $ | 1,020.63 | | | $ | 4.21 | | | | 0.84 | % |
Class B | | | | | | | | | | | | | | | | |
Actual | | $ | 1,000.00 | | | $ | 1,020.23 | | | $ | 7.96 | | | | 1.59 | % |
Hypothetical (5% return before expenses) | | $ | 1,000.00 | | | $ | 1,016.91 | | | $ | 7.95 | | | | 1.59 | % |
Class C | | | | | | | | | | | | | | | | |
Actual | | $ | 1,000.00 | | | $ | 1,020.38 | | | $ | 7.97 | | | | 1.59 | % |
Hypothetical (5% return before expenses) | | $ | 1,000.00 | | | $ | 1,016.91 | | | $ | 7.95 | | | | 1.59 | % |
Administrator Class | | | | | | | | | | | | | | | | |
Actual | | $ | 1,000.00 | | | $ | 1,023.98 | | | $ | 3.61 | | | | 0.72 | % |
Hypothetical (5% return before expenses) | | $ | 1,000.00 | | | $ | 1,021.22 | | | $ | 3.61 | | | | 0.72 | % |
Institutional Class | | | | | | | | | | | | | | | | |
Actual | | $ | 1,000.00 | | | $ | 1,025.49 | | | $ | 2.91 | | | | 0.58 | % |
Hypothetical (5% return before expenses) | | $ | 1,000.00 | | | $ | 1,021.92 | | | $ | 2.91 | | | | 0.58 | % |
Investor Class | | | | | | | | | | | | | | | | |
Actual | | $ | 1,000.00 | | | $ | 1,024.14 | | | $ | 4.27 | | | | 0.85 | % |
Hypothetical (5% return before expenses) | | $ | 1,000.00 | | | $ | 1,020.58 | | | $ | 4.26 | | | | 0.85 | % |
| 1 | Expenses paid is equal to the annualized expense ratio of each class multiplied by the average account value over the period, multiplied by the number of days in the most recent fiscal half-year divided by the number of days in the fiscal year (to reflect the one-half-year period). |
| | | | | | |
| Portfolio of investments—February 28, 2015 (unaudited) | | Wells Fargo Advantage Income Plus Fund | | | 7 | |
| | | | | | | | | | | | | | | | |
| Security name | | Interest rate | | | Maturity date | | | Principal | | | Value | |
| | | | |
Agency Securities: 29.96% | | | | | | | | | | | | | | | | |
FHLB Series VN-2015 Class A | | | 5.46 | % | | | 11-27-2015 | | | $ | 717,974 | | | $ | 742,176 | |
FHLMC ± | | | 1.90 | | | | 1-1-2036 | | | | 76,892 | | | | 79,983 | |
FHLMC %% | | | 3.50 | | | | 3-1-2045 | | | | 12,585,000 | | | | 13,167,548 | |
FHLMC %% | | | 4.00 | | | | 3-1-2045 | | | | 6,310,000 | | | | 6,746,771 | |
FHLMC | | | 5.00 | | | | 6-1-2036 | | | | 666,238 | | | | 738,241 | |
FHLMC | | | 5.00 | | | | 8-1-2040 | | | | 681,603 | | | | 759,967 | |
FHLMC | | | 5.50 | | | | 10-1-2017 | | | | 246,617 | | | | 259,208 | |
FHLMC | | | 5.50 | | | | 8-1-2038 | | | | 151,711 | | | | 169,181 | |
FHLMC | | | 5.50 | | | | 12-1-2038 | | | | 1,331,940 | | | | 1,487,340 | |
FHLMC | | | 5.50 | | | | 6-1-2040 | | | | 1,764,290 | | | | 1,970,139 | |
FHLMC | | | 7.50 | | | | 5-1-2038 | | | | 3,894 | | | | 4,066 | |
FHLMC | | | 8.00 | | | | 2-1-2030 | | | | 447 | | | | 497 | |
FHLMC Series 2013-K28 Class B ±144A | | | 3.49 | | | | 6-25-2046 | | | | 1,970,000 | | | | 2,011,234 | |
FHLMC Series 2013-K30 Class B ±144A | | | 3.56 | | | | 6-25-2045 | | | | 2,515,000 | | | | 2,545,703 | |
FHLMC Series 2013-K32 Class B ±144A | | | 3.54 | | | | 10-25-2046 | | | | 1,875,000 | | | | 1,918,204 | |
FHLMC Series 2640 Class G | | | 4.50 | | | | 7-15-2018 | | | | 815,615 | | | | 848,575 | |
FHLMC Series 3774 Class AB | | | 3.50 | | | | 12-15-2020 | | | | 469,458 | | | | 489,032 | |
FHLMC Series K020 Class X1 ±(c) | | | 1.46 | | | | 5-25-2022 | | | | 14,379,068 | | | | 1,221,631 | |
FHLMC Series T-42 Class A5 | | | 7.50 | | | | 2-25-2042 | | | | 2,364,447 | | | | 2,755,034 | |
FHLMC Series T-57 Class 2A1 ± | | | 3.26 | | | | 7-25-2043 | | | | 73,755 | | | | 76,490 | |
FHLMC Series T-59 Class 2A1 ± | | | 2.93 | | | | 10-25-2043 | | | | 68,756 | | | | 71,602 | |
FNMA ± | | | 2.25 | | | | 8-1-2036 | | | | 113,572 | | | | 121,275 | |
FNMA ± | | | 2.36 | | | | 9-1-2036 | | | | 59,251 | | | | 63,929 | |
FNMA ± | | | 2.40 | | | | 1-1-2036 | | | | 255,662 | | | | 275,659 | |
FNMA | | | 2.75 | | | | 10-1-2022 | | | | 2,250,000 | | | | 2,303,418 | |
FNMA %% | | | 3.00 | | | | 3-1-2030 | | | | 3,355,000 | | | | 3,512,397 | |
FNMA %% | | | 3.00 | | | | 3-1-2045 | | | | 25,520,000 | | | | 25,995,509 | |
FNMA | | | 3.27 | | | | 7-1-2022 | | | | 1,293,504 | | | | 1,370,827 | |
FNMA %% | | | 3.50 | | | | 3-1-2030 | | | | 4,945,000 | | | | 5,243,376 | |
FNMA %% | | | 3.50 | | | | 3-1-2045 | | | | 18,915,000 | | | | 19,822,330 | |
FNMA | | | 3.95 | | | | 9-1-2021 | | | | 433,805 | | | | 476,846 | |
FNMA | | | 4.00 | | | | 9-1-2024 | | | | 229,105 | | | | 242,413 | |
FNMA %% | | | 4.00 | | | | 3-1-2030 | | | | 2,570,000 | | | | 2,718,136 | |
FNMA %% | | | 4.00 | | | | 3-1-2045 | | | | 10,230,000 | | | | 10,938,108 | |
FNMA | | | 4.26 | | | | 4-1-2021 | | | | 2,845,617 | | | | 3,171,883 | |
FNMA | | | 4.39 | | | | 1-1-2020 | | | | 1,561,971 | | | | 1,725,977 | |
FNMA | | | 4.50 | | | | 1-1-2026 | | | | 3,345,000 | | | | 3,514,733 | |
FNMA %% | | | 4.50 | | | | 3-1-2045 | | | | 15,790,000 | | | | 17,159,290 | |
FNMA | | | 5.00 | | | | 1-1-2024 | | | | 279,806 | | | | 303,676 | |
FNMA | | | 5.00 | | | | 2-1-2036 | | | | 66,076 | | | | 73,518 | |
FNMA | | | 5.00 | | | | 6-1-2040 | | | | 219,938 | | | | 245,401 | |
FNMA | | | 5.00 | | | | 8-1-2040 | | | | 4,230,723 | | | | 4,723,330 | |
FNMA | | | 5.50 | | | | 11-1-2023 | | | | 140,733 | | | | 152,805 | |
FNMA | | | 5.50 | | | | 8-1-2034 | | | | 228,700 | | | | 258,538 | |
FNMA | | | 5.50 | | | | 2-1-2035 | | | | 68,828 | | | | 77,762 | |
FNMA | | | 5.50 | | | | 8-1-2038 | | | | 808,739 | | | | 922,396 | |
FNMA | | | 5.50 | | | | 8-1-2038 | | | | 342,930 | | | | 385,448 | |
FNMA | | | 6.00 | | | | 10-1-2037 | | | | 1,211,177 | | | | 1,379,143 | |
FNMA | | | 6.00 | | | | 11-1-2037 | | | | 102,191 | | | | 116,213 | |
FNMA %% | | | 6.00 | | | | 3-1-2045 | | | | 795,000 | | | | 904,111 | |
The accompanying notes are an integral part of these financial statements.
| | | | |
| 8 | | Wells Fargo Advantage Income Plus Fund | | Portfolio of investments—February 28, 2015 (unaudited) |
| | | | | | | | | | | | | | | | |
| Security name | | Interest rate | | | Maturity date | | | Principal | | | Value | |
| | | | |
Agency Securities (continued) | | | | | | | | | | | | | | | | |
FNMA | | | 6.50 | % | | | 7-1-2036 | | | $ | 21,637 | | | $ | 24,741 | |
FNMA | | | 6.50 | | | | 7-1-2036 | | | | 57,442 | | | | 65,684 | |
FNMA | | | 6.50 | | | | 11-1-2036 | | | | 14,029 | | | | 16,042 | |
FNMA | | | 6.50 | | | | 7-1-2037 | | | | 1,745,584 | | | | 2,112,941 | |
FNMA | | | 7.00 | | | | 12-1-2022 | | | | 526,471 | | | | 576,939 | |
FNMA | | | 7.00 | | | | 7-1-2036 | | | | 34,803 | | | | 41,318 | |
FNMA | | | 7.00 | | | | 11-1-2037 | | | | 20,699 | | | | 23,108 | |
FNMA | | | 7.50 | | | | 5-1-2038 | | | | 2,058 | | | | 2,099 | |
FNMA Series 2002-T12 Class A3 | | | 7.50 | | | | 5-25-2042 | | | | 9,317 | | | | 11,125 | |
FNMA Series 2003-W08 Class 4A ± | | | 3.18 | | | | 11-25-2042 | | | | 194,371 | | | | 202,161 | |
FNMA Series 2003-W14 Class 2A ± | | | 2.24 | | | | 6-25-2045 | | | | 161,854 | | | | 166,804 | |
FNMA Series 2003-W14 Class 2A ± | | | 3.48 | | | | 1-25-2043 | | | | 101,580 | | | | 103,392 | |
FNMA Series 2004-W11 Class 1A3 | | | 7.00 | | | | 5-25-2044 | | | | 1,992,934 | | | | 2,362,003 | |
FNMA Series 2004-W15 Class 1A3 | | | 7.00 | | | | 8-25-2044 | | | | 1,359,206 | | | | 1,571,355 | |
GNMA | | | 4.00 | | | | 1-20-2045 | | | | 4,131,585 | | | | 4,410,978 | |
GNMA | | | 5.00 | | | | 7-20-2040 | | | | 1,741,328 | | | | 1,948,293 | |
GNMA | | | 7.50 | | | | 12-15-2029 | | | | 802 | | | | 919 | |
GNMA Series 2008-22 Class XM ±(c) | | | 0.60 | | | | 2-16-2050 | | | | 3,347,700 | | | | 111,857 | |
GNMA Series 2008-86 Class D | | | 5.46 | | | | 6-16-2040 | | | | 3,102,896 | | | | 3,271,780 | |
| | | | |
Total Agency Securities (Cost $159,502,230) | | | | | | | | | | | | | | | 163,284,608 | |
| | | | | | | | | | | | | | | | |
| | | | |
Asset-Backed Securities: 0.85% | | | | | | | | | | | | | | | | |
CVS Pass-Through Trust First Lien | | | 6.04 | | | | 12-10-2028 | | | | 1,451,553 | | | | 1,707,443 | |
GE Equipment Transportation LLC Series 2015-1 Class A2 %% | | | 0.89 | | | | 11-24-2017 | | | | 840,000 | | | | 839,910 | |
Volkswagen Auto Lease Trust Series 2015-A Class A2A %% | | | 0.98 | | | | 6-20-2017 | | | | 2,080,000 | | | | 2,079,990 | |
| | | | |
Total Asset-Backed Securities (Cost $4,361,913) | | | | | | | | | | | | | | | 4,627,343 | |
| | | | | | | | | | | | | | | | |
| | | | |
Corporate Bonds and Notes: 26.84% | | | | | | | | | | | | | | | | |
| | | | |
Consumer Discretionary: 4.49% | | | | | | | | | | | | | | | | |
| | | | |
| Auto Components: 0.77% | | | | | | | | | | | | | | | | |
Delphi Corporation | | | 5.00 | | | | 2-15-2023 | | | | 1,025,000 | | | | 1,103,156 | |
Lear Corporation | | | 5.38 | | | | 3-15-2024 | | | | 1,320,000 | | | | 1,359,600 | |
TRW Automotive Incorporated 144A | | | 4.50 | | | | 3-1-2021 | | | | 1,750,000 | | | | 1,767,500 | |
| | | | |
| | | | | | | | | | | | | | | 4,230,256 | |
| | | | | | | | | | | | | | | | |
| | | | |
| Automobiles: 0.42% | | | | | | | | | | | | | | | | |
Ford Motor Company | | | 7.45 | | | | 7-16-2031 | | | | 1,645,000 | | | | 2,299,690 | |
| | | | | | | | | | | | | | | | |
| | | | |
| Diversified Consumer Services: 0.69% | | | | | | | | | | | | | | | | |
ERAC USA Finance LLC 144A | | | 4.50 | | | | 2-15-2045 | | | | 1,950,000 | | | | 1,977,193 | |
Service Corporation International | | | 8.00 | | | | 11-15-2021 | | | | 1,500,000 | | | | 1,770,000 | |
| | | | |
| | | | | | | | | | | | | | | 3,747,193 | |
| | | | | | | | | | | | | | | | |
| | | | |
| Hotels, Restaurants & Leisure: 0.05% | | | | | | | | | | | | | | | | |
Agua Caliente Band of Cahuilla Indians 144A | | | 6.44 | | | | 10-1-2016 | | | | 298,000 | | | | 287,922 | |
| | | | | | | | | | | | | | | | |
| | | | |
| Household Durables: 0.31% | | | | | | | | | | | | | | | | |
Toll Brothers Finance Corporation | | | 4.38 | | | | 4-15-2023 | | | | 1,655,000 | | | | 1,671,550 | |
| | | | | | | | | | | | | | | | |
The accompanying notes are an integral part of these financial statements.
| | | | | | |
| Portfolio of investments—February 28, 2015 (unaudited) | | Wells Fargo Advantage Income Plus Fund | | | 9 | |
| | | | | | | | | | | | | | | | |
| Security name | | Interest rate | | | Maturity date | | | Principal | | | Value | |
| | | | |
| Internet & Catalog Retail: 0.19% | | | | | | | | | | | | | | | | |
Amazon.com Incorporated | | | 4.95 | % | | | 12-5-2044 | | | $ | 955,000 | | | $ | 1,026,925 | |
| | | | | | | | | | | | | | | | |
| | | | |
| Media: 1.58% | | | | | | | | | | | | | | | | |
CBS Corporation | | | 7.88 | | | | 7-30-2030 | | | | 775,000 | | | | 1,096,706 | |
CCOH Safari LLC | | | 5.75 | | | | 12-1-2024 | | | | 1,530,000 | | | | 1,583,550 | |
DISH DBS Corporation | | | 5.13 | | | | 5-1-2020 | | | | 1,290,000 | | | | 1,301,288 | |
Gannett Company Incorporated 144A | | | 5.50 | | | | 9-15-2024 | | | | 1,405,000 | | | | 1,461,200 | |
News America Incorporated | | | 7.85 | | | | 3-1-2039 | | | | 1,180,000 | | | | 1,769,200 | |
Sirius XM Radio Incorporated 144A | | | 6.00 | | | | 7-15-2024 | | | | 1,320,000 | | | | 1,402,500 | |
| | | | |
| | | | | | | | | | | | | | | 8,614,444 | |
| | | | | | | | | | | | | | | | |
| | | | |
| Specialty Retail: 0.48% | | | | | | | | | | | | | | | | |
L Brands Incorporated | | | 6.63 | | | | 4-1-2021 | | | | 1,020,000 | | | | 1,170,450 | |
Sally Beauty Holdings Incorporated | | | 5.75 | | | | 6-1-2022 | | | | 1,360,000 | | | | 1,441,600 | |
| | | | |
| | | | | | | | | | | | | | | 2,612,050 | |
| | | | | | | | | | | | | | | | |
| | | | |
Consumer Staples: 0.57% | | | | | | | | | | | | | | | | |
| | | | |
| Beverages: 0.26% | | | | | | | | | | | | | | | | |
Constellation Brands Incorporated | | | 4.25 | | | | 5-1-2023 | | | | 1,385,000 | | | | 1,436,938 | |
| | | | | | | | | | | | | | | | |
| | | | |
| Food & Staples Retailing: 0.31% | | | | | | | | | | | | | | | | |
Walgreens Boots Alliance Incorporated | | | 4.80 | | | | 11-18-2044 | | | | 1,530,000 | | | | 1,664,571 | |
| | | | | | | | | | | | | | | | |
| | | | |
Energy: 2.78% | | | | | | | | | | | | | | | | |
| | | | |
| Energy Equipment & Services: 0.26% | | | | | | | | | | | | | | | | |
SESI LLC | | | 7.13 | | | | 12-15-2021 | | | | 1,410,000 | | | | 1,413,525 | |
| | | | | | | | | | | | | | | | |
| | | | |
| Oil, Gas & Consumable Fuels: 2.52% | | | | | | | | | | | | | | | | |
Chesapeake Energy Corporation | | | 4.88 | | | | 4-15-2022 | | | | 1,545,000 | | | | 1,525,688 | |
Concho Resources Incorporated | | | 5.50 | | | | 4-1-2023 | | | | 820,000 | | | | 848,700 | |
Continental Resources Incorporated | | | 4.50 | | | | 4-15-2023 | | | | 1,300,000 | | | | 1,268,942 | |
DCP Midstream LLC 144A | | | 5.35 | | | | 3-15-2020 | | | | 1,330,000 | | | | 1,310,825 | |
Energy Transfer Equity LP | | | 7.50 | | | | 10-15-2020 | | | | 1,200,000 | | | | 1,374,000 | |
Enterprise Products Operating LLC | | | 5.10 | | | | 2-15-2045 | | | | 1,135,000 | | | | 1,292,050 | |
Kinder Morgan Energy Partners LP | | | 5.50 | | | | 3-1-2044 | | | | 1,070,000 | | | | 1,143,189 | |
Marathon Petroleum Corporation | | | 4.75 | | | | 9-15-2044 | | | | 630,000 | | | | 643,027 | |
Newfield Exploration Company | | | 5.63 | | | | 7-1-2024 | | | | 325,000 | | | | 338,813 | |
Newfield Exploration Company | | | 6.88 | | | | 2-1-2020 | | | | 1,300,000 | | | | 1,335,750 | |
Phillips 66 Partners LP | | | 3.61 | | | | 2-15-2025 | | | | 1,300,000 | | | | 1,305,953 | |
Sabine Pass Liquefaction LLC | | | 5.63 | | | | 4-15-2023 | | | | 1,300,000 | | | | 1,329,250 | |
| | | | |
| | | | | | | | | | | | | | | 13,716,187 | |
| | | | | | | | | | | | | | | | |
| | | | |
Financials: 10.12% | | | | | | | | | | | | | | | | |
| | | | |
| Banks: 2.70% | | | | | | | | | | | | | | | | |
Australia and New Zealand Banking Group Limited 144A | | | 2.40 | | | | 11-23-2016 | | | | 3,320,000 | | | | 3,396,340 | |
Bank of America Corporation | | | 6.50 | | | | 8-1-2016 | | | | 2,300,000 | | | | 2,465,940 | |
Bank of America Corporation | | | 7.63 | | | | 6-1-2019 | | | | 2,480,000 | | | | 2,996,363 | |
CBA Capital Trust II ±144A | | | 6.02 | | | | 3-29-2049 | | | | 1,300,000 | | | | 1,345,500 | |
CIT Group Incorporated | | | 5.38 | | | | 5-15-2020 | | | | 1,650,000 | | | | 1,773,750 | |
The accompanying notes are an integral part of these financial statements.
| | | | |
| 10 | | Wells Fargo Advantage Income Plus Fund | | Portfolio of investments—February 28, 2015 (unaudited) |
| | | | | | | | | | | | | | | | |
| Security name | | Interest rate | | | Maturity date | | | Principal | | | Value | |
| | | | |
| Banks (continued) | | | | | | | | | | | | | | | | |
JPMorgan Chase & Company Series Q ± | | | 5.15 | % | | | 12-29-2049 | | | $ | 1,620,000 | | | $ | 1,587,600 | |
PNC Financial Services Group Incorporated ± | | | 4.48 | | | | 5-29-2049 | | | | 1,165,000 | | | | 1,167,913 | |
| | | | |
| | | | | | | | | | | | | | | 14,733,406 | |
| | | | | | | | | | | | | | | | |
| | | | |
| Capital Markets: 1.40% | | | | | | | | | | | | | | | | |
Affiliated Managers Group Incorporated | | | 3.50 | | | | 8-1-2025 | | | | 2,440,000 | | | | 2,428,586 | |
Blackstone Holdings Finance Company LLC 144A | | | 5.88 | | | | 3-15-2021 | | | | 1,110,000 | | | | 1,297,975 | |
Lazard Group LLC | | | 3.75 | | | | 2-13-2025 | | | | 2,625,000 | | | | 2,602,541 | |
Morgan Stanley | | | 4.35 | | | | 9-8-2026 | | | | 1,260,000 | | | | 1,313,474 | |
| | | | |
| | | | | | | | | | | | | | | 7,642,576 | |
| | | | | | | | | | | | | | | | |
| | | | |
| Consumer Finance: 1.25% | | | | | | | | | | | | | | | | |
Ally Financial Incorporated | | | 8.00 | | | | 3-15-2020 | | | | 913,000 | | | | 1,093,318 | |
General Motors Financial Company Incorporated | | | 4.25 | | | | 5-15-2023 | | | | 1,350,000 | | | | 1,414,125 | |
HSBC Finance Corporation | | | 6.68 | | | | 1-15-2021 | | | | 2,185,000 | | | | 2,612,157 | |
Navient Corporation | | | 8.00 | | | | 3-25-2020 | | | | 1,425,000 | | | | 1,658,344 | |
| | | | |
| | | | | | | | | | | | | | | 6,777,944 | |
| | | | | | | | | | | | | | | | |
| | | | |
| Diversified Financial Services: 1.39% | | | | | | | | | | | | | | | | |
Daimler Finance North America LLC %%144A | | | 2.25 | | | | 3-2-2020 | | | | 3,375,000 | | | | 3,387,231 | |
General Electric Capital Corporation ± | | | 6.38 | | | | 11-15-2067 | | | | 2,200,000 | | | | 2,392,940 | |
Moody’s Corporation | | | 4.88 | | | | 2-15-2024 | | | | 1,595,000 | | | | 1,779,183 | |
| | | | |
| | | | | | | | | | | | | | | 7,559,354 | |
| | | | | | | | | | | | | | | | |
| | | | |
| Insurance: 2.66% | | | | | | | | | | | | | | | | |
Allstate Corporation ± | | | 5.75 | | | | 8-15-2053 | | | | 1,635,000 | | | | 1,767,435 | |
Endurance Specialty Holdings Limited | | | 7.00 | | | | 7-15-2034 | | | | 1,520,000 | | | | 1,926,276 | |
National Life Insurance Company of Vermont 144A | | | 10.50 | | | | 9-15-2039 | | | | 1,315,000 | | | | 2,110,429 | |
Platinum Underwriters Finance Incorporated Series B | | | 7.50 | | | | 6-1-2017 | | | | 1,730,000 | | | | 1,923,084 | |
Protective Life Corporation | | | 8.45 | | | | 10-15-2039 | | | | 1,855,000 | | | | 2,803,224 | |
Prudential Financial Incorporated ± | | | 8.88 | | | | 6-15-2068 | | | | 1,645,000 | | | | 1,946,652 | |
ZFS Finance (USA) Trust II ±144A | | | 6.45 | | | | 12-15-2065 | | | | 1,920,000 | | | | 2,016,960 | |
| | | | |
| | | | | | | | | | | | | | | 14,494,060 | |
| | | | | | | | | | | | | | | | |
| | | | |
| Real Estate Management & Development: 0.18% | | | | | | | | | | | | | | | | |
CBRE Services Incorporated | | | 5.00 | | | | 3-15-2023 | | | | 940,000 | | | | 987,000 | |
| | | | | | | | | | | | | | | | |
| | | | |
| REITs: 0.54% | | | | | | | | | | | | | | | | |
American Tower Corporation | | | 7.00 | | | | 10-15-2017 | | | | 1,455,000 | | | | 1,641,055 | |
Crown Castle International Corporation | | | 5.25 | | | | 1-15-2023 | | | | 1,250,000 | | | | 1,318,750 | |
| | | | |
| | | | | | | | | | | | | | | 2,959,805 | |
| | | | | | | | | | | | | | | | |
| | | | |
Health Care: 1.31% | | | | | | | | | | | | | | | | |
| | | | |
| Health Care Equipment & Supplies: 0.38% | | | | | | | | | | | | | | | | |
Medtronic Incorporated 144A | | | 4.63 | | | | 3-15-2045 | | | | 1,825,000 | | | | 2,064,971 | |
| | | | | | | | | | | | | | | | |
| | | | |
| Health Care Providers & Services: 0.91% | | | | | | | | | | | | | | | | |
Fresenius Medical Care Holdings Incorporated 144A | | | 5.88 | | | | 1-31-2022 | | | | 1,435,000 | | | | 1,610,788 | |
HCA Incorporated | | | 6.50 | | | | 2-15-2020 | | | | 1,450,000 | | | | 1,649,375 | |
The accompanying notes are an integral part of these financial statements.
| | | | | | |
| Portfolio of investments—February 28, 2015 (unaudited) | | Wells Fargo Advantage Income Plus Fund | | | 11 | |
| | | | | | | | | | | | | | | | |
| Security name | | Interest rate | | | Maturity date | | | Principal | | | Value | |
| | | | |
| Health Care Providers & Services (continued) | | | | | | | | | | | | | | | | |
Tenet Healthcare Corporation | | | 6.00 | % | | | 10-1-2020 | | | $ | 1,575,000 | | | $ | 1,714,781 | |
| | | | |
| | | | | | | | | | | | | | | 4,974,944 | |
| | | | | | | | | | | | | | | | |
| | | | |
| Pharmaceuticals: 0.02% | | | | | | | | | | | | | | | | |
Teva Pharmaceutical Finance Company LLC | | | 6.15 | | | | 2-1-2036 | | | | 67,000 | | | | 85,498 | |
| | | | | | | | | | | | | | | | |
| | | | |
Industrials: 2.23% | | | | | | | | | | | | | | | | |
| | | | |
| Aerospace & Defense: 0.36% | | | | | | | | | | | | | | | | |
DigitalGlobe Incorporated 144A | | | 5.25 | | | | 2-1-2021 | | | | 635,000 | | | | 615,950 | |
Huntington Ingalls Industries Incorporated 144A | | | 5.00 | | | | 12-15-2021 | | | | 1,250,000 | | | | 1,310,938 | |
| | | | |
| | | | | | | | | | | | | | | 1,926,888 | |
| | | | | | | | | | | | | | | | |
| | | | |
| Building Products: 0.21% | | | | | | | | | | | | | | | | |
Masco Corporation | | | 5.95 | | | | 3-15-2022 | | | | 1,030,000 | | | | 1,156,175 | |
| | | | | | | | | | | | | | | | |
| | | | |
| Commercial Services & Supplies: 0.12% | | | | | | | | | | | | | | | | |
The ADT Corporation | | | 3.50 | | | | 7-15-2022 | | | | 730,000 | | | | 669,775 | |
| | | | | | | | | | | | | | | | |
| | | | |
| Professional Services: 0.59% | | | | | | | | | | | | | | | | |
FTI Consulting Incorporated | | | 6.75 | | | | 10-1-2020 | | | | 1,055,000 | | | | 1,114,344 | |
Verisk Analytics Incorporated | | | 5.80 | | | | 5-1-2021 | | | | 1,810,000 | | | | 2,071,826 | |
| | | | |
| | | | | | | | | | | | | | | 3,186,170 | |
| | | | | | | | | | | | | | | | |
| | | | |
| Trading Companies & Distributors: 0.95% | | | | | | | | | | | | | | | | |
Air Lease Corporation | | | 4.25 | | | | 9-15-2024 | | | | 1,270,000 | | | | 1,308,100 | |
Ashtead Capital Incorporated 144A | | | 6.50 | | | | 7-15-2022 | | | | 790,000 | | | | 859,125 | |
International Lease Finance Corporation | | | 8.25 | | | | 12-15-2020 | | | | 1,190,000 | | | | 1,478,575 | |
United Rentals North America Incorporated | | | 5.75 | | | | 11-15-2024 | | | | 1,460,000 | | | | 1,546,855 | |
| | | | |
| | | | | | | | | | | | | | | 5,192,655 | |
| | | | | | | | | | | | | | | | |
| | | | |
Information Technology: 2.13% | | | | | | | | | | | | | | | | |
| | | | |
| Communications Equipment: 0.28% | | | | | | | | | | | | | | | | |
Motorola Solutions Incorporated | | | 4.00 | | | | 9-1-2024 | | | | 1,465,000 | | | | 1,517,835 | |
| | | | | | | | | | | | | | | | |
| | | | |
| Electronic Equipment, Instruments & Components: 0.77% | | | | | | | | | | | | | | | | |
Arrow Electronics Incorporated %% | | | 4.00 | | | | 4-1-2025 | | | | 2,410,000 | | | | 2,398,225 | |
Corning Incorporated | | | 7.25 | | | | 8-15-2036 | | | | 1,417,000 | | | | 1,835,508 | |
| | | | |
| | | | | | | | | | | | | | | 4,233,733 | |
| | | | | | | | | | | | | | | | |
| | | | |
| Semiconductors & Semiconductor Equipment: 0.81% | | | | | | | | | | | | | | | | |
KLA-Tencor Corporation | | | 4.65 | | | | 11-1-2024 | | | | 2,800,000 | | | | 2,957,472 | |
Micron Technology Incorporated | | | 5.88 | | | | 2-15-2022 | | | | 1,385,000 | | | | 1,462,906 | |
| | | | |
| | | | | | | | | | | | | | | 4,420,378 | |
| | | | | | | | | | | | | | | | |
| | | | |
| Software: 0.27% | | | | | | | | | | | | | | | | |
Activision Blizzard Incorporated 144A | | | 5.63 | | | | 9-15-2021 | | | | 1,370,000 | | | | 1,465,900 | |
| | | | | | | | | | | | | | | | |
The accompanying notes are an integral part of these financial statements.
| | | | |
| 12 | | Wells Fargo Advantage Income Plus Fund | | Portfolio of investments—February 28, 2015 (unaudited) |
| | | | | | | | | | | | | | | | |
| Security name | | Interest rate | | | Maturity date | | | Principal | | | Value | |
| | | | |
Materials: 0.97% | | | | | | | | | | | | | | | | |
| | | | |
| Chemicals: 0.30% | | | | | | | | | | | | | | | | |
W.R. Grace & Company 144A« | | | 5.63 | % | | | 10-1-2024 | | | $ | 1,520,000 | | | $ | 1,634,000 | |
| | | | | | | | | | | | | | | | |
| | | | |
| Containers & Packaging: 0.25% | | | | | | | | | | | | | | | | |
Owens-Brockway Glass Container Incorporated 144A | | | 5.00 | | | | 1-15-2022 | | | | 1,310,000 | | | | 1,359,125 | |
| | | | | | | | | | | | | | | | |
| | | | |
| Metals & Mining: 0.29% | | | | | | | | | | | | | | | | |
Steel Dynamics Incorporated | | | 6.38 | | | | 8-15-2022 | | | | 1,465,000 | | | | 1,571,213 | |
| | | | | | | | | | | | | | | | |
| | | | |
| Paper & Forest Products: 0.13% | | | | | | | | | | | | | | | | |
International Paper Company | | | 7.30 | | | | 11-15-2039 | | | | 540,000 | | | | 726,342 | |
| | | | | | | | | | | | | | | | |
| | | | |
Telecommunication Services: 1.41% | | | | | | | | | | | | | | | | |
| | | | |
| Diversified Telecommunication Services: 0.69% | | | | | | | | | | | | | | | | |
CenturyLink Incorporated | | | 5.63 | | | | 4-1-2020 | | | | 1,375,000 | | | | 1,471,250 | |
Frontier Communications Corporation | | | 6.25 | | | | 9-15-2021 | | | | 880,000 | | | | 902,000 | |
Verizon Communications Incorporated | | | 6.55 | | | | 9-15-2043 | | | | 1,080,000 | | | | 1,421,120 | |
| | | | |
| | | | | | | | | | | | | | | 3,794,370 | |
| | | | | | | | | | | | | | | | |
| | | | |
| Wireless Telecommunication Services: 0.72% | | | | | | | | | | | | | | | | |
SBA Tower Trust 144A | | | 3.72 | | | | 4-15-2048 | | | | 1,820,000 | | | | 1,857,326 | |
Sprint Corporation | | | 7.88 | | | | 9-15-2023 | | | | 860,000 | | | | 887,950 | |
T-Mobile USA Incorporated | | | 6.63 | | | | 4-1-2023 | | | | 1,105,000 | | | | 1,174,063 | |
| | | | |
| | | | | | | | | | | | | | | 3,919,339 | |
| | | | | | | | | | | | | | | | |
| | | | |
Utilities: 0.83% | | | | | | | | | | | | | | | | |
| | | | |
| Independent Power & Renewable Electricity Producers: 0.83% | | | | | | | | | | | | | | | | |
Calpine Corporation 144A | | | 5.88 | | | | 1-15-2024 | | | | 1,275,000 | | | | 1,383,375 | |
Harper Lake Solar Funding Corporation 144A | | | 7.65 | | | | 12-31-2018 | | | | 1,110,914 | | | | 1,222,474 | |
NRG Energy Incorporated | | | 7.63 | | | | 1-15-2018 | | | | 800,000 | | | | 888,000 | |
The AES Corporation | | | 5.50 | | | | 3-15-2024 | | | | 1,010,000 | | | | 1,025,150 | |
| | | | | | | | | | | | | | | 4,518,999 | |
| | | | | | | | | | | | | | | | |
| | | | |
Total Corporate Bonds and Notes (Cost $137,959,163) | | | | | | | | | | | | | | | 146,293,706 | |
| | | | | | | | | | | | | | | | |
| | | | |
Municipal Obligations: 2.14% | | | | | | | | | | | | | | | | |
| | | | |
| California: 0.71% | | | | | | | | | | | | | | | | |
California Build America Bonds Stem Cell Research and Cures Series A (GO) | | | 4.99 | | | | 4-1-2039 | | | | 1,505,000 | | | | 1,602,404 | |
San Jose CA Series B (Airport Revenue, AGM Insured) | | | 6.60 | | | | 3-1-2041 | | | | 2,000,000 | | | | 2,293,780 | |
| | | | |
| | | | | | | | | | | | | | | 3,896,184 | |
| | | | | | | | | | | | | | | | |
| | | | |
| Illinois: 0.13% | | | | | | | | | | | | | | | | |
Chicago IL Series B (GO) | | | 6.31 | | | | 1-1-2044 | | | | 675,000 | | | | 709,148 | |
| | | | | | | | | | | | | | | | |
| | | | |
| Michigan: 0.39% | | | | | | | | | | | | | | | | |
Michigan Finance Authority Local Government Loan Program Project Series E (Lease Revenue) | | | 7.19 | | | | 11-1-2022 | | | | 1,915,000 | | | | 2,139,572 | |
| | | | | | | | | | | | | | | | |
The accompanying notes are an integral part of these financial statements.
| | | | | | |
| Portfolio of investments—February 28, 2015 (unaudited) | | Wells Fargo Advantage Income Plus Fund | | | 13 | |
| | | | | | | | | | | | | | | | |
| Security name | | Interest rate | | | Maturity date | | | Principal | | | Value | |
| | | | |
| Puerto Rico: 0.37% | | | | | | | | | | | | | | | | |
Puerto Rico Commonwealth Government Development Bank Refunding Bond (Miscellaneous Revenue, National Insured) ± | | | 4.75 | % | | | 12-1-2015 | | | $ | 2,005,000 | | | $ | 2,010,113 | |
| | | | | | | | | | | | | | | | |
| | | | |
| Texas: 0.36% | | | | | | | | | | | | | | | | |
North Texas Tollway Authority Build America Bonds Sub Lien Series B-2 (Transportation Revenue) | | | 8.91 | | | | 2-1-2030 | | | | 1,595,000 | | | | 1,934,895 | |
| | | | | | | | | | | | | | | | |
| | | | |
| Washington: 0.18% | | | | | | | | | | | | | | | | |
Metropolitan Washington DC Airports Authority Dulles Toll Road Revenue Build America Bonds (Transportation Revenue) | | | 7.46 | | | | 10-1-2046 | | | | 695,000 | | | | 992,189 | |
| | | | | | | | | | | | | | | | |
| | | | |
Total Municipal Obligations (Cost $11,066,537) | | | | | | | | | | | | | | | 11,682,101 | |
| | | | | | | | | | | | | | | | |
| | | | |
Non-Agency Mortgage-Backed Securities: 4.07% | | | | | | | | | | | | | | | | |
Banc of America Commercial Mortgage Securities Incorporated Series 2007-1 Class AMFX ± | | | 5.48 | | | | 1-15-2049 | | | | 2,535,000 | | | | 2,662,832 | |
Bear Stearns Commercial Mortgage Securities Incorporated Series 2005-T20 Class A4A ± | | | 5.14 | | | | 10-12-2042 | | | | 2,342,990 | | | | 2,369,327 | |
Citigroup Commercial Mortgage Trust Series 2015-GC27 Class A5 | | | 3.14 | | | | 2-10-2048 | | | | 2,315,000 | | | | 2,345,658 | |
Commercial Mortgage Trust Pass-Through Certificate Series 2005-C6 Class A5A ± | | | 5.12 | | | | 6-10-2044 | | | | 1,908,525 | | | | 1,921,414 | |
Commercial Mortgage Trust Pass-Through Certificate Series 2014-LC17 Class A5 | | | 3.92 | | | | 10-10-2047 | | | | 1,270,000 | | | | 1,376,439 | |
Credit Suisse First Boston Commercial Mortgage Trust Series 1998-C2 Class AX ±(c) | | | 0.33 | | | | 11-15-2030 | | | | 302,408 | | | | 953 | |
Financial Asset Securitization Incorporated Series 1997-NAM2 Class B2 (s) | | | 7.88 | | | | 7-25-2027 | | | | 45,692 | | | | 42,499 | |
GAHR Commercial Mortgage Trust Series 2015-NRF Class AFX 144A | | | 3.23 | | | | 12-15-2019 | | | | 1,600,000 | | | | 1,649,076 | |
GE Capital Commercial Mortgage Corporation Series 2005-C3 Class A7A ± | | | 4.97 | | | | 7-10-2045 | | | | 2,695,000 | | | | 2,702,169 | |
JPMorgan Chase Commercial Mortgage Trust Series 2007-LDPX Class AM ± | | | 5.46 | | | | 1-15-2049 | | | | 1,980,000 | | | | 2,057,202 | |
Lehman Brothers UBS Commercial Mortgage Trust Series 2006-C1 Class A4 | | | 5.16 | | | | 2-15-2031 | | | | 3,449,851 | | | | 3,518,914 | |
Mach One Trust Commercial Mortgage Backed Series 2004-1 Class X ±144A(c)(i) | | | 0.54 | | | | 5-28-2040 | | | | 363,350 | | | | 3,710 | |
Morgan Stanley Capital I Series 2004-RR2 Class X ±144A(c) | | | 0.58 | | | | 10-28-2033 | | | | 217,037 | | | | 2,470 | |
Morgan Stanley Capital I Series 2005-T19 Class A4A | | | 4.89 | | | | 6-12-2047 | | | | 1,498,489 | | | | 1,504,886 | |
| | | | |
Total Non-Agency Mortgage-Backed Securities (Cost $22,605,098) | | | | | | | | | | | | | | | 22,157,549 | |
| | | | | | | | | | | | | | | | |
| | | | |
U.S. Treasury Securities: 24.07% | | | | | | | | | | | | | | | | |
U.S. Treasury Bond | | | 2.75 | | | | 11-15-2042 | | | | 3,280,000 | | | | 3,374,556 | |
U.S. Treasury Bond | | | 2.88 | | | | 5-15-2043 | | | | 5,370,000 | | | | 5,664,093 | |
U.S. Treasury Bond | | | 3.00 | | | | 11-15-2044 | | | | 3,685,000 | | | | 3,996,784 | |
U.S. Treasury Bond | | | 4.50 | | | | 2-15-2036 | | | | 5,095,000 | | | | 6,873,073 | |
U.S. Treasury Note | | | 0.25 | | | | 12-15-2015 | | | | 11,350,000 | | | | 11,354,438 | |
U.S. Treasury Note | | | 0.25 | | | | 5-15-2016 | | | | 2,975,000 | | | | 2,971,745 | |
U.S. Treasury Note | | | 0.38 | | | | 3-15-2015 | | | | 24,345,000 | | | | 24,346,899 | |
U.S. Treasury Note | | | 0.38 | | | | 11-15-2015 | | | | 5,820,000 | | | | 5,828,637 | |
U.S. Treasury Note | | | 0.38 | | | | 3-15-2016 | | | | 2,250,000 | | | | 2,251,582 | |
U.S. Treasury Note | | | 0.88 | | | | 1-31-2018 | | | | 10,075,000 | | | | 10,040,362 | |
U.S. Treasury Note | | | 1.00 | | | | 8-31-2016 | | | | 11,380,000 | | | | 11,473,350 | |
U.S. Treasury Note | | | 1.00 | | | | 5-31-2018 | | | | 10,335,000 | | | | 10,296,244 | |
U.S. Treasury Note | | | 1.25 | | | | 10-31-2018 | | | | 7,145,000 | | | | 7,146,672 | |
U.S. Treasury Note | | | 1.38 | | | | 7-31-2018 | | | | 4,290,000 | | | | 4,319,494 | |
U.S. Treasury Note | | | 1.63 | | | | 12-31-2019 | | | | 1,690,000 | | | | 1,700,299 | |
U.S. Treasury Note | | | 2.00 | | | | 2-15-2025 | | | | 1,355,000 | | | | 1,355,106 | |
U.S. Treasury Note | | | 2.25 | | | | 7-31-2018 | | | | 17,585,000 | | | | 18,218,341 | |
| | | | |
Total U.S. Treasury Securities (Cost $128,996,240) | | | | | | | | | | | | | | | 131,211,675 | |
| | | | | | | | | | | | | | | | |
The accompanying notes are an integral part of these financial statements.
| | | | |
| 14 | | Wells Fargo Advantage Income Plus Fund | | Portfolio of investments—February 28, 2015 (unaudited) |
| | | | | | | | | | | | | | | | |
| Security name | | Interest rate | | | Maturity date | | | Principal | | | Value | |
| | | | |
Yankee Corporate Bonds and Notes: 7.60% | | | | | | | | | | | | | | | | |
| | | | |
Consumer Discretionary: 0.82% | | | | | | | | | | | | | | | | |
| | | | |
| Automobiles: 0.21% | | | | | | | | | | | | | | | | |
Jaguar Land Rover Automotive plc 144A | | | 5.63 | % | | | 2-1-2023 | | | $ | 1,065,000 | | | $ | 1,144,875 | |
| | | | | | | | | | | | | | | | |
| | | | |
| Media: 0.61% | | | | | | | | | | | | | | | | |
Myriad International Holdings BV 144A | | | 6.38 | | | | 7-28-2017 | | | | 1,445,000 | | | | 1,567,825 | |
WPP Finance 2010 | | | 5.63 | | | | 11-15-2043 | | | | 1,470,000 | | | | 1,771,374 | |
| | | | | | | | | | | | | | | 3,339,199 | |
| | | | | | | | | | | | | | | | |
| | | | |
Consumer Staples: 0.26% | | | | | | | | | | | | | | | | |
| | | | |
| Food Products: 0.26% | | | | | | | | | | | | | | | | |
BRF SA 144A | | | 3.95 | | | | 5-22-2023 | | | | 1,525,000 | | | | 1,437,923 | |
| | | | | | | | | | | | | | | | |
| | | | |
Energy: 0.92% | | | | | | | | | | | | | | | | |
| | | | |
| Energy Equipment & Services: 0.49% | | | | | | | | | | | | | | | | |
Ensco plc | | | 4.70 | | | | 3-15-2021 | | | | 2,605,000 | | | | 2,676,093 | |
| | | | | | | | | | | | | | | | |
| | | | |
| Oil, Gas & Consumable Fuels: 0.43% | | | | | | | | | | | | | | | | |
Ecopetrol SA | | | 4.13 | | | | 1-16-2025 | | | | 1,860,000 | | | | 1,770,162 | |
Talisman Energy Incorporated | | | 5.50 | | | | 5-15-2042 | | | | 545,000 | | | | 557,401 | |
| | | | | | | | | | | | | | | 2,327,563 | |
| | | | | | | | | | | | | | | | |
| | | | |
Financials: 2.28% | | | | | | | | | | | | | | | | |
| | | | |
| Banks: 1.79% | | | | | | | | | | | | | | | | |
BBVA Bancomer SA 144A | | | 4.50 | | | | 3-10-2016 | | | | 1,720,000 | | | | 1,778,480 | |
BPCE SA 144A | | | 5.15 | | | | 7-21-2024 | | | | 2,005,000 | | | | 2,146,367 | |
Nordea Bank AB ±144A | | | 5.50 | | | | 12-31-2049 | | | | 1,800,000 | | | | 1,845,000 | |
Oversea-Chinese Banking Corporation Limited ±144A | | | 4.00 | | | | 10-15-2024 | | | | 2,505,000 | | | | 2,589,930 | |
Royal Bank of Scotland Group plc | | | 5.13 | | | | 5-28-2024 | | | | 1,295,000 | | | | 1,371,665 | |
| | | | | | | | | | | | | | | 9,731,442 | |
| | | | | | | | | | | | | | | | |
| | | | |
| Capital Markets: 0.49% | | | | | | | | | | | | | | | | |
Macquarie Group Limited 144A | | | 6.00 | | | | 1-14-2020 | | | | 2,365,000 | | | | 2,683,258 | |
| | | | | | | | | | | | | | | | |
| | | | |
Health Care: 0.58% | | | | | | | | | | | | | | | | |
| | | | |
| Pharmaceuticals: 0.58% | | | | | | | | | | | | | | | | |
Actavis Funding SCS | | | 4.85 | | | | 6-15-2044 | | | | 1,255,000 | | | | 1,291,519 | |
Perrigo Company plc | | | 5.30 | | | | 11-15-2043 | | | | 1,635,000 | | | | 1,848,990 | |
| | | | | | | | | | | | | | | 3,140,509 | |
| | | | | | | | | | | | | | | | |
| | | | |
Information Technology: 0.59% | | | | | | | | | | | | | | | | |
| | | | |
| Internet Software & Services: 0.19% | | | | | | | | | | | | | | | | |
Tencent Holdings Limited 144A | | | 3.38 | | | | 5-2-2019 | | | | 1,000,000 | | | | 1,026,850 | |
| | | | | | | | | | | | | | | | |
| | | | |
| Technology Hardware, Storage & Peripherals: 0.40% | | | | | | | | | | | | | | | | |
Seagate HDD (Cayman) 144A | | | 4.75 | | | | 1-1-2025 | | | | 2,075,000 | | | | 2,197,000 | |
| | | | | | | | | | | | | | | | |
The accompanying notes are an integral part of these financial statements.
| | | | | | |
| Portfolio of investments—February 28, 2015 (unaudited) | | Wells Fargo Advantage Income Plus Fund | | | 15 | |
| | | | | | | | | | | | | | | | |
| Security name | | Interest rate | | | Maturity date | | | Principal | | | Value | |
| | | | |
Materials: 0.88% | | | | | | | | | | | | | | | | |
| | | | |
| Chemicals: 0.57% | | | | | | | | | | | | | | | | |
Agrium Incorporated %% | | | 4.13 | % | | | 3-15-2035 | | | $ | 1,955,000 | | | $ | 1,927,464 | |
Ineos Finance plc 144A | | | 7.50 | | | | 5-1-2020 | | | | 1,100,000 | | | | 1,167,375 | |
| | | | | | | | | | | | | | | 3,094,839 | |
| | | | | | | | | | | | | | | | |
| | | | |
| Metals & Mining: 0.31% | | | | | | | | | | | | | | | | |
ArcelorMittal SA | | | 6.13 | | | | 6-1-2018 | | | | 1,565,000 | | | | 1,693,917 | |
| | | | | | | | | | | | | | | | |
| | | | |
Telecommunication Services: 0.41% | | | | | | | | | | | | | | | | |
| | | | |
| Wireless Telecommunication Services: 0.41% | | | | | | | | | | | | | | | | |
Globo Communicacoes Participacoes SA 144A | | | 4.88 | | | | 4-11-2022 | | | | 2,145,000 | | | | 2,220,075 | |
| | | | | | | | | | | | | | | | |
| | | | |
Utilities: 0.86% | | | | | | | | | | | | | | | | |
| | | | |
| Electric Utilities: 0.86% | | | | | | | | | | | | | | | | |
Comision Federal de Electricidad 144A | | | 4.88 | | | | 1-15-2024 | | | | 1,635,000 | | | | 1,720,020 | |
Western Power Distributions Holdings Limited 144A | | | 7.38 | | | | 12-15-2028 | | | | 2,265,000 | | | | 2,964,673 | |
| | | | | | | | | | | | | | | 4,684,693 | |
| | | | | | | | | | | | | | | | |
| | | | |
Total Yankee Corporate Bonds and Notes (Cost $38,791,292) | | | | | | | | | | | | | | | 41,398,236 | |
| | | | | | | | | | | | | | | | |
| | | | |
| | | Yield | | | | | | Shares | | | | |
| | | | |
Short-Term Investments: 24.72% | | | | | | | | | | | | | | | | |
| | | | |
| Investment Companies: 24.58% | | | | | | | | | | | | | | | | |
Securities Lending Cash Investments, LLC (l)(r)(u) | | | 0.13 | | | | | | | | 1,344,000 | | | | 1,344,000 | |
Wells Fargo Advantage Cash Investment Money Market Fund, Select Class (l)(u)## | | | 0.10 | | | | | | | | 132,609,569 | | | | 132,609,569 | |
| | | | | | | | | | | | | | | 133,953,569 | |
| | | | | | | | | | | | | | | | |
| | | | |
| | | | | | | | | Principal | | | | |
| | | | |
| U.S. Treasury Securities: 0.14% | | | | | | | | | | | | | | | | |
U.S. Treasury Bill (z)# | | | 0.01 | | | | 3-19-2015 | | | $ | 50,000 | | | | 50,000 | |
U.S. Treasury Bill (z)# | | | 0.01 | | | | 3-19-2015 | | | | 700,000 | | | | 699,995 | |
| | | | | | | | | | | | | | | 749,995 | |
| | | | | | | | | | | | | | | | |
| | | | |
Total Short-Term Investments (Cost $134,703,561) | | | | | | | | | | | | | | | 134,703,564 | |
| | | | | | | | | | | | | | | | |
| | | | | | | | |
| Total investments in securities (Cost $637,986,034) * | | | 120.25 | % | | | 655,358,782 | |
Other assets and liabilities, net | | | (20.25 | ) | | | (110,356,870 | ) |
| | | | | | | | |
| Total net assets | | | 100.00 | % | | $ | 545,001,912 | |
| | | | | | | | |
The accompanying notes are an integral part of these financial statements.
| | | | |
| 16 | | Wells Fargo Advantage Income Plus Fund | | Portfolio of investments—February 28, 2015 (unaudited) |
| ± | Variable rate investment. The rate shown is the rate in effect at period end. |
| %% | The security is issued on a when-issued basis. |
| 144A | The security may be resold in transactions exempt from registration, normally to qualified institutional buyers, pursuant to Rule 144A under the Securities Act of 1933. |
| (c) | Investment in an interest-only security entitles holders to receive only the interest payments on the underlying mortgages. The principal amount shown is the notional amount of the underlying mortgages. The rate represents the coupon rate. |
| « | All or a portion of this security is on loan. |
| (s) | The security is currently in default with regards to scheduled interest and/or principal payments. The Fund has stopped accruing interest on the security. |
| (l) | The security represents an affiliate of the Fund as defined in the Investment Company Act of 1940. |
| (r) | The investment is a non-registered investment vehicle purchased with cash collateral received from securities on loan. |
| (u) | The rate represents the 7-day annualized yield at period end. |
| ## | All or a portion of this security is segregated for when-issued securities. |
| (z) | Zero coupon security. The rate represents the current yield to maturity. |
| # | All or a portion of this security is segregated as collateral for investments in derivative instruments. |
| * | Cost for federal income tax purposes is $638,185,688 and unrealized gains (losses) consists of: |
| | | | |
Gross unrealized gains | | $ | 18,635,008 | |
Gross unrealized losses | | | (1,461,914 | ) |
| | | | |
Net unrealized gains | | $ | 17,173,094 | |
The accompanying notes are an integral part of these financial statements.
| | | | | | |
| Statement of assets and liabilities—February 28, 2015 (unaudited) | | Wells Fargo Advantage Income Plus Fund | | | 17 | |
| | | | |
| | | | |
| |
Assets | | | | |
Investments | | | | |
In unaffiliated securities (including $1,315,688 of securities loaned), at value (cost $504,032,465) | | $ | 521,405,213 | |
In affiliated securities, at value (cost $133,953,569) | | | 133,953,569 | |
| | | | |
Total investments, at value (cost $637,986,034) | | | 655,358,782 | |
Cash | | | 1,699,549 | |
Receivable for investments sold | | | 3,513,411 | |
Principal paydown receivable | | | 11 | |
Receivable for Fund shares sold | | | 1,007,335 | |
Receivable for interest | | | 3,522,059 | |
Receivable for daily variation margin on open futures contracts | | | 104,864 | |
Receivable for securities lending income | | | 330 | |
Prepaid expenses and other assets | | | 188,797 | |
| | | | |
Total assets | | | 665,395,138 | |
| | | | |
| |
Liabilities | | | | |
Payable for investments purchased | | | 118,177,602 | |
Payable for Fund shares redeemed | | | 458,010 | |
Payable upon receipt of securities loaned | | | 1,344,000 | |
Payable for daily variation margin on open futures contracts | | | 5,625 | |
Advisory fee payable | | | 138,877 | |
Distribution fees payable | | | 13,864 | |
Administration fees payable | | | 85,598 | |
Accrued expenses and other liabilities | | | 169,650 | |
| | | | |
Total liabilities | | | 120,393,226 | |
| | | | |
Total net assets | | $ | 545,001,912 | |
| | | | |
| |
NET ASSETS CONSIST OF | | | | |
Paid-in capital | | $ | 548,091,825 | |
Undistributed net investment income | | | 227,634 | |
Accumulated net realized losses on investments | | | (20,733,916 | ) |
Net unrealized gains on investments | | | 17,416,369 | |
| | | | |
Total net assets | | $ | 545,001,912 | |
| | | | |
| |
COMPUTATION OF NET ASSET VALUE AND OFFERING PRICE PER SHARE | | | | |
Net assets – Class A | | $ | 188,917,085 | |
Shares outstanding – Class A1 | | | 15,231,633 | |
Net asset value per share – Class A | | | $12.40 | |
Maximum offering price per share – Class A2 | | | $12.98 | |
Net assets – Class B | | $ | 592,426 | |
Shares outstanding – Class B1 | | | 47,651 | |
Net asset value per share – Class B | | | $12.43 | |
Net assets – Class C | | $ | 22,432,142 | |
Shares outstanding – Class C1 | | | 1,809,174 | |
Net asset value per share – Class C | | | $12.40 | |
Net assets – Administrator Class | | $ | 97,252,892 | |
Shares outstanding – Administrator Class1 | | | 7,853,555 | |
Net asset value per share – Administrator Class | | | $12.38 | |
Net assets – Institutional Class | | $ | 65,728,623 | |
Shares outstanding – Institutional Class1 | | | 5,294,889 | |
Net asset value per share – Institutional Class | | | $12.41 | |
Net assets – Investor Class | | $ | 170,078,744 | |
Shares outstanding – Investor Class1 | | | 13,713,672 | |
Net asset value per share – Investor Class | | | $12.40 | |
| 1 | The Fund has an unlimited number of authorized shares. |
| 2 | Maximum offering price is computed as 100/95.50 of net asset value. On investments of $50,000 or more, the offering price is reduced. |
The accompanying notes are an integral part of these financial statements.
| | | | |
| 18 | | Wells Fargo Advantage Income Plus Fund | | Statement of operations—six months ended February 28, 2015 (unaudited) |
| | | | |
| | | | |
| |
Investment income | | | | |
Interest (net of foreign interest withholding taxes of $1,370) | | $ | 6,529,323 | |
Income from affiliated securities | | | 47,495 | |
Securities lending income, net | | | 3,354 | |
| | | | |
Total investment income | | | 6,580,172 | |
| | | | |
| |
Expenses | | | | |
Advisory fee | | | 1,012,103 | |
Administration fees | | | | |
Fund level | | | 126,813 | |
Class A | | | 130,269 | |
Class B | | | 539 | |
Class C | | | 18,287 | |
Administrator Class | | | 49,298 | |
Institutional Class | | | 22,801 | |
Investor Class | | | 157,018 | |
Shareholder servicing fees | | | | |
Class A | | | 203,546 | |
Class B | | | 842 | |
Class C | | | 28,573 | |
Administrator Class | | | 123,246 | |
Investor Class | | | 200,958 | |
Distribution fees | | | | |
Class B | | | 2,526 | |
Class C | | | 85,720 | |
Custody and accounting fees | | | 18,975 | |
Professional fees | | | 32,015 | |
Registration fees | | | 39,929 | |
Shareholder report expenses | | | 32,868 | |
Trustees’ fees and expenses | | | 5,376 | |
Other fees and expenses | | | 8,001 | |
| | | | |
Total expenses | | | 2,299,703 | |
Less: Fee waivers and/or expense reimbursements | | | (206,059 | ) |
| | | | |
Net expenses | | | 2,093,644 | |
| | | | |
Net investment income | | | 4,486,528 | |
| | | | |
| |
REALIZED AND UNREALIZED GAINS (LOSSES) ON INVESTMENTS | | | | |
| |
Net realized gains on: | | | | |
Unaffiliated securities | | | 4,899,330 | |
Futures transactions | | | 1,746,307 | |
| | | | |
Net realized gains on investments | | | 6,645,637 | |
| | | | |
| |
Net change in unrealized gains (losses) on: | | | | |
Unaffiliated securities | | | 1,522,959 | |
Futures transactions | | | (9,380 | ) |
| | | | |
Net change in unrealized gains (losses) on investments | | | 1,513,579 | |
| | | | |
Net realized and unrealized gains (losses) on investments | | | 8,159,216 | |
| | | | |
Net increase in net assets resulting from operations | | $ | 12,645,744 | |
| | | | |
The accompanying notes are an integral part of these financial statements.
| | | | | | |
| Statement of changes in net assets | | Wells Fargo Advantage Income Plus Fund | | | 19 | |
| | | | | | | | | | | | | | | | |
| | | Six months ended
February 28, 2015
(unaudited) | | | Year ended
August 31, 2014 | |
| | | |
Operations | | | | | | | | | | | | |
Net investment income | | | | | | $ | 4,486,528 | | | | | | | $ | 9,774,480 | |
Net realized gains on investments | | | | | | | 6,645,637 | | | | | | | | 10,554,149 | |
Net change in unrealized gains (losses) on investments | | | | | | | 1,513,579 | | | | | | | | 11,729,731 | |
| | | | |
Net increase in net assets resulting from operations | | | | | | | 12,645,744 | | | | | | | | 32,058,360 | |
| | | | |
| | | |
Distributions to shareholders from | | | | | | | | | | | | |
Net investment income | | | | | | | | | | | | | | | | |
Class A | | | | | | | (1,419,867 | ) | | | | | | | (2,785,204 | ) |
Class B | | | | | | | (3,131 | ) | | | | | | | (13,132 | ) |
Class C | | | | | | | (108,854 | ) | | | | | | | (338,257 | ) |
Administrator Class | | | | | | | (896,890 | ) | | | | | | | (2,257,480 | ) |
Institutional Class | | | | | | | (567,082 | ) | | | | | | | (736,477 | ) |
Investor Class | | | | | | | (1,401,900 | ) | | | | | | | (3,450,416 | ) |
Net realized gains | | | | | | | | | | | | | | | | |
Class A | | | | | | | (280,520 | ) | | | | | | | 0 | |
Class B | | | | | | | (1,076 | ) | | | | | | | 0 | |
Class C | | | | | | | (36,727 | ) | | | | | | | 0 | |
Administrator Class | | | | | | | (161,370 | ) | | | | | | | 0 | |
Institutional Class | | | | | | | (105,379 | ) | | | | | | | 0 | |
Investor Class | | | | | | | (272,008 | ) | | | | | | | 0 | |
| | | | |
Total distributions to shareholders | | | | | | | (5,254,804 | ) | | | | | | | (9,580,966 | ) |
| | | | |
| | | | |
Capital share transactions | | | Shares | | | | | | | | Shares | | | | | |
Proceeds from shares sold | | | | | | | | | | | | | | | | |
Class A | | | 5,873,680 | | | | 71,965,084 | | | | 1,160,901 | | | | 13,868,244 | |
Class B | | | 3,022 | | | | 37,000 | | | | 1,314 | | | | 15,572 | |
Class C | | | 108,477 | | | | 1,331,099 | | | | 121,464 | | | | 1,456,327 | |
Administrator Class | | | 651,825 | | | | 7,981,767 | | | | 1,398,185 | | | | 16,701,941 | |
Institutional Class | | | 2,750,810 | | | | 33,573,189 | | | | 492,530 | | | | 5,877,370 | |
Investor Class | | | 1,080,278 | | | | 13,304,553 | | | | 1,209,453 | | | | 14,530,064 | |
| | | | |
| | | | | | | 128,192,692 | | | | | | | | 52,449,518 | |
| | | | |
Reinvestment of distributions | | | | | | | | | | | | | | | | |
Class A | | | 125,816 | | | | 1,542,477 | | | | 200,967 | | | | 2,404,891 | |
Class B | | | 319 | | | | 3,912 | | | | 1,010 | | | | 12,092 | |
Class C | | | 8,749 | | | | 107,109 | | | | 21,094 | | | | 252,249 | |
Administrator Class | | | 85,925 | | | | 1,051,106 | | | | 186,098 | | | | 2,223,323 | |
Institutional Class | | | 51,729 | | | | 635,009 | | | | 55,722 | | | | 667,499 | |
Investor Class | | | 127,068 | | | | 1,556,833 | | | | 264,594 | | | | 3,166,726 | |
| | | | |
| | | | | | | 4,896,446 | | | | | | | | 8,726,780 | |
| | | | |
Payment for shares redeemed | | | | | | | | | | | | | | | | |
Class A | | | (1,363,692 | ) | | | (16,728,095 | ) | | | (3,358,614 | ) | | | (40,016,695 | ) |
Class B | | | (17,093 | ) | | | (210,090 | ) | | | (77,587 | ) | | | (923,855 | ) |
Class C | | | (287,632 | ) | | | (3,519,334 | ) | | | (710,658 | ) | | | (8,466,146 | ) |
Administrator Class | | | (1,205,817 | ) | | | (14,781,307 | ) | | | (2,289,649 | ) | | | (27,320,284 | ) |
Institutional Class | | | (156,812 | ) | | | (1,924,999 | ) | | | (574,594 | ) | | | (6,862,926 | ) |
Investor Class | | | (1,270,020 | ) | | | (15,557,505 | ) | | | (2,494,085 | ) | | | (29,776,812 | ) |
| | | | |
| | | | | | | (52,721,330 | ) | | | | | | | (113,366,718 | ) |
| | | | |
Net increase (decrease) in net assets resulting from capital share transactions | | | | | | | 80,367,808 | | | | | | | | (52,190,420 | ) |
| | | | |
Total increase (decrease) in net assets | | | | | | | 87,758,748 | | | | | | | | (29,713,026 | ) |
| | | | |
| | |
Net assets | | | | | | | | |
Beginning of period | | | | | | | 457,243,164 | | | | | | | | 486,956,190 | |
| | | | |
End of period | | | | | | $ | 545,001,912 | | | | | | | $ | 457,243,164 | |
| | | | |
Undistributed net investment income | | | | | | $ | 227,634 | | | | | | | $ | 138,830 | |
| | | | |
The accompanying notes are an integral part of these financial statements.
| | | | |
| 20 | | Wells Fargo Advantage Income Plus Fund | | Financial highlights |
(For a share outstanding throughout each period)
| | | | | | | | | | | | | | | | | | | | | | | | | | | | |
| | | Six months ended
February 28, 2015
(unaudited) | | | Year ended August 31 | | | Year ended
May 31, 2010 | |
| CLASS A | | | 2014 | | | 2013 | | | 2012 | | | 2011 | | | 20101 | | |
Net asset value, beginning of period | | | $12.24 | | | | $11.66 | | | | $12.57 | | | | $12.04 | | | | $12.00 | | | | $11.59 | | | | $10.82 | |
Net investment income | | | 0.11 | 2 | | | 0.26 | | | | 0.25 | | | | 0.30 | | | | 0.37 | 2 | | | 0.09 | 2 | | | 0.37 | 2 |
Net realized and unrealized gains (losses) on investments | | | 0.17 | | | | 0.57 | | | | (0.51 | ) | | | 0.55 | | | | 0.18 | | | | 0.44 | | | | 0.88 | |
| | | | | | | | | | | | | | | | | | | | | | | | | | | | |
Total from investment operations | | | 0.28 | | | | 0.83 | | | | (0.26 | ) | | | 0.85 | | | | 0.55 | | | | 0.53 | | | | 1.25 | |
Distributions to shareholders from | | | | | | | | | | | | | | | | | | | | |
Net investment income | | | (0.10 | ) | | | (0.25 | ) | | | (0.25 | ) | | | (0.29 | ) | | | (0.42 | ) | | | (0.12 | ) | | | (0.48 | ) |
Net realized gains | | | (0.02 | ) | | | 0.00 | | | | (0.40 | ) | | | (0.03 | ) | | | (0.09 | ) | | | 0.00 | | | | 0.00 | |
| | | | | | | | | | | | | | | | | | | | | | | | | | | | |
Total distributions to shareholders | | | (0.12 | ) | | | (0.25 | ) | | | (0.65 | ) | | | (0.32 | ) | | | (0.51 | ) | | | (0.12 | ) | | | (0.48 | ) |
Net asset value, end of period | | | $12.40 | | | | $12.24 | | | | $11.66 | | | | $12.57 | | | | $12.04 | | | | $12.00 | | | | $11.59 | |
Total return3 | | | 2.34 | % | | | 7.16 | % | | | (2.25 | )% | | | 7.19 | % | | | 4.76 | % | | | 4.62 | % | | | 11.74 | % |
Ratios to average net assets (annualized) | | | | | | | | | | | | | | | | | | | | |
Gross expenses | | | 0.91 | % | | | 0.93 | % | | | 0.91 | % | | | 0.89 | % | | | 0.88 | % | | | 0.91 | % | | | 1.03 | % |
Net expenses | | | 0.84 | % | | | 0.85 | % | | | 0.87 | % | | | 0.88 | % | | | 0.88 | % | | | 0.88 | % | | | 0.90 | % |
Net investment income | | | 1.76 | % | | | 2.10 | % | | | 2.00 | % | | | 2.42 | % | | | 3.17 | % | | | 3.07 | % | | | 3.29 | % |
Supplemental data | | | | | | | | | | | | | | | | | | | | |
Portfolio turnover rate | | | 148 | % | | | 267 | % | | | 256 | % | | | 256 | % | | | 215 | % | | | 84 | % | | | 187 | % |
Net assets, end of period (000s omitted) | | | $188,917 | | | | $129,646 | | | | $146,836 | | | | $172,577 | | | | $163,499 | | | | $261,227 | | | | $130,382 | |
| 1 | For the three months ended August 31, 2010. The Fund changed its fiscal year end from May 31 to August 31, effective August 31, 2010. |
| 2 | Calculated based upon average shares outstanding |
| 3 | Total return calculations do not include any sales charges. Returns for periods of less than one year are not annualized. |
The accompanying notes are an integral part of these financial statements.
| | | | | | |
| Financial highlights | | Wells Fargo Advantage Income Plus Fund | | | 21 | |
(For a share outstanding throughout each period)
| | | | | | | | | | | | | | | | | | | | | | | | | | | | |
| | | Six months ended
February 28, 2015
(unaudited) | | | Year ended August 31 | | | Year ended
May 31, 2010 | |
| CLASS B | | | 2014 | | | 2013 | | | 2012 | | | 2011 | | | 20101 | | |
Net asset value, beginning of period | | | $12.26 | | | | $11.68 | | | | $12.59 | | | | $12.05 | | | | $12.01 | | | | $11.61 | | | | $10.82 | |
Net investment income | | | 0.06 | 2 | | | 0.16 | 2 | | | 0.15 | 2 | | | 0.21 | 2 | | | 0.29 | 2 | | | 0.07 | 2 | | | 0.29 | 2 |
Net realized and unrealized gains (losses) on investments | | | 0.19 | | | | 0.57 | | | | (0.51 | ) | | | 0.56 | | | | 0.17 | | | | 0.43 | | | | 0.89 | |
| | | | | | | | | | | | | | | | | | | | | | | | | | | | |
Total from investment operations | | | 0.25 | | | | 0.73 | | | | (0.36 | ) | | | 0.77 | | | | 0.46 | | | | 0.50 | | | | 1.18 | |
Distributions to shareholders from | | | | | | | | | | | | | | | | | | | | |
Net investment income | | | (0.06 | ) | | | (0.15 | ) | | | (0.15 | ) | | | (0.20 | ) | | | (0.33 | ) | | | (0.10 | ) | | | (0.39 | ) |
Net realized gains | | | (0.02 | ) | | | 0.00 | | | | (0.40 | ) | | | (0.03 | ) | | | (0.09 | ) | | | 0.00 | | | | 0.00 | |
| | | | | | | | | | | | | | | | | | | | | | | | | | | | |
Total distributions to shareholders | | | (0.08 | ) | | | (0.15 | ) | | | (0.55 | ) | | | (0.23 | ) | | | (0.42 | ) | | | (0.10 | ) | | | (0.39 | ) |
Net asset value, end of period | | | $12.43 | | | | $12.26 | | | | $11.68 | | | | $12.59 | | | | $12.05 | | | | $12.01 | | | | $11.61 | |
Total return3 | | | 2.02 | % | | | 6.30 | % | | | (3.00 | )% | | | 6.45 | % | | | 3.97 | % | | | 4.31 | % | | | 11.04 | % |
Ratios to average net assets (annualized) | | | | | | | | | | | | | | | | | | | | |
Gross expenses | | | 1.66 | % | | | 1.68 | % | | | 1.66 | % | | | 1.63 | % | | | 1.63 | % | | | 1.65 | % | | | 1.78 | % |
Net expenses | | | 1.59 | % | | | 1.60 | % | | | 1.62 | % | | | 1.62 | % | | | 1.63 | % | | | 1.62 | % | | | 1.65 | % |
Net investment income | | | 1.01 | % | | | 1.35 | % | | | 1.24 | % | | | 1.71 | % | | | 2.40 | % | | | 2.33 | % | | | 2.54 | % |
Supplemental data | | | | | | | | | | | | | | | | | | | | |
Portfolio turnover rate | | | 148 | % | | | 267 | % | | | 256 | % | | | 256 | % | | | 215 | % | | | 84 | % | | | 187 | % |
Net assets, end of period (000s omitted) | | | $592 | | | | $753 | | | | $1,597 | | | | $2,823 | | | | $4,054 | | | | $6,140 | | | | $1,839 | |
| 1 | For the three months ended August 31, 2010. The Fund changed its fiscal year end from May 31 to August 31, effective August 31, 2010. |
| 2 | Calculated based upon average shares outstanding |
| 3 | Total return calculations do not include any sales charges. Returns for periods of less than one year are not annualized. |
The accompanying notes are an integral part of these financial statements.
| | | | |
| 22 | | Wells Fargo Advantage Income Plus Fund | | Financial highlights |
(For a share outstanding throughout each period)
| | | | | | | | | | | | | | | | | | | | | | | | | | | | |
| | | Six months ended
February 28, 2015
(unaudited) | | | Year ended August 31 | | | Year ended
May 31, 2010 | |
| CLASS C | | | 2014 | | | 2013 | | | 2012 | | | 2011 | | | 20101 | | |
Net asset value, beginning of period | | | $12.23 | | | | $11.65 | | | | $12.56 | | | | $12.03 | | | | $12.00 | | | | $11.59 | | | | $10.82 | |
Net investment income | | | 0.06 | | | | 0.16 | | | | 0.15 | | | | 0.21 | | | | 0.29 | 2 | | | 0.07 | 2 | | | 0.29 | 2 |
Net realized and unrealized gains (losses) on investments | | | 0.19 | | | | 0.58 | | | | (0.51 | ) | | | 0.55 | | | | 0.16 | | | | 0.44 | | | | 0.88 | |
| | | | | | | | | | | | | | | | | | | | | | | | | | | | |
Total from investment operations | | | 0.25 | | | | 0.74 | | | | (0.36 | ) | | | 0.76 | | | | 0.45 | | | | 0.51 | | | | 1.17 | |
Distributions to shareholders from | | | | | | | | | | | | | | | | | | | | |
Net investment income | | | (0.06 | ) | | | (0.16 | ) | | | (0.15 | ) | | | (0.20 | ) | | | (0.33 | ) | | | (0.10 | ) | | | (0.40 | ) |
Net realized gains | | | (0.02 | ) | | | 0.00 | | | | (0.40 | ) | | | (0.03 | ) | | | (0.09 | ) | | | 0.00 | | | | 0.00 | |
| | | | | | | | | | | | | | | | | | | | | | | | | | | | |
Total distributions to shareholders | | | (0.08 | ) | | | (0.16 | ) | | | (0.55 | ) | | | (0.23 | ) | | | (0.42 | ) | | | (0.10 | ) | | | (0.40 | ) |
Net asset value, end of period | | | $12.40 | | | | $12.23 | | | | $11.65 | | | | $12.56 | | | | $12.03 | | | | $12.00 | | | | $11.59 | |
Total return3 | | | 2.04 | % | | | 6.35 | % | | | (3.00 | )% | | | 6.40 | % | | | 3.92 | % | | | 4.42 | % | | | 10.93 | % |
Ratios to average net assets (annualized) | | | | | | | | | | | | | | | | | | | | |
Gross expenses | | | 1.66 | % | | | 1.68 | % | | | 1.66 | % | | | 1.64 | % | | | 1.63 | % | | | 1.66 | % | | | 1.78 | % |
Net expenses | | | 1.59 | % | | | 1.60 | % | | | 1.62 | % | | | 1.63 | % | | | 1.63 | % | | | 1.63 | % | | | 1.65 | % |
Net investment income | | | 1.01 | % | | | 1.35 | % | | | 1.24 | % | | | 1.65 | % | | | 2.41 | % | | | 2.32 | % | | | 2.53 | % |
Supplemental data | | | | | | | | | | | | | | | | | | | | |
Portfolio turnover rate | | | 148 | % | | | 267 | % | | | 256 | % | | | 256 | % | | | 215 | % | | | 84 | % | | | 187 | % |
Net assets, end of period (000s omitted) | | | $22,432 | | | | $24,212 | | | | $29,692 | | | | $41,259 | | | | $30,364 | | | | $30,253 | | | | $14,533 | |
| 1 | For the three months ended August 31, 2010. The Fund changed its fiscal year end from May 31 to August 31, effective August 31, 2010. |
| 2 | Calculated based upon average shares outstanding |
| 3 | Total return calculations do not include any sales charges. Returns for periods of less than one year are not annualized. |
The accompanying notes are an integral part of these financial statements.
| | | | | | |
| Financial highlights | | Wells Fargo Advantage Income Plus Fund | | | 23 | |
(For a share outstanding throughout each period)
| | | | | | | | | | | | | | | | | | | | | | | | |
| | | Six months ended
February 28, 2015
(unaudited) | | | Year ended August 31 | |
| ADMINISTRATOR CLASS | | | 2014 | | | 2013 | | | 2012 | | | 2011 | | | 20101 | |
Net asset value, beginning of period | | | $12.22 | | | | $11.64 | | | | $12.55 | | | | $12.02 | | | | $12.00 | | | | $11.87 | |
Net investment income | | | 0.11 | | | | 0.27 | 2 | | | 0.26 | 2 | | | 0.33 | | | | 0.39 | 2 | | | 0.03 | 2 |
Net realized and unrealized gains (losses) on investments | | | 0.18 | | | | 0.57 | | | | (0.51 | ) | | | 0.54 | | | | 0.16 | | | | 0.14 | |
| | | | | | | | | | | | | | | | | | | | | | | | |
Total from investment operations | | | 0.29 | | | | 0.84 | | | | (0.25 | ) | | | 0.87 | | | | 0.55 | | | | 0.17 | |
Distributions to shareholders from | | | | | | | | | | | | | | | | | | | | | | | | |
Net investment income | | | (0.11 | ) | | | (0.26 | ) | | | (0.26 | ) | | | (0.31 | ) | | | (0.44 | ) | | | (0.04 | ) |
Net realized gains | | | (0.02 | ) | | | 0.00 | | | | (0.40 | ) | | | (0.03 | ) | | | (0.09 | ) | | | 0.00 | |
| | | | | | | | | | | | | | | | | | | | | | | | |
Total distributions to shareholders | | | (0.13 | ) | | | (0.26 | ) | | | (0.66 | ) | | | (0.34 | ) | | | (0.53 | ) | | | (0.04 | ) |
Net asset value, end of period | | | $12.38 | | | | $12.22 | | | | $11.64 | | | | $12.55 | | | | $12.02 | | | | $12.00 | |
Total return3 | | | 2.40 | % | | | 7.31 | % | | | (2.11 | )% | | | 7.37 | % | | | 4.82 | % | | | 1.43 | % |
Ratios to average net assets (annualized) | | | | | | | | | | | | | | | | | | | | | | | | |
Gross expenses | | | 0.85 | % | | | 0.87 | % | | | 0.85 | % | | | 0.83 | % | | | 0.82 | % | | | 0.86 | % |
Net expenses | | | 0.72 | % | | | 0.72 | % | | | 0.72 | % | | | 0.73 | % | | | 0.75 | % | | | 0.86 | % |
Net investment income | | | 1.88 | % | | | 2.24 | % | | | 2.14 | % | | | 2.53 | % | | | 3.29 | % | | | 3.31 | % |
Supplemental data | | | | | | | | | | | | | | | | | | | | | | | | |
Portfolio turnover rate | | | 148 | % | | | 267 | % | | | 256 | % | | | 256 | % | | | 215 | % | | | 84 | % |
Net assets, end of period (000s omitted) | | | $97,253 | | | | $101,653 | | | | $105,094 | | | | $162,067 | | | | $90,063 | | | | $10 | |
| 1 | For the period from July 30, 2010 (commencement of class operations) to August 31, 2010 |
| 2 | Calculated based upon average shares outstanding |
| 3 | Returns for periods of less than one year are not annualized. |
The accompanying notes are an integral part of these financial statements.
| | | | |
| 24 | | Wells Fargo Advantage Income Plus Fund | | Financial highlights |
(For a share outstanding throughout each period)
| | | | | | | | | | | | | | | | | | | | | | | | | | | | |
| | | Six months ended
February 28, 2015
(unaudited) | | | Year ended August 31 | | | Year ended
May 31, 2010 | |
| INSTITUTIONAL CLASS | | | 2014 | | | 2013 | | | 2012 | | | 2011 | | | 20101 | | |
Net asset value, beginning of period | | | $12.24 | | | | $11.67 | | | | $12.57 | | | | $12.03 | | | | $12.00 | | | | $11.60 | | | | $10.82 | |
Net investment income | | | 0.12 | 2 | | | 0.28 | | | | 0.27 | 2 | | | 0.34 | | | | 0.41 | 2 | | | 0.10 | 2 | | | 0.41 | 2 |
Net realized and unrealized gains (losses) on investments | | | 0.19 | | | | 0.57 | | | | (0.49 | ) | | | 0.56 | | | | 0.17 | | | | 0.43 | | | | 0.88 | |
| | | | | | | | | | | | | | | | | | | | | | | | | | | | |
Total from investment operations | | | 0.31 | | | | 0.85 | | | | (0.22 | ) | | | 0.90 | | | | 0.58 | | | | 0.53 | | | | 1.29 | |
Distributions to shareholders from | | | | | | | | | | | | | | | | | | | | |
Net investment income | | | (0.12 | ) | | | (0.28 | ) | | | (0.28 | ) | | | (0.33 | ) | | | (0.46 | ) | | | (0.13 | ) | | | (0.51 | ) |
Net realized gains | | | (0.02 | ) | | | 0.00 | | | | (0.40 | ) | | | (0.03 | ) | | | (0.09 | ) | | | 0.00 | | | | 0.00 | |
| | | | | | | | | | | | | | | | | | | | | | | | | | | | |
Total distributions to shareholders | | | (0.14 | ) | | | (0.28 | ) | | | (0.68 | ) | | | (0.36 | ) | | | (0.55 | ) | | | (0.13 | ) | | | (0.51 | ) |
Net asset value, end of period | | | $12.41 | | | | $12.24 | | | | $11.67 | | | | $12.57 | | | | $12.03 | | | | $12.00 | | | | $11.60 | |
Total return3 | | | 2.55 | % | | | 7.36 | % | | | (1.89 | )% | | | 7.62 | % | | | 5.04 | % | | | 4.71 | % | | | 12.06 | % |
Ratios to average net assets (annualized) | | | | | | | | | | | | | | | | | | | | |
Gross expenses | | | 0.58 | % | | | 0.60 | % | | | 0.56 | % | | | 0.56 | % | | | 0.55 | % | | | 0.59 | % | | | 0.68 | % |
Net expenses | | | 0.58 | % | | | 0.58 | % | | | 0.56 | % | | | 0.56 | % | | | 0.55 | % | | | 0.56 | % | | | 0.61 | % |
Net investment income | | | 1.99 | % | | | 2.38 | % | | | 2.26 | % | | | 2.74 | % | | | 3.53 | % | | | 3.36 | % | | | 3.58 | % |
Supplemental data | | | | | | | | | | | | | | | | | | | | |
Portfolio turnover rate | | | 148 | % | | | 267 | % | | | 256 | % | | | 256 | % | | | 215 | % | | | 84 | % | | | 187 | % |
Net assets, end of period (000s omitted) | | | $65,729 | | | | $32,438 | | | | $31,221 | | | | $161,191 | | | | $161,276 | | | | $147,102 | | | | $112,163 | |
| 1 | For the three months ended August 31, 2010. The Fund changed its fiscal year end from May 31 to August 31, effective August 31, 2010. |
| 2 | Calculated based upon average shares outstanding |
| 3 | Returns for periods of less than one year are not annualized. |
The accompanying notes are an integral part of these financial statements.
| | | | | | |
| Financial highlights | | Wells Fargo Advantage Income Plus Fund | | | 25 | |
(For a share outstanding throughout each period)
| | | | | | | | | | | | | | | | | | | | | | | | | | | | |
| | | Six months ended
February 28, 2015
(unaudited) | | | Year ended August 31 | | | Year ended
May 31, 2010 | |
| INVESTOR CLASS | | | 2014 | | | 2013 | | | 2012 | | | 2011 | | | 20101 | | |
Net asset value, beginning of period | | | $12.23 | | | | $11.66 | | | | $12.57 | | | | $12.03 | | | | $12.00 | | | | $11.60 | | | | $10.82 | |
Net investment income | | | 0.11 | | | | 0.25 | | | | 0.24 | | | | 0.30 | | | | 0.37 | 2 | | | 0.09 | 2 | | | 0.37 | 2 |
Net realized and unrealized gains (losses) on investments | | | 0.18 | | | | 0.57 | | | | (0.51 | ) | | | 0.56 | | | | 0.17 | | | | 0.43 | | | | 0.88 | |
| | | | | | | | | | | | | | | | | | | | | | | | | | | | |
Total from investment operations | | | 0.29 | | | | 0.82 | | | | (0.27 | ) | | | 0.86 | | | | 0.54 | | | | 0.52 | | | | 1.25 | |
Distributions to shareholders from | | | | | | | | | | | | | | | | | | | | |
Net investment income | | | (0.10 | ) | | | (0.25 | ) | | | (0.24 | ) | | | (0.29 | ) | | | (0.42 | ) | | | (0.12 | ) | | | (0.47 | ) |
Net realized gains | | | (0.02 | ) | | | 0.00 | | | | (0.40 | ) | | | (0.03 | ) | | | (0.09 | ) | | | 0.00 | | | | 0.00 | |
| | | | | | | | | | | | | | | | | | | | | | | | | | | | |
Total distributions to shareholders | | | (0.12 | ) | | | (0.25 | ) | | | (0.64 | ) | | | (0.32 | ) | | | (0.51 | ) | | | (0.12 | ) | | | (0.47 | ) |
Net asset value, end of period | | | $12.40 | | | | $12.23 | | | | $11.66 | | | | $12.57 | | | | $12.03 | | | | $12.00 | | | | $11.60 | |
Total return3 | | | 2.41 | % | | | 7.06 | % | | | (2.26 | )% | | | 7.25 | % | | | 4.67 | % | | | 4.52 | % | | | 11.79 | % |
Ratios to average net assets (annualized) | | | | | | | | | | | | | | | | | | | | |
Gross expenses | | | 0.94 | % | | | 0.95 | % | | | 0.93 | % | | | 0.91 | % | | | 0.90 | % | | | 0.97 | % | | | 1.07 | % |
Net expenses | | | 0.85 | % | | | 0.86 | % | | | 0.89 | % | | | 0.90 | % | | | 0.90 | % | | | 0.92 | % | | | 0.94 | % |
Net investment income | | | 1.75 | % | | | 2.10 | % | | | 1.98 | % | | | 2.40 | % | | | 3.14 | % | | | 3.00 | % | | | 3.25 | % |
Supplemental data | | | | | | | | | | | | | | | | | | | | |
Portfolio turnover rate | | | 148 | % | | | 267 | % | | | 256 | % | | | 256 | % | | | 215 | % | | | 84 | % | | | 187 | % |
Net assets, end of period (000s omitted) | | | $170,079 | | | | $168,541 | | | | $172,516 | | | | $195,346 | | | | $189,051 | | | | $198,176 | | | | $188,551 | |
| 1 | For the three months ended August 31, 2010. The Fund changed its fiscal year end from May 31 to August 31, effective August 31, 2010. |
| 2 | Calculated based upon average shares outstanding |
| 3 | Returns for periods of less than one year are not annualized. |
The accompanying notes are an integral part of these financial statements.
| | | | |
| 26 | | Wells Fargo Advantage Income Plus Fund | | Notes to financial statements (unaudited) |
1. ORGANIZATION
Wells Fargo Funds Trust (the “Trust”), a Delaware statutory trust organized on March 10, 1999, is an open-end management investment company registered under the Investment Company Act of 1940, as amended (the “1940 Act”). As an investment company, the Trust follows the accounting and reporting guidance in Financial Accounting Standards Board (“FASB”) Accounting Standards Codification Topic 946, Financial Services—Investment Companies. These financial statements report on the Wells Fargo Advantage Income Plus Fund (the “Fund”) which is a diversified series of the Trust.
2. SIGNIFICANT ACCOUNTING POLICIES
The following significant accounting policies, which are consistently followed in the preparation of the financial statements of the Fund, are in conformity with U.S. generally accepted accounting principles which require management to make estimates and assumptions that affect the reported amounts of assets and liabilities, disclosure of contingent assets and liabilities at the date of the financial statements, and the reported amounts of revenues and expenses during the reporting period. Actual results could differ from those estimates.
Securities valuation
All investments are valued each business day as of the close of regular trading on the New York Stock Exchange (generally 4 p.m. Eastern Time).
Debt securities are valued at the evaluated bid price provided by an independent pricing service or, if a reliable price is not available, the quoted bid price from an independent broker-dealer.
Futures that are listed on a foreign or domestic exchange or market are valued at the official closing price or, if none, the last sales price.
Investments in registered open-end investment companies are valued at net asset value. Interests in non-registered investment vehicles that are redeemable at net asset value are fair valued at net asset value when available.
Investments which are not valued using any of the methods discussed above are valued at their fair value, as determined in good faith by the Board of Trustees of the Fund. The Board of Trustees has established a Valuation Committee comprised of the Trustees and has delegated to it the authority to take any actions regarding the valuation of portfolio securities that the Valuation Committee deems necessary or appropriate, including determining the fair value of portfolio securities, unless the determination has been delegated to the Management Valuation Team of Wells Fargo Funds Management, LLC (“Funds Management”). The Board of Trustees retains the authority to make or ratify any valuation decisions or approve any changes to the Valuation Procedures as it deems appropriate. On a quarterly basis, the Board of Trustees receives reports on any valuation actions taken by the Valuation Committee or the Management Valuation Team which may include items for ratification.
Valuations of fair valued securities are compared to the next actual sales price when available, or other appropriate market values, to assess the continued appropriateness of the fair valuation methodologies used. These securities are fair valued on a day-to-day basis, taking into consideration changes to appropriate market information and any significant changes to the inputs considered in the valuation process until there is a readily available price provided on an exchange or by an independent pricing service. Valuations received from an independent pricing service or independent broker-dealer quotes are periodically validated by comparisons to most recent trades and valuations provided by other independent pricing services in addition to the review of prices by the adviser and/or subadviser. Unobservable inputs used in determining fair valuations are identified based on the type of security, taking into consideration factors utilized by market participants in valuing the investment, knowledge about the issuer and the current market environment.
Security loans
The Fund may lend its securities from time to time in order to earn additional income in the form of fees or interest on securities received as collateral or the investment of any cash received as collateral. The Fund continues to receive interest or dividends on the securities loaned. The Fund receives collateral in the form of cash or securities with a value at least equal to the value of the securities on loan. The value of the loaned securities is determined at the close of each business day and any additional required collateral is delivered to the Fund on the next business day. In a securities lending transaction, the net asset value of the Fund will be affected by an increase or decrease in the value of the securities loaned and by an increase or decrease in the value of the instrument in which collateral is invested. The amount of securities lending activity undertaken by the Fund fluctuates from time to time. In the event of default or bankruptcy by the borrower, the Fund may be prevented from recovering the loaned securities or gaining access to the collateral or may experience delays or costs in doing so. In addition, the investment of any cash collateral received may lose all or part of its value. The Fund has the right under the lending agreement to recover the securities from the borrower on demand.
| | | | | | |
| Notes to financial statements (unaudited) | | Wells Fargo Advantage Income Plus Fund | | | 27 | |
The Fund lends its securities through an unaffiliated securities lending agent. Cash collateral received in connection with its securities lending transactions is invested in Securities Lending Cash Investments, LLC (the “Securities Lending Fund”). The Securities Lending Fund is exempt from registration under Section 3(c)(7) of the 1940 Act and is managed by Funds Management and is subadvised by Wells Capital Management Incorporated (“WellsCap”). Funds Management receives an advisory fee starting at 0.05% and declining to 0.01% as the average daily net assets of the Securities Lending Fund increase. All of the fees received by Funds Management are paid to WellsCap for its services as subadviser. The Securities Lending Fund seeks to provide a positive return compared to the daily Fed Funds Open rate by investing in high-quality, U.S. dollar-denominated short-term money market instruments. Securities Lending Fund investments are fair valued based upon the amortized cost valuation technique. Income earned from investment in the Securities Lending Fund is included in securities lending income on the Statement of Operations.
When-issued transactions
The Fund may purchase securities on a forward commitment or when-issued basis. The Fund records a when-issued transaction on the trade date and will segregate assets in an amount at least equal in value to the Fund’s commitment to purchase when-issued securities. Securities purchased on a when-issued basis are marked-to-market daily and the Fund begins earning interest on the settlement date. Losses may arise due to changes in the market value of the underlying securities or if the counterparty does not perform under the contract.
Futures contracts
The Fund is subject to interest rate risk in the normal course of pursuing its investment objectives. The Fund may buy and sell futures contracts in order to gain exposure to, or protect against, changes in security values and interest rates. The primary risks associated with the use of futures contracts are the imperfect correlation between changes in market values of securities held by the Fund and the prices of futures contracts, and the possibility of an illiquid market.
The aggregate principal amounts of the contracts are not recorded in the financial statements. Fluctuations in the value of the contracts are recorded in the Statement of Assets and Liabilities as an asset or liability and in the Statement of Operations as unrealized gains or losses until the contracts are closed, at which point they are recorded as net realized gains or losses on futures contracts. With futures contracts, there is minimal counterparty risk to the Fund since futures are exchange traded and the exchange’s clearinghouse, as counterparty to all exchange traded futures, guarantees the futures against default.
Security transactions and income recognition
Securities transactions are recorded on a trade date basis. Realized gains or losses are recorded on the basis of identified cost.
Interest income is accrued daily and bond discounts are accreted and premiums are amortized daily based on the effective interest method. To the extent debt obligations are placed on non-accrual status, any related interest income may be reduced by writing off interest receivables when the collection of all or a portion of interest has become doubtful based on consistently applied procedures. If the issuer subsequently resumes interest payments or when the collectability of interest is reasonably assured, the debt obligation is removed from non-accrual status.
Income from foreign securities is recorded net of foreign taxes withheld where recovery of such taxes is not assured.
Distributions to shareholders
Distributions to shareholders from net investment income are paid monthly. Distributions from net realized gains, if any, are recorded on the ex-dividend date. Such distributions are determined in conformity with federal income tax regulations, which may differ in amount or character from net investment income and realized gains recognized for purposes of U.S. generally accepted accounting principles.
Federal and other taxes
The Fund intends to continue to qualify as a regulated investment company by distributing substantially all of its investment company taxable income and any net realized capital gains (after reduction for capital loss carryforwards) sufficient to relieve it from all, or substantially all, federal income taxes. Accordingly, no provision for federal income taxes was required.
The Fund’s income and federal excise tax returns and all financial records supporting those returns for the prior three fiscal years are subject to examination by the federal and Delaware revenue authorities. Management has analyzed the Fund’s tax positions taken on federal, state, and foreign tax returns for all open tax years and does not believe that there are any uncertain tax positions that require recognition of a tax liability.
| | | | |
| 28 | | Wells Fargo Advantage Income Plus Fund | | Notes to financial statements (unaudited) |
As of August 31, 2014, the Fund had capital loss carryforwards available to offset future net realized capital gains in the amount of $27,081,872 with $16,809,059 expiring in 2016 and $10,272,813 expiring in 2017.
Class allocations
The separate classes of shares offered by the Fund differ principally in applicable sales charges, distribution, shareholder servicing, and administration fees. Class specific expenses are charged directly to that share class. Investment income, common expenses, and realized and unrealized gains (losses) on investments are allocated daily to each class of shares based on the relative proportion of net assets of each class.
3. FAIR VALUATION MEASUREMENTS
Fair value measurements of investments are determined within a framework that has established a fair value hierarchy based upon the various data inputs utilized in determining the value of the Fund’s investments. The three-level hierarchy gives the highest priority to unadjusted quoted prices in active markets for identical assets or liabilities (Level 1) and the lowest priority to significant unobservable inputs (Level 3). The Fund’s investments are classified within the fair value hierarchy based on the lowest level of input that is significant to the fair value measurement. The inputs are summarized into three broad levels as follows:
| n | | Level 1 – quoted prices in active markets for identical securities |
| n | | Level 2 – other significant observable inputs (including quoted prices for similar securities, interest rates, prepayment speeds, credit risk, use of amortized cost, etc.) |
| n | | Level 3 – significant unobservable inputs (including the Fund’s own assumptions in determining the fair value of investments) |
The inputs or methodologies used for valuing investments in securities are not necessarily an indication of the risk associated with investing in those securities.
The following is a summary of the inputs used in valuing the Fund’s assets and liabilities as of February 28, 2015:
| | | | | | | | | | | | | | | | |
| | | Quoted prices
(Level 1) | | | Other significant
observable inputs
(Level 2) | | | Significant
unobservable inputs
(Level 3) | | | Total | |
Assets | | | | | | | | | | | | | | | | |
Investments in: | | | | | | | | | | | | | | | | |
| | | | |
Agency securities | | $ | 0 | | | $ | 163,284,608 | | | $ | 0 | | | $ | 163,284,608 | |
| | | | |
Asset-backed securities | | | 0 | | | | 4,627,343 | | | | 0 | | | | 4,627,343 | |
| | | | |
Corporate bonds and notes | | | 0 | | | | 146,293,706 | | | | 0 | | | | 146,293,706 | |
| | | | |
Municipal obligations | | | 0 | | | | 11,682,101 | | | | 0 | | | | 11,682,101 | |
| | | | |
Non-agency mortgage-backed securities | | | 0 | | | | 22,157,549 | | | | 0 | | | | 22,157,549 | |
| | | | |
U.S. Treasury securities | | | 131,211,675 | | | | 0 | | | | 0 | | | | 131,211,675 | |
| | | | |
Yankee corporate bonds and notes | | | 0 | | | | 41,398,236 | | | | 0 | | | | 41,398,236 | |
| | | | |
Short-term investments | | | | | | | | | | | | | | | | |
Investment companies | | | 132,609,569 | | | | 1,344,000 | | | | 0 | | | | 133,953,569 | |
U.S. Treasury securities | | | 699,995 | | | | 50,000 | | | | 0 | | | | 749,995 | |
| | | 264,521,239 | | | | 390,837,543 | | | | 0 | | | | 655,358,782 | |
| | | | |
Futures contracts | | | 104,864 | | | | 0 | | | | 0 | | | | 104,864 | |
Total assets | | $ | 264,626,103 | | | $ | 390,837,543 | | | $ | 0 | | | $ | 655,463,646 | |
Liabilities | | | | | | | | | | | | | | | | |
| | | | |
Futures contracts | | $ | 5,625 | | | $ | 0 | | | $ | 0 | | | $ | 5,625 | |
Total liabilities | | $ | 5,625 | | | $ | 0 | | | $ | 0 | | | $ | 5,625 | |
Futures contracts are reported at their variation margin at measurement date, which represents the amount due to/from the Fund at that date. All other assets and liabilities are reported at their market value at measurement date.
| | | | | | |
| Notes to financial statements (unaudited) | | Wells Fargo Advantage Income Plus Fund | | | 29 | |
The Fund recognizes transfers between levels within the fair value hierarchy at the end of the reporting period. At February 28, 2015, the Fund did not have any transfers into/out of Level 1, Level 2, or Level 3.
4. TRANSACTIONS WITH AFFILIATES
Advisory fee
The Trust has entered into an advisory contract with Funds Management, an indirect wholly owned subsidiary of Wells Fargo & Company (“Wells Fargo”). The adviser is responsible for implementing investment policies and guidelines and for supervising the subadviser, who is responsible for day-to-day portfolio management of the Fund.
Pursuant to the contract, Funds Management is entitled to receive an annual advisory fee starting at 0.40% and declining to 0.30% as the average daily net assets of the Fund increase. For the six months ended February 28, 2015, the advisory fee was equivalent to an annual rate of 0.40% of the Fund’s average daily net assets.
Funds Management has retained the services of a subadviser to provide daily portfolio management to the Fund. The fee for subadvisory services is borne by Funds Management. WellsCap, an affiliate of Funds Management and an indirect wholly owned subsidiary of Wells Fargo, is the subadviser to the Fund and is entitled to receive a fee from Funds Management at an annual rate starting at 0.20% and declining to 0.10% as the average daily net assets of the Fund increase.
Administration fees
The Trust has entered into an administration agreement with Funds Management. Under this agreement, for providing administrative services, which includes paying fees and expenses for services provided by the transfer agent, sub-transfer agents, omnibus account servicers and record-keepers, Funds Management is entitled to receive from the Fund an annual fund level administration fee starting at 0.05% and declining to 0.03% as the average daily net assets of the Fund increase and a class level administration fee which is calculated based on the average daily net assets of each class as follows:
| | | | |
| | | Class level
administration fee | |
Class A, Class B, Class C | | | 0.16 | % |
Administrator Class | | | 0.10 | |
Institutional Class | | | 0.08 | |
Investor Class | | | 0.19 | |
Funds Management has contractually waived and/or reimbursed advisory and administration fees to the extent necessary to maintain certain net operating expense ratios for the Fund. Waiver of fees and/or reimbursement of expenses by Funds Management were made first from fund level expenses on a proportionate basis and then from class specific expenses. Funds Management has committed through December 31, 2015 to waive fees and/or reimburse expenses to the extent necessary to cap the Fund’s expenses at 0.84% for Class A shares, 1.59% for Class B shares, 1.59% for Class C shares, 0.72% for Administrator Class shares, 0.58 % for Institutional Class shares, and 0.85% for Investor Class shares. After this time, the cap may be increased or the commitment to maintain the cap may be terminated only with the approval of the Board of Trustees.
Distribution fees
The Trust has adopted a Distribution Plan for Class B and Class C shares of the Fund pursuant to Rule 12b-1 under the 1940 Act. Distribution fees are charged to Class B and Class C shares and paid to Wells Fargo Funds Distributor, LLC (“Funds Distributor”), the principal underwriter, at an annual rate of 0.75% of the average daily net assets of Class B and Class C shares.
In addition, Funds Distributor is entitled to receive the front-end sales charge from the purchase of Class A shares and a contingent deferred sales charge on the redemption of certain shares. Funds Distributor is also entitled to receive the contingent deferred sales charges from redemptions of Class B and Class C shares. For the six months ended February 28, 2015, Funds Distributor received $1,714 from the sale of Class A shares and $76 and $48 in contingent deferred sales charges from redemptions of Class B and Class C shares, respectively.
Shareholder servicing fees
The Trust has entered into contracts with one or more shareholder servicing agents, whereby Class A, Class B, Class C, Administrator Class, and Investor Class of the Fund is charged a fee at an annual rate of 0.25% of the average daily net assets of each respective class.
| | | | |
| 30 | | Wells Fargo Advantage Income Plus Fund | | Notes to financial statements (unaudited) |
A portion of these total shareholder servicing fees were paid to affiliates of Wells Fargo.
5. INVESTMENT PORTFOLIO TRANSACTIONS
Purchases and sales of investments, excluding short-term securities, for the six months ended February 28, 2015 were as follows:
| | | | | | |
Purchases at cost | | Sales proceeds |
U.S.
government | | Non-U.S.
government | | U.S.
government | | Non-U.S.
government |
| $691,068,398 | | $90,828,653 | | $686,765,614 | | $42,436,985 |
6. DERIVATIVE TRANSACTIONS
During the six months ended February 28, 2015, the Fund entered into futures contracts to speculate on interest rates and to help manage the duration of the portfolio.
At February 28, 2015, the Fund had long and short futures contracts outstanding as follows:
| | | | | | | | | | | | | | | | |
| Expiration date | | Counterparty | | Contracts | | Type | | | Contract
value at
February 28, 2015 | | | Unrealized
gains
(losses) | |
6-19-2015 | | JPMorgan | | 79 Long | | | U.S. Treasury Bonds | | | $ | 13,294,219 | | | $ | 114,241 | |
6-19-2015 | | JPMorgan | | 36 Short | | | 10-Year U.S. Treasury Notes | | | | 4,600,688 | | | | (16,381 | ) |
6-30-2015 | | JPMorgan | | 305 Long | | | 5-Year U.S. Treasury Notes | | | | 36,380,781 | | | | (54,431 | ) |
6-30-2015 | | JPMorgan | | 261 Long | | | 2-Year U.S. Treasury Notes | | | | 57,048,891 | | | | 192 | |
The Fund had an average notional amount of $91,553,838 and $628,771 in long and short futures contracts, respectively, during the six months ended February 28, 2015.
On February 28, 2015, the cumulative unrealized gains on futures contracts in the amount of $43,621 are reflected in net unrealized gains on investments on the Statement of Assets and Liabilities. The receivable and payable for daily variation margin on open futures contracts reflected in the Statement of Assets and Liabilities only represents the current day’s variation margin. The realized gains and change in unrealized gains (losses) on futures contracts are reflected in the Statement of Operations.
For certain types of derivative transactions, the Fund has entered into International Swaps and Derivatives Association, Inc. master agreements (“ISDA Master Agreements”) or similar agreements with approved counterparties. The ISDA Master Agreements or similar agreements may have requirements to deliver/deposit securities or cash to/with an exchange or broker-dealer as collateral and allows the Fund to offset, with each counterparty, certain derivative financial instrument’s assets and/or liabilities with collateral held or pledged. Collateral requirements differ by type of derivative. Collateral or margin requirements are set by the broker or exchange clearing house for exchange traded derivatives while collateral terms are contract specific for over-the-counter traded derivatives. Cash collateral that has been pledged to cover obligations of the Fund under ISDA Master Agreements or similar agreements, if any, will be reported separately in the Statement of Assets and Liabilities. Securities pledged as collateral, if any, for the same purpose are noted in the Portfolio of Investments. With respect to balance sheet offsetting, absent an event of default by the counterparty or a termination of the agreement, the reported amounts of financial assets and financial liabilities in the Statement of Assets and Liabilities are not offset across transactions between the Fund and the applicable counterparty. A reconciliation of the gross amounts on the Statement of Assets and Liabilities to the net amounts by derivative type, including any collateral exposure, is as follows:
| | | | | | | | | | | | | | | | |
| Derivative type | | Counterparty | | Gross amounts of assets in the
Statement of
Assets and
Liabilities | | Amounts
subject to
netting
agreements | | | Collateral
received | | | Net amount
of assets | |
Futures – variation margin | | JPMorgan | | $104,864 | | $ | (5,625 | ) | | $ | 0 | | | $ | 99,239 | |
| Derivative type | | Counterparty | | Gross amounts
of liabilities in the
Statement of
Assets and
Liabilities | | Amounts
subject to
netting
agreements | | | Collateral
pledged | | | Net amount
of liabilities | |
Futures – variation margin | | JPMorgan | | $5,625 | | $ | (5,625 | ) | | $ | 0 | | | | $0 | |
| | | | | | |
| Notes to financial statements (unaudited) | | Wells Fargo Advantage Income Plus Fund | | | 31 | |
7. BANK BORROWINGS
The Trust (excluding the money market funds and certain other funds in the Trust) and Wells Fargo Variable Trust are parties to a $150,000,000 revolving credit agreement, whereby the Fund is permitted to use bank borrowings for temporary or emergency purposes, such as to fund shareholder redemption requests. Interest under the credit agreement is charged to the Fund based on a borrowing rate equal to the higher of the Federal Funds rate in effect on that day plus 1.25% or the overnight LIBOR rate in effect on that day plus 1.25%. In addition, an annual commitment fee equal to 0.10% of the unused balance is allocated to each participating fund. For the six months ended February 28, 2015, the Fund paid $263 in commitment fees.
For the six months ended February 28, 2015, there were no borrowings by the Fund under the agreement.
8. INDEMNIFICATION
Under the Trust’s organizational documents, the officers and Trustees are indemnified against certain liabilities that may arise out of performance of their duties to the Trust. Additionally, in the normal course of business, the Trust may enter into contracts with service providers that contain a variety of indemnification clauses. The Trust’s maximum exposure under these arrangements is dependent on future claims that may be made against the Fund and, therefore, cannot be estimated.
9. SUBSEQUENT DISTRIBUTIONS
On March 25, 2015, the Fund declared distributions from net investment income to shareholders of record on March 24, 2015. The per share amounts payable on March 26, 2015 were as follows:
| | | | |
| | | Net investment income | |
Class A | | | $0.01762 | |
Class B | | | 0.00944 | |
Class C | | | 0.00952 | |
Administrator Class | | | 0.01892 | |
Institutional Class | | | 0.02020 | |
Investor Class | | | 0.01741 | |
On April 24, 2015, the Fund declared distributions from net investment income to shareholders of record on April 23, 2015. The per share amounts payable on April 27, 2015 were as follows:
| | | | |
| | | Net investment income | |
Class A | | | $0.01797 | |
Class B | | | 0.00937 | |
Class C | | | 0.01000 | |
Administrator Class | | | 0.01907 | |
Institutional Class | | | 0.02053 | |
Investor Class | | | 0.01775 | |
These distributions are not reflected in the accompanying financial statements. The final determination of the source of all distributions is subject to change and made after the Fund’s tax year-end.
| | | | |
| 32 | | Wells Fargo Advantage Income Plus Fund | | Other information (unaudited) |
PROXY VOTING INFORMATION
A description of the policies and procedures that the Fund uses to determine how to vote proxies relating to portfolio securities is available, upon request, by calling 1-800-222-8222, visiting our website at wellsfargoadvantagefunds.com, or visiting the SEC website at sec.gov. Information regarding how the Fund voted proxies relating to portfolio securities during the most recent 12-month period ended June 30 is available on the Fund’s website at wellsfargoadvantagefunds.com or by visiting the SEC website at sec.gov.
PORTFOLIO HOLDINGS INFORMATION
The complete portfolio holdings for the Fund are publicly available monthly on the Fund’s website (wellsfargoadvantagefunds.com), on a one-month delayed basis. In addition, top ten holdings information (excluding derivative positions) for the Fund is publicly available on the Fund’s website on a monthly, seven-day or more delayed basis. The Fund files its complete schedule of portfolio holdings with the SEC for the first and third quarters of each fiscal year on Form N-Q, which is available by visiting the SEC website at sec.gov. In addition, the Fund’s Form N-Q may be reviewed and copied at the SEC’s Public Reference Room in Washington, DC, and at regional offices in New York City, at 233 Broadway, and in Chicago, at 175 West Jackson Boulevard, Suite 900. Information about the Public Reference Room may be obtained by calling 1-800-SEC-0330.
| | | | | | |
| Other information (unaudited) | | Wells Fargo Advantage Income Plus Fund | | | 33 | |
BOARD OF TRUSTEES AND OFFICERS
Each of the Trustees and Officers1 listed in the table below acts in identical capacities for each fund in the Wells Fargo Advantage family of funds, which consists of 134 mutual funds comprising the Wells Fargo Funds Trust, Wells Fargo Variable Trust, Wells Fargo Master Trust and four closed-end funds (collectively the “Fund Complex”). This table should be read in conjunction with the Prospectus and the Statement of Additional Information2. The mailing address of each Trustee and Officer is 525 Market Street, 12th Floor, San Francisco, CA 94105. Each Trustee and Officer serves an indefinite term, however, each Trustee serves such term until reaching the mandatory retirement age established by the Trustees.
Independent Trustees
| | | | | | |
Name and
year of birth | | Position held and length of service* | | Principal occupations during past five years or longer | | Other directorships during
past five years |
William R. Ebsworth
(Born 1957) | | Trustee, since 2015** | | Retired. From 1984 to 2013, equities analyst, portfolio manager, research director at Fidelity Management and Research Company and retired in 2013 as Chief Investment Officer of Fidelity Strategic Advisers, Inc. in Boston, Tokyo, and Hong Kong where he led a team of investment professionals managing client assets. Prior thereto, Board member of Hong Kong Securities Clearing Co., Hong Kong Options Clearing Corp., the Thailand International Fund, Ltd., Fidelity Investments Life Insurance Company, and Empire Fidelity Investments Life Insurance Company. Mr. Ebsworth is an Adjunct Lecturer, Finance, at Babson College and a Chartered Financial Analyst. | | Asset Allocation Trust |
| Jane A. Freeman (Born 1953) | | Trustee, since 2015** | | Retired. From 2012 to 2014 and 1999 to 2008, Chief Financial Officer of Scientific Learning Corporation. From 2008 to 2012, Ms. Freeman provided consulting services related to strategic business projects. Prior thereto, Portfolio Manager at Rockefeller & Co. and Scudder, Stevens & Clark. Board member of the Harding Loevner Funds from 1996 to 2014, serving as both Lead Independent Director and chair of the Audit Committee. Board member of the Russell Exchange Traded Funds Trust from 2011 to 2012 and the chair of the Audit Committee. Ms. Freeman is a Chartered Financial Analyst (inactive), Chair of Taproot Foundation (non-profit organization) and a Board Member of Ruth Bancroft Garden (non-profit organization). | | Asset Allocation Trust |
| Peter G. Gordon (Born 1942) | | Trustee, since 1998; Chairman, since 2005 | | Co-Founder, Retired Chairman, President and CEO of Crystal Geyser Water Company. Trustee Emeritus, Colby College. | | Asset Allocation Trust |
| Isaiah Harris, Jr. (Born 1952) | | Trustee, since 2009 | | Retired. Chairman of the Board of CIGNA Corporation since 2009, and Director since 2005. From 2003 to 2011, Director of Delux Corporation. Prior thereto, President and CEO of BellSouth Advertising and Publishing Corp. from 2005 to 2007, President and CEO of BellSouth Enterprises from 2004 to 2005 and President of BellSouth Consumer Services from 2000 to 2003. Emeritus member of the Iowa State University Foundation Board of Governors. Emeritus Member of the Advisory Board of Iowa State University School of Business. Advisory Board Member, Palm Harbor Academy. Mr. Harris is a certified public accountant. | | CIGNA Corporation; Asset Allocation Trust |
| Judith M. Johnson (Born 1949) | | Trustee, since 2008; Audit Committee Chairman, since 2008 | | Retired. Prior thereto, Chief Executive Officer and Chief Investment Officer of Minneapolis Employees Retirement Fund from 1996 to 2008. Ms. Johnson is an attorney, certified public accountant and a certified managerial accountant. | | Asset Allocation Trust |
| David F. Larcker (Born 1950) | | Trustee, since 2009 | | James Irvin Miller Professor of Accounting at the Graduate School of Business, Stanford University, Morgan Stanley Director of the Center for Leadership Development and Research and Senior Faculty of The Rock Center for Corporate Governance since 2006. From 2005 to 2008, Professor of Accounting at the Graduate School of Business, Stanford University. Prior thereto, Ernst & Young Professor of Accounting at The Wharton School, University of Pennsylvania from 1985 to 2005. | | Asset Allocation Trust |
| Olivia S. Mitchell (Born 1953) | | Trustee, since 2006 | | International Foundation of Employee Benefit Plans Professor, Wharton School of the University of Pennsylvania since 1993. Director of Wharton’s Pension Research Council and Boettner Center on Pensions & Retirement Research, and Research Associate at the National Bureau of Economic Research. Previously, Cornell University Professor from 1978 to 1993. | | Asset Allocation Trust |
| Timothy J. Penny (Born 1951) | | Trustee, since 1996 | | President and Chief Executive Officer of Southern Minnesota Initiative Foundation, a non-profit organization, since 2007 and Senior Fellow at the Humphrey Institute Policy Forum at the University of Minnesota since 1995. Member of the Board of Trustees of NorthStar Education Finance, Inc., a non-profit organization, since 2007. | | Asset Allocation Trust |
| | | | |
| 34 | | Wells Fargo Advantage Income Plus Fund | | Other information (unaudited) |
| | | | | | |
Name and year of birth | | Position held and length of service* | | Principal occupations during past five years or longer | | Other directorships during
past five years |
| Michael S. Scofield (Born 1943) | | Trustee, since 2010 | | Served on the Investment Company Institute’s Board of Governors and Executive Committee from 2008-2011 as well the Governing Council of the Independent Directors Council from 2006-2011 and the Independent Directors Council Executive Committee from 2008-2011. Chairman of the IDC from 2008-2010. Institutional Investor (Fund Directions) Trustee of Year in 2007. Trustee of the Evergreen Funds complex (and its predecessors) from 1984 to 2010. Chairman of the Evergreen Funds from 2000-2010. Former Trustee of the Mentor Funds. Retired Attorney, Law Offices of Michael S. Scofield. | | Asset Allocation Trust |
| Donald C. Willeke (Born 1940) | | Trustee, since 1996 | | Principal of the law firm of Willeke & Daniels. General Counsel of the Minneapolis Employees Retirement Fund from 1984 until its consolidation into the Minnesota Public Employees Retirement Association on June 30, 2010. Director and Vice Chair of The Tree Trust (non-profit corporation). Director of the American Chestnut Foundation (non-profit corporation). | | Asset Allocation Trust |
| * | Length of service dates reflect the Trustee’s commencement of service with the Trust’s predecessor entities, where applicable. |
| ** | William R. Ebsworth and Jane A. Freeman each became a Trustee effective January 1, 2015. |
Officers
| | | | | | |
Name and year of birth | | Position held and
length of service | | Principal occupations during past five years or longer | | |
Karla M. Rabusch
(Born 1959) | | President, since 2003 | | Executive Vice President of Wells Fargo Bank, N.A. and President of Wells Fargo Funds Management, LLC since 2003. | | |
Nancy Wiser1 (Born 1967) | | Treasurer, since 2012 | | Executive Vice President of Wells Fargo Funds Management, LLC since 2011. Chief Operating Officer and Chief Compliance Officer at LightBox Capital Management LLC, from 2008 to 2011. Owned and operated a consulting business providing services to various hedge funds including acting as Chief Operating Officer and Chief Compliance Officer for a hedge fund from 2007 to 2008. Chief Operating Officer and Chief Compliance Officer of GMN Capital LLC from 2006 to 2007. | | |
C. David Messman
(Born 1960) | | Secretary, since 2000; Chief Legal Officer, since 2003 | | Senior Vice President and Secretary of Wells Fargo Funds Management, LLC since 2001. Assistant General Counsel of Wells Fargo Bank, N.A. since 2013 and Vice President and Managing Counsel of Wells Fargo Bank N.A. from 1996 to 2013. | | |
| Debra Ann Early (Born 1964) | | Chief Compliance Officer, since 2007 | | Senior Vice President of Wells Fargo Funds Management, LLC since 2007 and Chief Compliance Officer from 2007 to 2014. Chief Compliance Officer of Parnassus Investments from 2005 to 2007. Chief Financial Officer of Parnassus Investments from 2004 to 2007 and Senior Audit Manager of PricewaterhouseCoopers LLP from 1998 to 2004. | | |
David Berardi (Born 1975) | | Assistant Treasurer, since 2009 | | Vice President of Wells Fargo Funds Management, LLC since 2009. Vice President of Evergreen Investment Management Company, LLC from 2008 to 2010. Assistant Vice President of Evergreen Investment Services, Inc. from 2004 to 2008. Manager of Fund Reporting and Control for Evergreen Investment Management Company, LLC from 2004 to 2010. | | |
Jeremy DePalma1
(Born 1974) | | Assistant Treasurer, since 2009 | | Senior Vice President of Wells Fargo Funds Management, LLC since 2009. Senior Vice President of Evergreen Investment Management Company, LLC from 2008 to 2010. Vice President, Evergreen Investment Services, Inc. from 2004 to 2007. Head of the Fund Reporting and Control Team within Fund Administration from 2005 to 2010. | | |
| 1 | Nancy Wiser acts as Treasurer of 73 funds in the Fund Complex. Jeremy DePalma acts as Treasurer of 61 funds and Assistant Treasurer of 73 funds in the Fund Complex. |
| 2 | The Statement of Additional Information includes additional information about the Trustees and is available, without charge, upon request, by calling 1-800-222-8222 or by visiting the website at wellsfargoadvantagefunds.com. |
| | | | | | |
| List of abbreviations | | Wells Fargo Advantage Income Plus Fund | | | 35 | |
The following is a list of common abbreviations for terms and entities that may have appeared in this report.
| ACA | — ACA Financial Guaranty Corporation |
| ADR | — American depositary receipt |
| ADS | — American depositary shares |
| AGC | — Assured Guaranty Corporation |
| AGM | — Assured Guaranty Municipal |
| Ambac | — Ambac Financial Group Incorporated |
| AMT | — Alternative minimum tax |
| BAN | — Bond anticipation notes |
| BHAC | — Berkshire Hathaway Assurance Corporation |
| CAB | — Capital appreciation bond |
| CCAB | — Convertible capital appreciation bond |
| CDA | — Community Development Authority |
| CDO | — Collateralized debt obligation |
| DRIVER | — Derivative inverse tax-exempt receipts |
| DW&P | — Department of Water & Power |
| DWR | — Department of Water Resources |
| ECFA | — Educational & Cultural Facilities Authority |
| EDA | — Economic Development Authority |
| EDFA | — Economic Development Finance Authority |
| ETF | — Exchange-traded fund |
| FDIC | — Federal Deposit Insurance Corporation |
| FFCB | — Federal Farm Credit Banks |
| FGIC | — Financial Guaranty Insurance Corporation |
| FHA | — Federal Housing Administration |
| FHLB | — Federal Home Loan Bank |
| FHLMC | — Federal Home Loan Mortgage Corporation |
| FICO | — The Financing Corporation |
| FNMA | — Federal National Mortgage Association |
| GDR | — Global depositary receipt |
| GNMA | — Government National Mortgage Association |
| HCFR | — Healthcare facilities revenue |
| HEFA | — Health & Educational Facilities Authority |
| HEFAR | — Higher education facilities authority revenue |
| HFA | — Housing Finance Authority |
| HFFA | — Health Facilities Financing Authority |
| HUD | — Department of Housing and Urban Development |
| IDA | — Industrial Development Authority |
| IDAG | — Industrial Development Agency |
| KRW | — Republic of Korea won |
| LIBOR | — London Interbank Offered Rate |
| LIFER | — Long Inverse Floating Exempt Receipts |
| LLC | — Limited liability company |
| LLLP | — Limited liability limited partnership |
| LLP | — Limited liability partnership |
| MBIA | — Municipal Bond Insurance Association |
| MFHR | — Multifamily housing revenue |
| MSTR | — Municipal securities trust receipts |
| MUD | — Municipal Utility District |
| National | — National Public Finance Guarantee Corporation |
| PCFA | — Pollution Control Financing Authority |
| PCL | — Public Company Limited |
| PCR | — Pollution control revenue |
| PFA | — Public Finance Authority |
| PFFA | — Public Facilities Financing Authority |
| PFOTER | — Puttable floating option tax-exempt receipts |
| plc | — Public limited company |
| PUTTER | — Puttable tax-exempt receipts |
| R&D | — Research & development |
| Radian | — Radian Asset Assurance |
| RAN | — Revenue anticipation notes |
| RDA | — Redevelopment Authority |
| RDFA | — Redevelopment Finance Authority |
| REIT | — Real estate investment trust |
| ROC | — Reset option certificates |
| SAVRS | — Select auction variable rate securities |
| SBA | — Small Business Authority |
| SFHR | — Single-family housing revenue |
| SFMR | — Single-family mortgage revenue |
| SPA | — Standby purchase agreement |
| SPDR | — Standard & Poor’s Depositary Receipts |
| SPEAR | — Short Puttable Exempt Adjustable Receipts |
| STRIPS | — Separate trading of registered interest and |
| TAN | — Tax anticipation notes |
| TIPS | — Treasury inflation-protected securities |
| TRAN | — Tax revenue anticipation notes |
| TTFA | — Transportation Trust Fund Authority |
| TVA | — Tennessee Valley Authority |
This page is intentionally left blank.


For more information
More information about Wells Fargo Advantage Funds is available free upon request. To obtain literature, please write, email, visit the Fund’s website, or call:
Wells Fargo Advantage Funds
P.O. Box 8266
Boston, MA 02266-8266
Email: wfaf@wellsfargo.com
Website: wellsfargoadvantagefunds.com
Individual investors: 1-800-222-8222
Retail investment professionals: 1-888-877-9275
Institutional investment professionals: 1-866-765-0778
This report and the financial statements contained herein are submitted for the general information of the shareholders of Wells Fargo Advantage Funds. If this report is used for promotional purposes, distribution of the report must be accompanied or preceded by a current prospectus. Before investing, please consider the investment objectives, risks, charges, and expenses of the investment. For a current prospectus and, if available, a summary prospectus, containing this information, call 1-800-222-8222 or visit the Fund’s website at wellsfargoadvantagefunds.com. Read the prospectus carefully before you invest or send money.
Wells Fargo Funds Management, LLC, a wholly owned subsidiary of Wells Fargo & Company, provides investment advisory and administrative services for Wells Fargo Advantage Funds. Other affiliates of Wells Fargo & Company provide subadvisory and other services for the Funds. The Funds are distributed by Wells Fargo Funds Distributor, LLC, Member FINRA/SIPC, an affiliate of Wells Fargo & Company.
NOT FDIC INSURED ¡ NO BANK GUARANTEE ¡ MAY LOSE VALUE
© 2015 Wells Fargo Funds Management, LLC. All rights reserved.
| | |
 | | 232056 04-15 SA219/SAR219 02-15 |

Wells Fargo Advantage
Short Duration Government Bond Fund

Semi-Annual Report
February 28, 2015

Reduce clutter. Save trees.
Sign up for electronic delivery of prospectuses and shareholder reports at wellsfargo.com/advantagedelivery
Contents
The views expressed and any forward-looking statements are as of February 28, 2015, unless otherwise noted, and are those of the Fund managers and/or Wells Fargo Funds Management, LLC. Discussions of individual securities, or the markets generally, or any Wells Fargo Advantage Fund are not intended as individual recommendations. Future events or results may vary significantly from those expressed in any forward-looking statements; the views expressed are subject to change at any time in response to changing circumstances in the market. Wells Fargo Funds Management, LLC and the Fund disclaim any obligation to publicly update or revise any views expressed or forward-looking statements.
NOT FDIC INSURED ¡ NO BANK GUARANTEE ¡ MAY LOSE VALUE
| | | | |
| 2 | | Wells Fargo Advantage Short Duration Government Bond Fund | | Letter to shareholders (unaudited) |

Karla M. Rabusch
President
Wells Fargo Advantage Funds
Major central banks continued to inject liquidity into global banks and markets through various accommodative monetary policies, including quantitative easing.
Dear Valued Shareholder:
We are pleased to offer you this semi-annual report for the Wells Fargo Advantage Short Duration Government Bond Fund for the six-month period that ended February 28, 2015. The period was marked by low interest rates, a large decline in oil prices, and moderate U.S. economic growth. Investment-grade bonds, as measured by the Barclays U.S. Aggregate Bond Index1, returned 2.25% during the period.
Major central banks continued to provide stimulus.
Major central banks continued to inject liquidity into global banks and markets through various accommodative monetary policies, including quantitative easing. In the U.S., the Federal Reserve (Fed) kept its key interest rate near zero in order to support the economy and the financial system. It ended its quantitative easing program in October 2014 and also set expectations for it to begin normalizing monetary policy with higher target ranges for the federal funds rate in 2015.
Meanwhile, European markets continued to benefit from the European Central Bank’s (ECB’s) willingness to maintain low interest rates. In September 2014, the ECB cut its key rate to a historic low of 0.05%. In addition to its targeted longer-term refinancing operations that are designed to increase bank lending, the ECB said it intends to increase the size of its balance sheet, a result of quantitative easing, by buying eurozone government bonds. In Japan, the Bank of Japan maintained an aggressive monetary program aimed at combating deflation.
U.S. economic growth was moderate, and oil prices plummeted.
Economic growth advanced during the reporting period, the unemployment rate ticked lower to 5.5% as of February 2015, and inflation remained below the Fed’s longer-run objective of a 2% pace. The period was also marked by dramatically lower oil prices, which fell from more than $90 per barrel at the end of August 2014 to below $50 per barrel at the end of February 2015. While lower oil prices benefited consumers of oil products, the lower prices pressured companies within the energy sector.
Longer-dated securities and higher-rated credits were top performers.
Ten-year U.S. Treasury rates declined during the period, from 2.35% at end of August 2014 to 2.03% by the end of February 2015, benefiting both from safe-haven status as well as relative attractiveness to global investors. With the U.S. economy the furthest along its business cycle, the level of interest rates in the U.S. and Europe diverged. The 10-year U.S. Treasury yield was 2.03% at the end of February 2015 compared with 0.30% for 10-year German government yields, 173 basis points (bps; 100 bps equals 1.00%) higher. This was largely attributed to the
| 1 | The Barclays U.S. Aggregate Bond Index is a broad-based benchmark that measures the investment-grade, U.S. dollar-denominated, fixed-rate taxable bond market, including Treasuries, government-related and corporate securities, MBS (agency fixed-rate and hybrid ARM passthroughs), ABS, and CMBS. You cannot invest directly in an index. |
| | | | | | |
| Letter to shareholders (unaudited) | | Wells Fargo Advantage Short Duration Government Bond Fund | | | 3 | |
Fed being closer to eventually increasing interest rates while the ECB potentially needs to further increase, rather than scale back, its amount of accommodation. Further, U.S. economic activity was healthier than Europe’s.
Treasury bonds with maturities greater than 20 years returned more than 10% during the six-month period that ended February 28, 2015, according to the Barclays U.S. Aggregate Bond Index. This was due, in part, to strong demand from overseas investors because yields in Europe and Japan were substantially lower than U.S. yields. In addition, because the dollar strengthened, the returns from Treasuries were even higher for foreign-domiciled investors. Longer-maturity debt across all sectors outperformed shorter-dated securities.
Investment-grade corporate bonds returned 2.29% during the six-month reporting period, according to the Barclays U.S. Aggregate Bond Index, and AAA-rated2 bonds had higher returns than BBB-rated bonds. Lower-rated credits, including high yield, underperformed as oil prices fell dramatically. Not only were many energy and mining companies negatively affected, but investor trepidation about weak global growth caused investment-grade spreads to modestly widen while high-yield spreads widened substantially.
Don’t let short-term uncertainty derail long-term investment goals.
Periods of uncertainty can present challenges, but experience has taught us that maintaining long-term investment goals can be an effective way to plan for the future. To help you create a sound strategy based on your personal goals and risk tolerance, Wells Fargo Advantage Funds offers more than 100 mutual funds and other investments spanning a wide range of asset classes and investment styles. Although diversification cannot guarantee an investment profit or prevent losses, we believe it can be an effective way to manage investment risk and potentially smooth out overall portfolio performance. We encourage investors to know their investments and to understand that appropriate levels of risk-taking may unlock opportunities.
Thank you for choosing to invest with Wells Fargo Advantage Funds. We appreciate your confidence in us and remain committed to helping you meet your financial needs. For current information about your fund investments, contact your investment professional, visit our website at wellsfargoadvantagefunds.com, or call us directly at 1-800-222-8222. We are available 24 hours a day, 7 days a week.
Sincerely,

Karla M. Rabusch
President
Wells Fargo Advantage Funds
Periods of uncertainty can present challenges, but experience has taught us that maintaining long-term investment goals can be an effective way to plan for the future.
| 2 | The ratings indicated are from Standard & Poor’s, Moody’s Investors Service, and/or Fitch Ratings Ltd. Standard & Poor’s rates the creditworthiness of bonds from AAA (highest) to D (lowest). Ratings from A to CCC may be modified by the addition of a plus (+) or minus (-) sign to show relative standing within the rating categories. Moody’s rates the creditworthiness of bonds from Aaa (highest) to C (lowest). Ratings Aa to B may be modified by the addition of a number 1 (highest) to 3 (lowest) to show relative standing within the ratings categories. Fitch rates the creditworthiness of bonds from AAA (highest) to D (lowest). |
| | | | |
| 4 | | Wells Fargo Advantage Short Duration Government Bond Fund | | Performance highlights (unaudited) |
Investment objective
The Fund seeks to provide current income consistent with capital preservation.
Adviser
Wells Fargo Funds Management, LLC
Subadviser
Wells Capital Management Incorporated
Portfolio managers
Troy Ludgood
Thomas O’Connor, CFA
Average annual total returns1 (%) as of February 28, 2015
| | | | | | | | | | | | | | | | | | | | | | | | | | | | | | | | | | |
| | | | | Including sales charge | | | Excluding sales charge | | | Expense ratios2 (%) | |
| | | Inception date | | 1 year | | | 5 year | | | 10 year | | | 1 year | | | 5 year | | | 10 year | | | Gross | | | Net3 | |
| Class A (MSDAX) | | 3-11-1996 | | | (1.42 | ) | | | 0.98 | | | | 2.76 | | | | 0.59 | | | | 1.39 | | | | 2.97 | | | | 0.79 | | | | 0.78 | |
| Class B (MSDBX)* | | 5-31-2002 | | | (3.06 | ) | | | 0.77 | | | | 2.66 | | | | (0.06 | ) | | | 0.77 | | | | 2.66 | | | | 1.54 | | | | 1.53 | |
| Class C (MSDCX) | | 5-31-2002 | | | (1.06 | ) | | | 0.63 | | | | 2.20 | | | | (0.06 | ) | | | 0.63 | | | | 2.20 | | | | 1.54 | | | | 1.53 | |
| Class R6 (MSDRX) | | 11-30-2012 | | | – | | | | – | | | | – | | | | 1.01 | | | | 1.83 | | | | 3.42 | | | | 0.42 | | | | 0.37 | |
| Administrator Class (MNSGX) | | 12-18-1992 | | | – | | | | – | | | | – | | | | 0.87 | | | | 1.60 | | | | 3.22 | | | | 0.73 | | | | 0.60 | |
| Institutional Class (WSGIX) | | 4-8-2005 | | | – | | | | – | | | | – | | | | 1.06 | | | | 1.79 | | | | 3.40 | | | | 0.46 | | | | 0.42 | |
| Barclays 1-3 Year U.S. Government Index4 | | – | | | – | | | | – | | | | – | | | | 0.69 | | | | 0.97 | | | | 2.68 | | | | – | | | | – | |
| * | | Class B shares are closed to investment, except in connection with the reinvestment of any distributions and permitted exchanges. |
Figures quoted represent past performance, which is no guarantee of future results, and do not reflect taxes that a shareholder may pay on fund distributions or the redemption of fund shares. Investment return and principal value of an investment will fluctuate so that an investor’s shares, when redeemed, may be worth more or less than their original cost. Performance shown without sales charges would be lower if sales charges were reflected. Current performance may be lower or higher than the performance data quoted, which assumes the reinvestment of dividends and capital gains. Current month-end performance is available on the Fund’s website, wellsfargoadvantagefunds.com.
Index returns do not include transaction costs associated with buying and selling securities, any mutual fund fees or expenses, or any taxes. It is not possible to invest directly in an index.
For Class A shares, the maximum front-end sales charge is 2.00%. For Class B shares, the maximum contingent deferred sales charge is 3.00%. For Class C shares, the maximum contingent deferred sales charge is 1.00%. Performance including a contingent deferred sales charge assumes the sales charge for the corresponding time period. Class R6, Administrator Class, and Institutional Class shares are sold without a front-end sales charge or contingent deferred sales charge.
Bond values fluctuate in response to the financial condition of individual issuers, general market and economic conditions, and changes in interest rates. Changes in market conditions and government policies may lead to periods of heightened volatility in the bond market and reduced liquidity for certain bonds held by the Fund. In general, when interest rates rise, bond values fall and investors may lose principal value. Interest-rate changes and their impact on the fund and its share price can be sudden and unpredictable. Securities issued by U.S. government agencies or government-sponsored entities may not be guaranteed by the U.S. Treasury. Certain investment strategies tend to increase the total risk of an investment (relative to the broader market). The Fund is exposed to mortgage- and asset-backed securities risk. Consult the Fund’s prospectus for additional information on these and other risks. The U.S. government guarantee applies to certain underlying securities and not to shares of the Fund.
Please see footnotes on page 5.
| | | | | | |
| Performance highlights (unaudited) | | Wells Fargo Advantage Short Duration Government Bond Fund | | | 5 | |
| | | | |
| Ten largest long-term holdings5 (%) as of February 28, 2015 | |
U.S. Treasury Note, 0.63%, 7-15-2016 | | | 9.88 | |
U.S. Treasury Note, 0.63%, 12-31-2016 | | | 8.67 | |
U.S. Treasury Note 0.50%, 1-31-2017 | | | 7.10 | |
U.S. Treasury Note, 0.50%, 2-28-2017 | | | 4.79 | |
U.S. Treasury Note, 0.50%, 8-31-2016 | | | 4.48 | |
U.S. Treasury Note, 0.88%, 10-15-2017 | | | 2.42 | |
FHLMC Series 4327 Class A, 4.00%, 2-15-2040 | | | 2.02 | |
U.S. Treasury Note, 0.38%, 10-31-2016 | | | 1.94 | |
U.S. Treasury Note, 1.00%, 2-15-2018 | | | 1.70 | |
U.S. Treasury Note, 1.00%, 9-15-2017 | | | 1.64 | |
| | |
| Portfolio allocation6 as of February 28, 2015 |
| |
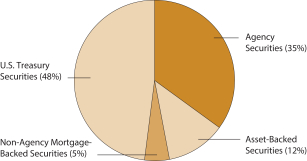
| | |
| 1 | Historical performance shown for Class R6 shares prior to their inception reflects the performance of Institutional Class shares and includes the higher expenses applicable to Institutional Class shares. If these expenses had not been included, returns would be higher. Historical performance shown for Institutional Class shares prior to their inception reflects the performance of Administrator Class shares and includes the higher expenses applicable to Administrator Class shares. If these expenses had not been included, returns would be higher. |
| 2 | Reflects the expense ratios as stated in the most recent prospectuses. The expense ratios shown are subject to change and may differ from the annualized expense ratios shown in the financial highlights of this report. |
| 3 | The Adviser has committed through December 31, 2015, to waive fees and/or reimburse expenses to the extent necessary to cap the Fund’s Total Annual Fund Operating Expenses After Fee Waiver, excluding certain expenses, at the amounts shown. After this time, the cap may be increased or the commitment to maintain the cap may be terminated only with the approval of the Board of Trustees. Brokerage commissions, stamp duty fees, interest, taxes, acquired fund fees and expenses, and extraordinary expenses are excluded from the cap. Without this cap, the Fund’s returns would have been lower. |
| 4 | The Barclays 1-3 Year U.S. Government Index is composed of all publicly issued, nonconvertible domestic debt of the U.S. government and its agencies. The index also includes corporate debt guaranteed by the U.S. government. Only notes and bonds with a minimum maturity of one year up to a maximum maturity of 2.9 years are included. You cannot invest directly in an index. |
| 5 | The ten largest long-term holdings are calculated based on the value of the securities divided by total net assets of the Fund. Holdings are subject to change and may have changed since the date specified. |
| 6 | Amounts are calculated based on the total long-term investments of the Fund. These percentages are subject to change and may have changed since the date specified. |
| | | | |
| 6 | | Wells Fargo Advantage Short Duration Government Bond Fund | | Fund expenses (unaudited) |
As a shareholder of the Fund, you incur two types of costs: (1) transaction costs, including sales charges (loads) on purchase payments and contingent deferred sales charges (if any) on redemptions and (2) ongoing costs, including management fees, distribution (12b-1) and/or shareholder service fees, and other Fund expenses. This example is intended to help you understand your ongoing costs (in dollars) of investing in the Fund and to compare these costs with the ongoing costs of investing in other mutual funds.
The example is based on an investment of $1,000 invested at the beginning of the six-month period and held for the entire period from September 1, 2014 to February 28, 2015.
Actual expenses
The “Actual” line of the table below provides information about actual account values and actual expenses. You may use the information in this line, together with the amount you invested, to estimate the expenses that you paid over the period. Simply divide your account value by $1,000 (for example, an $8,600 account value divided by $1,000 = 8.6), then multiply the result by the number in the “Actual” line under the heading entitled “Expenses paid during period” for your applicable class of shares to estimate the expenses you paid on your account during this period.
Hypothetical example for comparison purposes
The “Hypothetical” line of the table below provides information about hypothetical account values and hypothetical expenses based on the Fund’s actual expense ratio and an assumed rate of return of 5% per year before expenses, which is not the Fund’s actual return. The hypothetical account values and expenses may not be used to estimate the actual ending account balance or expenses you paid for the period. You may use this information to compare the ongoing costs of investing in the Fund and other funds. To do so, compare this 5% hypothetical example with the 5% hypothetical examples that appear in the shareholder reports of the other funds.
Please note that the expenses shown in the table are meant to highlight your ongoing costs only and do not reflect any transactional costs, such as sales charges (loads) and contingent deferred sales charges. Therefore, the “Hypothetical” line of the table is useful in comparing ongoing costs only and will not help you determine the relative total costs of owning different funds. In addition, if these transactional costs were included, your costs would have been higher.
| | | | | | | | | | | | | | | | |
| | | Beginning
account value
9-1-2014 | | | Ending
account value
2-28-2015 | | | Expenses
paid during
the period1 | | | Net annualized
expense ratio | |
Class A | | | | | | | | | | | | | | | | |
Actual | | $ | 1,000.00 | | | $ | 1,004.23 | | | $ | 3.88 | | | | 0.78 | % |
Hypothetical (5% return before expenses) | | $ | 1,000.00 | | | $ | 1,020.93 | | | $ | 3.91 | | | | 0.78 | % |
Class B | | | | | | | | | | | | | | | | |
Actual | | $ | 1,000.00 | | | $ | 1,000.51 | | | $ | 7.59 | | | | 1.53 | % |
Hypothetical (5% return before expenses) | | $ | 1,000.00 | | | $ | 1,017.21 | | | $ | 7.65 | | | | 1.53 | % |
Class C | | | | | | | | | | | | | | | | |
Actual | | $ | 1,000.00 | | | $ | 1,000.51 | | | $ | 7.59 | | | | 1.53 | % |
Hypothetical (5% return before expenses) | | $ | 1,000.00 | | | $ | 1,017.21 | | | $ | 7.65 | | | | 1.53 | % |
Class R6 | | | | | | | | | | | | | | | | |
Actual | | $ | 1,000.00 | | | $ | 1,006.27 | | | $ | 1.84 | | | | 0.37 | % |
Hypothetical (5% return before expenses) | | $ | 1,000.00 | | | $ | 1,022.96 | | | $ | 1.86 | | | | 0.37 | % |
Administrator Class | | | | | | | | | | | | | | | | |
Actual | | $ | 1,000.00 | | | $ | 1,005.12 | | | $ | 2.98 | | | | 0.60 | % |
Hypothetical (5% return before expenses) | | $ | 1,000.00 | | | $ | 1,021.82 | | | $ | 3.01 | | | | 0.60 | % |
Institutional Class | | | | | | | | | | | | | | | | |
Actual | | $ | 1,000.00 | | | $ | 1,006.02 | | | $ | 2.09 | | | | 0.42 | % |
Hypothetical (5% return before expenses) | | $ | 1,000.00 | | | $ | 1,022.71 | | | $ | 2.11 | | | | 0.42 | % |
| 1 | Expenses paid is equal to the annualized expense ratio of each class multiplied by the average account value over the period, multiplied by the number of days in the most recent fiscal half-year divided by the number of days in the fiscal year (to reflect the one-half-year period). |
| | | | | | |
| Portfolio of investments—February 28, 2015 (unaudited) | | Wells Fargo Advantage Short Duration Government Bond Fund | | | 7 | |
| | | | | | | | | | | | | | | | |
| Security name | | Interest rate | | | Maturity date | | | Principal | | | Value | |
| | | | | | | | | | | | | | | | |
| | | | |
Agency Securities: 34.53% | | | | | | | | | | | | | | | | |
FHLMC ± | | | 2.32 | % | | | 8-1-2044 | | | $ | 8,630,586 | | | $ | 8,824,847 | |
FHLMC ± | | | 2.51 | | | | 9-1-2043 | | | | 5,413,198 | | | | 5,567,018 | |
FHLMC ± | | | 2.58 | | | | 12-1-2041 | | | | 1,726,559 | | | | 1,793,587 | |
FHLMC ± | | | 3.11 | | | | 8-1-2041 | | | | 5,022,386 | | | | 5,330,718 | |
FHLMC ± | | | 3.26 | | | | 10-1-2041 | | | | 4,139,176 | | | | 4,392,744 | |
FHLMC | | | 3.50 | | | | 7-1-2028 | | | | 4,024,041 | | | | 4,312,573 | |
FHLMC | | | 3.50 | | | | 2-1-2029 | | | | 10,163,257 | | | | 10,887,489 | |
FHLMC | | | 3.50 | | | | 9-1-2029 | | | | 2,728,085 | | | | 2,924,115 | |
FHLMC | | | 3.50 | | | | 10-1-2029 | | | | 2,125,369 | | | | 2,278,320 | |
FHLMC | | | 3.50 | | | | 11-1-2029 | | | | 19,135,278 | | | | 20,482,162 | |
FHLMC | | | 3.50 | | | | 12-1-2029 | | | | 2,536,811 | | | | 2,719,630 | |
FHLMC | | | 3.50 | | | | 1-1-2030 | | | | 8,647,832 | | | | 9,272,736 | |
FHLMC | | | 3.50 | | | | 2-1-2030 | | | | 926,572 | | | | 993,243 | |
FHLMC | | | 3.50 | | | | 2-1-2030 | | | | 1,479,000 | | | | 1,585,849 | |
FHLMC ± | | | 3.64 | | | | 6-1-2041 | | | | 7,102,355 | | | | 7,557,413 | |
FHLMC ± | | | 3.69 | | | | 10-1-2041 | | | | 4,747,043 | | | | 5,060,941 | |
FHLMC | | | 4.00 | | | | 6-1-2031 | | | | 4,097,907 | | | | 4,426,475 | |
FHLMC | | | 4.00 | | | | 4-1-2032 | | | | 1,843,373 | | | | 1,988,278 | |
FHLMC | | | 4.00 | | | | 11-15-2039 | | | | 5,449,316 | | | | 5,857,356 | |
FHLMC | | | 4.50 | | | | 8-1-2018 | | | | 5,221,309 | | | | 5,479,917 | |
FHLMC | | | 4.50 | | | | 10-1-2018 | | | | 2,794,110 | | | | 2,932,501 | |
FHLMC | | | 4.50 | | | | 9-1-2024 | | | | 3,179,335 | | | | 3,434,161 | |
FHLMC | | | 4.50 | | | | 12-1-2024 | | | | 1,103,504 | | | | 1,191,539 | |
FHLMC | | | 4.50 | | | | 7-1-2025 | | | | 2,329,452 | | | | 2,514,990 | |
FHLMC | | | 4.50 | | | | 6-1-2026 | | | | 1,125,379 | | | | 1,215,188 | |
FHLMC | | | 4.50 | | | | 7-1-2026 | | | | 1,387,368 | | | | 1,497,518 | |
FHLMC | | | 4.50 | | | | 8-1-2026 | | | | 651,592 | | | | 702,387 | |
FHLMC | | | 4.50 | | | | 4-1-2031 | | | | 3,054,331 | | | | 3,328,660 | |
FHLMC | | | 4.50 | | | | 7-1-2032 | | | | 1,957,670 | | | | 2,130,347 | |
FHLMC | | | 5.50 | | | | 12-15-2039 | | | | 12,388,080 | | | | 13,959,731 | |
FHLMC | | | 5.50 | | | | 7-1-2041 | | | | 1,686,880 | | | | 1,943,648 | |
FHLMC ± | | | 5.89 | | | | 7-1-2038 | | | | 5,067,084 | | | | 5,432,700 | |
FHLMC ± | | | 5.92 | | | | 10-1-2038 | | | | 435,425 | | | | 465,289 | |
FHLMC | | | 6.00 | | | | 5-15-2039 | | | | 3,807,141 | | | | 4,312,668 | |
FHLMC ± | | | 6.07 | | | | 6-1-2037 | | | | 1,176,860 | | | | 1,262,091 | |
FHLMC | | | 6.50 | | | | 11-1-2037 | | | | 751,487 | | | | 856,536 | |
FHLMC | | | 6.50 | | | | 12-1-2038 | | | | 1,169,644 | | | | 1,340,902 | |
FHLMC | | | 7.00 | | | | 3-25-2044 | | | | 2,048,226 | | | | 2,578,345 | |
FHLMC Series 2638 Class MJ | | | 5.00 | | | | 7-15-2033 | | | | 3,836,256 | | | | 4,254,983 | |
FHLMC Series 2744 Class JH | | | 5.00 | | | | 2-15-2034 | | | | 2,927,000 | | | | 3,228,484 | |
FHLMC Series 2762 Class LY | | | 5.00 | | | | 3-15-2034 | | | | 1,716,305 | | | | 1,903,147 | |
FHLMC Series 3574 Class D | | | 5.00 | | | | 9-15-2039 | | | | 2,016,097 | | | | 2,209,399 | |
FHLMC Series 4227 Class AB | | | 3.50 | | | | 10-15-2037 | | | | 7,594,630 | | | | 7,933,936 | |
FHLMC Series 4327 Class A | | | 4.00 | | | | 2-15-2040 | | | | 23,634,384 | | | | 25,520,716 | |
FHLMC Series 4382 Class AB | | | 3.00 | | | | 7-15-2040 | | | | 8,548,786 | | | | 8,870,255 | |
FHLMC Series T-57 Class 1A3 | | | 7.50 | | | | 7-25-2043 | | | | 389,900 | | | | 468,497 | |
FHLMC Series T-59 Class 1A3 | | | 7.50 | | | | 10-25-2043 | | | | 168,290 | | | | 204,697 | |
FHLMC Series T-60 Class 1A3 | | | 7.50 | | | | 3-25-2044 | | | | 61,377 | | | | 73,981 | |
FHLMC Structured Pass-Through Securities Series T-51 Class 2A ± | | | 7.50 | | | | 8-25-2042 | | | | 1,786,400 | | | | 2,150,921 | |
FHLMC Structured Pass-Through Securities Series T-55 Class 1A2 | | | 7.00 | | | | 3-25-2043 | | | | 534,116 | | | | 595,414 | |
The accompanying notes are an integral part of these financial statements.
| | | | |
| 8 | | Wells Fargo Advantage Short Duration Government Bond Fund | | Portfolio of investments—February 28, 2015 (unaudited) |
| | | | | | | | | | | | | | | | |
| Security name | | Interest rate | | | Maturity date | | | Principal | | | Value | |
| | | | | | | | | | | | | | | | |
| | | | |
Agency Securities (continued) | | | | | | | | | | | | | | | | |
FNMA ± | | | 2.25 | % | | | 11-1-2042 | | | $ | 8,834,356 | | | $ | 9,033,702 | |
FNMA ± | | | 2.30 | | | | 5-1-2042 | | | | 4,495,821 | | | | 4,624,871 | |
FNMA ± | | | 2.34 | | | | 5-1-2042 | | | | 6,355,834 | | | | 6,543,624 | |
FNMA ± | | | 2.34 | | | | 10-1-2043 | | | | 3,047,793 | | | | 3,120,949 | |
FNMA ± | | | 2.50 | | | | 10-1-2043 | | | | 4,894,765 | | | | 5,038,984 | |
FNMA (a) | | | 2.55 | | | | 4-1-2045 | | | | 2,760,000 | | | | 2,816,239 | |
FNMA (a) | | | 2.60 | | | | 3-1-2045 | | | | 2,760,000 | | | | 2,824,756 | |
FNMA ± | | | 2.66 | | | | 12-1-2041 | | | | 7,179,572 | | | | 7,493,950 | |
FNMA ± | | | 2.66 | | | | 11-1-2044 | | | | 8,651,874 | | | | 8,908,355 | |
FNMA ± | | | 3.04 | | | | 10-1-2041 | | | | 933,538 | | | | 993,514 | |
FNMA ± | | | 3.23 | | | | 11-1-2041 | | | | 4,438,398 | | | | 4,705,210 | |
FNMA ± | | | 3.29 | | | | 6-1-2041 | | | | 1,912,601 | | | | 2,034,421 | |
FNMA | | | 3.50 | | | | 11-1-2029 | | | | 2,793,973 | | | | 2,993,587 | |
FNMA | | | 3.50 | | | | 2-1-2030 | | | | 882,000 | | | | 943,685 | |
FNMA | | | 3.50 | | | | 2-1-2030 | | | | 2,210,000 | | | | 2,368,705 | |
FNMA | | | 3.50 | | | | 2-1-2030 | | | | 1,976,000 | | | | 2,114,221 | |
FNMA | | | 3.50 | | | | 2-1-2030 | | | | 2,047,000 | | | | 2,194,011 | |
FNMA | | | 3.50 | | | | 2-1-2030 | | | | 773,000 | | | | 828,513 | |
FNMA | | | 3.50 | | | | 2-1-2030 | | | | 1,672,000 | | | | 1,792,080 | |
FNMA | | | 3.50 | | | | 3-1-2030 | | | | 1,459,000 | | | | 1,563,717 | |
FNMA | | | 4.00 | | | | 9-1-2025 | | | | 1,726,755 | | | | 1,845,849 | |
FNMA | | | 4.00 | | | | 12-1-2025 | | | | 3,513,483 | | | | 3,749,088 | |
FNMA | | | 4.00 | | | | 6-1-2026 | | | | 11,952,858 | | | | 12,811,482 | |
FNMA | | | 4.00 | | | | 8-1-2030 | | | | 5,503,503 | | | | 5,915,249 | |
FNMA | | | 4.00 | | | | 4-1-2032 | | | | 1,360,688 | | | | 1,483,939 | |
FNMA | | | 4.00 | | | | 8-1-2032 | | | | 1,391,175 | | | | 1,513,449 | |
FNMA | | | 4.00 | | | | 3-1-2033 | | | | 8,085,512 | | | | 8,717,991 | |
FNMA | | | 4.50 | | | | 6-1-2025 | | | | 2,535,024 | | | | 2,732,327 | |
FNMA | | | 4.50 | | | | 2-1-2026 | | | | 758,195 | | | | 794,772 | |
FNMA | | | 4.50 | | | | 10-1-2026 | | | | 8,581,241 | | | | 9,244,624 | |
FNMA | | | 4.50 | | | | 12-1-2031 | | | | 6,085,347 | | | | 6,608,655 | |
FNMA | | | 5.00 | | | | 2-1-2023 | | | | 5,179,656 | | | | 5,573,104 | |
FNMA | | | 5.00 | | | | 5-1-2023 | | | | 967,634 | | | | 1,049,031 | |
FNMA | | | 5.00 | | | | 8-1-2030 | | | | 1,197,045 | | | | 1,333,284 | |
FNMA | | | 5.50 | | | | 12-1-2033 | | | | 2,439,798 | | | | 2,791,255 | |
FNMA | | | 5.50 | | | | 9-1-2039 | | | | 1,124,731 | | | | 1,294,413 | |
FNMA | | | 6.00 | | | | 3-25-2035 | | | | 1,076,872 | | | | 1,142,735 | |
FNMA | | | 7.50 | | | | 7-1-2032 | | | | 262,890 | | | | 301,815 | |
FNMA Grantor Trust Series 2000-T6 Class A1 | | | 7.50 | | | | 6-25-2030 | | | | 609,922 | | | | 702,613 | |
FNMA Grantor Trust Series 2001-T16 Class A2 | | | 7.00 | | | | 7-25-2042 | | | | 368,249 | | | | 439,073 | |
FNMA Grantor Trust Series 2001-T3 Class A1 | | | 7.50 | | | | 11-25-2040 | | | | 681,852 | | | | 797,265 | |
FNMA Series 1999-T2 Class A1 ± | | | 7.50 | | | | 1-19-2039 | | | | 397,194 | | | | 440,286 | |
FNMA Series 2001-T4 Class A1 | | | 7.50 | | | | 7-25-2041 | | | | 92,235 | | | | 110,337 | |
FNMA Series 2001-W03 Class A ± | | | 6.92 | | | | 9-25-2041 | | | | 626,570 | | | | 716,345 | �� |
FNMA Series 2002-14 Class A2 | | | 7.00 | | | | 1-25-2042 | | | | 680,204 | | | | 789,586 | |
FNMA Series 2002-14 Class A2 | | | 7.50 | | | | 1-25-2042 | | | | 1,458,478 | | | | 1,744,380 | |
FNMA Series 2002-26 Class A2 | | | 7.50 | | | | 1-25-2048 | | | | 561,489 | | | | 679,600 | |
FNMA Series 2002-26 Class A1 | | | 7.00 | | | | 1-25-2048 | | | | 877,965 | | | | 1,028,218 | |
FNMA Series 2002-33 Class A2 | | | 7.50 | | | | 6-25-2032 | | | | 201,860 | | | | 237,559 | |
FNMA Series 2002-90 Class A1 | | | 6.50 | | | | 6-25-2042 | | | | 26,203 | | | | 29,853 | |
The accompanying notes are an integral part of these financial statements.
| | | | | | |
| Portfolio of investments—February 28, 2015 (unaudited) | | Wells Fargo Advantage Short Duration Government Bond Fund | | | 9 | |
| | | | | | | | | | | | | | | | |
| Security name | | Interest rate | | | Maturity date | | | Principal | | | Value | |
| | | | | | | | | | | | | | | | |
| | | | |
Agency Securities (continued) | | | | | | | | | | | | | | | | |
FNMA Series 2002-T12 Class A3 | | | 7.50 | % | | | 5-25-2042 | | | $ | 3,219,629 | | | $ | 3,844,748 | |
FNMA Series 2002-W1 Class 2A ± | | | 6.50 | | | | 2-25-2042 | | | | 538,893 | | | | 630,383 | |
FNMA Series 2002-W6 Class 2A1 ± | | | 6.42 | | | | 6-25-2042 | | | | 11,150 | | | | 12,863 | |
FNMA Series 2002-W8 Class A3 | | | 7.50 | | | | 6-25-2042 | | | | 112,674 | | | | 131,341 | |
FNMA Series 2003-63 Class GB | | | 4.00 | | | | 7-25-2033 | | | | 4,086,229 | | | | 4,340,707 | |
FNMA Series 2003-W1 Class 2A ± | | | 6.53 | | | | 12-25-2042 | | | | 283,444 | | | | 329,949 | |
FNMA Series 2003-W2 Class 1A1 | | | 6.50 | | | | 7-25-2042 | | | | 162,823 | | | | 188,434 | |
FNMA Series 2003-W4 Class 4A ± | | | 7.00 | | | | 10-25-2042 | | | | 684,304 | | | | 785,997 | |
FNMA Series 2004-W02 Class 5A | | | 7.50 | | | | 3-25-2044 | | | | 119,999 | | | | 138,211 | |
FNMA Series 2004-W11 Class 1A2 | | | 6.50 | | | | 5-25-2044 | | | | 4,646,271 | | | | 5,498,560 | |
FNMA Series 2004-W14 Class 2A | | | 7.50 | | | | 7-25-2044 | | | | 139,237 | | | | 162,505 | |
FNMA Series 2004-W8 Class 3A | | | 7.50 | | | | 6-25-2044 | | | | 1,139,145 | | | | 1,336,829 | |
FNMA Series 2004-W9 Class 1A3 | | | 6.05 | | | | 2-25-2044 | | | | 3,911,519 | | | | 4,392,374 | |
FNMA Series 2004-W9 Class 2A3 | | | 7.50 | | | | 2-25-2044 | | | | 776,096 | | | | 890,630 | |
FNMA Series 2005-W1 Class 1A4 | | | 7.50 | | | | 10-25-2044 | | | | 351,595 | | | | 421,293 | |
FNMA Series 2005-W3 Class 1A | | | 7.50 | | | | 3-25-2045 | | | | 214,626 | | | | 256,274 | |
FNMA Series 2009-14 Class A | | | 7.00 | | | | 6-25-2035 | | | | 1,508,071 | | | | 1,750,947 | |
FNMA Series 2010-98 Class EA | | | 4.00 | | | | 9-25-2030 | | | | 2,618,037 | | | | 2,806,894 | |
FNMA Series 2011-46 Class BA | | | 4.00 | | | | 4-25-2037 | | | | 11,470,045 | | | | 12,023,257 | |
FNMA Series 2011-M2 Class A1 | | | 2.02 | | | | 4-25-2021 | | | | 2,976,159 | | | | 3,020,542 | |
FNMA Series 2012-28 Class PT | | | 4.00 | | | | 3-25-2042 | | | | 1,323,289 | | | | 1,400,772 | |
FNMA Series 2012-65 Class HJ | | | 5.00 | | | | 7-25-2040 | | | | 9,476,328 | | | | 10,451,670 | |
FNMA Series 2013-103 Class H | | | 4.50 | | | | 3-25-2038 | | | | 6,235,664 | | | | 6,802,698 | |
GNMA | | | 5.50 | | | | 3-15-2033 | | | | 1,435,331 | | | | 1,652,579 | |
GNMA Series 2001-53 Class PB | | | 6.50 | | | | 11-20-2031 | | | | 3,336,000 | | | | 3,871,778 | |
| | | | |
Total Agency Securities (Cost $435,670,295) | | | | | | | | | | | | | | | 436,946,548 | |
| | | | | | | | | | | | | | | | |
| | | | |
Asset-Backed Securities: 12.50% | | | | | | | | | | | | | | | | |
Ally Master Owner Trust Series 2014-5 Class A1 ± | | | 0.66 | | | | 10-15-2019 | | | | 8,868,000 | | | | 8,868,000 | |
Ally Master Owner Trust Series 2015-2 Class A1 ± | | | 0.74 | | | | 1-15-2021 | | | | 4,386,000 | | | | 4,387,632 | |
American Express Issuance Trust II Series 2013-2 Class A ± | | | 0.59 | | | | 5-17-2021 | | | | 7,020,000 | | | | 7,040,695 | |
American Express Issuance Trust II Series 2013-2 Class A ± | | | 0.60 | | | | 8-15-2019 | | | | 5,323,000 | | | | 5,344,452 | |
Avis Budget Rental Car Funding LLC Series 2012-3A Class A 144A | | | 2.10 | | | | 3-20-2019 | | | | 8,934,000 | | | | 8,976,794 | |
Bank of America Credit Card Trust Series 2014-A3 Class A ± | | | 0.46 | | | | 1-15-2020 | | | | 1,986,000 | | | | 1,985,043 | |
California Republic Auto Receivables Trust Series 2013-2 Class A2 | | | 1.23 | | | | 3-15-2019 | | | | 4,323,091 | | | | 4,334,249 | |
California Republic Auto Receivables Trust Series 2014-1 Class A4 | | | 1.48 | | | | 8-15-2019 | | | | 3,136,000 | | | | 3,137,408 | |
California Republic Auto Receivables Trust Series 2014-2 Class A3 | | | 0.91 | | | | 8-15-2018 | | | | 3,253,000 | | | | 3,250,287 | |
California Republic Auto Receivables Trust Series 2014-2 Class A4 | | | 1.57 | | | | 12-16-2019 | | | | 3,579,000 | | | | 3,580,274 | |
California Republic Auto Receivables Trust Series 2014-3 Class A4 | | | 1.79 | | | | 3-16-2020 | | | | 3,179,000 | | | | 3,191,131 | |
Capital Auto Receivables Asset Trust Series 2013-1 Class A3 | | | 0.79 | | | | 6-20-2017 | | | | 5,028,000 | | | | 5,025,873 | |
Capital Auto Receivables Asset Trust Series 2014-1 Class A3 | | | 1.32 | | | | 6-20-2018 | | | | 7,875,000 | | | | 7,899,806 | |
Capital Auto Receivables Asset Trust Series 2014-2 Class A4 | | | 1.62 | | | | 10-22-2018 | | | | 3,186,000 | | | | 3,195,924 | |
Capital Auto Receivables Asset Trust Series 2014-3 Class A4 | | | 1.83 | | | | 4-22-2019 | | | | 3,144,000 | | | | 3,146,694 | |
Capital Auto Receivables Asset Trust Series 2015-1 Class A4 | | | 1.86 | | | | 10-21-2019 | | | | 2,433,000 | | | | 2,425,098 | |
Chase Issuance Trust Series 2013-A9 Class A ± | | | 0.59 | | | | 11-16-2020 | | | | 2,940,000 | | | | 2,942,193 | |
Discover Card Execution Note Trust Series 2014-A1 Class A1 ± | | | 0.60 | | | | 7-15-2021 | | | | 8,014,000 | | | | 8,023,545 | |
Ford Credit Floorplan Master Owner Trust Series 2015-1 Class A2 ± | | | 0.57 | | | | 1-15-2020 | | | | 1,989,000 | | | | 1,989,370 | |
GE Capital Credit Card Master Note Trust Series 2012-3 Class A ± | | | 0.62 | | | | 3-15-2020 | | | | 10,572,000 | | | | 10,583,227 | |
Navient Student Loan Trust Series 2014-8 Class A2 ± | | | 0.61 | | | | 4-25-2023 | | | | 8,384,000 | | | | 8,387,848 | |
The accompanying notes are an integral part of these financial statements.
| | | | |
| 10 | | Wells Fargo Advantage Short Duration Government Bond Fund | | Portfolio of investments—February 28, 2015 (unaudited) |
| | | | | | | | | | | | | | | | |
| Security name | | Interest rate | | | Maturity date | | | Principal | | | Value | |
| | | | | | | | | | | | | | | | |
| | | | |
Asset-Backed Securities (continued) | | | | | | | | | | | | | | | | |
Navient Student Loan Trust Series 2014-CTA Class A 144A± | | | 0.87 | % | | | 9-16-2024 | | | $ | 10,413,603 | | | $ | 10,391,120 | |
Nelnet Student Loan Trust Series 2004-4 Class A5 ± | | | 0.42 | | | | 1-25-2037 | | | | 4,096,513 | | | | 4,049,260 | |
Nelnet Student Loan Trust Series 2006-2 Class A4 ± | | | 0.34 | | | | 10-26-2026 | | | | 3,044,620 | | | | 3,041,688 | |
SLC Student Loan Trust Series 2007-2 Class A2 ± | | | 0.66 | | | | 5-15-2028 | | | | 973,421 | | | | 972,177 | |
SLC Student Loan Trust Series 2010-1 Class A ± | | | 1.14 | | | | 11-25-2042 | | | | 1,912,468 | | | | 1,933,700 | |
SLM Student Loan Trust Series 2002-6 Class A4 ± | | | 0.42 | | | | 3-15-2019 | | | | 626,022 | | | | 626,073 | |
SLM Student Loan Trust Series 2003-6 Class A4 ± | | | 0.44 | | | | 12-17-2018 | | | | 406,568 | | | | 406,496 | |
SLM Student Loan Trust Series 2005-6 Class A5 ± | | | 1.46 | | | | 7-27-2026 | | | | 1,427,370 | | | | 1,445,365 | |
SLM Student Loan Trust Series 2010-1 Class A ± | | | 0.57 | | | | 3-25-2025 | | | | 4,406,537 | | | | 4,399,394 | |
SLM Student Loan Trust Series 2010-A Class 2A 144A± | | | 3.42 | | | | 5-16-2044 | | | | 4,646,848 | | | | 4,912,266 | |
SLM Student Loan Trust Series 2010-A Class1A 144A± | | | 3.20 | | | | 5-16-2044 | | | | 3,608,068 | | | | 3,731,615 | |
SLM Student Loan Trust Series 2011-C Class A2A 144A± | | | 3.42 | | | | 10-17-2044 | | | | 1,882,000 | | | | 2,024,601 | |
SLM Student Loan Trust Series 2012-B Class A2 144A | | | 3.48 | | | | 10-15-2030 | | | | 3,197,000 | | | | 3,322,374 | |
SLM Student Loan Trust Series 2012-E Class A2 144A± | | | 1.92 | | | | 6-15-2045 | | | | 3,636,000 | | | | 3,738,928 | |
SLM Student Loan Trust Series 2013-C Class A2B 144A± | | | 1.57 | | | | 10-15-2031 | | | | 1,071,000 | | | | 1,084,043 | |
SLM Student Loan Trust Series 2014-A Class A2B 144A± | | | 1.31 | | | | 1-15-2026 | | | | 4,304,000 | | | | 4,321,470 | |
| | | | |
Total Asset-Backed Securities (Cost $158,010,306) | | | | | | | | | | | | | | | 158,116,113 | |
| | | | | | | | | | | | | | | | |
| | | | |
Non-Agency Mortgage-Backed Securities: 4.78% | | | | | | | | | | | | | | | | |
CFCRE Commercial Mortgage Trust Series 2011-C2 Class A1 | | | 1.56 | | | | 12-15-2047 | | | | 363,284 | | | | 363,716 | |
Commercial Mortgage Trust Series 2012-LC4 Class A2 | | | 2.26 | | | | 12-10-2044 | | | | 4,352,000 | | | | 4,427,316 | |
Commercial Mortgage Trust Series 2013-CR6 Class A1 | | | 0.72 | | | | 3-10-2046 | | | | 2,740,350 | | | | 2,721,729 | |
DBUBS Mortgage Trust Series 2011 Class C2 144A | | | 3.53 | | | | 7-10-2044 | | | | 986,805 | | | | 1,030,708 | |
DBUBS Mortgage Trust Series 2011-LC3A Class A1 | | | 2.24 | | | | 8-10-2044 | | | | 1,141,609 | | | | 1,148,261 | |
GS Mortgage Securities Trust Series 2010-C1 Class A1 144A | | | 3.68 | | | | 8-10-2043 | | | | 1,915,559 | | | | 1,985,370 | |
GS Mortgage Securities Trust Series 2010-C2 Class A1 144A | | | 3.85 | | | | 12-10-2043 | | | | 7,307,723 | | | | 7,473,513 | |
GS Mortgage Securities Trust Series 2011-GC3 Class A2 144A | | | 3.65 | | | | 3-10-2044 | | | | 8,827,103 | | | | 8,994,050 | |
JPMorgan Chase Commercial Mortgage Securities Corporation Series 2010-C1 Class A2 144A | | | 4.61 | | | | 6-15-2043 | | | | 2,478,000 | | | | 2,629,203 | |
JPMorgan Chase Commercial Mortgage Securities Corporation Series 2010-C2 Class A2 144A | | | 3.62 | | | | 11-15-2043 | | | | 2,259,000 | | | | 2,370,760 | |
JPMorgan Chase Commercial Mortgage Securities Corporation Series 2010-CNTR Class A1 144A | | | 3.30 | | | | 8-5-2032 | | | | 1,626,816 | | | | 1,682,274 | |
JPMorgan Chase Commercial Mortgage Securities Corporation Series 2011-C3 Class A2 144A | | | 3.67 | | | | 2-15-2046 | | | | 5,516,780 | | | | 5,675,497 | |
JPMorgan Chase Commercial Mortgage Securities Corporation Series 2011-C5 Class A2 | | | 3.15 | | | | 8-15-2046 | | | | 800,664 | | | | 823,241 | |
JPMorgan Chase Commercial Mortgage Securities Corporation Series 2012-CBX Class A3 | | | 3.14 | | | | 6-15-2045 | | | | 2,973,556 | | | | 3,074,436 | |
JPMorgan Chase Commercial Mortgage Securities Corporation Series 2012-LC9 Class A2 | | | 1.68 | | | | 12-15-2047 | | | | 3,876,000 | | | | 3,896,016 | |
Morgan Stanley Bank of America Merrill Lynch Trust Series 2012-C6 Class A2 | | | 1.87 | | | | 11-15-2045 | | | | 6,091,000 | | | | 6,151,581 | |
Morgan Stanley Capital I Trust Series 2011-C2 Class A3 144A | | | 4.21 | | | | 6-15-2044 | | | | 705,000 | | | | 759,763 | |
Morgan Stanley Dean Witter Capital I Series 2011-C3 Class A2 | | | 3.22 | | | | 7-15-2049 | | | | 5,185,764 | | | | 5,338,000 | |
| | | | |
Total Non-Agency Mortgage-Backed Securities (Cost $61,705,269) | | | | | | | | | | | | | | | 60,545,434 | |
| | | | | | | | | | | | | | | | |
| | | | |
U.S. Treasury Securities: 48.21% | | | | | | | | | | | | | | | | |
U.S. Treasury Note | | | 0.25 | | | | 2-29-2016 | | | | 16,935,000 | | | | 16,931,037 | |
U.S. Treasury Note | | | 0.38 | | | | 10-31-2016 | | | | 24,615,000 | | | | 24,553,463 | |
U.S. Treasury Note | | | 0.50 | | | | 6-30-2016 | | | | 18,086,000 | | | | 18,111,429 | |
U.S. Treasury Note | | | 0.50 | | | | 8-31-2016 | | | | 56,673,000 | | | | 56,717,262 | |
The accompanying notes are an integral part of these financial statements.
| | | | | | |
| Portfolio of investments—February 28, 2015 (unaudited) | | Wells Fargo Advantage Short Duration Government Bond Fund | | | 11 | |
| | | | | | | | | | | | | | | | |
| Security name | | Interest rate | | | Maturity date | | | Principal | | | Value | |
| | | | | | | | | | | | | | | | |
| | | | |
U.S. Treasury Securities (continued) | | | | | | | | | | | | | | | | |
U.S. Treasury Note ## | | | 0.50 | % | | | 9-30-2016 | | | $ | 13,865,000 | | | $ | 13,868,791 | |
U.S. Treasury Note | | | 0.50 | | | | 1-31-2017 | | | | 90,012,000 | | | | 89,829,186 | |
U.S. Treasury Note %% | | | 0.50 | | | | 2-28-2017 | | | | 60,713,000 | | | | 60,565,953 | |
U.S. Treasury Note | | | 0.63 | | | | 7-15-2016 | | | | 124,632,000 | | | | 124,992,311 | |
U.S. Treasury Note | | | 0.63 | | | | 8-15-2016 | | | | 16,262,000 | | | | 16,305,192 | |
U.S. Treasury Note | | | 0.63 | | | | 12-31-2016 | | | | 109,558,000 | | | | 109,643,565 | |
U.S. Treasury Note | | | 0.88 | | | | 10-15-2017 | | | | 30,698,000 | | | | 30,674,025 | |
U.S. Treasury Note | | | 0.88 | | | | 1-15-2018 | | | | 5,625,000 | | | | 5,607,861 | |
U.S. Treasury Note | | | 1.00 | | | | 9-15-2017 | | | | 20,691,000 | | | | 20,760,501 | |
U.S. Treasury Note | | | 1.00 | | | | 2-15-2018 | | | | 21,469,000 | | | | 21,467,325 | |
| | | | |
Total U.S. Treasury Securities (Cost $609,737,713) | | | | | | | | | | | | | | | 610,027,901 | |
| | | | | | | | | | | | | | | | |
| | | | |
| | | Yield | | | | | | Shares | | | | |
| Short-Term Investments: 3.93% | | | | | | | | | | | | | | | | |
| | | | |
| Investment Companies: 3.93% | | | | | | | | | | | | | | | | |
Wells Fargo Advantage Government Money Market Fund, Institutional Class ##(l)(u) | | | 0.01 | | | | | | | | 49,711,816 | | | | 49,711,816 | |
| | | | | | | | | | | | | | | | |
| | | | |
Total Short-Term Investments (Cost $49,711,816) | | | | | | | | | | | | | | | 49,711,816 | |
| | | | | | | | | | | | | | | | |
| | | | | | | | |
| Total investments in securities (Cost $1,314,835,399) * | | | 103.95 | % | | | 1,315,347,812 | |
Other assets and liabilities, net | | | (3.95 | ) | | | (49,996,354 | ) |
| | | | | | | | |
| Total net assets | | | 100.00 | % | | $ | 1,265,351,458 | |
| | | | | | | | |
| ± | Variable rate investment. The rate shown is the rate in effect at period end. |
| (a) | The security is fair valued in accordance with procedures approved by the Board of Trustees. |
| 144A | The security may be resold in transactions exempt from registration, normally to qualified institutional buyers, pursuant to Rule 144A under the Securities Act of 1933. |
| ## | All or a portion of this security is segregated for when-issued securities. |
| %% | The security is issued on a when-issued basis. |
| (l) | The security represents an affiliate of the Fund as defined in the Investment Company Act of 1940. |
| (u) | The rate represents the 7-day annualized yield at period end. |
| * | Cost for federal income tax purposes is $1,315,363,220 and unrealized gains (losses) consists of: |
| | | | |
Gross unrealized gains | | $ | 3,146,354 | |
Gross unrealized losses | | | (3,161,762 | ) |
| | | | |
Net unrealized losses | | $ | (15,408 | ) |
The accompanying notes are an integral part of these financial statements.
| | | | |
| 12 | | Wells Fargo Advantage Short Duration Government Bond Fund | | Statement of assets and liabilities—February 28, 2015 (unaudited) |
| | | | |
| | | | |
| |
Assets | | | | |
Investments | | | | |
In unaffiliated securities, at value (cost $1,265,123,583) | | $ | 1,265,635,996 | |
In affiliated securities, at value (cost $49,711,816) | | | 49,711,816 | |
| | | | |
Total investments, at value (cost $1,314,835,399) | | | 1,315,347,812 | |
Cash | | | 179,406 | |
Receivable for investments sold | | | 47,547,847 | |
Principal paydown receivable | | | 858,629 | |
Receivable for Fund shares sold | | | 414,116 | |
Receivable for interest | | | 2,495,174 | |
Prepaid expenses and other assets | | | 17,234 | |
| | | | |
Total assets | | | 1,366,860,218 | |
| | | | |
| |
Liabilities | | | | |
Dividends payable | | | 114,772 | |
Payable for investments purchased | | | 99,359,747 | |
Payable for Fund shares redeemed | | | 1,478,332 | |
Advisory fee payable | | | 260,587 | |
Distribution fees payable | | | 22,069 | |
Administration fees payable | | | 142,207 | |
Accrued expenses and other liabilities | | | 131,046 | |
| | | | |
Total liabilities | | | 101,508,760 | |
| | | | |
Total net assets | | $ | 1,265,351,458 | |
| | | | |
| |
NET ASSETS CONSIST OF | | | | |
Paid-in capital | | $ | 1,303,311,669 | |
Overdistributed net investment income | | | (2,522,072 | ) |
Accumulated net realized losses on investments | | | (35,950,552 | ) |
Net unrealized gains on investments | | | 512,413 | |
| | | | |
Total net assets | | $ | 1,265,351,458 | |
| | | | |
| |
COMPUTATION OF NET ASSET VALUE AND OFFERING PRICE PER SHARE | | | | |
Net assets – Class A | | $ | 90,581,719 | |
Shares outstanding – Class A1 | | | 8,991,201 | |
Net asset value per share – Class A | | | $10.07 | |
Maximum offering price per share – Class A2 | | | $10.28 | |
Net assets – Class B | | $ | 163,627 | |
Shares outstanding – Class B1 | | | 16,229 | |
Net asset value per share – Class B | | | $10.08 | |
Net assets – Class C | | $ | 36,076,997 | |
Shares outstanding – Class C1 | | | 3,575,263 | |
Net asset value per share – Class C | | | $10.09 | |
Net assets – Class R6 | | $ | 47,558,282 | |
Shares outstanding – Class R61 | | | 4,706,603 | |
Net assets – Class R6 | | | $10.10 | |
Net assets – Administrator Class | | $ | 186,290,344 | |
Shares outstanding – Administrator Class1 | | | 18,462,004 | |
Net asset value per share – Administrator Class | | | $10.09 | |
Net assets – Institutional Class | | $ | 904,680,489 | |
Shares outstanding – Institutional Class1 | | | 89,674,999 | |
Net asset value per share – Institutional Class | | | $10.09 | |
| 1 | The Fund has an unlimited number of authorized shares. |
| 2 | Maximum offering price is computed as 100/98 of net asset value. On investments of $50,000 or more, the offering price is reduced. |
The accompanying notes are an integral part of these financial statements.
| | | | | | |
| Statement of operations—six months ended February 28, 2015 (unaudited) | | Wells Fargo Advantage Short Duration Government Bond Fund | | | 13 | |
| | | | |
| | | | |
| |
Investment income | | | | |
Interest | | $ | 8,685,044 | |
Income from affiliated securities | | | 2,425 | |
| | | | |
Total investment income | | | 8,687,469 | |
| | | | |
| |
Expenses | | | | |
Advisory fee | | | 1,897,848 | |
Administration fees | | | | |
Fund level | | | 322,523 | |
Class A | | | 78,393 | |
Class B | | | 178 | |
Class C | | | 31,802 | |
Class R6 | | | 7,035 | |
Administrator Class | | | 94,148 | |
Institutional Class | | | 366,772 | |
Shareholder servicing fees | | | | |
Class A | | | 122,489 | |
Class B | | | 278 | |
Class C | | | 49,691 | |
Administrator Class | | | 235,138 | |
Distribution fees | | | | |
Class B | | | 834 | |
Class C | | | 149,072 | |
Custody and accounting fees | | | 36,765 | |
Professional fees | | | 26,165 | |
Registration fees | | | 43,246 | |
Shareholder report expenses | | | 31,782 | |
Trustees’ fees and expenses | | | 4,795 | |
Other fees and expenses | | | 16,005 | |
| | | | |
Total expenses | | | 3,514,959 | |
Less: Fee waivers and/or expense reimbursements | | | (250,704 | ) |
| | | | |
Net expenses | | | 3,264,255 | |
| | | | |
Net investment income | | | 5,423,214 | |
| | | | |
| |
REALIZED AND UNREALIZED GAINS (LOSSES) ON INVESTMENTS | | | | |
Net realized gains on investments | | | 2,697,605 | |
Net change in unrealized gains (losses) on investments | | | (743,396 | ) |
| | | | |
Net realized and unrealized gains (losses) on investments | | | 1,954,209 | |
| | | | |
Net increase in net assets resulting from operations | | $ | 7,377,423 | |
| | | | |
The accompanying notes are an integral part of these financial statements.
| | | | |
| 14 | | Wells Fargo Advantage Short Duration Government Bond Fund | | Statement of changes in net assets |
| | | | | | | | | | | | | | | | |
| | | Six months ended February 28, 2015 (unaudited) | | | Year ended
August 31, 2014 | |
| | | | |
Operations | | | | | | | | | | | | | | | | |
Net investment income | | | | | | $ | 5,423,214 | | | | | | | $ | 8,479,376 | |
Net realized gains (losses) on investments | | | | | | | 2,697,605 | | | | | | | | (4,014,003 | ) |
Net change in unrealized gains (losses) on investments | | | | | | | (743,396 | ) | | | | | | | 13,243,893 | |
| | | | |
Net increase (decrease) in net assets resulting from operations | | | | | | | 7,377,423 | | | | | | | | 17,709,266 | |
| | | | |
| | | | |
Distributions to shareholders from | | | | | | | | | | | | | | | | |
Net investment income | | | | | | | | | | | | | | | | |
Class A | | | | | | | (514,892 | ) | | | | | | | (1,294,991 | ) |
Class B | | | | | | | (330 | ) | | | | | | | (2,258 | ) |
Class C | | | | | | | (60,291 | ) | | | | | | | (209,312 | ) |
Class R6 | | | | | | | (342,789 | ) | | | | | | | (380,974 | ) |
Administrator Class | | | | | | | (1,160,021 | ) | | | | | | | (2,670,961 | ) |
Institutional Class | | | | | | | (6,473,247 | ) | | | | | | | (13,956,138 | ) |
| | | | |
Total distributions to shareholders | | | | | | | (8,551,570 | ) | | | | | | | (18,514,634 | ) |
| | | | |
| | | | |
Capital share transactions | | | Shares | | | | | | | | Shares | | | | | |
Proceeds from shares sold | | | | | | | | | | | | | | | | |
Class A | | | 429,571 | | | | 4,330,941 | | | | 2,050,091 | | | | 20,702,596 | |
Class B | | | 4,663 | | | | 47,021 | | | | 6,231 | | | | 62,998 | |
Class C | | | 145,018 | | | | 1,465,025 | | | | 299,780 | | | | 3,033,330 | |
Class R6 | | | 1,033,932 | | | | 10,453,395 | | | | 6,291,982 | | | | 63,793,536 | |
Administrator Class | | | 2,041,896 | | | | 20,616,233 | | | | 3,637,751 | | | | 36,805,716 | |
Institutional Class | | | 16,009,760 | | | | 161,568,643 | | | | 33,734,906 | | | | 341,098,630 | |
| | | | |
| | | | | | | 198,481,258 | | | | | | | | 465,496,806 | |
| | | | |
Reinvestment of distributions | | | | | | | | | | | | | | | | |
Class A | | | 46,999 | | | | 473,806 | | | | 118,250 | | | | 1,194,227 | |
Class B | | | 28 | | | | 284 | | | | 198 | | | | 1,999 | |
Class C | | | 5,434 | | | | 54,871 | | | | 19,110 | | | | 193,392 | |
Class R6 | | | 33,904 | | | | 342,789 | | | | 37,650 | | | | 380,974 | |
Administrator Class | | | 107,789 | | | | 1,088,637 | | | | 243,609 | | | | 2,464,121 | |
Institutional Class | | | 591,455 | | | | 5,971,729 | | | | 1,258,055 | | | | 12,725,255 | |
| | | | |
| | | | | | | 7,932,116 | | | | | | | | 16,959,968 | |
| | | | |
Payment for shares redeemed | | | | | | | | | | | | | | | | |
Class A | | | (2,097,582 | ) | | | (21,140,274 | ) | | | (4,076,175 | ) | | | (41,155,799 | ) |
Class B | | | (11,022 | ) | | | (111,210 | ) | | | (68,648 | ) | | | (693,890 | ) |
Class C | | | (973,700 | ) | | | (9,832,093 | ) | | | (2,166,936 | ) | | | (21,918,485 | ) |
Class R6 | | | (1,151,209 | ) | | | (11,641,505 | ) | | | (1,834,211 | ) | | | (18,570,451 | ) |
Administrator Class | | | (2,646,164 | ) | | | (26,708,165 | ) | | | (8,159,129 | ) | | | (82,511,132 | ) |
Institutional Class | | | (16,365,574 | ) | | | (165,121,661 | ) | | | (49,642,019 | ) | | | (501,916,330 | ) |
| | | | |
| | | | | | | (234,554,908 | ) | | | | | | | (666,766,087 | ) |
| | | | |
Net decrease in net assets resulting from capital share transactions | | | | | | | (28,141,534 | ) | | | | | | | (184,309,313 | ) |
| | | | |
Total decrease in net assets | | | | | | | (29,315,681 | ) | | | | | | | (185,114,681 | ) |
| | | | |
| | | | |
Net assets | | | | | | | | | | | | | | | | |
Beginning of period | | | | | | | 1,294,667,139 | | | | | | | | 1,479,781,820 | |
| | | | |
End of period | | | | | | $ | 1,265,351,458 | | | | | | | $ | 1,294,667,139 | |
| | | | |
Overdistributed net investment income | | | | | | $ | (2,522,072 | ) | | | | | | $ | 606,284 | |
| | | | |
The accompanying notes are an integral part of these financial statements.
| | | | | | |
| Financial highlights | | Wells Fargo Advantage Short Duration Government Bond Fund | | | 15 | |
(For a share outstanding throughout each period)
| | | | | | | | | | | | | | | | | | | | | | | | | | | | |
| | | Six months ended
February 28, 2015
(unaudited) | | | Year ended August 31 | | | Year ended
May 31, 2010 | |
| CLASS A | | | 2014 | | | 2013 | | | 2012 | | | 2011 | | | 20101 | | |
Net asset value, beginning of period | | | $10.08 | | | | $10.09 | | | | $10.35 | | | | $10.36 | | | | $10.47 | | | | $10.41 | | | | $10.30 | |
Net investment income | | | 0.03 | | | | 0.03 | | | | 0.08 | 2 | | | 0.10 | | | | 0.16 | | | | 0.05 | | | | 0.19 | 2 |
Net realized and unrealized gains (losses) on investments | | | 0.01 | | | | 0.07 | | | | (0.14 | ) | | | 0.09 | | | | 0.07 | | | | 0.08 | | | | 0.20 | |
| | | | | | | | | | | | | | | | | | | | | | | | | | | | |
Total from investment operations | | | 0.04 | | | | 0.10 | | | | (0.06 | ) | | | 0.19 | | | | 0.23 | | | | 0.13 | | | | 0.39 | |
Distributions to shareholders from | | | | | | | | | | | | | | | | | | | | | | | | | | | | |
Net investment income | | | (0.05 | ) | | | (0.11 | ) | | | (0.20 | ) | | | (0.20 | ) | | | (0.25 | ) | | | (0.07 | ) | | | (0.28 | ) |
Net realized gains | | | 0.00 | | | | 0.00 | | | | 0.00 | | | | 0.00 | | | | (0.09 | ) | | | 0.00 | | | | 0.00 | |
| | | | | | | | | | | | | | | | | | | | | | | | | | | | |
Total distributions to shareholders | | | (0.05 | ) | | | (0.11 | ) | | | (0.20 | ) | | | (0.20 | ) | | | (0.34 | ) | | | (0.07 | ) | | | (0.28 | ) |
Net asset value, end of period | | | $10.07 | | | | $10.08 | | | | $10.09 | | | | $10.35 | | | | $10.36 | | | | $10.47 | | | | $10.41 | |
Total return3 | | | 0.42 | % | | | 1.03 | % | | | (0.63 | )% | | | 1.86 | % | | | 2.17 | % | | | 1.23 | % | | | 3.85 | % |
Ratios to average net assets (annualized) | | | | | | | | | | | | | | | | | | | | | | | | | | | | |
Gross expenses | | | 0.78 | % | | | 0.80 | % | | | 0.82 | % | | | 0.86 | % | | | 0.87 | % | | | 0.86 | % | | | 0.88 | % |
Net expenses | | | 0.78 | % | | | 0.78 | % | | | 0.79 | % | | | 0.83 | % | | | 0.83 | % | | | 0.84 | % | | | 0.85 | % |
Net investment income | | | 0.56 | % | | | 0.38 | % | | | 0.80 | % | | | 0.98 | % | | | 1.60 | % | | | 1.85 | % | | | 1.86 | % |
Supplemental data | | | | | | | | | | | | | | | | | | | | | | | | | | | | |
Portfolio turnover rate | | | 273 | % | | | 408 | % | | | 324 | % | | | 399 | % | | | 485 | % | | | 135 | % | | | 501 | % |
Net assets, end of period (000s omitted) | | | $90,582 | | | | $107,005 | | | | $126,316 | | | | $167,266 | | | | $162,719 | | | | $181,951 | | | | $162,737 | |
| 1 | For the three months ended August 31, 2010. The Fund changed its fiscal year end from May 31 to August 31, effective August 31, 2010. |
| 2 | Calculated based upon average shares outstanding |
| 3 | Total return calculations do not include any sales charges. Returns for periods of less than one year are not annualized. |
The accompanying notes are an integral part of these financial statements.
| | | | |
| 16 | | Wells Fargo Advantage Short Duration Government Bond Fund | | Financial highlights |
(For a share outstanding throughout each period)
| | | | | | | | | | | | | | | | | | | | | | | | | | | | |
| | | Six months ended
February 28, 2015
(unaudited) | | | Year ended August 31 | | | Year ended
May 31, 2010 | |
| CLASS B | | | 2014 | | | 2013 | | | 2012 | | | 2011 | | | 20101 | | |
Net asset value, beginning of period | | | $10.09 | | | | $10.10 | | | | $10.36 | | | | $10.36 | | | | $10.48 | | | | $10.42 | | | | $10.31 | |
Net investment income (loss) | | | (0.01 | )2 | | | (0.04 | )2 | | | 0.01 | 2 | | | 0.03 | 2 | | | 0.09 | | | | 0.03 | | | | 0.14 | 2 |
Net realized and unrealized gains (losses) on investments | | | 0.02 | | | | 0.07 | | | | (0.15 | ) | | | 0.10 | | | | 0.05 | | | | 0.08 | | | | 0.18 | |
| | | | | | | | | | | | | | | | | | | | | | | | | | | | |
Total from investment operations | | | 0.01 | | | | 0.03 | | | | (0.14 | ) | | | 0.13 | | | | 0.14 | | | | 0.11 | | | | 0.32 | |
Distributions to shareholders from | | | | | | | | | | | | | | | | | | | | | | | | | | | | |
Net investment income | | | (0.02 | ) | | | (0.04 | ) | | | (0.12 | ) | | | (0.13 | ) | | | (0.17 | ) | | | (0.05 | ) | | | (0.21 | ) |
Net realized gains | | | 0.00 | | | | 0.00 | | | | 0.00 | | | | 0.00 | | | | (0.09 | ) | | | 0.00 | | | | 0.00 | |
| | | | | | | | | | | | | | | | | | | | | | | | | | | | |
Total distributions to shareholders | | | (0.02 | ) | | | (0.04 | ) | | | (0.12 | ) | | | (0.13 | ) | | | (0.26 | ) | | | (0.05 | ) | | | (0.21 | ) |
Net asset value, end of period | | | $10.08 | | | | $10.09 | | | | $10.10 | | | | $10.36 | | | | $10.36 | | | | $10.48 | | | | $10.42 | |
Total return3 | | | 0.05 | % | | | 0.28 | % | | | (1.37 | )% | | | 1.22 | % | | | 1.32 | % | | | 1.04 | % | | | 3.08 | % |
Ratios to average net assets (annualized) | | | | | | | | | | | | | | | | | | | | | | | | | | | | |
Gross expenses | | | 1.53 | % | | | 1.56 | % | | | 1.58 | % | | | 1.60 | % | | | 1.62 | % | | | 1.62 | % | | | 1.66 | % |
Net expenses | | | 1.53 | % | | | 1.53 | % | | | 1.54 | % | | | 1.57 | % | | | 1.58 | % | | | 1.59 | % | | | 1.60 | % |
Net investment income (loss) | | | (0.18 | )% | | | (0.37 | )% | | | (0.06 | )% | | | 0.25 | % | | | 0.85 | % | | | 1.07 | % | | | 1.30 | % |
Supplemental data | | | | | | | | | | | | | | | | | | | | | | | | | | | | |
Portfolio turnover rate | | | 273 | % | | | 408 | % | | | 324 | % | | | 399 | % | | | 485 | % | | | 135 | % | | | 501 | % |
Net assets, end of period (000s omitted) | | | $164 | | | | $228 | | | | $856 | | | | $1,115 | | | | $1,543 | | | | $1,548 | | | | $1,760 | |
| 1 | For the three months ended August 31, 2010. The Fund changed its fiscal year end from May 31 to August 31, effective August 31, 2010. |
| 2 | Calculated based upon average shares outstanding |
| 3 | Total return calculations do not include any sales charges. Returns for periods of less than one year are not annualized. |
The accompanying notes are an integral part of these financial statements.
| | | | | | |
| Financial highlights | | Wells Fargo Advantage Short Duration Government Bond Fund | | | 17 | |
(For a share outstanding throughout each period)
| | | | | | | | | | | | | | | | | | | | | | | | | | | | |
| | | Six months ended
February 28, 2015
(unaudited) | | | Year ended August 31 | | | Year ended
May 31, 2010 | |
| CLASS C | | | 2014 | | | 2013 | | | 2012 | | | 2011 | | | 20101 | | |
Net asset value, beginning of period | | | $10.10 | | | | $10.11 | | | | $10.37 | | | | $10.37 | | | | $10.48 | | | | $10.43 | | | | $10.32 | |
Net investment income (loss) | | | (0.01 | ) | | | (0.05 | ) | | | 0.01 | 2 | | | 0.03 | | | | 0.08 | | | | 0.03 | | | | 0.11 | 2 |
Net realized and unrealized gains (losses) on investments | | | 0.02 | | | | 0.08 | | | | (0.15 | ) | | | 0.09 | | | | 0.07 | | | | 0.07 | | | | 0.20 | |
| | | | | | | | | | | | | | | | | | | | | | | | | | | | |
Total from investment operations | | | 0.01 | | | | 0.03 | | | | (0.14 | ) | | | 0.12 | | | | 0.15 | | | | 0.10 | | | | 0.31 | |
Distributions to shareholders from | | | | | | | | | | | | | | | | | | | | | | | | | | | | |
Net investment income | | | (0.02 | ) | | | (0.04 | ) | | | (0.12 | ) | | | (0.12 | ) | | | (0.17 | ) | | | (0.05 | ) | | | (0.20 | ) |
Net realized gains | | | 0.00 | | | | 0.00 | | | | 0.00 | | | | 0.00 | | | | (0.09 | ) | | | 0.00 | | | | 0.00 | |
| | | | | | | | | | | | | | | | | | | | | | | | | | | | |
Total distributions to shareholders | | | (0.02 | ) | | | (0.04 | ) | | | (0.12 | ) | | | (0.12 | ) | | | (0.26 | ) | | | (0.05 | ) | | | (0.20 | ) |
Net asset value, end of period | | | $10.09 | | | | $10.10 | | | | $10.11 | | | | $10.37 | | | | $10.37 | | | | $10.48 | | | | $10.43 | |
Total return3 | | | 0.05 | % | | | 0.28 | % | | | (1.37 | )% | | | 1.20 | % | | | 1.41 | % | | | 0.94 | % | | | 3.06 | % |
Ratios to average net assets (annualized) | | | | | | | | | | | | | | | | | | | | | | | | | | | | |
Gross expenses | | | 1.53 | % | | | 1.55 | % | | | 1.57 | % | | | 1.61 | % | | | 1.62 | % | | | 1.62 | % | | | 1.65 | % |
Net expenses | | | 1.53 | % | | | 1.53 | % | | | 1.54 | % | | | 1.58 | % | | | 1.58 | % | | | 1.59 | % | | | 1.60 | % |
Net investment income (loss) | | | (0.19 | )% | | | (0.37 | )% | | | 0.05 | % | | | 0.23 | % | | | 0.85 | % | | | 1.10 | % | | | 1.01 | % |
Supplemental data | | | | | | | | | | | | | | | | | | | | | | | | | | | | |
Portfolio turnover rate | | | 273 | % | | | 408 | % | | | 324 | % | | | 399 | % | | | 485 | % | | | 135 | % | | | 501 | % |
Net assets, end of period (000s omitted) | | | $36,077 | | | | $44,423 | | | | $63,126 | | | | $78,385 | | | | $69,077 | | | | $72,124 | | | | $65,664 | |
| 1 | For the three months ended August 31, 2010. The Fund changed its fiscal year end from May 31 to August 31, effective August 31, 2010. |
| 2 | Calculated based upon average shares outstanding |
| 3 | Total return calculations do not include any sales charges. Returns for periods of less than one year are not annualized. |
The accompanying notes are an integral part of these financial statements.
| | | | |
| 18 | | Wells Fargo Advantage Short Duration Government Bond Fund | | Financial highlights |
(For a share outstanding throughout each period)
| | | | | | | | | | | | |
| | | Six months ended
February 28, 2015
(unaudited) | | | Year ended August 31 | |
| CLASS R6 | | | 2014 | | | 20131 | |
Net asset value, beginning of period | | | $10.11 | | | | $10.13 | | | | $10.33 | |
Net investment income | | | 0.05 | | | | 0.08 | 2 | | | 0.13 | 2 |
Net realized and unrealized gains (losses) on investments | | | 0.01 | | | | 0.05 | | | | (0.15 | ) |
| | | | | | | | | | | | |
Total from investment operations | | | 0.06 | | | | 0.13 | | | | (0.02 | ) |
Distributions to shareholders from | | | | | | | | | | | | |
Net investment income | | | (0.07 | ) | | | (0.15 | ) | | | (0.18 | ) |
Net asset value, end of period | | | $10.10 | | | | $10.11 | | | | $10.13 | |
Total return3 | | | 0.63 | % | | | 1.35 | % | | | (0.17 | )% |
Ratios to average net assets (annualized) | | | | | | | | | | | | |
Gross expenses | | | 0.40 | % | | | 0.41 | % | | | 0.43 | % |
Net expenses | | | 0.37 | % | | | 0.37 | % | | | 0.37 | % |
Net investment income | | | 0.97 | % | | | 0.76 | % | | | 0.81 | % |
Supplemental data | | | | | | | | | | | | |
Portfolio turnover rate | | | 273 | % | | | 408 | % | | | 324 | % |
Net assets, end of period (000s omitted) | | | $47,558 | | | | $48,446 | | | | $2,983 | |
| 1 | For the period from November 30, 2012 (commencement of class operations) to August 31, 2013 |
| 2 | Calculated based upon average shares outstanding |
| 3 | Returns for periods of less than one year are not annualized. |
The accompanying notes are an integral part of these financial statements.
| | | | | | |
| Financial highlights | | Wells Fargo Advantage Short Duration Government Bond Fund | | | 19 | |
(For a share outstanding throughout each period)
| | | | | | | | | | | | | | | | | | | | | | | | | | | | |
| | | Six months ended
February 28, 2015
(unaudited) | | | Year ended August 31 | | | Year ended
May 31, 2010 | |
| ADMINISTRATOR CLASS | | | 2014 | | | 2013 | | | 2012 | | | 2011 | | | 20101 | | |
Net asset value, beginning of period | | | $10.10 | | | | $10.11 | | | | $10.36 | | | | $10.37 | | | | $10.48 | | | | $10.42 | | | | $10.32 | |
Net investment income | | | 0.04 | | | | 0.06 | 2 | | | 0.10 | 2 | | | 0.13 | | | | 0.17 | | | | 0.05 | | | | 0.22 | 2 |
Net realized and unrealized gains (losses) on investments | | | 0.01 | | | | 0.06 | | | | (0.13 | ) | | | 0.09 | | | | 0.08 | | | | 0.08 | | | | 0.19 | |
| | | | | | | | | | | | | | | | | | | | | | | | | | | | |
Total from investment operations | | | 0.05 | | | | 0.12 | | | | (0.03 | ) | | | 0.22 | | | | 0.25 | | | | 0.13 | | | | 0.41 | |
Distributions to shareholders from | | | | | | | | | | | | | | | | | | | | | | | | | | | | |
Net investment income | | | (0.06 | ) | | | (0.13 | ) | | | (0.22 | ) | | | (0.23 | ) | | | (0.27 | ) | | | (0.07 | ) | | | (0.31 | ) |
Net realized gains | | | 0.00 | | | | 0.00 | | | | 0.00 | | | | 0.00 | | | | (0.09 | ) | | | 0.00 | | | | 0.00 | |
| | | | | | | | | | | | | | | | | | | | | | | | | | | | |
Total distributions to shareholders | | | (0.06 | ) | | | (0.13 | ) | | | (0.22 | ) | | | (0.23 | ) | | | (0.36 | ) | | | (0.07 | ) | | | (0.31 | ) |
Net asset value, end of period | | | $10.09 | | | | $10.10 | | | | $10.11 | | | | $10.36 | | | | $10.37 | | | | $10.48 | | | | $10.42 | |
Total return3 | | | 0.51 | % | | | 1.21 | % | | | (0.34 | )% | | | 2.10 | % | | | 2.41 | % | | | 1.29 | % | | | 4.01 | % |
Ratios to average net assets (annualized) | | | | | | | | | | | | | | | | | | | | | | | | | | | | |
Gross expenses | | | 0.72 | % | | | 0.74 | % | | | 0.76 | % | | | 0.80 | % | | | 0.80 | % | | | 0.79 | % | | | 0.80 | % |
Net expenses | | | 0.60 | % | | | 0.60 | % | | | 0.60 | % | | | 0.60 | % | | | 0.60 | % | | | 0.60 | % | | | 0.60 | % |
Net investment income | | | 0.75 | % | | | 0.56 | % | | | 0.99 | % | | | 1.20 | % | | | 1.84 | % | | | 2.06 | % | | | 2.13 | % |
Supplemental data | | | | | | | | | | | | | | | | | | | | | | | | | | | | |
Portfolio turnover rate | | | 273 | % | | | 408 | % | | | 324 | % | | | 399 | % | | | 485 | % | | | 135 | % | | | 501 | % |
Net assets, end of period (000s omitted) | | | $186,290 | | | | $191,469 | | | | $234,808 | | | | $285,637 | | | | $247,357 | | | | $435,363 | | | | $505,432 | |
| 1 | For the three months ended August 31, 2010. The Fund changed its fiscal year end from May 31 to August 31, effective August 31, 2010. |
| 2 | Calculated based upon average shares outstanding |
| 3 | Returns for periods of less than one year are not annualized. |
The accompanying notes are an integral part of these financial statements.
| | | | |
| 20 | | Wells Fargo Advantage Short Duration Government Bond Fund | | Financial highlights |
(For a share outstanding throughout each period)
| | | | | | | | | | | | | | | | | | | | | | | | | | | | |
| | | Six months ended
February 28, 2015
(unaudited) | | | Year ended August 31 | | | Year ended
May 31, 2010 | |
| INSTITUTIONAL CLASS | | | 2014 | | | 2013 | | | 2012 | | | 2011 | | | 20101 | | |
Net asset value, beginning of period | | | $10.10 | | | | $10.10 | | | | $10.36 | | | | $10.37 | | | | $10.48 | | | | $10.43 | | | | $10.32 | |
Net investment income | | | 0.05 | | | | 0.07 | | | | 0.12 | | | | 0.15 | | | | 0.21 | | | | 0.06 | | | | 0.31 | 2 |
Net realized and unrealized gains (losses) on investments | | | 0.01 | | | | 0.08 | | | | (0.15 | ) | | | 0.09 | | | | 0.06 | | | | 0.07 | | | | 0.13 | |
| | | | | | | | | | | | | | | | | | | | | | | | | | | | |
Total from investment operations | | | 0.06 | | | | 0.15 | | | | (0.03 | ) | | | 0.24 | | | | 0.27 | | | | 0.13 | | | | 0.44 | |
Distributions to shareholders from | | | | | | | | | | | | | | | | | | | | | | | | | | | | |
Net investment income | | | (0.07 | ) | | | (0.15 | ) | | | (0.23 | ) | | | (0.25 | ) | | | (0.29 | ) | | | (0.08 | ) | | | (0.33 | ) |
Net realized gains | | | 0.00 | | | | 0.00 | | | | 0.00 | | | | 0.00 | | | | (0.09 | ) | | | 0.00 | | | | 0.00 | |
| | | | | | | | | | | | | | | | | | | | | | | | | | | | |
Total distributions to shareholders | | | (0.07 | ) | | | (0.15 | ) | | | (0.23 | ) | | | (0.25 | ) | | | (0.38 | ) | | | (0.08 | ) | | | (0.33 | ) |
Net asset value, end of period | | | $10.09 | | | | $10.10 | | | | $10.10 | | | | $10.36 | | | | $10.37 | | | | $10.48 | | | | $10.43 | |
Total return3 | | | 0.60 | % | | | 1.50 | % | | | (0.26 | )% | | | 2.28 | % | | | 2.59 | % | | | 1.24 | % | | | 4.30 | % |
Ratios to average net assets (annualized) | | | | | | | | | | | | | | | | | | | | | | | | | | | | |
Gross expenses | | | 0.45 | % | | | 0.47 | % | | | 0.49 | % | | | 0.53 | % | | | 0.54 | % | | | 0.53 | % | | | 0.55 | % |
Net expenses | | | 0.42 | % | | | 0.42 | % | | | 0.42 | % | | | 0.42 | % | | | 0.42 | % | | | 0.42 | % | | | 0.42 | % |
Net investment income | | | 0.93 | % | | | 0.74 | % | | | 1.16 | % | | | 1.39 | % | | | 1.97 | % | | | 2.27 | % | | | 2.98 | % |
Supplemental data | | | | | | | | | | | | | | | | | | | | | | | | | | | | |
Portfolio turnover rate | | | 273 | % | | | 408 | % | | | 324 | % | | | 399 | % | | | 485 | % | | | 135 | % | | | 501 | % |
Net assets, end of period (000s omitted) | | | $904,680 | | | | $903,096 | | | | $1,051,693 | | | | $1,157,125 | | | | $862,174 | | | | $572,274 | | | | $489,762 | |
| 1 | For the three months ended August 31, 2010. The Fund changed its fiscal year end from May 31 to August 31, effective August 31, 2010. |
| 2 | Calculated based upon average shares outstanding |
| 3 | Returns for periods of less than one year are not annualized. |
The accompanying notes are an integral part of these financial statements.
| | | | | | |
| Notes to financial statements (unaudited) | | Wells Fargo Advantage Short Duration Government Bond Fund | | | 21 | |
1. ORGANIZATION
Wells Fargo Funds Trust (the “Trust”), a Delaware statutory trust organized on March 10, 1999, is an open-end management investment company registered under the Investment Company Act of 1940, as amended (the “1940 Act”). As an investment company, the Trust follows the accounting and reporting guidance in Financial Accounting Standards Board (“FASB”) Accounting Standards Codification Topic 946, Financial Services – Investment Companies. These financial statements report on the Wells Fargo Advantage Short Duration Government Bond Fund (the “Fund”) which is a diversified series of the Trust.
2. SIGNIFICANT ACCOUNTING POLICIES
The following significant accounting policies, which are consistently followed in the preparation of the financial statements of the Fund, are in conformity with U.S. generally accepted accounting principles which require management to make estimates and assumptions that affect the reported amounts of assets and liabilities, disclosure of contingent assets and liabilities at the date of the financial statements, and the reported amounts of revenues and expenses during the reporting period. Actual results could differ from those estimates.
Securities valuation
All investments are valued each business day as of the close of regular trading on the New York Stock Exchange (generally 4 p.m. Eastern Time).
Debt securities are valued at the evaluated bid price provided by an independent pricing service or, if a reliable price is not available, the quoted bid price from an independent broker-dealer.
Investments in registered open-end investment companies are valued at net asset value.
Investments which are not valued using any of the methods discussed above are valued at their fair value, as determined in good faith by the Board of Trustees of the Fund. The Board of Trustees has established a Valuation Committee comprised of the Trustees and has delegated to it the authority to take any actions regarding the valuation of portfolio securities that the Valuation Committee deems necessary or appropriate, including determining the fair value of portfolio securities, unless the determination has been delegated to the Management Valuation Team of Wells Fargo Funds Management, LLC (“Funds Management”). The Board of Trustees retains the authority to make or ratify any valuation decisions or approve any changes to the Valuation Procedures as it deems appropriate. On a quarterly basis, the Board of Trustees receives reports on any valuation actions taken by the Valuation Committee or the Management Valuation Team which may include items for ratification.
Valuations of fair valued securities are compared to the next actual sales price when available, or other appropriate market values, to assess the continued appropriateness of the fair valuation methodologies used. These securities are fair valued on a day-to-day basis, taking into consideration changes to appropriate market information and any significant changes to the inputs considered in the valuation process until there is a readily available price provided on an exchange or by an independent pricing service. Valuations received from an independent pricing service or independent broker-dealer quotes are periodically validated by comparisons to most recent trades and valuations provided by other independent pricing services in addition to the review of prices by the adviser and/or subadviser. Unobservable inputs used in determining fair valuations are identified based on the type of security, taking into consideration factors utilized by market participants in valuing the investment, knowledge about the issuer and the current market environment.
When-issued transactions
The Fund may purchase securities on a forward commitment or when-issued basis. The Fund records a when-issued transaction on the trade date and will segregate assets in an amount at least equal in value to the Fund’s commitment to purchase when-issued securities. Securities purchased on a when-issued basis are marked-to-market daily and the Fund begins earning interest on the settlement date. Losses may arise due to changes in the market value of the underlying securities or if the counterparty does not perform under the contract.
TBA sale commitments
The Fund may enter into To Be Announced (“TBA”) sale commitments to hedge its portfolio positions or to sell mortgage-backed securities it owns under delayed delivery arrangements. Proceeds of TBA sale commitments are not received until the contractual settlement date. During the time a TBA sale commitment is outstanding, equivalent deliverable securities or offsetting TBA purchase commitments, which are deliverable on or before the sale commitment date, are held as “cover” for the transaction. Unsettled TBA sale commitments are valued at the current market value of the underlying securities, according to the procedures described under “Securities valuation”. The contract is marked-to-market daily and the change in market value is recorded by the Fund as an unrealized gain or loss. If the TBA sale commitment is
| | | | |
| 22 | | Wells Fargo Advantage Short Duration Government Bond Fund | | Notes to financial statements (unaudited) |
closed through the acquisition of an offsetting purchase commitment, the Fund realizes a gain or loss. If the Fund delivers securities under the commitment, the Fund realizes a gain or a loss from the sale of the securities based upon the unit price established at the date the commitment was entered into.
Security transactions and income recognition
Securities transactions are recorded on a trade date basis. Realized gains or losses are recorded on the basis of identified cost.
Interest income is accrued daily and bond discounts are accreted and premiums are amortized daily based on the effective interest method. To the extent debt obligations are placed on non-accrual status, any related interest income may be reduced by writing off interest receivables when the collection of all or a portion of interest has become doubtful based on consistently applied procedures. If the issuer subsequently resumes interest payments or when the collectability of interest is reasonably assured, the debt obligation is removed from non-accrual status.
Distributions to shareholders
Distributions to shareholders from net investment income are accrued daily and paid monthly. Distributions from net realized gains, if any, are recorded on the ex-dividend date. Such distributions are determined in conformity with federal income tax regulations, which may differ in amount or character from net investment income and realized gains recognized for purposes of U.S. generally accepted accounting principles.
Federal and other taxes
The Fund intends to continue to qualify as a regulated investment company by distributing substantially all of its investment company taxable income and any net realized capital gains (after reduction for capital loss carryforwards) sufficient to relieve it from all, or substantially all, federal income taxes. Accordingly, no provision for federal income taxes was required.
The Fund’s income and federal excise tax returns and all financial records supporting those returns for the prior three fiscal years are subject to examination by the federal and Delaware revenue authorities. Management has analyzed the Fund’s tax positions taken on federal, state, and foreign tax returns for all open tax years and does not believe that there are any uncertain tax positions that require recognition of a tax liability.
As of August 31, 2014, the Fund had capital loss carryforwards which consist of $22,628,036 in short-term capital losses and $6,306,407 in long-term capital losses.
As of August 31, 2014, the Fund had $9,437,999 of current year deferred post-October capital losses, which was recognized on the first day of the current fiscal year.
Class allocations
The separate classes of shares offered by the Fund differ principally in applicable sales charges, distribution, shareholder servicing, and administration fees. Class specific expenses are charged directly to that share class. Investment income, common expenses, and realized and unrealized gains (losses) on investments are allocated daily to each class of shares based on the relative proportion of net assets of each class.
3. FAIR VALUATION MEASUREMENTS
Fair value measurements of investments are determined within a framework that has established a fair value hierarchy based upon the various data inputs utilized in determining the value of the Fund’s investments. The three-level hierarchy gives the highest priority to unadjusted quoted prices in active markets for identical assets or liabilities (Level 1) and the lowest priority to significant unobservable inputs (Level 3). The Fund’s investments are classified within the fair value hierarchy based on the lowest level of input that is significant to the fair value measurement. The inputs are summarized into three broad levels as follows:
| n | | Level 1 – quoted prices in active markets for identical securities |
| n | | Level 2 – other significant observable inputs (including quoted prices for similar securities, interest rates, prepayment speeds, credit risk, use of amortized cost, etc.) |
| n | | Level 3 – significant unobservable inputs (including the Fund’s own assumptions in determining the fair value of investments) |
| | | | | | |
| Notes to financial statements (unaudited) | | Wells Fargo Advantage Short Duration Government Bond Fund | | | 23 | |
The inputs or methodologies used for valuing investments in securities are not necessarily an indication of the risk associated with investing in those securities.
The following is a summary of the inputs used in valuing the Fund’s assets and liabilities as of February 28, 2015:
| | | | | | | | | | | | | | | | |
| | | Quoted prices
(Level 1) | | | Other significant
observable inputs
(Level 2) | | | Significant
unobservable inputs
(Level 3) | | | Total | |
Assets | | | | | | | | | | | | | | | | |
Investments in : | | | | | | | | | | | | | | | | |
| | | | |
Agency securities | | $ | 0 | | | $ | 436,946,548 | | | $ | 0 | | | $ | 436,946,548 | |
| | | | |
Asset-backed securities | | | 0 | | | | 158,116,113 | | | | 0 | | | | 158,116,113 | |
| | | | |
Non-agency mortgage-backed securities | | | 0 | | | | 60,545,434 | | | | 0 | | | | 60,545,434 | |
| | | | |
U.S. Treasury securities | | | 610,027,901 | | | | 0 | | | | 0 | | | | 610,027,901 | |
| | | | |
Short-term investments | | | | | | | | | | | | | | | | |
Investment companies | | | 49,711,816 | | | | 0 | | | | 0 | | | | 49,711,816 | |
Total assets | | $ | 659,739,717 | | | $ | 655,608,095 | | | $ | 0 | | | $ | 1,315,347,812 | |
The Fund recognizes transfers between levels within the fair value hierarchy at the end of the reporting period. At February 28, 2015, the Fund did not have any transfers into/out of Level 1, Level 2, or Level 3.
4. TRANSACTIONS WITH AFFILIATES
Advisory fee
The Trust has entered into an advisory contract with Funds Management, an indirect wholly owned subsidiary of Wells Fargo & Company (“Wells Fargo”). The adviser is responsible for implementing investment policies and guidelines and for supervising the subadviser, who is responsible for day-to-day portfolio management of the Fund.
Pursuant to the contract, Funds Management is entitled to receive an annual advisory fee starting at 0.30% and declining to 0.225% as the average daily net assets of the Fund increase. For the six months ended February 28, 2015, the advisory fee was equivalent to an annual rate of 0.29% of the Fund’s average daily net assets.
Funds Management has retained the services of a subadviser to provide daily portfolio management to the Fund. The fee for subadvisory services is borne by Funds Management. Wells Capital Management Incorporated, an affiliate of Funds Management and an indirect wholly owned subsidiary of Wells Fargo, is the subadviser to the Fund and is entitled to receive a fee from Funds Management at an annual rate starting at 0.15% and declining to 0.05% as the average daily net assets of the Fund increase.
Administration fees
The Trust has entered into an administration agreement with Funds Management. Under this agreement, for providing administrative services, which includes paying fees and expenses for services provided by the transfer agent, sub-transfer agents, omnibus account servicers and record-keepers, Funds Management is entitled to receive from the Fund an annual fund level administration fee starting at 0.05% and declining to 0.03% as the average daily net assets of the Fund increase and a class level administration fee which is calculated based on the average daily net assets of each class as follows:
| | | | |
| | | Class level
administration fee | |
Class A, Class B, Class C | | | 0.16 | % |
Class R6 | | | 0.03 | |
Administrator Class | | | 0.10 | |
Institutional Class | | | 0.08 | |
Funds Management has contractually waived and/or reimbursed advisory and administration fees to the extent necessary to maintain certain net operating expense ratios for the Fund. Waiver of fees and/or reimbursement of expenses by Funds Management were made first from fund level expenses on a proportionate basis and then from class
| | | | |
| 24 | | Wells Fargo Advantage Short Duration Government Bond Fund | | Notes to financial statements (unaudited) |
specific expenses. Funds Management has committed through December 31, 2015 to waive fees and/or reimburse expenses to the extent necessary to cap the Fund’s expenses at 0.78% for Class A shares, 1.53% for Class B shares, 1.53% for Class C shares, 0.37% for Class R6 shares, 0.60% for Administrator Class shares, and 0.42% for Institutional Class shares. After this time, the cap may be increased or the commitment to maintain the cap may be terminated only with the approval of the Board of Trustees.
Distribution fees
The Trust has adopted a Distribution Plan for Class B and Class C shares of the Fund pursuant to Rule 12b-1 under the 1940 Act. Distribution fees are charged to Class B and Class C shares and paid to Wells Fargo Funds Distributor, LLC (“Funds Distributor”), the principal underwriter, at an annual rate of 0.75% of the average daily net assets of Class B and Class C shares.
In addition, Funds Distributor is entitled to receive the front-end sales charge from the purchase of Class A shares and a contingent deferred sales charge on the redemption of certain shares. Funds Distributor is also entitled to receive the contingent deferred sales charges from redemptions of Class B and Class C shares. For the six months ended February 28, 2015, Funds Distributor received $723 from the sale of Class A shares.
Shareholder servicing fees
The Trust has entered into contracts with one or more shareholder servicing agents, whereby Class A, Class B, Class C, and Administrator Class of the Fund is charged a fee at an annual rate of 0.25% of the average daily net assets of each respective class.
A portion of these total shareholder servicing fees were paid to affiliates of Wells Fargo.
5. INVESTMENT PORTFOLIO TRANSACTIONS
Purchases and sales of investments, excluding short-term securities, for the six months ended February 28, 2015 were as follows:
| | | | | | |
Purchases at cost | | Sales proceeds |
U.S.
government | | Non-U.S.
government | | U.S.
government | | Non-U.S.
government |
| $3,453,663,044 | | $112,985,537 | | $3,425,802,486 | | $105,711,459 |
6. BANK BORROWINGS
The Trust (excluding the money market funds and certain other funds in the Trust) and Wells Fargo Variable Trust are parties to a $150,000,000 revolving credit agreement, whereby the Fund is permitted to use bank borrowings for temporary or emergency purposes, such as to fund shareholder redemption requests. Interest under the credit agreement is charged to the Fund based on a borrowing rate equal to the higher of the Federal Funds rate in effect on that day plus 1.25% or the overnight LIBOR rate in effect on that day plus 1.25%. In addition, an annual commitment fee equal to 0.10% of the unused balance is allocated to each participating fund. For the six months ended February 28, 2015, the Fund paid $715 in commitment fees.
For the six months ended February 28, 2015, there were no borrowings by the Fund under the agreement.
7. INDEMNIFICATION
Under the Trust’s organizational documents, the officers and Trustees are indemnified against certain liabilities that may arise out of performance of their duties to the Trust. Additionally, in the normal course of business, the Trust may enter into contracts with service providers that contain a variety of indemnification clauses. The Trust’s maximum exposure under these arrangements is dependent on future claims that may be made against the Fund and, therefore, cannot be estimated.
| | | | | | |
| Other information (unaudited) | | Wells Fargo Advantage Short Duration Government Bond Fund | | | 25 | |
PROXY VOTING INFORMATION
A description of the policies and procedures that the Fund uses to determine how to vote proxies relating to portfolio securities is available, upon request, by calling 1-800-222-8222, visiting our website at wellsfargoadvantagefunds.com, or visiting the SEC website at sec.gov. Information regarding how the Fund voted proxies relating to portfolio securities during the most recent 12-month period ended June 30 is available on the Fund’s website at wellsfargoadvantagefunds.com or by visiting the SEC website at sec.gov.
PORTFOLIO HOLDINGS INFORMATION
The complete portfolio holdings for the Fund are publicly available monthly on the Fund’s website (wellsfargoadvantagefunds.com), on a one-month delayed basis. In addition, top ten holdings information (excluding derivative positions) for the Fund is publicly available on the Fund’s website on a monthly, seven-day or more delayed basis. The Fund files its complete schedule of portfolio holdings with the SEC for the first and third quarters of each fiscal year on Form N-Q, which is available by visiting the SEC website at sec.gov. In addition, the Fund’s Form N-Q may be reviewed and copied at the SEC’s Public Reference Room in Washington, DC, and at regional offices in New York City, at 233 Broadway, and in Chicago, at 175 West Jackson Boulevard, Suite 900. Information about the Public Reference Room may be obtained by calling 1-800-SEC-0330.
| | | | |
| 26 | | Wells Fargo Advantage Short Duration Government Bond Fund | | Other information (unaudited) |
BOARD OF TRUSTEES AND OFFICERS
Each of the Trustees and Officers1 listed in the table below acts in identical capacities for each fund in the Wells Fargo Advantage family of funds, which consists of 134 mutual funds comprising the Wells Fargo Funds Trust, Wells Fargo Variable Trust, Wells Fargo Master Trust and four closed-end funds (collectively the “Fund Complex”). This table should be read in conjunction with the Prospectus and the Statement of Additional Information2. The mailing address of each Trustee and Officer is 525 Market Street, 12th Floor, San Francisco, CA 94105. Each Trustee and Officer serves an indefinite term, however, each Trustee serves such term until reaching the mandatory retirement age established by the Trustees.
Independent Trustees
| | | | | | |
Name and year of birth | | Position held and length of service* | | Principal occupations during past five years or longer | | Other directorships during past five years |
William R. Ebsworth (Born 1957) | | Trustee, since 2015** | | Retired. From 1984 to 2013, equities analyst, portfolio manager, research director at Fidelity Management and Research Company and retired in 2013 as Chief Investment Officer of Fidelity Strategic Advisers, Inc. in Boston, Tokyo, and Hong Kong where he led a team of investment professionals managing client assets. Prior thereto, Board member of Hong Kong Securities Clearing Co., Hong Kong Options Clearing Corp., the Thailand International Fund, Ltd., Fidelity Investments Life Insurance Company, and Empire Fidelity Investments Life Insurance Company. Mr. Ebsworth is an Adjunct Lecturer, Finance, at Babson College and a Chartered Financial Analyst. | | Asset Allocation Trust |
Jane A. Freeman (Born 1953) | | Trustee, since 2015** | | Retired. From 2012 to 2014 and 1999 to 2008, Chief Financial Officer of Scientific Learning Corporation. From 2008 to 2012, Ms. Freeman provided consulting services related to strategic business projects. Prior thereto, Portfolio Manager at Rockefeller & Co. and Scudder, Stevens & Clark. Board member of the Harding Loevner Funds from 1996 to 2014, serving as both Lead Independent Director and chair of the Audit Committee. Board member of the Russell Exchange Traded Funds Trust from 2011 to 2012 and the chair of the Audit Committee. Ms. Freeman is a Chartered Financial Analyst (inactive), Chair of Taproot Foundation (non-profit organization) and a Board Member of Ruth Bancroft Garden (non-profit organization). | | Asset Allocation Trust |
Peter G. Gordon (Born 1942) | | Trustee, since 1998; Chairman, since 2005 | | Co-Founder, Retired Chairman, President and CEO of Crystal Geyser Water Company. Trustee Emeritus, Colby College. | | Asset Allocation Trust |
Isaiah Harris, Jr. (Born 1952) | | Trustee, since 2009 | | Retired. Chairman of the Board of CIGNA Corporation since 2009, and Director since 2005. From 2003 to 2011, Director of Delux Corporation. Prior thereto, President and CEO of BellSouth Advertising and Publishing Corp. from 2005 to 2007, President and CEO of BellSouth Enterprises from 2004 to 2005 and President of BellSouth Consumer Services from 2000 to 2003. Emeritus member of the Iowa State University Foundation Board of Governors. Emeritus Member of the Advisory Board of Iowa State University School of Business. Advisory Board Member, Palm Harbor Academy. Mr. Harris is a certified public accountant. | | CIGNA Corporation; Asset Allocation Trust |
Judith M. Johnson (Born 1949) | | Trustee, since 2008; Audit Committee Chairman, since 2008 | | Retired. Prior thereto, Chief Executive Officer and Chief Investment Officer of Minneapolis Employees Retirement Fund from 1996 to 2008. Ms. Johnson is an attorney, certified public accountant and a certified managerial accountant. | | Asset Allocation Trust |
David F. Larcker (Born 1950) | | Trustee, since 2009 | | James Irvin Miller Professor of Accounting at the Graduate School of Business, Stanford University, Morgan Stanley Director of the Center for Leadership Development and Research and Senior Faculty of The Rock Center for Corporate Governance since 2006. From 2005 to 2008, Professor of Accounting at the Graduate School of Business, Stanford University. Prior thereto, Ernst & Young Professor of Accounting at The Wharton School, University of Pennsylvania from 1985 to 2005. | | Asset Allocation Trust |
Olivia S. Mitchell (Born 1953) | | Trustee, since 2006 | | International Foundation of Employee Benefit Plans Professor, Wharton School of the University of Pennsylvania since 1993. Director of Wharton’s Pension Research Council and Boettner Center on Pensions & Retirement Research, and Research Associate at the National Bureau of Economic Research. Previously, Cornell University Professor from 1978 to 1993. | | Asset Allocation Trust |
| | | | | | |
| Other information (unaudited) | | Wells Fargo Advantage Short Duration Government Bond Fund | | | 27 | |
| | | | | | |
Name and year of birth | | Position held and length of service* | | Principal occupations during past five years or longer | | Other directorships during past five years |
Timothy J. Penny (Born 1951) | | Trustee, since 1996 | | President and Chief Executive Officer of Southern Minnesota Initiative Foundation, a non-profit organization, since 2007 and Senior Fellow at the Humphrey Institute Policy Forum at the University of Minnesota since 1995. Member of the Board of Trustees of NorthStar Education Finance, Inc., a non-profit organization, since 2007. | | Asset Allocation Trust |
Michael S. Scofield (Born 1943) | | Trustee, since 2010 | | Served on the Investment Company Institute’s Board of Governors and Executive Committee from 2008-2011 as well the Governing Council of the Independent Directors Council from 2006-2011 and the Independent Directors Council Executive Committee from 2008-2011. Chairman of the IDC from 2008-2010. Institutional Investor (Fund Directions) Trustee of Year in 2007. Trustee of the Evergreen Funds complex (and its predecessors) from 1984 to 2010. Chairman of the Evergreen Funds from 2000-2010. Former Trustee of the Mentor Funds. Retired Attorney, Law Offices of Michael S. Scofield. | | Asset Allocation Trust |
Donald C. Willeke (Born 1940) | | Trustee, since 1996 | | Principal of the law firm of Willeke & Daniels. General Counsel of the Minneapolis Employees Retirement Fund from 1984 until its consolidation into the Minnesota Public Employees Retirement Association on June 30, 2010. Director and Vice Chair of The Tree Trust (non-profit corporation). Director of the American Chestnut Foundation (non-profit corporation). | | Asset Allocation Trust |
| * | Length of service dates reflect the Trustee’s commencement of service with the Trust’s predecessor entities, where applicable. |
| ** | William R. Ebsworth and Jane A. Freeman each became a Trustee effective January 1, 2015. |
Officers
| | | | | | |
Name and year of birth | | Position held and length of service | | Principal occupations during past five years or longer | | |
Karla M. Rabusch (Born 1959) | | President, since 2003 | | Executive Vice President of Wells Fargo Bank, N.A. and President of Wells Fargo Funds Management, LLC since 2003. | | |
Nancy Wiser1 (Born 1967) | | Treasurer, since 2012 | | Executive Vice President of Wells Fargo Funds Management, LLC since 2011. Chief Operating Officer and Chief Compliance Officer at LightBox Capital Management LLC, from 2008 to 2011. Owned and operated a consulting business providing services to various hedge funds including acting as Chief Operating Officer and Chief Compliance Officer for a hedge fund from 2007 to 2008. Chief Operating Officer and Chief Compliance Officer of GMN Capital LLC from 2006 to 2007. | | |
C. David Messman (Born 1960) | | Secretary, since 2000; Chief Legal Officer, since 2003 | | Senior Vice President and Secretary of Wells Fargo Funds Management, LLC since 2001. Assistant General Counsel of Wells Fargo Bank, N.A. since 2013 and Vice President and Managing Counsel of Wells Fargo Bank N.A. from 1996 to 2013. | | |
Debra Ann Early (Born 1964) | | Chief Compliance Officer, since 2007 | | Senior Vice President of Wells Fargo Funds Management, LLC since 2007 and Chief Compliance Officer from 2007 to 2014. Chief Compliance Officer of Parnassus Investments from 2005 to 2007. Chief Financial Officer of Parnassus Investments from 2004 to 2007 and Senior Audit Manager of PricewaterhouseCoopers LLP from 1998 to 2004. | | |
David Berardi (Born 1975) | | Assistant Treasurer, since 2009 | | Vice President of Wells Fargo Funds Management, LLC since 2009. Vice President of Evergreen Investment Management Company, LLC from 2008 to 2010. Assistant Vice President of Evergreen Investment Services, Inc. from 2004 to 2008. Manager of Fund Reporting and Control for Evergreen Investment Management Company, LLC from 2004 to 2010. | | |
Jeremy DePalma1 (Born 1974) | | Assistant Treasurer, since 2009 | | Senior Vice President of Wells Fargo Funds Management, LLC since 2009. Senior Vice President of Evergreen Investment Management Company, LLC from 2008 to 2010. Vice President, Evergreen Investment Services, Inc. from 2004 to 2007. Head of the Fund Reporting and Control Team within Fund Administration from 2005 to 2010. | | |
| 1 | Nancy Wiser acts as Treasurer of 73 funds in the Fund Complex. Jeremy DePalma acts as Treasurer of 61 funds and Assistant Treasurer of 73 funds in the Fund Complex. |
| 2 | The Statement of Additional Information includes additional information about the Trustees and is available, without charge, upon request, by calling 1-800-222-8222 or by visiting the website at wellsfargoadvantagefunds.com. |
| | | | |
| 28 | | Wells Fargo Advantage Short Duration Government Bond Fund | | List of abbreviations |
The following is a list of common abbreviations for terms and entities that may have appeared in this report.
| ACA | — ACA Financial Guaranty Corporation |
| ADR | — American depositary receipt |
| ADS | — American depositary shares |
| AGC | — Assured Guaranty Corporation |
| AGM | — Assured Guaranty Municipal |
| Ambac | — Ambac Financial Group Incorporated |
| AMT | — Alternative minimum tax |
| BAN | — Bond anticipation notes |
| BHAC | — Berkshire Hathaway Assurance Corporation |
| CAB | — Capital appreciation bond |
| CCAB | — Convertible capital appreciation bond |
| CDA | — Community Development Authority |
| CDO | — Collateralized debt obligation |
| DRIVER | — Derivative inverse tax-exempt receipts |
| DW&P | — Department of Water & Power |
| DWR | — Department of Water Resources |
| ECFA | — Educational & Cultural Facilities Authority |
| EDA | — Economic Development Authority |
| EDFA | — Economic Development Finance Authority |
| ETF | — Exchange-traded fund |
| FDIC | — Federal Deposit Insurance Corporation |
| FFCB | — Federal Farm Credit Banks |
| FGIC | — Financial Guaranty Insurance Corporation |
| FHA | — Federal Housing Administration |
| FHLB | — Federal Home Loan Bank |
| FHLMC | — Federal Home Loan Mortgage Corporation |
| FICO | — The Financing Corporation |
| FNMA | — Federal National Mortgage Association |
| GDR | — Global depositary receipt |
| GNMA | — Government National Mortgage Association |
| HCFR | — Healthcare facilities revenue |
| HEFA | — Health & Educational Facilities Authority |
| HEFAR | — Higher education facilities authority revenue |
| HFA | — Housing Finance Authority |
| HFFA | — Health Facilities Financing Authority |
| HUD | — Department of Housing and Urban Development |
| IDA | — Industrial Development Authority |
| IDAG | — Industrial Development Agency |
| KRW | — Republic of Korea won |
| LIBOR | — London Interbank Offered Rate |
| LIFER | — Long Inverse Floating Exempt Receipts |
| LLC | — Limited liability company |
| LLLP | — Limited liability limited partnership |
| LLP | — Limited liability partnership |
| MBIA | — Municipal Bond Insurance Association |
| MFHR | — Multifamily housing revenue |
| MSTR | — Municipal securities trust receipts |
| MUD | — Municipal Utility District |
| National | — National Public Finance Guarantee Corporation |
| PCFA | — Pollution Control Financing Authority |
| PCL | — Public Company Limited |
| PCR | — Pollution control revenue |
| PFA | — Public Finance Authority |
| PFFA | — Public Facilities Financing Authority |
| PFOTER | — Puttable floating option tax-exempt receipts |
| plc | — Public limited company |
| PUTTER | — Puttable tax-exempt receipts |
| R&D | — Research & development |
| Radian | — Radian Asset Assurance |
| RAN | — Revenue anticipation notes |
| RDA | — Redevelopment Authority |
| RDFA | — Redevelopment Finance Authority |
| REIT | — Real estate investment trust |
| ROC | — Reset option certificates |
| SAVRS | — Select auction variable rate securities |
| SBA | — Small Business Authority |
| SFHR | — Single-family housing revenue |
| SFMR | — Single-family mortgage revenue |
| SPA | — Standby purchase agreement |
| SPDR | — Standard & Poor’s Depositary Receipts |
| SPEAR | — Short Puttable Exempt Adjustable Receipts |
| STRIPS | — Separate trading of registered interest and |
| TAN | — Tax anticipation notes |
| TIPS | — Treasury inflation-protected securities |
| TRAN | — Tax revenue anticipation notes |
| TTFA | — Transportation Trust Fund Authority |
| TVA | — Tennessee Valley Authority |


For more information
More information about Wells Fargo Advantage Funds is available free upon request. To obtain literature, please write, email, visit the Fund’s website, or call:
Wells Fargo Advantage Funds
P.O. Box 8266
Boston, MA 02266-8266
Email: wfaf@wellsfargo.com
Website: wellsfargoadvantagefunds.com
Individual investors: 1-800-222-8222
Retail investment professionals: 1-888-877-9275
Institutional investment professionals: 1-866-765-0778
This report and the financial statements contained herein are submitted for the general information of the shareholders of Wells Fargo Advantage Funds. If this report is used for promotional purposes, distribution of the report must be accompanied or preceded by a current prospectus. Before investing, please consider the investment objectives, risks, charges, and expenses of the investment. For a current prospectus and, if available, a summary prospectus, containing this information, call 1-800-222-8222 or visit the Fund’s website at wellsfargoadvantagefunds.com. Read the prospectus carefully before you invest or send money.
Wells Fargo Funds Management, LLC, a wholly owned subsidiary of Wells Fargo & Company, provides investment advisory and administrative services for Wells Fargo Advantage Funds. Other affiliates of Wells Fargo & Company provide subadvisory and other services for the Funds. The Funds are distributed by Wells Fargo Funds Distributor, LLC, Member FINRA/SIPC, an affiliate of Wells Fargo & Company.
NOT FDIC INSURED ¡ NO BANK GUARANTEE ¡ MAY LOSE VALUE
© 2015 Wells Fargo Funds Management, LLC. All rights reserved.
| | |
 | | 232057 04-15 SA220/SAR220 02-15 |

Wells Fargo Advantage Short-Term Bond Fund

Semi-Annual Report
February 28, 2015

Reduce clutter. Save trees.
Sign up for electronic delivery of prospectuses and shareholder reports at wellsfargo.com/advantagedelivery
Contents
The views expressed and any forward-looking statements are as of February 28, 2015, unless otherwise noted, and are those of the Fund managers and/or Wells Fargo Funds Management, LLC. Discussions of individual securities, or the markets generally, or any Wells Fargo Advantage Fund are not intended as individual recommendations. Future events or results may vary significantly from those expressed in any forward-looking statements; the views expressed are subject to change at any time in response to changing circumstances in the market. Wells Fargo Funds Management, LLC and the Fund disclaim any obligation to publicly update or revise any views expressed or forward-looking statements.
NOT FDIC INSURED ¡ NO BANK GUARANTEE ¡ MAY LOSE VALUE
| | | | |
| 2 | | Wells Fargo Advantage Short-Term Bond Fund | | Letter to shareholders (unaudited) |

Karla M. Rabusch
President
Wells Fargo Advantage Funds
Major central banks continued to inject liquidity into global banks and markets through various accommodative monetary policies, including quantitative easing.
Dear Valued Shareholder:
We are pleased to offer you this semi-annual report for the Wells Fargo Advantage Short-Term Bond Fund for the six-month period that ended February 28, 2015. The period was marked by low interest rates, a large decline in oil prices, and moderate U.S. economic growth. Investment-grade bonds, as measured by the Barclays U.S. Aggregate Bond Index1, returned 2.25% during the period.
Major central banks continued to provide stimulus.
Major central banks continued to inject liquidity into global banks and markets through various accommodative monetary policies, including quantitative easing. In the U.S., the Federal Reserve (Fed) kept its key interest rate near zero in order to support the economy and the financial system. It ended its quantitative easing program in October 2014 and also set expectations for it to begin normalizing monetary policy with higher target ranges for the federal funds rate in 2015.
Meanwhile, European markets continued to benefit from the European Central Bank’s (ECB’s) willingness to maintain low interest rates. In September 2014, the ECB cut its key rate to a historic low of 0.05%. In addition to its targeted longer-term refinancing operations that are designed to increase bank lending, the ECB said it intends to increase the size of its balance sheet, a result of quantitative easing, by buying eurozone government bonds. In Japan, the Bank of Japan maintained an aggressive monetary program aimed at combating deflation.
U.S. economic growth was moderate, and oil prices plummeted.
Economic growth advanced during the reporting period, the unemployment rate ticked lower to 5.5% as of February 2015, and inflation remained below the Fed’s longer-run objective of a 2% pace. The period was also marked by dramatically lower oil prices, which fell from more than $90 per barrel at the end of August 2014 to below $50 per barrel at the end of February 2015. While lower oil prices benefited consumers of oil products, the lower prices pressured companies within the energy sector.
Longer-dated securities and higher-rated credits were top performers.
Ten-year U.S. Treasury rates declined during the period, from 2.35% at end of August 2014 to 2.03% by the end of February 2015, benefiting both from safe-haven status as well as relative attractiveness to global investors. With the U.S. economy the furthest along its business cycle, the level of interest rates in the U.S. and Europe diverged. The 10-year U.S. Treasury yield was 2.03% at the end of February 2015 compared with 0.30% for 10-year German government yields, 173 basis points (bps; 100 bps equals 1.00%) higher. This was largely attributed to the Fed being closer to eventually increasing interest rates while the ECB potentially needs to further increase, rather than scale back, its amount of accommodation. Further, U.S. economic activity was healthier than Europe’s.
Treasury bonds with maturities greater than 20 years returned more than 10% during the six-month period that ended February 28, 2015, according to the Barclays U.S. Aggregate Bond Index. This was due, in part, to strong demand from overseas investors because yields in Europe and Japan were substantially lower than U.S. yields. In addition, because the dollar strengthened, the returns from
| 1 | The Barclays U.S. Aggregate Bond Index is a broad-based benchmark that measures the investment-grade, U.S. dollar-denominated, fixed-rate taxable bond market, including Treasuries, government-related and corporate securities, MBS (agency fixed-rate and hybrid ARM passthroughs), ABS, and CMBS. You cannot invest directly in an index. |
| | | | | | |
| Letter to shareholders (unaudited) | | Wells Fargo Advantage Short-Term Bond Fund | | | 3 | |
Treasuries were even higher for foreign-domiciled investors. Longer-maturity debt across all sectors outperformed shorter-dated securities.
Investment-grade corporate bonds returned 2.29% during the six-month reporting period, according to the Barclays U.S. Aggregate Bond Index, and AAA-rated2 bonds had higher returns than BBB-rated bonds. Lower-rated credits, including high yield, underperformed as oil prices fell dramatically. Not only were many energy and mining companies negatively affected, but investor trepidation about weak global growth caused investment-grade spreads to modestly widen while high-yield spreads widened substantially.
Don’t let short-term uncertainty derail long-term investment goals.
Periods of uncertainty can present challenges, but experience has taught us that maintaining long-term investment goals can be an effective way to plan for the future. To help you create a sound strategy based on your personal goals and risk tolerance, Wells Fargo Advantage Funds offers more than 100 mutual funds and other investments spanning a wide range of asset classes and investment styles. Although diversification cannot guarantee an investment profit or prevent losses, we believe it can be an effective way to manage investment risk and potentially smooth out overall portfolio performance. We encourage investors to know their investments and to understand that appropriate levels of risk-taking may unlock opportunities.
Thank you for choosing to invest with Wells Fargo Advantage Funds. We appreciate your confidence in us and remain committed to helping you meet your financial needs. For current information about your fund investments, contact your investment professional, visit our website at wellsfargoadvantagefunds.com, or call us directly at 1-800-222-8222. We are available 24 hours a day, 7 days a week.
Sincerely,

Karla M. Rabusch
President
Wells Fargo Advantage Funds
Periods of uncertainty can present challenges, but experience has taught us that maintaining long-term investment goals can be an effective way to plan for the future.
| 2 | The ratings indicated are from Standard & Poor’s, Moody’s Investors Service, and/or Fitch Ratings Ltd. Standard & Poor’s rates the creditworthiness of bonds from AAA (highest) to D (lowest). Ratings from A to CCC may be modified by the addition of a plus (+) or minus (-) sign to show relative standing within the rating categories. Moody’s rates the creditworthiness of bonds from Aaa (highest) to C (lowest). Ratings Aa to B may be modified by the addition of a number 1 (highest) to 3 (lowest) to show relative standing within the ratings categories. Fitch rates the creditworthiness of bonds from AAA (highest) to D (lowest). |
| | | | |
| 4 | | Wells Fargo Advantage Short-Term Bond Fund | | Performance highlights (unaudited) |
Investment objective
The Fund seeks current income consistent with capital preservation.
Adviser
Wells Fargo Funds Management, LLC
Subadviser
Wells Capital Management Incorporated
Portfolio managers
Christopher Y. Kauffman, CFA
Jay N. Mueller, CFA
Noah Wise, CFA
Average annual total returns1 (%) as of February 28, 2015
| | | | | | | | | | | | | | | | | | | | | | | | | | | | | | | | | | |
| | | | | Including sales charge | | | Excluding sales charge | | | Expense ratios2 (%) | |
| | | Inception date | | 1 year | | | 5 year | | | 10 year | | | 1 year | | | 5 year | | | 10 year | | | Gross | | | Net3 | |
| Class A (SSTVX) | | 8-31-1999 | | | (1.08 | ) | | | 1.48 | | | | 2.89 | | | | 0.94 | | | | 1.89 | | | | 3.09 | | | | 0.81 | | | | 0.73 | |
| Class C (WFSHX) | | 3-31-2008 | | | (0.81 | ) | | | 1.13 | | | | 2.31 | | | | 0.19 | | | | 1.13 | | | | 2.31 | | | | 1.56 | | | | 1.48 | |
| Institutional Class (SSHIX) | | 8-31-1999 | | | – | | | | – | | | | – | | | | 1.24 | | | | 2.21 | | | | 3.42 | | | | 0.48 | | | | 0.48 | |
| Investor Class (SSTBX) | | 8-31-1987 | | | – | | | | – | | | | – | | | | 0.93 | | | | 1.89 | | | | 3.06 | | | | 0.84 | | | | 0.74 | |
| Barclays 1-3 Year Government/Credit Index4 | | – | | | – | | | | – | | | | – | | | | 0.80 | | | | 1.28 | | | | 2.91 | | | | – | | | | – | |
Figures quoted represent past performance, which is no guarantee of future results, and do not reflect taxes that a shareholder may pay on fund distributions or the redemption of fund shares. Investment return and principal value of an investment will fluctuate so that an investor’s shares, when redeemed, may be worth more or less than their original cost. Performance shown without sales charges would be lower if sales charges were reflected. Current performance may be lower or higher than the performance data quoted, which assumes the reinvestment of dividends and capital gains. Current month-end performance is available on the Fund’s website, wellsfargoadvantagefunds.com.
Index returns do not include transaction costs associated with buying and selling securities, any mutual fund fees or expenses, or any taxes. It is not possible to invest directly in an index.
For Class A shares, the maximum front-end sales charge is 2.00%. For Class C shares, the maximum contingent deferred sales charge is 1.00%. Performance including a contingent deferred sales charge assumes the sales charge for the corresponding time period. Institutional Class and Investor Class shares are sold without a front-end sales charge or contingent deferred sales charge.
Bond values fluctuate in response to the financial condition of individual issuers, general market and economic conditions, and changes in interest rates. Changes in market conditions and government policies may lead to periods of heightened volatility in the bond market and reduced liquidity for certain bonds held by the Fund. In general, when interest rates rise, bond values fall and investors may lose principal value. Interest-rate changes and their impact on the Fund and its share price can be sudden and unpredictable. Loans are subject to risks similar to those associated with other below-investment-grade bond investments, such as credit risk (for example, risk of issuer default), below-investment-grade bond risk (for example, risk of greater volatility in value), and risk that the loan may become illiquid or difficult to price. The use of derivatives may reduce returns and/or increase volatility. Certain investment strategies tend to increase the total risk of an investment (relative to the broader market). The Fund is exposed to foreign investment risk, high-yield securities risk, and mortgage- and asset-backed securities risk. Consult the Fund’s prospectus for additional information on these and other risks.
Please see footnotes on page 5.
| | | | | | |
| Performance highlights (unaudited) | | Wells Fargo Advantage Short-Term Bond Fund | | | 5 | |
| | | | |
| Ten largest long-term holdings5 (%) as of February 28, 2015 | |
Chase Issuance Trust Series 2012-A5 Class A5,
0.59%, 8-15-2017 | | | 0.81 | |
JPMorgan Chase Commercial Mortgage Securities Corporation Series 2014-INN Class A, 1.09%, 6-15-2029 | | | 0.74 | |
Nissan Auto Lease Trust Series 2014-B Class A2A,
0.73%, 4-17-2017 | | | 0.73 | |
GNMA Series 2012-19 Class A, 1.83%, 3-16-2039 | | | 0.70 | |
U.S. Treasury Note, 1.38%, 2-28-2019 | | | 0.68 | |
Port Arthur TX Navigation District Jefferson County Environmental Facilities Motiva Enterprises LLC Project Series D, 0.09%, 11-1-2040 | | | 0.67 | |
Volvo Financial Equipment LLC Series 2014-1A Class A2, 0.54%, 11-15-2016 | | | 0.66 | |
Murray Street Investment Trust I, 4.65%, 3-9-2017 | | | 0.63 | |
Bear Stearns Companies Incorporated, 5.55%, 1-22-2017 | | | 0.62 | |
Deutsche Annington Finance BV, 3.20%, 10-2-2017 | | | 0.61 | |
|
| Portfolio allocation6 as of February 28, 2015 |
|
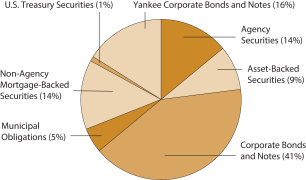 |
| 1 | Effective June 20, 2008, Advisor Class was renamed Class A and modified to assume the features and attributes of Class A. Historical performance shown for Class A shares through June 19, 2008, includes Advisor Class expenses. Historical performance shown for Class C shares prior to their inception reflects the performance of Investor Class shares, adjusted to include the higher expenses applicable to Class C shares. |
| 2 | Reflects the expense ratios as stated in the most recent prospectuses, which include the impact of 0.01% in acquired fund fees and expenses. The expense ratios shown are subject to change and may differ from the annualized expense ratios shown in the financial highlights of this report, which do not include acquired fund fees and expenses. |
| 3 | The Adviser has committed through December 31, 2015, to waive fees and/or reimburse expenses to the extent necessary to cap the Fund’s Total Annual Fund Operating Expenses After Fee Waiver, excluding certain expenses, at 0.72% for Class A, 1.47% for Class C, 0.48% for Institutional Class, and 0.73% for Investor Class. After this time, the cap may be increased or the commitment to maintain the cap may be terminated only with the approval of the Board of Trustees. Brokerage commissions, stamp duty fees, interest, taxes, acquired fund fees and expenses, and extraordinary expenses are excluded from the cap. Without this cap, the Fund’s returns would have been lower. |
| 4 | The Barclays 1-3 Year Government/Credit Index is the one- to three-year component of the Barclays Government/Credit Bond Index which includes securities in the Government and Credit Indices. The Government Index includes Treasuries (that is, public obligations of the U.S. Treasury that have remaining maturities of more than one year) and agencies (that is, publicly issued debt of U.S. Government agencies, quasi-federal corporations, and corporate or foreign debt guaranteed by the U.S. Government). The Credit Index includes publicly issued U.S. corporate and foreign debentures and secured notes that meet specified maturity, liquidity, and quality requirements. You cannot invest directly in an index. |
| 5 | The ten largest long-term holdings are calculated based on the value of the securities divided by total net assets of the Fund. Holdings are subject to change and may have changed since the date specified. |
| 6 | Amounts are calculated based on the total long-term investments of the Fund. These percentages are subject to change and may have changed since the date specified. |
| | | | |
| 6 | | Wells Fargo Advantage Short-Term Bond Fund | | Fund expenses (unaudited) |
As a shareholder of the Fund, you incur two types of costs: (1) transaction costs, including sales charges (loads) on purchase payments and contingent deferred sales charges (if any) on redemptions and (2) ongoing costs, including management fees, distribution (12b-1) and/or shareholder service fees, and other Fund expenses. This example is intended to help you understand your ongoing costs (in dollars) of investing in the Fund and to compare these costs with the ongoing costs of investing in other mutual funds.
The example is based on an investment of $1,000 invested at the beginning of the six-month period and held for the
entire period from September 1, 2014 to February 28, 2015.
Actual expenses
The “Actual” line of the table below provides information about actual account values and actual expenses. You may use the information in this line, together with the amount you invested, to estimate the expenses that you paid over the period. Simply divide your account value by $1,000 (for example, an $8,600 account value divided by $1,000 = 8.6), then multiply the result by the number in the “Actual” line under the heading entitled “Expenses paid during period” for your applicable class of shares to estimate the expenses you paid on your account during this period.
Hypothetical example for comparison purposes
The “Hypothetical” line of the table below provides information about hypothetical account values and hypothetical expenses based on the Fund’s actual expense ratio and an assumed rate of return of 5% per year before expenses, which is not the Fund’s actual return. The hypothetical account values and expenses may not be used to estimate the actual ending account balance or expenses you paid for the period. You may use this information to compare the ongoing costs of investing in the Fund and other funds. To do so, compare this 5% hypothetical example with the 5% hypothetical examples that appear in the shareholder reports of the other funds.
Please note that the expenses shown in the table are meant to highlight your ongoing costs only and do not reflect any transactional costs, such as sales charges (loads) and contingent deferred sales charges. Therefore, the “Hypothetical” line of the table is useful in comparing ongoing costs only and will not help you determine the relative total costs of owning different funds. In addition, if these transactional costs were included, your costs would have been higher.
| | | | | | | | | | | | | | | | |
| | | Beginning
account value
9-1-2014 | | | Ending
account value
2-28-2015 | | | Expenses
paid during
the period¹ | | | Net annualized
expense ratio | |
Class A | | | | | | | | | | | | | | | | |
Actual | | $ | 1,000.00 | | | $ | 1,003.76 | | | $ | 3.73 | | | | 0.75 | % |
Hypothetical (5% return before expenses) | | $ | 1,000.00 | | | $ | 1,021.08 | | | $ | 3.76 | | | | 0.75 | % |
Class C | | | | | | | | | | | | | | | | |
Actual | | $ | 1,000.00 | | | $ | 1,000.05 | | | $ | 7.44 | | | | 1.50 | % |
Hypothetical (5% return before expenses) | | $ | 1,000.00 | | | $ | 1,017.36 | | | $ | 7.50 | | | | 1.50 | % |
Institutional Class | | | | | | | | | | | | | | | | |
Actual | | $ | 1,000.00 | | | $ | 1,004.06 | | | $ | 2.29 | | | | 0.46 | % |
Hypothetical (5% return before expenses) | | $ | 1,000.00 | | | $ | 1,022.51 | | | $ | 2.31 | | | | 0.46 | % |
Investor Class | | | | | | | | | | | | | | | | |
Actual | | $ | 1,000.00 | | | $ | 1,003.72 | | | $ | 3.78 | | | | 0.76 | % |
Hypothetical (5% return before expenses) | | $ | 1,000.00 | | | $ | 1,021.03 | | | $ | 3.81 | | | | 0.76 | % |
| 1 | Expenses paid is equal to the annualized expense ratio of each class multiplied by the average account value over the period, multiplied by the number of days in the most recent fiscal half-year divided by the number of days in the fiscal year (to reflect the one-half-year period). |
| | | | | | |
| Portfolio of investments—February 28, 2015 (unaudited) | | Wells Fargo Advantage Short-Term Bond Fund | | | 7 | |
| | | | | | | | | | | | | | | | |
| Security name | | Interest rate | | | Maturity date | | | Principal | | | Value | |
| | | | |
Agency Securities: 12.15% | | | | | | | | | | | | | | | | |
FDIC Series 2010-R1 Class A 144A | | | 2.18 | % | | | 5-25-2050 | | | $ | 2,459,808 | | | $ | 2,480,795 | |
FDIC Series 2013-R1 Class A 144A | | | 1.15 | | | | 3-25-2033 | | | | 1,676,876 | | | | 1,665,374 | |
FHLMC ± | | | 2.38 | | | | 4-1-2032 | | | | 59,632 | | | | 63,255 | |
FHLMC ± | | | 2.41 | | | | 9-1-2031 | | | | 7,104 | | | | 7,256 | |
FHLMC ± | | | 2.53 | | | | 7-1-2029 | | | | 4,998 | | | | 5,216 | |
FHLMC ± | | | 2.90 | | | | 5-1-2026 | | | | 105,404 | | | | 111,070 | |
FHLMC | | | 3.00 | | | | 2-15-2024 | | | | 1,293,668 | | | | 1,338,908 | |
FHLMC | | | 3.50 | | | | 6-15-2038 | | | | 1,340,789 | | | | 1,407,074 | |
FHLMC | | | 4.50 | | | | 5-15-2018 | | | | 199,268 | | | | 208,817 | |
FHLMC | | | 4.50 | | | | 7-15-2022 | | | | 31,510 | | | | 31,535 | |
FHLMC | | | 5.00 | | | | 10-15-2032 | | | | 416,873 | | | | 430,756 | |
FHLMC | | | 6.00 | | | | 10-1-2021 | | | | 550,546 | | | | 604,940 | |
FHLMC | | | 8.50 | | | | 9-1-2017 | | | | 68,764 | | | | 71,263 | |
FHLMC | | | 9.00 | | | | 8-1-2018 | | | | 55,219 | | | | 58,239 | |
FHLMC | | | 9.00 | | | | 6-1-2019 | | | | 58,105 | | | | 61,946 | |
FHLMC | | | 9.00 | | | | 10-1-2019 | | | | 157,193 | | | | 171,821 | |
FHLMC | | | 9.50 | | | | 12-1-2022 | | | | 119,253 | | | | 129,689 | |
FHLMC | | | 10.50 | | | | 1-1-2016 | | | | 538 | | | | 545 | |
FHLMC | | | 10.50 | | | | 11-1-2017 | | | | 499 | | | | 538 | |
FHLMC | | | 10.50 | | | | 8-1-2018 | | | | 46,971 | | | | 50,920 | |
FHLMC | | | 10.50 | | | | 2-1-2019 | | | | 989 | | | | 1,100 | |
FHLMC | | | 10.50 | | | | 4-1-2019 | | | | 418 | | | | 454 | |
FHLMC | | | 10.50 | | | | 5-1-2019 | | | | 462 | | | | 513 | |
FHLMC | | | 10.50 | | | | 6-1-2019 | | | | 2,482 | | | | 2,740 | |
FHLMC | | | 10.50 | | | | 7-1-2019 | | | | 986 | | | | 1,101 | |
FHLMC Series 2597 Series AE | | | 5.50 | | | | 4-15-2033 | | | | 334,572 | | | | 367,515 | |
FHLMC Series 2631 Class LC | | | 4.50 | | | | 6-15-2018 | | | | 448,775 | | | | 470,279 | |
FHLMC Series 2642 Class AR | | | 4.50 | | | | 7-15-2023 | | | | 461,274 | | | | 499,016 | |
FHLMC Series 2656 Class BG | | | 5.00 | | | | 10-15-2032 | | | | 1,564,818 | | | | 1,637,953 | |
FHLMC Series 2835 Class NG | | | 5.50 | | | | 7-15-2033 | | | | 50,349 | | | | 50,338 | |
FHLMC Series 2958 Class QD | | | 4.50 | | | | 4-15-2020 | | | | 1,505,226 | | | | 1,571,141 | |
FHLMC Series 3117 Class PL | | | 5.00 | | | | 8-15-2034 | | | | 451,275 | | | | 454,582 | |
FHLMC Series 3656 Class BH | | | 3.00 | | | | 12-15-2019 | | | | 1,724,659 | | | | 1,743,708 | |
FHLMC Series 3778 Class BM | | | 3.50 | | | | 8-15-2028 | | | | 607,529 | | | | 626,908 | |
FHLMC Series 3794 Class LK | | | 3.00 | | | | 2-15-2024 | | | | 2,088,929 | | | | 2,132,005 | |
FHLMC Series 3855 Class HL | | | 3.50 | | | | 2-15-2026 | | | | 471,213 | | | | 489,605 | |
FHLMC Series 3920 Class AB | | | 3.00 | | | | 9-15-2025 | | | | 1,222,719 | | | | 1,262,135 | |
FHLMC Series T-42 Class A6 | | | 9.50 | | | | 2-25-2042 | | | | 503,691 | | | | 623,373 | |
FHLMC Series T-57 Class 2A1 ± | | | 3.26 | | | | 7-25-2043 | | | | 25,200 | | | | 26,134 | |
FHLMC Series T-59 Class 2A1 ± | | | 2.93 | | | | 10-25-2043 | | | | 1,177,067 | | | | 1,225,783 | |
FNMA ± | | | 2.31 | | | | 11-1-2031 | | | | 68,196 | | | | 71,661 | |
FNMA | | | 2.73 | | | | 10-1-2017 | | | | 3,026,703 | | | | 3,132,093 | |
FNMA | | | 2.93 | | | | 12-1-2017 | | | | 2,360,499 | | | | 2,456,679 | |
FNMA | | | 3.34 | | | | 4-1-2016 | | | | 957,969 | | | | 978,284 | |
FNMA | | | 3.34 | | | | 9-1-2017 | | | | 1,405,410 | | | | 1,472,394 | |
FNMA | | | 3.50 | | | | 10-1-2023 | | | | 1,575,681 | | | | 1,673,560 | |
FNMA | | | 3.50 | | | | 11-1-2023 | | | | 936,357 | | | | 994,569 | |
FNMA | | | 3.69 | | | | 6-1-2017 | | | | 3,336,735 | | | | 3,525,584 | |
FNMA | | | 3.74 | | | | 5-1-2018 | | | | 2,252,774 | | | | 2,399,539 | |
FNMA | | | 4.00 | | | | 5-25-2019 | | | | 384,239 | | | | 406,227 | |
The accompanying notes are an integral part of these financial statements.
| | | | |
| 8 | | Wells Fargo Advantage Short-Term Bond Fund | | Portfolio of investments—February 28, 2015 (unaudited) |
| | | | | | | | | | | | | | | | |
| Security name | | Interest rate | | | Maturity date | | | Principal | | | Value | |
| | | | |
Agency Securities (continued) | | | | | | | | | | | | | | | | |
FNMA | | | 4.00 | % | | | 12-15-2024 | | | $ | 608,269 | | | $ | 635,272 | |
FNMA | | | 4.00 | | | | 6-25-2026 | | | | 1,436,630 | | | | 1,535,121 | |
FNMA | | | 4.00 | | | | 8-25-2037 | | | | 1,285,452 | | | | 1,320,760 | |
FNMA | | | 4.44 | | | | 9-1-2015 | | | | 1,682,193 | | | | 1,717,469 | |
FNMA | | | 5.00 | | | | 1-15-2022 | | | | 1,646,185 | | | | 1,742,112 | |
FNMA | | | 5.00 | | | | 3-25-2034 | | | | 287,070 | | | | 290,680 | |
FNMA | | | 5.09 | | | | 2-1-2016 | | | | 855,655 | | | | 876,147 | |
FNMA | | | 5.24 | | | | 1-1-2018 | | | | 1,762,204 | | | | 1,836,125 | |
FNMA | | | 5.50 | | | | 8-25-2034 | | | | 2,365,332 | | | | 2,487,208 | |
FNMA | | | 6.00 | | | | 4-1-2021 | | | | 775,899 | | | | 818,861 | |
FNMA | | | 6.00 | | | | 3-1-2033 | | | | 843,555 | | | | 972,620 | |
FNMA | | | 6.28 | | | | 11-1-2018 | | | | 610,876 | | | | 626,363 | |
FNMA | | | 6.50 | | | | 8-1-2031 | | | | 484,100 | | | | 576,084 | |
FNMA | | | 7.60 | | | | 8-1-2018 | | | | 199,829 | | | | 215,939 | |
FNMA | | | 8.00 | | | | 4-1-2017 | | | | 91,298 | | | | 95,440 | |
FNMA | | | 8.00 | | | | 9-1-2019 | | | | 62,932 | | | | 66,624 | |
FNMA | | | 8.00 | | | | 9-1-2023 | | | | 8,483 | | | | 9,079 | |
FNMA | | | 8.33 | | | | 7-15-2020 | | | | 26,640 | | | | 29,330 | |
FNMA | | | 8.50 | | | | 7-1-2018 | | | | 46,044 | | | | 48,677 | |
FNMA | | | 8.50 | | | | 2-1-2023 | | | | 42,377 | | | | 44,550 | |
FNMA | | | 9.00 | | | | 2-15-2020 | | | | 1,160 | | | | 1,330 | |
FNMA | | | 9.00 | | | | 11-1-2024 | | | | 96,859 | | | | 108,354 | |
FNMA | | | 11.00 | | | | 10-15-2020 | | | | 21,637 | | | | 22,152 | |
FNMA | | | 12.00 | | | | 3-1-2017 | | | | 553 | | | | 555 | |
FNMA Grantor Trust Series 2002-T12 Class A4 | | | 9.50 | | | | 5-25-2042 | | | | 790,783 | | | | 989,792 | |
FNMA Series 1989-29 Class Z | | | 10.00 | | | | 6-25-2019 | | | | 88,192 | | | | 98,841 | |
FNMA Series 1989-63 Class Z | | | 9.40 | | | | 10-25-2019 | | | | 45,753 | | | | 49,341 | |
FNMA Series 2002-T1 Class A4 | | | 9.50 | | | | 11-25-2031 | | | | 68,938 | | | | 84,187 | |
FNMA Series 2003-15 Class CB | | | 5.00 | | | | 3-25-2018 | | | | 900,411 | | | | 940,065 | |
FNMA Series 2003-41 Class PE | | | 5.50 | | | | 5-25-2023 | | | | 1,316,621 | | | | 1,426,355 | |
FNMA Series 2003-W11 Class A1 ± | | | 3.46 | | | | 6-25-2033 | | | | 17,103 | | | | 17,932 | |
FNMA Series 2003-W6 Class 6A ± | | | 3.09 | | | | 8-25-2042 | | | | 1,271,785 | | | | 1,375,284 | |
FNMA Series 2003-W6 Class PT4 ± | | | 8.82 | | | | 10-25-2042 | | | | 108,737 | | | | 128,872 | |
FNMA Series 2004-90 Class XY | | | 4.00 | | | | 9-25-2034 | | | | 847,664 | | | | 883,948 | |
FNMA Series 2004-W6 Class 1A4 | | | 5.50 | | | | 7-25-2034 | | | | 310,059 | | | | 311,254 | |
FNMA Series 2006-48 Class TD | | | 5.50 | | | | 12-25-2034 | | | | 384,960 | | | | 391,311 | |
FNMA Series 2008-53 Class CA | | | 5.00 | | | | 7-25-2023 | | | | 1,055,790 | | | | 1,121,791 | |
FNMA Series 2011-133 Class A | | | 3.50 | | | | 6-25-2029 | | | | 1,884,631 | | | | 1,964,866 | |
FNMA Series 2011-17 Class ED | | | 3.50 | | | | 7-25-2025 | | | | 490,883 | | | | 509,470 | |
FNMA Series 2011-39 Class CA | | | 3.00 | | | | 5-25-2024 | | | | 482,146 | | | | 493,405 | |
FNMA Series 2011-66 Class BE | | | 3.00 | | | | 3-25-2025 | | | | 1,103,148 | | | | 1,131,394 | |
FNMA Series 2011-71 Class DJ | | | 3.00 | | | | 3-25-2025 | | | | 2,194,854 | | | | 2,252,634 | |
FNMA Series G95-2 Class IO ±(c) | | | 10.00 | | | | 5-25-2020 | | | | 117,296 | | | | 5,141 | |
GNMA | | | 4.00 | | | | 8-16-2023 | | | | 680,237 | | | | 714,418 | |
GNMA | | | 4.50 | | | | 4-20-2035 | | | | 623,242 | | | | 661,706 | |
GNMA | | | 8.00 | | | | 12-15-2023 | | | | 34,578 | | | | 40,324 | |
GNMA | | | 9.00 | | | | 11-15-2017 | | | | 25,640 | | | | 27,051 | |
GNMA | | | 9.00 | | | | 11-15-2024 | | | | 24,585 | | | | 28,310 | |
GNMA | | | 10.00 | | | | 2-20-2018 | | | | 6,693 | | | | 7,172 | |
GNMA | | | 12.50 | | | | 4-15-2019 | | | | 2,108 | | | | 2,118 | |
The accompanying notes are an integral part of these financial statements.
| | | | | | |
| Portfolio of investments—February 28, 2015 (unaudited) | | Wells Fargo Advantage Short-Term Bond Fund | | | 9 | |
| | | | | | | | | | | | | | | | |
| Security name | | Interest rate | | | Maturity date | | | Principal | | | Value | |
| | | | |
Agency Securities (continued) | | | | | | | | | | | | | | | | |
GNMA Series 2008-36 Class AN | | | 4.25 | % | | | 10-16-2022 | | | $ | 641,321 | | | $ | 659,293 | |
GNMA Series 2008-36 Class NA | | | 4.25 | | | | 10-16-2022 | | | | 1,349,645 | | | | 1,386,930 | |
GNMA Series 2010-6 Class EA | | | 4.00 | | | | 9-16-2023 | | | | 738,434 | | | | 768,981 | |
GNMA Series 2010-89 Class DG | | | 3.00 | | | | 12-20-2035 | | | | 1,503,841 | | | | 1,524,443 | |
GNMA Series 2011-82 Class HT | | | 2.00 | | | | 7-16-2036 | | | | 339,599 | | | | 343,428 | |
GNMA Series 2012-19 Class A | | | 1.83 | | | | 3-16-2039 | | | | 4,630,058 | | | | 4,674,562 | |
| | | | |
Total Agency Securities (Cost $79,303,205) | | | | | | | | | | | | | | | 80,288,401 | |
| | | | | | | | | | | | | | | | |
| | | | |
Asset-Backed Securities: 8.09% | | | | | | | | | | | | | | | | |
ASG Resecuritization Trust Series 2009-4 Class A60 144A | | | 6.00 | | | | 6-28-2037 | | | | 329,554 | | | | 333,451 | |
Chase Issuance Trust Series 2012-A3 Class A3 | | | 0.79 | | | | 6-15-2017 | | | | 3,945,000 | | | | 3,949,450 | |
Chase Issuance Trust Series 2012-A5 Class A5 | | | 0.59 | | | | 8-15-2017 | | | | 5,410,000 | | | | 5,412,510 | |
Citibank Credit Card Issuance Trust Series 2012-A1 Class A1 | | | 0.55 | | | | 10-10-2017 | | | | 3,000,000 | | | | 2,999,940 | |
CNH Equipment Trust Series 2013-C Class A2 | | | 0.63 | | | | 1-17-2017 | | | | 1,035,662 | | | | 1,035,895 | |
Ford Credit Auto Lease Trust Series 2014-B Class A2A | | | 0.51 | | | | 3-15-2017 | | | | 4,000,000 | | | | 3,995,404 | |
Ford Credit Auto Owner Trust Series 2014-A Class A2 | | | 0.48 | | | | 11-15-2016 | | | | 1,705,396 | | | | 1,705,350 | |
GE Equipment LLC Series 2013-2 Class A2 | | | 0.61 | | | | 6-24-2016 | | | | 1,231,963 | | | | 1,232,288 | |
GE Equipment Small Ticket LLC Series 2013-1A Class A2 144A | | | 0.73 | | | | 1-25-2016 | | | | 344,287 | | | | 344,418 | |
GE Equipment Transportation LLC Series 2015-1 Class A2 %% | | | 0.89 | | | | 11-24-2017 | | | | 1,430,000 | | | | 1,429,846 | |
Golden National Mortgage Asset-Backed Certificates Series 1998-GN1 Class M2 (s)(i) | | | 8.02 | | | | 2-25-2027 | | | | 34,322 | | | | 34,316 | |
Home Equity Asset Trust Series 2003-6 Class M1 ± | | | 1.22 | | | | 2-25-2034 | | | | 1,501,119 | | | | 1,417,055 | |
Honda Auto Receivables Owner Trust Series 2014-3 Class A2 | | | 0.48 | | | | 12-15-2016 | | | | 2,400,000 | | | | 2,398,594 | |
Hyundai Auto Lease Securitization Trust Series 2013-B Class A2 144A | | | 0.75 | | | | 3-15-2016 | | | | 1,172,938 | | | | 1,173,342 | |
Hyundai Auto Lease Securitization Trust Series 2014-A Class A2 144A | | | 0.52 | | | | 7-15-2016 | | | | 3,271,955 | | | | 3,272,599 | |
Hyundai Auto Receivables Trust Series 2013-B Class A3 | | | 0.71 | | | | 9-15-2017 | | | | 3,674,514 | | | | 3,677,645 | |
Mercedes-Benz Auto Lease Trust Series 2013-B Class A2 | | | 0.53 | | | | 9-15-2015 | | | | 37,366 | | | | 37,365 | |
Mercedes-Benz Auto Lease Trust Series 2014-A Class A2A | | | 0.48 | | | | 6-15-2016 | | | | 2,968,455 | | | | 2,967,508 | |
Nissan Auto Lease Trust Series 2013-B Class A2A | | | 0.57 | | | | 1-15-2016 | | | | 600,969 | | | | 601,064 | |
Nissan Auto Lease Trust Series 2014-B Class A2A | | | 0.73 | | | | 4-17-2017 | | | | 4,870,000 | | | | 4,871,446 | |
Porsche Innovative Lease Owner Pilot Trust Series 2013-1 Class A2 144A | | | 0.54 | | | | 1-22-2016 | | | | 463,512 | | | | 463,556 | |
Susquehanna Auto Receivables Trust Series 2014-1A Class A2 144A | | | 0.58 | | | | 10-17-2016 | | | | 2,000,000 | | | | 1,999,308 | |
Volkswagen Auto Lease Trust Series 2013-A Class A2A | | | 0.63 | | | | 12-21-2015 | | | | 203,758 | | | | 203,770 | |
Volkswagen Auto Lease Trust Series 2015-A Class A2A %% | | | 0.98 | | | | 6-20-2017 | | | | 3,520,000 | | | | 3,519,983 | |
Volvo Financial Equipment LLC Series 2014-1A Class A2 144A | | | 0.54 | | | | 11-15-2016 | | | | 4,419,248 | | | | 4,417,498 | |
| | | | |
Total Asset-Backed Securities (Cost $53,579,651) | | | | | | | | | | | | | | | 53,493,601 | |
| | | | | | | | | | | | | | | | |
| | | | |
Corporate Bonds and Notes: 35.72% | | | | | | | | | | | | | | | | |
| | | | |
Consumer Discretionary: 3.22% | | | | | | | | | | | | | | | | |
| | | | |
| Automobiles: 1.84% | | | | | | | | | | | | | | | | |
Ford Motor Company | | | 6.50 | | | | 8-1-2018 | | | | 2,667,000 | | | | 3,045,546 | |
General Motors Financial Company | | | 3.15 | | | | 1-15-2020 | | | | 3,000,000 | | | | 3,031,479 | |
Harley-Davidson Financial Services Incorporated 144A | | | 2.70 | | | | 3-15-2017 | | | | 3,000,000 | | | | 3,087,144 | |
Hyundai Motor Company 144A | | | 4.50 | | | | 4-15-2015 | | | | 3,006,000 | | | | 3,018,258 | |
| | | | |
| | | | | | | | | | | | | | | 12,182,427 | |
| | | | | | | | | | | | | | | | |
| | | | |
| Media: 0.89% | | | | | | | | | | | | | | | | |
Cox Communications Incorporated | | | 5.50 | | | | 10-1-2015 | | | | 2,000,000 | | | | 2,055,178 | |
McGraw-Hill Company Incorporated | | | 5.90 | | | | 11-15-2017 | | | | 3,500,000 | | | | 3,846,318 | |
| | | | |
| | | | | | | | | | | | | | | 5,901,496 | |
| | | | | | | | | | | | | | | | |
The accompanying notes are an integral part of these financial statements.
| | | | |
| 10 | | Wells Fargo Advantage Short-Term Bond Fund | | Portfolio of investments—February 28, 2015 (unaudited) |
| | | | | | | | | | | | | | | | |
| Security name | | Interest rate | | | Maturity date | | | Principal | | | Value | |
| | | | |
| Specialty Retail: 0.49% | | | | | | | | | | | | | | | | |
International Game Technology | | | 7.50 | % | | | 6-15-2019 | | | $ | 3,000,000 | | | $ | 3,207,693 | |
| | | | | | | | | | | | | | | | |
| | | | |
Consumer Staples: 0.48% | | | | | | | | | | | | | | | | |
| | | | |
| Beverages: 0.16% | | | | | | | | | | | | | | | | |
Constellation Brands Incorporated | | | 7.25 | | | | 9-1-2016 | | | | 1,000,000 | | | | 1,081,000 | |
| | | | | | | | | | | | | | | | |
| | | | |
| Food & Staples Retailing: 0.32% | | | | | | | | | | | | | | | | |
Tyson Foods Incorporated | | | 6.60 | | | | 4-1-2016 | | | | 1,995,000 | | | | 2,111,847 | |
| | | | | | | | | | | | | | | | |
| | | | |
Energy: 4.19% | | | | | | | | | | | | | | | | |
| | | | |
| Energy Equipment & Services: 0.96% | | | | | | | | | | | | | | | | |
SESI LLC | | | 6.38 | | | | 5-1-2019 | | | | 3,000,000 | | | | 3,015,000 | |
Spectra Energy Capital Company | | | 6.20 | | | | 4-15-2018 | | | | 3,000,000 | | | | 3,330,198 | |
| | | | |
| | | | | | | | | | | | | | | 6,345,198 | |
| | | | | | | | | | | | | | | | |
| | | | |
| Oil, Gas & Consumable Fuels: 3.23% | | | | | | | | | | | | | | | | |
Boardwalk Pipelines LP | | | 5.88 | | | | 11-15-2016 | | | | 1,000,000 | | | | 1,046,724 | |
Chevron Corporation %% | | | 1.37 | | | | 3-2-2018 | | | | 3,170,000 | | | | 3,169,290 | |
DCP Midstream Operating Company | | | 2.50 | | | | 12-1-2017 | | | | 3,000,000 | | | | 2,913,981 | |
Enterprise Products Operating LLC | | | 5.25 | | | | 1-31-2020 | | | | 2,010,000 | | | | 2,268,301 | |
Kinder Morgan Incorporated | | | 3.05 | | | | 12-1-2019 | | | | 3,500,000 | | | | 3,532,865 | |
Pioneer Natural Resources Company | | | 5.88 | | | | 7-15-2016 | | | | 2,940,000 | | | | 3,111,431 | |
Rockies Express Pipeline LLC 144A | | | 3.90 | | | | 4-15-2015 | | | | 3,250,000 | | | | 3,250,000 | |
Weatherford Bermuda Company | | | 5.50 | | | | 2-15-2016 | | | | 2,000,000 | | | | 2,060,162 | |
| | | | |
| | | | | | | | | | | | | | | 21,352,754 | |
| | | | | | | | | | | | | | | | |
| | | | |
Financials: 15.95% | | | | | | | | | | | | | | | | |
| | | | |
| Banks: 4.49% | | | | | | | | | | | | | | | | |
Associated Banc Corporation | | | 5.13 | | | | 3-28-2016 | | | | 2,000,000 | | | | 2,080,928 | |
Australia and New Zealand Banking Group Limited 144A | | | 2.40 | | | | 11-23-2016 | | | | 3,000,000 | | | | 3,068,982 | |
Bank of America Corporation | | | 6.50 | | | | 8-1-2016 | | | | 3,000,000 | | | | 3,216,444 | |
Capital One NA | | | 1.65 | | | | 2-5-2018 | | | | 3,000,000 | | | | 2,995,080 | |
Citigroup Incorporated | | | 2.40 | | | | 2-18-2020 | | | | 2,000,000 | | | | 1,991,828 | |
JPMorgan Chase & Company | | | 2.25 | | | | 1-23-2020 | | | | 1,500,000 | | | | 1,491,516 | |
PNC Bank NA | | | 1.50 | | | | 2-23-2018 | | | | 3,000,000 | | | | 3,006,120 | |
Santander Holdings USA | | | 4.63 | | | | 4-19-2016 | | | | 2,000,000 | | | | 2,074,764 | |
UBS AG | | | 5.88 | | | | 7-15-2016 | | | | 3,000,000 | | | | 3,193,482 | |
Union Bank NA | | | 5.95 | | | | 5-11-2016 | | | | 3,325,000 | | | | 3,504,021 | |
US Bancorp NA | | | 3.44 | | | | 2-1-2016 | | | | 2,000,000 | | | | 2,042,426 | |
US Bank NA ± | | | 3.78 | | | | 4-29-2020 | | | | 1,006,000 | | | | 1,010,827 | |
| | | | |
| | | | | | | | | | | | | | | 29,676,418 | |
| | | | | | | | | | | | | | | | |
| | | | |
| Capital Markets: 2.15% | | | | | | | | | | | | | | | | |
Bear Stearns Companies LLC | | | 5.55 | | | | 1-22-2017 | | | | 3,875,000 | | | | 4,161,025 | |
Janus Capital Group Incorporated | | | 6.70 | | | | 6-15-2017 | | | | 2,900,000 | | | | 3,195,113 | |
Lazard Group LLC | | | 6.85 | | | | 6-15-2017 | | | | 3,000,000 | | | | 3,339,291 | |
Merrill Lynch & Company Incorporated | | | 5.30 | | | | 9-30-2015 | | | | 1,400,000 | | | | 1,435,546 | |
Morgan Stanley | | | 1.88 | | | | 1-5-2018 | | | | 2,045,000 | | | | 2,053,550 | |
| | | | |
| | | | | | | | | | | | | | | 14,184,525 | |
| | | | | | | | | | | | | | | | |
The accompanying notes are an integral part of these financial statements.
| | | | | | |
| Portfolio of investments—February 28, 2015 (unaudited) | | Wells Fargo Advantage Short-Term Bond Fund | | | 11 | |
| | | | | | | | | | | | | | | | |
| Security name | | Interest rate | | | Maturity date | | | Principal | | | Value | |
| | | | |
| Consumer Finance: 3.31% | | | | | | | | | | | | | | | | |
Daimler Finance NA LLC 144A%% | | | 1.65 | % | | | 3-2-2018 | | | $ | 3,000,000 | | | $ | 3,012,018 | |
Discover Financial Services Company | | | 6.45 | | | | 6-12-2017 | | | | 3,000,000 | | | | 3,295,632 | |
Ford Motor Credit Company | | | 5.63 | | | | 9-15-2015 | | | | 1,000,000 | | | | 1,025,591 | |
Gatx Financial Corporation | | | 5.70 | | | | 4-15-2015 | | | | 2,635,000 | | | | 2,649,627 | |
HSBC Finance Corporation | | | 5.25 | | | | 4-15-2015 | | | | 3,000,000 | | | | 3,016,404 | |
Murray Street Investment Trust I | | | 4.65 | | | | 3-9-2017 | | | | 4,000,000 | | | | 4,250,712 | |
SLM Corporation | | | 3.88 | | | | 9-10-2015 | | | | 1,500,000 | | | | 1,515,000 | |
Toll Brothers Finance Corporation | | | 8.91 | | | | 10-15-2017 | | | | 2,710,000 | | | | 3,130,050 | |
| | | | |
| | | | | | | | | | | | | | | 21,895,034 | |
| | | | | | | | | | | | | | | | |
| | | | |
| Diversified Financial Services: 1.14% | | | | | | | | | | | | | | | | |
Moody’s Corporation | | | 2.75 | | | | 7-15-2019 | | | | 3,000,000 | | | | 3,049,068 | |
Raymond James Financial Incorporated | | | 4.25 | | | | 4-15-2016 | | | | 2,000,000 | | | | 2,080,970 | |
Toll Road Investors Partnership II LP 144A¤ | | | 0.00 | | | | 2-15-2016 | | | | 2,500,000 | | | | 2,400,203 | |
| | | | |
| | | | | | | | | | | | | | | 7,530,241 | |
| | | | | | | | | | | | | | | | |
| | | | |
| Insurance: 2.89% | | | | | | | | | | | | | | | | |
Genworth Financial Incorporated | | | 8.63 | | | | 12-15-2016 | | | | 2,000,000 | | | | 2,161,156 | |
Lincoln National Corporation | | | 8.75 | | | | 7-1-2019 | | | | 2,426,000 | | | | 3,040,496 | |
MetLife Insurance Company 144A | | | 7.70 | | | | 11-1-2015 | | | | 3,000,000 | | | | 3,131,250 | |
Prudential Insurance Company 144A | | | 8.10 | | | | 7-15-2015 | | | | 3,910,000 | | | | 4,013,380 | |
Symetra Financial Corporation 144A | | | 6.13 | | | | 4-1-2016 | | | | 3,000,000 | | | | 3,125,781 | |
Unum Group 144A | | | 6.85 | | | | 11-15-2015 | | | | 1,533,000 | | | | 1,594,921 | |
W.R. Berkley Corporation | | | 5.60 | | | | 5-15-2015 | | | | 2,000,000 | | | | 2,019,164 | |
| | | | |
| | | | | | | | | | | | | | | 19,086,148 | |
| | | | | | | | | | | | | | | | |
| | | | |
| REITs: 1.97% | | | | | | | | | | | | | | | | |
American Tower Corporation | | | 4.50 | | | | 1-15-2018 | | | | 2,700,000 | | | | 2,878,929 | |
ARC Properties Operating Partnership LP | | | 2.00 | | | | 2-6-2017 | | | | 1,085,000 | | | | 1,056,821 | |
Digital Realty Trust LP | | | 4.50 | | | | 7-15-2015 | | | | 3,000,000 | | | | 3,012,393 | |
Realty Income Corporation | | | 2.00 | | | | 1-31-2018 | | | | 3,000,000 | | | | 3,017,235 | |
Regency Centers LP | | | 5.25 | | | | 8-1-2015 | | | | 3,000,000 | | | | 3,055,428 | |
| | | | |
| | | | | | | | | | | | | | | 13,020,806 | |
| | | | | | | | | | | | | | | | |
| | | | |
Health Care: 1.01% | | | | | | | | | | | | | | | | |
| | | | |
| Biotechnology: 0.53% | | | | | | | | | | | | | | | | |
Biogen Idec Incorporated | | | 6.88 | | | | 3-1-2018 | | | | 3,045,000 | | | | 3,509,366 | |
| | | | | | | | | | | | | | | | |
| | | | |
| Life Sciences Tools & Services: 0.48% | | | | | | | | | | | | | | | | |
Life Technologies Corporation | | | 4.40 | | | | 3-1-2015 | | | | 3,170,000 | | | | 3,170,000 | |
| | | | | | | | | | | | | | | | |
| | | | |
Industrials: 3.40% | | | | | | | | | | | | | | | | |
| | | | |
| Airlines: 0.62% | | | | | | | | | | | | | | | | |
Delta Air Lines Incorporated | | | 4.75 | | | | 11-7-2021 | | | | 2,594,504 | | | | 2,782,605 | |
US Airway 2010-1 Class B Pass-Through Trust | | | 8.50 | | | | 10-22-2018 | | | | 1,227,922 | | | | 1,326,156 | |
| | | | |
| | | | | | | | | | | | | | | 4,108,761 | |
| | | | | | | | | | | | | | | | |
The accompanying notes are an integral part of these financial statements.
| | | | |
| 12 | | Wells Fargo Advantage Short-Term Bond Fund | | Portfolio of investments—February 28, 2015 (unaudited) |
| | | | | | | | | | | | | | | | |
| Security name | | Interest rate | | | Maturity date | | | Principal | | | Value | |
| | | | |
| Building Products: 0.02% | | | | | | | | | | | | | | | | |
Owens Corning Incorporated | | | 6.50 | % | | | 12-1-2016 | | | $ | 148,000 | | | $ | 159,453 | |
| | | | | | | | | | | | | | | | |
| | | | |
| Commercial Services & Supplies: 0.91% | | | | | | | | | | | | | | | | |
Boardwalk Pipelines LLC | | | 5.20 | | | | 6-1-2018 | | | | 2,179,000 | | | | 2,256,644 | |
Brambles USA Incorporated 144A | | | 3.95 | | | | 4-1-2015 | | | | 2,000,000 | | | | 2,004,400 | |
Penske Truck Leasing Company LP 144A | | | 3.13 | | | | 5-11-2015 | | | | 1,740,000 | | | | 1,747,606 | |
| | | | |
| | | | | | | | | | | | | | | 6,008,650 | |
| | | | | | | | | | | | | | | | |
| | | | |
| Machinery: 0.98% | | | | | | | | | | | | | | | | |
CNH Capital LLC | | | 3.25 | | | | 2-1-2017 | | | | 1,760,000 | | | | 1,773,200 | |
CNH Capital LLC | | | 3.88 | | | | 11-1-2015 | | | | 1,145,000 | | | | 1,152,156 | |
SPX Corporation | | | 6.88 | | | | 9-1-2017 | | | | 3,250,000 | | | | 3,542,500 | |
| | | | |
| | | | | | | | | | | | | | | 6,467,856 | |
| | | | | | | | | | | | | | | | |
| | | | |
| Road & Rail: 0.87% | | | | | | | | | | | | | | | | |
JB Hunt Transportation Services Company | | | 3.38 | | | | 9-15-2015 | | | | 3,700,000 | | | | 3,746,350 | |
Ryder System Incorporated | | | 2.65 | | | | 3-2-2020 | | | | 2,000,000 | | | | 2,011,664 | |
| | | | |
| | | | | | | | | | | | | | | 5,758,014 | |
| | | | | | | | | | | | | | | | |
| | | | |
Information Technology: 2.39% | | | | | | | | | | | | | | | | |
| | | | |
| Electronic Equipment, Instruments & Components: 0.46% | | | | | | | | | | | | | | | | |
Arrow Electronics Incorporated | | | 3.38 | | | | 11-1-2015 | | | | 3,000,000 | | | | 3,052,278 | |
| | | | | | | | | | | | | | | | |
| | | | |
| IT Services: 0.41% | | | | | | | | | | | | | | | | |
Western Union Company | | | 2.38 | | | | 12-10-2015 | | | | 2,700,000 | | | | 2,726,776 | |
| | | | | | | | | | | | | | | | |
| | | | |
| Semiconductors & Semiconductor Equipment: 0.53% | | | | | | | | | | | | | | | | |
Kla-Tencor Corporation | | | 2.38 | | | | 11-1-2017 | | | | 1,365,000 | | | | 1,384,440 | |
Kla-Tencor Corporation | | | 3.38 | | | | 11-1-2019 | | | | 2,000,000 | | | | 2,074,052 | |
| | | | |
| | | | | | | | | | | | | | | 3,458,492 | |
| | | | | | | | | | | | | | | | |
| | | | |
| Software: 0.99% | | | | | | | | | | | | | | | | |
CDK Global Incorporated 144A | | | 3.30 | | | | 10-15-2019 | | | | 3,500,000 | | | | 3,531,857 | |
Fidelity National Information Services Incorporated | | | 2.00 | | | | 4-15-2018 | | | | 2,000,000 | | | | 2,008,090 | |
Symantec Corporation | | | 2.75 | | | | 9-15-2015 | | | | 1,000,000 | | | | 1,009,149 | |
| | | | |
| | | | | | | | | | | | | | | 6,549,096 | |
| | | | | | | | | | | | | | | | |
| | | | |
Materials: 1.15% | | | | | | | | | | | | | | | | |
| | | | |
| Chemicals: 0.19% | | | | | | | | | | | | | | | | |
Ecolab Incorporated | | | 1.55 | | | | 1-12-2018 | | | | 1,275,000 | | | | 1,274,012 | |
| | | | | | | | | | | | | | | | |
| | | | |
| Construction Materials: 0.50% | | | | | | | | | | | | | | | | |
Martin Marietta Material ± | | | 1.36 | | | | 6-30-2017 | | | | 3,310,000 | | | | 3,292,646 | |
| | | | | | | | | | | | | | | | |
| | | | |
| Metals & Mining: 0.46% | | | | | | | | | | | | | | | | |
Glencore Funding LLC 144A | | | 1.70 | | | | 5-27-2016 | | | | 3,000,000 | | | | 3,010,674 | |
| | | | | | | | | | | | | | | | |
The accompanying notes are an integral part of these financial statements.
| | | | | | |
| Portfolio of investments—February 28, 2015 (unaudited) | | Wells Fargo Advantage Short-Term Bond Fund | | | 13 | |
| | | | | | | | | | | | | | | | |
| Security name | | Interest rate | | | Maturity date | | | Principal | | | Value | |
| | | | |
Telecommunication Services: 1.33% | | | | | | | | | | | | | | | | |
| | | | |
| Diversified Telecommunication Services: 1.33% | | | | | | | | | | | | | | | | |
Clearwire Communications LLC 144A | | | 14.75 | % | | | 12-1-2016 | | | $ | 2,710,000 | | | $ | 3,252,000 | |
Crown Castle Towers LLC 144A | | | 3.21 | | | | 8-15-2035 | | | | 2,650,000 | | | | 2,674,078 | |
Crown Castle Towers LLC 144A | | | 5.50 | | | | 1-15-2037 | | | | 2,695,000 | | | | 2,840,339 | |
| | | | |
| | | | | | | | | | | | | | | 8,766,417 | |
| | | | | | | | | | | | | | | | |
| | | | |
Utilities: 2.60% | | | | | | | | | | | | | | | | |
| | | | |
| Electric Utilities: 2.60% | | | | | | | | | | | | | | | | |
Dayton Power & Light Company | | | 1.88 | | | | 9-15-2016 | | | | 4,000,000 | | | | 4,044,068 | |
FPL Group Capital Incorporated | | | 2.60 | | | | 9-1-2015 | | | | 3,000,000 | | | | 3,028,149 | |
Interstate Power & Light Company | | | 3.30 | | | | 6-15-2015 | | | | 3,750,000 | | | | 3,778,954 | |
Monongahela Power Company 144A | | | 5.70 | | | | 3-15-2017 | | | | 3,000,000 | | | | 3,239,670 | |
Progress Energy Incorporated | | | 5.63 | | | | 1-15-2016 | | | | 3,000,000 | | | | 3,124,374 | |
| | | | |
| | | | | | | | | | | | | | | 17,215,215 | |
| | | | | | | | | | | | | | | | |
| | | | |
Total Corporate Bonds and Notes (Cost $235,723,140) | | | | | | | | | | | | | | | 236,103,293 | |
| | | | | | | | | | | | | | | | |
| | | | |
Municipal Obligations: 3.94% | | | | | | | | | | | | | | | | |
| | | | |
| California: 1.27% | | | | | | | | | | | | | | | | |
California PCFA Waste Management Services Incorporated Series A1 (Resource Recovery Revenue) ± | | | 1.88 | | | | 4-1-2025 | | | | 2,000,000 | | | | 2,002,620 | |
California Public Works Board Lease Series E (Miscellaneous Revenue) | | | 3.68 | | | | 12-1-2015 | | | | 2,960,000 | | | | 3,020,236 | |
San Bernardino County CA Financing Authority (Miscellaneous Revenue, National Insured) ¤ | | | 0.00 | | | | 8-1-2017 | | | | 3,500,000 | | | | 3,335,255 | |
| | | | |
| | | | | | | | | | | | | | | 8,358,111 | |
| | | | | | | | | | | | | | | | |
| | | | |
| Florida: 0.22% | | | | | | | | | | | | | | | | |
Village Center Florida Community Development District Utility (Water & Sewer Revenue) 144A | | | 1.60 | | | | 10-1-2016 | | | | 1,445,000 | | | | 1,444,379 | |
| | | | | | | | | | | | | | | | |
| | | | |
| Georgia: 0.46% | | | | | | | | | | | | | | | | |
Georgia Municipal Gas Authority Gas Portfolio III Series F (Utilities Revenue) | | | 4.77 | | | | 8-1-2015 | | | | 3,000,000 | | | | 3,051,390 | |
| | | | | | | | | | | | | | | | |
| | | | |
| Illinois: 0.30% | | | | | | | | | | | | | | | | |
Chicago IL (Tax Revenue) | | | 6.30 | | | | 12-1-2021 | | | | 1,800,000 | | | | 1,986,372 | |
| | | | | | | | | | | | | | | | |
| | | | |
| New Jersey: 0.42% | | | | | | | | | | | | | | | | |
New Jersey EDA Series B (Lease Revenue, AGM Insured) ¤ | | | 0.00 | | | | 2-15-2018 | | | | 3,000,000 | | | | 2,799,330 | |
| | | | | | | | | | | | | | | | |
| | | | |
| Oregon: 0.59% | | | | | | | | | | | | | | | | |
Portland OR Taxable Pension (GO) ±(m)(n) | | | 0.11 | | | | 6-1-2019 | | | | 3,975,000 | | | | 3,865,688 | |
| | | | | | | | | | | | | | | | |
| | | | |
| Texas: 0.68% | | | | | | | | | | | | | | | | |
Port Arthur TX Navigation District Jefferson County Environmental Facilities Motiva Enterprises LLC Project Series D (Industrial Development Revenue) ± | | | 0.09 | | | | 11-1-2040 | | | | 4,500,000 | | | | 4,500,000 | |
| | | | | | | | | | | | | | | | |
| | | | |
Total Municipal Obligations (Cost $25,718,955) | | | | | | | | | | | | | | | 26,005,270 | |
| | | | | | | | | | | | | | | | |
The accompanying notes are an integral part of these financial statements.
| | | | |
| 14 | | Wells Fargo Advantage Short-Term Bond Fund | | Portfolio of investments—February 28, 2015 (unaudited) |
| | | | | | | | | | | | | | | | |
| Security name | | Interest rate | | | Maturity date | | | Principal | | | Value | |
| | | | |
Non-Agency Mortgage-Backed Securities: 11.69% | | | | | | | | | | | | | | | | |
Bank of America Mortgage Securities Series 2002-K Class 3A1 ± | | | 2.63 | % | | | 10-20-2032 | | | $ | 21,112 | | | $ | 21,282 | |
Bear Stearns Commercial Mortgage Securities Incorporated Series 2005-PWR 9 Class A4A | | | 4.87 | | | | 9-11-2042 | | | | 2,479,955 | | | | 2,497,441 | |
Bear Stearns Commercial Mortgage Securities Incorporated Series 2005-PWR8 Class A4 | | | 4.67 | | | | 6-11-2041 | | | | 1,444,526 | | | | 1,446,734 | |
Bear Stearns Commercial Mortgage Securities Incorporated Series 2005-T20 Class A4A ± | | | 5.14 | | | | 10-12-2042 | | | | 1,743,071 | | | | 1,762,665 | |
Citigroup Commercial Mortgage Trust Series 2005-CD1 Class A4 ± | | | 5.23 | | | | 7-15-2044 | | | | 2,321,294 | | | | 2,343,439 | |
CNH Equipment Trust Series 2012-B Class A3 | | | 0.86 | | | | 9-15-2017 | | | | 2,477,827 | | | | 2,479,194 | |
CNH Equipment Trust Series 2014-A Class A2 | | | 0.49 | | | | 6-15-2017 | | | | 1,348,401 | | | | 1,347,830 | |
Commercial Mortgage Trust Pass-Through Certificate Series 2005-C6 Class A5A ± | | | 5.12 | | | | 6-10-2044 | | | | 2,212,622 | | | | 2,227,564 | |
Commercial Mortgage Trust Series 2010-C1 Class A1 144A | | | 3.16 | | | | 7-10-2046 | | | | 1,749,811 | | | | 1,761,325 | |
Commercial Mortgage Trust Series 2012-CR2 Class A1 | | | 0.82 | | | | 8-15-2045 | | | | 1,529,042 | | | | 1,528,511 | |
Commercial Mortgage Trust Series 2013-FL3 Class B 144A ± | | | 2.32 | | | | 10-13-2028 | | | | 3,000,000 | | | | 3,042,435 | |
Commercial Mortgage Trust Series 2014-BBG Class A 144A ± | | | 0.97 | | | | 3-15-2029 | | | | 2,100,000 | | | | 2,094,168 | |
ContiMortgage Home Equity Trust Series 1996-2 ±(c)(i) | | | 0.00 | | | | 7-15-2027 | | | | 903,437 | | | | 20,273 | |
Countrywide Home Loans Mortgage Pass-Through Trust Series 2001-HYB1 Class 2A1 ± | | | 1.93 | | | | 6-19-2031 | | | | 315,281 | | | | 314,348 | |
Countrywide Home Loans Mortgage Pass-Through Trust Series 2004-20 Class 3A1 ± | | | 2.24 | | | | 9-25-2034 | | | | 65,240 | | | | 55,472 | |
Credit Suisse Mortgage Capital Certificates Series 2006-C5 Class A3 | | | 5.31 | | | | 12-15-2039 | | | | 983,879 | | | | 1,029,669 | |
Drexel Burnham Lambert CMO Trust Series T Class 4 | | | 8.45 | | | | 9-20-2019 | | | | 71,299 | | | | 75,575 | |
EquiFirst Mortgage Loan Trust Series 2003-2 Class 3A3 ± | | | 1.30 | | | | 9-25-2033 | | | | 549,455 | | | | 525,849 | |
Equity Mortgage Trust Series 2014-INNS Class A 144A ± | | | 1.02 | | | | 5-8-2031 | | | | 4,000,000 | | | | 3,994,776 | |
FedEx Corporation 1998 Pass-Through Certificates | | | 7.02 | | | | 1-15-2016 | | | | 605,702 | | | | 637,501 | |
Greenwich Capital Commercial Funding Corporation Series 2007-GG9 Class A4 | | | 5.44 | | | | 3-10-2039 | | | | 3,000,000 | | | | 3,180,006 | |
GS Mortgage Securities Trust Series 2014-GSFL Class A 144A ± | | | 1.17 | | | | 7-15-2031 | | | | 3,000,000 | | | | 3,000,000 | |
GSMPS Mortgage Loan Trust Series 1998-1 Class A 144A ± | | | 8.00 | | | | 9-19-2027 | | | | 326,681 | | | | 332,670 | |
GSMPS Mortgage Loan Trust Series 2006-RP2 Class 1AF1 144A ± | | | 0.57 | | | | 4-25-2036 | | | | 1,173,352 | | | | 988,678 | |
JPMorgan Chase Commercial Mortgage Securities Corporation Series 2005-LDP5 Class A4 ± | | | 5.23 | | | | 12-15-2044 | | | | 2,715,630 | | | | 2,756,869 | |
JPMorgan Chase Commercial Mortgage Securities Corporation Series 2006-CB16 Class A4 | | | 5.55 | | | | 5-12-2045 | | | | 969,954 | | | | 1,008,650 | |
JPMorgan Chase Commercial Mortgage Securities Corporation Series 2007-CB18 Class A4 | | | 5.44 | | | | 6-12-2047 | | | | 2,699,864 | | | | 2,857,865 | |
JPMorgan Chase Commercial Mortgage Securities Corporation Series 2014-INN Class A 144A ± | | | 1.09 | | | | 6-15-2029 | | | | 5,000,000 | | | | 4,987,875 | |
JPMorgan Chase Commercial Mortgage Securities Corporation Series 2014-PHH Class A 144A ± | | | 1.37 | | | | 8-15-2027 | | | | 3,000,000 | | | | 2,998,422 | |
JPMorgan Chase Commercial Mortgage Trust Series 2007-LDPX Class AM ± | | | 5.46 | | | | 1-15-2049 | | | | 3,300,000 | | | | 3,428,670 | |
Lehman Brothers UBS Commercial Mortgage Trust Series 2005-C5 Class 4 | | | 4.95 | | | | 9-15-2030 | | | | 2,350,535 | | | | 2,356,366 | |
Lehman Brothers UBS Commercial Mortgage Trust Series 2007-C6 Class A4 ± | | | 5.86 | | | | 7-15-2040 | | | | 807,017 | | | | 848,430 | |
Macquarie Equipment Funding Trust Series 2014-A Class A2 144A | | | 0.80 | | | | 11-21-2016 | | | | 3,600,000 | | | | 3,604,626 | |
Master Mortgages Trust Series 2002-3 Class 4A1 ± | | | 2.50 | | | | 10-25-2032 | | | | 9,381 | | | | 9,360 | |
Morgan Stanley Capital I Series 2005-IQ10 Class A4A ± | | | 5.23 | | | | 9-15-2042 | | | | 2,278,104 | | | | 2,294,725 | |
Morgan Stanley Capital I Series 2005-T19 Class A4A | | | 4.89 | | | | 6-12-2047 | | | | 1,489,743 | | | | 1,496,102 | |
Morgan Stanley Capital I Series 2006-HQ8 Class A4 ± | | | 5.41 | | | | 3-12-2044 | | | | 2,802,578 | | | | 2,855,454 | |
Morgan Stanley Capital I Series 2007-IQ Class A4 | | | 5.81 | | | | 12-12-2049 | | | | 2,656,982 | | | | 2,881,685 | |
NCUA Guaranteed Notes Program Series 2010-C1 Class APT | | | 2.65 | | | | 10-29-2020 | | | | 2,225,073 | | | | 2,251,805 | |
Nomura Asset Acceptance Corporation Series 2005-AR1 Class 1A1 ± | | | 2.46 | | | | 2-25-2035 | | | | 714,293 | | | | 713,855 | |
The accompanying notes are an integral part of these financial statements.
| | | | | | |
| Portfolio of investments—February 28, 2015 (unaudited) | | Wells Fargo Advantage Short-Term Bond Fund | | | 15 | |
| | | | | | | | | | | | | | | | |
| Security name | | Interest rate | | | Maturity date | | | Principal | | | Value | |
| | | | |
Non-Agency Mortgage-Backed Securities (continued) | | | | | | | | | | | | | | | | |
SBA Tower Trust Series 2014-1A Class C 144A | | | 2.90 | % | | | 10-15-2044 | | | $ | 3,000,000 | | | $ | 3,018,456 | |
Structured Mortgage Asset Residential Trust Series 1992-5B Class BO ¤(i) | | | 0.00 | | | | 6-25-2023 | | | | 7,207 | | | | 6,785 | |
Wilshire Funding Corporation Series 1996-3 Class M2 ± | | | 7.09 | | | | 8-25-2032 | | | | 86,024 | | | | 84,406 | |
Wilshire Funding Corporation Series 1996-3 Class M3 ± | | | 7.09 | | | | 8-25-2032 | | | | 87,622 | | | | 84,426 | |
Wilshire Funding Corporation Series 1998-2 Class M1 ± | | | 2.00 | | | | 12-28-2037 | | | | 32,055 | | | | 31,304 | |
| | | | |
Total Non-Agency Mortgage-Backed Securities
(Cost $77,777,478) | | | | | | | | | | | | | | | 77,283,541 | |
| | | | | | | | | | | | | | | | |
| | | | |
| | | Dividend yield | | | | | | Shares | | | | |
| Preferred Stocks: 0.25% | | | | | | | | | | | | | | | | |
| | | | |
Financials: 0.25% | | | | | | | | | | | | | | | | |
| | | | |
| Banks: 0.25% | | | | | | | | | | | | | | | | |
Huntington Bancshares ±(a)(i) | | | 2.99 | | | | | | | | 80,000 | | | | 1,626,446 | |
| | | | | | | | | | | | | | | | |
| | | | |
Total Preferred Stocks (Cost $1,958,484) | | | | | | | | | | | | | | | 1,626,446 | |
| | | | | | | | | | | | | | | | |
| | | | |
| | | Interest rate | | | | | | Principal | | | | |
| U.S. Treasury Securities: 0.69% | | | | | | | | | | | | | | | | |
U.S. Treasury Note | | | 1.38 | | | | 2-28-2019 | | | $ | 4,530,000 | | | | 4,536,723 | |
| | | | | | | | | | | | | | | | |
| | | | |
Total U.S. Treasury Securities (Cost $4,497,394) | | | | | | | | | | | | | | | 4,536,723 | |
| | | | | | | | | | | | | | | | |
| | | | |
Yankee Corporate Bonds and Notes: 13.94% | | | | | | | | | | | | | | | | |
| | | | |
Consumer Discretionary: 1.02% | | | | | | | | | | | | | | | | |
| | | | |
| Media: 0.48% | | | | | | | | | | | | | | | | |
British Sky Broadcasting Group plc 144A | | | 6.10 | | | | 2-15-2018 | | | | 2,838,000 | | | | 3,159,653 | |
| | | | | | | | | | | | | | | | |
| | | | |
| Specialty Retail: 0.54% | | | | | | | | | | | | | | | | |
Seagate HDD Cayman Company | | | 3.75 | | | | 11-15-2018 | | | | 3,500,000 | | | | 3,575,541 | |
| | | | | | | | | | | | | | | | |
| | | | |
Consumer Staples: 0.53% | | | | | | | | | | | | | | | | |
| | | | |
| Food & Staples Retailing: 0.53% | | | | | | | | | | | | | | | | |
Tesco plc 144A | | | 2.70 | | | | 1-5-2017 | | | | 3,470,000 | | | | 3,482,419 | |
| | | | | | | | | | | | | | | | |
| | | | |
Energy: 2.18% | | | | | | | | | | | | | | | | |
| | | | |
| Oil, Gas & Consumable Fuels: 2.18% | | | | | | | | | | | | | | | | |
BP Capital Markets plc | | | 1.67 | | | | 2-13-2018 | | | | 3,000,000 | | | | 3,007,836 | |
Ecopetrol SA | | | 4.25 | | | | 9-18-2018 | | | | 3,000,000 | | | | 3,159,000 | |
Korea National Oil Corporation 144A | | | 2.75 | | | | 1-23-2019 | | | | 3,000,000 | | | | 3,053,460 | |
Petrobras Global Finance Company | | | 3.25 | | | | 3-17-2017 | | | | 2,065,000 | | | | 1,923,775 | |
Transocean Incorporated | | | 5.05 | | | | 12-15-2016 | | | | 3,235,000 | | | | 3,239,044 | |
| | | | |
| | | | | | | | | | | | | | | 14,383,115 | |
| | | | | | | | | | | | | | | | |
| | | | |
Financials: 7.06% | | | | | | | | | | | | | | | | |
| | | | |
| Banks: 4.49% | | | | | | | | | | | | | | | | |
Bank of Nova Scotia 144A | | | 1.65 | | | | 10-29-2015 | | | | 3,430,000 | | | | 3,458,054 | |
Banque Federative du Credit Mutuel SA 144A | | | 1.70 | | | | 1-20-2017 | | | | 2,850,000 | | | | 2,868,685 | |
BPCE SA | | | 1.61 | | | | 7-25-2017 | | | | 3,000,000 | | | | 3,008,613 | |
The accompanying notes are an integral part of these financial statements.
| | | | |
| 16 | | Wells Fargo Advantage Short-Term Bond Fund | | Portfolio of investments—February 28, 2015 (unaudited) |
| | | | | | | | | | | | | | | | |
| Security name | | Interest rate | | | Maturity date | | | Principal | | | Value | |
| | | | |
| Banks (continued) | | | | | | | | | | | | | | | | |
Canadian Imperial Bank 144A | | | 2.75 | % | | | 1-27-2016 | | | $ | 3,000,000 | | | $ | 3,058,536 | |
Corporacion Andina De Fomento | | | 3.75 | | | | 1-15-2016 | | | | 3,385,000 | | | | 3,469,869 | |
Experian Finance plc 144A | | | 2.38 | | | | 6-15-2017 | | | | 3,800,000 | | | | 3,819,251 | |
HBOS plc 144A | | | 6.75 | | | | 5-21-2018 | | | | 2,000,000 | | | | 2,238,948 | |
Sumitomo Mitsui Banking Corporation | | | 1.75 | | | | 1-16-2018 | | | | 2,500,000 | | | | 2,505,023 | |
Swedbank Hypotek 144A | | | 2.13 | | | | 8-31-2016 | | | | 3,000,000 | | | | 3,058,521 | |
Westpac Banking Corporation 144A | | | 5.30 | | | | 10-15-2015 | | | | 2,150,000 | | | | 2,214,117 | |
| | | | |
| | | | | | | | | | | | | | | 29,699,617 | |
| | | | | | | | | | | | | | | | |
| | | | |
| Diversified Financial Services: 0.25% | | | | | | | | | | | | | | | | |
Credit Suisse | | | 6.00 | | | | 2-15-2018 | | | | 1,500,000 | | | | 1,665,743 | |
| | | | | | | | | | | | | | | | |
| | | | |
| Insurance: 1.39% | | | | | | | | | | | | | | | | |
Allied World Assurance Company | | | 7.50 | | | | 8-1-2016 | | | | 3,000,000 | | | | 3,249,336 | |
Endurance Specialty Holdings Limited | | | 6.15 | | | | 10-15-2015 | | | | 2,850,000 | | | | 2,936,042 | |
QBE Insurance Group Limited 144A | | | 2.40 | | | | 5-1-2018 | | | | 2,985,000 | | | | 2,997,838 | |
| | | | |
| | | | | | | | | | | | | | | 9,183,216 | |
| | | | | | | | | | | | | | | | |
| | | | |
| Real Estate Management & Development: 0.93% | | | | | | | | | | | | | | | | |
Deutsche Annington Finance BV 144A | | | 3.20 | | | | 10-2-2017 | | | | 4,000,000 | | | | 4,110,136 | |
Korea Land & Housing Corporation 144A | | | 1.88 | | | | 8-2-2017 | | | | 2,000,000 | | | | 2,002,980 | |
| | | | |
| | | | | | | | | | | | | | | 6,113,116 | |
| | | | | | | | | | | | | | | | |
| | | | |
Health Care: 0.98% | | | | | | | | | | | | | | | | |
| | | | |
| Pharmaceuticals: 0.98% | | | | | | | | | | | | | | | | |
Actavis Funding SCS | | | 1.30 | | | | 6-15-2017 | | | | 3,500,000 | | | | 3,456,663 | |
Perrigo Company plc | | | 1.30 | | | | 11-8-2016 | | | | 3,000,000 | | | | 2,994,696 | |
| | | | |
| | | | | | | | | | | | | | | 6,451,359 | |
| | | | | | | | | | | | | | | | |
| | | | |
Information Technology: 0.90% | | | | | | | | | | | | | | | | |
| | | | |
| Internet Software & Services: 0.45% | | | | | | | | | | | | | | | | |
Alibaba Group Holding Limited 144A | | | 2.50 | | | | 11-28-2019 | | | | 3,000,000 | | | | 2,979,645 | |
| | | | | | | | | | | | | | | | |
| | | | |
| Semiconductors & Semiconductor Equipment: 0.45% | | | | | | | | | | | | | | | | |
TSMC Global Limited 144A | | | 1.63 | | | | 4-3-2018 | | | | 3,035,000 | | | | 2,991,958 | |
| | | | | | | | | | | | | | | | |
| | | | |
Materials: 0.51% | | | | | | | | | | | | | | | | |
| | | | |
| Construction Materials: 0.51% | | | | | | | | | | | | | | | | |
Lafarge SA 144A | | | 6.20 | | | | 7-9-2015 | | | | 3,321,000 | | | | 3,370,815 | |
| | | | | | | | | | | | | | | | |
| | | | |
Telecommunication Services: 0.30% | | | | | | | | | | | | | | | | |
| | | | |
| Wireless Telecommunication Services: 0.30% | | | | | | | | | | | | | | | | |
Telefonica Moviles Chile SA 144A | | | 2.88 | | | | 11-9-2015 | | | | 2,000,000 | | | | 2,019,256 | |
| | | | | | | | | | | | | | | | |
| | | | |
Utilities: 0.46% | | | | | | | | | | | | | | | | |
| | | | |
| Multi-Utilities: 0.46% | | | | | | | | | | | | | | | | |
Korea Western Power Company 144A | | | 3.13 | | | | 5-10-2017 | | | | 3,000,000 | | | | 3,079,197 | |
| | | | | | | | | | | | | | | | |
| | | | |
Total Yankee Corporate Bonds and Notes (Cost $92,091,673) | | | | | | | | | | | | | | | 92,154,650 | |
| | | | | | | | | | | | | | | | |
The accompanying notes are an integral part of these financial statements.
| | | | | | |
| Portfolio of investments—February 28, 2015 (unaudited) | | Wells Fargo Advantage Short-Term Bond Fund | | | 17 | |
| | | | | | | | | | | | | | | | |
| Security name | | Yield | | | | | | Shares | | | Value | |
| | | | |
Short-Term Investments: 5.42% | | | | | | | | | | | | | | | | |
| | | | |
| Investment Companies: 5.35% | | | | | | | | | | | | | | | | |
Wells Fargo Advantage Cash Investment Money Market Fund, Select Class (l)(u)## | | | 0.10 | % | | | | | | | 35,347,886 | | | $ | 35,347,886 | |
| | | | | | | | | | | | | | | | |
| | | | |
| | | | | | Maturity date | | | Principal | | | | |
| | | | |
| U.S. Treasury Securities: 0.07% | | | | | | | | | | | | | | | | |
U.S. Treasury Bill #(z) | | | 0.02 | | | | 3-19-2015 | | | $ | 475,000 | | | | 474,997 | |
| | | | | | | | | | | | | | | | |
| | | | |
Total Short-Term Investments (Cost $35,822,880) | | | | | | | | | | | | | | | 35,822,883 | |
| | | | | | | | | | | | | | | | |
| | | | | | | | |
| Total investments in securities (Cost $606,472,860) * | | | 91.89 | % | | | 607,314,808 | |
Other assets and liabilities, net | | | 8.11 | | | | 53,622,138 | |
| | | | | | | | |
| Total net assets | | | 100.00 | % | | $ | 660,936,946 | |
| | | | | | | | |
| 144A | The security may be resold in transactions exempt from registration, normally to qualified institutional buyers, pursuant to Rule 144A under the Securities Act of 1933. |
| ± | Variable rate investment. The rate shown is the rate in effect at period end. |
| (c) | Investment in an interest-only security entitles holders to receive only the interest payments on the underlying mortgages. The principal amount shown is the notional amount of the underlying mortgages. The rate represents the coupon rate. |
| %% | The security is issued on a when-issued basis. |
| ¤ | The security is issued in zero coupon form with no periodic interest payments. |
| (m) | The security is an auction-rate security which has an interest rate that resets at predetermined short-term intervals through a Dutch auction. The rate shown is the rate in effect at period end. |
| (n) | The auction to set the interest rate on the security failed at period end due to insufficient investor interest. A failed auction does not itself cause a default. |
| (s) | The security is currently in default with regards to scheduled interest and/or principal payments. The Fund has stopped accruing interest on the security. |
| (a) | The security is fair valued in accordance with procedures approved by the Board of Trustees. |
| (l) | The security represents an affiliate of the Fund as defined in the Investment Company Act of 1940. |
| (u) | The rate represents the 7-day annualized yield at period end. |
| ## | All or a portion of this security is segregated for when-issued securities. |
| # | All or a portion of this security is segregated as collateral for investments in derivative instruments. |
| (z) | Zero coupon security. The rate represents the current yield to maturity. |
| * | Cost for federal income tax purposes is $ 606,472,860 and unrealized gains (losses) consists of: |
| | | | |
Gross unrealized gains | | $ | 3,758,096 | |
Gross unrealized losses | | | (2,916,148 | ) |
| | | | |
Net unrealized gains | | $ | 841,948 | |
The accompanying notes are an integral part of these financial statements.
| | | | |
| 18 | | Wells Fargo Advantage Short-Term Bond Fund | | Statement of assets and liabilities—February 28, 2015 (unaudited) |
| | | | |
| | | | |
| |
Assets | | | | |
Investments | | | | |
In unaffiliated securities, at value (cost $571,124,974) | | $ | 571,966,922 | |
In affiliated securities, at value (cost $35,347,886) | | | 35,347,886 | |
| | | | |
Total investments, at value (cost $606,472,860) | | | 607,314,808 | |
Cash | | | 1,620,706 | |
Receivable for investments sold | | | 3,607,987 | |
Principal paydown receivable | | | 13,527 | |
Receivable for Fund shares sold | | | 60,183,764 | |
Receivable for interest | | | 4,154,357 | |
Receivable for daily variation margin on open futures contracts | | | 68,141 | |
Prepaid expenses and other assets | | | 26,646 | |
| | | | |
Total assets | | | 676,989,936 | |
| | | | |
| |
Liabilities | | | | |
Dividends payable | | | 184,077 | |
Payable for investments purchased | | | 14,724,428 | |
Payable for Fund shares redeemed | | | 815,412 | |
Payable for daily variation margin on open futures contracts | | | 4,517 | |
Advisory fee payable | | | 121,340 | |
Distribution fee payable | | | 7,920 | |
Administration fees payable | | | 87,820 | |
Accrued expenses and other liabilities | | | 107,476 | |
| | | | |
Total liabilities | | | 16,052,990 | |
| | | | |
Total net assets | | $ | 660,936,946 | |
| | | | |
| |
NET ASSETS CONSIST OF | | | | |
Paid-in capital | | $ | 658,945,635 | |
Undistributed net investment income | | | 22,588 | |
Accumulated net realized gains on investments | | | 1,125,253 | |
Net unrealized gains on investments | | | 843,470 | |
| | | | |
Total net assets | | $ | 660,936,946 | |
| | | | |
| |
COMPUTATION OF NET ASSET VALUE AND OFFERING PRICE PER SHARE | | | | |
Net assets – Class A | | $ | 61,357,852 | |
Shares outstanding – Class A1 | | | 6,980,148 | |
Net asset value per share – Class A | | | $8.79 | |
Maximum offering price per share – Class A2 | | | $8.97 | |
Net assets – Class C | | $ | 13,181,569 | |
Shares outstanding – Class C1 | | | 1,501,412 | |
Net asset value per share – Class C | | | $8.78 | |
Net assets – Institutional Class | | $ | 350,911,751 | |
Shares outstanding – Institutional Class1 | | | 39,908,873 | |
Net asset value per share – Institutional Class | | | $8.79 | |
Net assets – Investor Class | | $ | 235,485,774 | |
Shares outstanding – Investor Class1 | | | 26,804,492 | |
Net asset value per share – Investor Class | | | $8.79 | |
| 1 | The Fund has an unlimited number of authorized shares. |
| 2 | Maximum offering price is computed as 100/98 of net asset value. On investments of $50,000 or more, the offering price is reduced. |
The accompanying notes are an integral part of these financial statements.
| | | | | | |
| Statement of operations—six months ended February 28, 2015 (unaudited) | | Wells Fargo Advantage Short-Term Bond Fund | | | 19 | |
| | | | |
| | | | |
| |
Investment income | | | | |
Interest (net of foreign interest withholding taxes of $3,979) | | $ | 5,422,257 | |
Dividends | | | 29,321 | |
Income from affiliated securities | | | 14,742 | |
Securities lending income, net | | | 135 | |
| | | | |
Total investment income | | | 5,466,455 | |
| | | | |
| |
Expenses | | | | |
Advisory fee | | | 953,475 | |
Administration fees | | | | |
Fund level | | | 158,913 | |
Class A | | | 48,761 | |
Class C | | | 11,214 | |
Institutional Class | | | 128,266 | |
Investor Class | | | 228,015 | |
Shareholder servicing fees | | | | |
Class A | | | 76,190 | |
Class C | | | 17,522 | |
Investor Class | | | 299,782 | |
Distribution fee | | | | |
Class C | | | 52,567 | |
Custody and accounting fees | | | 20,775 | |
Professional fees | | | 26,042 | |
Registration fees | | | 30,401 | |
Shareholder report expenses | | | 21,914 | |
Trustees’ fees and expenses | | | 4,795 | |
Other fees and expenses | | | 6,548 | |
| | | | |
Total expenses | | | 2,085,180 | |
Less: Fee waivers and/or expense reimbursements | | | (87,877 | ) |
| | | | |
Net expenses | | | 1,997,303 | |
| | | | |
Net investment income | | | 3,469,152 | |
| | | | |
| |
REALIZED AND UNREALIZED GAINS (LOSSES) ON INVESTMENTS | | | | |
| |
Net realized gains on: | | | | |
Unaffiliated securities | | | 319,153 | |
Futures transactions | | | 921,964 | |
| | | | |
Net realized gains on investments | | | 1,241,117 | |
| | | | |
| |
Net change in unrealized gains (losses) on: | | | | |
Unaffiliated securities | | | (2,110,963 | ) |
Futures transactions | | | (110,842 | ) |
| | | | |
Net change in unrealized gains (losses) on investments | | | (2,221,805 | ) |
| | | | |
Net realized and unrealized gains (losses) on investments | | | (980,688 | ) |
| | | | |
Net increase in net assets resulting from operations | | $ | 2,488,464 | |
| | | | |
The accompanying notes are an integral part of these financial statements.
| | | | |
| 20 | | Wells Fargo Advantage Short-Term Bond Fund | | Statement of changes in net assets (unaudited) |
| | | | | | | | | | | | | | | | |
| | | Six months ended
February 28, 2015
(unaudited) | | | Year ended
August 31, 2014 | |
| | | | |
Operations | | | | | | | | | | | | | | | | |
Net investment income | | | | | | $ | 3,469,152 | | | | | | | $ | 8,049,360 | |
Net realized gains on investments | | | | | | | 1,241,117 | | | | | | | | 1,660,981 | |
Net change in unrealized gains (losses) on investments | | | | | | | (2,221,805 | ) | | | | | | | 2,395,846 | |
| | | | | | | | | | | | | | | | |
Net increase in net assets resulting from operations | | | | | | | 2,488,464 | | | | | | | | 12,106,187 | |
| | | | | | | | | | | | | | | | |
| | | | |
Distributions to shareholders from | | | | | | | | | | | | | | | | |
Net investment income | | | | | | | | | | | | | | | | |
Class A | | | | | | | (295,444 | ) | | | | | | | (785,936 | ) |
Class C | | | | | | | (15,564 | ) | | | | | | | (61,579 | ) |
Institutional Class | | | | | | | (2,015,531 | ) | | | | | | | (4,551,352 | ) |
Investor Class | | | | | | | (1,154,392 | ) | | | | | | | (2,784,889 | ) |
Net realized gains | | | | | | | | | | | | | | | | |
Class A | | | | | | | (151,151 | ) | | | | | | | 0 | |
Class C | | | | | | | (33,347 | ) | | | | | | | 0 | |
Institutional Class | | | | | | | (806,358 | ) | | | | | | | 0 | |
Investor Class | | | | | | | (572,046 | ) | | | | | | | 0 | |
| | | | | | | | | | | | | | | | |
Total distributions to shareholders | | | | | | | (5,043,833 | ) | | | | | | | (8,183,756 | ) |
| | | | | | | | | | | | | | | | |
| | | | |
Capital share transactions | | | Shares | | | | | | | | Shares | | | | | |
Proceeds from shares sold | | | | | | | | | | | | | | | | |
Class A | | | 2,258,184 | | | | 19,895,689 | | | | 4,711,737 | | | | 41,479,785 | |
Class C | | | 189,919 | | | | 1,668,671 | | | | 485,053 | | | | 4,264,729 | |
Institutional Class | | | 14,901,843 | | | | 131,147,954 | | | | 22,820,784 | | | | 201,021,960 | |
Investor Class | | | 2,137,045 | | | | 18,806,658 | | | | 5,760,381 | | | | 50,701,458 | |
| | | | | | | | | | | | | | | | |
| | | | | | | 171,518,972 | | | | | | | | 297,467,932 | |
| | | | | | | | | | | | | | | | |
Reinvestment of distributions | | | | | | | | | | | | | | | | |
Class A | | | 43,618 | | | | 383,354 | | | | 76,536 | | | | 674,307 | |
Class C | | | 4,348 | | | | 38,130 | | | | 5,618 | | | | 49,419 | |
Institutional Class | | | 191,272 | | | | 1,681,878 | | | | 303,096 | | | | 2,671,966 | |
Investor Class | | | 185,373 | | | | 1,628,308 | | | | 295,606 | | | | 2,603,622 | |
| | | | | | | | | | | | | | | | |
| | | | | | | 3,731,670 | | | | | | | | 5,999,314 | |
| | | | | | | | | | | | | | | | |
Payment for shares redeemed | | | | | | | | | | | | | | | | |
Class A | | | (2,118,516 | ) | | | (18,644,157 | ) | | | (5,499,067 | ) | | | (48,464,493 | ) |
Class C | | | (378,361 | ) | | | (3,325,836 | ) | | | (710,751 | ) | | | (6,249,544 | ) |
Institutional Class | | | (12,644,748 | ) | | | (111,173,277 | ) | | | (16,348,750 | ) | | | (144,017,590 | ) |
Investor Class | | | (3,576,984 | ) | | | (31,444,580 | ) | | | (6,315,079 | ) | | | (55,569,852 | ) |
| | | | | | | | | | | | | | | | |
| | | | | | | (164,587,850 | ) | | | | | | | (254,301,479 | ) |
| | | | | | | | | | | | | | | | |
Net increase in net assets resulting from capital share transactions | | | | | | | 10,662,792 | | | | | | | | 49,165,767 | |
| | | | | | | | | | | | | | | | |
Total increase in net assets | | | | | | | 8,107,423 | | | | | | | | 53,088,198 | |
| | | | | | | | | | | | | | | | |
| | | | |
Net assets | | | | | | | | | | | | | | | | |
Beginning of period | | | | | | | 652,829,523 | | | | | | | | 599,741,325 | |
| | | | | | | | | | | | | | | | |
End of period | | | | | | $ | 660,936,946 | | | | | | | $ | 652,829,523 | |
| | | | | | | | | | | | | | | | |
Undistributed net investment income | | | | | | $ | 22,588 | | | | | | | $ | 34,367 | |
| | | | | | | | | | | | | | | | |
The accompanying notes are an integral part of these financial statements.
| | | | | | |
| Financial highlights | | Wells Fargo Advantage Short-Term Bond Fund | | | 21 | |
(For a share outstanding throughout each period)
| | | | | | | | | | | | | | | | | | | | | | | | | | | | |
| | | Six months ended
February 28, 2015 (unaudited) | | | Year ended August 31 | | | Year ended May 31, 2010 | |
| CLASS A | | | 2014 | | | 2013 | | | 2012 | | | 2011 | | | 20101 | | |
Net asset value, beginning of period | | | $8.82 | | | | $8.77 | | | | $8.81 | | | | $8.76 | | | | $8.73 | | | | $8.66 | | | | $8.23 | |
Net investment income | | | 0.04 | | | | 0.10 | | | | 0.10 | | | | 0.14 | | | | 0.16 | | | | 0.05 | | | | 0.23 | |
Net realized and unrealized gains (losses) on investments | | | (0.01 | ) | | | 0.05 | | | | (0.04 | ) | | | 0.05 | | | | 0.04 | | | | 0.07 | | | | 0.46 | |
| | | | | | | | | | | | | | | | | | | | | | | | | | | | |
Total from investment operations | | | 0.03 | | | | 0.15 | | | | 0.06 | | | | 0.19 | | | | 0.20 | | | | 0.12 | | | | 0.69 | |
Distributions to shareholders from | | | | | | | | | | | | | | | | | | | | | | | | | | | | |
Net investment income | | | (0.04 | ) | | | (0.10 | ) | | | (0.10 | ) | | | (0.14 | ) | | | (0.17 | ) | | | (0.05 | ) | | | (0.26 | ) |
Net realized gains | | | (0.02 | ) | | | 0.00 | | | | 0.00 | | | | 0.00 | | | | 0.00 | | | | 0.00 | | | | 0.00 | |
| | | | | | | | | | | | | | | | | | | | | | | | | | | | |
Total distributions to shareholders | | | (0.06 | ) | | | (0.10 | ) | | | (0.10 | ) | | | (0.14 | ) | | | (0.17 | ) | | | (0.05 | ) | | | (0.26 | ) |
Net asset value, end of period | | | $8.79 | | | | $8.82 | | | | $8.77 | | | | $8.81 | | | | $8.76 | | | | $8.73 | | | | $8.66 | |
Total return2 | | | 0.38 | % | | | 1.72 | % | | | 0.72 | % | | | 2.22 | % | | | 2.33 | % | | | 1.37 | % | | | 8.43 | % |
Ratios to average net assets (annualized) | | | | | | | | | | | | | | | | | | | | | | | | | | | | |
Gross expenses | | | 0.79 | % | | | 0.82 | % | | | 0.87 | % | | | 0.90 | % | | | 0.89 | % | | | 0.89 | % | | | 0.93 | % |
Net expenses | | | 0.75 | % | | | 0.78 | % | | | 0.80 | % | | | 0.80 | % | | | 0.80 | % | | | 0.80 | % | | | 0.80 | % |
Net investment income | | | 0.97 | % | | | 1.12 | % | | | 1.17 | % | | | 1.63 | % | | | 1.84 | % | | | 2.05 | % | | | 2.64 | % |
Supplemental data | | | | | | | | | | | | | | | | | | | | | | | | | | | | |
Portfolio turnover rate | | | 29 | % | | | 70 | % | | | 75 | % | | | 44 | % | | | 51 | % | | | 11 | % | | | 45 | % |
Net assets, end of period (000s omitted) | | | $61,358 | | | | $59,962 | | | | $65,812 | | | | $69,247 | | | | $56,555 | | | | $47,121 | | | | $41,369 | |
| 1 | For the three months ended August 31, 2010. The Fund changed its fiscal year end from May 31 to August 31, effective August 31, 2010. |
| 2 | Total return calculations do not include any sales charges. Returns for periods of less than one year are not annualized. |
The accompanying notes are an integral part of these financial statements.
| | | | |
| 22 | | Wells Fargo Advantage Short-Term Bond Fund | | Financial highlights |
(For a share outstanding throughout each period)
| | | | | | | | | | | | | | | | | | | | | | | | | | | | |
| | | Six months ended
February 28, 2015 (unaudited) | | | Year ended August 31 | | | Year ended May 31, 2010 | |
| CLASS C | | | 2014 | | | 2013 | | | 2012 | | | 2011 | | | 20101 | | |
Net asset value, beginning of period | | | $8.81 | | | | $8.76 | | | | $8.80 | | | | $8.75 | | | | $8.73 | | | | $8.65 | | | | $8.22 | |
Net investment income | | | 0.01 | | | | 0.03 | | | | 0.04 | | | | 0.08 | | | | 0.10 | | | | 0.03 | | | | 0.16 | |
Net realized and unrealized gains (losses) on investments | | | (0.01 | ) | | | 0.05 | | | | (0.04 | ) | | | 0.05 | | | | 0.03 | | | | 0.08 | | | | 0.46 | |
| | | | | | | | | | | | | | | | | | | | | | | | | | | | |
Total from investment operations | | | 0.00 | | | | 0.08 | | | | 0.00 | | | | 0.13 | | | | 0.13 | | | | 0.11 | | | | 0.62 | |
Distributions to shareholders from | | | | | | | | | | | | | | | | | | | | | | | | | | | | |
Net investment income | | | (0.01 | ) | | | (0.03 | ) | | | (0.04 | ) | | | (0.08 | ) | | | (0.11 | ) | | | (0.03 | ) | | | (0.19 | ) |
Net realized gains | | | (0.02 | ) | | | 0.00 | | | | 0.00 | | | | 0.00 | | | | 0.00 | | | | 0.00 | | | | 0.00 | |
| | | | | | | | | | | | | | | | | | | | | | | | | | | | |
Total distributions to shareholders | | | (0.03 | ) | | | (0.03 | ) | | | (0.04 | ) | | | (0.08 | ) | | | (0.11 | ) | | | (0.03 | ) | | | (0.19 | ) |
Net asset value, end of period | | | $8.78 | | | | $8.81 | | | | $8.76 | | | | $8.80 | | | | $8.75 | | | | $8.73 | | | | $8.65 | |
Total return2 | | | 0.00 | % | | | 0.97 | % | | | (0.03 | )% | | | 1.46 | % | | | 1.45 | % | | | 1.29 | % | | | 7.61 | % |
Ratios to average net assets (annualized) | | | | | | | | | | | | | | | | | | | | | | | | | | | | |
Gross expenses | | | 1.55 | % | | | 1.57 | % | | | 1.62 | % | | | 1.65 | % | | | 1.65 | % | | | 1.65 | % | | | 1.68 | % |
Net expenses | | | 1.50 | % | | | 1.53 | % | | | 1.55 | % | | | 1.55 | % | | | 1.55 | % | | | 1.55 | % | | | 1.55 | % |
Net investment income | | | 0.22 | % | | | 0.37 | % | | | 0.42 | % | | | 0.89 | % | | | 1.10 | % | | | 1.28 | % | | | 1.70 | % |
Supplemental data | | | | | | | | | | | | | | | | | | | | | | | | | | | | |
Portfolio turnover rate | | | 29 | % | | | 70 | % | | | 75 | % | | | 44 | % | | | 51 | % | | | 11 | % | | | 45 | % |
Net assets, end of period (000s omitted) | | | $13,182 | | | | $14,852 | | | | $16,686 | | | | $18,501 | | | | $19,510 | | | | $14,299 | | | | $11,050 | |
| 1 | For the three months ended August 31, 2010. The Fund changed its fiscal year end from May 31 to August 31, effective August 31, 2010. |
| 2 | Total return calculations do not include any sales charges. Returns for periods of less than one year are not annualized. |
The accompanying notes are an integral part of these financial statements.
| | | | | | |
| Financial highlights | | Wells Fargo Advantage Short-Term Bond Fund | | | 23 | |
(For a share outstanding throughout each period)
| | | | | | | | | | | | | | | | | | | | | | | | | | | | |
| | | Six months ended
February 28, 2015 (unaudited) | | | Year ended August 31 | | | Year ended May 31, 2010 | |
| INSTITUTIONAL CLASS | | | 2014 | | | 2013 | | | 2012 | | | 2011 | | | 20101 | | |
Net asset value, beginning of period | | | $8.83 | | | | $8.77 | | | | $8.81 | | | | $8.77 | | | | $8.74 | | | | $8.66 | | | | $8.24 | |
Net investment income | | | 0.07 | | | | 0.12 | | | | 0.13 | | | | 0.17 | | | | 0.19 | | | | 0.06 | | | | 0.25 | |
Net realized and unrealized gains (losses) on investments | | | (0.03 | ) | | | 0.07 | | | | (0.04 | ) | | | 0.04 | | | | 0.04 | | | | 0.08 | | | | 0.45 | |
| | | | | | | | | | | | | | | | | | | | | | | | | | | | |
Total from investment operations | | | 0.04 | | | | 0.19 | | | | 0.09 | | | | 0.21 | | | | 0.23 | | | | 0.14 | | | | 0.70 | |
Distributions to shareholders from | | | | | | | | | | | | | | | | | | | | | | | | | | | | |
Net investment income | | | (0.06 | ) | | | (0.13 | ) | | | (0.13 | ) | | | (0.17 | ) | | | (0.20 | ) | | | (0.06 | ) | | | (0.28 | ) |
Net realized gains | | | (0.02 | ) | | | 0.00 | | | | 0.00 | | | | 0.00 | | | | 0.00 | | | | 0.00 | | | | 0.00 | |
| | | | | | | | | | | | | | | | | | | | | | | | | | | | |
Total distributions to shareholders | | | (0.08 | ) | | | (0.13 | ) | | | (0.13 | ) | | | (0.17 | ) | | | (0.20 | ) | | | (0.06 | ) | | | 0.00 | |
Net asset value, end of period | | | $8.79 | | | | $8.83 | | | | $8.77 | | | | $8.81 | | | | $8.77 | | | | $8.74 | | | | $8.66 | |
Total return2 | | | 0.41 | % | | | 2.15 | % | | | 1.04 | % | | | 2.43 | % | | | 2.66 | % | | | 1.57 | % | | | 8.65 | % |
Ratios to average net assets (annualized) | | | | | | | | | | | | | | | | | | | | | | | | | | | | |
Gross expenses | | | 0.46 | % | | | 0.49 | % | | | 0.53 | % | | | 0.57 | % | | | 0.56 | % | | | 0.56 | % | | | 0.58 | % |
Net expenses | | | 0.46 | % | | | 0.47 | % | | | 0.48 | % | | | 0.48 | % | | | 0.48 | % | | | 0.48 | % | | | 0.48 | % |
Net investment income | | | 1.25 | % | | | 1.42 | % | | | 1.47 | % | | | 1.95 | % | | | 2.17 | % | | | 2.38 | % | | | 2.84 | % |
Supplemental data | | | | | | | | | | | | | | | | | | | | | | | | | | | | |
Portfolio turnover rate | | | 29 | % | | | 70 | % | | | 75 | % | | | 44 | % | | | 51 | % | | | 11 | % | | | 45 | % |
Net assets, end of period (000s omitted) | | | $350,912 | | | | $330,613 | | | | $269,123 | | | | $282,512 | | | | $327,124 | | | | $292,080 | | | | $285,559 | |
| 1 | For the three months ended August 31, 2010. The Fund changed its fiscal year end from May 31 to August 31, effective August 31, 2010. |
| 2 | Returns for periods of less than one year are not annualized. |
The accompanying notes are an integral part of these financial statements.
| | | | |
| 24 | | Wells Fargo Advantage Short-Term Bond Fund | | Financial highlights |
(For a share outstanding throughout each period)
| | | | | | | | | | | | | | | | | | | | | | | | | | | | |
| | | Six months ended
February 28, 2015 (unaudited) | | | Year ended August 31 | | | Year ended May 31, 2010 | |
| INVESTOR CLASS | | | 2014 | | | 2013 | | | 2012 | | | 2011 | | | 20101 | | |
Net asset value, beginning of period | | | $8.82 | | | | $8.76 | | | | $8.80 | | | | $8.76 | | | | $8.73 | | | | $8.66 | | | | $8.23 | |
Net investment income | | | 0.04 | | | | 0.09 | | | | 0.10 | | | | 0.14 | | | | 0.16 | | | | 0.05 | | | | 0.23 | |
Net realized and unrealized gains (losses) on investments | | | (0.01 | ) | | | 0.07 | | | | (0.04 | ) | | | 0.04 | | | | 0.04 | | | | 0.07 | | | | 0.45 | |
| | | | | | | | | | | | | | | | | | | | | | | | | | | | |
Total from investment operations | | | 0.03 | | | | 0.16 | | | | 0.06 | | | | 0.18 | | | | 0.20 | | | | 0.12 | | | | 0.68 | |
Distributions to shareholders from | | | | | | | | | | | | | | | | | | | | | | | | | | | | |
Net investment income | | | (0.04 | ) | | | (0.10 | ) | | | (0.10 | ) | | | (0.14 | ) | | | (0.17 | ) | | | (0.05 | ) | | | (0.25 | ) |
Net realized gains | | | (0.02 | ) | | | 0.00 | | | | 0.00 | | | | 0.00 | | | | 0.00 | | | | 0.00 | | | | 0.00 | |
| | | | | | | | | | | | | | | | | | | | | | | | | | | | |
Total distributions to shareholders | | | (0.06 | ) | | | (0.10 | ) | | | (0.10 | ) | | | (0.14 | ) | | | (0.17 | ) | | | (0.05 | ) | | | (0.25 | ) |
Net asset value, end of period | | | $8.79 | | | | $8.82 | | | | $8.76 | | | | $8.80 | | | | $8.76 | | | | $8.73 | | | | $8.66 | |
Total return2 | | | 0.37 | % | | | 1.83 | % | | | 0.70 | % | | | 2.08 | % | | | 2.30 | % | | | 1.36 | % | | | 8.38 | % |
Ratios to average net assets (annualized) | | | | | | | | | | | | | | | | | | | | | | | | | | | | |
Gross expenses | | | 0.82 | % | | | 0.85 | % | | | 0.90 | % | | | 0.93 | % | | | 0.92 | % | | | 0.94 | % | | | 0.99 | % |
Net expenses | | | 0.76 | % | | | 0.79 | % | | | 0.82 | % | | | 0.83 | % | | | 0.83 | % | | | 0.84 | % | | | 0.85 | % |
Net investment income | | | 0.96 | % | | | 1.10 | % | | | 1.15 | % | | | 1.61 | % | | | 1.82 | % | | | 2.02 | % | | | 2.73 | % |
Supplemental data | | | | | | | | | | | | | | | | | | | | | | | | | | | | |
Portfolio turnover rate | | | 29 | % | | | 70 | % | | | 75 | % | | | 44 | % | | | 51 | % | | | 11 | % | | | 45 | % |
Net assets, end of period (000s omitted) | | | $235,486 | | | | $247,403 | | | | $248,120 | | | | $248,254 | | | | $248,514 | | | | $266,746 | | | | $267,625 | |
| 1 | For the three months ended August 31, 2010. The Fund changed its fiscal year end from May 31 to August 31, effective August 31, 2010. |
| 2 | Returns for periods of less than one year are not annualized. |
The accompanying notes are an integral part of these financial statements.
| | | | | | |
| Notes to financial statements (unaudited) | | Wells Fargo Advantage Short-Term Bond Fund | | | 25 | |
1. ORGANIZATION
Wells Fargo Funds Trust (the “Trust”), a Delaware statutory trust organized on March 10, 1999, is an open-end management investment company registered under the Investment Company Act of 1940, as amended (the “1940 Act”). As an investment company, the Trust follows the accounting and reporting guidance in Financial Accounting Standards Board (“FASB”) Accounting Standards Codification Topic 946, Financial Services – Investment Companies. These financial statements report on the Wells Fargo Advantage Short-Term Bond Fund (the “Fund”) which is a diversified series of the Trust.
2. SIGNIFICANT ACCOUNTING POLICIES
The following significant accounting policies, which are consistently followed in the preparation of the financial statements of the Fund, are in conformity with U.S. generally accepted accounting principles which require management to make estimates and assumptions that affect the reported amounts of assets and liabilities, disclosure of contingent assets and liabilities at the date of the financial statements, and the reported amounts of revenues and expenses during the reporting period. Actual results could differ from those estimates.
Securities valuation
All investments are valued each business day as of the close of regular trading on the New York Stock Exchange (generally 4 p.m. Eastern Time).
Debt securities are valued at the evaluated bid price provided by an independent pricing service or, if a reliable price is not available, the quoted bid price from an independent broker-dealer.
Equity securities and futures that are listed on a foreign or domestic exchange or market are valued at the official closing price or, if none, the last sales price. If no sale occurs on the primary exchange or market that day, the prior day’s price will be deemed “stale” and a fair value price will be determined in accordance with the Fund’s Valuation Procedures.
Equity securities that are not listed on a foreign or domestic exchange or market, but have a public trading market, are valued at the quoted bid price from an independent broker-dealer that the Management Valuation Team of Wells Fargo Funds Management, LLC (“Funds Management”) has determined is an acceptable source.
Investments in registered open-end investment companies are valued at net asset value. Interests in non-registered investment vehicles that are redeemable at net asset value are fair valued at net asset value when available.
Investments which are not valued using any of the methods discussed above are valued at their fair value, as determined in good faith by the Board of Trustees of the Fund. The Board of Trustees has established a Valuation Committee comprised of the Trustees and has delegated to it the authority to take any actions regarding the valuation of portfolio securities that the Valuation Committee deems necessary or appropriate, including determining the fair value of portfolio securities, unless the determination has been delegated to the Management Valuation Team. The Board of Trustees retains the authority to make or ratify any valuation decisions or approve any changes to the Valuation Procedures as it deems appropriate. On a quarterly basis, the Board of Trustees receives reports on any valuation actions taken by the Valuation Committee or the Management Valuation Team which may include items for ratification.
Valuations of fair valued securities are compared to the next actual sales price when available, or other appropriate market values, to assess the continued appropriateness of the fair valuation methodologies used. These securities are fair valued on a day-to-day basis, taking into consideration changes to appropriate market information and any significant changes to the inputs considered in the valuation process until there is a readily available price provided on an exchange or by an independent pricing service. Valuations received from an independent pricing service or independent broker-dealer quotes are periodically validated by comparisons to most recent trades and valuations provided by other independent pricing services in addition to the review of prices by the adviser and/or subadviser. Unobservable inputs used in determining fair valuations are identified based on the type of security, taking into consideration factors utilized by market participants in valuing the investment, knowledge about the issuer and the current market environment.
Security loans
The Fund may lend its securities from time to time in order to earn additional income in the form of fees or interest on securities received as collateral or the investment of any cash received as collateral. The Fund continues to receive interest or dividends on the securities loaned. The Fund receives collateral in the form of cash or securities with a value at least equal to the value of the securities on loan. The value of the loaned securities is determined at the close of each business day and any additional required collateral is delivered to the Fund on the next business day. In a securities lending transaction, the net asset value of the Fund will be affected by an increase or decrease in the value of the securities loaned and by an increase or decrease in the value of the instrument in which collateral is invested. The amount
| | | | |
| 26 | | Wells Fargo Advantage Short-Term Bond Fund | | Notes to financial statements (unaudited) |
of securities lending activity undertaken by the Fund fluctuates from time to time. In the event of default or bankruptcy by the borrower, the Fund may be prevented from recovering the loaned securities or gaining access to the collateral or may experience delays or costs in doing so. In addition, the investment of any cash collateral received may lose all or part of its value. The Fund has the right under the lending agreement to recover the securities from the borrower on demand.
The Fund lends its securities through an unaffiliated securities lending agent. Cash collateral received in connection with its securities lending transactions is invested in Securities Lending Cash Investments, LLC (the “Securities Lending Fund”). The Securities Lending Fund is exempt from registration under Section 3(c)(7) of the 1940 Act and is managed by Funds Management and is subadvised by Wells Capital Management Incorporated (“WellsCap”). Funds Management receives an advisory fee starting at 0.05% and declining to 0.01% as the average daily net assets of the Securities Lending Fund increase. All of the fees received by Funds Management are paid to WellsCap for its services as subadviser. The Securities Lending Fund seeks to provide a positive return compared to the daily Fed Funds Open rate by investing in high-quality, U.S. dollar-denominated short-term money market instruments. Securities Lending Fund investments are fair valued based upon the amortized cost valuation technique. Income earned from investment in the Securities Lending Fund is included in securities lending income on the Statement of Operations.
When-issued transactions
The Fund may purchase securities on a forward commitment or when-issued basis. The Fund records a when-issued transaction on the trade date and will segregate assets in an amount at least equal in value to the Fund’s commitment to purchase when-issued securities. Securities purchased on a when-issued basis are marked-to-market daily and the Fund begins earning interest on the settlement date. Losses may arise due to changes in the market value of the underlying securities or if the counterparty does not perform under the contract.
Futures contracts
The Fund is subject to interest rate risk in the normal course of pursuing its investment objectives. The Fund may buy and sell futures contracts in order to gain exposure to, or protect against, changes in security values and interest rates. The primary risks associated with the use of futures contracts are the imperfect correlation between changes in market values of securities held by the Fund and the prices of futures contracts, and the possibility of an illiquid market.
The aggregate principal amounts of the contracts are not recorded in the financial statements. Fluctuations in the value of the contracts are recorded in the Statement of Assets and Liabilities as an asset or liability and in the Statement of Operations as unrealized gains or losses until the contracts are closed, at which point they are recorded as net realized gains or losses on futures contracts. With futures contracts, there is minimal counterparty risk to the Fund since futures are exchange traded and the exchange’s clearinghouse, as counterparty to all exchange traded futures, guarantees the futures against default.
Security transactions and income recognition
Securities transactions are recorded on a trade date basis. Realized gains or losses are recorded on the basis of identified cost.
Interest income is accrued daily and bond discounts are accreted and premiums are amortized daily based on the effective interest method. To the extent debt obligations are placed on non-accrual status, any related interest income may be reduced by writing off interest receivables when the collection of all or a portion of interest has become doubtful based on consistently applied procedures. If the issuer subsequently resumes interest payments or when the collectability of interest is reasonably assured, the debt obligation is removed from non-accrual status.
Dividend income is recognized on the ex-dividend date.
Income from foreign securities is recorded net of foreign taxes withheld where recovery of such taxes is not assured.
Distributions to shareholders
Distributions to shareholders from net investment income are accrued daily and paid monthly. Distributions from net realized gains, if any, are recorded on the ex-dividend date. Such distributions are determined in conformity with federal income tax regulations, which may differ in amount or character from net investment income and realized gains recognized for purposes of U.S. generally accepted accounting principles.
Federal and other taxes
The Fund intends to continue to qualify as a regulated investment company by distributing substantially all of its investment company taxable income and any net realized capital gains (after reduction for capital loss carryforwards) sufficient to relieve it from all, or substantially all, federal income taxes. Accordingly, no provision for federal income taxes was required.
| | | | | | |
| Notes to financial statements (unaudited) | | Wells Fargo Advantage Short-Term Bond Fund | | | 27 | |
The Fund’s income and federal excise tax returns and all financial records supporting those returns for the prior three fiscal years are subject to examination by the federal and Delaware revenue authorities. Management has analyzed the Fund’s tax positions taken on federal, state, and foreign tax returns for all open tax years and does not believe that there are any uncertain tax positions that require recognition of a tax liability.
Class allocations
The separate classes of shares offered by the Fund differ principally in applicable sales charges, distribution, shareholder servicing, and administration fees. Class specific expenses are charged directly to that share class. Investment income, common expenses, and realized and unrealized gains (losses) on investments are allocated daily to each class of shares based on the relative proportion of net assets of each class.
3. FAIR VALUATION MEASUREMENTS
Fair value measurements of investments are determined within a framework that has established a fair value hierarchy based upon the various data inputs utilized in determining the value of the Fund’s investments. The three-level hierarchy gives the highest priority to unadjusted quoted prices in active markets for identical assets or liabilities (Level 1) and the lowest priority to significant unobservable inputs (Level 3). The Fund’s investments are classified within the fair value hierarchy based on the lowest level of input that is significant to the fair value measurement. The inputs are summarized into three broad levels as follows:
| n | | Level 1 – quoted prices in active markets for identical securities |
| n | | Level 2 – other significant observable inputs (including quoted prices for similar securities, interest rates, prepayment speeds, credit risk, use of amortized cost, etc.) |
| n | | Level 3 – significant unobservable inputs (including the Fund’s own assumptions in determining the fair value of investments) |
The inputs or methodologies used for valuing investments in securities are not necessarily an indication of the risk associated with investing in those securities.
The following is a summary of the inputs used in valuing the Fund’s assets and liabilities as of February 28, 2015:
| | | | | | | | | | | | | | | | |
| | | Quoted prices
(Level 1) | | | Other significant
observable inputs
(Level 2) | | | Significant
unobservable inputs
(Level 3) | | | Total | |
Assets | | | | | | | | | | | | | | | | |
Investments in : | | | | | | | | | | | | | | | | |
| | | | |
Agency securities | | | 0 | | | | 80,288,401 | | | | 0 | | | | 80,288,401 | |
| | | | |
Asset-backed securities | | | 0 | | | | 53,493,601 | | | | 0 | | | | 53,493,601 | |
| | | | |
Corporate bonds and notes | | | 0 | | | | 236,103,293 | | | | 0 | | | | 236,103,293 | |
| | | | |
Municipal obligations | | | 0 | | | | 22,139,582 | | | | 3,865,688 | | | | 26,005,270 | |
| | | | |
Non-agency mortgage-backed securities | | | 0 | | | | 77,283,541 | | | | 0 | | | | 77,283,541 | |
| | | | |
Preferred stocks | | | | | | | | | | | | | | | | |
Financials | | | 0 | | | | 0 | | | | 1,626,446 | | | | 1,626,446 | |
| | | | |
U.S. Treasury securities | | | 4,536,723 | | | | 0 | | | | 0 | | | | 4,536,723 | |
| | | | |
Yankee corporate bonds and notes | | | 0 | | | | 92,154,650 | | | | 0 | | | | 92,154,650 | |
| | | | |
Short-term investments | | | | | | | | | | | | | | | | |
Investment companies | | | 35,347,886 | | | | 0 | | | | 0 | | | | 35,347,886 | |
U.S. Treasury securities | | | 474,997 | | | | 0 | | | | 0 | | | | 474,997 | |
| | | 40,359,606 | | | | 561,463,068 | | | | 5,492,134 | | | | 607,314,808 | |
| | | | |
Futures contracts | | | 68,141 | | | | 0 | | | | 0 | | | | 68,141 | |
Total assets | | $ | 40,427,747 | | | $ | 561,463,068 | | | $ | 5,492,134 | | | $ | 607,382,949 | |
Liabilities | | | | | | | | | | | | | | | | |
| | | | |
Futures contracts | | $ | 4,517 | | | $ | 0 | | | $ | 0 | | | $ | 4,517 | |
Total liabilities | | $ | 4,517 | | | $ | 0 | | | $ | 0 | | | $ | 4,517 | |
| | | | |
| 28 | | Wells Fargo Advantage Short-Term Bond Fund | | Notes to financial statements (unaudited) |
Futures contracts are reported at their variation margin at measurement date, which represents the amount due to/from the Fund at that date. All other assets and liabilities are reported at their market value at measurement date.
The Fund recognizes transfers between levels within the fair value hierarchy at the end of the reporting period. At February 28, 2015, the Fund did not have any transfers into/out of Level 1, Level 2, or Level 3.
4. TRANSACTIONS WITH AFFILIATES
Advisory fee
The Trust has entered into an advisory contract with Funds Management, an indirect wholly owned subsidiary of Wells Fargo & Company (“Wells Fargo”). The adviser is responsible for implementing investment policies and guidelines and for supervising the subadviser, who is responsible for day-to-day portfolio management of the Fund.
Pursuant to the contract, Funds Management is entitled to receive an annual advisory fee starting at 0.30% and declining to 0.225% as the average daily net assets of the Fund increase. For the six months ended February 28, 2015, the advisory fee was equivalent to an annual rate of 0.30% of the Fund’s average daily net assets.
Funds Management has retained the services of a subadviser to provide daily portfolio management to the Fund. The fee for subadvisory services is borne by Funds Management. WellsCap, an affiliate of Funds Management and an indirect wholly owned subsidiary of Wells Fargo, is the subadviser to the Fund and is entitled to receive a fee from Funds Management at an annual rate starting at 0.15% and declining to 0.05% as the average daily net assets of the Fund increase.
Administration fees
The Trust has entered into an administration agreement with Funds Management. Under this agreement, for providing administrative services, which includes paying fees and expenses for services provided by the transfer agent, sub-transfer agents, omnibus account servicers and record-keepers, Funds Management is entitled to receive from the Fund an annual fund level administration fee starting at 0.05% and declining to 0.03% as the average daily net assets of the Fund increase and a class level administration fee which is calculated based on the average daily net assets of each class as follows:
| | | | |
| | | Class level
administration fee | |
Class A, Class C | | | 0.16 | % |
Institutional Class | | | 0.08 | |
Investor Class | | | 0.19 | |
Funds Management has contractually waived and/or reimbursed advisory and administration fees to the extent necessary to maintain certain net operating expense ratios for the Fund. Waiver of fees and/or reimbursement of expenses by Funds Management were made first from fund level expenses on a proportionate basis and then from class specific expenses. Funds Management has committed through December 31, 2015, to waive fees and/or reimburse expenses to the extent necessary to cap the Fund’s expenses at 0.72% for Class A shares, 1.47% for Class C shares, 0.48% for Institutional Class shares, and 0.73% for Investor Class shares. After this time, the cap may be increased or the commitment to maintain the cap may be terminated only with the approval of the Board of Trustees. Prior to January 1, 2015, the Fund’s expenses were capped at 0.77% for Class A shares, 1.52% for Class C shares and 0.78% for Investor Class shares.
Distribution fee
The Trust has adopted a Distribution Plan for Class C shares of the Fund pursuant to Rule 12b-1 under the 1940 Act. A distribution fee is charged to Class C shares and paid to Wells Fargo Funds Distributor, LLC (“Funds Distributor”), the principal underwriter, at an annual rate of 0.75% of the average daily net assets of Class C shares.
In addition, Funds Distributor is entitled to receive the front-end sales charge from the purchase of Class A shares and a contingent deferred sales charge on the redemption of certain shares. Funds Distributor is also entitled to receive the contingent deferred sales charges from redemptions of Class B and Class C shares. For the six months ended February 28, 2015, Funds Distributor received $723 from the sale of Class A shares.
Shareholder servicing fees
The Trust has entered into contracts with one or more shareholder servicing agents, whereby Class A, Class C, and Investor Class of the Fund is charged a fee at an annual rate of 0.25% of the average daily net assets of each respective class.
| | | | | | |
| Notes to financial statements (unaudited) | | Wells Fargo Advantage Short-Term Bond Fund | | | 29 | |
A portion of these total shareholder servicing fees were paid to affiliates of Wells Fargo.
5. INVESTMENT PORTFOLIO TRANSACTIONS
Purchases and sales of investments, excluding short-term securities, for the six months ended February 28, 2015 were as follows:
| | | | | | |
Purchases at cost | | Sales proceeds |
U.S.
government | | Non-U.S.
government | | U.S.
government | | Non-U.S.
government |
| $6,843,293 | | $198,245,064 | | $1,614,000 | | $170,535,081 |
6. DERIVATIVE TRANSACTIONS
During the six months ended February 28, 2015, the Fund entered into futures contracts to speculate on interest rates and to help manage the duration of the portfolio.
At February 28, 2015, the Fund had long futures contracts outstanding as follows:
| | | | | | | | | | | | | | | | | | |
| Expiration date | | Counterparty | | | Contracts | | Type | | | Contract value at February 28, 2015 | | | Unrealized
gains (losses) | |
6-30-2015 | | | JPMorgan | | | 623 Long | | | 2-Year U.S. Treasury Notes | | | $ | 136,174,173 | | | $ | 2,130 | |
6-30-2015 | | | JPMorgan | | | 24 Long | | | 5-Year U.S. Treasury Notes | | | | 2,862,750 | | | | (608 | ) |
The Fund had an average notional amount of $197,657,818 and $7,009,615 in long and short futures contracts, respectively, during the six months ended February 28, 2015.
On February 28, 2015, the cumulative unrealized gains on futures contracts in the amount of $1,522 are reflected in net unrealized gains on investments on the Statement of Assets and Liabilities. The receivable and payable for daily variation margin on open futures contracts reflected in the Statement of Assets and Liabilities only represents the current day’s variation margin. The realized gains and change in unrealized gains (losses) on futures contracts are reflected in the Statement of Operations.
For certain types of derivative transactions, the Fund has entered into International Swaps and Derivatives Association, Inc. master agreements (“ISDA Master Agreements”) or similar agreements with approved counterparties. The ISDA Master Agreements or similar agreements may have requirements to deliver/deposit securities or cash to/with an exchange or broker-dealer as collateral and allows the Fund to offset, with each counterparty, certain derivative financial instrument’s assets and/or liabilities with collateral held or pledged. Collateral requirements differ by type of derivative. Collateral or margin requirements are set by the broker or exchange clearing house for exchange traded derivatives while collateral terms are contract specific for over-the-counter traded derivatives. Cash collateral that has been pledged to cover obligations of the Fund under ISDA Master Agreements or similar agreements, if any, will be reported separately in the Statement of Assets and Liabilities. Securities pledged as collateral, if any, for the same purpose are noted in the Portfolio of Investments. With respect to balance sheet offsetting, absent an event of default by the counterparty or a termination of the agreement, the reported amounts of financial assets and financial liabilities in the Statement of Assets and Liabilities are not offset across transactions between the Fund and the applicable counterparty. A reconciliation of the gross amounts on the Statement of Assets and Liabilities to the net amounts by derivative type, including any collateral exposure, is as follows:
| | | | | | | | | | | | | | | | |
| Derivative type | | Counterparty | | Gross amounts
of assets in the
Statement of
Assets and
Liabilities | | Amounts
subject to
netting
agreements | | | Collateral
received | | | Net amount
of assets | |
Futures – variation margin | | JPMorgan | | $68,141 | | $ | (4,517 | ) | | $ | 0 | | | $ | 63,624 | |
| | | | | | | | | | | | | | | | |
| Derivative type | | Counterparty | | Gross amounts
of liabilities in the
Statement of
Assets and
Liabilities | | Amounts
subject to
netting
agreements | | | Collateral
pledged | | | Net amount
of liabilities | |
Futures – variation margin | | JPMorgan | | $4,517 | | $ | (4,517 | ) | | $ | 0 | | | $ | 0 | |
| | | | |
| 30 | | Wells Fargo Advantage Short-Term Bond Fund | | Notes to financial statements (unaudited) |
7. BANK BORROWINGS
The Trust (excluding the money market funds and certain other funds in the Trust) and Wells Fargo Variable Trust are parties to a $150,000,000 revolving credit agreement, whereby the Fund is permitted to use bank borrowings for temporary or emergency purposes, such as to fund shareholder redemption requests. Interest under the credit agreement is charged to the Fund based on a borrowing rate equal to the higher of the Federal Funds rate in effect on that day plus 1.25% or the overnight LIBOR rate in effect on that day plus 1.25%. In addition, an annual commitment fee equal to 0.10% of the unused balance is allocated to each participating fund. For the six months ended February 28, 2015, the Fund paid $363 in commitment fees.
For the six months ended February 28, 2015, there were no borrowings by the Fund under the agreement.
8. INDEMNIFICATION
Under the Trust’s organizational documents, the officers and Trustees are indemnified against certain liabilities that may arise out of performance of their duties to the Trust. Additionally, in the normal course of business, the Trust may enter into contracts with service providers that contain a variety of indemnification clauses. The Trust’s maximum exposure under these arrangements is dependent on future claims that may be made against the Fund and, therefore, cannot be estimated.
| | | | | | |
| Other information (unaudited) | | Wells Fargo Advantage Short-Term Bond Fund | | | 31 | |
PROXY VOTING INFORMATION
A description of the policies and procedures that the Fund uses to determine how to vote proxies relating to portfolio securities is available, upon request, by calling 1-800-222-8222, visiting our website at wellsfargoadvantagefunds.com, or visiting the SEC website at sec.gov. Information regarding how the Fund voted proxies relating to portfolio securities during the most recent 12-month period ended June 30 is available on the Fund’s website at wellsfargoadvantagefunds.com or by visiting the SEC website at sec.gov.
PORTFOLIO HOLDINGS INFORMATION
The complete portfolio holdings for the Fund are publicly available monthly on the Fund’s website (wellsfargoadvantagefunds.com), on a one-month delayed basis. In addition, top ten holdings information (excluding derivative positions) for the Fund is publicly available on the Fund’s website on a monthly, seven-day or more delayed basis. The Fund files its complete schedule of portfolio holdings with the SEC for the first and third quarters of each fiscal year on Form N-Q, which is available by visiting the SEC website at sec.gov. In addition, the Fund’s Form N-Q may be reviewed and copied at the SEC’s Public Reference Room in Washington, DC, and at regional offices in New York City, at 233 Broadway, and in Chicago, at 175 West Jackson Boulevard, Suite 900. Information about the Public Reference Room may be obtained by calling 1-800-SEC-0330.
| | | | |
| 32 | | Wells Fargo Advantage Short-Term Bond Fund | | Other information (unaudited) |
BOARD OF TRUSTEES AND OFFICERS
Each of the Trustees and Officers1 listed in the table below acts in identical capacities for each fund in the Wells Fargo Advantage family of funds, which consists of 134 mutual funds comprising the Wells Fargo Funds Trust, Wells Fargo Variable Trust, Wells Fargo Master Trust and four closed-end funds (collectively the “Fund Complex”). This table should be read in conjunction with the Prospectus and the Statement of Additional Information2. The mailing address of each Trustee and Officer is 525 Market Street, 12th Floor, San Francisco, CA 94105. Each Trustee and Officer serves an indefinite term, however, each Trustee serves such term until reaching the mandatory retirement age established by the Trustees.
Independent Trustees
| | | | | | |
Name and year of birth | | Position held and length of service* | | Principal occupations during past five years or longer | | Other directorships during
past five years |
William R. Ebsworth (Born 1957) | | Trustee, since 2015** | | Retired. From 1984 to 2013, equities analyst, portfolio manager, research director at Fidelity Management and Research Company and retired in 2013 as Chief Investment Officer of Fidelity Strategic Advisers, Inc. in Boston, Tokyo, and Hong Kong where he led a team of investment professionals managing client assets. Prior thereto, Board member of Hong Kong Securities Clearing Co., Hong Kong Options Clearing Corp., the Thailand International Fund, Ltd., Fidelity Investments Life Insurance Company, and Empire Fidelity Investments Life Insurance Company. Mr. Ebsworth is an Adjunct Lecturer, Finance, at Babson College and a Chartered Financial Analyst. | | Asset Allocation Trust |
Jane A. Freeman
(Born 1953) | | Trustee, since 2015** | | Retired. From 2012 to 2014 and 1999 to 2008, Chief Financial Officer of Scientific Learning Corporation. From 2008 to 2012, Ms. Freeman provided consulting services related to strategic business projects. Prior thereto, Portfolio Manager at Rockefeller & Co. and Scudder, Stevens & Clark. Board member of the Harding Loevner Funds from 1996 to 2014, serving as both Lead Independent Director and chair of the Audit Committee. Board member of the Russell Exchange Traded Funds Trust from 2011 to 2012 and the chair of the Audit Committee. Ms. Freeman is a Chartered Financial Analyst (inactive), Chair of Taproot Foundation (non-profit organization) and a Board Member of Ruth Bancroft Garden (non-profit organization). | | Asset Allocation Trust |
Peter G. Gordon
(Born 1942) | | Trustee, since 1998; Chairman, since 2005 | | Co-Founder, Retired Chairman, President and CEO of Crystal Geyser Water Company. Trustee Emeritus, Colby College. | | Asset Allocation Trust |
Isaiah Harris, Jr.
(Born 1952) | | Trustee, since 2009 | | Retired. Chairman of the Board of CIGNA Corporation since 2009, and Director since 2005. From 2003 to 2011, Director of Delux Corporation. Prior thereto, President and CEO of BellSouth Advertising and Publishing Corp. from 2005 to 2007, President and CEO of BellSouth Enterprises from 2004 to 2005 and President of BellSouth Consumer Services from 2000 to 2003. Emeritus member of the Iowa State University Foundation Board of Governors. Emeritus Member of the Advisory Board of Iowa State University School of Business. Advisory Board Member, Palm Harbor Academy. Mr. Harris is a certified public accountant. | | CIGNA Corporation; Asset Allocation Trust |
Judith M. Johnson
(Born 1949) | | Trustee, since 2008; Audit Committee Chairman, since 2008 | | Retired. Prior thereto, Chief Executive Officer and Chief Investment Officer of Minneapolis Employees Retirement Fund from 1996 to 2008. Ms. Johnson is an attorney, certified public accountant and a certified managerial accountant. | | Asset Allocation Trust |
David F. Larcker
(Born 1950) | | Trustee, since 2009 | | James Irvin Miller Professor of Accounting at the Graduate School of Business, Stanford University, Morgan Stanley Director of the Center for Leadership Development and Research and Senior Faculty of The Rock Center for Corporate Governance since 2006. From 2005 to 2008, Professor of Accounting at the Graduate School of Business, Stanford University. Prior thereto, Ernst & Young Professor of Accounting at The Wharton School, University of Pennsylvania from 1985 to 2005. | | Asset Allocation Trust |
Olivia S. Mitchell
(Born 1953) | | Trustee, since 2006 | | International Foundation of Employee Benefit Plans Professor, Wharton School of the University of Pennsylvania since 1993. Director of Wharton’s Pension Research Council and Boettner Center on Pensions & Retirement Research, and Research Associate at the National Bureau of Economic Research. Previously, Cornell University Professor from 1978 to 1993. | | Asset Allocation Trust |
| | | | | | |
| Other information (unaudited) | | Wells Fargo Advantage Short-Term Bond Fund | | | 33 | |
| | | | | | |
Name and year of birth | | Position held and length of service* | | Principal occupations during past five years or longer | | Other directorships during
past five years |
Timothy J. Penny
(Born 1951) | | Trustee, since 1996 | | President and Chief Executive Officer of Southern Minnesota Initiative Foundation, a non-profit organization, since 2007 and Senior Fellow at the Humphrey Institute Policy Forum at the University of Minnesota since 1995. Member of the Board of Trustees of NorthStar Education Finance, Inc., a non-profit organization, since 2007. | | Asset Allocation Trust |
Michael S. Scofield
(Born 1943) | | Trustee, since 2010 | | Served on the Investment Company Institute’s Board of Governors and Executive Committee from 2008-2011 as well the Governing Council of the Independent Directors Council from 2006-2011 and the Independent Directors Council Executive Committee from 2008-2011. Chairman of the IDC from 2008-2010. Institutional Investor (Fund Directions) Trustee of Year in 2007. Trustee of the Evergreen Funds complex (and its predecessors) from 1984 to 2010. Chairman of the Evergreen Funds from 2000-2010. Former Trustee of the Mentor Funds. Retired Attorney, Law Offices of Michael S. Scofield. | | Asset Allocation Trust |
Donald C. Willeke
(Born 1940) | | Trustee, since 1996 | | Principal of the law firm of Willeke & Daniels. General Counsel of the Minneapolis Employees Retirement Fund from 1984 until its consolidation into the Minnesota Public Employees Retirement Association on June 30, 2010. Director and Vice Chair of The Tree Trust (non-profit corporation). Director of the American Chestnut Foundation (non-profit corporation). | | Asset Allocation Trust |
| * | Length of service dates reflect the Trustee’s commencement of service with the Trust’s predecessor entities, where applicable. |
| ** | William R. Ebsworth and Jane A. Freeman each became a Trustee effective January 1, 2015. |
Officers
| | | | | | |
Name and year of birth | | Position held and
length of service | | Principal occupations during past five years or longer | | |
Karla M. Rabusch
(Born 1959) | | President, since 2003 | | Executive Vice President of Wells Fargo Bank, N.A. and President of Wells Fargo Funds Management, LLC since 2003. | | |
Nancy Wiser1
(Born 1967) | | Treasurer, since 2012 | | Executive Vice President of Wells Fargo Funds Management, LLC since 2011. Chief Operating Officer and Chief Compliance Officer at LightBox Capital Management LLC, from 2008 to 2011. Owned and operated a consulting business providing services to various hedge funds including acting as Chief Operating Officer and Chief Compliance Officer for a hedge fund from 2007 to 2008. Chief Operating Officer and Chief Compliance Officer of GMN Capital LLC from 2006 to 2007. | | |
C. David Messman
(Born 1960) | | Secretary, since 2000; Chief Legal Officer, since 2003 | | Senior Vice President and Secretary of Wells Fargo Funds Management, LLC since 2001. Assistant General Counsel of Wells Fargo Bank, N.A. since 2013 and Vice President and Managing Counsel of Wells Fargo Bank N.A. from 1996 to 2013. | | |
Debra Ann Early (Born 1964) | | Chief Compliance Officer, since 2007 | | Senior Vice President of Wells Fargo Funds Management, LLC since 2007 and Chief Compliance Officer from 2007 to 2014. Chief Compliance Officer of Parnassus Investments from 2005 to 2007. Chief Financial Officer of Parnassus Investments from 2004 to 2007 and Senior Audit Manager of PricewaterhouseCoopers LLP from 1998 to 2004. | | |
David Berardi (Born 1975) | | Assistant Treasurer, since 2009 | | Vice President of Wells Fargo Funds Management, LLC since 2009. Vice President of Evergreen Investment Management Company, LLC from 2008 to 2010. Assistant Vice President of Evergreen Investment Services, Inc. from 2004 to 2008. Manager of Fund Reporting and Control for Evergreen Investment Management Company, LLC from 2004 to 2010. | | |
Jeremy DePalma1
(Born 1974) | | Assistant Treasurer, since 2009 | | Senior Vice President of Wells Fargo Funds Management, LLC since 2009. Senior Vice President of Evergreen Investment Management Company, LLC from 2008 to 2010. Vice President, Evergreen Investment Services, Inc. from 2004 to 2007. Head of the Fund Reporting and Control Team within Fund Administration from 2005 to 2010. | | |
| 1 | Nancy Wiser acts as Treasurer of 73 funds in the Fund Complex. Jeremy DePalma acts as Treasurer of 61 funds and Assistant Treasurer of 73 funds in the Fund Complex. |
| 2 | The Statement of Additional Information includes additional information about the Trustees and is available, without charge, upon request, by calling
1-800-222-8222 or by visiting the website at wellsfargoadvantagefunds.com. |
| | | | |
| 34 | | Wells Fargo Advantage Short-Term Bond Fund | | List of abbreviations |
The following is a list of common abbreviations for terms and entities that may have appeared in this report.
| ACA | — ACA Financial Guaranty Corporation |
| ADR | — American depositary receipt |
| ADS | — American depositary shares |
| AGC | — Assured Guaranty Corporation |
| AGM | — Assured Guaranty Municipal |
| Ambac | — Ambac Financial Group Incorporated |
| AMT | — Alternative minimum tax |
| BAN | — Bond anticipation notes |
| BHAC | — Berkshire Hathaway Assurance Corporation |
| CAB | — Capital appreciation bond |
| CCAB | — Convertible capital appreciation bond |
| CDA | — Community Development Authority |
| CDO | — Collateralized debt obligation |
| DRIVER | — Derivative inverse tax-exempt receipts |
| DW&P | — Department of Water & Power |
| DWR | — Department of Water Resources |
| ECFA | — Educational & Cultural Facilities Authority |
| EDA | — Economic Development Authority |
| EDFA | — Economic Development Finance Authority |
| ETF | — Exchange-traded fund |
| FDIC | — Federal Deposit Insurance Corporation |
| FFCB | — Federal Farm Credit Banks |
| FGIC | — Financial Guaranty Insurance Corporation |
| FHA | — Federal Housing Administration |
| FHLB | — Federal Home Loan Bank |
| FHLMC | — Federal Home Loan Mortgage Corporation |
| FICO | — The Financing Corporation |
| FNMA | — Federal National Mortgage Association |
| GDR | — Global depositary receipt |
| GNMA | — Government National Mortgage Association |
| HCFR | — Healthcare facilities revenue |
| HEFA | — Health & Educational Facilities Authority |
| HEFAR | — Higher education facilities authority revenue |
| HFA | — Housing Finance Authority |
| HFFA | — Health Facilities Financing Authority |
| HUD | — Department of Housing and Urban Development |
| IDA | — Industrial Development Authority |
| IDAG | — Industrial Development Agency |
| KRW | — Republic of Korea won |
| LIBOR | — London Interbank Offered Rate |
| LIFER | — Long Inverse Floating Exempt Receipts |
| LLC | — Limited liability company |
| LLLP | — Limited liability limited partnership |
| LLP | — Limited liability partnership |
| MBIA | — Municipal Bond Insurance Association |
| MFHR | — Multifamily housing revenue |
| MSTR | — Municipal securities trust receipts |
| MUD | — Municipal Utility District |
| National | — National Public Finance Guarantee Corporation |
| PCFA | — Pollution Control Financing Authority |
| PCL | — Public Company Limited |
| PCR | — Pollution control revenue |
| PFA | — Public Finance Authority |
| PFFA | — Public Facilities Financing Authority |
| PFOTER | — Puttable floating option tax-exempt receipts |
| plc | — Public limited company |
| PUTTER | — Puttable tax-exempt receipts |
| R&D | — Research & development |
| Radian | — Radian Asset Assurance |
| RAN | — Revenue anticipation notes |
| RDA | — Redevelopment Authority |
| RDFA | — Redevelopment Finance Authority |
| REIT | — Real estate investment trust |
| ROC | — Reset option certificates |
| SAVRS | — Select auction variable rate securities |
| SBA | — Small Business Authority |
| SFHR | — Single-family housing revenue |
| SFMR | — Single-family mortgage revenue |
| SPA | — Standby purchase agreement |
| SPDR | — Standard & Poor’s Depositary Receipts |
| SPEAR | — Short Puttable Exempt Adjustable Receipts |
| STRIPS | — Separate trading of registered interest and |
| TAN | — Tax anticipation notes |
| TIPS | — Treasury inflation-protected securities |
| TRAN | — Tax revenue anticipation notes |
| TTFA | — Transportation Trust Fund Authority |
| TVA | — Tennessee Valley Authority |
This page is intentionally left blank.
This page is intentionally left blank.


For more information
More information about Wells Fargo Advantage Funds is available free upon request. To obtain literature, please write, email, visit the Fund’s website, or call:
Wells Fargo Advantage Funds
P.O. Box 8266
Boston, MA 02266-8266
Email: wfaf@wellsfargo.com
Website: wellsfargoadvantagefunds.com
Individual investors: 1-800-222-8222
Retail investment professionals: 1-888-877-9275
Institutional investment professionals: 1-866-765-0778
This report and the financial statements contained herein are submitted for the general information of the shareholders of Wells Fargo Advantage Funds. If this report is used for promotional purposes, distribution of the report must be accompanied or preceded by a current prospectus. Before investing, please consider the investment objectives, risks, charges, and expenses of the investment. For a current prospectus and, if available, a summary prospectus, containing this information, call 1-800-222-8222 or visit the Fund’s website at wellsfargoadvantagefunds.com. Read the prospectus carefully before you invest or send money.
Wells Fargo Funds Management, LLC, a wholly owned subsidiary of Wells Fargo & Company, provides investment advisory and administrative services for Wells Fargo Advantage Funds. Other affiliates of Wells Fargo & Company provide subadvisory and other services for the Funds. The Funds are distributed by Wells Fargo Funds Distributor, LLC, Member FINRA/SIPC, an affiliate of Wells Fargo & Company.
NOT FDIC INSURED ¡ NO BANK GUARANTEE ¡ MAY LOSE VALUE
© 2015 Wells Fargo Funds Management, LLC. All rights reserved.
| | |
 | | 232058 04-15 SA221/SAR221 02-15 |

Wells Fargo Advantage
Short-Term High Yield Bond Fund

Semi-Annual Report
February 28, 2015

Reduce clutter. Save trees.
Sign up for electronic delivery of prospectuses and shareholder reports at wellsfargo.com/advantagedelivery
Contents
The views expressed and any forward-looking statements are as of February 28, 2015, unless otherwise noted, and are those of the Fund managers and/or Wells Fargo Funds Management, LLC. Discussions of individual securities, or the markets generally, or any Wells Fargo Advantage Fund are not intended as individual recommendations. Future events or results may vary significantly from those expressed in any forward-looking statements; the views expressed are subject to change at any time in response to changing circumstances in the market. Wells Fargo Funds Management, LLC and the Fund disclaim any obligation to publicly update or revise any views expressed or forward-looking statements.
NOT FDIC INSURED ¡ NO BANK GUARANTEE ¡ MAY LOSE VALUE
| | | | |
| 2 | | Wells Fargo Advantage Short-Term High Yield Bond Fund | | Letter to shareholders (unaudited) |

Karla M. Rabusch
President
Wells Fargo Advantage Funds
Major central banks continued to inject liquidity into global banks and markets through various accommodative monetary policies, including quantitative easing.
Dear Valued Shareholder:
We are pleased to offer you this semi-annual report for the Wells Fargo Advantage Short-Term High Yield Bond Fund for the six-month period that ended February 28, 2015. The period was marked by low interest rates, a large decline in oil prices, and moderate U.S. economic growth. Investment-grade bonds, as measured by the Barclays U.S. Aggregate Bond Index1, returned 2.25% during the period.
Major central banks continued to provide stimulus.
Major central banks continued to inject liquidity into global banks and markets through various accommodative monetary policies, including quantitative easing. In the U.S., the Federal Reserve (Fed) kept its key interest rate near zero in order to support the economy and the financial system. It ended its quantitative easing program in October 2014 and also set expectations for it to begin normalizing monetary policy with higher target ranges for the federal funds rate in 2015.
Meanwhile, European markets continued to benefit from the European Central Bank’s (ECB’s) willingness to maintain low interest rates. In September 2014, the ECB cut its key rate to a historic low of 0.05%. In addition to its targeted longer-term refinancing operations that are designed to increase bank lending, the ECB said it intends to increase the size of its balance sheet, a result of quantitative easing, by buying eurozone government bonds. In Japan, the Bank of Japan maintained an aggressive monetary program aimed at combating deflation.
U.S. economic growth was moderate, and oil prices plummeted.
Economic growth advanced during the reporting period, the unemployment rate ticked lower to 5.5% as of February 2015, and inflation remained below the Fed’s longer-run objective of a 2% pace. The period was also marked by dramatically lower oil prices, which fell from more than $90 per barrel at the end of August 2014 to below $50 per barrel at the end of February 2015. While lower oil prices benefited consumers of oil products, the lower prices pressured companies within the energy sector.
Longer-dated securities and higher-rated credits were top performers.
Ten-year U.S. Treasury rates declined during the period, from 2.35% at end of August 2014 to 2.03% by the end of February 2015, benefiting both from safe-haven status as well as relative attractiveness to global investors. With the U.S. economy the furthest along its business cycle, the level of interest rates in the U.S. and Europe diverged. The 10-year U.S. Treasury yield was 2.03% at the end of February 2015 compared with 0.30% for 10-year German government yields, 173 basis points (bps; 100 bps equals 1.00%) higher. This was largely attributed to the Fed being closer to eventually increasing interest rates while the ECB potentially needs to further increase, rather than scale back, its amount of accommodation. Further, U.S. economic activity was healthier than Europe’s.
Treasury bonds with maturities greater than 20 years returned more than 10% during the six-month period that ended February 28, 2015, according to the Barclays U.S. Aggregate Bond Index. This was due, in part, to strong demand from overseas investors because yields in Europe and Japan were substantially lower than U.S. yields. In addition, because the dollar strengthened, the returns from Treasuries were even higher for foreign-domiciled investors. Longer-maturity debt across all sectors outperformed shorter-dated securities.
| 1 | The Barclays U.S. Aggregate Bond Index is a broad-based benchmark that measures the investment-grade, U.S. dollar-denominated, fixed-rate taxable bond market, including Treasuries, government-related and corporate securities, MBS (agency fixed-rate and hybrid ARM passthroughs), ABS, and CMBS. You cannot invest directly in an index. |
| | | | | | |
| Letter to shareholders (unaudited) | | Wells Fargo Advantage Short-Term High Yield Bond Fund | | | 3 | |
Investment-grade corporate bonds returned 2.29% during the six-month reporting period, according to the Barclays U.S. Aggregate Bond Index, and AAA-rated2 bonds had higher returns than BBB-rated bonds. Lower-rated credits, including high yield, underperformed as oil prices fell dramatically. Not only were many energy and mining companies negatively affected, but investor trepidation about weak global growth caused investment-grade spreads to modestly widen while high-yield spreads widened substantially.
Don’t let short-term uncertainty derail long-term investment goals.
Periods of uncertainty can present challenges, but experience has taught us that maintaining long-term investment goals can be an effective way to plan for the future. To help you create a sound strategy based on your personal goals and risk tolerance, Wells Fargo Advantage Funds offers more than 100 mutual funds and other investments spanning a wide range of asset classes and investment styles. Although diversification cannot guarantee an investment profit or prevent losses, we believe it can be an effective way to manage investment risk and potentially smooth out overall portfolio performance. We encourage investors to know their investments and to understand that appropriate levels of risk-taking may unlock opportunities.
Thank you for choosing to invest with Wells Fargo Advantage Funds. We appreciate your confidence in us and remain committed to helping you meet your financial needs. For current information about your fund investments, contact your investment professional, visit our website at wellsfargoadvantagefunds.com, or call us directly at 1-800-222-8222. We are available 24 hours a day, 7 days a week.
Sincerely,

Karla M. Rabusch
President
Wells Fargo Advantage Funds
Periods of uncertainty can present challenges, but experience has taught us that maintaining long-term investment goals can be an effective way to plan for the future.
| 2 | The ratings indicated are from Standard & Poor’s, Moody’s Investors Service, and/or Fitch Ratings Ltd. Standard & Poor’s rates the creditworthiness of bonds from AAA (highest) to D (lowest). Ratings from A to CCC may be modified by the addition of a plus (+) or minus (-) sign to show relative standing within the rating categories. Moody’s rates the creditworthiness of bonds from Aaa (highest) to C (lowest). Ratings Aa to B may be modified by the addition of a number 1 (highest) to 3 (lowest) to show relative standing within the ratings categories. Fitch rates the creditworthiness of bonds from AAA (highest) to D (lowest). |
| | | | |
| 4 | | Wells Fargo Advantage Short-Term High Yield Bond Fund | | Performance highlights (unaudited) |
Investment objective
The Fund seeks total return, consisting of a high level of current income and capital appreciation.
Adviser
Wells Fargo Funds Management, LLC
Subadviser
Wells Capital Management Incorporated
Portfolio managers
Kevin J. Maas, CFA
Thomas M. Price, CFA
Michael J. Schueller, CFA
Average annual total returns1 (%) as of February 28, 2015
| | | | | | | | | | | | | | | | | | | | | | | | | | | | | | | | | | |
| | | | | Including sales charge | | | Excluding sales charge | | | Expense ratios2 (%) | |
| | | Inception date | | 1 year | | | 5 year | | | 10 year | | | 1 year | | | 5 year | | | 10 year | | | Gross | | | Net3 | |
| Class A (SSTHX) | | 2-29-2000 | | | (1.41 | ) | | | 3.63 | | | | 3.94 | | | | 1.63 | | | | 4.26 | | | | 4.26 | | | | 0.92 | | | | 0.83 | |
| Class C (WFHYX) | | 3-31-2008 | | | (0.12 | ) | | | 3.49 | | | | 3.50 | | | | 0.88 | | | | 3.49 | | | | 3.50 | | | | 1.67 | | | | 1.58 | |
| Administrator Class (WDHYX) | | 7-30-2010 | | | – | | | | – | | | | – | | | | 1.80 | | | | 4.41 | | | | 4.33 | | | | 0.86 | | | | 0.67 | |
| Institutional Class (STYIX) | | 11-30-2012 | | | – | | | | – | | | | – | | | | 1.95 | | | | 4.44 | | | | 4.35 | | | | 0.59 | | | | 0.52 | |
| Investor Class (STHBX) | | 6-30-1997 | | | – | | | | – | | | | – | | | | 1.60 | | | | 4.23 | | | | 4.25 | | | | 0.95 | | | | 0.86 | |
| BofA Merrill Lynch High Yield U.S. Corporates, Cash Pay, BB Rated, 1-5 Year Index4 | | – | | | – | | | | – | | | | – | | | | 3.28 | | | | 7.64 | | | | 7.01 | | | | – | | | | – | |
| BofA Merrill Lynch High Yield U.S. Corporates, Cash Pay, B Rated, 1-5 Year Index5 | | – | | | – | | | | – | | | | – | | | | 1.36 | | | | 8.03 | | | | 7.33 | | | | – | | | | – | |
| Short-Term High Yield Bond Index III6 | | – | | | – | | | | – | | | | – | | | | 2.71 | | | | 7.76 | | | | 7.14 | | | | – | | | | – | |
Figures quoted represent past performance, which is no guarantee of future results, and do not reflect taxes that a shareholder may pay on fund distributions or the redemption of fund shares. Investment return and principal value of an investment will fluctuate so that an investor’s shares, when redeemed, may be worth more or less than their original cost. Performance shown without sales charges would be lower if sales charges were reflected. Current performance may be lower or higher than the performance data quoted, which assumes the reinvestment of dividends and capital gains. Current month-end performance is available on the Fund’s website, wellsfargoadvantagefunds.com.
Index returns do not include transaction costs associated with buying and selling securities, any mutual fund fees or expenses, or any taxes. It is not possible to invest directly in an index.
For Class A shares, the maximum front-end sales charge is 3.00%. For Class C shares, the maximum contingent deferred sales charge is 1.00%. Performance including a contingent deferred sales charge assumes the sales charge for the corresponding time period. Administrator Class, Institutional Class, and Investor Class shares are sold without a front-end sales charge or contingent deferred sales charge.
Bond values fluctuate in response to the financial condition of individual issuers, general market and economic conditions, and changes in interest rates. Changes in market conditions and government policies may lead to periods of heightened volatility in the bond market and reduced liquidity for certain bonds held by the fund. In general, when interest rates rise, bond values fall and investors may lose principal value. Interest-rate changes and their impact on the fund and its share price can be sudden and unpredictable. High-yield securities have a greater risk of default and tend to be more volatile than higher-rated debt securities. Loans are subject to risks similar to those associated with other below-investment-grade bond investments, such as credit risk (for example, risk of issuer default), below-investment-grade bond risk (for example, risk of greater volatility in value), and risk that the loan may become illiquid or difficult to price. The use of derivatives may reduce returns and/or increase volatility. Certain investment strategies tend to increase the total risk of an investment (relative to the broader market). The Fund is exposed to foreign investment risk. Consult the Fund’s prospectus for additional information on these and other risks.
Please see footnotes on page 5.
| | | | | | |
| Performance highlights (unaudited) | | Wells Fargo Advantage Short-Term High Yield Bond Fund | | | 5 | |
| | | | |
| Ten largest long-term holdings7 (%) as of February 28, 2015 | |
Chesapeake Energy Corporation, 3.50%, 4-15-2019 | | | 1.50 | |
CIT Group Incorporated, 4.25%, 8-15-2017 | | | 1.44 | |
CCO Holdings LLC , 7.38%, 6-1-2020 | | | 1.44 | |
Sally Holdings Incorporated, 6.88%, 11-15-2019 | | | 1.36 | |
Case New Holland Industrial Incorporated, 7.88%, 12-1-2017 | | | 1.28 | |
Ineos US Finance LLC, 3.75%, 5-4-2018 | | | 1.22 | |
AES Corporation, 8.00%, 10-15-2017 | | | 1.21 | |
Virgin Media Investment Holdings Limited, 3.50%, 6-7-2020 | | | 1.20 | |
NRG Energy Incorporated, 7.63%, 1-15-2018 | | | 1.20 | |
SESI LLC, 6.38%, 5-1-2019 | | | 1.17 | |
|
| Credit quality8 as of February 28, 2015 |
|
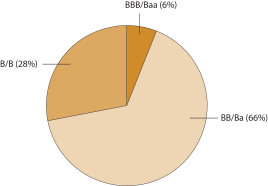 |
| 1 | Effective June 20, 2008, Advisor Class was renamed Class A and modified to assume the features and attributes of Class A. Historical performance shown for Class A shares through June 19, 2008, includes Advisor Class expenses. Historical performance shown for Class C shares prior to their inception reflects the performance of Investor Class shares, adjusted to include the higher expenses applicable to Class C shares. Historical performance shown for Administrator Class shares prior to their inception reflects the performance of Class A shares and includes the higher expenses applicable to Class A shares. If these expenses had not been included, returns would be higher. Historical performance shown for Institutional Class shares prior to their inception reflects the performance of Administrator Class shares and includes the higher expenses applicable to Administrator Class shares. If these expenses had not been included, returns would be higher. |
| 2 | Reflects the expense ratios as stated in the most recent prospectuses, which include the impact of 0.02% in acquired fund fees and expenses. The expense ratios shown are subject to change and may differ from the annualized expense ratios shown in the financial highlights of this report, which do not include acquired fund fees and expenses. |
| 3 | The Adviser has committed through December 31, 2015, to waive fees and/or reimburse expenses to the extent necessary to cap the Fund’s Total Annual Fund Operating Expenses After Fee Waiver, excluding certain expenses, at 0.81% for Class A, 1.56% for Class C, 0.65% for Administrator Class, 0.50% for Institutional Class, and 0.84% for Investor Class. After this time, the cap may be increased or the commitment to maintain the cap may be terminated only with the approval of the Board of Trustees. Brokerage commissions, stamp duty fees, interest, taxes, acquired fund fees and expenses, and extraordinary expenses are excluded from the cap. Without this cap, the Fund’s returns would have been lower. |
| 4 | The BofA Merrill Lynch High Yield U.S. Corporates, Cash Pay, BB Rated, 1-5 Year Index is an unmanaged index that generally tracks the performance of BB rated U.S. dollar-denominated corporate bonds publicly issued in the U.S. domestic market with maturities of one to five years. You cannot invest directly in an index. |
| 5 | The BofA Merrill Lynch High Yield U.S. Corporates, Cash Pay, B Rated, 1-5 Year Index is an unmanaged index that generally tracks the performance of B rated U.S. dollar-denominated corporate bonds publicly issued in the U.S. domestic market with maturities of one to five years. You cannot invest directly in an index. |
| 6 | The Short-Term High Yield Bond Index III is comprised of 70% of BofA Merrill Lynch High Yield U.S. Corporates, Cash Pay, BB Rated, 1-5 Year Index and 30% of BofA Merrill Lynch High Yield U.S. Corporates, Cash Pay, B Rated, 1-5 Year Index. The BofA Merrill Lynch High Yield U.S. Corporates, Cash Pay, BB Rated, 1-5 Year Index is an unmanaged index that generally tracks the performance of BB rated U.S. dollar-denominated corporate bonds publicly issued in the U.S. domestic market with maturities of one to five years. The BofA Merrill Lynch High Yield U.S. Corporates, Cash Pay, B Rated, 1-5 Year Index is an unmanaged index that generally tracks the performance of B rated U.S. dollar-denominated corporate bonds publicly issued in the U.S. domestic market with maturities of one to five years. You cannot invest directly in an index. |
| 7 | The ten largest long-term holdings are calculated based on the value of the securities divided by total net assets of the Fund. Holdings are subject to change and may have changed since the date specified. |
| 8 | The credit quality distribution of portfolio holdings reflected in the chart is based on ratings from Standard & Poor’s, Moody’s Investors Service, and/or Fitch Ratings Ltd. Credit quality ratings apply to the underlying holdings of the Fund and not to the Fund itself. The percentages of the Fund’s portfolio with the ratings depicted in the chart are calculated based on the total market value of fixed income securities held by the Fund. If a security was rated by all three rating agencies, the middle rating was utilized. If rated by two of three rating agencies, the lower rating was utilized, and if rated by one of the rating agencies, that rating was utilized. Standard & Poor’s rates the creditworthiness of bonds, ranging from AAA (highest) to D (lowest). Ratings from A to CCC may be modified by the addition of a plus (+) or minus (-) sign to show relative standing within the rating categories. Standard & Poor’s rates the creditworthiness of short-term notes from SP-1 (highest) to SP-3 (lowest). Moody’s rates the creditworthiness of bonds, ranging from Aaa (highest) to C (lowest). Ratings Aa to B may be modified by the addition of a number 1 (highest) to 3 (lowest) to show relative standing within the ratings categories. Moody’s rates the creditworthiness of short-term U.S. tax-exempt municipal securities from MIG 1/VMIG 1 (highest) to SG (lowest). Fitch rates the creditworthiness of bonds, ranging from AAA (highest) to D (lowest). Credit quality and credit quality ratings are subject to change and may have changed since the date specified. |
| | | | |
| 6 | | Wells Fargo Advantage Short-Term High Yield Bond Fund | | Fund expenses (unaudited) |
As a shareholder of the Fund, you incur two types of costs: (1) transaction costs, including sales charges (loads) on purchase payments and contingent deferred sales charges (if any) on redemptions and (2) ongoing costs, including management fees, distribution (12b-1) and/or shareholder service fees, and other Fund expenses. This example is intended to help you understand your ongoing costs (in dollars) of investing in the Fund and to compare these costs with the ongoing costs of investing in other mutual funds.
The example is based on an investment of $1,000 invested at the beginning of the six-month period and held for the entire period from September 1, 2014 to February 28, 2015.
Actual expenses
The “Actual” line of the table below provides information about actual account values and actual expenses. You may use the information in this line, together with the amount you invested, to estimate the expenses that you paid over the period. Simply divide your account value by $1,000 (for example, an $8,600 account value divided by $1,000 = 8.6), then multiply the result by the number in the “Actual” line under the heading entitled “Expenses paid during period” for your applicable class of shares to estimate the expenses you paid on your account during this period.
Hypothetical example for comparison purposes
The “Hypothetical” line of the table below provides information about hypothetical account values and hypothetical expenses based on the Fund’s actual expense ratio and an assumed rate of return of 5% per year before expenses, which is not the Fund’s actual return. The hypothetical account values and expenses may not be used to estimate the actual ending account balance or expenses you paid for the period. You may use this information to compare the ongoing costs of investing in the Fund and other funds. To do so, compare this 5% hypothetical example with the 5% hypothetical examples that appear in the shareholder reports of the other funds.
Please note that the expenses shown in the table are meant to highlight your ongoing costs only and do not reflect any transactional costs, such as sales charges (loads) and contingent deferred sales charges. Therefore, the “Hypothetical” line of the table is useful in comparing ongoing costs only and will not help you determine the relative total costs of owning different funds. In addition, if these transactional costs were included, your costs would have been higher.
| | | | | | | | | | | | | | | | |
| | | Beginning
account value
9-1-2014 | | | Ending
account value
2-28-2015 | | | Expenses
paid during
the period¹ | | | Net annualized
expense ratio | |
Class A | | | | | | | | | | | | | | | | |
Actual | | $ | 1,000.00 | | | $ | 1,008.69 | | | $ | 4.03 | | | | 0.81 | % |
Hypothetical (5% return before expenses) | | $ | 1,000.00 | | | $ | 1,020.78 | | | $ | 4.06 | | | | 0.81 | % |
Class C | | | | | | | | | | | | | | | | |
Actual | | $ | 1,000.00 | | | $ | 1,004.96 | | | $ | 7.76 | | | | 1.56 | % |
Hypothetical (5% return before expenses) | | $ | 1,000.00 | | | $ | 1,017.06 | | | $ | 7.80 | | | | 1.56 | % |
Administrator Class | | | | | | | | | | | | | | | | |
Actual | | $ | 1,000.00 | | | $ | 1,009.48 | | | $ | 3.24 | | | | 0.65 | % |
Hypothetical (5% return before expenses) | | $ | 1,000.00 | | | $ | 1,021.57 | | | $ | 3.26 | | | | 0.65 | % |
Institutional Class | | | | | | | | | | | | | | | | |
Actual | | $ | 1,000.00 | | | $ | 1,011.46 | | | $ | 2.49 | | | | 0.50 | % |
Hypothetical (5% return before expenses) | | $ | 1,000.00 | | | $ | 1,022.32 | | | $ | 2.51 | | | | 0.50 | % |
Investor Class | | | | | | | | | | | | | | | | |
Actual | | $ | 1,000.00 | | | $ | 1,008.54 | | | $ | 4.18 | | | | 0.84 | % |
Hypothetical (5% return before expenses) | | $ | 1,000.00 | | | $ | 1,020.63 | | | $ | 4.21 | | | | 0.84 | % |
| 1 | Expenses paid is equal to the annualized expense ratio of each class multiplied by the average account value over the period, multiplied by the number of days in the most recent fiscal half-year divided by the number of days in the fiscal year (to reflect the one-half-year period). |
| | | | | | |
| Portfolio of investments—February 28, 2015 (unaudited) | | Wells Fargo Advantage Short-Term High Yield Bond Fund | | | 7 | |
| | | | | | | | | | | | | | | | |
| Security name | | Interest rate | | | Maturity date | | | Principal | | | Value | |
| | | | |
Corporate Bonds and Notes: 57.53% | | | | | | | | | | | | | | | | |
| | | | |
Consumer Discretionary: 19.22% | | | | | | | | | | | | | | | | |
| | | | |
| Airlines: 0.76% | | | | | | | | | | | | | | | | |
US Airways Group Incorporated | | | 6.13 | % | | | 6-1-2018 | | | $ | 10,000,000 | | | $ | 10,587,500 | |
| | | | | | | | | | | | | | | | |
| | | | |
| Auto Components: 2.88% | | | | | | | | | | | | | | | | |
Allison Transmission Incorporated 144A | | | 7.13 | | | | 5-15-2019 | | | | 6,670,000 | | | | 6,961,813 | |
Goodyear Tire & Rubber Company | | | 8.25 | | | | 8-15-2020 | | | | 14,190,000 | | | | 15,094,613 | |
Tenneco Incorporated | | | 6.88 | | | | 12-15-2020 | | | | 9,650,000 | | | | 10,287,383 | |
TRW Automotive Incorporated 144A | | | 7.25 | | | | 3-15-2017 | | | | 7,400,000 | | | | 8,140,000 | |
| | | | |
| | | | | | | | | | | | | | | 40,483,809 | |
| | | | | | | | | | | | | | | | |
| | | | |
| Automobiles: 0.95% | | | | | | | | | | | | | | | | |
Chrysler Group LLC/CG Co-Issuer Incorporated | | | 8.00 | | | | 6-15-2019 | | | | 12,640,000 | | | | 13,353,149 | |
| | | | | | | | | | | | | | | | |
| | | | |
| Diversified Consumer Services: 4.44% | | | | | | | | | | | | | | | | |
Avis Budget Car Rental LLC ± | | | 3.01 | | | | 12-1-2017 | | | | 11,611,000 | | | | 11,669,055 | |
Avis Budget Car Rental LLC | | | 4.88 | | | | 11-15-2017 | | | | 8,120,000 | | | | 8,343,300 | |
Hertz Corporation | | | 7.50 | | | | 10-15-2018 | | | | 5,870,000 | | | | 6,075,450 | |
Service Corporation International | | | 7.00 | | | | 6-15-2017 | | | | 14,176,000 | | | | 15,451,840 | |
United Rentals North America Incorporated | | | 5.75 | | | | 7-15-2018 | | | | 15,230,000 | | | | 15,810,644 | |
United Rentals North America Incorporated | | | 7.38 | | | | 5-15-2020 | | | | 4,550,000 | | | | 4,936,750 | |
| | | | |
| | | | | | | | | | | | | | | 62,287,039 | |
| | | | | | | | | | | | | | | | |
| | | | |
| Hotels, Restaurants & Leisure: 0.45% | | | | | | | | | | | | | | | | |
MGM Resorts International | | | 7.50 | | | | 6-1-2016 | | | | 5,265,000 | | | | 5,580,900 | |
MGM Resorts International | | | 7.63 | | | | 1-15-2017 | | | | 735,000 | | | | 793,800 | |
| | | | |
| | | | | | | | | | | | | | | 6,374,700 | |
| | | | | | | | | | | | | | | | |
| | | | |
| Household Durables: 3.85% | | | | | | | | | | | | | | | | |
Beazer Homes USA Company | | | 6.63 | | | | 4-15-2018 | | | | 12,395,000 | | | | 12,890,800 | |
DR Horton Incorporated | | | 3.63 | | | | 2-15-2018 | | | | 3,930,000 | | | | 4,004,670 | |
DR Horton Incorporated | | | 4.75 | | | | 5-15-2017 | | | | 6,050,000 | | | | 6,322,250 | |
Jarden Corporation | | | 7.50 | | | | 5-1-2017 | | | | 13,115,000 | | | | 14,459,288 | |
Lennar Corporation | | | 4.13 | | | | 12-1-2018 | | | | 9,870,000 | | | | 9,993,375 | |
Lennar Corporation | | | 4.75 | | | | 12-15-2017 | | | | 600,000 | | | | 622,500 | |
Pulte Group Incorporated | | | 7.63 | | | | 10-15-2017 | | | | 5,185,000 | | | | 5,820,163 | |
| | | | |
| | | | | | | | | | | | | | | 54,113,046 | |
| | | | | | | | | | | | | | | | |
| | | | |
| Media: 3.14% | | | | | | | | | | | | | | | | |
CCO Holdings LLC | | | 7.38 | | | | 6-1-2020 | | | | 18,865,000 | | | | 20,232,713 | |
CSC Holdings LLC | | | 7.63 | | | | 7-15-2018 | | | | 8,050,000 | | | | 9,096,500 | |
DISH DBS Corporation | | | 4.25 | | | | 4-1-2018 | | | | 14,670,000 | | | | 14,743,350 | |
| | | | |
| | | | | | | | | | | | | | | 44,072,563 | |
| | | | | | | | | | | | | | | | |
| | | | |
| Specialty Retail: 2.37% | | | | | | | | | | | | | | | | |
Limited Brands Incorporated | | | 6.90 | | | | 7-15-2017 | | | | 12,815,000 | | | | 14,208,631 | |
Sally Holdings Incorporated | | | 6.88 | | | | 11-15-2019 | | | | 17,825,000 | | | | 19,028,188 | |
| | | | |
| | | | | | | | | | | | | | | 33,236,819 | |
| | | | | | | | | | | | | | | | |
The accompanying notes are an integral part of these financial statements.
| | | | |
| 8 | | Wells Fargo Advantage Short-Term High Yield Bond Fund | | Portfolio of investments—February 28, 2015 (unaudited) |
| | | | | | | | | | | | | | | | |
| Security name | | Interest rate | | | Maturity date | | | Principal | | | Value | |
| | | | |
| Textiles, Apparel & Luxury Goods: 0.38% | | | | | | | | | | | | | | | | |
Hanesbrands Incorporated | | | 6.38 | % | | | 12-15-2020 | | | $ | 5,035,000 | | | $ | 5,362,275 | |
| | | | | | | | | | | | | | | | |
| | | | |
Energy: 8.11% | | | | | | | | | | | | | | | | |
| | | | |
| Energy Equipment & Services: 1.87% | | | | | | | | | | | | | | | | |
Exterran Holdings Incorporated | | | 7.25 | | | | 12-1-2018 | | | | 7,840,000 | | | | 7,918,400 | |
SESI LLC | | | 6.38 | | | | 5-1-2019 | | | | 16,400,000 | | | | 16,482,000 | |
Targa Resources Partners 144A | | | 5.00 | | | | 1-15-2018 | | | | 1,835,000 | | | | 1,910,694 | |
| | | | |
| | | | | | | | | | | | | | | 26,311,094 | |
| | | | | | | | | | | | | | | | |
| | | | |
| Oil, Gas & Consumable Fuels: 6.24% | | | | | | | | | | | | | | | | |
Carrizo Oil & Gas Incorporated | | | 8.63 | | | | 10-15-2018 | | | | 6,495,000 | | | | 6,754,800 | |
Chesapeake Energy Corporation ± | | | 3.50 | | | | 4-15-2019 | | | | 21,490,000 | | | | 21,113,925 | |
Crestwood Midstream Partners LP | | | 7.75 | | | | 4-1-2019 | | | | 1,945,000 | | | | 2,025,231 | |
El Paso LLC | | | 7.00 | | | | 6-15-2017 | | | | 5,300,000 | | | | 5,866,040 | |
EP Energy LLC/Everest Acquisition Finance LLC | | | 6.88 | | | | 5-1-2019 | | | | 14,740,000 | | | | 15,108,500 | |
Kinder Morgan Finance Company LLC 144A | | | 6.00 | | | | 1-15-2018 | | | | 9,000,000 | | | | 9,865,665 | |
Peabody Energy Corporation | | | 7.38 | | | | 11-1-2016 | | | | 7,100,000 | | | | 7,455,000 | |
Tesoro Corporation | | | 4.25 | | | | 10-1-2017 | | | | 4,000,000 | | | | 4,160,000 | |
WPX Energy Incorporated | | | 5.25 | | | | 1-15-2017 | | | | 14,965,000 | | | | 15,264,300 | |
| | | | |
| | | | | | | | | | | | | | | 87,613,461 | |
| | | | | | | | | | | | | | | | |
| | | | |
Financials: 5.54% | | | | | | | | | | | | | | | | |
| | | | |
| Banks: 1.84% | | | | | | | | | | | | | | | | |
AmSouth Bank | | | 5.20 | | | | 4-1-2015 | | | | 5,370,000 | | | | 5,389,767 | |
CIT Group Incorporated | | | 4.25 | | | | 8-15-2017 | | | | 19,755,000 | | | | 20,248,875 | |
CIT Group Incorporated | | | 5.00 | | | | 5-15-2017 | | | | 135,000 | | | | 140,400 | |
| | | | |
| | | | | | | | | | | | | | | 25,779,042 | |
| | | | | | | | | | | | | | | | |
| | | | |
| Consumer Finance: 2.75% | | | | | | | | | | | | | | | | |
Ally Financial Incorporated ± | | | 2.94 | | | | 7-18-2016 | | | | 4,560,000 | | | | 4,601,674 | |
Ally Financial Incorporated | | | 5.50 | | | | 2-15-2017 | | | | 9,500,000 | | | | 9,957,995 | |
Ally Financial Incorporated | | | 6.25 | | | | 12-1-2017 | | | | 1,915,000 | | | | 2,068,200 | |
General Motors Financial Company Incorporated | | | 3.25 | | | | 5-15-2018 | | | | 880,000 | | | | 898,700 | |
Navient LLC | | | 6.00 | | | | 1-25-2017 | | | | 8,000,000 | | | | 8,460,320 | |
SLM Corporation | | | 4.63 | | | | 9-25-2017 | | | | 870,000 | | | | 896,100 | |
Toll Brothers Finance Corporation | | | 4.00 | | | | 12-31-2018 | | | | 2,650,000 | | | | 2,722,875 | |
Toll Brothers Finance Corporation | | | 8.91 | | | | 10-15-2017 | | | | 7,750,000 | | | | 8,951,250 | |
| | | | |
| | | | | | | | | | | | | | | 38,557,114 | |
| | | | | | | | | | | | | | | | |
| | | | |
| REITs: 0.95% | | | | | | | | | | | | | | | | |
Iron Mountain Incorporated | | | 7.75 | | | | 10-1-2019 | | | | 12,520,000 | | | | 13,380,750 | |
| | | | | | | | | | | | | | | | |
| | | | |
Health Care: 2.62% | | | | | | | | | | | | | | | | |
| | | | |
| Health Care Equipment & Supplies: 1.21% | | | | | | | | | | | | | | | | |
Biomet Incorporated | | | 6.50 | | | | 8-1-2020 | | | | 9,235,000 | | | | 9,846,819 | |
Fresenius US Finance II Incorporated 144A | | | 9.00 | | | | 7-15-2015 | | | | 7,000,000 | | | | 7,175,000 | |
| | | | |
| | | | | | | | | | | | | | | 17,021,819 | |
| | | | | | | | | | | | | | | | |
The accompanying notes are an integral part of these financial statements.
| | | | | | |
| Portfolio of investments—February 28, 2015 (unaudited) | | Wells Fargo Advantage Short-Term High Yield Bond Fund | | | 9 | |
| | | | | | | | | | | | | | | | |
| Security name | | Interest rate | | | Maturity date | | | Principal | | | Value | |
| | | | |
| Health Care Providers & Services: 1.41% | | | | | | | | | | | | | | | | |
Fresenius Medical Care Holdings Incorporated | | | 6.88 | % | | | 7-15-2017 | | | $ | 12,834,000 | | | $ | 14,117,400 | |
HCA Incorporated | | | 8.00 | | | | 10-1-2018 | | | | 4,610,000 | | | | 5,382,175 | |
Universal Health Services Incorporated | | | 7.13 | | | | 6-30-2016 | | | | 300,000 | | | | 323,250 | |
| | | | |
| | | | | | | | | | | | | | | 19,822,825 | |
| | | | | | | | | | | | | | | | |
| | | | |
Industrials: 6.59% | | | | | | | | | | | | | | | | |
| | | | |
| Aerospace & Defense: 0.83% | | | | | | | | | | | | | | | | |
Esterline Technologies Corporation | | | 7.00 | | | | 8-1-2020 | | | | 10,695,000 | | | | 11,229,750 | |
Huntington Ingalls Industries Incorporated | | | 7.13 | | | | 3-15-2021 | | | | 365,000 | | | | 393,342 | |
| | | | |
| | | | | | | | | | | | | | | 11,623,092 | |
| | | | | | | | | | | | | | | | |
| | | | |
| Building Products: 0.75% | | | | | | | | | | | | | | | | |
Masco Corporation | | | 5.85 | | | | 3-15-2017 | | | | 508,000 | | | | 544,830 | |
Masco Corporation | | | 6.13 | | | | 10-3-2016 | | | | 9,409,000 | | | | 10,044,108 | |
| | | | |
| | | | | | | | | | | | | | | 10,588,938 | |
| | | | | | | | | | | | | | | | |
| | | | |
| Commercial Services & Supplies: 0.84% | | | | | | | | | | | | | | | | |
Deluxe Corporation | | | 7.00 | | | | 3-15-2019 | | | | 2,770,000 | | | | 2,870,413 | |
Mobile Mini Incorporated | | | 7.88 | | | | 12-1-2020 | | | | 470,000 | | | | 497,025 | |
RR Donnelley & Sons Company | | | 5.50 | | | | 5-15-2015 | | | | 6,550,000 | | | | 6,582,750 | |
RR Donnelley & Sons Company | | | 7.25 | | | | 5-15-2018 | | | | 1,705,000 | | | | 1,901,075 | |
| | | | |
| | | | | | | | | | | | | | | 11,851,263 | |
| | | | | | | | | | | | | | | | |
| | | | |
| Diversified Consumer Services: 0.94% | | | | | | | | | | | | | | | | |
ADT Corporation | | | 2.25 | | | | 7-15-2017 | | | | 13,255,000 | | | | 13,122,450 | |
| | | | | | | | | | | | | | | | |
| | | | |
| Electrical Equipment: 0.36% | | | | | | | | | | | | | | | | |
General Cable Corporation ±(i) | | | 2.63 | | | | 4-1-2015 | | | | 5,000,000 | | | | 4,975,000 | |
| | | | | | | | | | | | | | | | |
| | | | |
| Machinery: 2.67% | | | | | | | | | | | | | | | | |
Case New Holland Industrial Incorporated | | | 7.88 | | | | 12-1-2017 | | | | 16,095,000 | | | | 17,945,925 | |
Manitowoc Company Incorporated | | | 8.50 | | | | 11-1-2020 | | | | 6,140,000 | | | | 6,631,200 | |
SPX Corporation | | | 6.88 | | | | 9-1-2017 | | | | 11,805,000 | | | | 12,867,450 | |
| | | | |
| | | | | | | | | | | | | | | 37,444,575 | |
| | | | | | | | | | | | | | | | |
| | | | |
| Trading Companies & Distributors: 0.20% | | | | | | | | | | | | | | | | |
International Lease Finance Corporation | | | 5.75 | | | | 5-15-2016 | | | | 2,750,000 | | | | 2,863,438 | |
| | | | | | | | | | | | | | | | |
| | | | |
Information Technology: 1.62% | | | | | | | | | | | | | | | | |
| | | | |
| Electronic Equipment, Instruments & Components: 0.63% | | | | | | | | | | | | | | | | |
Jabil Circuit Incorporated | | | 7.75 | | | | 7-15-2016 | | | | 8,300,000 | | | | 8,922,500 | |
| | | | | | | | | | | | | | | | |
| | | | |
| Internet Software & Services: 0.99% | | | | | | | | | | | | | | | | |
IAC/InterActiveCorp | | | 4.88 | | | | 11-30-2018 | | | | 13,400,000 | | | | 13,869,000 | |
| | | | | | | | | | | | | | | | |
| | | | |
Materials: 5.86% | | | | | | | | | | | | | | | | |
| | | | |
| Chemicals: 0.34% | | | | | | | | | | | | | | | | |
Polyone Corporation | | | 7.38 | | | | 9-15-2020 | | | | 4,480,000 | | | | 4,754,400 | |
| | | | | | | | | | | | | | | | |
The accompanying notes are an integral part of these financial statements.
| | | | |
| 10 | | Wells Fargo Advantage Short-Term High Yield Bond Fund | | Portfolio of investments—February 28, 2015 (unaudited) |
| | | | | | | | | | | | | | | | |
| Security name | | Interest rate | | | Maturity date | | | Principal | | | Value | |
| | | | |
| Construction Materials: 0.40% | | | | | | | | | | | | | | | | |
Vulcan Materials Company | | | 6.40 | % | | | 11-30-2017 | | | $ | 3,250,000 | | | $ | 3,550,625 | |
Vulcan Materials Company | | | 6.50 | | | | 12-1-2016 | | | | 635,000 | | | | 682,625 | |
Vulcan Materials Company | | | 7.00 | | | | 6-15-2018 | | | | 1,265,000 | | | | 1,416,800 | |
| | | | |
| | | | | | | | | | | | | | | 5,650,050 | |
| | | | | | | | | | | | | | | | |
| | | | |
| Containers & Packaging: 2.52% | | | | | | | | | | | | | | | | |
Greif Incorporated | | | 6.75 | | | | 2-1-2017 | | | | 9,180,000 | | | | 9,891,450 | |
Owens Brockway Glass Container Incorporated | | | 7.38 | | | | 5-15-2016 | | | | 6,560,000 | | | | 6,986,400 | |
Owens-Illinois Incorporated | | | 7.80 | | | | 5-15-2018 | | | | 9,305,000 | | | | 10,468,125 | |
Reynolds Group Holdings Limited | | | 7.13 | | | | 4-15-2019 | | | | 195,000 | | | | 202,800 | |
Reynolds Group Holdings Limited | | | 7.88 | | | | 8-15-2019 | | | | 7,345,000 | | | | 7,793,045 | |
| | | | |
| | | | | | | | | | | | | | | 35,341,820 | |
| | | | | | | | | | | | | | | | |
| | | | |
| Metals & Mining: 2.60% | | | | | | | | | | | | | | | | |
Commercial Metals Company | | | 7.35 | | | | 8-15-2018 | | | | 13,150,000 | | | | 14,267,750 | |
Steel Dynamics Incorporated | | | 6.13 | | | | 8-15-2019 | | | | 9,690,000 | | | | 10,392,525 | |
Sunchoke Energy Incorporated | | | 7.63 | | | | 8-1-2019 | | | | 4,310,000 | | | | 4,476,151 | |
US Steel Corporation | | | 7.00 | | | | 2-1-2018 | | | | 6,923,000 | | | | 7,398,956 | |
| | | | |
| | | | | | | | | | | | | | | 36,535,382 | |
| | | | | | | | | | | | | | | | |
| | | | |
Telecommunication Services: 4.89% | | | | | | | | | | | | | | | | |
| | | | |
| Diversified Telecommunication Services: 3.14% | | | | | | | | | | | | | | | | |
CenturyLink Incorporated | | | 6.00 | | | | 4-1-2017 | | | | 10,390,000 | | | | 11,117,300 | |
Frontier Communications Corporation | | | 8.13 | | | | 10-1-2018 | | | | 8,540,000 | | | | 9,714,250 | |
Level 3 Financing Incorporated | | | 8.13 | | | | 7-1-2019 | | | | 10,080,000 | | | | 10,659,600 | |
Windstream Corporation | | | 7.88 | | | | 11-1-2017 | | | | 8,050,000 | | | | 8,714,125 | |
Windstream Corporation | | | 9.88 | | | | 12-1-2018 | | | | 3,630,000 | | | | 3,829,650 | |
| | | | |
| | | | | | | | | | | | | | | 44,034,925 | |
| | | | | | | | | | | | | | | | |
| | | | |
| Wireless Telecommunication Services: 1.75% | | | | | | | | | | | | | | | | |
Sprint Nextel Corporation | | | 6.00 | | | | 12-1-2016 | | | | 14,260,000 | | | | 14,964,088 | |
T-Mobile USA Incorporated | | | 6.46 | | | | 4-28-2019 | | | | 9,270,000 | | | | 9,629,213 | |
| | | | |
| | | | | | | | | | | | | | | 24,593,301 | |
| | | | | | | | | | | | | | | | |
| | | | |
Utilities: 3.08% | | | | | | | | | | | | | | | | |
| | | | |
| Gas Utilities: 0.68% | | | | | | | | | | | | | | | | |
AmeriGas Partners LP | | | 6.25 | | | | 8-20-2019 | | | | 9,085,000 | | | | 9,493,825 | |
| | | | | | | | | | | | | | | | |
| | | | |
| Independent Power & Renewable Electricity Producers: 2.40% | | | | | | | | | | | | | | | | |
AES Corporation | | | 8.00 | | | | 10-15-2017 | | | | 15,080,000 | | | | 16,965,000 | |
NRG Energy Incorporated | | | 7.63 | | | | 1-15-2018 | | | | 15,130,000 | | | | 16,794,300 | |
| | | | |
| | | | | | | | | | | | | | | 33,759,300 | |
| | | | | | | | | | | | | | | | |
| | | | |
Total Corporate Bonds and Notes (Cost $809,184,806) | | | | | | | | | | | | | | | 807,780,264 | |
| | | | | | | | | | | | | | | | |
| | | | |
Loans: 33.48% | | | | | | | | | | | | | | | | |
Activision Blizzard Incorporated ± | | | 3.25 | | | | 10-12-2020 | | | | 10,091,250 | | | | 10,114,864 | |
Allison Transmission Incorporated ± | | | 2.93 | | | | 8-7-2017 | | | | 1,279,843 | | | | 1,276,912 | |
The accompanying notes are an integral part of these financial statements.
| | | | | | |
| Portfolio of investments—February 28, 2015 (unaudited) | | Wells Fargo Advantage Short-Term High Yield Bond Fund | | | 11 | |
| | | | | | | | | | | | | | | | |
| Security name | | Interest rate | | | Maturity date | | | Principal | | | Value | |
Loans (continued) | | | | | | | | | | | | | | | | |
Allison Transmission Incorporated ± | | | 3.50 | % | | | 8-23-2019 | | | $ | 6,198,157 | | | $ | 6,197,413 | |
Aramark Corporation ± | | | 3.25 | | | | 9-7-2019 | | | | 14,137,750 | | | | 14,095,337 | |
Aramark Corporation ± | | | 3.67 | | | | 7-26-2016 | | | | 253,281 | | | | 250,748 | |
Berry Plastics Group Incorporated ± | | | 3.50 | | | | 2-8-2020 | | | | 15,836,150 | | | | 15,756,969 | |
Biomet Incorporated ± | | | 3.67 | | | | 7-25-2017 | | | | 10,122,125 | | | | 10,110,485 | |
Biomet Incorporated ± | | | 3.17 | | | | 3-25-2015 | | | | 1,030,986 | | | | 1,030,471 | |
CDW LLC ± | | | 3.25 | | | | 4-29-2020 | | | | 13,452,370 | | | | 13,329,012 | |
Cequel Communications LLC ± | | | 3.50 | | | | 2-14-2019 | | | | 13,101,980 | | | | 13,103,683 | |
Chrysler Group LLC ± | | | 3.50 | | | | 5-24-2017 | | | | 7,749,169 | | | | 7,744,364 | |
CHS/Community Health Systems Incorporated ± | | | 4.25 | | | | 1-27-2021 | | | | 6,831,000 | | | | 6,844,116 | |
CHS/Community Health Systems Incorporated ± | | | 3.42 | | | | 1-25-2017 | | | | 10,069,821 | | | | 10,065,290 | |
Cinemark USA Incorporated ± | | | 3.18 | | | | 12-18-2019 | | | | 980,000 | | | | 978,951 | |
Crown Castle Operating Company ± | | | 3.00 | | | | 1-31-2021 | | | | 8,728,872 | | | | 8,709,232 | |
Dell Incorporated ±< | | | 4.50 | | | | 4-29-2020 | | | | 11,786,128 | | | | 11,830,326 | |
Delos Finance SARL ± | | | 3.50 | | | | 3-6-2021 | | | | 9,865,000 | | | | 9,860,857 | |
DigitalGlobe Incorporated ± | | | 3.75 | | | | 1-31-2020 | | | | 11,325,836 | | | | 11,308,168 | |
EFS Cogen Holdings I LLC ± | | | 3.75 | | | | 12-17-2020 | | | | 6,931,709 | | | | 6,905,715 | |
Generac Power Systems Incorporated ± | | | 3.25 | | | | 5-31-2020 | | | | 13,432,069 | | | | 13,327,165 | |
HCA Incorporated ± | | | 2.67 | | | | 2-2-2016 | | | | 6,741,496 | | | | 6,728,013 | |
HCA Incorporated ± | | | 2.92 | | | | 3-31-2017 | | | | 8,887,500 | | | | 8,886,434 | |
Huntsman International LLC ± | | | 3.75 | | | | 8-12-2021 | | | | 11,120,000 | | | | 11,138,570 | |
Iasis Healthcare LLC ± | | | 4.50 | | | | 5-3-2018 | | | | 7,732,125 | | | | 7,736,997 | |
Ineos US Finance LLC ± | | | 3.75 | | | | 5-4-2018 | | | | 17,151,252 | | | | 17,090,193 | |
Intelsat Jackson Holdings SA ± | | | 3.75 | | | | 6-30-2019 | | | | 14,548,512 | | | | 14,434,160 | |
KAR Auction Services Incorporated ± | | | 3.50 | | | | 3-7-2021 | | | | 5,855,404 | | | | 5,804,170 | |
Level 3 Financing Incorporated ± | | | 4.00 | | | | 1-15-2020 | | | | 8,300,000 | | | | 8,295,850 | |
Lifepoint Hospitals Incorporated ± | | | 2.68 | | | | 7-24-2017 | | | | 4,793,654 | | | | 4,807,124 | |
Michaels Stores Incorporated ± | | | 3.75 | | | | 1-28-2020 | | | | 13,960,717 | | | | 13,869,135 | |
NBTY Incorporated ± | | | 3.50 | | | | 10-1-2017 | | | | 8,172,889 | | | | 8,019,648 | |
Novelis Incorporated ± | | | 3.75 | | | | 3-10-2017 | | | | 13,196,683 | | | | 13,174,644 | |
Omnova Solutions Incorporated ± | | | 4.25 | | | | 5-31-2018 | | | | 2,274,063 | | | | 2,248,479 | |
Peabody Energy Corporation ± | | | 4.25 | | | | 9-24-2020 | | | | 7,519,813 | | | | 7,076,670 | |
Pinnacle Foods Finance LLC ± | | | 3.00 | | | | 4-29-2020 | | | | 6,066,631 | | | | 6,027,865 | |
Rexnord LLC ± | | | 4.00 | | | | 8-21-2020 | | | | 11,440,681 | | | | 11,405,902 | |
Reynolds Group Holdings Incorporated ± | | | 4.00 | | | | 12-1-2018 | | | | 7,303,464 | | | | 7,323,403 | |
Salix Pharmaceuticals Limited ± | | | 4.25 | | | | 1-2-2020 | | | | 9,688,534 | | | | 9,682,527 | |
SBA Senior Finance II LLC ± | | | 3.25 | | | | 3-24-2021 | | | | 9,666,425 | | | | 9,595,280 | |
Select Medical Corporation ± | | | 2.99 | | | | 12-20-2016 | | | | 948,664 | | | | 948,076 | |
Select Medical Corporation ± | | | 3.75 | | | | 6-1-2018 | | | | 9,304,881 | | | | 9,275,849 | |
Sensata Technologies BV ± | | | 3.25 | | | | 5-12-2019 | | | | 4,577,388 | | | | 4,583,934 | |
Serta Simmons Holdings LLC ± | | | 4.25 | | | | 10-1-2019 | | | | 1,832,328 | | | | 1,828,737 | |
Spectrum Brands Incorporated ± | | | 3.50 | | | | 9-4-2019 | | | | 987,500 | | | | 985,031 | |
SunGard Data Systems Incorporated ± | | | 4.00 | | | | 3-8-2020 | | | | 5,317,693 | | | | 5,316,044 | |
Tempur-Pedic International Incorporated ± | | | 3.50 | | | | 3-18-2020 | | | | 9,267,988 | | | | 9,244,818 | |
The Hertz Corporation ± | | | 3.50 | | | | 3-11-2018 | | | | 10,097,449 | | | | 10,018,588 | |
The Hertz Corporation ± | | | 4.00 | | | | 3-11-2018 | | | | 2,205,000 | | | | 2,196,048 | |
The Manitowoc Company Incorporated ± | | | 3.25 | | | | 1-3-2021 | | | | 1,685,000 | | | | 1,679,743 | |
TransDigm Incorporated ± | | | 3.50 | | | | 2-14-2017 | | | | 776,348 | | | | 774,407 | |
TransDigm Incorporated ± | | | 3.75 | | | | 2-28-2020 | | | | 16,225,992 | | | | 16,151,028 | |
Valeant Pharmaceuticals International Incorporated ± | | | 3.50 | | | | 2-13-2019 | | | | 15,677,867 | | | | 15,641,965 | |
The accompanying notes are an integral part of these financial statements.
| | | | |
| 12 | | Wells Fargo Advantage Short-Term High Yield Bond Fund | | Portfolio of investments—February 28, 2015 (unaudited) |
| | | | | | | | | | | | | | | | |
| Security name | | Interest rate | | | Maturity date | | | Principal | | | Value | |
Loans (continued) | | | | | | | | | | | | | | | | |
Virgin Media Investment Holdings Limited ± | | | 3.50 | % | | | 6-7-2020 | | | $ | 16,935,000 | | | $ | 16,882,840 | |
Wendy’s International Incorporated ± | | | 3.25 | | | | 5-15-2019 | | | | 2,020,892 | | | | 2,011,636 | |
West Corporation ± | | | 3.25 | | | | 6-30-2018 | | | | 12,772,955 | | | | 12,730,421 | |
Zayo Group LLC ±< | | | 4.00 | | | | 7-2-2019 | | | | 13,563,723 | | | | 13,546,768 | |
| | | | |
Total Loans (Cost $472,153,176) | | | | | | | | | | | | | | | 470,001,075 | |
| | | | | | | | | | | | | | | | |
| | | | |
Municipal Obligations: 1.08% | | | | | | | | | | | | | | | | |
| | | | |
| Alabama: 0.42% | | | | | | | | | | | | | | | | |
Jefferson County AL Taxable Warrants Series B (GO) | | | 4.90 | | | | 4-1-2017 | | | | 4,225,000 | | | | 4,316,725 | |
Jefferson County AL Taxable Warrants Series D (GO) | | | 4.90 | | | | 4-1-2017 | | | | 1,540,000 | | | | 1,573,433 | |
| | | | |
| | | | | | | | | | | | | | | 5,890,158 | |
| | | | | | | | | | | | | | | | |
| | | | |
| California: 0.33% | | | | | | | | | | | | | | | | |
California Judgment Trust (Miscellaneous Revenue) ± | | | 1.60 | | | | 6-1-2015 | | | | 1,185,000 | | | | 1,184,988 | |
Oakland CA Redevelopment Agency Refunding Bond Subordinated Housing Series A (Tax Revenue, Ambac Insured) | | | 5.38 | | | | 9-1-2016 | | | | 3,420,000 | | | | 3,478,037 | |
| | | | |
| | | | | | | | | | | | | | | 4,663,025 | |
| | | | | | | | | | | | | | | | |
| | | | |
| Texas: 0.33% | | | | | | | | | | | | | | | | |
Dallas-Fort Worth TX International Airport Facilities Improvement Corporation (Industrial Development Revenue) | | | 7.00 | | | | 1-1-2016 | | | | 4,485,000 | | | | 4,643,948 | |
| | | | | | | | | | | | | | | | |
| | | | |
Total Municipal Obligations (Cost $15,111,053) | | | | | | | | | | | | | | | 15,197,131 | |
| | | | | | | | | | | | | | | | |
| | | | |
Non-Agency Mortgage-Backed Securities: 0.00% | | | | | | | | | | | | | | | | |
Salomon Brothers Mortgage Securities VII Series 1994-5 Class B2 ±(i) | | | 2.73 | | | | 4-25-2024 | | | | 41,645 | | | | 35,264 | |
| | | | |
Total Non-Agency Mortgage-Backed Securities (Cost $41,243) | | | | | | | | | | | | | | | 35,264 | |
| | | | | | | | | | | | | | | | |
| | | | |
Yankee Corporate Bonds and Notes: 4.03% | | | | | | | | | | | | | | | | |
| | | | |
Consumer Discretionary: 1.27% | | | | | | | | | | | | | | | | |
| | | | |
| Automobiles: 0.65% | | | | | | | | | | | | | | | | |
Jaguar Land Rover Automotive plc 144A | | | 4.13 | | | | 12-15-2018 | | | | 8,735,000 | | | | 9,106,238 | |
| | | | | | | | | | | | | | | | |
| | | | |
| Media: 0.62% | | | | | | | | | | | | | | | | |
Numericable Group SA 144A | | | 4.88 | | | | 5-15-2019 | | | | 8,745,000 | | | | 8,745,000 | |
| | | | | | | | | | | | | | | | |
| | | | |
Financials: 0.18% | | | | | | | | | | | | | | | | |
| | | | |
| Diversified Financial Services: 0.18% | | | | | | | | | | | | | | | | |
AerCap Ireland Capital Limited 144A | | | 2.75 | | | | 5-15-2017 | | | | 2,535,000 | | | | 2,540,552 | |
| | | | | | | | | | | | | | | | |
| | | | |
Information Technology: 0.98% | | | | | | | | | | | | | | | | |
| | | | |
| Electronic Equipment, Instruments & Components: 0.98% | | | | | | | | | | | | | | | | |
NXP BV/NXP Funding LLC 144A | | | 3.50 | | | | 9-15-2016 | | | | 13,600,000 | | | | 13,804,000 | |
| | | | | | | | | | | | | | | | |
| | | | |
Materials: 1.44% | | | | | | | | | | | | | | | | |
| | | | |
| Metals & Mining: 1.44% | | | | | | | | | | | | | | | | |
ArcelorMittal SA | | | 6.13 | | | | 6-1-2018 | | | | 10,000,000 | | | | 10,823,750 | |
FMG Resources Limited 144A« | | | 6.00 | | | | 4-1-2017 | | | | 9,260,000 | | | | 9,346,805 | |
| | | | |
| | | | | | | | | | | | | | | 20,170,555 | |
| | | | | | | | | | | | | | | | |
The accompanying notes are an integral part of these financial statements.
| | | | | | |
| Portfolio of investments—February 28, 2015 (unaudited) | | Wells Fargo Advantage Short-Term High Yield Bond Fund | | | 13 | |
| | | | | | | | | | | | | | | | |
| Security name | | Interest rate | | | Maturity date | | | Principal | | | Value | |
| | | | |
Telecommunication Services: 0.16% | | | | | | | | | | | | | | | | |
| | | | |
| Diversified Telecommunication Services: 0.16% | | | | | | | | | | | | | | | | |
Intelsat Jackson Holdings SA | | | 7.25 | % | | | 4-1-2019 | | | $ | 2,140,000 | | | $ | 2,214,900 | |
| | | | | | | | | | | | | | | | |
| | | | |
Total Yankee Corporate Bonds and Notes (Cost $56,708,686) | | | | | | | | | | | | | | | 56,581,245 | |
| | | | | | | | | | | | | | | | |
| | | | |
| | | Yield | | | | | | Shares | | | | |
| Short-Term Investments: 2.40% | | | | | | | | | | | | | | | | |
| | | | |
| Investment Companies: 2.40% | | | | | | | | | | | | | | | | |
Securities Lending Cash Investments, LLC (l)(r)(u) | | | 0.13 | | | | | | | | 1,055,000 | | | | 1,055,000 | |
Wells Fargo Advantage Cash Investment Money Market Fund, Select Class (l)(u)## | | | 0.10 | | | | | | | | 32,653,432 | | | | 32,653,432 | |
| | | | |
Total Short-Term Investments (Cost $33,708,432) | | | | | | | | | | | | | | | 33,708,432 | |
| | | | | | | | | | | | | | | | |
| | | | | | | | |
| Total investments in securities (Cost $1,386,907,396) * | | | 98.52 | % | | | 1,383,303,411 | |
Other assets and liabilities, net | | | 1.48 | | | | 20,767,547 | |
| | | | | | | | |
| Total net assets | | | 100.00 | % | | $ | 1,404,070,958 | |
| | | | | | | | |
| 144A | The security may be resold in transactions exempt from registration, normally to qualified institutional buyers, pursuant to Rule 144A under the Securities Act of 1933. |
| ± | Variable rate investment. The rate shown is the rate in effect at period end. |
| < | All or a portion of the position represents an unfunded loan commitment. |
| « | All or a portion of this security is on loan. |
| (l) | The security represents an affiliate of the Fund as defined in the Investment Company Act of 1940. |
| (r) | The investment is a non-registered investment vehicle purchased with cash collateral received from securities on loan. |
| (u) | The rate represents the 7-day annualized yield at period end. |
| ## | All or a portion of this security is segregated for unfunded loans. |
| * | Cost for federal income tax purposes is $1,387,066,345 and unrealized gains (losses) consists of: |
| | | | |
Gross unrealized gains | | $ | 6,973,122 | |
Gross unrealized losses | | | (10,736,056 | ) |
| | | | |
Net unrealized losses | | $ | (3,762,934 | ) |
The accompanying notes are an integral part of these financial statements.
| | | | |
| 14 | | Wells Fargo Advantage Short-Term High Yield Bond Fund | | Statement of assets and liabilities—February 28, 2015 (unaudited) |
| | | | |
| | | | |
| |
Assets | | | | |
Investments | | | | |
In unaffiliated securities (including $1,032,817 of securities loaned), at value (cost $1,353,198,964) | | $ | 1,349,594,979 | |
In affiliated securities, at value (cost $33,708,432) | | | 33,708,432 | |
| | | | |
Total investments, at value (cost $1,386,907,396) | | | 1,383,303,411 | |
Receivable for investments sold | | | 32,198,867 | |
Principal paydown receivable | | | 341 | |
Receivable for Fund shares sold | | | 1,649,113 | |
Receivable for interest | | | 15,131,648 | |
Receivable for securities lending income | | | 8,881 | |
Prepaid expenses and other assets | | | 106,120 | |
| | | | |
Total assets | | | 1,432,398,381 | |
| | | | |
| |
Liabilities | | | | |
Dividends payable | | | 656,504 | |
Payable for investments purchased | | | 21,664,810 | |
Payable for Fund shares redeemed | | | 4,107,023 | |
Payable upon receipt of securities loaned | | | 1,055,000 | |
Advisory fee payable | | | 344,409 | |
Distribution fee payable | | | 76,160 | |
Administration fees payable | | | 194,486 | |
Accrued expenses and other liabilities | | | 229,031 | |
| | | | |
Total liabilities | | | 28,327,423 | |
| | | | |
Total net assets | | $ | 1,404,070,958 | |
| | | | |
| |
NET ASSETS CONSIST OF | | | | |
Paid-in capital | | $ | 1,421,950,295 | |
Overdistributed net investment income | | | (802,825 | ) |
Accumulated net realized losses on investments | | | (13,472,527 | ) |
Net unrealized losses on investments | | | (3,603,985 | ) |
| | | | |
Total net assets | | $ | 1,404,070,958 | |
| | | | |
| |
COMPUTATION OF NET ASSET VALUE AND OFFERING PRICE PER SHARE | | | | |
Net assets – Class A | | $ | 216,876,729 | |
Shares outstanding – Class A1 | | | 26,640,446 | |
Net asset value per share – Class A | | | $8.14 | |
Maximum offering price per share – Class A2 | | | $8.39 | |
Net assets – Class C | | $ | 127,313,408 | |
Shares outstanding – Class C1 | | | 15,638,767 | |
Net asset value per share – Class C | | | $8.14 | |
Net assets – Administrator Class | | $ | 371,349,969 | |
Shares outstanding – Administrator Class1 | | | 45,631,440 | |
Net asset value per share – Administrator Class | | | $8.14 | |
Net assets – Institutional Class | | $ | 507,300,671 | |
Shares outstanding – Institutional Class1 | | | 62,427,322 | |
Net asset value per share – Institutional Class | | | $8.13 | |
Net assets – Investor Class | | $ | 181,230,181 | |
Shares outstanding – Investor Class1 | | | 22,259,991 | |
Net asset value per share – Investor Class | | | $8.14 | |
| 1 | The Fund has an unlimited number of authorized shares. |
| 2 | Maximum offering price is computed as 100/97 of net asset value. On investments of $50,000 or more, the offering price is reduced. |
The accompanying notes are an integral part of these financial statements.
| | | | | | |
| Statement of operations—six months ended February 28, 2015 (unaudited) | | Wells Fargo Advantage Short-Term High Yield Bond Fund | | | 15 | |
| | | | |
| | | | |
| |
Investment income | | | | |
Interest | | $ | 31,689,217 | |
Securities lending income, net | | | 51,209 | |
Income from affiliated securities | | | 20,477 | |
| | | | |
Total investment income | | | 31,760,903 | |
| | | | |
| |
Expenses | | | | |
Advisory fee | | | 3,333,696 | |
Administration fees | | | | |
Fund level | | | 393,467 | |
Class A | | | 193,823 | |
Class C | | | 106,375 | |
Administrator Class | | | 224,314 | |
Institutional Class | | | 219,328 | |
Investor Class | | | 191,591 | |
Shareholder servicing fees | | | | |
Class A | | | 302,849 | |
Class C | | | 166,211 | |
Administrator Class | | | 558,025 | |
Investor Class | | | 251,149 | |
Distribution fee | | | | |
Class C | | | 498,633 | |
Custody and accounting fees | | | 42,392 | |
Professional fees | | | 28,944 | |
Registration fees | | | 68,016 | |
Shareholder report expenses | | | 62,711 | |
Trustees’ fees and expenses | | | 5,245 | |
Other fees and expenses | | | 24,173 | |
| | | | |
Total expenses | | | 6,670,942 | |
Less: Fee waivers and/or expense reimbursements | | | (976,686 | ) |
| | | | |
Net expenses | | | 5,694,256 | |
| | | | |
Net investment income | | | 26,066,647 | |
| | | | |
| |
REALIZED AND UNREALIZED GAINS (LOSSES) ON INVESTMENTS | | | | |
Net realized losses on investments | | | (12,710,486 | ) |
Net change in unrealized gains (losses) on investments | | | (1,186,924 | ) |
| | | | |
Net realized and unrealized gains (losses) on investments | | | (13,897,410 | ) |
| | | | |
Net increase in net assets resulting from operations | | $ | 12,169,237 | |
| | | | |
The accompanying notes are an integral part of these financial statements.
| | | | |
| 16 | | Wells Fargo Advantage Short-Term High Yield Bond Fund | | Statement of changes in net assets |
| | | | | | | | | | | | | | | | |
| | | Six months ended February 28, 2015 (unaudited) | | | Year ended August 31, 2014 | |
| | | | |
Operations | | | | | | | | | | | | | | | | |
Net investment income | | | | | | $ | 26,066,647 | | | | | | | $ | 54,855,027 | |
Net realized losses on investments | | | | | | | (12,710,486 | ) | | | | | | | (1,133,585 | ) |
Net change in unrealized gains (losses) on investments | | | | | | | (1,186,924 | ) | | | | | | | (62,645 | ) |
| | | | |
Net increase in net assets resulting from operations | | | | | | | 12,169,237 | | | | | | | | 53,658,797 | |
| | | | |
| | | | |
Distributions to shareholders from | | | | | | | | | | | | | | | | |
Net investment income | | | | | | | | | | | | | | | | |
Class A | | | | | | | (3,914,320 | ) | | | | | | | (9,990,440 | ) |
Class C | | | | | | | (1,651,736 | ) | | | | | | | (3,525,479 | ) |
Administrator Class | | | | | | | (7,584,967 | ) | | | | | | | (18,901,024 | ) |
Institutional Class | | | | | | | (9,700,212 | ) | | | | | | | (13,627,741 | ) |
Investor Class | | | | | | | (3,227,201 | ) | | | | | | | (8,293,472 | ) |
Net realized gains | | | | | | | | | | | | | | | | |
Class A | | | | | | | 0 | | | | | | | | (679,349 | ) |
Class C | | | | | | | 0 | | | | | | | | (311,057 | ) |
Administrator Class | | | | | | | 0 | | | | | | | | (1,207,759 | ) |
Institutional Class | | | | | | | 0 | | | | | | | | (665,596 | ) |
Investor Class | | | | | | | 0 | | | | | | | | (604,264 | ) |
| | | | |
Total distributions to shareholders | | | | | | | (26,078,436 | ) | | | | | | | (57,806,181 | ) |
| | | | |
| | | | |
Capital share transactions | | | Shares | | | | | | | | Shares | | | | | |
Proceeds from shares sold | | | | | | | | | | | | | | | | |
Class A | | | 2,660,513 | | | | 21,558,504 | | | | 15,249,110 | | | | 125,909,022 | |
Class C | | | 1,293,313 | | | | 10,482,374 | | | | 5,706,301 | | | | 47,093,148 | |
Administrator Class | | | 8,474,919 | | | | 68,634,959 | | | | 44,029,190 | | | | 363,558,568 | |
Institutional Class | | | 16,838,325 | | | | 136,382,125 | | | | 64,080,938 | | | | 527,975,480 | |
Investor Class | | | 5,001,870 | | | | 40,545,152 | | | | 18,738,706 | | | | 154,708,427 | |
| | | | |
| | | | | | | 277,603,114 | | | | | | | | 1,219,244,645 | |
| | | | |
Reinvestment of distributions | | | | | | | | | | | | | | | | |
Class A | | | 459,625 | | | | 3,727,177 | | | | 1,244,498 | | | | 10,266,433 | |
Class C | | | 194,901 | | | | 1,580,478 | | | | 444,388 | | | | 3,665,809 | |
Administrator Class | | | 844,354 | | | | 6,845,262 | | | | 2,075,373 | | | | 17,116,408 | |
Institutional Class | | | 752,521 | | | | 6,091,312 | | | | 970,793 | | | | 7,988,302 | |
Investor Class | | | 383,600 | | | | 3,110,776 | | | | 994,682 | | | | 8,205,806 | |
| | | | |
| | | | | | | 21,355,005 | | | | | | | | 47,242,758 | |
| | | | |
Payment for shares redeemed | | | | | | | | | | | | | | | | |
Class A | | | (10,199,574 | ) | | | (82,601,054 | ) | | | (17,587,268 | ) | | | (144,910,840 | ) |
Class C | | | (3,346,846 | ) | | | (27,115,267 | ) | | | (4,904,512 | ) | | | (40,456,301 | ) |
Administrator Class | | | (25,803,616 | ) | | | (209,054,668 | ) | | | (51,142,790 | ) | | | (422,085,077 | ) |
Institutional Class | | | (21,249,989 | ) | | | (171,488,828 | ) | | | (24,797,924 | ) | | | (204,250,615 | ) |
Investor Class | | | (10,907,054 | ) | | | (88,242,818 | ) | | | (23,422,680 | ) | | | (193,143,088 | ) |
| | | | |
| | | | | | | (578,502,635 | ) | | | | | | | (1,004,845,921 | ) |
| | | | |
Net increase (decrease) in net assets resulting from capital share transactions | | | | | | | (279,544,516 | ) | | | | | | | 261,641,482 | |
| | | | |
Total increase (decrease) in net assets | | | | | | | (293,453,715 | ) | | | | | | | 257,494,098 | |
| | | | |
| | | | |
Net assets | | | | | | | | | | | | | | | | |
Beginning of period | | | | | | | 1,697,524,673 | | | | | | | | 1,440,030,575 | |
| | | | |
End of period | | | | | | $ | 1,404,070,958 | | | | | | | $ | 1,697,524,673 | |
| | | | |
Overdistributed net investment income | | | | | | $ | (802,825 | ) | | | | | | $ | (791,036 | ) |
| | | | |
The accompanying notes are an integral part of these financial statements.
| | | | | | |
| Financial highlights | | Wells Fargo Advantage Short-Term High Yield Bond Fund | | | 17 | |
(For a share outstanding throughout each period)
| | | | | | | | | | | | | | | | | | | | | | | | | | | | |
| | | Six months ended
February 28, 2015
(unaudited) | | | Year ended August 31 | | | Year ended
May 31, 2010 | |
| CLASS A | | | 2014 | | | 2013 | | | 2012 | | | 2011 | | | 20101 | | |
Net asset value, beginning of period | | | $8.20 | | | | $8.21 | | | | $8.26 | | | | $8.04 | | | | $8.18 | | | | $8.09 | | | | $7.82 | |
Net investment income | | | 0.13 | | | | 0.27 | | | | 0.31 | | | | 0.36 | | | | 0.40 | | | | 0.11 | | | | 0.45 | |
Net realized and unrealized gains (losses) on investments | | | (0.06 | ) | | | 0.01 | | | | (0.05 | ) | | | 0.26 | | | | (0.14 | ) | | | 0.09 | | | | 0.26 | |
| | | | | | | | | | | | | | | | | | | | | | | | | | | | |
Total from investment operations | | | 0.07 | | | | 0.28 | | | | 0.26 | | | | 0.62 | | | | 0.26 | | | | 0.20 | | | | 0.71 | |
Distributions to shareholders from | | | | | | | | | | | | | | | | | | | | | | | | | | | | |
Net investment income | | | (0.13 | ) | | | (0.27 | ) | | | (0.31 | ) | | | (0.36 | ) | | | (0.40 | ) | | | (0.11 | ) | | | (0.44 | ) |
Net realized gains | | | 0.00 | | | | (0.02 | ) | | | (0.00 | )2 | | | (0.04 | ) | | | 0.00 | | | | 0.00 | | | | 0.00 | |
| | | | | | | | | | | | | | | | | | | | | | | | | | | | |
Total distributions to shareholders | | | (0.13 | ) | | | (0.29 | ) | | | (0.31 | ) | | | (0.40 | ) | | | (0.40 | ) | | | (0.11 | ) | | | (0.44 | ) |
Net asset value, end of period | | | $8.14 | | | | $8.20 | | | | $8.21 | | | | $8.26 | | | | $8.04 | | | | $8.18 | | | | $8.09 | |
Total return3 | | | 0.87 | % | | | 3.40 | % | | | 3.17 | % | | | 7.81 | % | | | 3.10 | % | | | 2.43 | % | | | 9.17 | % |
Ratios to average net assets (annualized) | | | | | | | | | | | | | | | | | | | | | | | | | | | | |
Gross expenses | | | 0.91 | % | | | 0.91 | % | | | 0.94 | % | | | 0.99 | % | | | 1.00 | % | | | 1.01 | % | | | 1.03 | % |
Net expenses | | | 0.81 | % | | | 0.81 | % | | | 0.81 | % | | | 0.81 | % | | | 0.81 | % | | | 0.81 | % | | | 0.81 | % |
Net investment income | | | 3.23 | % | | | 3.27 | % | | | 3.73 | % | | | 4.33 | % | | | 4.77 | % | | | 5.14 | % | | | 5.50 | % |
Supplemental data | | | | | | | | | | | | | | | | | | | | | | | | | | | | |
Portfolio turnover rate | | | 13 | % | | | 28 | % | | | 33 | % | | | 28 | % | | | 36 | % | | | 15 | % | | | 40 | % |
Net assets, end of period (000s omitted) | | | $216,877 | | | | $276,436 | | | | $285,726 | | | | $261,173 | | | | $201,523 | | | | $235,754 | | | | $212,688 | |
| 1 | For the three months ended August 31, 2010. The Fund changed its fiscal year end from May 31 to August 31, effective August 31, 2010. |
| 2 | Amount is less than $0.005. |
| 3 | Total return calculations do not include any sales charges. Returns for periods of less than one year are not annualized. |
The accompanying notes are an integral part of these financial statements.
| | | | |
| 18 | | Wells Fargo Advantage Short-Term High Yield Bond Fund | | Financial highlights |
(For a share outstanding throughout each period)
| | | | | | | | | | | | | | | | | | | | | | | | | | | | |
| | | Six months ended
February 28, 2015
(unaudited) | | | Year ended August 31 | | | Year ended
May 31, 2010 | |
| CLASS C | | | 2014 | | | 2013 | | | 2012 | | | 2011 | | | 20101 | | |
Net asset value, beginning of period | | | $8.20 | | | | $8.21 | | | | $8.26 | | | | $8.04 | | | | $8.18 | | | | $8.09 | | | | $7.82 | |
Net investment income | | | 0.10 | | | | 0.21 | | | | 0.25 | | | | 0.29 | 2 | | | 0.33 | | | | 0.09 | | | | 0.38 | |
Net realized and unrealized gains (losses) on investments | | | (0.06 | ) | | | 0.01 | | | | (0.06 | ) | | | 0.26 | | | | (0.14 | ) | | | 0.09 | | | | 0.26 | |
| | | | | | | | | | | | | | | | | | | | | | | | | | | | |
Total from investment operations | | | 0.04 | | | | 0.22 | | | | 0.19 | | | | 0.55 | | | | 0.19 | | | | 0.18 | | | | 0.64 | |
Distributions to shareholders from | | | | | | | | | | | | | | | | | | | | | | | | | | | | |
Net investment income | | | (0.10 | ) | | | (0.21 | ) | | | (0.24 | ) | | | (0.29 | ) | | | (0.33 | ) | | | (0.09 | ) | | | (0.37 | ) |
Net realized gains | | | 0.00 | | | | (0.02 | ) | | | (0.00 | )3 | | | (0.04 | ) | | | 0.00 | | | | 0.00 | | | | 0.00 | |
| | | | | | | | | | | | | | | | | | | | | | | | | | | | |
Total distributions to shareholders | | | (0.10 | ) | | �� | (0.22 | ) | | | (0.24 | ) | | | (0.33 | ) | | | (0.33 | ) | | | (0.09 | ) | | | (0.37 | ) |
Net asset value, end of period | | | $8.14 | | | | $8.20 | | | | $8.21 | | | | $8.26 | | | | $8.04 | | | | $8.18 | | | | $8.09 | |
Total return4 | | | 0.50 | % | | | 2.62 | % | | | 2.40 | % | | | 7.00 | % | | | 2.33 | % | | | 2.24 | % | | | 8.35 | % |
Ratios to average net assets (annualized) | | | | | | | | | | | | | | | | | | | | | | | | | | | | |
Gross expenses | | | 1.66 | % | | | 1.66 | % | | | 1.69 | % | | | 1.73 | % | | | 1.75 | % | | | 1.76 | % | | | 1.78 | % |
Net expenses | | | 1.56 | % | | | 1.56 | % | | | 1.56 | % | | | 1.56 | % | | | 1.56 | % | | | 1.56 | % | | | 1.56 | % |
Net investment income | | | 2.48 | % | | | 2.52 | % | | | 2.98 | % | | | 3.58 | % | | | 3.97 | % | | | 4.39 | % | | | 4.69 | % |
Supplemental data | | | | | | | | | | | | | | | | | | | | | | | | | | | | |
Portfolio turnover rate | | | 13 | % | | | 28 | % | | | 33 | % | | | 28 | % | | | 36 | % | | | 15 | % | | | 40 | % |
Net assets, end of period (000s omitted) | | | $127,313 | | | | $143,444 | | | | $133,379 | | | | $102,780 | | | | $71,831 | | | | $36,050 | | | | $32,985 | |
| 1 | For the three months ended August 31, 2010. The Fund changed its fiscal year end from May 31 to August 31, effective August 31, 2010. |
| 2 | Calculated based upon average shares outstanding |
| 3 | Amount is less than $0.005. |
| 4 | Total return calculations do not include any sales charges. Returns for periods of less than one year are not annualized. |
The accompanying notes are an integral part of these financial statements.
| | | | | | |
| Financial highlights | | Wells Fargo Advantage Short-Term High Yield Bond Fund | | | 19 | |
(For a share outstanding throughout each period)
| | | | | | | | | | | | | | | | | | | | | | | | |
| | | Six months ended
February 28, 2015
(unaudited) | | | Year ended August 31 | |
| ADMINISTRATOR CLASS | | | 2014 | | | 2013 | | | 2012 | | | 2011 | | | 20101 | |
Net asset value, beginning of period | | | $8.20 | | | | $8.20 | | | | $8.26 | | | | $8.03 | | | | $8.18 | | | | $8.18 | |
Net investment income | | | 0.14 | | | | 0.28 | | | | 0.32 | | | | 0.37 | | | | 0.41 | | | | 0.03 | 2 |
Net realized and unrealized gains (losses) on investments | | | (0.06 | ) | | | 0.02 | | | | (0.06 | ) | | | 0.27 | | | | (0.15 | ) | | | 0.00 | 3 |
| | | | | | | | | | | | | | | | | | | | | | | | |
Total from investment operations | | | 0.08 | | | | 0.30 | | | | 0.26 | | | | 0.64 | | | | 0.26 | | | | 0.03 | |
Distributions to shareholders from | | | | | | | | | | | | | | | | | | | | | | | | |
Net investment income | | | (0.14 | ) | | | (0.28 | ) | | | (0.32 | ) | | | (0.37 | ) | | | (0.41 | ) | | | (0.03 | ) |
Net realized gains | | | 0.00 | | | | (0.02 | ) | | | (0.00 | )3 | | | (0.04 | ) | | | 0.00 | | | | 0.00 | |
| | | | | | | | | | | | | | | | | | | | | | | | |
Total distributions to shareholders | | | (0.14 | ) | | | (0.30 | ) | | | (0.32 | ) | | | (0.41 | ) | | | (0.41 | ) | | | (0.03 | ) |
Net asset value, end of period | | | $8.14 | | | | $8.20 | | | | $8.20 | | | | $8.26 | | | | $8.03 | | | | $8.18 | |
Total return4 | | | 0.95 | % | | | 3.69 | % | | | 3.21 | % | | | 8.12 | % | | | 3.15 | % | | | 0.39 | % |
Ratios to average net assets (annualized) | | | | | | | | | | | | | | | | | | | | | | | | |
Gross expenses | | | 0.85 | % | | | 0.84 | % | | | 0.87 | % | | | 0.92 | % | | | 0.94 | % | | | 0.89 | % |
Net expenses | | | 0.65 | % | | | 0.65 | % | | | 0.65 | % | | | 0.65 | % | | | 0.65 | % | | | 0.64 | % |
Net investment income | | | 3.38 | % | | | 3.44 | % | | | 3.89 | % | | | 4.48 | % | | | 4.87 | % | | | 4.39 | % |
Supplemental data | | | | | | | | | | | | | | | | | | | | | | | | |
Portfolio turnover rate | | | 13 | % | | | 28 | % | | | 33 | % | | | 28 | % | | | 36 | % | | | 15 | % |
Net assets, end of period (000s omitted) | | | $371,350 | | | | $509,059 | | | | $550,981 | | | | $459,746 | | | | $249,301 | | | | $60 | |
| 1 | For the period from July 30, 2010 (commencement of class operations) to August 31, 2010 |
| 2 | Calculated based upon average shares outstanding |
| 3 | Amount is less than $0.005. |
| 4 | Returns for periods of less than one year are not annualized. |
The accompanying notes are an integral part of these financial statements.
| | | | |
| 20 | | Wells Fargo Advantage Short-Term High Yield Bond Fund | | Financial highlights |
(For a share outstanding throughout each period)
| | | | | | | | | | | | |
| | | Six months ended
February 28, 2015
(unaudited) | | | Year ended August 31 | |
| INSTITUTIONAL CLASS | | | 2014 | | | 20131 | |
Net asset value, beginning of period | | | $8.18 | | | | $8.19 | | | | $8.28 | |
Net investment income | | | 0.14 | | | | 0.29 | | | | 0.25 | |
Net realized and unrealized gains (losses) on investments | | | (0.05 | ) | | | 0.01 | | | | (0.09 | ) |
| | | | | | | | | | | | |
Total from investment operations | | | 0.09 | | | | 0.30 | | | | 0.16 | |
Distributions to shareholders from | | | | | | | | | | | | |
Net investment income | | | (0.14 | ) | | | (0.29 | ) | | | (0.25 | ) |
Net realized gains | | | 0.00 | | | | (0.02 | ) | | | (0.00 | )2 |
| | | | | | | | | | | | |
Total distributions to shareholders | | | (0.14 | ) | | | (0.31 | ) | | | (0.25 | ) |
Net asset value, end of period | | | $8.13 | | | | $8.18 | | | | $8.19 | |
Total return3 | | | 1.15 | % | | | 3.72 | % | | | 1.92 | % |
Ratios to average net assets (annualized) | | | | | | | | | | | | |
Gross expenses | | | 0.58 | % | | | 0.58 | % | | | 0.60 | % |
Net expenses | | | 0.50 | % | | | 0.50 | % | | | 0.50 | % |
Net investment income | | | 3.54 | % | | | 3.58 | % | | | 4.05 | % |
Supplemental data | | | | | | | | | | | | |
Portfolio turnover rate | | | 13 | % | | | 28 | % | | | 33 | % |
Net assets, end of period (000s omitted) | | | $507,301 | | | | $540,824 | | | | $211,642 | |
| 1 | For the period from November 30, 2012 (commencement of class operations) to August 31, 2013 |
| 2 | Amount is less than $0.005. |
| 3 | Returns for periods of less than one year are not annualized. |
The accompanying notes are an integral part of these financial statements.
| | | | | | |
| Financial highlights | | Wells Fargo Advantage Short-Term High Yield Bond Fund | | | 21 | |
(For a share outstanding throughout each period)
| | | | | | | | | | | | | | | | | | | | | | | | | | | | |
| | | Six months ended
February 28, 2015
(unaudited) | | | Year ended August 31 | | | Year ended
May 31, 2010 | |
| INVESTOR CLASS | | | 2014 | | | 2013 | | | 2012 | | | 2011 | | | 20101 | | |
Net asset value, beginning of period | | | $8.20 | | | | $8.21 | | | | $8.26 | | | | $8.03 | | | | $8.18 | | | | $8.09 | | | | $7.82 | |
Net investment income | | | 0.13 | | | | 0.27 | | | | 0.31 | | | | 0.35 | 2 | | | 0.39 | | | | 0.11 | | | | 0.44 | |
Net realized and unrealized gains (losses) on investments | | | (0.06 | ) | | | 0.00 | 3 | | | (0.06 | ) | | | 0.27 | | | | (0.15 | ) | | | 0.08 | | | | 0.26 | |
| | | | | | | | | | | | | | | | | | | | | | | | | | | | |
Total from investment operations | | | 0.07 | | | | 0.27 | | | | 0.25 | | | | 0.62 | | | | 0.24 | | | | 0.19 | | | | 0.70 | |
Distributions to shareholders from | | | | | | | | | | | | | | | | | | | | | | | | | | | | |
Net investment income | | | (0.13 | ) | | | (0.26 | ) | | | (0.30 | ) | | | (0.35 | ) | | | (0.39 | ) | | | (0.10 | ) | | | (0.43 | ) |
Net realized gains | | | 0.00 | | | | (0.02 | ) | | | (0.00 | )3 | | | (0.04 | ) | | | 0.00 | | | | 0.00 | | | | 0.00 | |
| | | | | | | | | | | | | | | | | | | | | | | | | | | | |
Total distributions to shareholders | | | (0.13 | ) | | | (0.28 | ) | | | (0.30 | ) | | | (0.39 | ) | | | (0.39 | ) | | | (0.10 | ) | | | (0.43 | ) |
Net asset value, end of period | | | $8.14 | | | | $8.20 | | | | $8.21 | | | | $8.26 | | | | $8.03 | | | | $8.18 | | | | $8.09 | |
Total return4 | | | 0.85 | % | | | 3.36 | % | | | 3.13 | % | | | 7.91 | % | | | 2.95 | % | | | 2.42 | % | | | 9.12 | % |
Ratios to average net assets (annualized) | | | | | | | | | | | | | | | | | | | | | | | | | | | | |
Gross expenses | | | 0.94 | % | | | 0.94 | % | | | 0.97 | % | | | 1.01 | % | | | 1.03 | % | | | 1.05 | % | | | 1.07 | % |
Net expenses | | | 0.84 | % | | | 0.84 | % | | | 0.84 | % | | | 0.84 | % | | | 0.84 | % | | | 0.85 | % | | | 0.86 | % |
Net investment income | | | 3.20 | % | | | 3.24 | % | | | 3.70 | % | | | 4.30 | % | | | 4.76 | % | | | 5.10 | % | | | 5.49 | % |
Supplemental data | | | | | | | | | | | | | | | | | | | | | | | | | | | | |
Portfolio turnover rate | | | 13 | % | | | 28 | % | | | 33 | % | | | 28 | % | | | 36 | % | | | 15 | % | | | 40 | % |
Net assets, end of period (000s omitted) | | | $181,230 | | | | $227,763 | | | | $258,302 | | | | $232,175 | | | | $170,952 | | | | $177,946 | | | | $165,759 | |
| 1 | For the three months ended August 31, 2010. The Fund changed its fiscal year end from May 31 to August 31, effective August 31, 2010. |
| 2 | Calculated based upon average shares outstanding |
| 3 | Amount is less than $0.005. |
| 4 | Returns for periods of less than one year are not annualized. |
The accompanying notes are an integral part of these financial statements.
| | | | |
| 22 | | Wells Fargo Advantage Short-Term High Yield Bond Fund | | Notes to financial statements (unaudited) |
1. ORGANIZATION
Wells Fargo Funds Trust (the “Trust”), a Delaware statutory trust organized on March 10, 1999, is an open-end management investment company registered under the Investment Company Act of 1940, as amended (the “1940 Act”). As an investment company, the Trust follows the accounting and reporting guidance in Financial Accounting Standards Board (“FASB”) Accounting Standards Codification 946, Financial Services – Investment Companies. These financial statements report on the Wells Fargo Advantage Short-Term High Yield Bond Fund (the “Fund”) which is a diversified series of the Trust.
2. SIGNIFICANT ACCOUNTING POLICIES
The following significant accounting policies, which are consistently followed in the preparation of the financial statements of the Fund, are in conformity with U.S. generally accepted accounting principles which require management to make estimates and assumptions that affect the reported amounts of assets and liabilities, disclosure of contingent assets and liabilities at the date of the financial statements, and the reported amounts of revenues and expenses during the reporting period. Actual results could differ from those estimates.
Securities valuation
All investments are valued each business day as of the close of regular trading on the New York Stock Exchange (generally 4 p.m. Eastern Time).
Debt securities are valued at the evaluated bid price provided by an independent pricing service or, if a reliable price is not available, the quoted bid price from an independent broker-dealer.
Investments in registered open-end investment companies are valued at net asset value. Interests in non-registered investment vehicles that are redeemable at net asset value are fair valued at net asset value when available.
Investments which are not valued using any of the methods discussed above are valued at their fair value, as determined in good faith by the Board of Trustees of the Fund. The Board of Trustees has established a Valuation Committee comprised of the Trustees and has delegated to it the authority to take any actions regarding the valuation of portfolio securities that the Valuation Committee deems necessary or appropriate, including determining the fair value of portfolio securities, unless the determination has been delegated to the Management Valuation Team of Wells Fargo Funds Management, LLC (“Funds Management”). The Board of Trustees retains the authority to make or ratify any valuation decisions or approve any changes to the Valuation Procedures as it deems appropriate. On a quarterly basis, the Board of Trustees receives reports on any valuation actions taken by the Valuation Committee or the Management Valuation Team which may include items for ratification.
Valuations of fair valued securities are compared to the next actual sales price when available, or other appropriate market values, to assess the continued appropriateness of the fair valuation methodologies used. These securities are fair valued on a day-to-day basis, taking into consideration changes to appropriate market information and any significant changes to the inputs considered in the valuation process until there is a readily available price provided on an exchange or by an independent pricing service. Valuations received from an independent pricing service or independent broker-dealer quotes are periodically validated by comparisons to most recent trades and valuations provided by other independent pricing services in addition to the review of prices by the adviser and/or subadviser. Unobservable inputs used in determining fair valuations are identified based on the type of security, taking into consideration factors utilized by market participants in valuing the investment, knowledge about the issuer and the current market environment.
Security loans
The Fund may lend its securities from time to time in order to earn additional income in the form of fees or interest on securities received as collateral or the investment of any cash received as collateral. The Fund continues to receive interest or dividends on the securities loaned. The Fund receives collateral in the form of cash or securities with a value at least equal to the value of the securities on loan. The value of the loaned securities is determined at the close of each business day and any additional required collateral is delivered to the Fund on the next business day. In a securities lending transaction, the net asset value of the Fund will be affected by an increase or decrease in the value of the securities loaned and by an increase or decrease in the value of the instrument in which collateral is invested. The amount of securities lending activity undertaken by the Fund fluctuates from time to time. In the event of default or bankruptcy by the borrower, the Fund may be prevented from recovering the loaned securities or gaining access to the collateral or may experience delays or costs in doing so. In addition, the investment of any cash collateral received may lose all or part of its value. The Fund has the right under the lending agreement to recover the securities from the borrower on demand.
| | | | | | |
| Notes to financial statements (unaudited) | | Wells Fargo Advantage Short-Term High Yield Bond Fund | | | 23 | |
The Fund lends its securities through an unaffiliated securities lending agent. Cash collateral received in connection with its securities lending transactions is invested in Securities Lending Cash Investments, LLC (the “Securities Lending Fund”). The Securities Lending Fund is exempt from registration under Section 3(c)(7) of the 1940 Act and is managed by Funds Management and is subadvised by Wells Capital Management Incorporated (“WellsCap”). Funds Management receives an advisory fee starting at 0.05% and declining to 0.01% as the average daily net assets of the Securities Lending Fund increase. All of the fees received by Funds Management are paid to WellsCap for its services as subadviser. The Securities Lending Fund seeks to provide a positive return compared to the daily Fed Funds Open rate by investing in high-quality, U.S. dollar-denominated short-term money market instruments. Securities Lending Fund investments are fair valued based upon the amortized cost valuation technique. Income earned from investment in the Securities Lending Fund is included in securities lending income on the Statement of Operations.
When-issued transactions
The Fund may purchase securities on a forward commitment or when-issued basis. The Fund records a when-issued transaction on the trade date and will segregate assets in an amount at least equal in value to the Fund’s commitment to purchase when-issued securities. Securities purchased on a when-issued basis are marked-to-market daily and the Fund begins earning interest on the settlement date. Losses may arise due to changes in the market value of the underlying securities or if the counterparty does not perform under the contract.
Loans
The Fund may invest in direct debt instruments which are interests in amounts owed to lenders by corporate or other borrowers. The loans pay interest at rates which are periodically reset by reference to a base lending rate plus a spread. Investments in loans may be in the form of participations in loans or assignments of all or a portion of loans from third parties. When the Fund purchases participations, it generally has no rights to enforce compliance with terms of the loan agreement with the borrower. As a result, the Fund assumes the credit risk of both the borrower and the lender that is selling the participation. When the Fund purchases assignments from lenders, it acquires direct rights against the borrower on the loan and may enforce compliance by the borrower with the terms of the loan agreement. Loans may include fully funded term loans or unfunded loan commitments, which are contractual obligations for future funding.
Security transactions and income recognition
Securities transactions are recorded on a trade date basis. Realized gains or losses are recorded on the basis of identified cost.
Interest income is accrued daily and bond discounts are accreted and premiums are amortized daily based on the effective interest method. To the extent debt obligations are placed on non-accrual status, any related interest income may be reduced by writing off interest receivables when the collection of all or a portion of interest has become doubtful based on consistently applied procedures. If the issuer subsequently resumes interest payments or when the collectability of interest is reasonably assured, the debt obligation is removed from non-accrual status.
Distributions to shareholders
Distributions to shareholders from net investment income are accrued daily and paid monthly. Distributions from net realized gains, if any, are recorded on the ex-dividend date. Such distributions are determined in conformity with federal income tax regulations, which may differ in amount or character from net investment income and realized gains recognized for purposes of U.S. generally accepted accounting principles.
Federal and other taxes
The Fund intends to continue to qualify as a regulated investment company by distributing substantially all of its investment company taxable income and any net realized capital gains (after reduction for capital loss carryforwards) sufficient to relieve it from all, or substantially all, federal income taxes. Accordingly, no provision for federal income taxes was required.
The Fund’s income and federal excise tax returns and all financial records supporting those returns for the prior three fiscal years are subject to examination by the federal and Delaware revenue authorities. Management has analyzed the Fund’s tax positions taken on federal, state, and foreign tax returns for all open tax years and does not believe that there are any uncertain tax positions that require recognition of a tax liability.
As of August 31, 2014, the Fund had capital loss carryforwards which consist of $760,488 in short-term capital losses.
Class allocations
The separate classes of shares offered by the Fund differ principally in applicable sales charges, distribution, shareholder servicing, and administration fees. Class specific expenses are charged directly to that share class. Investment income, common expenses, and realized and unrealized gains (losses) on investments are allocated daily to each class of shares based on the relative proportion of net assets of each class.
| | | | |
| 24 | | Wells Fargo Advantage Short-Term High Yield Bond Fund | | Notes to financial statements (unaudited) |
3. FAIR VALUATION MEASUREMENTS
Fair value measurements of investments are determined within a framework that has established a fair value hierarchy based upon the various data inputs utilized in determining the value of the Fund’s investments. The three-level hierarchy gives the highest priority to unadjusted quoted prices in active markets for identical assets or liabilities (Level 1) and the lowest priority to significant unobservable inputs (Level 3). The Fund’s investments are classified within the fair value hierarchy based on the lowest level of input that is significant to the fair value measurement. The inputs are summarized into three broad levels as follows:
| n | | Level 1 – quoted prices in active markets for identical securities |
| n | | Level 2 – other significant observable inputs (including quoted prices for similar securities, interest rates, prepayment speeds, credit risk, use of amortized cost, etc.) |
| n | | Level 3 – significant unobservable inputs (including the Fund’s own assumptions in determining the fair value of investments) |
The inputs or methodologies used for valuing investments in securities are not necessarily an indication of the risk associated with investing in those securities.
The following is a summary of the inputs used in valuing the Fund’s assets and liabilities as of February 28, 2015:
| | | | | | | | | | | | | | | | |
| | | Quoted prices
(Level 1) | | | Other significant
observable inputs
(Level 2) | | | Significant
unobservable inputs
(Level 3) | | | Total | |
Assets | | | | | | | | | | | | | | | | |
Investments in : | | | | | | | | | | | | | | | | |
| | | | |
Corporate bonds and notes | | $ | 0 | | | $ | 807,780,264 | | | $ | 0 | | | $ | 807,780,264 | |
| | | | |
Loans | | | 0 | | | | 465,822,105 | | | | 4,178,970 | | | | 470,001,075 | |
| | | | |
Municipal obligations | | | 0 | | | | 15,197,131 | | | | 0 | | | | 15,197,131 | |
| | | | |
Non-agency mortgage-backed securities | | | 0 | | | | 35,264 | | | | 0 | | | | 35,264 | |
| | | | |
Yankee corporate bonds and notes | | | 0 | | | | 56,581,245 | | | | 0 | | | | 56,581,245 | |
| | | | |
Short-term investments | | | | | | | | | | | | | | | | |
Investment companies | | | 32,653,432 | | | | 1,055,000 | | | | 0 | | | | 33,708,432 | |
Total assets | | $ | 32,653,432 | | | $ | 1,346,471,009 | | | $ | 4,178,970 | | | $ | 1,383,303,411 | |
The Fund recognizes transfers between levels within the fair value hierarchy at the end of the reporting period. At February 28, 2015, the Fund did not have any transfers into/out of Level 1, Level 2, or Level 3.
4. TRANSACTIONS WITH AFFILIATES
Advisory fee
The Trust has entered into an advisory contract with Funds Management, an indirect wholly owned subsidiary of Wells Fargo & Company (“Wells Fargo”). The adviser is responsible for implementing investment policies and guidelines and for supervising the subadviser, who is responsible for day-to-day portfolio management of the Fund.
Pursuant to the contract, Funds Management is entitled to receive an annual advisory fee starting at 0.45% and declining to 0.35% as the average daily net assets of the Fund increase. For the six months ended February 28, 2015, the advisory fee was equivalent to an annual rate of 0.42% of the Fund’s average daily net assets.
Funds Management has retained the services of a subadviser to provide daily portfolio management to the Fund. The fee for subadvisory services is borne by Funds Management. WellsCap, an affiliate of Funds Management and an indirect wholly owned subsidiary of Wells Fargo, is the subadviser to the Fund and is entitled to receive a fee from Funds Management at an annual rate starting at 0.35% and declining to 0.20% as the average daily net assets of the Fund increase.
| | | | | | |
| Notes to financial statements (unaudited) | | Wells Fargo Advantage Short-Term High Yield Bond Fund | | | 25 | |
Administration fees
The Trust has entered into an administration agreement with Funds Management. Under this agreement, for providing administrative services, which includes paying fees and expenses for services provided by the transfer agent, sub-transfer agents, omnibus account servicers and record-keepers, Funds Management is entitled to receive from the Fund an annual fund level administration fee starting at 0.05% and declining to 0.03% as the average daily net assets of the Fund increase and a class level administration fee which is calculated based on the average daily net assets of each class as follows:
| | | | |
| | | Class level
administration fee | |
Class A, Class C | | | 0.16 | % |
Administrator Class | | | 0.10 | |
Institutional Class | | | 0.08 | |
Investor Class | | | 0.19 | |
Funds Management has contractually waived and/or reimbursed advisory and administration fees to the extent necessary to maintain certain net operating expense ratios for the Fund. Waiver of fees and/or reimbursement of expenses by Funds Management were made first from fund level expenses on a proportionate basis and then from class specific expenses. Funds Management has committed through December 31, 2015 to waive fees and/or reimburse expenses to the extent necessary to cap the Fund’s expenses at 0.81% for Class A shares, 1.56% for Class C shares, 0.65% for Administrator Class shares, 0.50% for Institutional Class shares, and 0.84% for Investor Class shares. After this time, the cap may be increased or the commitment to maintain the cap may be terminated only with the approval of the Board of Trustees.
Distribution fee
The Trust has adopted a Distribution Plan for Class C shares of the Fund pursuant to Rule 12b-1 under the 1940 Act. A distribution fee is charged to Class C shares and paid to Wells Fargo Funds Distributor, LLC (“Funds Distributor”), the principal underwriter, at an annual rate of 0.75% of the average daily net assets of Class C shares.
In addition, Funds Distributor is entitled to receive the front-end sales charge from the purchase of Class A shares and a contingent deferred sales charge on the redemption of certain shares. Funds Distributor is also entitled to receive the contingent deferred sales charges from redemptions of Class C shares. For the six months ended February 28, 2015, Funds Distributor received $3,148 from the sale of Class A shares.
Shareholder servicing fees
The Trust has entered into contracts with one or more shareholder servicing agents, whereby Class A, Class C, Administrator Class, and Investor Class of the Fund is charged a fee at an annual rate of 0.25% of the average daily net assets of each respective class.
A portion of these total shareholder servicing fees were paid to affiliates of Wells Fargo.
5. INVESTMENT PORTFOLIO TRANSACTIONS
Purchases and sales of investments, excluding U.S. government obligations (if any) and short-term securities, for the six months ended February 28, 2015 were $198,362,819 and $374,679,224, respectively.
As of February 28, 2015, the Fund had unfunded term loan commitments of $10,894,631.
6. BANK BORROWINGS
The Trust (excluding the money market funds and certain other funds in the Trust) and Wells Fargo Variable Trust are parties to a $150,000,000 revolving credit agreement, whereby the Fund is permitted to use bank borrowings for temporary or emergency purposes, such as to fund shareholder redemption requests. Interest under the credit agreement is charged to the Fund based on a borrowing rate equal to the higher of the Federal Funds rate in effect on that day plus 1.25% or the overnight LIBOR rate in effect on that day plus 1.25%. In addition, an annual commitment fee equal to 0.10% of the unused balance is allocated to each participating fund. For the six months ended February 28, 2015, the Fund paid $1,544 in commitment fees.
For the six months ended February 28, 2015, there were no borrowings by the Fund under the agreement.
7. INDEMNIFICATION
Under the Trust’s organizational documents, the officers and Trustees are indemnified against certain liabilities that may arise out of performance of their duties to the Trust. Additionally, in the normal course of business, the Trust may enter into contracts with service providers that contain a variety of indemnification clauses. The Trust’s maximum exposure under these arrangements is dependent on future claims that may be made against the Fund and, therefore, cannot be estimated.
| | | | |
| 26 | | Wells Fargo Advantage Short-Term High Yield Bond Fund | | Other information (unaudited) |
PROXY VOTING INFORMATION
A description of the policies and procedures that the Fund uses to determine how to vote proxies relating to portfolio securities is available, upon request, by calling 1-800-222-8222, visiting our website at wellsfargoadvantagefunds.com, or visiting the SEC website at sec.gov. Information regarding how the Fund voted proxies relating to portfolio securities during the most recent 12-month period ended June 30 is available on the Fund’s website at wellsfargoadvantagefunds.com or by visiting the SEC website at sec.gov.
PORTFOLIO HOLDINGS INFORMATION
The complete portfolio holdings for the Fund are publicly available monthly on the Fund’s website (wellsfargoadvantagefunds.com), on a one-month delayed basis. In addition, top ten holdings information (excluding derivative positions) for the Fund is publicly available on the Fund’s website on a monthly, seven-day or more delayed basis. The Fund files its complete schedule of portfolio holdings with the SEC for the first and third quarters of each fiscal year on Form N-Q, which is available by visiting the SEC website at sec.gov. In addition, the Fund’s Form N-Q may be reviewed and copied at the SEC’s Public Reference Room in Washington, DC, and at regional offices in New York City, at 233 Broadway, and in Chicago, at 175 West Jackson Boulevard, Suite 900. Information about the Public Reference Room may be obtained by calling 1-800-SEC-0330.
| | | | | | |
| Other information (unaudited) | | Wells Fargo Advantage Short-Term High Yield Bond Fund | | | 27 | |
BOARD OF TRUSTEES AND OFFICERS
Each of the Trustees and Officers1 listed in the table below acts in identical capacities for each fund in the Wells Fargo Advantage family of funds, which consists of 134 mutual funds comprising the Wells Fargo Funds Trust, Wells Fargo Variable Trust, Wells Fargo Master Trust and four closed-end funds (collectively the “Fund Complex”). This table should be read in conjunction with the Prospectus and the Statement of Additional Information2. The mailing address of each Trustee and Officer is 525 Market Street, 12th Floor, San Francisco, CA 94105. Each Trustee and Officer serves an indefinite term, however, each Trustee serves such term until reaching the mandatory retirement age established by the Trustees.
Independent Trustees
| | | | | | |
Name and year of birth | | Position held and length of service* | | Principal occupations during past five years or longer | | Other directorships during
past five years |
| William R. Ebsworth (Born 1957) | | Trustee, since 2015** | | Retired. From 1984 to 2013, equities analyst, portfolio manager, research director at Fidelity Management and Research Company and retired in 2013 as Chief Investment Officer of Fidelity Strategic Advisers, Inc. in Boston, Tokyo, and Hong Kong where he led a team of investment professionals managing client assets. Prior thereto, Board member of Hong Kong Securities Clearing Co., Hong Kong Options Clearing Corp., the Thailand International Fund, Ltd., Fidelity Investments Life Insurance Company, and Empire Fidelity Investments Life Insurance Company. Mr. Ebsworth is an Adjunct Lecturer, Finance, at Babson College and a Chartered Financial Analyst. | | Asset Allocation Trust |
| Jane A. Freeman (Born 1953) | | Trustee, since 2015** | | Retired. From 2012 to 2014 and 1999 to 2008, Chief Financial Officer of Scientific Learning Corporation. From 2008 to 2012, Ms. Freeman provided consulting services related to strategic business projects. Prior thereto, Portfolio Manager at Rockefeller & Co. and Scudder, Stevens & Clark. Board member of the Harding Loevner Funds from 1996 to 2014, serving as both Lead Independent Director and chair of the Audit Committee. Board member of the Russell Exchange Traded Funds Trust from 2011 to 2012 and the chair of the Audit Committee. Ms. Freeman is a Chartered Financial Analyst (inactive), Chair of Taproot Foundation (non-profit organization) and a Board Member of Ruth Bancroft Garden (non-profit organization). | | Asset Allocation Trust |
| Peter G. Gordon (Born 1942) | | Trustee, since 1998; Chairman, since 2005 | | Co-Founder, Retired Chairman, President and CEO of Crystal Geyser Water Company. Trustee Emeritus, Colby College. | | Asset Allocation Trust |
| Isaiah Harris, Jr. (Born 1952) | | Trustee, since 2009 | | Retired. Chairman of the Board of CIGNA Corporation since 2009, and Director since 2005. From 2003 to 2011, Director of Delux Corporation. Prior thereto, President and CEO of BellSouth Advertising and Publishing Corp. from 2005 to 2007, President and CEO of BellSouth Enterprises from 2004 to 2005 and President of BellSouth Consumer Services from 2000 to 2003. Emeritus member of the Iowa State University Foundation Board of Governors. Emeritus Member of the Advisory Board of Iowa State University School of Business. Advisory Board Member, Palm Harbor Academy. Mr. Harris is a certified public accountant. | | CIGNA Corporation; Asset Allocation Trust |
| Judith M. Johnson (Born 1949) | | Trustee, since 2008; Audit Committee Chairman, since 2008 | | Retired. Prior thereto, Chief Executive Officer and Chief Investment Officer of Minneapolis Employees Retirement Fund from 1996 to 2008. Ms. Johnson is an attorney, certified public accountant and a certified managerial accountant. | | Asset Allocation Trust |
| David F. Larcker (Born 1950) | | Trustee, since 2009 | | James Irvin Miller Professor of Accounting at the Graduate School of Business, Stanford University, Morgan Stanley Director of the Center for Leadership Development and Research and Senior Faculty of The Rock Center for Corporate Governance since 2006. From 2005 to 2008, Professor of Accounting at the Graduate School of Business, Stanford University. Prior thereto, Ernst & Young Professor of Accounting at The Wharton School, University of Pennsylvania from 1985 to 2005. | | Asset Allocation Trust |
| Olivia S. Mitchell (Born 1953) | | Trustee, since 2006 | | International Foundation of Employee Benefit Plans Professor, Wharton School of the University of Pennsylvania since 1993. Director of Wharton’s Pension Research Council and Boettner Center on Pensions & Retirement Research, and Research Associate at the National Bureau of Economic Research. Previously, Cornell University Professor from 1978 to 1993. | | Asset Allocation Trust |
| | | | |
| 28 | | Wells Fargo Advantage Short-Term High Yield Bond Fund | | Other information (unaudited) |
| | | | | | |
Name and year of birth | | Position held and length of service* | | Principal occupations during past five years or longer | | Other directorships during
past five years |
| Timothy J. Penny (Born 1951) | | Trustee, since 1996 | | President and Chief Executive Officer of Southern Minnesota Initiative Foundation, a non-profit organization, since 2007 and Senior Fellow at the Humphrey Institute Policy Forum at the University of Minnesota since 1995. Member of the Board of Trustees of NorthStar Education Finance, Inc., a non-profit organization, since 2007. | | Asset Allocation Trust |
| Michael S. Scofield (Born 1943) | | Trustee, since 2010 | | Served on the Investment Company Institute’s Board of Governors and Executive Committee from 2008-2011 as well the Governing Council of the Independent Directors Council from 2006-2011 and the Independent Directors Council Executive Committee from 2008-2011. Chairman of the IDC from 2008-2010. Institutional Investor (Fund Directions) Trustee of Year in 2007. Trustee of the Evergreen Funds complex (and its predecessors) from 1984 to 2010. Chairman of the Evergreen Funds from 2000-2010. Former Trustee of the Mentor Funds. Retired Attorney, Law Offices of Michael S. Scofield. | | Asset Allocation Trust |
| Donald C. Willeke (Born 1940) | | Trustee, since 1996 | | Principal of the law firm of Willeke & Daniels. General Counsel of the Minneapolis Employees Retirement Fund from 1984 until its consolidation into the Minnesota Public Employees Retirement Association on June 30, 2010. Director and Vice Chair of The Tree Trust (non-profit corporation). Director of the American Chestnut Foundation (non-profit corporation). | | Asset Allocation Trust |
| * | Length of service dates reflect the Trustee’s commencement of service with the Trust’s predecessor entities, where applicable. |
| ** | William R. Ebsworth and Jane A. Freeman each became a Trustee effective January 1, 2015. |
Officers
| | | | | | |
Name and year of birth | | Position held and
length of service | | Principal occupations during past five years or longer | | |
| Karla M. Rabusch (Born 1959) | | President, since 2003 | | Executive Vice President of Wells Fargo Bank, N.A. and President of Wells Fargo Funds Management, LLC since 2003. | | |
| Nancy Wiser1 (Born 1967) | | Treasurer, since 2012 | | Executive Vice President of Wells Fargo Funds Management, LLC since 2011. Chief Operating Officer and Chief Compliance Officer at LightBox Capital Management LLC, from 2008 to 2011. Owned and operated a consulting business providing services to various hedge funds including acting as Chief Operating Officer and Chief Compliance Officer for a hedge fund from 2007 to 2008. Chief Operating Officer and Chief Compliance Officer of GMN Capital LLC from 2006 to 2007. | | |
| C. David Messman (Born 1960) | | Secretary, since 2000; Chief Legal Officer, since 2003 | | Senior Vice President and Secretary of Wells Fargo Funds Management, LLC since 2001. Assistant General Counsel of Wells Fargo Bank, N.A. since 2013 and Vice President and Managing Counsel of Wells Fargo Bank N.A. from 1996 to 2013. | | |
| Debra Ann Early (Born 1964) | | Chief Compliance Officer, since 2007 | | Senior Vice President of Wells Fargo Funds Management, LLC since 2007 and Chief Compliance Officer from 2007 to 2014. Chief Compliance Officer of Parnassus Investments from 2005 to 2007. Chief Financial Officer of Parnassus Investments from 2004 to 2007 and Senior Audit Manager of PricewaterhouseCoopers LLP from 1998 to 2004. | | |
| David Berardi (Born 1975) | | Assistant Treasurer, since 2009 | | Vice President of Wells Fargo Funds Management, LLC since 2009. Vice President of Evergreen Investment Management Company, LLC from 2008 to 2010. Assistant Vice President of Evergreen Investment Services, Inc. from 2004 to 2008. Manager of Fund Reporting and Control for Evergreen Investment Management Company, LLC from 2004 to 2010. | | |
| Jeremy DePalma1 (Born 1974) | | Assistant Treasurer, since 2009 | | Senior Vice President of Wells Fargo Funds Management, LLC since 2009. Senior Vice President of Evergreen Investment Management Company, LLC from 2008 to 2010. Vice President, Evergreen Investment Services, Inc. from 2004 to 2007. Head of the Fund Reporting and Control Team within Fund Administration from 2005 to 2010. | | |
| 1 | Nancy Wiser acts as Treasurer of 73 funds in the Fund Complex. Jeremy DePalma acts as Treasurer of 61 funds and Assistant Treasurer of 73 funds in the Fund Complex. |
| 2 | The Statement of Additional Information includes additional information about the Trustees and is available, without charge, upon request, by calling 1-800-222-8222 or by visiting the website at wellsfargoadvantagefunds.com. |
| | | | | | |
| List of abbreviations | | Wells Fargo Advantage Short-Term High Yield Bond Fund | | | 29 | |
The following is a list of common abbreviations for terms and entities that may have appeared in this report.
| ACA | — ACA Financial Guaranty Corporation |
| ADR | — American depositary receipt |
| ADS | — American depositary shares |
| AGC | — Assured Guaranty Corporation |
| AGM | — Assured Guaranty Municipal |
| Ambac | — Ambac Financial Group Incorporated |
| AMT | — Alternative minimum tax |
| BAN | — Bond anticipation notes |
| BHAC | — Berkshire Hathaway Assurance Corporation |
| CAB | — Capital appreciation bond |
| CCAB | — Convertible capital appreciation bond |
| CDA | — Community Development Authority |
| CDO | — Collateralized debt obligation |
| DRIVER | — Derivative inverse tax-exempt receipts |
| DW&P | — Department of Water & Power |
| DWR | — Department of Water Resources |
| ECFA | — Educational & Cultural Facilities Authority |
| EDA | — Economic Development Authority |
| EDFA | — Economic Development Finance Authority |
| ETF | — Exchange-traded fund |
| FDIC | — Federal Deposit Insurance Corporation |
| FFCB | — Federal Farm Credit Banks |
| FGIC | — Financial Guaranty Insurance Corporation |
| FHA | — Federal Housing Administration |
| FHLB | — Federal Home Loan Bank |
| FHLMC | — Federal Home Loan Mortgage Corporation |
| FICO | — The Financing Corporation |
| FNMA | — Federal National Mortgage Association |
| GDR | — Global depositary receipt |
| GNMA | — Government National Mortgage Association |
| HCFR | — Healthcare facilities revenue |
| HEFA | — Health & Educational Facilities Authority |
| HEFAR | — Higher education facilities authority revenue |
| HFA | — Housing Finance Authority |
| HFFA | — Health Facilities Financing Authority |
| HUD | — Department of Housing and Urban Development |
| IDA | — Industrial Development Authority |
| IDAG | — Industrial Development Agency |
| KRW | — Republic of Korea won |
| LIBOR | — London Interbank Offered Rate |
| LIFER | — Long Inverse Floating Exempt Receipts |
| LLC | — Limited liability company |
| LLLP | — Limited liability limited partnership |
| LLP | — Limited liability partnership |
| MBIA | — Municipal Bond Insurance Association |
| MFHR | — Multifamily housing revenue |
| MSTR | — Municipal securities trust receipts |
| MUD | — Municipal Utility District |
| National | — National Public Finance Guarantee Corporation |
| PCFA | — Pollution Control Financing Authority |
| PCL | — Public Company Limited |
| PCR | — Pollution control revenue |
| PFA | — Public Finance Authority |
| PFFA | — Public Facilities Financing Authority |
| PFOTER | — Puttable floating option tax-exempt receipts |
| plc | — Public limited company |
| PUTTER | — Puttable tax-exempt receipts |
| R&D | — Research & development |
| Radian | — Radian Asset Assurance |
| RAN | — Revenue anticipation notes |
| RDA | — Redevelopment Authority |
| RDFA | — Redevelopment Finance Authority |
| REIT | — Real estate investment trust |
| ROC | — Reset option certificates |
| SAVRS | — Select auction variable rate securities |
| SBA | — Small Business Authority |
| SFHR | — Single-family housing revenue |
| SFMR | — Single-family mortgage revenue |
| SPA | — Standby purchase agreement |
| SPDR | — Standard & Poor’s Depositary Receipts |
| SPEAR | — Short Puttable Exempt Adjustable Receipts |
| STRIPS | — Separate trading of registered interest and |
| TAN | — Tax anticipation notes |
| TIPS | — Treasury inflation-protected securities |
| TRAN | — Tax revenue anticipation notes |
| TTFA | — Transportation Trust Fund Authority |
| TVA | — Tennessee Valley Authority |
This page is intentionally left blank.
This page is intentionally left blank.
This page is intentionally left blank.


For more information
More information about Wells Fargo Advantage Funds is available free upon request. To obtain literature, please write, email, visit the Fund’s website, or call:
Wells Fargo Advantage Funds
P.O. Box 8266
Boston, MA 02266-8266
Email: wfaf@wellsfargo.com
Website: wellsfargoadvantagefunds.com
Individual investors: 1-800-222-8222
Retail investment professionals: 1-888-877-9275
Institutional investment professionals: 1-866-765-0778
This report and the financial statements contained herein are submitted for the general information of the shareholders of Wells Fargo Advantage Funds. If this report is used for promotional purposes, distribution of the report must be accompanied or preceded by a current prospectus. Before investing, please consider the investment objectives, risks, charges, and expenses of the investment. For a current prospectus and, if available, a summary prospectus, containing this information, call 1-800-222-8222 or visit the Fund’s website at wellsfargoadvantagefunds.com. Read the prospectus carefully before you invest or send money.
Wells Fargo Funds Management, LLC, a wholly owned subsidiary of Wells Fargo & Company, provides investment advisory and administrative services for Wells Fargo Advantage Funds. Other affiliates of Wells Fargo & Company provide subadvisory and other services for the Funds. The Funds are distributed by Wells Fargo Funds Distributor, LLC, Member FINRA/SIPC, an affiliate of Wells Fargo & Company.
NOT FDIC INSURED ¡ NO BANK GUARANTEE ¡ MAY LOSE VALUE
© 2015 Wells Fargo Funds Management, LLC. All rights reserved.
| | |
 | | 232059 04-15 SA222/SAR222 02-15 |

Wells Fargo Advantage
Ultra Short-Term Income Fund

Semi-Annual Report
February 28, 2015

Reduce clutter. Save trees.
Sign up for electronic delivery of prospectuses and shareholder reports at wellsfargo.com/advantagedelivery
Contents
The views expressed and any forward-looking statements are as of February 28, 2015, unless otherwise noted, and are those of the Fund managers and/or Wells Fargo Funds Management, LLC. Discussions of individual securities, or the markets generally, or any Wells Fargo Advantage Fund are not intended as individual recommendations. Future events or results may vary significantly from those expressed in any forward-looking statements; the views expressed are subject to change at any time in response to changing circumstances in the market. Wells Fargo Funds Management, LLC and the Fund disclaim any obligation to publicly update or revise any views expressed or forward-looking statements.
NOT FDIC INSURED ¡ NO BANK GUARANTEE ¡ MAY LOSE VALUE
| | | | |
| 2 | | Wells Fargo Advantage Ultra Short-Term Income Fund | | Letter to shareholders (unaudited) |

Karla M. Rabusch
President
Wells Fargo Advantage Funds
Major central banks continued to inject liquidity into global banks and markets through various accommodative monetary policies, including quantitative easing.
Dear Valued Shareholder:
We are pleased to offer you this semi-annual report for the Wells Fargo Advantage Ultra Short-Term Income Fund for the six-month period that ended February 28, 2015. The period was marked by low interest rates, a large decline in oil prices, and moderate U.S. economic growth. Investment-grade bonds, as measured by the Barclays U.S. Aggregate Bond Index1, returned 2.25% during the period.
Major central banks continued to provide stimulus.
Major central banks continued to inject liquidity into global banks and markets through various accommodative monetary policies, including quantitative easing. In the U.S., the Federal Reserve (Fed) kept its key interest rate near zero in order to support the economy and the financial system. It ended its quantitative easing program in October 2014 and also set expectations for it to begin normalizing monetary policy with higher target ranges for the federal funds rate in 2015.
Meanwhile, European markets continued to benefit from the European Central Bank’s (ECB’s) willingness to maintain low interest rates. In September 2014, the ECB cut its key rate to a historic low of 0.05%. In addition to its targeted longer-term refinancing operations that are designed to increase bank lending, the ECB said it intends to increase the size of its balance sheet, a result of quantitative easing, by buying eurozone government bonds. In Japan, the Bank of Japan maintained an aggressive monetary program aimed at combating deflation.
U.S. economic growth was moderate, and oil prices plummeted.
Economic growth advanced during the reporting period, the unemployment rate ticked lower to 5.5% as of February 2015, and inflation remained below the Fed’s longer-run objective of a 2% pace. The period was also marked by dramatically lower oil prices, which fell from more than $90 per barrel at the end of August 2014 to below $50 per barrel at the end of February 2015. While lower oil prices benefited consumers of oil products, the lower prices pressured companies within the energy sector.
Longer-dated securities and higher-rated credits were top performers.
Ten-year U.S. Treasury rates declined during the period, from 2.35% at end of August 2014 to 2.03% by the end of February 2015, benefiting both from safe-haven status as well as relative attractiveness to global investors. With the U.S. economy the furthest along its business cycle, the level of interest rates in the U.S. and Europe diverged. The 10-year U.S. Treasury yield was 2.03% at the end of February 2015 compared with 0.30% for 10-year German government yields, 173 basis points (bps; 100 bps equals 1.00%) higher. This was largely attributed to the Fed being closer to eventually increasing interest rates while the ECB potentially needs to further increase, rather than scale back, its amount of accommodation. Further, U.S. economic activity was healthier than Europe’s.
Treasury bonds with maturities greater than 20 years returned more than 10% during the six-month period that ended February 28, 2015, according to the Barclays U.S. Aggregate Bond Index. This was due, in part, to strong demand from overseas investors because yields in Europe and Japan were substantially lower
| 1 | The Barclays U.S. Aggregate Bond Index is a broad-based benchmark that measures the investment-grade, U.S. dollar-denominated, fixed-rate taxable bond market, including Treasuries, government-related and corporate securities, MBS (agency fixed-rate and hybrid ARM passthroughs), ABS, and CMBS. You cannot invest directly in an index. |
| | | | | | |
| Letter to shareholders (unaudited) | | Wells Fargo Advantage Ultra Short-Term Income Fund | | | 3 | |
than U.S. yields. In addition, because the dollar strengthened, the returns from Treasuries were even higher for foreign-domiciled investors. Longer-maturity debt across all sectors outperformed shorter-dated securities.
Investment-grade corporate bonds returned 2.29% during the six-month reporting period, according to the Barclays U.S. Aggregate Bond Index, and AAA-rated2 bonds had higher returns than BBB-rated bonds. Lower-rated credits, including high yield, underperformed as oil prices fell dramatically. Not only were many energy and mining companies negatively affected, but investor trepidation about weak global growth caused investment-grade spreads to modestly widen while high-yield spreads widened substantially.
Don’t let short-term uncertainty derail long-term investment goals.
Periods of uncertainty can present challenges, but experience has taught us that maintaining long-term investment goals can be an effective way to plan for the future. To help you create a sound strategy based on your personal goals and risk tolerance, Wells Fargo Advantage Funds offers more than 100 mutual funds and other investments spanning a wide range of asset classes and investment styles. Although diversification cannot guarantee an investment profit or prevent losses, we believe it can be an effective way to manage investment risk and potentially smooth out overall portfolio performance. We encourage investors to know their investments and to understand that appropriate levels of risk-taking may unlock opportunities.
Thank you for choosing to invest with Wells Fargo Advantage Funds. We appreciate your confidence in us and remain committed to helping you meet your financial needs. For current information about your fund investments, contact your investment professional, visit our website at wellsfargoadvantagefunds.com, or call us directly at 1-800-222-8222. We are available 24 hours a day, 7 days a week.
Sincerely,

Karla M. Rabusch
President
Wells Fargo Advantage Funds
Periods of uncertainty can present challenges, but experience has taught us that maintaining long-term investment goals can be an effective way to plan for the future.
| 2 | The ratings indicated are from Standard & Poor’s, Moody’s Investors Service, and/or Fitch Ratings Ltd. Standard & Poor’s rates the creditworthiness of bonds from AAA (highest) to D (lowest). Ratings from A to CCC may be modified by the addition of a plus (+) or minus (-) sign to show relative standing within the rating categories. Moody’s rates the creditworthiness of bonds from Aaa (highest) to C (lowest). Ratings Aa to B may be modified by the addition of a number 1 (highest) to 3 (lowest) to show relative standing within the ratings categories. Fitch rates the creditworthiness of bonds from AAA (highest) to D (lowest). |
| | | | |
| 4 | | Wells Fargo Advantage Ultra Short-Term Income Fund | | Performance highlights (unaudited) |
Investment objective
The Fund seeks current income consistent with capital preservation.
Adviser
Wells Fargo Funds Management, LLC
Subadviser
Wells Capital Management Incorporated
Portfolio managers
Christopher Y. Kauffman, CFA
Jay N. Mueller, CFA
Thomas M. Price, CFA
Noah Wise, CFA
Average annual total returns1 (%) as of February 28, 2015
| | | | | | | | | | | | | | | | | | | | | | | | | | | | | | | | | | |
| | | | | Including sales charge | | | Excluding sales charge | | | Expense ratios2 (%) | |
| | | Inception date | | 1 year | | | 5 year | | | 10 year | | | 1 year | | | 5 year | | | 10 year | | | Gross | | | Net3 | |
| Class A (SADAX) | | 8-31-1999 | | | (1.85 | ) | | | 0.68 | | | | 1.69 | | | | 0.15 | | | | 1.09 | | | | 1.89 | | | | 0.78 | | | | 0.71 | |
| Class C (WUSTX) | | 7-18-2008 | | | (1.68 | ) | | | 0.35 | | | | 1.14 | | | | (0.68 | ) | | | 0.35 | | | | 1.14 | | | | 1.53 | | | | 1.46 | |
| Administrator Class (WUSDX) | | 4-8-2005 | | | – | | | | – | | | | – | | | | 0.30 | | | | 1.24 | | | | 2.02 | | | | 0.72 | | | | 0.56 | |
| Institutional Class (SADIX) | | 8-31-1999 | | | – | | | | – | | | | – | | | | 0.50 | | | | 1.46 | | | | 2.28 | | | | 0.45 | | | | 0.36 | |
| Investor Class (STADX) | | 11-25-1998 | | | – | | | | – | | | | – | | | | 0.01 | | | | 1.05 | | | | 1.86 | | | | 0.81 | | | | 0.74 | |
| Barclays Short-Term U.S. Government/Corporate Index4 | | – | | | – | | | | – | | | | – | | | | 0.21 | | | | 0.35 | | | | 1.98 | | | | – | | | | – | |
| Barclays 9-12 Month U.S. Short-Term Treasury Index5 | | – | | | – | | | | – | | | | – | | | | 0.21 | | | | 0.34 | | | | 1.98 | | | | – | | | | – | |
| Barclays 1-3 Year U.S. Government/Credit Bond Index6 | | – | | | – | | | | – | | | | – | | | | 0.80 | | | | 1.28 | | | | 2.91 | | | | – | | | | – | |
Figures quoted represent past performance, which is no guarantee of future results, and do not reflect taxes that a shareholder may pay on fund distributions or the redemption of fund shares. Investment return and principal value of an investment will fluctuate so that an investor’s shares, when redeemed, may be worth more or less than their original cost. Performance shown without sales charges would be lower if sales charges were reflected. Current performance may be lower or higher than the performance data quoted, which assumes the reinvestment of dividends and capital gains. Current month-end performance is available on the Fund’s website, wellsfargoadvantagefunds.com.
Index returns do not include transaction costs associated with buying and selling securities, any mutual fund fees or expenses, or any taxes. It is not possible to invest directly in an index.
For Class A shares, the maximum front-end sales charge is 2.00%. For Class C shares, the maximum contingent deferred sales charge is 1.00%. Performance including a contingent deferred sales charge assumes the sales charge for the corresponding time period. Administrator Class, Institutional Class, and Investor Class shares are sold without a front-end sales charge or contingent deferred sales charge.
Bond values fluctuate in response to the financial condition of individual issuers, general market and economic conditions, and changes in interest rates. Changes in market conditions and government policies may lead to periods of heightened volatility in the bond market and reduced liquidity for certain bonds held by the Fund. In general, when interest rates rise, bond values fall and investors may lose principal value. Interest-rate changes and their impact on the Fund and its share price can be sudden and unpredictable. Loans are subject to risks similar to those associated with other below-investment-grade bond investments, such as credit risk (for example, risk of issuer default), below-investment-grade bond risk (for example, risk of greater volatility in value), and risk that the loan may become illiquid or difficult to price. The use of derivatives may reduce returns and/or increase volatility. Certain investment strategies tend to increase the total risk of an investment (relative to the broader market). The Fund is exposed to foreign investment risk, high-yield securities risk, and mortgage- and asset-backed securities risk. Consult the Fund’s prospectus for additional information on these and other risks.
Please see footnotes on page 5.
| | | | | | |
| Performance highlights (unaudited) | | Wells Fargo Advantage Ultra Short-Term Income Fund | | | 5 | |
| | | | |
| Ten largest long-term holdings7 (%) as of February 28, 2015 | |
FNMA, 3.50%, 3-18-2030 | | | 1.08 | |
Chase Issuance Trust Series 2012-A5 Class A5, 0.59%, 8-15-2017 | | | 0.98 | |
Nissan Auto Lease Trust Series 2014-B Class A2A, 0.73%, 4-17-2017 | | | 0.90 | |
JPMorgan Chase Commercial Mortgage Securities Corporation Series 2014-INN Class A, 1.09%, 6-15-2029 | | | 0.89 | |
Ford Credit Auto Lease Trust Series 2014-B Class A2A, 0.51%, 3-15-2017 | | | 0.74 | |
Providence Health & Services Company, 1.06%, 10-1-2016 | | | 0.72 | |
Port Arthur TX Naval District Environmental Facilities Motiva Enterprises Project Series B, 0.09%, 12-1-2039 | | | 0.72 | |
Chase Issuance Trust Series 2012-A3 Class A3, 0.79%, 6-15-2017 | | | 0.71 | |
Bear Stearns Companies Incorporated, 5.55%, 1-22-2017 | | | 0.69 | |
Experian Finance plc, 2.38%, 6-15-2017 | | | 0.69 | |
|
| Portfolio allocation8 as of February 28, 2015 |
|
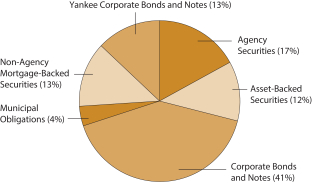 |
| 1 | Effective June 20, 2008, Advisor Class was renamed Class A and modified to assume the features and attributes of Class A. Historical performance shown for Class A shares through June 19, 2008, includes Advisor Class expenses. Historical performance shown for Class C shares prior to their inception reflects the performance of Investor Class shares, adjusted to reflect the higher expenses applicable to Class C shares. Historical performance shown for Administrator Class shares prior to their inception reflects the performance of Institutional Class shares, adjusted to reflect the higher expenses applicable to Administrator Class shares. |
| 2 | Reflects the expense ratios as stated in the most recent prospectuses, which include the impact of 0.01% in acquired fund fees and expenses. The expense ratios shown are subject to change and may differ from the annualized expense ratios shown in the financial highlights of this report, which do not include acquired fund fees and expenses. |
| 3 | The Adviser has committed through December 31, 2015, to waive fees and/or reimburse expenses to the extent necessary to cap the Fund’s Total Annual Fund Operating Expenses After Fee Waiver, excluding certain expenses, at 0.70% for Class A, 1.45% for Class C, 0.55% for Administrator Class, 0.35% for Institutional Class, and 0.73% for Investor Class. After this time, the cap may be increased or the commitment to maintain the cap may be terminated only with the approval of the Board of Trustees. Brokerage commissions, stamp duty fees, interest, taxes, acquired fund fees and expenses, and extraordinary expenses are excluded from the cap. Without this cap, the Fund’s returns would have been lower. |
| 4 | The Barclays Short-Term U.S. Government/Corporate Index contains securities that have fallen out of the Barclays U.S. Government/Credit Index because of the standard minimum one-year to maturity constraint. Securities in the Barclays Short-Term U.S. Government/Corporate Index must have a maturity from one up to (but not including) 12 months. You cannot invest directly in an index. |
| 5 | The Barclays 9-12 Month U.S. Short-Term Treasury Index is an unmnaged index that includes aged U.S. Treasury bills, notes and bonds with a remaining maturity from nine up to (but not including) 12 months. It excludes zero-coupon STRIPS. You cannot invest directly in an index. |
| 6 | The Barclays 1-3 Year U.S. Government/Credit Bond Index is the one- to three-year component of the Barclays U.S. Government/Credit Bond Index that includes securities in the Government and Credit Indexes. The Government Index includes Treasuries (that is, public obligations of the U.S. Treasury that have remaining maturities of more than one year) and agencies (that is, publicly issued debt of U.S. Government agencies, quasi-federal corporations, and corporate or foreign debt guaranteed by the U.S. Government). The Credit Index includes publicly issued U.S. corporate and foreign debentures and secured notes that meet specified maturity, liquidity, and quality requirements. You cannot invest directly in an index. |
| 7 | The ten largest long-term holdings are calculated based on the value of the securities divided by total net assets of the Fund. Holdings are subject to change and may have changed since the date specified. |
| 8 | Amounts are calculated based on the total long-term investments of the Fund. These percentages are subject to change and may have changed since the date specified. |
| | | | |
| 6 | | Wells Fargo Advantage Ultra Short-Term Income Fund | | Fund expenses (unaudited) |
As a shareholder of the Fund, you incur two types of costs: (1) transaction costs, including sales charges (loads) on purchase payments and contingent deferred sales charges (if any) on redemptions and (2) ongoing costs, including management fees, distribution (12b-1) and/or shareholder service fees, and other Fund expenses. This example is intended to help you understand your ongoing costs (in dollars) of investing in the Fund and to compare these costs with the ongoing costs of investing in other mutual funds.
The example is based on an investment of $1,000 invested at the beginning of the six-month period and held for the entire period from September 1, 2014 to February 28, 2015.
Actual expenses
The “Actual” line of the table below provides information about actual account values and actual expenses. You may use the information in this line, together with the amount you invested, to estimate the expenses that you paid over the period. Simply divide your account value by $1,000 (for example, an $8,600 account value divided by $1,000 = 8.6), then multiply the result by the number in the “Actual” line under the heading entitled “Expenses paid during period” for your applicable class of shares to estimate the expenses you paid on your account during this period.
Hypothetical example for comparison purposes
The “Hypothetical” line of the table below provides information about hypothetical account values and hypothetical expenses based on the Fund’s actual expense ratio and an assumed rate of return of 5% per year before expenses, which is not the Fund’s actual return. The hypothetical account values and expenses may not be used to estimate the actual ending account balance or expenses you paid for the period. You may use this information to compare the ongoing costs of investing in the Fund and other funds. To do so, compare this 5% hypothetical example with the 5% hypothetical examples that appear in the shareholder reports of the other funds.
Please note that the expenses shown in the table are meant to highlight your ongoing costs only and do not reflect any transactional costs, such as sales charges (loads) and contingent deferred sales charges. Therefore, the “Hypothetical” line of the table is useful in comparing ongoing costs only and will not help you determine the relative total costs of owning different funds. In addition, if these transactional costs were included, your costs would have been higher.
| | | | | | | | | | | | | | | | |
| | | Beginning
account value
9-1-2014 | | | Ending
account value
2-28-2015 | | | Expenses
paid during
the period¹ | | | Net annualized
expense ratio | |
Class A | | | | | | | | | | | | | | | | |
Actual | | $ | 1,000.00 | | | $ | 999.02 | | | $ | 3.47 | | | | 0.70 | % |
Hypothetical (5% return before expenses) | | $ | 1,000.00 | | | $ | 1,021.32 | | | $ | 3.51 | | | | 0.70 | % |
Class C | | | | | | | | | | | | | | | | |
Actual | | $ | 1,000.00 | | | $ | 995.35 | | | $ | 7.17 | | | | 1.45 | % |
Hypothetical (5% return before expenses) | | $ | 1,000.00 | | | $ | 1,017.60 | | | $ | 7.25 | | | | 1.45 | % |
Administrator Class | | | | | | | | | | | | | | | | |
Actual | | $ | 1,000.00 | | | $ | 999.76 | | | $ | 2.73 | | | | 0.55 | % |
Hypothetical (5% return before expenses) | | $ | 1,000.00 | | | $ | 1,022.07 | | | $ | 2.76 | | | | 0.55 | % |
Institutional Class | | | | | | | | | | | | | | | | |
Actual | | $ | 1,000.00 | | | $ | 1,000.77 | | | $ | 1.74 | | | | 0.35 | % |
Hypothetical (5% return before expenses) | | $ | 1,000.00 | | | $ | 1,023.06 | | | $ | 1.76 | | | | 0.35 | % |
Investor Class | | | | | | | | | | | | | | | | |
Actual | | $ | 1,000.00 | | | $ | 998.89 | | | $ | 3.62 | | | | 0.73 | % |
Hypothetical (5% return before expenses) | | $ | 1,000.00 | | | $ | 1,021.17 | | | $ | 3.66 | | | | 0.73 | % |
| 1 | Expenses paid is equal to the annualized expense ratio of each class multiplied by the average account value over the period, multiplied by the number of days in the most recent fiscal half-year divided by the number of days in the fiscal year (to reflect the one-half-year period). |
| | | | | | |
| Portfolio of investments—February 28, 2015 (unaudited) | | Wells Fargo Advantage Ultra Short-Term Income Fund | | | 7 | |
| | | | | | | | | | | | | | | | |
| Security name | | Interest rate | | | Maturity date | | | Principal | | | Value | |
| | | | |
Agency Securities: 15.95% | | | | | | | | | | | | | | | | |
FDIC Series 2013-R1 Class A 144A | | | 1.15 | % | | | 3-25-2033 | | | $ | 3,689,127 | | | $ | 3,663,820 | |
FHLMC ± | | | 2.36 | | | | 3-1-2035 | | | | 1,590,023 | | | | 1,700,031 | |
FHLMC ± | | | 2.37 | | | | 11-1-2035 | | | | 6,566,412 | | | | 7,017,784 | |
FHLMC ± | | | 2.38 | | | | 4-1-2032 | | | | 141,625 | | | | 150,231 | |
FHLMC ± | | | 2.38 | | | | 6-1-2032 | | | | 6,580 | | | | 6,981 | |
FHLMC ± | | | 2.44 | | | | 10-1-2031 | | | | 77,462 | | | | 78,073 | |
FHLMC ± | | | 2.46 | | | | 1-1-2029 | | | | 76,797 | | | | 77,587 | |
FHLMC ± | | | 2.53 | | | | 7-1-2029 | | | | 4,998 | | | | 5,216 | |
FHLMC | | | 4.50 | | | | 2-1-2020 | | | | 2,050,769 | | | | 2,178,795 | |
FHLMC | | | 4.50 | | | | 8-1-2020 | | | | 1,156,052 | | | | 1,231,840 | |
FHLMC | | | 4.50 | | | | 1-1-2022 | | | | 959,742 | | | | 1,022,606 | |
FHLMC | | | 5.00 | | | | 12-1-2019 | | | | 2,320,046 | | | | 2,476,077 | |
FHLMC | | | 5.50 | | | | 8-1-2018 | | | | 600,287 | | | | 630,936 | |
FHLMC | | | 6.00 | | | | 4-1-2016 | | | | 72,475 | | | | 74,118 | |
FHLMC | | | 6.00 | | | | 5-1-2017 | | | | 334,071 | | | | 346,540 | |
FHLMC | | | 6.00 | | | | 1-1-2024 | | | | 2,131,719 | | | | 2,338,466 | |
FHLMC | | | 7.00 | | | | 6-1-2031 | | | | 420,940 | | | | 489,811 | |
FHLMC | | | 9.00 | | | | 11-1-2016 | | | | 52,565 | | | | 54,968 | |
FHLMC | | | 9.00 | | | | 12-1-2016 | | | | 188,410 | | | | 195,567 | |
FHLMC | | | 9.00 | | | | 8-1-2018 | | | | 61,325 | | | | 64,679 | |
FHLMC | | | 9.00 | | | | 10-1-2019 | | | | 46,059 | | | | 50,345 | |
FHLMC | | | 9.50 | | | | 12-1-2016 | | | | 23,398 | | | | 23,709 | |
FHLMC | | | 9.50 | | | | 5-1-2020 | | | | 9,290 | | | | 9,405 | |
FHLMC | | | 9.50 | | | | 9-1-2020 | | | | 107,155 | | | | 118,331 | |
FHLMC | | | 9.50 | | | | 12-1-2022 | | | | 203,918 | | | | 221,764 | |
FHLMC | | | 10.00 | | | | 11-17-2021 | | | | 35,137 | | | | 36,073 | |
FHLMC | | | 10.50 | | | | 5-1-2020 | | | | 114,357 | | | | 128,409 | |
FHLMC Series 2530 Class BH | | | 5.00 | | | | 11-15-2017 | | | | 1,438,475 | | | | 1,498,863 | |
FHLMC Series 2617 Class GR | | | 4.50 | | | | 5-15-2018 | | | | 461,093 | | | | 479,913 | |
FHLMC Series 2684 Class PE | | | 5.00 | | | | 1-15-2033 | | | | 59,784 | | | | 61,274 | |
FHLMC Series 2690 Class TG | | | 4.50 | | | | 4-15-2032 | | | | 365,527 | | | | 376,378 | |
FHLMC Series 2704 Class BH | | | 4.50 | | | | 11-15-2023 | | | | 1,257,037 | | | | 1,359,829 | |
FHLMC Series 2707 Class QE | | | 4.50 | | | | 11-15-2018 | | | | 912,604 | | | | 959,156 | |
FHLMC Series 2727 Class PE | | | 4.50 | | | | 7-15-2032 | | | | 602,012 | | | | 615,827 | |
FHLMC Series 2843 Class BC | | | 5.00 | | | | 8-15-2019 | | | | 1,124,681 | | | | 1,185,616 | |
FHLMC Series 2849 Class B | | | 5.00 | | | | 8-15-2019 | | | | 2,046,283 | | | | 2,163,605 | |
FHLMC Series 2855 Class WN | | | 4.00 | | | | 9-15-2019 | | | | 458,628 | | | | 484,338 | |
FHLMC Series 2864 Class NB | | | 5.50 | | | | 7-15-2033 | | | | 1,906,454 | | | | 2,021,705 | |
FHLMC Series 2881 Class AE | | | 5.00 | | | | 8-15-2034 | | | | 938,265 | | | | 996,415 | |
FHLMC Series 2896 Class CB | | | 4.50 | | | | 11-15-2019 | | | | 1,664,987 | | | | 1,746,809 | |
FHLMC Series 2907 Class HE | | | 5.00 | | | | 5-15-2033 | | | | 2,755,994 | | | | 2,802,246 | |
FHLMC Series 2937 Class HJ | | | 5.00 | | | | 10-15-2019 | | | | 70,349 | | | | 70,557 | |
FHLMC Series 2953 Class LD | | | 5.00 | | | | 12-15-2034 | | | | 591,579 | | | | 625,143 | |
FHLMC Series 2963 Class BP | | | 5.00 | | | | 9-15-2034 | | | | 307,643 | | | | 315,189 | |
FHLMC Series 3053 Class AC | | | 5.00 | | | | 2-15-2035 | | | | 318,594 | | | | 319,876 | |
FHLMC Series 3166 Class AC | | | 5.00 | | | | 6-15-2021 | | | | 10,585,600 | | | | 11,469,053 | |
FHLMC Series 3420 Class A | | | 4.50 | | | | 1-15-2027 | | | | 104,681 | | | | 105,056 | |
FHLMC Series 3501 Class AC | | | 4.00 | | | | 8-15-2023 | | | | 1,201,197 | | | | 1,235,845 | |
FHLMC Series 3538 Class DE | | | 3.50 | | | | 7-15-2023 | | | | 1,002,485 | | | | 1,021,716 | |
FHLMC Series 3574 Class EA | | | 3.00 | | | | 9-15-2021 | | | | 443,067 | | | | 454,044 | |
The accompanying notes are an integral part of these financial statements.
| | | | |
| 8 | | Wells Fargo Advantage Ultra Short-Term Income Fund | | Portfolio of investments—February 28, 2015 (unaudited) |
| | | | | | | | | | | | | | | | |
| Security name | | Interest rate | | | Maturity date | | | Principal | | | Value | |
|
Agency Securities (continued) | |
FHLMC Series 3589 Class CA | | | 4.00 | % | | | 10-15-2021 | | | $ | 719,465 | | | $ | 736,596 | |
FHLMC Series 3619 Class EB | | | 3.50 | | | | 5-15-2024 | | | | 223,481 | | | | 230,653 | |
FHLMC Series 3647 Class BG | | | 4.00 | | | | 12-15-2027 | | | | 30,834 | | | | 30,838 | |
FHLMC Series 3649 Class DG | | | 4.00 | | | | 4-15-2028 | | | | 3,943,376 | | | | 4,034,871 | |
FHLMC Series 3656 Class EC | | | 3.50 | | | | 5-15-2024 | | | | 590,932 | | | | 600,577 | |
FHLMC Series 3660 Class HE | | | 3.50 | | | | 10-15-2023 | | | | 262,322 | | | | 265,032 | |
FHLMC Series 3689 Class BD | | | 2.00 | | | | 7-15-2020 | | | | 484,435 | | | | 485,691 | |
FHLMC Series 3706 Class AB | | | 3.50 | | | | 7-15-2020 | | | | 1,738,806 | | | | 1,780,473 | |
FHLMC Series 3728 Class EA | | | 3.50 | | | | 9-15-2020 | | | | 1,808,810 | | | | 1,838,641 | |
FHLMC Series 3728 Class EH | | | 3.00 | | | | 9-15-2020 | | | | 1,353,224 | | | | 1,373,160 | |
FHLMC Series 3772 Class HC | | | 3.00 | | | | 10-15-2018 | | | | 1,224,735 | | | | 1,258,454 | |
FHLMC Series 3780 Class DG | | | 3.00 | | | | 10-15-2027 | | | | 1,074,684 | | | | 1,091,273 | |
FHLMC Series 3780 Class GX | | | 3.50 | | | | 9-15-2028 | | | | 5,336,530 | | | | 5,541,303 | |
FHLMC Series 3784 Class DA | | | 4.00 | | | | 7-15-2025 | | | | 443,428 | | | | 459,692 | |
FHLMC Series 3821 Class LA | | | 3.50 | | | | 4-15-2025 | | | | 845,377 | | | | 877,602 | |
FHLMC Series 3834 Class EA | | | 3.50 | | | | 6-15-2029 | | | | 944,554 | | | | 986,467 | |
FHLMC Series 3842 Class CJ | | | 2.00 | | | | 9-15-2018 | | | | 398,785 | | | | 403,320 | |
FHLMC Series 3878 Class JA | | | 3.50 | | | | 1-15-2025 | | | | 661,062 | | | | 680,199 | |
FHLMC Series 3888 Class JP | | | 4.00 | | | | 2-15-2037 | | | | 336,878 | | | | 344,095 | |
FHLMC Series 3898 Class NE | | | 4.00 | | | | 7-15-2040 | | | | 1,172,330 | | | | 1,214,712 | |
FHLMC Series 3952 Class MK | | | 3.00 | | | | 11-15-2021 | | | | 967,864 | | | | 974,560 | |
FHLMC Series K003 Class A3 | | | 4.32 | | | | 12-25-2015 | | | | 1,584,945 | | | | 1,616,659 | |
FHLMC Series K003 Class AAB | | | 4.77 | | | | 5-25-2018 | | | | 1,077,719 | | | | 1,138,507 | |
FHLMC Series K702 Class A1 | | | 2.08 | | | | 12-25-2017 | | | | 4,763,762 | | | | 4,846,513 | |
FHLMC Series T-42 Class A6 | | | 9.50 | | | | 2-25-2042 | | | | 968,636 | | | | 1,198,795 | |
FHLMC Series Y2-2015 Class 1 | | | 2.60 | | | | 4-20-2015 | | | | 260,590 | | | | 261,368 | |
FNMA ± | | | 1.77 | | | | 10-1-2031 | | | | 148,918 | | | | 153,402 | |
FNMA | | | 1.89 | | | | 2-1-2017 | | | | 2,000,000 | | | | 2,032,433 | |
FNMA ± | | | 1.98 | | | | 1-1-2023 | | | | 19,447 | | | | 19,519 | |
FNMA ± | | | 2.14 | | | | 12-1-2034 | | | | 1,579,851 | | | | 1,690,509 | |
FNMA ± | | | 2.25 | | | | 5-1-2032 | | | | 44,783 | | | | 47,715 | |
FNMA ± | | | 2.31 | | | | 11-1-2031 | | | | 98,018 | | | | 102,998 | |
FNMA ± | | | 2.32 | | | | 4-1-2038 | | | | 4,461,913 | | | | 4,746,242 | |
FNMA ± | | | 2.34 | | | | 6-1-2032 | | | | 144,796 | | | | 152,877 | |
FNMA ± | | | 2.38 | | | | 12-1-2040 | | | | 454,382 | | | | 482,388 | |
FNMA ± | | | 2.39 | | | | 2-1-2033 | | | | 695,077 | | | | 737,062 | |
FNMA ± | | | 2.40 | | | | 8-1-2045 | | | | 1,455,950 | | | | 1,554,486 | |
FNMA ± | | | 2.42 | | | | 5-1-2036 | | | | 1,627,879 | | | | 1,741,728 | |
FNMA ± | | | 2.49 | | | | 11-1-2034 | | | | 2,467,088 | | | | 2,637,756 | |
FNMA ± | | | 2.50 | | | | 5-1-2036 | | | | 1,740,168 | | | | 1,847,702 | |
FNMA | | | 2.71 | | | | 9-1-2017 | | | | 3,591,002 | | | | 3,709,168 | |
FNMA | | | 3.00 | | | | 1-1-2021 | | | | 911,851 | | | | 956,062 | |
FNMA | | | 3.09 | | | | 5-1-2016 | | | | 1,136,178 | | | | 1,157,469 | |
FNMA | | | 3.18 | | | | 12-1-2017 | | | | 4,364,173 | | | | 4,476,896 | |
FNMA | | | 3.21 | | | | 2-1-2016 | | | | 467,228 | | | | 475,096 | |
FNMA ± | | | 3.36 | | | | 4-1-2033 | | | | 5,378 | | | | 5,601 | |
FNMA ± | | | 3.45 | | | | 7-1-2033 | | | | 64,649 | | | | 65,647 | |
FNMA | | | 3.50 | | | | 9-1-2018 | | | | 836,466 | | | | 887,622 | |
FNMA %% | | | 3.50 | | | | 3-18-2030 | | | | 17,000,000 | | | | 18,025,763 | |
FNMA | | | 3.77 | | | | 1-1-2018 | | | | 1,178,664 | | | | 1,185,286 | |
The accompanying notes are an integral part of these financial statements.
| | | | | | |
| Portfolio of investments—February 28, 2015 (unaudited) | | Wells Fargo Advantage Ultra Short-Term Income Fund | | | 9 | |
| | | | | | | | | | | | | | | | |
| Security name | | Interest rate | | | Maturity date | | | Principal | | | Value | |
|
Agency Securities (continued) | |
FNMA | | | 4.00 | % | | | 5-25-2019 | | | $ | 163,302 | | | $ | 172,647 | |
FNMA | | | 4.00 | | | | 12-15-2024 | | | | 945,729 | | | | 987,712 | |
FNMA | | | 4.22 | | | | 5-1-2016 | | | | 2,244,200 | | | | 2,307,941 | |
FNMA | | | 4.29 | | | | 5-1-2016 | | | | 770,404 | | | | 793,016 | |
FNMA | | | 4.44 | | | | 9-1-2015 | | | | 3,923,525 | | | | 4,005,801 | |
FNMA | | | 4.50 | | | | 9-25-2018 | | | | 1,015,656 | | | | 1,064,935 | |
FNMA | | | 4.50 | | | | 6-1-2019 | | | | 254,394 | | | | 268,298 | |
FNMA | | | 5.00 | | | | 1-15-2022 | | | | 3,668,642 | | | | 3,882,421 | |
FNMA | | | 5.09 | | | | 12-1-2016 | | | | 971,405 | | | | 1,029,648 | |
FNMA | | | 5.14 | | | | 2-1-2016 | | | | 5,997,606 | | | | 6,084,219 | |
FNMA | | | 5.23 | | | | 7-1-2018 | | | | 1,713,837 | | | | 1,784,362 | |
FNMA | | | 5.24 | | | | 1-1-2018 | | | | 2,150,308 | | | | 2,240,510 | |
FNMA | | | 5.27 | | | | 12-1-2016 | | | | 943,776 | | | | 1,002,317 | |
FNMA | | | 5.40 | | | | 12-1-2016 | | | | 970,493 | | | | 1,031,934 | |
FNMA | | | 5.52 | | | | 5-1-2017 | | | | 1,428,461 | | | | 1,544,734 | |
FNMA | | | 5.85 | | | | 5-1-2016 | | | | 4,000,000 | | | | 4,199,815 | |
FNMA | | | 6.00 | | | | 4-1-2021 | | | | 1,440,955 | | | | 1,520,743 | |
FNMA | | | 6.50 | | | | 8-1-2031 | | | | 778,859 | | | | 926,850 | |
FNMA | | | 6.74 | | | | 12-1-2015 | | | | 1,211,158 | | | | 1,252,988 | |
FNMA | | | 7.84 | | | | 4-1-2018 | | | | 4,655,756 | | | | 4,976,754 | |
FNMA | | | 8.33 | | | | 7-15-2020 | | | | 37,091 | | | | 40,835 | |
FNMA | | | 8.50 | | | | 7-1-2017 | | | | 160,072 | | | | 168,103 | |
FNMA | | | 9.00 | | | | 12-1-2016 | | | | 141,582 | | | | 147,931 | |
FNMA | | | 9.00 | | | | 2-15-2020 | | | | 131,429 | | | | 150,788 | |
FNMA | | | 9.00 | | | | 10-15-2021 | | | | 69,871 | | | | 78,649 | |
FNMA | | | 9.00 | | | | 6-1-2024 | | | | 96,862 | | | | 106,385 | |
FNMA | | | 9.50 | | | | 12-1-2020 | | | | 92,212 | | | | 101,798 | |
FNMA | | | 9.50 | | | | 3-1-2021 | | | | 20,611 | | | | 21,162 | |
FNMA | | | 10.00 | | | | 3-20-2018 | | | | 29,589 | | | | 30,440 | |
FNMA | | | 10.25 | | | | 9-1-2021 | | | | 105,090 | | | | 117,481 | |
FNMA | | | 10.50 | | | | 8-1-2020 | | | | 4,777 | | | | 5,309 | |
FNMA | | | 10.50 | | | | 4-1-2022 | | | | 72,428 | | | | 77,021 | |
FNMA Series 1988-4 Class Z | | | 9.25 | | | | 3-25-2018 | | | | 37,722 | | | | 40,346 | |
FNMA Series 1988-9 Class Z | | | 9.45 | | | | 4-25-2018 | | | | 23,535 | | | | 25,104 | |
FNMA Series 1989-30 Class Z | | | 9.50 | | | | 6-25-2019 | | | | 108,416 | | | | 119,022 | |
FNMA Series 1989-49 Class E | | | 9.30 | | | | 8-25-2019 | | | | 14,072 | | | | 15,107 | |
FNMA Series 1990-111 Class Z | | | 8.75 | | | | 9-25-2020 | | | | 25,768 | | | | 27,611 | |
FNMA Series 1990-119 Class J | | | 9.00 | | | | 10-25-2020 | | | | 67,042 | | | | 75,348 | |
FNMA Series 1990-124 Class Z | | | 9.00 | | | | 10-25-2020 | | | | 30,025 | | | | 33,792 | |
FNMA Series 1990-21 Class Z | | | 9.00 | | | | 3-25-2020 | | | | 129,201 | | | | 145,034 | |
FNMA Series 1990-27 Class Z | | | 9.00 | | | | 3-25-2020 | | | | 90,326 | | | | 101,431 | |
FNMA Series 1990-30 Class D | | | 9.75 | | | | 3-25-2020 | | | | 26,048 | | | | 29,282 | |
FNMA Series 1990-77 Class D | | | 9.00 | | | | 6-25-2020 | | | | 38,852 | | | | 43,877 | |
FNMA Series 1991-132 Class Z | | | 8.00 | | | | 10-25-2021 | | | | 160,243 | | | | 182,220 | |
FNMA Series 1992-71 Class X | | | 8.25 | | | | 5-25-2022 | | | | 66,448 | | | | 77,035 | |
FNMA Series 2000-T6 Class A2 | | | 9.50 | | | | 6-25-2030 | | | | 569,938 | | | | 646,414 | |
FNMA Series 2001-T10 Class A3 | | | 9.50 | | | | 12-25-2041 | | | | 1,187,680 | | | | 1,371,346 | |
FNMA Series 2001-T12 Class A3 | | | 9.50 | | | | 8-25-2041 | | | | 995,012 | | | | 1,161,959 | |
FNMA Series 2001-T8 Class A3 ± | | | 3.63 | | | | 7-25-2041 | | | | 2,311,011 | | | | 2,372,421 | |
FNMA Series 2002-94 Class BK | | | 5.50 | | | | 1-25-2018 | | | | 1,124,715 | | | | 1,165,623 | |
The accompanying notes are an integral part of these financial statements.
| | | | |
| 10 | | Wells Fargo Advantage Ultra Short-Term Income Fund | | Portfolio of investments—February 28, 2015 (unaudited) |
| | | | | | | | | | | | | | | | |
| Security name | | Interest rate | | | Maturity date | | | Principal | | | Value | |
|
Agency Securities (continued) | |
FNMA Series 2002-T1 Class A4 | | | 9.50 | % | | | 11-25-2031 | | | $ | 1,286,076 | | | $ | 1,570,562 | |
FNMA Series 2002-W4 Class A6 ± | | | 3.36 | | | | 5-25-2042 | | | | 1,187,565 | | | | 1,244,422 | |
FNMA Series 2003-125 Class AY | | | 4.00 | | | | 12-25-2018 | | | | 2,218,752 | | | | 2,345,743 | |
FNMA Series 2003-129 Class AP | | | 4.00 | | | | 1-25-2019 | | | | 569,672 | | | | 582,641 | |
FNMA Series 2003-15 Class CN | | | 5.00 | | | | 3-25-2018 | | | | 393,593 | | | | 411,766 | |
FNMA Series 2003-35 Class BC | | | 5.00 | | | | 5-25-2018 | | | | 773,842 | | | | 817,057 | |
FNMA Series 2003-35 Class ME | | | 5.00 | | | | 5-25-2018 | | | | 396,421 | | | | 415,425 | |
FNMA Series 2003-W11 Class A1 ± | | | 3.46 | | | | 6-25-2033 | | | | 44,094 | | | | 46,234 | |
FNMA Series 2003-W3 Class 1A4 ± | | | 3.40 | | | | 8-25-2042 | | | | 53,897 | | | | 60,145 | |
FNMA Series 2004-10 Class FA ± | | | 0.52 | | | | 2-25-2034 | | | | 1,831,412 | | | | 1,835,968 | |
FNMA Series 2004-92 Class QY | | | 4.50 | | | | 8-25-2034 | | | | 873,182 | | | | 912,309 | |
FNMA Series 2004-W6 Class 1A4 | | | 5.50 | | | | 7-25-2034 | | | | 926,281 | | | | 929,852 | |
FNMA Series 2006-74 Class DP | | | 5.50 | | | | 3-25-2035 | | | | 262,202 | | | | 265,350 | |
FNMA Series 2006-M3 Class B | | | 5.10 | | | | 8-25-2016 | | | | 1,289,437 | | | | 1,359,547 | |
FNMA Series 2007-2 Class FA ± | | | 0.37 | | | | 2-25-2037 | | | | 81,806 | | | | 81,839 | |
FNMA Series 2007-36 Class AB | | | 5.00 | | | | 11-25-2021 | | | | 1,064,711 | | | | 1,094,863 | |
FNMA Series 2007-W2 Class 1A1 ± | | | 0.49 | | | | 3-25-2037 | | | | 1,231,862 | | | | 1,232,930 | |
FNMA Series 2008-36 Class AB | | | 4.50 | | | | 10-25-2022 | | | | 535,519 | | | | 543,797 | |
FNMA Series 2008-76 Class GF ± | | | 0.82 | | | | 9-25-2023 | | | | 941,677 | | | | 948,093 | |
FNMA Series 2008-81 Class LK | | | 5.00 | | | | 9-25-2023 | | | | 521,000 | | | | 548,753 | |
FNMA Series 2009-76 Class HA | | | 4.00 | | | | 1-25-2019 | | | | 511,660 | | | | 525,399 | |
FNMA Series 2010-153 Class AB | | | 2.00 | | | | 11-25-2018 | | | | 1,369,761 | | | | 1,389,450 | |
FNMA Series 2010-153 Class BG | | | 2.50 | | | | 11-25-2018 | | | | 1,058,208 | | | | 1,077,625 | |
FNMA Series 2010-25 Class ND | | | 3.50 | | | | 3-25-2025 | | | | 562,049 | | | | 582,746 | |
FNMA Series 2010-39 Class PD | | | 3.00 | | | | 6-25-2038 | | | | 556,291 | | | | 566,376 | |
FNMA Series 2010-39 Class VY | | | 4.50 | | | | 3-25-2025 | | | | 2,570,000 | | | | 2,666,367 | |
FNMA Series 2010-57 Class DQ | | | 3.00 | | | | 6-25-2025 | | | | 901,825 | | | | 929,532 | |
FNMA Series 2010-70 Class CT | | | 4.00 | | | | 11-25-2027 | | | | 339,620 | | | | 342,523 | |
FNMA Series 2010-9 Class MB | | | 5.00 | | | | 5-25-2032 | | | | 1,000,000 | | | | 1,037,958 | |
FNMA Series 2010-9 Class PD | | | 4.50 | | | | 10-25-2039 | | | | 64,457 | | | | 64,543 | |
FNMA Series 2011-111 Class MA | | | 4.00 | | | | 7-25-2038 | | | | 1,286,484 | | | | 1,303,666 | |
FNMA Series 2011-115 Class DP | | | 3.50 | | | | 4-25-2034 | | | | 578,370 | | | | 587,282 | |
FNMA Series 2011-122 Class A | | | 3.00 | | | | 12-25-2025 | | | | 624,881 | | | | 646,801 | |
FNMA Series 2011-129 Class LG | | | 3.00 | | | | 3-25-2037 | | | | 1,030,814 | | | | 1,059,668 | |
FNMA Series 2011-33 Class GA | | | 3.50 | | | | 10-25-2028 | | | | 1,686,687 | | | | 1,737,085 | |
FNMA Series 2011-35 Class PA | | | 4.00 | | | | 2-25-2039 | | | | 1,680,733 | | | | 1,733,588 | |
FNMA Series 2011-39 Class DA | | | 3.50 | | | | 7-25-2024 | | | | 719,179 | | | | 734,587 | |
FNMA Series 2011-40 Class CA | | | 3.50 | | | | 12-25-2028 | | | | 4,710,982 | | | | 4,860,843 | |
FNMA Series 2011-42 Class A | | | 3.00 | | | | 2-25-2024 | | | | 6,564,551 | �� | | | 6,785,100 | |
FNMA Series 2011-56 Class AC | | | 2.00 | | | | 7-25-2018 | | | | 381,294 | | | | 386,506 | |
FNMA Series 2011-61 Class VA | | | 5.00 | | | | 4-25-2040 | | | | 1,754,648 | | | | 1,807,804 | |
FNMA Series 2011-99 Class AB | | | 4.00 | | | | 12-25-2038 | | | | 410,112 | | | | 417,805 | |
FNMA Series 2012-94 Class E | | | 3.00 | | | | 6-25-2022 | | | | 199,385 | | | | 206,419 | |
FNMA Series 2013-M12 Class A | | | 1.53 | | | | 10-25-2017 | | | | 2,114,544 | | | | 2,129,720 | |
FNMA Series 2013-M5 Class ASQ2 | | | 0.59 | | | | 8-25-2015 | | | | 3,452,262 | | | | 3,452,196 | |
FNMA Series 2014-M3 Class ASQ2 | | | 0.56 | | | | 3-25-2016 | | | | 6,413,733 | | | | 6,413,258 | |
FNMA Series G-22 Class ZT | | | 8.00 | | | | 12-25-2016 | | | | 157,464 | | | | 164,032 | |
GNMA | | | 7.00 | | | | 6-15-2033 | | | | 624,374 | | | | 763,192 | |
GNMA | | | 9.00 | | | | 11-15-2017 | | | | 44,924 | | | | 47,396 | |
GNMA | | | 9.50 | | | | 11-15-2017 | | | | 12,208 | | | | 12,438 | |
GNMA | | | 10.00 | | | | 10-20-2017 | | | | 37,178 | | | | 37,868 | |
The accompanying notes are an integral part of these financial statements.
| | | | | | |
| Portfolio of investments—February 28, 2015 (unaudited) | | Wells Fargo Advantage Ultra Short-Term Income Fund | | | 11 | |
| | | | | | | | | | | | | | | | |
| Security name | | Interest rate | | | Maturity date | | | Principal | | | Value | |
|
Agency Securities (continued) | |
GNMA Series 2004-11 Class QE | | | 5.00 | % | | | 12-16-2032 | | | $ | 1,147,245 | | | $ | 1,179,066 | |
GNMA Series 2008-36 Class GA | | | 4.25 | | | | 10-16-2022 | | | | 2,986,448 | | | | 3,070,140 | |
GNMA Series 2009-122 Class AC | | | 4.00 | | | | 3-16-2023 | | | | 848,108 | | | | 879,389 | |
GNMA Series 2009-35 Class PA | | | 5.00 | | | | 11-16-2032 | | | | 501,871 | | | | 513,074 | |
GNMA Series 2009-74 Class BP | | | 3.50 | | | | 1-20-2037 | | | | 498,679 | | | | 506,744 | |
GNMA Series 2009-93 Class UW | | | 5.00 | | | | 10-20-2020 | | | | 1,742,362 | | | | 1,796,661 | |
GNMA Series 2010-10 Class KC | | | 3.00 | | | | 8-20-2035 | | | | 394,904 | | | | 396,654 | |
GNMA Series 2010-133 Class QK | | | 3.50 | | | | 9-16-2034 | | | | 948,813 | | | | 965,793 | |
GNMA Series 2010-145 Class UA | | | 1.25 | | | | 1-20-2036 | | | | 150,596 | | | | 150,850 | |
GNMA Series 2010-167 Class KW | | | 5.00 | | | | 9-20-2036 | | | | 408,036 | | | | 413,665 | |
GNMA Series 2010-27 Class AK | | | 4.00 | | | | 2-16-2023 | | | | 1,808,449 | | | | 1,867,032 | |
GNMA Series 2010-29 Class PL | | | 3.00 | | | | 8-20-2036 | | | | 457,188 | | | | 459,899 | |
GNMA Series 2010-32 Class PL | | | 3.25 | | | | 3-20-2036 | | | | 411,754 | | | | 414,138 | |
GNMA Series 2010-43 Class JA | | | 3.00 | | | | 9-20-2037 | | | | 785,086 | | | | 802,166 | |
GNMA Series 2010-69 Class DQ | | | 2.75 | | | | 4-20-2040 | | | | 258,197 | | | | 262,627 | |
GNMA Series 2010-7 Class CK | | | 3.50 | | | | 1-16-2034 | | | | 537,632 | | | | 543,474 | |
GNMA Series 2010-87 Class ME | | | 2.00 | | | | 3-20-2036 | | | | 1,284,657 | | | | 1,292,071 | |
GNMA Series 2011-29 Class AG | | | 3.00 | | | | 8-16-2037 | | | | 313,867 | | | | 319,021 | |
| | | | |
Total Agency Securities (Cost $265,874,833) | | | | | | | | | | | | | | | 267,228,145 | |
| | | | | | | | | | | | | | | | |
| | | | |
Asset-Backed Securities: 11.66% | | | | | | | | | | | | | | | | |
Chase Issuance Trust Series 2012-A3 Class A3 | | | 0.79 | | | | 6-15-2017 | | | | 11,850,000 | | | | 11,863,367 | |
Chase Issuance Trust Series 2012-A5 Class A5 | | | 0.59 | | | | 8-15-2017 | | | | 16,444,000 | | | | 16,451,630 | |
Citibank Credit Card Issuance Trust Series 2005-A5 Class A5 | | | 4.55 | | | | 6-20-2017 | | | | 3,180,000 | | | | 3,220,860 | |
Citibank Credit Card Issuance Trust Series 2012-A1 Class A1 | | | 0.55 | | | | 10-10-2017 | | | | 10,000,000 | | | | 9,999,800 | |
CNH Equipment Trust Series 2013-C Class A2 | | | 0.63 | | | | 1-17-2017 | | | | 2,329,881 | | | | 2,330,405 | |
Countrywide Asset-Backed Certificates Series 2004-AB2 Class A3 ± | | | 0.99 | | | | 5-25-2036 | | | | 420,639 | | | | 419,413 | |
Dell Equipment Finance Trust Series 2014-1 Class A2 144A | | | 0.64 | | | | 7-22-2016 | | | | 4,000,000 | | | | 4,000,880 | |
FedEx Corporation 1998 Pass-Through Certificates | | | 7.02 | | | | 1-15-2016 | | | | 1,700,823 | | | | 1,790,116 | |
Ford Credit Auto Lease Trust Series 2014-A Class A2A | | | 0.50 | | | | 10-15-2016 | | | | 5,291,733 | | | | 5,289,389 | |
Ford Credit Auto Lease Trust Series 2014-B Class A2A | | | 0.51 | | | | 3-15-2017 | | | | 12,450,000 | | | | 12,435,695 | |
Ford Credit Auto Owner Trust Series 2014-A Class A2 | | | 0.48 | | | | 11-15-2016 | | | | 4,775,109 | | | | 4,774,980 | |
GE Equipment LLC Series 2013-1 Class A2 | | | 0.64 | | | | 3-22-2016 | | | | 763,589 | | | | 763,673 | |
GE Equipment LLC Series 2013-2 Class A2 | | | 0.61 | | | | 6-24-2016 | | | | 3,316,823 | | | | 3,317,699 | |
GE Equipment Small Ticket LLC Series 2013-1A Class A2 144A | | | 0.73 | | | | 1-25-2016 | | | | 2,187,233 | | | | 2,188,068 | |
GE Equipment Transportation LLC Series 2015-1 Class A2 %% | | | 0.89 | | | | 11-24-2017 | | | | 3,995,000 | | | | 3,994,571 | |
Honda Auto Receivables Owner Trust Series 2013-2 Class A3 | | | 0.53 | | | | 2-16-2017 | | | | 3,126,215 | | | | 3,125,534 | |
Honda Auto Receivables Owner Trust Series 2013-3 Class A3 | | | 0.77 | | | | 5-15-2017 | | | | 1,525,000 | | | | 1,526,548 | |
Honda Auto Receivables Owner Trust Series 2014-3 Class A2 | | | 0.48 | | | | 12-15-2016 | | | | 7,200,000 | | | | 7,195,781 | |
Hyundai Auto Lease Securitization Trust Series 2013-A Class A3 144A | | | 0.66 | | | | 6-15-2016 | | | | 3,278,193 | | | | 3,277,796 | |
Hyundai Auto Lease Securitization Trust Series 2013-B Class A2 144A | | | 0.75 | | | | 3-15-2016 | | | | 3,187,985 | | | | 3,189,082 | |
Hyundai Auto Lease Securitization Trust Series 2014-A Class A2 144A | | | 0.52 | | | | 7-15-2016 | | | | 8,652,502 | | | | 8,654,207 | |
Hyundai Auto Lease Securitization Trust Series 2014-B Class A2 144A | | | 0.61 | | | | 2-15-2017 | | | | 11,100,000 | | | | 11,088,822 | |
Hyundai Auto Receivables Trust Series 2013-B Class A3 | | | 0.71 | | | | 9-15-2017 | | | | 11,023,543 | | | | 11,032,935 | |
Macquarie Equipment Funding Trust Series 2014-A Class A2 144A | | | 0.80 | | | | 11-21-2016 | | | | 11,400,000 | | | | 11,414,649 | |
Mercedes-Benz Auto Lease Trust Series 2013-B Class A2 | | | 0.53 | | | | 9-15-2015 | | | | 101,096 | | | | 101,093 | |
Mercedes-Benz Auto Lease Trust Series 2014-A Class A2A | | | 0.48 | | | | 6-15-2016 | | | | 8,278,278 | | | | 8,275,637 | |
Nissan Auto Lease Trust Series 2013-B Class A2A | | | 0.57 | | | | 1-15-2016 | | | | 6,009,689 | | | | 6,010,639 | |
Nissan Auto Lease Trust Series 2014-B Class A2A | | | 0.73 | | | | 4-17-2017 | | | | 15,140,000 | | | | 15,144,497 | |
Porsche Innovative Lease Owner Pilot Trust Series 2013-1 Class A2 144A | | | 0.54 | | | | 1-22-2016 | | | | 1,481,924 | | | | 1,482,063 | |
The accompanying notes are an integral part of these financial statements.
| | | | |
| 12 | | Wells Fargo Advantage Ultra Short-Term Income Fund | | Portfolio of investments—February 28, 2015 (unaudited) |
| | | | | | | | | | | | | | | | |
| Security name | | Interest rate | | | Maturity date | | | Principal | | | Value | |
| | | | |
Asset-Backed Securities (continued) | | | | | | | | | | | | | | | | |
Susquehanna Auto Receivables Trust Series 2014-1A Class A2 144A | | | 0.58 | % | | | 10-17-2016 | | | $ | 5,750,000 | | | $ | 5,748,011 | |
Toyota Auto Receivables Owner Trust Series 2013-B Class A2 | | | 0.48 | | | | 2-15-2016 | | | | 764,981 | | | | 765,003 | |
Volkswagen Auto Lease Trust Series 2013-A Class A2A | | | 0.63 | | | | 12-21-2015 | | | | 388,690 | | | | 388,714 | |
Volkswagen Auto Lease Trust Series 2015-A Class A2A %% | | | 0.98 | | | | 6-20-2017 | | | | 9,700,000 | | | | 9,699,952 | |
World Omni Automobile Lease Trust Series 2013-A Class A2A | | | 0.73 | | | | 5-16-2016 | | | | 4,318,434 | | | | 4,321,709 | |
| | | | |
Total Asset-Backed Securities (Cost $195,303,058) | | | | | | | | | | | | | | | 195,283,218 | |
| | | | | | | | | | | | | | | | |
| | | | |
Corporate Bonds and Notes: 40.52% | | | | | | | | | | | | | | | | |
| | | | |
Consumer Discretionary: 3.57% | | | | | | | | | | | | | | | | |
| | | | |
| Automobiles: 1.09% | | | | | | | | | | | | | | | | |
Harley-Davidson Financial Services Incorporated 144A | | | 1.15 | | | | 9-15-2015 | | | | 2,500,000 | | | | 2,506,650 | |
Harley-Davidson Financial Services Incorporated 144A | | | 2.70 | | | | 3-15-2017 | | | | 6,000,000 | | | | 6,174,288 | |
Harley-Davidson Financial Services Incorporated 144A | | | 3.88 | | | | 3-15-2016 | | | | 1,500,000 | | | | 1,547,570 | |
Volkswagen Group America 144A | | | 1.25 | | | | 5-23-2017 | | | | 3,000,000 | | | | 2,996,277 | |
Volkswagen Group America 144A | | | 1.60 | | | | 11-20-2017 | | | | 5,000,000 | | | | 5,025,585 | |
| | | | |
| | | | | | | | | | | | | | | 18,250,370 | |
| | | | | | | | | | | | | | | | |
| | | | |
| Media: 2.48% | | | | | | | | | | | | | | | | |
Cox Communications Incorporated | | | 5.50 | | | | 10-1-2015 | | | | 9,000,000 | | | | 9,248,301 | |
DIRECTV Holdings LLC | | | 3.55 | | | | 3-15-2015 | | | | 3,000,000 | | | | 3,002,832 | |
McGraw-Hill Company Incorporated | | | 5.90 | | | | 11-15-2017 | | | | 4,692,000 | | | | 5,156,264 | |
News America Incorporated | | | 7.60 | | | | 10-11-2015 | | | | 5,618,000 | | | | 5,841,164 | |
News America Incorporated | | | 8.00 | | | | 10-17-2016 | | | | 827,000 | | | | 918,516 | |
Omnicom Group Incorporated | | | 5.90 | | | | 4-15-2016 | | | | 7,000,000 | | | | 7,368,725 | |
Thomson Reuters Corporation | | | 1.65 | | | | 9-29-2017 | | | | 10,000,000 | | | | 10,013,320 | |
| | | | |
| | | | | | | | | | | | | | | 41,549,122 | |
| | | | | | | | | | | | | | | | |
| | | | |
Consumer Staples: 1.94% | | | | | | | | | | | | | | | | |
| | | | |
| Beverages: 0.56% | | | | | | | | | | | | | | | | |
Constellation Brands Incorporated | | | 7.25 | | | | 9-1-2016 | | | | 8,600,000 | | | | 9,296,600 | |
| | | | | | | | | | | | | | | | |
| | | | |
| Food & Staples Retailing: 0.77% | | | | | | | | | | | | | | | | |
Tyson Foods Incorporated | | | 6.60 | | | | 4-1-2016 | | | | 7,446,000 | | | | 7,882,112 | |
Walgreens Boots Alliance Company | | | 1.75 | | | | 11-17-2017 | | | | 5,000,000 | | | | 5,050,370 | |
| | | | |
| | | | | | | | | | | | | | | 12,932,482 | |
| | | | | | | | | | | | | | | | |
| | | | |
| Tobacco: 0.61% | | | | | | | | | | | | | | | | |
Lorillard Tobacco Company | | | 3.50 | | | | 8-4-2016 | | | | 10,000,000 | | | | 10,298,220 | |
| | | | | | | | | | | | | | | | |
| | | | |
Energy: 5.72% | | | | | | | | | | | | | | | | |
| | | | |
| Energy Equipment & Services: 0.36% | | | | | | | | | | | | | | | | |
Enterprise Products Operating LLC | | | 3.70 | | | | 6-1-2015 | | | | 6,000,000 | | | | 6,046,056 | |
| | | | | | | | | | | | | | | | |
| | | | |
| Oil, Gas & Consumable Fuels: 5.36% | | | | | | | | | | | | | | | | |
Anadarko Petroleum Corporation | | | 6.38 | | | | 9-15-2017 | | | | 9,700,000 | | | | 10,855,251 | |
Boardwalk Pipelines LP | | | 5.88 | | | | 11-15-2016 | | | | 9,000,000 | | | | 9,420,516 | |
Colorado Interstate Gas Company | | | 5.95 | | | | 3-15-2015 | | | | 8,450,000 | | | | 8,465,016 | |
DCP Midstream Operating Company | | | 2.50 | | | | 12-1-2017 | | | | 7,628,000 | | | | 7,409,282 | |
The accompanying notes are an integral part of these financial statements.
| | | | | | |
| Portfolio of investments—February 28, 2015 (unaudited) | | Wells Fargo Advantage Ultra Short-Term Income Fund | | | 13 | |
| | | | | | | | | | | | | | | | |
| Security name | | Interest rate | | | Maturity date | | | Principal | | | Value | |
| | | | |
| Oil, Gas & Consumable Fuels (continued) | | | | | | | | | | | | | | | | |
El Paso LLC | | | 7.00 | % | | | 6-15-2017 | | | $ | 4,574,000 | | | $ | 5,062,503 | |
Enterprise Products Operating LLC | | | 1.25 | | | | 8-13-2015 | | | | 3,000,000 | | | | 3,005,910 | |
Marathon Petroleum Corporation | | | 3.50 | | | | 3-1-2016 | | | | 9,029,000 | | | | 9,235,168 | |
Nabors Industries Incorporated | | | 2.35 | | | | 9-15-2016 | | | | 10,000,000 | | | | 10,024,410 | |
ONEOK Partners LP | | | 3.25 | | | | 2-1-2016 | | | | 10,000,000 | | | | 10,144,800 | |
Rockies Express Pipeline LLC 144A | | | 3.90 | | | | 4-15-2015 | | | | 10,000,000 | | | | 10,000,000 | |
Southwestern Energy Company | | | 3.30 | | | | 1-23-2018 | | | | 2,000,000 | | | | 2,027,908 | |
Williams Partners LP | | | 7.25 | | | | 2-1-2017 | | | | 3,700,000 | | | | 4,073,090 | |
| | | | |
| | | | | | | | | | | | | | | 89,723,854 | |
| | | | | | | | | | | | | | | | |
| | | | |
Financials: 15.53% | | | | | | | | | | | | | | | | |
| | | | |
| Banks: 3.23% | | | | | | | | | | | | | | | | |
Associated Banc Corporation | | | 5.13 | | | | 3-28-2016 | | | | 3,500,000 | | | | 3,641,624 | |
Bank of America Corporation | | | 1.70 | | | | 8-25-2017 | | | | 4,000,000 | | | | 4,018,440 | |
Bank of America Corporation | | | 6.05 | | | | 5-16-2016 | | | | 8,000,000 | | | | 8,434,360 | |
Bank One Corporation | | | 4.90 | | | | 4-30-2015 | | | | 4,260,000 | | | | 4,286,186 | |
Citigroup Incorporated | | | 4.88 | | | | 5-7-2015 | | | | 5,589,000 | | | | 5,631,387 | |
PNC Funding Corporation | | | 5.25 | | | | 11-15-2015 | | | | 9,221,000 | | | | 9,502,637 | |
UBS AG (Stamford Connecticut) | | | 5.88 | | | | 7-15-2016 | | | | 8,000,000 | | | | 8,515,952 | |
US Bank NA ± | | | 3.78 | | | | 4-29-2020 | | | | 10,000,000 | | | | 10,047,980 | |
| | | | |
| | | | | | | | | | | | | | | 54,078,566 | |
| | | | | | | | | | | | | | | | |
| | | | |
| Capital Markets: 2.66% | | | | | | | | | | | | | | | | |
Bear Stearns Companies LLC | | | 5.55 | | | | 1-22-2017 | | | | 10,785,000 | | | | 11,581,073 | |
Goldman Sachs Group Incorporated | | | 5.63 | | | | 1-15-2017 | | | | 6,261,000 | | | | 6,725,817 | |
Janus Capital Group Incorporated | | | 6.70 | | | | 6-15-2017 | | | | 8,418,000 | | | | 9,274,641 | |
Merrill Lynch & Company Incorporated | | | 5.30 | | | | 9-30-2015 | | | | 1,600,000 | | | | 1,640,624 | |
Morgan Stanley | | | 1.75 | | | | 2-25-2016 | | | | 5,500,000 | | | | 5,540,645 | |
Morgan Stanley | | | 1.88 | | | | 1-5-2018 | | | | 6,060,000 | | | | 6,085,337 | |
Morgan Stanley | | | 6.00 | | | | 4-28-2015 | | | | 3,660,000 | | | | 3,689,602 | |
| | | | |
| | | | | | | | | | | | | | | 44,537,739 | |
| | | | | | | | | | | | | | | | |
| | | | |
| Consumer Finance: 4.49% | | | | | | | | | | | | | | | | |
AIG Global Funding 144A | | | 1.65 | | | | 12-15-2017 | | | | 4,000,000 | | | | 4,018,928 | |
Capital One Bank USA NA | | | 1.30 | | | | 6-5-2017 | | | | 5,145,000 | | | | 5,109,129 | |
Capital One Financial Corporation | | | 1.00 | | | | 11-6-2015 | | | | 2,315,000 | | | | 2,318,065 | |
Daimler Finance NA LLC 144A %% | | | 1.65 | | | | 3-2-2018 | | | | 7,000,000 | | | | 7,028,042 | |
Discover Financial Services Company | | | 6.45 | | | | 6-12-2017 | | | | 570,000 | | | | 626,170 | |
ERAC USA Finance LLC 144A | | | 1.40 | | | | 4-15-2016 | | | | 1,024,000 | | | | 1,026,293 | |
ERAC USA Finance LLC 144A | | | 2.75 | | | | 3-15-2017 | | | | 750,000 | | | | 769,868 | |
ERAC USA Finance LLC 144A | | | 5.90 | | | | 11-15-2015 | | | | 1,020,000 | | | | 1,055,624 | |
Ford Motor Credit Company LLC | | | 6.63 | | | | 8-15-2017 | | | | 5,180,000 | | | | 5,789,354 | |
Ford Motor Credit Company LLC | | | 12.00 | | | | 5-15-2015 | | | | 1,000,000 | | | | 1,022,398 | |
General Motors Financial Company Incorporated | | | 2.75 | | | | 5-15-2016 | | | | 9,890,000 | | | | 10,035,185 | |
HSBC Finance Corporation | | | 5.50 | | | | 1-19-2016 | | | | 2,665,000 | | | | 2,768,975 | |
Hyundai Capital America Company 144A | | | 3.75 | | | | 4-6-2016 | | | | 7,331,000 | | | | 7,529,839 | |
The accompanying notes are an integral part of these financial statements.
| | | | |
| 14 | | Wells Fargo Advantage Ultra Short-Term Income Fund | | Portfolio of investments—February 28, 2015 (unaudited) |
| | | | | | | | | | | | | | | | |
| Security name | | Interest rate | | | Maturity date | | | Principal | | | Value | |
| | | | |
| Consumer Finance (continued) | | | | | | | | | | | | | | | | |
Nissan Motor Acceptance Corporation 144A± | | | 0.78 | % | | | 3-3-2017 | | | $ | 4,000,000 | | | $ | 4,011,896 | |
SLM Corporation | | | 3.88 | | | | 9-10-2015 | | | | 3,500,000 | | | | 3,535,000 | |
The Western Union Company ± | | | 1.26 | | | | 8-21-2015 | | | | 8,830,000 | | | | 8,852,861 | |
Toll Brothers Finance Corporation | | | 8.91 | | | | 10-15-2017 | | | | 8,405,000 | | | | 9,707,775 | |
| | | | |
| | | | | | | | | | | | | | | 75,205,402 | |
| | | | | | | | | | | | | | | | |
| | | | |
| Diversified Financial Services: 0.34% | | | | | | | | | | | | | | | | |
Toll Road Investors Partnership II LP 144A¤ | | | 0.00 | | | | 2-15-2016 | | | | 6,000,000 | | | | 5,760,486 | |
| | | | | | | | | | | | | | | | |
| | | | |
| Energy Equipment & Services: 0.33% | | | | | | | | | | | | | | | | |
Texas Eastern Transmission LP 144A | | | 6.00 | | | | 9-15-2017 | | | | 5,000,000 | | | | 5,516,310 | |
| | | | | | | | | | | | | | | | |
| | | | |
| Insurance: 2.71% | | | | | | | | | | | | | | | | |
MetLife Insurance Company 144A | | | 7.70 | | | | 11-1-2015 | | | | 8,500,000 | | | | 8,871,875 | |
Platinum Underwriters Finance Incorporated Series B | | | 7.50 | | | | 6-1-2017 | | | | 2,705,000 | | | | 3,006,902 | |
Prudential Insurance Company 144A | | | 8.10 | | | | 7-15-2015 | | | | 11,090,000 | | | | 11,383,220 | |
Symetra Financial Corporation 144A | | | 6.13 | | | | 4-1-2016 | | | | 9,100,000 | | | | 9,481,536 | |
Unum Group 144A | | | 6.85 | | | | 11-15-2015 | | | | 3,799,000 | | | | 3,952,449 | |
W.R. Berkley Corporation | | | 5.60 | | | | 5-15-2015 | | | | 8,620,000 | | | | 8,702,597 | |
| | | | |
| | | | | | | | | | | | | | | 45,398,579 | |
| | | | | | | | | | | | | | | | |
| | | | |
| REITs: 1.77% | | | | | | | | | | | | | | | | |
ARC Properties Operating Partnership LP | | | 2.00 | | | | 2-6-2017 | | | | 2,915,000 | | | | 2,839,295 | |
Camden Property Trust | | | 5.00 | | | | 6-15-2015 | | | | 6,490,000 | | | | 6,568,451 | |
Digital Realty Trust LP | | | 4.50 | | | | 7-15-2015 | | | | 8,210,000 | | | | 8,243,916 | |
Health Care REIT Incorporated | | | 6.20 | | | | 6-1-2016 | | | | 3,000,000 | | | | 3,183,261 | |
Realty Income Corporation | | | 5.50 | | | | 11-15-2015 | | | | 3,833,000 | | | | 3,952,854 | |
Regency Centers LP | | | 5.25 | | | | 8-1-2015 | | | | 4,788,000 | | | | 4,876,463 | |
| | | | |
| | | | | | | | | | | | | | | 29,664,240 | |
| | | | | | | | | | | | | | | | |
| | | | |
Health Care: 2.45% | | | | | | | | | | | | | | | | |
| | | | |
| Biotechnology: 1.08% | | | | | | | | | | | | | | | | |
Amgen Incorporated | | | 1.25 | | | | 5-22-2017 | | | | 11,020,000 | | | | 11,013,531 | |
Biogen Idec Incorporated | | | 6.88 | | | | 3-1-2018 | | | | 6,200,000 | | | | 7,145,506 | |
| | | | |
| | | | | | | | | | | | | | | 18,159,037 | |
| | | | | | | | | | | | | | | | |
| | | | |
| Health Care Providers & Services: 0.72% | | | | | | | | | | | | | | | | |
Providence Health & Services Company ± | | | 1.06 | | | | 10-1-2016 | | | | 12,000,000 | | | | 12,056,256 | |
| | | | | | | | | | | | | | | | |
| | | | |
| Life Sciences Tools & Services: 0.65% | | | | | | | | | | | | | | | | |
Life Technologies Corporation | | | 4.40 | | | | 3-1-2015 | | | | 5,830,000 | | | | 5,830,000 | |
Thermo Fisher Scientific Incorporated | | | 1.30 | | | | 2-1-2017 | | | | 5,000,000 | | | | 5,001,235 | |
| | | | |
| | | | | | | | | | | | | | | 10,831,235 | |
| | | | | | | | | | | | | | | | |
| | | | |
Industrials: 3.41% | | | | | | | | | | | | | | | | |
| | | | |
| Aerospace & Defense: 0.56% | | | | | | | | | | | | | | | | |
L-3 Communications Corporation | | | 3.95 | | | | 11-15-2016 | | | | 9,000,000 | | | | 9,325,404 | |
| | | | | | | | | | | | | | | | |
The accompanying notes are an integral part of these financial statements.
| | | | | | |
| Portfolio of investments—February 28, 2015 (unaudited) | | Wells Fargo Advantage Ultra Short-Term Income Fund | | | 15 | |
| | | | | | | | | | | | | | | | |
| Security name | | Interest rate | | | Maturity date | | | Principal | | | Value | |
| | | | |
| Airlines: 0.69% | | | | | | | | | | | | | | | | |
Delta Air Lines Incorporated 2009-1 Series B Pass Through Trust | | | 9.75 | % | | | 6-17-2018 | | | $ | 7,975,375 | | | $ | 8,992,235 | |
United Airlines Incorporated 2009-2A Series A-2 Pass Through Trust | | | 9.75 | | | | 7-15-2018 | | | | 2,255,669 | | | | 2,503,793 | |
| | | | |
| | | | | | | | | | | | | | | 11,496,028 | |
| | | | | | | | | | | | | | | | |
| | | | |
| Commercial Services & Supplies: 0.54% | | | | | | | | | | | | | | | | |
Penske Truck Leasing Company LP 144A | | | 2.50 | | | | 3-15-2016 | | | | 2,720,000 | | | | 2,761,834 | |
Penske Truck Leasing Company LP 144A | | | 3.13 | | | | 5-11-2015 | | | | 6,310,000 | | | | 6,337,581 | |
| | | | |
| | | | | | | | | | | | | | | 9,099,415 | |
| | | | | | | | | | | | | | | | |
| | | | |
| Machinery: 0.56% | | | | | | | | | | | | | | | | |
CNH Capital LLC | | | 3.25 | | | | 2-1-2017 | | | | 5,240,000 | | | | 5,279,300 | |
CNH Capital LLC | | | 3.88 | | | | 11-1-2015 | | | | 4,105,000 | | | | 4,130,656 | |
| | | | |
| | | | | | | | | | | | | | | 9,409,956 | |
| | | | | | | | | | | | | | | | |
| | | | |
| Road & Rail: 0.63% | | | | | | | | | | | | | | | | |
GATX Corporation | | | 4.75 | | | | 5-15-2015 | | | | 5,442,000 | | | | 5,483,936 | |
Ryder System Incorporated | | | 3.15 | | | | 3-2-2015 | | | | 5,000,000 | | | | 5,000,000 | |
| | | | |
| | | | | | | | | | | | | | | 10,483,936 | |
| | | | | | | | | | | | | | | | |
| | | | |
| Trading Companies & Distributors: 0.43% | | | | | | | | | | | | | | | | |
International Lease Finance Corporation | | | 8.63 | | | | 9-15-2015 | | | | 7,000,000 | | | | 7,236,250 | |
| | | | | | | | | | | | | | | | |
| | | | |
Information Technology: 1.50% | | | | | | | | | | | | | | | | |
| | | | |
| Electronic Equipment, Instruments & Components: 0.53% | | | | | | | | | | | | | | | | |
Arrow Electronics Incorporated | | | 3.38 | | | | 11-1-2015 | | | | 8,800,000 | | | | 8,953,349 | |
| | | | | | | | | | | | | | | | |
| | | | |
| IT Services: 0.18% | | | | | | | | | | | | | | | | |
Fidelity National Information Services Incorporated | | | 1.45 | | | | 6-5-2017 | | | | 3,000,000 | | | | 2,994,573 | |
| | | | | | | | | | | | | | | | |
| | | | |
| Semiconductors & Semiconductor Equipment: 0.60% | | | | | | | | | | | | | | | | |
Kla-Tencor Corporation | | | 2.38 | | | | 11-1-2017 | | | | 10,000,000 | | | | 10,142,420 | |
| | | | | | | | | | | | | | | | |
| | | | |
| Technology Hardware, Storage & Peripherals: 0.19% | | | | | | | | | | | | | | | | |
Xerox Corporation | | | 6.40 | | | | 3-15-2016 | | | | 2,950,000 | | | | 3,113,589 | |
| | | | | | | | | | | | | | | | |
| | | | |
Materials: 2.03% | | | | | | | | | | | | | | | | |
| | | | |
| Chemicals: 0.81% | | | | | | | | | | | | | | | | |
Eastman Chemical Company | | | 3.00 | | | | 12-15-2015 | | | | 9,760,000 | | | | 9,924,027 | |
Ecolab Incorporated | | | 1.55 | | | | 1-12-2018 | | | | 3,725,000 | | | | 3,722,113 | |
| | | | |
| | | | | | | | | | | | | | | 13,646,140 | |
| | | | | | | | | | | | | | | | |
| | | | |
| Construction Materials: 0.58% | | | | | | | | | | | | | | | | |
Martin Marietta Material ± | | | 1.36 | | | | 6-30-2017 | | | | 9,690,000 | | | | 9,639,195 | |
| | | | | | | | | | | | | | | | |
| | | | |
| Metals & Mining: 0.18% | | | | | | | | | | | | | | | | |
Glencore Funding LLC 144A | | | 1.70 | | | | 5-27-2016 | | | | 3,000,000 | | | | 3,010,674 | |
| | | | | | | | | | | | | | | | |
| | | | |
| Paper & Forest Products: 0.46% | | | | | | | | | | | | | | | | |
Georgia-Pacific LLC | | | 7.70 | | | | 6-15-2015 | | | | 7,570,000 | | | | 7,709,061 | |
| | | | | | | | | | | | | | | | |
The accompanying notes are an integral part of these financial statements.
| | | | |
| 16 | | Wells Fargo Advantage Ultra Short-Term Income Fund | | Portfolio of investments—February 28, 2015 (unaudited) |
| | | | | | | | | | | | | | | | |
| Security name | | Interest rate | | | Maturity date | | | Principal | | | Value | |
| | | | |
Telecommunication Services: 1.76% | | | | | | | | | | | | | | | | |
| | | | |
| Diversified Telecommunication Services: 1.76% | | | | | | | | | | | | | | | | |
CenturyLink Incorporated | | | 5.15 | % | | | 6-15-2017 | | | $ | 1,500,000 | | | $ | 1,582,500 | |
CenturyLink Incorporated | | | 6.00 | | | | 4-1-2017 | | | | 1,000,000 | | | | 1,070,000 | |
Clearwire Communications LLC 144A | | | 14.75 | | | | 12-1-2016 | | | | 7,290,000 | | | | 8,748,000 | |
Crown Castle Towers LLC 144A | | | 3.21 | | | | 8-15-2035 | | | | 8,061,000 | | | | 8,134,242 | |
Crown Castle Towers LLC 144A | | | 5.50 | | | | 1-15-2037 | | | | 7,305,000 | | | | 7,698,951 | |
Verizon Communications Incorporated | | | 0.70 | | | | 11-2-2015 | | | | 2,325,000 | | | | 2,326,688 | |
| | | | |
| | | | | | | | | | | | | | | 29,560,381 | |
| | | | | | | | | | | | | | | | |
| | | | |
Utilities: 2.61% | | | | | | | | | | | | | | | | |
| | | | |
| Electric Utilities: 1.84% | | | | | | | | | | | | | | | | |
Dayton Power & Light Company | | | 1.88 | | | | 9-15-2016 | | | | 9,000,000 | | | | 9,099,153 | |
Eversource Energy | | | 1.60 | | | | 1-15-2018 | | | | 5,000,000 | | | | 4,999,600 | |
Exelon Corporation | | | 4.90 | | | | 6-15-2015 | | | | 2,000,000 | | | | 2,023,634 | |
LG&E & KU Energy LLC | | | 2.13 | | | | 11-15-2015 | | | | 7,635,000 | | | | 7,696,729 | |
NextEra Energy Capital Holdings Incorporated | | | 1.34 | | | | 9-1-2015 | | | | 7,000,000 | | | | 7,024,199 | |
| | | | |
| | | | | | | | | | | | | | | 30,843,315 | |
| | | | | | | | | | | | | | | | |
| | | | |
| Gas Utilities: 0.77% | | | | | | | | | | | | | | | | |
CenterPoint Energy Resource Corporation | | | 6.15 | | | | 5-1-2016 | | | | 3,000,000 | | | | 3,172,887 | |
Questar Corporation | | | 2.75 | | | | 2-1-2016 | | | | 9,500,000 | | | | 9,666,516 | |
| | | | |
| | | | | | | | | | | | | | | 12,839,403 | |
| | | | | | | | | | | | | | | | |
| | | | |
Total Corporate Bonds and Notes (Cost $679,361,596) | | | | | | | | | | | | | | | 678,807,643 | |
| | | | | | | | | | | | | | | | |
| | | | |
Municipal Obligations: 3.78% | | | | | | | | | | | | | | | | |
| | | | |
| California: 0.54% | | | | | | | | | | | | | | | | |
California PCFA Waste Management Services Incorporated Series A1 (Resource Recovery Revenue) ± | | | 1.88 | | | | 4-1-2025 | | | | 4,000,000 | | | | 4,005,240 | |
California Public Works Board Lease Series E (Miscellaneous Revenue) | | | 3.68 | | | | 12-1-2015 | | | | 5,000,000 | | | | 5,101,750 | |
| | | | |
| | | | | | | | | | | | | | | 9,106,990 | |
| | | | | | | | | | | | | | | | |
| | | | |
| Connecticut: 0.37% | | | | | | | | | | | | | | | | |
Connecticut Series A (GO) | | | 5.46 | | | | 3-1-2019 | | | | 5,675,000 | | | | 6,142,109 | |
| | | | | | | | | | | | | | | | |
| | | | |
| Florida: 0.31% | | | | | | | | | | | | | | | | |
Village Center Florida Community Development District (Water & Sewer Revenue) 144A## | | | 1.30 | | | | 11-1-2015 | | | | 2,250,000 | | | | 2,248,920 | |
Village Center Florida Community Development District (Water & Sewer Revenue) 144A | | | 1.60 | | | | 11-1-2016 | | | | 2,000,000 | | | | 1,999,420 | |
Village Center Florida Community Development District Little Sumter Service Area System Series B (Water & Sewer Revenue) 144A | | | 1.30 | | | | 10-1-2015 | | | | 1,000,000 | | | | 999,660 | |
| | | | |
| | | | | | | | | | | | | | | 5,248,000 | |
| | | | | | | | | | | | | | | | |
| | | | |
| New Jersey: 1.36% | | | | | | | | | | | | | | | | |
Atlantic City (GO, AGM Insured) | | | 3.30 | | | | 12-15-2016 | | | | 1,600,000 | | | | 1,636,992 | |
New Jersey EDA School Facilities Series QQ (Education Revenue) | | | 1.80 | | | | 6-15-2017 | | | | 10,000,000 | | | | 10,070,300 | |
New Jersey EDA Series B (Lease Revenue, AGM Insured) ¤ | | | 0.00 | | | | 2-15-2018 | | | | 10,000,000 | | | | 9,331,100 | |
New Jersey Turnpike Authority Series B (Transportation Revenue, Ambac Insured) | | | 4.25 | | | | 1-1-2016 | | | | 1,725,000 | | | | 1,767,901 | |
| | | | |
| | | | | | | | | | | | | | | 22,806,293 | |
| | | | | | | | | | | | | | | | |
The accompanying notes are an integral part of these financial statements.
| | | | | | |
| Portfolio of investments—February 28, 2015 (unaudited) | | Wells Fargo Advantage Ultra Short-Term Income Fund | | | 17 | |
| | | | | | | | | | | | | | | | |
| Security name | | Interest rate | | | Maturity date | | | Principal | | | Value | |
| | | | |
| South Carolina: 0.15% | | | | | | | | | | | | | | | | |
South Carolina Jobs EDA Waste Management South Carolina Incorporated Project (Resource Recovery Revenue) ± | | | 1.88 | % | | | 11-1-2016 | | | $ | 2,500,000 | | | $ | 2,553,975 | |
| | | | | | | | | | | | | | | | |
| | | | |
| Texas: 1.05% | | | | | | | | | | | | | | | | |
Gulf Coast Waste Disposal Authority Waste Management of Texas Series B (Resource Recovery Revenue) ± | | | 0.70 | | | | 5-1-2028 | | | | 4,000,000 | | | | 4,000,320 | |
Port Arthur TX Naval District Environmental Facilities Motiva Enterprises Project Series B (Resource Recovery Revenue) ± | | | 0.09 | | | | 12-1-2039 | | | | 12,000,000 | | | | 12,000,000 | |
Port Arthur TX Navigation District Jefferson County Environmental Facilities Motiva Enterprises LLC Project Series D (Industrial Development Revenue) ± | | | 0.09 | | | | 11-1-2040 | | | | 1,500,000 | | | | 1,500,000 | |
| | | | |
| | | | | | | | | | | | | | | 17,500,320 | |
| | | | | | | | | | | | | | | | |
| | | | |
Total Municipal Obligations (Cost $63,075,613) | | | | | | | | | | | | | | | 63,357,687 | |
| | | | | | | | | | | | | | | | |
| | | | |
Non-Agency Mortgage-Backed Securities: 12.02% | | | | | | | | | | | | | | | | |
Bank of America Commercial Mortgage Incorporated Series 2007-3 Class A1A ± | | | 5.58 | | | | 6-10-2049 | | | | 917,420 | | | | 986,617 | |
Bank of America Mortgage Securities Series 2002-K Class 3A1 ± | | | 2.63 | | | | 10-20-2032 | | | | 2,346 | | | | 2,365 | |
Bear Stearns Commercial Mortgage Securities Incorporated Series 2005-PW10 Class A4 ± | | | 5.41 | | | | 12-11-2040 | | | | 5,743,309 | | | | 5,859,117 | |
Bear Stearns Commercial Mortgage Securities Incorporated Series 2005-PWR 9 Class A4A | | | 4.87 | | | | 9-11-2042 | | | | 4,393,621 | | | | 4,424,600 | |
Bear Stearns Commercial Mortgage Securities Incorporated Series 2005-PWR8 Class A4 | | | 4.67 | | | | 6-11-2041 | | | | 4,122,059 | | | | 4,128,358 | |
Bear Stearns Commercial Mortgage Securities Incorporated Series 2007-PWR15 Class A4 | | | 5.33 | | | | 2-11-2044 | | | | 2,309,725 | | | | 2,455,531 | |
Citigroup Commercial Mortgage Trust Series 2005-CD1 Class A4 ± | | | 5.23 | | | | 7-15-2044 | | | | 3,477,299 | | | | 3,510,472 | |
CNH Equipment Trust Series 2012-B Class A3 | | | 0.86 | | | | 9-15-2017 | | | | 7,433,480 | | | | 7,437,583 | |
CNH Equipment Trust Series 2014-A Class A2 | | | 0.49 | | | | 6-15-2017 | | | | 5,200,977 | | | | 5,198,772 | |
Collateralized Mortgage Obligation Trust Series 66 Class Z | | | 8.00 | | | | 9-20-2021 | | | | 64,840 | | | | 70,782 | |
Commercial Mortgage Trust Series 2005-C6 Class A5A ± | | | 5.12 | | | | 6-10-2044 | | | | 9,206,061 | | | | 9,268,230 | |
Commercial Mortgage Trust Series 2010-C1 Class A1 144A | | | 3.16 | | | | 7-10-2046 | | | | 6,038,565 | | | | 6,078,298 | |
Commercial Mortgage Trust Series 2013-FL3 Class B 144A± | | | 2.32 | | | | 10-13-2028 | | | | 9,000,000 | | | | 9,127,305 | |
Commercial Mortgage Trust Series 2014-BBG Class A 144A± | | | 0.97 | | | | 3-15-2029 | | | | 5,400,000 | | | | 5,385,004 | |
Countrywide Home Loans Mortgage Pass-Through Trust Series 2001-HYB1 Class 1A1 ± | | | 2.08 | | | | 6-19-2031 | | | | 590,532 | | | | 591,467 | |
Countrywide Home Loans Mortgage Pass-Through Trust Series 2001-HYB1 Class 2A1 ± | | | 1.93 | | | | 6-19-2031 | | | | 269,174 | | | | 268,377 | |
Countrywide Home Loans Mortgage Pass-Through Trust Series 2004-20 Class 3A1 ± | | | 2.24 | | | | 9-25-2034 | | | | 156,938 | | | | 133,441 | |
Credit Suisse First Boston Mortgage Securities Corporation Series 2005-C5 Class A4 ± | | | 5.10 | | | | 8-15-2038 | | | | 1,632,469 | | | | 1,647,545 | |
Credit Suisse First Boston Mortgage Securities Corporation Series 2006-C4 Class A3 | | | 5.47 | | | | 9-15-2039 | | | | 5,383,580 | | | | 5,641,884 | |
Credit Suisse Mortgage Capital Certificates Series 2006-C5 Class A3 | | | 5.31 | | | | 12-15-2039 | | | | 8,813,654 | | | | 9,223,841 | |
DLJ Mortgage Acceptance Corporation Series 1990-2 Class A ±(i) | | | 3.43 | | | | 1-25-2022 | | | | 77,400 | | | | 78,259 | |
DLJ Mortgage Acceptance Corporation Series 1991-3 Class A1 ±(i) | | | 1.95 | | | | 1-25-2021 | | | | 19,649 | | | | 19,796 | |
EquiFirst Mortgage Loan Trust Series 2003-2 Class 3A3 ± | | | 1.30 | | | | 9-25-2033 | | | | 634,371 | | | | 607,116 | |
Equity Mortgage Trust Series 2014-INNS Class A 144A± | | | 1.02 | | | | 5-8-2031 | | | | 11,000,000 | | | | 10,985,634 | |
GE Capital Commercial Mortgage Corporation Series 2005-C3 Class A7A ± | | | 4.97 | | | | 7-10-2045 | | | | 5,430,000 | | | | 5,444,444 | |
GE Equipment Transportation LLC Series 2014-1 Class A2 | | | 0.55 | | | | 12-23-2016 | | | | 8,396,107 | | | | 8,395,049 | |
GS Mortgage Securities Trust Series 2014-GSFL Class A 144A± | | | 1.17 | | | | 7-15-2031 | | | | 10,000,000 | | | | 10,000,000 | |
GSMPS Mortgage Loan Trust Series 1998-1 Class A 144A± | | | 8.00 | | | | 9-19-2027 | | | | 75,137 | | | | 76,514 | |
Housing Securities Incorporated Series 1992-8 Class E ± | | | 3.56 | | | | 6-25-2024 | | | | 117,438 | | | | 117,814 | |
JPMorgan Chase Commercial Mortgage Securities Corporation Series 2005-LDP5 Class A4 ± | | | 5.23 | | | | 12-15-2044 | | | | 4,577,005 | | | | 4,646,512 | |
The accompanying notes are an integral part of these financial statements.
| | | | |
| 18 | | Wells Fargo Advantage Ultra Short-Term Income Fund | | Portfolio of investments—February 28, 2015 (unaudited) |
| | | | | | | | | | | | | | | | |
| Security name | | Interest rate | | | Maturity date | | | Principal | | | Value | |
|
Non-Agency Mortgage-Backed Securities (continued) | |
JPMorgan Chase Commercial Mortgage Securities Corporation Series 2006-CB17 Class A4 | | | 5.43 | % | | | 12-12-2043 | | | $ | 951,124 | | | $ | 998,845 | |
JPMorgan Chase Commercial Mortgage Securities Corporation Series 2006-LDP6 Class A4 ± | | | 5.48 | | | | 4-15-2043 | | | | 1,751,430 | | | | 1,798,582 | |
JPMorgan Chase Commercial Mortgage Securities Corporation Series 2006-LDP7 Class A4 ± | | | 5.88 | | | | 4-15-2045 | | | | 2,200,000 | | | | 2,286,053 | |
JPMorgan Chase Commercial Mortgage Securities Corporation Series 2014-INN Class A 144A± | | | 1.09 | | | | 6-15-2029 | | | | 15,000,000 | | | | 14,963,625 | |
JPMorgan Chase Commercial Mortgage Securities Corporation Series 2014-PHH Class A 144A± | | | 1.37 | | | | 8-15-2027 | | | | 10,000,000 | | | | 9,994,740 | |
Lehman Brothers UBS Commercial Mortgage Trust Series 2005-C5 Class 4 | | | 4.95 | | | | 9-15-2030 | | | | 4,637,811 | | | | 4,649,318 | |
Lehman Brothers UBS Commercial Mortgage Trust Series 2007-C2 Class A3 | | | 5.43 | | | | 2-15-2040 | | | | 2,907,729 | | | | 3,094,327 | |
Lehman Brothers UBS Commercial Mortgage Trust Series 2007-C6 Class A4 ± | | | 5.86 | | | | 7-15-2040 | | | | 950,796 | | | | 999,588 | |
Master Mortgages Trust Series 2002-3 Class 4A1 ± | | | 2.50 | | | | 10-25-2032 | | | | 18,762 | | | | 18,720 | |
Morgan Stanley Capital I Series 2005-IQ10 Class A4A ± | | | 5.23 | | | | 9-15-2042 | | | | 4,452,026 | | | | 4,484,508 | |
Morgan Stanley Capital I Series 2005-T19 Class A4A | | | 4.89 | | | | 6-12-2047 | | | | 2,859,956 | | | | 2,872,165 | |
Morgan Stanley Capital I Series 2006-HQ8 Class A4 ± | | | 5.41 | | | | 3-12-2044 | | | | 1,868,385 | | | | 1,903,636 | |
Morgan Stanley Capital I Series 2007-IQ Class A4 | | | 5.81 | | | | 12-12-2049 | | | | 7,661,537 | | | | 8,309,480 | |
Morgan Stanley Mortgage Trust Series 35 Class 2 ±(w)(i) | | | 15,318.50 | | | | 4-20-2021 | | | | 7 | | | | 423 | |
NCUA Guaranteed Notes Program Series 2010-C1 Class A1 | | | 1.60 | | | | 10-29-2020 | | | | 3,404,142 | | | | 3,409,738 | |
NCUA Guaranteed Notes Program Series 2010-C1 Class APT | | | 2.65 | | | | 10-29-2020 | | | | 5,183,863 | | | | 5,246,142 | |
NCUA Guaranteed Notes Program Series 2010-R1 Class 2A | | | 1.84 | | | | 10-7-2020 | | | | 303,047 | | | | 304,691 | |
Prudential Home Mortgage Securities Series 1988-1 Class A ± | | | 2.46 | | | | 4-25-2018 | | | | 12,158 | | | | 12,291 | |
Resecuritization Mortgage Trust Series 1998-B Class A 144A± | | | 0.42 | | | | 4-26-2021 | | | | 8,859 | | | | 8,410 | |
Salomon Brothers Mortgage Securities VII Series 1990-2 Class A ± | | | 2.51 | | | | 11-25-2020 | | | | 353,080 | | | | 357,894 | |
SCG Trust Series 2013-SRP1 Class A 144A± | | | 1.56 | | | | 11-15-2026 | | | | 7,500,000 | | | | 7,500,255 | |
Springleaf Mortgage Loan Trust Series 2012-2A Class A 144A± | | | 2.22 | | | | 10-25-2057 | | | | 1,684,110 | | | | 1,705,723 | |
Structured Asset Mortgage Investments Incorporated Series 2001-4 Class A2 ± | | | 9.44 | | | | 10-25-2024 | | | | 94,114 | | | | 97,380 | |
Structured Asset Securities Corporation Series 1998-2 Class A ± | | | 0.69 | | | | 2-25-2028 | | | | 198,453 | | | | 195,863 | |
UBS Barclays Commercial Mortgage Trust Series 2012-C2 Class A1 | | | 1.01 | | | | 5-10-2063 | | | | 3,529,737 | | | | 3,531,262 | |
Wilshire Funding Corporation Series 1996-3 Class M2 ± | | | 7.09 | | | | 8-25-2032 | | | | 142,187 | | | | 139,511 | |
Wilshire Funding Corporation Series 1996-3 Class M3 ± | | | 7.09 | | | | 8-25-2032 | | | | 127,677 | | | | 123,019 | |
Wilshire Funding Corporation Series 1998-2 Class M1 ± | | | 2.00 | | | | 12-28-2037 | | | | 612,235 | | | | 597,898 | |
| | | | |
Total Non-Agency Mortgage-Backed Securities (Cost $202,099,675) | | | | | | | | | | | | | | | 201,414,814 | |
| | | | | | | | | | | | | | | | |
| | | | |
Yankee Corporate Bonds and Notes: 12.14% | | | | | | | | | | | | | | | | |
| | | | |
Consumer Staples: 0.96% | | | | | | | | | | | | | | | | |
| | | | |
| Food & Staples Retailing: 0.96% | | | | | | | | | | | | | | | | |
FBG Finance Limited 144A | | | 5.13 | | | | 6-15-2015 | | | | 5,900,000 | | | | 5,977,172 | |
Tesco plc 144A | | | 2.70 | | | | 1-5-2017 | | | | 10,100,000 | | | | 10,136,148 | |
| | | | |
| | | | | | | | | | | | | | | 16,113,320 | |
| | | | | | | | | | | | | | | | |
| | | | |
Energy: 1.45% | | | | | | | | | | | | | | | | |
| | | | |
| Energy Equipment & Services: 0.51% | | | | | | | | | | | | | | | | |
Ensco plc | | | 3.25 | | | | 3-15-2016 | | | | 8,380,000 | | | | 8,523,482 | |
| | | | | | | | | | | | | | | | |
| | | | |
| Oil, Gas & Consumable Fuels: 0.94% | | | | | | | | | | | | | | | | |
BP Capital Markets plc | | | 1.67 | | | | 2-13-2018 | | | | 2,000,000 | | | | 2,005,224 | |
Petrobras Global Finance Company | | | 3.25 | | | | 3-17-2017 | | | | 5,435,000 | | | | 5,063,300 | |
The accompanying notes are an integral part of these financial statements.
| | | | | | |
| Portfolio of investments—February 28, 2015 (unaudited) | | Wells Fargo Advantage Ultra Short-Term Income Fund | | | 19 | |
| | | | | | | | | | | | | | | | |
| Security name | | Interest rate | | | Maturity date | | | Principal | | | Value | |
| | | | |
| Oil, Gas & Consumable Fuels (continued) | | | | | | | | | | | | | | | | |
Transocean Incorporated | | | 5.05 | % | | | 12-15-2016 | | | $ | 8,765,000 | | | $ | 8,775,956 | |
| | | | |
| | | | | | | | | | | | | | | 15,844,480 | |
| | | | | | | | | | | | | | | | |
| | | | |
| Financial Services: 0.60% | | | | | | | | | | | | | | | | |
Caisse Centrale Desjardins 144A | | | 1.75 | | | | 1-29-2018 | | | | 10,000,000 | | | | 9,971,060 | |
| | | | | | | | | | | | | | | | |
| | | | |
Financials: 6.40% | | | | | | | | | | | | | | | | |
| | | | |
| Banks: 4.16% | | | | | | | | | | | | | | | | |
ABN AMRO Bank NV 144A | | | 1.38 | | | | 1-22-2016 | | | | 9,815,000 | | | | 9,856,812 | |
Banque Federative du Credit Mutuel SA 144A | | | 1.70 | | | | 1-20-2017 | | | | 8,150,000 | | | | 8,203,431 | |
BPCE SA | | | 1.61 | | | | 7-25-2017 | | | | 10,000,000 | | | | 10,028,710 | |
Corporacion Andina De Fomento | | | 3.75 | | | | 1-15-2016 | | | | 2,360,000 | | | | 2,419,170 | |
Experian Finance plc 144A | | | 2.38 | | | | 6-15-2017 | | | | 11,500,000 | | | | 11,558,259 | |
ING Bank NV 144A | | | 1.38 | | | | 3-7-2016 | | | | 8,000,000 | | | | 8,034,160 | |
Royal Bank of Scotland plc | | | 3.95 | | | | 9-21-2015 | | | | 3,000,000 | | | | 3,050,973 | |
Shinhan Bank 144A± | | | 0.90 | | | | 4-8-2017 | | | | 5,000,000 | | | | 5,011,265 | |
Sumitomo Mitsui Banking Corporation | | | 1.35 | | | | 7-11-2017 | | | | 5,000,000 | | | | 4,975,040 | |
Sumitomo Mitsui Banking Corporation | | | 1.75 | | | | 1-16-2018 | | | | 2,500,000 | | | | 2,505,023 | |
Westpac Banking Corporation 144A | | | 5.30 | | | | 10-15-2015 | | | | 4,040,000 | | | | 4,160,481 | |
| | | | |
| | | | | | | | | | | | | | | 69,803,324 | |
| | | | | | | | | | | | | | | | |
| | | | |
| Diversified Financial Services: 0.65% | | | | | | | | | | | | | | | | |
AerCap Ireland Capital Limited 144A | | | 2.75 | | | | 5-15-2017 | | | | 2,600,000 | | | | 2,605,694 | |
Credit Suisse New York | | | 6.00 | | | | 2-15-2018 | | | | 7,500,000 | | | | 8,328,713 | |
| | | | |
| | | | | | | | | | | | | | | 10,934,407 | |
| | | | | | | | | | | | | | | | |
| | | | |
| Insurance: 1.04% | | | | | | | | | | | | | | | | |
Allied World Assurance Company | | | 7.50 | | | | 8-1-2016 | | | | 9,252,000 | | | | 10,020,952 | |
Endurance Specialty Holdings Limited | | | 6.15 | | | | 10-15-2015 | | | | 7,130,000 | | | | 7,345,255 | |
| | | | |
| | | | | | | | | | | | | | | 17,366,207 | |
| | | | | | | | | | | | | | | | |
| | | | |
| Real Estate Management & Development: 0.24% | | | | | | | | | | | | | | | | |
Korea Land & Housing Corporation 144A | | | 1.88 | | | | 8-2-2017 | | | | 4,000,000 | | | | 4,005,960 | |
| | | | | | | | | | | | | | | | |
| | | | |
| Thrifts & Mortgage Finance: 0.31% | | | | | | | | | | | | | | | | |
Korea Finance Corporation | | | 3.25 | | | | 9-20-2016 | | | | 5,000,000 | | | | 5,151,170 | |
| | | | | | | | | | | | | | | | |
| | | | |
Health Care: 1.23% | | | | | | | | | | | | | | | | |
| | | | |
| Pharmaceuticals: 1.23% | | | | | | | | | | | | | | | | |
Actavis Funding SCS | | | 1.30 | | | | 6-15-2017 | | | | 10,171,000 | | | | 10,045,063 | |
Perrigo Company plc | | | 1.30 | | | | 11-8-2016 | | | | 10,550,000 | | | | 10,531,348 | |
| | | | |
| | | | | | | | | | | | | | | 20,576,411 | |
| | | | | | | | | | | | | | | | |
| | | | |
Information Technology: 0.20% | | | | | | | | | | | | | | | | |
| | | | |
| Semiconductors & Semiconductor Equipment: 0.20% | | | | | | | | | | | | | | | | |
TSMC Global Limited 144A | | | 0.95 | | | | 4-3-2016 | | | | 3,385,000 | | | | 3,370,736 | |
| | | | | | | | | | | | | | | | |
| | | | |
Materials: 0.58% | | | | | | | | | | | | | | | | |
| | | | |
| Construction Materials: 0.58% | | | | | | | | | | | | | | | | |
Lafarge SA 144A | | | 6.20 | | | | 7-9-2015 | | | | 9,590,000 | | | | 9,733,850 | |
| | | | | | | | | | | | | | | | |
The accompanying notes are an integral part of these financial statements.
| | | | |
| 20 | | Wells Fargo Advantage Ultra Short-Term Income Fund | | Portfolio of investments—February 28, 2015 (unaudited) |
| | | | | | | | | | | | | | | | |
| Security name | | Interest rate | | | Maturity date | | | Principal | | | Value | |
| | | | |
Telecommunication Services: 0.72% | | | | | | | | | | | | | | | | |
| | | | |
| Diversified Telecommunication Services: 0.48% | | | | | | | | | | | | | | | | |
Telefonica Emisiones SAU | | | 6.42 | % | | | 6-20-2016 | | | $ | 7,500,000 | | | $ | 8,000,618 | |
| | | | | | | | | | | | | | | | |
| | | | |
| Wireless Telecommunication Services: 0.24% | | | | | | | | | | | | | | | | |
America Movil SAB de CV ± | | | 1.24 | | | | 9-12-2016 | | | | 4,000,000 | | | | 4,030,216 | |
| | | | | | | | | | | | | | | | |
| | | | |
Total Yankee Corporate Bonds and Notes (Cost $204,128,290) | | | | | | | | | | | | | | | 203,425,241 | |
| | | | | | | | | | | | | | | | |
| | | | |
| | | Yield | | | | | | Shares | | | | |
| Short-Term Investments: 5.42% | | | | | | | | | | | | | | | | |
| | | | |
| Investment Companies: 5.31% | | | | | | | | | | | | | | | | |
Wells Fargo Advantage Cash Investment Money Market Fund, Select Class (l)(u)## | | | 0.10 | | | | | | | | 88,849,705 | | | | 88,849,705 | |
| | | | | | | | | | | | | | | | |
| | | | |
| | | | | | | | | Principal | | | | |
| U.S. Treasury Securities: 0.11% | | | | | | | | | | | | | | | | |
U.S. Treasury Bill (z)# | | | 0.02 | | | | 3-19-2015 | | | $ | 1,850,000 | | | | 1,849,987 | |
| | | | | | | | | | | | | | | | |
| | | | |
Total Short-Term Investments (Cost $90,699,681) | | | | | | | | | | | | | | | 90,699,692 | |
| | | | | | | | | | | | | | | | |
| | | | | | | | |
| Total investments in securities (Cost $1,700,542,746) * | | | 101.49 | % | | | 1,700,216,440 | |
Other assets and liabilities, net | | | (1.49 | ) | | | (24,902,711 | ) |
| | | | | | | | |
| Total net assets | | | 100.00 | % | | $ | 1,675,313,729 | |
| | | | | | | | |
| 144A | The security may be resold in transactions exempt from registration, normally to qualified institutional buyers, pursuant to Rule 144A under the Securities Act of 1933. |
| ± | Variable rate investment. The rate shown is the rate in effect at period end. |
| %% | The security is issued on a when-issued basis. |
| ¤ | The security is issued in zero coupon form with no periodic interest payments. |
| ## | All or a portion of this security is segregated for when-issued securities. |
| (w) | The security is a structured note which generates income based on a coupon formula (-1,500 * 1 month LIBOR + 15,573.5%) and the prepayment behavior of the underlying collateral. The coupon is subject to a mandatory cap of 15,573.5% and a mandatory floor of 11%. |
| (l) | The security represents an affiliate of the Fund as defined in the Investment Company Act of 1940. |
| (u) | The rate represents the 7-day annualized yield at period end. |
| (z) | Zero coupon security. The rate represents the current yield to maturity. |
| # | All or a portion of this security is segregated as collateral for investments in derivative instruments. |
| * | Cost for federal income tax purposes is $1,699,991,901 and unrealized gains (losses) consists of: |
| | | | |
Gross unrealized gains | | $ | 5,776,627 | |
Gross unrealized losses | | | (5,552,088 | ) |
| | | | |
Net unrealized gains | | $ | 224,539 | |
The accompanying notes are an integral part of these financial statements.
| | | | | | |
| Statement of assets and liabilities—February 28, 2015 (unaudited) | | Wells Fargo Advantage Ultra Short-Term Income Fund | | | 21 | |
| | | | |
| | | | |
| |
Assets | | | | |
Investments | | | | |
In unaffiliated securities, at value (cost $1,611,693,041) | | $ | 1,611,366,735 | |
In affiliated securities, at value (cost $88,849,705) | | | 88,849,705 | |
| | | | |
Total investments, at value (cost $1,700,542,746) | | | 1,700,216,440 | |
Cash | | | 5,220,973 | |
Receivable for investments sold | | | 10,280,893 | |
Principal paydown receivable | | | 504,789 | |
Receivable for Fund shares sold | | | 1,010,060 | |
Receivable for interest | | | 11,520,601 | |
Receivable for daily variation margin on open futures contracts | | | 12,375 | |
Prepaid expenses and other assets | | | 102,077 | |
| | | | |
Total assets | | | 1,728,868,208 | |
| | | | |
| |
Liabilities | | | | |
Dividends payable | | | 631,580 | |
Payable for investments purchased | | | 47,586,115 | |
Payable for Fund shares redeemed | | | 4,411,583 | |
Payable for daily variation margin on open futures contracts | | | 284,599 | |
Advisory fee payable | | | 272,090 | |
Distribution fee payable | | | 4,873 | |
Administration fees payable | | | 213,402 | |
Accrued expenses and other liabilities | | | 150,237 | |
| | | | |
Total liabilities | | | 53,554,479 | |
| | | | |
Total net assets | | $ | 1,675,313,729 | |
| | | | |
| |
NET ASSETS CONSIST OF | | | | |
Paid-in capital | | $ | 1,764,589,976 | |
Overdistributed net investment income | | | (1,633,056 | ) |
Accumulated net realized losses on investments | | | (86,883,690 | ) |
Net unrealized losses on investments | | | (759,501 | ) |
| | | | |
Total net assets | | $ | 1,675,313,729 | |
| | | | |
| |
COMPUTATION OF NET ASSET VALUE AND OFFERING PRICE PER SHARE | | | | |
Net assets – Class A | | $ | 167,793,762 | |
Shares outstanding – Class A1 | | | 19,761,516 | |
Net asset value per share – Class A | | | $8.49 | |
Maximum offering price per share – Class A2 | | | $8.66 | |
Net assets – Class C | | $ | 8,055,952 | |
Shares outstanding – Class C1 | | | 949,850 | |
Net asset value per share – Class C | | | $8.48 | |
Net assets – Administrator Class | | $ | 52,251,702 | |
Shares outstanding – Administrator Class1 | | | 6,177,602 | |
Net asset value per share – Administrator Class | | | $8.46 | |
Net assets – Institutional Class | | $ | 1,162,333,540 | |
Shares outstanding – Institutional Class1 | | | 136,947,331 | |
Net asset value per share – Institutional Class | | | $8.49 | |
Net assets – Investor Class | | $ | 284,878,773 | |
Shares outstanding – Investor Class1 | | | 33,536,919 | |
Net asset value per share – Investor Class | | | $8.49 | |
| 1 | The Fund has an unlimited number of authorized shares. |
| 2 | Maximum offering price is computed as 100/98 of net asset value. On investments of $50,000 or more, the offering price is reduced. |
The accompanying notes are an integral part of these financial statements.
| | | | |
| 22 | | Wells Fargo Advantage Ultra Short-Term Income Fund | | Statement of operations—six months ended February 28, 2015 (unaudited) |
| | | | |
| | | | |
| |
Investment income | | | | |
Interest | | $ | 12,861,444 | |
Income from affiliated securities | | | 47,411 | |
Securities lending income, net | | | 852 | |
| | | | |
Total investment income | | | 12,909,707 | |
| | | | |
| |
Expenses | | | | |
Advisory fee | | | 2,727,825 | |
Administration fees | | | | |
Fund level | | | 473,428 | |
Class A | | | 153,161 | |
Class C | | | 6,862 | |
Administrator Class | | | 40,434 | |
Institutional Class | | | 526,119 | |
Investor Class | | | 282,640 | |
Shareholder servicing fees | | | | |
Class A | | | 239,315 | |
Class C | | | 10,722 | |
Administrator Class | | | 100,011 | |
Investor Class | | | 371,103 | |
Distribution fee | | | | |
Class C | | | 32,166 | |
Custody and accounting fees | | | 53,423 | |
Professional fees | | | 36,012 | |
Registration fees | | | 43,529 | |
Shareholder report expenses | | | 39,286 | |
Trustees’ fees and expenses | | | 4,795 | |
Other fees and expenses | | | 13,373 | |
| | | | |
Total expenses | | | 5,154,204 | |
Less: Fee waivers and/or expense reimbursements | | | (811,856 | ) |
| | | | |
Net expenses | | | 4,342,348 | |
| | | | |
Net investment income | | | 8,567,359 | |
| | | | |
| |
REALIZED AND UNREALIZED GAINS (LOSSES) ON INVESTMENTS | | | | |
| |
Net realized losses on: | | | | |
Unaffiliated securities | | | (402,873 | ) |
Futures transactions | | | (3,540,109 | ) |
| | | | |
Net realized losses on investments | | | (3,942,982 | ) |
| | | | |
| |
Net change in unrealized gains (losses) on: | | | | |
Unaffiliated securities | | | (4,850,769 | ) |
Futures transactions | | | 117,650 | |
| | | | |
Net change in unrealized gains (losses) on investments | | | (4,733,119 | ) |
| | | | |
Net realized and unrealized gains (losses) on investments | | | (8,676,101 | ) |
| | | | |
Net decrease in net assets resulting from operations | | $ | (108,742 | ) |
| | | | |
The accompanying notes are an integral part of these financial statements.
| | | | | | |
| Statement of changes in net assets | | Wells Fargo Advantage Ultra Short-Term Income Fund | | | 23 | |
| | | | | | | | | | | | | | | | |
| | | Six months ended
February 28, 2015
(unaudited) | | | Year ended
August 31, 2014 | |
| | | |
Operations | | | | | | | | | | | | |
Net investment income | | | | | | $ | 8,567,359 | | | | | | | $ | 16,905,144 | |
Net realized losses on investments | | | | | | | (3,942,982 | ) | | | | | | | (3,098,045 | ) |
Net change in unrealized gains (losses) on investments | | | | | | | (4,733,119 | ) | | | | | | | 4,121,513 | |
| | | | |
Net increase (decrease) in net assets resulting from operations | | | | | | | (108,742 | ) | | | | | | | 17,928,612 | |
| | | | |
| | | |
Distributions to shareholders from | | | | | | | | | | | | |
Net investment income | | | | | | | | | | | | | | | | |
Class A | | | | | | | (718,308 | ) | | | | | | | (1,311,025 | ) |
Class C | | | | | | | (384 | ) | | | | | | | (4,885 | ) |
Administrator Class | | | | | | | (365,760 | ) | | | | | | | (1,089,252 | ) |
Institutional Class | | | | | | | (7,264,643 | ) | | | | | | | (12,933,549 | ) |
Investor Class | | | | | | | (1,078,153 | ) | | | | | | | (2,280,773 | ) |
| | | | |
Total distributions to shareholders | | | | | | | (9,427,248 | ) | | | | | | | (17,619,484 | ) |
| | | | |
| | | | | | | | | | | | |
| | | | |
Capital share transactions | | | Shares | | | | | | | | Shares | | | | | |
Proceeds from shares sold | | | | | | | | | | | | | | | | |
Class A | | | 7,906,269 | | | | 67,291,806 | | | | 19,620,269 | | | | 167,527,734 | |
Class C | | | 153,402 | | | | 1,303,865 | | | | 160,363 | | | | 1,367,745 | |
Administrator Class | | | 2,050,238 | | | | 17,386,974 | | | | 13,855,490 | | | | 117,870,044 | |
Institutional Class | | | 84,905,168 | | | | 722,045,317 | | | | 200,951,647 | | | | 1,715,174,083 | |
Investor Class | | | 3,029,162 | | | | 25,777,633 | | | | 9,811,002 | | | | 83,805,971 | |
| | | | |
| | | | | | | 833,805,595 | | | | | | | | 2,085,745,577 | |
| | | | |
Reinvestment of distributions | | | | | | | | | | | | | | | | |
Class A | | | 81,573 | | | | 693,515 | | | | 148,168 | | | | 1,264,904 | |
Class C | | | 43 | | | | 363 | | | | 549 | | | | 4,687 | |
Administrator Class | | | 30,114 | | | | 255,085 | | | | 67,702 | | | | 575,851 | |
Institutional Class | | | 321,201 | | | | 2,730,386 | | | | 590,277 | | | | 5,037,910 | |
Investor Class | | | 122,061 | | | | 1,037,731 | | | | 256,307 | | | | 2,188,945 | |
| | | | |
| | | | | | | 4,717,080 | | | | | | | | 9,072,297 | |
| | | | |
Payment for shares redeemed | | | | | | | | | | | | | | | | |
Class A | | | (11,252,562 | ) | | | (95,702,677 | ) | | | (15,311,490 | ) | | | (130,736,274 | ) |
Class C | | | (268,915 | ) | | | (2,284,592 | ) | | | (487,060 | ) | | | (4,154,932 | ) |
Administrator Class | | | (10,006,109 | ) | | | (84,846,091 | ) | | | (16,944,553 | ) | | | (144,114,902 | ) |
Institutional Class | | | (114,576,455 | ) | | | (973,856,880 | ) | | | (152,147,868 | ) | | | (1,298,604,917 | ) |
Investor Class | | | (6,284,014 | ) | | | (53,457,360 | ) | | | (12,513,153 | ) | | | (106,880,999 | ) |
| | | | |
| | | | | | | (1,210,147,600 | ) | | | | | | | (1,684,492,024 | ) |
| | | | |
Net increase (decrease) in net assets resulting from capital share transactions | | | | | | | (371,624,925 | ) | | | | | | | 410,325,850 | |
| | | | |
Total increase (decrease) in net assets | | | | | | | (381,160,915 | ) | | | | | | | 410,634,978 | |
| | | | |
| | |
Net assets | | | | | | | | |
Beginning of period | | | | | | | 2,056,474,644 | | | | | | | | 1,645,839,666 | |
| | | | |
End of period | | | | | | $ | 1,675,313,729 | | | | | | | $ | 2,056,474,644 | |
| | | | |
Overdistributed net investment income | | | | | | $ | (1,633,056 | ) | | | | | | $ | (773,167 | ) |
| | | | |
The accompanying notes are an integral part of these financial statements.
| | | | |
| 24 | | Wells Fargo Advantage Ultra Short-Term Income Fund | | Financial highlights |
(For a share outstanding throughout each period)
| | | | | | | | | | | | | | | | | | | | | | | | | | | | |
| | | Six months ended
February 28, 2015 (unaudited) | | | Year ended August 31 | | | Year ended May 31, 2010 | |
| CLASS A | | | 2014 | | | 2013 | | | 2012 | | | 2011 | | | 20101 | | |
Net asset value, beginning of period | | | $8.53 | | | | $8.53 | | | | $8.55 | | | | $8.52 | | | | $8.52 | | | | $8.48 | | | | $8.03 | |
Net investment income | | | 0.03 | | | | 0.06 | | | | 0.06 | | | | 0.10 | | | | 0.10 | | | | 0.04 | | | | 0.17 | |
Net realized and unrealized gains (losses) on investments | | | (0.04 | ) | | | 0.00 | | | | (0.02 | ) | | | 0.03 | | | | 0.02 | | | | 0.04 | | | | 0.48 | |
| | | | | | | | | | | | | | | | | | | | | | | | | | | | |
Total from investment operations | | | (0.01 | ) | | | 0.06 | | | | 0.04 | | | | 0.13 | | | | 0.12 | | | | 0.08 | | | | 0.65 | |
Distributions to shareholders from | | | | | | | | | | | | | | | | | | | | | | | | |
Net investment income | | | (0.03 | ) | | | (0.06 | ) | | | (0.06 | ) | | | (0.10 | ) | | | (0.12 | ) | | | (0.04 | ) | | | (0.20 | ) |
Net asset value, end of period | | | $8.49 | | | | $8.53 | | | | $8.53 | | | | $8.55 | | | | $8.52 | | | | $8.52 | | | | $8.48 | |
Total return2 | | | (0.10 | )% | | | 0.74 | % | | | 0.52 | % | | | 1.47 | % | | | 1.37 | % | | | 0.94 | % | | | 8.22 | % |
Ratios to average net assets (annualized) | | | | | | | | | | | | | | | | | | | | | | | | |
Gross expenses | | | 0.77 | % | | | 0.78 | % | | | 0.83 | % | | | 0.88 | % | | | 0.87 | % | | | 0.88 | % | | | 0.91 | % |
Net expenses | | | 0.70 | % | | | 0.70 | % | | | 0.70 | % | | | 0.70 | % | | | 0.70 | % | | | 0.70 | % | | | 0.70 | % |
Net investment income | | | 0.66 | % | | | 0.70 | % | | | 0.72 | % | | | 1.11 | % | | | 1.17 | % | | | 1.62 | % | | | 1.98 | % |
Supplemental data | | | | | | | | | | | | | | | | | | | | | | | | |
Portfolio turnover rate | | | 31 | % | | | 47 | % | | | 56 | % | | | 61 | % | | | 60 | % | | | 9 | % | | | 45 | % |
Net assets, end of period (000s omitted) | | | $167,794 | | | | $196,459 | | | | $158,363 | | | | $146,400 | | | | $160,768 | | | | $208,845 | | | | $154,016 | |
| 1 | For the three months ended August 31, 2010. The Fund changed its fiscal year end from May 31 to August 31, effective August 31, 2010. |
| 2 | Total return calculations do not include any sales charges. Returns for periods of less than one year are not annualized. |
The accompanying notes are an integral part of these financial statements.
| | | | | | |
| Financial highlights | | Wells Fargo Advantage Ultra Short-Term Income Fund | | | 25 | |
(For a share outstanding throughout each period)
| | | | | | | | | | | | | | | | | | | | | | | | | | | | |
| | | Six months ended
February 28, 2015 (unaudited) | | | Year ended August 31 | | | Year ended May 31, 2010 | |
| CLASS C | | | 2014 | | | 2013 | | | 2012 | | | 2011 | | | 20101 | | |
Net asset value, beginning of period | | | $8.52 | | | | $8.52 | | | | $8.55 | | | | $8.52 | | | | $8.52 | | | | $8.48 | | | | $8.03 | |
Net investment income (loss) | | | (0.01 | ) | | | (0.01 | ) | | | (0.00 | )2 | | | 0.03 | | | | 0.04 | | | | 0.02 | | | | 0.12 | |
Net realized and unrealized gains (losses) on investments | | | (0.03 | ) | | | 0.01 | | | | (0.03 | ) | | | 0.03 | | | | 0.01 | | | | 0.04 | | | | 0.47 | |
| | | | | | | | | | | | | | | | | | | | | | | | | | | | |
Total from investment operations | | | (0.04 | ) | | | 0.00 | | | | (0.03 | ) | | | 0.06 | | | | 0.05 | | | | 0.06 | | | | 0.59 | |
Distributions to shareholders from | | | | | | | | | | | | | | | | | | | | | | | | |
Net investment income | | | (0.00 | )2 | | | (0.00 | )2 | | | (0.00 | )2 | | | (0.03 | ) | | | (0.05 | ) | | | (0.02 | ) | | | (0.14 | ) |
Net asset value, end of period | | | $8.48 | | | | $8.52 | | | | $8.52 | | | | $8.55 | | | | $8.52 | | | | $8.52 | | | | $8.48 | |
Total return3 | | | (0.47 | )% | | | 0.05 | % | | | (0.31 | )% | | | 0.71 | % | | | 0.61 | % | | | 0.75 | % | | | 7.41 | % |
Ratios to average net assets (annualized) | | | | | | | | | | | | | | | | | | | | | | | | |
Gross expenses | | | 1.52 | % | | | 1.53 | % | | | 1.59 | % | | | 1.63 | % | | | 1.62 | % | | | 1.63 | % | | | 1.67 | % |
Net expenses | | | 1.45 | % | | | 1.45 | % | | | 1.45 | % | | | 1.45 | % | | | 1.45 | % | | | 1.45 | % | | | 1.45 | % |
Net investment income (loss) | | | (0.08 | )% | | | (0.05 | )% | | | (0.02 | )% | | | 0.37 | % | | | 0.43 | % | | | 0.88 | % | | | 1.30 | % |
Supplemental data | | | | | | | | | | | | | | | | | | | | | | | | |
Portfolio turnover rate | | | 31 | % | | | 47 | % | | | 56 | % | | | 61 | % | | | 60 | % | | | 9 | % | | | 45 | % |
Net assets, end of period (000s omitted) | | | $8,056 | | | | $9,078 | | | | $11,859 | | | | $14,951 | | | | $19,117 | | | | $21,226 | | | | $16,519 | |
| 1 | For the three months ended August 31, 2010. The Fund changed its fiscal year end from May 31 to August 31, effective August 31, 2010. |
| 2 | Amount is less than $0.005. |
| 3 | Total return calculations do not include any sales charges. Returns for periods of less than one year are not annualized. |
The accompanying notes are an integral part of these financial statements.
| | | | |
| 26 | | Wells Fargo Advantage Ultra Short-Term Income Fund | | Financial highlights |
(For a share outstanding throughout each period)
| | | | | | | | | | | | | | | | | | | | | | | | | | | | |
| | | Six months ended
February 28, 2015 (unaudited) | | | Year ended August 31 | | | Year ended May 31, 2010 | |
| ADMINISTRATOR CLASS | | | 2014 | | | 2013 | | | 2012 | | | 2011 | | | 20101 | | |
Net asset value, beginning of period | | | $8.50 | | | | $8.50 | | | | $8.52 | | | | $8.48 | | | | $8.48 | | | | $8.45 | | | | $8.00 | |
Net investment income | | | 0.04 | 2 | | | 0.07 | | | | 0.07 | | | | 0.11 | | | | 0.11 | | | | 0.04 | | | | 0.19 | |
Net realized and unrealized gains (losses) on investments | | | (0.04 | ) | | | 0.01 | | | | (0.01 | ) | | | 0.04 | | | | 0.02 | | | | 0.03 | | | | 0.46 | |
| | | | | | | | | | | | | | | | | | | | | | | | | | | | |
Total from investment operations | | | 0.00 | | | | 0.08 | | | | 0.06 | | | | 0.15 | | | | 0.13 | | | | 0.07 | | | | 0.65 | |
Distributions to shareholders from | | | | | | | | | | | | | | | | | | | | | | | | |
Net investment income | | | (0.04 | ) | | | (0.08 | ) | | | (0.08 | ) | | | (0.11 | ) | | | (0.13 | ) | | | (0.04 | ) | | | (0.20 | ) |
Net asset value, end of period | | | $8.46 | | | | $8.50 | | | | $8.50 | | | | $8.52 | | | | $8.48 | | | | $8.48 | | | | $8.45 | |
Total return3 | | | (0.02 | )% | | | 0.89 | % | | | 0.67 | % | | | 1.74 | % | | | 1.52 | % | | | 0.86 | % | | | 8.41 | % |
Ratios to average net assets (annualized) | | | | | | | | | | | | | | | | | | | | | | | | |
Gross expenses | | | 0.71 | % | | | 0.72 | % | | | 0.77 | % | | | 0.82 | % | | | 0.79 | % | | | 0.79 | % | | | 0.81 | % |
Net expenses | | | 0.55 | % | | | 0.55 | % | | | 0.55 | % | | | 0.55 | % | | | 0.55 | % | | | 0.55 | % | | | 0.55 | % |
Net investment income | | | 0.82 | % | | | 0.84 | % | | | 0.87 | % | | | 1.26 | % | | | 1.33 | % | | | 1.65 | % | | | 2.32 | % |
Supplemental data | | | | | | | | | | | | | | | | | | | | | | | | |
Portfolio turnover rate | | | 31 | % | | | 47 | % | | | 56 | % | | | 61 | % | | | 60 | % | | | 9 | % | | | 45 | % |
Net assets, end of period (000s omitted) | | | $52,252 | | | | $119,884 | | | | $145,498 | | | | $103,810 | | | | $107,449 | | | | $205,587 | | | | $82,835 | |
| 1 | For the three months ended August 31, 2010. The Fund changed its fiscal year end from May 31 to August 31, effective August 31, 2010. |
| 2 | Calculated based upon average shares outstanding |
| 3 | Returns for periods of less than one year are not annualized. |
The accompanying notes are an integral part of these financial statements.
| | | | | | |
| Financial highlights | | Wells Fargo Advantage Ultra Short-Term Income Fund | | | 27 | |
(For a share outstanding throughout each period)
| | | | | | | | | | | | | | | | | | | | | | | | | | | | |
| | | Six months ended
February 28, 2015 (unaudited) | | | Year ended August 31 | | | Year ended May 31, 2010 | |
| INSTITUTIONAL CLASS | | | 2014 | | | 2013 | | | 2012 | | | 2011 | | | 20101 | | |
Net asset value, beginning of period | | | $8.53 | | | | $8.52 | | | | $8.55 | | | | $8.51 | | | | $8.51 | | | | $8.48 | | | | $8.03 | |
Net investment income | | | 0.04 | | | | 0.09 | | | | 0.09 | | | | 0.13 | | | | 0.13 | | | | 0.04 | | | | 0.19 | |
Net realized and unrealized gains (losses) on investments | | | (0.03 | ) | | | 0.01 | | | | (0.03 | ) | | | 0.04 | | | | 0.02 | | | | 0.04 | | | | 0.49 | |
| | | | | | | | | | | | | | | | | | | | | | | | | | | | |
Total from investment operations | | | 0.01 | | | | 0.10 | | | | 0.06 | | | | 0.17 | | | | 0.15 | | | | 0.08 | | | | 0.68 | |
Distributions to shareholders from | | | | | | | | | | | | | | | | | | | | | | | | |
Net investment income | | | (0.05 | ) | | | (0.09 | ) | | | (0.09 | ) | | | (0.13 | ) | | | (0.15 | ) | | | (0.05 | ) | | | (0.23 | ) |
Net asset value, end of period | | | $8.49 | | | | $8.53 | | | | $8.52 | | | | $8.55 | | | | $8.51 | | | | $8.51 | | | | $8.48 | |
Total return2 | | | 0.08 | % | | | 1.21 | % | | | 0.75 | % | | | 1.94 | % | | | 1.72 | % | | | 1.03 | % | | | 8.48 | % |
Ratios to average net assets (annualized) | | | | | | | | | | | | | | | | | | | | | | | | |
Gross expenses | | | 0.44 | % | | | 0.45 | % | | | 0.50 | % | | | 0.55 | % | | | 0.54 | % | | | 0.54 | % | | | 0.57 | % |
Net expenses | | | 0.35 | % | | | 0.35 | % | | | 0.35 | % | | | 0.35 | % | | | 0.35 | % | | | 0.35 | % | | | 0.35 | % |
Net investment income | | | 1.01 | % | | | 1.05 | % | | | 1.07 | % | | | 1.46 | % | | | 1.50 | % | | | 2.01 | % | | | 2.26 | % |
Supplemental data | | | | | | | | | | | | | | | | | | | | | | | | |
Portfolio turnover rate | | | 31 | % | | | 47 | % | | | 56 | % | | | 61 | % | | | 60 | % | | | 9 | % | | | 45 | % |
Net assets, end of period (000s omitted) | | | $1,162,334 | | | | $1,418,101 | | | | $996,437 | | | | $588,228 | | | | $596,838 | | | | $260,747 | | | | $197,087 | |
| 1 | For the three months ended August 31, 2010. The Fund changed its fiscal year end from May 31 to August 31, effective August 31, 2010. |
| 2 | Returns for periods of less than one year are not annualized. |
The accompanying notes are an integral part of these financial statements.
| | | | |
| 28 | | Wells Fargo Advantage Ultra Short-Term Income Fund | | Financial highlights |
(For a share outstanding throughout each period)
| | | | | | | | | | | | | | | | | | | | | | | | | | | | |
| | | Six months ended
February 28, 2015 (unaudited) | | | Year ended August 31 | | | Year ended May 31, 2010 | |
| INVESTOR CLASS | | | 2014 | | | 2013 | | | 2012 | | | 2011 | | | 20101 | | |
Net asset value, beginning of period | | | $8.53 | | | | $8.53 | | | | $8.56 | | | | $8.52 | | | | $8.52 | | | | $8.48 | | | | $8.03 | |
Net investment income | | | 0.03 | | | | 0.06 | | | | 0.06 | | | | 0.09 | | | | 0.10 | | | | 0.04 | | | | 0.18 | |
Net realized and unrealized gains (losses) on investments | | | (0.04 | ) | | | 0.00 | | | | (0.03 | ) | | | 0.04 | | | | 0.01 | | | | 0.04 | | | | 0.47 | |
| | | | | | | | | | | | | | | | | | | | | | | | | | | | |
Total from investment operations | | | (0.01 | ) | | | 0.06 | | | | 0.03 | | | | 0.13 | | | | 0.11 | | | | 0.08 | | | | 0.65 | |
Distributions to shareholders from | | | | | | | | | | | | | | | | | | | | | | | | |
Net investment income | | | (0.03 | ) | | | (0.06 | ) | | | (0.06 | ) | | | (0.09 | ) | | | (0.11 | ) | | | (0.04 | ) | | | (0.20 | ) |
Net asset value, end of period | | | $8.49 | | | | $8.53 | | | | $8.53 | | | | $8.56 | | | | $8.52 | | | | $8.52 | | | | $8.48 | |
Total return2 | | | (0.11 | )% | | | 0.71 | % | | | 0.37 | % | | | 1.56 | % | | | 1.34 | % | | | 0.93 | % | | | 8.18 | % |
Ratios to average net assets (annualized) | | | | | | | | | | | | | | | | | | | | | | | | |
Gross expenses | | | 0.80 | % | | | 0.81 | % | | | 0.87 | % | | | 0.91 | % | | | 0.90 | % | | | 0.92 | % | | | 0.98 | % |
Net expenses | | | 0.73 | % | | | 0.73 | % | | | 0.73 | % | | | 0.73 | % | | | 0.73 | % | | | 0.74 | % | | | 0.75 | % |
Net investment income | | | 0.64 | % | | | 0.67 | % | | | 0.69 | % | | | 1.08 | % | | | 1.15 | % | | | 1.66 | % | | | 2.16 | % |
Supplemental data | | | | | | | | | | | | | | | | | | | | | | | | |
Portfolio turnover rate | | | 31 | % | | | 47 | % | | | 56 | % | | | 61 | % | | | 60 | % | | | 9 | % | | | 45 | % |
Net assets, end of period (000s omitted) | | | $284,879 | | | | $312,953 | | | | $333,684 | | | | $351,969 | | | | $384,998 | | | | $436,991 | | | | $453,772 | |
| 1 | For the three months ended August 31, 2010. The Fund changed its fiscal year end from May 31 to August 31, effective August 31, 2010. |
| 2 | Returns for periods of less than one year are not annualized. |
The accompanying notes are an integral part of these financial statements.
| | | | | | |
| Notes to financial statements (unaudited) | | Wells Fargo Advantage Ultra Short-Term Income Fund | | | 29 | |
1. ORGANIZATION
Wells Fargo Funds Trust (the “Trust”), a Delaware statutory trust organized on March 10, 1999, is an open-end management investment company registered under the Investment Company Act of 1940, as amended (the “1940 Act”). As an investment company, the Trust follows the accounting and reporting guidance in Financial Accounting Standards Board (“FASB”) Accounting Standards Codification Topic 946, Financial Services—Investment Companies. These financial statements report on the Wells Fargo Advantage Ultra Short-Term Income Fund (the “Fund”) which is a diversified series of the Trust.
2. SIGNIFICANT ACCOUNTING POLICIES
The following significant accounting policies, which are consistently followed in the preparation of the financial statements of the Fund, are in conformity with U.S. generally accepted accounting principles which require management to make estimates and assumptions that affect the reported amounts of assets and liabilities, disclosure of contingent assets and liabilities at the date of the financial statements, and the reported amounts of revenues and expenses during the reporting period. Actual results could differ from those estimates.
Securities valuation
All investments are valued each business day as of the close of regular trading on the New York Stock Exchange (generally 4 p.m. Eastern Time).
Debt securities are valued at the evaluated bid price provided by an independent pricing service or, if a reliable price is not available, the quoted bid price from an independent broker-dealer.
Futures that are listed on a foreign or domestic exchange or market are valued at the official closing price or, if none, the last sales price.
Investments in registered open-end investment companies are valued at net asset value. Interests in non-registered investment vehicles that are redeemable at net asset value are fair valued at net asset value when available.
Investments which are not valued using any of the methods discussed above are valued at their fair value, as determined in good faith by the Board of Trustees of the Fund. The Board of Trustees has established a Valuation Committee comprised of the Trustees and has delegated to it the authority to take any actions regarding the valuation of portfolio securities that the Valuation Committee deems necessary or appropriate, including determining the fair value of portfolio securities, unless the determination has been delegated to the Management Valuation Team of Wells Fargo Funds Management, LLC (“Funds Management”). The Board of Trustees retains the authority to make or ratify any valuation decisions or approve any changes to the Valuation Procedures as it deems appropriate. On a quarterly basis, the Board of Trustees receives reports on any valuation actions taken by the Valuation Committee or the Management Valuation Team which may include items for ratification.
Valuations of fair valued securities are compared to the next actual sales price when available, or other appropriate market values, to assess the continued appropriateness of the fair valuation methodologies used. These securities are fair valued on a day-to-day basis, taking into consideration changes to appropriate market information and any significant changes to the inputs considered in the valuation process until there is a readily available price provided on an exchange or by an independent pricing service. Valuations received from an independent pricing service or independent broker-dealer quotes are periodically validated by comparisons to most recent trades and valuations provided by other independent pricing services in addition to the review of prices by the adviser and/or subadviser. Unobservable inputs used in determining fair valuations are identified based on the type of security, taking into consideration factors utilized by market participants in valuing the investment, knowledge about the issuer and the current market environment.
Security loans
The Fund may lend its securities from time to time in order to earn additional income in the form of fees or interest on securities received as collateral or the investment of any cash received as collateral. The Fund continues to receive interest or dividends on the securities loaned. The Fund receives collateral in the form of cash or securities with a value at least equal to the value of the securities on loan. The value of the loaned securities is determined at the close of each business day and any additional required collateral is delivered to the Fund on the next business day. In a securities lending transaction, the net asset value of the Fund will be affected by an increase or decrease in the value of the securities loaned and by an increase or decrease in the value of the instrument in which collateral is invested. The amount of securities lending activity undertaken by the Fund fluctuates from time to time. In the event of default or bankruptcy by the borrower, the Fund may be prevented from recovering the loaned securities or gaining access to the collateral or may experience delays or costs in doing so. In addition, the investment of any cash collateral received may lose all or part of its value. The Fund has the right under the lending agreement to recover the securities from the borrower on demand.
| | | | |
| 30 | | Wells Fargo Advantage Ultra Short-Term Income Fund | | Notes to financial statements (unaudited) |
The Fund lends its securities through an unaffiliated securities lending agent. Cash collateral received in connection with its securities lending transactions is invested in Securities Lending Cash Investments, LLC (the “Securities Lending Fund”). The Securities Lending Fund is exempt from registration under Section 3(c)(7) of the 1940 Act and is managed by Funds Management and is subadvised by Wells Capital Management Incorporated (“WellsCap”). Funds Management receives an advisory fee starting at 0.05% and declining to 0.01% as the average daily net assets of the Securities Lending Fund increase. All of the fees received by Funds Management are paid to WellsCap for its services as subadviser. The Securities Lending Fund seeks to provide a positive return compared to the daily Fed Funds Open rate by investing in high-quality, U.S. dollar-denominated short-term money market instruments. Securities Lending Fund investments are fair valued based upon the amortized cost valuation technique. Income earned from investment in the Securities Lending Fund is included in securities lending income on the Statement of Operations.
When-issued transactions
The Fund may purchase securities on a forward commitment or when-issued basis. The Fund records a when-issued transaction on the trade date and will segregate assets in an amount at least equal in value to the Fund’s commitment to purchase when-issued securities. Securities purchased on a when-issued basis are marked-to-market daily and the Fund begins earning interest on the settlement date. Losses may arise due to changes in the market value of the underlying securities or if the counterparty does not perform under the contract.
Futures contracts
The Fund is subject to interest rate risk in the normal course of pursuing its investment objectives. The Fund may buy and sell futures contracts in order to gain exposure to, or protect against, changes in security values and interest rates. The primary risks associated with the use of futures contracts are the imperfect correlation between changes in market values of securities held by the Fund and the prices of futures contracts, and the possibility of an illiquid market.
The aggregate principal amounts of the contracts are not recorded in the financial statements. Fluctuations in the value of the contracts are recorded in the Statement of Assets and Liabilities as an asset or liability and in the Statement of Operations as unrealized gains or losses until the contracts are closed, at which point they are recorded as net realized gains or losses on futures contracts. With futures contracts, there is minimal counterparty risk to the Fund since futures are exchange traded and the exchange’s clearinghouse, as counterparty to all exchange traded futures, guarantees the futures against default.
Security transactions and income recognition
Securities transactions are recorded on a trade date basis. Realized gains or losses are recorded on the basis of identified cost.
Interest income is accrued daily and bond discounts are accreted and premiums are amortized daily based on the effective interest method. To the extent debt obligations are placed on non-accrual status, any related interest income may be reduced by writing off interest receivables when the collection of all or a portion of interest has become doubtful based on consistently applied procedures. If the issuer subsequently resumes interest payments or when the collectability of interest is reasonably assured, the debt obligation is removed from non-accrual status.
Distributions to shareholders
Distributions to shareholders from net investment income are accrued daily and paid monthly. Distributions from net realized gains, if any, are recorded on the ex-dividend date. Such distributions are determined in conformity with federal income tax regulations, which may differ in amount or character from net investment income and realized gains recognized for purposes of U.S. generally accepted accounting principles.
Federal and other taxes
The Fund intends to continue to qualify as a regulated investment company by distributing substantially all of its investment company taxable income and any net realized capital gains (after reduction for capital loss carryforwards) sufficient to relieve it from all, or substantially all, federal income taxes. Accordingly, no provision for federal income taxes was required.
The Fund’s income and federal excise tax returns and all financial records supporting those returns for the prior three fiscal years are subject to examination by the federal and Delaware revenue authorities. Management has analyzed the Fund’s tax positions taken on federal, state, and foreign tax returns for all open tax years and does not believe that there are any uncertain tax positions that require recognition of a tax liability.
| | | | | | |
| Notes to financial statements (unaudited) | | Wells Fargo Advantage Ultra Short-Term Income Fund | | | 31 | |
Capital loss carryforwards that do not expire are required to be utilized prior to capital loss carryforwards that expire. As of August 31, 2014, capital loss carryforwards available to offset future net realized capital gains were as follows through the indicated expiration dates:
| | | | | | | | | | | | |
| | | | | | | | | | | No expiration |
| 2015 | | 2016 | | 2017 | | 2018 | | 2019 | | Short-term | | Long-term |
| $2,154,408 | | $8,848,032 | | $35,029,445 | | $7,738,751 | | $7,448,920 | | $1,262,457 | | $20,608,750 |
As of August 31, 2014, the Fund had $400,790 of current year deferred post-October capital losses, which was recognized on the first day of the current fiscal year.
Class allocations
The separate classes of shares offered by the Fund differ principally in applicable sales charges, distribution, shareholder servicing, and administration fees. Class specific expenses are charged directly to that share class. Investment income, common expenses, and realized and unrealized gains (losses) on investments are allocated daily to each class of shares based on the relative proportion of net assets of each class.
3. FAIR VALUATION MEASUREMENTS
Fair value measurements of investments are determined within a framework that has established a fair value hierarchy based upon the various data inputs utilized in determining the value of the Fund’s investments. The three-level hierarchy gives the highest priority to unadjusted quoted prices in active markets for identical assets or liabilities (Level 1) and the lowest priority to significant unobservable inputs (Level 3). The Fund’s investments are classified within the fair value hierarchy based on the lowest level of input that is significant to the fair value measurement. The inputs are summarized into three broad levels as follows:
| n | | Level 1 – quoted prices in active markets for identical securities |
| n | | Level 2 – other significant observable inputs (including quoted prices for similar securities, interest rates, prepayment speeds, credit risk, use of amortized cost, etc.) |
| n | | Level 3 – significant unobservable inputs (including the Fund’s own assumptions in determining the fair value of investments) |
The inputs or methodologies used for valuing investments in securities are not necessarily an indication of the risk associated with investing in those securities.
| | | | |
| 32 | | Wells Fargo Advantage Ultra Short-Term Income Fund | | Notes to financial statements (unaudited) |
The following is a summary of the inputs used in valuing the Fund’s assets and liabilities as of February 28, 2015:
| | | | | | | | | | | | | | | | |
| | | Quoted prices (Level 1) | | | Other significant
observable inputs (Level 2) | | | Significant
unobservable inputs
(Level 3) | | | Total | |
Assets | | | | | | | | | | | | | | | | |
Investments in: | | | | | | | | | | | | | | | | |
| | | | |
Agency securities | | $ | 0 | | | $ | 267,228,145 | | | $ | 0 | | | $ | 267,228,145 | |
| | | | |
Asset-backed securities | | | 0 | | | | 195,283,218 | | | | 0 | | | | 195,283,218 | |
| | | | |
Corporate bonds and notes | | | 0 | | | | 678,807,643 | | | | 0 | | | | 678,807,643 | |
| | | | |
Municipal obligations | | | 0 | | | | 63,357,687 | | | | 0 | | | | 63,357,687 | |
| | | | |
Non-agency mortgage-backed securities | | | 0 | | | | 201,414,814 | | | | 0 | | | | 201,414,814 | |
| | | | |
Yankee corporate bonds and notes | | | 0 | | | | 203,425,241 | | | | 0 | | | | 203,425,241 | |
| | | | |
Short-term investments | | | | | | | | | | | | | | | | |
Investment companies | | | 88,849,705 | | | | 0 | | | | 0 | | | | 88,849,705 | |
U.S. Treasury securities | | | 1,849,987 | | | | 0 | | | | 0 | | | | 1,849,987 | |
| | | | |
| | | 90,699,692 | | | | 1,609,516,748 | | | | 0 | | | | 1,700,216,440 | |
Futures contracts | | | 12,375 | | | | 0 | | | | 0 | | | | 12,375 | |
Total assets | | $ | 90,712,067 | | | $ | 1,609,516,748 | | | $ | 0 | | | $ | 1,700,228,815 | |
Liabilities | | | | | | | | | | | | | | | | |
Futures contracts | | $ | 284,599 | | | $ | 0 | | | $ | 0 | | | $ | 284,599 | |
Total liabilities | | $ | 284,599 | | | $ | 0 | | | $ | 0 | | | $ | 284,599 | |
Futures contracts are reported at their variation margin at measurement date, which represents the amount due to/from the Fund at that date. All other assets and liabilities are reported at their market value at measurement date.
The Fund recognizes transfers between levels within the fair value hierarchy at the end of the reporting period. At February 28, 2015, the Fund did not have any transfers into/out of Level 1, Level 2, or Level 3.
4. TRANSACTIONS WITH AFFILIATES
Advisory fee
The Trust has entered into an advisory contract with Funds Management, an indirect wholly owned subsidiary of Wells Fargo & Company (“Wells Fargo”). The adviser is responsible for implementing investment policies and guidelines and for supervising the subadviser who is responsible for day-to-day portfolio management of the Fund.
Pursuant to the contract, Funds Management is entitled to receive an annual advisory fee starting at 0.30% and declining to 0.225% as the average daily net assets of the Fund increase. For the six months ended February 28, 2015, the advisory fee was equivalent to an annual rate of 0.29% of the Fund’s average daily net assets.
Funds Management has retained the services of a subadviser to provide daily portfolio management to the Fund. The fee for subadvisory services is borne by Funds Management. WellsCap, an affiliate of Funds Management and an indirect wholly owned subsidiary of Wells Fargo, is the subadviser to the Fund and is entitled to receive a fee from Funds Management at an annual rate starting at 0.15% and declining to 0.05% as the average daily net assets of the Fund increase.
Administration fees
The Trust has entered into an administration agreement with Funds Management. Under this agreement, for providing administrative services, which includes paying fees and expenses for services provided by the transfer agent, sub-transfer agents, omnibus account servicers and record-keepers, Funds Management is entitled to receive from the Fund an
| | | | | | |
| Notes to financial statements (unaudited) | | Wells Fargo Advantage Ultra Short-Term Income Fund | | | 33 | |
annual fund level administration fee starting at 0.05% and declining to 0.03% as the average daily net assets of the Fund increase and a class level administration fee which is calculated based on the average daily net assets of each class as follows:
| | | | |
| | | Class level administration fee | |
Class A, Class C | | | 0.16 | % |
Administrator Class | | | 0.10 | |
Institutional Class | | | 0.08 | |
Investor Class | | | 0.19 | |
Funds Management has contractually waived and/or reimbursed advisory and administration fees to the extent necessary to maintain certain net operating expense ratios for the Fund. Waiver of fees and/or reimbursement of expenses by Funds Management were made first from fund level expenses on a proportionate basis and then from class specific expenses. Funds Management has committed through December 31, 2015 to waive fees and/or reimburse expenses to the extent necessary to cap the Fund’s expenses at 0.70% for Class A shares, 1.45% for Class C shares, 0.55% for Administrator Class shares, 0.35% for Institutional Class shares, and 0.73% for Investor Class shares. After this time, the cap may be increased or the commitment to maintain the cap may be terminated only with the approval of the Board of Trustees.
Distribution fee
The Trust has adopted a Distribution Plan for Class C shares of the Fund pursuant to Rule 12b-1 under the 1940 Act. A distribution fee is charged to Class C shares and paid to Wells Fargo Funds Distributor, LLC (“Funds Distributor”), the principal underwriter, at an annual rate of 0.75% of the average daily net assets of Class C shares.
In addition, Funds Distributor is entitled to receive the front-end sales charge from the purchase of Class A shares and a contingent deferred sales charge on the redemption of certain shares. Funds Distributor is also entitled to receive the contingent deferred sales charges from redemptions of Class C shares. For the six months ended February 28, 2015, Funds Distributor received $489 from the sale of Class A shares.
Shareholder servicing fees
The Trust has entered into contracts with one or more shareholder servicing agents, whereby Class A, Class C, Administrator Class, and Investor Class of the Fund is charged a fee at an annual rate of 0.25% of the average daily net assets of each respective class.
A portion of these total shareholder servicing fees were paid to affiliates of Wells Fargo.
5. INVESTMENT PORTFOLIO TRANSACTIONS
Purchases and sales of investments, excluding short-term securities, for the six months ended February 28, 2015 were as follows:
| | | | | | |
Purchases at cost | | Sales proceeds |
U.S.
government | | Non-U.S.
government | | U.S.
government | | Non-U.S.
government |
| $134,909,579 | | $412,812,180 | | $109,460,788 | | $493,163,211 |
6. DERIVATIVE TRANSACTIONS
During the six months ended February 28, 2015, the Fund entered into futures contracts to speculate on interest rates and to help manage the duration of the portfolio.
At February 28, 2015, the Fund had long and short futures contracts outstanding as follows:
| | | | | | | | | | | | | | | | |
| Expiration date | | Counterparty | | Contracts | | Type | | | Contract value at
February 28, 2015 | | | Unrealized
losses | |
6-30-2015 | | JPMorgan | | 99 Long | | | 5-Year U.S. Treasury Notes | | | $ | 11,808,844 | | | | (17,438 | ) |
6-30-2015 | | JPMorgan | | 2,486 Short | | | 2-Year U.S. Treasury Notes | | | | 543,385,221 | | | | (415,757 | ) |
| | | | |
| 34 | | Wells Fargo Advantage Ultra Short-Term Income Fund | | Notes to financial statements (unaudited) |
The Fund had an average notional amount of $6,074,457 and $597,512,773 in long and short futures contracts, respectively, during the six months ended February 28, 2015.
On February 28, 2015, the cumulative unrealized losses on futures contracts in the amount of $433,195 are reflected in net unrealized losses on investments on the Statement of Assets and Liabilities. The receivable and payable for daily variation margin on open futures contracts reflected in the Statement of Assets and Liabilities only represents the current day’s variation margin. The realized losses and change in unrealized gains (losses) on futures contracts are reflected in the Statement of Operations.
For certain types of derivative transactions, the Fund has entered into International Swaps and Derivatives Association, Inc. master agreements (“ISDA Master Agreements”) or similar agreements with approved counterparties. The ISDA Master Agreements or similar agreements may have requirements to deliver/deposit securities or cash to/with an exchange or broker-dealer as collateral and allows the Fund to offset, with each counterparty, certain derivative financial instrument’s assets and/or liabilities with collateral held or pledged. Collateral requirements differ by type of derivative. Collateral or margin requirements are set by the broker or exchange clearing house for exchange traded derivatives while collateral terms are contract specific for over-the-counter traded derivatives. Cash collateral that has been pledged to cover obligations of the Fund under ISDA Master Agreements or similar agreements, if any, will be reported separately in the Statement of Assets and Liabilities. Securities pledged as collateral, if any, for the same purpose are noted in the Portfolio of Investments. With respect to balance sheet offsetting, absent an event of default by the counterparty or a termination of the agreement, the reported amounts of financial assets and financial liabilities in the Statement of Assets and Liabilities are not offset across transactions between the Fund and the applicable counterparty. A reconciliation of the gross amounts on the Statement of Assets and Liabilities to the net amounts by derivative type, including any collateral exposure, is as follows:
| | | | | | | | | | | | | | | | |
| Derivative type | | Counterparty | | Gross amounts
of assets in the Statement of Assets and Liabilities | | Amounts subject to netting agreements | | | Collateral received | | | Net amount
of assets | |
Futures – variation margin | | JPMorgan | | $12,375 | | $ | (12,375 | ) | | $ | 0 | | | $ | 0 | |
| | | | | | | | | | | | | | | | |
| Derivative type | | Counterparty | | Gross amounts
of liabilities in the
Statement of
Assets and
Liabilities | | Amounts
subject to
netting
agreements | | | Collateral
pledged1 | | | Net amount
of liabilities | |
Futures – variation margin | | JPMorgan | | $284,599 | | $ | (12,375 | ) | | $ | (272,224 | ) | | $ | 0 | |
| | 1 | Collateral pledged within this table is limited to the collateral for the net transaction with the counterparty. | |
7. BANK BORROWINGS
The Trust (excluding the money market funds and certain other funds in the Trust) and Wells Fargo Variable Trust are parties to a $150,000,000 revolving credit agreement, whereby the Fund is permitted to use bank borrowings for temporary or emergency purposes, such as to fund shareholder redemption requests. Interest under the credit agreement is charged to the Fund based on a borrowing rate equal to the higher of the Federal Funds rate in effect on that day plus 1.25% or the overnight LIBOR rate in effect on that day plus 1.25%. In addition, an annual commitment fee equal to 0.10% of the unused balance is allocated to each participating fund. For the six months ended February 28, 2015, the Fund paid $1,104 in commitment fees.
For the six months ended February 28, 2015, there were no borrowings by the Fund under the agreement.
8. INDEMNIFICATION
Under the Trust’s organizational documents, the officers and Trustees are indemnified against certain liabilities that may arise out of performance of their duties to the Trust. Additionally, in the normal course of business, the Trust may enter into contracts with service providers that contain a variety of indemnification clauses. The Trust’s maximum exposure under these arrangements is dependent on future claims that may be made against the Fund and, therefore, cannot be estimated.
| | | | | | |
| Other information (unaudited) | | Wells Fargo Advantage Ultra Short-Term Income Fund | | | 35 | |
PROXY VOTING INFORMATION
A description of the policies and procedures that the Fund uses to determine how to vote proxies relating to portfolio securities is available, upon request, by calling 1-800-222-8222, visiting our website at wellsfargoadvantagefunds.com, or visiting the SEC website at sec.gov. Information regarding how the Fund voted proxies relating to portfolio securities during the most recent 12-month period ended June 30 is available on the Fund’s website at wellsfargoadvantagefunds.com or by visiting the SEC website at sec.gov.
PORTFOLIO HOLDINGS INFORMATION
The complete portfolio holdings for the Fund are publicly available monthly on the Fund’s website (wellsfargoadvantagefunds.com), on a one-month delayed basis. In addition, top ten holdings information (excluding derivative positions) for the Fund is publicly available on the Fund’s website on a monthly, seven-day or more delayed basis. The Fund files its complete schedule of portfolio holdings with the SEC for the first and third quarters of each fiscal year on Form N-Q, which is available by visiting the SEC website at sec.gov. In addition, the Fund’s Form N-Q may be reviewed and copied at the SEC’s Public Reference Room in Washington, DC, and at regional offices in New York City, at 233 Broadway, and in Chicago, at 175 West Jackson Boulevard, Suite 900. Information about the Public Reference Room may be obtained by calling 1-800-SEC-0330.
| | | | |
| 36 | | Wells Fargo Advantage Ultra Short-Term Income Fund | | Other information (unaudited) |
BOARD OF TRUSTEES AND OFFICERS
Each of the Trustees and Officers1 listed in the table below acts in identical capacities for each fund in the Wells Fargo Advantage family of funds, which consists of 134 mutual funds comprising the Wells Fargo Funds Trust, Wells Fargo Variable Trust, Wells Fargo Master Trust and four closed-end funds (collectively the “Fund Complex”). This table should be read in conjunction with the Prospectus and the Statement of Additional Information2. The mailing address of each Trustee and Officer is 525 Market Street, 12th Floor, San Francisco, CA 94105. Each Trustee and Officer serves an indefinite term, however, each Trustee serves such term until reaching the mandatory retirement age established by the Trustees.
Independent Trustees
| | | | | | |
Name and year of birth | | Position held and length of service* | | Principal occupations during past five years or longer | | Other directorships during past five years |
William R. Ebsworth (Born 1957) | | Trustee, since 2015** | | Retired. From 1984 to 2013, equities analyst, portfolio manager, research director at Fidelity Management and Research Company and retired in 2013 as Chief Investment Officer of Fidelity Strategic Advisers, Inc. in Boston, Tokyo, and Hong Kong where he led a team of investment professionals managing client assets. Prior thereto, Board member of Hong Kong Securities Clearing Co., Hong Kong Options Clearing Corp., the Thailand International Fund, Ltd., Fidelity Investments Life Insurance Company, and Empire Fidelity Investments Life Insurance Company. Mr. Ebsworth is an Adjunct Lecturer, Finance, at Babson College and a Chartered Financial Analyst. | | Asset Allocation Trust |
Jane A. Freeman (Born 1953) | | Trustee, since 2015** | | Retired. From 2012 to 2014 and 1999 to 2008, Chief Financial Officer of Scientific Learning Corporation. From 2008 to 2012, Ms. Freeman provided consulting services related to strategic business projects. Prior thereto, Portfolio Manager at Rockefeller & Co. and Scudder, Stevens & Clark. Board member of the Harding Loevner Funds from 1996 to 2014, serving as both Lead Independent Director and chair of the Audit Committee. Board member of the Russell Exchange Traded Funds Trust from 2011 to 2012 and the chair of the Audit Committee. Ms. Freeman is a Chartered Financial Analyst (inactive), Chair of Taproot Foundation (non-profit organization) and a Board Member of Ruth Bancroft Garden (non-profit organization). | | Asset Allocation Trust |
Peter G. Gordon (Born 1942) | | Trustee, since 1998; Chairman, since 2005 | | Co-Founder, Retired Chairman, President and CEO of Crystal Geyser Water Company. Trustee Emeritus, Colby College. | | Asset Allocation Trust |
Isaiah Harris, Jr. (Born 1952) | | Trustee, since 2009 | | Retired. Chairman of the Board of CIGNA Corporation since 2009, and Director since 2005. From 2003 to 2011, Director of Delux Corporation. Prior thereto, President and CEO of BellSouth Advertising and Publishing Corp. from 2005 to 2007, President and CEO of BellSouth Enterprises from 2004 to 2005 and President of BellSouth Consumer Services from 2000 to 2003. Emeritus member of the Iowa State University Foundation Board of Governors. Emeritus Member of the Advisory Board of Iowa State University School of Business. Advisory Board Member, Palm Harbor Academy. Mr. Harris is a certified public accountant. | | CIGNA Corporation; Asset Allocation Trust |
Judith M. Johnson (Born 1949) | | Trustee, since 2008; Audit Committee Chairman, since 2008 | | Retired. Prior thereto, Chief Executive Officer and Chief Investment Officer of Minneapolis Employees Retirement Fund from 1996 to 2008. Ms. Johnson is an attorney, certified public accountant and a certified managerial accountant. | | Asset Allocation Trust |
David F. Larcker (Born 1950) | | Trustee, since 2009 | | James Irvin Miller Professor of Accounting at the Graduate School of Business, Stanford University, Morgan Stanley Director of the Center for Leadership Development and Research and Senior Faculty of The Rock Center for Corporate Governance since 2006. From 2005 to 2008, Professor of Accounting at the Graduate School of Business, Stanford University. Prior thereto, Ernst & Young Professor of Accounting at The Wharton School, University of Pennsylvania from 1985 to 2005. | | Asset Allocation Trust |
Olivia S. Mitchell (Born 1953) | | Trustee, since 2006 | | International Foundation of Employee Benefit Plans Professor, Wharton School of the University of Pennsylvania since 1993. Director of Wharton’s Pension Research Council and Boettner Center on Pensions & Retirement Research, and Research Associate at the National Bureau of Economic Research. Previously, Cornell University Professor from 1978 to 1993. | | Asset Allocation Trust |
| | | | | | |
| Other information (unaudited) | | Wells Fargo Advantage Ultra Short-Term Income Fund | | | 37 | |
| | | | | | |
Name and year of birth | | Position held and length of service* | | Principal occupations during past five years or longer | | Other directorships during past five years |
Timothy J. Penny (Born 1951) | | Trustee, since 1996 | | President and Chief Executive Officer of Southern Minnesota Initiative Foundation, a non-profit organization, since 2007 and Senior Fellow at the Humphrey Institute Policy Forum at the University of Minnesota since 1995. Member of the Board of Trustees of NorthStar Education Finance, Inc., a non-profit organization, since 2007. | | Asset Allocation Trust |
Michael S. Scofield (Born 1943) | | Trustee, since 2010 | | Served on the Investment Company Institute’s Board of Governors and Executive Committee from 2008-2011 as well the Governing Council of the Independent Directors Council from 2006-2011 and the Independent Directors Council Executive Committee from 2008-2011. Chairman of the IDC from 2008-2010. Institutional Investor (Fund Directions) Trustee of Year in 2007. Trustee of the Evergreen Funds complex (and its predecessors) from 1984 to 2010. Chairman of the Evergreen Funds from 2000-2010. Former Trustee of the Mentor Funds. Retired Attorney, Law Offices of Michael S. Scofield. | | Asset Allocation Trust |
Donald C. Willeke (Born 1940) | | Trustee, since 1996 | | Principal of the law firm of Willeke & Daniels. General Counsel of the Minneapolis Employees Retirement Fund from 1984 until its consolidation into the Minnesota Public Employees Retirement Association on June 30, 2010. Director and Vice Chair of The Tree Trust (non-profit corporation). Director of the American Chestnut Foundation (non-profit corporation). | | Asset Allocation Trust |
| * | Length of service dates reflect the Trustee’s commencement of service with the Trust’s predecessor entities, where applicable. |
| ** | William R. Ebsworth and Jane A. Freeman each became a Trustee effective January 1, 2015. |
Officers
| | | | | | |
Name and year of birth | | Position held and length of service | | Principal occupations during past five years or longer | | |
Karla M. Rabusch (Born 1959) | | President, since 2003 | | Executive Vice President of Wells Fargo Bank, N.A. and President of Wells Fargo Funds Management, LLC since 2003. | | |
Nancy Wiser1 (Born 1967) | | Treasurer, since 2012 | | Executive Vice President of Wells Fargo Funds Management, LLC since 2011. Chief Operating Officer and Chief Compliance Officer at LightBox Capital Management LLC, from 2008 to 2011. Owned and operated a consulting business providing services to various hedge funds including acting as Chief Operating Officer and Chief Compliance Officer for a hedge fund from 2007 to 2008. Chief Operating Officer and Chief Compliance Officer of GMN Capital LLC from 2006 to 2007. | | |
C. David Messman (Born 1960) | | Secretary, since 2000; Chief Legal Officer, since 2003 | | Senior Vice President and Secretary of Wells Fargo Funds Management, LLC since 2001. Assistant General Counsel of Wells Fargo Bank, N.A. since 2013 and Vice President and Managing Counsel of Wells Fargo Bank N.A. from 1996 to 2013. | | |
Debra Ann Early (Born 1964) | | Chief Compliance Officer, since 2007 | | Senior Vice President of Wells Fargo Funds Management, LLC since 2007 and Chief Compliance Officer from 2007 to 2014. Chief Compliance Officer of Parnassus Investments from 2005 to 2007. Chief Financial Officer of Parnassus Investments from 2004 to 2007 and Senior Audit Manager of PricewaterhouseCoopers LLP from 1998 to 2004. | | |
David Berardi (Born 1975) | | Assistant Treasurer, since 2009 | | Vice President of Wells Fargo Funds Management, LLC since 2009. Vice President of Evergreen Investment Management Company, LLC from 2008 to 2010. Assistant Vice President of Evergreen Investment Services, Inc. from 2004 to 2008. Manager of Fund Reporting and Control for Evergreen Investment Management Company, LLC from 2004 to 2010. | | |
Jeremy DePalma1
(Born 1974) | | Assistant Treasurer, since 2009 | | Senior Vice President of Wells Fargo Funds Management, LLC since 2009. Senior Vice President of Evergreen Investment Management Company, LLC from 2008 to 2010. Vice President, Evergreen Investment Services, Inc. from 2004 to 2007. Head of the Fund Reporting and Control Team within Fund Administration from 2005 to 2010. | | |
| 1 | Nancy Wiser acts as Treasurer of 73 funds in the Fund Complex. Jeremy DePalma acts as Treasurer of 61 funds and Assistant Treasurer of 73 funds in the Fund Complex. |
| 2 | The Statement of Additional Information includes additional information about the Trustees and is available, without charge, upon request, by calling 1-800-222-8222 or by visiting the website at wellsfargoadvantagefunds.com. |
| | | | |
| 38 | | Wells Fargo Advantage Ultra Short-Term Income Fund | | List of abbreviations |
The following is a list of common abbreviations for terms and entities that may have appeared in this report.
| ACA | — ACA Financial Guaranty Corporation |
| ADR | — American depositary receipt |
| ADS | — American depositary shares |
| AGC | — Assured Guaranty Corporation |
| AGM | — Assured Guaranty Municipal |
| Ambac | — Ambac Financial Group Incorporated |
| AMT | — Alternative minimum tax |
| BAN | — Bond anticipation notes |
| BHAC | — Berkshire Hathaway Assurance Corporation |
| CAB | — Capital appreciation bond |
| CCAB | — Convertible capital appreciation bond |
| CDA | — Community Development Authority |
| CDO | — Collateralized debt obligation |
| DRIVER | — Derivative inverse tax-exempt receipts |
| DW&P | — Department of Water & Power |
| DWR | — Department of Water Resources |
| ECFA | — Educational & Cultural Facilities Authority |
| EDA | — Economic Development Authority |
| EDFA | — Economic Development Finance Authority |
| ETF | — Exchange-traded fund |
| FDIC | — Federal Deposit Insurance Corporation |
| FFCB | — Federal Farm Credit Banks |
| FGIC | — Financial Guaranty Insurance Corporation |
| FHA | — Federal Housing Administration |
| FHLB | — Federal Home Loan Bank |
| FHLMC | — Federal Home Loan Mortgage Corporation |
| FICO | — The Financing Corporation |
| FNMA | — Federal National Mortgage Association |
| GDR | — Global depositary receipt |
| GNMA | — Government National Mortgage Association |
| HCFR | — Healthcare facilities revenue |
| HEFA | — Health & Educational Facilities Authority |
| HEFAR | — Higher education facilities authority revenue |
| HFA | — Housing Finance Authority |
| HFFA | — Health Facilities Financing Authority |
| HUD | — Department of Housing and Urban Development |
| IDA | — Industrial Development Authority |
| IDAG | — Industrial Development Agency |
| KRW | — Republic of Korea won |
| LIBOR | — London Interbank Offered Rate |
| LIFER | — Long Inverse Floating Exempt Receipts |
| LLC | — Limited liability company |
| LLLP | — Limited liability limited partnership |
| LLP | — Limited liability partnership |
| MBIA | — Municipal Bond Insurance Association |
| MFHR | — Multifamily housing revenue |
| MSTR | — Municipal securities trust receipts |
| MUD | — Municipal Utility District |
| National | — National Public Finance Guarantee Corporation |
| PCFA | — Pollution Control Financing Authority |
| PCL | — Public Company Limited |
| PCR | — Pollution control revenue |
| PFA | — Public Finance Authority |
| PFFA | — Public Facilities Financing Authority |
| PFOTER | — Puttable floating option tax-exempt receipts |
| plc | — Public limited company |
| PUTTER | — Puttable tax-exempt receipts |
| R&D | — Research & development |
| Radian | — Radian Asset Assurance |
| RAN | — Revenue anticipation notes |
| RDA | — Redevelopment Authority |
| RDFA | — Redevelopment Finance Authority |
| REIT | — Real estate investment trust |
| ROC | — Reset option certificates |
| SAVRS | — Select auction variable rate securities |
| SBA | — Small Business Authority |
| SFHR | — Single-family housing revenue |
| SFMR | — Single-family mortgage revenue |
| SPA | — Standby purchase agreement |
| SPDR | — Standard & Poor’s Depositary Receipts |
| SPEAR | — Short Puttable Exempt Adjustable Receipts |
| STRIPS | — Separate trading of registered interest and |
| TAN | — Tax anticipation notes |
| TIPS | — Treasury inflation-protected securities |
| TRAN | — Tax revenue anticipation notes |
| TTFA | — Transportation Trust Fund Authority |
| TVA | — Tennessee Valley Authority |
This page is intentionally left blank.
This page is intentionally left blank.


For more information
More information about Wells Fargo Advantage Funds is available free upon request. To obtain literature, please write, email, visit the Fund’s website, or call:
Wells Fargo Advantage Funds
P.O. Box 8266
Boston, MA 02266-8266
Email: wfaf@wellsfargo.com
Website: wellsfargoadvantagefunds.com
Individual investors: 1-800-222-8222
Retail investment professionals: 1-888-877-9275
Institutional investment professionals: 1-866-765-0778
This report and the financial statements contained herein are submitted for the general information of the shareholders of Wells Fargo Advantage Funds. If this report is used for promotional purposes, distribution of the report must be accompanied or preceded by a current prospectus. Before investing, please consider the investment objectives, risks, charges, and expenses of the investment. For a current prospectus and, if available, a summary prospectus, containing this information, call 1-800-222-8222 or visit the Fund’s website at wellsfargoadvantagefunds.com. Read the prospectus carefully before you invest or send money.
Wells Fargo Funds Management, LLC, a wholly owned subsidiary of Wells Fargo & Company, provides investment advisory and administrative services for Wells Fargo Advantage Funds. Other affiliates of Wells Fargo & Company provide subadvisory and other services for the Funds. The Funds are distributed by Wells Fargo Funds Distributor, LLC, Member FINRA/SIPC, an affiliate of Wells Fargo & Company.
NOT FDIC INSURED ¡ NO BANK GUARANTEE ¡ MAY LOSE VALUE
© 2015 Wells Fargo Funds Management, LLC. All rights reserved.
| | |
 | | 232060 04-15 SA223/SAR223 02-15 |
Not applicable.
| ITEM 3. | AUDIT COMMITTEE FINANCIAL EXPERT |
Not applicable.
| ITEM 4. | PRINCIPAL ACCOUNTANT FEES AND SERVICES |
Not applicable.
| ITEM 5. | AUDIT COMMITTEE OF LISTED REGISTRANTS |
Not applicable.
A Portfolio of Investments for each series of Wells Fargo Funds Trust (except for Wells Fargo Advantage Adjustable Rate Government Fund and Wells Fargo Advantage Government Securities Fund) is included as part of the report to shareholders filed under Item 1 of this Form. Wells Fargo Advantage Adjustable Rate Government Fund and Wells Fargo Advantage Government Securities Fund included a Summary Portfolio of Investments under Item 1. A Portfolio of Investments for each of Wells Fargo Advantage Adjustable Rate Government Fund and Wells Fargo Advantage Government Securities Fund are filed under this Item.
| | | | | | |
| Portfolio of investments—February 28, 2015 (unaudited) | | Wells Fargo Advantage Adjustable Rate Government Fund | | | 1 | |
| | | | | | | | | | | | | | | | |
| Security name | | Interest rate | | | Maturity date | | | Principal | | | Value | |
| | | | |
Agency Securities: 94.59% | | | | | | | | | | | | | | | | |
FDIC Series 2010-S2 Class 3A 144A± | | | 0.87 | % | | | 12-29-2045 | | | $ | 1,463,489 | | | $ | 1,428,623 | |
Federal Agricultural Mortgage Corporation Series 2000-A Class A ± | | | 0.04 | | | | 12-15-2039 | | | | 142,871 | | | | 144,165 | |
FHLMC ± | | | 0.86 | | | | 4-1-2030 | | | | 138,357 | | | | 140,396 | |
FHLMC ± | | | 1.00 | | | | 3-15-2024 | | | | 1,022,958 | | | | 1,026,424 | |
FHLMC ± | | | 1.79 | | | | 2-1-2037 | | | | 16,294 | | | | 17,136 | |
FHLMC ± | | | 1.86 | | | | 7-1-2034 | | | | 12,442,231 | | | | 13,222,592 | |
FHLMC ± | | | 1.88 | | | | 12-1-2017 | | | | 14,888 | | | | 15,099 | |
FHLMC ± | | | 1.88 | | | | 5-1-2018 | | | | 783 | | | | 784 | |
FHLMC ± | | | 1.88 | | | | 6-1-2018 | | | | 9,335 | | | | 9,405 | |
FHLMC ± | | | 1.88 | | | | 9-1-2018 | | | | 1,584 | | | | 1,620 | |
FHLMC ± | | | 1.88 | | | | 5-1-2019 | | | | 6,541 | | | | 6,549 | |
FHLMC ± | | | 1.91 | | | | 1-1-2030 | | | | 7,131 | | | | 7,312 | |
FHLMC ± | | | 1.91 | | | | 1-1-2030 | | | | 10,571 | | | | 11,151 | |
FHLMC ± | | | 1.91 | | | | 7-1-2030 | | | | 191,993 | | | | 200,596 | |
FHLMC ± | | | 1.92 | | | | 9-1-2016 | | | | 2,850 | | | | 2,914 | |
FHLMC ± | | | 1.92 | | | | 11-1-2016 | | | | 55,964 | | | | 56,725 | |
FHLMC ± | | | 1.92 | | | | 7-1-2018 | | | | 2,013 | | | | 2,090 | |
FHLMC ± | | | 1.92 | | | | 1-1-2019 | | | | 6,494 | | | | 6,550 | |
FHLMC ± | | | 1.92 | | | | 2-1-2019 | | | | 11,418 | | | | 11,524 | |
FHLMC ± | | | 1.92 | | | | 2-1-2035 | | | | 441,692 | | | | 461,538 | |
FHLMC ± | | | 1.94 | | | | 2-1-2037 | | | | 648,064 | | | | 676,782 | |
FHLMC ± | | | 1.96 | | | | 6-1-2035 | | | | 3,971,329 | | | | 4,202,409 | |
FHLMC ± | | | 2.00 | | | | 1-1-2023 | | | | 56,818 | | | | 60,551 | |
FHLMC ± | | | 2.03 | | | | 3-1-2018 | | | | 11,651 | | | | 11,981 | |
FHLMC ± | | | 2.04 | | | | 5-1-2028 | | | | 323,490 | | | | 340,516 | |
FHLMC ± | | | 2.04 | | | | 5-1-2035 | | | | 1,182,929 | | | | 1,255,885 | |
FHLMC ± | | | 2.06 | | | | 1-1-2037 | | | | 3,397,475 | | | | 3,581,902 | |
FHLMC ± | | | 2.07 | | | | 10-1-2030 | | | | 16,343 | | | | 17,071 | |
FHLMC ± | | | 2.08 | | | | 6-1-2037 | | | | 1,269,629 | | | | 1,340,804 | |
FHLMC ± | | | 2.09 | | | | 8-1-2036 | | | | 4,338,752 | | | | 4,631,130 | |
FHLMC ± | | | 2.11 | | | | 6-1-2024 | | | | 10,708 | | | | 10,756 | |
FHLMC ± | | | 2.11 | | | | 11-1-2034 | | | | 972,623 | | | | 1,031,666 | |
FHLMC ± | | | 2.14 | | | | 6-1-2020 | | | | 1,912 | | | | 1,919 | |
FHLMC ± | | | 2.14 | | | | 12-1-2035 | | | | 1,043,327 | | | | 1,105,568 | |
FHLMC ± | | | 2.14 | | | | 5-1-2020 | | | | 828 | | | | 831 | |
FHLMC ± | | | 2.14 | | | | 5-1-2020 | | | | 603 | | | | 621 | |
FHLMC ± | | | 2.16 | | | | 3-1-2025 | | | | 125,990 | | | | 132,569 | |
FHLMC ± | | | 2.17 | | | | 8-1-2018 | | | | 2,429 | | | | 2,484 | |
FHLMC ± | | | 2.19 | | | | 7-1-2024 | | | | 49,436 | | | | 49,611 | |
FHLMC ± | | | 2.19 | | | | 1-1-2024 | | | | 18,499 | | | | 18,542 | |
FHLMC ± | | | 2.20 | | | | 7-1-2030 | | | | 24,129 | | | | 24,467 | |
FHLMC ± | | | 2.20 | | | | 8-1-2033 | | | | 2,718,417 | | | | 2,891,907 | |
FHLMC ± | | | 2.21 | | | | 6-1-2020 | | | | 99,415 | | | | 102,310 | |
FHLMC ± | | | 2.22 | | | | 8-1-2035 | | | | 403,471 | | | | 422,425 | |
FHLMC ± | | | 2.22 | | | | 1-1-2030 | | | | 29,397 | | | | 30,855 | |
FHLMC ± | | | 2.22 | | | | 1-1-2022 | | | | 22,991 | | | | 23,703 | |
FHLMC ± | | | 2.23 | | | | 10-1-2037 | | | | 1,801,984 | | | | 1,913,812 | |
FHLMC ± | | | 2.23 | | | | 11-1-2030 | | | | 1,028,629 | | | | 1,058,665 | |
FHLMC ± | | | 2.24 | | | | 12-1-2017 | | | | 3,050 | | | | 3,059 | |
FHLMC ± | | | 2.25 | | | | 6-1-2033 | | | | 2,406,279 | | | | 2,562,285 | |
| | | | |
| 2 | | Wells Fargo Advantage Adjustable Rate Government Fund | | Portfolio of investments—February 28, 2015 (unaudited) |
| | | | | | | | | | | | | | | | |
| Security name | | Interest rate | | | Maturity date | | | Principal | | | Value | |
| | | | |
Agency Securities (continued) | | | | | | | | | | | | | | | | |
FHLMC ± | | | 2.25 | % | | | 1-1-2035 | | | $ | 589,787 | | | $ | 626,777 | |
FHLMC ± | | | 2.26 | | | | 7-1-2019 | | | | 1,635 | | | | 1,642 | |
FHLMC ± | | | 2.26 | | | | 5-1-2033 | | | | 440,339 | | | | 468,192 | |
FHLMC ± | | | 2.27 | | | | 12-1-2036 | | | | 706,222 | | | | 753,288 | |
FHLMC ± | | | 2.27 | | | | 10-1-2035 | | | | 2,540,698 | | | | 2,693,779 | |
FHLMC ± | | | 2.27 | | | | 6-1-2036 | | | | 4,212,706 | | | | 4,481,020 | |
FHLMC ± | | | 2.27 | | | | 6-1-2035 | | | | 3,039,455 | | | | 3,244,585 | |
FHLMC ± | | | 2.28 | | | | 11-1-2035 | | | | 718,715 | | | | 766,545 | |
FHLMC ± | | | 2.28 | | | | 4-1-2035 | | | | 594,589 | | | | 633,919 | |
FHLMC ± | | | 2.28 | | | | 10-1-2035 | | | | 3,566,034 | | | | 3,802,450 | |
FHLMC ± | | | 2.29 | | | | 6-1-2033 | | | | 673,160 | | | | 713,900 | |
FHLMC ± | | | 2.30 | | | | 8-1-2034 | | | | 1,959,413 | | | | 2,086,621 | |
FHLMC ± | | | 2.30 | | | | 10-1-2036 | | | | 1,164,723 | | | | 1,244,718 | |
FHLMC ± | | | 2.31 | | | | 7-1-2017 | | | | 18,903 | | | | 18,988 | |
FHLMC ± | | | 2.31 | | | | 4-1-2023 | | | | 418,532 | | | | 427,503 | |
FHLMC ± | | | 2.31 | | | | 8-1-2036 | | | | 4,449,654 | | | | 4,741,503 | |
FHLMC ± | | | 2.31 | | | | 6-1-2036 | | | | 1,640,313 | | | | 1,747,384 | |
FHLMC ± | | | 2.33 | | | | 10-1-2018 | | | | 14,506 | | | | 14,578 | |
FHLMC ± | | | 2.33 | | | | 7-1-2036 | | | | 750,205 | | | | 794,229 | |
FHLMC ± | | | 2.33 | | | | 6-1-2037 | | | | 8,291,923 | | | | 8,865,330 | |
FHLMC ± | | | 2.33 | | | | 5-1-2037 | | | | 4,032,377 | | | | 4,330,944 | |
FHLMC ± | | | 2.34 | | | | 5-1-2039 | | | | 2,676,601 | | | | 2,876,021 | |
FHLMC ± | | | 2.34 | | | | 1-1-2037 | | | | 2,505,229 | | | | 2,673,343 | |
FHLMC ± | | | 2.34 | | | | 3-1-2037 | | | | 2,953,547 | | | | 3,159,123 | |
FHLMC ± | | | 2.34 | | | | 12-1-2033 | | | | 1,345,115 | | | | 1,434,926 | |
FHLMC ± | | | 2.34 | | | | 12-1-2034 | | | | 927,167 | | | | 990,330 | |
FHLMC ± | | | 2.34 | | | | 11-1-2036 | | | | 2,054,624 | | | | 2,193,526 | |
FHLMC ± | | | 2.34 | | | | 10-1-2033 | | | | 2,697,135 | | | | 2,872,504 | |
FHLMC ± | | | 2.34 | | | | 10-1-2033 | | | | 666,810 | | | | 710,636 | |
FHLMC ± | | | 2.34 | | | | 10-1-2033 | | | | 1,417,956 | | | | 1,513,156 | |
FHLMC ± | | | 2.35 | | | | 8-1-2033 | | | | 559,734 | | | | 596,456 | |
FHLMC ± | | | 2.35 | | | | 1-1-2033 | | | | 1,292,973 | | | | 1,378,763 | |
FHLMC ± | | | 2.35 | | | | 5-1-2038 | | | | 2,347,224 | | | | 2,506,320 | |
FHLMC ± | | | 2.35 | | | | 10-1-2033 | | | | 65,237 | | | | 65,966 | |
FHLMC ± | | | 2.35 | | | | 2-1-2034 | | | | 1,532,260 | | | | 1,629,934 | |
FHLMC ± | | | 2.35 | | | | 4-1-2034 | | | | 1,305,405 | | | | 1,397,539 | |
FHLMC ± | | | 2.35 | | | | 9-1-2035 | | | | 2,953,922 | | | | 3,150,764 | |
FHLMC ± | | | 2.35 | | | | 3-1-2034 | | | | 1,120,587 | | | | 1,194,105 | |
FHLMC ± | | | 2.35 | | | | 3-1-2034 | | | | 1,240,146 | | | | 1,321,921 | |
FHLMC ± | | | 2.35 | | | | 5-1-2032 | | | | 75,533 | | | | 79,268 | |
FHLMC ± | | | 2.35 | | | | 5-1-2034 | | | | 3,273,349 | | | | 3,496,253 | |
FHLMC ± | | | 2.35 | | | | 6-1-2037 | | | | 8,480,726 | | | | 9,064,337 | |
FHLMC ± | | | 2.36 | | | | 1-1-2034 | | | | 1,466,908 | | | | 1,563,173 | |
FHLMC ± | | | 2.36 | | | | 2-1-2034 | | | | 1,244,105 | | | | 1,324,042 | |
FHLMC ± | | | 2.36 | | | | 4-1-2034 | | | | 1,062,850 | | | | 1,132,872 | |
FHLMC ± | | | 2.36 | | | | 9-1-2035 | | | | 7,790,802 | | | | 8,307,609 | |
FHLMC ± | | | 2.36 | | | | 7-1-2034 | | | | 275,638 | | | | 296,764 | |
FHLMC ± | | | 2.36 | | | | 1-1-2036 | | | | 3,201,831 | | | | 3,434,873 | |
FHLMC ± | | | 2.36 | | | | 2-1-2036 | | | | 2,452,991 | | | | 2,615,991 | |
FHLMC ± | | | 2.36 | | | | 5-1-2038 | | | | 3,003,280 | | | | 3,203,292 | |
| | | | | | |
| Portfolio of investments—February 28, 2015 (unaudited) | | Wells Fargo Advantage Adjustable Rate Government Fund | | | 3 | |
| | | | | | | | | | | | | | | | |
| Security name | | Interest rate | | | Maturity date | | | Principal | | | Value | |
| | | | |
Agency Securities (continued) | | | | | | | | | | | | | | | | |
FHLMC ± | | | 2.36 | % | | | 2-1-2037 | | | $ | 736,052 | | | $ | 787,532 | |
FHLMC ± | | | 2.37 | | | | 6-1-2035 | | | | 3,669,067 | | | | 3,894,688 | |
FHLMC ± | | | 2.37 | | | | 2-1-2036 | | | | 1,549,649 | | | | 1,652,311 | |
FHLMC ± | | | 2.37 | | | | 3-1-2027 | | | | 160,395 | | | | 165,003 | |
FHLMC ± | | | 2.37 | | | | 4-1-2035 | | | | 4,457,589 | | | | 4,760,039 | |
FHLMC ± | | | 2.37 | | | | 4-1-2036 | | | | 1,107,768 | | | | 1,184,212 | |
FHLMC ± | | | 2.37 | | | | 5-1-2035 | | | | 500,621 | | | | 530,117 | |
FHLMC ± | | | 2.37 | | | | 11-1-2035 | | | | 2,263,898 | | | | 2,419,517 | |
FHLMC ± | | | 2.37 | | | | 11-1-2036 | | | | 1,877,177 | | | | 2,004,897 | |
FHLMC ± | | | 2.37 | | | | 8-1-2035 | | | | 4,603,608 | | | | 4,919,999 | |
FHLMC ± | | | 2.37 | | | | 4-1-2037 | | | | 1,198,706 | | | | 1,281,944 | |
FHLMC ± | | | 2.37 | | | | 8-1-2035 | | | | 1,002,298 | | | | 1,069,363 | |
FHLMC ± | | | 2.37 | | | | 12-1-2032 | | | | 4,369,434 | | | | 4,652,253 | |
FHLMC ± | | | 2.38 | | | | 9-1-2033 | | | | 450,601 | | | | 480,392 | |
FHLMC ± | | | 2.38 | | | | 5-1-2034 | | | | 738,225 | | | | 787,070 | |
FHLMC ± | | | 2.38 | | | | 5-1-2034 | | | | 160,339 | | | | 170,846 | |
FHLMC ± | | | 2.38 | | | | 9-1-2034 | | | | 3,069,725 | | | | 3,273,572 | |
FHLMC ± | | | 2.38 | | | | 10-1-2034 | | | | 3,317,080 | | | | 3,544,390 | |
FHLMC ± | | | 2.38 | | | | 2-1-2035 | | | | 2,774,330 | | | | 2,962,608 | |
FHLMC ± | | | 2.38 | | | | 7-1-2035 | | | | 4,401,313 | | | | 4,704,540 | |
FHLMC ± | | | 2.38 | | | | 8-1-2035 | | | | 4,285,753 | | | | 4,578,711 | |
FHLMC ± | | | 2.38 | | | | 12-1-2035 | | | | 3,539,487 | | | | 3,776,909 | |
FHLMC ± | | | 2.38 | | | | 2-1-2036 | | | | 2,348,166 | | | | 2,505,642 | |
FHLMC ± | | | 2.38 | | | | 2-1-2036 | | | | 2,452,647 | | | | 2,618,846 | |
FHLMC ± | | | 2.38 | | | | 3-1-2036 | | | | 1,535,857 | | | | 1,638,952 | |
FHLMC ± | | | 2.38 | | | | 1-1-2037 | | | | 418,902 | | | | 447,788 | |
FHLMC ± | | | 2.38 | | | | 4-1-2037 | | | | 4,360,667 | | | | 4,667,796 | |
FHLMC ± | | | 2.38 | | | | 4-1-2038 | | | | 7,946,931 | | | | 8,493,979 | |
FHLMC ± | | | 2.38 | | | | 4-1-2038 | | | | 2,578,211 | | | | 2,750,301 | |
FHLMC ± | | | 2.38 | | | | 4-1-2034 | | | | 4,822,412 | | | | 5,144,096 | |
FHLMC ± | | | 2.38 | | | | 2-1-2036 | | | | 1,219,995 | | | | 1,302,375 | |
FHLMC ± | | | 2.38 | | | | 10-1-2034 | | | | 2,080,587 | | | | 2,221,439 | |
FHLMC ± | | | 2.38 | | | | 7-1-2031 | | | | 2,759,609 | | | | 2,911,475 | |
FHLMC ± | | | 2.38 | | | | 1-1-2038 | | | | 8,041,265 | | | | 8,611,436 | |
FHLMC ± | | | 2.38 | | | | 6-1-2036 | | | | 4,680,801 | | | | 5,002,636 | |
FHLMC ± | | | 2.39 | | | | 11-1-2022 | | | | 350,700 | | | | 368,228 | |
FHLMC ± | | | 2.39 | | | | 2-1-2035 | | | | 6,201,918 | | | | 6,615,274 | |
FHLMC ± | | | 2.39 | | | | 9-1-2030 | | | | 539,195 | | | | 566,975 | |
FHLMC ± | | | 2.39 | | | | 2-1-2034 | | | | 1,068,435 | | | | 1,141,055 | |
FHLMC ± | | | 2.39 | | | | 4-1-2035 | | | | 3,839,975 | | | | 4,104,843 | |
FHLMC ± | | | 2.39 | | | | 5-1-2035 | | | | 4,501,929 | | | | 4,808,652 | |
FHLMC ± | | | 2.39 | | | | 2-1-2036 | | | | 1,431,788 | | | | 1,528,450 | |
FHLMC ± | | | 2.39 | | | | 8-1-2027 | | | | 8,978 | | | | 9,133 | |
FHLMC ± | | | 2.40 | | | | 5-1-2025 | | | | 103,094 | | | | 105,649 | |
FHLMC ± | | | 2.40 | | | | 11-1-2029 | | | | 191,122 | | | | 196,399 | |
FHLMC ± | | | 2.40 | | | | 5-1-2034 | | | | 2,703,384 | | | | 2,870,436 | |
FHLMC ± | | | 2.40 | | | | 10-1-2036 | | | | 1,489,412 | | | | 1,594,323 | |
FHLMC ± | | | 2.40 | | | | 11-1-2035 | | | | 2,045,749 | | | | 2,200,213 | |
FHLMC ± | | | 2.40 | | | | 10-1-2036 | | | | 981,042 | | | | 1,049,069 | |
FHLMC ± | | | 2.40 | | | | 4-1-2037 | | | | 1,169,621 | | | | 1,251,175 | |
| | | | |
| 4 | | Wells Fargo Advantage Adjustable Rate Government Fund | | Portfolio of investments—February 28, 2015 (unaudited) |
| | | | | | | | | | | | | | | | |
| Security name | | Interest rate | | | Maturity date | | | Principal | | | Value | |
| | | | |
Agency Securities (continued) | | | | | | | | | | | | | | | | |
FHLMC ± | | | 2.41 | % | | | 1-1-2035 | | | $ | 625,405 | | | $ | 669,842 | |
FHLMC ± | | | 2.41 | | | | 1-1-2037 | | | | 4,794,750 | | | | 5,122,261 | |
FHLMC ± | | | 2.41 | | | | 2-1-2034 | | | | 3,293,854 | | | | 3,555,397 | |
FHLMC ± | | | 2.41 | | | | 4-1-2036 | | | | 3,675,650 | | | | 3,935,765 | |
FHLMC ± | | | 2.41 | | | | 11-1-2027 | | | | 902,531 | | | | 960,980 | |
FHLMC ± | | | 2.41 | | | | 11-1-2029 | | | | 255,324 | | | | 265,774 | |
FHLMC ± | | | 2.42 | | | | 9-1-2033 | | | | 1,601,349 | | | | 1,712,317 | |
FHLMC ± | | | 2.42 | | | | 4-1-2034 | | | | 5,886,618 | | | | 6,292,077 | |
FHLMC ± | | | 2.42 | | | | 9-1-2036 | | | | 1,244,567 | | | | 1,330,671 | |
FHLMC ± | | | 2.42 | | | | 1-1-2036 | | | | 1,213,076 | | | | 1,296,394 | |
FHLMC ± | | | 2.42 | | | | 3-1-2037 | | | | 793,168 | | | | 848,000 | |
FHLMC ± | | | 2.42 | | | | 6-1-2026 | | | | 1,560,398 | | | | 1,648,586 | |
FHLMC ± | | | 2.43 | | | | 6-1-2035 | | | | 672,939 | | | | 713,877 | |
FHLMC ± | | | 2.43 | | | | 6-1-2035 | | | | 2,411,100 | | | | 2,575,773 | |
FHLMC ± | | | 2.44 | | | | 9-1-2032 | | | | 3,052,534 | | | | 3,236,042 | |
FHLMC ± | | | 2.44 | | | | 9-1-2029 | | | | 1,177,651 | | | | 1,261,658 | |
FHLMC ± | | | 2.44 | | | | 7-1-2031 | | | | 389,820 | | | | 414,172 | |
FHLMC ± | | | 2.44 | | | | 2-1-2031 | | | | 1,229,762 | | | | 1,304,451 | |
FHLMC ± | | | 2.45 | | | | 10-1-2033 | | | | 3,114,843 | | | | 3,316,982 | |
FHLMC ± | | | 2.46 | | | | 4-1-2035 | | | | 2,342,146 | | | | 2,513,972 | |
FHLMC ± | | | 2.46 | | | | 9-1-2033 | | | | 1,280,908 | | | | 1,364,212 | |
FHLMC ± | | | 2.46 | | | | 5-1-2023 | | | | 83,221 | | | | 84,574 | |
FHLMC ± | | | 2.46 | | | | 6-1-2035 | | | | 3,512,962 | | | | 3,741,433 | |
FHLMC ± | | | 2.46 | | | | 6-1-2019 | | | | 70,479 | | | | 71,539 | |
FHLMC ± | | | 2.48 | | | | 9-1-2030 | | | | 11,352,162 | | | | 12,075,320 | |
FHLMC ± | | | 2.48 | | | | 7-1-2038 | | | | 3,109,262 | | | | 3,342,272 | |
FHLMC ± | | | 2.48 | | | | 4-1-2035 | | | | 1,551,844 | | | | 1,663,626 | |
FHLMC ± | | | 2.48 | | | | 2-1-2036 | | | | 263,813 | | | | 282,156 | |
FHLMC ± | | | 2.48 | | | | 4-1-2038 | | | | 2,927,162 | | | | 3,123,569 | |
FHLMC ± | | | 2.48 | | | | 1-1-2028 | | | | 27,163 | | | | 28,668 | |
FHLMC ± | | | 2.48 | | | | 1-1-2028 | | | | 5,883 | | | | 6,270 | |
FHLMC ± | | | 2.48 | | | | 6-1-2035 | | | | 919,432 | | | | 986,754 | |
FHLMC ± | | | 2.48 | | | | 12-1-2034 | | | | 5,198,105 | | | | 5,569,884 | |
FHLMC ± | | | 2.48 | | | | 2-1-2035 | | | | 1,775,910 | | | | 1,892,576 | |
FHLMC ± | | | 2.49 | | | | 1-1-2019 | | | | 607 | | | | 608 | |
FHLMC ± | | | 2.49 | | | | 1-1-2037 | | | | 1,794,785 | | | | 1,921,500 | |
FHLMC ± | | | 2.49 | | | | 4-1-2034 | | | | 971,963 | | | | 1,042,676 | |
FHLMC ± | | | 2.49 | | | | 9-1-2038 | | | | 1,291,880 | | | | 1,383,605 | |
FHLMC ± | | | 2.49 | | | | 7-1-2034 | | | | 1,139,422 | | | | 1,208,679 | |
FHLMC ± | | | 2.50 | | | | 5-1-2037 | | | | 504,939 | | | | 541,469 | |
FHLMC ± | | | 2.50 | | | | 4-1-2037 | | | | 2,132,902 | | | | 2,296,555 | |
FHLMC ± | | | 2.50 | | | | 11-1-2018 | | | | 12,426 | | | | 12,491 | |
FHLMC ± | | | 2.50 | | | | 6-1-2019 | | | | 93,600 | | | | 96,629 | |
FHLMC ± | | | 2.50 | | | | 6-1-2028 | | | | 239,591 | | | | 249,248 | |
FHLMC ± | | | 2.50 | | | | 7-1-2027 | | | | 839,018 | | | | 884,686 | |
FHLMC ± | | | 2.51 | | | | 12-1-2032 | | | | 1,152,259 | | | | 1,235,428 | |
FHLMC ± | | | 2.51 | | | | 4-1-2037 | | | | 855,279 | | | | 919,855 | |
FHLMC ± | | | 2.52 | | | | 10-1-2030 | | | | 2,879,635 | | | | 3,068,291 | |
FHLMC ± | | | 2.53 | | | | 9-1-2031 | | | | 82,746 | | | | 85,480 | |
FHLMC ± | | | 2.53 | | | | 7-1-2029 | | | | 87,102 | | | | 91,527 | |
| | | | | | |
| Portfolio of investments—February 28, 2015 (unaudited) | | Wells Fargo Advantage Adjustable Rate Government Fund | | | 5 | |
| | | | | | | | | | | | | | | | |
| Security name | | Interest rate | | | Maturity date | | | Principal | | | Value | |
| | | | |
Agency Securities (continued) | | | | | | | | | | | | | | | | |
FHLMC ± | | | 2.53 | % | | | 12-1-2018 | | | $ | 25,869 | | | $ | 26,137 | |
FHLMC ± | | | 2.53 | | | | 12-1-2018 | | | | 20,007 | | | | 20,399 | |
FHLMC ± | | | 2.53 | | | | 3-1-2032 | | | | 1,386,627 | | | | 1,486,693 | |
FHLMC ± | | | 2.53 | | | | 7-1-2036 | | | | 1,314,595 | | | | 1,412,131 | |
FHLMC ± | | | 2.54 | | | | 7-1-2037 | | | | 1,129,621 | | | | 1,203,793 | |
FHLMC ± | | | 2.55 | | | | 6-1-2025 | | | | 101,116 | | | | 103,628 | |
FHLMC ± | | | 2.55 | | | | 8-1-2029 | | | | 148,763 | | | | 152,688 | |
FHLMC ± | | | 2.57 | | | | 2-1-2029 | | | | 258,929 | | | | 269,010 | |
FHLMC ± | | | 2.57 | | | | 4-1-2029 | | | | 159,529 | | | | 163,701 | |
FHLMC ± | | | 2.57 | | | | 9-1-2038 | | | | 1,606,652 | | | | 1,712,815 | |
FHLMC ± | | | 2.58 | | | | 10-1-2029 | | | | 135,397 | | | | 139,771 | |
FHLMC ± | | | 2.60 | | | | 7-1-2034 | | | | 2,524,602 | | | | 2,689,654 | |
FHLMC ± | | | 2.60 | | | | 10-1-2024 | | | | 207,331 | | | | 218,715 | |
FHLMC ± | | | 2.60 | | | | 10-1-2025 | | | | 123,550 | | | | 127,211 | |
FHLMC ± | | | 2.60 | | | | 10-1-2025 | | | | 42,207 | | | | 42,485 | |
FHLMC ± | | | 2.60 | | | | 2-1-2030 | | | | 62,837 | | | | 64,042 | |
FHLMC ± | | | 2.60 | | | | 6-1-2030 | | | | 138,471 | | | | 142,488 | |
FHLMC ± | | | 2.60 | | | | 6-1-2030 | | | | 478,255 | | | | 502,611 | |
FHLMC ± | | | 2.60 | | | | 6-1-2030 | | | | 131,203 | | | | 135,517 | |
FHLMC ± | | | 2.60 | | | | 11-1-2032 | | | | 136,622 | | | | 140,516 | |
FHLMC ± | | | 2.62 | | | | 3-1-2025 | | | | 2,516,300 | | | | 2,631,701 | |
FHLMC ± | | | 2.62 | | | | 6-1-2029 | | | | 953,049 | | | | 1,009,037 | |
FHLMC ± | | | 2.62 | | | | 5-1-2036 | | | | 5,164,019 | | | | 5,555,879 | |
FHLMC ± | | | 2.63 | | | | 11-1-2029 | | | | 1,342,540 | | | | 1,437,890 | |
FHLMC ± | | | 2.65 | | | | 11-1-2029 | | | | 302,165 | | | | 314,566 | |
FHLMC ± | | | 2.67 | | | | 9-1-2029 | | | | 164,763 | | | | 169,571 | |
FHLMC ± | | | 2.69 | | | | 5-1-2028 | | | | 423,817 | | | | 445,032 | |
FHLMC ± | | | 2.69 | | | | 8-1-2030 | | | | 6,180,102 | | | | 6,622,598 | |
FHLMC ± | | | 2.70 | | | | 11-1-2026 | | | | 348,045 | | | | 363,155 | |
FHLMC ± | | | 2.70 | | | | 2-1-2024 | | | | 30,547 | | | | 30,724 | |
FHLMC ± | | | 2.71 | | | | 2-1-2036 | | | | 5,454,852 | | | | 5,864,519 | |
FHLMC ± | | | 2.71 | | | | 4-1-2020 | | | | 7,903 | | | | 7,989 | |
FHLMC ± | | | 2.72 | | | | 6-1-2022 | | | | 574 | | | | 577 | |
FHLMC ± | | | 2.73 | | | | 6-1-2032 | | | | 250,393 | | | | 260,353 | |
FHLMC ± | | | 2.74 | | | | 9-1-2030 | | | | 175,059 | | | | 180,494 | |
FHLMC ± | | | 2.77 | | | | 4-1-2019 | | | | 23,895 | | | | 24,126 | |
FHLMC ± | | | 2.78 | | | | 8-1-2029 | | | | 170,366 | | | | 177,466 | |
FHLMC ± | | | 2.82 | | | | 2-1-2018 | | | | 3,558 | | | | 3,614 | |
FHLMC ± | | | 2.88 | | | | 8-1-2019 | | | | 18,144 | | | | 18,243 | |
FHLMC ± | | | 2.88 | | | | 9-1-2016 | | | | 673 | | | | 673 | |
FHLMC ± | | | 2.93 | | | | 4-1-2032 | | | | 124,312 | | | | 128,081 | |
FHLMC ± | | | 3.00 | | | | 12-1-2025 | | | | 327,655 | | | | 335,423 | |
FHLMC ± | | | 3.06 | | | | 2-1-2027 | | | | 181,532 | | | | 184,060 | |
FHLMC ± | | | 3.10 | | | | 7-1-2018 | | | | 63,328 | | | | 64,729 | |
FHLMC ± | | | 3.12 | | | | 6-1-2021 | | | | 123,684 | | | | 127,220 | |
FHLMC ± | | | 3.26 | | | | 5-1-2031 | | | | 178,602 | | | | 189,048 | |
FHLMC ± | | | 3.27 | | | | 7-1-2028 | | | | 95,078 | | | | 96,070 | |
FHLMC ± | | | 3.33 | | | | 6-1-2035 | | | | 1,836,199 | | | | 1,957,767 | |
FHLMC ± | | | 3.38 | | | | 5-1-2032 | | | | 276,492 | | | | 288,700 | |
FHLMC ± | | | 3.49 | | | | 12-1-2025 | | | | 772,769 | | | | 817,556 | |
| | | | |
| 6 | | Wells Fargo Advantage Adjustable Rate Government Fund | | Portfolio of investments—February 28, 2015 (unaudited) |
| | | | | | | | | | | | | | | | |
| Security name | | Interest rate | | | Maturity date | | | Principal | | | Value | |
| | | | |
Agency Securities (continued) | | | | | | | | | | | | | | | | |
FHLMC ± | | | 3.64 | % | | | 11-1-2026 | | | $ | 162,572 | | | $ | 169,220 | |
FHLMC ± | | | 3.74 | | | | 8-1-2029 | | | | 40,158 | | | | 42,025 | |
FHLMC ± | | | 3.85 | | | | 4-1-2023 | | | | 165,164 | | | | 168,510 | |
FHLMC | | | 4.00 | | | | 12-15-2023 | | | | 175,131 | | | | 181,533 | |
FHLMC | | | 4.00 | | | | 3-15-2039 | | | | 4 | | | | 4 | |
FHLMC ± | | | 4.39 | | | | 2-1-2021 | | | | 37,279 | | | | 37,500 | |
FHLMC ± | | | 4.72 | | | | 8-1-2027 | | | | 78,430 | | | | 78,861 | |
FHLMC | | | 5.00 | | | | 10-1-2022 | | | | 36,533 | | | | 39,645 | |
FHLMC ± | | | 5.50 | | | | 8-1-2024 | | | | 558,262 | | | | 596,732 | |
FHLMC | | | 6.50 | | | | 4-1-2018 | | | | 70,623 | | | | 80,495 | |
FHLMC | | | 7.00 | | | | 9-1-2035 | | | | 70,415 | | | | 72,849 | |
FHLMC | | | 7.50 | | | | 1-1-2016 | | | | 3,750 | | | | 3,782 | |
FHLMC | | | 8.50 | | | | 5-1-2020 | | | | 73,580 | | | | 77,632 | |
FHLMC Series 0020 Class F ± | | | 1.14 | | | | 7-1-2029 | | | | 25,606 | | | | 26,102 | |
FHLMC Series 1671 Class QA ± | | | 1.64 | | | | 2-15-2024 | | | | 590,190 | | | | 609,167 | |
FHLMC Series 1686 Class FE ± | | | 1.79 | | | | 2-15-2024 | | | | 44,587 | | | | 45,807 | |
FHLMC Series 1730 Class FA ± | | | 1.25 | | | | 5-15-2024 | | | | 290,996 | | | | 293,314 | |
FHLMC Series 2315 Class FW ± | | | 0.72 | | | | 4-15-2027 | | | | 169,079 | | | | 171,436 | |
FHLMC Series 2391 Class EF ± | | | 0.67 | | | | 6-15-2031 | | | | 148,841 | | | | 150,805 | |
FHLMC Series 2454 Class SL ±(c) | | | 7.83 | | | | 3-15-2032 | | | | 331,226 | | | | 80,534 | |
FHLMC Series 2461 Class FI ± | | | 0.67 | | | | 4-15-2028 | | | | 222,999 | | | | 225,924 | |
FHLMC Series 2464 Class FE ± | | | 1.17 | | | | 3-15-2032 | | | | 215,885 | | | | 222,941 | |
FHLMC Series 2466 Class FV ± | | | 0.72 | | | | 3-15-2032 | | | | 369,903 | | | | 375,825 | |
FHLMC Series 2538 Class F ± | | | 0.77 | | | | 12-15-2032 | | | | 916,711 | | | | 930,886 | |
FHLMC Series 3001 Class EA ± | | | 0.52 | | | | 3-15-2035 | | | | 401,562 | | | | 402,889 | |
FHLMC Series 3335 Class FT ± | | | 0.32 | | | | 8-15-2019 | | | | 609,613 | | | | 610,066 | |
FHLMC Series 3436 Class A ± | | | 2.27 | | | | 11-15-2036 | | | | 629,430 | | | | 665,277 | |
FHLMC Series T-48 Class 2A ± | | | 3.34 | | | | 7-25-2033 | | | | 3,180,064 | | | | 3,388,482 | |
FHLMC Series T-54 Class 4A ± | | | 3.05 | | | | 2-25-2043 | | | | 2,280,466 | | | | 2,424,666 | |
FHLMC Series T-55 Class 1A1 | | | 6.50 | | | | 3-25-2043 | | | | 100,737 | | | | 112,327 | |
FHLMC Series T-56 Class 3AF ± | | | 1.17 | | | | 5-25-2043 | | | | 1,466,017 | | | | 1,503,788 | |
FHLMC Series T-62 Class 1A1 ± | | | 1.31 | | | | 10-25-2044 | | | | 5,878,424 | | | | 5,990,843 | |
FHLMC Series T-63 Class 1A1 ± | | | 1.31 | | | | 2-25-2045 | | | | 4,297,334 | | | | 4,380,746 | |
FHLMC Series T-66 Class 2A1 ± | | | 2.83 | | | | 1-25-2036 | | | | 3,742,018 | | | | 3,928,127 | |
FHLMC Series T-67 Class 1A1C ± | | | 2.92 | | | | 3-25-2036 | | | | 12,698,698 | | | | 13,420,911 | |
FHLMC Series T-67 Class 2A1C ± | | | 2.95 | | | | 3-25-2036 | | | | 8,045,876 | | | | 8,365,603 | |
FHLMC Series T-75 Class A1 ± | | | 0.21 | | | | 12-25-2036 | | | | 3,965,568 | | | | 3,944,337 | |
FNMA ± | | | 1.37 | | | | 6-1-2021 | | | | 64,285 | | | | 67,416 | |
FNMA ± | | | 1.38 | | | | 12-1-2020 | | | | 26,764 | | | | 26,822 | |
FNMA ± | | | 1.38 | | | | 1-1-2021 | | | | 3,177 | | | | 3,333 | |
FNMA ± | | | 1.38 | | | | 1-1-2021 | | | | 3,916 | | | | 4,032 | |
FNMA ± | | | 1.45 | | | | 9-1-2032 | | | | 63,991 | | | | 64,030 | |
FNMA ± | | | 1.51 | | | | 12-1-2030 | | | | 154,764 | | | | 161,954 | |
FNMA ± | | | 1.52 | | | | 8-1-2032 | | | | 264,908 | | | | 265,955 | |
FNMA ± | | | 1.63 | | | | 12-1-2016 | | | | 801 | | | | 804 | |
FNMA ± | | | 1.63 | | | | 7-1-2017 | | | | 1,049 | | | | 1,052 | |
FNMA ± | | | 1.63 | | | | 8-1-2030 | | | | 2,529,184 | | | | 2,631,711 | |
FNMA ± | | | 1.65 | | | | 8-1-2033 | | | | 1,813,899 | | | | 1,909,607 | |
FNMA ± | | | 1.71 | | | | 8-1-2033 | | | | 314,265 | | | | 328,181 | |
FNMA ± | | | 1.71 | | | | 3-1-2034 | | | | 509,701 | | | | 542,786 | |
| | | | | | |
| Portfolio of investments—February 28, 2015 (unaudited) | | Wells Fargo Advantage Adjustable Rate Government Fund | | | 7 | |
| | | | | | | | | | | | | | | | |
| Security name | | Interest rate | | | Maturity date | | | Principal | | | Value | |
| | | | |
Agency Securities (continued) | | | | | | | | | | | | | | | | |
FNMA ± | | | 1.73 | % | | | 1-1-2017 | | | $ | 1,008 | | | $ | 1,010 | |
FNMA ± | | | 1.74 | | | | 1-1-2032 | | | | 419,708 | | | | 438,382 | |
FNMA ± | | | 1.75 | | | | 8-1-2033 | | | | 3,991 | | | | 4,087 | |
FNMA ± | | | 1.75 | | | | 8-1-2031 | | | | 155,605 | | | | 159,830 | |
FNMA ± | | | 1.75 | | | | 12-1-2031 | | | | 25,635 | | | | 25,668 | |
FNMA ± | | | 1.77 | | | | 5-1-2029 | | | | 438,279 | | | | 459,603 | |
FNMA ± | | | 1.79 | | | | 8-1-2031 | | | | 139,688 | | | | 143,593 | |
FNMA ± | | | 1.79 | | | | 9-1-2031 | | | | 245,365 | | | | 254,247 | |
FNMA ± | | | 1.79 | | | | 12-1-2031 | | | | 377,163 | | | | 394,347 | |
FNMA ± | | | 1.79 | | | | 4-1-2033 | | | | 578,935 | | | | 611,013 | |
FNMA ± | | | 1.81 | | | | 12-1-2031 | | | | 156,901 | | | | 160,536 | |
FNMA ± | | | 1.82 | | | | 3-1-2030 | | | | 23,031 | | | | 23,127 | |
FNMA ± | | | 1.82 | | | | 10-1-2037 | | | | 1,753,680 | | | | 1,848,562 | |
FNMA ± | | | 1.83 | | | | 7-1-2020 | | | | 12,558 | | | | 13,072 | |
FNMA ± | | | 1.87 | | | | 5-1-2018 | | | | 5,987 | | | | 6,006 | |
FNMA ± | | | 1.87 | | | | 1-1-2032 | | | | 34,376 | | | | 34,488 | |
FNMA ± | | | 1.87 | | | | 1-1-2035 | | | | 126,712 | | | | 133,348 | |
FNMA ± | | | 1.88 | | | | 7-1-2017 | | | | 1,746 | | | | 1,759 | |
FNMA ± | | | 1.88 | | | | 8-1-2017 | | | | 905 | | | | 918 | |
FNMA ± | | | 1.88 | | | | 3-1-2021 | | | | 1,051 | | | | 1,071 | |
FNMA ± | | | 1.88 | | | | 3-1-2030 | | | | 27,416 | | | | 27,467 | |
FNMA ± | | | 1.88 | | | | 8-1-2032 | | | | 161,713 | | | | 166,225 | |
FNMA ± | | | 1.91 | | | | 3-1-2033 | | | | 251,290 | | | | 262,509 | |
FNMA ± | | | 1.92 | | | | 1-1-2035 | | | | 5,074,421 | | | | 5,340,820 | |
FNMA ± | | | 1.92 | | | | 11-1-2024 | | | | 9,849 | | | | 10,114 | |
FNMA ± | | | 1.92 | | | | 12-1-2022 | | | | 13,923 | | | | 14,050 | |
FNMA ± | | | 1.92 | | | | 1-1-2018 | | | | 49,151 | | | | 49,359 | |
FNMA ± | | | 1.92 | | | | 11-1-2023 | | | | 41,000 | | | | 42,000 | |
FNMA ± | | | 1.92 | | | | 10-1-2017 | | | | 36,859 | | | | 38,961 | |
FNMA ± | | | 1.93 | | | | 4-1-2021 | | | | 66,798 | | | | 70,125 | |
FNMA ± | | | 1.93 | | | | 4-1-2019 | | | | 4,173 | | | | 4,220 | |
FNMA ± | | | 1.93 | | | | 1-1-2035 | | | | 1,450,335 | | | | 1,518,399 | |
FNMA ± | | | 1.94 | | | | 4-1-2042 | | | | 4,156,979 | | | | 4,394,291 | |
FNMA ± | | | 1.94 | | | | 10-1-2044 | | | | 1,581,395 | | | | 1,673,528 | |
FNMA ± | | | 1.94 | | | | 2-1-2033 | | | | 257,779 | | | | 268,612 | |
FNMA ± | | | 1.95 | | | | 6-1-2031 | | | | 319,716 | | | | 330,892 | |
FNMA ± | | | 1.95 | | | | 4-1-2038 | | | | 1,223,890 | | | | 1,300,595 | |
FNMA ± | | | 1.95 | | | | 6-1-2035 | | | | 1,203,529 | | | | 1,264,354 | |
FNMA ± | | | 1.97 | | | | 12-1-2017 | | | | 59,704 | | | | 60,573 | |
FNMA ± | | | 1.99 | | | | 11-1-2034 | | | | 1,383,623 | | | | 1,456,185 | |
FNMA ± | | | 2.00 | | | | 1-1-2022 | | | | 11,701 | | | | 11,734 | |
FNMA ± | | | 2.00 | | | | 4-1-2018 | | | | 3,852 | | | | 3,928 | |
FNMA ± | | | 2.01 | | | | 8-1-2031 | | | | 72,878 | | | | 76,787 | |
FNMA ± | | | 2.01 | | | | 7-1-2032 | | | | 213,251 | | | | 218,568 | |
FNMA ± | | | 2.02 | | | | 6-1-2032 | | | | 72,301 | | | | 72,829 | |
FNMA ± | | | 2.03 | | | | 9-1-2035 | | | | 2,853,914 | | | | 3,034,297 | |
FNMA ± | | | 2.03 | | | | 10-1-2035 | | | | 8,399,073 | | | | 8,825,632 | |
FNMA ± | | | 2.06 | | | | 1-1-2038 | | | | 565,751 | | | | 578,940 | |
FNMA ± | | | 2.07 | | | | 10-1-2018 | | | | 90,312 | | | | 94,105 | |
FNMA ± | | | 2.07 | | | | 7-1-2018 | | | | 1,293 | | | | 1,305 | |
| | | | |
| 8 | | Wells Fargo Advantage Adjustable Rate Government Fund | | Portfolio of investments—February 28, 2015 (unaudited) |
| | | | | | | | | | | | | | | | |
| Security name | | Interest rate | | | Maturity date | | | Principal | | | Value | |
| | | | |
Agency Securities (continued) | | | | | | | | | | | | | | | | |
FNMA ± | | | 2.07 | % | | | 12-1-2035 | | | $ | 7,358,890 | | | $ | 7,738,672 | |
FNMA ± | | | 2.08 | | | | 6-1-2035 | | | | 3,207,893 | | | | 3,417,234 | |
FNMA ± | | | 2.09 | | | | 11-1-2035 | | | | 1,948,085 | | | | 2,046,954 | |
FNMA ± | | | 2.09 | | | | 1-1-2036 | | | | 4,968,953 | | | | 5,227,291 | |
FNMA ± | | | 2.09 | | | | 7-1-2035 | | | | 2,179,760 | | | | 2,298,235 | |
FNMA ± | | | 2.10 | | | | 11-1-2035 | | | | 44,547 | | | | 46,864 | |
FNMA ± | | | 2.12 | | | | 10-1-2024 | | | | 56,861 | | | | 57,160 | |
FNMA ± | | | 2.12 | | | | 12-1-2024 | | | | 87,755 | | | | 89,097 | |
FNMA ± | | | 2.12 | | | | 1-1-2034 | | | | 3,533,043 | | | | 3,757,336 | |
FNMA ± | | | 2.13 | | | | 11-1-2017 | | | | 91,908 | | | | 95,985 | |
FNMA ± | | | 2.13 | | | | 1-1-2018 | | | | 429,445 | | | | 450,235 | |
FNMA ± | | | 2.13 | | | | 2-1-2018 | | | | 6,577 | | | | 6,722 | |
FNMA ± | | | 2.13 | | | | 6-1-2019 | | | | 783 | | | | 784 | |
FNMA ± | | | 2.13 | | | | 2-1-2020 | | | | 11,242 | | | | 11,287 | |
FNMA ± | | | 2.13 | | | | 5-1-2033 | | | | 6,005,987 | | | | 6,382,680 | |
FNMA ± | | | 2.13 | | | | 7-1-2035 | | | | 1,743,481 | | | | 1,839,235 | |
FNMA ± | | | 2.14 | | | | 10-1-2035 | | | | 922,138 | | | | 971,040 | |
FNMA ± | | | 2.15 | | | | 12-1-2032 | | | | 1,162,159 | | | | 1,227,554 | |
FNMA ± | | | 2.15 | | | | 1-1-2040 | | | | 665,616 | | | | 708,414 | |
FNMA ± | | | 2.15 | | | | 1-1-2035 | | | | 781,426 | | | | 823,559 | |
FNMA ± | | | 2.16 | | | | 11-1-2027 | | | | 57,899 | | | | 58,811 | |
FNMA ± | | | 2.16 | | | | 6-1-2034 | | | | 908,830 | | | | 966,949 | |
FNMA ± | | | 2.16 | | | | 11-1-2035 | | | | 2,488,264 | | | | 2,622,733 | |
FNMA ± | | | 2.17 | | | | 7-1-2035 | | | | 3,867,246 | | | | 4,111,451 | |
FNMA ± | | | 2.17 | | | | 5-1-2019 | | | | 261 | | | | 261 | |
FNMA ± | | | 2.18 | | | | 4-1-2030 | | | | 150,208 | | | | 154,587 | |
FNMA ± | | | 2.18 | | | | 12-1-2033 | | | | 2,686,140 | | | | 2,858,458 | |
FNMA ± | | | 2.18 | | | | 12-1-2023 | | | | 11,312 | | | | 11,356 | |
FNMA ± | | | 2.19 | | | | 1-1-2037 | | | | 3,543,180 | | | | 3,764,696 | |
FNMA ± | | | 2.20 | | | | 7-1-2018 | | | | 300,848 | | | | 314,663 | |
FNMA ± | | | 2.20 | | | | 4-1-2018 | | | | 294,704 | | | | 309,240 | |
FNMA ± | | | 2.20 | | | | 2-1-2033 | | | | 900,692 | | | | 951,897 | |
FNMA ± | | | 2.20 | | | | 11-1-2017 | | | | 35,969 | | | | 36,194 | |
FNMA ± | | | 2.21 | | | | 1-1-2035 | | | | 2,862,950 | | | | 3,047,719 | |
FNMA ± | | | 2.21 | | | | 8-1-2025 | | | | 47,322 | | | | 48,675 | |
FNMA ± | | | 2.21 | | | | 1-1-2036 | | | | 536,931 | | | | 570,248 | |
FNMA ± | | | 2.21 | | | | 5-1-2034 | | | | 1,286,450 | | | | 1,364,200 | |
FNMA ± | | | 2.21 | | | | 11-1-2038 | | | | 1,531,928 | | | | 1,631,797 | |
FNMA ± | | | 2.22 | | | | 4-1-2024 | | | | 3,874,691 | | | | 3,992,692 | |
FNMA ± | | | 2.22 | | | | 9-1-2032 | | | | 7,443,486 | | | | 7,921,280 | |
FNMA ± | | | 2.23 | | | | 9-1-2038 | | | | 1,603,763 | | | | 1,706,925 | |
FNMA ± | | | 2.23 | | | | 7-1-2035 | | | | 1,519,796 | | | | 1,616,383 | |
FNMA ± | | | 2.23 | | | | 7-1-2036 | | | | 4,018,220 | | | | 4,273,856 | |
FNMA ± | | | 2.23 | | | | 5-1-2036 | | | | 2,981,265 | | | | 3,163,023 | |
FNMA ± | | | 2.23 | | | | 9-1-2036 | | | | 1,734,525 | | | | 1,865,335 | |
FNMA ± | | | 2.23 | | | | 1-1-2037 | | | | 4,618,463 | | | | 4,901,294 | |
FNMA ± | | | 2.24 | | | | 11-1-2035 | | | | 1,443,177 | | | | 1,528,647 | |
FNMA ± | | | 2.24 | | | | 4-1-2037 | | | | 4,283,344 | | | | 4,554,612 | |
FNMA ± | | | 2.24 | | | | 12-1-2025 | | | | 22,953 | | | | 23,289 | |
FNMA ± | | | 2.24 | | | | 8-1-2026 | | | | 102,988 | | | | 106,669 | |
| | | | | | |
| Portfolio of investments—February 28, 2015 (unaudited) | | Wells Fargo Advantage Adjustable Rate Government Fund | | | 9 | |
| | | | | | | | | | | | | | | | |
| Security name | | Interest rate | | | Maturity date | | | Principal | | | Value | |
| | | | |
Agency Securities (continued) | | | | | | | | | | | | | | | | |
FNMA ± | | | 2.24 | % | | | 12-1-2033 | | | $ | 1,848,452 | | | $ | 1,987,177 | |
FNMA ± | | | 2.24 | | | | 5-1-2032 | | | | 217,682 | | | | 222,932 | |
FNMA ± | | | 2.24 | | | | 2-1-2036 | | | | 6,144,601 | | | | 6,555,071 | |
FNMA ± | | | 2.25 | | | | 3-1-2031 | | | | 41,902 | | | | 42,154 | |
FNMA ± | | | 2.25 | | | | 6-1-2036 | | | | 862,460 | | | | 918,691 | |
FNMA ± | | | 2.25 | | | | 9-1-2036 | | | | 1,341,821 | | | | 1,430,322 | |
FNMA ± | | | 2.25 | | | | 5-1-2017 | | | | 35,923 | | | | 36,013 | |
FNMA ± | | | 2.25 | | | | 7-1-2017 | | | | 1,119 | | | | 1,122 | |
FNMA ± | | | 2.25 | | | | 5-1-2018 | | | | 64,326 | | | | 65,903 | |
FNMA ± | | | 2.25 | | | | 1-1-2019 | | | | 104,096 | | | | 110,921 | |
FNMA ± | | | 2.25 | | | | 10-1-2025 | | | | 154,315 | | | | 159,935 | |
FNMA ± | | | 2.25 | | | | 1-1-2027 | | | | 43,037 | | | | 43,376 | |
FNMA ± | | | 2.25 | | | | 5-1-2033 | | | | 1,051,167 | | | | 1,125,515 | |
FNMA ± | | | 2.25 | | | | 8-1-2036 | | | | 4,368,179 | | | | 4,631,014 | |
FNMA ± | | | 2.25 | | | | 9-1-2035 | | | | 2,987,438 | | | | 3,179,713 | |
FNMA ± | | | 2.26 | | | | 4-1-2035 | | | | 3,988,314 | | | | 4,266,467 | |
FNMA ± | | | 2.26 | | | | 8-1-2035 | | | | 798,439 | | | | 846,156 | |
FNMA ± | | | 2.26 | | | | 4-1-2033 | | | | 1,184,169 | | | | 1,262,671 | |
FNMA ± | | | 2.26 | | | | 10-1-2035 | | | | 467,280 | | | | 503,014 | |
FNMA ± | | | 2.26 | | | | 4-1-2040 | | | | 328,808 | | | | 351,492 | |
FNMA ± | | | 2.27 | | | | 8-1-2039 | | | | 5,770,401 | | | | 6,147,987 | |
FNMA ± | | | 2.27 | | | | 12-1-2034 | | | | 1,854,442 | | | | 1,982,484 | |
FNMA ± | | | 2.27 | | | | 3-1-2037 | | | | 890,398 | | | | 948,240 | |
FNMA ± | | | 2.27 | | | | 10-1-2033 | | | | 781,081 | | | | 831,259 | |
FNMA ± | | | 2.28 | | | | 1-1-2036 | | | | 466,905 | | | | 490,203 | |
FNMA ± | | | 2.28 | | | | 4-1-2033 | | | | 1,191,263 | | | | 1,264,031 | |
FNMA ± | | | 2.28 | | | | 5-1-2038 | | | | 5,462,409 | | | | 5,822,288 | |
FNMA ± | | | 2.28 | | | | 12-1-2039 | | | | 315,288 | | | | 328,982 | |
FNMA ± | | | 2.28 | | | | 5-1-2039 | | | | 4,776,644 | | | | 5,073,841 | |
FNMA ± | | | 2.29 | | | | 4-1-2034 | | | | 1,541,627 | | | | 1,638,338 | |
FNMA ± | | | 2.29 | | | | 2-1-2038 | | | | 1,429,524 | | | | 1,521,604 | |
FNMA ± | | | 2.29 | | | | 7-1-2029 | | | | 775,765 | | | | 826,473 | |
FNMA ± | | | 2.29 | | | | 7-1-2035 | | | | 1,265,354 | | | | 1,347,747 | |
FNMA ± | | | 2.29 | | | | 8-1-2035 | | | | 3,854,831 | | | | 4,106,457 | |
FNMA ± | | | 2.29 | | | | 9-1-2034 | | | | 2,072,384 | | | | 2,205,963 | |
FNMA ± | | | 2.29 | | | | 9-1-2039 | | | | 5,113,778 | | | | 5,441,034 | |
FNMA ± | | | 2.29 | | | | 7-1-2025 | | | | 5,309 | | | | 5,596 | |
FNMA ± | | | 2.29 | | | | 4-1-2034 | | | | 654,660 | | | | 697,794 | |
FNMA ± | | | 2.29 | | | | 1-1-2033 | | | | 4,654,890 | | | | 4,966,725 | |
FNMA ± | | | 2.29 | | | | 12-1-2037 | | | | 986,435 | | | | 1,052,096 | |
FNMA ± | | | 2.29 | | | | 11-1-2038 | | | | 1,355,230 | | | | 1,446,538 | |
FNMA ± | | | 2.30 | | | | 10-1-2035 | | | | 3,487,047 | | | | 3,714,976 | |
FNMA ± | | | 2.30 | | | | 1-1-2037 | | | | 9,773,253 | | | | 10,459,496 | |
FNMA ± | | | 2.30 | | | | 5-1-2035 | | | | 1,714,701 | | | | 1,825,429 | |
FNMA ± | | | 2.30 | | | | 12-1-2024 | | | | 35,387 | | | | 35,587 | |
FNMA ± | | | 2.30 | | | | 6-1-2032 | | | | 45,337 | | | | 45,544 | |
FNMA ± | | | 2.30 | | | | 6-1-2032 | | | | 353,505 | | | | 369,650 | |
FNMA ± | | | 2.30 | | | | 1-1-2035 | | | | 483,805 | | | | 515,164 | |
FNMA ± | | | 2.30 | | | | 6-1-2035 | | | | 583,183 | | | | 627,777 | |
FNMA ± | | | 2.30 | | | | 1-1-2036 | | | | 1,553,906 | | | | 1,657,929 | |
| | | | |
| 10 | | Wells Fargo Advantage Adjustable Rate Government Fund | | Portfolio of investments—February 28, 2015 (unaudited) |
| | | | | | | | | | | | | | | | |
| Security name | | Interest rate | | | Maturity date | | | Principal | | | Value | |
| | | | |
Agency Securities (continued) | | | | | | | | | | | | | | | | |
FNMA ± | | | 2.30 | % | | | 9-1-2036 | | | $ | 1,028,210 | | | $ | 1,098,937 | |
FNMA ± | | | 2.30 | | | | 1-1-2035 | | | | 1,625,512 | | | | 1,745,128 | |
FNMA ± | | | 2.30 | | | | 7-1-2038 | | | | 7,192,290 | | | | 7,798,216 | |
FNMA ± | | | 2.31 | | | | 12-1-2035 | | | | 834,650 | | | | 889,841 | |
FNMA ± | | | 2.31 | | | | 12-1-2034 | | | | 2,128,847 | | | | 2,277,778 | |
FNMA ± | | | 2.31 | | | | 2-1-2036 | | | | 1,320,859 | | | | 1,407,196 | |
FNMA ± | | | 2.31 | | | | 5-1-2033 | | | | 642,914 | | | | 677,989 | |
FNMA ± | | | 2.31 | | | | 3-1-2035 | | | | 1,501,379 | | | | 1,615,044 | |
FNMA ± | | | 2.31 | | | | 2-1-2033 | | | | 393,260 | | | | 407,186 | |
FNMA ± | | | 2.31 | | | | 6-1-2033 | | | | 1,076,794 | | | | 1,143,857 | |
FNMA ± | | | 2.31 | | | | 7-1-2039 | | | | 5,552,287 | | | | 5,942,209 | |
FNMA ± | | | 2.32 | | | | 7-1-2038 | | | | 2,962,620 | | | | 3,157,322 | |
FNMA ±(a) | | | 2.32 | | | | 2-1-2045 | | | | 4,336,936 | | | | 4,610,027 | |
FNMA ± | | | 2.32 | | | | 2-1-2035 | | | | 472,979 | | | | 500,251 | |
FNMA ± | | | 2.32 | | | | 12-1-2040 | | | | 2,427,021 | | | | 2,606,845 | |
FNMA ± | | | 2.32 | | | | 12-1-2040 | | | | 686,938 | | | | 735,556 | |
FNMA ± | | | 2.32 | | | | 2-1-2035 | | | | 4,883,764 | | | | 5,202,222 | |
FNMA ± | | | 2.32 | | | | 10-1-2036 | | | | 1,570,499 | | | | 1,673,049 | |
FNMA ± | | | 2.33 | | | | 10-1-2024 | | | | 353,651 | | | | 369,118 | |
FNMA ± | | | 2.33 | | | | 4-1-2038 | | | | 2,237,212 | | | | 2,386,179 | |
FNMA ± | | | 2.33 | | | | 5-1-2033 | | | | 4,289,530 | | | | 4,597,311 | |
FNMA ± | | | 2.33 | | | | 12-1-2036 | | | | 1,042,722 | | | | 1,112,291 | |
FNMA ± | | | 2.33 | | | | 12-1-2040 | | | | 10,126,546 | | | | 10,785,747 | |
FNMA ± | | | 2.33 | | | | 1-1-2037 | | | | 4,831,835 | | | | 5,170,060 | |
FNMA ± | | | 2.33 | | | | 6-1-2033 | | | | 345,094 | | | | 360,003 | |
FNMA ± | | | 2.33 | | | | 5-1-2037 | | | | 2,409,770 | | | | 2,567,075 | |
FNMA ± | | | 2.33 | | | | 12-1-2032 | | | | 1,229,023 | | | | 1,327,255 | |
FNMA ± | | | 2.33 | | | | 8-1-2035 | | | | 3,561,905 | | | | 3,806,233 | |
FNMA ± | | | 2.33 | | | | 11-1-2035 | | | | 2,430,380 | | | | 2,605,831 | |
FNMA ± | | | 2.33 | | | | 12-1-2040 | | | | 6,041,538 | | | | 6,438,480 | |
FNMA ± | | | 2.33 | | | | 1-1-2027 | | | | 831,212 | | | | 876,191 | |
FNMA ± | | | 2.34 | | | | 7-1-2033 | | | | 173,693 | | | | 184,136 | |
FNMA ± | | | 2.34 | | | | 6-1-2035 | | | | 1,682,386 | | | | 1,796,904 | |
FNMA ± | | | 2.34 | | | | 7-1-2035 | | | | 2,287,544 | | | | 2,467,881 | |
FNMA ± | | | 2.34 | | | | 9-1-2034 | | | | 5,603,263 | | | | 5,978,156 | |
FNMA ±(a) | | | 2.34 | | | | 3-1-2038 | | | | 3,506,637 | | | | 3,737,856 | |
FNMA ± | | | 2.34 | | | | 1-1-2035 | | | | 6,842,460 | | | | 7,294,166 | |
FNMA ± | | | 2.34 | | | | 7-1-2040 | | | | 4,040,988 | | | | 4,309,303 | |
FNMA ± | | | 2.34 | | | | 4-1-2030 | | | | 18,640 | | | | 18,752 | |
FNMA ± | | | 2.34 | | | | 4-1-2033 | | | | 1,863,807 | | | | 1,977,334 | |
FNMA ± | | | 2.34 | | | | 5-1-2033 | | | | 364,904 | | | | 388,634 | |
FNMA ± | | | 2.34 | | | | 6-1-2035 | | | | 533,025 | | | | 572,440 | |
FNMA ± | | | 2.34 | | | | 1-1-2038 | | | | 7,550,021 | | | | 8,086,413 | |
FNMA ± | | | 2.34 | | | | 6-1-2027 | | | | 111,684 | | | | 114,901 | |
FNMA ± | | | 2.34 | | | | 7-1-2036 | | | | 5,447,050 | | | | 5,807,518 | |
FNMA ± | | | 2.35 | | | | 8-1-2031 | | | | 131,823 | | | | 135,096 | |
FNMA ± | | | 2.35 | | | | 12-1-2033 | | | | 2,397,942 | | | | 2,565,712 | |
FNMA ± | | | 2.35 | | | | 10-1-2034 | | | | 495,843 | | | | 528,549 | |
FNMA ± | | | 2.35 | | | | 9-1-2037 | | | | 1,776,393 | | | | 1,907,295 | |
FNMA ± | | | 2.35 | | | | 1-1-2031 | | | | 836,861 | | | | 891,678 | |
| | | | | | |
| Portfolio of investments—February 28, 2015 (unaudited) | | Wells Fargo Advantage Adjustable Rate Government Fund | | | 11 | |
| | | | | | | | | | | | | | | | |
| Security name | | Interest rate | | | Maturity date | | | Principal | | | Value | |
| | | | |
Agency Securities (continued) | | | | | | | | | | | | | | | | |
FNMA ± | | | 2.35 | % | | | 1-1-2035 | | | $ | 1,029,893 | | | $ | 1,098,795 | |
FNMA ± | | | 2.35 | | | | 12-1-2044 | | | | 6,924,786 | | | | 7,386,930 | |
FNMA ± | | | 2.35 | | | | 6-1-2026 | | | | 90,214 | | | | 93,303 | |
FNMA ± | | | 2.35 | | | | 7-1-2035 | | | | 2,286,514 | | | | 2,458,238 | |
FNMA ± | | | 2.35 | | | | 7-1-2035 | | | | 908,689 | | | | 970,703 | |
FNMA ± | | | 2.35 | | | | 8-1-2035 | | | | 5,064,654 | | | | 5,404,786 | |
FNMA ± | | | 2.35 | | | | 9-1-2033 | | | | 63,005 | | | | 63,466 | |
FNMA ± | | | 2.35 | | | | 9-1-2033 | | | | 63,756 | | | | 64,215 | |
FNMA ± | | | 2.35 | | | | 10-1-2035 | | | | 1,790,773 | | | | 1,918,074 | |
FNMA ± | | | 2.35 | | | | 5-1-2035 | | | | 2,792,482 | | | | 2,997,376 | |
FNMA ± | | | 2.36 | | | | 10-1-2036 | | | | 5,346,971 | | | | 5,753,763 | |
FNMA ± | | | 2.36 | | | | 7-1-2037 | | | | 1,025,799 | | | | 1,095,803 | |
FNMA ± | | | 2.36 | | | | 3-1-2033 | | | | 629,266 | | | | 671,322 | |
FNMA ± | | | 2.36 | | | | 4-1-2035 | | | | 2,293,196 | | | | 2,453,020 | |
FNMA ± | | | 2.36 | | | | 8-1-2037 | | | | 5,643,299 | | | | 6,034,646 | |
FNMA ± | | | 2.36 | | | | 7-1-2028 | | | | 272 | | | | 291 | |
FNMA ± | | | 2.36 | | | | 2-1-2034 | | | | 3,519,975 | | | | 3,783,480 | |
FNMA ± | | | 2.36 | | | | 5-1-2036 | | | | 3,437,906 | | | | 3,677,874 | |
FNMA ± | | | 2.36 | | | | 12-1-2040 | | | | 3,297,992 | | | | 3,515,217 | |
FNMA ± | | | 2.36 | | | | 11-1-2037 | | | | 1,498,707 | | | | 1,598,605 | |
FNMA ± | | | 2.36 | | | | 5-1-2036 | | | | 5,545,680 | | | | 5,965,448 | |
FNMA ± | | | 2.36 | | | | 12-1-2037 | | | | 4,906,071 | | | | 5,239,423 | |
FNMA ± | | | 2.36 | | | | 12-1-2040 | | | | 6,814,358 | | | | 7,271,316 | |
FNMA ± | | | 2.36 | | | | 9-1-2039 | | | | 8,383,927 | | | | 8,931,630 | |
FNMA ± | | | 2.36 | | | | 4-1-2033 | | | | 1,066,465 | | | | 1,142,984 | |
FNMA ± | | | 2.36 | | | | 6-1-2036 | | | | 5,327,267 | | | | 5,695,054 | |
FNMA ± | | | 2.37 | | | | 8-1-2026 | | | | 862,540 | | | | 918,153 | |
FNMA ± | | | 2.37 | | | | 9-1-2030 | | | | 1,314,651 | | | | 1,413,161 | |
FNMA ± | | | 2.37 | | | | 6-1-2034 | | | | 5,138,599 | | | | 5,484,554 | |
FNMA ± | | | 2.37 | | | | 12-1-2035 | | | | 5,863,484 | | | | 6,253,389 | |
FNMA ± | | | 2.37 | | | | 3-1-2035 | | | | 5,047,676 | | | | 5,384,933 | |
FNMA ± | | | 2.37 | | | | 6-1-2027 | | | | 1,591 | | | | 1,642 | |
FNMA ± | | | 2.38 | | | | 8-1-2017 | | | | 331,905 | | | | 333,645 | |
FNMA ± | | | 2.38 | | | | 6-1-2025 | | | | 9,059 | | | | 9,111 | |
FNMA ± | | | 2.38 | | | | 10-1-2029 | | | | 130,388 | | | | 133,627 | |
FNMA ± | | | 2.38 | | | | 5-1-2034 | | | | 1,007,026 | | | | 1,072,983 | |
FNMA ± | | | 2.38 | | | | 4-1-2035 | | | | 2,888,012 | | | | 3,093,036 | |
FNMA ± | | | 2.38 | | | | 5-1-2035 | | | | 771,811 | | | | 811,563 | |
FNMA ± | | | 2.38 | | | | 1-1-2038 | | | | 1,658,867 | | | | 1,775,719 | |
FNMA ± | | | 2.39 | | | | 7-1-2036 | | | | 4,124,702 | | | | 4,453,303 | |
FNMA ± | | | 2.39 | | | | 12-1-2040 | | | | 5,438,548 | | | | 5,807,615 | |
FNMA ± | | | 2.39 | | | | 9-1-2019 | | | | 6,028 | | | | 6,075 | |
FNMA ± | | | 2.40 | | | | 2-1-2036 | | | | 12,401,812 | | | | 13,401,749 | |
FNMA ± | | | 2.40 | | | | 5-1-2037 | | | | 2,886,710 | | | | 3,120,398 | |
FNMA ± | | | 2.40 | | | | 2-1-2038 | | | | 7,200,442 | | | | 7,734,077 | |
FNMA ± | | | 2.40 | | | | 4-1-2024 | | | | 71,719 | | | | 72,452 | |
FNMA ± | | | 2.40 | | | | 4-1-2024 | | | | 25,392 | | | | 26,415 | |
FNMA ± | | | 2.40 | | | | 7-1-2024 | | | | 15,319 | | | | 15,405 | |
FNMA ± | | | 2.40 | | | | 9-1-2026 | | | | 108,925 | | | | 112,661 | |
FNMA ± | | | 2.40 | | | | 2-1-2037 | | | | 4,094,121 | | | | 4,419,066 | |
| | | | |
| 12 | | Wells Fargo Advantage Adjustable Rate Government Fund | | Portfolio of investments—February 28, 2015 (unaudited) |
| | | | | | | | | | | | | | | | |
| Security name | | Interest rate | | | Maturity date | | | Principal | | | Value | |
| | | | |
Agency Securities (continued) | | | | | | | | | | | | | | | | |
FNMA ± | | | 2.40 | % | | | 10-1-2034 | | | $ | 762,715 | | | $ | 825,448 | |
FNMA ± | | | 2.41 | | | | 11-1-2022 | | | | 70,553 | | | | 71,004 | |
FNMA ± | | | 2.41 | | | | 10-1-2036 | | | | 1,395,787 | | | | 1,491,403 | |
FNMA ± | | | 2.41 | | | | 8-1-2034 | | | | 3,735,772 | | | | 4,010,293 | |
FNMA ± | | | 2.41 | | | | 9-1-2036 | | | | 906,062 | | | | 965,006 | |
FNMA ± | | | 2.42 | | | | 12-1-2030 | | | | 83,068 | | | | 85,376 | |
FNMA ± | | | 2.42 | | | | 6-1-2037 | | | | 1,460,958 | | | | 1,566,514 | |
FNMA ± | | | 2.42 | | | | 9-1-2030 | | | | 193,939 | | | | 199,926 | |
FNMA ± | | | 2.42 | | | | 9-1-2037 | | | | 1,076,085 | | | | 1,150,613 | |
FNMA ± | | | 2.42 | | | | 8-1-2035 | | | | 1,465,538 | | | | 1,538,703 | |
FNMA ± | | | 2.43 | | | | 5-1-2033 | | | | 1,264,554 | | | | 1,361,650 | |
FNMA ± | | | 2.43 | | | | 7-1-2033 | | | | 1,387,044 | | | | 1,486,576 | |
FNMA ± | | | 2.43 | | | | 5-1-2034 | | | | 2,213,503 | | | | 2,369,132 | |
FNMA ± | | | 2.43 | | | | 4-1-2036 | | | | 5,614,153 | | | | 6,010,893 | |
FNMA ± | | | 2.44 | | | | 12-1-2034 | | | | 1,317,091 | | | | 1,414,139 | |
FNMA ± | | | 2.44 | | | | 1-1-2037 | | | | 1,893,691 | | | | 2,025,397 | |
FNMA ± | | | 2.44 | | | | 12-1-2028 | | | | 46,250 | | | | 47,183 | |
FNMA ± | | | 2.44 | | | | 2-1-2035 | | | | 1,778,736 | | | | 1,898,499 | |
FNMA ± | | | 2.44 | | | | 5-1-2035 | | | | 2,390,954 | | | | 2,566,323 | |
FNMA ± | | | 2.44 | | | | 5-1-2025 | | | | 49,786 | | | | 50,266 | |
FNMA ± | | | 2.44 | | | | 10-1-2034 | | | | 1,488,551 | | | | 1,583,932 | |
FNMA ± | | | 2.45 | | | | 4-1-2028 | | | | 323,262 | | | | 337,067 | |
FNMA ± | | | 2.45 | | | | 6-1-2032 | | | | 47,591 | | | | 47,880 | |
FNMA ± | | | 2.45 | | | | 12-1-2046 | | | | 1,514,106 | | | | 1,618,919 | |
FNMA ± | | | 2.45 | | | | 9-1-2035 | | | | 933,989 | | | | 1,000,909 | |
FNMA ± | | | 2.45 | | | | 7-1-2020 | | | | 118,593 | | | | 121,352 | |
FNMA ± | | | 2.45 | | | | 6-1-2017 | | | | 14,121 | | | | 14,169 | |
FNMA ± | | | 2.45 | | | | 4-1-2020 | | | | 5,667 | | | | 5,683 | |
FNMA ± | | | 2.45 | | | | 1-1-2028 | | | | 8,940 | | | | 8,994 | |
FNMA ± | | | 2.45 | | | | 3-1-2033 | | | | 7,138 | | | | 7,176 | |
FNMA ± | | | 2.45 | | | | 1-1-2026 | | | | 366,619 | | | | 382,742 | |
FNMA ± | | | 2.45 | | | | 9-1-2028 | | | | 111,693 | | | | 114,671 | |
FNMA ± | | | 2.45 | | | | 11-1-2020 | | | | 968,751 | | | | 974,144 | |
FNMA ± | | | 2.45 | | | | 1-1-2033 | | | | 2,347,915 | | | | 2,508,392 | |
FNMA ± | | | 2.45 | | | | 4-1-2033 | | | | 559,869 | | | | 590,894 | |
FNMA ± | | | 2.46 | | | | 11-1-2024 | | | | 164,502 | | | | 171,451 | |
FNMA ± | | | 2.47 | | | | 7-1-2030 | | | | 1,376,228 | | | | 1,473,896 | |
FNMA ± | | | 2.47 | | | | 1-1-2032 | | | | 127,065 | | | | 131,067 | |
FNMA ± | | | 2.47 | | | | 3-1-2037 | | | | 5,502,141 | | | | 5,917,370 | |
FNMA ± | | | 2.47 | | | | 4-1-2030 | | | | 22,476 | | | | 23,693 | |
FNMA ± | | | 2.47 | | | | 9-1-2022 | | | | 398,231 | | | | 423,276 | |
FNMA ± | | | 2.48 | | | | 6-1-2030 | | | | 191,447 | | | | 197,746 | |
FNMA ± | | | 2.48 | | | | 6-1-2027 | | | | 93,793 | | | | 95,408 | |
FNMA ± | | | 2.48 | | | | 1-1-2029 | | | | 734,151 | | | | 766,499 | |
FNMA ± | | | 2.49 | | | | 11-1-2034 | | | | 6,877,917 | | | | 7,353,716 | |
FNMA ± | | | 2.49 | | | | 1-1-2036 | | | | 134,929 | | | | 140,726 | |
FNMA ± | | | 2.49 | | | | 12-1-2030 | | | | 894,832 | | | | 953,371 | |
FNMA ± | | | 2.49 | | | | 9-1-2033 | | | | 1,259,788 | | | | 1,338,375 | |
FNMA ± | | | 2.49 | | | | 9-1-2032 | | | | 164,403 | | | | 168,485 | |
FNMA ± | | | 2.49 | | | | 7-1-2028 | | | | 1,280,268 | | | | 1,344,254 | |
| | | | | | |
| Portfolio of investments—February 28, 2015 (unaudited) | | Wells Fargo Advantage Adjustable Rate Government Fund | | | 13 | |
| | | | | | | | | | | | | | | | |
| Security name | | Interest rate | | | Maturity date | | | Principal | | | Value | |
| | | | |
Agency Securities (continued) | | | | | | | | | | | | | | | | |
FNMA ± | | | 2.49 | % | | | 3-1-2033 | | | $ | 2,107,420 | | | $ | 2,254,921 | |
FNMA ± | | | 2.49 | | | | 8-1-2040 | | | | 1,116,946 | | | | 1,201,306 | |
FNMA ± | | | 2.50 | | | | 7-1-2027 | | | | 30,626 | | | | 30,810 | |
FNMA ± | | | 2.50 | | | | 9-1-2030 | | | | 1,008,772 | | | | 1,082,454 | |
FNMA ± | | | 2.50 | | | | 5-1-2017 | | | | 37,327 | | | | 38,306 | |
FNMA ± | | | 2.50 | | | | 7-1-2017 | | | | 40,041 | | | | 40,146 | |
FNMA ± | | | 2.50 | | | | 2-1-2019 | | | | 1,787 | | | | 1,797 | |
FNMA ± | | | 2.50 | | | | 7-1-2027 | | | | 346,622 | | | | 361,634 | |
FNMA ± | | | 2.51 | | | | 10-1-2027 | | | | 971,474 | | | | 1,030,877 | |
FNMA ± | | | 2.52 | | | | 7-1-2017 | | | | 91,104 | | | | 91,619 | |
FNMA ± | | | 2.52 | | | | 8-1-2035 | | | | 1,750,758 | | | | 1,876,991 | |
FNMA ± | | | 2.52 | | | | 5-1-2028 | | | | 71,866 | | | | 72,679 | |
FNMA ± | | | 2.53 | | | | 6-1-2024 | | | | 55,768 | | | | 56,572 | |
FNMA ± | | | 2.53 | | | | 5-1-2036 | | | | 741,429 | | | | 797,023 | |
FNMA ± | | | 2.53 | | | | 7-1-2037 | | | | 3,347,128 | | | | 3,595,479 | |
FNMA ± | | | 2.53 | | | | 5-1-2027 | | | | 96,857 | | | | 101,256 | |
FNMA ± | | | 2.54 | | | | 7-1-2037 | | | | 1,174,048 | | | | 1,237,037 | |
FNMA ± | | | 2.54 | | | | 10-1-2017 | | | | 2,331 | | | | 2,340 | |
FNMA ± | | | 2.54 | | | | 9-1-2033 | | | | 956,827 | | | | 1,028,879 | |
FNMA ± | | | 2.54 | | | | 4-1-2018 | | | | 371,306 | | | | 387,203 | |
FNMA ± | | | 2.55 | | | | 9-1-2019 | | | | 57,453 | | | | 58,010 | |
FNMA ± | | | 2.55 | | | | 8-1-2036 | | | | 550,079 | | | | 588,157 | |
FNMA ± | | | 2.55 | | | | 8-1-2035 | | | | 3,881,543 | | | | 4,166,196 | |
FNMA ± | | | 2.56 | | | | 12-1-2021 | | | | 70,111 | | | | 71,993 | |
FNMA ± | | | 2.57 | | | | 5-1-2018 | | | | 508 | | | | 508 | |
FNMA ± | | | 2.57 | | | | 10-1-2024 | | | | 10,132 | | | | 10,675 | |
FNMA ± | | | 2.58 | | | | 3-1-2027 | | | | 182,867 | | | | 190,799 | |
FNMA ± | | | 2.58 | | | | 3-1-2035 | | | | 4,291,102 | | | | 4,608,474 | |
FNMA ± | | | 2.59 | | | | 9-1-2021 | | | | 96,384 | | | | 98,443 | |
FNMA ± | | | 2.59 | | | | 9-1-2035 | | | | 151,186 | | | | 161,750 | |
FNMA ± | | | 2.60 | | | | 6-1-2032 | | | | 136,508 | | | | 140,947 | |
FNMA ± | | | 2.60 | | | | 4-1-2036 | | | | 5,088,733 | | | | 5,461,174 | |
FNMA ± | | | 2.61 | | | | 6-1-2040 | | | | 1,157,951 | | | | 1,225,340 | |
FNMA ± | | | 2.61 | | | | 5-1-2028 | | | | 221,161 | | | | 235,425 | |
FNMA ± | | | 2.62 | | | | 9-1-2030 | | | | 890,815 | | | | 954,725 | |
FNMA ± | | | 2.63 | | | | 6-1-2016 | | | | 37,276 | | | | 37,872 | |
FNMA ± | | | 2.63 | | | | 7-1-2016 | | | | 7,605 | | | | 7,643 | |
FNMA ± | | | 2.63 | | | | 6-1-2018 | | | | 15,080 | | | | 15,124 | |
FNMA ± | | | 2.63 | | | | 8-1-2018 | | | | 59,965 | | | | 61,096 | |
FNMA ± | | | 2.63 | | | | 12-1-2028 | | | | 128,955 | | | | 133,672 | |
FNMA ± | | | 2.63 | | | | 1-1-2029 | | | | 16,163 | | | | 16,775 | |
FNMA ± | | | 2.63 | | | | 10-1-2029 | | | | 564,297 | | | | 595,682 | |
FNMA ± | | | 2.63 | | | | 3-1-2034 | | | | 1,330,918 | | | | 1,427,280 | |
FNMA ± | | | 2.64 | | | | 11-1-2024 | | | | 87,270 | | | | 88,225 | |
FNMA ± | | | 2.64 | | | | 9-1-2030 | | | | 765,828 | | | | 816,521 | |
FNMA ± | | | 2.65 | | | | 11-1-2024 | | | | 45,527 | | | | 45,749 | |
FNMA ± | | | 2.66 | | | | 5-1-2035 | | | | 2,315,522 | | | | 2,491,064 | |
FNMA ± | | | 2.66 | | | | 1-1-2019 | | | | 2,960 | | | | 2,965 | |
FNMA ± | | | 2.66 | | | | 5-1-2035 | | | | 3,621,201 | | | | 3,898,737 | |
FNMA ± | | | 2.68 | | | | 10-1-2018 | | | | 201,341 | | | | 211,739 | |
| | | | |
| 14 | | Wells Fargo Advantage Adjustable Rate Government Fund | | Portfolio of investments—February 28, 2015 (unaudited) |
| | | | | | | | | | | | | | | | |
| Security name | | Interest rate | | | Maturity date | | | Principal | | | Value | |
| | | | |
Agency Securities (continued) | | | | | | | | | | | | | | | | |
FNMA ± | | | 2.68 | % | | | 1-1-2025 | | | $ | 66,688 | | | $ | 67,726 | |
FNMA ± | | | 2.70 | | | | 3-1-2032 | | | | 138,716 | | | | 142,772 | |
FNMA ± | | | 2.70 | | | | 3-1-2035 | | | | 4,191,253 | | | | 4,511,168 | |
FNMA ± | | | 2.72 | | | | 10-1-2025 | | | | 11,144 | | | | 11,385 | |
FNMA ± | | | 2.72 | | | | 4-1-2026 | | | | 8,567 | | | | 8,627 | |
FNMA ± | | | 2.72 | | | | 2-1-2028 | | | | 46,842 | | | | 47,190 | |
FNMA ± | | | 2.74 | | | | 10-1-2018 | | | | 105,143 | | | | 106,016 | |
FNMA ± | | | 2.74 | | | | 4-1-2020 | | | | 1,876,227 | | | | 1,931,359 | |
FNMA ± | | | 2.75 | | | | 9-1-2017 | | | | 292,986 | | | | 296,248 | |
FNMA ± | | | 2.75 | | | | 6-1-2018 | | | | 1,461 | | | | 1,475 | |
FNMA ± | | | 2.75 | | | | 7-1-2039 | | | | 2,818,975 | | | | 3,085,829 | |
FNMA ± | | | 2.76 | | | | 5-1-2018 | | | | 308,397 | | | | 310,256 | |
FNMA ± | | | 2.77 | | | | 7-1-2028 | | | | 352,076 | | | | 367,470 | |
FNMA ± | | | 2.77 | | | | 10-1-2025 | | | | 8,935 | | | | 8,970 | |
FNMA ± | | | 2.78 | | | | 10-1-2028 | | | | 234,778 | | | | 244,718 | |
FNMA ± | | | 2.79 | | | | 1-1-2033 | | | | 167,787 | | | | 172,766 | |
FNMA ± | | | 2.79 | | | | 7-1-2020 | | | | 1,676,482 | | | | 1,686,565 | |
FNMA ± | | | 2.80 | | | | 11-1-2035 | | | | 12,914,315 | | | | 13,884,685 | |
FNMA ± | | | 2.81 | | | | 11-1-2034 | | | | 5,007,102 | | | | 5,407,606 | |
FNMA ± | | | 2.84 | | | | 7-1-2019 | | | | 2,407 | | | | 2,450 | |
FNMA ± | | | 2.86 | | | | 7-1-2033 | | | | 41,004 | | | | 41,325 | |
FNMA ± | | | 2.88 | | | | 3-1-2019 | | | | 438,844 | | | | 467,075 | |
FNMA ± | | | 2.92 | | | | 4-1-2040 | | | | 2,677,048 | | | | 2,902,158 | |
FNMA ± | | | 2.92 | | | | 4-1-2033 | | | | 512,906 | | | | 541,997 | |
FNMA ± | | | 2.93 | | | | 9-1-2032 | | | | 1,768,004 | | | | 1,928,914 | |
FNMA ± | | | 2.94 | | | | 2-1-2029 | | | | 107,826 | | | | 111,020 | |
FNMA ± | | | 2.94 | | | | 1-1-2029 | | | | 24,386 | | | | 25,779 | |
FNMA ± | | | 2.98 | | | | 5-1-2017 | | | | 43,877 | | | | 45,241 | |
FNMA ± | | | 2.98 | | | | 8-1-2029 | | | | 661,237 | | | | 699,349 | |
FNMA ± | | | 2.98 | | | | 11-1-2028 | | | | 135,607 | | | | 140,188 | |
FNMA ± | | | 3.00 | | | | 8-1-2030 | | | | 242,695 | | | | 249,256 | |
FNMA ± | | | 3.02 | | | | 1-1-2031 | | | | 79,278 | | | | 80,231 | |
FNMA ± | | | 3.09 | | | | 8-1-2031 | | | | 68,991 | | | | 69,751 | |
FNMA ± | | | 3.09 | | | | 4-1-2024 | | | | 361,351 | | | | 385,923 | |
FNMA ± | | | 3.09 | | | | 3-1-2030 | | | | 154,835 | | | | 159,320 | |
FNMA ± | | | 3.14 | | | | 1-1-2021 | | | | 502,094 | | | | 528,694 | |
FNMA ± | | | 3.15 | | | | 10-1-2024 | | | | 49,285 | | | | 49,575 | |
FNMA ± | | | 3.16 | | | | 9-1-2033 | | | | 43,596 | | | | 43,838 | |
FNMA ± | | | 3.16 | | | | 7-1-2033 | | | | 26,642 | | | | 26,910 | |
FNMA ± | | | 3.17 | | | | 1-1-2033 | | | | 70,481 | | | | 71,681 | |
FNMA ± | | | 3.22 | | | | 4-1-2034 | | | | 2,911,366 | | | | 3,144,955 | |
FNMA ± | | | 3.25 | | | | 9-1-2017 | | | | 1,868 | | | | 1,877 | |
FNMA ± | | | 3.26 | | | | 7-1-2028 | | | | 71,681 | | | | 74,496 | |
FNMA ± | | | 3.34 | | | | 2-1-2029 | | | | 2,024,005 | | | | 2,178,631 | |
FNMA ± | | | 3.45 | | | | 11-1-2031 | | | | 44,149 | | | | 44,413 | |
FNMA ± | | | 3.46 | | | | 11-1-2029 | | | | 10,054 | | | | 10,142 | |
FNMA ± | | | 3.47 | | | | 6-1-2024 | | | | 30,231 | | | | 30,441 | |
FNMA ± | | | 3.48 | | | | 7-1-2021 | | | | 173,327 | | | | 179,306 | |
FNMA ± | | | 3.48 | | | | 10-1-2034 | | | | 282,034 | | | | 296,267 | |
FNMA ± | | | 3.51 | | | | 5-1-2033 | | | | 1,728,064 | | | | 1,866,150 | |
| | | | | | |
| Portfolio of investments—February 28, 2015 (unaudited) | | Wells Fargo Advantage Adjustable Rate Government Fund | | | 15 | |
| | | | | | | | | | | | | | | | |
| Security name | | Interest rate | | | Maturity date | | | Principal | | | Value | |
| | | | |
Agency Securities (continued) | | | | | | | | | | | | | | | | |
FNMA ± | | | 3.56 | % | | | 10-1-2018 | | | $ | 35 | | | $ | 36 | |
FNMA ± | | | 3.58 | | | | 10-1-2017 | | | | 431,365 | | | | 442,154 | |
FNMA ± | | | 3.67 | | | | 5-1-2017 | | | | 677 | | | | 683 | |
FNMA ± | | | 3.72 | | | | 7-1-2017 | | | | 23,076 | | | | 24,397 | |
FNMA ± | | | 3.78 | | | | 4-1-2033 | | | | 212,606 | | | | 220,140 | |
FNMA ± | | | 3.85 | | | | 12-1-2032 | | | | 171,292 | | | | 177,628 | |
FNMA ± | | | 3.89 | | | | 9-1-2031 | | | | 329,147 | | | | 345,450 | |
FNMA ± | | | 3.90 | | | | 9-1-2028 | | | | 4,769 | | | | 5,059 | |
FNMA ± | | | 3.92 | | | | 2-1-2033 | | | | 98,630 | | | | 100,254 | |
FNMA ± | | | 3.92 | | | | 4-1-2032 | | | | 251,016 | | | | 254,072 | |
FNMA ± | | | 3.95 | | | | 9-1-2023 | | | | 6,024 | | | | 6,075 | |
FNMA ± | | | 4.03 | | | | 5-1-2034 | | | | 477,671 | | | | 504,402 | |
FNMA ± | | | 4.17 | | | | 6-1-2019 | | | | 3,975 | | | | 4,048 | |
FNMA ± | | | 4.19 | | | | 9-1-2017 | | | | 2,032 | | | | 2,055 | |
FNMA ± | | | 4.20 | | | | 11-1-2031 | | | | 21,764 | | | | 21,896 | |
FNMA ± | | | 4.20 | | | | 11-1-2031 | | | | 142,978 | | | | 146,715 | |
FNMA ± | | | 4.26 | | | | 8-1-2017 | | | | 24,470 | | | | 24,982 | |
FNMA ± | | | 4.30 | | | | 1-1-2018 | | | | 760 | | | | 768 | |
FNMA ± | | | 4.37 | | | | 12-1-2036 | | | | 137,217 | | | | 146,380 | |
FNMA ± | | | 4.48 | | | | 6-1-2034 | | | | 313,816 | | | | 333,352 | |
FNMA ± | | | 4.56 | | | | 11-1-2019 | | | | 343 | | | | 349 | |
FNMA ± | | | 4.62 | | | | 2-1-2019 | | | | 374,759 | | | | 391,904 | |
FNMA ± | | | 4.64 | | | | 1-1-2019 | | | | 431,565 | | | | 450,793 | |
FNMA ± | | | 4.70 | | | | 6-1-2028 | | | | 64,656 | | | | 67,036 | |
FNMA ± | | | 4.85 | | | | 4-1-2018 | | | | 170,406 | | | | 172,532 | |
FNMA ± | | | 5.00 | | | | 6-1-2028 | | | | 27,451 | | | | 27,713 | |
FNMA ± | | | 5.08 | | | | 5-1-2025 | | | | 85 | | | | 85 | |
FNMA ± | | | 5.25 | | | | 10-1-2021 | | | | 12,827 | | | | 12,950 | |
FNMA | | | 5.50 | | | | 9-1-2019 | | | | 139,048 | | | | 146,921 | |
FNMA ± | | | 5.67 | | | | 1-1-2019 | | | | 72,990 | | | | 76,612 | |
FNMA ± | | | 6.00 | | | | 1-1-2020 | | | | 9,451 | | | | 9,716 | |
FNMA ± | | | 6.12 | | | | 9-1-2017 | | | | 135 | | | | 136 | |
FNMA ± | | | 6.45 | | | | 2-1-2034 | | | | 72,212 | | | | 73,091 | |
FNMA | | | 6.50 | | | | 8-1-2028 | | | | 68,110 | | | | 70,749 | |
FNMA | | | 6.50 | | | | 5-1-2031 | | | | 196,968 | | | | 225,226 | |
FNMA | | | 7.00 | | | | 11-1-2017 | | | | 10,464 | | | | 10,892 | |
FNMA | | | 7.06 | | | | 11-1-2024 | | | | 46,600 | | | | 48,423 | |
FNMA | | | 7.06 | | | | 12-1-2024 | | | | 33,298 | | | | 33,938 | |
FNMA | | | 7.06 | | | | 3-1-2025 | | | | 62,539 | | | | 65,547 | |
FNMA | | | 7.06 | | | | 3-1-2025 | | | | 10,425 | | | | 10,548 | |
FNMA | | | 7.06 | | | | 4-1-2025 | | | | 22,700 | | | | 22,972 | |
FNMA | | | 7.06 | | | | 1-1-2027 | | | | 58,437 | | | | 60,702 | |
FNMA | | | 7.50 | | | | 2-1-2016 | | | | 56,809 | | | | 57,799 | |
FNMA | | | 7.50 | | | | 1-1-2031 | | | | 173,167 | | | | 196,579 | |
FNMA | | | 7.50 | | | | 1-1-2033 | | | | 314,750 | | | | 360,585 | |
FNMA | | | 7.50 | | | | 5-1-2033 | | | | 224,470 | | | | 256,780 | |
FNMA | | | 7.50 | | | | 5-1-2033 | | | | 208,079 | | | | 234,198 | |
FNMA | | | 7.50 | | | | 6-1-2033 | | | | 133,063 | | | | 145,127 | |
FNMA | | | 7.50 | | | | 7-1-2033 | | | | 253,516 | | | | 292,835 | |
FNMA | | | 7.50 | | | | 8-1-2033 | | | | 114,628 | | | | 128,124 | |
| | | | |
| 16 | | Wells Fargo Advantage Adjustable Rate Government Fund | | Portfolio of investments—February 28, 2015 (unaudited) |
| | | | | | | | | | | | | | | | |
| Security name | | Interest rate | | | Maturity date | | | Principal | | | Value | |
| | | | |
Agency Securities (continued) | | | | | | | | | | | | | | | | |
FNMA | | | 8.00 | % | | | 12-1-2026 | | | $ | 114,223 | | | $ | 129,267 | |
FNMA | | | 8.00 | | | | 2-1-2030 | | | | 314 | | | | 322 | |
FNMA | | | 8.00 | | | | 3-1-2030 | | | | 367 | | | | 414 | |
FNMA | | | 8.00 | | | | 7-1-2031 | | | | 42,543 | | | | 43,895 | |
FNMA | | | 8.00 | | | | 5-1-2033 | | | | 248,462 | | | | 287,718 | |
FNMA | | | 8.50 | | | | 10-1-2026 | | | | 16,684 | | | | 18,936 | |
FNMA | | | 8.50 | | | | 2-1-2027 | | | | 18,538 | | | | 18,930 | |
FNMA | | | 8.50 | | | | 6-1-2030 | | | | 59,730 | | | | 62,545 | |
FNMA | | | 8.51 | | | | 8-15-2024 | | | | 72,237 | | | | 81,645 | |
FNMA | | | 9.00 | | | | 7-1-2030 | | | | 11,243 | | | | 11,406 | |
FNMA | | | 9.50 | | | | 8-1-2021 | | | | 24,933 | | | | 25,608 | |
FNMA | | | 9.50 | | | | 12-1-2024 | | | | 19,030 | | | | 19,567 | |
FNMA | | | 10.00 | | | | 1-20-2021 | | | | 21,207 | | | | 21,786 | |
FNMA | | | 11.00 | | | | 1-1-2018 | | | | 7,015 | | | | 7,621 | |
FNMA Series 1989-74 Class J | | | 9.80 | | | | 10-25-2019 | | | | 19,139 | | | | 21,544 | |
FNMA Series 1989-96 Class H | | | 9.00 | | | | 12-25-2019 | | | | 9,290 | | | | 10,210 | |
FNMA Series 1992-39 Class FA ± | | | 1.92 | | | | 3-25-2022 | | | | 207,125 | | | | 211,510 | |
FNMA Series 1992-45 Class F ± | | | 1.92 | | | | 4-25-2022 | | | | 38,948 | | | | 39,791 | |
FNMA Series 1992-87 Class Z | | | 8.00 | | | | 5-25-2022 | | | | 25,520 | | | | 28,629 | |
FNMA Series 1993-113 Class FA ± | | | 1.46 | | | | 7-25-2023 | | | | 154,245 | | | | 155,384 | |
FNMA Series 1993-247 Class FM ± | | | 1.89 | | | | 12-25-2023 | | | | 529,282 | | | | 544,556 | |
FNMA Series 1994-14 Class F ± | | | 2.29 | | | | 10-25-2023 | | | | 342,516 | | | | 355,953 | |
FNMA Series 1998-T2 Class A5 ± | | | 2.30 | | | | 1-25-2032 | | | | 592,328 | | | | 603,408 | |
FNMA Series 2001-50 Class BA | | | 7.00 | | | | 10-25-2041 | | | | 276,981 | | | | 316,534 | |
FNMA Series 2001-63 Class FD ± | | | 0.77 | | | | 12-18-2031 | | | | 183,425 | | | | 186,504 | |
FNMA Series 2001-81 Class F ± | | | 0.72 | | | | 1-25-2032 | | | | 121,398 | | | | 123,310 | |
FNMA Series 2001-T08 Class A1 | | | 7.50 | | | | 7-25-2041 | | | | 195,697 | | | | 220,821 | |
FNMA Series 2001-T10 Class A2 | | | 7.50 | | | | 12-25-2041 | | | | 4,316,402 | | | | 5,018,530 | |
FNMA Series 2001-T12 Class A2 | | | 7.50 | | | | 8-25-2041 | | | | 314,184 | | | | 367,979 | |
FNMA Series 2001-T12 Class A4 ± | | | 3.36 | | | | 8-25-2041 | | | | 7,625,454 | | | | 7,870,033 | |
FNMA Series 2001-W03 Class A ± | | | 6.92 | | | | 9-25-2041 | | | | 925,980 | | | | 1,058,656 | |
FNMA Series 2002-05 Class FD ± | | | 1.07 | | | | 2-25-2032 | | | | 346,838 | | | | 355,964 | |
FNMA Series 2002-33 Class A4 ± | | | 4.62 | | | | 11-25-2030 | | | | 191,965 | | | | 201,362 | |
FNMA Series 2002-59 Class F ± | | | 0.57 | | | | 9-25-2032 | | | | 727,094 | | | | 734,420 | |
FNMA Series 2002-66 Class A3 ± | | | 3.12 | | | | 4-25-2042 | | | | 11,235,040 | | | | 11,581,056 | |
FNMA Series 2002-T12 Class A3 | | | 7.50 | | | | 5-25-2042 | | | | 1,826,046 | | | | 2,180,589 | |
FNMA Series 2002-T12 Class A5 ± | | | 3.48 | | | | 10-25-2041 | | | | 2,673,031 | | | | 2,749,939 | |
FNMA Series 2002-T18 Class A5 ± | | | 3.61 | | | | 5-25-2042 | | | | 2,433,217 | | | | 2,568,939 | |
FNMA Series 2002-T19 Class A4 ± | | | 3.28 | | | | 3-25-2042 | | | | 265,141 | | | | 282,197 | |
FNMA Series 2002-W1 Class 3A ± | | | 3.13 | | | | 4-25-2042 | | | | 1,779,271 | | | | 1,844,541 | |
FNMA Series 2002-W4 Class A6 ± | | | 3.36 | | | | 5-25-2042 | | | | 2,931,224 | | | | 3,071,563 | |
FNMA Series 2003-07 Class A2 ± | | | 2.47 | | | | 5-25-2042 | | | | 1,281,391 | | | | 1,308,234 | |
FNMA Series 2003-17 Class FN ± | | | 0.47 | | | | 3-25-2018 | | | | 533,134 | | | | 533,282 | |
FNMA Series 2003-63 Class A8 ± | | | 2.66 | | | | 1-25-2043 | | | | 1,841,153 | | | | 1,909,626 | |
FNMA Series 2003-W02 Class 1A3 | | | 7.50 | | | | 7-25-2042 | | | | 546,539 | | | | 650,401 | |
FNMA Series 2003-W04 Class 5A ± | | | 2.94 | | | | 10-25-2042 | | | | 1,560,075 | | | | 1,647,297 | |
FNMA Series 2003-W08 Class 4A ± | | | 3.18 | | | | 11-25-2042 | | | | 2,191,508 | | | | 2,279,337 | |
FNMA Series 2003-W10 Class 2A ± | | | 3.08 | | | | 6-25-2043 | | | | 4,153,383 | | | | 4,384,212 | |
FNMA Series 2003-W18 Class 2A ± | | | 3.43 | | | | 6-25-2043 | | | | 14,978,638 | | | | 16,225,100 | |
FNMA Series 2004-31 Class FG ± | | | 0.57 | | | | 8-25-2033 | | | | 761,564 | | | | 763,885 | |
| | | | | | |
| Portfolio of investments—February 28, 2015 (unaudited) | | Wells Fargo Advantage Adjustable Rate Government Fund | | | 17 | |
| | | | | | | | | | | | | | | | |
| Security name | | Interest rate | | | Maturity date | | | Principal | | | Value | |
| | | | |
Agency Securities (continued) | | | | | | | | | | | | | | | | |
FNMA Series 2004-38 Class FT ± | | | 0.60 | % | | | 10-25-2033 | | | $ | 493,986 | | | $ | 497,057 | |
FNMA Series 2004-T3 Class 1A3 | | | 7.00 | | | | 2-25-2044 | | | | 751,142 | | | | 864,892 | |
FNMA Series 2004-T3 Class 2A ± | | | 3.20 | | | | 8-25-2043 | | | | 2,449,092 | | | | 2,587,279 | |
FNMA Series 2004-T9 Class A1 ± | | | 0.45 | | | | 4-25-2035 | | | | 741,204 | | | | 738,115 | |
FNMA Series 2004-W02 Class 5A | | | 7.50 | | | | 3-25-2044 | | | | 252,450 | | | | 290,763 | |
FNMA Series 2004-W1 Class 2A2 | | | 7.00 | | | | 12-25-2033 | | | | 433,374 | | | | 509,301 | |
FNMA Series 2004-W1 Class 3A ± | | | 3.35 | | | | 1-25-2043 | | | | 128,850 | | | | 140,000 | |
FNMA Series 2004-W12 Class 2A ± | | | 3.34 | | | | 6-25-2044 | | | | 7,565,789 | | | | 8,033,491 | |
FNMA Series 2004-W15 Class 3A ± | | | 2.63 | | | | 6-25-2044 | | | | 9,789,228 | | | | 10,561,510 | |
FNMA Series 2005-57 Class EG ± | | | 0.47 | | | | 3-25-2035 | | | | 904,937 | | | | 906,672 | |
FNMA Series 2005-W3 Class 3A ± | | | 2.67 | | | | 4-25-2045 | | | | 1,996,326 | | | | 2,128,415 | |
FNMA Series 2006-15 Class FW ± | | | 0.47 | | | | 1-25-2036 | | | | 646,315 | | | | 649,743 | |
FNMA Series 2006-W1 Class 3A ± | | | 2.15 | | | | 10-25-2045 | | | | 10,619,366 | | | | 11,237,923 | |
FNMA Series 2007-95 Class A2 ± | | | 0.42 | | | | 8-27-2036 | | | | 979,347 | | | | 975,614 | |
FNMA Series 2011-40 Class DK | | | 4.00 | | | | 11-25-2037 | | | | 142,772 | | | | 143,462 | |
FNMA Series G92-20 Class FB ± | | | 1.92 | | | | 4-25-2022 | | | | 102,701 | | | | 102,337 | |
FNMA Series G93-1 Class K | | | 6.68 | | | | 1-25-2023 | | | | 646,650 | | | | 713,407 | |
FNMA Series G93-19 Class FD ± | | | 1.46 | | | | 4-25-2023 | | | | 570,353 | | | | 575,620 | |
GNMA ± | | | 2.04 | | | | 8-20-2062 | | | | 7,863,759 | | | | 8,322,664 | |
GNMA ± | | | 2.05 | | | | 9-20-2062 | | | | 2,463,588 | | | | 2,611,297 | |
GNMA | | | 6.45 | | | | 4-20-2025 | | | | 65,069 | | | | 74,199 | |
GNMA | | | 6.45 | | | | 5-20-2025 | | | | 27,089 | | | | 30,024 | |
GNMA | | | 6.45 | | | | 9-20-2025 | | | | 47,312 | | | | 55,664 | |
GNMA | | | 6.50 | | | | 6-20-2034 | | | | 82,652 | | | | 86,595 | |
GNMA | | | 6.50 | | | | 8-20-2034 | | | | 798,621 | | | | 899,792 | |
GNMA | | | 6.50 | | | | 8-20-2034 | | | | 117,560 | | | | 125,817 | |
GNMA | | | 6.75 | | | | 2-15-2029 | | | | 120,126 | | | | 137,454 | |
GNMA | | | 7.00 | | | | 7-20-2034 | | | | 64,401 | | | | 67,105 | |
GNMA | | | 7.25 | | | | 7-15-2017 | | | | 4,722 | | | | 4,742 | |
GNMA | | | 7.25 | | | | 8-15-2017 | | | | 18,796 | | | | 19,628 | |
GNMA | | | 7.25 | | | | 8-15-2017 | | | | 12,614 | | | | 12,778 | |
GNMA | | | 7.25 | | | | 9-15-2017 | | | | 20,470 | | | | 21,330 | |
GNMA | | | 7.25 | | | | 10-15-2017 | | | | 27,009 | | | | 28,276 | |
GNMA | | | 7.25 | | | | 10-15-2017 | | | | 11,910 | | | | 12,065 | |
GNMA | | | 7.25 | | | | 11-15-2017 | | | | 13,718 | | | | 13,905 | |
GNMA | | | 7.25 | | | | 1-15-2018 | | | | 5,327 | | | | 5,350 | |
GNMA | | | 7.25 | | | | 1-15-2018 | | | | 8,119 | | | | 8,154 | |
GNMA | | | 7.25 | | | | 2-15-2018 | | | | 15,849 | | | | 16,095 | |
GNMA | | | 7.25 | | | | 5-15-2018 | | | | 8,696 | | | | 8,734 | |
GNMA | | | 9.00 | | | | 5-15-2016 | | | | 3,468 | | | | 3,487 | |
GNMA | | | 9.00 | | | | 7-15-2016 | | | | 96 | | | | 96 | |
GNMA | | | 9.00 | | | | 8-15-2016 | | | | 5,153 | | | | 5,181 | |
GNMA | | | 9.00 | | | | 11-15-2016 | | | | 1,841 | | | | 1,867 | |
GNMA | | | 9.00 | | | | 12-15-2016 | | | | 131 | | | | 132 | |
GNMA | | | 9.00 | | | | 2-15-2017 | | | | 3,566 | | | | 3,627 | |
GNMA | | | 9.00 | | | | 5-15-2017 | | | | 624 | | | | 627 | |
GNMA | | | 9.00 | | | | 7-15-2017 | | | | 6,110 | | | | 6,145 | |
GNMA | | | 9.00 | | | | 3-15-2020 | | | | 3,427 | | | | 3,511 | |
GNMA | | | 9.00 | | | | 8-15-2021 | | | | 586 | | | | 590 | |
GNMA | | | 9.00 | | | | 8-20-2024 | | | | 377 | | | | 421 | |
| | | | |
| 18 | | Wells Fargo Advantage Adjustable Rate Government Fund | | Portfolio of investments—February 28, 2015 (unaudited) |
| | | | | | | | | | | | | | | | |
| Security name | | Interest rate | | | Maturity date | | | Principal | | | Value | |
| | | | |
Agency Securities (continued) | | | | | | | | | | | | | | | | |
GNMA | | | 9.00 | % | | | 9-20-2024 | | | $ | 1,812 | | | $ | 2,080 | |
GNMA | | | 9.00 | | | | 10-20-2024 | | | | 7,727 | | | | 8,538 | |
GNMA | | | 9.00 | | | | 11-20-2024 | | | | 176 | | | | 177 | |
GNMA | | | 9.00 | | | | 1-20-2025 | | | | 6,960 | | | | 8,058 | |
GNMA | | | 9.00 | | | | 2-20-2025 | | | | 23,080 | | | | 26,689 | |
GNMA Series 2008-6 Class DF ± | | | 0.57 | | | | 8-20-2032 | | | | 124,762 | | | | 124,824 | |
GNMA Series 2011-H12 Class FA ± | | | 0.66 | | | | 2-20-2061 | | | | 3,185,773 | | | | 3,189,978 | |
GNMA Series 2011-H17 Class FA ± | | | 0.70 | | | | 6-20-2061 | | | | 1,673,178 | | | | 1,677,753 | |
| | | | |
Total Agency Securities (Cost $1,256,177,401) | | | | | | | | | | | | | | | 1,279,495,413 | |
| | | | | | | | | | | | | | | | |
| | | | |
| | | Yield | | | | | | Shares | | | | |
| Short-Term Investments: 5.69% | | | | | | | | | | | | | | | | |
| | | | |
| Investment Companies: 5.62% | | | | | | | | | | | | | | | | |
Wells Fargo Advantage Government Money Market Fund, Institutional Class (l)(u) | | | 0.01 | | | | | | | | 76,055,353 | | | | 76,055,353 | |
| | | | | | | | | | | | | | | | |
| | | | |
| | | | | | | | | Principal | | | | |
| U.S. Treasury Securities: 0.07% | | | | | | | | | | | | | | | | |
U.S. Treasury Bill #(z) | | | 0.01 | | | | 3-19-2015 | | | $ | 900,000 | | | | 899,994 | |
| | | | | | | | | | | | | | | | |
| | | | |
Total Short-Term Investments (Cost $76,955,342) | | | | | | | | | | | | | | | 76,955,347 | |
| | | | | | | | | | | | | | | | |
| | | | | | | | |
| Total investments in securities (Cost $1,333,132,743) * | | | 100.28 | % | | | 1,356,450,760 | |
Other assets and liabilities, net | | | (0.28 | ) | | | (3,765,149 | ) |
| | | | | | | | |
| Total net assets | | | 100.00 | % | | $ | 1,352,685,611 | |
| | | | | | | | |
| 144A | The security may be resold in transactions exempt from registration, normally to qualified institutional buyers, pursuant to Rule 144A under the Securities Act of 1933. |
| ± | Variable rate investment. The rate shown is the rate in effect at period end. |
| (c) | Investment in an interest-only security entitles holders to receive only the interest payments on the underlying mortgages. The principal amount shown is the notional amount of the underlying mortgages. The rate represents the coupon rate. |
| (a) | The security is fair valued in accordance with procedures approved by the Board of Trustees. |
| (l) | The security represents an affiliate of the Fund as defined in the Investment Company Act of 1940. |
| (u) | The rate represents the 7-day annualized yield at period end. |
| # | All or a portion of this security is segregated as collateral for investments in derivative instruments. |
| (z) | Zero coupon security. The rate represents the current yield to maturity. |
| * | Cost for federal income tax purposes is $1,333,962,748 and unrealized gains (losses) consists of: |
| | | | |
Gross unrealized gains | | $ | 24,236,582 | |
Gross unrealized losses | | | (1,748,570 | ) |
| | | | |
Net unrealized gains | | $ | 22,488,012 | |
| | | | | | |
| Portfolio of investments—February 28, 2015 (unaudited) | | Wells Fargo Advantage Government Securities Fund | | | 1 | |
| | | | | | | | | | | | | | | | |
| Security name | | Interest rate | | | Maturity date | | | Principal | | | Value | |
| | | | |
Agency Securities: 72.84% | | | | | | | | | | | | | | | | |
FDIC Series 2010-S1 Class 1A 144A± | | | 0.72 | % | | | 2-25-2048 | | | $ | 6,508,796 | | | $ | 6,511,152 | |
FDIC Series 2013-R1 Class A 144A | | | 1.15 | | | | 3-25-2033 | | | | 5,366,002 | | | | 5,329,192 | |
FHLB ¤ | | | 0.00 | | | | 5-27-2015 | | | | 113,270,000 | | | | 113,259,126 | |
FHLB | | | 5.63 | | | | 3-14-2036 | | | | 6,150,000 | | | | 8,683,837 | |
FHLMC ± | | | 2.26 | | | | 10-1-2026 | | | | 225,022 | | | | 234,564 | |
FHLMC | | | 2.38 | | | | 1-13-2022 | | | | 10,415,000 | | | | 10,733,949 | |
FHLMC ± | | | 2.38 | | | | 6-1-2032 | | | | 85,191 | | | | 90,377 | |
FHLMC ± | | | 2.41 | | | | 9-1-2031 | | | | 56,294 | | | | 56,700 | |
FHLMC ± | | | 2.41 | | | | 9-1-2031 | | | | 9,472 | | | | 9,675 | |
FHLMC ± | | | 2.53 | | | | 1-1-2038 | | | | 1,096,886 | | | | 1,182,724 | |
FHLMC ± | | | 2.53 | | | | 7-1-2029 | | | | 206,373 | | | | 215,370 | |
FHLMC ± | | | 2.90 | | | | 5-1-2026 | | | | 120,318 | | | | 126,786 | |
FHLMC ± | | | 3.02 | | | | 7-1-2032 | | | | 1,505,636 | | | | 1,487,289 | |
FHLMC %% | | | 3.50 | | | | 3-1-2045 | | | | 54,565,000 | | | | 57,090,765 | |
FHLMC %% | | | 4.00 | | | | 3-1-2045 | | | | 11,875,000 | | | | 12,696,973 | |
FHLMC | | | 4.50 | | | | 3-1-2042 | | | | 1,073,226 | | | | 1,167,808 | |
FHLMC | | | 5.00 | | | | 5-1-2018 | | | | 227,321 | | | | 239,714 | |
FHLMC | | | 5.00 | | | | 4-1-2019 | | | | 211,585 | | | | 223,119 | |
FHLMC | | | 5.00 | | | | 4-1-2019 | | | | 239,423 | | | | 252,745 | |
FHLMC | | | 5.00 | | | | 6-1-2019 | | | | 334,179 | | | | 355,410 | |
FHLMC | | | 5.00 | | | | 8-1-2019 | | | | 1,200,048 | | | | 1,276,201 | |
FHLMC | | | 5.00 | | | | 10-1-2019 | | | | 436,062 | | | | 461,472 | |
FHLMC | | | 5.00 | | | | 2-1-2020 | | | | 1,267,393 | | | | 1,347,536 | |
FHLMC | | | 5.00 | | | | 8-1-2040 | | | | 3,184,837 | | | | 3,550,999 | |
FHLMC | | | 5.50 | | | | 7-1-2035 | | | | 8,105,433 | | | | 9,105,910 | |
FHLMC | | | 5.50 | | | | 12-1-2038 | | | | 5,331,382 | | | | 5,953,406 | |
FHLMC | | | 6.00 | | | | 1-1-2024 | | | | 3,165,257 | | | | 3,472,244 | |
FHLMC | | | 6.00 | | | | 10-1-2032 | | | | 67,832 | | | | 77,650 | |
FHLMC | | | 6.00 | | | | 5-25-2043 | | | | 6,668,020 | | | | 7,703,977 | |
FHLMC ± | | | 6.38 | | | | 1-1-2026 | | | | 78,108 | | | | 80,841 | |
FHLMC | | | 6.50 | | | | 4-1-2018 | | | | 19,987 | | | | 20,798 | |
FHLMC | | | 6.50 | | | | 4-1-2021 | | | | 36,979 | | | | 38,734 | |
FHLMC | | | 6.50 | | | | 4-1-2022 | | | | 122,090 | | | | 139,156 | |
FHLMC | | | 6.50 | | | | 9-1-2028 | | | | 37,968 | | | | 43,724 | |
FHLMC | | | 6.50 | | | | 9-1-2028 | | | | 23,159 | | | | 26,396 | |
FHLMC | | | 6.50 | | | | 7-1-2031 | | | | 6 | | | | 7 | |
FHLMC | | | 6.50 | | | | 8-1-2037 | | | | 213,461 | | | | 234,294 | |
FHLMC | | | 7.00 | | | | 12-1-2023 | | | | 6,113 | | | | 7,043 | |
FHLMC | | | 7.00 | | | | 5-1-2024 | | | | 11,081 | | | | 11,340 | |
FHLMC | | | 7.00 | | | | 12-1-2026 | | | | 4,238 | | | | 4,560 | |
FHLMC | | | 7.00 | | | | 12-1-2026 | | | | 349 | | | | 350 | |
FHLMC | | | 7.00 | | | | 12-1-2026 | | | | 862 | | | | 973 | |
FHLMC | | | 7.00 | | | | 4-1-2029 | | | | 3,121 | | | | 3,446 | |
FHLMC | | | 7.00 | | | | 4-1-2029 | | | | 1,723 | | | | 1,730 | |
FHLMC | | | 7.00 | | | | 5-1-2029 | | | | 22,384 | | | | 25,506 | |
FHLMC | | | 7.00 | | | | 4-1-2032 | | | | 196,357 | | | | 230,571 | |
FHLMC | | | 7.50 | | | | 11-1-2031 | | | | 294,355 | | | | 354,461 | |
FHLMC | | | 7.50 | | | | 4-1-2032 | | | | 245,996 | | | | 293,028 | |
FHLMC | | | 8.00 | | | | 2-1-2017 | | | | 6,146 | | | | 6,416 | |
FHLMC | | | 8.00 | | | | 8-1-2023 | | | | 29,951 | | | | 32,735 | |
| | | | |
| 2 | | Wells Fargo Advantage Government Securities Fund | | Portfolio of investments—February 28, 2015 (unaudited) |
| | | | | | | | | | | | | | | | |
| Security name | | Interest rate | | | Maturity date | | | Principal | | | Value | |
| | | | |
Agency Securities (continued) | | | | | | | | | | | | | | | | |
FHLMC | | | 8.00 | % | | | 6-1-2024 | | | $ | 8,444 | | | $ | 9,635 | |
FHLMC | | | 8.00 | | | | 6-1-2024 | | | | 3,862 | | | | 3,997 | |
FHLMC | | | 8.00 | | | | 6-1-2024 | | | | 12,168 | | | | 13,600 | |
FHLMC | | | 8.00 | | | | 8-1-2026 | | | | 26,007 | | | | 32,023 | |
FHLMC | | | 8.00 | | | | 11-1-2026 | | | | 28,348 | | | | 34,991 | |
FHLMC | | | 8.00 | | | | 11-1-2028 | | | | 20,436 | | | | 24,133 | |
FHLMC | | | 8.50 | | | | 7-1-2022 | | | | 4,969 | | | | 5,569 | |
FHLMC | | | 8.50 | | | | 12-1-2025 | | | | 17,537 | | | | 20,416 | |
FHLMC | | | 8.50 | | | | 5-1-2026 | | | | 2,779 | | | | 3,172 | |
FHLMC | | | 8.50 | | | | 8-1-2026 | | | | 6,655 | | | | 6,975 | |
FHLMC | | | 8.50 | | | | 8-1-2026 | | | | 25,627 | | | | 25,764 | |
FHLMC | | | 9.00 | | | | 6-1-2016 | | | | 1,396 | | | | 1,410 | |
FHLMC | | | 9.00 | | | | 1-1-2017 | | | | 4,996 | | | | 5,054 | |
FHLMC | | | 9.00 | | | | 4-1-2017 | | | | 7,739 | | | | 8,008 | |
FHLMC | | | 9.00 | | | | 11-1-2018 | | | | 27,781 | | | | 28,169 | |
FHLMC | | | 9.00 | | | | 8-1-2019 | | | | 435 | | | | 466 | |
FHLMC | | | 9.00 | | | | 8-1-2019 | | | | 80 | | | | 81 | |
FHLMC | | | 9.00 | | | | 12-1-2019 | | | | 191 | | | | 209 | |
FHLMC | | | 9.00 | | | | 1-1-2020 | | | | 21 | | | | 21 | |
FHLMC | | | 9.00 | | | | 2-1-2020 | | | | 134 | | | | 147 | |
FHLMC | | | 9.00 | | | | 3-1-2020 | | | | 1,904 | | | | 1,943 | |
FHLMC | | | 9.00 | | | | 3-1-2020 | | | | 260 | | | | 271 | |
FHLMC | | | 9.00 | | | | 9-1-2020 | | | | 204 | | | | 224 | |
FHLMC | | | 9.00 | | | | 9-1-2020 | | | | 743 | | | | 775 | |
FHLMC | | | 9.00 | | | | 12-1-2020 | | | | 61 | | | | 63 | |
FHLMC | | | 9.00 | | | | 3-1-2021 | | | | 4,311 | | | | 4,734 | |
FHLMC | | | 9.00 | | | | 4-1-2021 | | | | 3,496 | | | | 3,613 | |
FHLMC | | | 9.00 | | | | 4-1-2021 | | | | 248 | | | | 281 | |
FHLMC | | | 9.00 | | | | 4-1-2021 | | | | 39,952 | | | | 41,953 | |
FHLMC | | | 9.00 | | | | 7-1-2021 | | | | 4,644 | | | | 4,670 | |
FHLMC | | | 9.00 | | | | 7-1-2021 | | | | 4,027 | | | | 4,186 | |
FHLMC | | | 9.00 | | | | 8-1-2021 | | | | 579 | | | | 659 | |
FHLMC | | | 9.00 | | | | 7-1-2022 | | | | 623 | | | | 635 | |
FHLMC | | | 9.00 | | | | 9-1-2024 | | | | 1,549 | | | | 1,732 | |
FHLMC | | | 9.50 | | | | 9-1-2016 | | | | 17 | | | | 18 | |
FHLMC | | | 9.50 | | | | 10-1-2016 | | | | 130 | | | | 135 | |
FHLMC | | | 9.50 | | | | 8-1-2018 | | | | 30 | | | | 30 | |
FHLMC | | | 9.50 | | | | 8-1-2019 | | | | 150 | | | | 164 | |
FHLMC | | | 9.50 | | | | 2-1-2020 | | | | 7 | | | | 8 | |
FHLMC | | | 9.50 | | | | 6-1-2020 | | | | 75 | | | | 83 | |
FHLMC | | | 9.50 | | | | 8-1-2020 | | | | 309 | | | | 342 | |
FHLMC | | | 9.50 | | | | 9-1-2020 | | | | 20 | | | | 20 | |
FHLMC | | | 9.50 | | | | 9-1-2020 | | | | 4,544 | | | | 4,879 | |
FHLMC | | | 9.50 | | | | 9-1-2020 | | | | 50 | | | | 56 | |
FHLMC | | | 9.50 | | | | 10-1-2020 | | | | 71 | | | | 79 | |
FHLMC | | | 9.50 | | | | 10-1-2020 | | | | 39 | | | | 43 | |
FHLMC | | | 9.50 | | | | 11-1-2020 | | | | 84 | | | | 94 | |
FHLMC | | | 9.50 | | | | 5-1-2021 | | | | 244 | | | | 276 | |
FHLMC | | | 9.50 | | | | 9-17-2022 | | | | 552,827 | | | | 594,012 | |
FHLMC | | | 9.50 | | | | 4-1-2025 | | | | 61,107 | | | | 70,599 | |
| | | | | | |
| Portfolio of investments—February 28, 2015 (unaudited) | | Wells Fargo Advantage Government Securities Fund | | | 3 | |
| | | | | | | | | | | | | | | | |
| Security name | | Interest rate | | | Maturity date | | | Principal | | | Value | |
| | | | |
Agency Securities (continued) | | | | | | | | | | | | | | | | |
FHLMC | | | 10.00 | % | | | 8-1-2017 | | | $ | 12 | | | $ | 12 | |
FHLMC | | | 10.00 | | | | 1-1-2019 | | | | 12 | | | | 13 | |
FHLMC | | | 10.00 | | | | 8-1-2019 | | | | 2 | | | | 2 | |
FHLMC | | | 10.00 | | | | 12-1-2019 | | | | 249 | | | | 277 | |
FHLMC | | | 10.00 | | | | 3-1-2020 | | | | 24 | | | | 26 | |
FHLMC | | | 10.00 | | | | 6-1-2020 | | | | 33 | | | | 37 | |
FHLMC | | | 10.00 | | | | 7-1-2020 | | | | 11 | | | | 11 | |
FHLMC | | | 10.00 | | | | 8-1-2020 | | | | 38 | | | | 43 | |
FHLMC | | | 10.00 | | | | 10-1-2021 | | | | 57,300 | | | | 63,313 | |
FHLMC | | | 10.00 | | | | 8-17-2022 | | | | 235,094 | | | | 254,055 | |
FHLMC | | | 10.00 | | | | 2-17-2025 | | | | 607,931 | | | | 692,322 | |
FHLMC | | | 10.50 | | | | 2-1-2019 | | | | 23 | | | | 23 | |
FHLMC | | | 10.50 | | | | 5-1-2019 | | | | 91 | | | | 93 | |
FHLMC | | | 10.50 | | | | 6-1-2019 | | | | 9 | | | | 10 | |
FHLMC | | | 10.50 | | | | 8-1-2019 | | | | 15,962 | | | | 17,708 | |
FHLMC | | | 10.50 | | | | 12-1-2019 | | | | 18,074 | | | | 18,425 | |
FHLMC | | | 10.50 | | | | 5-1-2020 | | | | 4,744 | | | | 4,847 | |
FHLMC | | | 10.50 | | | | 5-1-2020 | | | | 32,352 | | | | 36,052 | |
FHLMC | | | 10.50 | | | | 8-1-2020 | | | | 31,496 | | | | 33,007 | |
FHLMC | | | 10.50 | | | | 8-1-2020 | | | | 13,665 | | | | 13,824 | |
FHLMC Series 16 Class D | | | 10.00 | | | | 10-15-2019 | | | | 10,479 | | | | 11,101 | |
FHLMC Series 2758 Class FH ± | | | 0.52 | | | | 3-15-2019 | | | | 2,716,125 | | | | 2,724,121 | |
FHLMC Series 2882 Class TF ± | | | 0.42 | | | | 10-15-2034 | | | | 2,258,198 | | | | 2,264,081 | |
FHLMC Series 3221 Class VA | | | 5.00 | | | | 9-15-2017 | | | | 3,701,516 | | | | 3,770,530 | |
FHLMC Series 3706 Class C | | | 2.00 | | | | 8-15-2020 | | | | 4,843,960 | | | | 4,907,788 | |
FHLMC Series 3767 Class PD | | | 4.00 | | | | 7-15-2040 | | | | 375,857 | | | | 390,331 | |
FHLMC Series 3948 Class DA | | | 3.00 | | | | 12-15-2024 | | | | 979,105 | | | | 1,012,502 | |
FHLMC Series K020 Class X1 ±(c) | | | 1.46 | | | | 5-25-2022 | | | | 47,857,164 | | | | 4,065,897 | |
FHLMC Series T-15 Class A6 ± | | | 0.57 | | | | 11-25-2028 | | | | 234,920 | | | | 231,814 | |
FHLMC Series T-23 Class A ± | | | 0.45 | | | | 5-25-2030 | | | | 1,003,864 | | | | 975,803 | |
FHLMC Series T-35 Class A ± | | | 0.45 | | | | 9-25-2031 | | | | 1,044,003 | | | | 978,714 | |
FHLMC Series T-42 Class A6 | | | 9.50 | | | | 2-25-2042 | | | | 1,245,864 | | | | 1,541,895 | |
FHLMC Series T-55 Class 2A1 ± | | | 2.68 | | | | 3-25-2043 | | | | 638,612 | | | | 640,831 | |
FHLMC Series T-57 Class 1A1 | | | 6.50 | | | | 7-25-2043 | | | | 1,627,471 | | | | 1,910,270 | |
FHLMC Series T-57 Class 2A1 ± | | | 3.26 | | | | 7-25-2043 | | | | 3,270,163 | | | | 3,391,450 | |
FHLMC Series T-67 Class 1A1C ± | | | 2.92 | | | | 3-25-2036 | | | | 1,687,520 | | | | 1,783,494 | |
FHLMC Series T-67 Class 2A1C ± | | | 2.95 | | | | 3-25-2036 | | | | 3,119,783 | | | | 3,243,757 | |
FHLMC Series T-75 Class A1 ± | | | 0.21 | | | | 12-25-2036 | | | | 5,702,414 | | | | 5,671,883 | |
FNMA ± | | | 1.83 | | | | 1-1-2043 | | | | 2,085,529 | | | | 2,151,404 | |
FNMA ± | | | 2.00 | | | | 5-1-2036 | | | | 2,326,219 | | | | 2,460,426 | |
FNMA ± | | | 2.07 | | | | 12-1-2035 | | | | 1,771,903 | | | | 1,886,689 | |
FNMA ± | | | 2.11 | | | | 5-1-2036 | | | | 3,407,269 | | | | 3,580,861 | |
FNMA ± | | | 2.25 | | | | 8-1-2036 | | | | 2,969,276 | | | | 3,170,678 | |
FNMA ± | | | 2.27 | | | | 4-1-2032 | | | | 126,677 | | | | 129,364 | |
FNMA ± | | | 2.31 | | | | 9-1-2031 | | | | 94,183 | | | | 99,896 | |
FNMA ± | | | 2.31 | | | | 11-1-2031 | | | | 204,589 | | | | 214,982 | |
FNMA ± | | | 2.34 | | | | 6-1-2032 | | | | 172,376 | | | | 181,997 | |
FNMA ± | | | 2.36 | | | | 9-1-2036 | | | | 1,613,923 | | | | 1,741,349 | |
FNMA ± | | | 2.36 | | | | 12-1-2034 | | | | 1,776,734 | | | | 1,894,518 | |
FNMA ± | | | 2.38 | | | | 12-1-2040 | | | | 86,549 | | | | 91,883 | |
| | | | |
| 4 | | Wells Fargo Advantage Government Securities Fund | | Portfolio of investments—February 28, 2015 (unaudited) |
| | | | | | | | | | | | | | | | |
| Security name | | Interest rate | | | Maturity date | | | Principal | | | Value | |
| | | | |
Agency Securities (continued) | | | | | | | | | | | | | | | | |
FNMA ± | | | 2.40 | % | | | 9-1-2031 | | | $ | 459,904 | | | $ | 483,265 | |
FNMA ± | | | 2.42 | | | | 6-1-2034 | | | | 792,983 | | | | 837,138 | |
FNMA | | | 2.50 | | | | 4-25-2039 | | | | 346,789 | | | | 349,265 | |
FNMA ± | | | 2.54 | | | | 10-1-2027 | | | | 265,753 | | | | 278,266 | |
FNMA ± | | | 2.61 | | | | 9-1-2027 | | | | 638,832 | | | | 682,448 | |
FNMA | | | 2.63 | | | | 9-6-2024 | | | | 16,000,000 | | | | 16,457,008 | |
FNMA ± | | | 2.95 | | | | 7-1-2026 | | | | 447,712 | | | | 476,914 | |
FNMA ± | | | 3.00 | | | | 5-1-2036 | | | | 1,344,013 | | | | 1,431,749 | |
FNMA | | | 3.00 | | | | 4-1-2022 | | | | 1,246,711 | | | | 1,307,158 | |
FNMA %% | | | 3.00 | | | | 3-18-2030 | | | | 18,235,000 | | | | 19,090,479 | |
FNMA %% | | | 3.00 | | | | 3-12-2045 | | | | 85,745,000 | | | | 87,342,669 | |
FNMA ± | | | 3.11 | | | | 2-1-2027 | | | | 792,535 | | | | 806,301 | |
FNMA | | | 3.21 | | | | 3-1-2015 | | | | 984,753 | | | | 984,244 | |
FNMA ± | | | 3.22 | | | | 1-1-2033 | | | | 46,092 | | | | 47,220 | |
FNMA ± | | | 3.36 | | | | 4-1-2033 | | | | 80,673 | | | | 84,009 | |
FNMA %% | | | 3.50 | | | | 3-18-2030 | | | | 15,180,000 | | | | 16,095,946 | |
FNMA %% | | | 3.50 | | | | 3-12-2045 | | | | 50,820,000 | | | | 53,257,774 | |
FNMA ± | | | 3.90 | | | | 9-1-2028 | | | | 281,909 | | | | 299,034 | |
FNMA | | | 4.00 | | | | 5-1-2021 | | | | 1,190,579 | | | | 1,259,692 | |
FNMA %% | | | 4.00 | | | | 3-18-2030 | | | | 12,615,000 | | | | 13,342,136 | |
FNMA %% | | | 4.00 | | | | 3-12-2045 | | | | 52,050,000 | | | | 55,652,839 | |
FNMA ± | | | 4.11 | | | | 7-1-2033 | | | | 161,120 | | | | 166,223 | |
FNMA | | | 4.50 | | | | 12-1-2018 | | | | 918,449 | | | | 964,009 | |
FNMA | | | 4.50 | | | | 1-1-2026 | | | | 11,305,000 | | | | 11,878,641 | |
FNMA %% | | | 4.50 | | | | 3-12-2045 | | | | 59,157,000 | | | | 64,287,024 | |
FNMA | | | 4.68 | | | | 2-1-2020 | | | | 3,249,975 | | | | 3,632,918 | |
FNMA | | | 4.79 | | | | 5-1-2019 | | | | 2,155,311 | | | | 2,393,006 | |
FNMA | | | 5.00 | | | | 12-1-2018 | | | | 690,338 | | | | 727,588 | |
FNMA | | | 5.00 | | | | 6-1-2019 | | | | 650,323 | | | | 685,414 | |
FNMA | | | 5.00 | | | | 6-1-2023 | | | | 1,572,266 | | | | 1,694,984 | |
FNMA | | | 5.00 | | | | 3-1-2034 | | | | 1,205,650 | | | | 1,343,821 | |
FNMA | | | 5.00 | | | | 8-1-2040 | | | | 23,633,250 | | | | 26,385,000 | |
FNMA | | | 5.22 | | | | 10-1-2015 | | | | 3,175,961 | | | | 3,225,557 | |
FNMA | | | 5.30 | | | | 4-1-2017 | | | | 6,265,835 | | | | 6,607,275 | |
FNMA | | | 5.38 | | | | 5-1-2017 | | | | 707,717 | | | | 749,799 | |
FNMA | | | 5.39 | | | | 1-1-2024 | | | | 2,525,484 | | | | 2,898,472 | |
FNMA | | | 5.50 | | | | 6-1-2016 | | | | 92,238 | | | | 97,460 | |
FNMA | | | 5.50 | | | | 11-1-2023 | | | | 208,397 | | | | 226,274 | |
FNMA | | | 5.50 | | | | 1-1-2025 | | | | 807,278 | | | | 876,142 | |
FNMA | | | 5.50 | | | | 1-1-2025 | | | | 188,177 | | | | 203,435 | |
FNMA | | | 5.50 | | | | 8-1-2033 | | | | 7,899,647 | | | | 8,931,296 | |
FNMA | | | 5.50 | | | | 9-1-2033 | | | | 4,038,808 | | | | 4,567,111 | |
FNMA | | | 5.50 | | | | 9-1-2033 | | | | 1,768,922 | | | | 1,999,526 | |
FNMA | | | 5.50 | | | | 8-1-2035 | | | | 1,429,750 | | | | 1,610,071 | |
FNMA | | | 5.50 | | | | 1-1-2037 | | | | 1,527,417 | | | | 1,718,783 | |
FNMA | | | 5.55 | | | | 5-1-2016 | | | | 3,045,287 | | | | 3,187,811 | |
FNMA | | | 5.55 | | | | 9-1-2019 | | | | 1,468,002 | | | | 1,521,684 | |
FNMA | | | 5.61 | | | | 2-1-2021 | | | | 2,535,032 | | | | 2,776,234 | |
FNMA | | | 5.63 | | | | 2-1-2018 | | | | 1,069,964 | | | | 1,182,405 | |
FNMA | | | 5.67 | | | | 3-1-2016 | | | | 6,034,833 | | | | 6,260,489 | |
| | | | | | |
| Portfolio of investments—February 28, 2015 (unaudited) | | Wells Fargo Advantage Government Securities Fund | | | 5 | |
| | | | | | | | | | | | | | | | |
| Security name | | Interest rate | | | Maturity date | | | Principal | | | Value | |
| | | | |
Agency Securities (continued) | | | | | | | | | | | | | | | | |
FNMA | | | 5.67 | % | | | 11-1-2021 | | | $ | 5,460,662 | | | $ | 5,851,283 | |
FNMA | | | 5.70 | | | | 3-1-2016 | | | | 921,099 | | | | 955,692 | |
FNMA | | | 5.75 | | | | 5-1-2021 | | | | 3,466,024 | | | | 3,931,676 | |
FNMA | | | 5.79 | | | | 10-1-2017 | | | | 1,061,645 | | | | 1,168,229 | |
FNMA | | | 5.95 | | | | 6-1-2024 | | | | 1,753,899 | | | | 2,072,667 | |
FNMA | | | 6.00 | | | | 5-1-2016 | | | | 27,524 | | | | 28,035 | |
FNMA | | | 6.00 | | | | 3-1-2024 | | | | 148,183 | | | | 168,363 | |
FNMA | | | 6.00 | | | | 2-1-2035 | | | | 2,168,022 | | | | 2,432,391 | |
FNMA | | | 6.00 | | | | 11-1-2037 | | | | 1,318,996 | | | | 1,499,985 | |
FNMA %% | | | 6.00 | | | | 3-12-2045 | | | | 15,585,000 | | | | 17,723,980 | |
FNMA | | | 6.08 | | | | 1-1-2019 | | | | 586,839 | | | | 606,848 | |
FNMA | | | 6.50 | | | | 6-1-2017 | | | | 84,151 | | | | 86,997 | |
FNMA | | | 6.50 | | | | 1-1-2024 | | | | 80,978 | | | | 92,596 | |
FNMA | | | 6.50 | | | | 3-1-2028 | | | | 42,631 | | | | 47,347 | |
FNMA | | | 6.50 | | | | 12-1-2029 | | | | 475,022 | | | | 552,375 | |
FNMA | | | 6.50 | | | | 11-1-2031 | | | | 114,156 | | | | 132,458 | |
FNMA | | | 6.50 | | | | 7-1-2036 | | | | 874,641 | | | | 1,000,125 | |
FNMA | | | 6.50 | | | | 7-1-2036 | | | | 602,288 | | | | 688,698 | |
FNMA | | | 6.50 | | | | 7-25-2042 | | | | 2,269,543 | | | | 2,569,179 | |
FNMA | | | 6.65 | | | | 5-1-2016 | | | | 1,383,341 | | | | 1,466,560 | |
FNMA | | | 7.00 | | | | 11-1-2026 | | | | 14,598 | | | | 17,075 | |
FNMA | | | 7.00 | | | | 9-1-2031 | | | | 5,859 | | | | 5,903 | |
FNMA | | | 7.00 | | | | 1-1-2032 | | | | 6,736 | | | | 7,742 | |
FNMA | | | 7.00 | | | | 2-1-2032 | | | | 151,419 | | | | 182,596 | |
FNMA | | | 7.00 | | | | 2-1-2032 | | | | 8,193 | | | | 8,492 | |
FNMA | | | 7.00 | | | | 10-1-2032 | | | | 358,981 | | | | 404,883 | |
FNMA | | | 7.00 | | | | 2-1-2034 | | | | 3,270 | | | | 3,761 | |
FNMA | | | 7.00 | | | | 4-1-2034 | | | | 296,577 | | | | 354,888 | |
FNMA | | | 7.00 | | | | 1-1-2036 | | | | 6,842 | | | | 7,279 | |
FNMA | | | 7.00 | | | | 9-1-2036 | | | | 308,087 | | | | 355,211 | |
FNMA | | | 7.50 | | | | 9-1-2031 | | | | 145,598 | | | | 182,148 | |
FNMA | | | 7.50 | | | | 11-25-2031 | | | | 742,410 | | | | 864,287 | |
FNMA | | | 7.50 | | | | 2-1-2032 | | | | 51,077 | | | | 62,139 | |
FNMA | | | 7.50 | | | | 10-1-2037 | | | | 2,077,150 | | | | 2,364,165 | |
FNMA | | | 8.00 | | | | 5-1-2027 | | | | 57,069 | | | | 60,158 | |
FNMA | | | 8.00 | | | | 10-1-2027 | | | | 11,168 | | | | 11,317 | |
FNMA | | | 8.00 | | | | 6-1-2028 | | | | 8,452 | | | | 9,656 | |
FNMA | | | 8.00 | | | | 2-1-2030 | | | | 183,263 | | | | 212,175 | |
FNMA | | | 8.00 | | | | 7-1-2031 | | | | 1,912,003 | | | | 2,344,655 | |
FNMA | | | 8.50 | | | | 5-1-2017 | | | | 163,367 | | | | 171,911 | |
FNMA | | | 8.50 | | | | 5-1-2017 | | | | 2,762 | | | | 2,903 | |
FNMA | | | 8.50 | | | | 8-1-2024 | | | | 34,517 | | | | 39,042 | |
FNMA | | | 8.50 | | | | 5-1-2026 | | | | 213,363 | | | | 243,519 | |
FNMA | | | 8.50 | | | | 7-1-2026 | | | | 31,912 | | | | 34,316 | |
FNMA | | | 8.50 | | | | 8-1-2026 | | | | 16,160 | | | | 16,587 | |
FNMA | | | 8.50 | | | | 9-1-2026 | | | | 171 | | | | 172 | |
FNMA | | | 8.50 | | | | 10-1-2026 | | | | 368 | | | | 388 | |
FNMA | | | 8.50 | | | | 10-1-2026 | | | | 8,828 | | | | 8,872 | |
FNMA | | | 8.50 | | | | 10-1-2026 | | | | 35,039 | | | | 35,783 | |
FNMA | | | 8.50 | | | | 11-1-2026 | | | | 11,295 | | | | 12,093 | |
| | | | |
| 6 | | Wells Fargo Advantage Government Securities Fund | | Portfolio of investments—February 28, 2015 (unaudited) |
| | | | | | | | | | | | | | | | |
| Security name | | Interest rate | | | Maturity date | | | Principal | | | Value | |
| | | | |
Agency Securities (continued) | | | | | | | | | | | | | | | | |
FNMA | | | 8.50 | % | | | 11-1-2026 | | | $ | 34,769 | | | $ | 36,000 | |
FNMA | | | 8.50 | | | | 12-1-2026 | | | | 22,446 | | | | 25,858 | |
FNMA | | | 8.50 | | | | 12-1-2026 | | | | 328 | | | | 330 | |
FNMA | | | 8.50 | | | | 12-1-2026 | | | | 249,755 | | | | 301,221 | |
FNMA | | | 8.50 | | | | 2-1-2027 | | | | 409 | | | | 462 | |
FNMA | | | 8.50 | | | | 2-1-2027 | | | | 8,785 | | | | 8,890 | |
FNMA | | | 8.50 | | | | 3-1-2027 | | | | 1,287 | | | | 1,487 | |
FNMA | | | 8.50 | | | | 3-1-2027 | | | | 2,925 | | | | 2,940 | |
FNMA | | | 8.50 | | | | 6-1-2027 | | | | 260,110 | | | | 298,807 | |
FNMA | | | 8.50 | | | | 7-1-2029 | | | | 948 | | | | 953 | |
FNMA | | | 9.00 | | | | 3-1-2021 | | | | 33,057 | | | | 35,637 | |
FNMA | | | 9.00 | | | | 6-1-2021 | | | | 203 | | | | 227 | |
FNMA | | | 9.00 | | | | 7-1-2021 | | | | 53,098 | | | | 58,314 | |
FNMA | | | 9.00 | | | | 8-1-2021 | | | | 276 | | | | 313 | |
FNMA | | | 9.00 | | | | 10-1-2021 | | | | 34,283 | | | | 35,489 | |
FNMA | | | 9.00 | | | | 1-1-2025 | | | | 23,199 | | | | 26,671 | |
FNMA | | | 9.00 | | | | 1-1-2025 | | | | 2,853 | | | | 2,922 | |
FNMA | | | 9.00 | | | | 2-1-2025 | | | | 8,813 | | | | 8,860 | |
FNMA | | | 9.00 | | | | 3-1-2025 | | | | 336 | | | | 338 | |
FNMA | | | 9.00 | | | | 3-1-2025 | | | | 1,531 | | | | 1,540 | |
FNMA | | | 9.00 | | | | 3-1-2025 | | | | 3,943 | | | | 4,169 | |
FNMA | | | 9.00 | | | | 4-1-2025 | | | | 3,544 | | | | 3,563 | |
FNMA | | | 9.00 | | | | 7-1-2028 | | | | 41,898 | | | | 46,051 | |
FNMA | | | 9.50 | | | | 11-1-2020 | | | | 194 | | | | 218 | |
FNMA | | | 9.50 | | | | 12-15-2020 | | | | 58,765 | | | | 65,471 | |
FNMA | | | 9.50 | | | | 1-1-2021 | | | | 27,308 | | | | 28,712 | |
FNMA | | | 9.50 | | | | 6-1-2022 | | | | 3,954 | | | | 4,026 | |
FNMA | | | 9.50 | | | | 7-1-2028 | | | | 60,556 | | | | 64,267 | |
FNMA | | | 10.00 | | | | 12-1-2020 | | | | 81,793 | | | | 90,858 | |
FNMA | | | 11.00 | | | | 2-1-2019 | | | | 9,598 | | | | 9,711 | |
FNMA | | | 11.00 | | | | 10-15-2020 | | | | 3,361 | | | | 3,441 | |
FNMA | | | 11.25 | | | | 2-1-2016 | | | | 596 | | | | 599 | |
FNMA Series 161 Class 2 (c) | | | 8.50 | | | | 7-25-2022 | | | | 66,812 | | | | 16,350 | |
FNMA Series 1988-2 Class Z | | | 10.10 | | | | 2-25-2018 | | | | 2,243 | | | | 2,283 | |
FNMA Series 1988-7 Class Z | | | 9.25 | | | | 4-25-2018 | | | | 21,471 | | | | 23,155 | |
FNMA Series 1989-10 Class Z | | | 9.50 | | | | 3-25-2019 | | | | 163,526 | | | | 180,757 | |
FNMA Series 1989-100 Class Z | | | 8.75 | | | | 12-25-2019 | | | | 89,531 | | | | 98,763 | |
FNMA Series 1989-12 Class Y | | | 10.00 | | | | 3-25-2019 | | | | 209,293 | | | | 230,689 | |
FNMA Series 1989-22 Class G | | | 10.00 | | | | 5-25-2019 | | | | 166,107 | | | | 185,980 | |
FNMA Series 1989-63 Class Z | | | 9.40 | | | | 10-25-2019 | | | | 21,351 | | | | 23,026 | |
FNMA Series 1989-98 Class E | | | 9.20 | | | | 12-25-2019 | | | | 50,670 | | | | 55,383 | |
FNMA Series 1990-144 Class W | | | 9.50 | | | | 12-25-2020 | | | | 112,304 | | | | 127,154 | |
FNMA Series 1990-75 Class Z | | | 9.50 | | | | 7-25-2020 | | | | 131,445 | | | | 148,480 | |
FNMA Series 1990-84 Class Y | | | 9.00 | | | | 7-25-2020 | | | | 27,707 | | | | 30,796 | |
FNMA Series 1990-96 Class Z | | | 9.67 | | | | 8-25-2020 | | | | 180,228 | | | | 204,538 | |
FNMA Series 1991-5 Class Z | | | 8.75 | | | | 1-25-2021 | | | | 41,278 | | | | 45,662 | |
FNMA Series 1991-85 Class Z | | | 8.00 | | | | 6-25-2021 | | | | 105,728 | | | | 114,037 | |
FNMA Series 1992-45 Class Z | | | 8.00 | | | | 4-25-2022 | | | | 142,558 | | | | 163,314 | |
FNMA Series 1999-W6 Class A ± | | | 9.13 | | | | 9-25-2028 | | | | 16,832 | | | | 17,671 | |
FNMA Series 2000-T6 Class A2 | | | 9.50 | | | | 6-25-2030 | | | | 1,186,685 | | | | 1,345,918 | |
| | | | | | |
| Portfolio of investments—February 28, 2015 (unaudited) | | Wells Fargo Advantage Government Securities Fund | | | 7 | |
| | | | | | | | | | | | | | | | |
| Security name | | Interest rate | | | Maturity date | | | Principal | | | Value | |
| | | | |
Agency Securities (continued) | | | | | | | | | | | | | | | | |
FNMA Series 2001-T10 Class A3 | | | 9.50 | % | | | 12-25-2041 | | | $ | 1,808,259 | | | $ | 2,087,894 | |
FNMA Series 2001-T12 Class A3 | | | 9.50 | | | | 8-25-2041 | | | | 452,715 | | | | 528,673 | |
FNMA Series 2001-T4 Class A1 | | | 7.50 | | | | 7-25-2041 | | | | 1,089,116 | | | | 1,302,865 | |
FNMA Series 2001-T8 Class A3 ± | | | 3.63 | | | | 7-25-2041 | | | | 1,224,767 | | | | 1,257,313 | |
FNMA Series 2002-T12 Class A5 ± | | | 3.48 | | | | 10-25-2041 | | | | 1,507,487 | | | | 1,550,861 | |
FNMA Series 2002-T19 Class A1 | | | 6.50 | | | | 7-25-2042 | | | | 6,195,378 | | | | 7,068,338 | |
FNMA Series 2002-T5 Class A1 ± | | | 0.41 | | | | 5-25-2032 | | | | 385,208 | | | | 379,426 | |
FNMA Series 2002-W4 Class A4 | | | 6.25 | | | | 5-25-2042 | | | | 1,013,272 | | | | 1,122,274 | |
FNMA Series 2003-T2 Class A1 ± | | | 0.45 | | | | 3-25-2033 | | | | 410,829 | | | | 398,618 | |
FNMA Series 2003-W1 Class 1A1 ± | | | 5.84 | | | | 12-25-2042 | | | | 959,007 | | | | 1,074,441 | |
FNMA Series 2003-W11 Class A1 ± | | | 3.46 | | | | 6-25-2033 | | | | 124,514 | | | | 130,554 | |
FNMA Series 2003-W3 Class 1A4 ± | | | 3.40 | | | | 8-25-2042 | | | | 3,852,298 | | | | 4,298,872 | |
FNMA Series 2003-W5 Class A ± | | | 0.39 | | | | 4-25-2033 | | | | 635,327 | | | | 622,844 | |
FNMA Series 2003-W6 Class 6A ± | | | 3.09 | | | | 8-25-2042 | | | | 2,717,007 | | | | 2,938,119 | |
FNMA Series 2003-W6 Class PT4 ± | | | 8.82 | | | | 10-25-2042 | | | | 2,389,426 | | | | 2,831,893 | |
FNMA Series 2003-W8 Class PT1 ± | | | 9.86 | | | | 12-25-2042 | | | | 972,913 | | | | 1,118,154 | |
FNMA Series 2003-W9 Class A ± | | | 0.41 | | | | 6-25-2033 | | | | 161,644 | | | | 156,012 | |
FNMA Series 2004-79 Class FA ± | | | 0.46 | | | | 8-25-2032 | | | | 1,428,516 | | | | 1,429,819 | |
FNMA Series 2004-T1 Class 1A2 | | | 6.50 | | | | 1-25-2044 | | | | 928,892 | | | | 1,065,185 | |
FNMA Series 2004-W1 Class 2A2 | | | 7.00 | | | | 12-25-2033 | | | | 2,117,636 | | | | 2,488,643 | |
FNMA Series 2004-W15 Class 1A3 | | | 7.00 | | | | 8-25-2044 | | | | 1,726,826 | | | | 1,996,354 | |
FNMA Series 2005-71 Class DB | | | 4.50 | | | | 8-25-2025 | | | | 1,787,521 | | | | 1,915,618 | |
FNMA Series 2006-M2 Class A2F ± | | | 5.26 | | | | 5-25-2020 | | | | 6,790,390 | | | | 7,488,965 | |
FNMA Series 2007-2 Class FA ± | | | 0.37 | | | | 2-25-2037 | | | | 142,117 | | | | 142,175 | |
FNMA Series 2007-W10 Class 2A ± | | | 6.30 | | | | 8-25-2047 | | | | 975,185 | | | | 1,106,014 | |
FNMA Series 2009-108 Class DE | | | 4.50 | | | | 8-25-2027 | | | | 63,559 | | | | 63,889 | |
FNMA Series 2009-3 Class HL | | | 5.00 | | | | 2-25-2039 | | | | 729,416 | | | | 754,989 | |
FNMA Series 2011-15 Class HI (c) | | | 5.50 | | | | 3-25-2026 | | | | 3,037,671 | | | | 274,181 | |
FNMA Series 2011-42 Class A | | | 3.00 | | | | 2-25-2024 | | | | 1,276,477 | | | | 1,319,363 | |
FNMA Series 265 Class 2 | | | 9.00 | | | | 3-25-2024 | | | | 176,359 | | | | 205,779 | |
FNMA Series G-8 Class E | | | 9.00 | | | | 4-25-2021 | | | | 140,312 | | | | 156,703 | |
FNMA Series G92-30 Class Z | | | 7.00 | | | | 6-25-2022 | | | | 253,466 | | | | 274,632 | |
FNMA Series G93-39 Class ZQ | | | 6.50 | | | | 12-25-2023 | | | | 2,700,115 | | | | 2,983,206 | |
GNMA ± | | | 3.00 | | | | 8-20-2020 | | | | 189,922 | | | | 200,551 | |
GNMA ± | | | 3.00 | | | | 11-20-2020 | | | | 127,643 | | | | 134,155 | |
GNMA | | | 4.00 | | | | 1-20-2045 | | | | 17,374,613 | | | | 18,549,547 | |
GNMA | | | 5.00 | | | | 7-20-2040 | | | | 7,843,352 | | | | 8,775,574 | |
GNMA | | | 6.00 | | | | 8-20-2034 | | | | 336,266 | | | | 380,188 | |
GNMA | | | 6.50 | | | | 12-15-2025 | | | | 42,463 | | | | 48,588 | |
GNMA | | | 6.50 | | | | 5-15-2029 | | | | 2,482 | | | | 2,840 | |
GNMA | | | 6.50 | | | | 5-15-2031 | | | | 2,584 | | | | 2,974 | |
GNMA | | | 6.50 | | | | 9-20-2033 | | | | 93,693 | | | | 113,882 | |
GNMA | | | 7.00 | | | | 12-15-2022 | | | | 47,953 | | | | 52,645 | |
GNMA | | | 7.00 | | | | 5-15-2026 | | | | 5,006 | | | | 5,594 | |
GNMA | | | 7.00 | | | | 3-15-2028 | | | | 71,376 | | | | 79,590 | |
GNMA | | | 7.00 | | | | 1-15-2031 | | | | 477 | | | | 493 | |
GNMA | | | 7.00 | | | | 4-15-2031 | | | | 1,260 | | | | 1,304 | |
GNMA | | | 7.00 | | | | 8-15-2031 | | | | 22,082 | | | | 23,472 | |
GNMA | | | 7.00 | | | | 3-15-2032 | | | | 16,440 | | | | 16,970 | |
GNMA | | | 7.34 | | | | 10-20-2021 | | | | 58,426 | | | | 60,717 | |
| | | | |
| 8 | | Wells Fargo Advantage Government Securities Fund | | Portfolio of investments—February 28, 2015 (unaudited) |
| | | | | | | | | | | | | | | | |
| Security name | | Interest rate | | | Maturity date | | | Principal | | | Value | |
| | | | |
Agency Securities (continued) | | | | | | | | | | | | | | | | |
GNMA | | | 7.34 | % | | | 12-20-2021 | | | $ | 20,774 | | | $ | 20,866 | |
GNMA | | | 7.34 | | | | 2-20-2022 | | | | 17,935 | | | | 18,014 | |
GNMA | | | 7.34 | | | | 4-20-2022 | | | | 25,429 | | | | 25,541 | |
GNMA | | | 7.34 | | | | 9-20-2022 | | | | 41,261 | | | | 43,972 | |
GNMA | | | 8.00 | | | | 4-15-2023 | | | | 280 | | | | 281 | |
GNMA | | | 8.00 | | | | 6-15-2023 | | | | 6,504 | | | | 7,267 | |
GNMA | | | 8.00 | | | | 12-15-2023 | | | | 450,152 | | | | 524,953 | |
GNMA | | | 8.00 | | | | 2-15-2024 | | | | 1,247 | | | | 1,400 | |
GNMA | | | 8.00 | | | | 9-15-2024 | | | | 4,782 | | | | 5,012 | |
GNMA | | | 8.00 | | | | 6-15-2025 | | | | 93 | | | | 93 | |
GNMA | | | 8.35 | | | | 4-15-2020 | | | | 340,006 | | | | 377,141 | |
GNMA | | | 8.40 | | | | 5-15-2020 | | | | 182,557 | | | | 203,029 | |
GNMA | | | 8.50 | | | | 7-15-2016 | | | | 476 | | | | 479 | |
GNMA | | | 9.00 | | | | 12-15-2016 | | | | 2,721 | | | | 2,736 | |
GNMA | | | 9.50 | | | | 10-20-2019 | | | | 71,992 | | | | 78,193 | |
GNMA | | | 10.00 | | | | 12-15-2018 | | | | 6,742 | | | | 6,786 | |
GNMA | | | 12.50 | | | | 4-15-2019 | | | | 302 | | | | 303 | |
GNMA Series 2002-53 Class IO ±(c) | | | 0.00 | | | | 4-16-2042 | | | | 4,258,195 | | | | 43 | |
GNMA Series 2005-23 Class IO ±(c) | | | 0.36 | | | | 6-17-2045 | | | | 13,984,294 | | | | 151,730 | |
GNMA Series 2006-32 Class C ± | | | 5.26 | | | | 11-16-2038 | | | | 11,398,849 | | | | 12,003,638 | |
GNMA Series 2006-32 Class XM ±(c) | | | 0.01 | | | | 11-16-2045 | | | | 17,789,362 | | | | 33,675 | |
GNMA Series 2006-68 Class D ± | | | 5.31 | | | | 12-16-2037 | | | | 12,520,000 | | | | 13,695,102 | |
GNMA Series 2007-35 Class NF ± | | | 0.27 | | | | 10-16-2035 | | | | 4,227,359 | | | | 4,225,838 | |
GNMA Series 2007-44 Class FP ± | | | 0.34 | | | | 3-20-2036 | | | | 1,275,587 | | | | 1,275,554 | |
GNMA Series 2007-69 Class D ± | | | 5.25 | | | | 6-16-2041 | | | | 1,000,000 | | | | 1,063,020 | |
GNMA Series 2008-22 Class XM ±(c) | | | 0.60 | | | | 2-16-2050 | | | | 45,802,343 | | | | 1,530,394 | |
GNMA Series 2011-33 Class CH | | | 4.18 | | | | 10-16-2052 | | | | 717,490 | | | | 726,922 | |
SBA (a)(c)(i) | | | 1.30 | | | | 2-15-2018 | | | | 193,872 | | | | 3,463 | |
SBA Series 1992-6 Class A (a)(c)(i) | | | 2.09 | | | | 10-15-2017 | | | | 249,200 | | | | 6,726 | |
TVA | | | 5.38 | | | | 4-1-2056 | | | | 3,670,000 | | | | 4,908,353 | |
| | | | |
Total Agency Securities (Cost $905,221,395) | | | | | | | | | | | | | | | 924,235,786 | |
| | | | | | | | | | | | | | | | |
| | | | |
Municipal Obligations: 0.61% | | | | | | | | | | | | | | | | |
| | | | |
| Texas: 0.61% | | | | | | | | | | | | | | | | |
San Antonio TX Retama Development Corporation (Miscellaneous Revenue) | | | 10.00 | | | | 12-15-2020 | | | | 5,405,000 | | | | 7,800,280 | |
| | | | | | | | | | | | | | | | |
| | | | |
Total Municipal Obligations (Cost $6,665,706) | | | | | | | | | | | | | | | 7,800,280 | |
| | | | | | | | | | | | | | | | |
| | | | |
Non-Agency Mortgage-Backed Securities: 5.85% | | | | | | | | | | | | | | | | |
Citigroup Commercial Mortgage Trust Series 2005-CD1 Class A4 ± | | | 5.23 | | | | 7-15-2044 | | | | 9,285 | | | | 9,374 | |
Citigroup Commercial Mortgage Trust Series 2006-C4 Class A3 ± | | | 5.77 | | | | 3-15-2049 | | | | 8,876,687 | | | | 9,204,148 | |
Citigroup Commercial Mortgage Trust Series 2006-C5 Class A4 | | | 5.43 | | | | 10-15-2049 | | | | 11,280,000 | | | | 11,876,069 | |
Citigroup Commercial Mortgage Trust Series 2015-GC27 Class A5 | | | 3.14 | | | | 2-10-2048 | | | | 6,130,000 | | | | 6,211,180 | |
GAHR Commercial Mortgage Trust Series 2015-NRF Class AFX 144A | | | 3.23 | | | | 12-15-2019 | | | | 4,195,000 | | | | 4,323,671 | |
GE Capital Commercial Mortgage Corporation Series 2005-C3 Class A7A ± | | | 4.97 | | | | 7-10-2045 | | | | 9,360,000 | | | | 9,384,898 | |
GS Mortgage Securities Trust Series 2013-G1 Class A2 144A± | | | 3.56 | | | | 4-10-2031 | | | | 5,349,842 | | | | 5,418,266 | |
Lehman Brothers UBS Commercial Mortgage Trust Series 2006-C1 Class A4 | | | 5.16 | | | | 2-15-2031 | | | | 12,811,647 | | | | 13,068,124 | |
Morgan Stanley Capital I Series 2006-HQ8 Class A4 ± | | | 5.41 | | | | 3-12-2044 | | | | 2,284,101 | | | | 2,327,195 | |
NCUA Guaranteed Notes Program Series 2010-C1
Class APT | | | 2.65 | | | | 10-29-2020 | | | | 7,879,471 | | | | 7,974,135 | |
NCUA Guaranteed Notes Program Series 2011-R4
Class 1A ± | | | 0.55 | | | | 3-6-2020 | | | | 2,307,362 | | | | 2,313,179 | |
| | | | | | |
| Portfolio of investments—February 28, 2015 (unaudited) | | Wells Fargo Advantage Government Securities Fund | | | 9 | |
| | | | | | | | | | | | | | | | |
| Security name | | Interest rate | | | Maturity date | | | Principal | | | Value | |
| | | | |
Non-Agency Mortgage-Backed Securities (continued) | | | | | | | | | | | | | | | | |
NCUA Guaranteed Notes Program Series 2011-R6 Class 1A ± | | | 0.55 | % | | | 5-7-2020 | | | $ | 1,124,006 | | | $ | 1,124,687 | |
Vendee Mortgage Trust Series 1995-1 Class 4 ± | | | 8.77 | | | | 2-15-2025 | | | | 373,719 | | | | 427,528 | |
Vendee Mortgage Trust Series 1995-2C Class 3A | | | 8.79 | | | | 6-15-2025 | | | | 486,466 | | | | 580,836 | |
| | | | |
Total Non-Agency Mortgage-Backed Securities (Cost $75,867,231) | | | | | | | | | | | | | | | 74,243,290 | |
| | | | | | | | | | | | | | | | |
| | | | |
U.S. Treasury Securities: 50.01% | | | | | | | | | | | | | | | | |
U.S. Treasury Bond | | | 2.75 | | | | 8-15-2042 | | | | 16,720,000 | | | | 17,221,600 | |
U.S. Treasury Bond | | | 3.00 | | | | 11-15-2044 | | | | 5,965,000 | | | | 6,469,693 | |
U.S. Treasury Bond | | | 3.75 | | | | 8-15-2041 | | | | 17,565,000 | | | | 21,641,995 | |
U.S. Treasury Bond | | | 4.50 | | | | 2-15-2036 | | | | 7,475,000 | | | | 10,083,655 | |
U.S. Treasury Bond | | | 4.63 | | | | 2-15-2040 | | | | 20,150,000 | | | | 27,912,465 | |
U.S. Treasury Bond | | | 6.25 | | | | 8-15-2023 | | | | 16,335,000 | | | | 21,913,141 | |
U.S. Treasury Bond | | | 7.25 | | | | 8-15-2022 | | | | 4,685,000 | �� | | | 6,478,844 | |
U.S. Treasury Note ±## | | | 0.07 | | | | 1-31-2016 | | | | 130,990,000 | | | | 130,986,987 | |
U.S. Treasury Note ## | | | 0.25 | | | | 9-30-2015 | | | | 114,015,000 | | | | 114,077,366 | |
U.S. Treasury Note | | | 0.25 | | | | 12-31-2015 | | | | 56,000,000 | | | | 56,008,736 | |
U.S. Treasury Note ## | | | 0.38 | | | | 3-15-2015 | | | | 89,940,000 | | | | 89,947,015 | |
U.S. Treasury Note ## | | | 0.38 | | | | 11-15-2015 | | | | 81,495,000 | | | | 81,615,939 | |
U.S. Treasury Note | | | 1.00 | | | | 8-31-2016 | | | | 12,240,000 | | | | 12,340,405 | |
U.S. Treasury Note | | | 1.38 | | | | 2-28-2019 | | | | 37,735,000 | | | | 37,790,996 | |
| | | | |
Total U.S. Treasury Securities
(Cost $621,132,986) | | | | | | | | | | | | | | | 634,488,837 | |
| | | | | | | | | | | | | | | | |
| | | | |
Yankee Corporate Bonds and Notes: 1.56% | | | | | | | | | | | | | | | | |
| | | | |
Financials: 1.56% | | | | | | | | | | | | | | | | |
| | | | |
| Banks: 1.56% | | | | | | | | | | | | | | | | |
Bank of Nova Scotia 144A | | | 1.65 | | | | 10-29-2015 | | | | 13,235,000 | | | | 13,343,249 | |
Royal Bank of Canada Incorporated | | | 2.00 | | | | 10-1-2018 | | | | 6,370,000 | | | | 6,452,765 | |
| | | | |
Total Yankee Corporate Bonds and Notes
(Cost $19,598,373) | | | | | | | | | | | | | | | 19,796,014 | |
| | | | | | | | | | | | | | | | |
| | | | |
| | | Yield | | | | | | Shares | | | | |
| | | | |
Short-Term Investments: 0.33% | | | | | | | | | | | | | | | | |
| | | | |
| Investment Companies: 0.20% | | | | | | | | | | | | | | | | |
Wells Fargo Advantage Government Money Market Fund, Institutional Class (l)(u)## | | | 0.01 | | | | | | | | 2,598,477 | | | | 2,598,477 | |
| | | | | | | | | | | | | | | | |
| | | | |
| | | | | | | | | Principal | | | | |
| U.S. Treasury Securities: 0.13% | | | | | | | | | | | | | | | | |
U.S. Treasury Bill (z)# | | | 0.01 | | | | 3-19-2015 | | | $ | 1,600,000 | | | | 1,599,989 | |
| | | | | | | | | | | | | | | | |
| | | | |
Total Short-Term Investments (Cost $4,198,457) | | | | | | | | | | | | | | | 4,198,466 | |
| | | | | | | | | | | | | | | | |
| | | | | | | | |
| Total investments in securities (Cost $1,632,684,148) * | | | 131.20 | % | | | 1,664,762,673 | |
Other assets and liabilities, net | | | (31.20 | ) | | | (395,905,819 | ) |
| | | | | | | | |
| Total net assets | | | 100.00 | % | | $ | 1,268,856,854 | |
| | | | | | | | |
| | | | |
| 10 | | Wells Fargo Advantage Government Securities Fund | | Portfolio of investments—February 28, 2015 (unaudited) |
| 144A | The security may be resold in transactions exempt from registration, normally to qualified institutional buyers, pursuant to Rule 144A under the Securities Act of 1933. |
| ± | Variable rate investment. The rate shown is the rate in effect at period end. |
| %% | The security is issued on a when-issued basis. |
| ¤ | The security is issued in zero coupon form with no periodic interest payments. |
| (c) | Investment in an interest-only security entitles holders to receive only the interest payments on the underlying mortgages. The principal amount shown is the notional amount of the underlying mortgages. The rate represents the coupon rate. |
| (a) | The security is fair valued in accordance with procedures approved by the Board of Trustees. |
| (l) | The security represents an affiliate of the Fund as defined in the Investment Company Act of 1940. |
| (u) | The rate represents the 7-day annualized yield at period end. |
| ## | All or a portion of this security is segregated for when-issued securities. |
| (z) | Zero coupon security. The rate represents the current yield to maturity. |
| # | All or a portion of this security is segregated as collateral for investments in derivative instruments. |
| * | Cost for federal income tax purposes is $1,633,676,021 and unrealized gains (losses) consists of: |
| | | | |
Gross unrealized gains | | $ | 39,360,419 | |
Gross unrealized losses | | | (8,273,767 | ) |
| | | | |
Net unrealized gains | | $ | 31,086,652 | |
| ITEM 7. | DISCLOSURE OF PROXY VOTING POLICIES AND PROCEDURES FOR CLOSED-END MANAGEMENT INVESTMENT COMPANIES |
Not applicable.
| ITEM 8. | PORTFOLIO MANAGERS OF CLOSED-END MANAGEMENT INVESTMENT COMPANIES |
Not applicable.
| ITEM 9. | PURCHASES OF EQUITY SECURITIES BY CLOSED-END MANAGEMEENT INVESTMENT COMPANY AND AFFILIATED PURCHASERS |
Not applicable.
| ITEM 10. | SUBMISSION OF MATTERS TO A VOTE OF SECURITY HOLDERS |
There have been no material changes to the procedures by which shareholders may recommend nominees to the registrant’s Board of Trustees that have been implemented since the registrant’s last provided disclosure in response to the requirements of this Item.
| ITEM 11. | CONTROLS AND PROCEDURES |
(a) The President and Treasurer have concluded that the Wells Fargo Funds Trust (the “Trust”) disclosure controls and procedures (as defined in Rule 30a-3(c) under the Investment Company Act of 1940) provide reasonable assurances that material information relating to the Trust is made known to them by the appropriate persons, based on their evaluation of these controls and procedures as of a date within 90 days of the filing of this report.
(b) There were no significant changes in the Trust’s internal controls over financial reporting (as defined in Rule 30a-3(d) under the Investment Company Act of 1940) that occurred during the second fiscal quarter of the period covered by this report that materially affected, or is reasonably likely to materially affect, the registrant’s internal control over financial reporting.
(a)(1) Not applicable.
(a)(2) Certification pursuant to Rule 30a-2(a) under the Investment Company Act of 1940 (17 CFR 270.30a-2(a)) is filed and attached hereto as Exhibit 99.CERT.
(a)(3) Not applicable.
(b) Certification pursuant to Rule 30a-2(b) under the Investment Company Act of 1940 (17 CFR 270.30a-2(b)) is filed and attached hereto as Exhibit 99.906CERT.
SIGNATURES
Pursuant to the requirements of the Securities Exchange Act of 1934 and the Investment Company Act of 1940, the registrant has duly caused this report to be signed on its behalf by the undersigned, thereunto duly authorized.
| | |
| Wells Fargo Funds Trust |
| |
| By: | |
/s/ Karla M. Rabusch |
| |
| | Karla M. Rabusch |
| | President |
| |
| Date: | | April 24, 2015 |
Pursuant to the requirements of the Securities Exchange Act of 1934 and the Investment Company Act of 1940, this report has been signed below by the following persons on behalf of the registrant and in the capacities and on the date indicated.
| | |
| Wells Fargo Funds Trust |
| |
By: | |
/s/ Karla M. Rabusch |
| |
| | Karla M. Rabusch |
| | President |
| |
| Date: | | April 24, 2015 |
| |
By: | |
/s/ Nancy Wiser |
| |
| | Nancy Wiser |
| | Treasurer |
| |
| Date: | | April 24, 2015 |